an examination of positive selection and changing effective population size in angus and holstein...
TRANSCRIPT
BioMed CentralBMC Genomics
ss
Open AcceResearch articleAn examination of positive selection and changing effective population size in Angus and Holstein cattle populations (Bos taurus) using a high density SNP genotyping platform and the contribution of ancient polymorphism to genomic diversity in Domestic cattleSean MacEachern*1,2,5, Ben Hayes1, John McEwan3 and Mike Goddard1,4Address: 1Primary Industries Research Victoria, Animal Genetics and Genomics, Attwood VIC 3049, Australia, 2Latrobe University, Department of Genetics, Bundoora VIC 3086, Australia, 3Animal Genomics, AgResearch, Invermay, Private Bag 50034, Mosgiel, New Zealand, 4Melbourne University, School of Agriculture and Food Systems, Melbourne, VIC 3000, Australia and 5Avian Disease and Oncology Laboratory 3606 E Mt. Hope Rd, East Lansing, MI 48823, USA
Email: Sean MacEachern* - [email protected]; Ben Hayes - [email protected]; John McEwan - [email protected]; Mike Goddard - [email protected]
* Corresponding author
AbstractBackground: Identifying recent positive selection signatures in domesticated animals could provideinformation on genome response to strong directional selection from domestication and artificialselection. With the completion of the cattle genome, private companies are now providing large numbersof polymorphic markers for probing variation in domestic cattle (Bos taurus). We analysed over 7,500polymorphic single nucleotide polymorphisms (SNP) in beef (Angus) and dairy (Holstein) cattle andoutgroup species Bison, Yak and Banteng in an indirect test of inbreeding and positive selection inDomestic cattle.
Results: Outgroup species: Bison, Yak and Banteng, were genotyped with high levels of success (90%) andused to determine ancestral and derived allele states in domestic cattle. Frequency spectrums of thederived alleles in Angus and Holstein were examined using Fay and Wu's H test. Significant divergencesfrom the predicted frequency spectrums expected under neutrality were identified. This appeared to bethe result of combined influences of positive selection, inbreeding and ascertainment bias for moderatelyfrequent SNP. Approximately 10% of all polymorphisms identified as segregating in B. taurus were alsosegregating in Bison, Yak or Banteng; highlighting a large number of polymorphisms that are ancient inorigin.
Conclusion: These results suggest that a large effective population size (Ne) of approximately 90,000 ormore existed in B. taurus since they shared a common ancestor with Bison, Yak and Banteng ~1–2 millionyears ago (MYA). More recently Ne decreased sharply probably associated with domestication. This maypartially explain the paradox of high levels of polymorphism in Domestic cattle and the relatively smallrecent Ne in this species. The period of inbreeding caused Fay and Wu's H statistic to depart from itsexpectation under neutrality mimicking the effect of selection. However, there was also evidence forselection, because high frequency derived alleles tended to cluster near each other on the genome.
Published: 24 April 2009
BMC Genomics 2009, 10:181 doi:10.1186/1471-2164-10-181
Received: 29 January 2008Accepted: 24 April 2009
This article is available from: http://www.biomedcentral.com/1471-2164/10/181
© 2009 MacEachern et al; licensee BioMed Central Ltd. This is an Open Access article distributed under the terms of the Creative Commons Attribution License (http://creativecommons.org/licenses/by/2.0), which permits unrestricted use, distribution, and reproduction in any medium, provided the original work is properly cited.
Page 1 of 19(page number not for citation purposes)
BMC Genomics 2009, 10:181 http://www.biomedcentral.com/1471-2164/10/181
BackgroundIdentifying positive genomic selection in domestic ani-mals is a major challenge in contemporary agriculturalresearch. To date only a small number of examples havesuccessfully identified genomic regions subject to positiveselection in domestic animals [1-10]. Increasing theunderstanding of positive selection and how it shapesgenetic variation in domestic animals has the potential toprovide powerful insights into the mechanisms involvedin evolution, help target loci for selection and possiblyhighlight the genetic basis of phenotypic diversity forcomplex traits [5,11]. Domestic animals provide a uniqueopportunity to detect positive selection due to their exten-sive diversity amongst breeds, increasing availability ofsequence data and large databases of polymorphisms thatare accruing in domestic species like Bos taurus.
Data on polymorphisms can provide evidence of selectionif the patterns in the data are incompatible with a neutralmodel [12]. For instance, the neutral model with constanteffective population size predicts that most polymor-phisms will have one common allele and one rare allele.More specifically, if p is the frequency of one of the twoalleles chosen at random and f(p) is the distribution orspectrum of all polymorphisms where one allele has fre-quency p, then f(p) = k/(p(1-p)) where k is a constant.Tajima's D statistic [13] measures the extent to which realdata differs from this theoretical expectation. Tajima [13]suggests that changes in the frequency spectrum of neutralpolymorphic alleles can be used to detect a hitchhikingeffect due to the spread of linked advantageous muta-tions. Therefore, high values of D indicate that commonpolymorphisms are more frequent than expected from theneutral theory and this is a result of genetic hitchhiking.However, polymorphisms are discovered by methods thattend to find common variants and this ascertainment biascan also generate an excess of polymorphisms with inter-mediate allele frequency.
The test for departure from expectation can be made morepowerful if it is possible to distinguish the ancestral allelefrom the derived or mutant allele at each locus. If p is thefrequency of the derived allele, then the distribution of allderived alleles is f(p) = k/p. Fay and Wu measure depar-ture from this expectation with their H statistic [14]. Ifderived alleles are found at high frequency more oftenthan expected, then H will be positive. They suggest thatselection causes a positive H statistic, because selectionsometimes drives the derived allele to high frequency.This can occur if the polymorphisms observed are subjectto selection themselves, but can also occur at neutral locias a result of hitchhiking caused by selection acting onlinked loci. This makes H a very useful test for selectionbecause most polymorphisms are discovered randomly
and few of them are likely to be directly subject to selec-tion.
Unfortunately, both D and H can depart from expectationfor reasons other than selection [13,15-17]. The way inwhich polymorphisms are discovered usually means thatlow frequency polymorphisms are less likely to be discov-ered than one with alleles at intermediate frequency. Dand H are also affected by changing effective populationsize (Ne). If Ne declines, polymorphisms with one rareallele become less frequent and the frequency spectrumbecomes flatter. In this way a decline in Ne (i.e. inbreed-ing) can mimic selection [16-18]. Therefore, detectingunambiguous examples of positive selection has been dif-ficult due the difficulty of many methods to differentiatebetween positive selection and demographic history. Thisis of particular concern in domestic species where SNP dis-covery typically involves some ascertainment bias anddemographic fluctuations coupled with strong directional(artificial) selection, which have played important roles inthe formation of domestic breeds [19].
The problem of ascertainment bias will result in anobserved allele frequency spectrum that is more flat thanthat predicted by theory. However, it is possible to con-struct a test that is not affected by this ascertainment biasif derived and ancestral alleles can be distinguished. Sincef(p) = k/p for derived alleles with frequency p [14], the fre-quency spectrum for all ancestral alleles with frequency 1-p is f(1-p). The spectrum for all alleles with derived orancestral allele frequencies p or 1-p is then f(p) + f(1-p),which is equal to f(p(1-p)), see above. So neutrality pre-dicts that the proportion of these alleles where the ances-tral allele is p is f(1-p)/[f(p)+f(1-p)], which is equal to p.Assuming that the polymorphism discovery method can-not distinguish ancestral and derived alleles, this expecta-tion for different p intervals is not affected by theascertainment bias. It has only been tested for p from 0 to0.5, since the value of any f(1-p)/[f(p)+f(1-p)] is 1-(valueat 1-p). Also, because selection does not typically affect allparts of the genome equally, selection and demographicphenomena can be compared. For instance, a selectedallele can drag derived alleles that are closely linked tohigh frequencies by hitchhiking. Therefore, selectionshould cause an autocorrelation of high frequency derivedalleles between one locus and the next on the chromo-some. To test if the observed autocorrelation could be dueto inbreeding, we have used a simulation study to demon-strate the effect of inbreeding in the absence of selectionand compared the results with those found in real data.
Recently it has become possible to assay large numbers ofpolymorphisms in cattle and this offers a new source ofdata with which to detect evidence of selection. In thispaper we use data from two breeds of cattle (Angus and
Page 2 of 19(page number not for citation purposes)
BMC Genomics 2009, 10:181 http://www.biomedcentral.com/1471-2164/10/181
Holstein) each genotyped for over 7,500 SNPs using theParallele/Affymetrix platform. By also genotyping theseSNPs on 3 species related to Bos taurus (Bison, Yak andBanteng) we have been able to distinguish the derived andancestral allele at each locus and use this information totest for deviations from neutrality.
The comparison between the allele frequencies in theAngus and Holstein breeds might also contain evidence ofselection since they have been selected for different traits.However, their allele frequencies also differ due to geneticdrift caused by finite population size or inbreeding. Thedifference in allele frequencies can be quantified by thestatistic Fst. Inbreeding should affect all loci equally andgenetic drift should affect loci randomly and not showany linkage disequilibrium between adjacent loci, but wehypothesise that selection will drive linked derived allelesto high frequency in one breed but not the other. There-fore selection should cause higher values of Fst amongloci where the derived allele is common than when theancestral allele is common. We examine how Fst betweenAngus and Holstein changes with allele frequency andcompare the result to that obtained with the simulateddata.
ResultsAmplification of B. taurus designed markers in wild relativesApproximately 383 Holstein, 379 Angus and one of theoutgroup species each (Banteng, Yak, and Bison) weregenotyped for over 9,000 SNP. In total 7,611 amplified inboth breeds of B. taurus and at least one of the outgroupspecies. Of these 6,718 and 7,215 SNP were found to besegregating in Angus and Holstein, respectively. Theremaining assays were fixed for the derived or ancestralalleles (table 1).
Table 2 summarises the proportion of successful assays inthe outgroup species sampled from 9,323 SNP genotypedin Angus. On average very high rates of successful assayswere found in the majority of wild species. Similar resultshave been found for the successful amplification of SNPmarkers as for successful amplification of exons fromprimers designed from the flanking 5- and 3- primeregions of each exon [20]. From the 8,677 loci that ampli-fied in the wild species 7,611 could be used to identify the
ancestral allele, while 931 were determined to be poly-morphic or segregating in the ancestral species.
Fay and Wu's H testIn table 3 a summary of Fay and Wu's H statistic is pre-sented for a survey of 7, 611 SNP in Holstein and Anguscattle. In both Angus and Holstein populations H valuesare considerably larger than 0 (p < 0.001, one sided). Acomparison of H values between Holstein and Angusidentified a significantly larger value for H in Angus cattle(p < 0.001). This indicates that derived alleles occur at ahigher frequency than expected under the neutral model,especially in Angus.
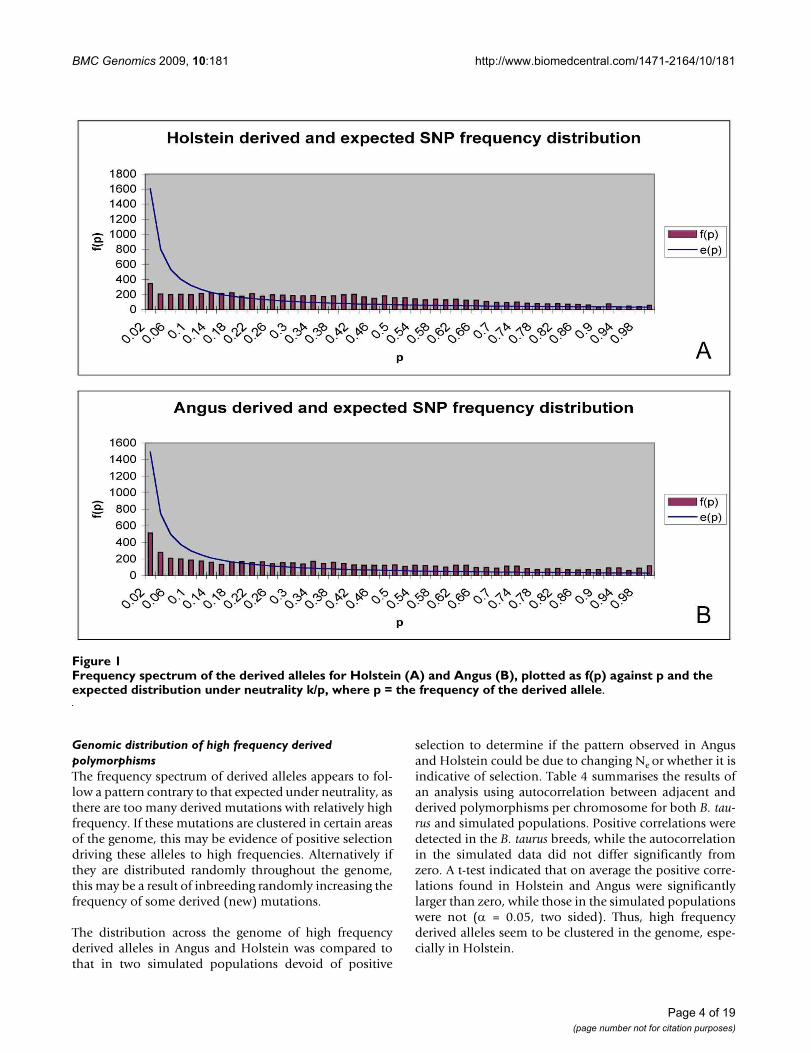
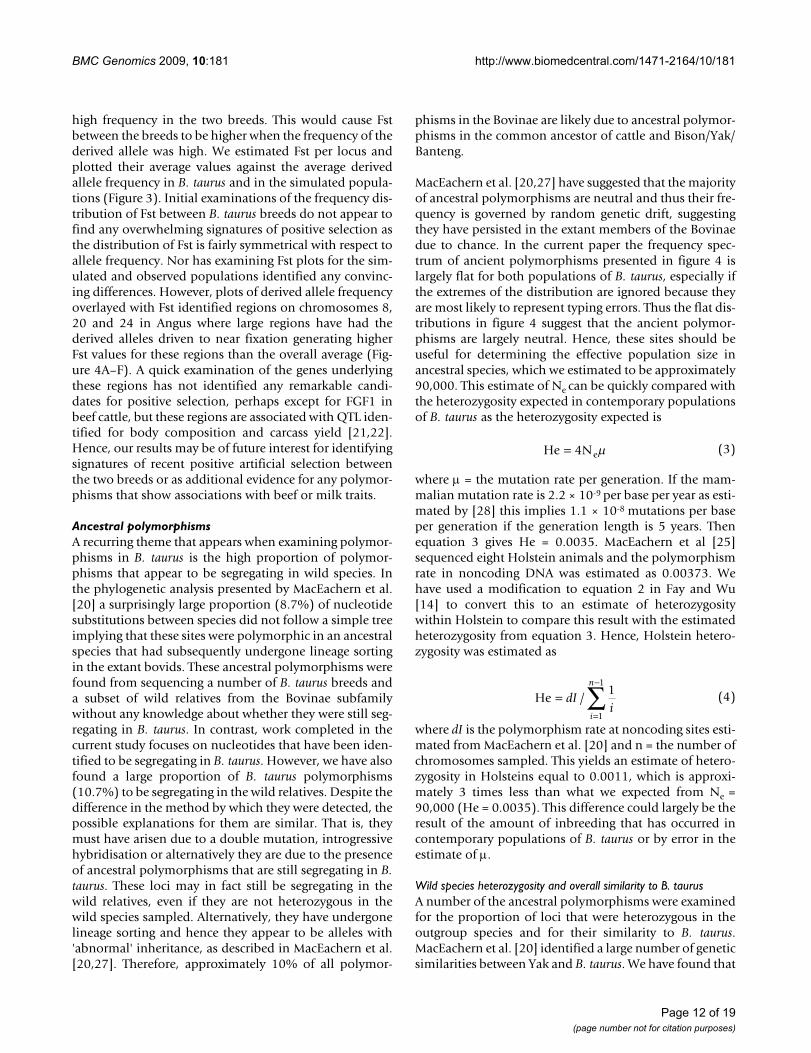
Frequency spectrum of derived and ancient allelesThe frequency spectrum of derived variants f(p) alongsidethe expected frequency spectrum e(p) under neutrality,which is calculated as k/p where k = the value calculatedfrom the sum of all f(p) so the theoretical and actualcurves match as close as possible for Holstein and Anguscattle, is presented in figure 1A, B. In general both breedsshow a flat distribution for the spectrum of derived alleles.Both Holstein and Angus show a deficiency of derivedalleles at low frequency, especially in Holstein. However,at high frequencies there may be an increase in the abun-dance of derived alleles, especially in Angus cattle.
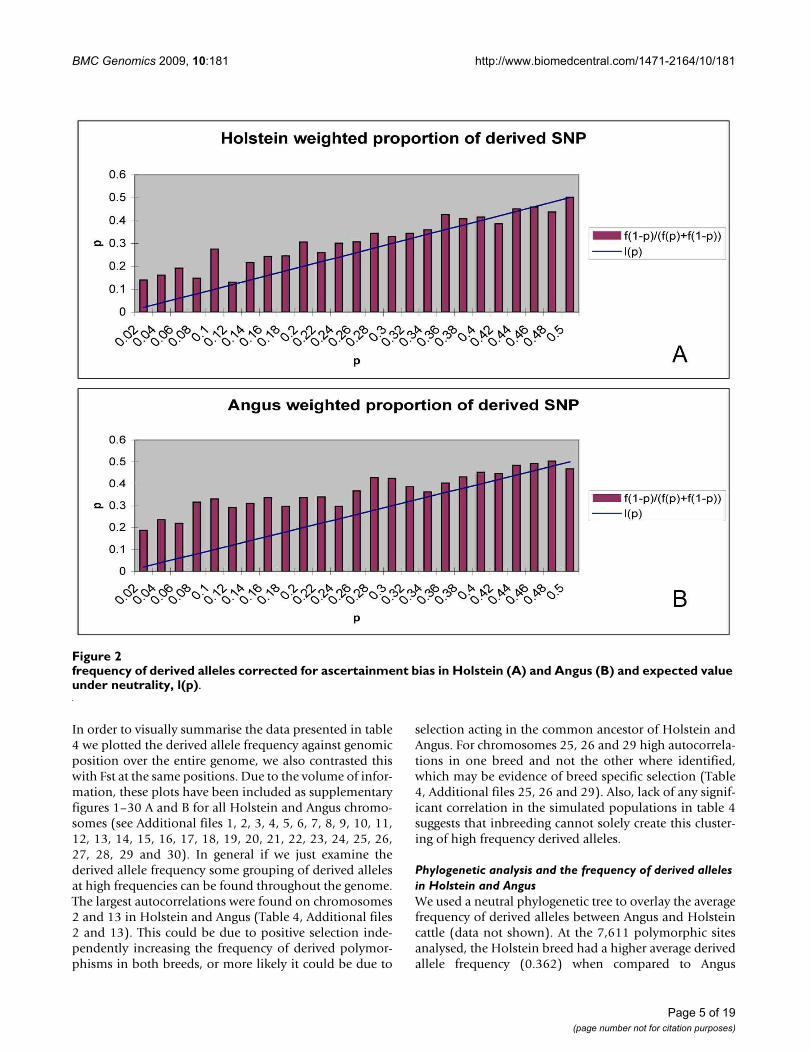
To avoid ascertainment bias, we have plotted f(1-p)/[f(p)+f(1-p)] against its expectation under the neutralmodel in figures 2A and 2B. Under a neutral model withconstant Ne, the expectation of this statistic is simply p.The figures show that the derived alleles are more com-mon than expected. For instance, in figure 2A when theminor allele frequency is 0.1, we expect that in 0.1 of theloci the common allele is the derived allele, but weobserve this in 0.27 of the loci. In Holstein and especiallyAngus, derived alleles are more common than expected.
Table 1: Summary of successful genotypes for loci amplified in Angus, Holstein and at least one wild species
Segregating Fixed ancestral Fixed derived Total
Angus 6,718 809 84 7,746Holstein 7,215 373 23 7,746
Table 2: Proportion and numbers of alleles showing successful genotypes in individual wild relatives and overall total where at least one animal was successfully genotyped from the 9,323 SNP genotyped in Angus
Bison Yak Banteng Water Buffalo ≥ 1 species
Proportion 0.924 0.923 0.923 0.0 0.931Genotypes 8,615 8,608 8,607 0 8,677
Table 3: Summary of H statistics from a survey of over 7,746 SNP in Holstein and Angus cattle
Sample size θH θπ H s.e.(H) p(H)
Angus 7,746 0.448 0.274 0.174 0.0065 p < 0.001Holstein 7,746 0.435 0.316 0.119 0.0061 p < 0.001
*s.e.(H) is the standard error of H and p(H) is the probability that θH and θπ are equal
Page 3 of 19(page number not for citation purposes)
BMC Genomics 2009, 10:181 http://www.biomedcentral.com/1471-2164/10/181
Genomic distribution of high frequency derived polymorphismsThe frequency spectrum of derived alleles appears to fol-low a pattern contrary to that expected under neutrality, asthere are too many derived mutations with relatively highfrequency. If these mutations are clustered in certain areasof the genome, this may be evidence of positive selectiondriving these alleles to high frequencies. Alternatively ifthey are distributed randomly throughout the genome,this may be a result of inbreeding randomly increasing thefrequency of some derived (new) mutations.
The distribution across the genome of high frequencyderived alleles in Angus and Holstein was compared tothat in two simulated populations devoid of positive
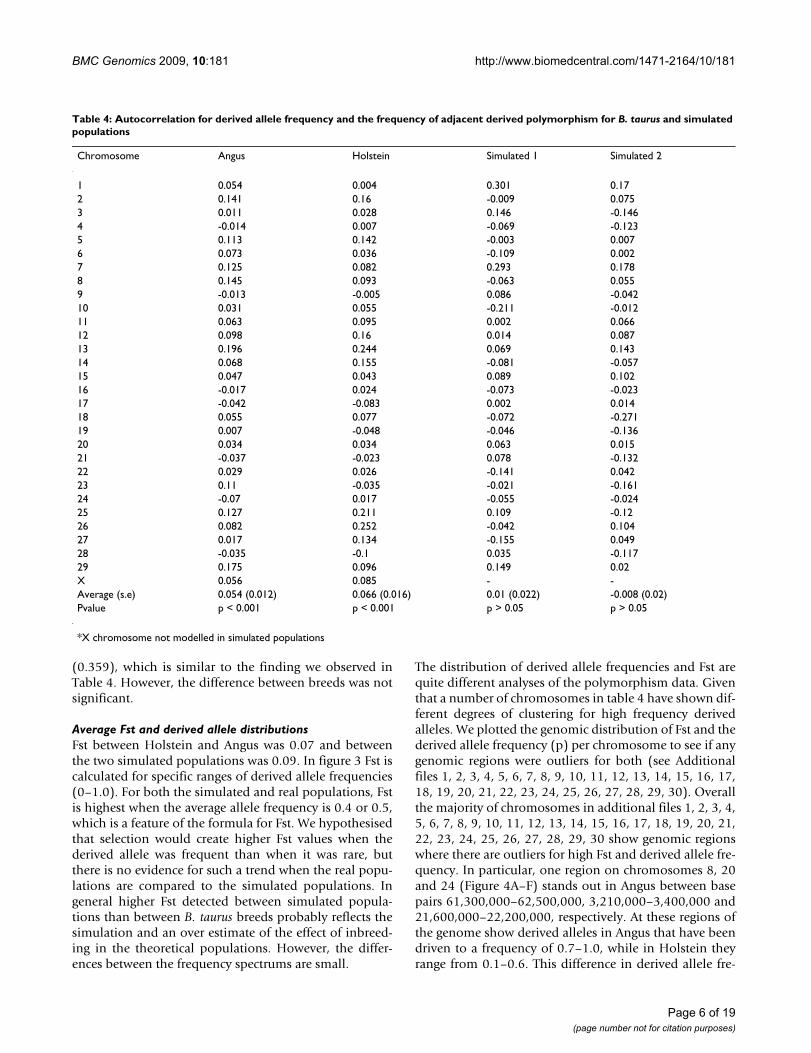
selection to determine if the pattern observed in Angusand Holstein could be due to changing Ne or whether it isindicative of selection. Table 4 summarises the results ofan analysis using autocorrelation between adjacent andderived polymorphisms per chromosome for both B. tau-rus and simulated populations. Positive correlations weredetected in the B. taurus breeds, while the autocorrelationin the simulated data did not differ significantly fromzero. A t-test indicated that on average the positive corre-lations found in Holstein and Angus were significantlylarger than zero, while those in the simulated populationswere not (α = 0.05, two sided). Thus, high frequencyderived alleles seem to be clustered in the genome, espe-cially in Holstein.
Frequency spectrum of the derived alleles for Holstein (A) and Angus (B), plotted as f(p) against p and the expected distribu-tion under neutrality k/p, where p = the frequency of the derived alleleFigure 1Frequency spectrum of the derived alleles for Holstein (A) and Angus (B), plotted as f(p) against p and the expected distribution under neutrality k/p, where p = the frequency of the derived allele.
Page 4 of 19(page number not for citation purposes)
BMC Genomics 2009, 10:181 http://www.biomedcentral.com/1471-2164/10/181
In order to visually summarise the data presented in table4 we plotted the derived allele frequency against genomicposition over the entire genome, we also contrasted thiswith Fst at the same positions. Due to the volume of infor-mation, these plots have been included as supplementaryfigures 1–30 A and B for all Holstein and Angus chromo-somes (see Additional files 1, 2, 3, 4, 5, 6, 7, 8, 9, 10, 11,12, 13, 14, 15, 16, 17, 18, 19, 20, 21, 22, 23, 24, 25, 26,27, 28, 29 and 30). In general if we just examine thederived allele frequency some grouping of derived allelesat high frequencies can be found throughout the genome.The largest autocorrelations were found on chromosomes2 and 13 in Holstein and Angus (Table 4, Additional files2 and 13). This could be due to positive selection inde-pendently increasing the frequency of derived polymor-phisms in both breeds, or more likely it could be due to
selection acting in the common ancestor of Holstein andAngus. For chromosomes 25, 26 and 29 high autocorrela-tions in one breed and not the other where identified,which may be evidence of breed specific selection (Table4, Additional files 25, 26 and 29). Also, lack of any signif-icant correlation in the simulated populations in table 4suggests that inbreeding cannot solely create this cluster-ing of high frequency derived alleles.
Phylogenetic analysis and the frequency of derived alleles in Holstein and AngusWe used a neutral phylogenetic tree to overlay the averagefrequency of derived alleles between Angus and Holsteincattle (data not shown). At the 7,611 polymorphic sitesanalysed, the Holstein breed had a higher average derivedallele frequency (0.362) when compared to Angus
frequency of derived alleles corrected for ascertainment bias in Holstein (A) and Angus (B) and expected value under neutral-ity, l(p)Figure 2frequency of derived alleles corrected for ascertainment bias in Holstein (A) and Angus (B) and expected value under neutrality, l(p).
Page 5 of 19(page number not for citation purposes)
BMC Genomics 2009, 10:181 http://www.biomedcentral.com/1471-2164/10/181
(0.359), which is similar to the finding we observed inTable 4. However, the difference between breeds was notsignificant.
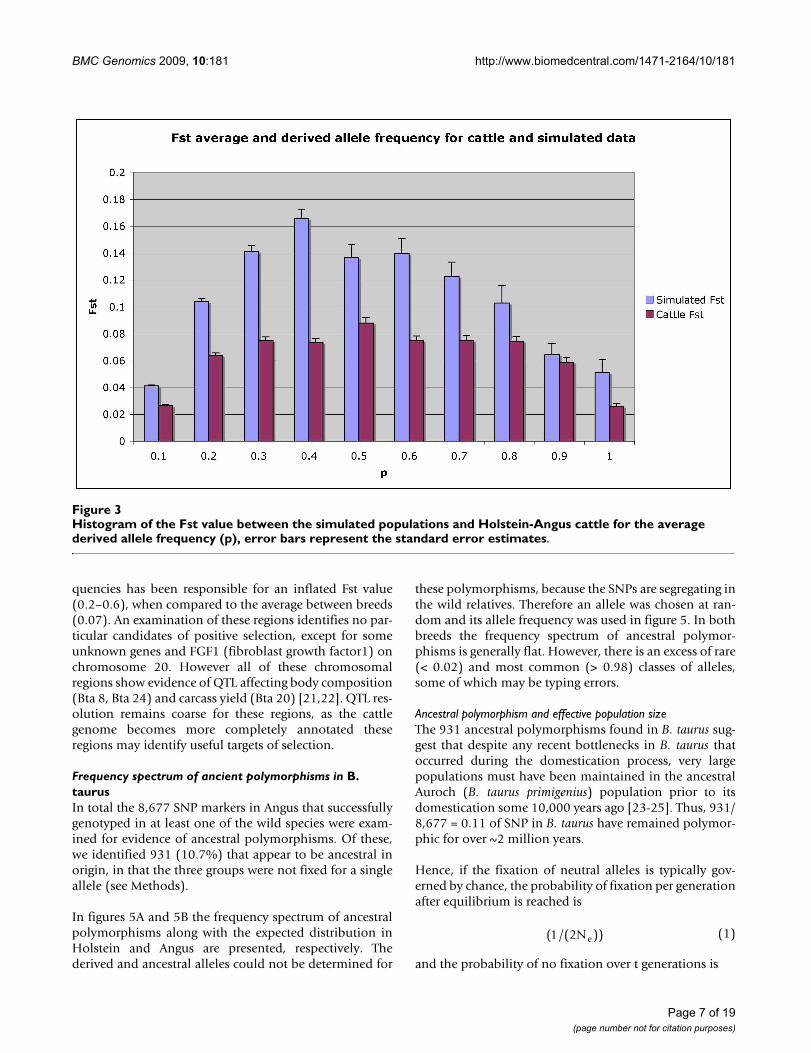
Average Fst and derived allele distributionsFst between Holstein and Angus was 0.07 and betweenthe two simulated populations was 0.09. In figure 3 Fst iscalculated for specific ranges of derived allele frequencies(0–1.0). For both the simulated and real populations, Fstis highest when the average allele frequency is 0.4 or 0.5,which is a feature of the formula for Fst. We hypothesisedthat selection would create higher Fst values when thederived allele was frequent than when it was rare, butthere is no evidence for such a trend when the real popu-lations are compared to the simulated populations. Ingeneral higher Fst detected between simulated popula-tions than between B. taurus breeds probably reflects thesimulation and an over estimate of the effect of inbreed-ing in the theoretical populations. However, the differ-ences between the frequency spectrums are small.
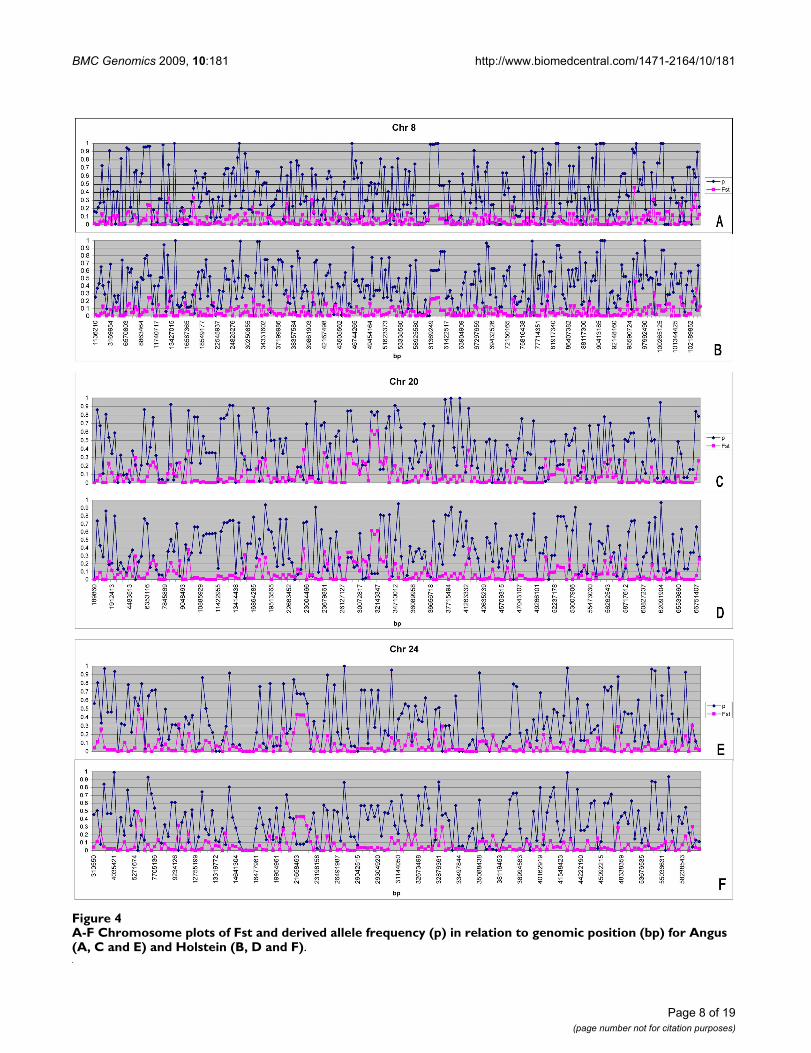
The distribution of derived allele frequencies and Fst arequite different analyses of the polymorphism data. Giventhat a number of chromosomes in table 4 have shown dif-ferent degrees of clustering for high frequency derivedalleles. We plotted the genomic distribution of Fst and thederived allele frequency (p) per chromosome to see if anygenomic regions were outliers for both (see Additionalfiles 1, 2, 3, 4, 5, 6, 7, 8, 9, 10, 11, 12, 13, 14, 15, 16, 17,18, 19, 20, 21, 22, 23, 24, 25, 26, 27, 28, 29, 30). Overallthe majority of chromosomes in additional files 1, 2, 3, 4,5, 6, 7, 8, 9, 10, 11, 12, 13, 14, 15, 16, 17, 18, 19, 20, 21,22, 23, 24, 25, 26, 27, 28, 29, 30 show genomic regionswhere there are outliers for high Fst and derived allele fre-quency. In particular, one region on chromosomes 8, 20and 24 (Figure 4A–F) stands out in Angus between basepairs 61,300,000–62,500,000, 3,210,000–3,400,000 and21,600,000–22,200,000, respectively. At these regions ofthe genome show derived alleles in Angus that have beendriven to a frequency of 0.7–1.0, while in Holstein theyrange from 0.1–0.6. This difference in derived allele fre-
Table 4: Autocorrelation for derived allele frequency and the frequency of adjacent derived polymorphism for B. taurus and simulated populations
Chromosome Angus Holstein Simulated 1 Simulated 2
1 0.054 0.004 0.301 0.172 0.141 0.16 -0.009 0.0753 0.011 0.028 0.146 -0.1464 -0.014 0.007 -0.069 -0.1235 0.113 0.142 -0.003 0.0076 0.073 0.036 -0.109 0.0027 0.125 0.082 0.293 0.1788 0.145 0.093 -0.063 0.0559 -0.013 -0.005 0.086 -0.04210 0.031 0.055 -0.211 -0.01211 0.063 0.095 0.002 0.06612 0.098 0.16 0.014 0.08713 0.196 0.244 0.069 0.14314 0.068 0.155 -0.081 -0.05715 0.047 0.043 0.089 0.10216 -0.017 0.024 -0.073 -0.02317 -0.042 -0.083 0.002 0.01418 0.055 0.077 -0.072 -0.27119 0.007 -0.048 -0.046 -0.13620 0.034 0.034 0.063 0.01521 -0.037 -0.023 0.078 -0.13222 0.029 0.026 -0.141 0.04223 0.11 -0.035 -0.021 -0.16124 -0.07 0.017 -0.055 -0.02425 0.127 0.211 0.109 -0.1226 0.082 0.252 -0.042 0.10427 0.017 0.134 -0.155 0.04928 -0.035 -0.1 0.035 -0.11729 0.175 0.096 0.149 0.02X 0.056 0.085 - -Average (s.e) 0.054 (0.012) 0.066 (0.016) 0.01 (0.022) -0.008 (0.02)Pvalue p < 0.001 p < 0.001 p > 0.05 p > 0.05
*X chromosome not modelled in simulated populations
Page 6 of 19(page number not for citation purposes)
BMC Genomics 2009, 10:181 http://www.biomedcentral.com/1471-2164/10/181
quencies has been responsible for an inflated Fst value(0.2–0.6), when compared to the average between breeds(0.07). An examination of these regions identifies no par-ticular candidates of positive selection, except for someunknown genes and FGF1 (fibroblast growth factor1) onchromosome 20. However all of these chromosomalregions show evidence of QTL affecting body composition(Bta 8, Bta 24) and carcass yield (Bta 20) [21,22]. QTL res-olution remains coarse for these regions, as the cattlegenome becomes more completely annotated theseregions may identify useful targets of selection.
Frequency spectrum of ancient polymorphisms in B. taurusIn total the 8,677 SNP markers in Angus that successfullygenotyped in at least one of the wild species were exam-ined for evidence of ancestral polymorphisms. Of these,we identified 931 (10.7%) that appear to be ancestral inorigin, in that the three groups were not fixed for a singleallele (see Methods).
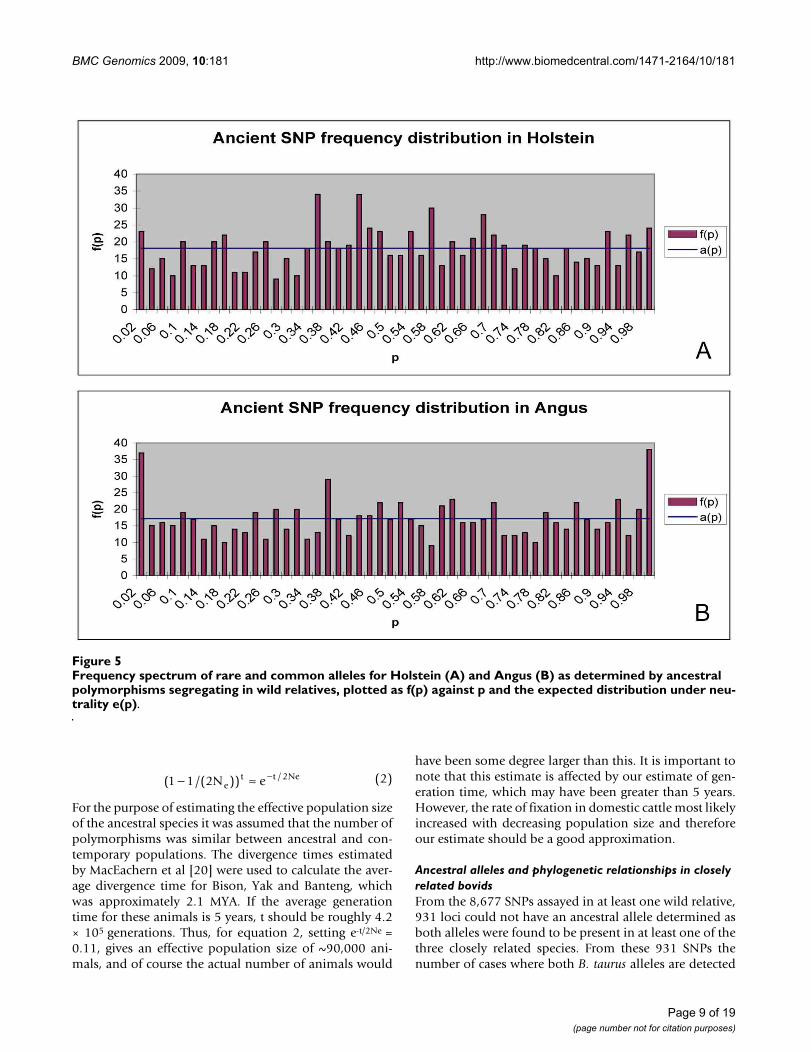
In figures 5A and 5B the frequency spectrum of ancestralpolymorphisms along with the expected distribution inHolstein and Angus are presented, respectively. Thederived and ancestral alleles could not be determined for
these polymorphisms, because the SNPs are segregating inthe wild relatives. Therefore an allele was chosen at ran-dom and its allele frequency was used in figure 5. In bothbreeds the frequency spectrum of ancestral polymor-phisms is generally flat. However, there is an excess of rare(< 0.02) and most common (> 0.98) classes of alleles,some of which may be typing errors.
Ancestral polymorphism and effective population sizeThe 931 ancestral polymorphisms found in B. taurus sug-gest that despite any recent bottlenecks in B. taurus thatoccurred during the domestication process, very largepopulations must have been maintained in the ancestralAuroch (B. taurus primigenius) population prior to itsdomestication some 10,000 years ago [23-25]. Thus, 931/8,677 = 0.11 of SNP in B. taurus have remained polymor-phic for over ~2 million years.
Hence, if the fixation of neutral alleles is typically gov-erned by chance, the probability of fixation per generationafter equilibrium is reached is
and the probability of no fixation over t generations is
( /( ))1 2Ne (1)
Histogram of the Fst value between the simulated populations and Holstein-Angus cattle for the average derived allele fre-quency (p), error bars represent the standard error estimatesFigure 3Histogram of the Fst value between the simulated populations and Holstein-Angus cattle for the average derived allele frequency (p), error bars represent the standard error estimates.
Page 7 of 19(page number not for citation purposes)
BMC Genomics 2009, 10:181 http://www.biomedcentral.com/1471-2164/10/181
Page 8 of 19(page number not for citation purposes)
A-F Chromosome plots of Fst and derived allele frequency (p) in relation to genomic position (bp) for Angus (A, C and E) and Holstein (B, D and F)Figure 4A-F Chromosome plots of Fst and derived allele frequency (p) in relation to genomic position (bp) for Angus (A, C and E) and Holstein (B, D and F).
BMC Genomics 2009, 10:181 http://www.biomedcentral.com/1471-2164/10/181
For the purpose of estimating the effective population sizeof the ancestral species it was assumed that the number ofpolymorphisms was similar between ancestral and con-temporary populations. The divergence times estimatedby MacEachern et al [20] were used to calculate the aver-age divergence time for Bison, Yak and Banteng, whichwas approximately 2.1 MYA. If the average generationtime for these animals is 5 years, t should be roughly 4.2× 10⁵ generations. Thus, for equation 2, setting e-t/2Ne =0.11, gives an effective population size of ~90,000 ani-mals, and of course the actual number of animals would
have been some degree larger than this. It is important tonote that this estimate is affected by our estimate of gen-eration time, which may have been greater than 5 years.However, the rate of fixation in domestic cattle most likelyincreased with decreasing population size and thereforeour estimate should be a good approximation.
Ancestral alleles and phylogenetic relationships in closely related bovidsFrom the 8,677 SNPs assayed in at least one wild relative,931 loci could not have an ancestral allele determined asboth alleles were found to be present in at least one of thethree closely related species. From these 931 SNPs thenumber of cases where both B. taurus alleles are detected
( /( )) /1 1 2 2− ≈ −N eet t Ne (2)
Frequency spectrum of rare and common alleles for Holstein (A) and Angus (B) as determined by ancestral polymorphisms segregating in wild relatives, plotted as f(p) against p and the expected distribution under neutrality e(p)Figure 5Frequency spectrum of rare and common alleles for Holstein (A) and Angus (B) as determined by ancestral polymorphisms segregating in wild relatives, plotted as f(p) against p and the expected distribution under neu-trality e(p).
Page 9 of 19(page number not for citation purposes)
BMC Genomics 2009, 10:181 http://www.biomedcentral.com/1471-2164/10/181
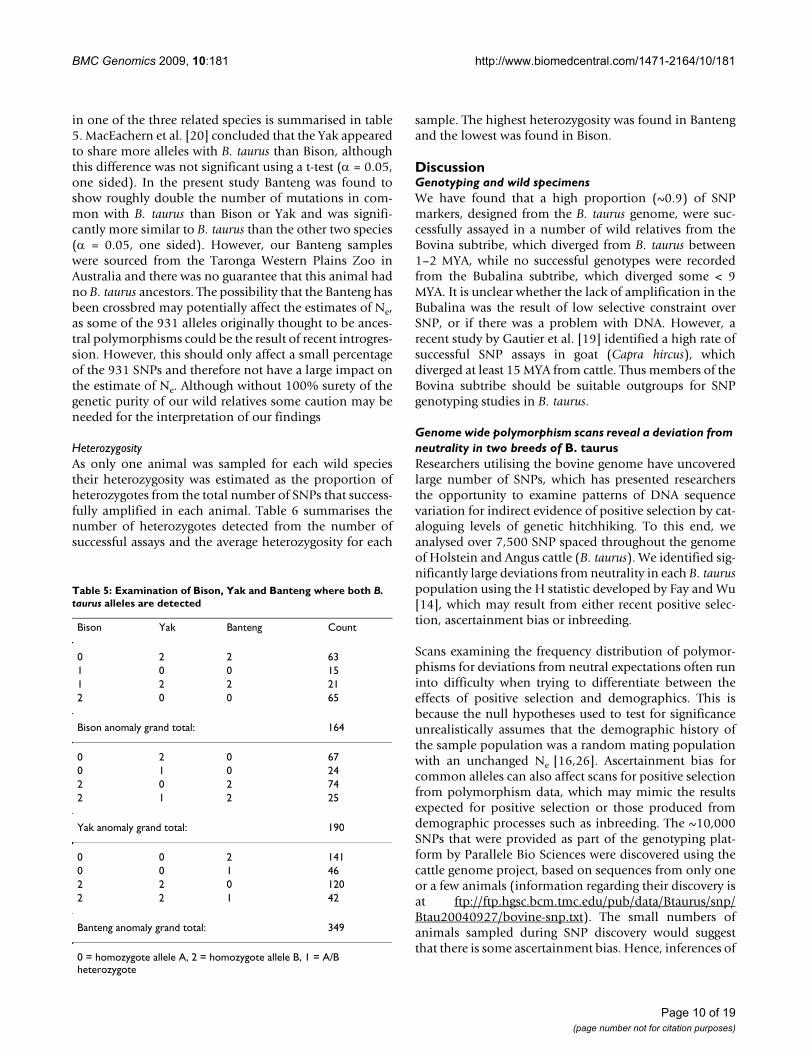
in one of the three related species is summarised in table5. MacEachern et al. [20] concluded that the Yak appearedto share more alleles with B. taurus than Bison, althoughthis difference was not significant using a t-test (α = 0.05,one sided). In the present study Banteng was found toshow roughly double the number of mutations in com-mon with B. taurus than Bison or Yak and was signifi-cantly more similar to B. taurus than the other two species(α = 0.05, one sided). However, our Banteng sampleswere sourced from the Taronga Western Plains Zoo inAustralia and there was no guarantee that this animal hadno B. taurus ancestors. The possibility that the Banteng hasbeen crossbred may potentially affect the estimates of Ne,as some of the 931 alleles originally thought to be ances-tral polymorphisms could be the result of recent introgres-sion. However, this should only affect a small percentageof the 931 SNPs and therefore not have a large impact onthe estimate of Ne. Although without 100% surety of thegenetic purity of our wild relatives some caution may beneeded for the interpretation of our findings
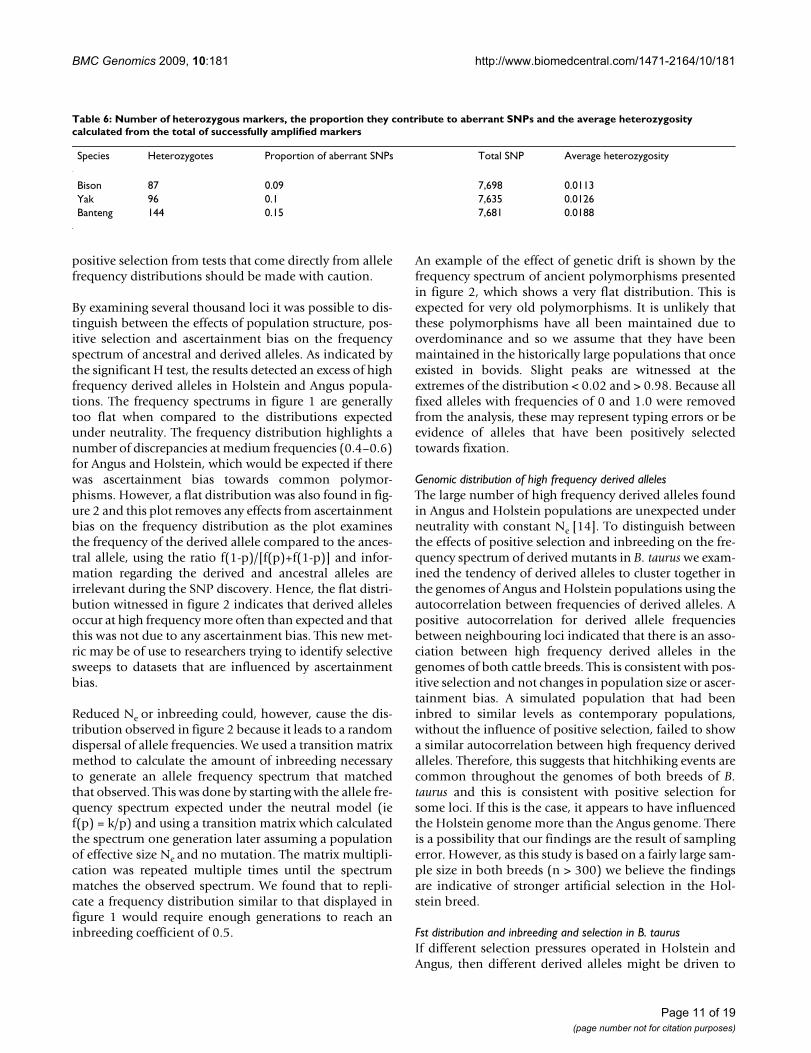
HeterozygosityAs only one animal was sampled for each wild speciestheir heterozygosity was estimated as the proportion ofheterozygotes from the total number of SNPs that success-fully amplified in each animal. Table 6 summarises thenumber of heterozygotes detected from the number ofsuccessful assays and the average heterozygosity for each
sample. The highest heterozygosity was found in Bantengand the lowest was found in Bison.
DiscussionGenotyping and wild specimensWe have found that a high proportion (~0.9) of SNPmarkers, designed from the B. taurus genome, were suc-cessfully assayed in a number of wild relatives from theBovina subtribe, which diverged from B. taurus between1–2 MYA, while no successful genotypes were recordedfrom the Bubalina subtribe, which diverged some < 9MYA. It is unclear whether the lack of amplification in theBubalina was the result of low selective constraint overSNP, or if there was a problem with DNA. However, arecent study by Gautier et al. [19] identified a high rate ofsuccessful SNP assays in goat (Capra hircus), whichdiverged at least 15 MYA from cattle. Thus members of theBovina subtribe should be suitable outgroups for SNPgenotyping studies in B. taurus.
Genome wide polymorphism scans reveal a deviation from neutrality in two breeds of B. taurusResearchers utilising the bovine genome have uncoveredlarge number of SNPs, which has presented researchersthe opportunity to examine patterns of DNA sequencevariation for indirect evidence of positive selection by cat-aloguing levels of genetic hitchhiking. To this end, weanalysed over 7,500 SNP spaced throughout the genomeof Holstein and Angus cattle (B. taurus). We identified sig-nificantly large deviations from neutrality in each B. tauruspopulation using the H statistic developed by Fay and Wu[14], which may result from either recent positive selec-tion, ascertainment bias or inbreeding.
Scans examining the frequency distribution of polymor-phisms for deviations from neutral expectations often runinto difficulty when trying to differentiate between theeffects of positive selection and demographics. This isbecause the null hypotheses used to test for significanceunrealistically assumes that the demographic history ofthe sample population was a random mating populationwith an unchanged Ne [16,26]. Ascertainment bias forcommon alleles can also affect scans for positive selectionfrom polymorphism data, which may mimic the resultsexpected for positive selection or those produced fromdemographic processes such as inbreeding. The ~10,000SNPs that were provided as part of the genotyping plat-form by Parallele Bio Sciences were discovered using thecattle genome project, based on sequences from only oneor a few animals (information regarding their discovery isat ftp://ftp.hgsc.bcm.tmc.edu/pub/data/Btaurus/snp/Btau20040927/bovine-snp.txt). The small numbers ofanimals sampled during SNP discovery would suggestthat there is some ascertainment bias. Hence, inferences of
Table 5: Examination of Bison, Yak and Banteng where both B. taurus alleles are detected
Bison Yak Banteng Count
0 2 2 631 0 0 151 2 2 212 0 0 65
Bison anomaly grand total: 164
0 2 0 670 1 0 242 0 2 742 1 2 25
Yak anomaly grand total: 190
0 0 2 1410 0 1 462 2 0 1202 2 1 42
Banteng anomaly grand total: 349
0 = homozygote allele A, 2 = homozygote allele B, 1 = A/B heterozygote
Page 10 of 19(page number not for citation purposes)
BMC Genomics 2009, 10:181 http://www.biomedcentral.com/1471-2164/10/181
positive selection from tests that come directly from allelefrequency distributions should be made with caution.
By examining several thousand loci it was possible to dis-tinguish between the effects of population structure, pos-itive selection and ascertainment bias on the frequencyspectrum of ancestral and derived alleles. As indicated bythe significant H test, the results detected an excess of highfrequency derived alleles in Holstein and Angus popula-tions. The frequency spectrums in figure 1 are generallytoo flat when compared to the distributions expectedunder neutrality. The frequency distribution highlights anumber of discrepancies at medium frequencies (0.4–0.6)for Angus and Holstein, which would be expected if therewas ascertainment bias towards common polymor-phisms. However, a flat distribution was also found in fig-ure 2 and this plot removes any effects from ascertainmentbias on the frequency distribution as the plot examinesthe frequency of the derived allele compared to the ances-tral allele, using the ratio f(1-p)/[f(p)+f(1-p)] and infor-mation regarding the derived and ancestral alleles areirrelevant during the SNP discovery. Hence, the flat distri-bution witnessed in figure 2 indicates that derived allelesoccur at high frequency more often than expected and thatthis was not due to any ascertainment bias. This new met-ric may be of use to researchers trying to identify selectivesweeps to datasets that are influenced by ascertainmentbias.
Reduced Ne or inbreeding could, however, cause the dis-tribution observed in figure 2 because it leads to a randomdispersal of allele frequencies. We used a transition matrixmethod to calculate the amount of inbreeding necessaryto generate an allele frequency spectrum that matchedthat observed. This was done by starting with the allele fre-quency spectrum expected under the neutral model (ief(p) = k/p) and using a transition matrix which calculatedthe spectrum one generation later assuming a populationof effective size Ne and no mutation. The matrix multipli-cation was repeated multiple times until the spectrummatches the observed spectrum. We found that to repli-cate a frequency distribution similar to that displayed infigure 1 would require enough generations to reach aninbreeding coefficient of 0.5.
An example of the effect of genetic drift is shown by thefrequency spectrum of ancient polymorphisms presentedin figure 2, which shows a very flat distribution. This isexpected for very old polymorphisms. It is unlikely thatthese polymorphisms have all been maintained due tooverdominance and so we assume that they have beenmaintained in the historically large populations that onceexisted in bovids. Slight peaks are witnessed at theextremes of the distribution < 0.02 and > 0.98. Because allfixed alleles with frequencies of 0 and 1.0 were removedfrom the analysis, these may represent typing errors or beevidence of alleles that have been positively selectedtowards fixation.
Genomic distribution of high frequency derived allelesThe large number of high frequency derived alleles foundin Angus and Holstein populations are unexpected underneutrality with constant Ne [14]. To distinguish betweenthe effects of positive selection and inbreeding on the fre-quency spectrum of derived mutants in B. taurus we exam-ined the tendency of derived alleles to cluster together inthe genomes of Angus and Holstein populations using theautocorrelation between frequencies of derived alleles. Apositive autocorrelation for derived allele frequenciesbetween neighbouring loci indicated that there is an asso-ciation between high frequency derived alleles in thegenomes of both cattle breeds. This is consistent with pos-itive selection and not changes in population size or ascer-tainment bias. A simulated population that had beeninbred to similar levels as contemporary populations,without the influence of positive selection, failed to showa similar autocorrelation between high frequency derivedalleles. Therefore, this suggests that hitchhiking events arecommon throughout the genomes of both breeds of B.taurus and this is consistent with positive selection forsome loci. If this is the case, it appears to have influencedthe Holstein genome more than the Angus genome. Thereis a possibility that our findings are the result of samplingerror. However, as this study is based on a fairly large sam-ple size in both breeds (n > 300) we believe the findingsare indicative of stronger artificial selection in the Hol-stein breed.
Fst distribution and inbreeding and selection in B. taurusIf different selection pressures operated in Holstein andAngus, then different derived alleles might be driven to
Table 6: Number of heterozygous markers, the proportion they contribute to aberrant SNPs and the average heterozygosity calculated from the total of successfully amplified markers
Species Heterozygotes Proportion of aberrant SNPs Total SNP Average heterozygosity
Bison 87 0.09 7,698 0.0113Yak 96 0.1 7,635 0.0126Banteng 144 0.15 7,681 0.0188
Page 11 of 19(page number not for citation purposes)
BMC Genomics 2009, 10:181 http://www.biomedcentral.com/1471-2164/10/181
high frequency in the two breeds. This would cause Fstbetween the breeds to be higher when the frequency of thederived allele was high. We estimated Fst per locus andplotted their average values against the average derivedallele frequency in B. taurus and in the simulated popula-tions (Figure 3). Initial examinations of the frequency dis-tribution of Fst between B. taurus breeds do not appear tofind any overwhelming signatures of positive selection asthe distribution of Fst is fairly symmetrical with respect toallele frequency. Nor has examining Fst plots for the sim-ulated and observed populations identified any convinc-ing differences. However, plots of derived allele frequencyoverlayed with Fst identified regions on chromosomes 8,20 and 24 in Angus where large regions have had thederived alleles driven to near fixation generating higherFst values for these regions than the overall average (Fig-ure 4A–F). A quick examination of the genes underlyingthese regions has not identified any remarkable candi-dates for positive selection, perhaps except for FGF1 inbeef cattle, but these regions are associated with QTL iden-tified for body composition and carcass yield [21,22].Hence, our results may be of future interest for identifyingsignatures of recent positive artificial selection betweenthe two breeds or as additional evidence for any polymor-phisms that show associations with beef or milk traits.
Ancestral polymorphismsA recurring theme that appears when examining polymor-phisms in B. taurus is the high proportion of polymor-phisms that appear to be segregating in wild species. Inthe phylogenetic analysis presented by MacEachern et al.[20] a surprisingly large proportion (8.7%) of nucleotidesubstitutions between species did not follow a simple treeimplying that these sites were polymorphic in an ancestralspecies that had subsequently undergone lineage sortingin the extant bovids. These ancestral polymorphisms werefound from sequencing a number of B. taurus breeds anda subset of wild relatives from the Bovinae subfamilywithout any knowledge about whether they were still seg-regating in B. taurus. In contrast, work completed in thecurrent study focuses on nucleotides that have been iden-tified to be segregating in B. taurus. However, we have alsofound a large proportion of B. taurus polymorphisms(10.7%) to be segregating in the wild relatives. Despite thedifference in the method by which they were detected, thepossible explanations for them are similar. That is, theymust have arisen due to a double mutation, introgressivehybridisation or alternatively they are due to the presenceof ancestral polymorphisms that are still segregating in B.taurus. These loci may in fact still be segregating in thewild relatives, even if they are not heterozygous in thewild species sampled. Alternatively, they have undergonelineage sorting and hence they appear to be alleles with'abnormal' inheritance, as described in MacEachern et al.[20,27]. Therefore, approximately 10% of all polymor-
phisms in the Bovinae are likely due to ancestral polymor-phisms in the common ancestor of cattle and Bison/Yak/Banteng.
MacEachern et al. [20,27] have suggested that the majorityof ancestral polymorphisms are neutral and thus their fre-quency is governed by random genetic drift, suggestingthey have persisted in the extant members of the Bovinaedue to chance. In the current paper the frequency spec-trum of ancient polymorphisms presented in figure 4 islargely flat for both populations of B. taurus, especially ifthe extremes of the distribution are ignored because theyare most likely to represent typing errors. Thus the flat dis-tributions in figure 4 suggest that the ancient polymor-phisms are largely neutral. Hence, these sites should beuseful for determining the effective population size inancestral species, which we estimated to be approximately90,000. This estimate of Ne can be quickly compared withthe heterozygosity expected in contemporary populationsof B. taurus as the heterozygosity expected is
where μ = the mutation rate per generation. If the mam-malian mutation rate is 2.2 × 10⁻⁹ per base per year as esti-mated by [28] this implies 1.1 × 10⁻⁸ mutations per baseper generation if the generation length is 5 years. Thenequation 3 gives He = 0.0035. MacEachern et al [25]sequenced eight Holstein animals and the polymorphismrate in noncoding DNA was estimated as 0.00373. Wehave used a modification to equation 2 in Fay and Wu[14] to convert this to an estimate of heterozygositywithin Holstein to compare this result with the estimatedheterozygosity from equation 3. Hence, Holstein hetero-zygosity was estimated as
where dI is the polymorphism rate at noncoding sites esti-mated from MacEachern et al. [20] and n = the number ofchromosomes sampled. This yields an estimate of hetero-zygosity in Holsteins equal to 0.0011, which is approxi-mately 3 times less than what we expected from Ne =90,000 (He = 0.0035). This difference could largely be theresult of the amount of inbreeding that has occurred incontemporary populations of B. taurus or by error in theestimate of μ.
Wild species heterozygosity and overall similarity to B. taurusA number of the ancestral polymorphisms were examinedfor the proportion of loci that were heterozygous in theoutgroup species and for their similarity to B. taurus.MacEachern et al. [20] identified a large number of geneticsimilarities between Yak and B. taurus. We have found that
He Ne= 4 μ (3)
He ==
−
∑dIi
i
n
/1
1
1
(4)
Page 12 of 19(page number not for citation purposes)
BMC Genomics 2009, 10:181 http://www.biomedcentral.com/1471-2164/10/181
Yak shares slightly more alleles with B. taurus than doesBison, but the difference was not significant. Thus, there isonly weak evidence that Yak is more closely related to B.taurus than is Bison. We have also found that Bantengshared a larger number of alleles with B. taurus than Yakor Bison, which is most likely a result of having a Bantenganimal with questionable ancestry, which may result in aslight over estimation of the number of ancestral poly-morphisms and hence of Ne. If the Banteng sample con-tained Bos taurus genes, it would inflate the number ofcases where Banteng was heterozygous for the Yak/Bisonallele and the B. taurus allele. Table 5 shows that thisoccurred in only 88 cases out of 931 SNPs. Therefore, evenif this hybridisation had occurred, it would not affect theconclusions greatly.
Examining the proportion of heterozygous loci in table 5,Yak appears to be more heterozygous than Bison, whichmay reflect past population bottlenecks in Bison [29,30].Not surprisingly, Banteng was the most heterozygous ofall animals, and this might be expected if the Banteng hasa questionable background. Although we believe the Yakand Bison samples used are genetically pure, without100% certainty about the ancestry of our samples, somecaution may be needed with our interpretations that relyon this aspect.
ConclusionWe have examined the frequency distribution of polymor-phisms in milking and beef breeds of B. taurus using Fayand Wu's H as a test to identify genomic positive selection.Significant deviations from neutral expectations wereidentified, which appears to be a combined effect of posi-tive selection, inbreeding and ascertainment bias for com-mon polymorphisms. By distinguishing derived fromancestral alleles we were able to eliminate the effect ofascertainment bias from our test for selection using a newmetric f(1-p)/[f(p)+f(1-p)] that is able to overcome manyof the problems associated ascertainment bias whenknowledge of the ancestral state is known. This metriccould potentially be useful for a number of studies thatrely on information from allele frequency distributions.The high frequency of derived alleles we have identifiedhere could be caused either by selection or reduced Ne.Reduction in Ne appears to have occurred because theancestral Ne predicts a higher herterozygosity thanobserved. However, the tendency of high frequency,derived alleles to cluster in certain parts of the genome isevidence for positive selection because inbreeding alonedoes not cause this autocorrelation.
By including a number of wild relatives in the analysis theancestral alleles were inferred. Surprisingly a high propor-tion of ancestral polymorphisms were identified suggest-ing that nearly 10% of all of the polymorphisms that are
segregating in contemporary populations of B. taurus areancient in origin and must predate the divergence ofBison, Yak, Banteng and the Domesticated cow. Theseancestral polymorphisms were therefore used to estimatethe ancestral population size of domesticated cattle overthe last 2 million years, which must have been at least90,000. This estimate is roughly 9 times greater than theestimate of the effective population size in humans, whichhas been estimated as 10,000 [31].
MethodsSample AnimalsTwo separate breeds of Bos taurus and a number of wildrelatives were analysed for genotypic polymorphismsusing a high-throughput, high-density SNP genotypingplatform. This platform is commercially available fromParallele Biosciences, which was acquired by Affymetrixhttps://www.affymetrix.com/corporate/parallele.affx. Theoriginal progenitors of the Angus and Holstein breeds arethought to be have existed for over two thousand years inScotland and Germany/North Holland, respectively.However breed development did not occur until the earlyto mid 1800's [32]. The breed histories are very similar inthat, during the past 50 years Angus and Holstein haveexperienced dramatic increases in selection pressure forbeef and milk production, respectively and decreases ineffective population size to approximately 100 individu-als each [33].
Angus animals were selected from Trangie AgriculturalResearch Centre in NSW, Australia. All animals had infor-mation on sire and dam pedigree records, were born from1993 to 2000 and had been selected for high or low post-weaning feed efficiency (FE), or were part of a controlherd. Holstein animals were selected from a researchproject based at Genetics Australia in Victoria, Australia.All animals were bulls selected as semen donors for artifi-cial selection, have information on pedigrees and havebeen selected for high and low estimated breeding values(EBVs) as determined by Australian Selection Index (ASI),which is an economic index of milk, fat and protein yieldfrom bulls' daughters via progeny testing. Approximatelyequal numbers of the extreme highest and lowest FE andASI animals were selected for SNP genotyping. A singleYak (Bos grunniens), North American Bison (Bison bison),Banteng (Bos javanicus) and Water buffalo (Bubalus buba-lis) were chosen as outgroup species and genotyped in aneffort to infer derived and ancestral alleles in both popu-lations of B. taurus. Thus, there were 762 B. taurus animalsand 4 wild relatives genotyped for a number of SNP mark-ers, using the Parallele™ technology.
GenotypingFor each of the 766 animals, DNA was extracted fromblood or semen and DNA samples were diluted to 30 ng/
Page 13 of 19(page number not for citation purposes)
BMC Genomics 2009, 10:181 http://www.biomedcentral.com/1471-2164/10/181
ul. In Angus and the four wild species 9,323 SNPs, distrib-uted across the bovine genome were genotyped at Paral-lele Bio Science Inc. There were slight differences in SNPplatforms as a result of Parallele Bio Sciences being takenover by Affymetrix Inc., thus, a total of 9,919 SNP weregenotyped in Holstein. Only the polymorphisms geno-typed on both breeds were compared.
AnalysisWe used the Python programming language to parse datafiles and extract genotypes for all animals at each locusand calculate frequencies of derived and ancient alleles inAngus and Holstein populations.
Ancestral and derived allelesAncestral alleles were determined using outgroup species.For loci where only one allele was represented in the wildrelatives, that allele was determined as ancestral. Lociwhere both alleles were represented among the outgroupspecies were considered ancient polymorphisms thatmust have arisen at least 2 MYA, before the separation ofthe Bison, Yak, Banteng and B. taurus.
Genomic position of Parallele polymorphismsThe genomic position of all Parallele SNPs were deter-mined by comparing the flanking sequence to the Bovinegenome (Btau_3.1) scaffolds using the BLAT algorithm[34]. Results are presented in the genome browser of theInteractive Bovine In Silico SNP (IBISS) database.
Computer simulationsA computer simulation was developed to determine theprobability that the observed differences in allele frequen-cies between breeds were due to finite Ne without selec-tion. A diploid population, of Ne = 50,000 was simulatedwith mutation and recombination until an equilibriumwas reached. Then Ne was reduced to 1,000, was simu-lated for 1,000 generations. In reality, estimated values ofNe for early domestic B. taurus some 2,000 generationsago was closer to 1,500 [35]. However, for computationalease N = 1,000 and 1,000 generations was chosen. Eachindividual in the population consisted of 29 pairs of chro-mosomes, and was either male or female (probability0.5). Each chromosome was 100 cM long, and had 301marker loci, which resulted in a similar number of poly-morphisms to the real dataset. A pair of parents of differ-ent sex was randomly chosen from the population tocreate each offspring. For each parent in a mating pair, agamete was formed from its chromosome pairs by sam-pling the number of crossovers for each chromosome pairfrom a Poisson distribution, with mean of 1.0. Crossoverpoints were randomly positioned along chromosomepairs. The haploid gametes were mutated at a rate of 5 ×10⁻⁹ per locus per gamete per generation. If a locus wasmutated, a new allele was added.
To model contemporary B. taurus breeds, the simulatedpopulation was subdivided in two at generation 900, bothwith Ne = 200. These populations were simulated withoutinter mating for a further 100 generations, thus generatingan inbreeding coefficient (F = 1-(1-1/2Ne)g), where g =generations, relative to generation 900 of F = 0.22. In gen-eration 1000, the difference in allele frequency was calcu-lated for each marker. The X chromosome was notincluded in the simulation due to difficulties associatedwith the difference in Ne for this chromosome.
Statistical analysisWe used the H statistic developed in Fay and Wu [14] as afrequency based test of selection from species polymor-phism. The H test examines the difference between twoestimates of the population genetic parameter θ, where Neis the effective population size (diploid) and μ is themutation rate per generation.
The first estimate θπ is typically based on the unbiasedheterozygosity in the sample [13,18]. While the secondestimate θH is based on the unbiased estimate of homozy-gosity of the derived allele in the sample [14]. However,in the case where sample numbers are sufficiently large (ieallele frequencies are based on a large number of chromo-somes), it should be suitable to derive the H statistic usingthe uncorrected average heterozygosity (θπ) where p and1-p = the frequency of the derived and ancestral alleles,respectively and NL = the number of loci.
Likewise the uncorrected average homozygosity (θH)should be suitable to estimate from the sample.
Testing the frequency distribution of B. taurus SNP againstthose predicted under the neutral model was completedusing a paired t-test to determine whether the mean valueof θH was significantly larger than θπ. Traditionally signif-icance tests were completed using null distributions gen-erated from computer simulations. Given the largenumber of loci used, the central limit theorem predictsthat the test statistic will be close to a t-distribution evenif the allele frequencies are not normally distributed.
Fay and Wu [14] originally modelled back mutations toaccount for incorrect inferences of derived and ancestralalleles. The presence of back mutations is dependent onthe mutation rate and the divergence time [16]. The closerelationship between B. taurus and the successfully ampli-fied outgroup species should mean that double mutations
θ μ= 4Ne (5)
θπ = −Σ2 1p p NL( ) / (6)
θH2
Lp N= Σ2 / (7)
Page 14 of 19(page number not for citation purposes)
BMC Genomics 2009, 10:181 http://www.biomedcentral.com/1471-2164/10/181
were unlikely. Because the SNP assays are known to bepolymorphic in B. taurus, the probability of a doublemutation is simply the probability of a mutation at thesame base in the lineage leading to Banteng, Bison andYak. Therefore, the probability of a mutation occurring atthe same site is
and the expected number of double mutations over n sitesis
where u = mutation rate per year and t = generation timein years. Therefore, if u is 2.2e-9 from the estimate of mam-malian mutation rates by Subramanian and Kumar [36]and t is the average divergence time for Bison, Yak andBanteng, which is roughly 2.1 MY [20] then the probabil-ity for a double mutation between any of these two spe-cies and B. taurus is 0.005. Thus, for 7,500 bases we wouldexpect 37 such mutations. Hence, the inferred ancestralallele should be correct over 97% of the time and aretherefore assumed to be correct.
The H statistics estimated for Angus and Holstein cattlewere tested for evidence of differences in the frequencyspectrum of derived alleles in the two populations using at-test. Differences in the H statistic between breeds may bedue to increased selective pressure or possibly indicate dif-ferences in population substructure.
Frequency spectrum, the genomic distribution of derived alleles and distinguishing between the effects of positive selection, inbreeding and ascertainment biasFay and Wu's H statistic makes predictions regarding thefrequency distribution of derived alleles under neutrality,which can be affected by population substructure, ascer-tainment bias or positive selection. By cataloguing the var-iation expected and observed with the frequency spectrumof derived alleles, inferences can be made regarding devi-ations from neutrality. Therefore, plots examining thespectrum of the derived polymorphism f(p) against theallele frequency (p) were compared with the theoreticalvalue of derived polymorphisms under neutrality e(p),which is calculated as k/p and is modified from equation4 in Fay and Wu [14], where k was chosen to match theobserved values of f(p) as closely as possible. By compar-ing the frequency of expected and observed values of f(p),observations regarding positive selection and populationsubstructure can be made.
One drawback of using H is that ascertainment bias canaffect the frequency spectrum if there is a bias for commonalleles. However, because derived and ancestral alleles are
known it should be possible to examine the frequencyspectrum of derived alleles devoid of any affects by ascer-tainment bias. The ratio f(1-p)/[f(p)+f(1-p)] should notbe affected by ascertainment bias because this ratio relieson knowing the derived and ancestral allele and this infor-mation is irrelevant during SNP discovery. Therefore, f(1-p)/[f(p)+f(1-p)] was compared with the theoretical spec-trum value l(p), which under neutrality was simply theproportion of derived alleles that were found to be themost common allele, or alternatively, p against p. This canbe restated as: Because f(p) = k/p, f(1-p)/[f(p)+f(1-p)] = k/(1-p)/[k/p + k/(1-p)] = p.
Due to the influence of demographics on Fay and Wu's Hstatistic and the frequency spectrum of derived alleles, wewere interested in detecting whether positive selectionhad driven the frequency of derived alleles in either breedof B. taurus at specific regions of the genome. Therefore,plots of derived allele frequency and the genomic positionwere examined for clustering of high frequency derivedalleles. An autocorrelation of derived allele frequenciesbetween one locus and the next on the chromosome wasalso completed. A positive autocorrelation should indi-cate that high frequency derived alleles are clustered onthe genome and this may be evidence of genetic hitchhik-ing. To test if the observed autocorrelation could be due toinbreeding, we have examined the autocorrelation inAngus and Holstein and the simulated populations,which have been modelled to demonstrate the effect ofinbreeding in the absence of selection.
Ancestral polymorphisms and neutral evolutionThe frequency distribution of ancestral polymorphismswas examined. Ancestral polymorphisms are those thathave been found to be polymorphic in Domestic cattleand also vary between the wild relatives (Bison, Yak andBanteng), and hence no ancestral allele could be deter-mined for these sites. The frequency distribution of allelefrequencies at these ancestral polymorphisms should fol-low a neutral model with a relatively flat distribution asthey would have been segregating for ~2 million years, orsince all species last shared a common ancestor. Thus theJ shaped curve expected for derived mutants is notexpected and a flat distribution is predicted under neutral-ity, as these polymorphisms are ancient with no influx ofnew mutations. Therefore, plots examining the frequencyspectrum of ancestral alleles f(p) were compared with pand the theoretical value a(p), which was simply the meanvalue for f(p).
Differences between breeds in allele frequencyTo determine if recent selection was responsible for thedifferences in allele frequencies between Angus and Hol-stein plots of Fst and average allele frequency were derivedfor Angus vs Holstein and the two simulated populations.
( ( ) )1 1− − u t (8)
n u t( ( ) )1 1− − (9)
Page 15 of 19(page number not for citation purposes)
BMC Genomics 2009, 10:181 http://www.biomedcentral.com/1471-2164/10/181
The fixation index (Fst) is an estimate of population dif-ferentiation based on genetic polymorphism data. Esti-mates of Fst were calculated using the relationshipbetween inbreeding and heterozygosity, which allows Fstto be calculated from genetic markers using the followingequation modified from equation 13.7 in Frankham et al.[37]
where Hs is the expected heterozygosity averaged acrossall populations and Ht = the expected heterozygosityexpected for the total population. Thus, Fst must varyfrom 0 to 1, which at the extremes represent fixation ofalleles in different populations. If derived alleles havebeen fixed in one population and not in the other, as aresult of positive selection, one might expect reasonablyhigh values of Fst for alleles with extreme allele frequen-cies. Alternatively, if these alleles have drifted to fixationthe frequency distribution of Fst should be independentof allele frequency.
Authors' contributionsSM collected and prepared outgroup species for genotyp-ing, analysed the SNPs and prepared the manuscript forsubmission. BH wrote the simulation for comparisonwith the real population. JM and MG coordinated thestudy and provided statistical and writing support. Allauthors read and approved the final manuscript.
Additional material
Additional file 1Plots for Angus and Holstein examining the frequency of the derived allele and Fst in relation to genomic position for chromosome 1.Click here for file[http://www.biomedcentral.com/content/supplementary/1471-2164-10-181-S1.jpeg]
Additional file 2Plots for Angus and Holstein examining the frequency of the derived allele and Fst in relation to genomic position for chromosome 2.Click here for file[http://www.biomedcentral.com/content/supplementary/1471-2164-10-181-S2.jpeg]
Additional file 3Plots for Angus and Holstein examining the frequency of the derived allele and Fst in relation to genomic position for chromosome 3.Click here for file[http://www.biomedcentral.com/content/supplementary/1471-2164-10-181-S3.jpeg]
Fst Ht Hs Ht= −( ) / (10)
Additional file 4Plots for Angus and Holstein examining the frequency of the derived allele and Fst in relation to genomic position for chromosome 4.Click here for file[http://www.biomedcentral.com/content/supplementary/1471-2164-10-181-S4.jpeg]
Additional file 5Plots for Angus and Holstein examining the frequency of the derived allele and Fst in relation to genomic position for chromosome 5.Click here for file[http://www.biomedcentral.com/content/supplementary/1471-2164-10-181-S5.jpeg]
Additional file 6Plots for Angus and Holstein examining the frequency of the derived allele and Fst in relation to genomic position for chromosome 6.Click here for file[http://www.biomedcentral.com/content/supplementary/1471-2164-10-181-S6.jpeg]
Additional file 7Plots for Angus and Holstein examining the frequency of the derived allele and Fst in relation to genomic position for chromosome 7.Click here for file[http://www.biomedcentral.com/content/supplementary/1471-2164-10-181-S7.jpeg]
Additional file 8Plots for Angus and Holstein examining the frequency of the derived allele and Fst in relation to genomic position for chromosome 8.Click here for file[http://www.biomedcentral.com/content/supplementary/1471-2164-10-181-S8.jpeg]
Additional file 9Plots for Angus and Holstein examining the frequency of the derived allele and Fst in relation to genomic position for chromosome 9.Click here for file[http://www.biomedcentral.com/content/supplementary/1471-2164-10-181-S9.jpeg]
Additional file 10Plots for Angus and Holstein examining the frequency of the derived allele and Fst in relation to genomic position for chromosome 10.Click here for file[http://www.biomedcentral.com/content/supplementary/1471-2164-10-181-S10.jpeg]
Additional file 11Plots for Angus and Holstein examining the frequency of the derived allele and Fst in relation to genomic position for chromosome 11.Click here for file[http://www.biomedcentral.com/content/supplementary/1471-2164-10-181-S11.jpeg]
Page 16 of 19(page number not for citation purposes)
BMC Genomics 2009, 10:181 http://www.biomedcentral.com/1471-2164/10/181
Additional file 12Plots for Angus and Holstein examining the frequency of the derived allele and Fst in relation to genomic position for chromosome 12.Click here for file[http://www.biomedcentral.com/content/supplementary/1471-2164-10-181-S12.jpeg]
Additional file 13Plots for Angus and Holstein examining the frequency of the derived allele and Fst in relation to genomic position for chromosome 13.Click here for file[http://www.biomedcentral.com/content/supplementary/1471-2164-10-181-S13.jpeg]
Additional file 14Plots for Angus and Holstein examining the frequency of the derived allele and Fst in relation to genomic position for chromosome 14.Click here for file[http://www.biomedcentral.com/content/supplementary/1471-2164-10-181-S14.jpeg]
Additional file 15Plots for Angus and Holstein examining the frequency of the derived allele and Fst in relation to genomic position for chromosome 15.Click here for file[http://www.biomedcentral.com/content/supplementary/1471-2164-10-181-S15.jpeg]
Additional file 16Plots for Angus and Holstein examining the frequency of the derived allele and Fst in relation to genomic position for chromosome 16.Click here for file[http://www.biomedcentral.com/content/supplementary/1471-2164-10-181-S16.jpeg]
Additional file 17Plots for Angus and Holstein examining the frequency of the derived allele and Fst in relation to genomic position for chromosome 17.Click here for file[http://www.biomedcentral.com/content/supplementary/1471-2164-10-181-S17.jpeg]
Additional file 18Plots for Angus and Holstein examining the frequency of the derived allele and Fst in relation to genomic position for chromosome 18.Click here for file[http://www.biomedcentral.com/content/supplementary/1471-2164-10-181-S18.jpeg]
Additional file 19Plots for Angus and Holstein examining the frequency of the derived allele and Fst in relation to genomic position for chromosome 19.Click here for file[http://www.biomedcentral.com/content/supplementary/1471-2164-10-181-S19.jpeg]
Additional file 20Plots for Angus and Holstein examining the frequency of the derived allele and Fst in relation to genomic position for chromosome 20.Click here for file[http://www.biomedcentral.com/content/supplementary/1471-2164-10-181-S20.jpeg]
Additional file 21Plots for Angus and Holstein examining the frequency of the derived allele and Fst in relation to genomic position for chromosome 21.Click here for file[http://www.biomedcentral.com/content/supplementary/1471-2164-10-181-S21.jpeg]
Additional file 22Plots for Angus and Holstein examining the frequency of the derived allele and Fst in relation to genomic position for chromosome 22.Click here for file[http://www.biomedcentral.com/content/supplementary/1471-2164-10-181-S22.jpeg]
Additional file 23Plots for Angus and Holstein examining the frequency of the derived allele and Fst in relation to genomic position for chromosome 23.Click here for file[http://www.biomedcentral.com/content/supplementary/1471-2164-10-181-S23.jpeg]
Additional file 24Plots for Angus and Holstein examining the frequency of the derived allele and Fst in relation to genomic position for chromosome 24.Click here for file[http://www.biomedcentral.com/content/supplementary/1471-2164-10-181-S24.jpeg]
Additional file 25Plots for Angus and Holstein examining the frequency of the derived allele and Fst in relation to genomic position for chromosome 25.Click here for file[http://www.biomedcentral.com/content/supplementary/1471-2164-10-181-S25.jpeg]
Additional file 26Plots for Angus and Holstein examining the frequency of the derived allele and Fst in relation to genomic position for chromosome 26.Click here for file[http://www.biomedcentral.com/content/supplementary/1471-2164-10-181-S26.jpeg]
Additional file 27Plots for Angus and Holstein examining the frequency of the derived allele and Fst in relation to genomic position for chromosome 27.Click here for file[http://www.biomedcentral.com/content/supplementary/1471-2164-10-181-S27.jpeg]
Page 17 of 19(page number not for citation purposes)
BMC Genomics 2009, 10:181 http://www.biomedcentral.com/1471-2164/10/181
AcknowledgementsWe thank staff from the Toronga open plains zoo, Claire Gill and Jeannette Muntwyler for providing the outgroup samples. Thanks to Amanda Cham-berlain, Lakshmi Sethuraman and Jodie Ryan for extracting and preparing DNA for SNP analysis by Parallele. We also thank Keith Savin for work identifying genomic positions of SNP using existing human and cattle web resources, and Gemma Payne plus two anonymous reviewers for their con-tributions to editing the manuscript. The authors acknowledge the early access under the Fort Lauderdale conventions to the draft bovine genome sequence provided by the bovine genome sequencing project consortia and in particular Richard Gibbs and George Weinstock and the rest of the Bay-lor Human Genome Sequencing Center.
References1. Ward TJ, Honeycutt RL, Derr JN: Nucleotide sequence evolution
at the kappa-casein locus: evidence for positive selectionwithin the family Bovidae. Genetics 1997, 147(4):1863-72.
2. Beja-Pereira A, Luikart G, England PR, Bradley DG, Jann OC, Bertore-lle G, Chamberlain AT, Nunes TP, Metodiev S, Ferrand N, Erhardt G:Gene-culture coevolution between cattle milk protein genesand human lactase genes. Nat Genet 2003, 35(4):311-3.
3. Van Laere AS, Nguyen M, Braunschweig M, Nezer C, Collette C,Moreau L, Archibald AL, Haley CS, Buys N, Tally M, Andersson G,Georges M, Andersson L: A regulatory mutation in IGF2 causesa major QTL effect on muscle growth in the pig. Nature 2003,425(6960):832-6.
4. Wiener P, Burton D, Ajmone-Marsan P, Dunner S, Mommens G, Nij-man IJ, Rodellar C, Valentini A, Williams JL: Signatures of selec-tion? Patterns of microsatellite diversity on a chromosomecontaining a selected locus. Heredity 2003, 90(5):350-8.
5. Andersson L, Georges M: Domestic-animal genomics: decipher-ing the genetics of complex traits. Nat Rev Genet 2004,5(3):202-12.
6. Cohen-Zinder M, Seroussi E, Larkin DM, Loor JJ, Everts-van der WindA, Lee JH, Drackley JK, Band MR, Hernandez AG, Shani M, Lewin HA,Weller JL, Ron M: Identification of a missense mutation in thebovine ABCG2 gene with a major effect on the QTL on chro-mosome 6 affecting milk yield and composition in Holsteincattle. Genome Res 2005, 15(7):936-44.
7. Lynn DJ, Freeman AR, Murray C, Bradley DG: A genomicsapproach to the detection of positive selection in cattle:adaptive evolution of the T-cell and natural killer cell-surfaceprotein CD2. Genetics 2005, 170(3):1189-96.
8. Pollinger JP, Bustamante CD, Fledel-Alon A, Schmutz S, Gray MM,Wayne RK: Selective sweep mapping of genes with large phe-notypic effects. Genome Res 2005, 15(12):1809-19.
9. Li MH, Adamowicz T, Switonski M, Ammosov I, Ivanova Z, KiselyovaT, Popov R, Kantanen J: Analysis of population differentiation inNorth Eurasian cattle (Bos taurus) using single nucleotidepolymorphisms in three genes associated with productiontraits. Anim Genet 2006, 37(4):390-2.
10. Hayes BJ, Lien S, Nilsen H, Gro Olsen H, Berg P, MacEachern S, Pot-ter S, Meuwissen THE: The origin of selection signatures onbovine chromosome six. Anim Genet 2008, 39(2):105-11.
11. Akey JM, Zhang G, Zhang K, Jin L, Shriver MD: Interrogating ahigh-density SNP map for signatures of natural selection.Genome Res 2002, 12(12):1805-14.
12. Kimura M: The neutral theory of molecular evolution. Cam-bridge: Cambridge University Press; 1983.
13. Tajima F: Statistical method for testing the neutral mutationhypothesis by DNA polymorphism. Genetics 1989,123(3):585-95.
14. Fay JC, Wu CI: Hitchhiking under positive Darwinian selec-tion. Genetics 2000, 155(3):1405-13.
15. Akashi H: Within- and between-species DNA sequence varia-tion and the 'footprint' of natural selection. Gene 1999,238(1):39-51.
16. Przeworski M: The signature of positive selection at randomlychosen loci. Genetics 2002, 160(3):1179-89.
17. Sabeti PC, Schaffner SF, Fry B, Lohmueller J, Varilly P, Shamovsky O,Palma A, Mikkelsen TS, Altshuler D, Lander ES: Positive naturalselection in the human lineage. Science 2006,312(5780):1614-20.
18. Tajima F: Evolutionary relationship of DNA sequences in finitepopulations. Genetics 1983, 105(2):437-60.
19. Gautier M, Faraut T, Moazami-Goudarzi K, Navratil V, Foglio M,Grohs C, Boland A, Garnier J, Boichard D, Lathrop GM, Gut IG,Eggen A: Genetic and haplotypic structure in 14 European andAfrican cattle breeds. Genetics 2007, 177(2):1059-1070.
20. MacEachern S, McEwan J, Goddard M: Phylogenetic reconstruc-tion and the identification of ancient polymorphism in theBovini tribe (Bovidae, Bovinae). BMC Genomics 2009, 10:177.
21. McClure MC, Schnabel RD, Morsci NS, Kim JW, Sellner EM, Yao P,Taylor JF: Whole Genome Mapping For Marbling QTL In ACommercial Angus Cattle Population. In Plant & AnimalGenome XV Conference Town & Country Hotel, San Diego, CA;2007:P524.
22. Website, Bovine QTL Viewer [http://genomes.sapac.edu.au/bovineqtl/index.html]
23. Bradley DG, Loftus RT, Cunningham P, Machugh DE: Genetics andDomestic Cattle Origins. Evolutionary Anthropology 1998,6(3):79-86.
24. Diamond J: Evolution, consequences and future of plant andanimal domestication. Nature 2002, 418(6898):700-7.
25. Bruford MW, Bradley DG, Luikart G: DNA markers reveal thecomplexity of livestock domestication. Nat Rev Genet 2003,4:900-910.
26. Akey JM, Eberle MA, Rieder MJ, Carlson CS, Shriver MD, NickersonDA, Kruglyak L: Population History and Natural SelectionShape Patterns of Genetic Variation in 132 Genes. PLOS Biol2004, 2(10):1591-1599.
27. MacEachern S, McEwan J, McCulloch A, Mather A, Savin K, GoddardM: Molecular evolution of the Bovini tribe (Bovidae, Bovi-nae): Is there evidence of rapid evolution or reduced selec-tive constraint in Domestic cattle? BMC Genomics 2009, 10:179.
28. Kumar S, Subramanian S: Mutation rates in mammaliangenomes. Proc Natl Acad Sci USA 2002, 99(2):803-8.
29. Ward TJ, Skow LC, Gallagher DS, Schnabel RD, Nall CA, Kolenda CE,Davis SK, Taylor JF, Derr JN: Differential introgression of unipa-rentally inherited markers in bison populations with hybridancestries. Anim Genet 2001, 32(2):89-91.
30. Halbert ND, Ward TJ, Schnabel RD, Taylor JF, Derr JN: Conserva-tion genomics: disequilibrium mapping of domestic cattlechromosomal segments in North American bison popula-tions. Mol Ecol 2005, 14(8):2343-62.
31. Takahata N, Satta Y, Klein J: Divergence time and populationsize in the lineage leading to modern humans. Theor Popul Biol1995, 48(2):198-221.
Additional file 28Plots for Angus and Holstein examining the frequency of the derived allele and Fst in relation to genomic position for chromosome 28.Click here for file[http://www.biomedcentral.com/content/supplementary/1471-2164-10-181-S28.jpeg]
Additional file 29Plots for Angus and Holstein examining the frequency of the derived allele and Fst in relation to genomic position for chromosome 29.Click here for file[http://www.biomedcentral.com/content/supplementary/1471-2164-10-181-S29.jpeg]
Additional file 30Plots for Angus and Holstein examining the frequency of the derived allele and Fst in relation to genomic position for chromosome X.Click here for file[http://www.biomedcentral.com/content/supplementary/1471-2164-10-181-S30.jpeg]
Page 18 of 19(page number not for citation purposes)
BMC Genomics 2009, 10:181 http://www.biomedcentral.com/1471-2164/10/181
Publish with BioMed Central and every scientist can read your work free of charge
"BioMed Central will be the most significant development for disseminating the results of biomedical research in our lifetime."
Sir Paul Nurse, Cancer Research UK
Your research papers will be:
available free of charge to the entire biomedical community
peer reviewed and published immediately upon acceptance
cited in PubMed and archived on PubMed Central
yours — you keep the copyright
Submit your manuscript here:http://www.biomedcentral.com/info/publishing_adv.asp
BioMedcentral
32. Friend JB, Bishop D: Cattle of the World in Colour. Poole: Bland-ford Press; 1978.
33. de Roos APW, Hayes BJ, Spelman RJ, Goddard ME: Linkage dise-quilibrium and persistence of phase in Holstein Friesian, Jer-sey and Angus cattle. Genetics 2008, 179:1503-1512.
34. Kent WJ: BLAT – the BLAST-like alignment tool. Genome Res2002, 12(4):656-64.
35. Goddard M, Hayes BJ, McPartlan HC, Chamberlain AT: Can thesame genetic markers be used in multiple breeds. In Proceed-ings of the 8th World Congress on Genetics Applied to Livestock ProductionBelo Horizonte, Brazil; 2006:14-22.
36. Subramanian S, Kumar S: Neutral substitutions occur at a fasterrate in exons than in noncoding DNA in primate genomes.Genome Res 2003, 13(5):838-44.
37. Frankham R, Ballou JD, Brisoce DA: Introduction to Conserva-tion Genetics. Cambridge: Cambridge University Press; 2002.
Page 19 of 19(page number not for citation purposes)