an evolutionary approach to the measurement of development of the knowledge and innovation economies
TRANSCRIPT
24
Chapter 2.
An Evolutionary Approach to Measurement
of Development of the Knowledge and
Innovation Economies
Krzysztof Piech
Introduction
The aim of the research was to assess the competitiveness of countries (mostly the European ones) with a bias towards knowledge and innovation in comparison to other methodologies of competitiveness measurement. We follow here the evolutionary approach of Schumpeter, and Freeman and Louca (2001). This paper contains parts of the papers published previously in Piech (2008 and 2009).
2.1. Conceptual framework
Different approaches to the measurement the competitiveness and the so-called knowledge-based economy were first analysed. The reviews of knowledge economy measurement were presented e.g. in Piech (2004). There is much broader literature on measurement of competitiveness, as this notion is being known to economists for dozens of years. Probably since the famous Porter’s work entitled „The Competitive Advantage of Nations” (Porter 1990) the ideas that knowledge and innovations may be among the driving forces of competitiveness were underlined well enough to stimulate further interests in them and their relations with economic growth. We should not however ne-
Krzysztof Piech
25
glect earlier works of e.g. Schumpeter (1911, 1939), who’s works on the role of entrepreneurs and innovations were one of the milestones in economics. It however had to wait until it was much later appreciated (as far as in 1990s).
However, what has really stimulated the interests in the notions of “knowledge” and “innovations” was the next industrial revolution, which has happened just in 1990s. It was the information resolution, which has brought an intensive use of means of enabling fast communication (information and telecommunication technologies – ICTs). This was always a factor having impact on development: since the ancient times the armies, the countries that were better able to communicate had a competitive advantage thanks to which were sometimes able to win battles, wars or develop faster in peaceful times. The discovery of computer was not a factor that had a direct impact on industrial revolution. It was similar to other discoveries: sometimes many years have to pass before the new technology became widely used. The years 1980s have brought computer to homes, when IBM introduced first personal computers. It was possible also due to the development and diffusion of semiconductor technology caused by the growing competition on this market (Jorgensen 2001). Together with software enabling their easier utilisation, including some relaxing purposes (i.e. computer games), they became more accessible for non-technical users. However the most important might have been the invention of ways of connecting the computer and enabling their users to communicate easily. Internet was the real stimulus for the information revolution and some other inventions like the mobile phones only intensified it. Concluding: the in-ventions of computer, software, and internet were crucial for the present in-dustrial revolution. They are a few examples of innovations that also in the past led to industrial revolutions.
These inventions were however possible due to the knowledge accommoda-tion. Without very many earlier discoveries, research results, but also without the knowledge embodied in humans enabling them to operate the more so-phisticated tools, the invention of microprocessor or such complicated software like Windows operating system would not be possible. Thus we see that alt-hough innovation is something that may boost development quite directly (but not immediate), it is the knowledge and for the long term is responsible for technological and economic (or even – civilisation) progress. What should be added here we do not only consider the creation of knowledge, but its overall, more universal accumulation. Thus, the exchange of knowledge is also im-portant through globalisation, external openness of countries, societies or with the use of ICTs.
An evolutionary approach to measurement…
26
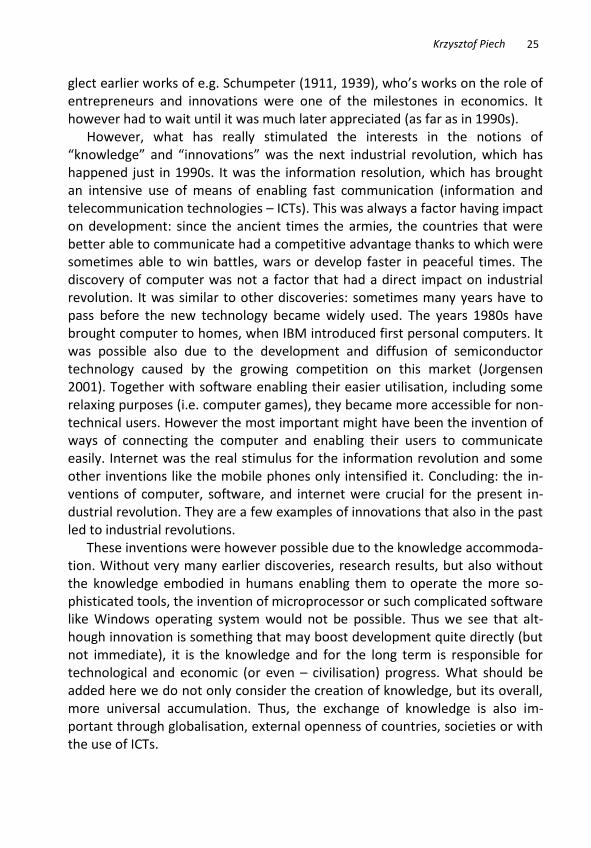
We will try to present this idea at the picture below. It adopts some findings of Schumpeter (i.e. the innovation waves). We see that the next technological wave starts from the higher level than the previous one. It is possible thanks to the accumulation of knowledge that has happened in the meantime. Differently than Perez (2002), who favours the idea of c. half-century length of changes, we are convinced that the length of technological waves is becoming shorter. It means that the accumulation of knowledge enables new discoveries to be found out earlier, because knowledge develops not only in the direction of the present, dominating (from growth perspective) technology, but may appear somewhere else, because knowledge development is not linear. Figure 2.1. Model of development with innovations and knowledge accumulation
Source: own study.
The knowledge accumulation curve together with the innovation ones are
becoming sharper what also express of the pace of development. Economic, historical estimations show that the economic growth has started after the first industrial revolution (it was approximated that before the rate of economic development was close to zero, and thereafter increased in the industrialising countries to c. 1% annually). Later, it became faster. However, even most of developed countries face the problems with technology frontiers, i.e. it is very costly to invent new technologies, the rest of the world have still a large poten-tial to catch-up and may be an engine of the world’s development. Neverthe-less, the comparisons of the historical growth rates show that nowadays the pace of development of the world is much higher than e.g. a century ago and it seems that it continue to increase (despite medium-term business cycles).
Krzysztof Piech
27
Recent years have brought into economics some better understanding of development processes. The technological progress and its consequences de-pends also on institutions, both in broader meaning (e.g. democracy, creative environment, intellectual rights protection, control over corruption) and in narrower meaning (quality of economic policy, ability of forecasting it etc.). They influence both innovations and knowledge (accumulation, creation, dis-semination, usage). Large, sharp institutional change may play a role of an in-novation (we could observe it at the beginning of 1990s in many transition countries), but further they evolve and are similar to the role of knowledge – they change rather smoothly and in a long run.
From this perspective, Schumpeter’s works on of his followers have changed our understanding of process of economic development: it does not consist of stages (as e.g. Rostow (1960) has seen it), but of perpetual process of radical innovations stimulating development. It creates so-called idea of techno-economic paradigm of development (Perez 1985).
All of these processes outlined above should be somehow included in a con-cept enabling comparison of development of countries as well as of abilities of them to beat the others, to win competition and develop faster. Thus, we have distinguished between the following dimensions of civilisation evolution and key transformations accompanying them: 1. technological transformation (creation and use of more sophisticated
technologies; transformation from low-tech to high-tech), 2. communication changes (showing time and costs necessary to communi-
cate, from the necessity to travel (on food, by horse) to deliver a message through sending letters (and later also faxes) to e-mails and exchange of movies),
3. globalisation (factor that stimulates exchange of knowledge, intermediates in exchanging goods, enabling pressure from foreign countries, companies to modernise, to be more competitive; transformation from closed, autar-chic countries to very open ones with multinational corporations and FDIs present),
4. social development – social evolution (transition from the usage of muscles through the usage of machines to the use of intellect; from peasants and labourers to the knowledge workers),
5. institutional maturity (ability of a country to have well-functioning institu-tions, both in a wider and in a narrower meaning, as discussed above).
We believe that all of the above elements lead to the creation of knowledge and innovation economy. This notion however is not about ICTs only, does not

An evolutionary approach to measurement…
28
(or should not) be limited to the matters of education or technology only. They are not enough to understand development, which has also some other im-portant aspects.
This scope of development shows also that we associate the results of civili-sation evolution not only with such measures like size of economy per person. Social development is also not only about the salaries, incomes of households etc. This can have broader meaning, based on values that are believed as im-portant, e.g. social cohesion, protection of clean environment. Education can also be treated similarly.
Transition countries mostly concentrated on institutional transformation. Some of them included also globalisation, e.g. Estonia. It was believed that the society will follow the institutional changes, and in many cases it happened indeed, however some its parts were unable to adopt (and are still excluded: passive, unable to take risks, change (or find) jobs). It was also believed that together with the progress towards openness to the influence of globalisation, also technologies will inflow. However it has not happened yet on the scale, which should be satisfying. The level, structure and quality education of the labour force may be one of the brakes that do not provide satisfactory techno-logical development. Moreover, the social and technological transformation could have been stimulated by institutions, however not everywhere they were properly constructed (during the early transition processes) and therefore able to do this.
We see that some of these processes depend on others. From the point of view of stimulation of development it would be important to know them, un-derstand them and to apply the conclusions that could be derived from them. Below we will try to gather them on a simple picture. We tried to concentrate not on all the possible aspects but only on the most important ones that seem to be dominating over the others.
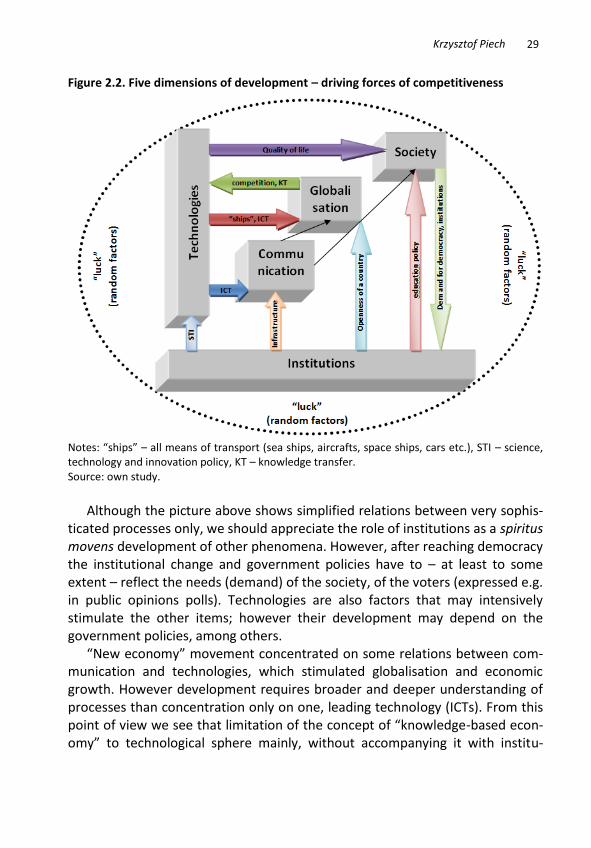
Institutions may play a crucial role in stimulation of development of science, technology and innovation running proper policies. Government may enhance communication through participation in building of infrastructure, setting up standards, issuing regulations ordering the markets, avoiding too extensive taxation etc. The scale of openness of a country also depends on institutions by such instruments like tariffs, transport infrastructure, education policy etc. Globalisation is also stimulated by technological (with communication) devel-opment, with the role of ICTs especially well visible during last several years. On the other hand globalisation stimulates competition and brings knowledge what stimulates technological development. Technologies also increase quality of life through many inventions applied in everyday life.
Krzysztof Piech
29
Figure 2.2. Five dimensions of development – driving forces of competitiveness
Notes: “ships” – all means of transport (sea ships, aircrafts, space ships, cars etc.), STI – science, technology and innovation policy, KT – knowledge transfer. Source: own study.
Although the picture above shows simplified relations between very sophis-
ticated processes only, we should appreciate the role of institutions as a spiritus movens development of other phenomena. However, after reaching democracy the institutional change and government policies have to – at least to some extent – reflect the needs (demand) of the society, of the voters (expressed e.g. in public opinions polls). Technologies are also factors that may intensively stimulate the other items; however their development may depend on the government policies, among others.
“New economy” movement concentrated on some relations between com-munication and technologies, which stimulated globalisation and economic growth. However development requires broader and deeper understanding of processes than concentration only on one, leading technology (ICTs). From this point of view we see that limitation of the concept of “knowledge-based econ-omy” to technological sphere mainly, without accompanying it with institu-
An evolutionary approach to measurement…
30
tions, knowledge society, globalisation processes may be misleading in explain-ing the changes that are happening for decades.
2.2. Analytical framework
The above outlined “big picture” should be equipped with more analytical instruments in order to allow better observations not of the long-term process-es happening in civilisations or groups of countries, but of the short term changes in particular countries. In order to do this we have reviewed all possi-ble (and widely-recognised) methodologies of measurement of the knowledge economy and innovations. In stead of choosing TFP approach based on regres-sions, we have chosen an approach used to capture competitiveness. As it is also difficult to measure competitiveness, we believe that measurement of competitiveness with the special focus on knowledge and innovations should also follow this road. Thus, we have gathered data, which were (freely) accessi-ble for the large possible group of countries concentrating on the European ones, for the longest possible time periods and for as many indicators as possi-ble.
Three main methodologies were combined in order to elaborate a new one:
1. Knowledge Assessment Methodology of the World Bank Institute, 2. Global Competitiveness of the World Economic Forum, 3. European Innovation Scoreboard of the MERIT and the European Commis-
sion.
The above outlined conceptual framework was adopted. There were five main groups of indicators with 2-4 subgroups:
1. knowledge society: a) labour market, b) (formal) education, c) scientists, d) level of economic development;
2. globalisation: a) exchange of goods and trade, b) “exchange of embodied knowledge”, c) R&D financing from abroad;
3. technological development: a) innovativeness of economies, b) innovativeness of enterprises;
Krzysztof Piech
31
4. communication: a) “traditional” communication, b) Internet penetration, c) ICT spending;
5. institutions: a) legal environment, b) macroeconomic environment, c) structural policy, d) democracy and quality of politics.
The process of statistical transformation of data consisted of four main
steps:
» collection of data, » verification of data, » correlation analysis of the variables, » standardisation of data.
Once the data were fully prepared, the calculations leading to the final re-sults were conducted.
The largest source of data was Eurostat. We put much emphasis on adop-tion of structural indicators, as they are important from policy recommenda-tions point of view. We have also used the data from: International Telecom-munication Union (from the UN website), World Governance Indicators and indicators from Doing Business reports of the World Bank, United Nations Sta-tistical Division and the Heritage Foundation.
We have used the simplest method of weighting the variables: all of them were assigned the same weights, as it is quite widely used in different method-ologies. Other approaches were also checked (e.g. factor analysis), however they did not led to conclusive results.1
We tried to collect the longest possible time series and due to the compara-bility requirements we have limited the analysed period to the years 1994-2006.
34 countries were considered (see appendix). Most of them were the Euro-pean countries, but also the United States, Japan, Turkey (country regarded as
1 Fagerberg and Srholec (2005) have successfully adopted factor analysis in their research and
have identified knowledge as one of the important factors of development. This method was also checked by the European Commission in the EIS, however its results were not used in further studies.
An evolutionary approach to measurement…
32
a candidate to the EU). There were all EU member states included and also: Croatia, Island, Norway, and Switzerland.
The lacking data were added. Two situations were possible:
1. the “holes” within the time series or 2. the lacks at the end of the data series.
In the first situation the missing data were estimated using a simple average of neighbouring data. The second problem was solved with the use of extrapo-lation of trends and not assuming, like many international institutions do so that the lacking data should be replaced with the closest available data. Two shapes of trends were used: linear and exponential (choosing the most suitable one for the specific variable). The maximum horizon of forecasts was assigned with the use of heuristics that each additional forecasted period requires hav-ing 2-3 real (historical) data. Where it was possible, longer data were used to obtain replacing values (e.g. if data for 1990-93 were available, they were also used, however the size of the period used for estimation of missing data was limited to 10 year, what was intended to reflected the length of the business cycle and – as was checked – gave better forecasting results than longer series especially while forecasting some technological changes). Of course, if the fore-casts gave unreal results (e.g. negative values when only the positive ones were possible), they were not included. Moreover, if the forecasted value was high-est than any other existing value, it also was not added to the database.
Despite the trials to obtain more complete database, some of the variables were still lacking many values. From this reason an important variable – e-commerce through internet had to be eliminated.
After first preparatory works with the database, the relations between the variables were studied. The aim of this operation was to avoid situation of hav-ing many intercorrelated variables. As we adopted equal weights it would result in a bias of the final value of indicator towards such groups of variables. To-gether with the statistical criterion we applied also the policy relevance one, i.e. even if statistical methods indicated a specific variable to be eliminated, but it seemed to be very important from the possible policy recommendations point of view, it could stay in the database.
Two methods were used to identify the intercorrelated variables:
1. simple correlation matrix, and 2. agglomeration method (one of the cluster analysis methods) in three vari-
ants: a) single linkage,
Krzysztof Piech
33
b) weighted pair-group average and c) Ward’s method, counting the distances with the use of two measures of distance:
Euclidean distance and
1-r Pearson distance.
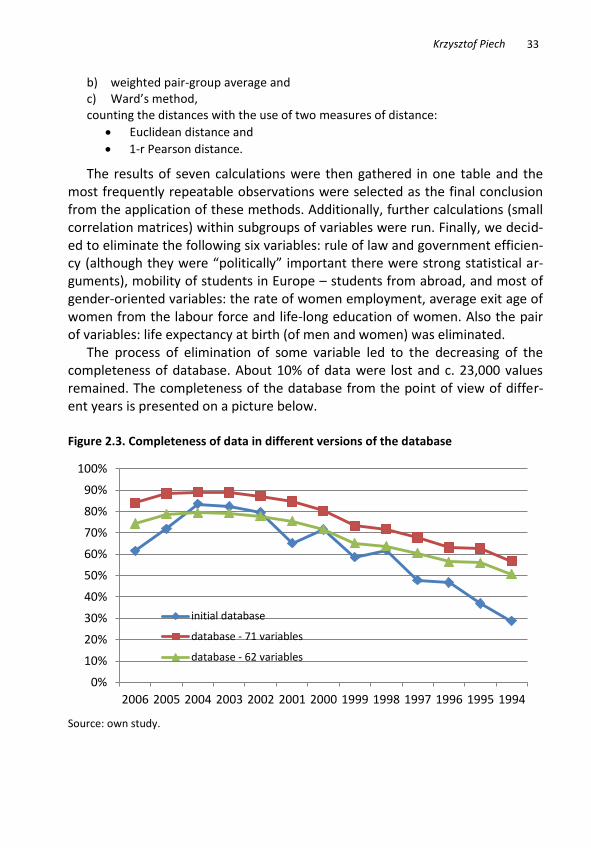
The results of seven calculations were then gathered in one table and the most frequently repeatable observations were selected as the final conclusion from the application of these methods. Additionally, further calculations (small correlation matrices) within subgroups of variables were run. Finally, we decid-ed to eliminate the following six variables: rule of law and government efficien-cy (although they were “politically” important there were strong statistical ar-guments), mobility of students in Europe – students from abroad, and most of gender-oriented variables: the rate of women employment, average exit age of women from the labour force and life-long education of women. Also the pair of variables: life expectancy at birth (of men and women) was eliminated.
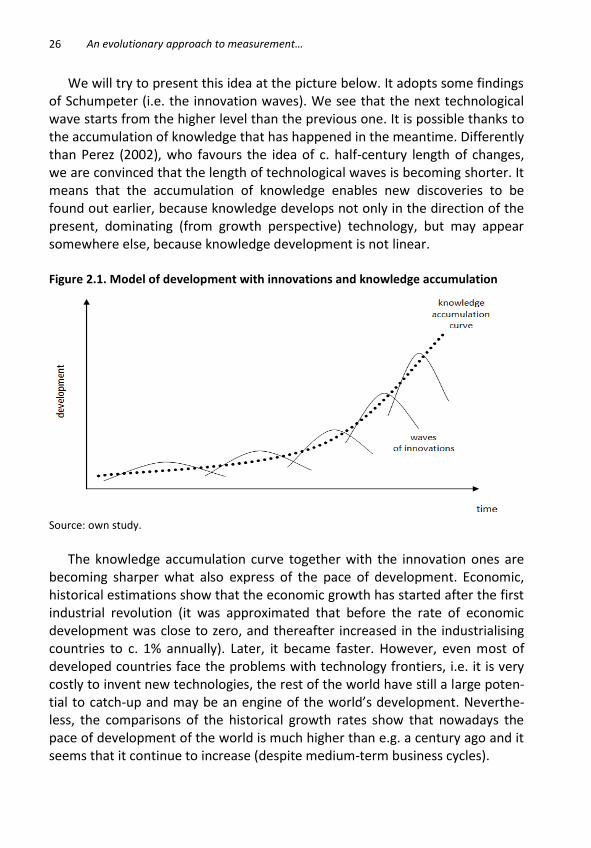
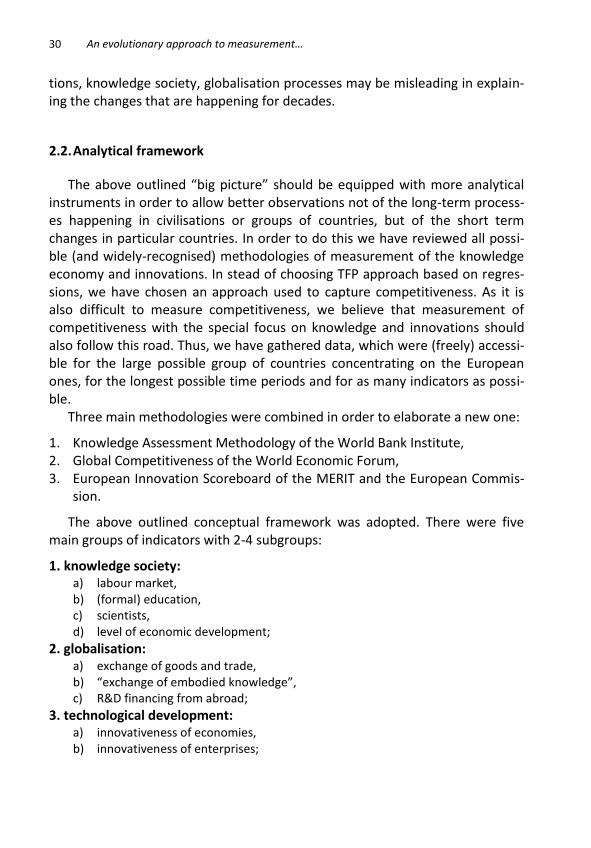
The process of elimination of some variable led to the decreasing of the completeness of database. About 10% of data were lost and c. 23,000 values remained. The completeness of the database from the point of view of differ-ent years is presented on a picture below. Figure 2.3. Completeness of data in different versions of the database
Source: own study.
0%
10%
20%
30%
40%
50%
60%
70%
80%
90%
100%
2006 2005 2004 2003 2002 2001 2000 1999 1998 1997 1996 1995 1994
initial database
database - 71 variables
database - 62 variables
An evolutionary approach to measurement…
34
The final database that was used for further calculations had from 50% of data for 1994 up to 80% for 2003-04. It is in most cases more complete (espe-cially at the ends of the analysed period) than the initial database, i.e. before missing data were added and some variables eliminated.
As a result of the preparatory works, we have used the set of 62 variables. The list of them is in the appendix 2. The next stage before obtaining the final values was the standardisation of data. It consisted of four steps:
1. identification and elimination of extreme observations, 2. normalisation, 3. rescaling of all data, 4. rescaling the destimulants.
The first step was conducted with the use of the Grubbs test which was veri-fied by the significance test. The analysis was also enriched by the use of graph-ical presentation of the dispersion of data. Extreme values were identified as such ones when their values were higher than three lengths between the first and the third quartile. Some of the identified extreme values remained in the database, if it was justified; some were replaced by approximated data, and the rest – completely deleted.
Then, the normalisation of data was conducted. The values were trans-formed in such a way to receive their average value equal zero with the stand-ard deviation equal one. All within the same year. Thereafter the data were rescaled to fit the range from 0 to 100. Seven variables were identified as des-timulants (the increase of values of a variable lead to the decrease of competi-tiveness, e.g. unemployment rate) and their values were transformed to reflect their characteristics.
Finally, the averages of subgroups of variables and of groups of them were counted. Again, the analysis was conducted aimed at identification of extreme values. Some data for variables had to be eliminated, other – replaced with estimations.
The initial results which were obtained were deeply studied to find any sur-prising results like some sharp changes of value of the final indicator. We have noticed large fluctuations caused by the missing data. In order to solve this problem the standardisation method was modified: this procedure was run not on each year separately, but on the period of 12 years. The process of rescaling of data also included the lowest and highest values over the whole period of 12 years.
Krzysztof Piech
35
The final values of the indicator of competitiveness were obtained again. Some values were again eliminated, after checking the matters of extreme val-ues not from the time perspective, but from the structural point of view (values for different countries and identification of outlying countries).
Basing on the completeness of the database we estimated the reliability of the results obtained in order to ensure proper interpretation of results.
The results for specific years did not change much in comparison to the situ-ation presented earlier graphically.
As a result of the above described efforts, the stability of the results ob-tained has increased.
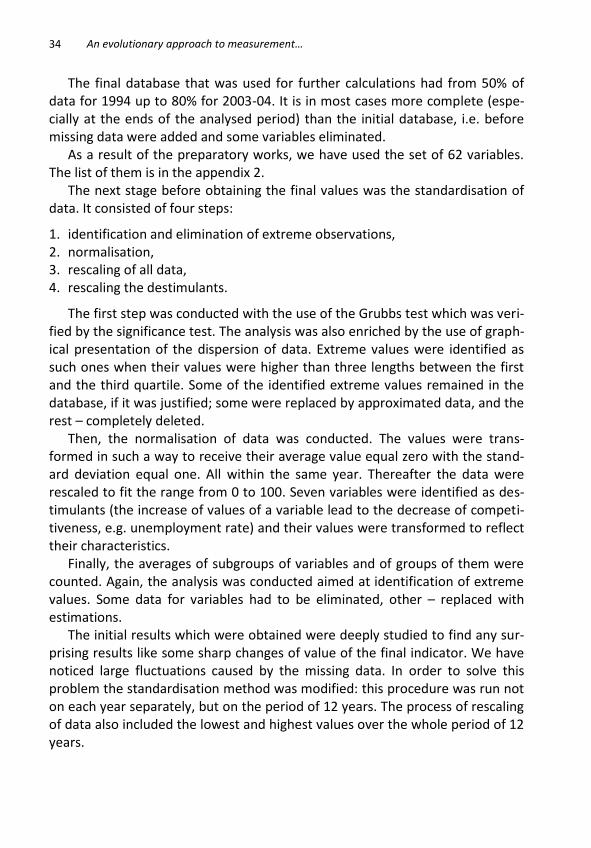
Table 2.1. Share of the data possessed for particular countries
Country Share Country Share Country Share
Austria 78.7% Ireland 78.1% Slovakia 76,90% Belgium 71.9% Island 65.9% Slovenia 70.9% Bulgaria 66.3% Italy 76.6% Spain 80.1% Croatia 44.0% Japan 58.6% Sweden 78.4% Cyprus 67.8% Latvia 72.0% Switzerland 58.1% Czech Rep. 78.1% Lithuania 71.6% Turkey 55.6% Denmark 78.4% Luxembourg 61.4% UE-15 50.5% Estonia 71.8% Malta 56.6% UE-25 46.4% Finland 79.3% Netherlands 78,00% UE-27 39.1% France 77.3% Norway 76.9% UK 77.7% Germany 77.4% Poland 74.8% USA 60.7% Greece 74.9% Portugal 79.2% Hungary 78.2% Romania 67.7% average 69,1% Source: own study.
However some instability or unexpected results remained, e.g.:
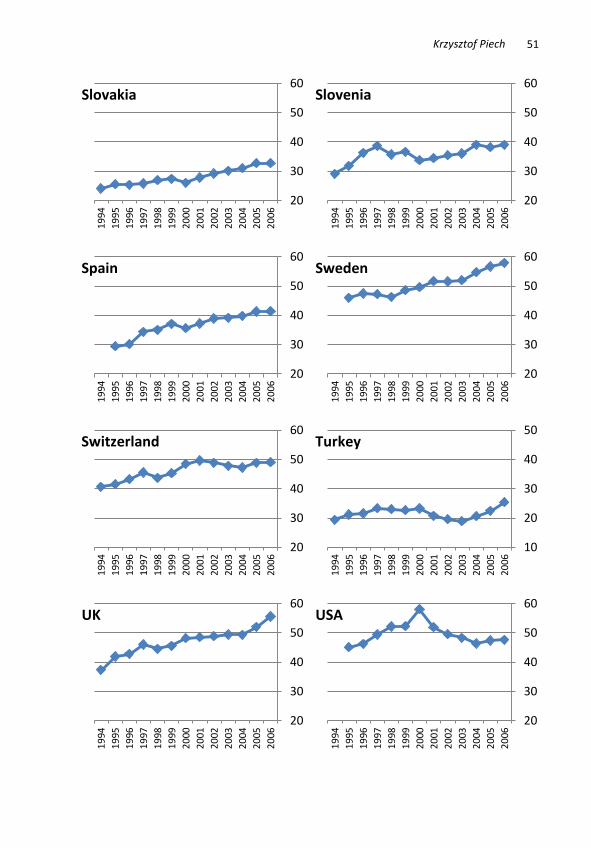
» the falling values of competitiveness indicator for the United States since 2000, which was mainly caused by the decrease of values for the venture capital variables,
» United Kingdom in 2006 achieved very high place thanks to ir061 variable (venture capital), the value of which was in 2006 c. 5 times higher than in the preceding years,
» the growth of Switzerland in 1998-2000 was mainly caused by the increase of a number of mobile phones within this period by 3 times,
» the weaker results for the Netherlands in 2003-04 were caused by smaller number of patents (there were 5 times less of them in 2003 than in 2002),
» Poland had much better results in 1997-1999 due to the lacks of data (especially in the third and fourth group of variables).
An evolutionary approach to measurement…
36
2.3. Results
The results of the calculations conducted will be presented in different ways:
a) ranking of countries, b) values of the new competitiveness indicator with graphical presentation of them, c) structure of the indicator (values for the main groups) for all the countries in 2006.
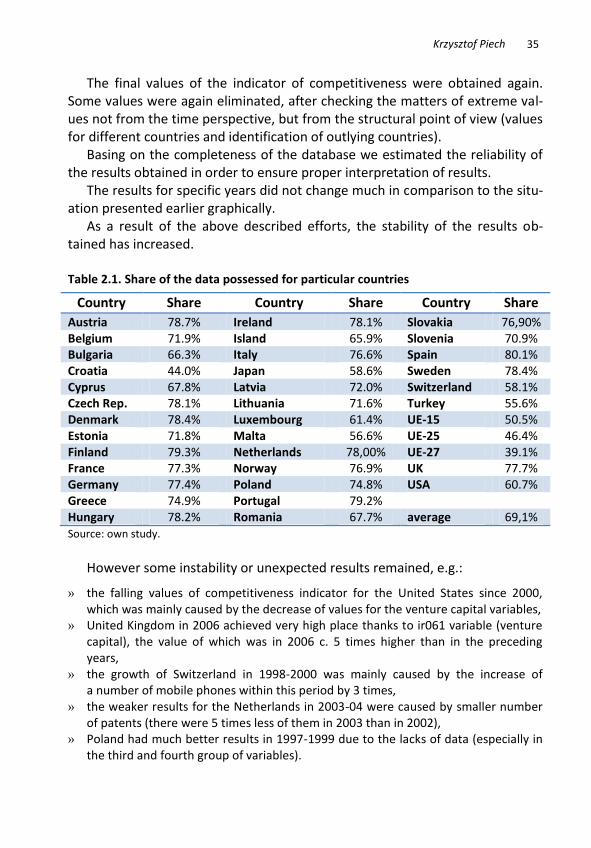
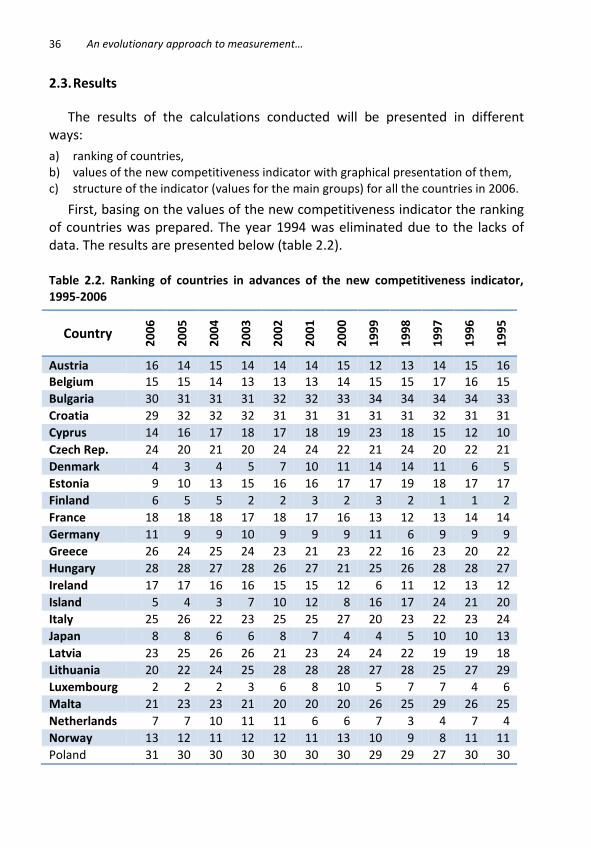
First, basing on the values of the new competitiveness indicator the ranking of countries was prepared. The year 1994 was eliminated due to the lacks of data. The results are presented below (table 2.2).
Table 2.2. Ranking of countries in advances of the new competitiveness indicator, 1995-2006
Country
20
06
20
05
20
04
20
03
20
02
20
01
20
00
19
99
19
98
19
97
19
96
19
95
Austria 16 14 15 14 14 14 15 12 13 14 15 16 Belgium 15 15 14 13 13 13 14 15 15 17 16 15
Bulgaria 30 31 31 31 32 32 33 34 34 34 34 33
Croatia 29 32 32 32 31 31 31 31 31 32 31 31
Cyprus 14 16 17 18 17 18 19 23 18 15 12 10
Czech Rep. 24 20 21 20 24 24 22 21 24 20 22 21
Denmark 4 3 4 5 7 10 11 14 14 11 6 5
Estonia 9 10 13 15 16 16 17 17 19 18 17 17
Finland 6 5 5 2 2 3 2 3 2 1 1 2
France 18 18 18 17 18 17 16 13 12 13 14 14
Germany 11 9 9 10 9 9 9 11 6 9 9 9
Greece 26 24 25 24 23 21 23 22 16 23 20 22
Hungary 28 28 27 28 26 27 21 25 26 28 28 27
Ireland 17 17 16 16 15 15 12 6 11 12 13 12
Island 5 4 3 7 10 12 8 16 17 24 21 20
Italy 25 26 22 23 25 25 27 20 23 22 23 24
Japan 8 8 6 6 8 7 4 4 5 10 10 13
Latvia 23 25 26 26 21 23 24 24 22 19 19 18
Lithuania 20 22 24 25 28 28 28 27 28 25 27 29
Luxembourg 2 2 2 3 6 8 10 5 7 7 4 6
Malta 21 23 23 21 20 20 20 26 25 29 26 25
Netherlands 7 7 10 11 11 6 6 7 3 4 7 4
Norway 13 12 11 12 12 11 13 10 9 8 11 11
Poland 31 30 30 30 30 30 30 29 29 27 30 30
Krzysztof Piech
37
Portugal 27 27 28 27 27 26 26 28 27 26 25 26
Romania 33 33 33 33 33 33 34 33 33 33 33 34
Slovakia 32 29 29 29 29 29 29 30 30 30 29 28
Slovenia 22 21 20 22 22 22 25 19 20 16 18 19
Spain 19 19 19 19 19 19 18 18 21 21 24 23
Sweden 1 1 1 1 1 2 3 2 4 3 2 1
Switzerland 10 11 8 9 4 4 5 9 10 6 5 8
Turkey 34 34 34 34 34 34 32 32 32 31 32 32
UK 3 6 7 4 5 5 7 8 8 5 8 7
USA 12 13 12 8 3 1 1 1 1 2 3 3
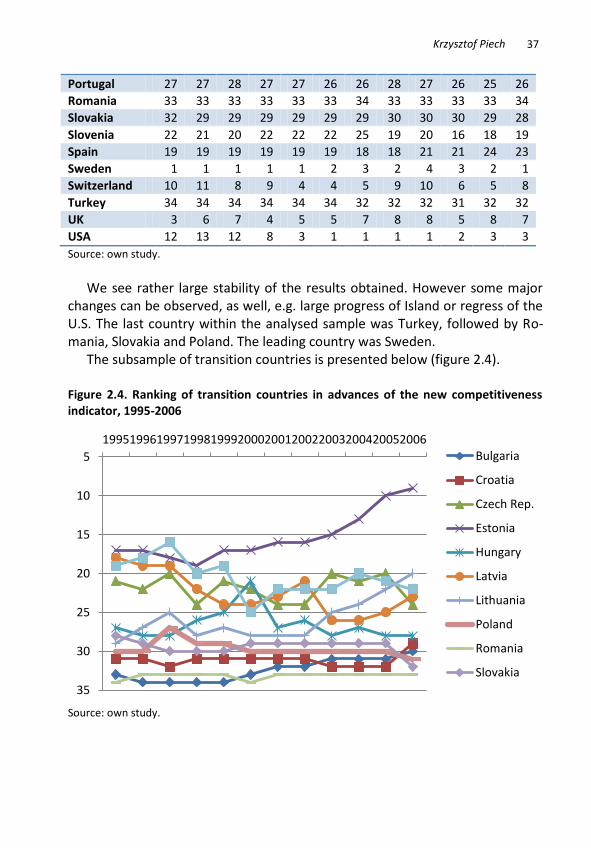
Source: own study. We see rather large stability of the results obtained. However some major
changes can be observed, as well, e.g. large progress of Island or regress of the U.S. The last country within the analysed sample was Turkey, followed by Ro-mania, Slovakia and Poland. The leading country was Sweden.
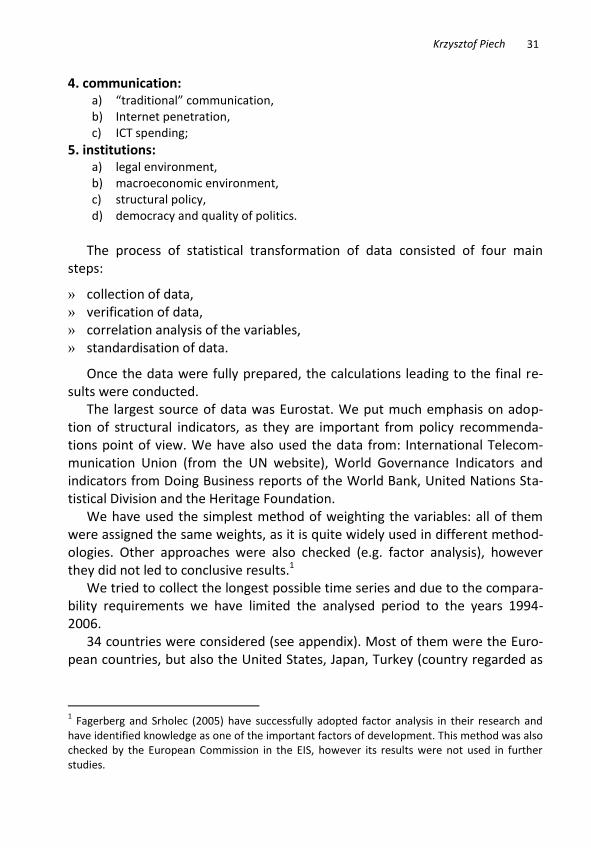
The subsample of transition countries is presented below (figure 2.4).
Figure 2.4. Ranking of transition countries in advances of the new competitiveness indicator, 1995-2006
Source: own study.
5
10
15
20
25
30
35
199519961997199819992000200120022003200420052006Bulgaria
Croatia
Czech Rep.
Estonia
Hungary
Latvia
Lithuania
Poland
Romania
Slovakia
An evolutionary approach to measurement…
38
Within this group, Estonia experienced the largest progress in comparison with other, analysed countries, especially from 1999. Its results are outstand-ing: it started from 17th position in 1995 and eleven years later ended in 2006 on the 9th position. The group of the next three countries (Latvia, Slovenia, and the Czech Republic) has not changed during the analysed period, apart from the case of Lithuania, which has occupied the second place in the subgroup. The weakest transition country was Romania, which has been outperformed by Bulgaria (that has won also with Croatia).
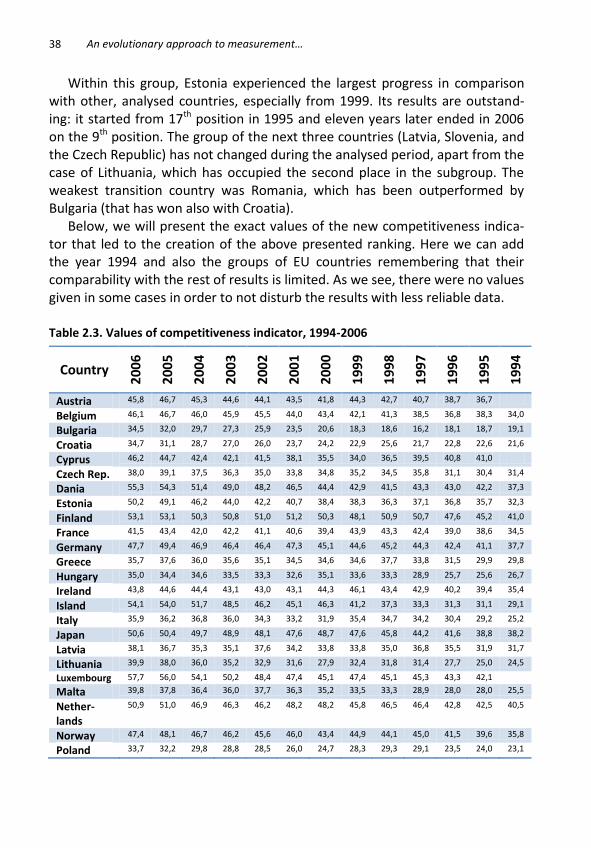
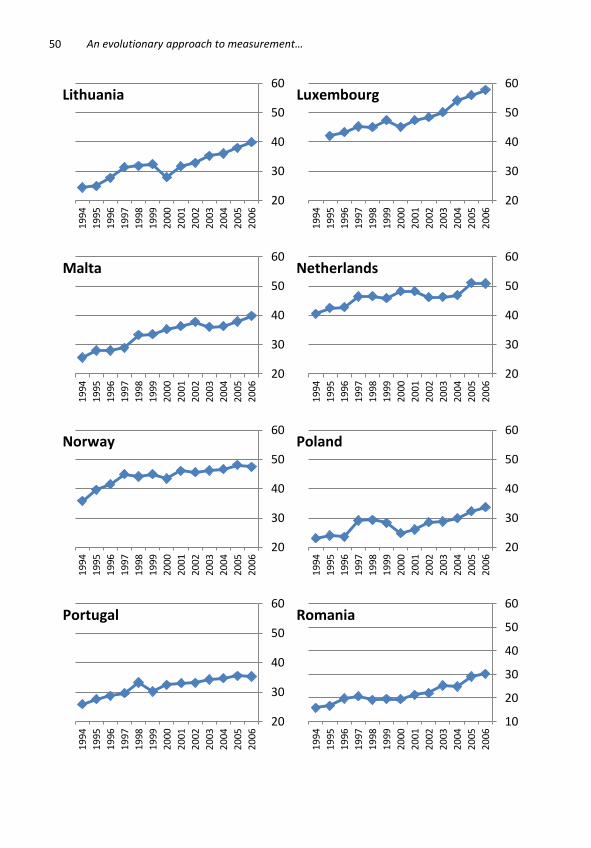
Below, we will present the exact values of the new competitiveness indica-tor that led to the creation of the above presented ranking. Here we can add the year 1994 and also the groups of EU countries remembering that their comparability with the rest of results is limited. As we see, there were no values given in some cases in order to not disturb the results with less reliable data.
Table 2.3. Values of competitiveness indicator, 1994-2006
Country
20
06
20
05
20
04
20
03
20
02
20
01
20
00
19
99
19
98
19
97
19
96
19
95
19
94
Austria 45,8 46,7 45,3 44,6 44,1 43,5 41,8 44,3 42,7 40,7 38,7 36,7
Belgium 46,1 46,7 46,0 45,9 45,5 44,0 43,4 42,1 41,3 38,5 36,8 38,3 34,0
Bulgaria 34,5 32,0 29,7 27,3 25,9 23,5 20,6 18,3 18,6 16,2 18,1 18,7 19,1
Croatia 34,7 31,1 28,7 27,0 26,0 23,7 24,2 22,9 25,6 21,7 22,8 22,6 21,6
Cyprus 46,2 44,7 42,4 42,1 41,5 38,1 35,5 34,0 36,5 39,5 40,8 41,0
Czech Rep. 38,0 39,1 37,5 36,3 35,0 33,8 34,8 35,2 34,5 35,8 31,1 30,4 31,4
Dania 55,3 54,3 51,4 49,0 48,2 46,5 44,4 42,9 41,5 43,3 43,0 42,2 37,3
Estonia 50,2 49,1 46,2 44,0 42,2 40,7 38,4 38,3 36,3 37,1 36,8 35,7 32,3
Finland 53,1 53,1 50,3 50,8 51,0 51,2 50,3 48,1 50,9 50,7 47,6 45,2 41,0
France 41,5 43,4 42,0 42,2 41,1 40,6 39,4 43,9 43,3 42,4 39,0 38,6 34,5
Germany 47,7 49,4 46,9 46,4 46,4 47,3 45,1 44,6 45,2 44,3 42,4 41,1 37,7
Greece 35,7 37,6 36,0 35,6 35,1 34,5 34,6 34,6 37,7 33,8 31,5 29,9 29,8
Hungary 35,0 34,4 34,6 33,5 33,3 32,6 35,1 33,6 33,3 28,9 25,7 25,6 26,7
Ireland 43,8 44,6 44,4 43,1 43,0 43,1 44,3 46,1 43,4 42,9 40,2 39,4 35,4
Island 54,1 54,0 51,7 48,5 46,2 45,1 46,3 41,2 37,3 33,3 31,3 31,1 29,1
Italy 35,9 36,2 36,8 36,0 34,3 33,2 31,9 35,4 34,7 34,2 30,4 29,2 25,2
Japan 50,6 50,4 49,7 48,9 48,1 47,6 48,7 47,6 45,8 44,2 41,6 38,8 38,2
Latvia 38,1 36,7 35,3 35,1 37,6 34,2 33,8 33,8 35,0 36,8 35,5 31,9 31,7
Lithuania 39,9 38,0 36,0 35,2 32,9 31,6 27,9 32,4 31,8 31,4 27,7 25,0 24,5
Luxembourg 57,7 56,0 54,1 50,2 48,4 47,4 45,1 47,4 45,1 45,3 43,3 42,1
Malta 39,8 37,8 36,4 36,0 37,7 36,3 35,2 33,5 33,3 28,9 28,0 28,0 25,5
Nether-lands
50,9 51,0 46,9 46,3 46,2 48,2 48,2 45,8 46,5 46,4 42,8 42,5 40,5
Norway 47,4 48,1 46,7 46,2 45,6 46,0 43,4 44,9 44,1 45,0 41,5 39,6 35,8
Poland 33,7 32,2 29,8 28,8 28,5 26,0 24,7 28,3 29,3 29,1 23,5 24,0 23,1
Krzysztof Piech
39
Portugal 35,3 35,5 34,6 34,3 33,1 33,0 32,5 30,2 33,2 29,6 28,7 27,6 25,9
Romania 30,3 29,0 24,9 25,3 22,1 21,4 19,5 19,6 19,2 20,6 19,8 16,7 15,9
Slovakia 32,8 32,8 31,0 30,2 29,2 27,8 26,1 27,5 26,9 25,8 25,4 25,5 24,1
Slovenia 39,0 38,2 39,1 36,0 35,4 34,5 33,7 36,6 35,7 38,6 36,2 31,8 29,1
Spain 41,4 41,3 39,8 39,2 38,9 37,2 35,6 37,1 35,0 34,4 30,2 29,4
Sweden 57,9 56,7 54,7 52,0 51,5 51,7 49,7 48,6 46,2 47,3 47,5 46,0
Switzer-land
49,0 48,9 47,2 47,8 48,9 49,7 48,4 45,2 43,7 45,6 43,2 41,5 40,7
Turkey 25,4 22,4 20,6 18,9 19,5 20,8 23,2 22,6 23,0 23,3 21,6 21,2 19,3
UK 55,6 52,0 49,3 49,4 48,8 48,5 48,2 45,6 44,5 46,0 42,8 41,9 37,3
USA 47,6 47,4 46,3 48,3 49,5 51,9 58,0 52,3 52,2 49,4 46,2 45,1
EU-15 49,0 46,6 45,0 44,4 43,5 43,4 43,1 42,2 47,4 48,3 47,8 47,4
EU-25 66,5 63,9 63,1 62,3 61,3 59,1 55,3 58,7 55,4 54,8 54,4
EU-27 66,5 64,2 63,6 63,0 60,8 55,2 55,0 54,8 51,7 50,7 49,5
average 43,2 42,7 40,9 40,0 39,4 38,7 38,0 37,8 37,5 36,8 34,8 33,7 30,2
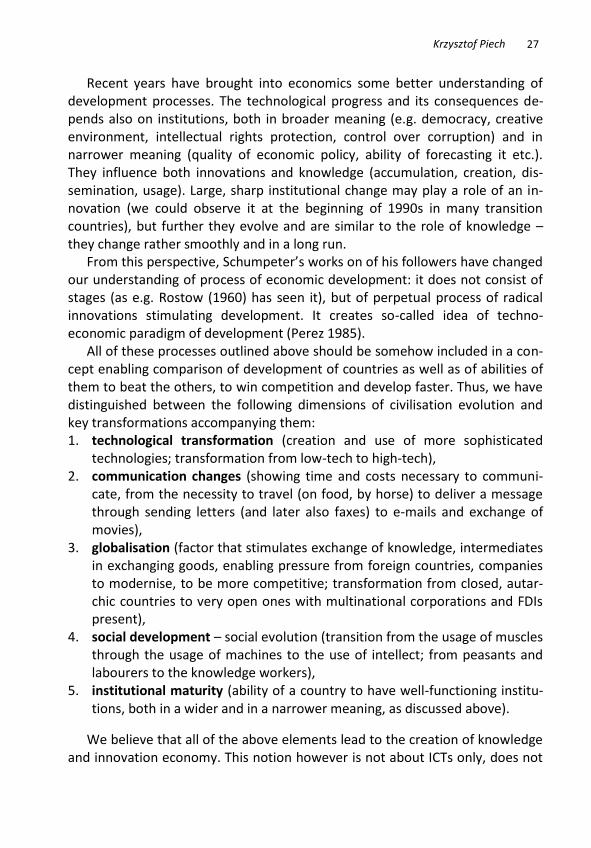
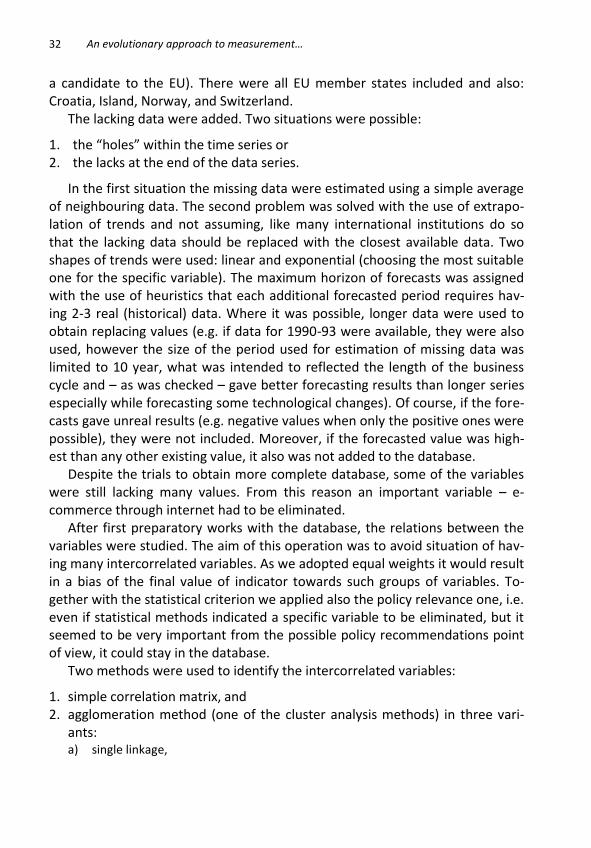
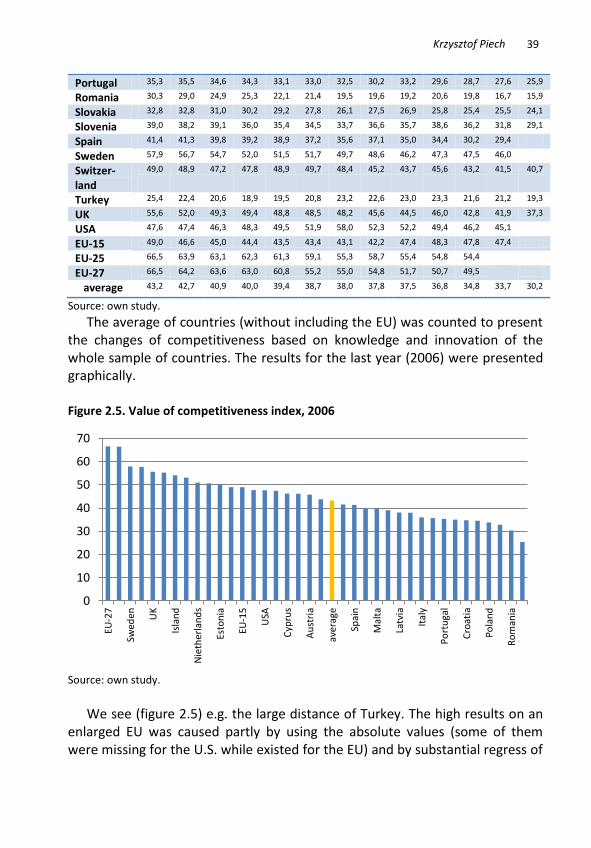
Source: own study. The average of countries (without including the EU) was counted to present
the changes of competitiveness based on knowledge and innovation of the whole sample of countries. The results for the last year (2006) were presented graphically. Figure 2.5. Value of competitiveness index, 2006
Source: own study.
We see (figure 2.5) e.g. the large distance of Turkey. The high results on an
enlarged EU was caused partly by using the absolute values (some of them were missing for the U.S. while existed for the EU) and by substantial regress of
0
10
20
30
40
50
60
70
EU-2
7
Swed
en UK
Isla
nd
Nie
ther
lan
ds
Esto
nia
EU-1
5
USA
Cyp
rus
Au
stri
a
aver
age
Spai
n
Mal
ta
Latv
ia
Ital
y
Po
rtu
gal
Cro
atia
Po
lan
d
Ro
man
ia
An evolutionary approach to measurement…
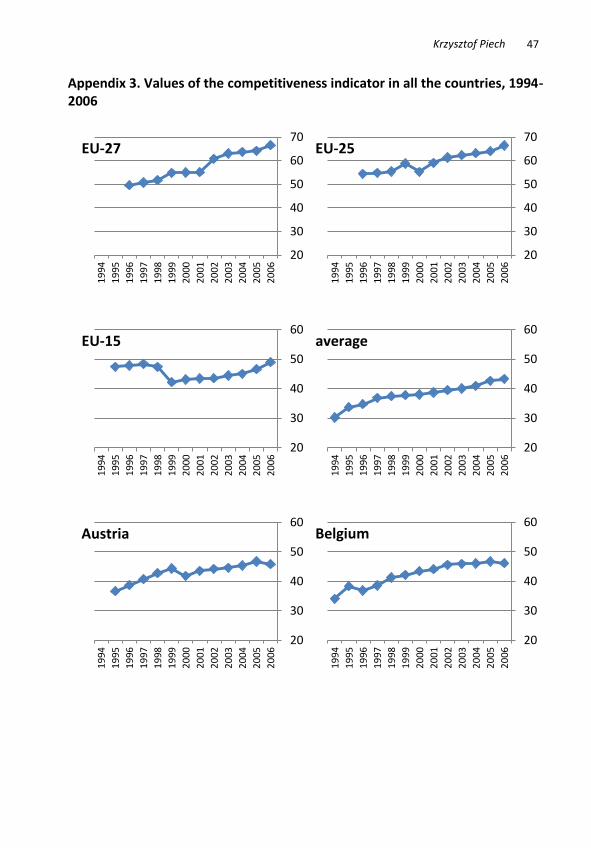
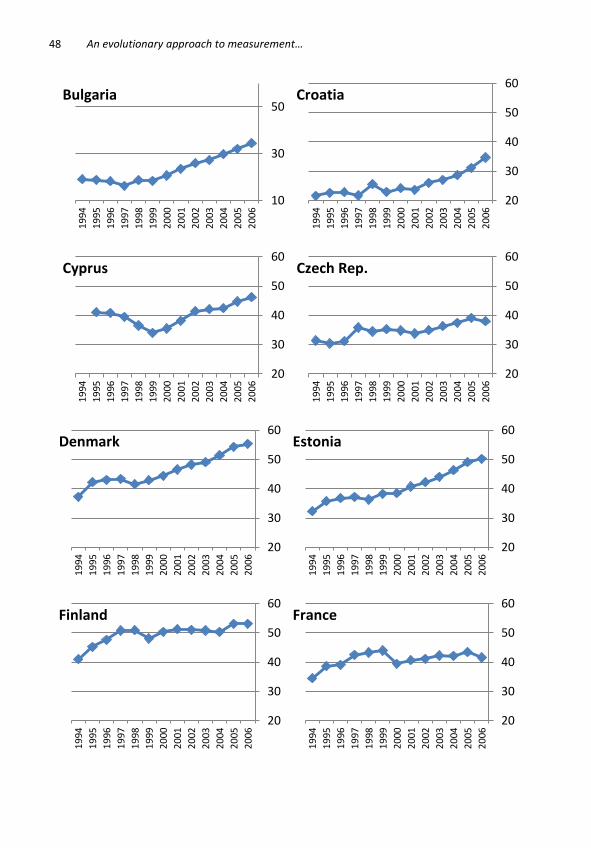
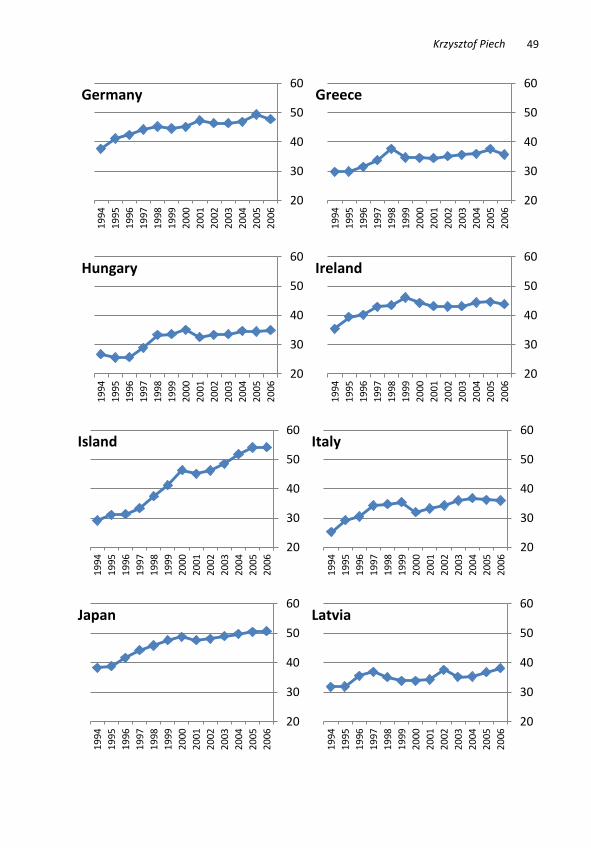
40
the U.S. since 2000. The changes in time of the values presented in the table 3 are presented graphically of figures in the appendix 3. Their scale was adjusted to provide possibly clear comparisons.
Conclusions
The historical analysis of development of countries conducted by many economists so far led to identification of interesting factors that stimulate competitiveness in the long run. Sometimes such relations are difficult to be caught-up quantitatively due to e.g. problems with lacking and comparable data. They may however bring very interesting results and sometimes more reliable than econometric analyses. However they cannot answer the question about specifics, about exact changes of particular countries in a given period of time. Thus both scientific approaches: historical (evolutionary) analyses with statistical calculations can (should) be combined. That was the way used in this paper. After identification of main driving forces of development, there were taken the attempts to quantify them. A database consisting of c. 22,000 values was collected and prepared for final analyses. Of course many problems with data appeared, but application of a few statistical techniques allowed elimina-tion of some of them.
The results show the progress of the European countries in developing their competitiveness based on knowledge and innovations. We see large changes in the U.S. after the burst of the dotcom bubble – their competitiveness has been gradually decreasing, while e.g. the competitiveness of the enlarged UE is in-creasing (while the competitiveness of the EU15 is only slightly higher than of the US in the recent years). It was mainly caused by transition countries. The results has shown that they have positively influenced the competitiveness of the whole EU. Especially visible was the progress of Estonia, which is becoming one of the leading countries in development in Europe. Also Lithuania is doing well. Despite problems in some EU transition countries, all of them increased the EU markets and provided the “old Europe” a new stimulus for develop-ment.
Most of the European Union countries in 1990s has run economic policies based on neoclassical theory without looking at historical (evolutionary) framework.
The poor results that were obtained should prove the inadequacy of such a theo-ry to direct economic policy towards full employment, social justice and growth. (Reati and Toporowski 2004).
Krzysztof Piech
41
Some of the new member states like Estonia, but also such a distant country like Island or one of the EU-sceptical countries – the United Kingdom have proven that there are ways to run “innovative economic policies” that would stimulate the growth of competitiveness. Also the EU as a whole noticed that technological progress accompanied by the growth of human capital may be the key solutions for development and increase of competitiveness – as they were among the goals of the Lisbon Agenda.
It is time to change the general orientation of the European macroeconomic poli-cy, if we really want to foster employment, growth and the diffusion of the new technological paradigm. (Reati and Toporowski 2004)
We see however those changes are happening and the overall competitive-ness is increasing, although with different pace in particular countries.
References
Fagerberg J., Srholec M. (2005), Catching Up: What Are The Critical Factors For Suc-cess?, Centre for Technology, Innovation and Culture, University of Oslo, Back-ground paper for the UNIDO World Industrial Development Report 2005 (prelimi-nary version), April 2005, http://folk.uio.no/janf/downloadable_papers/ 05Fagerberg-Srholec_CatchingUp.pdf
Freeman Ch., F. Louçã (2001), As Time Goes By: From the Industrial Revolutions to the Information Revolution, Oxford University Press, Oxford.
Jorgensen D.W. (2001), Information Technology and the U.S. Economy, “American Economic Review“, 91.
Perez C. (1985), Microelectronics, long waves and world structural change: New per-spectives for developing countries, “World Development”, Vol. 13, No. 3.
Perez C. (2002), Technological Revolutions and Financial Capital. The Dynamics of Bub-bles and Golden Ages, Edward Elgar, Cheltenham.
Piech K. (2004), The knowledge-based economy in transition countries: assessing the place of new EU member states [in:] K. Piech (ed.), The Knowledge-Based Economy in Transition Countries: selected issues, University College London – School of Sla-vonic and East European Studies, London.
Piech K. (2008), Międzynarodowa konkurencyjność gospodarcza krajów Unii Europej-skiej w kontekście współczesnej roli wiedzy i innowacji [in:] T. Michalski, K. Piech (ed.), Konkurencyjność Polski w procesie pogłębiania integracji europejskiej, Oficyna Wydawnicza SGH, Warszawa 2008.
Piech K. (2009), Knowledge- and Innovation-based Competitiveness – Assessing the Position of Poland in Europe [in:] Z. Liberda, A. Grochowska (ed.), Civilizational Com-petences and Regional Development in Poland, Warsaw University Press, Warsaw.
Porter M. (1990), The Competitive Advantage of Nations, The Free Press, New York.

An evolutionary approach to measurement…
42
Reati A., Toporowski J. (2004), An economic policy for the fifth long wave, “Banca Na-zionale del Lavoro Quarterly Review”, December.
Rostow W.W. (1960), The stages of economic growth. A non-Communist manifesto, Cambridge University Press, Cambridge.
Schumpeter J. (1911), The Theory of Economic Development: An inquiry into profits, capital, credit, interest and the business cycle.
Schumpeter J. (1939), Business Cycles: A Theoretical, Historical and Statistical Analysis of the Capitalist Process, McGraw-Hill Book, New York and London.
Krzysztof Piech
43
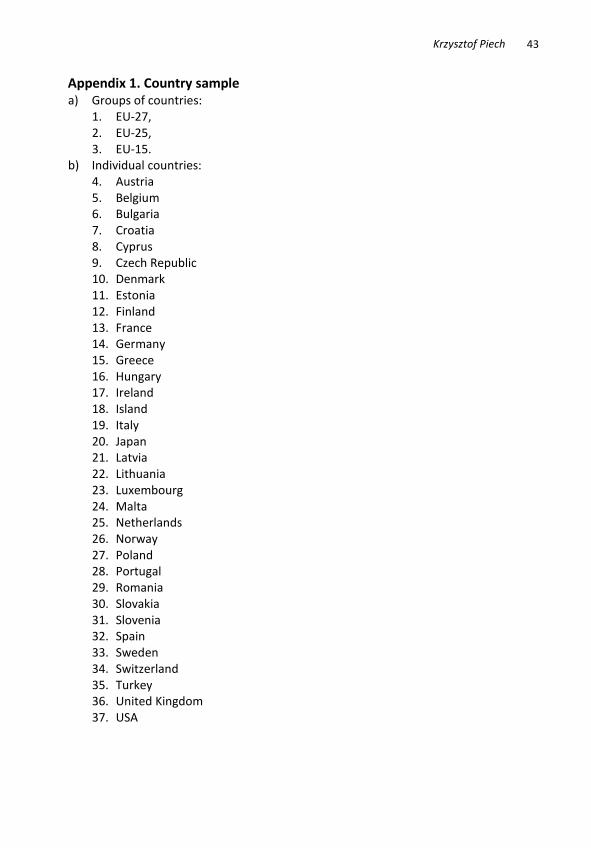
Appendix 1. Country sample a) Groups of countries:
1. EU-27, 2. EU-25, 3. EU-15.
b) Individual countries: 4. Austria 5. Belgium 6. Bulgaria 7. Croatia 8. Cyprus 9. Czech Republic 10. Denmark 11. Estonia 12. Finland 13. France 14. Germany 15. Greece 16. Hungary 17. Ireland 18. Island 19. Italy 20. Japan 21. Latvia 22. Lithuania 23. Luxembourg 24. Malta 25. Netherlands 26. Norway 27. Poland 28. Portugal 29. Romania 30. Slovakia 31. Slovenia 32. Spain 33. Sweden 34. Switzerland 35. Turkey 36. United Kingdom 37. USA
An evolutionary approach to measurement…
44
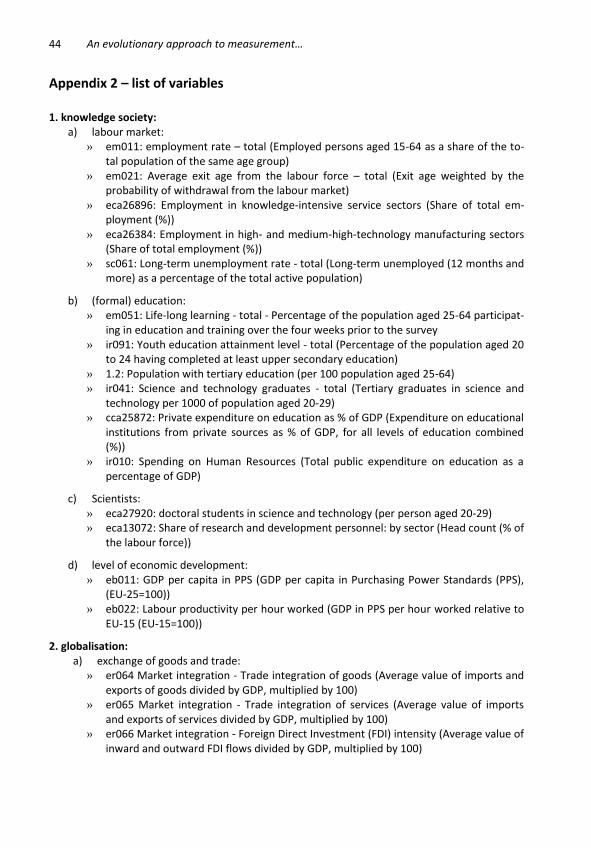
Appendix 2 – list of variables 1. knowledge society:
a) labour market: » em011: employment rate – total (Employed persons aged 15-64 as a share of the to-
tal population of the same age group) » em021: Average exit age from the labour force – total (Exit age weighted by the
probability of withdrawal from the labour market) » eca26896: Employment in knowledge-intensive service sectors (Share of total em-
ployment (%)) » eca26384: Employment in high- and medium-high-technology manufacturing sectors
(Share of total employment (%)) » sc061: Long-term unemployment rate - total (Long-term unemployed (12 months and
more) as a percentage of the total active population)
b) (formal) education: » em051: Life-long learning - total - Percentage of the population aged 25-64 participat-
ing in education and training over the four weeks prior to the survey » ir091: Youth education attainment level - total (Percentage of the population aged 20
to 24 having completed at least upper secondary education) » 1.2: Population with tertiary education (per 100 population aged 25-64) » ir041: Science and technology graduates - total (Tertiary graduates in science and
technology per 1000 of population aged 20-29) » cca25872: Private expenditure on education as % of GDP (Expenditure on educational
institutions from private sources as % of GDP, for all levels of education combined (%))
» ir010: Spending on Human Resources (Total public expenditure on education as a percentage of GDP)
c) Scientists: » eca27920: doctoral students in science and technology (per person aged 20-29) » eca13072: Share of research and development personnel: by sector (Head count (% of
the labour force))
d) level of economic development: » eb011: GDP per capita in PPS (GDP per capita in Purchasing Power Standards (PPS),
(EU-25=100)) » eb022: Labour productivity per hour worked (GDP in PPS per hour worked relative to
EU-15 (EU-15=100))
2. globalisation: a) exchange of goods and trade: » er064 Market integration - Trade integration of goods (Average value of imports and
exports of goods divided by GDP, multiplied by 100) » er065 Market integration - Trade integration of services (Average value of imports
and exports of services divided by GDP, multiplied by 100) » er066 Market integration - Foreign Direct Investment (FDI) intensity (Average value of
inward and outward FDI flows divided by GDP, multiplied by 100)
Krzysztof Piech
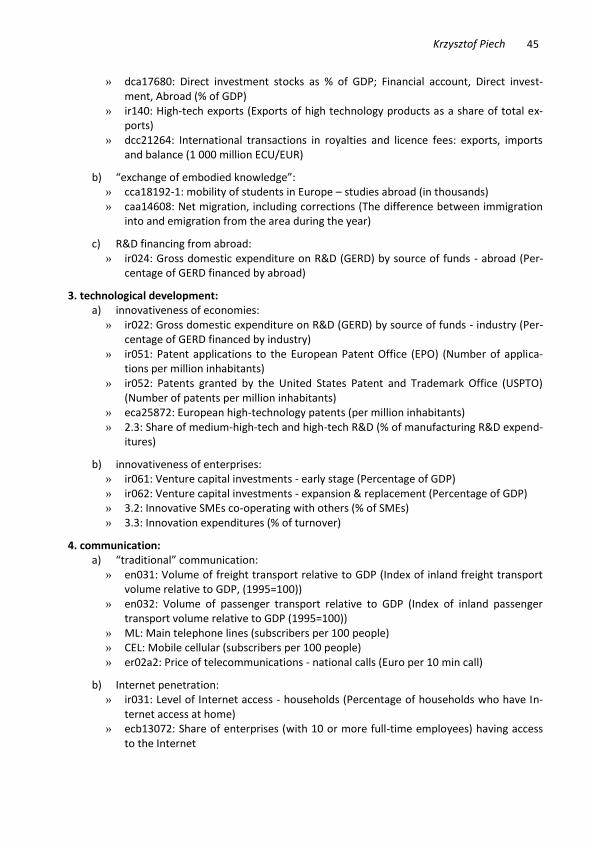
45
» dca17680: Direct investment stocks as % of GDP; Financial account, Direct invest-ment, Abroad (% of GDP)
» ir140: High-tech exports (Exports of high technology products as a share of total ex-ports)
» dcc21264: International transactions in royalties and licence fees: exports, imports and balance (1 000 million ECU/EUR)
b) “exchange of embodied knowledge”: » cca18192-1: mobility of students in Europe – studies abroad (in thousands) » caa14608: Net migration, including corrections (The difference between immigration
into and emigration from the area during the year)
c) R&D financing from abroad: » ir024: Gross domestic expenditure on R&D (GERD) by source of funds - abroad (Per-
centage of GERD financed by abroad)
3. technological development: a) innovativeness of economies: » ir022: Gross domestic expenditure on R&D (GERD) by source of funds - industry (Per-
centage of GERD financed by industry) » ir051: Patent applications to the European Patent Office (EPO) (Number of applica-
tions per million inhabitants) » ir052: Patents granted by the United States Patent and Trademark Office (USPTO)
(Number of patents per million inhabitants) » eca25872: European high-technology patents (per million inhabitants) » 2.3: Share of medium-high-tech and high-tech R&D (% of manufacturing R&D expend-
itures)
b) innovativeness of enterprises: » ir061: Venture capital investments - early stage (Percentage of GDP) » ir062: Venture capital investments - expansion & replacement (Percentage of GDP) » 3.2: Innovative SMEs co-operating with others (% of SMEs) » 3.3: Innovation expenditures (% of turnover)
4. communication: a) “traditional” communication: » en031: Volume of freight transport relative to GDP (Index of inland freight transport
volume relative to GDP, (1995=100)) » en032: Volume of passenger transport relative to GDP (Index of inland passenger
transport volume relative to GDP (1995=100)) » ML: Main telephone lines (subscribers per 100 people) » CEL: Mobile cellular (subscribers per 100 people) » er02a2: Price of telecommunications - national calls (Euro per 10 min call)
b) Internet penetration: » ir031: Level of Internet access - households (Percentage of households who have In-
ternet access at home) » ecb13072: Share of enterprises (with 10 or more full-time employees) having access
to the Internet
An evolutionary approach to measurement…
46
» IR130 Broadband penetration rate (Number of broadband lines subscribed in per-centage of the population)
» ecb15632: Share of individuals (aged 16 to 74) having ordered/bought goods or ser-vices for private use over the Internet in the last three months
c) ICT spending: » ir071: ICT expenditure - IT (Expenditure on Information Technology as a percentage of
GDP) » ir072: ICT expenditure - Telecommunications (Expenditure on Telecommunications
Technology as a percentage of GDP)
5. institutions: a) legal environment: » RQ: Regulatory Quality » CoC: Control of Corruption » PR: Property Rights
b) macroeconomic environment: » eb012: Real GDP growth rate - Growth rate of GDP volume (Percentage change on
previous year) » eb040: Inflation rate (Annual average rate of change in Harmonized Indices of Con-
sumer Prices (HICPs)) » em071: Unemployment rate - total (Unemployed persons as a share of the total ac-
tive population) » eb060: Public balance (Net borrowing/lending of consolidated general government
sector as a percentage of GDP) » eb070: General government debt (General government consolidated gross debt as a
percentage of GDP) » dca11536: Balance of the current account (% of GDP)
c) structural policy: » IR023 Gross domestic expenditure on R&D (GERD) by source of funds - government
(Percentage of GERD financed by government) » R: Regulation » SaB: Starting a Business (Cost (% of income per capita)) » ir100: E-government on-line availability (Percentage of online availability of 20 basic
public services)
d) democracy and quality of politics: » V&A: Voice and Accountability » PS: Political Stability » FF: Fiscal Freedom » FfG: Freedom from Government » WiP: Women in Parliament (% or members of parliament)
Krzysztof Piech
47
Appendix 3. Values of the competitiveness indicator in all the countries, 1994-2006
20
30
40
50
60
70
20
06
20
05
20
04
20
03
20
02
20
01
20
00
19
99
19
98
19
97
19
96
19
95
19
94
EU-27
20
30
40
50
60
70
20
06
20
05
20
04
20
03
20
02
20
01
20
00
19
99
19
98
19
97
19
96
19
95
19
94
EU-25
20
30
40
50
60
20
06
20
05
20
04
20
03
20
02
20
01
20
00
19
99
19
98
19
97
19
96
19
95
19
94
EU-15
20
30
40
50
60
20
06
20
05
20
04
20
03
20
02
20
01
20
00
19
99
19
98
19
97
19
96
19
95
19
94average
20
30
40
50
60
20
06
20
05
20
04
20
03
20
02
20
01
20
00
19
99
19
98
19
97
19
96
19
95
19
94
Austria
20
30
40
50
60
20
06
20
05
20
04
20
03
20
02
20
01
20
00
19
99
19
98
19
97
19
96
19
95
19
94
Belgium
An evolutionary approach to measurement…
48
10
30
50
20
06
20
05
20
04
20
03
20
02
20
01
20
00
19
99
19
98
19
97
19
96
19
95
19
94
Bulgaria
20
30
40
50
60
20
06
20
05
20
04
20
03
20
02
20
01
20
00
19
99
19
98
19
97
19
96
19
95
19
94
Croatia
20
30
40
50
602
006
20
05
20
04
20
03
20
02
20
01
20
00
19
99
19
98
19
97
19
96
19
95
19
94
Cyprus
20
30
40
50
60
20
06
20
05
20
04
20
03
20
02
20
01
20
00
19
99
19
98
19
97
19
96
19
95
19
94
Czech Rep.
20
30
40
50
60
20
06
20
05
20
04
20
03
20
02
20
01
20
00
19
99
19
98
19
97
19
96
19
95
19
94
Denmark
20
30
40
50
60
20
06
20
05
20
04
20
03
20
02
20
01
20
00
19
99
19
98
19
97
19
96
19
95
19
94
Estonia
20
30
40
50
60
20
06
20
05
20
04
20
03
20
02
20
01
20
00
19
99
19
98
19
97
19
96
19
95
19
94
Finland
20
30
40
50
60
20
06
20
05
20
04
20
03
20
02
20
01
20
00
19
99
19
98
19
97
19
96
19
95
19
94
France
Krzysztof Piech
49
20
30
40
50
60
20
06
20
05
20
04
20
03
20
02
20
01
20
00
19
99
19
98
19
97
19
96
19
95
19
94Germany
20
30
40
50
60
20
06
20
05
20
04
20
03
20
02
20
01
20
00
19
99
19
98
19
97
19
96
19
95
19
94
Greece
20
30
40
50
602
006
20
05
20
04
20
03
20
02
20
01
20
00
19
99
19
98
19
97
19
96
19
95
19
94
Hungary
20
30
40
50
60
20
06
20
05
20
04
20
03
20
02
20
01
20
00
19
99
19
98
19
97
19
96
19
95
19
94
Ireland
20
30
40
50
60
20
06
20
05
20
04
20
03
20
02
20
01
20
00
19
99
19
98
19
97
19
96
19
95
19
94
Island
20
30
40
50
60
20
06
20
05
20
04
20
03
20
02
20
01
20
00
19
99
19
98
19
97
19
96
19
95
19
94
Italy
20
30
40
50
60
20
06
20
05
20
04
20
03
20
02
20
01
20
00
19
99
19
98
19
97
19
96
19
95
19
94
Japan
20
30
40
50
60
20
06
20
05
20
04
20
03
20
02
20
01
20
00
19
99
19
98
19
97
19
96
19
95
19
94
Latvia
An evolutionary approach to measurement…
50
20
30
40
50
60
20
06
20
05
20
04
20
03
20
02
20
01
20
00
19
99
19
98
19
97
19
96
19
95
19
94
Lithuania
20
30
40
50
60
20
06
20
05
20
04
20
03
20
02
20
01
20
00
19
99
19
98
19
97
19
96
19
95
19
94
Luxembourg
20
30
40
50
602
006
20
05
20
04
20
03
20
02
20
01
20
00
19
99
19
98
19
97
19
96
19
95
19
94
Malta
20
30
40
50
60
20
06
20
05
20
04
20
03
20
02
20
01
20
00
19
99
19
98
19
97
19
96
19
95
19
94
Netherlands
20
30
40
50
60
20
06
20
05
20
04
20
03
20
02
20
01
20
00
19
99
19
98
19
97
19
96
19
95
19
94
Norway
20
30
40
50
60
20
06
20
05
20
04
20
03
20
02
20
01
20
00
19
99
19
98
19
97
19
96
19
95
19
94
Poland
20
30
40
50
60
20
06
20
05
20
04
20
03
20
02
20
01
20
00
19
99
19
98
19
97
19
96
19
95
19
94
Portugal
10
20
30
40
50
60
20
06
20
05
20
04
20
03
20
02
20
01
20
00
19
99
19
98
19
97
19
96
19
95
19
94
Romania
Krzysztof Piech
51
20
30
40
50
60
20
06
20
05
20
04
20
03
20
02
20
01
20
00
19
99
19
98
19
97
19
96
19
95
19
94Slovakia
20
30
40
50
60
20
06
20
05
20
04
20
03
20
02
20
01
20
00
19
99
19
98
19
97
19
96
19
95
19
94
Slovenia
20
30
40
50
602
006
20
05
20
04
20
03
20
02
20
01
20
00
19
99
19
98
19
97
19
96
19
95
19
94
Spain
20
30
40
50
60
20
06
20
05
20
04
20
03
20
02
20
01
20
00
19
99
19
98
19
97
19
96
19
95
19
94
Sweden
20
30
40
50
60
20
06
20
05
20
04
20
03
20
02
20
01
20
00
19
99
19
98
19
97
19
96
19
95
19
94
Switzerland
10
20
30
40
50
20
06
20
05
20
04
20
03
20
02
20
01
20
00
19
99
19
98
19
97
19
96
19
95
19
94
Turkey
20
30
40
50
60
20
06
20
05
20
04
20
03
20
02
20
01
20
00
19
99
19
98
19
97
19
96
19
95
19
94
UK
20
30
40
50
60
20
06
20
05
20
04
20
03
20
02
20
01
20
00
19
99
19
98
19
97
19
96
19
95
19
94
USA