an epidemiologic investigation of injxjry mortality among
TRANSCRIPT
A N EPIDEMIOLOGIC INVESTIGATION OF INJXJRY M O R T A L I T Y A M O N G S A W M I L L WORKERS
by
M A R I A CRISTINA B A R R O E T A V E N A
M.D. The University of Buenos Aires (ARGENTINA), 1972 M.H.Sc., The University of British Columbia, 1990
A THESIS SUBMITTED IN P A R T I A L F U L F I L M E N T OF THE REQUIREMENTS FOR T H E D E G R E E OF
DOCTOR OF PHILOSOPHY
in
THE F A C U L T Y OF G R A D U A T E STUDIES
Department of Health Care and Epidemiology
We accept this thesis as conforming to the required standard
THE UNIVERSITY OF BRITISH C O L U M B I A
April, 2001
© Maria Cristina Barroetavena, 2001
In presenting this thesis in partial fulfilment of the requirements for an advanced
degree at the University of British Columbia, I agree that the Library shall make it
freely available for reference and study. I further agree that permission for extensive
copying of this thesis for scholarly purposes may be granted by the head of my
department or by his or her representatives. It is understood that copying or
publication of this thesis for financial gain shall not be allowed without my written
permission.
Department
The University of British Columbia Vancouver, Canada
DE-6 (2/88)
Abstract
Sawmill jobs rank among the most hazardous occupations in Canada due to the high work-
related injury morbidity and fatality rates. As little is known about the circumstances of fatal
injuries in this workforce, a study of all fatal injuries (on-the-job and off-the-job) among
sawmill workers was undertaken. The study population comprises over 26,000 workers from
the British Columbia Sawmill Workers Cohort. We combined data from this database with
B.C. Coroners Service (BCCS) and Workers' Compensation Board (BCWCB) data to
analyze the facts surrounding the occurrence of fatal injuries among sawmill workers during
1950-1990.
This study consisted of three components: 1) an analysis of the usefulness of the data sources
available for surveillance of work-related injuries, 2) an analysis of work-related fatalities
among sawmill workers for the period 1950-1990, and 3) an analysis of all fatal injuries in
this workforce during 1950-1990.
The W C B records alone identified more work-related fatalities than the BCCS files alone
(95.4% vs. 81.8%). Each data source has specific limitations precluding a complete count of
fatal injuries at the workplace. Forty cohort members were fatally injured while working at a
sawmill. The work-related fatality rate was 18.3 per 100,000 person-years. The risk of fatal
work-related injury was lower during 1970-1990 than during 1950-1969. Crude fatality rates
were higher among workers older than 35 years and in the occupational categories of
"machine operators/clearers/sorters" and "mobile equipment operators". Factors related to
the workplace physical and socio-cultural environment (e.g. unsafe work station, defective
equipment, safety policies) were the main contributors to fatal injuries.
When compared to the general male population, sawmill workers had fewer deaths than
expected from every injury type except "being caught by machinery". The group of "skilled
labour" workers had the lowest risk of dying from motor vehicle crashes and suicides. Fatal
motor vehicle crashes and suicides were highest among workers living in isolated mill towns.
These findings have implications for prevention. Effective countermeasures should not only
address a combination of factors related to the environment, the injury event and the person
but these interventions should be evaluated in terms of cost-effectiveness.
iii

TABLE OF CONTENTS
Abstract ii
TABLE OF CONTENTS iv
List of Tables viii
List of Figures xi
Glossary xiii
Acknowledgments xiv
CHAPTER ONE 1
1.0 Introduction 1
CHAPTER TWO 5
2.0 Background 5
2.1 Injury Research: Concepts and issues 5
2.2 The development of the epidemiological model of injuries 7
2.2.1 Pioneering work into the causes of injuries 7
2.2.2 The epidemiological model 9
2.2.3 The Haddon matrix 11
2.3 Canadian injury facts 12
2.3.1 Data Sources 12
2.3.2 Injury Mortality 14
2.3.3 Injury Morbidity 17
2.3.4 The economic cost of injuries 17
2.3.5 Overview of risk patterns for fatal injuries in British Columbia 19
2.4 Scientific literature about sawmill workers 22
2.4.1 The work environment 22
2.4.2 Work-related injuries 24
2.4.3 Non work-related fatal injuries among sawmill workers 28
CHAPTER THREE 29
iv

3.0 Methodology 29
3.1 The study population and the original data base: The BC Sawmill Workers Cohort 29
3.2 Data sources 32
3.2.1 B.C. Coroners Service 32
3.2.2 Workers' Compensation Board of B.C. 33
3.2.3 B. C. Division of Vital Statistics 33
3.3 Exposure assessment 34
3.4 Analytical methodology 35
CHAPTER FOUR 39
4.0 Completeness of ascertainment of work-related injury fatalities: implications for surveillance 39
4.1 Introduction 39
4.2 Methods 42
4.2.1 Datasources 42
4.2.2 Analysis 46
4.3 Results 49
4.3.1 Completeness of ascertainment of work-related fatal injuries to B.C. sawmill workers 49 4.3.2 Accuracy of "place of injury" to identify work-related fatal injuries 54
4.4 Discussion §6
CHAPTER FIVE 60
5.0 Epidemiology of work-related fatalities among sawmill workers, 1950-1990 60
5.1 Introduction 60
5.2 Methods 63
5.2.1 Study population- The original B.C. Sawmill Workers study 63
5.2.2 Work-relatedness of a fatality 65
5.2.3 Assessment of exposure 66
5.2.4 Statistical analysis 67
5.2.5 Data preparation 70
v
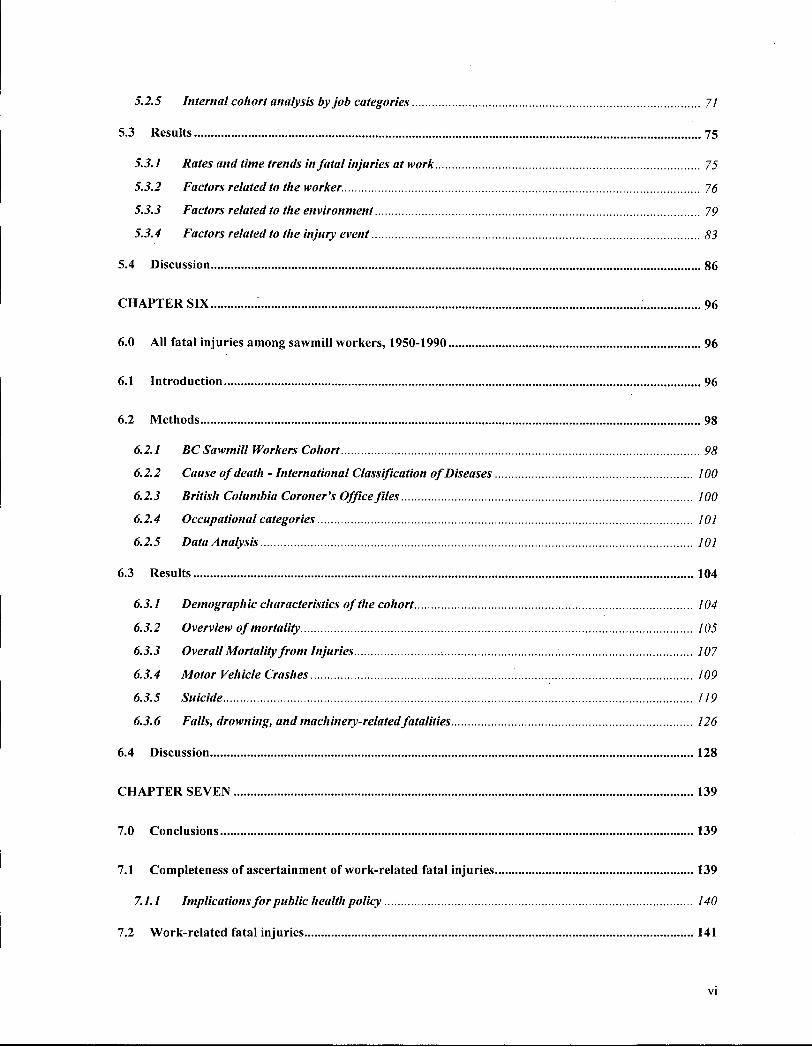
5.2.5 Internal cohort analysis by job categories 71
5.3 Results 75
5.3.1 Rates and time trends in fatal injuries at work 75
5.3.2 Factors related to the worker 76
5.3.3 Factors related to the environment 79
5.3.4 Factors related to the injury event 83
5.4 Discussion 86
CHAPTER SIX '. 96
6.0 AH fatal injuries among sawmill workers, 1950-1990 96
6.1 Introduction 96
6.2 Methods 98
6.2.1 BC Sawmill Workers Cohort 98
6.2.2 Cause of death - International Classification of Diseases 100
6.2.3 British Columbia Coroner's Office files 100
6.2.4 Occupational categories 101
6.2.5 Data Analysis 101
6.3 Results 104
6.3.1 Demographic characteristics of the cohort 104
6.3.2 Overview of mortality 105
6.3.3 Overall Mortality from Injuries 107
6.3.4 Motor Vehicle Crashes 109
6.3.5 Suicide U9
6.3.6 Falls, drowning, and machinery-related fatalities 126
6.4 Discussion 128
CHAPTER SEVEN 139
7.0 Conclusions 139
7.1 Completeness of ascertainment of work-related fatal injuries 139
7.1.1 Implications for public health policy 140
7.2 Work-related fatal injuries 141
vi

7.2.1 Implications for public health policy 143
7.3 All fatal injuries 145
7.5.7 Implications for public health policy 146
1A Limitations 147
7.4.1 Implications for public health policy 151
Bibliography 154
Appendix A - Location of study sawmills 166
Appendix B - Data collection forms 168
Appendix C - Job title groupings according to task, process area, and skill level 173
Appendix D - External causes of death categories by ICD revision 183
vii
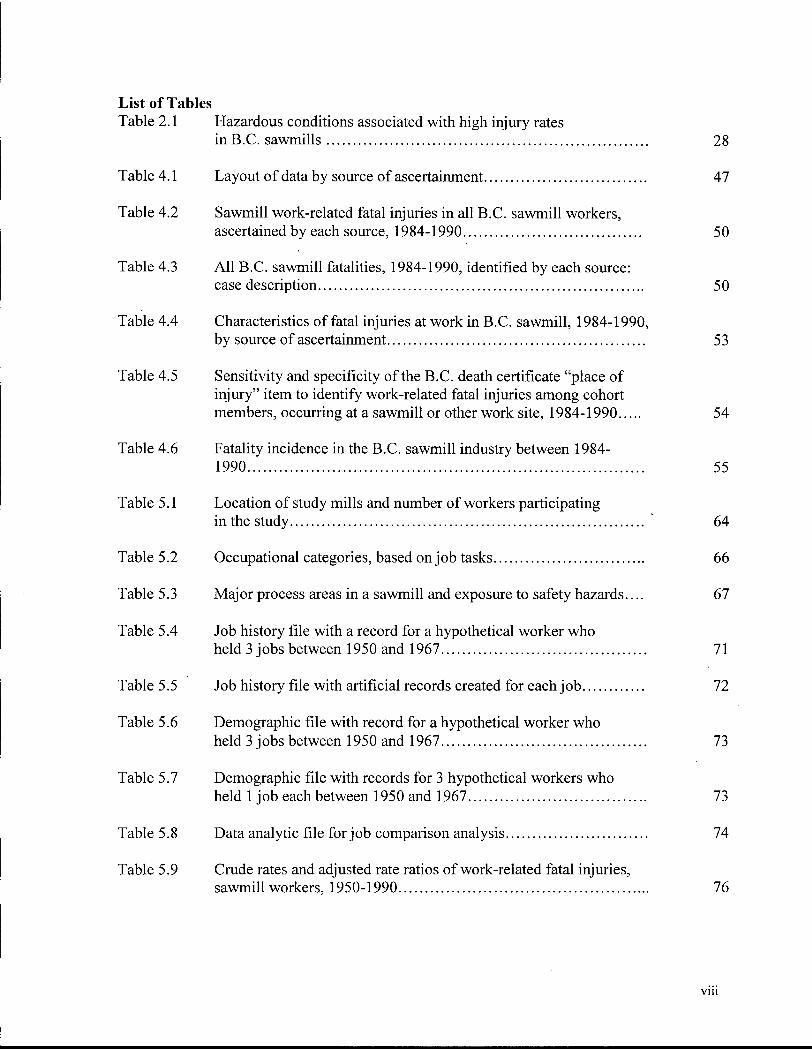
List of Tables Table 2.1 Hazardous conditions associated with high injury rates
in B.C. sawmills 28
Table 4.1 Layout of data by source of ascertainment 47
Table 4.2 Sawmill work-related fatal injuries in all B.C. sawmill workers, ascertained by each source, 1984-1990 50
Table 4.3 A l l B.C. sawmill fatalities, 1984-1990, identified by each source: case description 50
Table 4.4 Characteristics of fatal injuries at work in B.C. sawmill, 1984-1990, by source of ascertainment 53
Table 4.5 Sensitivity and specificity of the B.C. death certificate "place of injury" item to identify work-related fatal injuries among cohort members, occurring at a sawmill or other work site, 1984-1990 54
Table 4.6 Fatality incidence in the B.C. sawmill industry between 1984-1990 55
Table 5.1 Location of study mills and number of workers participating
in the study 64
Table 5.2 Occupational categories, based on job tasks 66
Table 5.3 Major process areas in a sawmill and exposure to safety hazards.... 67
Table 5.4 Job history file with a record for a hypothetical worker who
held 3 jobs between 1950 and 1967 71
Table 5.5 Job history file with artificial records created for each job 72
Table 5.6 Demographic file with record for a hypothetical worker who held 3 jobs between 1950 and 1967 73
Table 5.7 Demographic file with records for 3 hypothetical workers who
held 1 job each between 1950 and 1967 73
Table 5.8 Data analytic file for job comparison analysis 74
Table 5.9 Crude rates and adjusted rate ratios of work-related fatal injuries, sawmill workers, 1950-1990 76
viii
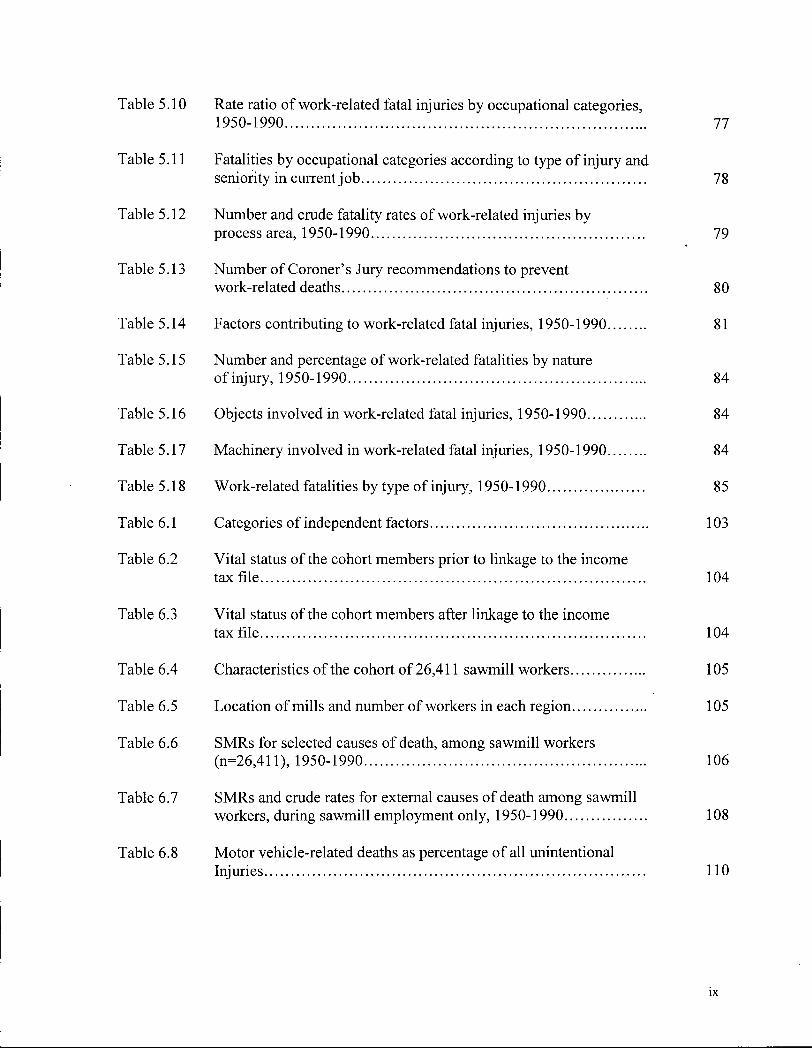
Table 5.10 Rate ratio of work-related fatal injuries by occupational categories, 1950-1990 77
Table 5.11 Fatalities by occupational categories according to type of injury and seniority in current job 78
Table 5.12 Number and crude fatality rates of work-related injuries by process area, 1950-1990 79
Table 5.13 Number of Coroner's Jury recommendations to prevent
work-related deaths 80
Table 5.14 Factors contributing to work-related fatal injuries, 1950-1990 81
Table 5.15 Number and percentage of work-related fatalities by nature
of injury, 1950-1990 84
Table 5.16 Objects involved in work-related fatal injuries, 1950-1990 84
Table 5.17 Machinery involved in work-related fatal injuries, 1950-1990 84
Table 5.18 Work-related fatalities by type of injury, 1950-1990 85
Table 6.1 Categories of independent factors 103
Table 6.2 Vital status of the cohort members prior to linkage to the income tax file 104
Table 6.3 Vital status of the cohort members after linkage to the income
tax file 104
Table 6.4 Characteristics of the cohort of 26,411 sawmill workers 105
Table 6.5 Location of mills and number of workers in each region 105
Table 6.6 SMRs for selected causes of death, among sawmill workers (n=26,411), 1950-1990 106
Table 6.7 SMRs and crude rates for external causes of death among sawmill workers, during sawmill employment only, 1950-1990 108
Table 6.8 Motor vehicle-related deaths as percentage of all unintentional Injuries 110
ix
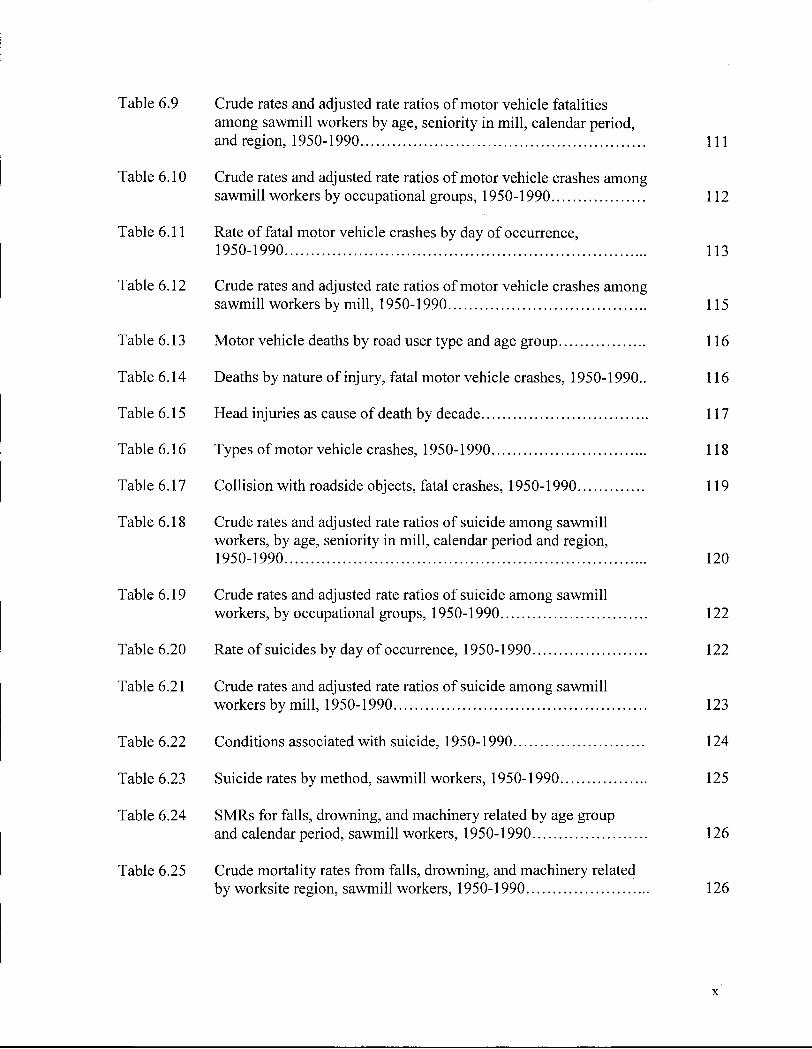
Table 6.9 Crude rates and adjusted rate ratios of motor vehicle fatalities among sawmill workers by age, seniority in mill, calendar period, and region, 1950-1990 I l l
Table 6.10 Crude rates and adjusted rate ratios of motor vehicle crashes among sawmill workers by occupational groups, 1950-1990 112
Table 6.11 Rate of fatal motor vehicle crashes by day of occurrence, 1950-1990 113
Table 6.12 Crude rates and adjusted rate ratios of motor vehicle crashes among
sawmill workers by mill, 1950-1990 115
Table 6.13 Motor vehicle deaths by road user type and age group 116
Table 6.14 Deaths by nature of injury, fatal motor vehicle crashes, 1950-1990.. 116
Table 6.15 Head injuries as cause of death by decade 117
Table 6.16 Types of motor vehicle crashes, 1950-1990 118
Table 6.17 Collision with roadside objects, fatal crashes, 1950-1990 119 Table 6.18 Crude rates and adjusted rate ratios of suicide among sawmill
workers, by age, seniority in mill, calendar period and region, 1950-1990 120
Table 6.19 Crude rates and adjusted rate ratios of suicide among sawmill
workers, by occupational groups, 1950-1990 122
Table 6.20 Rate of suicides by day of occurrence, 1950-1990 122
Table 6.21 Crude rates and adjusted rate ratios of suicide among sawmill
workers by mill, 1950-1990 123
Table 6.22 Conditions associated with suicide, 1950-1990 124
Table 6.23 Suicide rates by method, sawmill workers, 1950-1990 125
Table 6.24 SMRs for falls, drowning, and machinery related by age group and calendar period, sawmill workers, 1950-1990 126
Table 6.25 Crude mortality rates from falls, drowning, and machinery related by worksite region, sawmill workers, 1950-1990 126
x
List of Figures Figure 2.1 Percentage of deaths and hospitalizations due to unintentional
injuries by age groups, Canadian males, 1985 15
Figure 2.2 Percentage of deaths and hospitalizations due to unintentional injuries by age groups, Canadian females, 1985 15
Figure 2.3 Years of life lost before age 65 for selected causes of death, Canada, 1985 16
Figure 2.4 Costs of pension and benefits, and research costs share for selected illnesses, Canada, 1986 18
Figure 2.5 Percentage of leading causes of injury deaths by sex, Canada, 1985 20
Figure 4.1 Methodology for analyzing completeness of ascertainment of sawmill work-related fatal injuries 43
Figure 4.2 Methodology for assessing accuracy of "place of injury" on death certificates in identifying work-related fatalities at a sawmill or other work site 45
Figure 4.3 Number of work-related fatalities in all B.C. sawmill workers, 1984-1990, identified by each data sources... 49
Figure 5.1 Work-related injury fatality rates per 100,000 person-years,
1950-1990 76
Figure 5.2 Work-related fatality rates by time of occurrence, 1950-1990 82
Figure 5.3 Work-related fatality rates by day of occurrence, 1950-1990 82
Figure 5.4 Work-related fatality rates by month of occurrence, 1950-1990 83
Figure 5.5 Activity at time of incident : 83
Figure 6.1 Comparison of motor vehicle injury fatality rates between BC male
population and sawmill workers by age group, 1950-1990 I l l
Figure 6.2 Motor vehicle-related death by time and day of crash, 1950-1990... 114
Figure 6.3 Rate of M V crashes by season, 1950-1990 114
Figure 6.4 Motor vehicle crashes by road user type, 1950-1990 115
Figure 6.5 Contributing factors to motor vehicle crashes, 1950-1990 117
Figure 6.6 Comparison of suicide rates between B.C. male population and
sawmill workers by age group, 1950-1990 120
Figure 6.7 Suicide rates by trimester 123
Figure 6.8 Suicide by methods 124
Figure 6.9 Suicide rates by methods and age groups, 1950-1990 125
xii
Glossary
BC British Columbia
BCCS British Columbia Coroners Service
BCDF British Columbia Death File
B C D V S British Columbia Division of Vital Statistics
BCSWC British Columbia Sawmill Workers Cohort
C.I. Confidence Intervals
C M D B Canadian Mortality Data Base
CR Capture-Recapture
ICD International Classification of Diseases
LTAS Life Table Analysis System
M V Motor Vehicle
NIOSH National Institute for Occupational Safety and Health
OSHA Occupational Safety and Health Administration
P M R Proportionate Mortality Ratio
P Y L L Person Years of Life Lost
RR Rate Ratio
SMR Standardized Mortality Ratio
U.S. United States
WHO World Health Organization
xiii

Acknowledgments
This study could not have been possible without the help, support and encouragement of
many colleagues and friends, specially the members of my committee. They know only too
well that this research would never have been completed without their support and patience.
To my supervisor, Kay Teschke, special thanks for her vision, guidance and encouragement
during the seemingly endless succession of crises that marked this period. Clyde Hertzman
provided me with valuable comments and advice to enhance my skills as researcher. Paul
Demers guided me with patience and wisdom through the methodological challenges of the
statistical analyses without dismay. I also value the professional guidance I have received
from Sam Sheps.
I am sincerely grateful to my fellow colleagues who started the U B C Sawmill Workers
Cohort study. Especially valuable were the support and encouragement provided by Aleck
Ostry, Hugh Davies, Shona Kelly, Ruth Hershler, and Lisa Chan.
Needless to say this work would not have been possible without the support of the many
people at the Department of Health Care and Epidemiology whose support and friendship are
treasured. I am grateful to Virginia, Laurel, Zeba, and Stephanie for their friendship. I am
also grateful to Tej Sidhu, from the Chief Coroner's Office, for her kind assistance locating
files and to June Wick for her warm hospitality while I was collecting data in Victoria.
Finally, I thank Roberto, Daniel, Laura, Analia and Martina whose love sustained me during
the completion of this research.
xiv

CHAPTER ONE
1.0 Introduction
The major goal of this research is to expand knowledge on the epidemiology of injuries. The
ultimate goal is to help to reduce the number of unnecessary deaths due to preventable
injuries.
In Canada, the forestry industry contributes substantially to the wealth of the country. The
value of shipments by the sawmill, planing and shingle mill products reached $12.5 billion in
1993. With a workforce of approximately 70,000 sawmill and planer mill workers, this
country is among the world's leading producers of forestry products (Statistics Canada,
1993). In 1992, Canada was the world's largest producer of newsprint, the second largest
producer of pulp, and the third largest manufacturer of sawn lumber (Statistics Canada, 1994;
Statistics Canada, 1995a). British Columbia with 45 million hectares of productive forest,
accounts for approximately 50 percent of the activity of the Canadian forest industry.
In addition to being a principal component of the economy of the country, the forestry
industry is among the most hazardous. Forestry based industries have the second highest
fatality rate in Canada (117 fatalities per 100,000 workers in 1987) after fishing (Labour
Canada, 1990). Sawmill workers have the second highest rate of work-related injury
morbidity and mortality of the wood products industries. During 1987-1991 sawmill workers
had an average of 9 wage loss claims per 100 person-years which exceeded the average for
all industries combined of 6.5 wage loss claims per 100 person-years (WCB, 1992).
l
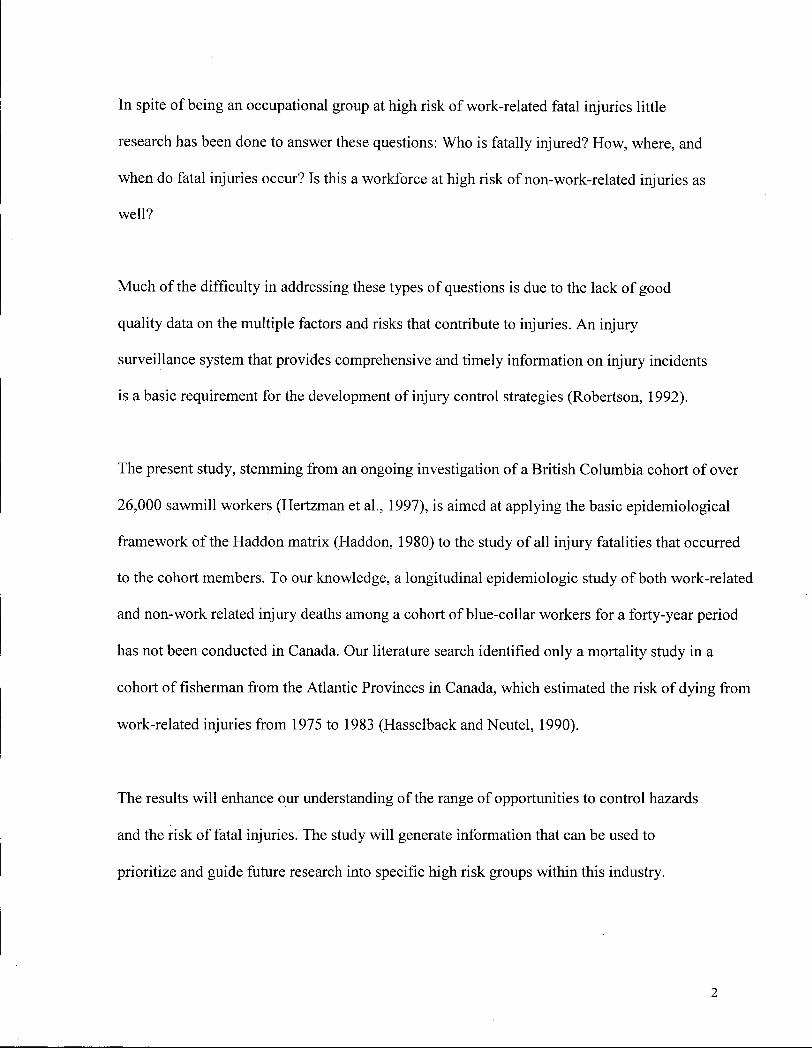
In spite of being an occupational group at high risk of work-related fatal injuries little
research has been done to answer these questions: Who is fatally injured? How, where, and
when do fatal injuries occur? Is this a workforce at high risk of non-work-related injuries as
well?
Much of the difficulty in addressing these types of questions is due to the lack of good
quality data on the multiple factors and risks that contribute to injuries. An injury
surveillance system that provides comprehensive and timely information on injury incidents
is a basic requirement for the development of injury control strategies (Robertson, 1992).
The present study, stemming from an ongoing investigation of a British Columbia cohort of over
26,000 sawmill workers (Hertzman et al., 1997), is aimed at applying the basic epidemiological
framework of the Haddon matrix (Haddon, 1980) to the study of all injury fatalities that occurred
to the cohort members. To our knowledge, a longitudinal epidemiologic study of both work-related
and non-work related injury deaths among a cohort of blue-collar workers for a forty-year period
has not been conducted in Canada. Our literature search identified only a mortality study in a
cohort of fisherman from the Atlantic Provinces in Canada, which estimated the risk of dying from
work-related injuries from 1975 to 1983 (Hasselback andNeutel, 1990).
The results will enhance our understanding of the range of opportunities to control hazards
and the risk of fatal injuries. The study will generate information that can be used to
prioritize and guide future research into specific high risk groups within this industry.
2

Furthermore, the findings will provide evidence of the potential usefulness of the available
data sources for surveillance.
The following specific aims define the structure of the research:
1. To investigate completeness of ascertainment of work-related fatal injuries using
records from the B.C. Coroner's Office and the Workers Compensation Board of
B.C., and also to assess the accuracy of the item "place of injury" on death certificates
in identifying work-related deaths among sawmill workers.
Capture rates for each data source are calculated. Capture-recapture techniques for two
independent data sources are applied to estimate the degree of underreporting. The sensitivity
and specificity of the designation "place of injury" on death certificates are estimated. The
implications of these findings for injury surveillance are discussed.
2. To examine all work-related fatal injuries among the sawmill workers in terms of
a) characterizing the pattern and trend of fatal injuries at work
b) estimating the risk of fatal injuries at work
c) assessing the relationship between selected variables and the risk of fatal injuries at work
d) identifying the occupational categories at highest risk of fatal injuries at work
Both descriptive and analytical methods are applied. Frequency distributions are used to
characterize the pattern of fatalities according to factors related to the worker, the physical
environment and the socio-cultural environment. Mortality rates are estimated to illustrate
trends from 1950 through 1990.
3

Poisson regression modeling is used to assess the relationship of selected variables and the
risk of fatal injury at work, and also to identify the occupational categories at highest risk of
fatal injury at work.
3. To examine mortality among the sawmill workers from selected external causes in terms of
a) characterizing the pattern and trend of mortality from selected external causes
b) estimating the risk of mortality from selected external causes
c) comparing injury mortality from external causes in the cohort with that of the male population of British Columbia.
d) assessing the association of selected variables with the risk of mortality from selected external causes.
e) comparing injury mortality from selected external causes among subcohorts defined according to occupational categories.
Both descriptive and analytical methods are applied. Frequency distributions are used to
characterize the pattern of fatalities according to factors related to the worker, the physical
environment and the socio-cultural environment. Mortality rates are estimated to illustrate
trends from 1950 through 1990.
Standardized Mortality Ratios (SMRs) are calculated to compare the injury mortality of
cohort members with that of the B.C. male population. Poisson regression modeling is used
to assess the association of selected variables with the risk of mortality from selected external
causes, and also to compare fatality rates among occupational categories.
4
CHAPTER TWO
2.0 Background
The background for this study is presented according to the following themes:
• Injury research: concepts and issues
• Development of the epidemiological model of injuries
• Canadian injury facts
• Scientific literature about injuries among sawmill workers
The first theme is concerned with the use and misuse of the term "accident" as synonym for
"injury". The detrimental connotations and consequences of using this term particularly hindering
the advance of knowledge in the area of injury control, are explained. The second theme addresses
the evolution of knowledge into the causes of injury. It covers the successive steps from the
pioneering work of DeHaven, Gordon and Gibson to the adoption of an epidemiological model and
the development of the Haddon matrix. The third theme consists of a summary of statistics
regarding the magnitude of the injury problem in Canada. Mortality and morbidity data are
presented together with the estimated costs of injury in Canada. The fourth theme summarizes
epidemiological studies of injury among sawmill workers.
2.1 Injury Research: Concepts and issues
According to the Webster's Dictionary, an accident is " a mishap, a chance event commonly
involving catastrophe, suffering or damage". The definition implies that such events are
random and can not be foreseen or expected. The word accident has also the connotation of
lack of intent. Furthermore, the etymological history of the word reveals that accidents have
5

also been interpreted as "acts of God" for centuries and this fatalistic view persists to this
day. Another common understanding is that accidents are a result of inattention or in some
cases deliberate risk taking (Loimer and Guarnieri, 1996; Rivara, 1982; Pless, 1989;
Robertson, 1992).
The term accident has a number of misleading connotations that underscore the
inappropriateness of its use to describe injury events. First, randomness signifies that every
person has an equal chance of being affected. For many years it has been known that injuries
occur more frequently among certain groups than others and that there is a differential
distribution of injuries according to age, sex, time and place as well as other demographic
factors (Baker, et al., 1992). In fact, insurance companies use this knowledge to estimate the
likelihood of an injury event for specific populations and circumstances and set their rates
accordingly (Waller, 1985).
Injuries are non-random events and they do not occur by chance. Most injuries are
predictable and preventable.
Second, accidents are viewed as acts of God or fate, sometimes assumed to be the
consequence of human error or behaviour. This misconception has led to a focus on the
notion of fault; assuming that accidents are necessarily the result of carelessness,
unawareness or ignorance on the part of the individual suffering the injury. This attention on
the person involved has resulted in blaming the victim and has hindered the development of
preventive countermeasures by ignoring the full range of factors that contribute to the
6

occurrence and severity of injuries. To believe that the reduction of the injury toll depends
primarily on changing individual behaviour is far too narrow a focus considering the present
knowledge about causation (Waller, 1985; Robertson, 1983; Kraus and Robertson, 1992).
For these reasons the term accident will not be used here. The term injury (from the latin,
injuria, harm or insult) will be used instead to denote an event in which 1) damage occurs
over a short period of time (i.e. acute exposure), and 2) the damage results either from one of
the forms of physical energy in the environment (kinetic, chemical, thermal, electrical,
ionizing radiation) or because normal body mechanisms for using such energy are blocked by
external causes (such as by drowning). The term injury is also chosen because it allows to
focus on the damage or harm rather than the incident, and apply an epidemiologic approach
to the study of injuries (Rivara, 1982; Waller, 1985).
Both unintentional (e.g. falls, machinery-related, transportation-related) and intentional (e.g.
suicide, homicide) fatal injuries are included in this study.
2.2 The development of the epidemiological model of injuries
2.2.1 Pioneering work into the causes of injuries
Although injuries are as old as mankind and have always been at least endemic, it was not
until the middle of the 20 t h century that researchers started to gain insight into the causes of
injuries (Haddon, et al., 1964). Among the pioneers in this field is Hugh De Haven, an
engineer who in 1942 published a paper that began a conceptual shift in the understanding of
the determinants of injury severity. His study of people who survived falls from great heights
7

showed that the injury severity in falls is mainly determined by the characteristics of the
environment, including the surface of impact and what is beneath that surface. It also
illustrated that, under appropriate conditions, the normal human body can tolerate very high
deceleration forces without significant injury (DeHaven, 1942; National Committee on Injury
Prevention and Control, 1989).
In 1949, John E. Gordon, proposed that injuries behaved like infectious diseases and were
characterized by epidemic episodes, seasonal variation, long-term trends, and geographic,
socioeconomic, and rural-urban distributions. He suggested that in a broad sense injuries are
in many ways, a problem in medical ecology. Most important, injuries could be studied like
classical infectious diseases recognizing that they are product of the interaction of factors
related to the host, the agent and the environment (Gordon, 1949; Haddon, et al., 1964).
It was not until 1961, that an experimental psychologist, James J. Gibson identified the
causes of injuries. He wrote:
"Man.. .responds to the flux of energies which surround him -gravitational and mechanical,
radiant, thermal, and chemical.. .Injuries to a living organism can be produced only by some
energy interchange. Consequently, a most effective way of classifying sources of energy is
according to the forms of physical energy involved. The analysis can thus be exhaustive and
conceptually clear. Physical energy is either mechanical, thermal, radiant, chemical, or
electrical" (Gibson, 1961; Haddon, et a l , 1964).
8

At approximately the same time, William Haddon concluded as Gibson did, that the several
kinds of energy are the necessary causes of injuries (Haddon, 1963). He also included the
notion of "negative agents" for injuries resulting from the absence of elements such as
oxygen or heat needed for normal health (i.e. drowning). Haddon expanded the model by
identifying the vehicles and vectors of energy transmission and including the notion of
human resistance to these energy forces (Haddon, 1970).
The importance of these pioneers' work and others that followed their concepts, is the shift in
injury prevention from a naive preoccupation with distributing educational pamphlets and
posters towards modifying instead the environments in which injuries occur (Waller, 1987;
Baker, et a l , 1992; Kraus and Robertson, 1992).
2.2.2 The epidemiological model
Like any other health problem, injuries can be analyzed using the epidemiological model
with the triad of components: the host, the agent (and mechanisms of transfer of the agent),
and the environment.
The agent: injury results from a transfer of energy to the human body at levels that exceed
the body threshold. It is the nature and extent of the energy transfer which determines the
type and severity of injury. Waller suggests that the occurrence of injury and its severity is
determined by 1) the mass of energy liberated and the speed of that release, 2) the rate of
transfer of that energy to the tissues (considering the amount of energy impacting the tissue
in an specific time), and 3) the inherent characteristics of the tissue and the organism.
(Waller, 1985).
9

The understanding of the mechanisms of energy transmission and the changes that this
energy produces at the cellular, tissue or organ level is fundamental for the development of
injury control strategies.
Vehicles and vectors: energy in any of its forms can be carried by inanimate objects
(vehicles) or living organisms (vectors) from its reservoir to the host. Thus, electrical wires
are vehicles of electricity and moving objects, like cars, are vehicles of mechanical energy.
Animals that produce an injury by tearing (i.e. dog bit) or crushing (i.e. horse kick) are
vectors of mechanical energy.
The identification of the vehicles of energy is useful since many preventive interventions can
be directed against the vehicles and vectors rather than against the physical and chemical
agents they carry.
Host: the human body has certain resistance to energy impacting on it. However, there are
limits beyond which the energy received by the host cannot be tolerated or neutralized. In
addition, there are variations in resistance to the agents of injury which affect the occurrence
and severity of injuries. The susceptibility to injury agents is greatly affected by personal
factors that can be related to biological features (e.g. physiological changes due to aging or
pathological changes due to diseases) or conditions due to peculiar temporary circumstances
(e.g. fatigue, alcohol). The importance of injury threshold in bodily mechanical energy
exchanges was demonstrated by De Haven's studies (De Haven, 1942; Waller, 1985). He
realized that these injury thresholds and the conditions of impact (and not velocity of impact
per se) are the determinants of the injury outcome.
2.2.3 The Haddon matrix
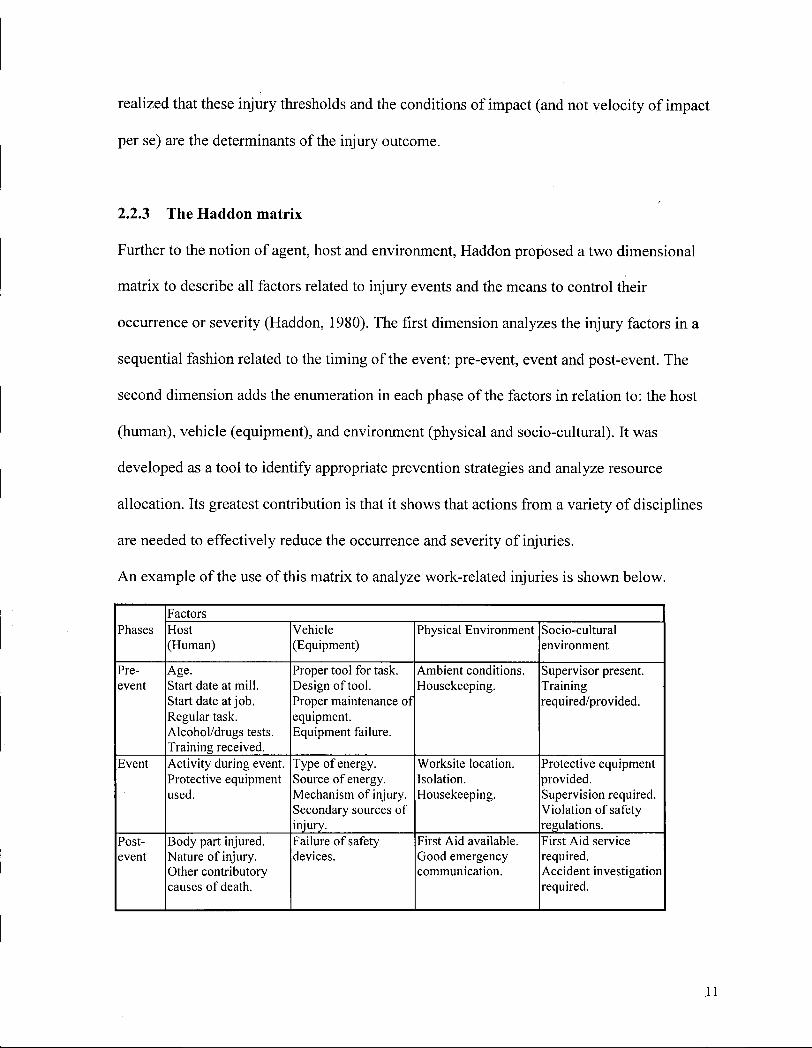
Further to the notion of agent, host and environment, Haddon proposed a two dimensional
matrix to describe all factors related to injury events and the means to control their
occurrence or severity (Haddon, 1980). The first dimension analyzes the injury factors in a
sequential fashion related to the timing of the event: pre-event, event and post-event. The
second dimension adds the enumeration in each phase of the factors in relation to: the host
(human), vehicle (equipment), and environment (physical and socio-cultural). It was
developed as a tool to identify appropriate prevention strategies and analyze resource
allocation. Its greatest contribution is that it shows that actions from a variety of disciplines
are needed to effectively reduce the occurrence and severity of injuries.
A n example of the use of this matrix to analyze work-related injuries is shown below.
Phases Factors
Phases Host (Human)
Vehicle (Equipment)
Physical Environment Socio-cultural environment
Pre-event
Age. Start date at mill. Start date at job. Regular task. Alcohol/drugs tests. Training received.
Proper tool for task. Design of tool. Proper maintenance of equipment. Equipment failure.
Ambient conditions. Housekeeping.
Supervisor present. Training required/provided.
Event Activity during event. Protective equipment used.
Type of energy. Source of energy. Mechanism of injury. Secondary sources of injury.
Worksite location. Isolation. Housekeeping.
Protective equipment provided. Supervision required. Violation of safety regulations.
Post-event
Body part injured. Nature of injury. Other contributory causes of death.
Failure of safety devices.
First Aid available. Good emergency communication.
First A id service required. Accident investigation required.
.11
In the pre-event phase attention is given to the characteristics of each factor that will increase
the likelihood of an incident to occur. For example, a sensory impairment like hearing loss
(human factor); or the operation of a tool that has not received proper maintenance (vehicle
factor); or extreme temperature conditions (physical environment factor); or the lack of
safety policy regarding provision of training for the worker (sociocultural environment
factor), can contribute to the occurrence of an injury. During the event phase the interest is
placed on those features of each factor that will increase the probability of having an injury
once the incident has happened (e.g. use of protective equipment, guards of mobile parts,
housekeeping conditions, regulations regarding supervision, etc.). Finally in the post-event
phase it is important to list the peculiarities in each factor that will worsen the injury sequelae
(e.g. age, failure of safety devices, availability of first aid, regulations requiring accident
investigation, etc.).
2.3 Canadian injury facts
2.3.1 Data Sources
Although injuries are a major cause of morbidity and mortality, they have not received the
attention given to many other diseases of comparable or lesser public health importance
(Pless,1989). One of the major challenges faced by safety professionals concerned with
injury control is the lack of a comprehensive surveillance system to describe the magnitude
of the injury problem in terms of who is more likely to suffer an injury, and where, when,
and how injuries occur. While data on injury mortality is available from a couple of sources,
morbidity data is very limited. It has been said that for every death, there are at least 45
hospitalized injuries, and approximately 1300 others that are sufficiently serious so as to
12
require treatment in emergency departments. However, these figures alone are insufficient to
illustrate the real magnitude and nature of the injury problem (Saunders and Stewart, 1991;
Pless, 1989).
Data on fatal injuries can be obtained from a couple of sources that systematically collect
information on deaths in the population: 1) death certificates, and 2) Coroner's records.
Death certificates contain basic demographic information and the cause of death. While these
certificates are a good source for counting fatalities resulting from broadly defined causes of
injury, they do not provide information on the circumstances of the event. A l l deaths
resulting from injuries are classified according to the International Classification of Diseases
External cause of death codes (E800-E999). This group of causes of deaths comprises two
subcategories defined as unintentional injuries (E800-E949), such as falls, drowning, motor
vehicle related, etc. and intentional or violent injuries (E950-E999), such as suicide,
homicide, legal execution and war.
Data on the circumstances of a fatal injury can be retrieved from the Coroner's records. The
Chief Coroner is responsible for the investigation of the facts related to sudden, and
unexpected deaths, like injury deaths. Other causes requiring coroners investigations include
deaths in a correctional institution or police custody, and deaths during pregnancy. The
coroner may decide to hold an Inquiry (without a jury) or an Inquest before a jury and with
presentations by witnesses, of the circumstances of the fatality. Coroners and coroners' juries
may make recommendations to agencies and individuals involved, to prevent similar loss of
13
life in the future. In order to investigate the circumstances of a sudden death, the Coroner
gathers information from several sources including pathologists, police, workers'
compensation board inspectors, and any other professional considered relevant to clarify the
sequence of events that led to a fatal injury. Although these records are very useful for
epidemiological research, the lack of a standardized reporting format results in poor
consistency from one report to the next and the level of detail in the narrative depends on the
coroner in charge of the investigation.
Data on specific injuries like work-related injury deaths are collected by the Workers'
Compensation Boards. These files contain detailed descriptions of injuries that have occurred
at the workplace and required compensation for medical treatment, disability or death. Severe
injuries and fatalities are investigated by field officers from the WCB with the purpose of
determining the cause of the incident, identifying unsafe conditions (i.e. violations of safety
regulations) and developing recommendations for corrective action to prevent future injuries.
The fatality investigation report has a standardized format with very comprehensive
information on the pre-event and event phases of the incident. While the use of these records
may result in an undercounting of fatal cases (e.g. non-universal coverage, incomplete
workers report, and count of adjudicated claims only), the database is a very useful resource
for surveillance of work-related injuries (Spiegel and Yassi, 1991).
2.3.2 Injury Mortality
Injuries are the leading cause of both death and hospitalizations up to age 45. For the whole
population, injuries are the fourth cause of death after cardiovascular diseases, cancer and
14
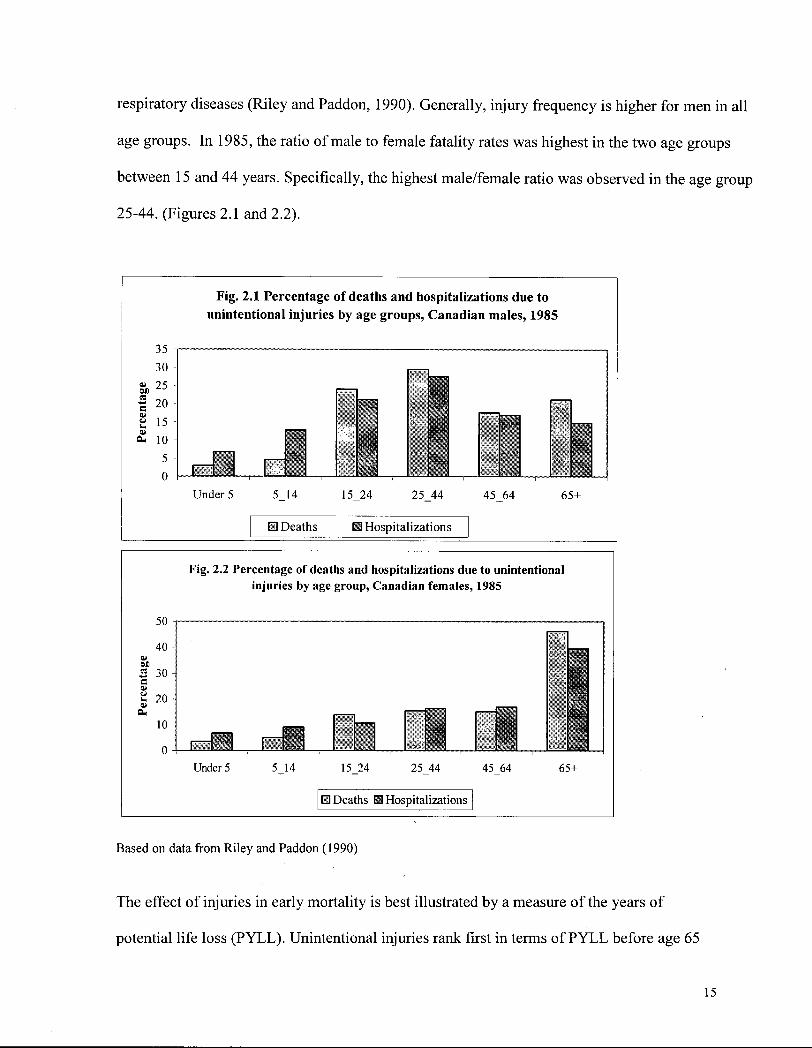
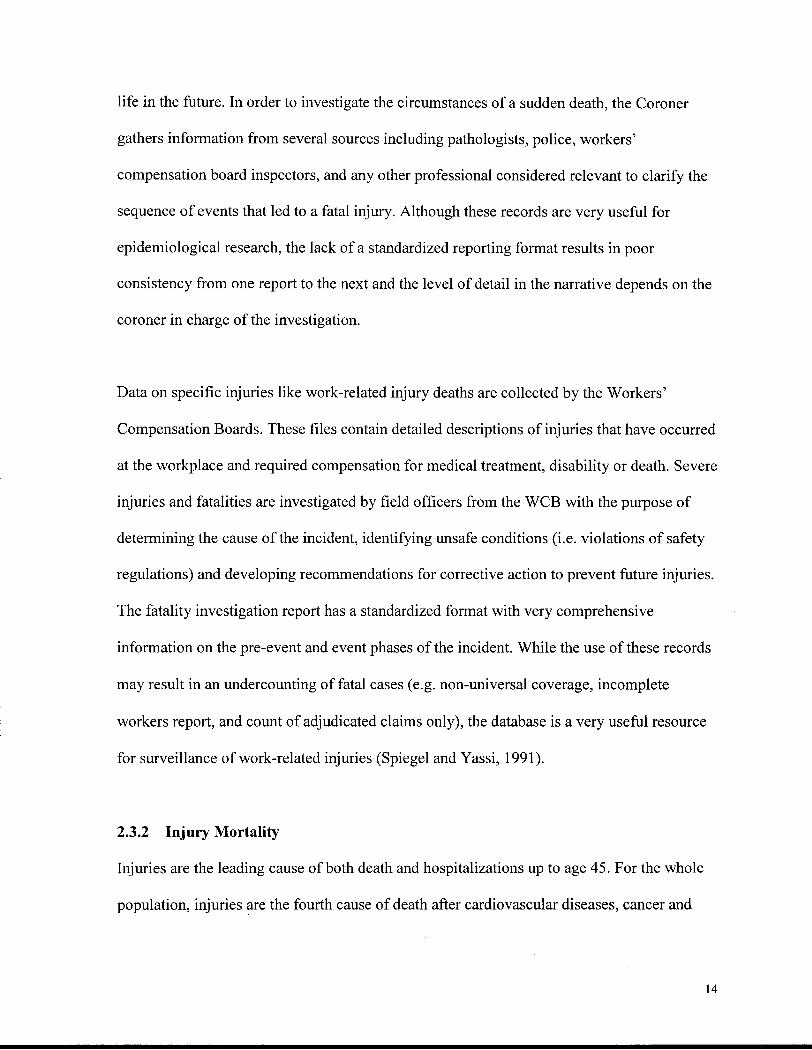
respiratory diseases (Riley and Paddon, 1990). Generally, injury frequency is higher for men in all
age groups. In 1985, the ratio of male to female fatality rates was highest in the two age groups
between 15 and 44 years. Specifically, the highest male/female ratio was observed in the age group
25-44. (Figures 2.1 and 2.2).
Fig. 2.1 Percentage of deaths and hospitalizations due to unintentional injuries by age groups, Canadian males, 1985
35 30
& 2 5
| 20
a is CU
o- io
Under 5 5 14 15 24 25 44 45 64 65+
H Deaths I Hospitalizations
Fig. 2.2 Percentage of deaths and hospitalizations due to unintentional injuries by age group, Canadian females, 1985
50
40 Ml « 30 C V
u L .
20 <U
20 0-
10
0 Under 5 5 14 15 24 25 44 45 64 65+
B Deaths U Hospitalizations
Based on data from Riley and Paddon (1990)
The effect of injuries in early mortality is best illustrated by a measure of the years of
potential life loss (PYLL). Unintentional injuries rank first in terms of P Y L L before age 65
15
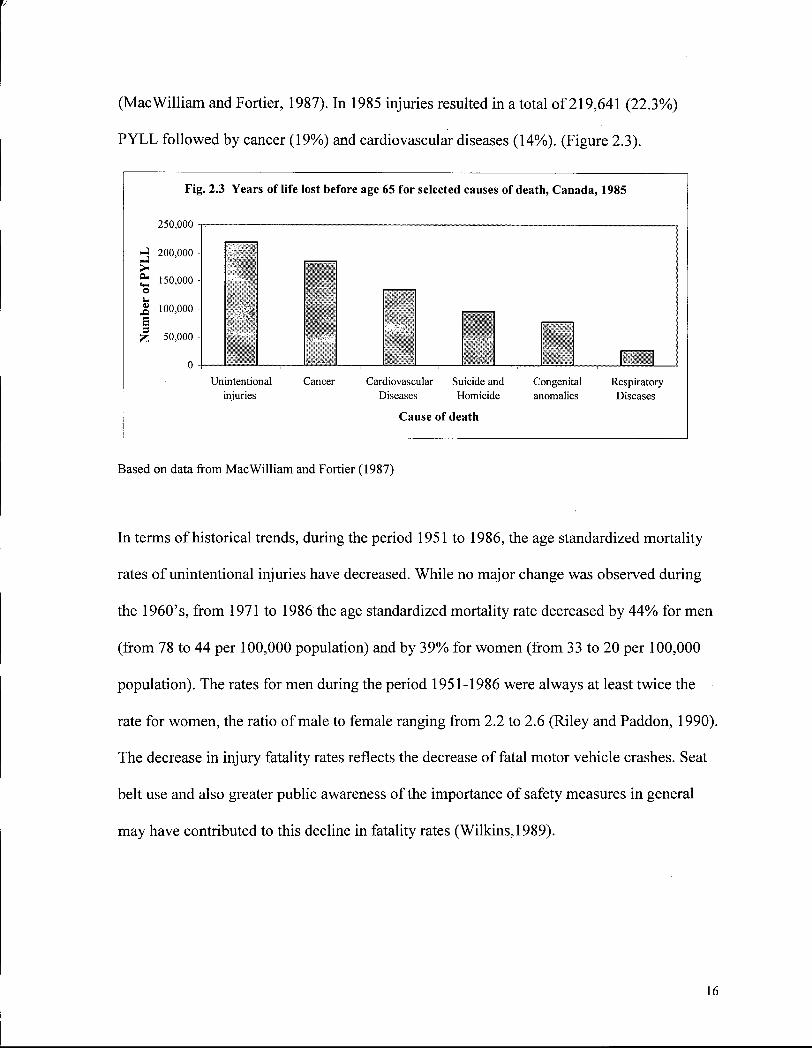
(MacWilliam and Fortier, 1987). In 1985 injuries resulted in a total of 219,641 (22.3%)
P Y L L followed by cancer (19%) and cardiovascular diseases (14%). (Figure 2.3).
Fig. 2.3 Years of life lost before age 65 for selected causes of death, Canada, 1985
250,000 -r
200,000 -
150,000 -o
XI 100,000 -
s Z 50,000 -
0 Unintentional Cancer Cardiovascular
Diseases Suicide and Homicide
Congenital anomalies
Respiratory Diseases injuries
Cause of death
Based on data from Mac William and Fortier (1987)
In terms of historical trends, during the period 1951 to 1986, the age standardized mortality
rates of unintentional injuries have decreased. While no major change was observed during
the 1960's, from 1971 to 1986 the age standardized mortality rate decreased by 44% for men
(from 78 to 44 per 100,000 population) and by 39% for women (from 33 to 20 per 100,000
population). The rates for men during the period 1951-1986 were always at least twice the
rate for women, the ratio of male to female ranging from 2.2 to 2.6 (Riley and Paddon, 1990).
The decrease in injury fatality rates reflects the decrease of fatal motor vehicle crashes. Seat
belt use and also greater public awareness of the importance of safety measures in general
may have contributed to this decline in fatality rates (Wilkins,1989).
16
Suicide rates were lowest during the 1940's (13.8 per 100,000 in 1945) and stabilized during
the period from 1946 to 1964. They increased sharply during the 1960's and 1970's reaching
a maximum of 28.8 per 100,000 in 1983 (Canada Health and Welfare, 1987).
2.3.3 Injury Morbidity
In 1987, approximately 4 million Canadians, aged 15 and over, reported that they had an
injury. Motor vehicle injuries were the most frequent (one in three incidents), followed by
sports injuries (23%), injuries at work (21%), and at home (13%). The highest injury rate
among men was 107 per 100,000 population for motor vehicle related injuries (Millar and
Adams, 1991).
Approximately 80% of all incidents resulted in personal injury, and almost half of these resulted in
medical attention in a hospital (2.3 million injury events). Overall, 79% of incidents resulted in
activity-loss days, and 36% involved bed-disability days. In 1987, approximately 51 million
activity-loss days, nine million disability days and two million hospital days were attributable to
injuries. Apart from the hospital utilization costs, about 13 % of incidents involved out-of-pocket
expenses.
2.3.4 The economic cost of injuries
The economic impact of injury in Canada, both in terms of direct (e.g. hospital care,
professional services, medications, research, pensions and benefits) and indirect costs (e.g.
loss of future income and value of productivity lost due to chronic disability) was estimated
at $11 billion in 1986. This amount was the second highest after cardiovascular disease costs
17
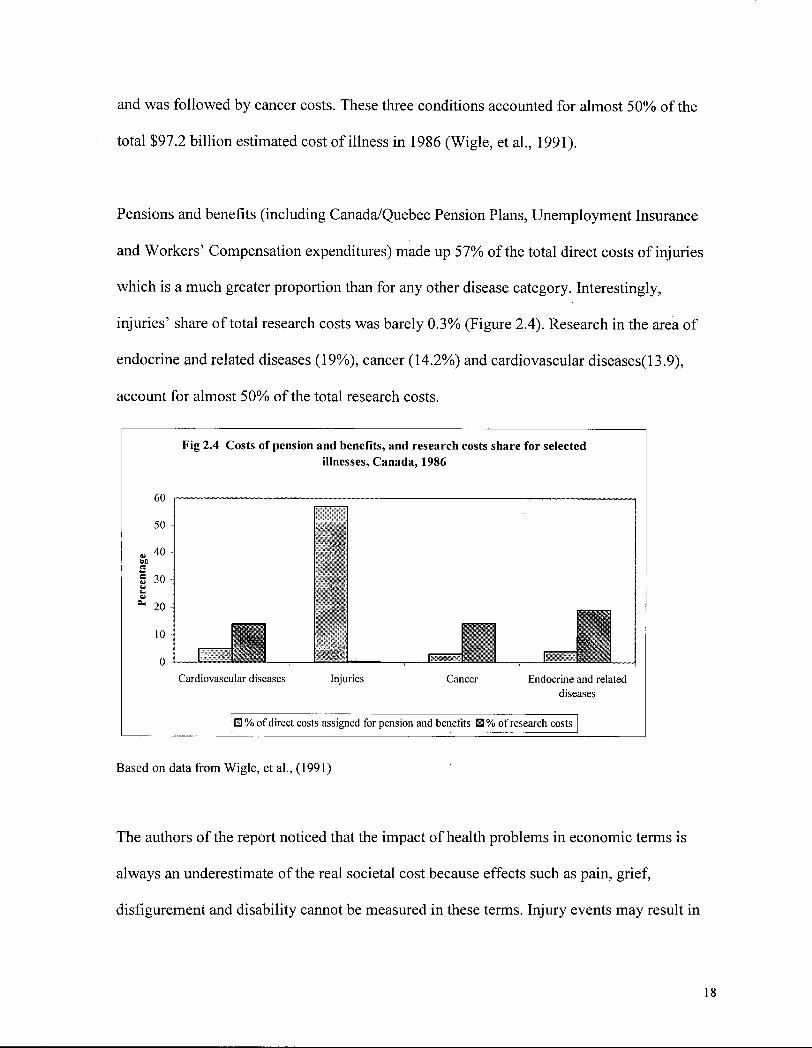
and was followed by cancer costs. These three conditions accounted for almost 50% of the
total $97.2 billion estimated cost of illness in 1986 (Wigle, et al., 1991).
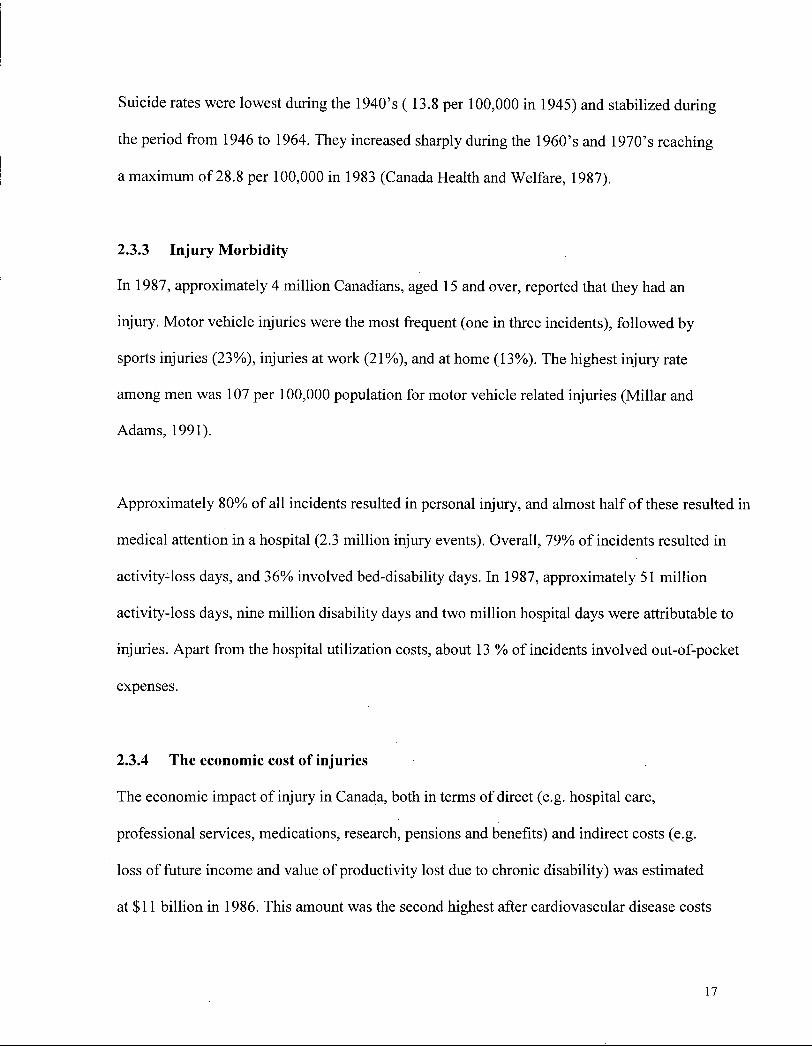
Pensions and benefits (including Canada/Quebec Pension Plans, Unemployment Insurance
and Workers' Compensation expenditures) made up 57% of the total direct costs of injuries
which is a much greater proportion than for any other disease category. Interestingly,
injuries' share of total research costs was barely 0.3% (Figure 2.4). Research in the area of
endocrine and related diseases (19%), cancer (14.2%) and cardiovascular diseases(13.9),
account for almost 50% of the total research costs.
60
50
„ 40 R
1 30 U L. tU
^ 20
10
0
Fig 2.4 Costs of pension and benefits, and research costs share for selected illnesses, Canada, 1986
• H
Cardiovascular diseases Injuries Cancer Endocrine and related diseases
• % of direct costs assigned for pension and benefits • % of research costs
Based on data from Wigle, et al., (1991)
The authors of the report noticed that the impact of health problems in economic terms is
always an underestimate of the real societal cost because effects such as pain, grief,
disfigurement and disability cannot be measured in these terms. Injury events may result in
18
economic dependence, social isolation, loss of opportunities for education as well as other
unwanted changes in life plans (Rice et al., 1985).
2.3.5 Overview of risk patterns for fatal injuries in British Columbia
Sex
In B.C. the age-standardized injury mortality rate for men was 53.1 per 100,000 population in
1987. At all ages men are more likely to suffer fatal injuries than women. The ratio
male/female varied from 1.2 times greater for adults aged 85+ to 4.1 times greater for those
aged 20-24. The unintentional injury type with the greatest male/female differential was
drowning with males having 5.0 times more deaths than females (B.C. Vital Statistics, 1997).
The average suicide rate for B.C. males for 1984-1992 was 20.9 per 100,000 male population
and 5.8 per 100,000 female population. The largest proportion of male suicides occurred
between the ages of 20 and 29 (22.8%), followed by men aged 30-39 (21.6%) (Tuk and
Macdonald, 1995).
Age
Data from B.C. (1987-1995) show that the elderly (75 and over) had the highest mortality
rate from unintentional injuries, followed by young adults, aged 15-24. The lowest rates were
among children under age 15 (B.C. Vital Statistics, 1997). These figures show that despite of
being the 5 t h cause of death among individuals aged 85 and more, injuries occur more
frequently among the elderly than among the rest of the population.
During the period 1985-1993 the highest age specific suicide rates were in the 80+ age group.
The lowest rates were in the 10-19 year age group (Tuk and Macdonald, 1995).
Type of injury
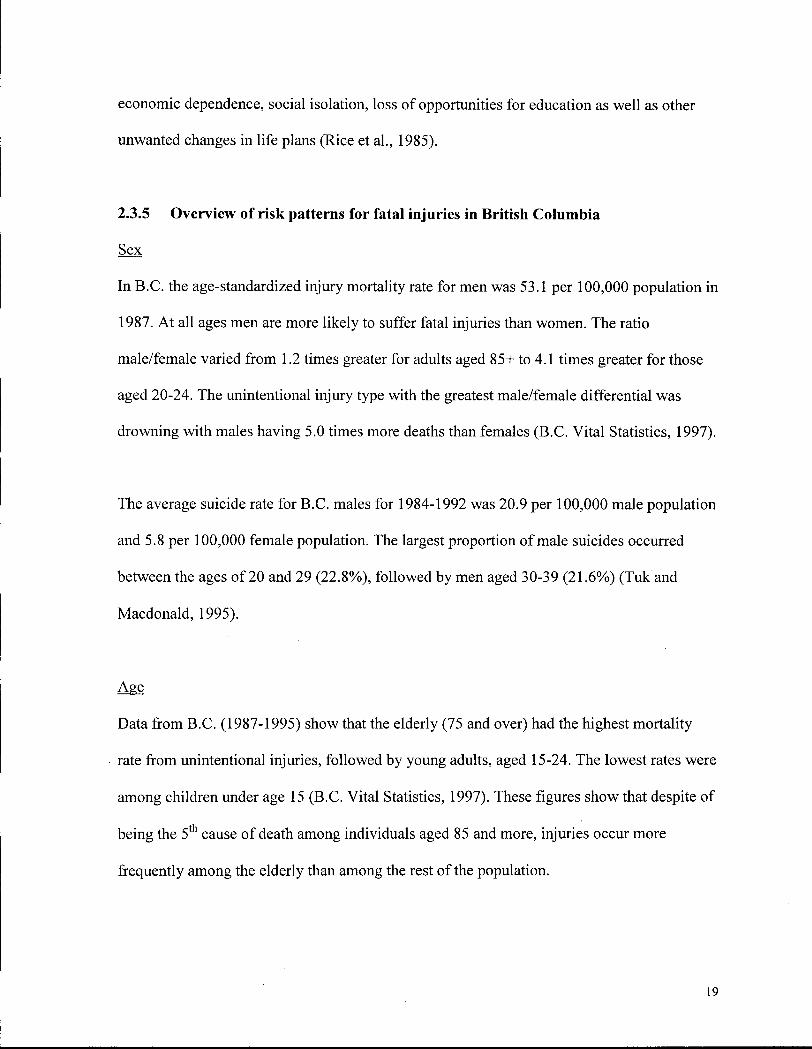
The six leading causes of death from unintentional injuries show a slightly different order
among men than among women.(Figure 2.5). Drowning is the third cause of death for men
but the fifth for women. Falls were the second leading cause of death for both but the
proportion of fatal falls was greater among women in the age group 64 and over.
Fig. 2.5 Percentage of leading causes of injury death by sex, Canada, 1985
50 T .
45 -I I
35
Motor vehicle Falls Drowning Fires Suffocation Poisoning
H Males 8 Females
Based on data from Riley and Paddon (1990)
Suicide is the 8 most frequent cause of death among British Columbians. Its importance as
cause of death varies at different stages of life. It is the second cause of death for young
adults aged 15-24, and the third for the groups aged 25-44 and 45-64. The largest proportion
of male suicides involved the use of guns. On the other hand, the largest proportion of female
suicides was by drug overdose.
20
The highest ratio of observed to expected suicide was among the unemployed labour force.
High ratios for suicide, homicide and gun deaths, were also observed among blue collar
workers in the primary industry areas of forestry, fishing, hunting/trapping and construction
(Tuk and Macdonald, 1995).
Regional variation
Compared with other provinces, British Columbia has the highest rate of unintentional
injuries. (Statistics Canada, 1995b). The age standardized injury rates for men and women in
the Atlantic region, Quebec and Ontario, were lower than the national average. In contrast,
the rates in the Prairie Region and British Columbia were higher than the national average.
For example, in the Atlantic region, the motor vehicle injury rates was 47 per 1,000
compared with 85 per 1,000 in Ontario and 130 per 1,000 in British Columbia (Millar and
Adams, 1991).
Within British Columbia, people living in the northern interior and rural areas of the province
are at greater risk of injuries (B.C. Provincial Health Officer's Annual Report, 1996).
Coincidentally, using an index of socio-economic status based on three variables (i.e.
percent of population on income assistance, percent of population aged 25-34 with less than
high school graduation, and unemployment rate), it was found that the regions of the
province with the worst scores (i.e. lowest socioeconomic status) were the northern interior,
south central, and Cariboo. These regions had the highest mortality rates from unintentional
injuries. Other factors likely to affect this distribution are that more miles are driven in rural
21
areas, the roads may be in poor conditions, driving practices may differ (greater speeds,
lower use of seat belts).
There are regional differences regarding the occurrence of intentional deaths as well. For
example, statistically significantly higher standardized mortality ratios of violent deaths were
reported in the northern and rural areas of the province (observed cases higher than expected
number, calculated based on B.C specific mortality rates). This pattern coincides with the
highest involvement of guns as a means of death in those regions. Urban areas (except for
Vancouver and New Westminster) had generally lower SMRs.
2.4 Scientific literature about sawmill workers
2.4.1 The work environment
The physical environment of a sawmill
In a survey of approximately 700 workers from 15 Swedish sawmills, noise was identified as
the most disturbing environmental problem (Ager, 1974). The level of noise was measured at
different workstations for 5 hours of daily exposure and it was concluded that 41% of the
workers were exposed to noise levels between 85-95 dBA and 28 % to levels between 95-
110 dBA. Therefore about 70% of the workers were exposed to noise levels that indicated the
need for hearing protection. Apart from causing hearing loss, excessive noise was implicated
as a factor for social isolation, increased stress and reduced performance.
22
Other environmental stressors identified by the Swedish sawmill workers were wood dust
and other particulate matter, temperature extremes, and insufficient lighting. Approximately
2/3 of the workers complained about wood dust, particularly in large mills (Ager,1974).
Physical workload
Ager (1974) calculated the amount of energy consumed by sawmill workers in different mill
jobs in order to ascertain their physical work load. Jobs with an energy consumption
exceeding an average of 5.4 kcal/min during an 8 hour working day were classified as
physically strenuous. Thirty one per cent of the jobs in small mills were physically strenuous
compared to 4 percent in large mills. However, the proportion of workers experiencing their
jobs as strenuous was about the same in large and small mills. The reason for this is that
work in large mechanized mill implies more time in fixed postures because of the work
station layout (e.g. position of pedals, etc.), thus producing muscle strain.
Approximately 80% of the 700 workers interviewed performed their jobs standing or
standing and walking. These workers found that the postures at workstations were unnatural
and uncomfortable. Uncomfortable postures were reported with similar frequency by workers
from large mills (highly mechanized) and small mills (more manual tasks).
Psychosocial stressors
Psychosocial conditions were also assessed in the Swedish survey. In terms of job
satisfaction, it was found that the majority of the workers (70%) claimed that pay was the
23
only satisfaction obtained from work. A great number of workers described their work as too
hectic and mentally strenuous.
For most sawmill jobs, the psychological job content is determined by the features pertaining
to an assembly line production: a) fast, machine-paced working rhythm, b) repetitiveness and
monotony, and c) social isolation as a result of the above mentioned factors, combined with
geographical distance between workers and high noise levels (Baneryd,1974; Nilsson, 1974).
It was concluded that work in a sawmill is characterized by small demands for skill, short
operational cycles, small task variation, restricted possibility to influence product quantity
and quality, and restrained possibilities to communicate with fellow workers. The most
negative occupations in terms of job content were sawyers, edgerman, sorters, stickers,
trimmer-graders and packagers.
2.4.2 Work-related injuries
Experience from Sweden
Aminoff (1974) analyzed 330 injuries reported to the National Social Insurance Board by
sawmill workers from 15 sawmills in Sweden during 1970 and 1971. The highest frequency
of injuries was observed among maintenance workers followed by those working in the
packaging, sawing and bundling areas. While the highest frequency of injuries was observed
among young workers, the most severe injuries occurred to workers aged 50-59. According
to the workers, injuries occurred because of: 1) deficiencies of technical equipment, 2)
stress, and 3) hurry.
24
Larsson (1991) reviewed 352 claims filed with the Swedish insurance agency for severe
injuries that occurred during 1988-1989 among sawyers and planers with the objective of
identifying the most hazardous activities, exposures and equipment. The following findings
were reported: 1) 30% of accidents were associated with some type of contact with machines
(mostly sawing machines and conveyors); 2) four circumstances were identified as posing the
greatest risks for injury: a) Getting caught in conveyor/in-feed roller, b) Hit by /against tool,
c) Inadvertent action of belt or rollers, and d) Acute overexertion.
Experience from Australia
In Australia, Driscoll reviewed the coroner's records to obtain information on fatal injuries
among forestry workers, including sawmill workers, for the period 1982-1984. Sixteen
sawmill workers suffered fatal injuries at work. The activities at the time of the injury event
were working with a bench saw (n=6; 38%), loading/unloading (n=5; 31%), and traffic
related (n=4; 25%). A n injury fatality rate of 30 per 100,000 was reported. The denominator
was estimated from the Employed Civilian Labour Force survey (Driscoll, et al., 1995).
Experience from the United States
O'Gara (1978) carried out a study of injuries and illnesses among workers from sawmills and
planing mills in California in 1976. A total of 1,922 injuries and illnesses were sampled from
all Employer's Reports of Occupational Injury completed during 1976. The results were
expressed in terms of the proportion of injuries or illnesses that could have been prevented by
compliance with safety and health orders, those that could have been prevented by better
25
safety and health training (but not by compliance with safety orders), and those that were not
preventable by either of the two means. Interestingly, 32 percent of the injuries and illnesses
were classified as preventable by compliance with safety orders. The remaining proportion of
cases (66%) were considered as preventable by better safety training and only 1% were
considered random occurrences, not preventable by either compliance with safety orders or
training.
A booklet produced by OSHA titled "Coping with Hazards in Sawmills" enumerates the
workplace conditions considered to be related to the occurrence of injuries in sawmills. The
authors included the four following factors: 1) Failure of foremen to properly instruct and
manage the work for which they are responsible; 2) Poor training of workers in work
methods and safety procedures; 3) Failure to enforce safety regulations; and 4) Excessive
pressure for production (OSHA, 1976).
Cooke & Blummenstock (1979) abstracted data from employers' reports of injuries filed with
the Maine Workers Compensation Commission during 1972 with the purpose of identifying
risk factors for work-related injuries. The results showed that injuries were more severe, as
measured by days lost from work, in plants processing hardwood than those using softwood.
Age was also associated with severity for the extreme groups. Younger (less than 24 years
old) and older workers (more than 45 years old) had more severe injuries. The third factor
associated with injury severity was "temporary assignment".
26
Punnett (1994) in a case-control study examined the relationship between environmental risk
factors and work-related injury among sawmill workers in Maine. A total of 157 cases and
251 controls were interviewed to gather information on demographics, work history, and
characteristics of tasks, equipment, tools, and other conditions of the job. The strongest risk
factors associated with acute traumatic injuries were processing hard wood, high physical
effort, one year or less on the job, and the lack of a lockout/tagout program in effect in the
mill. Social support had a small protective effect. The distinctive working conditions that
prevailed on injured workers were jobs in machine-paced workstations, exposure to
dangerous work methods and materials, loud noise levels, fast work pace, high lifting
demands, and frequent postural stress.
Experience in Canada
Laflamme and Cloutier (1989) investigated the typical scenarios where injuries occur most
often. The study included analysis of 728 injuries reported in nine sawmills in Quebec in
1987. The authors were able to identify 10 scenarios of injury, 6 of them related to
production, 3 including maintenance operations and 1 in relation to movement of workers
from one place to the other. Most injuries occurred in the sawing section while workers were
handling logs/planks. Regarding type of machine involved, accidents occurred more
frequently at the sawing and conveying machines.
An analysis of the relationship between hazardous conditions and injury rates in 61 sawmills
in British Columbia carried out by Keith Mason from the Workers Compensation Board,
showed that several hazards were significantly correlated with injury rates (Mason, 1973).
27
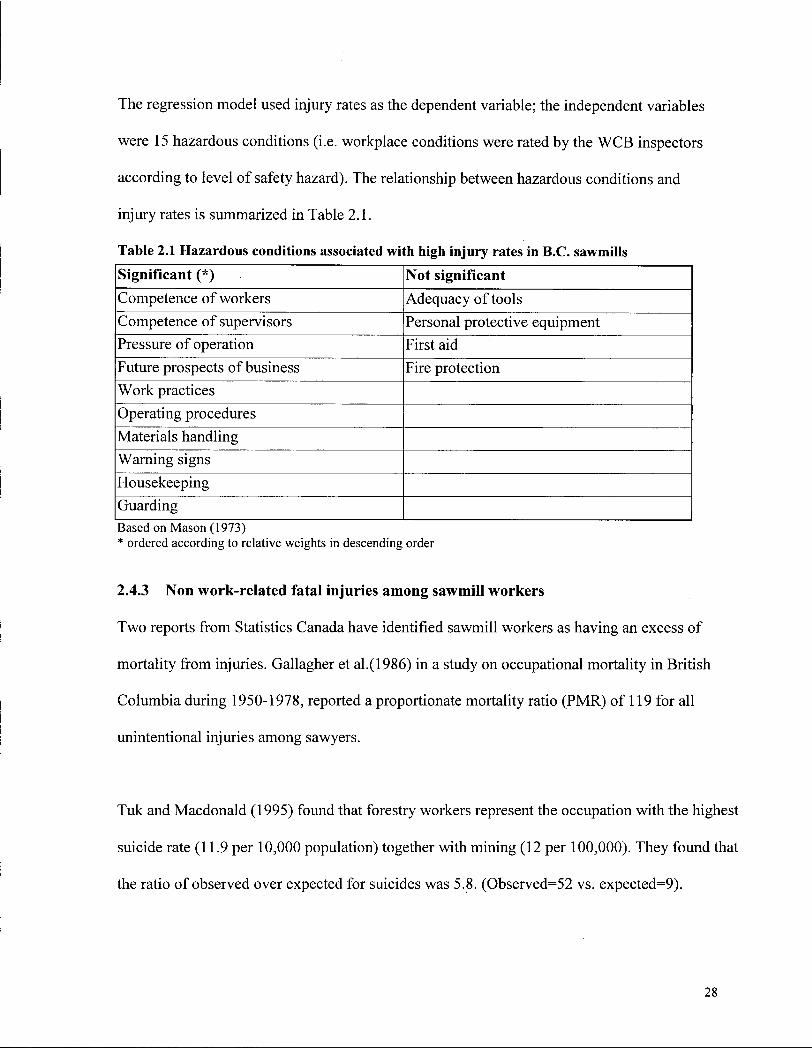
The regression model used injury rates as the dependent variable; the independent variables
were 15 hazardous conditions (i.e. workplace conditions were rated by the W C B inspectors
according to level of safety hazard). The relationship between hazardous conditions and
injury rates is summarized in Table 2.1.
Table 2.1 Hazardous conditions associated with high injury rates in B .C. sawmills Significant (*) Not significant Competence of workers Adequacy of tools Competence of supervisors Personal protective equipment Pressure of operation First aid Future prospects of business Fire protection Work practices Operating procedures Materials handling Warning signs Housekeeping Guarding Based on Mason (1973) * ordered according to relative weights in descending order
2.4.3 Non work-related fatal injuries among sawmill workers
Two reports from Statistics Canada have identified sawmill workers as having an excess of
mortality from injuries. Gallagher et al.(1986) in a study on occupational mortality in British
Columbia during 1950-1978, reported a proportionate mortality ratio (PMR) of 119 for all
unintentional injuries among sawyers.
Tuk and Macdonald (1995) found that forestry workers represent the occupation with the highest
suicide rate (11.9 per 10,000 population) together with mining (12 per 100,000). They found that
the ratio of observed over expected for suicides was 5.8. (Observed=52 vs. expected=9).
28
CHAPTER THREE
3.0 Methodology
3.1 The study population and the original data base: The BC Sawmill Workers Cohort
The study population analyzed in this investigation comprises all workers of the British
Columbia Sawmill Workers Cohort (BCSWC). In 1988, researchers at the Department of
Health Care & Epidemiology at the University of British Columbia, started an historical
cohort study of B.C. sawmill workers, with the purpose of examining exposure to
chorophenate wood preservatives and the risk of soft tissue sarcoma and non-Hodgkin's
lymphoma. Fourteen sawmills from BC were included in the study. M i l l selection was based
on the use of chlorophenate fungicides and completeness of job history records. Eleven mills
that had used chlorophenate based fungicides and three mills where these fungicides had not
been used were included in the study.
Six mills were located on Vancouver Island, five on the south coast of BC mainland, and
three in the interior of the province. A map of B.C showing the location of the study mills
and their classification by region is provided in Appendix A . The degree of urbanization of
these regions ranges from well established urban settings (e.g. Vancouver Lower Mainland)
to isolated mill towns (e.g. Tahsis, Youbou, Mackenzie) where the only source of
employment is the mill.
The original study population consisted of 26,487 men who had been employed for at least
one year in a study mill, between January 1, 1950 and December 31, 1985 ( Hertzman et al.
1997). For those employees who worked on a non-permanent basis, a total of 260 days of
29

cumulative service was required to complete a qualifying year. The original follow-up period
extended to December 31, 1990. The number of workers in this study (n=26,411) differs
slightly from the original report because after various data quality control checks for
validation, 76 workers did not meet the requirements for cohort membership.
At each mill data were abstracted from personnel records to construct two files. One with
personal information included worker's name and date of birth; and another with the job
history included hire date, job title, work department, and start and end dates for each new
job held at the mill.
Vital status was ascertained by means of probabilistic linkage to the British Columbia Death
File (BCDF) and the Canadian Mortality Data Base (CMDB). Probabilistic linkage was
dependent on the level of agreement on workers' full name and date of birth between the
cohort demographic file and the two death datasets. The generalized iterative record linkage
system was used to determine probability of agreement on each item matched (Howe and
Lindsay, 1981). Secondary sources of ascertainment were Pension plans, B C motor vehicle
records and the income tax files. As a result of these procedures, vital status was determined
for 85.7% of the cohort members. The steps followed to ensure completeness of
ascertainment were thorough. First, with the linkage to the C M D B an additional 4.4% of
deaths, from workers who died outside the province, was obtained. Mortality ascertainment
through the C M D B has been estimated to be as high as 97.6% for deaths in Canada
(Schnatter, et al., 1990). Secondly, the information from income tax files added an extra 16%
30
of workers who were known to be alive. For these reasons, it can be stated that the
probability of any of the subjects with unknown vital status being dead is very low.
The BC Division of Vital Statistics and the Canadian Mortality Data Base provided
information on death date and cause of death from the death certificates for the period 1950-
1990. Underlying causes of death were coded according to the International Classification of
Diseases (ICD) codes in effect at the year when death occurred. Therefore, codes for the 6 t h
to the 9 t h revision of the ICD were utilized.
For this study on injury deaths among sawmill workers, all deaths coded as due to external
causes (codes E800-E999, ICD 9 t h Revision) that occurred during the period 1950-1990
identified by the provincial death file were selected.
The data base constructed for the BC sawmill study constitutes a unique source of
information for studying health outcomes in a cohort of blue collar workers. This is to our
knowledge the largest assembled cohort of sawmill workers and has a follow-up period of
over 40 years. Teschke et al.(1998 ) examined the benefits in terms of efficiency regarding
savings in time and cost, that this type of data set offers for new investigations on this
workforce. The paper also includes a summary of the work either completed or in progress
based on this cohort database.
31

3.2 Data sources
3.2.1 B.C. Coroners Service
Information on the circumstances prior to or concurrent with the fatal incident was obtained from
the B.C. Coroners Service (BCCS) records. Under the Coroner's Act of British Columbia all
sudden, unexpected deaths as well as those resulting from violence, negligence or during
pregnancy or from any cause other than disease or in a correctional institution shall immediately be
reported to the Coroner. A coroner's investigation may proceed as an inquiry or an inquest. A n
inquiry comprises a full investigation and formal report of the coroner's findings. An inquest is an
independent public hearing involving a jury and the examination of witnesses under oath, required
when deaths occur in prison or police custody. Inquests are also held at the coroner's discretion i f
it serves the public interest, when there is a need to clarify evidence, or to address family concerns.
The jury may propose recommendations for preventing the occurrence of future deaths based on
findings from the case analyzed, but is not allowed to assign legal responsibility. A coroner's
inquiry or inquest determines the identity of the deceased and clarifies the facts about the fatal
incident.
The coroner's files contain the investigation reports and may include autopsy reports, police
reports, Workers' Compensation Board reports and other information relevant to the fatal injury.
A list with the names of the cohort members who died from external causes between 1950 and
1990 was produced. This roll was matched to the Coroner's records to retrieve the relevant
investigation reports.
32
Data on factors related to the individual, the environment and the injury event abstracted from the
BCCS files were recorded on forms designed specially for this study (Appendix B).
3.2.2 Workers' Compensation Board of B.C.
According to the WCB of B.C. (BCWCB) act, all employers covered by this act are required
to report immediately to the agency the death of a worker where the death is or is claimed to
have resulted out of and in the course of employment. An officer of the board may
investigate the fatality with the purpose of determining the cause of the incident, identifying
unsafe conditions which contributed to the incident and developing recommendations to
prevent reoccurrence of similar fatal injuries.
To confirm work-relatedness of a death, a list of all accepted claims for fatalities in the
sawmill industry from 1950 to 1990 was obtained from the WCB including the worker's
name, the date of injury and the company name, size and location.
3.2.3 B.C. Division of Vital Statistics
The Division of Vital Statistics of B.C. (BCDVS) provided the underlying and immediate
causes of death codes pertaining to cohort sawmill workers who died during the period 1950-
1990. Additionally, for all deaths due to external causes (E800-E999) among the cohort
members from 1984 to 1990, the BCDVS cross-checked the item "place of injury" on the
death certificate to assess its accuracy in identifying fatalities that occurred at a workplace.
33
3.3 Exposure assessment
Exposure categories were defined based on job titles and work areas. In order to meet the
objectives of this study, a new grouping of the original job titles was needed. The original job
history file contained approximately 4,500 unique job titles. The first compilation was based on a
thorough review of potential for exposure to chlorophenate fungicides and as a result,
approximately 800 job titles were identified which were useful for the original study analyses of
chlorophenol's association with cancer outcomes.
Subsequently, through a series of consecutive steps, the job history file was shortened to a roster of
86 job titles. Briefly, the data reduction procedure comprised the following operations:
a) Thorough spelling checking. Spelling differences on equivalent job titles, were resolved by a
researcher with ample expertise in the sawmill industry.
b) Job titles standardization. Based on similarity of tasks, job titles were standardized across the
fourteen mills.
c) Consultation with knowledgeable mill personnel. A group of retired sawmill workers with
knowledge of sawmill operations and the historical changes that have occurred in the mills since
the 1950's provided information to resolve unclassified jobs.
In order to investigate whether certain jobs or work areas were associated with increased injury
mortality, workers were classified into broad groups defined on the basis of similarity of 1) tasks,
2) process areas, and 3) skills. Details of each one of these classification schemes are provided in
the methods sections of subsequent chapters. The complete list of job titles included in each of
these three schemes is presented in Appendix C.
34
3.4 Analytical methodology
Crude rates per 100,000 person-years were calculated to illustrate the absolute risk of fatal
injuries among sawmill workers.
Comparison with external reference population- SMR
Observed deaths in the cohort were compared with expected numbers based on rates for the
province of BC male population for 1950-1990, via the standardized mortality ratios (SMRs).
The numerator of the SMR is the sum of observed deaths across all strata and the
denominator is the sum of expected deaths across all strata. The expected numbers of deaths
for each cause of death were calculated by multiplying the age and calendar year-specific
person-years of observation by the age and calendar year-specific provincial death rate
(Berry, 1983). Also two-sided 95% confidence intervals were calculated under the
assumption that the observed deaths have a Poisson distribution.
For each worker, total person-years at risk comprises the period between the date of entry in
the cohort and the death date or last day of follow-up whichever occurred first.
Person-years contribution for those workers with unknown vital status at the end of the study,
can be handled in different ways (Checkoway, et al., 1989) and each approach will yield
different mortality rates. For example, i f person-years are counted up until the day of last
contact, the mortality rates will be spuriously inflated. Inversely, mortality rates will be
underestimated if person-years are counted until the end of the study. Both SMRs counting
person-years up to the last day of contact and up to the end of the study are presented to
illustrate both the least and the most conservative effect estimates.
35

SMR analysis is used in cohort studies to describe the mortality experience of the workforce.
However, it is susceptible to several drawbacks that may limit its validity as a measure of
exposure-response associations (Gaffey, 1976; Breslow, 1990). One criticism is that an SMR
provides a summary measure of effect, and as such it gives no information on exposure
effects that may be different among subgroups of the study population (Chiazze, 1976).
Moreover, because the external general population is composed of people too i l l to work as
well as employed individuals, the estimated SMR will always underestimate any true
increased or decreased risk (Hennekens and Buring, 1987). Another limitation is that SMRs
for sub-cohorts are not comparable because the distribution of confounders (e.g. age or
calendar year) may be different among the groups being compared. Therefore, for a valid
comparison of SMRs, the assumption required is that the age/calendar year specific rates in
each stratum are a constant multiple of the external standard rates (Miettinen, 1972; Breslow
and Day, 1987).
Taking into consideration the limitations discussed above, SMRs are presented as the first
analysis of this cohort, mainly to compare the injury mortality risk among sawmill workers
with another group with stable estimates and to remove the confounding effect due to
structural differences between the groups being compared.
36

Comparison with internal reference population- Poisson regression modeling
The use of an internal reference group removes the differences in employment and
socioeconomic status associated with the use of the general population and thus reduces the
bias due to the healthy worker effect (Wen and Tsai, 1982).
Mortality rates were compared among subcohorts defined on the basis of occupational
categories using regression analysis. Generally, mathematical modeling provides an efficient
way to describe the joint effects of multiple variables on mortality rates (Breslow, 1990;
Selvin, 1995; Armstrong, 1988). Particularly, in occupational cohort studies, Poisson
regression is used to assess the effect of time-related variables. The death rates are modeled
on a logarithmic scale as a linear function of the covariates of interest. Thus, the rate is a
product of the effects related to each independent variable (Frome and Checkoway, 1985;
Pearce, et al., 1988). Causes of death selected for internal comparison analysis were those
with 20 or more deaths. Thus, only the following will be considered for Poisson regression
analysis: all work-related injuries, motor vehicle crashes, and suicide.
The statistical packages used for SMR and Poisson regression analyses were Life Table
Analysis System (LTAS) version 1.0.c (Cassinelli, et al., 2000) and EGRET version 0.26.06
(SERC, 1993).
Capture-Recapture
To investigate the completeness of ascertainment of work-related deaths from WCB data,
capture recapture methods were utilized (Hook and Regal, 1992). This technique permits
37
calculation of an unbiased estimate of the degree of underreporting but relies heavily on the
assumption of independence of the sources.
Cases of work-related fatal injuries obtained from WCB records were cross-checked with the
number of cases identified by the Coroner's Office records.
In order to determine the accuracy of the denomination "place of injury" on death
certificates, sensitivity, specificity and predictive values (positive and negative) were
calculated to determine the usefulness of the item in identifying fatal injuries occurring at a
workplace.
38

CHAPTER FOUR
4.0 Completeness of ascertainment of work-related injury fatalities: implications for
surveillance
4.1 Introduction
In Canada, during the last decade there has been increasing recognition from the public
health sector of the importance of injury as a major public health problem. Approximately
21% (1.1 million) of all injuries among Canadians aged 15 and over, occur at work (Millar
and Adams, 1991). Moreover, almost two out of three (65%) work-related injuries result in
hospital care. A worker suffers a compensable work-related injury every seven seconds and
one worker is killed every two hours of each working day (Labour Canada, 1991).
While more than one million work-related injuries were reported to the General Social
Survey in 1987 (Millar and Adams, 1991), the total numbers of time-loss claims accepted by
the Workers' Compensation Boards across Canada was 602,531. These claims represented
injuries severe enough to require time off work to recover but do not count the claims for non
severe injuries for which only medical expenses are paid.
The number of work-related injuries reported by the National Work Injury data base is much
less than reported by the General Social Survey. This was not surprising because data from
the Workers' Compensation Boards represent only adjudicated claims. For example, Labour
Canada reported that of 1090 fatalities reported to the WCBs across the country, only 796
received compensation (Labour Canada, 1989). Furthermore, there are sectors of the labour
force which are not covered by Workers' Compensation. Millar and Adams concluded that
39
given the magnitude of the social and economic losses resulting from work-related injury, it
is necessary to develop an improved system of data collection and analysis to provide the
basic knowledge for intervention strategies.
In 1991, a symposium was held in Alberta to define the Year 2000 Injury Control Objectives
for Canada. Five areas were targeted: home and community; occupational health and safety;
sport and recreation; transportation; and violent and abusive behaviour. The working group
on occupational health and safety set as the first objective a reduction of 30% in the national
rate of work-related deaths (from 8.2 per 100,000 to 5.7 per 100,000). This group also
stressed the difficulty in setting and evaluating objectives in this area where baseline data is
lacking. Currently, statistics on work-related fatalities are based solely on the reports
produced by the National Work Injury Statistics Program which compiles information from
all Workers' Compensation Boards (Saunders and Stewart, 1991).
Similarly, in 1996 the British Columbia Minister of Health's Injury Prevention Advisory
Committee developed the Provincial Injury Prevention Plan for Children and Youth which
identified the objectives, targets and strategies for the province. Although the target group was
children and youth, injuries occurring at workplaces were also considered for those aged 15-24.
The goal proposed for 2001 was to reduce the average number of industrial fatalities for youth
ages 15-24 by 14 %. The WCB of B.C. reported that from 1990-1994 an average of 14 deaths
received compensation annually in this age group (BC Ministry of Health, 1997). This was, as in
the previous example, the only source for ascertaining number of deaths in the workplace and
underlines the importance of accurate surveillance data for public health planning.
40
Stout and Bell (1991) in a review of 10 studies from various states in the U S A aimed at
determining the best method for surveillance of occupational fatalities using different data
sources including death certificates, Workers' Compensation reports, Medical Examiner
records, and OSHA reports, concluded that death certificates are the best source, ascertaining
as a single source an average of 81% of cases, followed by medical examiners records (61%)
and workers compensation reports (57%).
Incomplete statistics lead to inaccurate assumptions about the magnitude of health and safety
problems in the workforce, hampering the planning and implementation of prevention
strategies. Data sources with high sensitivity and representativeness are needed to establish
an efficient surveillance system for injury fatalities.
The objectives of this study were 1) to determine the completeness of ascertainment of sawmill
work-related fatal injuries among all B.C. sawmill workers between 1984 and 1990, from two
sources of information, the Workers' Compensation Board of B.C.(BCWCB) and the British
Columbia Coroner's Service (BCCS) and the characteristics of the cases missed by each source;
and 2) to assess the usefulness of using the item "place of injury" on death certificates to identify
work-related fatal injuries at a workplace (sawmill or other industrial site) among members of the
B.C. sawmill cohort during 1984-1990 using the BCCS data as the gold standard.
41
4.2 Methods
4.2.1 Datasources
British Columbia Coroners Service
The BC Coroners Act establishes that the coroner shall be notified of any death resulting
from unnatural and unexpected causes. Coroner's investigations are carried out to determine
the identity of the deceased and how, when and where the person died. Depending on the
circumstances of the incident, these files may include policy investigation reports, autopsy
reports, toxicological reports or WCB reports. By definition, all injury deaths are Coroner's
cases.
In order to investigate completeness of ascertainment of sawmill-related fatal injuries, the
coroner's reports of deaths that occurred to all sawmill workers in B.C. between 1984 and 1990
were sought (Figure 4.1). Since 1984 the Coroners Service has computerized records. The
retrieval of these reports was carried out by using the entry code "death at industrial site". Unlike
other industries which have their own specific code (e.g. logging, construction, farming, mining,
etc), sawmills are included in a group comprising various industrial sites. Subsequent manual
sorting of every record was required to select only those where the place of death was a sawmill.
This selection was not always easy because the only means to identify the type of industry was by
the firm name recorded in the report. When the name was unclear, the industry was resolved using
the Madison Lumber Directory which provides a listing of sawmills by province.
Additionally we obtained the coroner's reports of all cases identified through the W C B list as
work-related fatal injuries in the sawmill industry, for the same period 1984-1990.
42
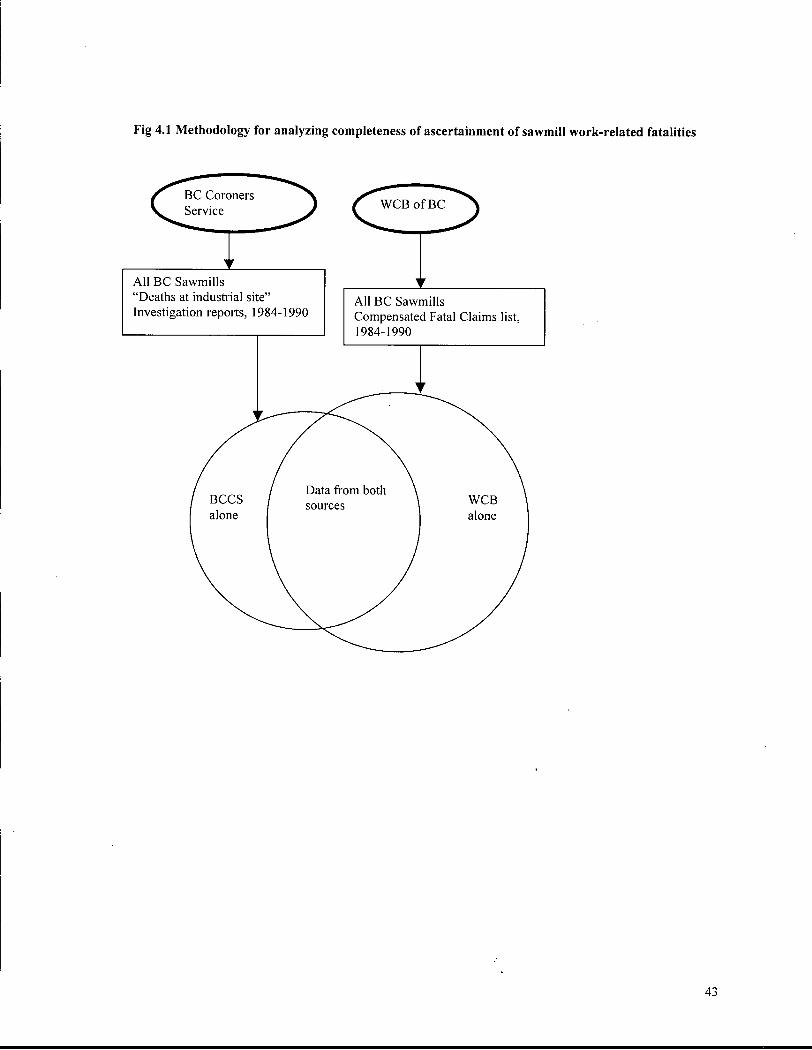
Fig 4.1 Methodology for analyzing completeness of ascertainment of sawmill work-related fatalities
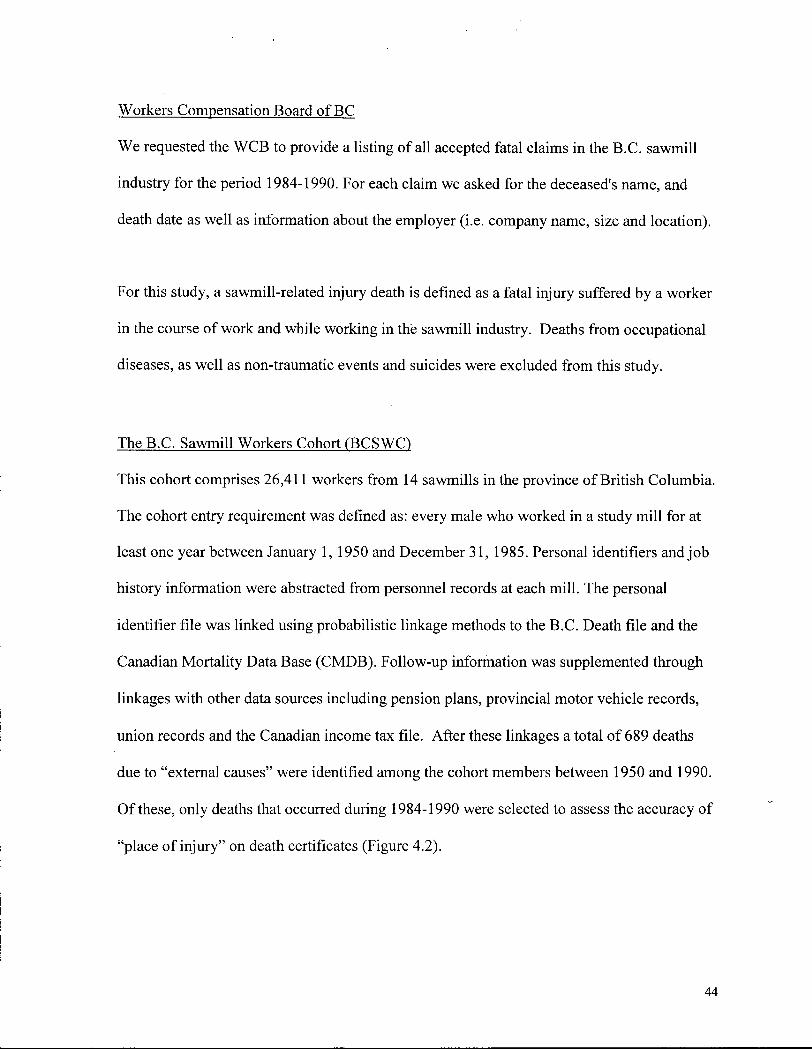
Workers Compensation Board of BC
We requested the WCB to provide a listing of all accepted fatal claims in the B.C. sawmill
industry for the period 1984-1990. For each claim we asked for the deceased's name, and
death date as well as information about the employer (i.e. company name, size and location).
For this study, a sawmill-related injury death is defined as a fatal injury suffered by a worker
in the course of work and while working in the sawmill industry. Deaths from occupational
diseases, as well as non-traumatic events and suicides were excluded from this study.
The B.C. Sawmill Workers Cohort f B C S W Q
This cohort comprises 26,411 workers from 14 sawmills in the province of British Columbia.
The cohort entry requirement was defined as: every male who worked in a study mill for at
least one year between January 1, 1950 and December 31, 1985. Personal identifiers and job
history information were abstracted from personnel records at each mill. The personal
identifier file was linked using probabilistic linkage methods to the B.C. Death file and the
Canadian Mortality Data Base (CMDB). Follow-up information was supplemented through
linkages with other data sources including pension plans, provincial motor vehicle records,
union records and the Canadian income tax file. After these linkages a total of 689 deaths
due to "external causes" were identified among the cohort members between 1950 and 1990.
Of these, only deaths that occurred during 1984-1990 were selected to assess the accuracy of
"place of injury" on death certificates (Figure 4.2).
44
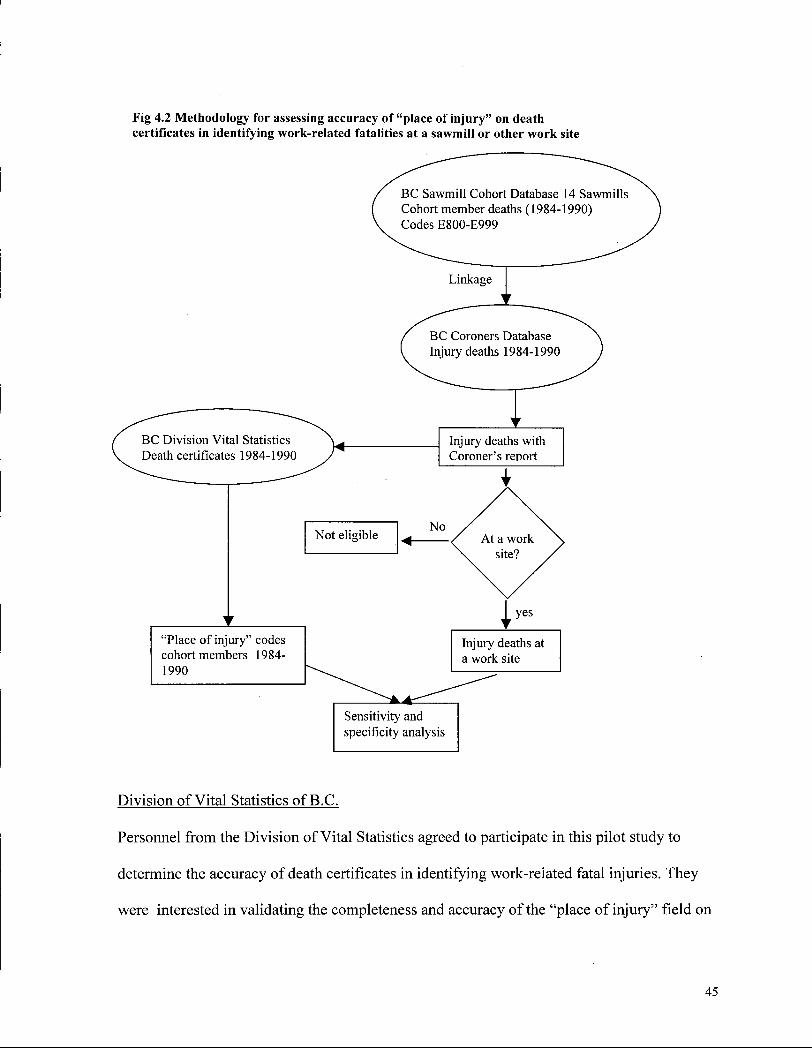
Fig 4.2 Methodology for assessing accuracy of "place of injury" on death certificates in identifying work-related fatalities at a sawmill or other work site
B C Sawmill Cohort Database 14 Sawmills Cohort member deaths (1984-1990) Codes E800-E999
B C Division Vital Statistics Death certificates 1984-1990
1 T
"Place of injury" codes cohort members 1984-1990
Linkage
B C Coroners Database Injury deaths 1984-1990
Injury deaths with Coroner's rerjort
Injury deaths at a work site
Sensitivity and specificity analysis
Division of Vital Statistics of B.C.
Personnel from the Division of Vital Statistics agreed to participate in this pilot study to
determine the accuracy of death certificates in identifying work-related fatal injuries. They
were interested in validating the completeness and accuracy of the "place of injury" field on
45

the death certificates. This item is coded according to the categories provided in the ICD 9 t h
Revision Manual (E849). According to these categories, work-related fatalities among our
sawmill workers would be identified if the place of injury was coded as "Industrial place and
premises" (subcategory #3).
A list with all death certificate numbers for deaths that occurred among workers from the
BCSWC study between 1984 and 1990 was sent to Vital Statistics. This roll was cross
checked with the provincial death file to add the injury place codes. The period 1984-1990
was selected because the BCCS has computerized files starting in 1984 and the information
from these files was used as the gold standard to identify work-related fatal injuries.
4.2.2 Analysis
Completeness of ascertainment of sawmill-related fatal injuries
The primary analysis is descriptive, presenting the number of cases obtained from each
source and the frequency distribution by age groups and mill size. Each injury fatality is then
briefly described to illustrate the types of cases recorded by each institution.
The number of work-related fatal injuries among all B.C. sawmill workers between 1984-1990
obtained from the W C B records were compared to the number obtained from the BCCS records.
Capture-recapture methods were used to estimate the degree of underreporting and the total
number of fatalities (Hook and Regal, 1992). The method of capture-recapture (CR) has been used
primarily by ecologists to monitor the census of bird, fish and insect populations. Chiu et al. (1993)
46
describes the methodology as conceptually simple and provides the following example: " i f we
want to estimate the number of fish in a pond, we would net fish in various parts of the pond, tag
these fish and then release them back into the pond. The following day, after the tagged fish had
mixed with the other fish, we would net again. Some of the fish from the first net (tagged) would
be recaptured in the second net. It is the degree of overlap between nettings that allows the
estimation of the total population of fish in the pond, even though we did not net all the fish".
These methods have been used in demography to adjust for undercounting in population censuses
(Himes and Logg, 1992). Within epidemiology capture-recapture techniques are increasingly being
used to estimate degree of underreporting of morbidity or mortality from various datasources
(Hook and Regal, 1992; Chiu et. al., 1993; Keifer, et al., 1996; Cormack, et a l , 2000).
When data from only two sources are compared, a 2x2 table is constructed with the count of cases
in each source as is shown below
Table 4.1 Layout of data by source of ascertainment
Cases reported in source
A
Yes No
Cases reported in source B Yes a
No c d=?
The formula to obtain a nearly unbiased estimator for the number of unascertained cases is
d= bc/(a+l)
47
Accuracy of "place of injury" to identify work-related fatal injuries
We estimated sensitivity (the percentage of work-related fatal injuries coded as occurring at
industrial premises on the death certificates), specificity (the percentage of non-work related
fatal injuries coded with any other code, different from industrial premises, on the death
certificate), and the predictive values positive and negative (Kelsey et al., 1986) of the
"industrial premises" item to properly denote work-related and non-work related fatalities.
The BCCS records were used as the gold standard for determining work-related fatal injuries.
In order to calculate predictive value we calculated the prevalence of work-related deaths.
We used the average mortality rate from fatal injuries among all B.C sawmill workers
between 1984-1990. Fatality rates per 100,000 person-years were calculated for the sawmill
industry between 1984 and 1990. Numerators are the sum of cases identified in this study
using information from the BCSWC, the BCCS and the WCB. Denominator estimates for the
period 1985-1990 were obtained from the report titled "Fatal claims in sawmills" published
by the W C B of B.C.(Howard, 1996). For 1984, it was assumed that the number of person-
years was the same as that for 1985. The number of person-years was calculated by the
Statistical Department of the B C W C B from company payroll records and accounted for part-
time workers. Having a person-years count for the denominator, improves the accuracy of the
rates calculated because the risk of injury death is expressed in relation to hours worked. This
avoids the underestimates that result when rates are expressed per 100,000 workers whereby
part-time workers are counted as equivalent to full time workers (Conroy, 1993). Confidence
Intervals were calculated using the Poisson distribution assumption (Breslow and Day,
1987).
48
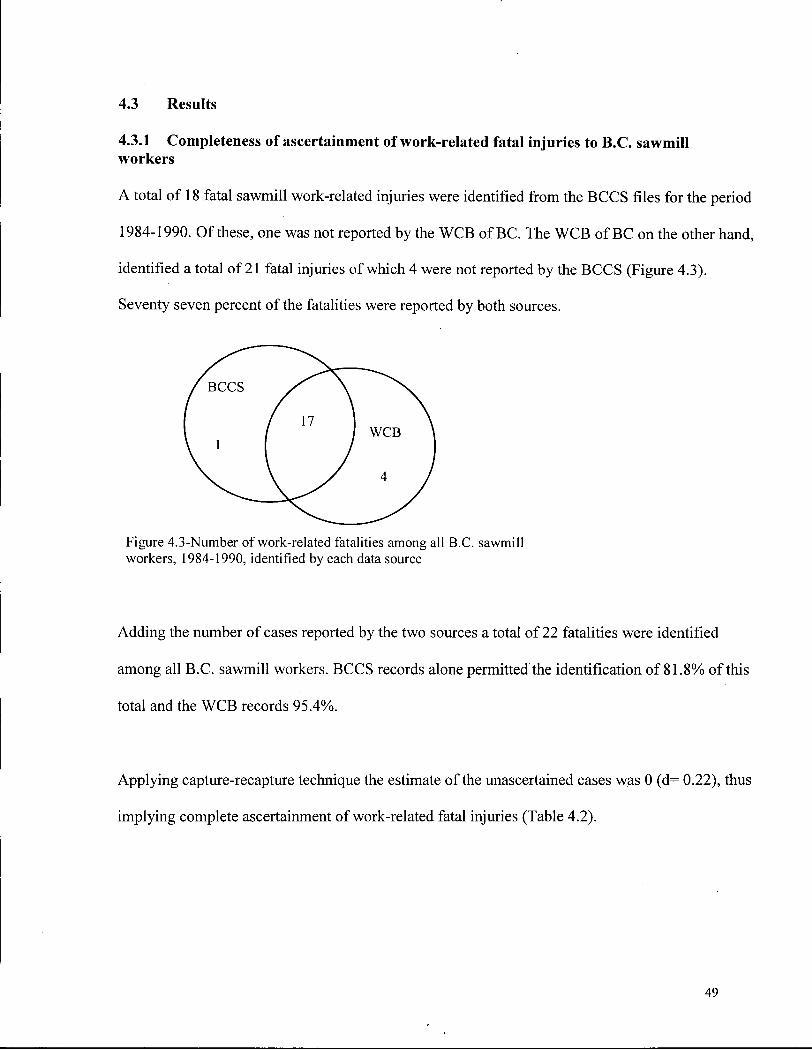
4.3 Results
4.3.1 Completeness of ascertainment of work-related fatal injuries to B.C. sawmill workers
A total of 18 fatal sawmill work-related injuries were identified from the BCCS files for the period
1984-1990. Of these, one was not reported by the WCB of BC. The WCB of BC on the other hand,
identified a total of 21 fatal injuries of which 4 were not reported by the BCCS (Figure 4.3).
Seventy seven percent of the fatalities were reported by both sources.
Figure 4.3-Number of work-related fatalities among all B.C. sawmill workers, 1984-1990, identified by each data source
Adding the number of cases reported by the two sources a total of 22 fatalities were identified
among all B.C. sawmill workers. BCCS records alone permitted the identification of 81.8% of this
total and the W C B records 95.4%.
Applying capture-recapture technique the estimate of the unascertained cases was 0 (d= 0.22), thus
implying complete ascertainment of work-related fatal injuries (Table 4.2).
49
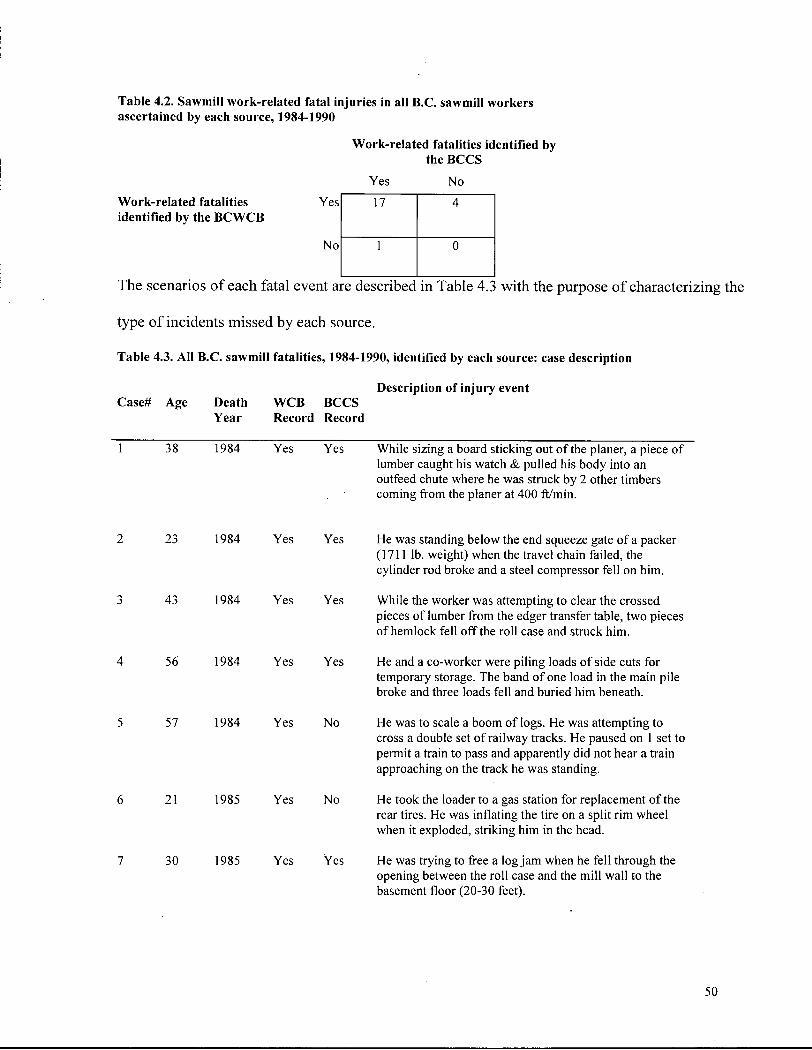
Table 4.2. Sawmill work-related fatal injuries in all B.C. sawmill workers ascertained by each source, 1984-1990
Work-related fatalities identified by the BCCS
Yes No
Work-related fatalities Yes 17 4 identified by the BCWCB
No 1 0
The scenarios of each fatal event are described in Table 4.3 with the purpose of characterizing the
type of incidents missed by each source.
Table 4.3. AH B.C. sawmill fatalities, 1984-1990, identified by each source: case description
Description of injury event Case# Age Death WCB BCCS
Year Record Record
1 38 1984 Yes Yes While sizing a board sticking out of the planer, a piece of lumber caught his watch & pulled his body into an outfeed chute where he was struck by 2 other timbers coming from the planer at 400 ft/min.
23 1984 Yes Yes He was standing below the end squeeze gate of a packer (1711 lb. weight) when the travel chain failed, the cylinder rod broke and a steel compressor fell on him.
43 1984 Yes Yes While the worker was attempting to clear the crossed pieces of lumber from the edger transfer table, two pieces of hemlock fell off the roll case and struck him.
56 1984 Yes Yes He and a co-worker were piling loads of side cuts for temporary storage. The band of one load in the main pile broke and three loads fell and buried him beneath.
57 1984 Yes No He was to scale a boom of logs. He was attempting to cross a double set of railway tracks. He paused on 1 set to permit a train to pass and apparently did not hear a train approaching on the track he was standing.
21 1985 Yes No He took the loader to a gas station for replacement of the rear tires. He was inflating the tire on a split rim wheel when it exploded, striking him in the head.
30 1985 Yes Yes He was trying to free a log jam when he fell through the opening between the roll case and the mill wall to the basement floor (20-30 feet).
50

Description of injury event Case# Age Death WCB BCCS
Year Record Record
8 55 1986 Yes Yes He was supervising the installation of a gang saw (weight 4,000-5,000 lb.). The saw was chained to a forklift mast. This chain failed and the saw fell crushing the worker.
9 29 1986 Yes Yes As he was attempting to re-adjust the log & the carriage of a portable sawmill, he stepped onto a moving slab belt and was thrown backwards onto the head rig.
10 54 1987 Yes Yes He was operating a Caterpillar-Front End loader. The motor stalled and the loader started free wheeling backwards. The loader flipped over crushing the driver.
11 19 1988 Yes Yes He was cleaning the tail spool area around a planer conveyor. His shirt was caught in a tail spool, his right arm dragged under the tail spool and the left arm under tension roller. The arms crossed caused asphyxia.
12 37 1988 Yes Yes She was operating an automatic strapping machine. She reloaded the strap reel. For unknown reason she returned to the outfeed roll case and was caught between a load and a roller.
13 56 1988 Yes No While riding a bicycle at his worksite, he collided with a forklift. The worker's front wheel struck the right hand fork and he was catapulted through the air striking his head on a large steel upright of the forklift.
14 36 1988 Yes Yes He noticed that a chain had dropped off the double idler sprocket at the bottom of the unscrambler. He went under the machine that was turned off. Another fellow turned it on and the worker was trapped there.
15 52 1988 Yes Yes He climbed the stairways to the sorter trays to clear a problem. The stacker operator started the electrical motors by switches to clear the tray and the worker was caught between moving lumber and sorter frame.
16 49 1988 Yes Yes He was trying to solve a vibration problem in a Mark II Chip n Saw. By doing so he approached the motor too much and was caught & pulled into the revolving chipping head knives of the machine.
17 60 1988 Yes Yes He was going to the lunch room to retrieve his jacket as he was ready to go off shift. He came down the blind side of the breezeway & not hearing the straddle loader coming had stepped out in front of it.
18 32 1989 Yes Yes He was trying to release a pile of boards to the stacker. A bin of lumber dropped from the sorter and pinned the worker causing fatal crushing injuries.
51
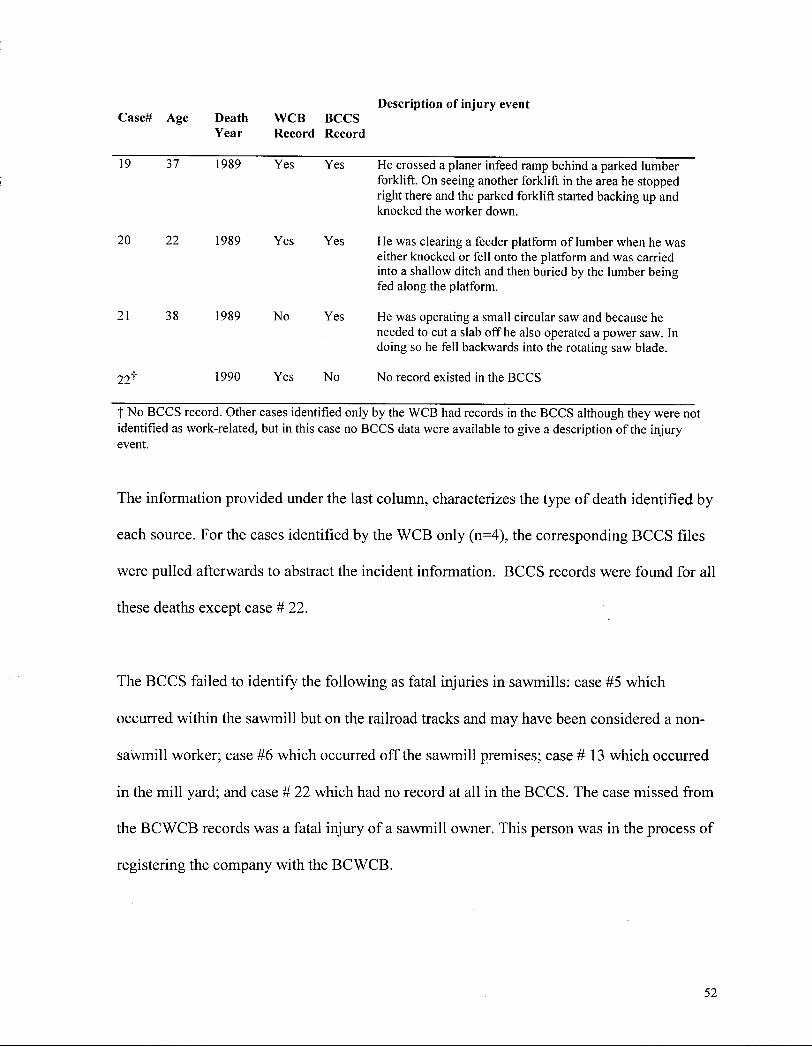
Case# Age Death WCB BCCS Year Record Record
Description of injury event
19 37 1989 Yes Yes He crossed a planer infeed ramp behind a parked lumber forklift. On seeing another forklift in the area he stopped right there and the parked forklift started backing up and knocked the worker down.
20 22 1989 Yes Yes He was clearing a feeder platform of lumber when he was either knocked or fell onto the platform and was carried into a shallow ditch and then buried by the lumber being fed along the platform.
21 38 1989 No Yes He was operating a small circular saw and because he needed to cut a slab off he also operated a power saw. In doing so he fell backwards into the rotating saw blade.
221 1 9 9 0 Y e s N o No record existed in the BCCS
f No BCCS record. Other cases identified only by the WCB had records in the BCCS although they were not identified as work-related, but in this case no BCCS data were available to give a description of the injury event.
The information provided under the last column, characterizes the type of death identified by
each source. For the cases identified by the WCB only (n=4), the corresponding BCCS files
were pulled afterwards to abstract the incident information. BCCS records were found for all
these deaths except case #22.
The BCCS failed to identify the following as fatal injuries in sawmills: case #5 which
occurred within the sawmill but on the railroad tracks and may have been considered a non-
sawmill worker; case #6 which occurred off the sawmill premises; case #13 which occurred
in the mill yard; and case # 22 which had no record at all in the BCCS. The case missed from
the B C W C B records was a fatal injury of a sawmill owner. This person was in the process of
registering the company with the B C W C B .
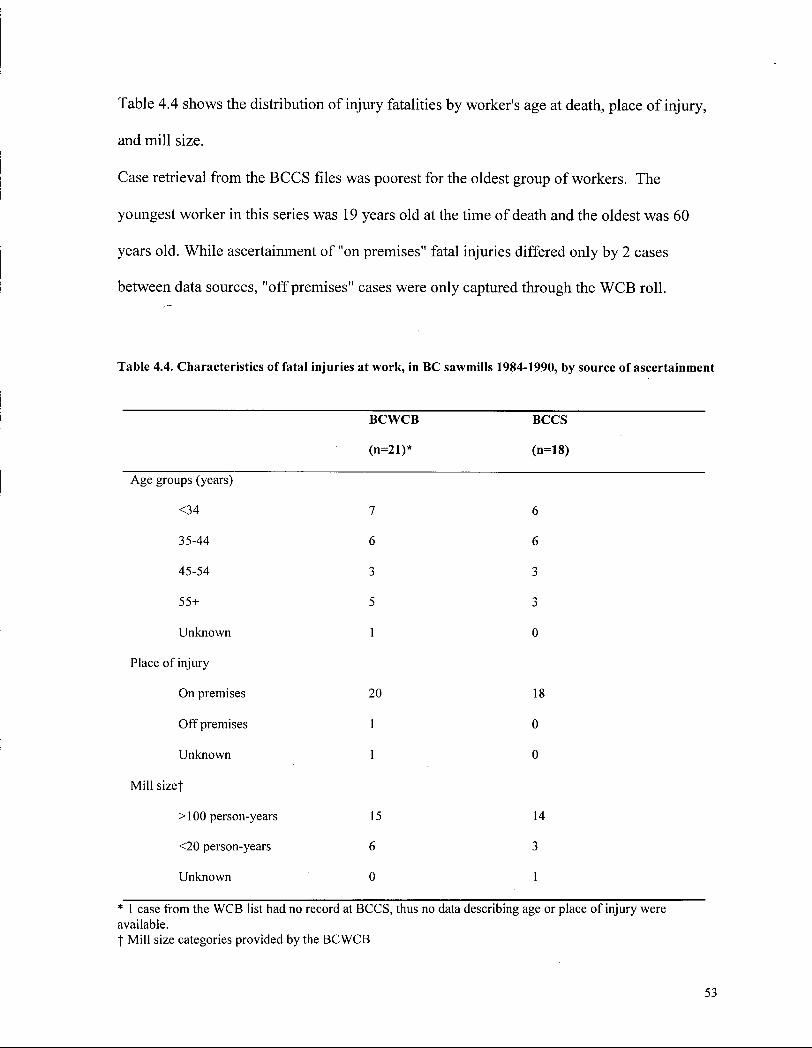
Table 4.4 shows the distribution of injury fatalities by worker's age at death, place of injury,
and mill size.
Case retrieval from the BCCS files was poorest for the oldest group of workers. The
youngest worker in this series was 19 years old at the time of death and the oldest was 60
years old. While ascertainment of "on premises" fatal injuries differed only by 2 cases
between data sources, "off premises" cases were only captured through the WCB roll.
Table 4.4. Characteristics of fatal injuries at work, in BC sawmills 1984-1990, by source of ascertainment
BCWCB
(n=21)*
BCCS
(n=18)
Age groups (years)
<34 7 6
35-44 6 6
45-54 3 3
55+ 5 3
Unknown 1 0
Place of injury
On premises 20 18
Off premises 1 0
Unknown 1 0
M i l l size"!-
>100 person-years 15 14
<20 person-years 6 3
Unknown 0 1
* 1 case from the W C B list had no record at BCCS, thus no data describing age or place of injury were available. f M i l l size categories provided by the B C W C B
53
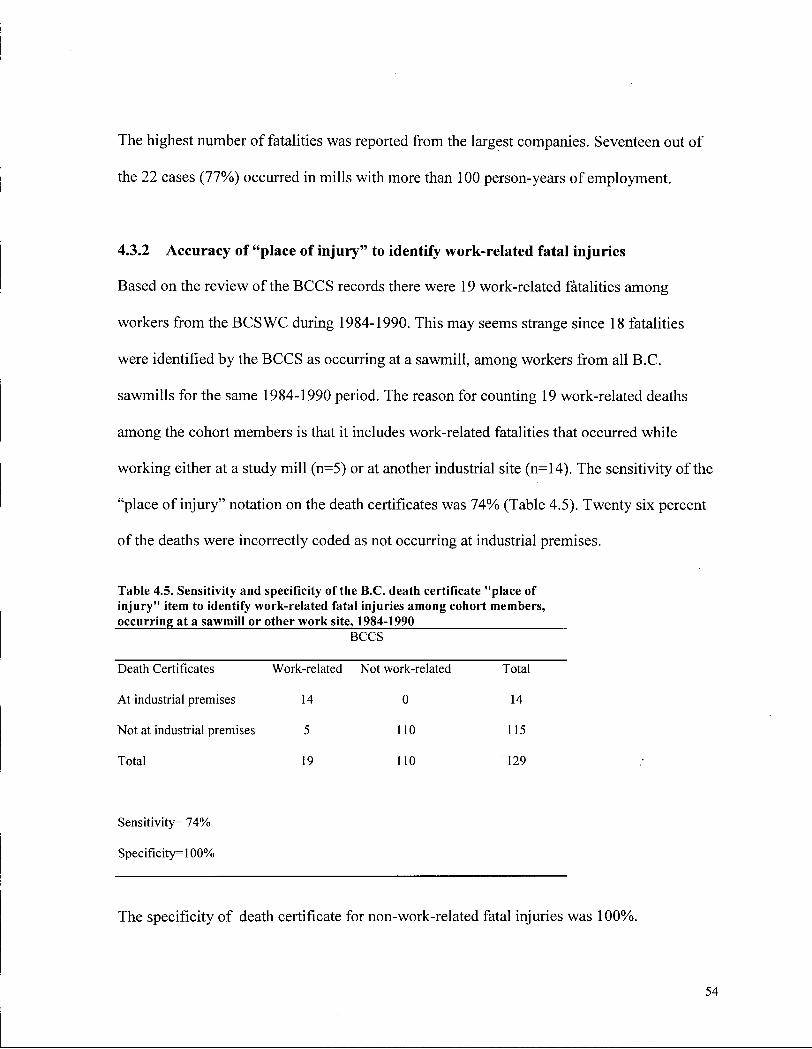
The highest number of fatalities was reported from the largest companies. Seventeen out of
the 22 cases (77%) occurred in mills with more than 100 person-years of employment.
4.3.2 Accuracy of "place of injury" to identify work-related fatal injuries
Based on the review of the BCCS records there were 19 work-related fatalities among
workers from the BCSWC during 1984-1990. This may seems strange since 18 fatalities
were identified by the BCCS as occurring at a sawmill, among workers from all B.C.
sawmills for the same 1984-1990 period. The reason for counting 19 work-related deaths
among the cohort members is that it includes work-related fatalities that occurred while
working either at a study mill (n=5) or at another industrial site (n=14). The sensitivity of the
"place of injury" notation on the death certificates was 74% (Table 4.5). Twenty six percent
of the deaths were incorrectly coded as not occurring at industrial premises.
Table 4.5. Sensitivity and specificity of the B.C. death certificate "place of injury" item to identify work-related fatal injuries among cohort members, occurring at a sawmill or other work site, 1984-1990
BCCS
Death Certificates Work-related Not work-related
At industrial premises 14 0
Not at industrial premises 5 110
Total 19 110
Sensitivity= 74%
Specificity=100%
The specificity of death certificate for non-work-related fatal injuries was 100%.
Total
14
115
129
54
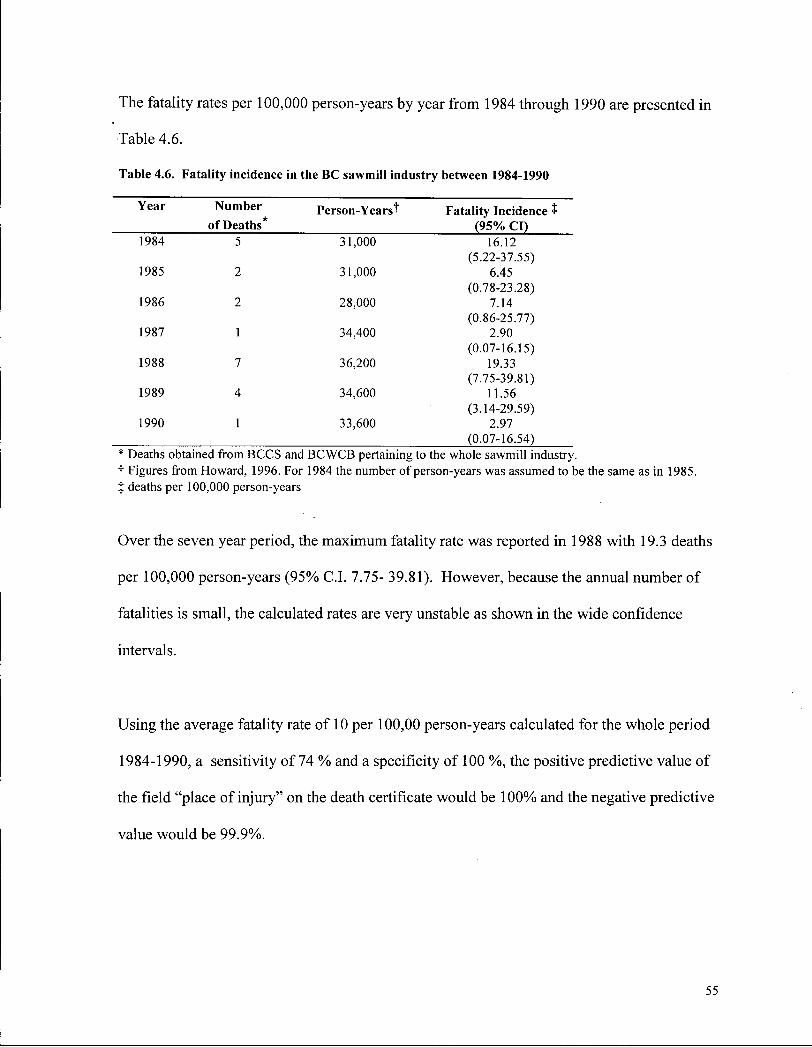
The fatality rates per 100,000 person-years by year from 1984 through 1990 are presented in
Table 4.6.
Table 4.6. Fatality incidence in the BC sawmill industry between 1984-1990
Year Number Person-Yearst Fatality Incidence t of Deaths* (95% CI)
1984 5 31,000 16.12 (5.22-37.55)
1985 2 31,000 6.45 (0.78-23.28)
1986 2 28,000 7.14 (0.86-25.77)
1987 1 34,400 2.90 (0.07-16.15)
1988 7 36,200 19.33 (7.75-39.81)
1989 4 34,600 11.56 (3.14-29.59)
1990 1 33,600 2.97 (0.07-16.54)
* Deaths obtained from BCCS and B C W C B pertaining to the whole sawmill industry. t Figures from Howard, 1996. For 1984 the number of person-years was assumed to be the same as in 1985. J deaths per 100,000 person-years
Over the seven year period, the maximum fatality rate was reported in 1988 with 19.3 deaths
per 100,000 person-years (95% C.I. 7.75- 39.81). However, because the annual number of
fatalities is small, the calculated rates are very unstable as shown in the wide confidence
intervals.
Using the average fatality rate of 10 per 100,00 person-years calculated for the whole period
1984-1990, a sensitivity of 74 % and a specificity of 100 %, the positive predictive value of
the field "place of injury" on the death certificate would be 100% and the negative predictive
value would be 99.9%.
55
4.4 Discussion
A total of 22 fatal work related injuries in all B.C. sawmills were identified between 1984
andl990. The proportion of cases identified by the WCB was approximately 14% higher than the
BCCS .
The capture-recapture analysis suggests that the ascertainment of work-related fatal injuries is
complete. There are however some caveats in interpreting this result. First, the capture recapture
methods relies on the assumption of independence of the sources. The estimates obtained from this
method are sensitive to assumptions about independence of sources and these estimates have some
uncertainty because of statistical fluctuation. In our study, the sources can not be considered totally
independent. While not all BCCS records for work-related fatal injuries included a B C W C B
report, the fact that some records contained a B C W C B report suggests that these agencies are
interdependent.
If the sources are not independent then the estimated underreporting is an underestimate of the true
population value (Hook and Regal, 1995). Thus, the zero underreporting estimated in our study is
most likely an underestimate because of the sources' interdependence. Second, the precision of the
estimate increases proportionally to the number of overlapped cases. In our study the number of
cases reported is small and the estimate may be unstable. More evidence of underreporting by
these data sources, is provided with the description of the cases specifically excluded by each
agency. The identification of the types of fatality missed by each source clearly reveals the fact
that every time there is such a case it will be missed because of the procedures for data collection
applied by each source. For example, the people not covered by the B C W C B will not be found on
the compensation files, neither will fatally injured workers whose claims were not accepted.
56
Likewise i f a worker dies of a work-related fatal injury outside the premises of the company but
while doing work for the company, he will most likely not be found in the BCCS i f the retrieval
based on the entry code "on premises". Thus, from the beginning we are undercounting the total
number of work-related fatal injuries by using either data source alone.
The ascertainment rate for the B C W C B (95.4%) is higher than that reported in U.S. by Stout
and Bell (1991) where it ranged from 40 to 70 percent. The BCCS ascertainment rate of
work-related fatal injuries (81.8%) was within the range for U.S. coroner's records reported
in the same study (32 to 90 percent). The authors suggested that the gap between the
proportion of cases ascertained for all industries by different data sources may be the result
of differences in compensation coverage among states (Stout and Bell, 1991). In this study,
because sawmills are covered by the WCB, we expected that the list of W C B claims for
sawmill workers would include most cases and this was confirmed in our results. In fact our
findings are comparable to those reported by Rossignol (1994) regarding capture rates for the
industrial group "forestry, fishing and mining" in Quebec. He reported that 91.8% of all
deaths in this industrial group were captured by the WCB. In contrast, Rossignol found that
the proportion of cases ascertained was much lower for Agriculture and Transportation
(45.5% and 76.6% respectively). Applying capture-recapture methods, this author calculated
that the true number of fatal injuries at work was 24% higher than that obtained from Quebec
WCB alone and 9% higher than that obtained using Quebec WCB and Coroners death
certificates combined. The author concluded that more self-employed and business owners
are likely to be found in agriculture and transportation.
5 7
With regard to the accuracy of the designation "place of injury" on the death certificates, our
findings show that it is better at identifying deaths that have not occurred at industrial places than
at identifying those that occurred at a workplace. The use of the notation "on industrial premises"
results in failure to capture fatal injuries that occur off premises but that are work-related (e.g.
motor vehicle-related). This is the same failure observed in the BCCS system.
While the small number of deaths included in this study may have produced unstable
estimates (most likely underestimates) regarding completeness of ascertainment of fatal
work-related injuries, it has served the purpose of illustrating the weaknesses and strengths
of each system.
Criteria for developing, implementing and evaluating an injury surveillance system have been
proposed by several authors (Rubens, et al., 1995; Waller and Clemmer, 1993; Graitcer, 1987;
Klaucke et al, 1988). In agreement with them, we propose that in order to improve surveillance of
work-related fatal injuries, both the BCCS and the B C W C B should use standardized industrial and
occupational codes (e.g. North American Industry Classification System, NAICS, 1997). The
adoption of standard industrial and occupational coding systems will facilitate comparability
among data sources at the provincial, national and international level. Similarly, the use of E codes
to classify causes of death would help make the data comparable with that recorded by Vital
Statistics.
The development by the BCCS of standardized data collection procedures similar to the
B C W C B Investigation Report will eliminate the great variability in the type and amount of
58

information collected by different Coroners. Notwithstanding these limitations, most of the
time the investigation reports from the Office of the Chief Coroner provided a detailed
narrative of the circumstances of every injury death, making this data source a very useful
resource for epidemiological research on injury fatalities.
The possibility exists for building a population-based occupational injury fatality surveillance
system in British Columbia. Having automated files with personal identifiers, it should be
feasible to link death certificates with Coroners records and WCB files. This record linkage
procedure would facilitate the use of current resources in a more efficient way and promote
cooperative relationships between participating agencies. Likewise, linking records would
improve the quality and completeness of information by allowing reliability and validity
checks among sources (Conroy, 1993; Colorado Department of Health, 1984). The benefits
from this strategy would be the availability of the best possible information to plan,
implement and evaluate injury prevention programs.
59
CHAPTER FIVE
5.0 Epidemiology of work-related fatalities among sawmill workers, 1950-1990
5.1 Introduction
In British Columbia (B.C.), the forest products industry constitutes a significant component of the
provincial economy. In terms of production, in 1992 Canada was the world's largest producer of
newsprint, the second largest producer of pulp and the third largest producer of sawn lumber.
Within Canada, the British Columbia sawmill industry with a workforce of approximately 27,881
workers, produced the largest amount of lumber in 1992 (Statistics Canada, 1994). Although the
type of equipment may vary from one mill to another depending on the type of wood processed
and the degree of modernization of the plant, in general terms the production phases in a typical
sawmill are the same around the world (Driscoll et al., 1995). A summary of the processes at a
typical mill comprises the following sequence: after arrival to the mill, the logs are transported by
a system of conveyors, belts and rollers from one cutting station to the next, until the desired shape
and size are obtained. The next step consists of the grading and sorting of the boards according to
the standards of quality of the market. Then, and depending on the subsequent industrial use, the
lumber may be transported through another cutting and planing station for final shaping and
smoothing of the surfaces. This finished product is then sorted, stacked, bundled, and prepared for
shipping (Davies, et al., 1998).
Forestry ranks among the industries with the highest rates of both lost time injury and
fatalities (Labour Canada 1990; Salisbury, et al., 1991). The Workers' Compensation Board
of B.C. (2000) reported that in 1999, a total of 6,574 claims were accepted from the sawmill
industry, and sawmill workers stayed off work 128,453 days due to short and long term
60
disability. During the ten-year period from 1990 to 1999, 42 sawmill workers died from
injuries sustained at the workplace, outnumbered only by loggers who have the highest
fatality rates within the forest industry. (WCB of BC, 2000).
Sawmill workers are exposed to several chemical and physical hazards including wood dust,
pesticides, metal fumes, noise, temperature extremes, mould and bacteria (Davies, et. al., 1998).
Similarly, exposure to safety hazards is virtually ubiquitous, and risks of falls, cuts, slips, trips,
strains, and being struck by objects are present throughout the different process areas of a mill. It
a workplace where strict adherence to safety regulations and procedures is indispensable (Demers
1998a). Ergonomic studies in sawmills have found that heavy physical workload, uncomfortable
working postures, fast work pace, noise, dust and extreme temperatures are the most common
concerns voiced by workers. The problem is compound by the psychological stress that results
from the high repetitiveness of the tasks and the social isolation caused by the attention demands,
noise and distance between operators (Aminoff, 1974; Baneryd,1974).
A few studies have been conducted among sawmill workers to investigate the sequence of
events leading to non-fatal injuries. Characteristics of injury scenarios suggest that injuries
do not occur by chance, but rather in specific production areas during the performance of
specific tasks. Handling logs or unblocking jammed logs (Laflamme and Cloutier, 1989);
performing maintenance work (Aminoff, 1974); clearing away logs, and feeding machines
(Larsson, 1991) have been identified as the most common activities preceding a work-related
injury.
61
Injured workers were most frequently working in the following sections: sawing, planing,
sorting and piling (Laflamme and Cloutier, 1989); packaging and sawing (Aminoff, 1974).
Cooke and Blumenstock(1979) reported that among sawmill workers in Maine, injury severity was
associated with worker's age, processing hardwood (as opposed to softwood) and being
temporarily assigned to a job (as opposed to permanently assigned). Punnett (1994) also studied
work-related injuries among sawmill workers in Maine with the purpose of identifying
environmental risk factors associated with injury occurrence. The strongest risk factors associated
with injury were: processing hard wood and high physical demand. Having 1 year or less of
experience on the job, inability to take a break when tired, and absence of a lockout program in
effect in the plant were also found significantly related to injury occurrence. Driscoll et al. (1995)
analyzed 16 sawmill work-related fatalities in Australia and reported that workers most frequently
died as a result of being struck by objects while handling logs or operating bench saws.
Although studies on work-related injuries in the sawmill industry are limited, they provide a basis
for understanding the type of factors that are part of the causal pathway of injuries for this
particular workforce. However, most of these studies, were designed as case series (except
Punnett's case-control study) and included almost exclusively non-fatal injuries without
differentiation of severity (except Driscoll et al.). In the present study complete counting of
person-years contributed by every cohort member allows the calculation of mortality rates which
are not commonly reported in statistics of industrial injuries, and the focus is on the most severe
outcomes where preventive strategies would have the greatest impact.
62

The specific objective of this study was to examine all work-related fatal injuries among sawmill
workers during 1950-1990, in terms of
a) characterizing the pattern and trend of fatal injuries at work
b) estimating the risk of fatal injuries at work
c) assessing the relationship between selected variables and the risk of fatal injuries at work
d) identifying the occupational categories at highest risk of fatal injuries at work
5.2 Methods
5.2.1 Study population- The original B.C. Sawmill Workers study
This study is part of a larger investigation of health effects of exposure to fungicides among
sawmill workers (Hertzman, et al., 1997). The original cohort was enumerated from mill personnel
records and included all workers who had at least 1 year of cumulative service between January 1st,
1950 and December 31 s t. 1985 at any of the study mills.
Fourteen sawmills operating in different regions within British Columbia participated in the study.
They were selected based on completeness of records, use of fungicide and willingness to
participate. Eleven mills were located on the coast and three in the interior of B.C. Table 5.1 shows
the location of the 14 mills and the number of participating workers from each one. Tahsis,
Youbou and Mackenzie are mill towns where the only source of employment is the mill.
63
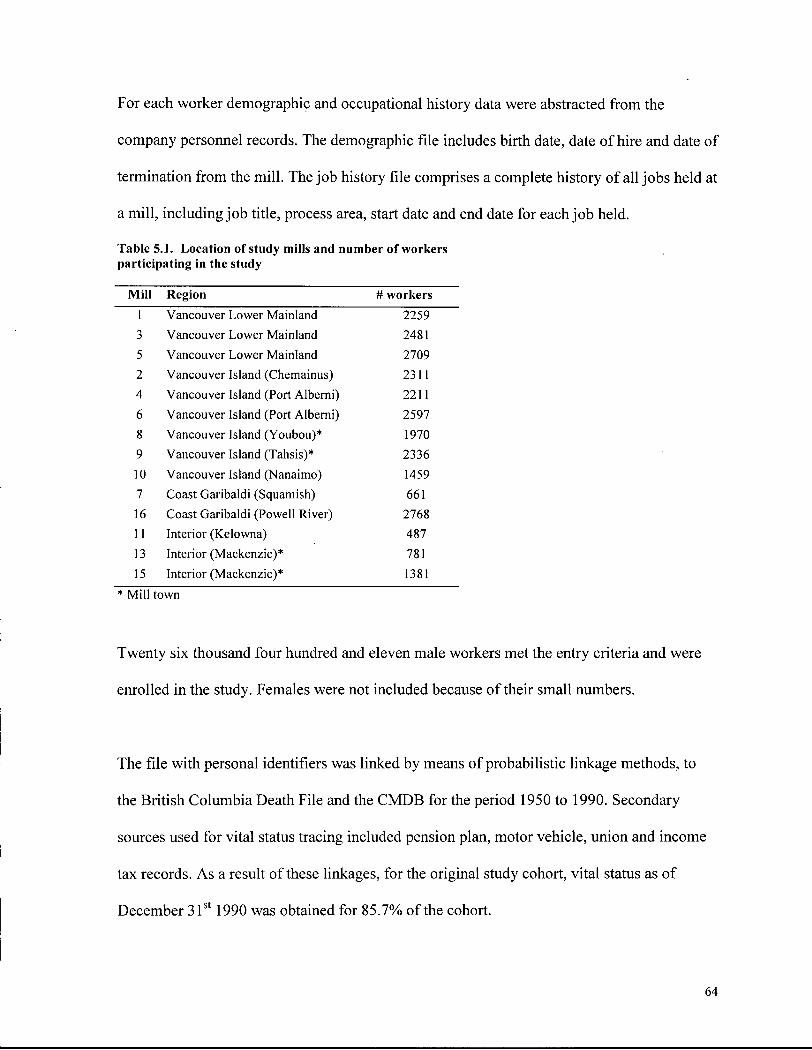
For each worker demographic and occupational history data were abstracted from the
company personnel records. The demographic file includes birth date, date of hire and date of
termination from the mill. The job history file comprises a complete history of all jobs held at
a mill, including job title, process area, start date and end date for each job held.
Table 5.1. Location of study mills and number of workers participating in the study
Mill Region # workers 1 Vancouver Lower Mainland 2259 3 Vancouver Lower Mainland 2481 5 Vancouver Lower Mainland 2709 2 Vancouver Island (Chemainus) 2311 4 Vancouver Island (Port Alberni) 2211 6 Vancouver Island (Port Alberni) 2597 8 Vancouver Island (Youbou)* 1970 9 Vancouver Island (Tahsis)* 2336 10 Vancouver Island (Nanaimo) 1459 7 Coast Garibaldi (Squamish) 661 16 Coast Garibaldi (Powell River) 2768 11 Interior (Kelowna) 487 13 Interior (Mackenzie)* 781 15 Interior (Mackenzie)* 1381
* Mill town
Twenty six thousand four hundred and eleven male workers met the entry criteria and were
enrolled in the study. Females were not included because of their small numbers.
The file with personal identifiers was linked by means of probabilistic linkage methods, to
the British Columbia Death File and the C M D B for the period 1950 to 1990. Secondary
sources used for vital status tracing included pension plan, motor vehicle, union and income
tax records. As a result of these linkages, for the original study cohort, vital status as of
December 31 s t 1990 was obtained for 85.7% of the cohort.
64
Cause of death was obtained from the provincial Division of Vital Statistics and was coded
according to the International Classification of Diseases in effect at the time of death. A l l
causes of deaths with an External cause of death code (E800-E999), were selected as cases of
interest for this study.
5.2.2 Work-relatedness of a fatality
The determination of whether or not a death was work-related was based on information
abstracted from the B.C Coroners Service (BCCS) and the WCB records.
With the list of names of sawmill workers who died from injuries in our Sawmill cohort, a search
was performed in the Coroner's Office files. Under the Coroner's Act of British Columbia all
sudden, unexpected deaths shall immediately be reported to the Coroner. The coroners investigate
the identity of the deceased and the facts about the death. Coroners records may include autopsy
reports, police reports, WCB reports and other information deemed important for the clarification
of the circumstances of the event.
The Coroner's Office has computerized records of fatalities from 1984 to present. For deaths that
happened before 1984, hard copies were manually searched to retrieve the reports corresponding to
deaths that occurred during the period 1950 to 1983 inclusive.
The data describing the circumstances of a worker's death were first recorded on forms
purposely designed containing the variables of interest for this research (Appendix B) and
65
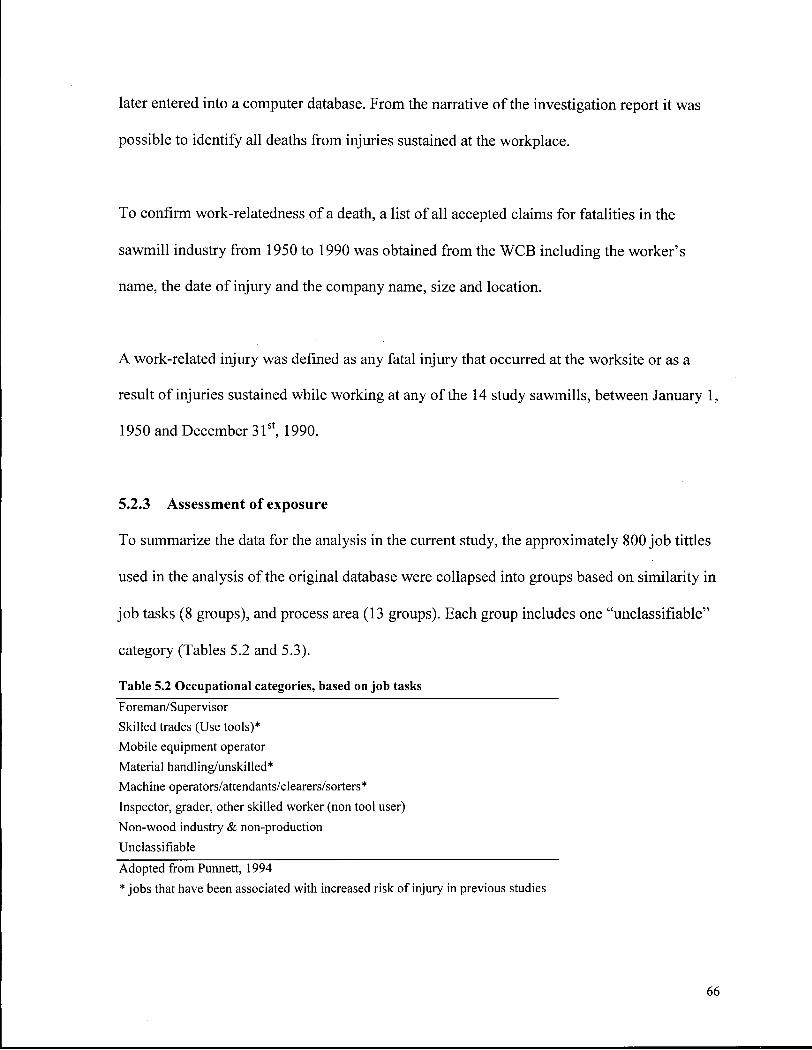
later entered into a computer database. From the narrative of the investigation report it was
possible to identify all deaths from injuries sustained at the workplace.
To confirm work-relatedness of a death, a list of all accepted claims for fatalities in the
sawmill industry from 1950 to 1990 was obtained from the WCB including the worker's
name, the date of injury and the company name, size and location.
A work-related injury was defined as any fatal injury that occurred at the worksite or as a
result of injuries sustained while working at any of the 14 study sawmills, between January 1,
1950 and December 31 s t, 1990.
5.2.3 Assessment of exposure
To summarize the data for the analysis in the current study, the approximately 800 job tittles
used in the analysis of the original database were collapsed into groups based on similarity in
job tasks (8 groups), and process area (13 groups). Each group includes one "unclassifiable"
category (Tables 5.2 and 5.3).
Table 5.2 Occupational categories, based on job tasks
Foreman/Supervisor
Skilled trades (Use tools)*
Mobile equipment operator
Material handling/unskilled*
Machine operators/attendants/clearers/sorters *
Inspector, grader, other skilled worker (non tool user)
Non-wood industry & non-production
Unclassifiable
Adopted from Punnett, 1994
* jobs that have been associated with increased risk of injury in previous studies
66

Table 5.3 Major process areas in a sawmill and exposure to safety hazards Process areas Exposure
Debarking Elevated walk-ways; unsecure logs/lumber Sawing/trimming/edging* conveyor belts; saws/cutting equipment; Planing flying debris; failure to lock-out machinery Chipping and related operations
Clean-up
Maintenance*
Sorting and clearing* Elevated walk-ways; unsecure logs/lumber; conveyor belts Grading flying debris; failure to lock-out machinery
Yard and pond Mobile equipment; unsecure logs/lumber; conveyor belts
Stenciling, packing and shipping* Elevated walk-ways; unsecure logs/lumber; conveyor belts;
mobile equipment; failure to lock-out machinery
Kiln drying Mobile equipment
General plant functions Occasional exposure to any of the above safety hazards
Unclassifiable
Adapted from Davies et al., 1998
*: Areas that have been associated with increased risk of injuries in previous studies
The task-based classification was developed by Laura Punnett (Punnett, 1994). The grouping
by process areas is based on the work by Davies, et al. (1998) with a slight modification to
include a category for general plant functions that comprises non-production workers (i.e.
clerical, first aid, watch-man).
5.2.4 Statistical analysis
The first analysis was descriptive and examined the frequency distribution of fatalities by
selected variables. These variables were grouped into three categories according to the
67
Haddon matrix: factors relating to the environment, factors relating to the person, and factors
relating to the injury event.
Crude rates of fatal injuries per 100,000 person years were calculated for work-related
injuries for the 40-year period for the whole cohort, and also for every job and process area
categories. For the present investigation, because the outcomes of interest are work-related
injury deaths that occurred to workers while actively employed at a mill, the follow-up was
truncated at the date of termination plus 30 days. This criterion was adopted to reduce the
probability of counting deaths that may have occurred in other jobs, but also to avoid missing
deaths that may have occurred as late effects or complications of injuries sustained at the
work-site.
Internal cohort analyses were conducted to compare the job categories in terms of their risk
of death from work-related injuries. Rate ratios comparing mortality rates for each job
category against the rest of the cohort adjusted for age and calendar time, were calculated
using Poisson regression modeling (Frome and Checkoway, 1985; Breslow and Day, 1987).
The decision to use the rates for the whole cohort (except the category being compared) as
the reference category was based on the fact that the only group that could be treated as
relatively unexposed, "non-wood products", would have very unstable rates given the small
number of deaths in that category. Similarly, due to the small number of fatalities, all types
of injury ( e.g. falls, struck by falling object, etc.) were combined for this analysis.
68
Poisson regression was also used to compute rate ratios and 95 % C.I. for the relationship
between duration of employment in current job, age and calendar period. The covariate
duration of employment in current job is defined as the cumulative length of employment in
the current job (i.e. the one held at the moment of the injury event). Two duration of
employment categories were defined as 1) less than 2 years in current job, and 2) equal to or
greater than 2 years in current job. Age was dichotomized into 2 categories: 1) less than 35
years, and 2) equal to or greater than 35 years. The boundaries for the calendar periods of
interest were "<1970", and ">= 1970". The categories "less than 2 years in current job",
"<35 years", and "<1970", were used as the reference groups for the rate ratios. The selection
criteria for the independent variables boundaries were based on an "a priori" concept of
selecting one distinctive category against which the others will be compared; ideally with a
large enough number of observations that a stable estimate will result against which relative
rates will be derived. Having a small number of deaths (number of deaths = 40), further
stratification of variables would result in several cells having 0 or 1 case each.
One methodological and technological challenge was the reformatting of the database for
input onto Life Table Analysis System (LTAS) so that the program could be used to analyze
acute effects of risk factors instead of the common cumulative effects studied in most
occupational cohort studies. A detailed explanation of the data preparation process for the
analyses performed in this study, is provided below.
69
5.2.5 Data preparation
Two statistical packages were used in the analysis of the cohort database. First, we used the Life
Table Analysis System (LTAS, version 1.0.c) developed by researchers from NIOSH (Cassinelli et
al., 2000), to produce a file with observed deaths, expected deaths, and person time at risk for each
combination of level of risk factors for each relevant cause of death. Next, we used EGRET
version 0.26.06 (SERC, 1993) for Poisson regression modeling to compare risk of fatal injuries
across job categories.
LTAS was developed by researchers from the National Institute for Occupational Safety and
Health (NIOSH), primarily to analyze cohorts defined according to workplace exposures. The
program requires input of two types of files: a demographic file and a job history file. Observed
deaths are divided by person-time at risk to construct rates by age, sex, race, calendar time, and
duration or level of exposure. Person time at risk of death usually begins when exposure begins
and continues until death date, date of last observed, or end of follow-up period. Mortality rates
can be calculated for each stratum and compared with external rates via indirect standardization to
compute Standardized Mortality Ratios (SMRs). Apart from calculating rates, the program can
generate stratified files with observed deaths and person-time at risk, that can be exported and used
with other software for regression analysis.
The database compiled for the B.C. Sawmill Workers Cohort consisted of two files: the
demographic file and the job history file which were reconstructed for comparison of risk of
work-related fatal injury among job categories. The reason for the reconstruction was to be
able to accurately assign person-time at risk of death according to the outcome of interest of
70
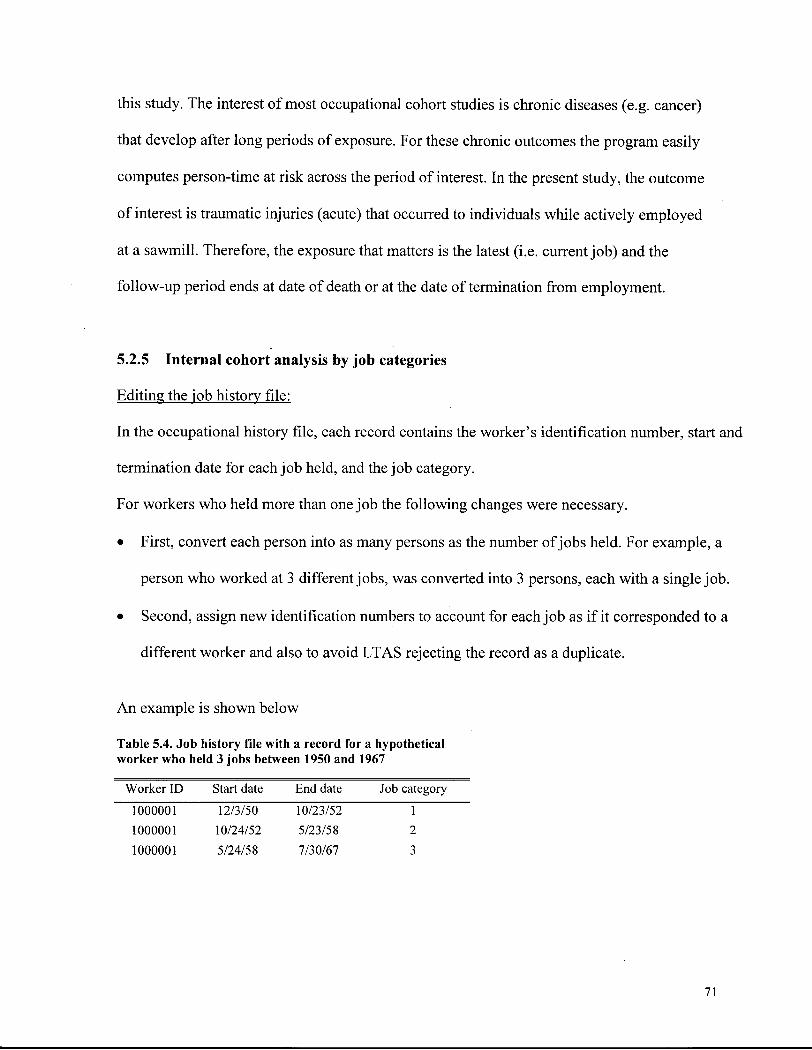
this study. The interest of most occupational cohort studies is chronic diseases (e.g. cancer)
that develop after long periods of exposure. For these chronic outcomes the program easily
computes person-time at risk across the period of interest. In the present study, the outcome
of interest is traumatic injuries (acute) that occurred to individuals while actively employed
at a sawmill. Therefore, the exposure that matters is the latest (i.e. current job) and the
follow-up period ends at date of death or at the date of termination from employment.
5.2.5 Internal cohort analysis by job categories
Editing the job history file:
In the occupational history file, each record contains the worker's identification number, start and
termination date for each job held, and the job category.
For workers who held more than one job the following changes were necessary.
• First, convert each person into as many persons as the number of jobs held. For example, a
person who worked at 3 different jobs, was converted into 3 persons, each with a single job.
• Second, assign new identification numbers to account for each job as i f it corresponded to a
different worker and also to avoid LTAS rejecting the record as a duplicate.
An example is shown below
Table 5.4. Job history file with a record for a hypothetical worker who held 3 jobs between 1950 and 1967
Worker ID Start date End date Job category
1000001 12/3/50 10/23/52 I
1000001 10/24/52 5/23/58 2
1000001 5/24/58 7/30/67 3
71
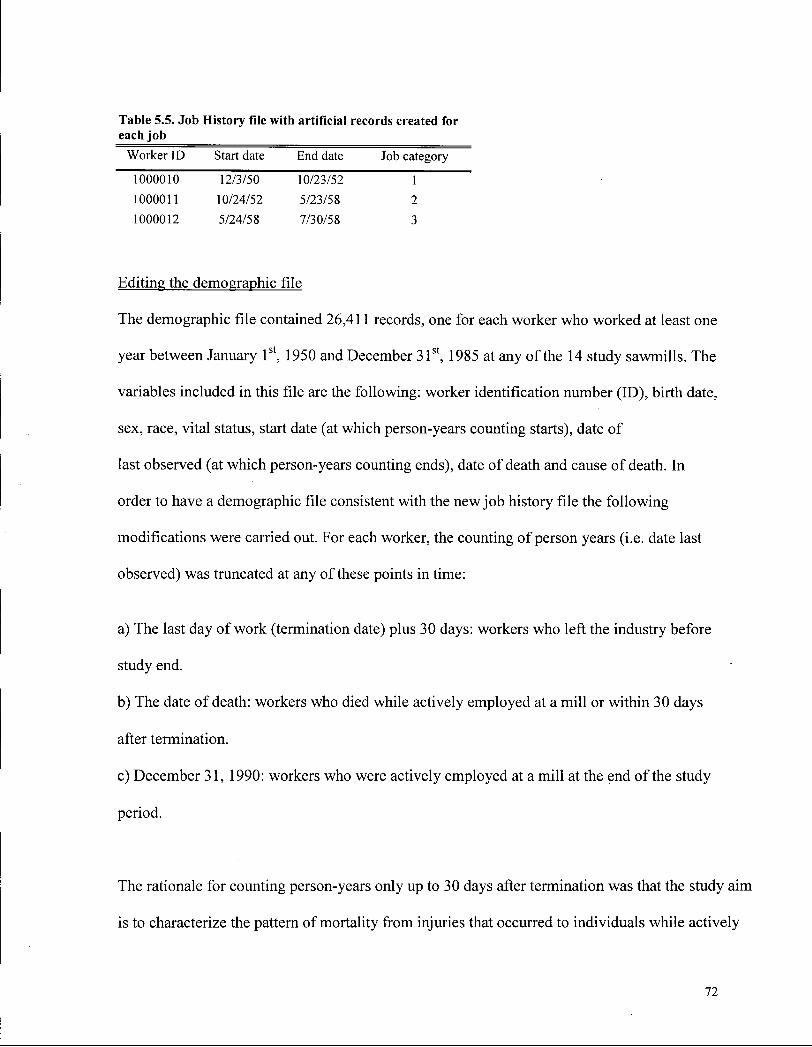
Table 5.5. Job History file with artificial records created for each job
Worker ID Start date End date Job category
1000010 12/3/50 10/23/52 I
1000011 10/24/52 5/23/58 2
1000012 5/24/58 7/30/58 3
Editing the demographic file
The demographic file contained 26,411 records, one for each worker who worked at least one
year between January 1st, 1950 and December 31 s t, 1985 at any of the 14 study sawmills. The
variables included in this file are the following: worker identification number (ID), birth date,
sex, race, vital status, start date (at which person-years counting starts), date of
last observed (at which person-years counting ends), date of death and cause of death. In
order to have a demographic file consistent with the new job history file the following
modifications were carried out. For each worker, the counting of person years (i.e. date last
observed) was truncated at any of these points in time:
a) The last day of work (termination date) plus 30 days: workers who left the industry before
study end.
b) The date of death: workers who died while actively employed at a mill or within 30 days
after termination.
c) December 31, 1990: workers who were actively employed at a mill at the end of the study
period.
The rationale for counting person-years only up to 30 days after termination was that the study aim
is to characterize the pattern of mortality from injuries that occurred to individuals while actively
72
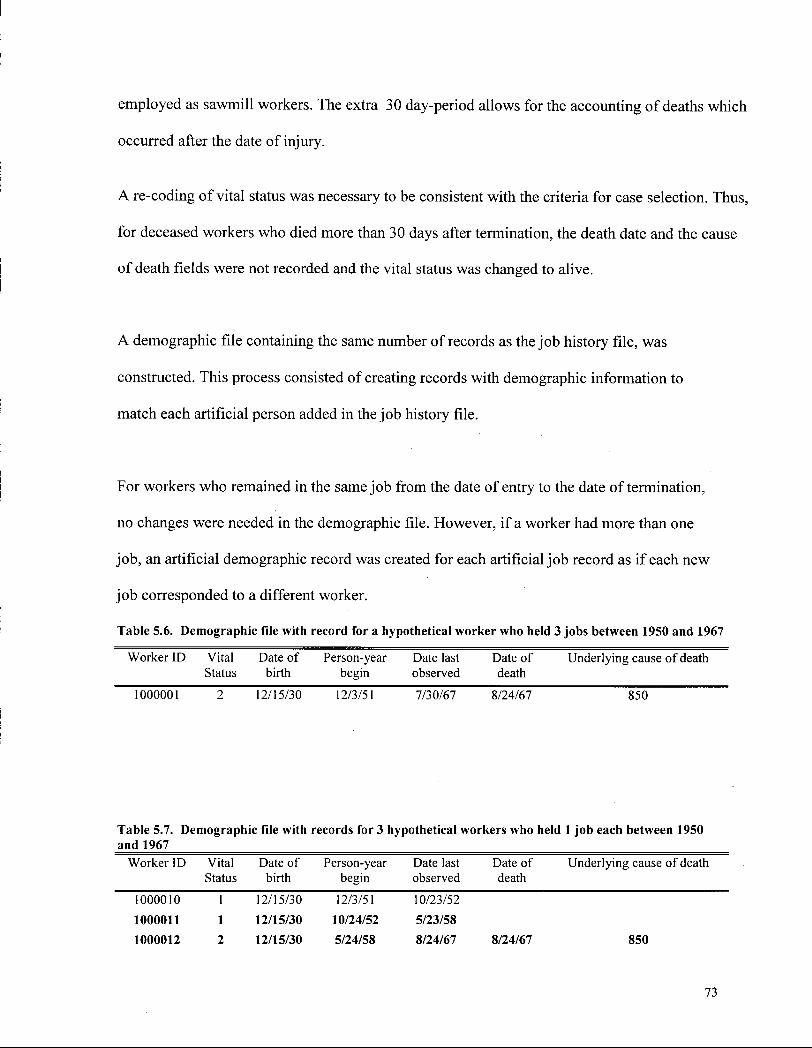
employed as sawmill workers. The extra 30 day-period allows for the accounting of deaths which
occurred after the date of injury.
A re-coding of vital status was necessary to be consistent with the criteria for case selection. Thus,
for deceased workers who died more than 30 days after termination, the death date and the cause
of death fields were not recorded and the vital status was changed to alive.
A demographic file containing the same number of records as the job history file, was
constructed. This process consisted of creating records with demographic information to
match each artificial person added in the job history file.
For workers who remained in the same job from the date of entry to the date of termination,
no changes were needed in the demographic file. However, i f a worker had more than one
job, an artificial demographic record was created for each artificial job record as i f each new
job corresponded to a different worker.
Table 5.6. Demographic file with record for a hypothetical worker who held 3 jobs between 1950 and 1967
Worker ID Vital Date of Person-year Date last Date of Underlying cause of death Status birth begin observed death
1000001 2 12/15/30 12/3/51 7/30/67 8/24/67 850
Table 5.7. Demographic file with records for 3 hypothetical workers who held 1 job each between 1950 and 1967
Worker ID Vital Status
Date of birth
Person-year begin
Date last observed
Date of death
Underlying cause of death
1000010 1 12/15/30 12/3/51 10/23/52
1000011 1 12/15/30 10/24/52 5/23/58 1000012 2 12/15/30 5/24/58 8/24/67 8/24/67 850
73
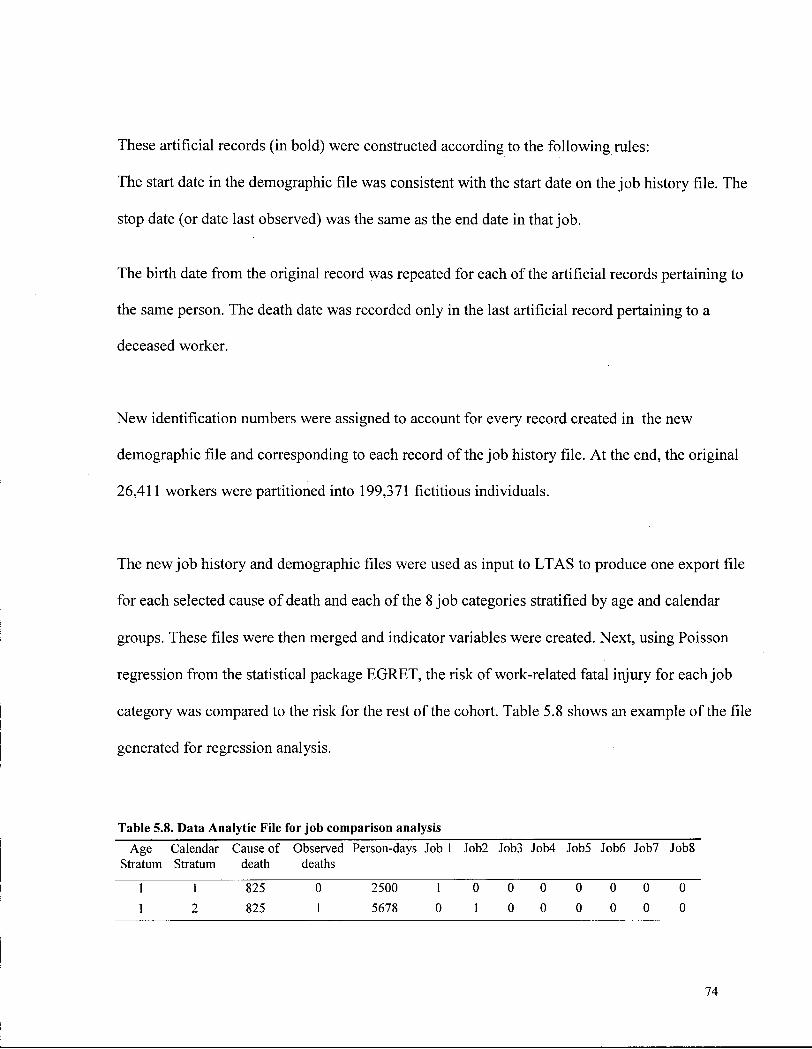
These artificial records (in bold) were constructed according to the following rules:
The start date in the demographic file was consistent with the start date on the job history file. The
stop date (or date last observed) was the same as the end date in that job.
The birth date from the original record was repeated for each of the artificial records pertaining to
the same person. The death date was recorded only in the last artificial record pertaining to a
deceased worker.
New identification numbers were assigned to account for every record created in the new
demographic file and corresponding to each record of the job history file. At the end, the original
26,411 workers were partitioned into 199,371 fictitious individuals.
The new job history and demographic files were used as input to LTAS to produce one export file
for each selected cause of death and each of the 8 job categories stratified by age and calendar
groups. These files were then merged and indicator variables were created. Next, using Poisson
regression from the statistical package EGRET, the risk of work-related fatal injury for each job
category was compared to the risk for the rest of the cohort. Table 5.8 shows an example of the file
generated for regression analysis.
Table 5.8. Data Analytic File for job comparison analysis
Age Calendar Cause of Observed Person-days Job 1 Job2 Job3 Job4 Job5 Job6 Job7 Job8 Stratum Stratum death deaths
1 1 825 0 2500 1 0 0 0 0 0 0 0
1 2 825 1 5678 0 1 0 0 0 0 0 0
74
5.3 Results
5.3.1 Rates and time trends in fatal injuries at work
Eighty-eight cohort members died from work-related injuries from 1950 through 1990. Of
these, forty workers died from injuries sustained at work while employed at any of the study
sawmill and the rest occurred while working at a different job. The total number of person-
years at risk was 220,965. The overall incidence of work-related fatal injuries was 18.10 per
100,000 person-years.
Coroner's files were found for 35 of these 40 work-related fatalities (87.5%). For the
remaining five deaths, all of which occurred prior to 1984, a manual search of the hard
copies was conducted. One of the five cases had a record in the Coroner's files but the
investigation report could not be found. None of the other four deaths had any record in the
BCCS. For this reason, part of the descriptive analysis (i.e. that which is based on
information from Coroner's reports) could include data for only 35 deaths. In addition,
because information on some variables is not consistently collected by the coroners, the data
presented may sometimes be limited to fewer than 35 deaths (see footnotes of each table and
figure).
Figure 5.1 shows that the fatality rates were higher during 1950-1959 than during the last
three decades of the study.
75
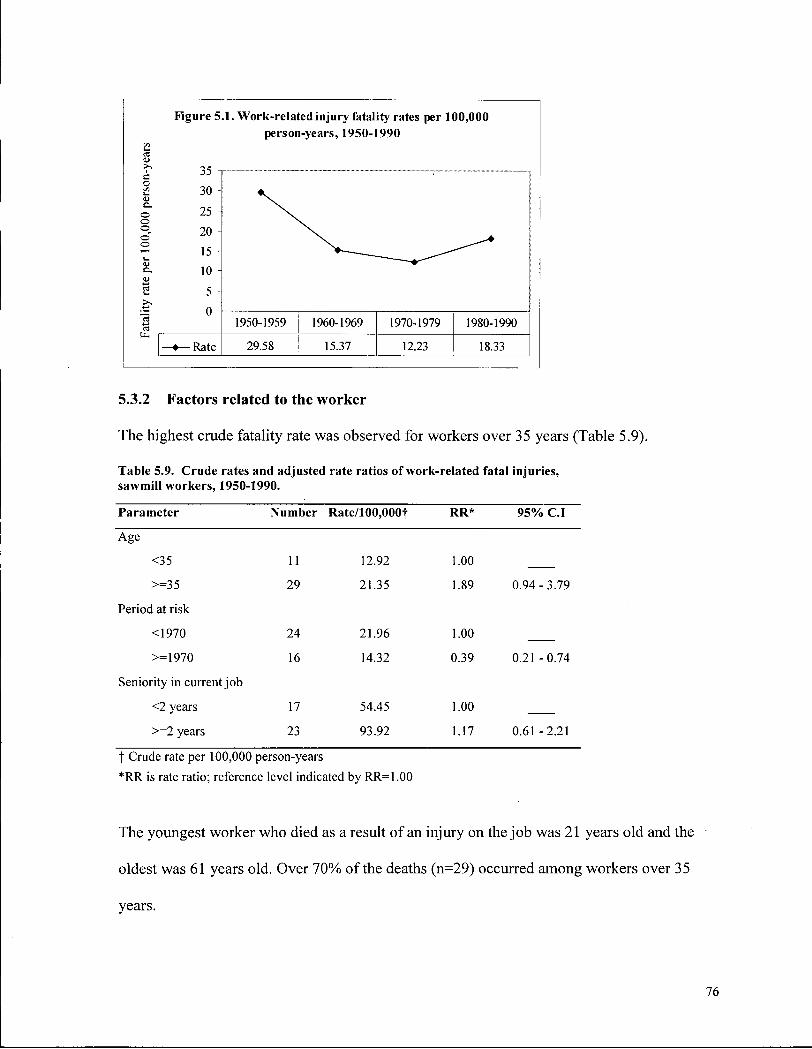
CB <u >^ I c o
(SI •— u a. o o o ©" o
CO
CO IX
Figure 5.1. Work-related injury fatality rates per 100,000 person-years, 1950-1990
35
30
25
20
15
10
5
0
-•—Rate
1950-1959
29.58
1960-1969
15.37
1970-1979
12.23
1980-1990
18.33
5.3.2 Factors related to the worker
The highest crude fatality rate was observed for workers over 35 years (Table 5.9).
Table 5.9. Crude rates and adjusted rate ratios of work-related fatal injuries, sawmill workers, 1950-1990.
Parameter Number Rate/100,000f
Age
<35
>=35
Period at risk
<1970
>=1970
Seniority in current job
<2 years
>=2 years
11 12.92
29 21.35
24
16
17
23
21.96
14.32
54.45
93.92
| Crude rate per 100,000 person-years
*RR is rate ratio; reference level indicated by RR=1.00
RR*
1.00
1.00
1.17
95% C.I
1.89 0.94-3.79
1.00
0.39 0.21 -0.74
0.61 -2.21
The youngest worker who died as a result of an injury on the job was 21 years old and the
oldest was 61 years old. Over 70% of the deaths (n=29) occurred among workers over 35
years.
76
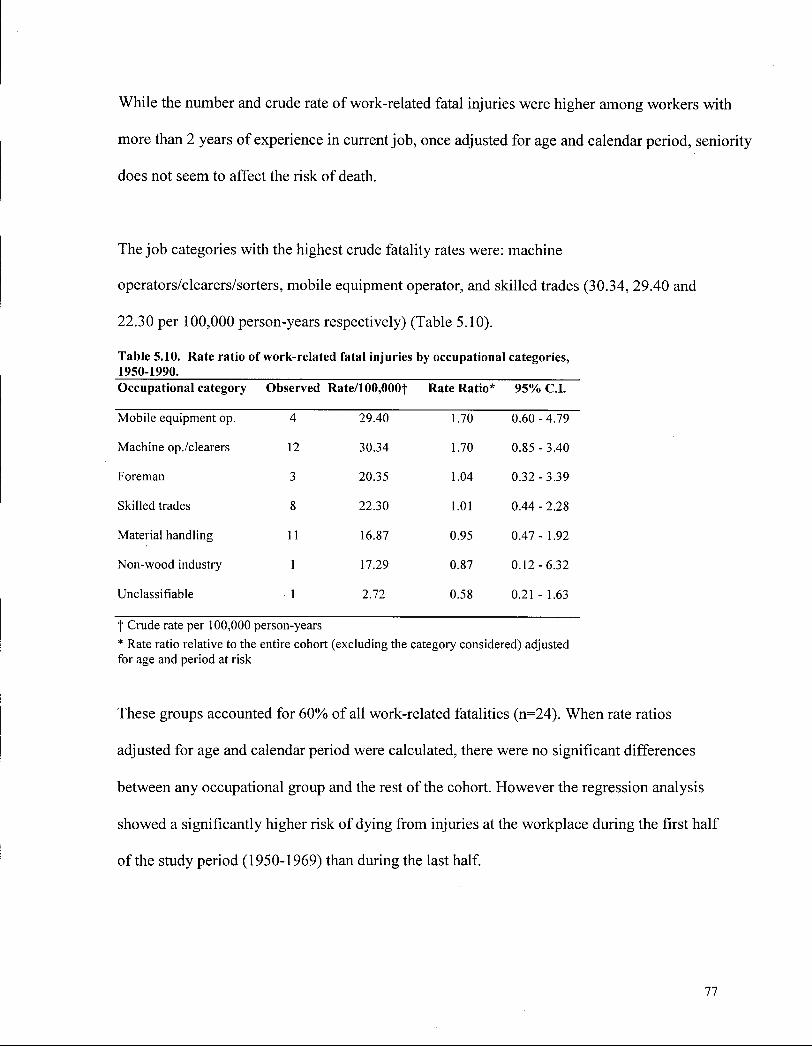
While the number and crude rate of work-related fatal injuries were higher among workers with
more than 2 years of experience in current job, once adjusted for age and calendar period, seniority
does not seem to affect the risk of death.
The job categories with the highest crude fatality rates were: machine
operators/clearers/sorters, mobile equipment operator, and skilled trades (30.34, 29.40 and
22.30 per 100,000 person-years respectively) (Table 5.10).
Table 5.10. Rate ratio of work-related fatal injuries by occupational categories, 1950-1990. Occupational category Observed Rate/100,000f Rate Ratio* 95% C.I.
Mobile equipment op. 4 29.40 1.70 0.60-4.79
Machine op./clearers 12 30.34 1.70 0.85-3.40
Foreman 3 20.35 1.04 0.32-3.39
Skilled trades 8 22.30 1.01 0.44 - 2.28
Material handling 11 16.87 0.95 0.47- 1.92
Non-wood industry 1 17.29 0.87 0.12-6.32
Unclassifiable 1 2.72 0.58 0.21 - 1.63
t Crude rate per 100,000 person-years * Rate ratio relative to the entire cohort (excluding the category considered) adjusted for age and period at risk
These groups accounted for 60% of all work-related fatalities (n=24). When rate ratios
adjusted for age and calendar period were calculated, there were no significant differences
between any occupational group and the rest of the cohort. However the regression analysis
showed a significantly higher risk of dying from injuries at the workplace during the first half
of the study period (1950-1969) than during the last half.
77
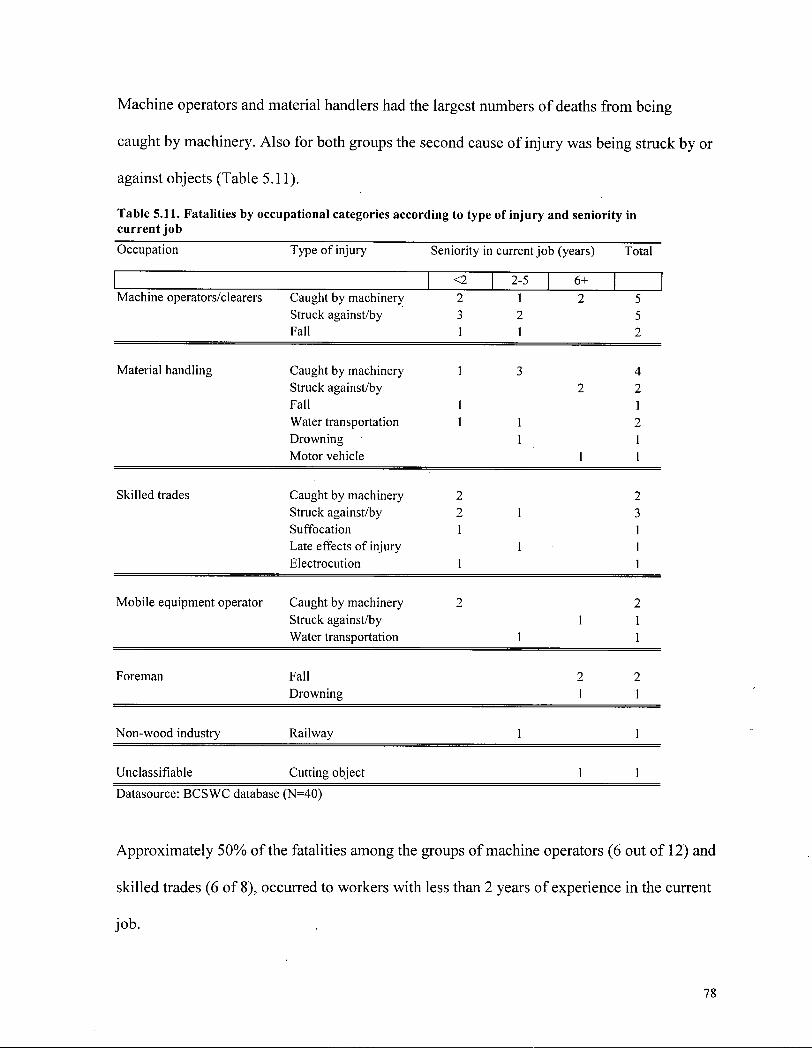
Machine operators and material handlers had the largest numbers of deaths from being
caught by machinery. Also for both groups the second cause of injury was being struck by or
against objects (Table 5.11).
Table 5.11. Fatalities by occupational categories according to type of injury and seniority in current job
Occupation Type of injury Seniority in current job (years) Total
<2 2-5 6+ Machine operators/clearers Caught by machinery 2 1 2 5
Struck against/by 3 2 5 Fall 1 1 2
Material handling Caught by machinery 1 3 4 Struck against/by 2 2 Fall 1 1 Water transportation 1 1 2 Drowning 1 1 Motor vehicle 1 1
Skilled trades Caught by machinery 2 2 Struck against/by 2 1 3 Suffocation 1 1 Late effects of injury 1 1 Electrocution 1 1
Mobile equipment operator Caught by machinery 2 2 Struck against/by 1 1 Water transportation 1 1
Foreman Fall 2 2 Drowning 1 1
Non-wood industry Railway 1 1
Unclassifiable Cutting object 1 1
Datasource: B C S W C database (N=40)
Approximately 50% of the fatalities among the groups of machine operators (6 out of 12) and
skilled trades (6 of 8), occurred to workers with less than 2 years of experience in the current
job.
78
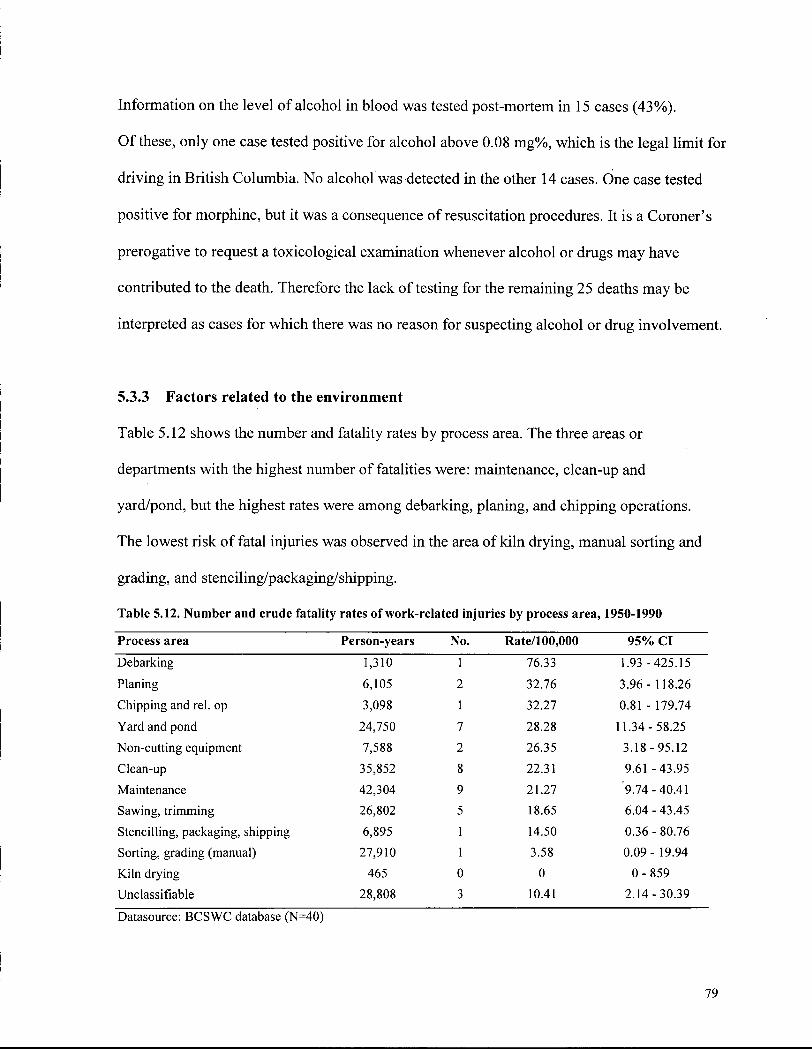
Information on the level of alcohol in blood was tested post-mortem in 15 cases (43%).
Of these, only one case tested positive for alcohol above 0.08 mg%, which is the legal limit for
driving in British Columbia. No alcohol was detected in the other 14 cases. One case tested
positive for morphine, but it was a consequence of resuscitation procedures. It is a Coroner's
prerogative to request a toxicological examination whenever alcohol or drugs may have
contributed to the death. Therefore the lack of testing for the remaining 25 deaths may be
interpreted as cases for which there was no reason for suspecting alcohol or drug involvement.
5.3.3 Factors related to the environment
Table 5.12 shows the number and fatality rates by process area. The three areas or
departments with the highest number of fatalities were: maintenance, clean-up and
yard/pond, but the highest rates were among debarking, planing, and chipping operations.
The lowest risk of fatal injuries was observed in the area of kiln drying, manual sorting and
grading, and stenciling/packaging/shipping.
Table 5.12. Number and crude fatality rates of work-related injuries by process area, 1950-1990
Process area Person-years No. Rate/100,000 95% CI
Debarking 1,310 1 76.33 1.93 -425.15
Planing 6,105 2 32.76 3.96-118.26
Chipping and rel. op 3,098 1 32.27 0.81 - 179.74
Yard and pond 24,750 7 28.28 11.34- 58.25
Non-cutting equipment 7,588 2 26.35 3.18-95.12
Clean-up 35,852 8 22.31 9.61-43.95
Maintenance 42,304 9 21.27 '9.74-40.41
Sawing, trimming 26,802 5 18.65 6.04-43.45
Stencilling, packaging, shipping 6,895 1 14.50 0.36 - 80.76
Sorting, grading (manual) 27,910 1 3.58 0.09- 19.94
Kiln drying 465 0 0 0-859
Unclassifiable 28,808 3 10.41 2.14-30.39
Datasource: BCSWC database (N=40)
79
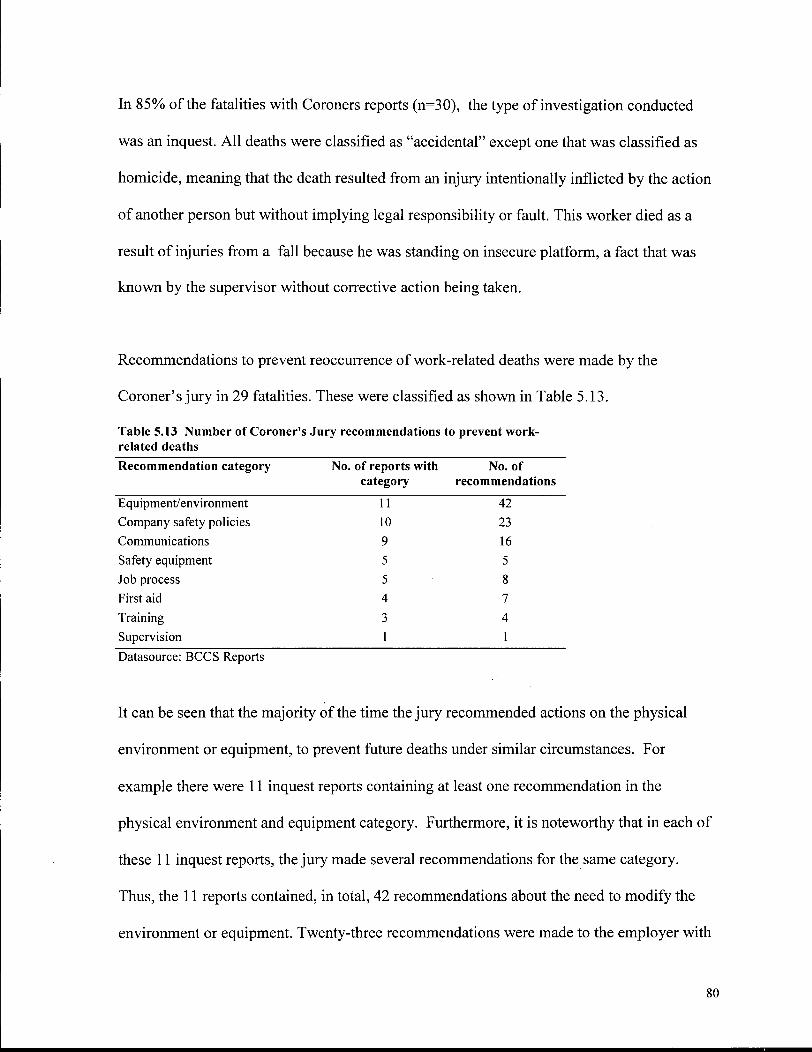
In 85% of the fatalities with Coroners reports (n=30), the type of investigation conducted
was an inquest. A l l deaths were classified as "accidental" except one that was classified as
homicide, meaning that the death resulted from an injury intentionally inflicted by the action
of another person but without implying legal responsibility or fault. This worker died as a
result of injuries from a fall because he was standing on insecure platform, a fact that was
known by the supervisor without corrective action being taken.
Recommendations to prevent reoccurrence of work-related deaths were made by the
Coroner's jury in 29 fatalities. These were classified as shown in Table 5.13.
Table 5.13 Number of Coroner's Jury recommendations to prevent work-related deaths Recommendation category No. of reports with No. of
category recommendations
Equipment/environment 11 42 Company safety policies 10 23 Communications 9 16 Safety equipment 5 5 Job process 5 8 First aid 4 7 Training 3 4 Supervision 1 1
Datasource: BCCS Reports
It can be seen that the majority of the time the jury recommended actions on the physical
environment or equipment, to prevent future deaths under similar circumstances. For
example there were 11 inquest reports containing at least one recommendation in the
physical environment and equipment category. Furthermore, it is noteworthy that in each of
these 11 inquest reports, the jury made several recommendations for the same category.
Thus, the 11 reports contained, in total, 42 recommendations about the need to modify the
environment or equipment. Twenty-three recommendations were made to the employer with
80
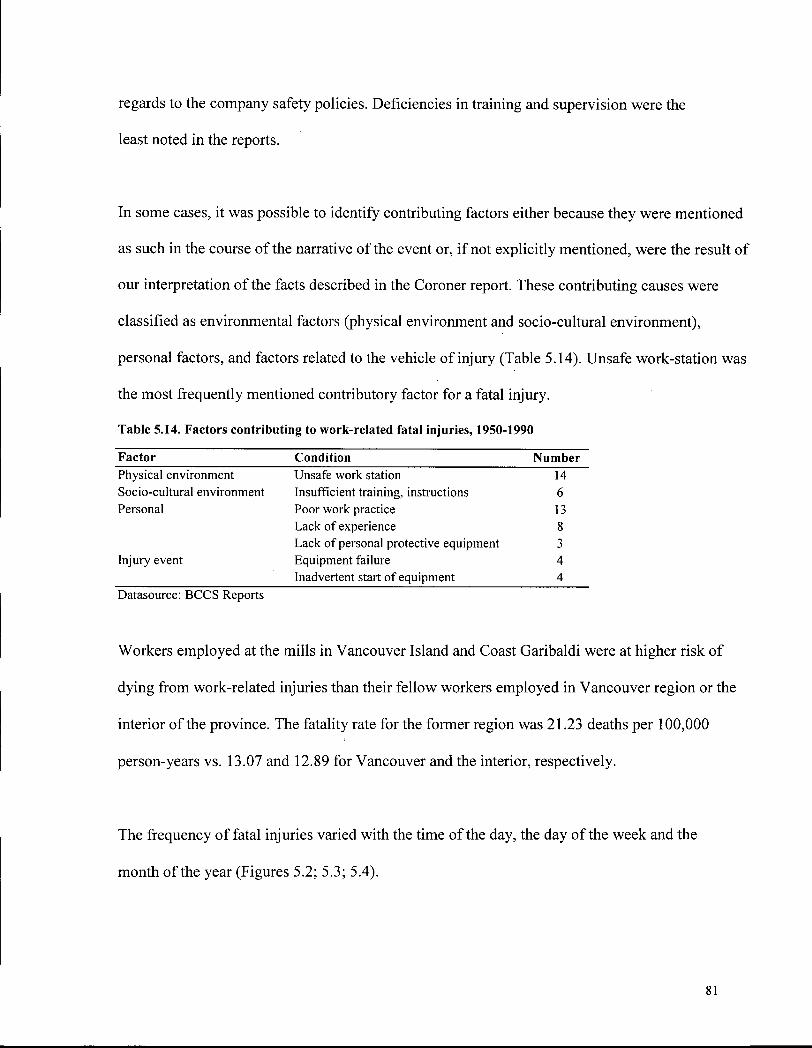
regards to the company safety policies. Deficiencies in training and supervision were the
least noted in the reports.
In some cases, it was possible to identify contributing factors either because they were mentioned
as such in the course of the narrative of the event or, i f not explicitly mentioned, were the result of
our interpretation of the facts described in the Coroner report. These contributing causes were
classified as environmental factors (physical environment and socio-cultural environment),
personal factors, and factors related to the vehicle of injury (Table 5.14). Unsafe work-station was
the most frequently mentioned contributory factor for a fatal injury.
Table 5.14. Factors contributing to work-related fatal injuries, 1950-1990
Factor Condition Number Physical environment Unsafe work station 14 Socio-cultural environment Insufficient training, instructions 6 Personal Poor work practice 13
Lack of experience 8 Lack of personal protective equipment 3
Injury event Equipment failure 4 Inadvertent start of equipment 4
Datasource: BCCS Reports
Workers employed at the mills in Vancouver Island and Coast Garibaldi were at higher risk of
dying from work-related injuries than their fellow workers employed in Vancouver region or the
interior of the province. The fatality rate for the former region was 21.23 deaths per 100,000
person-years vs. 13.07 and 12.89 for Vancouver and the interior, respectively.
The frequency of fatal injuries varied with the time of the day, the day of the week and the
month of the year (Figures 5.2; 5.3; 5.4).
81
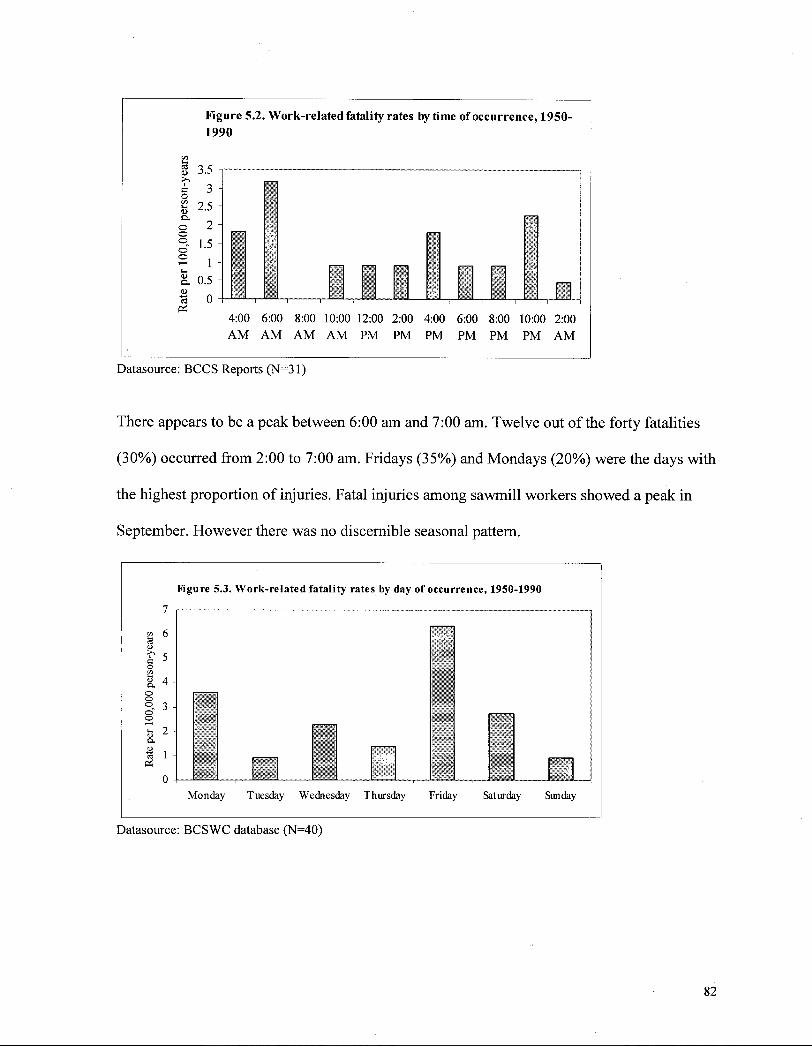
Figure 5.2. Work-related fatality rates by time of occurrence, 1950-
1990
<D >> i e o <D OH o O q
o a.
Pi
3.5
3
2.5
2
1.5
1
0.5
0 • 4:00 6:00 8:00 10:00 12:00 2:00 4:00 6:00 8:00 10:00 2:00
A M A M A M A M PM PM PM PM PM PM A M
Datasource: BCCS Reports (N=31)
There appears to be a peak between 6:00 am and 7:00 am. Twelve out of the forty fatalities
(30%) occurred from 2:00 to 7:00 am. Fridays (35%) and Mondays (20%) were the days with
the highest proportion of injuries. Fatal injuries among sawmill workers showed a peak in
September. However there was no discernible seasonal pattern.
Figure 5.3. Work-related fatality rates by day of occurrence, 1950-1990
5 \
<U A
Z- 3
o % 2 a. ca 1
Pi
Monday Tuesday Wednesday Thursday Friday Saturday Sunday
Datasource: BCSWC database (N=40)
82
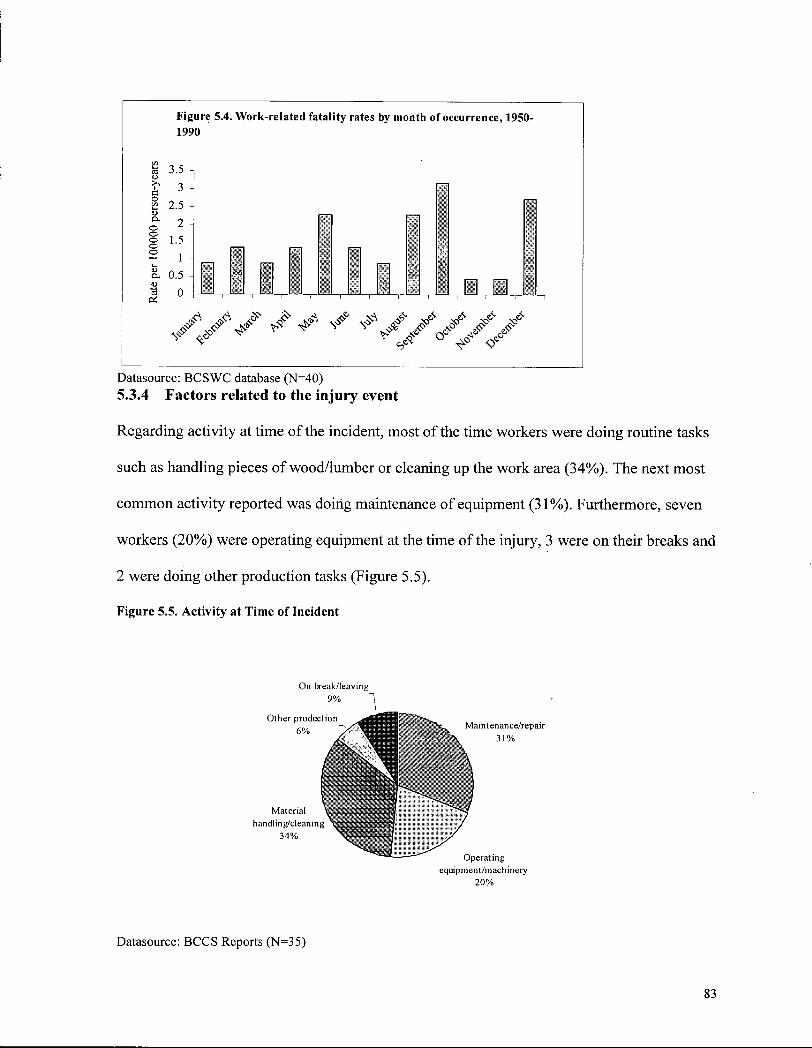
Figure 5.4. Work-related fatality rates by month of occurrence, 1950-1990
Datasource: BCSWC database (N=40)
5.3.4 Factors related to the injury event
Regarding activity at time of the incident, most of the time workers were doing routine tasks
such as handling pieces of wood/lumber or cleaning up the work area (34%). The next most
common activity reported was doing maintenance of equipment (31%). Furthermore, seven
workers (20%) were operating equipment at the time of the injury, 3 were on their breaks and
2 were doing other production tasks (Figure 5.5).
Figure 5.5. Activity at Time of Incident
On break/leaving
equipment/machinery 20%
Datasource: BCCS Reports (N=35)
83
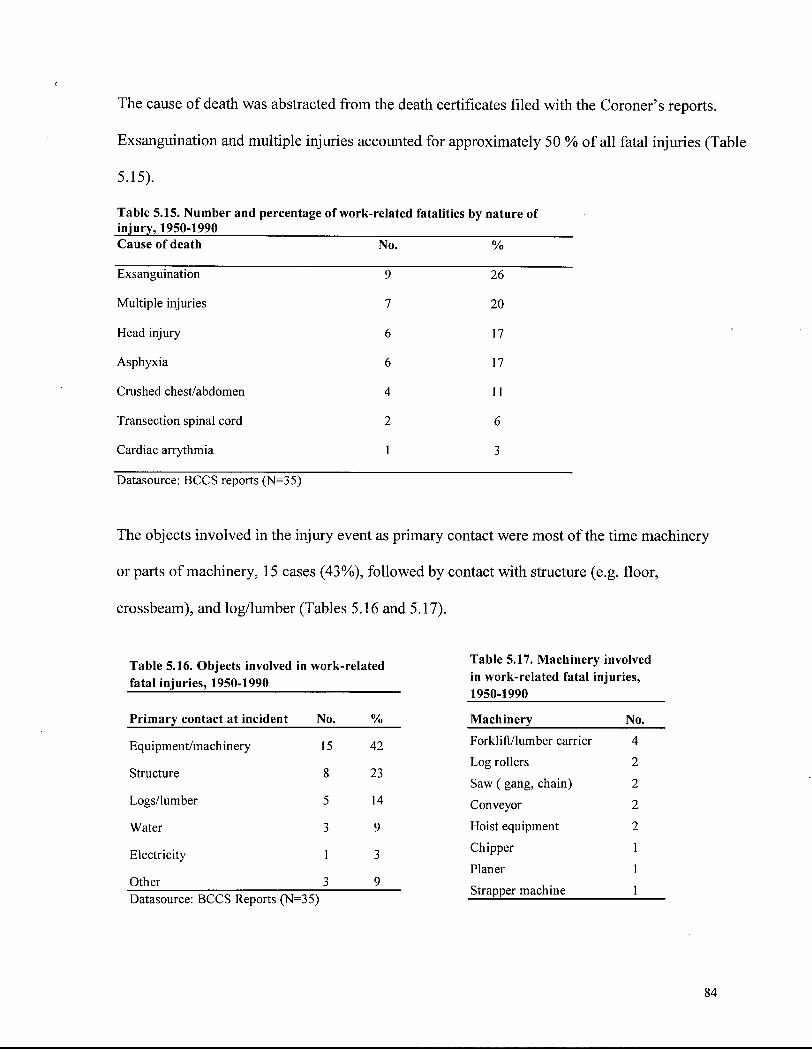
The cause of death was abstracted from the death certificates filed with the Coroner's reports.
Exsanguination and multiple injuries accounted for approximately 50 % of all fatal injuries (Table
5.15).
Table 5.15. Number and percentage of work-related fatalities by nature of
Cause of death No. %
Exsanguination 9 26
Multiple injuries 7 20
Head injury 6 17
Asphyxia 6 17
Crushed chest/abdomen 4 11
Transection spinal cord 2 6
Cardiac arrythmia 1 3
Datasource: BCCS reports (N=35)
The objects involved in the injury event as primary contact were most of the time machinery
or parts of machinery, 15 cases (43%), followed by contact with structure (e.g. floor,
crossbeam), and log/lumber (Tables 5.16 and 5.17).
Table 5.16. Objects involved in work-related fatal injuries, 1950-1990
Primary contact at incident No. %
Equipment/machinery 15 42
Structure 8 23
Logs/lumber 5 14
Water 3 9
Electricity 1 3
Other 3 9 Datasource: BCCS Reports (N=35)
Table 5.17. Machinery involved in work-related fatal injuries, 1950-1990
Machinery No.
Forklift/lumber carrier 4
Log rollers 2
Saw (gang, chain) 2
Conveyor 2
Hoist equipment 2
Chipper 1
Planer 1
Strapper machine 1
84
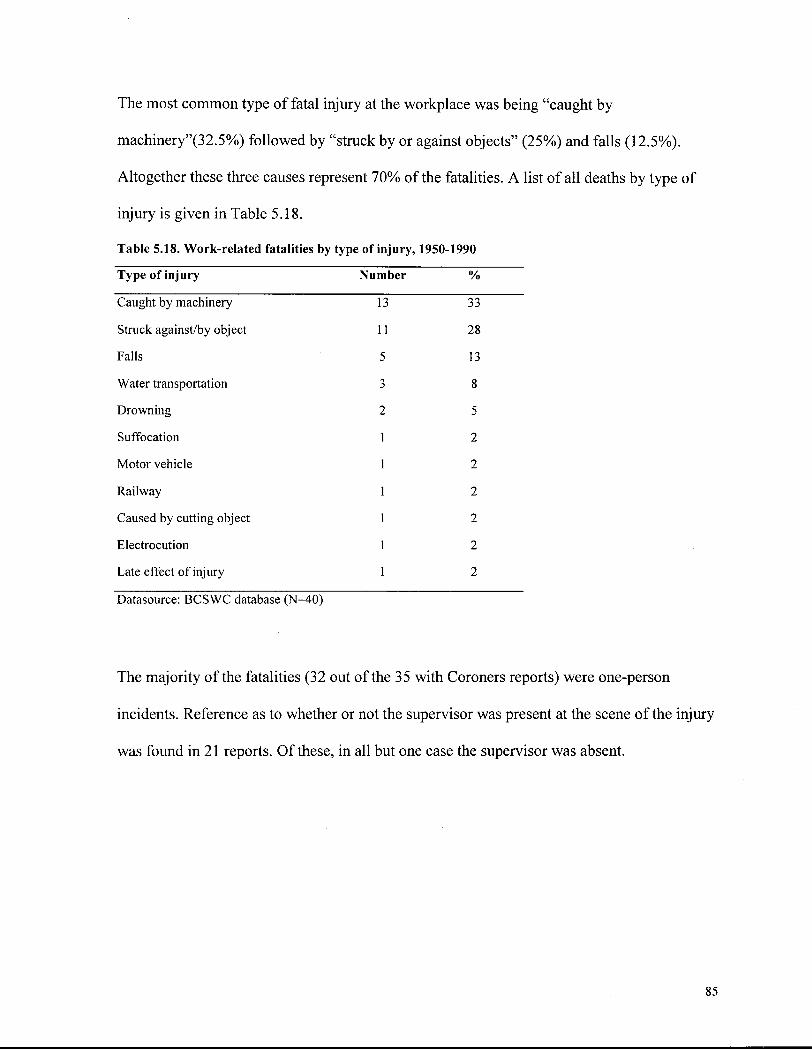
The most common type of fatal injury at the workplace was being "caught by
machinery"(32.5%) followed by "struck by or against objects" (25%) and falls (12.5%).
Altogether these three causes represent 70% of the fatalities. A list of all deaths by type of
injury is given in Table 5.18.
Table 5.18. Work-related fatalities by type of injury, 1950-1990
Type of injury Number %
Caught by machinery 13 33
Struck against/by object 11 28
Falls 5 13
Water transportation 3 8
Drowning 2 5
Suffocation 1 2
Motor vehicle 1 2
Railway 1 2
Caused by cutting object 1 2
Electrocution 1 2
Late effect of injury 1 2
Datasource: BCSWC database (N=40)
The majority of the fatalities (32 out of the 35 with Coroners reports) were one-person
incidents. Reference as to whether or not the supervisor was present at the scene of the injury
was found in 21 reports. Of these, in all but one case the supervisor was absent.
85

5.4 Discussion
Pattern and trend of fatal injuries at work
The overall fatality rate in our cohort was 18.10 per 100,000 person-years for the period
1950-1990. For comparison purposes, given the lack of data from comparable cohorts, rates
by decades are selected. The fatality rate reported among Australian sawmill workers for the
period 1982-1984 (Driscoll, et al., 1995) was higher than the one observed in our cohort for
the period 1980-1990 (30 vs.18.33 per 100,000 person-years).
In comparison with other industrial branches, our forty-year rate of 18.10 per 100,000 person-years
is higher than the 13.20 per 100,000 person-years observed among U.S. electrical workers during
1950-1988 (Loomis, et al., 1999). Similarly, the fatality rate among our cohort members for the
period 1980-1990 (18.33 per 100,000 person-years) was higher than the 13.8 and 11.6 per 100,000
workers in the construction industry in U.S and Australia respectively during 1988-1991 (Ore and
Stout, 1996) and also higher than the B.C. fatality rate of 12 per 100,000 person-years for all
industries combined during 1985-1994 (Howard, 1996)
There was a 38% decline in the rate of fatalities across the 41-year study period. The fatality rates
observed during 1950-1959 decreased by almost 50 % in the subsequent decade (29.58 and 15.37
deaths per 100,000 person-years respectively) and then they fluctuated only slightly during the last
two decades of the study. The same pattern has been reported by other investigators (Baker, et al.,
1992; Stout et al., 1996). Several reasons may account for the observed decline of fatality rates.
First, it may reflect the beneficial impact of safety policies implemented at the workplaces since
the late 1950's onwards. For example, in 1957 the WCB of B.C. made mandatory the use of
86
buoyancy equipment for workers exposed to risk of drowning. The regulation states : "The device
provided shall not be dependent upon manual manipulation to produce the buoyant effect" (WCB,
1966). This safety measure alone saved many lives among boom men. Before 1957, an average of
5 boom men drowned every year (WCB, 1970). It is noteworthy that, in our cohort, 27 % of all
deaths during 1950-1959 were due to drowning (3 coded as watercraft incidents and 1 as
drowning). There were no deaths from drowning during 1960-1969, one during 1970-1979 and
none during the last decade.
In 1966 new safety regulations included a revised and expanded section on personal protective
equipment, machine guards, and specific injury prevention strategies for sawmills. The right for a
worker's representative to accompany an inspector during workplace inspections, the need for the
company to have a joint management/labour safety committee and noise control regulations are a
few examples of the regulations implemented by the WCB of B.C during the 1970's. (Rest and
Ashford, 1992). Moreover, workers are now better informed about hazardous conditions on the job
and more conscious about safety measures, and employers are being held responsible for providing
safe workplaces (Wegman and Fine, 1990; Stout, et al., 1996).
The decline in fatality rates may also be related to the process of modernization of the mills
initiated in the 1960's and characterized by major technological changes that led to the automation
of several production stages (Government of British Columbia, 1972).
87

Personal characteristics
This study found that older sawmill workers were at higher risk of suffering a fatal injury at
work than younger workers. Our finding is consistent with other reports from U S A and
Canada, whether considering fatalities in all industries (Kisner and Pratt, 1997; Baker, et al.,
1992; Sniezek and Horiagon, 1989; Rossignol and Pineaud, 1993) or in particular industries
like construction or retail (Prat, et al., 1996; Peek-Asa, et al., 1999; Ore and Stout, 1996).
Injuries may have more severe consequences among older workers. Pre-existing diseases,
medication side effects, complications and infections could contribute to a poor prognosis in
older workers who have been injured (Doering, et al., 1983; Schiller, et al., 1995; De Maria
et al., 1987; Rossignol and Pineaud, 1993). Furthermore, a decline in visual acuity, hearing
and alertness contribute to a diminished ability to perceive and avoid hazards (Baker, et
al.,1982; Robertson, 1992; Salisbury, et al., 1991).
In our cohort, one worker of 56 years died while crossing the breezeway on his way to the
lunchroom; he didn't hear the straddle loader and was run over by it. Three workers over 55
years died as a result of injuries sustained from falling while doing maintenance work. The
most common type of incident among older workers was being struck by or against objects.
Two deaths were equipment-related, in one the contact was a forklift and in the other was a
case roll.
It seems that experience or seniority in the plant was not a factor for these fatalities, since
two of the 13 workers over 55 years were foremen and eleven had been employed for more
than 10 years in the mill. The small number of cases in this study preclude further analysis
88
for this group of workers but it concurs with other investigations in identifying older workers
as a high risk group for work-related deaths. The implications for prevention are that this
group needs to be given special consideration, especially since recent population projections
estimate that the population of Canadians aged 55-64 years is expected to increase 73% by
2016 and 76% by 2026 (Statistics Canada' Internet Site,2001).
Machine operators and mobile equipment operators were the occupational groups with the
highest crude fatality rates. Material handlers and clean up workers on the other hand, even
though they had the second largest number of fatalities, were at lower risk of suffering fatal
injuries compared to the rest of their coworkers. These findings were expected since the
physical environment in a sawmill is dominated by high-speed machinery, cutting blades,
and open conveyors transporting large and heavy logs from one machine to the next. In this
setting workers need to act fast and accurately to maintain a continuous production line
eliminating the flow disturbances as they arise and in the shortest time possible. Maintenance
work is often done during break time (e.g. lunch time) so that the production line is not
slowed down (Larsson, 1991). Not surprisingly workers were most frequently clearing
jammed logs or doing maintenance work when they were caught by a machinery or struck by
a falling object. The same activities at time of injury and mechanism of injury have been
reported by Larsson (1991) and Laflamme and Cloutier (1989) in their studies of non-fatal
injuries among sawmill workers in Sweden and Canada respectively. In contrast, Driscoll
(1995) reported that Australian sawmill workers were loading/unloading logs when they
were fatally injured.
89
Blood alcohol levels were above 0.08 mg% in only one case out of the 15 (0.06%) for whom test
results were available. Although it seems that alcohol was not a factor in the occurrence of fatal
injuries, conclusions are limited due to the small number of tests reported. However this result is
consistent with previous studies. Salisbury et al. (1991) reported that none of the fatalities among
B.C. loggers occurred as a consequence of alcohol consumption (only two tested positive and were
below 0.08 mg%, the legal limit for driving in Canada). Other studies on work-related fatalities in
all industries have similarly found that alcohol does not play a role in the occurrence of fatal
injuries at work. (Baker, et al., 1982; Copeland,1985; Shannon, et al.,1993; Parkinson, et al., 1986;
Sniezek and Horiagon,1989; Lewis and Cooper, 1989). Therefore the lack of testing for alcohol for
most of the deaths included in this study, may indicate that the Coroner in charge of the
investigation did not consider it relevant to the incident.
According to our results, a non significant increase in the risk of work-related injury deaths
was directly observed among workers with more seniority in current job. In contrast, it has
been reported that sawmill workers with less than 1 year in current job or in temporary job
assignment were more likely to suffer non-fatal injuries (Punnett, 1994) or have more severe
injuries (Cooke and Blumenstock, 1979). In our cohort, workers with less than 1 year of
employment were excluded so it was not possible to assess risk of injury specifically during
the first year of employment. In another industry, a direct relationship between seniority in
current job and risk of fatal injury at work was found in a cohort of electrical workers in
U.S.A. (Loomis, et al., 1999). Seniority has generally been interpreted as a measure of
experience in the job and increased fatality rates in new hired workers has been interpreted as
lack of experience or training. High fatality rates for workers with more than 2 years of
90
employment in their current job, can be the result of excessive confidence performing their
daily routine. It may also be possible that the occupational history data from company
records used to estimate seniority, did not always reflect the actual seniority in the current
job. For example, according to Coroner's records, 3 workers were replacing coworkers the
day of the incident but according to the company records these workers had been for more
than 2 years in their current job. It is possible that replacements or temporary assignment of
duties are decided on the shop floor but not recorded on personnel records because the
situation is only temporary. It is likely that workers performing non-routine tasks have not
received appropriate and complete training (Shannon, et al., 1993).
Environmental characteristics
The higher fatality rates observed among mills located in Vancouver Island and Coast Garibaldi
compared to the mills in the City of Vancouver and the interior of B.C., is consistent with the
pattern for injury deaths in the general population of B.C. for the period 1980-1990 (B.C. Ministry
of Health, 1997). The City of Vancouver had lower rate of deaths from injuries from all causes
than Vancouver Island. In the U.S. the highest fatality rates have been found in rural areas (Baker,
et al., 1992). In this study the fatality rate in Vancouver Island and Coast Garibaldi mills was
38% higher than the other two locations. Two of the mills on Vancouver Island (Tahsis and
Youbou) are located in small, isolated towns economically dependent on the mill. Rural/urban
differences in rates may reflect unequal access to medical treatment (Baker, et al., 1992).
The risk of sustaining a fatal injury seems to peak both at 6:00 am and 10:00 pm every day.
The highest proportion of deaths occurred between 2:00 am and 6:00 am which corresponds
91
to graveyard shift. The peak at 6:00 am may indicate fatigue for those who are finishing the
shift.
More workers died on Fridays and Mondays than on the other weekdays. Again, the role of
fatigue at the end of the week may explain the Friday peak. The higher frequency on
Mondays, also described among loggers, has been ascribed to a hangover effect from the
weekend (Salisbury, et al., 1991; Driscoll, et al., 1995). In our study, more deaths occurred
on Fridays than on Mondays which appears consistent with the lack of alcohol involvement
in these incidents.
September was the month peak for fatalities, followed by December. However there is no
apparent seasonal pattern. It may depend on monthly variations in production demands or be
the result of chance (Driscoll, et al., 1995).
In our study, a couple more workers died as a result of machinery-related injuries (33%) than
from being struck by objects (28%). Falls were the cause of death in 13% of the fatalities.
Four out of the five fatal falls occurred while the operators were working on elevated
surfaces that were not properly secured. Two workers stepped on insecure planks and fell.
One worker fell through a hole in the wire mesh platform where he was standing. Another
worker fell from a crane used as elevator, where he was standing on loose planks. Apparently
this was considered a normal procedure.
o
92
Environmental factors were identified as contributory causes in the majority of the fatal
incidents. The contributing factors were grouped into three categories for ease of illustration
but they are interrelated. Unsafe work station (e.g. insecure planks, hole in wire mesh
platform) was mentioned 14 times in the narrative of the fatalities studied.
Injury event characteristics
Factors related to the injury event, like equipment failure and unexpected starting of
equipment, was mentioned in 8 fatalities.
Eighty-three percent of the workers died within 24 hours of injury. The severity of the
injuries suffered seems to indicate that faster medical treatment or the use of personal
protective equipment would probably not have prevented these deaths (Driscoll, et al., 1995).
Over 80% of the deaths were caused by severe trauma to the head, spinal cord, or multiple
sites.
Limitations of the study derive from the fact that the sawmills enrolled in the study were those
willing to participate and they over-represent large plants. It has been reported that largest mills
have lower injury rates than smaller ones (Punnett, 1992). Thus, our estimates of fatality rates may
be conservative compared to the experience for the entire industry. Larger companies are more
likely than smaller companies to have resources available for safety improvements. Therefore,
while the results may apply to large companies, extrapolation to the whole industry (i.e. including
small mills) may be questionable.
Despite the large number of workers in our cohort, there was a small number of fatalities
from work-related injuries and this precluded further analysis (e.g. by specific external cause
of death) of the cases, and limited the statistical precision of the estimates. Another limitation
is that a number of factors studied were not consistently recorded by the BCCS; it was not
possible to assess their impact on the occurrence of fatal injuries at the workplace.
Summary
Our results suggest that machine operators/clearers/sorters, over 35 years with more than 2 years of
experience in their current job were at highest risk of suffering a fatal injury at work. Most
frequently workers handling materials, clearing jammed logs or doing maintenance work were
caught by machinery or struck by falling objects.
Of greatest importance in the analysis of the various factors related to the fatal incident, are
the recommendations of the Coroner's jury because they unveil some contributing factors
which i f corrected may prevent reoccurrence of similar deaths. The majority of the
recommendations pointed at factors related to the physical environment of the mill (e.g.
unsafe work station, equipment) as well as organizational factors (e.g. company safety
policies, training).
From a practical point of view, the findings of this study are useful because they provide
further evidence that injury control strategies directed at correcting the environment could
have effectively prevented unnecessary deaths among these workers. Unsafe work-stations,
defective equipment, inadvertent start of equipment, are all modifiable by adherence to safety
94

regulations and most effectively by engineering control. Insufficient training or instructions
are dependent on the company commitment to provide a safe work environment. Poor
practices can be reduced if safety is valued more than production by both management and
labour.
The traditional approach to the control of injuries at the workplace has mainly focused on
changing the worker's behaviour (Kraus and Robertson, 1992). However, it has been
recognized that the reduction of occupational injuries has been achieved mainly by
eliminating high-risk tasks, changing procedures to make them less hazardous, imposing
physical barriers between workers and equipment and installing fail-safe devices and
secondarily by education on safety regulations (Haddon and Baker, 1981).
95

CHAPTER SIX
6.0 All fatal injuries among sawmill workers, 1950-1990
6.1 Introduction
Injuries are a major national public health problem because they are associated with a significant
burden of morbidity and mortality and consume substantial proportions of health expenditures
(Wigle, et al., 1991; Millar, 1995; Baker, et al., 1992). Injury is the leading cause of death for
Canadians between 1 and 44 years and the fourth cause of death among all age groups, after
cardiovascular, cancer and respiratory diseases (Riley and Paddon, 1990). Direct and indirect costs
associated with injuries in Canada were estimated at over $11 billion in 1986 (Wigle, et al. 1991).
The impact of injury mortality in society can be illustrated by the number of potential years of life
lost (PYLL) by those who died before the expected age for the general population. Unintentional
injuries are the leading cause of P Y L L before age 65 (MacWilliam and Fortier, 1987). In 1985
injuries caused 219,641 P Y L L in Canada (22.3% of all P Y L L ) . Cancer and cardiovascular ranked
second and third in the count of P Y L L for that same year (19% and 14% respectively).
Compared to other industrial workers, forestry workers are at a higher risk of injuries at the
workplace. Forestry based industries have the second highest fatality rate in Canada (Labour
Canada, 1990). In British Columbia (B.C.), during the ten-year period from 1990 to 1999, 42
sawmill workers died from injuries sustained at the workplace, outnumbered only by loggers
(WCB of B C , 2000). This would explain why most of the limited literature on injuries among
sawmill workers has focused on work-related incidents.
96
Much less is known about mortality in this workforce from injuries sustained in other settings. Few
studies analyzing overall mortality among forestry workers in general, have reported a higher
mortality rate from unintentional injuries and suicides compared to the general population
(Notkola, et a l , 1993; Green, 1991). In these studies the investigators combined different types of
injuries in two groups, all unintentional injuries (e.g. transportation-related, falls, drowning, etc.)
and suicide. This crude categorization does not allow the detection of increases in specific causes.
A mortality analysis by broad categories hinders the understanding of the different contributory
factors related to specific types of injury that, once recognized, should help plan preventive
interventions.
The availability of the British Columbia Sawmill Workers Cohort (BCSWC) database (Hertzman,
et al., 1997), provided us the unique opportunity to fully characterize the trend and pattern of both
on-the-job and off-the-job mortality from specific injury types in this workforce, filling some of
the gaps in the published literature. Work-related injuries were analyzed in chapter 5. This chapter
analyses all fatal injuries that occurred in a cohort of over 26,000 sawmill workers from 1950 to
1990.
The 40 work-related deaths in the cohort were included in this analysis for the following reasons:
1) the injury specific standardized mortality ratios identify the type of injuries with relative excess
or deficit compared to the general population, 2) it makes the study comparable with studies of
overall injury mortality in other workforces, 3) work-related injuries are easily identifiable and are
not mixed with the causes analyzed in more detail.
97

The objective of this study was to examine mortality from selected external causes among
sawmill workers between 1950 and 1990 in terms of:
a) characterizing the pattern and trend of mortality from selected external causes (motor vehicle-related, falls, drowning, machinery-related and suicide).
b) estimating the risk of mortality from external causes.
c) comparing injury mortality from external causes in the sawmill cohort with that of the male population of British Columbia.
d) assessing the relationship between age, seniority in mill and calendar period, and the risk of mortality from motor vehicle crashes and suicide.
e) comparing injury mortality from motor vehicle crashes and suicide among subcohorts defined according to occupational categories.
6.2 Methods
6.2.1 BC Sawmill Workers Cohort
The original B.C. Sawmill workers cohort included 26,487 workers who were employed for at
least 1 year cumulative service in any of the 14 study sawmills between January 1st, 1950 and
December 31 s t, 1985. Workers employed on a casual basis or any other non-permanent plan, were
required to work a minimum of 260 days to qualify for membership. A l l cohort members are men.
No women were included due to small numbers. The number of workers in this study (n=26,411)
differs slightly from the number analyzed in the original study as a result of data cleaning and
compilation for this study.
98
Fourteen sawmills were selected to participate in the investigation based on the use of
chlorophenate fungicides, completeness of company records, and willingness to participate. Eleven
mills were located in the coast and three in the interior of B.C. Most of the mills are situated in
cities or towns built by mill companies for exploitation of the local forests (Demers, 1998b). Some
of these towns have evolved into large urban areas where the mills are no longer the sole source of
employment (e.g. Vancouver Lower Mainland), and some remain as forest-based communities
(e.g. Squamish, Tahsis, Youbou). Two of the six mills located on Vancouver Island are very
special from the point of view of their geographic and socio-cultural characteristics : Tahsis and
Youbou. They may be described as isolated single industry-towns where the mill is the only source
of employment for the community. In the interior of B.C. there are three mills, one in the city of
Kelowna, at 400 kilometers east of Vancouver, and two mills in the town of Mackenzie which is at
750 kilometers east of Vancouver and 190 Km. north of Prince George, the closest urban centre.
The location of the mills and their classification by region is shown in Appendix A .
The cohort was folio wed-up until the end of 1990 and several sources were consulted for
vital status ascertainment. The list of personal identifiers was linked by means of
probabilistic record linkage methods to the death files of both the Vital Statistics Division of
British Columbia and the Canadian Mortality Database. Secondary sources of ascertainment
like pension plan, union, motor vehicle records and income tax records were consulted as
well. As a result of these procedures, vital status was determined for 85.7% of the cohort
members. Given the linkages with the two death databases and the income tax file, it seems
highly unlikely that a significant proportion of the 3,791 workers for whom no vital status
was confirmed were dead.
99
6.2.2 Cause of death - International Classification of Diseases
The Division of Vital Statistics of British Columbia provided the underlying cause of death
coded according to the International Classification of Diseases (WHO, 1977) codes in effect
at the year of the death. The B.C. sawmill workers study spanned four decades and four
revisions of the International Classification of Diseases. For this study, a reconciliation
scheme devised by researchers from the British Columbia Cancer Agency was used
(Appendix D). A total of 26 categories were used to identify deaths due to external causes
(E800-E999).
6.2.3 British Columbia Coroner's Office files
Information on the circumstances prior to or concurrent with the fatal incident was sought
from the Coroner's Office. According to the B.C. Coroner's Act all sudden, unexpected
deaths, are cases requiring investigation regarding the causes of death, the identification of
the deceased and the place of death. The coroner's files contain the investigation reports and
may include autopsy reports, police reports, Workers' Compensation Board reports and other
information relevant to the fatal injury.
A list with the names of the cohort members who died from external causes between 1950 and
1990 was produced. This roll was matched to the Coroner's records to retrieve the relevant
investigation reports.
100
Data on factors related to the individual, the environment and the injury event abstracted from the
BCCS files were recorded on forms designed specially for this study.
6.2.4 Occupational categories
Workers were grouped into 4 broad categories considered to be relatively similar with
respect to skill level required for job duties. Every worker was assigned to one occupational
category according to the level of skill required in the current job (i.e. the one held at the
moment of the injury event). The five categories (including an unclassifiable category) are:
1) Clerical, 2) Unskilled labour, 3) Skilled labour, 4) Maintenance, and 5) Unclassifiable.
This scheme was developed by Aleck Ostry, with ample experience in this industrial sector,
and has been used previously in this cohort (Ostry, et al., 2000). We adapted the original
version of the classification by including the group "supervisor" in the category of "skilled
labour". The purpose of using this skill-based classification was to categorize workers into
groups that could reflect socio-economic differences (e.g. maintenance workers have higher
salary and education than unskilled workers) that may affect the risk of fatal injuries.
6.2.5 Data Analysis
Standardized Mortality Ratios (SMRs) were computed with indirect standardization (Hill,
1972). Expected numbers of deaths for the cohort members were calculated by applying age,
sex, and calendar-specific cause of death rates for the British Columbia male population for
the period 1950-1990, to the age, sex, and calendar-specific number of years of person-years
contributed by the sawmill workers during the same period. Follow-up began January 1,
1950, for workers with one or more years of experience at that date. Follow-up began on the
date of accruing 1 year of employment for all other workers. SMRs for all causes of deaths
were calculated counting person-years at risk up to the date last observed and also up to the
end of the study period (December 31 s t., 1990) to present both the least and the most
conservative estimates.
SMRs for injury mortality were calculated counting person years at risk either until the death
date or up to 30 days after the date of termination from the mill whichever was earlier. This
criterion was adopted to reduce the probability of counting deaths that may have occurred in
other jobs, but also to avoid missing deaths that may have occurred as late effects or
complications of injuries sustained while employed at a sawmill.
Internal cohort analyses were carried out for two purposes: 1) to identify the job categories at
highest risk of death from motor vehicle related injuries and suicide; and 2) to characterize
the association between age, calendar period, region and seniority in the mill, and the risk of
mortality from motor vehicle crashes and suicide. Rate ratio estimates were calculated using
a multiplicative regression model ( Breslow and Day, 1987; Pearce, et al., 1988). The
Poisson regression model for a rate ratio can be formulated as
D/Do = exp ( b l X l + b2X2+.. .+bjXj)
where D is the incidence rate for persons with specific values of X I , X2, .. . ,Xj , and Do is
the baseline or reference incidence rate. The outcome variables analyzed were mortality from
motor vehicle-related injuries and suicide. The independent variables were age, calendar,
region of work-site, and seniority in the mill (i.e. length of employment in the mill). A l l these
102
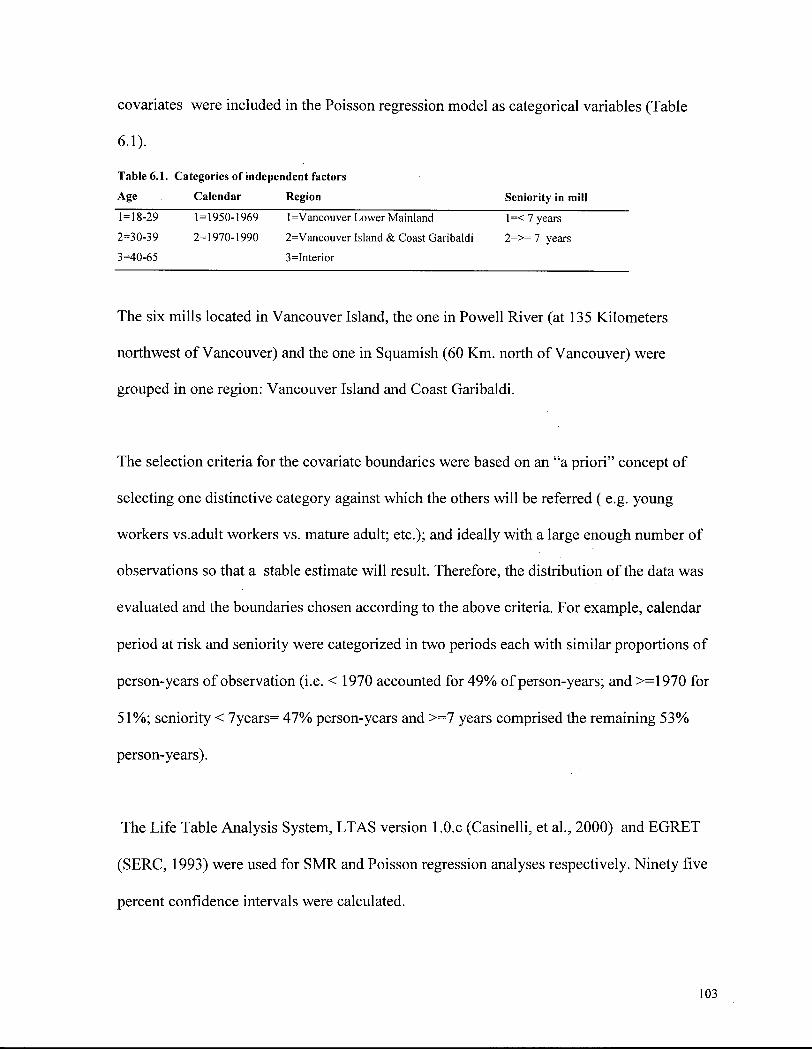
covariates were included in the Poisson regression model as categorical variables (Table
6.1).
Table 6.1. Categories of independent factors
Age Calendar Region Seniority in mill
1=18-29 1=1950-1969 1= Vancouver Lower Mainland l=<7years
2=30-39 2=1970-1990 2=Vancouver Island & Coast Garibaldi 2=>= 7 years
3=40-65 3=Interior
The six mills located in Vancouver Island, the one in Powell River (at 135 Kilometers
northwest of Vancouver) and the one in Squamish (60 Km. north of Vancouver) were
grouped in one region: Vancouver Island and Coast Garibaldi.
The selection criteria for the covariate boundaries were based on an "a priori" concept of
selecting one distinctive category against which the others will be referred ( e.g. young
workers vs.adult workers vs. mature adult; etc.); and ideally with a large enough number of
observations so that a stable estimate will result. Therefore, the distribution of the data was
evaluated and the boundaries chosen according to the above criteria. For example, calendar
period at risk and seniority were categorized in two periods each with similar proportions of
person-years of observation (i.e. < 1970 accounted for 49% of person-years; and >=1970 for
51%; seniority < 7years= 47% person-years and >=7 years comprised the remaining 53%
person-years).
The Life Table Analysis System, LTAS version 1.0.c (Casinelli, et al., 2000) and EGRET
(SERC, 1993) were used for SMR and Poisson regression analyses respectively. Ninety five
percent confidence intervals were calculated.
103
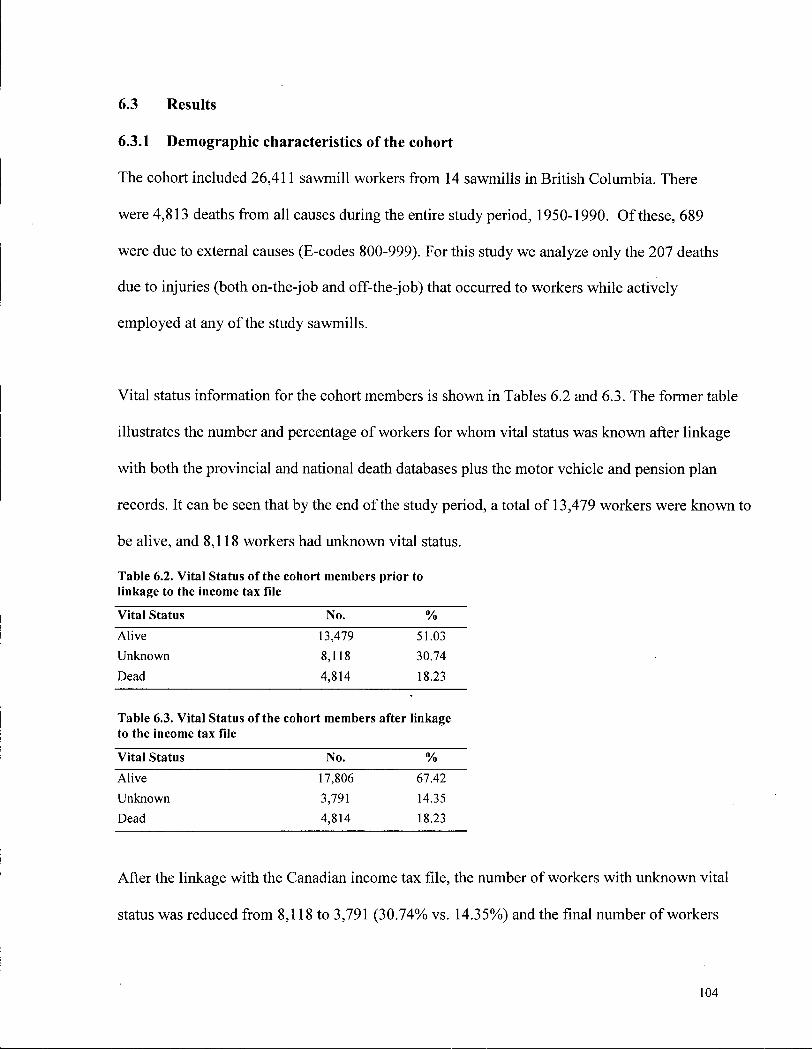
6.3 Results
6.3.1 Demographic characteristics of the cohort
The cohort included 26,411 sawmill workers from 14 sawmills in British Columbia. There
were 4,813 deaths from all causes during the entire study period, 1950-1990. Of these, 689
were due to external causes (E-codes 800-999). For this study we analyze only the 207 deaths
due to injuries (both on-the-job and off-the-job) that occurred to workers while actively
employed at any of the study sawmills.
Vital status information for the cohort members is shown in Tables 6.2 and 6.3. The former table
illustrates the number and percentage of workers for whom vital status was known after linkage
with both the provincial and national death databases plus the motor vehicle and pension plan
records. It can be seen that by the end of the study period, a total of 13,479 workers were known to
be alive, and 8,118 workers had unknown vital status.
Table 6.2. Vital Status of the cohort members prior to linkage to the income tax file
Vital Status No. %
Alive 13,479 51.03 Unknown 8,118 30.74
Dead 4,814 18.23
Table 6.3. Vital Status of the cohort members after linkage to the income tax file
Vital Status No. %
Alive 17,806 67.42
Unknown 3,791 14.35
Dead 4,814 18.23
After the linkage with the Canadian income tax file, the number of workers with unknown vital
status was reduced from 8,118 to 3,791 (30.74% vs. 14.35%) and the final number of workers
104
known to be alive by the end of follow-up, was 17,806 (Table 6.3). Thus, vital status was
determined for 85.6% of the cohort. Given that the data were linked with the two mortality data
sets (provincial and national) and the income tax files, it can be assumed that the likelihood of any
of the workers with unknown vital status being dead is very low, provided that we had accurate
personal identifying information.
Demographic characteristics of the sawmill workers are presented in Table 6.4. The average
worker was 27 years old when he started working at a mill. The mean length of employment
was 10.4 years and 50% of the workers died at or before age 68. Among the 207 workers
who died from injuries, the average age at death was 38 years.
Table 6.4. Characteristics of the cohort of 26,411 sawmill workers 207 workers dead from injuries
Mean Median Range Mean Median Range
Age at hire 27 24 10 75 27 23 15 55 Year of birth 1935 1938 1877 1968 1933 1934 1890 1964 Length of employment 10.4 5.8 1 52 8.7 6.8 1 29.2 Age at death 66 68 18 102 38 37 18 65
Over 60% of the workers in this cohort worked and lived in the Vancouver Island and Coast
Garibaldi region. (Table 6.5).
Table 6.5. Location of mills and number of workers in each region
Region No. mills No. workers
%
Vancouver 3 7,449 28.20
Vancouver Island and Coast 8 16,313 61.77
Interior 3 2,649 10.03
6.3.2 Overview of mortality
Table 6.6 shows standardized mortality ratios (SMRs) for selected causes and all causes
combined calculated for the original cohort study.
105
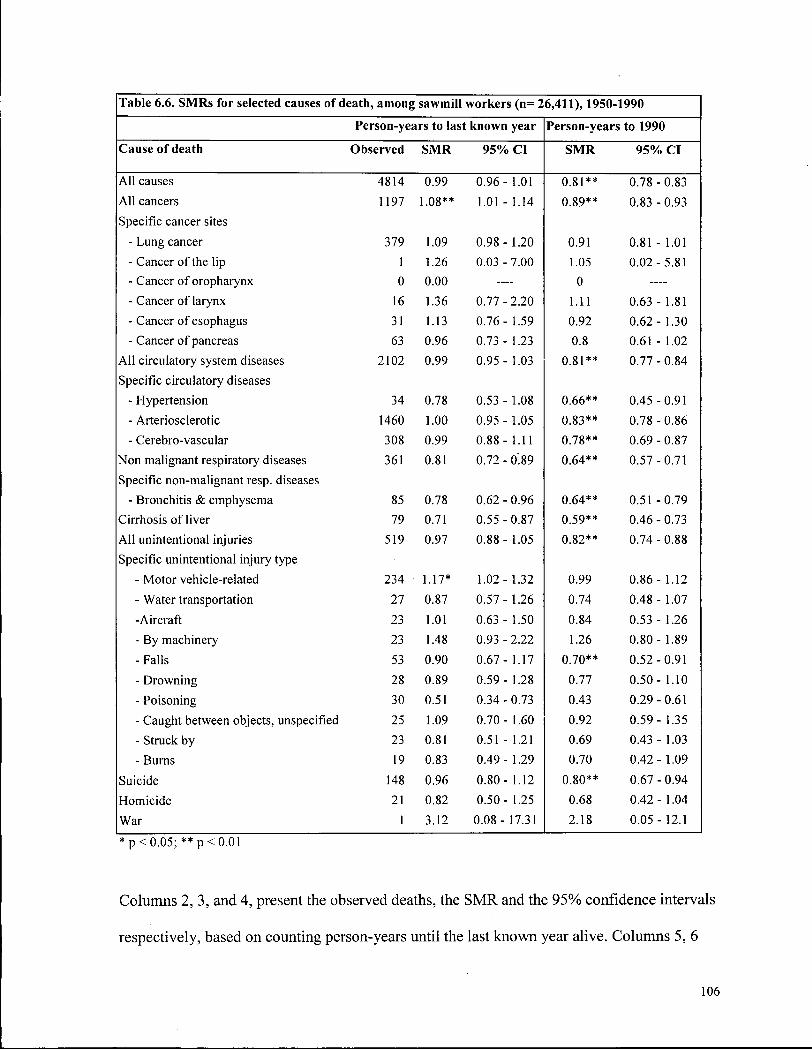
Table 6.6. SMRs for selected causes of death, among sawmill workers (n= 26,411), 1950-1990
Person-years to last known year Person-years to 1990
Cause of death Observed SMR 95% CI SMR 95% CI
All causes 4814 0.99 0.96-1.01 0.81** 0.78 - 0.83 All cancers 1197 1.08** 1.01 - 1.14 0.89** 0.83 - 0.93 Specific cancer sites
- Lung cancer 379 1.09 0.98-1.20 0.91 0.81 - 1.01 - Cancer of the lip 1 1.26 0.03 - 7.00 1.05 0.02- 5.81 - Cancer of oropharynx 0 0.00 — 0 — -- Cancer of larynx 16 1.36 0.77-2.20 1.11 0.63 - 1.81 - Cancer of esophagus 31 1.13 0.76- 1.59 0.92 0.62- 1.30 - Cancer of pancreas 63 0.96 0.73 - 1.23 0.8 0.61 - 1.02
All circulatory system diseases 2102 0.99 0.95 - 1.03 0.81** 0.77- 0.84 Specific circulatory diseases
- Hypertension 34 0.78 0.53 - 1.08 0.66** 0.45 - 0.91 - Arteriosclerotic 1460 1.00 0.95 - 1.05 0.83** 0.78 - 0.86 - Cerebro-vascular 308 0.99 0.88- 1.11 0.78** 0.69- 0.87
Non malignant respiratory diseases 361 0.81 0.72 - 0.89 0.64** 0.57- 0.71 Specific non-malignant resp. diseases
- Bronchitis & emphysema 85 0.78 0.62 - 0.96 0.64** 0.51 - 0.79 Cirrhosis of liver 79 0.71 0.55-0.87 0.59** 0.46- 0.73 All unintentional injuries 519 0.97 0.88- 1.05 0.82** 0.74- 0.88 Specific unintentional injury type
- Motor vehicle-related 234 1.17* 1.02- 1.32 0.99 0.86- 1.12
- Water transportation 27 0.87 . 0.57-1.26 0.74 0.48 - 1.07
-Aircraft 23 1.01 0.63 - 1.50 0.84 0.53 - 1.26 - By machinery 23 1.48 0.93 - 2.22 1.26 0.80- 1.89
- Falls 53 0.90 0.67-1.17 0.70** 0.52- 0.91
- Drowning 28 0.89 0.59- 1.28 0.77 0.50- 1.10
- Poisoning 30 0.51 0.34-0.73 0.43 0.29- 0.61
- Caught between objects, unspecified 25 1.09 0.70-1.60 0.92 0.59- 1.35
- Struck by 23 0.81 0.51 - 1.21 0.69 0.43 - 1.03
- Burns 19 0.83 0.49-1.29 0.70 0.42- 1.09
Suicide 148 0.96 0.80-1.12 0.80** 0.67- 0.94
Homicide 21 0.82 0.50- 1.25 0.68 0.42- 1.04
War 1 3.12 0.08-17.31 2.18 0.05 - 12.1
*p<0.05;**p<0.01
Columns 2, 3, and 4, present the observed deaths, the SMR and the 95% confidence intervals
respectively, based on counting person-years until the last known year alive. Columns 5, 6
106
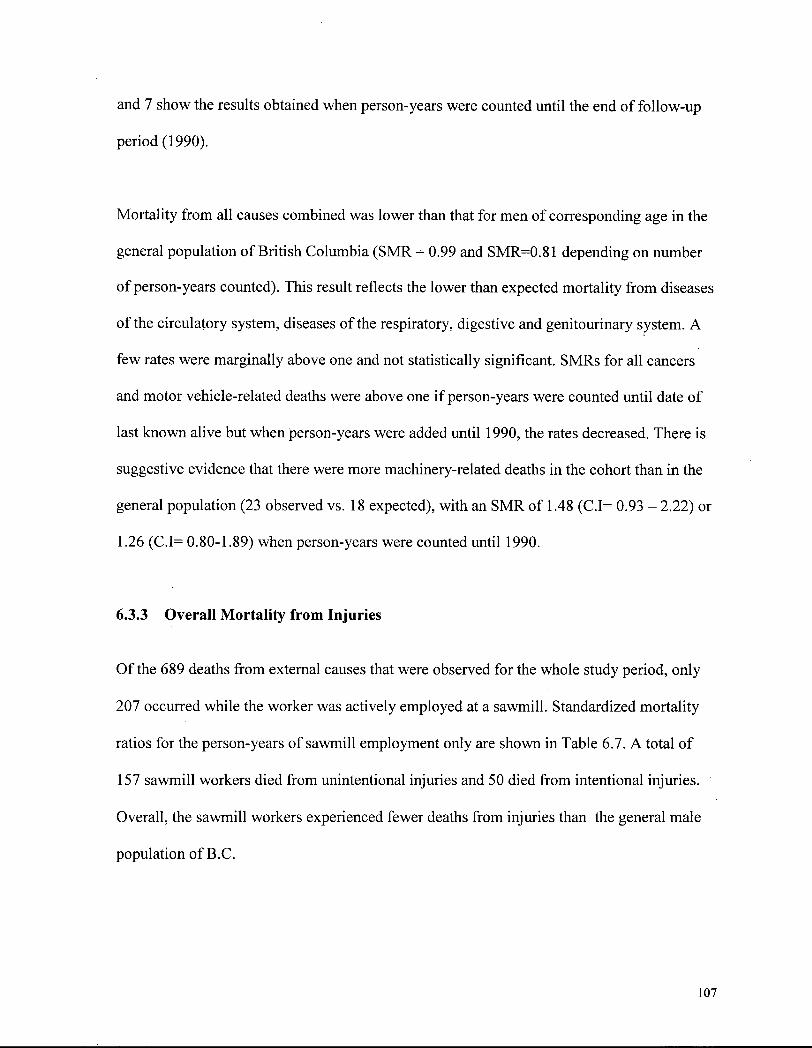
and 7 show the results obtained when person-years were counted until the end of follow-up
period (1990).
Mortality from all causes combined was lower than that for men of corresponding age in the
general population of British Columbia (SMR = 0.99 and SMR=0.81 depending on number
of person-years counted). This result reflects the lower than expected mortality from diseases
of the circulatory system, diseases of the respiratory, digestive and genitourinary system. A
few rates were marginally above one and not statistically significant. SMRs for all cancers
and motor vehicle-related deaths were above one if person-years were counted until date of
last known alive but when person-years were added until 1990, the rates decreased. There is
suggestive evidence that there were more machinery-related deaths in the cohort than in the
general population (23 observed vs. 18 expected), with an SMR of 1.48 (C.I= 0.93 - 2.22) or
1.26 (C.I= 0.80-1.89) when person-years were counted until 1990.
6.3.3 Overall Mortality from Injuries
Of the 689 deaths from external causes that were observed for the whole study period, only
207 occurred while the worker was actively employed at a sawmill. Standardized mortality
ratios for the person-years of sawmill employment only are shown in Table 6.7. A total of
157 sawmill workers died from unintentional injuries and 50 died from intentional injuries.
Overall, the sawmill workers experienced fewer deaths from injuries than the general male
population of B.C.
107
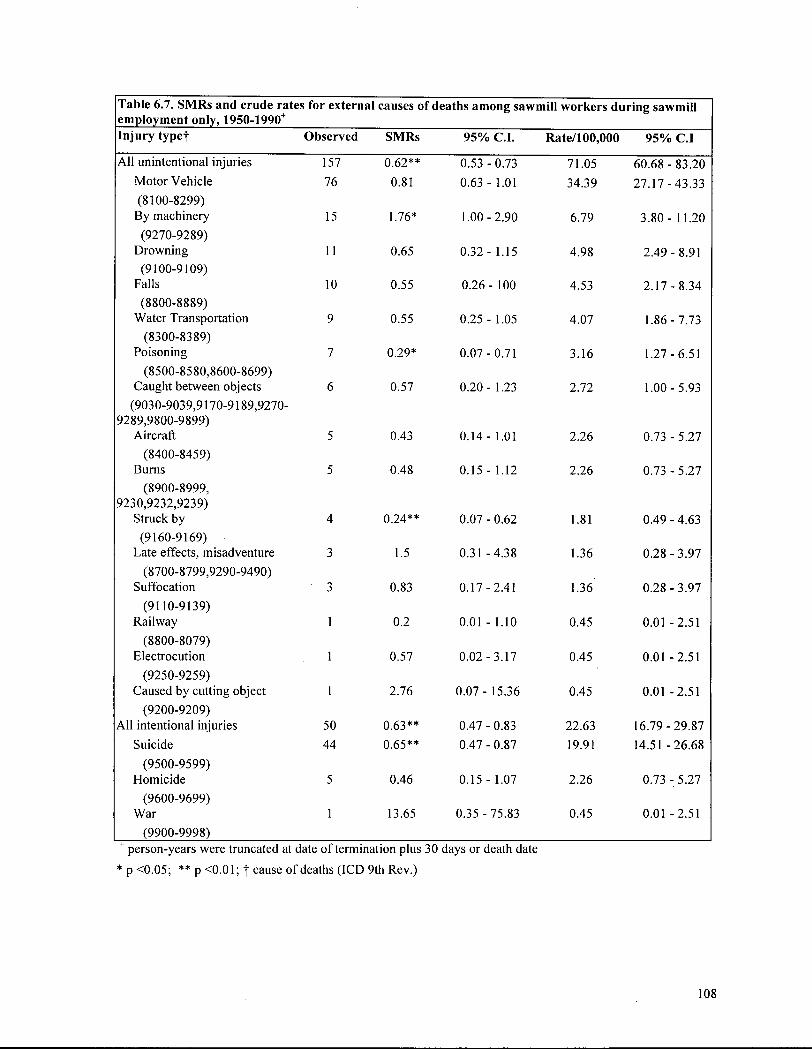
Table 6.7. SMRs and crude rates for external causes of deaths among sawmill workers during sawmill employment only, 1950-1990+
Injury typef Observed SMRs 95% C.I. Rate/100,000 95% C.I
All unintentional injuries 157 0.62** 0.53 - 0.73 71.05 60.68 - 83.20 Motor Vehicle 76 0.81 0.63 - 1.01 34.39 27.17-43.33 (8100-8299)
By machinery 15 1.76* 1.00-2.90 6.79 3.80-11.20 (9270-9289)
Drowning 11 0.65 0.32- 1.15 4.98 2.49-8.91 (9100-9109)
Falls 10 0.55 0.26 - 100 4.53 2.17-8.34 (8800-8889)
Water Transportation 9 0.55 0.25 - 1.05 4.07 1.86-7.73 (8300-8389)
Poisoning 7 0.29* 0.07-0.71 3.16 1.27-6.51 (8500-8580,8600-8699)
Caught between objects 6 0.57 0.20- 1.23 2.72 1.00-5.93 (9030-9039,9170-9189,9270-
9289,9800-9899) Aircraft 5 0.43 0.14 - 1.01 2.26 0.73 - 5.27
(8400-8459) Burns 5 0.48 0.15 - 1.12 2.26 0.73-5.27
(8900-8999, 9230,9232,9239)
Struck by 4 0.24** 0.07 - 0.62 1.81 0.49-4.63 (9160-9169)
Late effects, misadventure 3 1.5 0.31 -4.38 1.36 0.28-3.97 (8700-8799,9290-9490)
Suffocation 3 0.83 0.17-2.41 1.36 0.28-3.97 (9110-9139)
Railway 1 0.2 0.01 - 1.10 0.45 0.01 -2.51 (8800-8079)
Electrocution 1 0.57 0.02-3.17 0.45 0.01-2.51 (9250-9259)
Caused by cutting object 1 2.76 0.07-15.36 0.45 0.01 -2.51 (9200-9209)
All intentional injuries 50 0.63** 0.47 - 0.83 22.63 16.79-29.87 Suicide 44 0.65** 0.47 - 0.87 19.91 14.51-26.68
(9500-9599) Homicide 5 0.46 0.15 - 1.07 2.26 0.73 -5.27
(9600-9699) War 1 13.65 0.35 - 75.83 0.45 0.01-2.51
(9900-9998) + person-years were truncated at date of termination plus 30 days or death date
* p O.05; ** p <0.01; f cause of deaths (ICD 9th Rev.)
108
There have been fewer than expected deaths from motor vehicle-related injuries, falls,
drowning and poisoning which are the major causes of fatal injury. However, a statistically
significant increased number of machinery-related deaths was observed in this cohort. (15
observed versus 8 expected). There were a couple of other SMRs above one but they were
based on small number of cases (Late effects of injury, 3 deaths and SMR=1.5; and caused
by cutting object, 1 death and SMR=2.76).
The second last column of Table 6.7 presents sawmill workers' absolute risk of dying from
injuries. The highest mortality rate from unintentional injuries was observed for motor
vehicle-related injuries followed by machinery related and drowning. Motor vehicle injuries
accounted for almost 50 % of all unintentional fatal injuries. The second largest proportion of
deaths (10%), resulted from machinery-related injuries. However, when all deaths due to
external causes (unintentional and intentional) are considered, the first cause of death was
motor vehicle crashes and the second, suicide.
6.3.4 Motor Vehicle Crashes
Seventy-six workers lost their lives in motor vehicle crashes. Records for 61 such deaths (80%)
were found at the Coroner's Office. The degree of detail in the narrative of the circumstances of
the fatal event varied from record to record, and this resulted in different counts for the variables
described here.
Motor vehicle crashes account for most of the deaths from external causes. The relative
impact of this type of event varies across the life span. Table 6.8 shows that among the
109
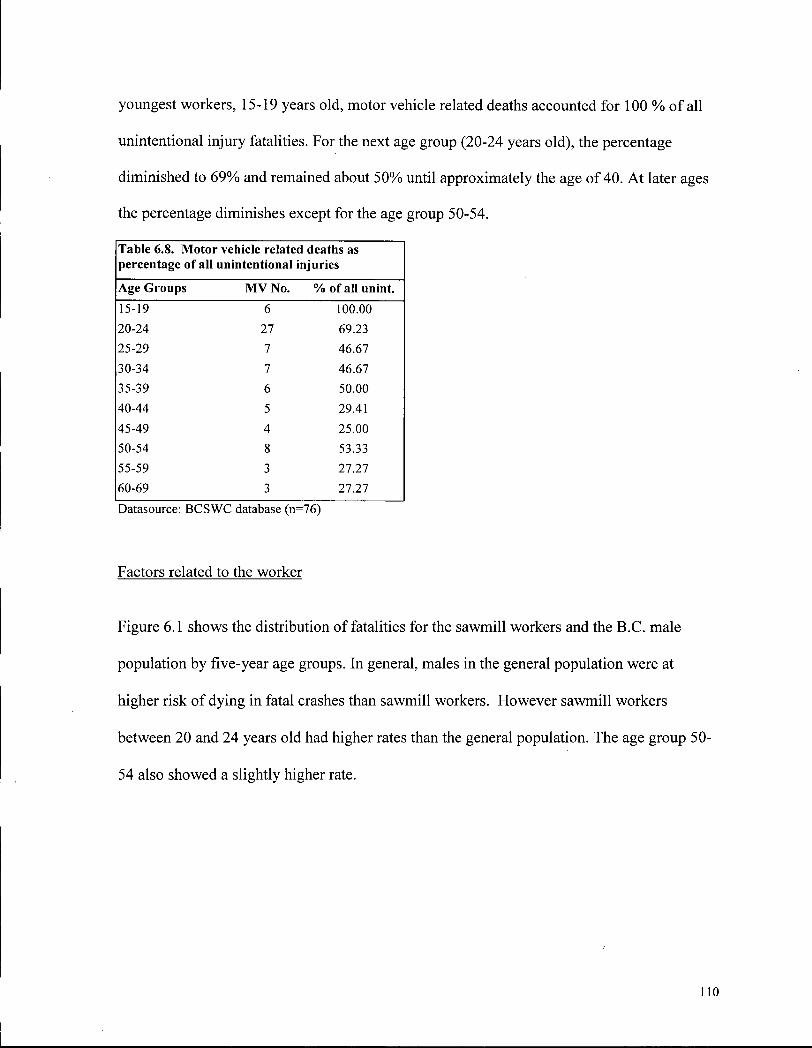
youngest workers, 15-19 years old, motor vehicle related deaths accounted for 100 % of all
unintentional injury fatalities. For the next age group (20-24 years old), the percentage
diminished to 69% and remained about 50% until approximately the age of 40. At later ages
the percentage diminishes except for the age group 50-54.
Table 6.8. Motor vehicle related deaths as percentage of all unintentional injuries
Age Groups MV No. % of all unint.
15-19 6 100.00 20-24 27 69.23 25-29 7 46.67 30-34 7 46.67 35-39 6 50.00 40-44 5 29.41
45-49 4 25.00 50-54 8 53.33 55-59 3 27.27 60-69 3 27.27
Datasource: BCSWC database (n=76)
Factors related to the worker
Figure 6.1 shows the distribution of fatalities for the sawmill workers and the B.C. male
population by five-year age groups. In general, males in the general population were at
higher risk of dying in fatal crashes than sawmill workers. However sawmill workers
between 20 and 24 years old had higher rates than the general population. The age group 50-
54 also showed a slightly higher rate.
110
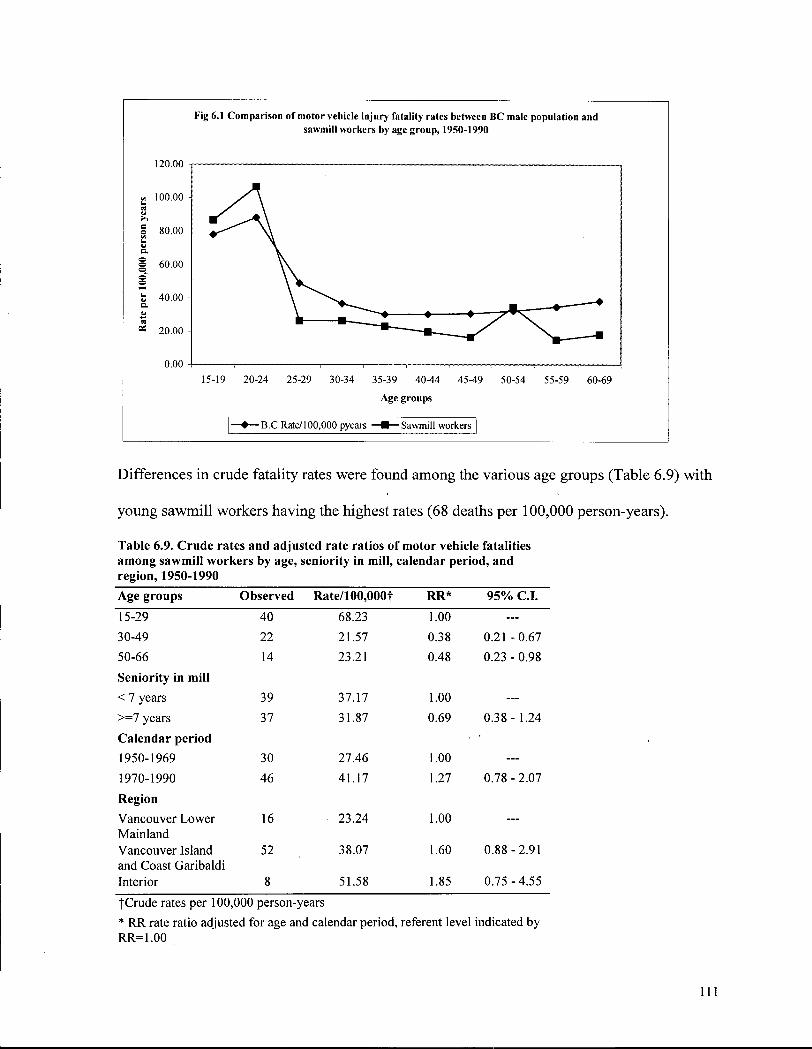
Fig 6.1 Comparison of motor vehicle injury fatality rates between BC male population and sawmill workers by age group, 1950-1990
120.00 1
0.00 -I 1 1 1 1 , 1 , , 1 15-19 20-24 25-29 30-34 35-39 40-44 45-49 50-54 55-59 60-69
Age groups
— • — B C Rate/100,000 pyears —•—Sawmill workers I
Differences in crude fatality rates were found among the various age groups (Table 6.9) with
young sawmill workers having the highest rates (68 deaths per 100,000 person-years).
Table 6.9. Crude rates and adjusted rate ratios of motor vehicle fatalities among sawmill workers by age, seniority in mill, calendar period, and region, 1950-1990
Age groups Observed Rate/100,000f RR* 95% C.I.
15-29 40 68.23 1.00 — 30-49 22 21.57 0.38 0.21-0.67 50-66 14 23.21 0.48 0.23 - 0.98
Seniority in mill
< 7 years 39 37.17 1.00 — >=7 years 37 31.87 0.69 0.38-1.24
Calendar period
1950-1969 30 27.46 1.00 — 1970-1990 46 41.17 1.27 0.78 - 2.07
Region Vancouver Lower 16 23.24 1.00 — Mainland Vancouver Island 52 38.07 1.60 0.88-2.91 and Coast Garibaldi Interior 8 51.58 1.85 0.75-4.55
•fCrude rates per 100,000 person-years * RR rate ratio adjusted for age and calendar period, referent level indicated by RR=1.00
111
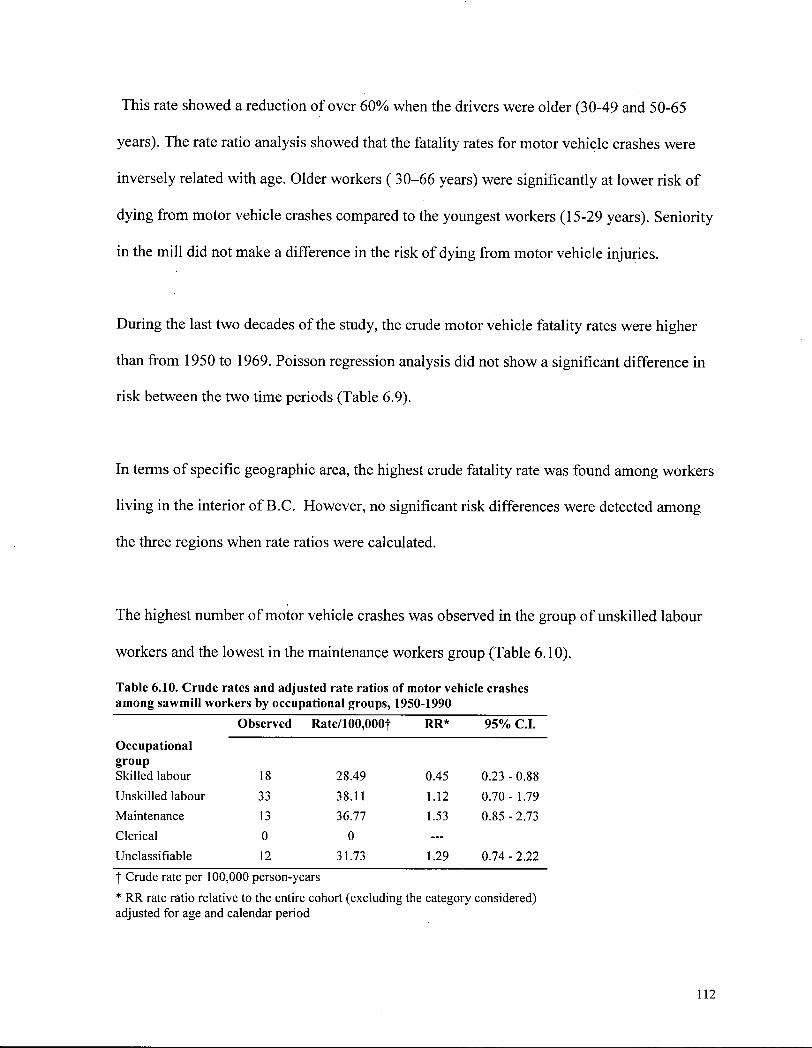
This rate showed a reduction of over 60% when the drivers were older (30-49 and 50-65
years). The rate ratio analysis showed that the fatality rates for motor vehicle crashes were
inversely related with age. Older workers ( 30-66 years) were significantly at lower risk of
dying from motor vehicle crashes compared to the youngest workers (15-29 years). Seniority
in the mill did not make a difference in the risk of dying from motor vehicle injuries.
During the last two decades of the study, the crude motor vehicle fatality rates were higher
than from 1950 to 1969. Poisson regression analysis did not show a significant difference in
risk between the two time periods (Table 6.9).
In terms of specific geographic area, the highest crude fatality rate was found among workers
living in the interior of B.C. However, no significant risk differences were detected among
the three regions when rate ratios were calculated.
The highest number of motor vehicle crashes was observed in the group of unskilled labour
workers and the lowest in the maintenance workers group (Table 6.10).
Table 6.10. Crude rates and adjusted rate ratios of motor vehicle crashes among sawmill workers by occupational groups, 1950-1990
Observed Rate/100,000f RR* 95% C.I.
Occupational group Skilled labour 18 28.49 0.45 0.23-0.88 Unskilled labour 33 38.11 1.12 0.70- 1.79 Maintenance 13 36.77 1.53 0.85-2.73 Clerical 0 0 — Unclassifiable 12 31.73 1.29 0.74 - 2.22
t Crude rate per 100,000 person-years
* RR rate ratio relative to the entire cohort (excluding the category considered) adjusted for age and calendar period
112
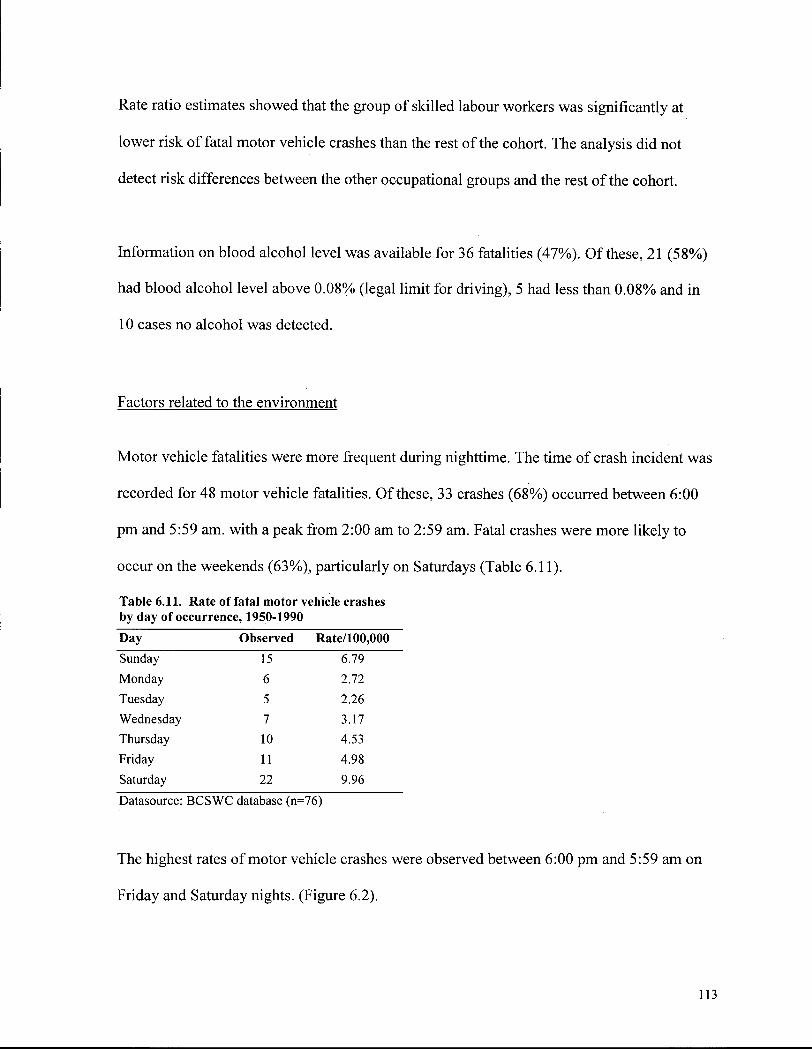
Rate ratio estimates showed that the group of skilled labour workers was significantly at
lower risk of fatal motor vehicle crashes than the rest of the cohort. The analysis did not
detect risk differences between the other occupational groups and the rest of the cohort.
Information on blood alcohol level was available for 36 fatalities (47%). Of these, 21 (58%)
had blood alcohol level above 0.08% (legal limit for driving), 5 had less than 0.08% and in
10 cases no alcohol was detected.
Factors related to the environment
Motor vehicle fatalities were more frequent during nighttime. The time of crash incident was
recorded for 48 motor vehicle fatalities. Of these, 33 crashes (68%) occurred between 6:00
pm and 5:59 am. with a peak from 2:00 am to 2:59 am. Fatal crashes were more likely to
occur on the weekends (63%), particularly on Saturdays (Table 6.11).
Table 6.11. Rate of fatal motor vehicle crashes by day of occurrence, 1950-1990
Day Observed Rate/100,000
Sunday 15 6.79
Monday 6 2.72
Tuesday 5 2.26
Wednesday 7 3.17
Thursday 10 4.53
Friday 11 4.98
Saturday 22 9.96
Datasource: BCSWC database (n=76)
The highest rates of motor vehicle crashes were observed between 6:00 pm and 5:59 am on
Friday and Saturday nights. (Figure 6.2).
113
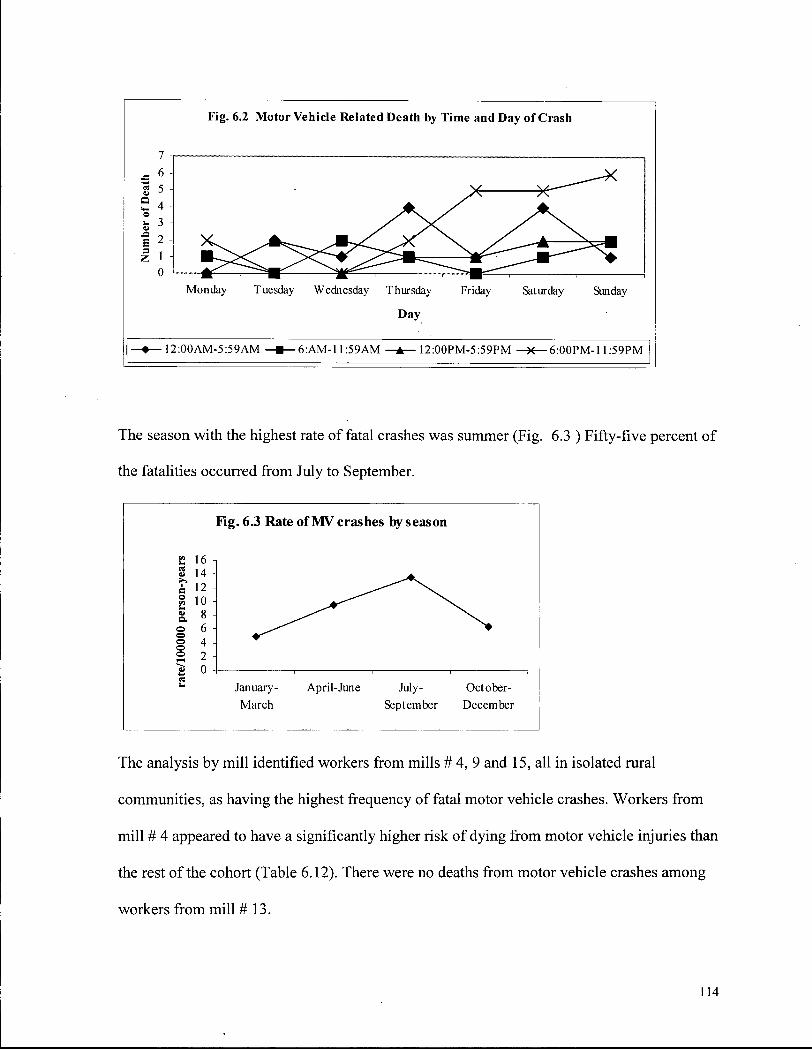
F i g . 6 . 2 M o t o r V e h i c l e R e l a t e d D e a t h b y T i m e a n d D a y o f C r a s h
-•— 12:00AM-5:59AM —•—6:AM-11:59 AM —A— 12:00PM-5:59PM —K—6:00PM-11:59PM
The season with the highest rate of fatal crashes was summer (Fig. 6.3 ) Fifty-five percent of
the fatalities occurred from July to September.
F i g . 6 . 3 Rate of M V crashes b y season
.-ear
s 16 14
erso
n-j
12 10 8 a.
o 6 o 4 o 2
0 2 0
£ J a n u a r y - April-June July- October-March September December
The analysis by mill identified workers from mills # 4, 9 and 15, all in isolated rural
communities, as having the highest frequency of fatal motor vehicle crashes. Workers from
mill # 4 appeared to have a significantly higher risk of dying from motor vehicle injuries than
the rest of the cohort (Table 6.12). There were no deaths from motor vehicle crashes among
workers from mill #13.
114
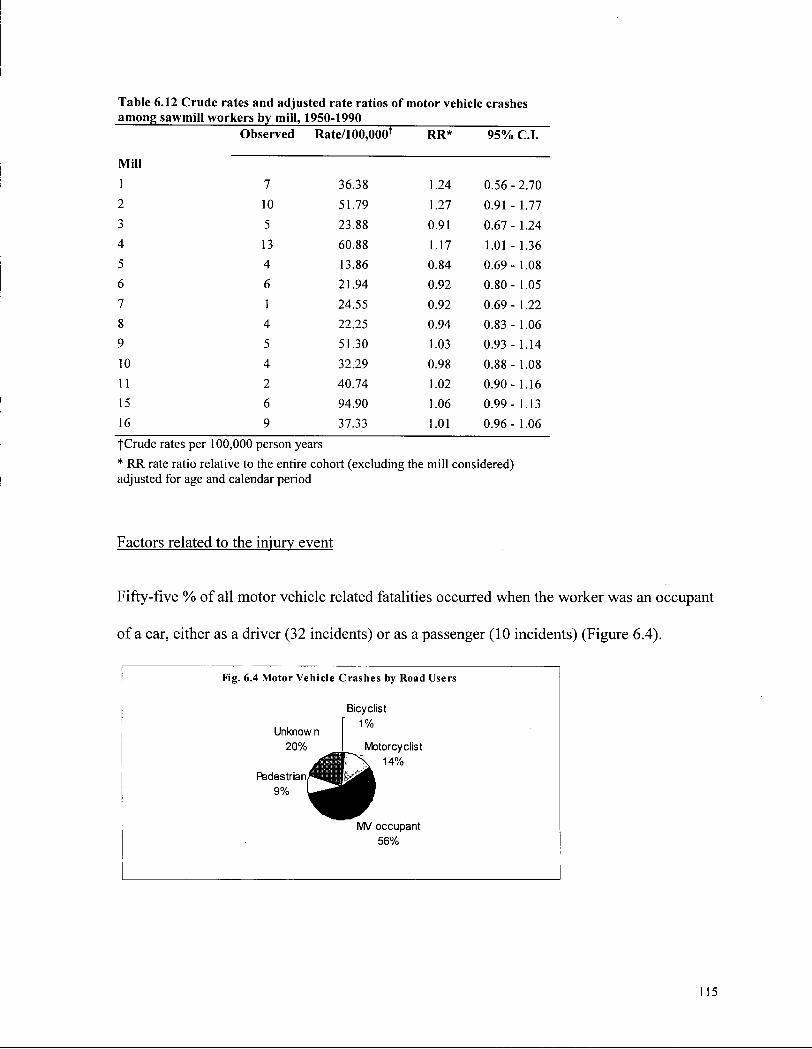
Table 6.12 Crude rates and adjusted rate ratios of motor vehicle crashes among sawmill workers by mill, 1950-1990
Observed Rate/100,000f RR* 95% C.I.
Mill
1 7 36.38 1.24 0.56-2.70 2 10 51.79 1.27 0.91 - 1.77 3 5 23.88 0.91 0.67- 1.24 4 13 60.88 1.17 1.01 - 1.36 5 4 13.86 0.84 0.69- 1.08 6 6 21.94 0.92 0.80-1.05 7 1 24.55 0.92 0.69-1.22 8 4 22.25 0.94 0.83 - 1.06 9 5 51.30 1.03 0.93 - 1.14 10 4 32.29 0.98 0.88 - 1.08 11 2 40.74 1.02 0.90- 1.16 15 6 94.90 1.06 0.99- 1.13 16 9 37.33 1.01 0.96- 1.06
f Crude rates per 100,000 person years
* RR rate ratio relative to the entire cohort (excluding the mill considered) adjusted for age and calendar period
Factors related to the injury event
Fifty-five % of all motor vehicle related fatalities occurred when the worker was an occupant
of a car, either as a driver (32 incidents) or as a passenger (10 incidents) (Figure 6.4).
Fig. 6.4 Motor Vehicle Crashes by Road Users
Bicyclist 1%
Unknow n 1%
20% Motorcyclist
r x 14% Ftedestr ian^l— mm w
W MV occupant 56%
115
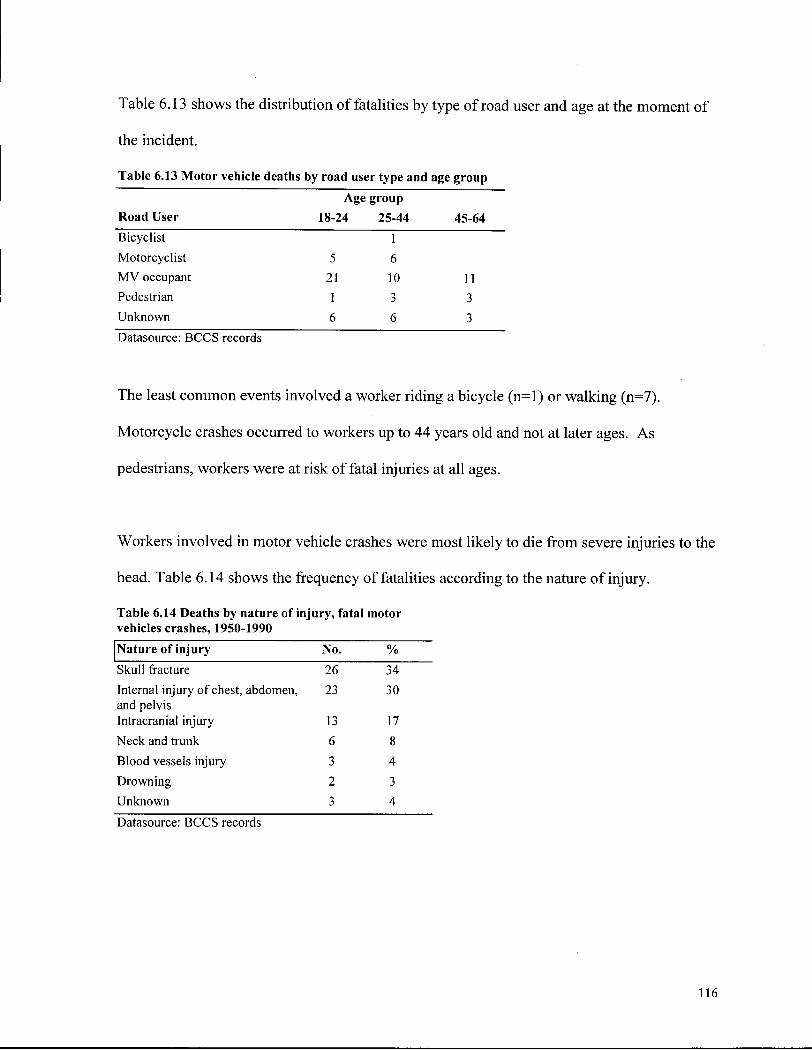
Table 6.13 shows the distribution of fatalities by type of road user and age at the moment of
the incident.
Table 6.13 Motor vehicle deaths by road user type and age group
Age group Road User 18-24 25-44 45-64 Bicyclist 1 Motorcyclist 5 6 MV occupant 21 10 11 Pedestrian 1 3 3 Unknown 6 6 3 Datasource: BCCS records
The least common events involved a worker riding a bicycle (n=l) or walking (n=7).
Motorcycle crashes occurred to workers up to 44 years old and not at later ages. As
pedestrians, workers were at risk of fatal injuries at all ages.
Workers involved in motor vehicle crashes were most likely to die from severe injuries to the
head. Table 6.14 shows the frequency of fatalities according to the nature of injury.
Table 6.14 Deaths by nature of injury, fatal motor vehicles crashes, 1950-1990
Nature of injury No. %
Skull fracture 26 34 Internal injury of chest, abdomen, 23 30 and pelvis Intracranial injury 13 17 Neck and trunk 6 8 Blood vessels injury 3 4
Drowning 2 3 Unknown 3 4
Datasource: BCCS records
116
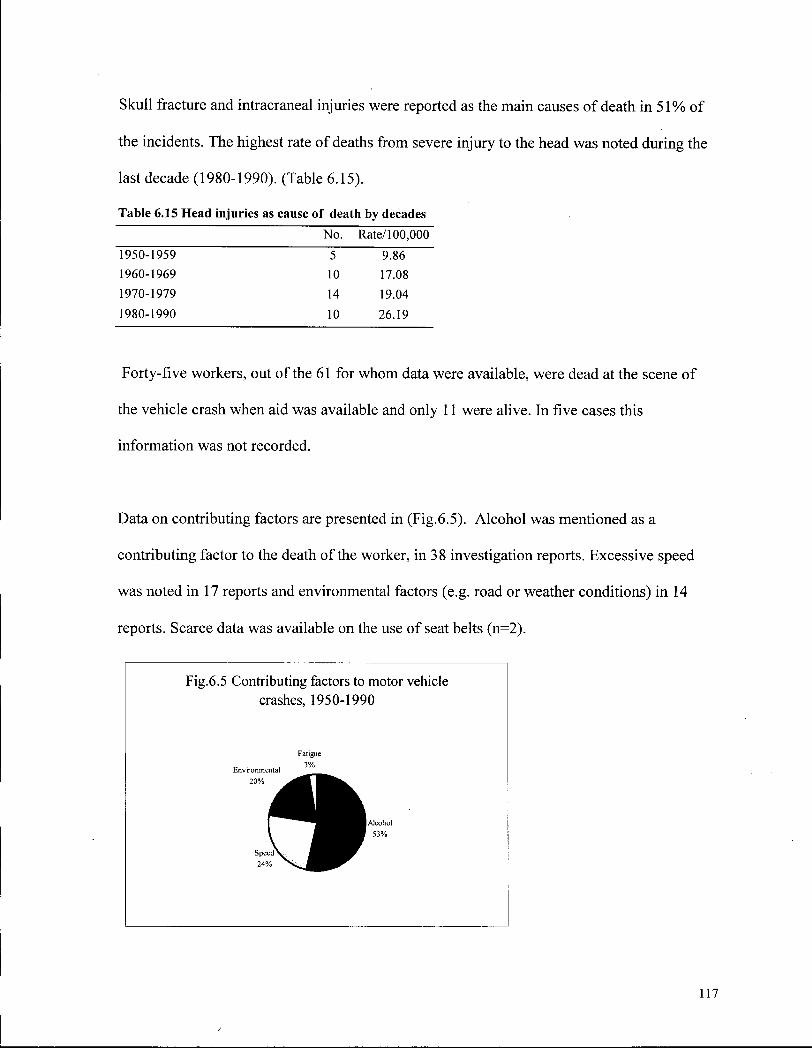
Skull fracture and intracraneal injuries were reported as the main causes of death in 51% of
the incidents. The highest rate of deaths from severe injury to the head was noted during the
last decade (1980-1990). (Table 6.15).
Table 6.15 Head injuries as cause of death by decades
No. Rate/100,000
1950-1959 5 9.86 1960-1969 10 17.08 1970-1979 14 19.04
1980-1990 10 26.19
Forty-five workers, out of the 61 for whom data were available, were dead at the scene of
the vehicle crash when aid was available and only 11 were alive. In five cases this
information was not recorded.
Data on contributing factors are presented in (Fig.6.5). Alcohol was mentioned as a
contributing factor to the death of the worker, in 38 investigation reports. Excessive speed
was noted in 17 reports and environmental factors (e.g. road or weather conditions) in 14
reports. Scarce data was available on the use of seat belts (n=2).
Fig.6.5 Contributing factors to motor vehicle crashes, 1950-1990
Fatigue
117
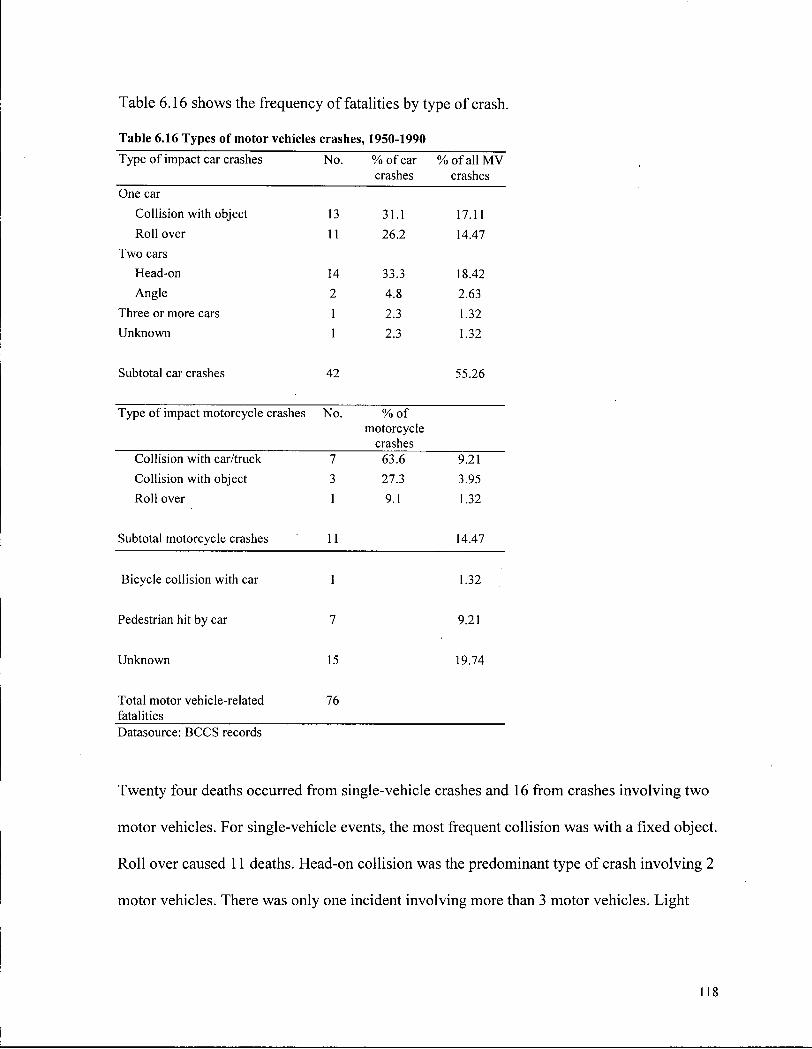
Table 6.16 shows the frequency of fatalities by type of crash.
Table 6.16 Types of motor vehicles crashes, 1950-1990
Type of impact car crashes No. % of car crashes
% of all M V crashes
One car
Collision with object 13 31.1 17.11 Roll over 11 26.2 14.47
Two cars Head-on 14 33.3 18.42 Angle 2 4.8 2.63
Three or more cars 1 2.3 1.32 Unknown 1 2.3 1.32
Subtotal car crashes 42 55.26
Type of impact motorcycle crashes No. % o f motorcycle
crashes Collision with car/truck 7 63.6 9.21 Collision with object 3 27.3 3.95 Roll over 1 9.1 1.32
Subtotal motorcycle crashes 11 14.47
Bicycle collision with car 1 1.32
Pedestrian hit by car 7 9.21
Unknown 15 19.74
Total motor vehicle-related fatalities
76
Datasource: BCCS records
Twenty four deaths occurred from single-vehicle crashes and 16 from crashes involving two
motor vehicles. For single-vehicle events, the most frequent collision was with a fixed object.
Roll over caused 11 deaths. Head-on collision was the predominant type of crash involving 2
motor vehicles. There was only one incident involving more than 3 motor vehicles. Light
118
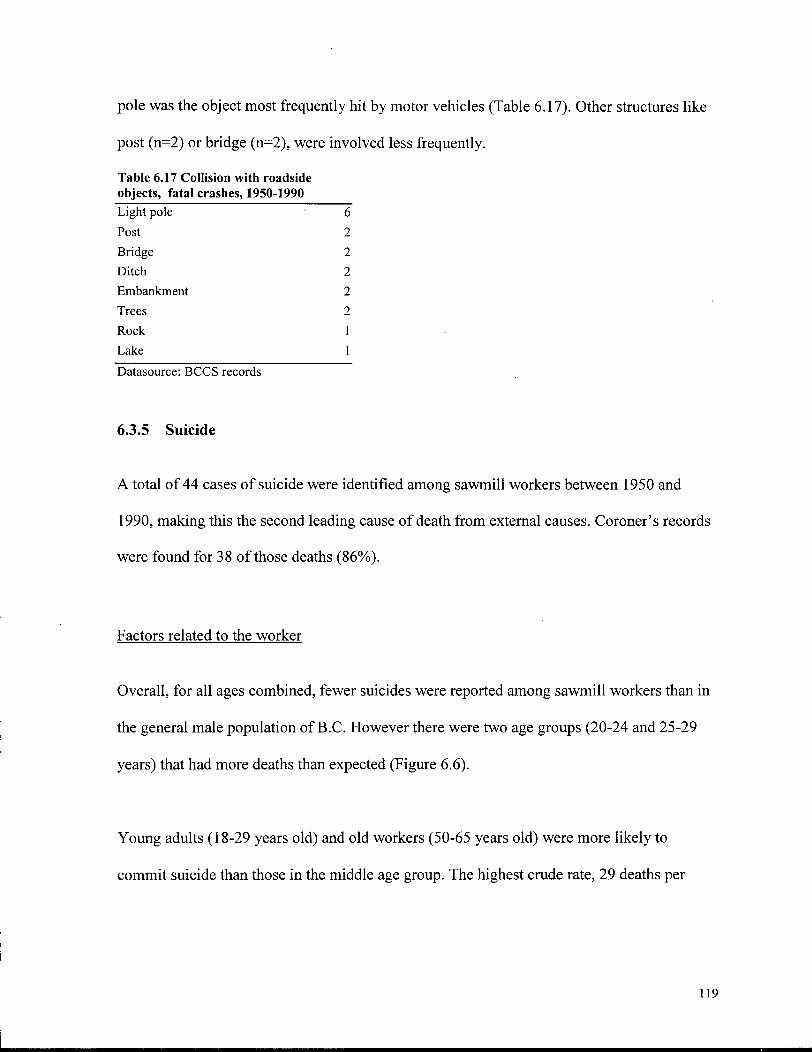
pole was the object most frequently hit by motor vehicles (Table 6.17). Other structures like
post (n=2) or bridge (n=2), were involved less frequently.
T a b l e 6 . 1 7 C o l l i s i o n w i t h r o a d s i d e o b j e c t s , f a t a l c r a s h e s , 1 9 5 0 - 1 9 9 0 Light pole 6 Post 2
Bridge 2 Ditch 2
Embankment 2
Trees 2
Rock 1 Lake 1
Datasource: BCCS records
6.3.5 Suicide
A total of 44 cases of suicide were identified among sawmill workers between 1950 and
1990, making this the second leading cause of death from external causes. Coroner's records
were found for 38 of those deaths (86%).
Factors related to the worker
Overall, for all ages combined, fewer suicides were reported among sawmill workers than in
the general male population of B.C. However there were two age groups (20-24 and 25-29
years) that had more deaths than expected (Figure 6.6).
Young adults (18-29 years old) and old workers (50-65 years old) were more likely to
commit suicide than those in the middle age group. The highest crude rate, 29 deaths per
119
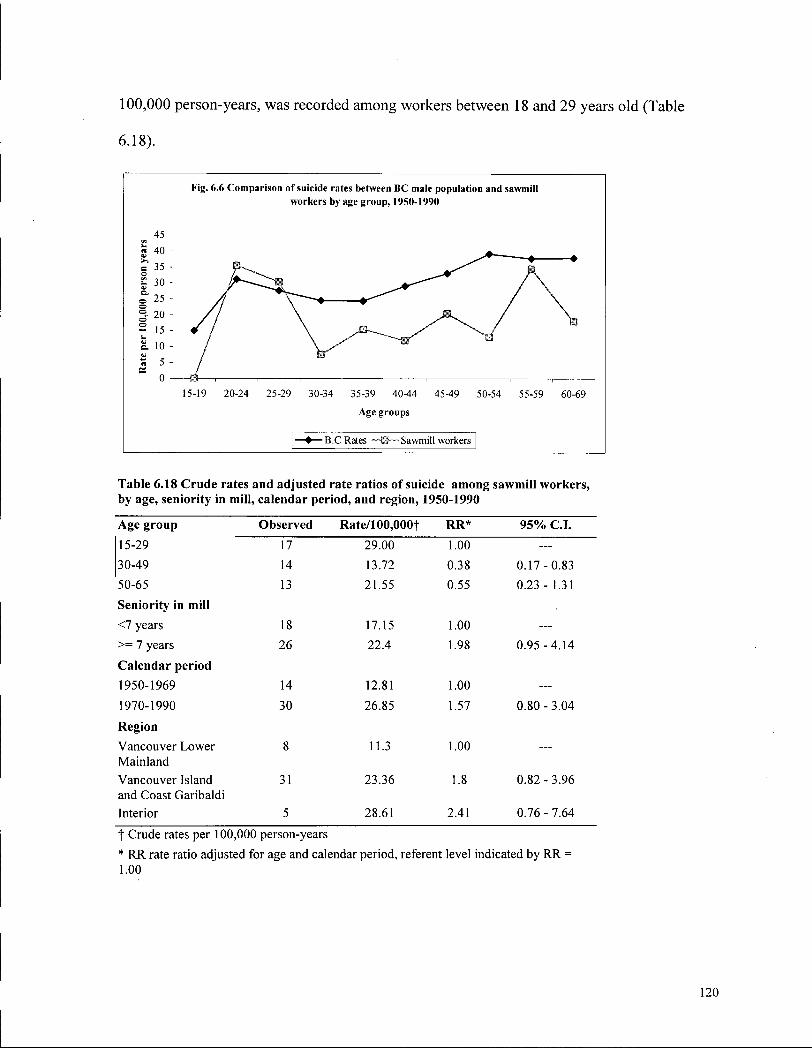
100,000 person-years, was recorded among workers between 18 and 29 years old (Table
6.18).
Fig. 6.6 Comparison of suicide rates between BC male population and sawmill workers by age group, 1950-1990
45 40 35 H 30 25 20 15 10 5 0
15-19 20-24 25-29 30-34 35-39 4044
Age groups
45-49 50-54 55-59 60-69
• B.C Rates — -H— Sawmill workers
Table 6.18 Crude rates and adjusted rate ratios of suicide among sawmill workers, by age, seniority in mill, calendar period, and region, 1950-1990
Age group
15-29
30-49
50-65
Seniority in mill
<7 years
>= 7 years
Calendar period
1950-1969
1970-1990
Region Vancouver Lower Mainland Vancouver Island and Coast Garibaldi Interior
Observed Rate/100,000f RR*
17
14
13
18
26
14
30
31
5
29.00
13.72
21.55
17.15
22.4
12.81
26.85
11.3
23.36
28.61
1.00
0.38
0.55
1.00
1.98
1.00
1.57
1.00
1.8
2.41
95% C.I.
0.17-0.83
0.23 - 1.31
0.95-4.14
0.80-3.04
0.82 - 3.96
0.76 - 7.64
t Crude rates per 100,000 person-years * RR rate ratio adjusted for age and calendar period, referent level indicated by R R :
1.00
120
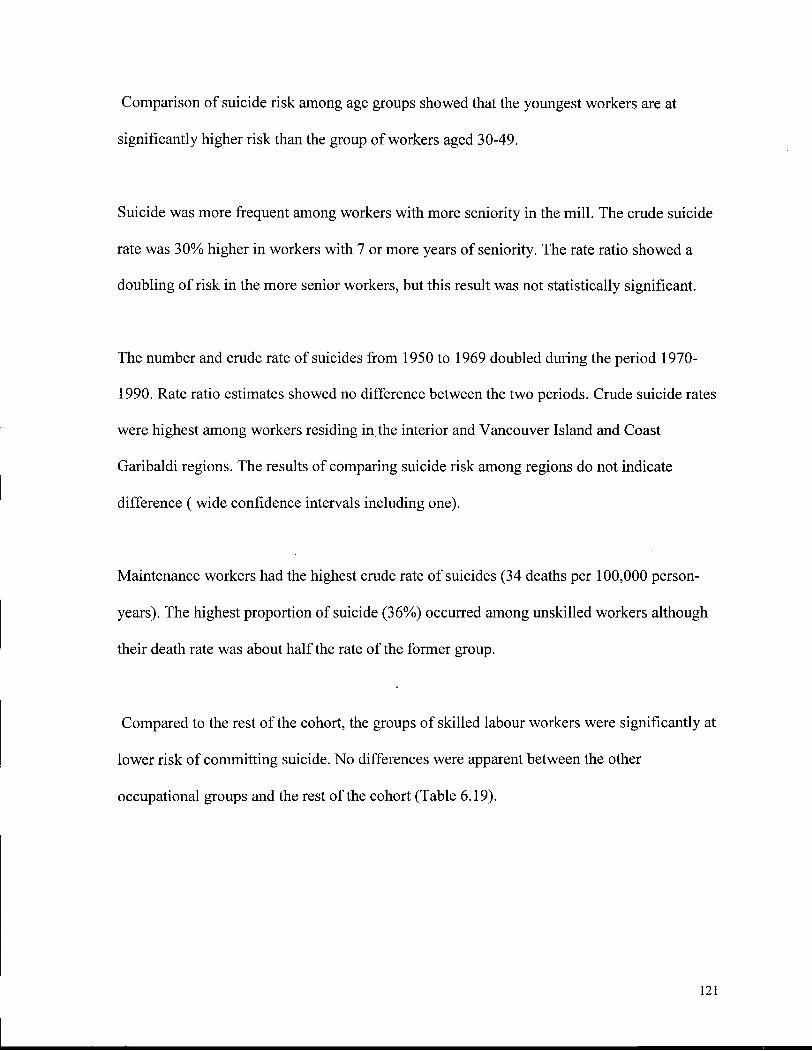
Comparison of suicide risk among age groups showed that the youngest workers are at
significantly higher risk than the group of workers aged 30-49.
Suicide was more frequent among workers with more seniority in the mill. The crude suicide
rate was 30% higher in workers with 7 or more years of seniority. The rate ratio showed a
doubling of risk in the more senior workers, but this result was not statistically significant.
The number and crude rate of suicides from 1950 to 1969 doubled during the period 1970-
1990. Rate ratio estimates showed no difference between the two periods. Crude suicide rates
were highest among workers residing in the interior and Vancouver Island and Coast
Garibaldi regions. The results of comparing suicide risk among regions do not indicate
difference ( wide confidence intervals including one).
Maintenance workers had the highest crude rate of suicides (34 deaths per 100,000 person-
years). The highest proportion of suicide (36%) occurred among unskilled workers although
their death rate was about half the rate of the former group.
Compared to the rest of the cohort, the groups of skilled labour workers were significantly at
lower risk of committing suicide. No differences were apparent between the other
occupational groups and the rest of the cohort (Table 6.19).
121
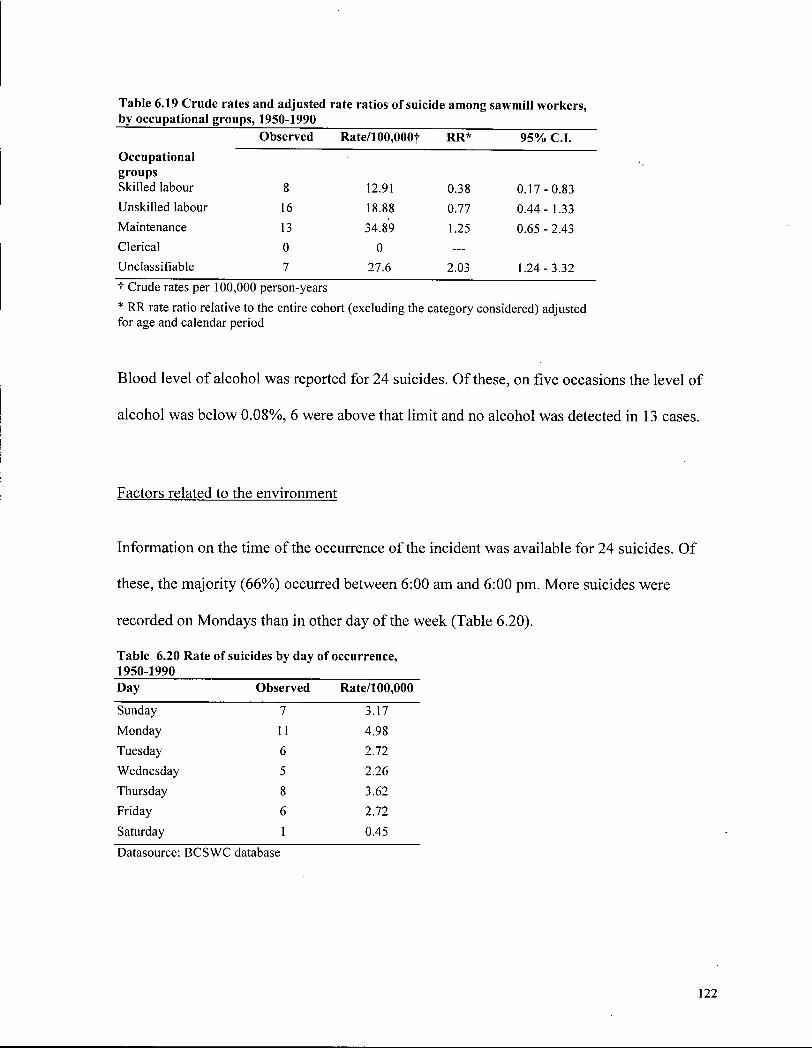
Table 6.19 Crude rates and adjusted rate ratios of suicide among sawmill workers, by occupational groups, 1950-1990
Observed Rate/100,000f RR* 95% C.I. Occupational groups Skilled labour 8 12.91 0.38 0.17-0.83 Unskilled labour 16 18.88 0.77 0.44- 1.33 Maintenance 13 34.89 1.25 0.65 - 2.43 Clerical 0 0 —
Unclassifiable 7 27.6 2.03 1.24-3.32 t Crude rates per 100,000 person-years
* RR rate ratio relative to the entire cohort (excluding the category considered) adjusted for age and calendar period
Blood level of alcohol was reported for 24 suicides. Of these, on five occasions the level of
alcohol was below 0.08%, 6 were above that limit and no alcohol was detected in 13 cases.
Factors related to the environment
Information on the time of the occurrence of the incident was available for 24 suicides. Of
these, the majority (66%) occurred between 6:00 am and 6:00 pm. More suicides were
recorded on Mondays than in other day of the week (Table 6.20).
Table 6.20 Rate of suicides by day of occurrence, 1950-1990 Day Observed Rate/100,000
Sunday 7 3.17 Monday 11 4.98 Tuesday 6 2.72 Wednesday 5 2.26
Thursday 8 3.62 Friday 6 2.72
Saturday 1 0.45
Datasource: BCSWC database
122
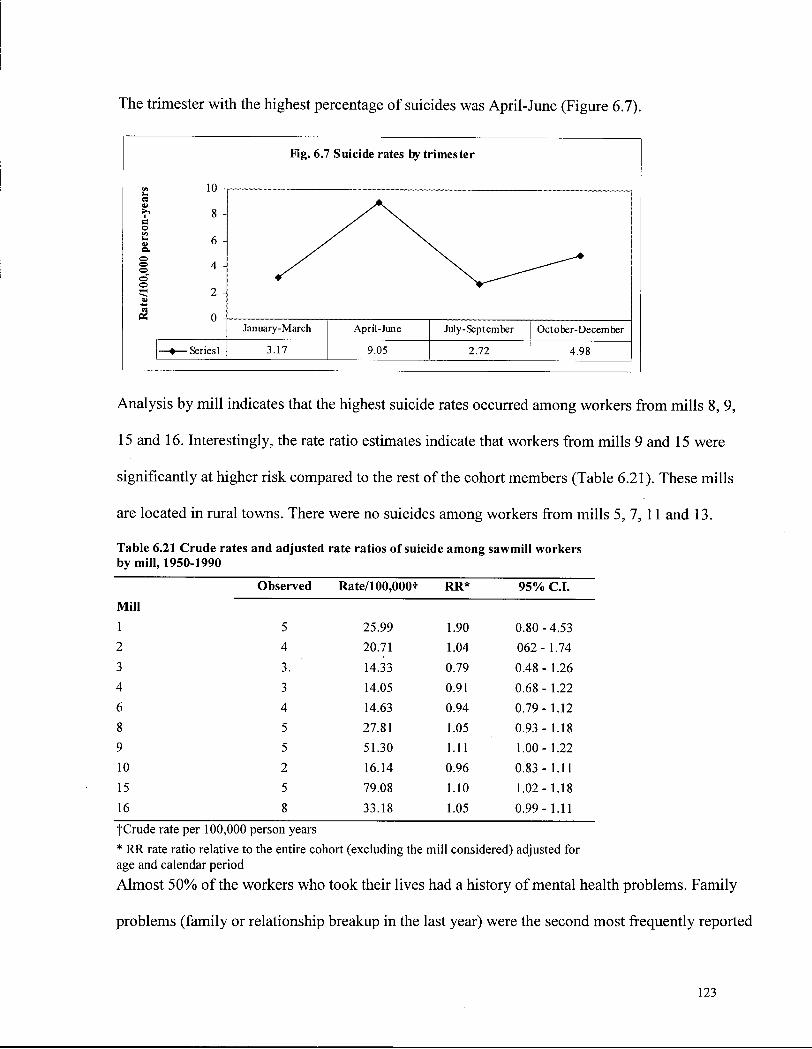
The trimester with the highest percentage of suicides was April-June (Figure 6.7).
Fig. 6.7 Suicide rates by trimester
10
8 -
6 -
4 -
2 -
0 January-March April-June July-September October-December
— • — Series 1 3.17 9.05 2.72 4.98
Analysis by mill indicates that the highest suicide rates occurred among workers from mills 8, 9,
15 and 16. Interestingly, the rate ratio estimates indicate that workers from mills 9 and 15 were
significantly at higher risk compared to the rest of the cohort members (Table 6.21). These mills
are located in rural towns. There were no suicides among workers from mills 5, 7, 11 and 13.
Table 6.21 Crude rates and adjusted rate ratios of suicide among sawmill workers by mill, 1950-1990
Observed Rate/100,000f RR* 95% C.I. Mill
1 5 25.99 1.90 0.80-4.53 2 4 20.71 1.04 062- 1.74 3 3. 14.33 0.79 0.48-1.26 4 3 14.05 0.91 0.68-1.22 6 4 14.63 0.94 0.79-1.12 8 5 27.81 1.05 0.93 - 1.18 9 5 51.30 1.11 1.00-1.22 10 2 16.14 0.96 0.83 - 1.11 15 5 79.08 1.10 1.02- 1.18
16 8 33.18 1.05 0.99-1.11
fCrude rate per 100,000 person years
* RR rate ratio relative to the entire cohort (excluding the mill considered) adjusted for age and calendar period
Almost 50% of the workers who took their lives had a history of mental health problems. Family
problems (family or relationship breakup in the last year) were the second most frequently reported
123
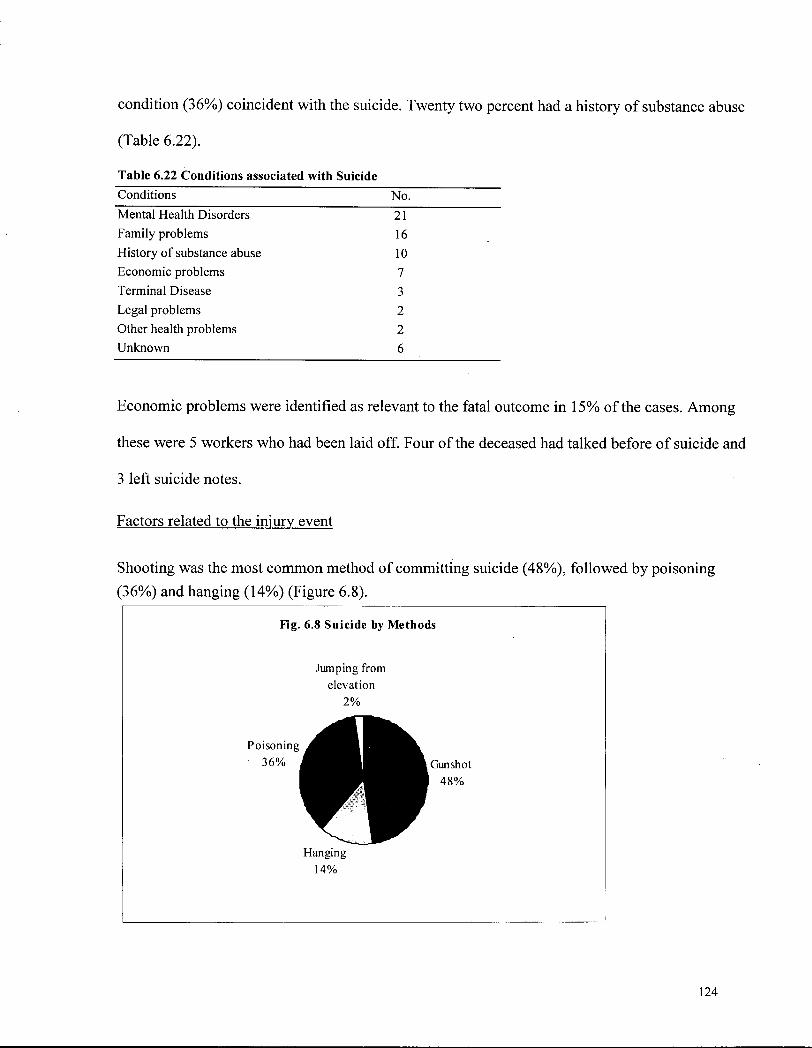
condition (36%) coincident with the suicide. Twenty two percent had a history of substance abuse
(Table 6.22).
Table 6.22 Conditions associated with Suicide Conditions No. Mental Health Disorders 21 Family problems 16 History of substance abuse 10 Economic problems 7 Terminal Disease 3 Legal problems 2 Other health problems 2 Unknown 6
Economic problems were identified as relevant to the fatal outcome in 15% of the cases. Among
these were 5 workers who had been laid off. Four of the deceased had talked before of suicide and
3 left suicide notes.
Factors related to the injury event
Shooting was the most common method of committing suicide (48%), followed by poisoning (36%) and hanging (14%) (Figure 6.8).
Fig. 6.8 Suicide by Methods
Jumping from elevation
2%
Hanging 14%
124
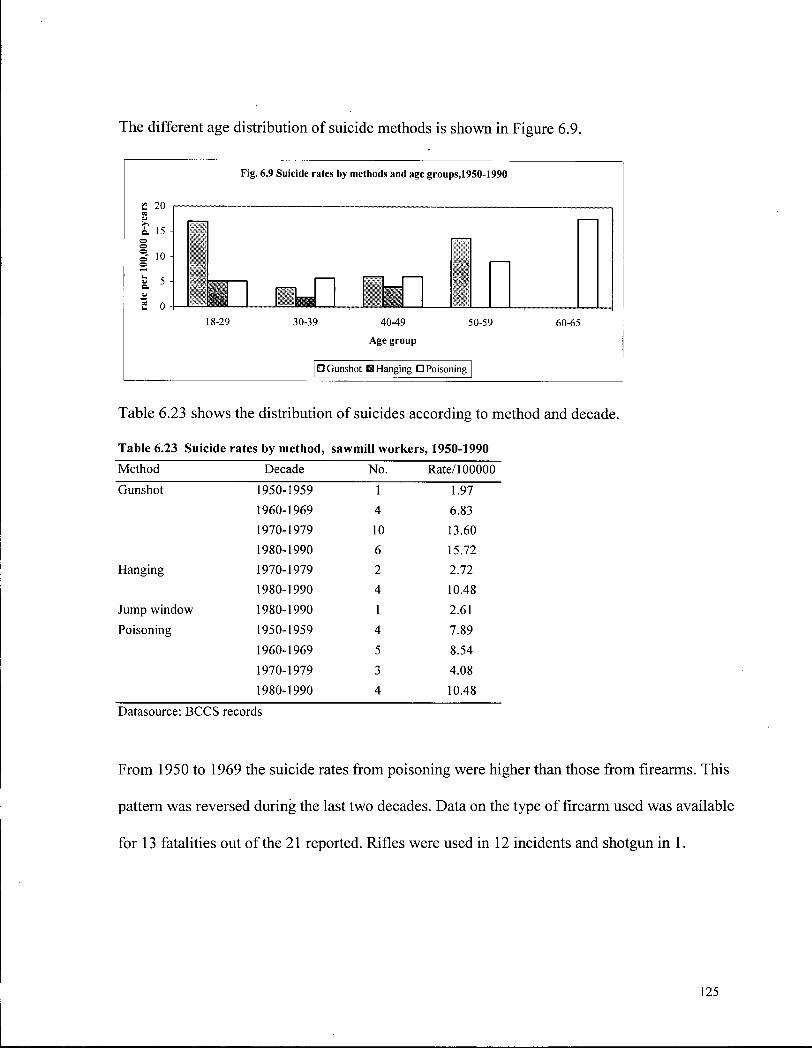
The different age distribution of suicide methods is shown in Figure 6.9.
Fig. 6.9 Suicide rates by methods and age groups,1950-1990
18-29 30-39 40-49 50-59 60-65
Age group
• Gunshot • Hanging • Poisoning
Table 6.23 shows the distribution of suicides according to method and decade.
Table 6.23 Suicide rates by method, sawmill workers, 1950-1990
Method Decade No. Rate/100000
Gunshot 1950-1959 1 1.97 1960-1969 4 6.83 1970-1979 10 13.60 1980-1990 6 15.72
Hanging 1970-1979 2 2.72 1980-1990 4 10.48
Jump window 1980-1990 1 2.61 Poisoning 1950-1959 4 7.89
1960-1969 5 8.54
1970-1979 3 4.08 1980-1990 4 10.48
Datasource: BCCS records
From 1950 to 1969 the suicide rates from poisoning were higher than those from firearms. This
pattern was reversed during the last two decades. Data on the type of firearm used was available
for 13 fatalities out of the 21 reported. Rifles were used in 12 incidents and shotgun in 1.
125
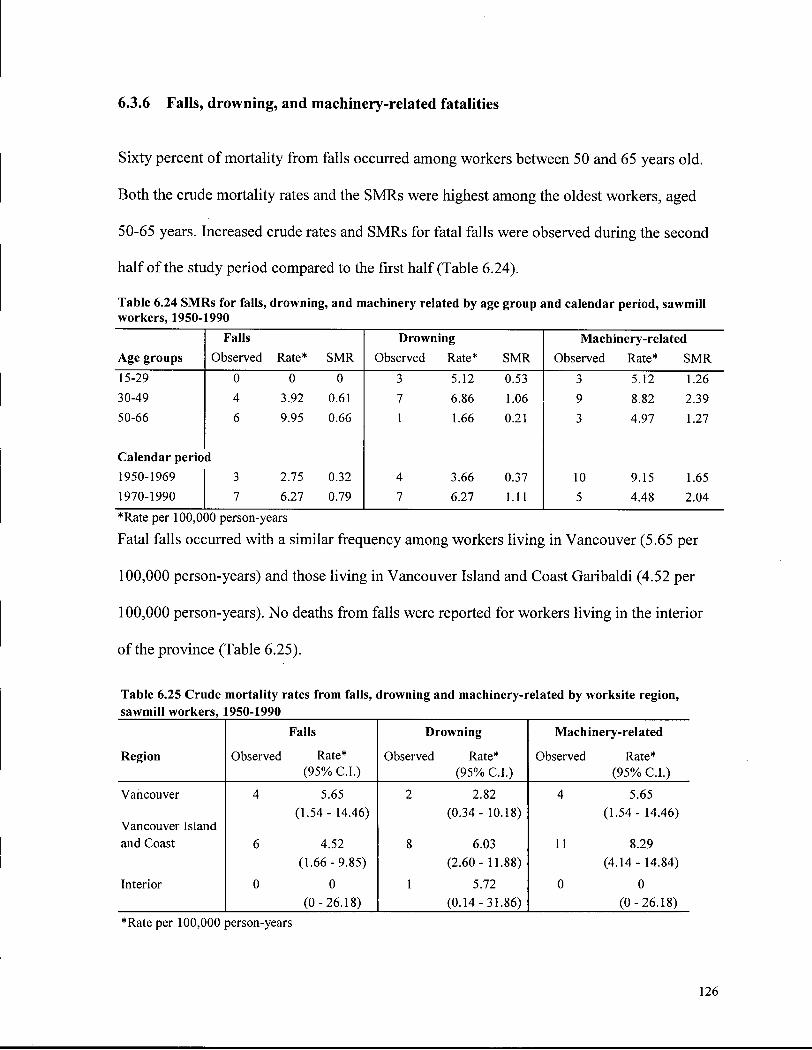
6.3.6 Falls, drowning, and machinery-related fatalities
Sixty percent of mortality from falls occurred among workers between 50 and 65 years old.
Both the crude mortality rates and the SMRs were highest among the oldest workers, aged
50-65 years. Increased crude rates and SMRs for fatal falls were observed during the second
half of the study period compared to the first half (Table 6.24).
Table 6.24 SMRs for falls, drowning, and machinery related by age group and calendar period, sawmill workers, 1950-1990
Falls Drowning Machinery-related Age groups Observed Rate* SMR Observed Rate* SMR Observed Rate* SMR 15-29 0 0 0 3 5.12 0.53 3 5.12 1.26 30-49 4 3.92 0.61 7 6.86 1.06 9 8.82 2.39 50-66 6 9.95 0.66 1 1.66 0.21 3 4.97 1.27
Calendar perio d 1950-1969 3 2.75 0.32 4 3.66 0.37 10 9.15 1.65 1970-1990 7 6.27 0.79 7 6.27 1.11 5 4.48 2.04
*Rate per 100,000 person-years
Fatal falls occurred with a similar frequency among workers living in Vancouver (5.65 per
100,000 person-years) and those living in Vancouver Island and Coast Garibaldi (4.52 per
100,000 person-years). No deaths from falls were reported for workers living in the interior
of the province (Table 6.25).
Table 6.25 Crude mortality rates from falls, drowning and machinery-related by worksite region, sawmill workers, 1950-1990
Falls Drowning Machinery-related
Region Observed Rate* Observed Rate* Observed Rate* (95% C.I.) (95% C.I.) (95% C.I.)
Vancouver 4 5.65 2 2.82 4 5.65
Vancouver Island (1.54- 14.46) (0.34- 10.18) (1.54- 14.46)
and Coast 6 4.52 (1.66 - 9.85)
8 6.03 (2.60 - 11.88)
11 8.29 (4.14-14.84)
Interior 0 0 (0-26.18)
1 5.72 (0.14-31.86)
0 0 (0-26.18)
*Rate per 100,000 person-years
126
Regarding place of occurrence, 5 fatal falls happened at home and 5 at work.
Mortality rate from drowning was highest for workers aged 30-49. Drowning showed a
calendar trend similar to falls. There was approximately a twofold increase in drowning death
rates from 1950-1969, to 1970-1990 (3.66 and 6.27 deaths per 100,000 person-years
respectively). The SMRs indicate the same calendar trend.
Workers living in Vancouver Island and coast Garibaldi were at higher risk for drowning
than workers residing in the Lower Mainland and interior regions of B.C.. Nine of the eleven
drowning deaths occurred in recreational settings and two at the workplace.
The highest rate of deaths from machinery-related injuries was for the group of workers aged
30-49. The SMRs calculated for various age group indicate that this workforce had more
machinery-related deaths than expected based on general male population rates. Sawmill
workers between 30 and 49 years had a risk of dying from machinery-related injuries 2.4
times that of the males of the same age group from the general B.C. population (SMR= 2.39;
95% C.I.= 1.09 - 4.54). There were more machinery-related deaths from 1950 through 1969
than during 1970-1990; yet the highest SMR was observed during 1970-1990.
Fatal injuries from contact with machinery were more frequent among workers from
Vancouver Island and coast Garibaldi than for workers living in other regions. There were no
deaths from this cause among workers residing in the interior of the province.
127
6.4 Discussion
Overall unintentional injury mortality
We examined the mortality from injuries in a cohort of 26,411 sawmill workers from 1950 to
1990. The overall injury mortality rate for this period was 71.05 per 100,000 person-years.
Compared to the mortality rate in the male general population for the same period, the 157
deaths observed among the sawmill workers were 37 percent fewer than expected. This
finding is in line with the lower overall mortality observed in the analysis of the original
study. The all cause standardized mortality ratio was below unity (SMR for all causes of
death = 0.81) and illustrates the healthy worker effect. The healthy worker effect was
expected because this cohort represented physically fit individuals selected because the
nature of most mill tasks is characterized by high physical demands. Although the healthy
worker effect is strongest during the first years of employment and then decreases, it is also
more pronounced in workers who stay longer in their jobs (survival of healthier workers).
The effect is known to disappear rapidly after termination of employment, especially if the
worker retires before the usual age for retirement (Checkoway, et al., 1989; Fox and Collier,
1976).
It has been indicated that part of the healthy worker effect may be due to the use of an
inappropriate comparison population (Wen and Tsai, 1982). The general population includes
those who are not fit to work due to illness as well as those who are employed. Therefore,
the expected number of deaths is calculated based on the rates of a population that combines
exposed and unexposed individuals. Internal cohort analyses were conducted to remove the
128
differences in employment and socioeconomic status associated with the use of the general
population and reduce the bias due to the healthy worker effect (Wen and Tsai, 1982).
Regarding mortality from external causes, the healthy worker effect is not expected to affect
the injury mortality rates. Contrary to other reports of injury mortality among forestry
workers, our cohort had fewer deaths from injuries (even when work-related injuries were
included) than the B.C. male population. Previous reports (Millar and Adams, 1991) have
indicated that active workers are at greater risk of motor vehicle injuries than unemployed
people. Notkola et al. (1993) in a mortality study in Finnish forestry and construction
workers from 1970-1985, reported a significant increased mortality rate from all injuries
among forestry workers compared to the rest of the working population (R.R 2.17; 95% C.I.
1.98 - 2.39). The authors could not determine whether or not the excess of injury deaths was
driven by work-related incidents because death data were obtained from death certificates.
Similarly, Asp (1994) and Green (1991) reported non significant increased standardized
mortality ratios (SMR 1.13 and 1.09 respectively) for all unintentional injuries among
workers exposed to chlorophenoxy herbicides.
In the Poisson regression analyses the injury mortality rate for each occupational group was
compared to the mortality rates of the rest of the cohort members. This showed that except
for the category "skilled labour" there were no significant differences among the
occupational groups regarding risk of fatal injuries for the two selected outcomes (i.e. motor
vehicle crashes and suicide).
129
Mortality from motor vehicle crashes
The pattern of motor vehicle crashes found in this study is consistent with that reported for
Canada and U.S population (Waller, 1985, Riley and Paddon, 1990). Young drivers, aged 15-
24, had the highest fatality rates. The peak of fatal crashes during the summer may be the
result of increased volume of traffic and length of time driving during this season, as well as
increased numbers of young drivers on the road at that time. The high frequency of fatalities
at nighttime during the weekends may reflect the problem of driving while impaired (Wilson,
1984).
The trend in mortality across the forty year period according to the nature of injury did not
show decreases in skull fractures, intracraneal injuries or internal injuries to the chest,
abdomen and pelvis. In contrast Millar and Last (1988) in an analysis of motor vehicle
fatalities in Canada during 1921-1984, concluded that the shift from skull fractures to
intracraneal and internal injuries of the chest, abdomen and pelvis reported during the period
1970-1980, could be consistent with an increased use of seat belts among the drivers. In this
study, the mortality rates from skull fractures and intracraneal injuries increased from 1950 to
1990. Internal injuries of the chest, abdomen and pelvis increased from 1950 to 1980 and
then decreased during the last decade. It is known that compliance with seat belt use laws is
far from complete. In Canada there are notable differences in seatbelt use between provinces
with and provinces without legislation mandating seatbelt use. The average percent of users
of seat belt in provinces with relevant legislation was 61.4 (B.C. 67.4) and for provinces
without, was 15.0 (Millar and Last, 1988; Last, 1984; Minister of Supply and Services and
Minister of National Health and Welfare, 1981).
130
The results of the internal cohort analyses have confirmed the relationship between age and
town of residence and mortality from motor vehicle crashes. The youngest workers (15-29
years) were significantly at higher risk of fatal motor vehicle crashes (68.23 per 100,000
person-years) than the older workers, consistent with the pattern observed at both the
provincial and national level. The overrepresentation of young drivers in fatal crashes has
been attributed to several reasons. One is that young drivers are new and inexperienced
drivers. Another reason is that young drivers are more frequently exposed at times and
locations posing greater safety hazards. In addition, young people are more sensitive to small
amounts of alcohol than older, experienced drinkers (Waller, 1985). It has been reported that
the risk of crashing increases as blood alcohol level exceeds 0.05 percent by weight (U.S.
Department of Transportation, 1968; Jones and Joscelyn, 1978). For young people the risk of
motor vehicle crash increases with even one drink and thereafter it rises at a faster rate than
for drivers over 25 or 30 years (Hyman, 1968). In terms of behavioral factors, the risk of fatal
crashes seems to be closely related to feelings of hostility and rebellion, especially among
male drivers (Pelz and Shuman, 1971). It has also been suggested that the excess of car
crashes among young males may be attributed to men's tendency to drive faster, violate
motor vehicle traffic regulations, drive while impaired and without seat belts (Baker, et al.,
1992; Waters, et al., 1993; Millar and Last, 1988).
In this study, 21 workers out of the 36 tested had blood alcohol levels above the legal limit
for driving (0.08 %) and 5 below. No alcohol was detected in 10 fatalities. Since blood
alcohol tests are done when it is considered relevant to the event, it may be that the cases
131
tested were the more likely to give a positive result. In 1993, it was reported that alcohol was
a contributing factor in approximately 31 % of all motor vehicle-related fatalities in B.C. (BC
Ministry of Transportation and Highway, 1993). Because of the link between motor vehicle
crashes and alcohol, several causes of death known to be associated with alcohol were
examined to ascertain whether or not there was evidence of excessive alcohol consumption
among the sawmill workers. SMRs for oral and laryngeal cancers and cirrhosis were below
unity, suggesting that sawmill workers consume less alcohol than the general population.
The association of fatal motor vehicle crashes and residence in several of the rural isolated
mill towns also agrees with the provincial pattern of injury mortality. Most of the mills in our
study are located in rural areas or newly developed urban centers rather than in well
established cities. Fatal motor vehicle crashes occur at higher frequency in rural areas where
more miles are driven and at greater speed, the roads are in poor conditions, the distance to
medical facilities is greater, and seat belt use is lower (Waller, 1985; Baker, et al.,1992).
Freeways have fewer crash fatality rates than primary and secondary roads, mainly because
their sides have been generally cleared of trees, rocks or other hazards but also because there
are no intersections.
Suicide
Forestry workers have been identified as a workforce at high risk of suicide in several reports
(Tuk and Macdonald, 1995; Notkola, et a l , 1993; Asp, et al., 1994; Green, 1991). However,
both the study by Asp et al. and the one by Green included exclusively chlorophenoxy acid
herbicides applicators. Green suggested that the increased suicide rates could be related to
132
neurological toxicity resulting from exposure to phenoxy acid herbicides. Notkola, et al.,
studied mortality in forestry workers but the authors did not provide details of the
occupational groups included in the broad category of forestry workers and thus is not
possible to know whether sawmill workers were part of the study. Tuk and Macdonald also
refer to "forestry and logging" as the industrial group with the highest suicide rate among all
industries in B.C. It implies that the category may include sawmill workers as well as loggers
and workers in other forestry-related activities.
In this cohort, sawmill workers had higher suicide rates than the B.C population only at ages
20-29. Similar to the pattern of the general population of B.C. suicide ranked second as cause
of death among persons 15 to 24 years of age, following motor vehicle crashes.
Factors that have been found to contribute to the risk of suicide include psychiatric
conditions, substance abuse, genetic and family background, sociological and biological
factors, and stressful life events (Health Canada, 1995). Some common stressful situations
arise from breaking up with a girl friend, problems at school, arguments with parents. This is
the age of entry into the job market as well. The level of stress triggered by these
circumstances varies with the individual personality as well. Social factors such as alcohol
consumption seem to play the role of facilitator for the act. Besides, alcohol consumption is
likely to be associated to other risk factors such as depression or other mental illness
(National Committee for Injury Prevention and Control, 1989). In this cohort, the leading
conditions noted as relevant to the suicides were mental health disorder, history of substance
133

abuse and family and economic problems. This cohort experienced massive layoffs during
the recession of the early 1980's when the labour force was reduced by 50 percent.
Geographic differences in suicide rates have also been reported in U.S, with rural areas
having the highest rates (Baker, et al., 1992). One possible explanation for this is that in
rural areas the availability of firearms may be greater for hunting purposes. Another possible
explanation may be related to some qualities of rural life, particularly loneliness (National
Committee for Injury Prevention and Control, 1989). In this cohort the highest suicide rates
(79.08 and 51.30 per 100,000 person-years) were observed in the two most isolated mill
communities. These rates are far greater than the ones reported during the periods of great
economic depression of the late 1920s and early 1930s (17 per 100,000 person-years)
(National Committee for Injury Prevention and Control, 1989; Health Canada, 1995).
Three mill communities shared special socio-demographic features that make them different
from the other mill locations; these may be related to the results. These three are mill towns
that are totally dependent on the labor force needs of the company that built the town
(Marchak, 1990). Their survival is subordinate to the economic success of one particular
company. Adverse market conditions, technology changes, depletion of the natural resources
are the major threats for these communities. Marchak (1990) provides an example of forest-
based towns describing the socio-demographic characteristics of Mackenzie. This town,
situated in the northeast of British Columbia, was constructed in the mid 1960's by a large
company mill. Although the average income of the workers is high, the population seems to
have no strong ties with the town. There are few long-term residents. This instability has
134
been ascribed to the following circumstances: 1) mill workers are known to experience
frequent lay-offs; 2) geographical isolation of the town (i.e. Mackenzie is 190 K m from the
nearest urban center); and 3) lack of opportunities for women and children (Marchak, 1990).
Possible limitations of this study include the number of workers for whom vital status was
not known. In this cohort, after the linkage with both the provincial and national mortality
databases and the income tax records, vital status was ascertained for 85.6 % of the cohort.
Given that death ascertainment through Statistics Canada's mortality database is estimated to
be 97.6%, it can be stated that the likelihood that workers with unknown vital status are dead
is very low. In addition, injury mortality must be reported to the Coroner. One possible
explanation for the cases with unknown vital status is that they may have moved out of the
country.
Another limitation relates to the number of workers who could not be assigned to specific job
categories. Instead of deleting these workers, we created a category "unclassifiable" so that
all person-years were used in the internal cohort analysis (Checkoway, et al., 1989). The
intent of this skill-based classification was to categorize workers into groups that could
somehow reflect socio-economic differences (e.g. maintenance workers have higher salary
and education than unskilled workers). The results seem to indicate that there are no
significant differences among occupational groups regarding the risk of fatal injuries either
from motor vehicle crashes or suicide. The exception was the group "skilled labor" that had
significantly fewer deaths from both motor vehicle crashes and suicide. Such outcomes may
be related to particular characteristics of the skilled labour group. The fact that this group of
135
workers lies between the unskilled labour group and the maintenance group (in terns of skills
and income), suggests that the "skilled labour" workers may be at a comfortable work stage.
This group may experience lower stress level than unskilled workers. Karasek and Theorell
(1990) have found that if the worker's skill is developed and used, the worker is more likely
to feel in control of the situations that may arise. Job induced skill development results in
improved confidence and self-esteem thus reducing stress response. In contrast, unskilled
workers having unstable jobs (i.e. great turnover), with little or no control over tasks are
more susceptible to experience more dissatisfaction and stress. Maintenance workers, on the
other hand, having a formal education and being the best paid in the industry, have more
responsibility. While their work is not repetitive and monotonous, they are pressured to fix
problems as quickly as possible without interrupting the production flow. Maintenance work
is often done during break times or night shifts. The degree of stress thus can be high and
exceed the person's resilience.
It has been suggested that the risk of personal injury is affected by socioeconomic factors, but
this association seems to be complex. The following findings from the General Social Survey
illustrate this relationship. Motor vehicle injuries were highest among working people. Also,
for men, the highest risk of motor vehicle crashes was observed among individuals with
some postsecondary education. In general, income level and injury events appear to be
directly associated. People with the highest income had the highest motor vehicle-related
injury rates. Additionally, married people tended to have the lowest injury rates (Millar and
Adams, 1991).
136
The understanding of the causes of the different risk of injuries among an otherwise
homogeneous industrial group would require knowledge of other important determinants of
health such as housing, social support, or life-style (Evans, et al., 1994).
Finally, the study could not analyze the contribution of other factors (e.g. from the physical
and social environment). The coroner's files contain the investigating coroner's report of the
events surrounding each event. These were based on the accounts of individuals who knew
the deceased, relatives and friends or coworkers. Although the documentation provided
useful information describing the scenario of the injury event, the thoroughness of each
investigation and or completeness of the coroner's report is not consistent. Therefore many
conditions relating to personal and environmental factors associated with the occurrence of
fatalities are likely to have been underreported. Also it is not possible to develop rates for
these factors since no denominator data are available.
The strengths of the study are the length of the follow-up, the large number of workers
included, and the availability of information from the Coroner's records that are the best
source of information on pre-event and event phases of injury fatalities. The most important
feature of this study is that it provides mortality rates for cause-specific injury mortality. This
has allowed us to discriminate the risk of fatal injuries in different settings.
Relationship of this study with the chapter on work-related injuries
This study completes the characterization of the pattern of mortality from injuries among
sawmill workers. It allowed us to quantify the magnitude of both the absolute and relative
risk of fatal injuries in different settings in a cohort of blue collar workers. These analyses
have provided some interesting results. First, the overall mortality rate from unintentional
injuries is unacceptably high (71.05 per 100,000 person-years) given that most injuries are
preventable. Comparatively, the rate is lower than the one observed in the general male
population of B.C.( SMR= 0.62). This deficit in injury mortality is mainly due to the reduced
mortality from motor vehicle crashes, falls, and drowning that represent the three leading
causes of death in the general population.
Second, machinery-related injuries with a mortality rate of 6.79 per 100,000 person-years
was the second leading cause of unintentional injury deaths in this cohort, and the only cause
with significantly more deaths than expected. According to this analysis, sawmill workers
experienced 76% more machinery-related deaths than the general population. This was
expected given the nature of the production processes typical of a mill including exposure to
various safety hazards including different types of saws, conveyor belts, chippers, planers,
and mobile equipment such as forklift, and lumber carriers.
Third, surprisingly, the only setting where this workforce had more fatal injuries than the
general population was in the workplace. While the increased mortality (compared to the
general population) from work-related injuries was expected, the lower mortality from other
types of injury was not. If the occurrence of a work-related fatal injury were attributable
solely to personal factors such as risk-taking behavior, carelessness, or lifestyle
characteristics, we would expect greater mortality rates for other injury types as well. These
results seem to indicate that work-related, not personal, factors play the decisive role in the
occurrence of injuries at work.
138
CHAPTER SEVEN
7.0 Conclusions
The primary purpose of this research was to advance our knowledge of the epidemiology of
injuries. The injury mortality among a cohort of blue collar workers was analyzed in terms of
to whom, how, when and where injuries occur with the purpose of understanding why
injuries happened and what can be done to prevent future deaths. In addition, the usefulness
of the data sources available for injury surveillance was explored.
In addition to the limitations, strengths, and conclusions that were discussed with respect to
each research objective in the preceding chapters, the following discussion addresses key
issues influencing the results and interpretation of this study.
7.1 Completeness of ascertainment of work-related fatal injuries
Epidemiologic surveillance is defined as the ongoing and systematic collection, analysis, and
interpretation of health data in the process of describing and monitoring a health event.
Surveillance data are essential both to determine the need for public health action and to
assess the effectiveness of programs (Klaucke, et al, 1988).
In this study, although the evaluation of completeness of the data sources using capture-
recapture methods was limited due to the small number of fatalities and the interdependence
of the data sources, it was possible to identify the types of cases that will be systematically
missed by each source due to the data collection procedures. The specific limitations of using
BCCS or B C W C B records to account for all fatal injuries occurring at a workplace have been
documented.
139
The use of death certificates to identify work-related fatal injuries was assessed. The
selection of the item "place of injury" on the death certificate was suggested by an officer
from the Division of Vital Statistics of B.C. because Vital Statistics was interested in
validating the accuracy of this item. The results indicated better specificity than sensitivity
when using this source of ascertainment.
Given that there is no universally accepted gold standard against which to compare each
source, it is difficult to assess the degree of underreporting of fatal injuries occurring at
workplaces. Therefore any overall estimate of the number of occupational fatalities is likely
to be uncertain and surely an underestimate no matter what data source is used.
The evaluation of the completeness of reporting of fatal injuries occurring at workplaces
using data from the BC Coroners Service, the Workers Compensation Board and the BC
Vital Statistics Division has not been documented before.
7.1.1 Implications for public health policy
The lack of an accurate number of fatalities should not divert our attention from the
seriousness of the social and economic losses due to work-related deaths. A major issue is
how people are being killed and what can be done to prevent future deaths. Causal factor
information on occupational fatalities can be obtained from Coroners and W C B investigation
reports. Standardization of the present data collection system used by both agencies will yield
data of greater value for injury control countermeasure. We need to develop a method to
140

abstract the important information from narrative data in a concise way. The current system
of presenting injury statistics focuses on the outcome (i.e. injury) rather than the preceding
events or circumstances that led to it. Thus it is not prevention oriented. For example, the
death of a worker (i.e. case # 7, Table 4.3 Chapter 4) can be recorded in different ways
1) narrative form: John Doe, 30 years old, was trying to free a jammed log. He stepped on an
insecure plank (57 inches overhang) which up-ended dropping him through an opening to the
basement floor, 20 feet below. He hit his head on a steel cross beam
2) Current system of WCB report/ Work Injury Program:
Type of injury: fall from elevation
Source of injury: steel cross beam
Nature of injury: fracture
Part of body: head
Unlike the narrative form, the current system of reporting work-related injuries does not
allow the identification of the obvious immediate cause of the incident: "the worker stepped
on an insecure plank". Likewise other violations of safety regulations could be flagged and
be the basis for developing special programs within the mill.
7.2 Work-related fatal injuries
Given that injuries are preventable, the injury fatality rate of 18.10 per 100,000 person-years
indicates that injury prevention strategies tailored to this workforce are needed. The
downward trend of injury fatalities at the workplace observed from the 1960's onward may
be ascribed partly to the implementation of more stringent safety regulations in the
141
workplace as well as the automation of production processes experienced by all industrial
sectors. The impact of a single protective measure in reducing the number of deaths, such as
the one observed by the mandatory use of buoyancy equipment proves that passive strategies
(i.e. not requiring the active participation of the worker) are effective for injury control.
Environmental factors were identified as contributory causes in the majority of the fatal
injuries occurring at the workplace. Similarly, the most frequent Coroner's jury
recommendations were related to the need for improving the workplace environment. The
majority of factors thus corresponded to the pre-event phase of the incident according to the
Haddon matrix: e.g. unsafe work stations, inappropriate maintenance of
equipment/machinery, job process (physical environment) and inappropriate safety policies,
communications, training, supervision (socio-cultural environment). Equipment failure and
inadvertent starting of equipment were identified factors in the pre-event phase in relation to
the equipment (carriers of energy) producing the injury. Most of these conditions are
amenable to correction by engineering control and enforcement of safety regulations.
Another interesting finding is the absence of positive alcohol results in the deaths analyzed.
This indicates that, in this workforce, alcohol was not a factor for being fatally injured at the
workplace.
The data analyzed also pointed to a few characteristics common to fatal injuries that deserve
further research. Older workers were at higher risk of injuries than their younger fellow
workers and 50 % of the workers were alone at the moment of the incident. It has been
142
suggested that one of the characteristics that distinguish fatal from non-fatal injuries is
working alone, without supervision. Fatigue may also have an effect on the risk of injury. In
our study, 38% of the deaths with reports occurred between 2:00 am and 7:00 am and on
Mondays.
Future research should include the study of psychosocial factors that reflect the workplace
organization and affect the well-being of the workforce. Low lost-time frequency rates have
been associated with demonstration by management of its concern for the employees, greater
involvement of workers in general decision making, greater willingness of the health and
safety committee to solve problems internally as well as greater experience of the workforce
(Shannon, et al., 1994).
7.2.1 Implications for public health policy
Attention should be focused on work-related fatalities occurring among workers in
occupations at highest risk of injury (i.e. machine operators/clearers; mobile equipment
operators, and skilled trades). Another way of establishing priorities for prevention
countermeasures is to focus on groups of fatalities that share common circumstances or
patterns. For example, we found that most fatal injuries occurred while workers were
performing routine tasks (i.e. clearing jammed logs, repairing equipment) which suggests that
redesign of job procedures or equipment may be necessary. Similar patterns regarding injury
event types such as "inadvertent start of equipment" (i.e. failure to lock out equipment) point
to situations that may require consideration of the multiple factors that may be involved when
there is no compliance with safety regulations. One could label this as an unsafe act on the
143
part of the worker even when the unsafe act may be a standard operating procedure of the
mill. The findings from this study, in agreement with other reports of non-fatal injuries,
suggest that sawmill workers are routinely exposed to "normal" hazardous situations when
they get injured (Larsson, 1991). Therefore, countermeasures should focus on safer ways of
doing routine tasks such as redesigning the job or developing special tools.
From the point of view of planning injury control strategies, our findings suggest that
prevention measures directed at modifying the workplace physical environment should be
prioritized to reduce the unnecessary loss of lives from preventable causes. However, to be
maximally effective in preventing injury occurrence and severity it is necessary to develop
countermeasures that take into consideration the full range of factors (human, equipment and
environment) interacting in each of the three phases: pre-event, event and post-event.
Passive countermeasures are preferable to active measures that require voluntary action from
the worker. Finally, cost and effectiveness are important considerations since frequently
prevention measures are chosen without previous evaluation of their efficacy (Haddon and
Baker, 1981).
It has been indicated that fatal injuries are different from non-fatal injuries in terms of the
type of injury and the circumstances surrounding the incident (Salminen, et al., 1992). Fatal
work-related injuries are primarily the result of being struck by a falling object, or being run
over by a moving vehicle. Also, injuries to the head or trunk are more likely to be fatal than
injuries to other parts of the body. Such fatal injuries are more likely to occur when the
worker is alone, without supervision, and in situations where injuries have previously
144
occurred. Our results suggest that sawmill workers were fatally injured in circumstances
similar to the ones reported for non-fatal injuries in previous studies (Larsson, 1991;
Laflamme and Cloutier, 1989). This is encouraging because it implies that by focusing on the
circumstances identified, not only are we addressing the most severe injuries (and less
frequent), but also the most frequent, less severe injuries. Thus the greatest benefit can be
expected.
7.3 All fatal injuries
One interesting finding of the study is the significantly higher risk of fatal motor vehicle
crashes and suicide among workers living in isolated towns. The socio-economic
characteristics of these mill towns are 1) the economic dependence of the community on a
company and 2) the social isolation of the residents and 3) the lack of opportunities for
children and women. Furthermore, residents of rural areas drive more miles, usually on
poorer roads and at greater speed than residents of urban settings.
The contribution of this study is that it completed the characterization of the broad pattern of
mortality from injuries among sawmill workers from 1950 through 1990. It was possible to
quantify the magnitude of both the absolute and relative risk of fatal injuries in different
settings. Interestingly machinery-related injuries were the second leading cause of
unintentional injury deaths in this cohort, and the only cause with significantly more deaths
than expected when compared to the general BC population. While the increased risk of
mortality from machinery-related injuries was expected given the physical environment of a
sawmill, what was not expected is the fact that there were many fewer deaths from non-
145
work-related injuries among these workers than in the general population. The results of
previous mortality studies in forestry workers indicated that the opposite result was more
likely. In addition it has been suggested that blue collar workers operating machinery tend to
experience more depression and worse global health than those employed in managerial or
professional jobs (Grosch and Murphy, 1998). Furthermore sawmill jobs may comprise
working rotating shift schedules, and overtime. These factors may result in fatigue and affect
the risk of injuries outside the workplace. Our results indicate that sawmill workers are at
greater risk of fatal injuries at work than at other settings. The causes of this different risk can
not be explained with the data available in this study. However, our findings suggest that the
workplace environment plays a critical role in the occurrence of fatal injuries at work. If
these fatalities were solely related to personal factors such as risk-taking behaviour or
carelessness or fatigue, then the same factors would likely effect the risk of fatal injuries
away from work.
7.3.1 Implications for public health policy
The highest fatality rates of motor vehicle crashes and suicides observed in the isolated mill
towns of B.C. indicate where countermeasures should be first implemented. Consideration
should be given to the particular environmental and socioeconomic characteristics of the
region that may be contributing to this increased risk of fatal injuries.
The significantly lower risk of fatal motor vehicle crashes and suicides in the occupational
group of "skilled labour" prompts a question regarding the relative impact of income and
education on health outcomes. Why were workers who are between the occupational
146
categories with the highest and lowest level of income and education (tradesmen and
unskilled labour respectively) at the lowest risk? Studies addressing other important
determinants of health such as housing, social support, self-esteem, and lifestyle are
warranted to understand better what makes some people healthier than others (Evans, et al.,
1994).
More funding should be made available for research into the risk factors for severe non-fatal
as well as fatal injuries in order to plan preventive strategies. The implementation of cost-
effective countermeasures will result in a significant reduction of the social and economic
costs of preventable injury which is the second most expensive disease category for
Canadians (Wigle, et a l , 1991).
7.4 Limitations
There are some limitations of the study that mostly derive from the research design.
One limitation is related to the small number of deaths included in the analyses. This was the
result of the criteria used to define the follow-up period in this investigation. Since the aim of
our study was to characterize the mortality from injuries among sawmill workers, only fatal
injuries that occurred to our cohort members while actively employed at any of the study
sawmills were analyzed. This criterion was applied to the study of both on-the-job as well as
off-the-job fatal injuries (i.e. chapters 5 and 6). Consequently, the small number of cases
precluded more detailed analysis of the cohort mortality and limited the statistical precision
of the estimates. For example, it was not possible to model the effect of age, seniority and
calendar period on mortality by specific injury type.
Another limitation derives from the quality of information from the Chief Coroner's Office
records and the lack of consistency in recording data on factors relevant to the fatal incidents.
The breadth of information of the investigation reports varies from coroner to coroner due to
the absence of a standardized format for data collection. The lack of standardized procedures
for the Coroner to investigate injury deaths has also been recognized in other countries like
U.S and England (Hanzlick and Parrish, 1996; Gaffney, 1993; Runyan et al., 1994). Several
reasons, including differences in statutes, funding, staffing, training, automation and methods
of managing records have also been cited as important determinants of the quality of
Coroners data (Hanzlick and Parrish, 1996). In spite of the limitations, Coroners records are
the best available source for epidemiologic research of fatal injuries.
Furthermore, in our study, for most of the factors included in the descriptive analysis of the
fatal injuries, the lack of proper denominator precluded any definitive conclusion about the
role of these factors on the injury event. For example, the finding that the highest proportion
of work-related deaths occurred between 6:00 and 7:00 am and also at 10:00 pm would
suggest the effect of fatigue but this can not be definitively concluded with the data available.
The generalizability of our results may be limited by the over-representation of large mills in
our study. Punnett (1992) has reported that largest mills have lower injury rates than smaller
companies. Large companies are likely to have more resources available to implement
occupational health and safety programs. If that is the case, then the mortality rates
estimated in this study are likely to be conservative compared to the experience of the entire
148

industry. Therefore, while the results may apply to large mills, generalizability beyond them
is questionable.
With respect to the analyses of the cohort mortality for all types of injuries, reported in
chapter 6, two different approaches were used. First, SMRs were computed using the B.C.
general male population as the standard for calculating expected deaths. The use of an
external population as a reference has been criticized because it provides a summary measure
of effect but it doesn't give information on exposure effects that may be different among
subgroups of the study population (Chiazze, 1976). In addition, because the external general
population is composed of people too i l l to work as well as employed individuals, the
estimated SMRs will underestimate any true decreased or increased risk (Hennekens and
Buring, 1987).
Those in favour of using SMRs as the primary analytic method for occupational cohort data
argue that one of the advantages of using national or provincial rates to compare mortality
experience of exposed cohorts would be that rates for the general population are readily
available. Secondly, national or provincial rates generally provide stable stratum specific
rates which improve the precision of the estimates for the study population (Checkoway et al.
1986).
Breslow (1990) discusses the problem of SMRs in terms of its susceptibility to selection and
confounding biases and proposes alternative analytic methods to control for confounding,
mainly through the use of Poisson regression analysis. The reason for using such
149

mathematical modeling is that there may be several factors that could influence the outcome
and should also be controlled to the greatest possible extent. For example, differences in
injury rates between the working population and those in the provincial comparison group
may reflect the different composition of the groups in terms of ethnicity, education,
socioeconomic status and lifestyle habits. Breslow concludes that despite its limitations, a list
of SMRs by cause of death provides a useful summary of the relative effects of cohort
membership on the risk of cause specific mortality.
Given the limitations of the SMRs, internal analyses were conducted comparing injury
mortality rates among subcohorts defined according to 1) occupational categories; and 2) age
groups, calendar period at risk, seniority in mill and region. Poisson regression techniques
were used to eliminate confounding within the limits of the data available. This approach
removed the differences in employment and socio-economic status noted with the use of an
external comparison group. Mortality rates were compared among subgroups controlling for
the confounding effects of different risk factors which were included in the regression
equation. For example, in chapter 6, the use of Poisson regression allowed us to identify the
group of youngest workers (i.e. 15 to 29 years) as the age category at the highest risk of
suicide. This increased risk was statistically significant after adjustment for the effect of
calendar period, seniority in the mill and region.
150
7.4.1 Implications for public health policy
The discussion of the limitations of this study prompts the following query: How can we
improve further research on the risk factors for injuries and identify the most effective
interventions to reduce injury morbidity and mortality?
According to experts in this field, the main components of any comprehensive plan to reduce
the toll of injuries should be surveillance and research (CDC, 1992; Saunders and Stewart,
1991; Pless, 1989; Waller, 1993). An injury surveillance system is important to describe and
monitor the injury problem. Surveillance data not only assist to determine the need for public
health action but to assess the effectiveness of preventive strategies.
Criteria for developing, implementing and evaluating an injury surveillance system have
been proposed by several authors( Rubens et al., 1995, Waller and Clemmer, 1993; Graitcer,
1987; Klaucke et al., 1988). In agreement with them, we propose that in order to improve
surveillance of work-related fatalities, the following actions be considered:
1) To use standardized industrial and occupational codes to record injury events. This will
facilitate the comparison of statistics at the provincial, national and international level. It
would be helpful i f both the B.C.Coroners Service and the Workers Compensation Board
of B.C. adopted these coding systems.
2) To use the E-codes from the most recent International Classification of Diseases to
classify fatal injuries. This will facilitate the identification of the various types of injury
when abstracting information from different sources.
3) To develop guideliness to standardize the data collection and recording processes used
by the Coroners Service to ensure comprehensiveness and consistency of the
investigation reports. In this regard, the format of the WCB Investigation Report provides
an example of the type of data relevant to the analysis of work-related fatal injuries.
4) To develop a system that takes into account the information contained in the narrative of
the Coroners Investigation reports. This will add important information on the pre-event
and event phases of the injury event. For example: what was the worker doing? what
went wrong? what was the contact? what equipment was involved? how did the incident
occurred? where did the event occur?
As a general rule it is necessary to develop a data collection system that describes in a more
comprehensive way the components of the preinjury and injury phases of injury event.
Research is the other priority area requiring attention because funds for injury investigation
and training programs for professionals are scarce. Research could be used to improve injury
surveillance systems and to develop and test hypothesis aimed at identifying specific risk
factors in special populations.
For example, the present investigation of injuries among sawmill workers not only has
identified job categories at higher risk of suffering fatal injuries on-the-job and off-the-job,
but has also generated hypotheses about other potential risk factors that hopefully could be
addressed in future studies. Being a workforce at high risk of injury disability future studies
could aim at identifying organizational risk factors for non-fatal injuries. We propose a
152

population-based case-control study where injured workers will be identified from W C B
claims and their injury experience compared to fellow workers (i.e. controls) from the same
company who had not suffered a work-related injury on that day, matched to the case on age.
A questionnaire would then be administered to both cases and controls to identify
organizational (e.g. work satisfaction, support from supervisor and management, working
hours), work environment (e.g., machinery, heights of work platforms), and personal (e.g.,
family support, age, experience) characteristics that may have been relevant to the injury
event. The case-control design would ensure that both numerator and denominator
information was available. Examining morbidity instead of mortality outcomes would allow
a large number of injured sawmill workers to be included so that differences in risk can be
estimated with precision. In addition, mills of various sizes could be included in the study so
that the sample will be representative of the entire industry and minimize the problem of
generalizability of the results.
153
Bibliography
Ager, B. " A Review of the Ergonomic Problems in Sawmills and Wood-Working Industries." In Proceedings of IUFRO Joint Meeting Divisions 3 and 5. Ergonomics in Sawmills and Woodworking Industries. Sweden, 1974.
Aminoff, S. "Accidents and Accident Risks Within the Sawmill Industry." In Proceedings of IUFRO Joint Meeting Divisions 3 and 5. Ergonomics in Sawmills and Woodworking Industries. Sweden, 1974.
Armstrong, B. "Choosing between SMR and Poisson Regression Analyses of Cohort Data." Progress in occupational epidemiology ed. Hogsted C. and C. Reuterwall 45-48. Elsevier Science Publisher B.V.,1988.
Asp, S., V . Riihimaki, S. Hernberg, and E. Pukkala. "Mortality and Cancer Morbidity of Finnish Chlorophenoxy Herbicide Applicators: an 18-Year Prospective Follow-up." American Journal of Industrial Medicine 26 (1994):243-253.
Baker, S., J.S. Samkoff, R. Fisher, and C.B. Van Buren. "Fatal occupational injuries." Journal of the American Medical Association 248 (1982):692-697.
Baker, S.P., B. O'Neill , M.J. Ginsburg, and G. L i . The Injury Fact Book. 2 n d . Edition. New York: Oxford University Press, 1992.
Baneryd, K. "Analysis of the Psychological Job Content in Sawmill Work." In Proceedings of IUFRO Joint Meeting Divisions 3 and 5. Ergonomics in Sawmills and Woodworking Industries. Sweden, 1974.
Berry, G. "The analysis of mortality by the subject-years method." Biometrics 39 (1983):173-184.
Breslow, N . "Statistical Issues in the Analysis of Data from Occupational Cohort Studies." Recent Results in Cancer Research 120 (1990):78-93.
Breslow, N.E. and N.E. Day. Statistical Methods in Cancer Research. Vol II.: The Design and Analysis of Cohort Studies. IARC Scientific Publications No.82. Lyon: International Agency for Research on Cancer, 1987.
British Columbia Ministry of Transportation and Highways. 1993 Traffic Accident Statistics. B.C. : Ministry of Transportation and Highways, 1993.
British Columbia Ministry of Health and Ministry Responsible for Seniors. BC-Injury Free-A Framework for Action. The Provincial Injury Prevention Plan for Children and Youth (Ages Birth to 24). Report of the Minister's Injury Prevention Advisory Committee. Victoria. B.C.: Ministry of Health and Ministry Responsible for Seniors, 1997.
154
British Columbia Provincial Health Officer. A report on the health of British Columbians: Provincial Health Officer's Annual Report 1995. Victoria: B.C. Ministry of Health and Ministry Responsible for Seniors, 1996.
British Columbia Provincial Health Officer. A report on the health of British Columbians: Provincial Health Officer's Annual Report 1996. Victoria: B.C. Ministry of Health and Ministry Responsible for Seniors, 1997.
British Columbia Vital Statistics Agency. Vital Statistics Quarterly Digest. Ministry of Health. Victoria, B.C., 6 (1997).
Canada Health and Welfare. Suicide in Canada. Report of the National Task Force on Suicide in Canada. Ottawa: Minister of National Health and Welfare, 1987.
Cassinelli, R., K.J . Kock, K. Steenland, S. Spaeth, and P. Laber. Life Table Analysis System for Use on the PC. User documentation PC LTAS. Version 1.0.c. NIOSH. Cincinnati: Division of Surveillance, Hazards Evaluation, and Field Studies, 2000.
CDC. Centers for Disease Control. Position papers from the third national injury control conference: setting the national agenda for injury control in the 1990s. Atlanta, Ga 1992. M M W R Vol . 41(1992):No. RR-6.
Checkoway, H. , N . Pearce, and D.J. Crawford-Brown. Research Methods in Occupational Epidemiology. New York: Oxford University Press, 1989.
Chiazze, L. "Problems of study design and interpretation of industrial mortality experience." Journal of Occupational Medicine 18 (1976): 169-170.
Chiu, W., S.R. Dearwater, D.J. McCarty, T.J. Songer, and R.E. LaPorte. "Establishment of accurate incidence rates for head and spinal cord injuries in developing and developed countries: A Capture-Recapture approach." The Journal of Trauma 35 (1993):206-21.
Colorado Department of Health. Colorado Population-based Occupational Injury and Fatality Surveillance System. Report 1982-1984. Health Statistics Section. Denver: Colorado Department of Health, 1984.
Conroy, C. "The Methodology of Fatal Occupational Injury Surveillance." American Journal of Public Health 83 (1993): 1491.
Cooke, W.N., and M.W.Blumenstock. "The Determinants of Occupational Injury Severity: The Case of Maine Sawmills" Journal of Safety Research 11 (1979):115-120.
Copeland, A.R. "Fatal Occupational Accidents- the Five Year Metro Dade County Experience, 1979-1983." Journal of Forensic Science 30 (1985):494-503.
155
Cormack, R. M . , Y . Chang, G.S. Smith. "Estimating deaths from industrial injury by captrure-recapture: a cautionary tale." InternationalJournal of Epidemiology 29 (2000):1053-1059.
Davies, H. , P. Demers, T. Kauppinen, and K. Teschke. "Industries Based on Biological Resources. Major Sectors and Processes: occupational hazards and controls." In Encyclopedia of Occupational Health and Safety, 4th Edition. International Labour Office. Editor: Mager Stellman J. Geneva, 1998.
De Haven, H. "Mechanical analysis of survival in falls from heights of fifty to one hundred and fifty feet." War Medicine 2 (1942):586-596.
DeMaria, E.J., P.R. Kenney, M . A . Merriam, L .A. Casanova, and D.S. Gann. "Survival after Trauma in Geriatric Patients." Annals of Surgery 206 (1987):738-743.
Demers, P. "Industries Based on Biological Resources. Disease and Injury Patterns." In Encyclopedia of Occupational Health and Safety, 4th Edition. International Labour Office. Editor: Mager Stellman J. Geneva, 1998a.
Demers, P. "Industries Based on Biological Resources. General Profile." In Encyclopedia of Occupational Health and Safety, 4th Edition. International Labour Office. Editor: Mager Stellman J. Geneva, 1998b.
Doering, M . , S.R. Rhodes, and M . Schuster. The aging Worker. Beverly Hi l l , C A : S A G E Publications, Inc., 1983:61-82.
Driscoll, T.R., G. Ansari, J.E. Harrison, M.S. Frommer, and E.A. Ruck. "Traumatic Work-Related Fatalities in Forestry and Sawmill Workers in Australia." Journal of Safety Research 26 (1995):221-233.
Evans, R.G., M . L . Barer, and T.R. Marmor.Ed. Why are some people healthy and others not? The determinants of health populations. New York: Aldine de Gruyter, 1994.
Fox, A.J . and F.F. Collier. "Low mortality rates in industrial cohort studies due to selection for work and survival in the industry." British Journal of Preventive and Social Medicine 30 (1976):225-230.
Frome, E.L. and H. Checkoway. "Epidemiologic Programs for Computers and Calculators Use of Poisson Regression Models in Estimating Incidence rates and Ratios." American Journal of Epidemiology 121 (1985):309-323.
Gaffey, W.R. " A Critique of the Standardized Mortality Ratio." Journal of Occupational Medicine 18 (1976): 157-160.
Gaffney B.P. "Use of Coroner's reports for surveillance of accidental death." Journal of Public Health Medicine 15 (1993):272-276.
156

Gallagher, R.P, WJ. Threlfall, P.R. Band, J.J. Spinelly, and A.J . Coldman. Occupational Mortality in British Columbia 1950-1978. Catalogue No. 84-544.0ttawa: Minister of Supply and Services Canada, 1986.
Gibson, J.J. "The contribution of experimental psychology to the formulation of the problem of safety- a brief for basic research." In Behavioural approaches to accident research. Association for the Aid of Crippled Children. New York, 1961.
Gordon, J.E. "The epidemiology of accidents." American Journal of Public Health 39 (1949):504-515.
Government of British Columbia. The Sawmilling Industry of British Columbia. Department of Industrial Development, Trade and Commerce. Victoria, B.C.: 1972.
Graitcer, P. "The Development of State and Local Injury Surveillance Systems." Journal of Safety Research 18 (1987): 191-197.
Green, L . M . " A cohort mortality study of forestry workers exposed to phenoxy acid herbicides." British Journal of Industrial Medicine 48 (1991):234-238.
Grosch, J.W. and L.R. Murphy. "Occupational Differences in Depression and Global Health: Results from a National Sample of U.S. Workers." Journal of Occupational and Environmental Medicine 40 (1998): 153-164.
Haddon, W. "Advances in the Epidemiology of Injuries as a Basis for Public Policy." Landmarks in American Epidemiology. Public Health Reports 95 (1980):411-421.
Haddon, W.Jr. " A Note Concerning Accident Theory and Research with Special Reference to Motor Vehicle Accidents." Annals of New York Academy of Sciences 107 (1963):635-646.
Haddon, W.Jr. "On the Escape of Tigers: An Ecologic Note." American Journal of Public Health 60 (1970):2229-2234.
Haddon, W.and S.P. Baker. Injury control. In: Clark C. MacMachon B, eds. Preventive and Community Medicine. Boston: Little and Brown Co, 1981.109-40.
Haddon, W.Jr., E. Schuman, and D. Klein. Accident Research, Methods and Approaches. New York: Harper & Row, 1964.
Hanzlick R. and R.G. Parrish. "The Role of Medical Examiners and Coroners in Public Health Surveillance and Epidemiologic Research." Annual Review of Public Health 17 (1996):383-409.
157
Hasselback, P. and C.I. Neutel. "Risk for commercial fishing deaths in Canadian Atlantic provinces." British Journal of Industrial Medicine Al (1990):498-501.
Health Canada. Suicide in Canada: Update of the report of the Task Force on Suicide in Canada. Cat No. H39-107/1995E. Ottawa: Mental Health Division, Health Services Directorate, Health Programs and Services Branch, 1995.
Hennekens, C. H. and J.E. Buring. Epidemiology in Medicine. Boston: Little Brown and Company, 1987.
Hertzman, C , K . Teschke, A. Ostry, R. Hershler, H. Dimich-Ward, D. Kelly, J.J. Spindly, R.P. Gallagher, M . McBride, and S. Marion. "Mortality and Cancer Incidence among Sawmill Workers exposed to Chlorophenate Wood Preservatives." American Journal of Public Health 87 (1997): 71-79.
Hi l l , I.D. "Computing man-years at risk." British Journal of Preventive and Social Medicine 26 (1972):132-134.
Himes, C.L., C C . Clogg. "An overview of demographic analysis as a method for evaluating census coverage in the U.S." Population Index 58 (1992):587-607.
Hook, E.B. and R.R. Regal. "The value of capture-recapture methods even for apparent exhaustive surveys." American Journal of Epidemiology 135 (1992):1060-1067.
Hook, E.B. and R.R. Regal. "Capture-recapture methods in epidemiology: methods and limitations." Epidemiologic Reviews 17 (1995):243-264.
Howard, G. Fatal Claims in Sawmills (classification 010501 to 010509) Analysis of Causes and Costs from 1985 to 1994. Final Report. Engineering Department. Vancouver, B.C.: Workers' Compensation Board of B.C., 1996.
Howe, G.R. and J.A. Lindsay. " A generalized record linkage computer system for use in medical follow-up studies." Computers and Biomedical Research 14 (1981):327-340.
Hyman, M . M . "Accident Vulnerability and Blood Alcohol Concentrations of Drivers by Demographic Characteristics." Quarterly Journal of Studies on Alcohol 29 (1968):34-57.
Jones, R.K. and K . B . Joscelyn. Alcohol and Highway safety 1978: A review of the State of Knowledge. AnnArbor, Mich.: Highway Safety Research Institute, University of Michigan, Report DOT HS-803 764, 1978.
Karasek, R., and T. Theorell. Healthy Work. Stress, productivity, and the reconstruction of working life. New York: Basic Books, Inc., 1990.
158
Keifer, M . , R. McConnell, A.F. Daniel, L. Rosenstock. "Estimating underreported pesticide
poisoning in Nicaragua." American Journal of Industrial Medicine 30 (1996): 195-201.
Kelsey, J., W.D. Thompson, and A.S. Evans. Methods in Occupational Epidemiology. New York: Oxford University Press, 1986.
Kisner, S.M. and S.G. Pratt. "Occupational Fatalities Among Older Workers in the United States: 1980-1991." Journal of Occupational and Environmental Medicine 39 (1997):715-721.
Klaucke, D.N. , J.W. Buehler, S.B. Thacker, R. Gibson Parrish, F.L. Trowbridge, R.L. Berkelman, and the Surveillance Coordination Group. "Guideliness for Evaluating Surveillance Systems." MMWR. 37 (1988):1-18.
Kraus, J.F. and L.S. Robertson. "Injuries and the Public Health" In: Maxcy-Rosenau-Last. Public Health & Preventive Medicine. 13 th Edition. 1021-1034. Connecticut: Appleton and Lange, 1992.
Labour Canada. Bulletin No. 14. Ottawa: Labour Canada, 1991.
Labour Canada. Employment Injuries and Occupational Illnesses 1985-1987. Catalogue No. L151-2068/90B. Ottawa: Labour Canada, 1990.
Labour Canada. Occupational Injuries and their cost in Canada 1987-1989.Ottawa: Labour Canada, 1989.
Laflamme, L. and E. Cloutier. "Typical Accident Scenarios in Sawmills: Their Distribution among Production Stages and Types of Machines." International Union of Forestry Research Organizations. Conference on Working Conditions in Woodworking Industry, Conference of Division 3 P3.03-04 Ergonomics in the Timber Industry. Lappeenranta, Finland, 1989.
Larsson, T.J. Safety in Sawmills- three Swedish studies-1988-1990. Stockholm:Institute for Human Safety and Accident Research (IPSO), 1991.
Last, J .M. "Health -whose responsibility is it anyway.? Canadian Journal of Public Health 75 (1984):410-41.
Lewis, R.J., and S.P. Cooper. "Alcohol, Other Drugs, and Fatal Work-related Injuries" Journal of Occupational Medicine 31 (1989):23-28.
Loimer, H. and M . Guarnieri. "Accidents and Acts of God: A History of the Terms." American Journal of Public Health 86 (1996): 101-107.
159
Loomis, D., V . Dufort, R.C. Kleckner, and D.A. Savitz. "Fatal Occupational Injuries Among Electric Power Company Workers." American Journal of Industrial Medicine 35 (1999):302-309.
Mac William, L. and L. Fortier. "Early Mortality due to Unintentional Injury in Canada, 1985." Chronic Diseases in Canada 8 (1987): 11
Marchack P. "Forestry Industry Towns in British Columbia." In Community and Forestry: Continuities in the sociology of natural resources. Ed. Lee, R.G. et al. Boulder: Westview Press, 1990.
Mason, K. A Correlation Between Types of Hazardous Conditions and Accident Rates. Vancouver: Workers" Compensation Board of British Columbia, 1973.
Mietinnen, O.S. "Standardization of risk ratios." American Journal of Epidemiology 96 (1972):383-388.
Millar, W. "Accidents in Canada, 1988 and 1993." Health Reports 7 (1995):7-16.
Millar, W. and O. Adams. Accidents in Canada. General Social Survey. Analysis Series. Housing, Family and Social Statistics Division. Catalogue No. l 1-612E No.3. Ottawa: Statistics Canada, 1991.
Millar, W.J., and J .M. Last. "Motor Vehicle Traffic Accident Mortality in Canada, 1921-1984." American Journal of Preventive Medicine 4 (1988):220-230.
Minister of Supply and Services and Minister of National Health and Welfare. The Health of Canadians. Report of the Canada Health Survey. Catalogue No. 82-538E. Ottawa: Minister of Supply and Services and Minister of National Health and Welfare, 1981.
NAICS -North American Industry Classification System, United States, 1997-. Virginia, U.S.: Department of Commerce. Technology Administration, 1997.
National Committee for Injury Prevention and Control "Injury Prevention: Meeting the Challenge." American Journal ofPreventive Medicine 5 (1989): 1-303 Supplement.
Nilsson, C. "Working Conditions in the Sawmill Industry: A sociopsychological approach based on subjective data." In Proceedings of IUFRO Joint Meeting Divisions 3 and 5. Ergonomics in Sawmills and Woodworking Industries. Sweden, 1974.
Notkola, V.J . , P. Martikainen, and P.I. Leino. "Time trends in mortality in forestry and construction workers in Finland 1970-195 and impact of adjustment for socioeconomic variables." Journal of Epidemiology and Community Health 47 (1993): 186-191.
160
O'Gara, K. California Sawmills and Planing Mills Industry: Analysis of Work Injuries and Illnesses. Division of Labor Statistics and Research. Department of Industrial Relations. San Francisco, CA, 1978.
Ore, T. and N . Stout. "Traumatic Occupational Fatalities in the U.S. and Australian Construction Industries." American Journal of Industrial Medicine 30 (1996):202-206.
OSHA. Occupational Safety and Health Administration. Coping with hazards in Sawmills. Ocupational Safety Training. University of Wisconsin- School for Workers. Wisconsin, June 1976.
Ostry, A. , S.A. Marion, L. Green, P.A. Demers, R. Hershler, S. Kelly, K. Teschke, and C. Hertzman. "Downsizing and Industrial Restructuring in Relation to Changes in Psychosocial Conditions of Work in British Columbia Sawmills." Scandinavian Journal of Work Health and Environment 26 (2000):273-277.
Parkinson, D.K, W.F. Gauss, J.A. Perper, and S.A. Elliott. "Traumatic Workplace Deaths in Allegheny County, Pennsylvania, 1983 and 1984." Journal of Occupational Medicine 28 (1986):100-102.
Pearce, N . , H . Checkoway, and J. Dement J. "Exponential Models for analyses of Time-related Factors, Illustrated with Asbestos Textile Worker Mortality Data." Journal of Occupational Medicine 30 (1988):517-522.
Peek-Asa, C , R. Erickson, and J.F. Kraus. "Traumatic Occupational Fatalities in the Retail Industry, United States 1992-1996." American Journal of Industrial Medicine 35 (1999):186-191.
Pelz, D.C. and S.H. Schuman. Motivational Factors in Crashes and Violations of Young Drivers. Ann Arbor, Mich.: University of Michigan, paper presented at the Annual Meeting of American Public Health Association, 13 October 1971.
Pless, B.I. "Challenges for Injury Prevention: Two Neglected Aspects." Chronic Diseases in Canada 10 (1989):2.
Pratt, S.G., S.M. Kisner, and J.C. Helmkamp. "Machinery-Related Occupational Fatalities in the United States, 1980 to 1989." Journal of Occupational and Environmental Medicine 38 (1996):70-76.
Punnett, L. Case-Control Study of Sawmill Injuries in Maine. Final Report to the National Institute of Occupational Safety and Health. University of Massachusetts, Lowell. Lowell, M A . , 1994.
Punnett, L. Epidemiologic study of sawmill injuries in Maine. Final Report to The Centers for Disease Control. University of Massachusetts, Lowell. Lowell, M A . , 1992.
161
Rest, K . M and N . A . Ashford. Occupational Safety and Health in British Columbia: An Administrative Inventory. Richmond: Workers' Compensation Board of British Columbia, 1992.
Rice, D.P., T.A. Hodgson, and A . N . Kopstein. "The economic cost of illness: a replication and update." Health Care Financing Review 7 (1985):61-80.
Riley, R. and P. Paddon. "Accidents in Canada: mortality and hospitalization." Health Reports 1 (1990): 23-50.
Rivara, F.P. "Epidemiology of Childhood Injuries. Review of current Research and Presentation of Conceptual Framework." American Journal of Diseases of Children 136 (1982):399-405.
Robertson, L.S. Injuries: Causes, Control Strategies, and Public Policy. Lexington, Mass., DC: Heath, 1983.
Robertson, L.S. Injury Epidemiology. New York: Oxford University Press, 1992.
Rossignol, M . "Completeness of Provincial Workers' compensation Files to Identify Fatal Occupational Injuries." Canadian Journal of Public Health 85 (1994):244-247.
Rossignol, M . , and M . Pineault. "Fatal Occupational Injury Rates: Quebec, 1981 through 1988." American Journal of Public Health 83 (1993):1563-1566.
Rubens, A.J . , W.A. Oleckno, and L. Papaeliou. "Establishing Guidelines for the Identification of Occupational Injuries: A Systematic Appraisal." Journal of Occupational and Environmental Medicine 37 (1995): 151-159.
Runyan, C.W., D.Loomis, and J. Butts. "Practices of County Medical Examiners in Classifying Deaths as On the Job." Journal of Occupational Medicine 36 (1994):36-41.
Salisbury, D.A., R. Brubaker, C. Hertzman, and G.R. Loeb. "Fatalities among British Columbia Fallers and Buckers 1981-7." Canadian Journal of Public Health 82 (1991):32-37.
Salminen, S., J. Saari, K . L . Saarela, and T. Rasanen. "Fatal and non-fatal occupational accidents: identical versus differential causation." Safety Science 15 (1992): 109-118.
Saunders, L.D. and L . M . Stewart. " A Safer Canada Year 2000 Injury Control Objectives for Canada" In Proceedings of a symposium held in Edmonton, Alberta, Canada. May 21-22, 1991.
Schnatter, R.A., J.F. Acquavella, F.S. Thompson, D. Donaleski, and G. Theriault. "An Analysis of Death Ascertainment and Follow-up through Statistics Canada's Mortality Data Base System." Canadian Journal of Public Health 81 (1990):60-65.
162
Selvin, S. Practical Bio statistical Methods. California: Wadsworth Publishing Company, 1995.
Shannon, H.S., L. Hope, L. Griffith, and D. Stieb. "Fatal Occupational Accidents in Ontario, 1986-1989." American Journal of Industrial Medicine 23 (1993):253-264.
Shannon, H.S., V . Walters, W. Lewchuk, J. Richardson, L .A. Moran, T. Haines, and D. Verma. "Workplace Organizational Correlates of Lost-time Accident Rates in Manufacturing." American Journal of Industrial Medicine 29 (1996):258-268.
Sniezek, J.E., T .M. Horiagon. "Medical-Examiner-Reported Fatal Occupational Injuries, North Carolina, 1978-1984." American Journal ojIndustrial Medicine 15 (1989):669-678.
Spiegel, J. and A . Yassi. "Occupational Disease Surveillance in Canada: A Framework for Considering Options and Opportunities." Canadian Journal of Public Health (1991):294-299.
SERC Statistical Epidemiological Research Corporation. EGRET Reference Manual. Seattle (WA): Statistical Epidemiological Research Corporation, 1993.
Statistics Canada. Canadian Forestry Statistics 1992. Industry Division. Annual Survey of Manufactures Section. Catalogue 25-202. Ottawa: Statistics Canada, 1994.
Statistics Canada. Industry and the Class of Worker. The Nation. Ottawa: Statistics Canada, 1993.
Statistics Canada. National Population Health Survey. Overview. 1994-1995. Catalogue No. 82-567. Ottawa: Statistics Canada, 1995b.
Statistics Canada. Wood Industries. SIC 25,1993. Industry Division Annual Survey of Manufactures Section. Catalogue 35-250. Ottawa: Statistics Canada, 1995a.
Statistics Canada's Internet Site. Population Projections, http://www.statcan.ca. 23 Jan 2001.
Stout, N . , and C. Bell. "Effectiveness of source Documents for Identifying Fatal Occupational Injuries: A Synthesis of Studies. "American Journal of Public Health 81 (1991):725-728.
Stout, N .A. , E.L. Jenkins, and T.J. Pizatella. "Occupational Injury Mortality Rates in the United States: Changes from 1980 to \9%9." American Journal of Public Health 86 (1996):73-77.
Teschke, K. , A . Ostry, C. Hertzman, P. Demers, M.C. Barroetavena, H. Davies, H . Dimich-Ward, H. Heacock, and S. Marion. "Opportunities for a broader Understanding of Work and Health: Multiple uses of an Occupational Cohort Database." Canadian Journal of Public Health S9 (\998):\32-\36.
163
Tuk, T.A. and J. Macdonald. Suicide, Homicide, and Gun Deaths British Columbia: 1985 to 1993. Victoria, B.C.: Division of Vital Statistics, Ministry of Health and Ministry Responsible for Seniors, 1995.
U.S. Department of Transportation. Alcohol and Highway Safety. Report to the U.S. Congress. Washington, D C : U.S. Department of Transportation, 1968.
Waller, J.A. "Injury: conceptual shifts and preventive implications." Annual Review of Public Health 8 (1987):21-49.
Waller, J.A. Injury Control: A guide to the causes and prevention of trauma. Lexington, Mass., D . C : Health and Company, 1985.
Waller, J.A., Clemer D.I. A Scheme for Describing Injury Events. The Journal of Trauma. 1993; 35(6):909-919.
Waters, C , L. Gibbons, R. Semenciu, and Y. Mao. "Motor Vehicle Traffic Accidents in Canada, 1978-87 by Time of Occurrence." Canadian Journal of Public Health 84 (1993):58-59.
Wegman, D.H., and L.J. Fine. "Occupational Health in the 1990s." Annul Review of Public Health 11 (1990): 89-103.
Wen, C P . and S.P. Tsai. "Anatomy of the healthy worker effect- a critique of summary statistics employed in occupational epidemiology." Scandinavian Journal of Work, Environment and Health 8 (1982):48-52.
Wigle, D.T., Y . Mas, T. Wong, and R. Lane. "The economic burden of illness in Canada, 1986." Chronic Diseases in Canada 12 (1991): 1-37.
Wilkins, K . "The major causes of death among young adults: trends from 1926 to 1985." Chronic Diseases in Canada 10 (1989):3-7.
Wilson, R.J. A national household survey on drinking and driving. Knowledge, attitudes and behaviours of Canadian drivers. A report prepared for the Road Safety and Motor Vehicle Directorate. Catalogue No. TP5865-E62,68. Ottawa: Transport Canada, 1984.
Workers' Compensation Board of British Columbia. Accident Prevention Regulations. B.C.Reg.43/66. Vancouver, B.C.: Workers' Compensation Board of British Columbia, 1966.
Workers' Compensation Board of British Columbia. Annual Report 1969. Richmond, B.C.: Workers' Compensation Board of British Columbia, 1970.
Workers' Compensation Board of British Columbia. Annual Report 1999. Richmond, B.C.: Workers' Compensation Board of British Columbia, 2000.
164

Workers' Compensation Board of British Columbia. News. Volume 34, No. 2. Richmond, B.C.: Workers' Compensation Board of British Columbia, 1992.
World Health Organization: Manual of the International Classification of Diseases, Ninth Revision. Geneva: WHO, 1977.
165

Appendix A Location of study sawmills

Location of study sawmills
Mill - Region Mill - Region M i l l 1 - Vancouver Lower Mainland M i l l 3 - Vancouver Lower Mainland M i l l 5 - Vancouver Lower Mainland M i l l 2 - Vancouver Island (Chemainus) M i l l 4 - Vancouver Island (Port Alberni) M i l l 6 - Vancouver Island (Port Alberni) M i l l 8 - Vancouver Island (Youbou)
M i l l 9 - Vancouver Island (Tahsis) M i l l 10 - Vancouver Island (Nanaimo) M i l l 7 - Coast Garibaldi (Squamish) M i l l 16 - Coast Garibaldi (Powell River) M i l l 11 - Interior (Kelowna) M i l l 13 - Interior (Mackenzie) M i l l 15 - Interior (Mackenzie)
167

Appendix B - Data collection forms

HUMAN FACTORS
STUDY N° SEX
M f ~ i F n BIRTH DATE
~ I M r n . Y AGE
BIRTH PLACE: CANADA | | OTHER COUNTRY:.
MARITAL STATUS: S • M • W Q D | |
START DATE INDUSTRY D
START DATE JOB D
OCCUPATION:
1 1 i M l • l Y l | |
N |Y | | |
C H I L D R E N : Y • N • # C H I L D R E N :
S T A R T D A T E M I L L D 1 1 IMl | Y | | |
1 M | | Y | | |
INJURY DATE AND TIME D 1 1 | M | 1 | Y | I I IAM I I I I I P M 1 1 :l 1
ACTIVITY AT TIME OF INJURY:
EMPLOYMENT STATUS: EMPLOYED | | UNEMPLOYED | | RETIRED | |
TRAINING RECEIVED: Y u N L
PROTECTIVE EQUIPMENT USED: Y • ALONE AT SCENE OF INJURY Y n PART OF BODY:
CHEST ABDOMEN MULTIPLE SITES
HEAD/FACE UPPER EXTREMITIES LOWER EXTREMITIES
INTERNAL ORGANS .
TYPE OF EVENT: FALL-FROM ELEVATION FALL-SAME LEVEL STRUCK AGAINST STRUCK BY RUBBED-ABRADED
CAUGHT IN/UNDER/BETWEEN .
SOVEREXERTION VEHICLE ACCIDENT OTHER
CAUSE OF DEATH: #1:
#2:
#3:
#4:
AUTOPSY Y | | N | | SUBSTANCE CONCENT. SPECIMEN
ALCOHOL BENZODIAZEPINE MEDICATION
BASIC DRUGS I [OTHER ACID DRUGS OPIATE .
HEALTH PREVIOUS TO ACCIDENT: RESPIRATORY DISEASE ALCOHOL/DRUG ABUSE
HEALTHY PSYQUIATRIC DIS. MEDICATION USE
CARDIOVASCULAR/HYPERTENSION OTHER CHRONIC DISEASE

V E H I C L E FACTORS
STUDY N°
Y N TYPE O F ENERGY • PROPER TOOL FOR TASK • • MECHANICAL • EQUIPMENT FAILURE • • ELECTRICAL • FAILURE SAFETY DEVICES • • CHEMICAL • PROPER FRCCSDURES • • THERMAL • PROPER MAINTENANCE O F EQUIPMENT • • RADIANT
SOURCE O F INJURY 1 • 2 • 1 2
HAND T O O L S
1 • 2 • MATERIAL HANDLING EQUIPMENT • • SAW • • : LADDER • • CONVEYOR • • MACHINERY • • W O O D / P L A N K S / B O A R D S / L O G S • • HOISTING APPARATUS • • FIREARM • • PERSON • • MOTOR VEHICLE (INDUSTRIAL) • • WORKING SURFACE • • MOTOR VEHICLE (ROAD/HIGHWAY) • • OTHER • •
NATURE O F INJURY
A S P H Y X I A / S T R A N G U L O R O W N I N G • A M P O T A T I O N • F O E C N I N G •
B U R N S • C O N C U S S I O N • M U L T I P L E INJURIES •
B R U I S E ' C O N T U S S y C R U S H I N G fj F R A C T U R E Q C U T / L A C E R A T I O N / P U N C T U R E Q
OTHER Q
ADDITIONAL INFO:
170
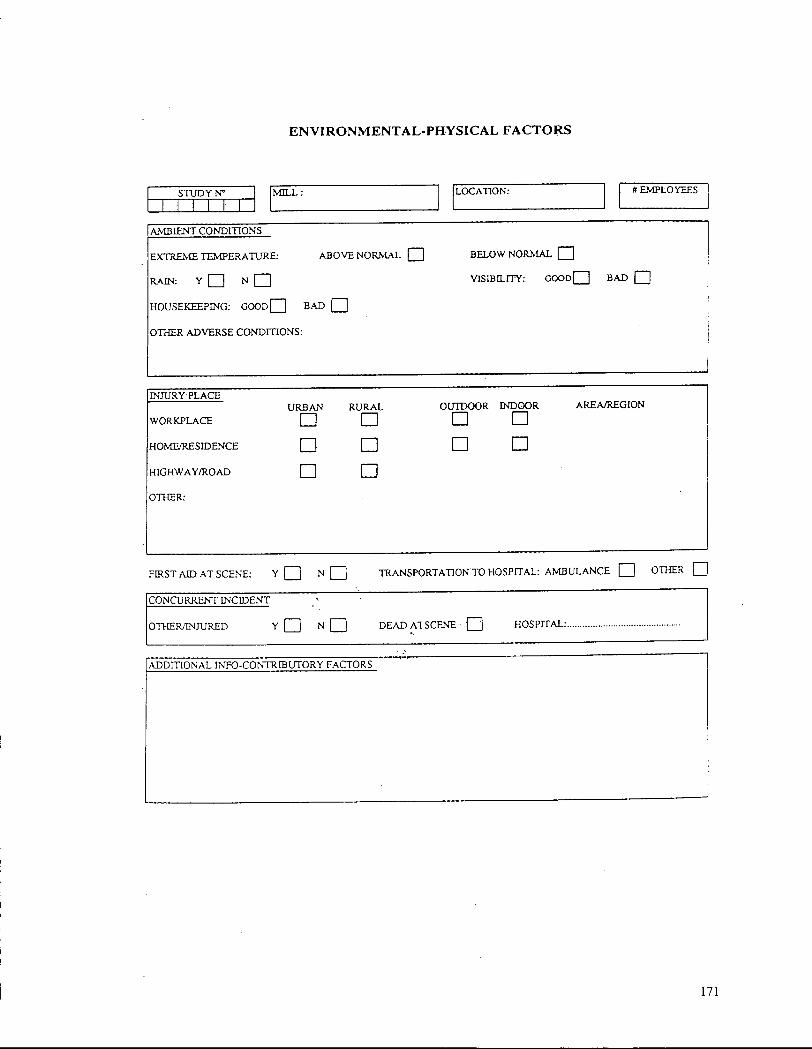
E N V I R O N M E N T A L - P H Y S I C A L F A C T O R S
STUDY N ° MILL : L O C A T I O N : # E M P L O Y E E S
AMBIENT CONDITIONS
EXTREME TEMPERATURE: ABOVENORMAL • BELOW NORMAL |~]
RAIN: Y • N • VISIBD_rTY: G O O D | | B A D | |
HOUSEKEEPING: GOQp| | BAD f J J
OTHER ADVERSE CONDITIONS:
INJURY PLACE
WORKPLACE URBAN
•
RURAL
•
OUTDOOR
•
INDOOR
•
AREA/REGION
HOME/RESIDENCE • • • •
HIGHWAY/ROAD • •
OTHER:
FIRST AID AT SCENE: Y Q N Q TRANSPORTATION TO HOSPITAL: AMBULANCE • OTHER Q
CONCURRENT INCIDENT
OTHER/INJURED Y • N Q DEAD A l SCENE • HOSPITAL:..
.ADDITIONAL INFO-CONTRIBUTORY FACTORS
171

E N V I R O N M E N T A L SOCIO C U L T U R A L F A C T O R S
STUDY NP INQUIRY Q INQUEST •
Y N
SUPERVISOR P R E S E N T • j |
WRITTEN S A F E T Y P R O C E D U R E S REQUIRED • | |
S A F E T Y COMMfTTES • O
Y N • • W C B R E P O R T
TRAJNING/INSTRUCTIONS PROVIDED • •
UMON • •
VIOLATIONS OF OHS REGULATIONS
WCB FINDINGS-INCIDENT ATTRIBUTED TO: WORKPLACE/ORGANIZATIONAL [ | HUMAN FACTORS [_|
ACTION TAKEN AS A RESULT OF THE ACCIDENT:
Y N
FAMILY PROBLEMS • f £ ]
WORKPLACE PROBLEMS • •
EMOTIONALLY STABLE Q
CORONER'S CLASSIFICATION OF DEATH
SUICIDE • ' HOMICIDE • ACCIDENTAL Q
NATURAL UNDETERMINED | |
ADDITIONAL INFO - CORONER'S RECOMMENDATIONS: Y/N

Appendix C - Job title groupings according to task, process area, and skill level

Similar task Job Title
Foreman/Supervisor Dept Foreman
Logs Foreman
Manager/Superintendent
M i l l Foreman
Yard Foreman
Inspector, grader, other skilled worker (non tool user) Grader
Ki ln Operator
Marker
Scaler
Scowman
Stenciller
Tallyman
Machine operators/attendants/clearers/sorters Barker Operator
Boomman
Breakdown
Chipnsaw Operator
Chipper Feeder
Chipper Operator
Cut-Off Sawyer
Dogger
Dropsorter
Edger Operator
End Loader Operator
End Sealer
Gang Sawyer
Head Sawyer
Hog Operator
Hoist Operator
J-Bar Sorter Operator
J-Bar Sorter Patrolman
Jump Rolls Operator
Leverman
Log Deck Operator
Package Press Operator
Planer Feeder
Planerman
Pony Edger Operator
Resawyer

Similar task Job Title
Machine operators/attendants/clearers/sorters Sawyer
Setter
Stacker Operator
Tailsawyer
Timber Deckman
Trimmer Operator
Unscrambler Operator
Material handling/unskilled Blockman
Casual Labour
Clean Up
Helper
Labour
Lumber Straightener
Offbearer
Slab Picker
Slipman
Spotter
Swamper
Wire Tie
Woodpicker
Mobile equipment operator Boat Operator
Carrier Driver
Cat Operator
Crane Operator
Forklift
Log Loader Operator
Truck Driver
Non-wood industry & non-production Clerk
Fire Protection
First A i d
Shortage Clerk
Watchman
Yard Locomotive
Skilled trades (Use tools) Benchman
Carpenter
Chipper Maintenance
Electrician

Similar task
Skilled trades (Use tools)
Job Title
Machinist
Mechanic
Millwright
Oiler
Painter
Pipefitter
Power House Maintenance
Sawfiler
Sawfiter
Steam Engineer
Utility
Welder

Process Area Job Title
Chipping and related op. Chipper Feeder
Chipper Operator
Scowman
Clean-up
Debarking
General Plant functions
Casual Labour
Clean Up
Helper
Labour
Barker Operator
Clerk
Fire Protection
First Aid
Manager/Superintendent
Shortage Clerk
Watchman
Ki ln drying Ki ln Operator
Maintenance Benchman
Carpenter
Chipper Maintenance
Electrician
Machinist
Mechanic
Millwright
Oiler
Painter
Pipefitter
Power House Maintenance
Sawfiler
Sawfiter
Steam Engineer
Welder
Non-cutting equipment- (Sorting and clearing equipment) Breakdown
Dropsorter
J-Bar Sorter Operator
J-Bar Sorter Patrolman
Jump Rolls Operator

Process Area Job Title
Non-cutting equipment- (Sorting and clearing equipment) Leverman
Log Deck Operator
Tailsawyer
Timber Deckman
Planing Planer Feeder
Planerman
Sawing, trimming and edging
Sorting and grading
Chipnsaw Operator
Cut-Off Sawyer
Dogger
Edger Operator
Gang Sawyer
Head Sawyer
Hog Operator
Pony Edger Operator
Resawyer
Sawyer
Setter
Trimmer Operator
Unscrambler Operator
Utility
Grader
Lumber Straightener
Offbearer
Slab Picker
Spotter
Woodpicker
Stenciling, packaging, shipping End Loader Operator
End Sealer
Marker
Package Press Operator
Stacker Operator
Stenciller
Tallyman
Wire Tie
Yard and pond Blockman
Boat Operator

Process Area Job Title
Yard and pond Boomman
Carrier Driver
Cat Operator
Crane Operator
Forklift
Hoist Operator
Log Loader Operator
Logs Foreman
Scaler
Slipman
Swamper
Truck Driver
Yard Foreman
Yard Locomotive

Skill level Job Title
Clerical Clerk
Shortage Clerk
Maintenance Benchman
Carpenter
Chipper Maintenance
Electrician
Machinist
Mechanic Millwright
Oiler
Painter
Pipefitter
Planerman
Power House Maintenance
Sawfiler
Sawfiter
Steam Engineer
Welder
Yard Locomotive
Boat Operator
Carrier Driver
Cat Operator
Chipnsaw Operator
Crane Operator
Cut-Off Sawyer
Edger Operator
First A i d
Forklift
Gang Sawyer
Grader
Head Sawyer
Hoist Operator
J-Bar Sorter Operator
Ki ln Operator
Log Deck Operator
Log Loader Operator
Marker
Package Press Operator
Skilled labour Barker Operator

Skill level Job Title
Skilled labour
Unskilled Labour
Pony Edger Operator
Resawyer
Sawyer
Scaler
Stacker Operator
Tallyman
Timber Deckman
Trimmer Operator
Utility
Dept Foreman
Logs Foreman
Manager/Superintendent
M i l l Foreman
Yard Foreman
Blockman
Boomman
Breakdown
Casual Labour
Chipper Feeder
Chipper Operator
Clean Up
Dogger
Dropsorter
End Loader Operator
End Sealer
Fire Protection
Helper
Hog Operator
J-Bar Sorter Patrolman
Jump Rolls Operator
Labour
Leverman
Lumber Straightener
Offbearer
Planer Feeder
Scowman
Setter
Slab Picker
Slipman
Spotter

Skill level Job Title
Unskilled Labour Stenciller
Swamper Tailsawyer Truck Driver Unscrambler Operator Watchman Wire Tie Woodpicker

Appendix D - External causes of death categories by ICD revision
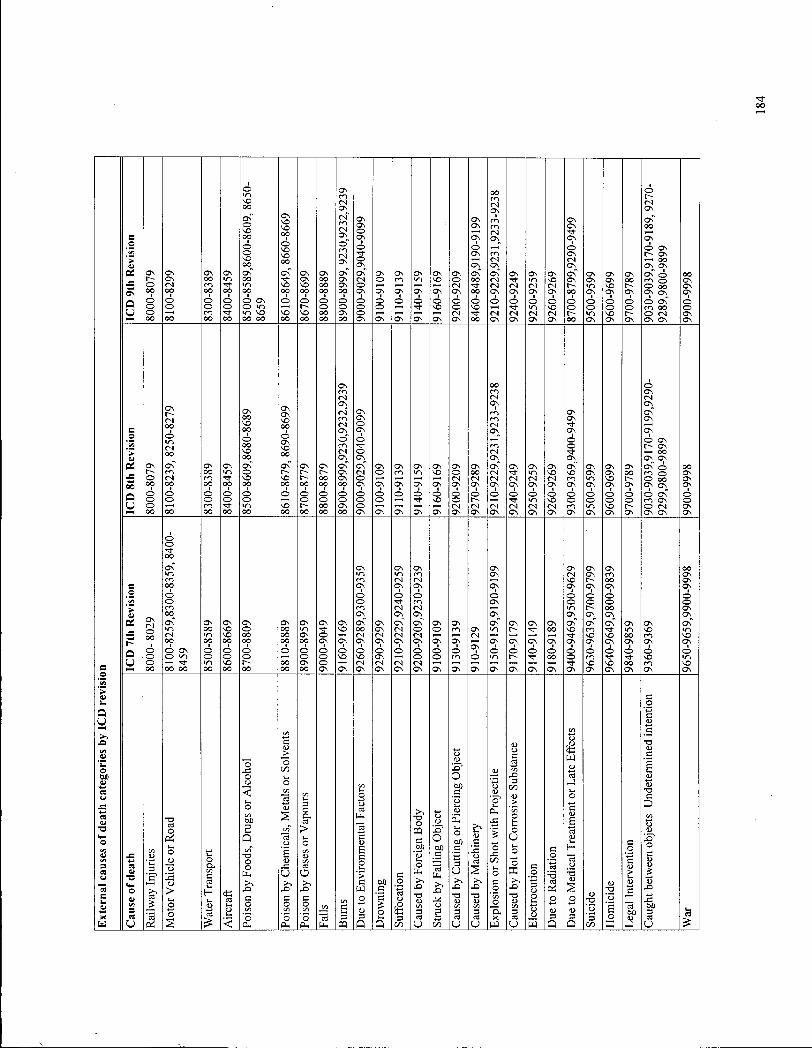
> OS
ON Q U
o 00 I o o o
ON o so 00 I o o NO oo
O OS o «-> KO so OO 00
OS SO so 00 o so SO OS so
so oo
OS r-o oo o o o oo
o o 00
o oo so °°» Os" o SO oo I o o 00
OS OS so oo o OS so oo Os" r-SO
OS 00
, 9230,9232,923 co
CN OS
, 9230,9232,923
OS Os co OS
, 9230,9232,923
OS Os co Os
, 9230,9232,923
o CN
, 9230,9232,923
OS OS os OS
, 9230,9232,923
o o o
, 9230,9232,923
t̂- OS co OS
, 9230,9232,923
o CN CN , 9230,9232,923
Os OSK CTs^ OS OS OS OS Os" OS OS Os OS OS os" os" OS OS OS Os" OS OS OS OS 00 OS <N o co «o SO o oo CN "3- >o so OS OS Os oo SO 00 OS o CN 1̂- CN <N CN ( N r~ </"> SO 00 00 00 OS OS OS OS OS OS oo OS OS OS OS oo OS OS OS o o o o o o o o o o o o o O o o o o o o o o SO o so •* in so o o o o SO oo OS o <N "d- CN rs| (N <N r- <n so r-oo oo oo OS OS OS OS OS OS oo OS OS OS OS oo OS OS OS
OS oo co co CM CM OS Os CN OS co OS co OS co OS CM o CN -d-OS OS °\ os o" o o co co o <N o CN OS Os OS
OS OS OS- os" OS OS OS OS OS OS os" OS OS OS Os" OS OS OS r- OS CN o co ' O so o oo CN «-> SO so OS OS 00 oo OS o <N <N (N CN CN CN m </-> so r-oo oo 00 OS OS Os OS OS OS OS OS OS OS Os Os OS OS OS o o o o o o o o o o o o o o o o o o o o o o o SO o r- •q- <n SO o o o o r- 00 OS o O J CN CN CN CN CM >o SO l> 00 00 00 OS OS Os OS OS OS OS OS OS OS OS Os Os OS OS
OS OS Os OS OS OS OS «o «-l m OS CN OS CO co CN <N SO r- oo Os OS OS OS Os OS OS o o o o o o o o co Os o o o co <N CN 1/1 00 OS °\ °\ °\ OS OS OS
OS Os Os Os" OS os" os" OS OS os" OS OS OS Os" Os" Os" OS «n SO oo OS CM o o CO OS «/-> r- oo SO m OS o CN CN CN ( N <N 3̂- so so oo 00 OS OS OS OS OS OS OS OS Os •
OS OS OS OS OS OS OS OS o o o O o o o o o Os • o o o o O o o o o o SO SO OS o o co o «/-> r-- 00 o m OS o CN CN CN <N 1—1 »—< f—1 .—i «—i — so so oo oo Os Os OS OS OS OS OS OS OS OS OS OS OS OS OS Os OS
<u o ffec
ts
I w x 1 in O J3
ing1 3
m ors
ing1
jec 00
<u o
apou
r
IFac
t
o Pie
rc
:hP
rp
TOSJVi
men
t
> cd m X?
gor & o
O en
c o gor
ne u ID c
Gas
es i
viro
nm
c For
eig
Fal
ling
Cut
tin
Mac
hi
or S
ho
Hot
or
ion
c o .S3 id
ical
T
rven
tio
by
En 60
c
ffoc
atio
by
>> by
by
on by 3
o Rai
u S
de u UOSI in rn
s o
owni
ffoc
atio
used
uck
1
used
use
d
plos
i
use
d
lect
ro^ o
u o 1) ic
ide
imic
i
gal
Ii
o 3 3 cd S3 cd X lect
ro^
3 3 3 <x m Q Q C/3 U </} U U w U w Q Q VI X 1—1
OS O OS r- os —< oo Os Os OS o m o O OO OS OS o os" CO oo O CN OS OS
o OS CN OS Os" OS OS o OS t-- OS oo Os OS Os" o oo CO o OS o oo OS OS °\ OS o Os" o ro OS o O CN OS OS OS OS
OS
Q u
o o o oo
o o ̂r oo
o o CO 00„ Os" >n CN oo
OS oo
O OS O «o — 00 oo
OS so SO oo I o o so
OS 00 oo
u
o en
•a 4> l> 1-O O
'I
60 l l O
i l
X! 60 3 cd U