mortality shifts and mortality compression. the case of norway
TRANSCRIPT
Discussion Papers
Statistics NorwayResearch department
No. 884 •September 2018
Nico Keilman, Dinh Q. Pham og Astri Syse
Mortality shifts and mortality compressionThe case of Norway, 1900-2060

Discussion Papers No. 884, September 2018 Statistics Norway, Research Department
Nico Keilman, Dinh Q. Pham og Astri Syse
Mortality shifts and mortality compression The case of Norway, 1900-2060
Abstract: Historically, official Norwegian mortality projections computed by Statistics Norway have consistently under-predicted life expectancy. The projected age distribution of deaths may be used to check if the official mortality projections are plausible. The aim of the paper is to verify whether the projections predict a continuation of the ongoing compression in mortality and of the steady upward shift in the ages at which people die. We use official period data on observed (1900-2015) and projected (2016-2060) sex- and age-specific mortality to estimate the age distribution of life table deaths. We analyse trends in life expectancy at birth, modal and median ages at death, and standard deviation of the age distribution at ages > 30. The historical shifts towards longer longevity are projected to continue into the future. The projections suggest a steady increase in the modal and the median age at death for men and women towards values between 90 and 94 years in 2060. At present these ages are in the range 83-90 years. Simultaneously, deaths become more concentrated around the mean, as the standard deviation of the age distribution is projected to fall continuously. Statistics Norway’s projection methodology is capable of tracking ongoing processes of mortality shifts towards higher ages and a compression of mortality around the modal and mean ages. Mortality projections could potentially benefit from including assessments of the age distribution of deaths.
Keywords: age distribution; life expectancy; median age; modal age; mortality compression; mortality delay; Norway; population projection
JEL classification: C53, I10
Acknowledgements: We are grateful for valuable input from Terje Skjerpen and Kjetil Telle. This study was funded in part by the Norwegian Research Council (grant number 256678).
Address: Astri Syse, Statistics Norway, Research Department. E-mail: [email protected]

Discussion Papers comprise research papers intended for international journals or books. A preprint of a Discussion Paper may be longer and more elaborate than a standard journal article, as it may include intermediate calculations and background material etc.
© Statistics Norway Abstracts with downloadable Discussion Papers in PDF are available on the Internet: http://www.ssb.no/en/forskning/discussion-papers http://ideas.repec.org/s/ssb/dispap.html ISSN 1892-753X (electronic)
3
Sammendrag
Siden begynnelsen av 1900-tallet har det vært en markant økning i forventet levealder i Norge, som i
de fleste andre utviklede land. At dødeligheten skifter til høyere alder har implikasjoner for offentlige
finanser og tjenester, særlig når det gjelder pensjonsopptak og helsekostnader. Når folk lever lenger
etter at de har gått av med pensjon, forlenges gjennomsnittlig pensjonsopptak. Selv om mange land har
implementert reformer for å minimere effekten av aldring ved å regne med lengre levetid i
pensjonssystemet, forventes pensjonskostnadene å fortsette å øke. Videre er helsekostnader sterkt
knyttet til alderen. Eldre mennesker har oftere flere helseproblemer. Som sådan bruker eldre
mennesker flere helsetjenester. Samtidig tyder noen undersøkelser på at behandlingene eldre personer
får, er billigere enn yngre personers. Imidlertid er eldre i gjennomsnitt dyrere enn yngre mennesker, da
de krever lengre sykehusopphold og behandlinger for flere sykdommer samtidig. Gode
befolkningsframskrivinger av modal alder ved død (det vil si den alderen hvor de fleste dør) og
sannsynligheten for å dø i den alderen, er derfor viktig for å sikre tilstrekkelig helse- og
omsorgsstyring for aldrende befolkninger.
Historisk har de offisielle norske dødelighetsframskrivingene beregnet av SSB konsekvent
underestimert den reelle økningen i forventet levealder. Den forventede aldersfordelingen av dødsfall
kan brukes til å kontrollere hvorvidt de offisielle dødelighetsframskrivningene er troverdige. Formålet
med denne artikkelen er å verifisere om projeksjonene forutser en fortsettelse av den pågående
komprimeringen i dødelighet, samt et stadig oppadgående skift i aldrene hvor mennesker typisk dør.
Vi benytter offisielle periodedata om observert (1900-2015) og framskrevet (2016-2060) kjønns- og
aldersspesifikk dødelighet for å estimere aldersfordelingen av dødsfall i en dødelighetstabell. Vi
analyserer trender i forventet levetid ved fødsel, modal og median alder ved død, og standardavviket
av aldersfordelingen for de som er eldre enn 30 år.
Framskrivningene fra 2016 tyder på en jevn økning i modal- og medianalder ved dødsfall for menn og
kvinner til mellom 90 og 94 år i 2060. I dag ligger disse i området 83 til 90 år. Samtidig blir dødsfall
mer konsentrert rundt gjennomsnittet, da standardavviket i aldersfordelingen forventes å falle
kontinuerlig. De historiske skiftene mot lengre levetid forventes dermed å fortsette i framtiden, og
SSBs framskrivingsmetode synes å være i stand til å spore løpende prosesser med dødelighetsskift i
høyere aldre og en dødelighetskomprimering rundt den modale alderen for død. Framtidige
dødelighetsframskrivninger kan potensielt dra nytte av å inkludere vurderinger av aldersfordeling av
dødsfall.
4
1. Introduction
Since the beginning of the 20th century, there has been a tremendous increase in the length of lives of
humans, in Norway as in most other developed countries. Currently, these countries have relatively
low levels of mortality. In Norway, life expectancy at birth for men and women has risen from 52 and
55 years in 1900, to 80 and 84 years in 2015. Improvement in longevity has been observed also in
other countries (Meslé and Vallin, 2011), and has resulted in a pronounced growth of the elderly
population worldwide (United Nations, 2013). In addition, the older population itself is ageing.
Globally, the share of older persons aged 80 years or over (the ‘oldest old’) was 14 per cent in 2013
and is projected to reach 19 per cent in 2050 (United Nations, 2013). If this projection is realized,
there will be 392 million persons aged 80 years or over by 2050, corresponding to a threefold increase
in the number of oldest old individuals.
Historically, official Norwegian mortality projections have consistently underestimated life
expectancy. During the past decade, Statistics Norway has computed these projections by means of a
modified Lee-Carter model. The resulting age distribution of life table deaths may be used to check if
the official mortality projections are plausible. The aim of this paper is thus to assess whether the
current method predicts a continuation of the ongoing compression in mortality and shifts to higher
ages. This is important and relevant because mortality shifts to higher ages has profound implications
for public finances and services, especially in terms of pension uptake and health care costs (Bloom et
al., 2015). In case people live longer after retirement, the average period of pension uptake is
prolonged. Although many countries have implemented reforms to help minimize the impact of ageing
by accounting for longer life expectancies in the pension system, pension costs are expected to
continue to rise (Bloom et al., 2015). Furthermore, health care costs are strongly associated with age.
Older people have more health problems and suffer more frequently from multi-morbidity (Verbrugge
et al., 2017). As such, older people use more health services (Bloom et al., 2015). At the same time,
some research suggests that the treatments older persons receive are cheaper than those of younger
persons. This has been shown, for instance, for mortality related health services costs (Gregersen,
2014). However, in total, older people are on average more expensive than younger people, as they
require longer hospital stays and treatments for multiple illnesses simultaneously (Bähler et al., 2015).
How increasing life expectancy affects the relationship between health and illness in older age
continues to be debated (Chatterji et al., 2015; Jagger et al., 2016; Zeng et al., 2017). A summary from
2015 concludes that there is some evidence of a compression of morbidity in high income countries, if
one considers trends in functioning and disability status. However, uncertainty remains about the
5
health of future older generations given different risk factor exposures in different cohorts and
increases in the prevalence of chronic diseases (Chatterji et al., 2015). A recent study reports less
cognitive impairment, more healthy life years and a decline in mild disability, but no decline in severe
disability (Jagger et al., 2016). The latter finding concurs with conclusions in yet another study stating
that lifespan extensions might expand disability of physical and cognitive functioning as an increasing
number of frail, elderly individuals survive with health problems (Zeng et al., 2017). Longer surviving
groups have nevertheless less average disability, and slower disability increases, than shorter surviving
groups (Verbrugge et al., 2017). Near death, however, disability rises sharply for all. Adequate
projections of the modal age at death (the age at which most people die) and the probability of dying at
that age thus appear essential to ensure adequate health and care management for ageing populations.
The arguments given above show that a reliable population projection of the elderly is of paramount
importance for the planning of welfare, in Norway inasmuch as in other developed countries.
Therefore, it is useful to check whether future mortality trends according to the official Norwegian
mortality projections, computed by Statistics Norway, are plausible. When preparing these projections
in 2016, Statistics Norway focused on historical and future trends in the life expectancy; see below for
illustrations. The life expectancy reflects the mean age at which people die. Other indicators, such as
the modal age at death or the statistical variation around the mean age, provide important additional
information – yet they were not part of the assumptions Statistics Norway formulated with respect to
future mortality. After the projections were published, we felt the need to assess the plausibility of
trends in future mortality by inspecting a broader range of indicators than just life expectancy.
The aim of the paper is to verify whether the 2016 population projections published by Statistics
Norway project a continuation of the ongoing trends. More specifically, we analyse whether mortality
becomes more concentrated around the mean age at which people die, and whether the steady upward
shift in the ages at death (“delay of mortality”) is expected to continue. We examine changes over time
in the distribution of the age at which people died from 1900 to 2015. Next, we use the projection
results from 2016 to 2060 to examine how this distribution is expected to change in the future. We
analyse the mean of the age distribution of life table deaths, i.e. the life expectancy at birth, as well as
the median and modal ages as measures of location of the distribution. We also examine historical and
projected values of the standard deviation of the distribution of deaths as a measure of spread, to
assess if a further compression of mortality is likely.
6
2. The age distribution of deaths
In earlier periods, the age distribution of life table deaths for humans was bimodal, with the first local
mode at the left end (age 0) and the second local mode at an old age (Horiuchi et al., 2013). In recent
years in low-mortality countries such as Norway, the peak at age 0 has become less pronounced. We
focus on the peak that is evident in old age and denote the corresponding age the modal age at death.
In the remainder of this paper, it is understood that the age distribution of deaths is one that follows
from a life table calculation based on age-specific death rates, not the distribution of empirically
observed or projected numbers of deaths. The reason is that historical variations in cohort size, caused,
for instance, by the baby boom after World War II or by business cycles, will affect numbers of deaths
many decades later, even if mortality rates are constant. Life table deaths only depend on death rates,
not cohort sizes.
Whereas both the life expectancy at birth (the mean of the age distribution) and the median age at
death are affected by mortality among infants, children and young and middle-age adults, the modal
age is solely determined by old-age mortality (Horiuchi et al., 2013). This feature gives a special
significance to the modal age because the lifespan extension during the recent few decades is mainly
due to the reduction in old-age mortality (Wilmoth et al., 2000). As such, the modal age at death may
be considered an equally adequate or more suitable longevity measure for assessing historical changes
in old-age survival, compared with the life expectancy or the median age. Whether this also is the case
for projected old-age survival in the future is less clear, and will be examined here.
The median, mean, and mode of the distribution of deaths are measures of location. A measure of
spread is given by the variance or the standard deviation of the distribution, reflecting the compression
of mortality around the mean or the modal age at death. A critical issue for the projection of mortality
is thus to investigate how future patterns in the variance of the age at death will unfold (Tuljapurkar
and Edwards, 2011), as well as related measures for mortality compression (Kannisto, 2000).
Indeed, when we observe that the variance does not change over time, while the mode increases, this
may be the consequence of a shift of the distribution to higher ages (ignoring possible changes in
higher order moments). In that case, we speak of a delay in the time of death, or shifting mortality. On
the other hand, a constant mode combined with decreasing variances reflects a compression of
mortality. In practice, a mixture of these two features is observed (Bergeron-Boucher et al., 2015).
7
3. Material and methods
We utilize data on the number of deaths and population size by age, sex, and year, obtained from
Statistics Norway for the period 1900-2015. We computed mortality rates, assuming piecewise
constant forces of mortality within one-year age intervals. We employed the rates in period life tables
to compute the number of deaths per age (0-108 years) in the life table population for each year for
which we have data. This variable is conventionally known as the dx-column of the life table. In case
one selects a life table radix equal to one, one can interpret the dx-column as the probability
distribution for the age at which the life table population dies. The purpose of the current analysis is to
check whether the historical trends in the year-on-year distributions of deaths diverges markedly
compared with the projected distributions. A comparison of distributions for a long series of years is
difficult. Therefore, we summarized these distributions by using three measures of location, and one
measure of spread, and inspected time series of those measures. We computed the life expectancy at
birth (e0) from the life tables. To find the modal and the median age, we used methods presented in
Canudas-Romo (2008), also used in Horiuchi et al. (2013) and Missov et al. (2015). We interpolated
between integer ages by assuming, for each year, a Gompertz model for the age pattern of the force of
mortality. Estimation was done by weighted regression with mortality rates as dependent variables,
and the inverse variances of those rate estimates as weights. Although not perfect, the Gompertz curve
describes mortality quite well between ages 30 and 90 (Wetterstrand, 1981), and hence we restricted
the fit to that age interval. The Gompertz model was used to extrapolate the distribution below age 30
and beyond age 90. Finally, we computed the standard deviation of the distribution, restricted to ages
30 and over as a measure of compression. Infant and child mortality contribute strongly to the
variation of total life length, but, as Tuljapurkar and Edwards (2011) argue, by including them, one
may mask important trends in old-age mortality - the focus of our analysis. We selected 30 as a cut-off
age, thus avoiding a possible effect of changes in the accident hump (elevated mortality in ages
between 15 and 30). As an alternative to the standard deviation, which measures variation around the
mean of the distribution, we could have used the standard deviation around the modal age. In the
section on results, we refer to a study by Canudas-Romo (2008) that uses the standard deviation
around the mode. It finds a more or less continuous compression of mortality in six developed
countries during the 20th century – qualitatively similar to our findings for Norway using the
traditional standard deviation.
For the years 2016-2060, we relied on the mortality rates used in the medium variant of Statistics
Norway’s 2016 official population projection. The methodology used to obtain the projected mortality
rates in those population projections is described in detail elsewhere (Aase et al., 2014). In short,
8
Statistics Norway projects future mortality rates by first using the 'product-ratio method' version of
Hyndman et al. (2013) of the Lee-Carter model (Lee and Carter, 1992). The method estimates
parameters for changes in the mortality level over time for the product and the ratio of men’s and
women’s mortality rates by age, based on data for the years 1990-2015. This relatively brief period
was selected because life expectancy increased rapidly during those years (in particular for men). At
the same time, old projections published by Statistics Norway until 1996 had systematically
underestimated life expectancy increases. Those old projections extrapolated mortality observed
during periods that started in the year 1968. In case Statistics Norway had based its 2016 mortality
projections on data for the years 1968-2015, it had run the risk of underestimating longevity
improvements. The product-ratio version of the Lee-Carter model maintains the coherence between
male and female mortality. A two components product-ratio version of the Lee-Carter model fits well
to the Norwegian data for ages 0-100. The first component describes the main trends in age specific
mortality in the period, while the second component covers systematic patterns that remained in the
residuals after the inclusion of the first component.
When extrapolating the trend over time in the observed development in mortality, Statistics Norway
assumed that each of the four-time indices of the model follows a 'random walk with drift' (RWD)
process. Thus, the year-on-year step for each index consists of a certain fixed term (the drift) plus a
normally distributed error term which has zero expectation. The result is an index with increasing
variance around a linear trend. We only show results for the main (medium) variant, represented by an
average across 2000 simulated trajectories by means of bootstrapping.
The life expectancy of men has increased more rapidly than that of women in Norway (and many
other countries) during the latest decades. A mechanical extrapolation of the Lee-Carter model would
have led to a cross-over of male and female rates for important ages. This is considered an implausible
development, and thus the drift estimates were changed such that the sex difference in life
expectancies is reduced from 3.7 years in 2015 to two years in 2060. Appropriate values of the drift
parameters were found after trial and error. A sex gap equal to two years in 2060 is clearly an arbitrary
choice, but it is in line with current opinions among demographers about a likely reduction in the
mortality sex gap in developed countries in the future; see, for instance, the paper by Raftery et al.
(2014) for references.
The relatively short base period in the official projections attempts to account for recent changes in life
style factors, morbidity, medical care and prognoses with implications for future mortality at various
9
ages. According to the official projections, many of the changes since 1990 are likely irreversible and
thus likely to continue also in the future. Examples include profound changes in for instance smoking
and health care advances for cardiovascular diseases and cancer, which have lowered mortality. On the
other hand, obesity is on the rise and likely to result in an increase in illnesses and deaths associated
with overweight (NCD-RisC, 2016). Furthermore, resistance to antibiotics has been hypothesized to
possibly increase in the future, which may result in an increase in infectious deaths. Lastly, dementia
is prevalent among the oldest old and thus likely to increase in the future. Deaths from dementia have
increased markedly over the last two decades, and currently account for around 8% of all deaths in
Norway (Norwegian Institute of Public Health, 2017).
Although the official projections extend to the year 2100, we have limited our analyses of projection
results to the shorter period 2016-2060. In the very long run, projections become extremely uncertain,
in particular for high ages. For instance, the 80 per cent prediction interval around the death rate of
men aged 90 in 2100 (an age close to the projected life expectancy that year) stretches from 60 per
cent to 160 per cent of the predicted rate value. The prediction interval widens rapidly, to between 38
and 254 per cent of the prediction at age 97. For women, the prediction intervals around age-specific
death rates at high ages are similarly uncertain in the very long run. We do not have much confidence
in the projection results at such a distant future.
As with the registered rates, we employ these extrapolated rates in a life table to estimate the number
of deaths per age (0-108 years), sex and projected year, and use the methods described above to
calculate the life expectancy, the modal and median ages at death, and the standard deviation of the
distributions of ages at death for men and women.
4. Results
Table 1a, and Figures 1 and 2 show a strong postponement of death during the previous century and
the past decade, as all three measures of location of the age distribution have increased markedly.
10
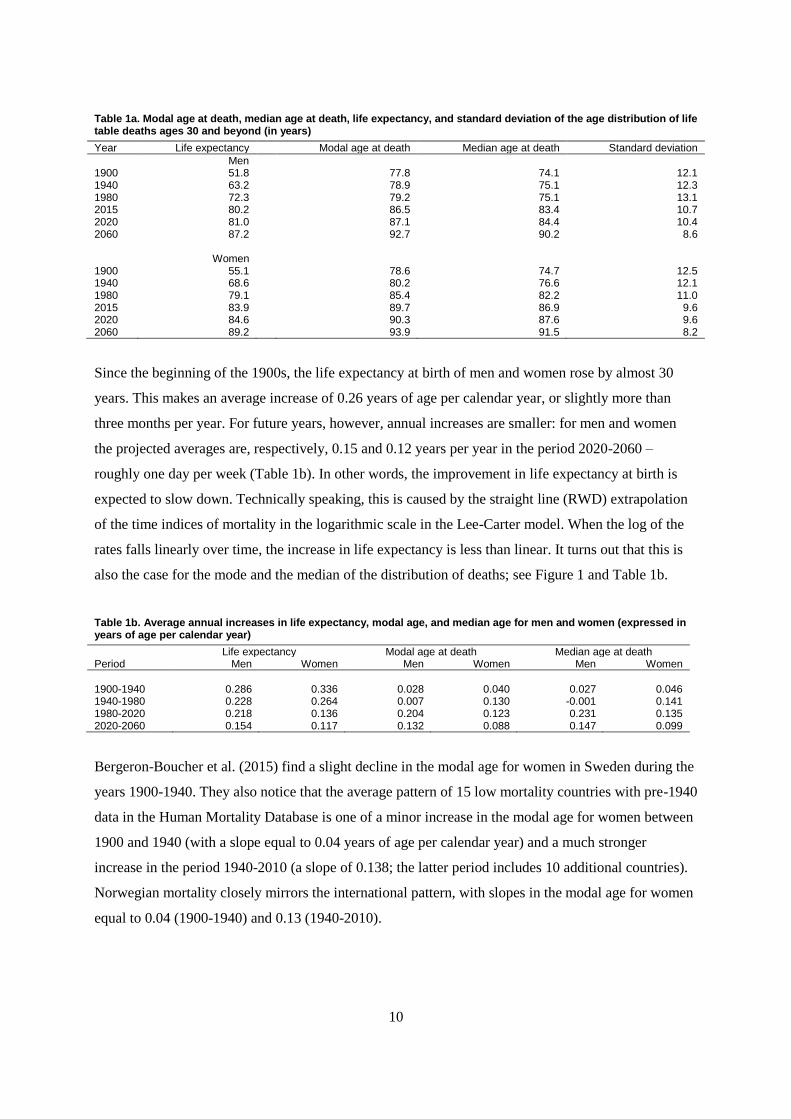
Table 1a. Modal age at death, median age at death, life expectancy, and standard deviation of the age distribution of life table deaths ages 30 and beyond (in years)
Year Life expectancy Modal age at death Median age at death Standard deviation
Men 1900 51.8 77.8 74.1 12.1 1940 63.2 78.9 75.1 12.3 1980 72.3 79.2 75.1 13.1 2015 80.2 86.5 83.4 10.7 2020 81.0 87.1 84.4 10.4 2060 87.2 92.7 90.2 8.6 Women 1900 55.1 78.6 74.7 12.5 1940 68.6 80.2 76.6 12.1 1980 79.1 85.4 82.2 11.0 2015 83.9 89.7 86.9 9.6 2020 84.6 90.3 87.6 9.6 2060 89.2 93.9 91.5 8.2
Since the beginning of the 1900s, the life expectancy at birth of men and women rose by almost 30
years. This makes an average increase of 0.26 years of age per calendar year, or slightly more than
three months per year. For future years, however, annual increases are smaller: for men and women
the projected averages are, respectively, 0.15 and 0.12 years per year in the period 2020-2060 –
roughly one day per week (Table 1b). In other words, the improvement in life expectancy at birth is
expected to slow down. Technically speaking, this is caused by the straight line (RWD) extrapolation
of the time indices of mortality in the logarithmic scale in the Lee-Carter model. When the log of the
rates falls linearly over time, the increase in life expectancy is less than linear. It turns out that this is
also the case for the mode and the median of the distribution of deaths; see Figure 1 and Table 1b.
Table 1b. Average annual increases in life expectancy, modal age, and median age for men and women (expressed in years of age per calendar year)
Life expectancy Modal age at death Median age at death Period Men Women Men Women Men Women
1900-1940 0.286 0.336 0.028 0.040 0.027 0.046 1940-1980 0.228 0.264 0.007 0.130 -0.001 0.141 1980-2020 0.218 0.136 0.204 0.123 0.231 0.135 2020-2060 0.154 0.117 0.132 0.088 0.147 0.099
Bergeron-Boucher et al. (2015) find a slight decline in the modal age for women in Sweden during the
years 1900-1940. They also notice that the average pattern of 15 low mortality countries with pre-1940
data in the Human Mortality Database is one of a minor increase in the modal age for women between
1900 and 1940 (with a slope equal to 0.04 years of age per calendar year) and a much stronger
increase in the period 1940-2010 (a slope of 0.138; the latter period includes 10 additional countries).
Norwegian mortality closely mirrors the international pattern, with slopes in the modal age for women
equal to 0.04 (1900-1940) and 0.13 (1940-2010).
11
Stagnating longevity for men during the 1950s and 1960s has been observed in a number of Western
countries (Meslé and Vallin, 2011). Life expectancies stagnated not only in Norway in those years, but
also in other countries such as Denmark, Finland, Netherlands, Belgium, New Zealand, and Australia
(Luy, 2015). One possible explanation for the structural breaks in male mortality after World War II is
the progression of the tobacco epidemic. Several studies have found that smoking had a distorting
effect on trends in the male life expectancy and male mortality (see e.g. Janssen et al., 2015; Beltran-
Sanchez et al., 2015), and also for Norway specifically (Vollset et al., 2006). Yet, smoking is not the
main force behind the sex gap in life expectancy in all countries where male life expectancy stagnated
(Luy and Wegner-Siegmundt, 2015). In Norway, dietary changes with a more pronounced intake of
unhealthy fats have likely contributed. This is evident by a marked increase in cardiovascular deaths
for men in all age groups from the mid-1950s. Nowadays, circulatory disease mortality is no longer
the first cause of death in many developed countries (Beltran-Sanchez et al., 2015). Different changes
in mortality regimes for different age groups may have led to changes in the age pattern of mortality.
More generally, the trend shifts for males were caused by a change in major causes of death for men
below age 45 after World War II, from infectious diseases before the war to man-made diseases after
the war (Meslé and Vallin, 2011). In Norway, while mortality from infectious diseases continued to
decline also after World War II, the most pronounced change was the increase in cardiovascular
deaths. The greater male vulnerability to cardiovascular conditions led to changes in health-related
behaviours. In the historical data from Norway, the mode (M) of the distribution of deaths occurs at a
considerably higher age than the average, i.e. the life expectancy at birth (e0). The median age (Med) is
placed in between these two. This is because the distribution has a long tail to the left. Horiuchi et al.
(2013) state that during the last few decades, M is typically around five years higher than e0, and Med
is near the mid-point between M and e0 in developed countries. In the Norwegian data of 2015, the
difference between M and e0 is about 6 years (6.3 years for men, 5.8 years for women). Med is located
almost perfectly in the middle between M and e0. In the future, the three measures will converge as the
deaths will become more concentrated around the median (see below). In 1900, the modal age was
more than 20 years higher than the life expectancy, while the median age was very close to the modal
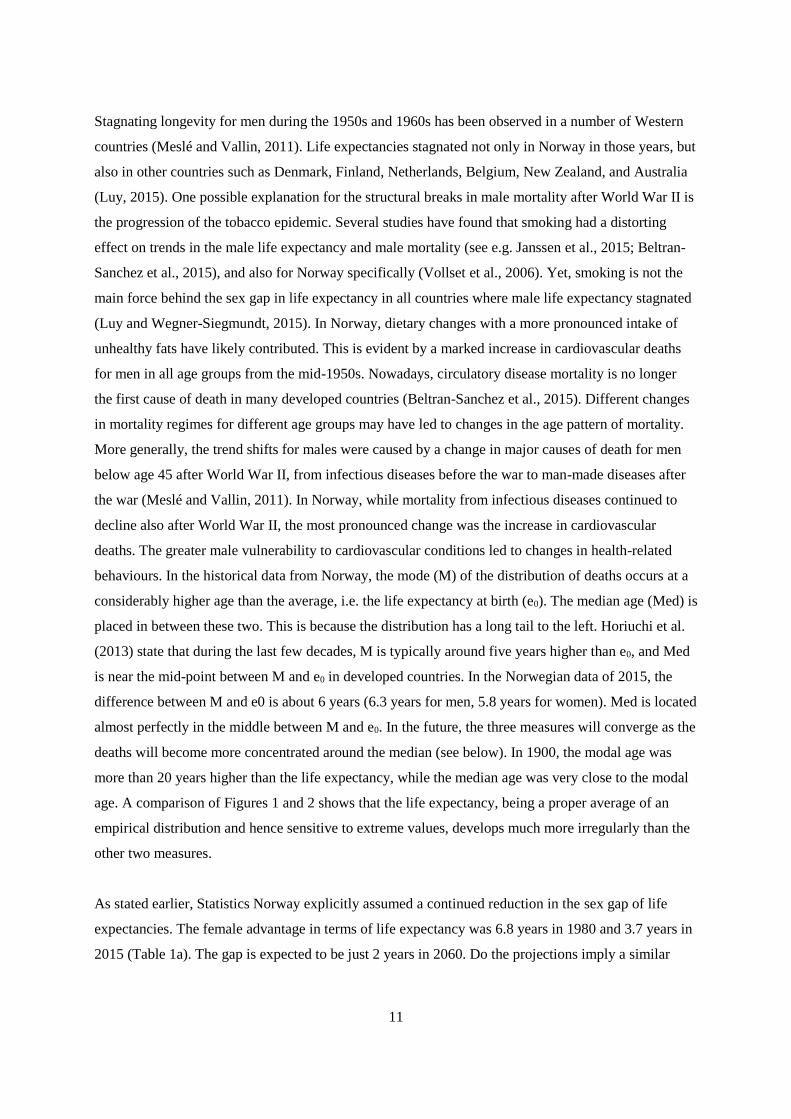
age. A comparison of Figures 1 and 2 shows that the life expectancy, being a proper average of an
empirical distribution and hence sensitive to extreme values, develops much more irregularly than the
other two measures.
As stated earlier, Statistics Norway explicitly assumed a continued reduction in the sex gap of life
expectancies. The female advantage in terms of life expectancy was 6.8 years in 1980 and 3.7 years in
2015 (Table 1a). The gap is expected to be just 2 years in 2060. Do the projections imply a similar
12
narrowing sex gap for the modal age and the median age? The answer is yes, as can be seen from
Table 1a. The sex gap in the modal age will narrow further, from 6.2 years in 1980 and 3.2 years in
2015, to 1.2 years in 2060. The gap in median ages is expected to be reduced from 7.1 (1980) and 3.5
(2015) years to 1.3 years in 2060.
Figure 1. Modal and median ages at death; historical (1900-2015) and projected (2016-2060) values
Figure 2. Life expectancy at birth; historical (1900-2015) and projected (2016-2060) values
60
65
70
75
80
85
90
95
100
1900 1920 1940 1960 1980 2000 2020 2040 2060
yea
rs
modal age men modal age women
median age men median age women
40
50
60
70
80
90
100
1900 1920 1940 1960 1980 2000 2020 2040 2060
yea
rs
men women
13
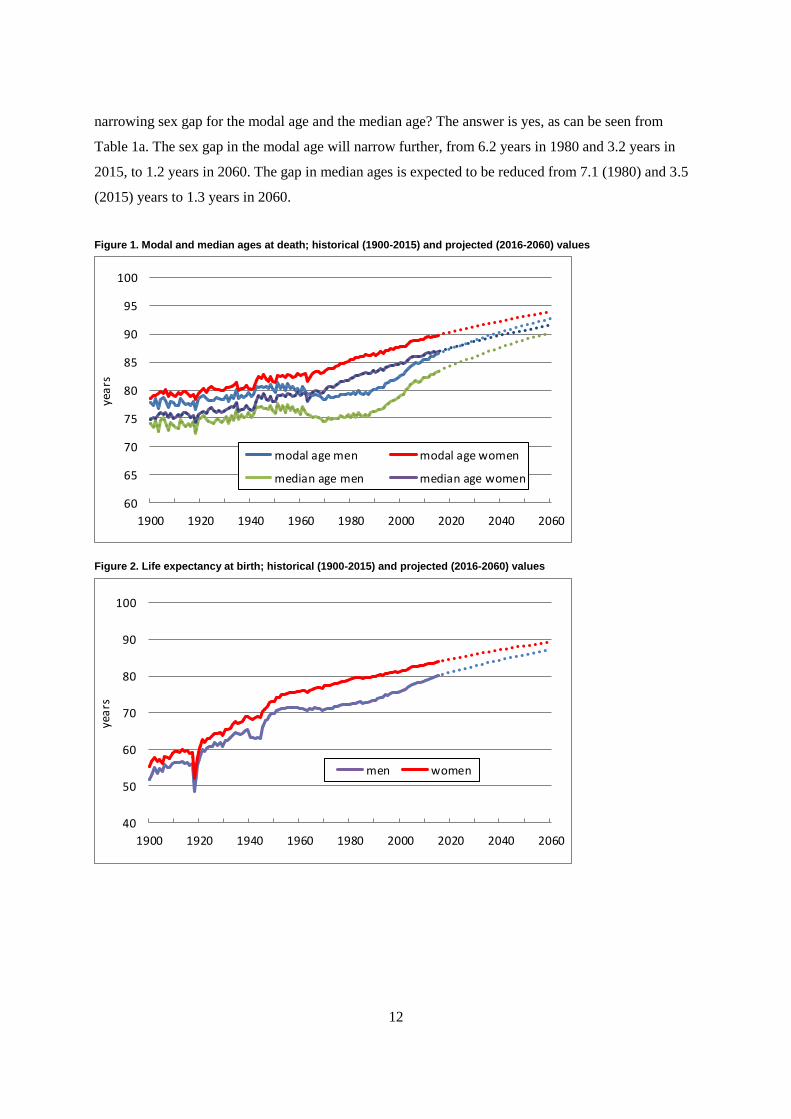
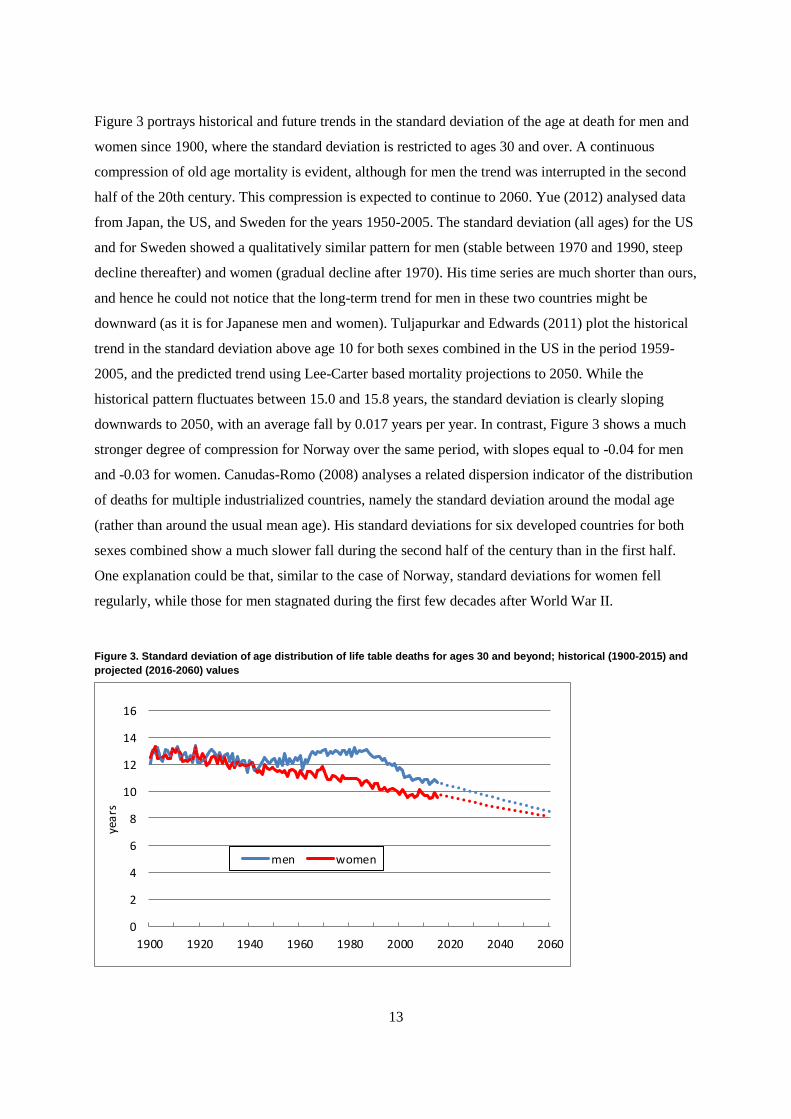
Figure 3 portrays historical and future trends in the standard deviation of the age at death for men and
women since 1900, where the standard deviation is restricted to ages 30 and over. A continuous
compression of old age mortality is evident, although for men the trend was interrupted in the second
half of the 20th century. This compression is expected to continue to 2060. Yue (2012) analysed data
from Japan, the US, and Sweden for the years 1950-2005. The standard deviation (all ages) for the US
and for Sweden showed a qualitatively similar pattern for men (stable between 1970 and 1990, steep
decline thereafter) and women (gradual decline after 1970). His time series are much shorter than ours,
and hence he could not notice that the long-term trend for men in these two countries might be
downward (as it is for Japanese men and women). Tuljapurkar and Edwards (2011) plot the historical
trend in the standard deviation above age 10 for both sexes combined in the US in the period 1959-
2005, and the predicted trend using Lee-Carter based mortality projections to 2050. While the
historical pattern fluctuates between 15.0 and 15.8 years, the standard deviation is clearly sloping
downwards to 2050, with an average fall by 0.017 years per year. In contrast, Figure 3 shows a much
stronger degree of compression for Norway over the same period, with slopes equal to -0.04 for men
and -0.03 for women. Canudas-Romo (2008) analyses a related dispersion indicator of the distribution
of deaths for multiple industrialized countries, namely the standard deviation around the modal age
(rather than around the usual mean age). His standard deviations for six developed countries for both
sexes combined show a much slower fall during the second half of the century than in the first half.
One explanation could be that, similar to the case of Norway, standard deviations for women fell
regularly, while those for men stagnated during the first few decades after World War II.
Figure 3. Standard deviation of age distribution of life table deaths for ages 30 and beyond; historical (1900-2015) and
projected (2016-2060) values
0
2
4
6
8
10
12
14
16
1900 1920 1940 1960 1980 2000 2020 2040 2060
yea
rs
men women
14
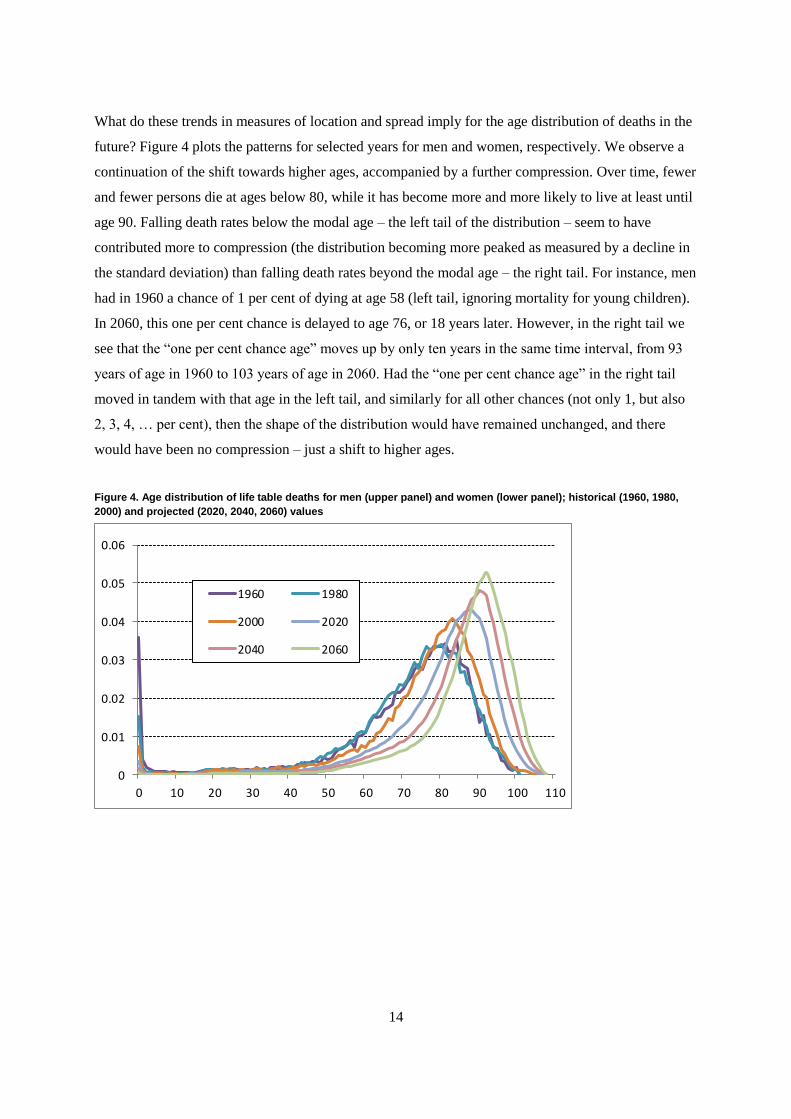
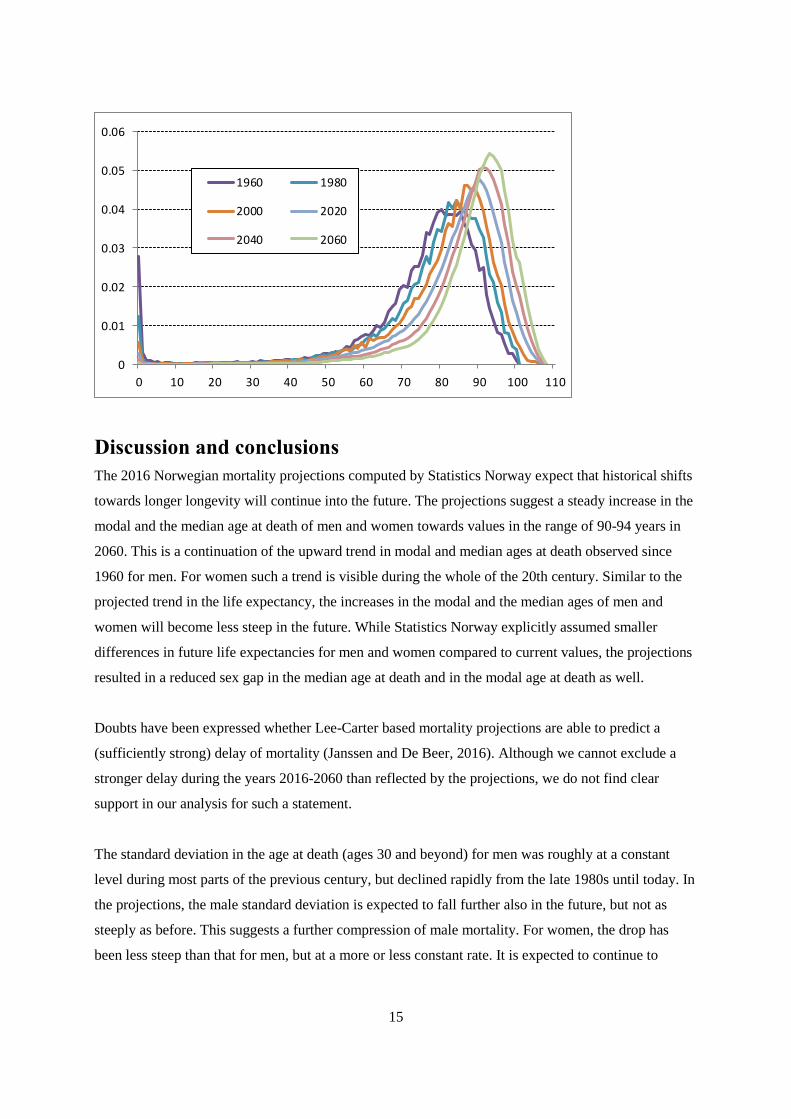
What do these trends in measures of location and spread imply for the age distribution of deaths in the
future? Figure 4 plots the patterns for selected years for men and women, respectively. We observe a
continuation of the shift towards higher ages, accompanied by a further compression. Over time, fewer
and fewer persons die at ages below 80, while it has become more and more likely to live at least until
age 90. Falling death rates below the modal age – the left tail of the distribution – seem to have
contributed more to compression (the distribution becoming more peaked as measured by a decline in
the standard deviation) than falling death rates beyond the modal age – the right tail. For instance, men
had in 1960 a chance of 1 per cent of dying at age 58 (left tail, ignoring mortality for young children).
In 2060, this one per cent chance is delayed to age 76, or 18 years later. However, in the right tail we
see that the “one per cent chance age” moves up by only ten years in the same time interval, from 93
years of age in 1960 to 103 years of age in 2060. Had the “one per cent chance age” in the right tail
moved in tandem with that age in the left tail, and similarly for all other chances (not only 1, but also
2, 3, 4, … per cent), then the shape of the distribution would have remained unchanged, and there
would have been no compression – just a shift to higher ages.
Figure 4. Age distribution of life table deaths for men (upper panel) and women (lower panel); historical (1960, 1980,
2000) and projected (2020, 2040, 2060) values
0
0.01
0.02
0.03
0.04
0.05
0.06
0 10 20 30 40 50 60 70 80 90 100 110
1960 1980
2000 2020
2040 2060
15
Discussion and conclusions
The 2016 Norwegian mortality projections computed by Statistics Norway expect that historical shifts
towards longer longevity will continue into the future. The projections suggest a steady increase in the
modal and the median age at death of men and women towards values in the range of 90-94 years in
2060. This is a continuation of the upward trend in modal and median ages at death observed since
1960 for men. For women such a trend is visible during the whole of the 20th century. Similar to the
projected trend in the life expectancy, the increases in the modal and the median ages of men and
women will become less steep in the future. While Statistics Norway explicitly assumed smaller
differences in future life expectancies for men and women compared to current values, the projections
resulted in a reduced sex gap in the median age at death and in the modal age at death as well.
Doubts have been expressed whether Lee-Carter based mortality projections are able to predict a
(sufficiently strong) delay of mortality (Janssen and De Beer, 2016). Although we cannot exclude a
stronger delay during the years 2016-2060 than reflected by the projections, we do not find clear
support in our analysis for such a statement.
The standard deviation in the age at death (ages 30 and beyond) for men was roughly at a constant
level during most parts of the previous century, but declined rapidly from the late 1980s until today. In
the projections, the male standard deviation is expected to fall further also in the future, but not as
steeply as before. This suggests a further compression of male mortality. For women, the drop has
been less steep than that for men, but at a more or less constant rate. It is expected to continue to
0
0.01
0.02
0.03
0.04
0.05
0.06
0 10 20 30 40 50 60 70 80 90 100 110
1960 1980
2000 2020
2040 2060

16
decline at a steady pace also in the future. Consequently, the observed gap in the standard deviations
of men and women is expected to narrow. As such, also female mortality is expected to be further
compressed in the future. In conclusion, the method used by Statistics Norway for projecting mortality
is capable of tracking ongoing processes of mortality shifts towards higher ages, and of a compression
of mortality around the modal and mean ages.
Our empirical findings are entirely based on period mortality. Some scholars argue that the observed
compression of mortality may be due to, at least partly, distortions in the period age schedule (see e.g.
Ediev, 2013). Cohort mortality would thus be a more appropriate perspective. However, although we
have an extended time series of data of good quality, we would be able to analyse empirical data for
only 16 birth cohorts (those born 1900-1915) up to age 100. In our view, this is too short a series to
draw any firm conclusions.
In terms of consequences for public finances, pension costs will increase as mortality is shifted to
older ages. A reform of the Norwegian public pension scheme was implemented in 2011, adjusting
annual pension benefits for increases in life expectancy in an actuarial neutral way. In terms of health
care costs, a higher modal age at death is likely to be associated with higher costs due to the
documented increase in the prevalence of multi-morbidity at older ages (Chatterji et al., 2015).
However, if future morbidity will compress parallel to the projected compression of future mortality,
this will ensure that not too many people live too long with conditions in need of treatment, and thus
prevent escalating health care costs.
To minimize overestimations of future mortality in official projections – with important implications
for public finances and services – it may be advisable to include an assessment of the age distribution
of deaths when producing such projections.
17
References
Aase, K. N, Tønnessen, M. & Syse, A. (2014). The population projections - Documentation of the
BEFINN and BEFREG models. Report 2014/25. Oslo: Statistics Norway.
Bähler, C., Huber, C. A., Brüngger, B., & et al. (2015). Multimorbidity, health care utilization and
costs in an elderly community-dwelling population: a claims data based observational study.
BMC Health Services Research, 22(15):23.
Beltran-Sanchez, H., Finch, C. E., & Crimmins, E. M. (2015). Twentieth century surge of excess adult
male mortality. Proceedings of the National Academy of Sciences of the United States of
America, 112:8993–8998.
Bergeron-Boucher, M. P., Ebeling, M., & Canudas-Romo, V. (2015). Decomposing changes in life
expectancy: compression versus shifting mortality. Demographic Research, 33(1):391–424.
Bloom, D. E., Chatterji, S., Kowal, P., & et al. (2015). Macroeconomic implications of population
ageing and selected policy responses. Lancet, 385(9968):649–657.
Canudas-Romo, V. (2008). The modal age at death and the shifting mortality hypothesis. Demograph-
ic Research, 19(30):1179–1204.
Chatterji, S., Byles, J., Cutler, D., & et al. (2015). Health, functioning, and disability in older adults –
present status and future implications. Lancet, 385(9967):563–575.
Ediev, D. (2013). Mortality compression in period life tables hides decompression in birth cohorts in
low-mortality countries. Genus, 69(2):53–84.
Gregersen, F. A. (2014). The impact of ageing on health care expenditures: a study of steepening. Eur
Journal of Health Economics, 15(9):979–989.
Horiuchi, S., Ouellette, N., Cheung, S. L. K., & et al. (2013). Modal age at death: lifespan indicator in
the era of longevity extension. Vienna Yearbook of Population Research, 11:37–69.
Hyndman, R. J., Booth, H., & Yasmeen, F. (2013). Coherent mortality forecasting: the product-ratio
method with functional time series models. Demography, 50(1):261–283.
Jagger, C., Matthews, F. E., Wohland, P., & et al. (2016). A comparison of health expectancies over
two decades in England: results of the Cognitive Function and Ageing Study I and II. Lancet,
387(10020):779–786.
Janssen, F., & De Beer, J. (2016). Projecting future mortality in the Netherlands taking into account
mortality delay and smoking. WP 18/2016. Joint Eurostat/UNECE Work Session on Demo-
graphic Projections, 2016. Accessed from:
https://www.unece.org/fileadmin/DAM/stats/documents/ece/ces/ge.11/2016/WP18.pdf
Janssen, F., Rousson, V., & Paccaud, F. (2015). The role of smoking in changes in the survival curve:
an empirical study in 10 European countries. Annals of Epidemiology, 25(4):243–249.
Kannisto, V. (2000). Measuring the compression of mortality. Demographic Research, 3:6.
Lee, R. D., & Carter L. R. (1992). Modeling and forecasting U.S. mortality. Journal of the American
Statistical Association, 87(419):659–671.
18
Luy, M. (2015). Adult mortality in industrialized societies. In: J.D. Wright (ed.). International ency-
clopedia of the social and behavioral sciences (2nd ed., vol. 1). Oxford: Elsevier, pp. 170–180.
Luy, M., & Wegner-Siegmundt, C. (2015). The impact of smoking on gender differences in life expec-
tancy: more heterogeneous than often stated. European Journal of Public Health, 25(4):706–
710.
Meslé, F., & Vallin, J. (2011). Historical trends in mortality. In: R.G. Rogers, & E.G. Crimmins (eds).
International handbook of adult mortality. New York: Springer, pp. 9–47.
Missov, T. I., Lenart, A., Nemeth, L., & et al. (2015). The Gompertz force of mortality in terms of the
modal age at death. Demographic Research, 32(36):1031–1048.
NCD Risk Factor Collaboration (NCD-RisC). (2016). Trends in adult body-mass index in 200 coun-
tries from 1975 to 2014: a pooled analysis of 1698 population-based measurement studies with
19.2 million participants. Lancet, 387(10026):1377–1396.
Norwegian Institute of Public Health. (2017). Cause of Death Registry/Causes of death 2016: Cancer
stable, dementia increasing. Accessed from: www.fhi.no/helseregistre/dodsaarsaksregisteret
Raftery, A., Lalic, N., & Gerland, P. (2014). Joint probabilistic projection of female and male life ex-
pectancy. Demographic Research, 30:795–822.
Tuljapurkar, S., & Edwards, R. (2011). Variance in death and its implications for modeling and fore-
casting mortality. Demographic Research, 24:497–526.
United Nations, Department of Economic and Social Affairs, Population Division. (2013). World pop-
ulation ageing. ST/ESA/SER.A/348.
Verbrugge, L. M., Brown, D. C., & Zajacova, A. (2017). Disability rises gradually for a cohort of old-
er Americans. The journals of gerontology. Series B, Psychological sciences and social sci-
ences, 72(1):151–161.
Vollset, S. E., Tverdal, A., & Gjessing, H. K. (2006). Smoking and deaths between 40 and 70 years of
age in women and men. Annals of Internal Medicine, 144:381–389.
Wetterstrand, W. H. (1981). Parametric models for life insurance mortality data: Gompertz’ law over
time. Transactions Society Actuaries, 33:159–179.
Wilmoth, J. R., Deegan, L. J., Lundstrõm, H., & et al. (2000). Increase of maximum life-span in Swe-
den, 1861-1999. Science, 289 (5488):2366–2368.
Yue, J. C. (2012). Mortality compression and longevity risk. Northern American Actuarial Journal,
16(4):434–448.
Zeng, Y., Feng, Q., Hesketh, T., & et al. (2017). Survival, disabilities in activities of daily living, and
physical and cognitive functioning among the oldest-old in China: a cohort study. Lancet,
389(10079):1619–1629.

Statistics Norway
Postal address:PO Box 8131 DeptNO-0033 Oslo
Offi ce address:Akersveien 26, OsloOterveien 23, Kongsvinger
E-mail: [email protected]: www.ssb.noTelephone: + 47 62 88 50 00
ISSN: 1892-753X
Desig
n: Siri B
oq
uist