an empirical study of bagging and boosting ensembles for identifying faulty classes in...
TRANSCRIPT
In Proceedings of the IEEE Symposium on Computational Intelligence and Data Mining (CIDM’09), pp. 187-194, TN, USA, Mar. 2009.
Abstract— Identifying faulty classes in object-oriented software is one of the important software quality assurance activities. This paper empirically investigates the application of two popular ensemble techniques (bagging and boosting) in identifying faulty classes in object-oriented software, and evaluates the extent to which these ensemble techniques offer an increase in classification accuracy over single classifiers. As base classifiers, we used multilayer perceptron, radial basis function network, bayesian belief network, naïve bayes, support vector machines, and decision tree. The experiment was based on well-known and respected NASA dataset. The results indicate that bagging and boosting yield improved classification accuracy over most of the investigated single classifiers. In some cases, bagging outperforms boosting, while in some other cases, boosting outperforms bagging. However, in case of support vector machines, neither bagging nor boosting improved its classification accuracy.
I. INTRODUCTION OWADAYS object-oriented approach to software development is widely used in the software industry. It
promises better management of system complexity and improvement in project outcomes such as software quality. Identifying faulty classes in object-oriented software is important for minimizing cost and improving the effectiveness of the software testing process. It also enables software developers to focus quality assurance activities and allocate effort and resources more effectively and efficiently. However, identifying faulty classes in object-oriented software is a challenge for software developers before the software is released.
Many computational intelligence models have been applied to software quality prediction/classification problems. Recently, ensemble classification techniques have received much attention and have demonstrated promising capabilities in improving classification accuracy over single classifiers [3, 33]. However, these techniques have not been applied and evaluated in the context of identifying faulty classes in object-oriented software.
The main objective of this paper is to determine the extent to which bagging and boosting ensemble techniques offer an increase in classification accuracy over single classifiers in the context of identifying faulty classes in object-oriented
H. Aljamaan and M. Elish are with the Information and Computer
Science Department, King Fahd University of Petroleum and Minerals, Dhahran, Saudi Arabia; e-mail: {hjamaan, elish}@kfupm.edu.sa.
software. We used six popular and common computational intelligence classification models as base classifiers: multilayer perceptron, radial basis function network, bayesian belief networks, naïve bayes, support vector machines, and decision tree.
The rest of this paper is structured as follows. Section II discusses related work. Section III briefly describes the investigated classification models that we used as base classifiers for the ensemble techniques. Section IV provides some technical background for ensemble techniques. Section V describes the design of the conducted experiment. Section VI reports the results with their analysis. Section VII concludes the paper.
II. LITERATURE REVIEW Many research studies have investigated the use of
prediction models in object-oriented software fault prediction problem using object-oriented design metrics. Most of these prediction models are built using statistical models [5, 7, 17, 35]. Briand et al. [5] used univariate analysis to show that many coupling and inheritance measures are strongly related to the probability of fault detection in a class. El-Emam et al. [7] constructed a logistic regression model to predict which classes in a future release of a commercial Java application will be faulty. Yu et al. [35] presented a set of object-oriented metrics as an important software quality indicators, and empirically validated them using two data analysis techniques: regression analysis and discriminant analysis. However, since the relationships between software metrics and quality factors are often complex and nonlinear, this limits the accuracy of such models. As a result, research studies have investigated the use of computational intelligence models for software quality prediction due to their capabilities of modeling nonlinear functional relationships [8].
Research studies have also investigated the use of computational intelligence models to predict class fault proneness as regression and classification problems. For regression problems, examples include artificial neural networks (ANNs) [14, 31] and decision trees [14]. For classification problems, ANNs [19] and Bayesian methods [23] have been used. Mahaweerawat et al. [19] proposed the use of ANNs as a new approach for classification of class faults in object-oriented software. In their work, multilayer perceptron was used to identify faulty classes, while radial basis function was used to categorize the faults according to
An Empirical Study of Bagging and Boosting Ensembles for Identifying Faulty Classes in Object-Oriented Software
Hamoud I. Aljamaan and Mahmoud O. Elish
N
In Proceedings of the IEEE Symposium on Computational Intelligence and Data Mining (CIDM’09), pp. 187-194, TN, USA, Mar. 2009.
several defined fault types. Pai and Dugan [23] performed empirical analysis of software fault content and proneness using Bayesian methods. Therefore, the number of investigated models for identifying faulty classes is limited, and these models are mainly statistical regression, neural networks, and Bayesian network.
Recently, ensemble classification techniques have received much attention and have demonstrated promising capabilities in improving classification accuracy over single classifiers [3, 33]. Some of these techniques are simple ensemble [30], AdaBoost [10], bagging [4] and boosting [11, 28]. Ensemble techniques have been used in the area of software engineering prediction problems. They have been used in software reliability prediction [38], software project effort estimation [3], and software module fault prediction [18]. In addition, they have been used in many real applications such as face recognition [13, 16], OCR [20], seismic signal classification [29] and protein structural class prediction [2]. However, none of the ensemble techniques have been used in the area of class fault prediction.
III. CLASSIFICATION MODELS In this section, we briefly describe the investigated
classification models that we used as base classifiers for the ensemble techniques. These models are the most commonly and widely applied models in the literature of software quality prediction. • Multilayer Perceptron (MLP) [15] is a feedforward
network that consists of an input layer, one or more hidden layers of nonlinearly activating nodes, and an output layer. Each node in one layer connects with a certain weight to every other node in the following layer. MLP uses backpropagation algorithm as the standard learning algorithm for any supervised-learning.
• Radial Basis Function Network (RBF) [24] is an artificial neural network that uses radial basis functions as activation functions to provide a flexible way to generalize linear regression function. Commonly used types of radial basis functions include Gaussian, Multiquadric, and Polyharmonic spline. RBF models with Gaussian basis functions possess desirable mathematical properties of universal approximation and best approximation. A typical RBF model consists of three layers: an input layer, a hidden layer with a non-linear RBF activation function, and a linear output layer.
• Bayesian Belief Network (BBN) [12] is a probabilistic graphical model that represents a set of variables and their probabilistic independencies. In BBN, each node in the graph represents a random variable, while the edges between the nodes represent probabilistic dependencies among the corresponding random variables. These conditional dependencies in the graph are often estimated by using known statistical and computational methods.
• Naïve Bayes (NB) [27] is the simplest form of Bayesian network, in which all attributes are independent given the value of the class variable. This is called conditional independence. Although independence is generally a poor assumption, in practice naïve Bayes competes well with more sophisticated classifiers.
• Support Vector Machines (SVM) [32] was proposed by Vapnik [32] based on the structured risk minimization (SRM) principle. SVMs are a group of supervised learning methods that can be applied to classification or regression. SVMs aim to minimize the empirical error and maximize the geometric margin. SVM model is defined by these parameters: complexity parameter C, extent to which deviations are tolerated ε, and kernel.
• Decision Tree (DT) [36] is a mapping from observations about an item to conclusions about its target value. Decisions trees are created typically using C4.5 algorithm developed by Quinlan [26]. C4.5 creates decision tree whose structure consists of leaves using a top-down, divide-and-conquer approach.
IV. ENSEMBLE TECHNIQUES An ensemble classification model consists of a set of
individually trained classifiers whose classifications are combined to produce the final classification. The simplest way to combine classifiers is by voting. Bagging and boosting implement this approach in different ways using a base classifier.
A. Bagging Bagging, short for bootstrap aggregating, is an ensemble
technique proposed by Breiman [4] to improve the accuracy of classification models by combining classifications of same type (i.e., based on the same base classifier) of randomly generated training sets. Bagging assigns equal weight to models created, thus helps in reducing the variance associated with classification, which in turn improves the classification process. Bagging technique has produced good results whenever the learning algorithm is unstable [4]. The following figure states the bagging algorithm [34]:
model generation Let n be the number of instances in the training data For each of t iterations: Sample n instances with replacement from training data Apply the learning algorithm to the sample Store the resulting model classification For each of the t models: Predict class of instance using model Return class that has been predicted most often Figure 1: Bagging algorithm
In Proceedings of the IEEE Symposium on Computational Intelligence and Data Mining (CIDM’09), pp. 187-194, TN, USA, Mar. 2009.
Bagging technique requires three parameters: • classifier: the base classifier to apply bagging on. • bagSizePercent: size of each bag, as a percentage of
the training set size. • numIterations: number of instances of the base
classifiers to be created, i.e. the ensemble size. In this paper, we prefer to use the term ensemble size for clarity purpose.
B. Boosting Boosting is an ensemble technique proposed by Freund
[9] to build a classifier ensemble incrementally, by adding one classifier at a time. The training set used for each member of the ensemble is chosen based on the performance of the earlier classifiers in the ensemble. The following figure states the boosting algorithm [34]:
model generation Assign equal weight to each training instance. For each of t iterations: Apply learning algorithm to weighted dataset and store resulting model. Compute error e of model on weighted dataset and store error. If e equal to zero, or e greater or equal to 0.5: Terminate model generation. For each instance in dataset: If instance classified correctly by model: Multiply weight of instance by e / (1 – e). Normalize weight of all instances. classification Assign weight of zero to all classes. For each of the t (or less) models: Add –log(e / (1 – e)) to weight of class predicted by model. Return class with highest weight.
Figure 2: Boosting algorithm
Boosting technique requires three parameters: • classifier: the base classifier to apply boosting on. • Resampling/Reweighting: which approach is used
(resampling or reweighting) • numIterations: number of instances of the base
classifiers to be created, i.e. the ensemble size. In this paper, we prefer to use the term ensemble size for clarity purpose.
There are a family of boosting algorithms [11]. In this paper, we used AdaBoost algorithm proposed by Freund et al. [10]. AdaBoost was proposed to improve the performance of other learning algorithms. There are two approaches implemented in AdaBoost: resampling and reweighting. In resampling, the fixed training sample size and training examples are resampled according to a probability distribution used in each iteration. In reweighting, all training examples, with weights assigned to
each example, are used in each iteration to train the base classifier. In this paper, we used the resampling approach, because it has been reported to yield better accuracy [1, 37].
There is no conclusion on which ensemble technique is superior to the other. However, several observations have been made [1, 2, 22, 25]:
• In some cases, boosting can significantly outperform bagging, while in some other cases, it can also be substantially worse than bagging (in a few cases even worse than individual classifiers)
• Bagging’s improvement over individual classifiers is more consistent on various data sets than boosting’s.
The following table summarizes the similarities and differences between bagging and boosting techniques:
Table 1: Comparison between bagging and boosting
Bagging Boosting
Similarities • Uses voting • Combines models of the same type Individual models are built separately
Each new model is influenced by the performance of those built previously Differences
Equal weight is given to all models
Weights a model’s contribution by its performance
V. EXPERIMENTAL DESIGN This section describes the design of the conducted
experiment. The main objective is to determine the extent to which bagging and boosting ensemble techniques offer an increase in classification accuracy over single classifiers in the context of identifying faulty classes in object-oriented software.
A. Dataset The dataset used in this study is from a mission critical
NASA software project called KC1, which is publicly available from the repository of the NASA IV&V Facility Metrics Data Program1. This project is a storage management system for receiving and processing ground data. It is written in C++ and consists of 145 classes with more than 43 KLOC. This dataset consists of class-level metrics data and the associated fault data that has been collected since the beginning of the project.
The dependent (output) variable is a binary variable indicating whether or not a class is faulty. Around 40% of the classes are faulty. The independent (input) variables are nine class-level metrics. Six out of these nine metrics are the well-known Chidamber and Kemerer’s metrics [6], i.e., Weighted Methods per Class (WMC), Depth of Inheritance Tree (DIT), Number of Children (NOC), Coupling Between Object classes (CBO), Response For a Class (RFC), and Lack of Cohesion in Methods (LCOM). The other three
1 http://mdp.ivv.nasa.gov/index.html
In Proceedings of the IEEE Symposium on Computational Intelligence and Data Mining (CIDM’09), pp. 187-194, TN, USA, Mar. 2009.
metrics are Fan-in (FIN), Percentage of Public/Protected Data (PPD), and Dependency on Child (DOC). Table 2 provides brief description for each metric.
Table 2: Independent (input) variables in the dataset
Metric Description WMC Count of methods implemented within a class DIT Level for a class within its class hierarchy NOC Number of immediate subclasses of a class CBO Number of distinct non-inheritance-related
classes on which a class depends RFC Count of methods implemented within a class
plus the number of methods accessible to an object class due to inheritance
LCOM The average percentage of methods in a class using each data field in the class subtracted from 100%
FIN Number of classes that depend upon a class PPD Percentage of public and protected data in a
class DOC Whether a class is dependent on a descendant
B. Tool WEKA (Waikato Environment for Knowledge Analysis)
[34] software tool was used to conduct this experiment. It is an open source tool that contains a collection of machine learning algorithms for data mining tasks and tools for data pre-processing, classification, regression, clustering, association rules, and visualization.
C. Accuracy Evaluation Measure The accuracy (correct classification rate) of a classification
model for two-class classification problems (i.e., faulty or not faulty) is evaluated using a confusion matrix, shown in Table 3.
Table 3: Confusion matrix for two-class classification
problems
Predicted Class Faulty Not Faulty
Faulty True Positive (TP)
False Negative (FN) Actual
Class Not Faulty
False Positive (FP)
True Negative (TN)
Accuracy can be seen as proportion of true results (both
true positives and true negatives) in the population. It is calculated as the sum of correct classifications divided by the total number of classifications:
TP TNAccuracy
TP TN FP FN+
=+ + +
D. Cross-validation A leave-one-out cross-validation procedure was used in
this experiment. In this procedure, one observation is removed from the dataset, and then each model is built with the remaining n-1 observations and evaluated in predicting the value of the observation that was removed. The process is repeated each time removing a different observation. Given that there are 145 observations in the dataset, all models were trained using 144 observations and then their classification accuracy was tested on the withheld observation. This procedure was used because [21, 34]: (i) it is closer to a real world situation than k-cross validation from a practitioner’s point of view (ii) it is deterministic (no sampling is involved); and (iii) it ensures the largest possible amount of data is used for training.
E. Parameter Initialization The parameters of the base classification models were
initialized with the default settings set by WEKA as follows: • MLP: trained using backpropagation algorithm.
Sigmoid was used as an activation function. Number of hidden layers was 5. Learning rate was 0.3 with momentum 0.2. Network was set to reset with a lower learning rate. Number of epochs to rain through was 500. Validation threshold was 20.
• RBF: implements a normalized Gaussian radial basis function network. Random seed to pass on to K-means was 1. Number of clusters for K-means to generate was 2 with minimum standard deviation for clusters set to 0.1.
• BBN: used SimpleEstimator for estimating the conditional probability table of a Bayes network with 0.5 as the initial count for each value. Hill climbing algorithm was used as a search algorithm.
• NB: no parameters were required. • SVM: cost parameter C was set to 1 and RBF was used
as a kernel. The tolerance of termination criterion was 0.001.
• DT: used C4.5 algorithm to generate decision tree. Confidence factor used for pruning was 25%. Minimum number of instance per leaf was 2.
In addition, the parameters of the bagging and boosting ensemble techniques were initialized as follows. In bagging, the bag size was set to 100. In boosting (Adaboost), resampling was used instead of reweighting. Boosting by resampling improves the classification accuracy, the execution speed as well as the robustness to classification noise [37]. We have applied bagging and boosting to all of the investigated classification models described in Section III. We used ensemble sizes from 5 to 50 with an increment of 5. This approach was used previously in the literature [4, 33]. Hence, we can investigate the effect of the ensemble size on the classification accuracy of these ensemble techniques.
In Proceedings of the IEEE Symposium on Computational Intelligence and Data Mining (CIDM’09), pp. 187-194, TN, USA, Mar. 2009.
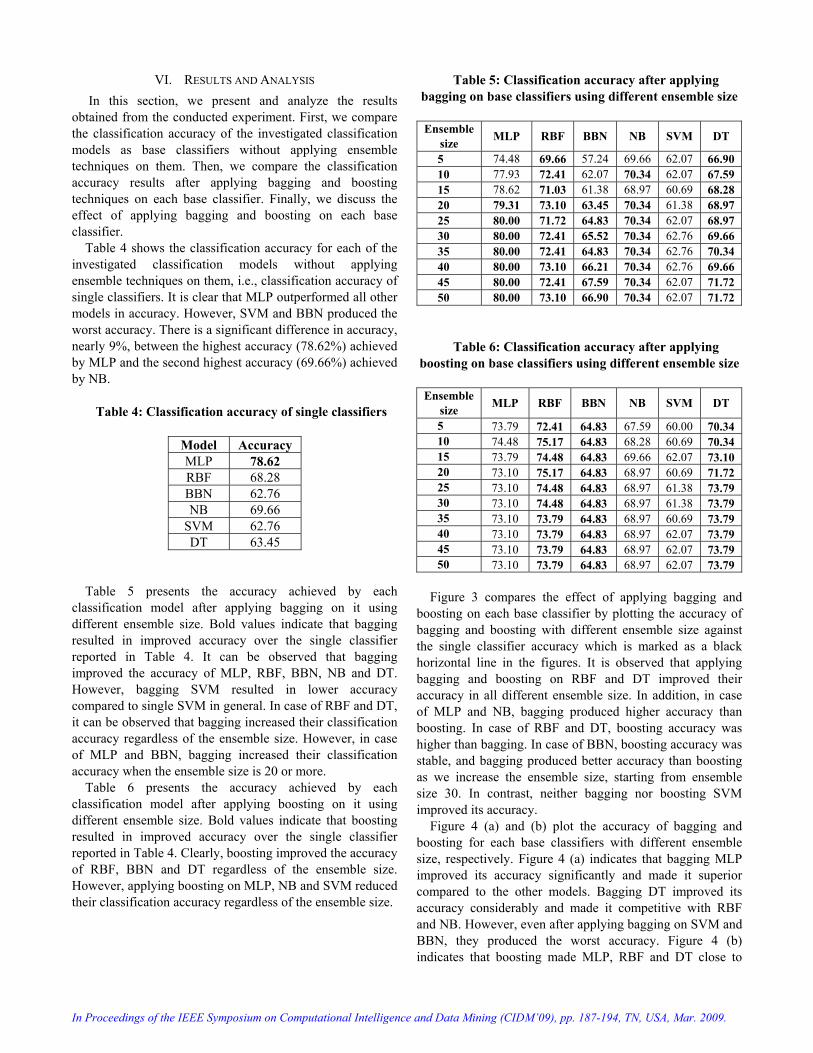
VI. RESULTS AND ANALYSIS In this section, we present and analyze the results
obtained from the conducted experiment. First, we compare the classification accuracy of the investigated classification models as base classifiers without applying ensemble techniques on them. Then, we compare the classification accuracy results after applying bagging and boosting techniques on each base classifier. Finally, we discuss the effect of applying bagging and boosting on each base classifier.
Table 4 shows the classification accuracy for each of the investigated classification models without applying ensemble techniques on them, i.e., classification accuracy of single classifiers. It is clear that MLP outperformed all other models in accuracy. However, SVM and BBN produced the worst accuracy. There is a significant difference in accuracy, nearly 9%, between the highest accuracy (78.62%) achieved by MLP and the second highest accuracy (69.66%) achieved by NB.
Table 4: Classification accuracy of single classifiers
Model Accuracy MLP 78.62 RBF 68.28 BBN 62.76 NB 69.66
SVM 62.76 DT 63.45
Table 5 presents the accuracy achieved by each
classification model after applying bagging on it using different ensemble size. Bold values indicate that bagging resulted in improved accuracy over the single classifier reported in Table 4. It can be observed that bagging improved the accuracy of MLP, RBF, BBN, NB and DT. However, bagging SVM resulted in lower accuracy compared to single SVM in general. In case of RBF and DT, it can be observed that bagging increased their classification accuracy regardless of the ensemble size. However, in case of MLP and BBN, bagging increased their classification accuracy when the ensemble size is 20 or more.
Table 6 presents the accuracy achieved by each classification model after applying boosting on it using different ensemble size. Bold values indicate that boosting resulted in improved accuracy over the single classifier reported in Table 4. Clearly, boosting improved the accuracy of RBF, BBN and DT regardless of the ensemble size. However, applying boosting on MLP, NB and SVM reduced their classification accuracy regardless of the ensemble size.
Table 5: Classification accuracy after applying bagging on base classifiers using different ensemble size
Ensemble
size MLP RBF BBN NB SVM DT
5 74.48 69.66 57.24 69.66 62.07 66.90 10 77.93 72.41 62.07 70.34 62.07 67.59 15 78.62 71.03 61.38 68.97 60.69 68.28 20 79.31 73.10 63.45 70.34 61.38 68.97 25 80.00 71.72 64.83 70.34 62.07 68.97 30 80.00 72.41 65.52 70.34 62.76 69.66 35 80.00 72.41 64.83 70.34 62.76 70.34 40 80.00 73.10 66.21 70.34 62.76 69.66 45 80.00 72.41 67.59 70.34 62.07 71.72 50 80.00 73.10 66.90 70.34 62.07 71.72
Table 6: Classification accuracy after applying boosting on base classifiers using different ensemble size
Ensemble size MLP RBF BBN NB SVM DT
5 73.79 72.41 64.83 67.59 60.00 70.34 10 74.48 75.17 64.83 68.28 60.69 70.34 15 73.79 74.48 64.83 69.66 62.07 73.10 20 73.10 75.17 64.83 68.97 60.69 71.72 25 73.10 74.48 64.83 68.97 61.38 73.79 30 73.10 74.48 64.83 68.97 61.38 73.79 35 73.10 73.79 64.83 68.97 60.69 73.79 40 73.10 73.79 64.83 68.97 62.07 73.79 45 73.10 73.79 64.83 68.97 62.07 73.79 50 73.10 73.79 64.83 68.97 62.07 73.79
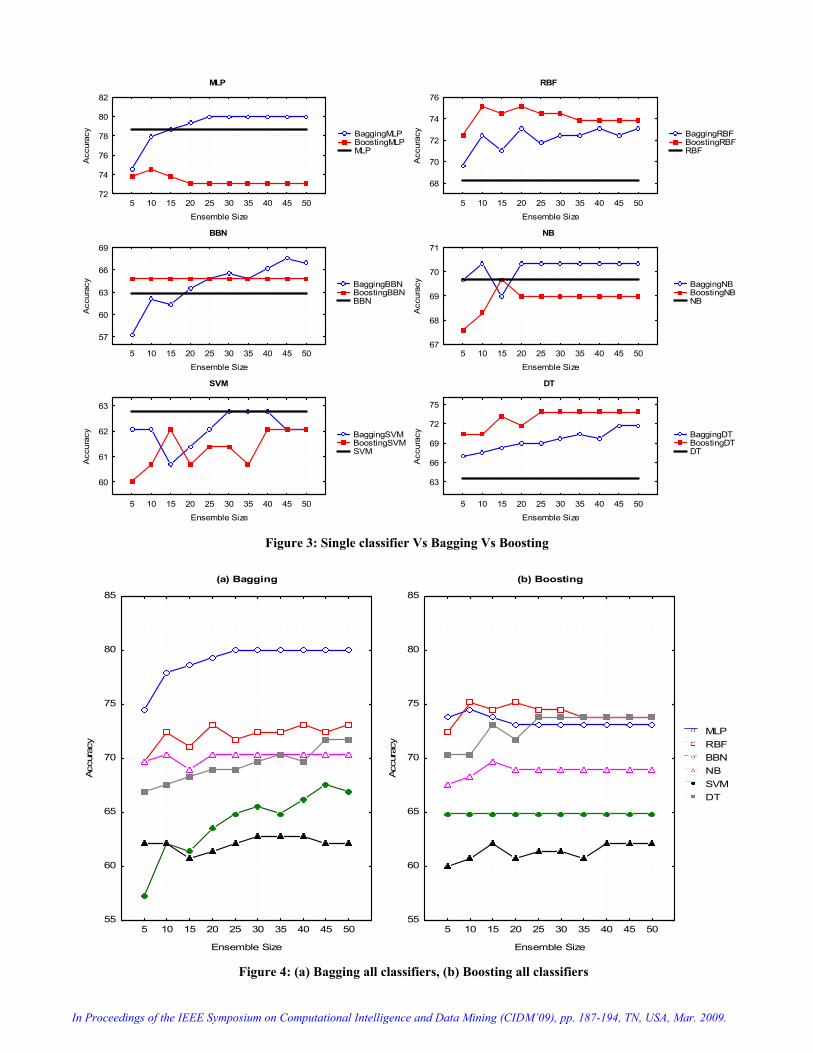
Figure 3 compares the effect of applying bagging and
boosting on each base classifier by plotting the accuracy of bagging and boosting with different ensemble size against the single classifier accuracy which is marked as a black horizontal line in the figures. It is observed that applying bagging and boosting on RBF and DT improved their accuracy in all different ensemble size. In addition, in case of MLP and NB, bagging produced higher accuracy than boosting. In case of RBF and DT, boosting accuracy was higher than bagging. In case of BBN, boosting accuracy was stable, and bagging produced better accuracy than boosting as we increase the ensemble size, starting from ensemble size 30. In contrast, neither bagging nor boosting SVM improved its accuracy.
Figure 4 (a) and (b) plot the accuracy of bagging and boosting for each base classifiers with different ensemble size, respectively. Figure 4 (a) indicates that bagging MLP improved its accuracy significantly and made it superior compared to the other models. Bagging DT improved its accuracy considerably and made it competitive with RBF and NB. However, even after applying bagging on SVM and BBN, they produced the worst accuracy. Figure 4 (b) indicates that boosting made MLP, RBF and DT close to
In Proceedings of the IEEE Symposium on Computational Intelligence and Data Mining (CIDM’09), pp. 187-194, TN, USA, Mar. 2009.
MLP
BaggingMLP BoostingMLP MLP
5 10 15 20 25 30 35 40 45 50
Ensemble Size
72
74
76
78
80
82A
ccur
acy
RBF
BaggingRBF BoostingRBF RBF
5 10 15 20 25 30 35 40 45 50
Ensemble Size
68
70
72
74
76
Acc
urac
y
BBN
BaggingBBN BoostingBBN BBN
5 10 15 20 25 30 35 40 45 50
Ensemble Size
57
60
63
66
69
Acc
urac
y
NB
BaggingNB BoostingNB NB
5 10 15 20 25 30 35 40 45 50
Ensemble Size
67
68
69
70
71
Acc
urac
y
SVM
BaggingSVM BoostingSVM SVM
5 10 15 20 25 30 35 40 45 50
Ensemble Size
60
61
62
63
Acc
urac
y
DT
BaggingDT BoostingDT DT
5 10 15 20 25 30 35 40 45 50
Ensemble Size
63
66
69
72
75A
ccur
acy
Figure 3: Single classifier Vs Bagging Vs Boosting
(a) Bagging
5 10 15 20 25 30 35 40 45 50
Ensemble Size
55
60
65
70
75
80
85
Accu
racy
(b) Boosting
5 10 15 20 25 30 35 40 45 50
Ensemble Size
55
60
65
70
75
80
85
Accu
racy
MLP RBF BBN NB SVM DT
Figure 4: (a) Bagging all classifiers, (b) Boosting all classifiers
In Proceedings of the IEEE Symposium on Computational Intelligence and Data Mining (CIDM’09), pp. 187-194, TN, USA, Mar. 2009.
each other to compete for the best accuracy. Boosting RBF and DT had a positive effect on the accuracy of these models, but boosting MLP decreased its accuracy. As in bagging, SVM and BBN produced the worst accuracy after applying boosting on them compared to the other boosted models.
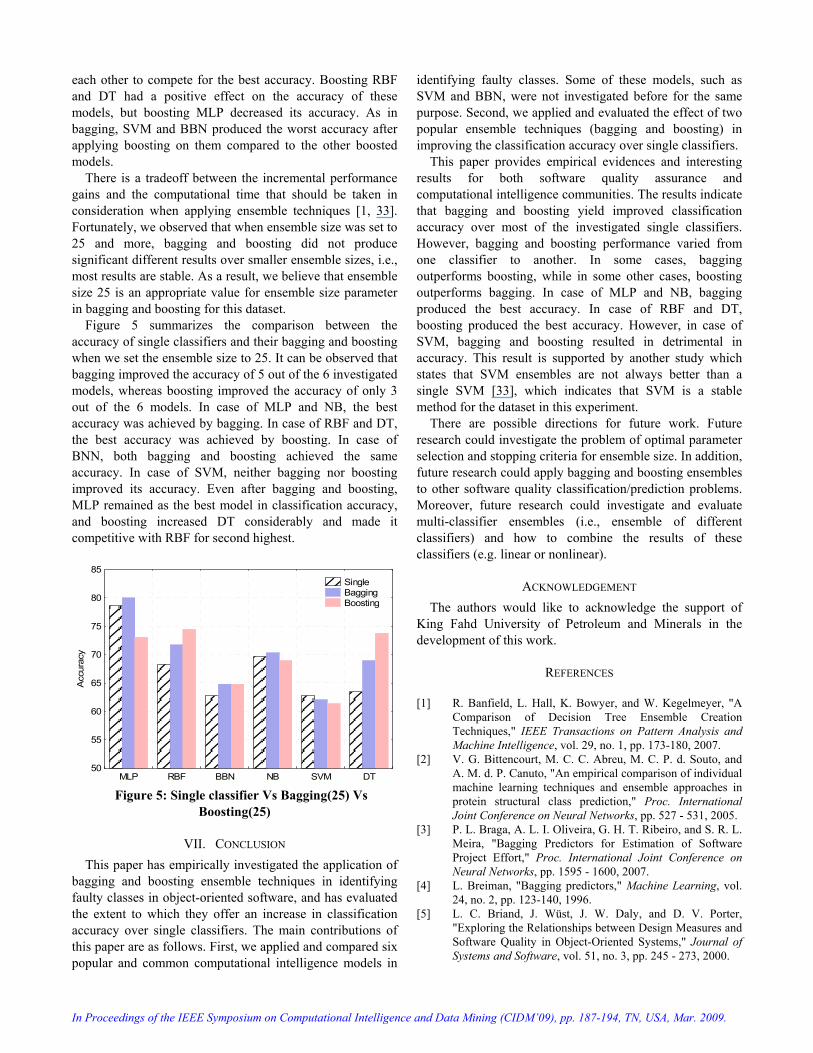
There is a tradeoff between the incremental performance gains and the computational time that should be taken in consideration when applying ensemble techniques [1, 33]. Fortunately, we observed that when ensemble size was set to 25 and more, bagging and boosting did not produce significant different results over smaller ensemble sizes, i.e., most results are stable. As a result, we believe that ensemble size 25 is an appropriate value for ensemble size parameter in bagging and boosting for this dataset.
Figure 5 summarizes the comparison between the accuracy of single classifiers and their bagging and boosting when we set the ensemble size to 25. It can be observed that bagging improved the accuracy of 5 out of the 6 investigated models, whereas boosting improved the accuracy of only 3 out of the 6 models. In case of MLP and NB, the best accuracy was achieved by bagging. In case of RBF and DT, the best accuracy was achieved by boosting. In case of BNN, both bagging and boosting achieved the same accuracy. In case of SVM, neither bagging nor boosting improved its accuracy. Even after bagging and boosting, MLP remained as the best model in classification accuracy, and boosting increased DT considerably and made it competitive with RBF for second highest.
MLP RBF BBN NB SVM DT50
55
60
65
70
75
80
85
Acc
urac
y
Single Bagging Boosting
Figure 5: Single classifier Vs Bagging(25) Vs
Boosting(25)
VII. CONCLUSION This paper has empirically investigated the application of
bagging and boosting ensemble techniques in identifying faulty classes in object-oriented software, and has evaluated the extent to which they offer an increase in classification accuracy over single classifiers. The main contributions of this paper are as follows. First, we applied and compared six popular and common computational intelligence models in
identifying faulty classes. Some of these models, such as SVM and BBN, were not investigated before for the same purpose. Second, we applied and evaluated the effect of two popular ensemble techniques (bagging and boosting) in improving the classification accuracy over single classifiers.
This paper provides empirical evidences and interesting results for both software quality assurance and computational intelligence communities. The results indicate that bagging and boosting yield improved classification accuracy over most of the investigated single classifiers. However, bagging and boosting performance varied from one classifier to another. In some cases, bagging outperforms boosting, while in some other cases, boosting outperforms bagging. In case of MLP and NB, bagging produced the best accuracy. In case of RBF and DT, boosting produced the best accuracy. However, in case of SVM, bagging and boosting resulted in detrimental in accuracy. This result is supported by another study which states that SVM ensembles are not always better than a single SVM [33], which indicates that SVM is a stable method for the dataset in this experiment.
There are possible directions for future work. Future research could investigate the problem of optimal parameter selection and stopping criteria for ensemble size. In addition, future research could apply bagging and boosting ensembles to other software quality classification/prediction problems. Moreover, future research could investigate and evaluate multi-classifier ensembles (i.e., ensemble of different classifiers) and how to combine the results of these classifiers (e.g. linear or nonlinear).
ACKNOWLEDGEMENT The authors would like to acknowledge the support of
King Fahd University of Petroleum and Minerals in the development of this work.
REFERENCES
[1] R. Banfield, L. Hall, K. Bowyer, and W. Kegelmeyer, "A Comparison of Decision Tree Ensemble Creation Techniques," IEEE Transactions on Pattern Analysis and Machine Intelligence, vol. 29, no. 1, pp. 173-180, 2007.
[2] V. G. Bittencourt, M. C. C. Abreu, M. C. P. d. Souto, and A. M. d. P. Canuto, "An empirical comparison of individual machine learning techniques and ensemble approaches in protein structural class prediction," Proc. International Joint Conference on Neural Networks, pp. 527 - 531, 2005.
[3] P. L. Braga, A. L. I. Oliveira, G. H. T. Ribeiro, and S. R. L. Meira, "Bagging Predictors for Estimation of Software Project Effort," Proc. International Joint Conference on Neural Networks, pp. 1595 - 1600, 2007.
[4] L. Breiman, "Bagging predictors," Machine Learning, vol. 24, no. 2, pp. 123-140, 1996.
[5] L. C. Briand, J. Wüst, J. W. Daly, and D. V. Porter, "Exploring the Relationships between Design Measures and Software Quality in Object-Oriented Systems," Journal of Systems and Software, vol. 51, no. 3, pp. 245 - 273, 2000.
In Proceedings of the IEEE Symposium on Computational Intelligence and Data Mining (CIDM’09), pp. 187-194, TN, USA, Mar. 2009.
[6] S. R. Chidamber and C. F. Kemerer, "A Metrics Suite for Object Oriented Design," IEEE Transactions on Software Engineering, vol. 20, no. 6, pp. 476 - 493, 1994.
[7] K. El-Emam, W. Melo, and J. C. Machado, "The Prediction of Faulty Classes Using Object-Oriented Design Metrics," Journal of Systems and Software, vol. 56, no. 1, pp. 63 - 75, 2001.
[8] K. O. Elish and M. O. Elish, "Predicting defect-prone software modules using support vector machines," Journal of Systems and Software, vol. 81, no. 5, pp. 649-660, 2008.
[9] Y. Freund, "Boosting a weak learning algorithm by majority," Information and Computation, vol. 121, no. 2, pp. 256–285, 1995.
[10] Y. Freund and R. E. Schapire, "A decision-theoretic generalization of on-line learning and an application to boosting," Proc. European Conference on Computational Learning Theory, pp. 23-37, 1995.
[11] Y. Freund and R. E. Schapire, "Experiments with a new boosting algorithm," Proc. Thirteenth International Conference on Machine Learning, Italy, pp. 148-156, 1996.
[12] N. Friedman, D. Geiger, and M. Goldszmidt, "Bayesian Network Classifiers," Machine Learning, vol. 29, pp. 131-163, 1997.
[13] S. Gutta and H. Wechsler, "Face Recognition Using Hybrid Classifier Systems," Proc. IEEE Int. Conf. on Neural Networks, pp. 1017-1022, 1996.
[14] T. Gyimothy, R. Ferenc, and I. Siket, "Empirical Validation of Object-Oriented Metrics on Open Source Software for Fault Prediction," IEEE Transactions on Software Engineering, vol. 31, no. 10, pp. 897 - 910, 2005.
[15] S. Haykin, Neural Networks: A Comprehensive Foundation New Jersey, USA: Prentice Hall, 1999.
[16] F. J. Huang, Z. Zhou, H.-J. Zhang, and T. Chen, "Pose invariant face recognition," Proc. 4th IEEE Int. Conf. on Automatic Face and Gesture Recognition, France, pp. 245-250, 2000.
[17] T. Kamiya, S. Kusumoto, and K. Inoue, "Prediction of fault-proneness at early phase in object-oriented development," Proc. Second IEEE International Symposium on Object Oriented Real-Time Distributed Computing, pp. 253 – 258, 1999.
[18] T. M. Khoshgoftaar, E. Geleyn, and L. Nguyen, "Empirical Case Studies of Combining Software Quality Classification Models," Proc. Third International Conference on Quality Software, pp. 40, 2003.
[19] A. Mahaweerawat, P. Sophatsathit, C. Lursinsap, and P. Musilek, "Fault Prediction in Object-Oriented Software Using Neural Network Techniques," Proc. International Conference on Intelligent Technologies, pp. 27-34, 2004.
[20] J. Mao, "A case study on bagging, boosting and basic ensembles of neural networks for OCR," Proc. IEEE Int. Joint Conf. on Neural Networks, pp. 1828-1833, 1998.
[21] I. Myrtveit and M. Shepperd, "Reliability and validity in comparative studies of software prediction models," IEEE Transactions on Software Engineering, vol. 31, no. 5, pp. 380 - 391, 2005.
[22] D. W. Opitz and R. F. Maclin, "An empirical evaluation of bagging and boosting for artificial neural networks," Proc. Intl. Conf. on Neural Networks, pp. 1401-1405, 1997.
[23] G. J. Pai and J. B. Dugan, "Empirical Analysis of Software Fault Content and Fault Proneness Using Bayesian Methods," IEEE Transactions on Software Engineering, vol. 33, no. 10, pp. 675-686, 2007.
[24] T. Poggio and F. Girosi, "Networks for approximation and learning," Proceedings of the IEEE, vol. 78, no. 9, pp. 1481-1497, 1990.
[25] J. R. Quinlan, "Bagging, boosting, and c4.5," Proc. Thirteenth National Conference on Artificial Intelligence, pp. 725-730, 1996.
[26] J. R. Quinlan, C4.5: Programs for Machine Learning: Morgan Kaufmann Publishers, 1993.
[27] I. Rish, "An empirical study of the naive Bayes classifier," Proc. IJCAI 2001 Workshop on Empirical Methods in Artificial Intelligence, 2001.
[28] R. E. Schapire, "The strength of weak learnability," Machine Learning, vol. 5, no. 2, pp. 197-227, 1990.
[29] Y. Shimshoni and N. Intrator, "Classification of seismic signals by integrating ensembles of neural networks," IEEE Trans. Signal Processing, vol. 46, no. 5, pp. 1194-1201, 1998.
[30] P. Sollich, "Learning with Ensembles: How over-fitting can be useful," Advances in Neural Information Processing Systems, vol. 8, pp. 190-196, 1996.
[31] M. M. T. Thwin and T.-S. Quah, "Application of Neural Networks for Software Quality Prediction Using Object-Oriented Metrics," Journal of Systems and Software, vol. 76, no. 2, pp. 147 - 156, 2005.
[32] V. Vapnik, The Nature of Statistical Learning Theory. New York: Springer, 1995.
[33] S.-j. Wang, A. Mathew, Y. Chen, L.-f. Xi, L. Ma, and J. Lee, "Empirical analysis of support vector machine ensemble classifiers," 2008.
[34] I. H. Witten and E. Frank, Data Mining: Practical Machine Learning Tools and Techniques, second ed. San Francisco: Morgan Kaufmann, 2005.
[35] P. Yu, T. Systä, and H. A. Müller, "Predicting Fault-Proneness Using OO Metrics: An Industrial Case Study," Proc. 6th European Conference on Software Maintenance and Reengineering, pp. 99 - 107, 2002.
[36] Y. Yuan and M. J. Shaw, "Induction of fuzzy decision trees," Fuzzy Sets and Systems vol. 69, no. 2, pp. 125-139, 1995.
[37] C.-X. Zhang, J.-S. Zhang, and G.-Y. Zhang, "An efficient modified boosting method for solving classification problems," Journal of Computational and Applied Mathematics, vol. 214, pp. 381 – 392, 2008.
[38] J. Zheng, "Predicting software reliability with neural network ensembles," Expert Systems with Applications, vol. 36, no. 2, pp. 2116-2122, 2009.