an efficient naturalness-preserving image-recoloring method for dichromats
TRANSCRIPT

An Efficient Naturalness-Preserving Image-Recoloring Method forDichromats
Giovane R. Kuhn, Manuel M. Oliveira, and Leandro A. F. Fernandes
Abstract— We present an efficient and automatic image-recoloring technique for dichromats that highlights important visual detailsthat would otherwise be unnoticed by these individuals. While previous techniques approach this problem by potentially changing allcolors of the original image, causing their results to look unnatural to color vision deficients, our approach preserves, as much aspossible, the image’s original colors. Our approach is about three orders of magnitude faster than previous ones. The results of apaired-comparison evaluation carried out with fourteen color-vision deficients (CVDs) indicated the preference of our technique overthe state-of-the-art automatic recoloring technique for dichromats. When considering information visualization examples, the subjectstend to prefer our results over the original images. An extension of our technique that exaggerates color contrast tends to be preferredwhen CVDs compared pairs of scientific visualization images. These results provide valuable information for guiding the design ofvisualizations for color-vision deficients.
Index Terms—Color-contrast enhancement, Color-vision deficiency, Recoloring algorithms, Information and Scientific Visualization
1 INTRODUCTION
Individuals with normal color vision, called trichromats, present threekinds of cone cells (retinal photoreceptors associated with color sen-sation). People who are missing one class of cones are called dichro-mats, and can be further classified as protanopes, deuteranopes, andtritanopes, depending on whether the missing cones are more sensi-tive to the long, medium, or short wavelengths of the visible spec-trum, respectively. Natural variations of some proteins may result inchanges in the cones’ photopigments, making them more sensitive toa different band of the visible spectrum [26]. Individuals with alteredphotopigments are called anomalous trichromats and, likewise, can beclassified as protanomalous, deuteranomalous, or tritanomalous. Amuch rarer situation is characterized by individuals having a single orno kind of cone cells, who are called monochromats. Some estimatesindicate that for the male population, approximately 7.40% of Euro-pean descendents, 4.17% of Asians, and 2.61% of Africans have somekind of red-green color vision deficiency (CVD) [26]. For the femalepopulation, the numbers are smaller: 0.50%, 0.58%, and 0.54%, re-spectively. According to these numbers, approximately 200 millionpeople should have some kind of CVD. Among the European descen-dants, the only ethnic group for which one can find detailed statistics,the numbers are summarized in Table 1.
Color vision deficiency tends to impose several limitations, espe-cially for dichromats and monochromats. Children often feel frus-trated by not being able to perform color-related tasks [8], and adultstend to face difficulties to perform some daily activities. Some pro-fessional fields, such as biology, chemistry, geology, fashion design,electronics, and others that require interpreting scientific and infor-mation visualization data may be especially challenging for colorvision deficients [20]. Recently, several techniques have been pro-posed to recolor images highlighting visual details missed by dichro-mats [11, 13, 23, 24, 31]. Although these techniques use differentstrategies, they all approach the problem by potentially changing allcolors of the original image. In consequence, their results tend to lookunnatural to color vision deficients. Moreover, they tend to presenthigh computational costs, not scaling well with the number of colorsand the size of the input images.
• Giovane R. Kuhn, Manuel M. Oliveira, and Leandro A. F. Fernandes arewith Instituto de Informatica - UFRGS. E-mails: {grkuhn | oliveira |laffernandes}@inf.ufrgs.br.
Manuscript received 31 March 2008; accepted 1 August 2008; posted online19 October 2008; mailed on 13 October 2008.For information on obtaining reprints of this article, please sende-mailto:[email protected].
We present an efficient and automatic technique for enhancing colorcontrast for dichromats that preserves, as much as possible, the natu-ralness of the original colors (Section 3). Given the dichromats’ re-duced color gamut, in the context of this paper naturalness preserva-tion should be understood under the as much as possible constraint.Our algorithm is based on a mass-spring optimization and presentsseveral other desirable features: (i) it is deterministic; (ii) it satisfies aglobal consistency property (i.e., all pixels with the same color in theoriginal image will be mapped to the same shade in the recolored im-age); (iii) it preserves the original image luminance and (iv) it can beefficiently implemented on modern GPUs. A paired-comparison eval-uation with fourteen color-vision deficients indicated their preferencefor the results produced by our technique for information visualizationexamples. For a set of scientific visualization images, the subjects pre-ferred an extension of our technique that exaggerates color contrast.
Figure 1 illustrates a result produced by our technique and comparesit with an image obtained using the approach of Rasche et al. [24].Figure 1 (a) shows a photograph (839×602 pixels) used as reference,while (b) is a simulated view of a protanope for the same image. Thesimulation was performed using the algorithm described by Brettel etal. [1]. Figure 1 (c) shows a simulated view of a protanope after the im-age in (a) has been recolored using Rasche et al.’s approach. Figure 1(d) shows the simulated view of a protanope for the result producedby our technique for the same image. Note that although the colorsof the petals have changed to enhance contrast, the colors of the flow-ers’ nuclei and the background foliage have been preserved as much aspossible. For this example, the GPU implementation of our algorithmperforms about 2,000× faster than Rasche et al.’s approach. Our CPUimplementation is still approximately 370× faster than Rasche et al’simplementation.
2 RELATED WORK
Recoloring techniques for color-vision deficients can be broadly clas-sified as user-assisted and automatic techniques.
User-Assisted Recoloring Techniques: Daltonize [4] uses threeuser-provided parameters for recoloring images for protanopes anddeuteranopes. Such parameters specify how much of the red-greenchannel should be stretched, projected into the luminance channel,and projected into the yellow-blue channel, respectively. Working onthe HSL color space, Iaccarino et al. [9] modulate the original imagecolors using six user-provided parameters. The quality of the resultsobtained with user-assisted recoloring techniques is highly dependenton the user-provided parameters.
Automatic Recoloring Techniques: Ichikawa et al. [10] used anobjective function to recolor web pages for anomalous trichromatspreserving the ratio between the color differences perceived by trichro-

(a) (b) (c) (d)
Fig. 1. Images of natural flowers: (a) Photograph. (b) Same image as perceived by protanopes (i.e., individuals without red cones). (c) Simulatedview of a protanope for a contrast-enhanced version of the photograph recolored by Rasche et al.’s [24] approach. (d) Simulated view of a protanopefor the result produced by our technique. Note how our approach enhanced the overall image contrast by selectively changing only the colors forwhich there is a significant perceptual difference between trichromats and dichromats. As a result, it preserved the naturalness of the colors (fromthe perspective of the dichromat) of the flowers’ nuclei and of the background foliage (compare images (b) and (d)). For this 839×602-pixel image,our approach performs approximately 2,000× faster than Rasche et al.’s technique.
mats and by anomalous trichromats. A genetic algorithm was used tominimize the objective function. Ichikawa et al. [11] extended theirprevious technique for use on color images, but they did not considerthe preservation of color naturalness. Wakita and Shimamura [31] pro-posed a technique to recolor documents (e.g., web pages, charts, maps)for dichromats using three objective functions aiming, respectively, at:(i) color contrast preservation, (ii) maximum color contrast enforcing,and (iii) color naturalness preservation. However, the colors for whichnaturalness should be preserved must be specified by the user. Theobjective functions are then combined by weighting user-specified pa-rameters and optimized using simulated annealing. They report thatdocuments with more than 10 colors could take several seconds to beoptimized. Jefferson and Harvey [13] select a set of key colors fromthe difference between the trichromat’s and dichromat’s image his-togram and use four objective functions to preserve brightness, colorcontrast, colors in the available gamut, and color naturalness. Again,the user must specify the set of colors whose naturalness should bepreserved. They optimize the combined objective functions using amethod of preconditioned conjugate gradients. They report times ofseveral minutes to optimize a set of 25 key colors on a P4 2.0 GHzusing a Matlab implementation.
Rasche et al. [23] proposed an automatic recoloring technique fordichromats as an optimization that tries to preserve the perceptualcolor differences between all pairs of colors using an affine transfor-mation. Such transformation, however, does not capture color varia-tions along many directions and does not ensure that the mapped col-ors are all within the available gamut. Rasche et al. [24] addressedthese limitations using a constrained multivariate optimization proce-dure applied to a reduced set of quantized color, which are in turn usedto optimize the entire set of colors. The authors did not consider theproblem of naturalness preservation and the technique can arbitrarilychange the colors of the original images (Figure 1 c). Moreover, thealgorithm does not scale well with the number of quantized colors andthe size of the input images. Our technique can optimize hundreds ofcolors in real time, and can be used to create images that have a muchmore natural look (Figure 1 d). Contrary to all previous automatictechniques, our approach is deterministic, always producing the sameresult for a given input image.
Recoloring images for dichromats is a dimensionality reductionproblem and, as such, is somehow related to recent techniques usedto map color to grayscale techniques [6, 7, 14].
2.1 Mass-Spring SystemsA mass-spring system consists of a set of particles (nodes) connectedby springs that deform in the presence of some external forces. Whencompressed or stretched, the springs apply internal reaction forcesto maintain their rest length [5]. Mass-spring systems are simulatedby assigning some position and mass to each particle, and some restlength to each spring. The system must obey Newton’s second law:
Fi = miai (1)
Classification Incidence (%)Male Female
Anomalous trichromacy 5.71 0.39Protanomaly 1.08 0.03Deuteranomaly 4.63 0.36Tritanomaly 0.0001 0.0001Dichromacy 2.28 0.03Protanopia 1.01 0.02Deuteranopia 1.27 0.01Tritanopia 0.002 0.001Monochromacy 0.003 0.00001
Table 1. Incidence of CVD among caucasians [26, 25].
where mi is the mass of node Pi, ai is the acceleration caused by forceFi, which is the composition of internal and external forces. Therefore,Fi can be obtained from Hooke’s law by summing the tensions of allthe springs that connect Pi to its neighbors Pj:
Fi = ∑j∈N
ki j(1−li j
l′i j)(p j − pi) (2)
where N is the set of neighbors linked to Pi, li j and l′i j are, respectively,the rest length and current length of the spring between Pi and Pj, ki jis the stiffness of that spring, and pi and p j are the current positions ofPi and Pj, respectively. Verlet integration is often used to express thedynamics of each node. This type of integration is frequently used insimulations of small unoriented mass-points, being especially interest-ing when it is necessary to place constraints on the distances betweenthe points. With a time step Δt, the new position of a node Pi at timet +Δt can be computed as:
pi(t +Δt) =Fi(t)mi
(Δt)2 +2pi(t)− pi(t −Δt) (3)
Recently, some researchers have demonstrated efficient implementa-tions of mass-spring systems on GPUs [3, 5, 28]. In each integrationstep, the forces acting on each mass point Pi are accumulated in a frag-ment shader, requiring information about the system topology, whichis usually stored in two textures [3, 28]. Our recoloring approach ismodeled as a mass-spring system with every mass point Pi connectedto every other mass point Pj by a spring Si j . This fixed and implicitlydefined topology lends itself to an efficient GPU implementation, withno topology setup needed.
3 THE RECOLORING ALGORITHM FOR DICHROMATS
Our algorithm uses a mass-spring system to optimize the colors in theinput image to enhance color contrast for dichromats. The color gamutof each class of dichromacy can be represented by two half-planes in

the LMS color space [1], which can be satisfactorily approximated bya single plane passing through the luminance axis [30]. Thus, for eachclass of dichromacy, we mapped its color gamut to the approximatelyperceptually-uniform CIE L*a*b* color space and used least-squaresto obtain a plane Π that contains the luminance axis and best representsthe corresponding gamut. This is similar to what has been describedby Rasche et al. [24], who suggested the use of a single plane for bothprotanopes and deuteranopes as a further simplification. The anglesbetween the recovered planes and the L*b* plane are θp = −11.48◦ ,θd = −8.11◦, and θt = 46.37◦ , for protanopes, deuteranopes, and tri-tanopes, respectively (Figure 2). These angles are used to align theircorresponding planes to the L*b* plane, reducing the optimization to1D along the b* axis (the luminance values are preserved). After theoptimization, the new colors are obtained by rotating the correspond-ing plane back to its original orientation.
Fig. 2. Approximating each dichromatic color gamut by a plane in theCIE L*a*b* color space. θp = −11.48◦, θd = −8.11◦, and θt = 46.37◦ .
Our algorithm has three main steps: (1) image quantization,(2) mass-spring optimization of the quantized colors, and (3) recon-struction of the final colors from the optimized ones. The first stepconsists in obtaining a set Q of quantized colors from the set of allcolors C in the input image I. This can be performed using any colorquantization technique, such as uniform quantization, k-means, mini-mum variance, median cut, or color palettes.
3.1 Modeling the Problem as a Mass-Spring SystemWorking in the CIE L*a*b* color space, each quantized color �qi ∈ Qis associated to a particle Pi with mass mi. The position �pi of theparticle Pi is initialized with the coordinates of the perceived color bythe dichromat after the rotation of plane Π:
�pi = Mθ D �qi (4)
where D is the matrix for orthographic projection onto the dichromat’splane Π (see Appendix A), and Mθ is a rotation matrix that aligns Πwith the L*b* plane. We connect each pair of particles Pi and Pj witha spring Si j with elasticity coefficient ki j = 1 (Equation 2), and restlength li j = ‖�qi − �q j‖, the (Euclidean) distance between colors �qi and�q j in the L*a*b* space. At each optimization step, we update the po-sitions �pi and �p j and compute Si j’s current length as l′i j = ‖�pi − �p j‖.Given the restoring forces of the springs, the system will try to con-verge to a configuration for which l′i j = li j for all Si j . Thus, after sta-bilization (or a maximum number of iterations has been reached), theperceptual distances between all pairs of new colors/positions (�pi, �p j)will have approximately the same perceptual distances as their cor-responding pairs of quantized colors (�qi, �q j) from Q. The set T ofoptimized colors�ti is obtained by applying, to each resulting color �pi,the inverse rotation used in Equation 4:
�ti = M−1θ �pi (5)
In order to enforce color naturalness preservation, we define themass mi of each particle Pi as the reciprocal of the perceptual distance(in the L*a*b* space), between �qi and D �qi:
mi =1
‖�qi −D �qi‖ (6)
This equation enforces that any color perceived similarly by bothtrichromats and dichromats will have larges masses, causing their
corresponding particles to move less. If trichromats and dichromatsperceive �qi exactly the same way (e.g., achromatic colors), the particlewould have infinite mass. In this case, we simply set the forces actingon the particle to zero (i.e., Fi = 0 in Equation 1).
3.2 Dealing with Local MinimaLike other optimization techniques, mass-spring systems are proneto local minima. Figure 3 (left) depicts the problem with a con-figuration obtained right after the quantized colors �qi have been ro-tated: �qri = Mθ D �qi. Particles P1 and P2 have large masses (m1is infinite) since they are perceived as having, respectively, the sameand very similar colors by trichromats and dichromats. The springs(S13,S14,S23,S24) connecting P1 and P2 to P3 and P4 apply forces thatconstrain P3 and P4 from moving to the other half of the b* axis. Fig-ure 4 illustrates this situation, where the resulting optimized image (c)does not represent any significant improvement over the original im-age perceived by the dichromat (b).
Once the plane that approximates the dichromat’s gamut has beenaligned to the L*b* plane, pairs of ambiguous colors with consider-able changes in chrominance will have their a* color coordinates withopposite signs (e.g., the red and green colors in Figure 3 left). We usethis observation and the topology of our mass spring system to dealwith local minima using the following heuristic: we switch the sign ofthe b* color coordinate of all rotated quantized colors whose a* coor-dinates are positive and whose perceptual distance between the coloritself and how it is perceived by the class of dichromacy is bigger thansome threshold τ (Equation 7).
pb∗i =
{−pb∗
i if (qra∗i > 0) and (‖�qi −D�qi‖ > τ)
pb∗i otherwise
(7)
The threshold τ enforces that colors that are perceptually similar toboth dichromats and trichromats should not have the signs of their b*coordinates switched.
Although at first this might look too naive because one would just bereplacing some ambiguities with another ones, it has some rationale:(i) it avoids the ambiguities among some colors found in the origi-nal image and (ii) although there is the possibility of introducing newambiguities, as we switch the sign of the b* coordinate for some col-ors, we are also compressing and stretching their associated springs,adding to the system a lot of potential energy that will contribute todrive the solution. Although such a heuristic cannot guarantee that thesystem will not run into a local minimum, it works well in practice.Figure 3 (right) illustrates the configuration obtained by applying ourheuristics to the example shown to its left. Figure 4 (d) shows thecorresponding result of applying this heuristic to the example shownin Figure 4 (a). According to our experience, τ = 15 tends to producegood results in general and was used for all images shown in this paperand in the accompanying video.
Fig. 3. Dealing with local minima. (left) A configuration, obtained rightafter plane rotation, which leads to a local minimum: since P1 cannotmove at all (it is an achromatic color) and P2 can only move a little bit,they will constrain the optimization to the yellow portion of b* axis. (right)By switching the sign of the b* coordinate of �qr4, the system escapes thelocal minimum.

(a) (b) (c) (d)
Fig. 4. Color naturalness preservation: (a) Reference image. (b) Sim-ulation of a deuteranope’s view of the image in (a). (c) Simulation of adeuteranope’s view after recoloring the reference image using the mass-spring optimization without the heuristic described by Equation 7. (d)Result produced by our technique with the use of Equation 7.
3.3 Computing the Final Color ValuesThe last step of the algorithm consists in obtaining the color values forall pixels of the resulting image from the set of optimized colors tk,k ∈ {1, ..,‖T‖}, where ‖T‖ is the cardinality of T . For this task, wehave developed two distinct interpolation solutions: projection of theperceptual difference and an optimization with respect to T .
Projection of the perceptual difference: Let Ck ⊂ C be a clusterformed by all colors in C that are represented by the optimized color�tk. The final value �tk
m associated to color �ckm ∈Ck is then obtained as
�tkm =�tk +(�d.L∗,rk �d.a∗,rk �d.b∗) (8)
where �d.L∗, �d.a∗, and �d.b∗ are respectively the L*, a*, and b* coordi-nates of the difference vector �d = (�ck
m − �qk). �qk ∈ Q is the quantizedcolor associated to the optimized color �tk. Equation 8 guarantees thatthe final color �tk
m has the same luminance as �ckm. rk is an interpolation
of ratios that indicates how close the transformed value �tk is to the op-timal solution. This interpolation is guided by Shepard’s method [27],a standard technique for distance-weighted interpolation:
rk =∑‖T‖
i=1 wki‖�tk−�ti‖
‖�qk−�qi‖+ε
∑‖T‖i=1 wki
(9)
where ε is a small value just to avoid division by zero, andwki = 1/(‖�qk −�qi‖2 + ε) is the distance-weighted term suggestedby Shepard [27]. Equation 8 can be efficiently implemented both ona CPU and on a GPU. On the CPU, the cost to compute all clusterratios using Equation 9 is O(‖Q‖2) for the set Q of quantized colors,and the cost to interpolate each pixel using Equation 8 given an imagewith N ×N pixels is O(N2). Thus, the total cost of this strategy isO(‖Q‖2 +N2).
Since the final colors are computed by optimizing the set of quan-tized colors Q, the quality of the results depends directly on the qualityof the quantization algorithm used. According to our experience, thetransformation expressed by Equation 8 produces excellent results incombination with k-means. Unfortunately, k-means is not very fast.Table 2 compares uniform quantization and k-means execution timesfor various image resolutions and number of clusters. In the case ofuniform quantization, we discretize the RGB space using a uniform10×10×10 grid. The quantized color is given by the grid color clos-est to the input one. Uniform quantization is fast, but tends to leadto poorer results when used in combination with the transformationdefined by Equation 8.
Optimization with respect to T : One can benefit from the speed ofuniform quantization by performing a more expensive reconstructionof the final set of colors, achieving results similar to the ones obtainedwhen using k-means. In this case, the final shading of each pixel isobtained by optimizing it against the set of already optimized colorsT . This is modeled by setting up a mass-spring system, and creatingsprings between the current pixel (treated as a particle initialized withEquation 7) and all optimized colors tk, k ∈ [1, ..,‖T‖]. For thisrefining optimization stage, we force the particles associated to the
Quantization Image resolution (pixels)technique 640x480 800x600 1024x768Uniform 0.055 0.087 0.150K-means 64 2.082 3.338 5.517K-means 128 3.932 6.029 10.432K-means 256 7.545 11.972 20.049
Table 2. Time (in seconds) to quantize images with various resolutionsand numbers of clusters on a 2.2 GHz PC.
shades in T to remain stationary by setting the forces acting on themto zero (Fi in Equation 1). For each color �cm ∈ C, we define its massas mcm = 1/‖�cm −D �cm‖. This way, we allow a color to change by anamount directly proportional to the difference of how it is perceivedby trichromats and dichromats. This mechanism guarantees the colornaturalness in the resulting image.
The cost of this optimization procedure is O(‖Q‖2 + ‖Q‖N2) foran N ×N image and can be significantly higher than the mapping de-fined by Equation 8. However, since the color of each output pixelcan be computed independently of each other, the computation can beefficiently implemented in a fragment program. Table 3 compares thetimes for recoloring images with various resolutions using different al-gorithms. MS CPU and MS GPU are respectively the CPU and GPUversions of our mass-spring algorithm using Equation 8 to obtain thefinal colors. MS GPU full optimizes the final colors with respect toT as described in the previous paragraph. Table 3 shows that in allof its variations, our approach is a few orders of magnitude faster thanRasche et al.’s approach. All images (and execution times) reported forthe technique of Rasche et al. [24] were obtained using the softwareavailable at [22]. Since Rasche et al.’s technique is not deterministic,for each example shown in the paper, we ran their software three timesand selected the best image result.
Recoloring Image resolution (pixels)technique 640x480 800x600 1024x768Rasche 225.16 349.31 580.49MS CPU 0.41 0.46 0.54MS GPU 0.20 0.22 0.26MS GPU (full) 0.22 0.23 0.27
Table 3. Performance of various algorithms on images of different res-olutions. Times measured in seconds on a 2.2 GHz PC with 2 GB ofmemory and on a GeForce 8800 GTX GPU. Quantization times not in-cluded. All techniques used 128 quantized colors. Mass-spring (MS)optimized the set of quantized colors using 500 iterations. The full ver-sion obtained the final colors using 100 iterations per pixel.
3.4 Exaggerated Color ContrastFor applications involving non-natural images (e.g., scientific and in-formation visualization) contrast enhancement is probably more im-portant than preserving color naturalness. This comes from the factthat colors used in such applications tend to be arbitrary, usually hav-ing little connection to the viewer’s previous experiences in the realworld. In scientific visualization, the details presented by the datasetsare interactively explored via transfer functions [21]. Until now, trans-fer function design has largely ignored the limitations of color-visiondeficients. Popular color scales usually range from red to green, colorsthat are hard to be distinguished by most CVDs.
By supporting real-time recoloring of transfer functions and im-ages, our approach can assist color-vision deficients to exploit the ben-efits of scientific visualization. Such assistance can be even improvedwith the use of some color contrast exaggeration, achieved with thefollowing changes in our image-recoloring algorithm:
1. Modifying the springs’ rest lengths to exaggerate the contrast be-tween colors during the optimization process: li j = α ‖�qi − �q j‖,where α is a scalar used to exaggerate the perceptual differencebetween any pair of colors �qi and �q j;
2. Defining the mass of particle Pi as: mi = 1/‖(a∗i ,b∗i )‖, where‖(a∗i ,b∗i )‖ is the distance from color �qi to the luminance axisL∗. Thus, less saturated colors present bigger masses and tend tomove less. This preserves achromatic colors;
3. Initializing the mass-spring system with τ = 0 (Equation 7),since we do not need to preserve the naturalness of colors.
4 RESULTS
We have implemented the described algorithms using C++ and GLSL,and used them to recolor a large number of images. The reported timeswere measured using a 2.2 GHz PC with 2 GB of memory and on aGeForce 8800 GTX with 768 MB of memory. Figures 1, 5, and 6compare the results of our technique against Rasche et al.’s approach,which is the only truly automatic competing technique. Table 4 sum-marizes the performances of both algorithms. For these experiments,we used two different quantization techniques for the purpose of il-lustration: k-means and uniform quantization. For k-means we al-lowed up to 128 clusters. Uniform quantization was performed on a10×10×10 grid, allowing up to 1,000 clusters. The actual numbersof quantized colors (clusters) were obtained automatically by thesealgorithms observing the specified limits. k-means and uniform quan-tization were used in combination with the following reconstructionstrategies: projection of the perceptual difference, and optimizationwith respect to T, respectively. Figure 1 (Flowers) used uniform quan-tization with 227 colors; Figure 5 (Bell Peppers) used k-means with127 colors; Figure 6 (Chinese Garden) used k-means with 128 col-ors; Figure 7 (Flame) used uniform quantization with 84 colors; andFigure 8 (Carp) used uniform quantization with 131 colors.
Image (size) Rasche CPU GPUTime Time Time
Flowers (839×602) 315.84 0.85 0.16Bell Peppers (321×481) 114.63 0.27 0.09Chinese Garden (239×280) 44.06 0.23 0.08Flame (288×184) 52.15 0.19 0.08Carp (629×241) 121.25 0.26 0.09
Table 4. Performance comparison between our technique and Rascheet al.’s for images of various sizes and different quantization strategies.Time (in seconds) shows that our technique scales well with image size.
Figure 1 (Flowers) has 839×602 pixels and shows an example of animage recolored for protanopes. Our GPU implementation recoloredthis image in 0.158 seconds. This is 2,000× faster than Rasche et al.’sapproach. Our CPU implementation was still 372× faster than Rascheet al.’s for this example.
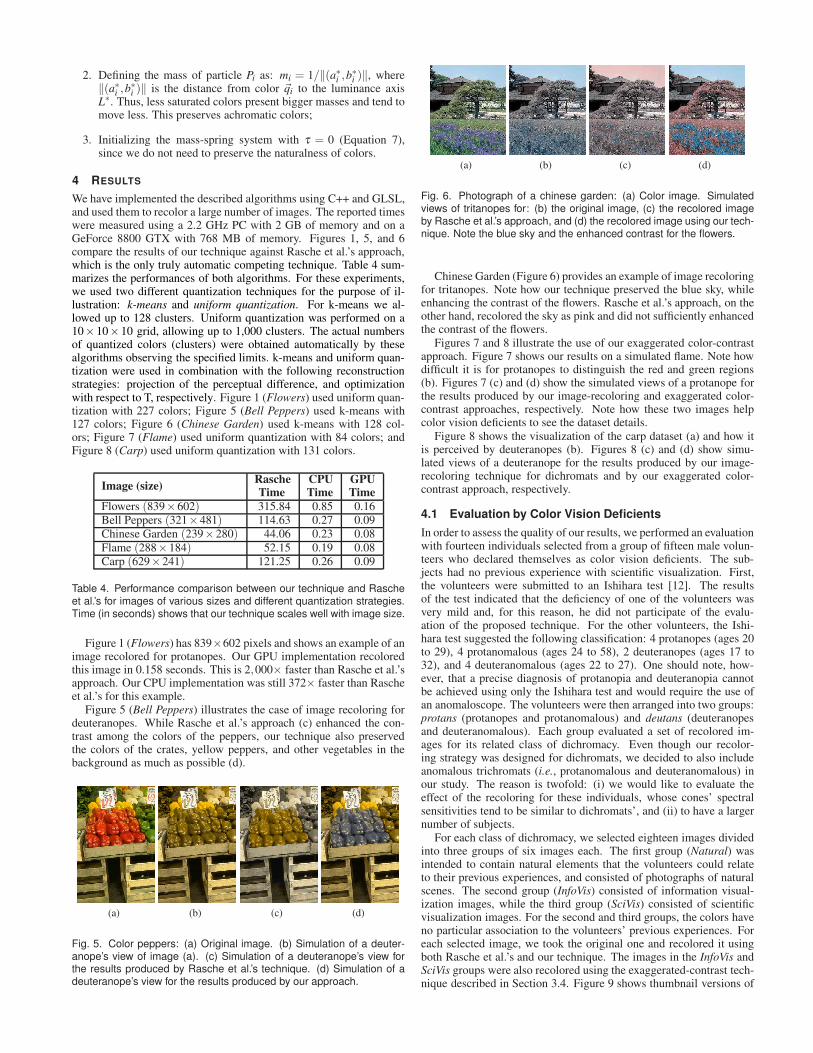
Figure 5 (Bell Peppers) illustrates the case of image recoloring fordeuteranopes. While Rasche et al.’s approach (c) enhanced the con-trast among the colors of the peppers, our technique also preservedthe colors of the crates, yellow peppers, and other vegetables in thebackground as much as possible (d).
(a) (b) (c) (d)
Fig. 5. Color peppers: (a) Original image. (b) Simulation of a deuter-anope’s view of image (a). (c) Simulation of a deuteranope’s view forthe results produced by Rasche et al.’s technique. (d) Simulation of adeuteranope’s view for the results produced by our approach.
(a) (b) (c) (d)
Fig. 6. Photograph of a chinese garden: (a) Color image. Simulatedviews of tritanopes for: (b) the original image, (c) the recolored imageby Rasche et al.’s approach, and (d) the recolored image using our tech-nique. Note the blue sky and the enhanced contrast for the flowers.
Chinese Garden (Figure 6) provides an example of image recoloringfor tritanopes. Note how our technique preserved the blue sky, whileenhancing the contrast of the flowers. Rasche et al.’s approach, on theother hand, recolored the sky as pink and did not sufficiently enhancedthe contrast of the flowers.
Figures 7 and 8 illustrate the use of our exaggerated color-contrastapproach. Figure 7 shows our results on a simulated flame. Note howdifficult it is for protanopes to distinguish the red and green regions(b). Figures 7 (c) and (d) show the simulated views of a protanope forthe results produced by our image-recoloring and exaggerated color-contrast approaches, respectively. Note how these two images helpcolor vision deficients to see the dataset details.
Figure 8 shows the visualization of the carp dataset (a) and how itis perceived by deuteranopes (b). Figures 8 (c) and (d) show simu-lated views of a deuteranope for the results produced by our image-recoloring technique for dichromats and by our exaggerated color-contrast approach, respectively.
4.1 Evaluation by Color Vision DeficientsIn order to assess the quality of our results, we performed an evaluationwith fourteen individuals selected from a group of fifteen male volun-teers who declared themselves as color vision deficients. The sub-jects had no previous experience with scientific visualization. First,the volunteers were submitted to an Ishihara test [12]. The resultsof the test indicated that the deficiency of one of the volunteers wasvery mild and, for this reason, he did not participate of the evalu-ation of the proposed technique. For the other volunteers, the Ishi-hara test suggested the following classification: 4 protanopes (ages 20to 29), 4 protanomalous (ages 24 to 58), 2 deuteranopes (ages 17 to32), and 4 deuteranomalous (ages 22 to 27). One should note, how-ever, that a precise diagnosis of protanopia and deuteranopia cannotbe achieved using only the Ishihara test and would require the use ofan anomaloscope. The volunteers were then arranged into two groups:protans (protanopes and protanomalous) and deutans (deuteranopesand deuteranomalous). Each group evaluated a set of recolored im-ages for its related class of dichromacy. Even though our recolor-ing strategy was designed for dichromats, we decided to also includeanomalous trichromats (i.e., protanomalous and deuteranomalous) inour study. The reason is twofold: (i) we would like to evaluate theeffect of the recoloring for these individuals, whose cones’ spectralsensitivities tend to be similar to dichromats’, and (ii) to have a largernumber of subjects.
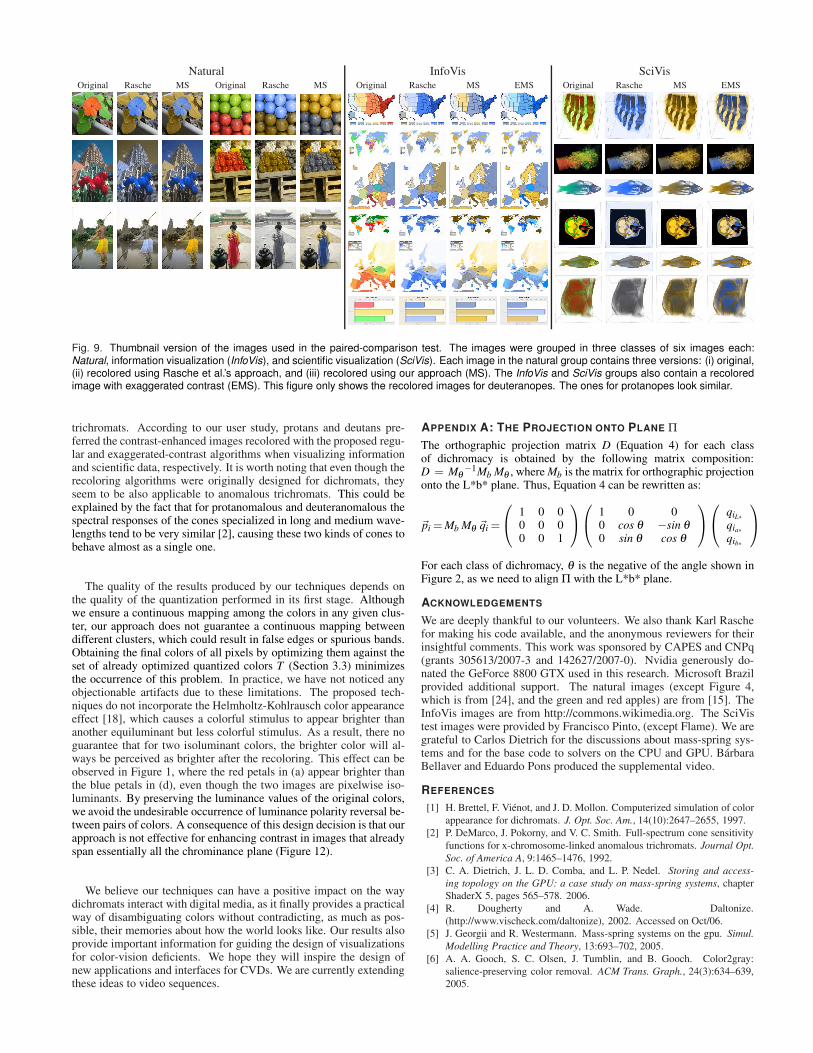
For each class of dichromacy, we selected eighteen images dividedinto three groups of six images each. The first group (Natural) wasintended to contain natural elements that the volunteers could relateto their previous experiences, and consisted of photographs of naturalscenes. The second group (InfoVis) consisted of information visual-ization images, while the third group (SciVis) consisted of scientificvisualization images. For the second and third groups, the colors haveno particular association to the volunteers’ previous experiences. Foreach selected image, we took the original one and recolored it usingboth Rasche et al.’s and our technique. The images in the InfoVis andSciVis groups were also recolored using the exaggerated-contrast tech-nique described in Section 3.4. Figure 9 shows thumbnail versions of

(a) (b)
(c) (d)
Fig. 7. Simulation of a flame: (a) Color image. Simulated views ofprotanopes for: (b) original image, (c) result produced by our image-recoloring technique for dichromats, and (d) result produced by our ex-aggerated color-contrast approach using α = 2.
(a) (b)
(c) (d)
Fig. 8. Visualization of a carp dataset using a multi-dimensional transferfunction: (a) Color image. Simulated view of deuteranopes for: (b) orig-inal image, (c) result produced by our image-recoloring technique fordichromats, and (d) result produced by our exaggerated color-contrastapproach using α = 2.
the images used in the experiment.For the evaluation of the techniques, we used the method of paired
comparisons [29]. For each image in the Natural group, the volun-teers were presented with the following pairs of side-by-side images:(Or,R), (Or,MS), and (R,MS) and were asked to indicate their binarypreferences according to the following subjective questions: (i) Whichimage looks more natural?, (ii) Which image has the most pleasantcontrast?, and (iii) What is your overall preference. Or, R, and MSstand for original, recolored with Rasche et al. technique, and recol-ored with the proposed technique, respectively. For the InfoVis andSciVis groups, the pairs of images included all combinations of Or,R, MS, and EMS (images with exaggerated contrast, recolored as de-scribed in Section 3.4 using α = 2). For such groups, the volunteerswere asked to indicate their binary preferences only with respect toquestions (ii) and (iii). Each volunteer compared a total of 18 (i.e.,6×3), 36 (i.e., 6×6), and 36 pairs of images for the Natural, InfoVis,and SciVis groups, respectively. The order in which the pairs of imageswere presented as well as the order of the images in each pair were de-fined randomly. Each question was asked for all pairs of images beforechanging to the next question. The order of the questions varied be-tween subjects. The images were displayed on an LG L1953HS LCDmonitor (19 inches, 1280x1024 pixels, NVIDIA GeForce 9600 GT) atapproximated 50 cm from the subject. The average time for complet-ing the experiment by the volunteers in the protans and deutans groups
were 24 and 29 minutes, respectively.We analyzed the paired-comparison data using Turnstone’s
Law [29], Case V. Turnstone’s Law allows one to measure individ-uals’ preference orderings for some stimuli, from a set of discrete bi-nary choices. It is the classic tool for ranking items based on subjectivechoices. For the protans, the ranking of the preferred technique wasbased on 144 (8 ×18) binary choices for the natural images, and on288 (8 ×36) binary choices for both the InfoVis and SciVis groups. Forthe deutans, the number of binary choices were 108 (6 ×18) and 216(6 ×36), respectively. We verified that Case V fits the data well byalso analyzing the results of our experiments using dual scaling [19]and Mosteller’s χ2 test of goodness-of-fit [17], working with a signif-icance test at the 5% level.
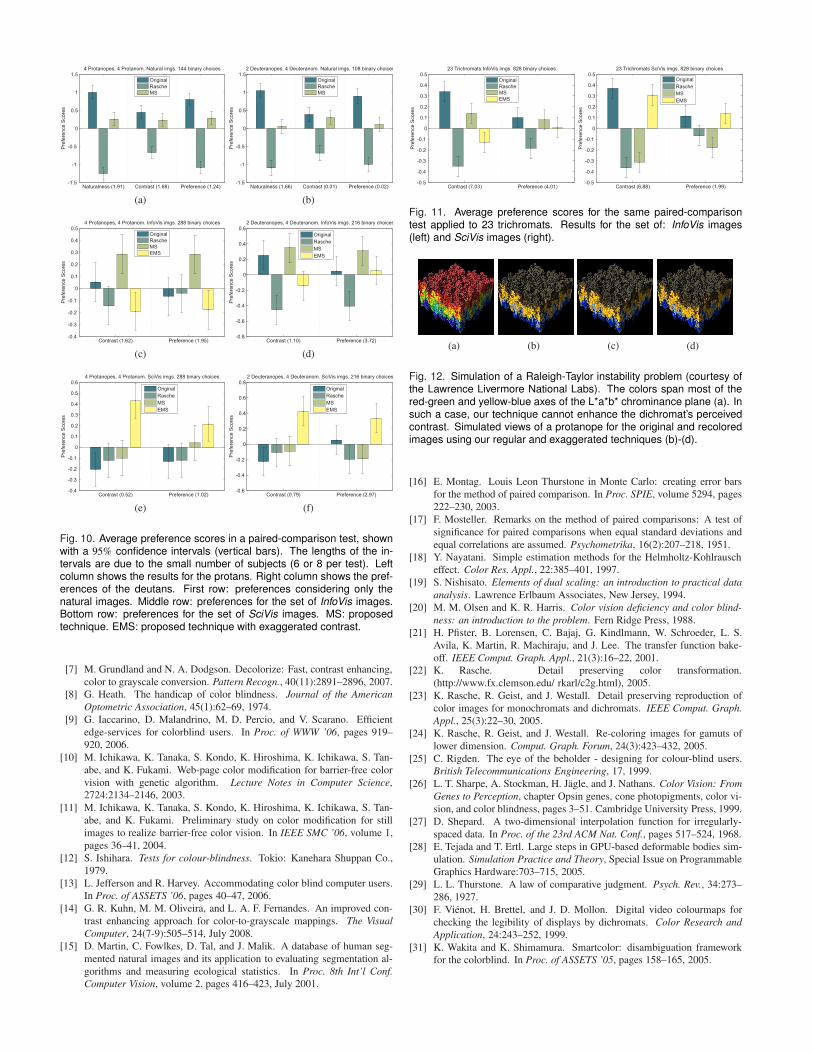
Figure 10 shows the average preference scores for the groups ofprotans (left column) and deutans (right column). For the natural im-ages, the χ2 has 1 degree of freedom (dof), causing the goodness-of-fitfor Thurstone’s Case V to be confirmed for χ2 < 3.84. For the InfoVisand SciVis images, the χ2 has 3 dofs, satisfying Case V for χ2 < 7.81.The numbers shown in parenthesis next to each evaluated criteria (atthe bottom of the graphs) are the corresponding computed χ2 values,which satisfy the stated conditions. For the average preference scoresobtained using Case V, we also computed the corresponding 95% con-fidence intervals (the vertical error bars in Figure 10) using [16].
Figure 10 (a) shows the scores for the protans group consideringonly the set of natural images. As expected, the original images wereranked best regarding naturalness. Considering the preferred contrast,given the significant overlap of the confidence intervals, one can as-sume a tie between the original image and the one recolored with ourtechnique. Overall preference of these subjects was for the originalimage. Figure 10 (c) presents the scores of the protans group for theset of InfoVis images. In this case, the images recolored with the mass-spring algorithm without contrast exaggeration was preferred both interms of contrast and overall preference. It is interesting to note, how-ever, that when comparing the SciVis images (Figure 10 e), protansshowed a clear preference for the ones with exaggerated contrast.
Figure 10 (right) shows the corresponding scores for the deutansgroup, which are similar to the ones observed for the protans. Theonly difference is that for the set of InfoVis images (d), the subjectsconsidered the contrast of the original images as good as the recoloredones. This might be explained by the small number of subjects (six) inthis group, with only two deuteranopes.
We have also performed a paired-comparison evaluation of thesame set of images using a group of 23 male trichromats (ages 18to 35) with no previous experience with scientific visualization. Oneshould recall that the recolored images matched the reduced colorgamut of dichromats. Therefore, the original natural images were pre-ferred by trichromats. When considering the set of InfoVis images,trichromats found the contrast of the original images slightly betterthan the ones of the images recolored using our approach (MS). How-ever, when asked about their overall preference, there is a tie betweenthe original and the recolored images (Figure 11 left). For the SciVisgroup, the original and recolored images with exaggerated contrast(EMS) were equally preferred by trichromats both in terms of contrastand overall preference (Figure 11 right). These rankings of trichro-mats were computed using Thurstone Law, Case V, from a total of 828binary choices.
5 CONCLUSIONS
We presented an efficient technique for enhancing color contrast fordichromats based on mass-spring optimization. Contrary to previousautomatic techniques, our approach preserves, as much as possible,the naturalness of the images as perceived by color vision deficients.Our technique can be efficiently implemented on modern GPUs andboth its CPU and GPU versions are significantly faster than previousapproaches. We also described an extension to the proposed image-recoloring algorithm for exaggerating color contrast.
We have evaluated the results produced by our technique using themethod of paired-comparison [29] with 8 protans, 6 deutans, and 23
Natural InfoVis SciVisOriginal Rasche MS Original Rasche MS Original Rasche MS EMS Original Rasche MS EMS
Fig. 9. Thumbnail version of the images used in the paired-comparison test. The images were grouped in three classes of six images each:Natural, information visualization (InfoVis), and scientific visualization (SciVis). Each image in the natural group contains three versions: (i) original,(ii) recolored using Rasche et al.’s approach, and (iii) recolored using our approach (MS). The InfoVis and SciVis groups also contain a recoloredimage with exaggerated contrast (EMS). This figure only shows the recolored images for deuteranopes. The ones for protanopes look similar.
trichromats. According to our user study, protans and deutans pre-ferred the contrast-enhanced images recolored with the proposed regu-lar and exaggerated-contrast algorithms when visualizing informationand scientific data, respectively. It is worth noting that even though therecoloring algorithms were originally designed for dichromats, theyseem to be also applicable to anomalous trichromats. This could beexplained by the fact that for protanomalous and deuteranomalous thespectral responses of the cones specialized in long and medium wave-lengths tend to be very similar [2], causing these two kinds of cones tobehave almost as a single one.
The quality of the results produced by our techniques depends onthe quality of the quantization performed in its first stage. Althoughwe ensure a continuous mapping among the colors in any given clus-ter, our approach does not guarantee a continuous mapping betweendifferent clusters, which could result in false edges or spurious bands.Obtaining the final colors of all pixels by optimizing them against theset of already optimized quantized colors T (Section 3.3) minimizesthe occurrence of this problem. In practice, we have not noticed anyobjectionable artifacts due to these limitations. The proposed tech-niques do not incorporate the Helmholtz-Kohlrausch color appearanceeffect [18], which causes a colorful stimulus to appear brighter thananother equiluminant but less colorful stimulus. As a result, there noguarantee that for two isoluminant colors, the brighter color will al-ways be perceived as brighter after the recoloring. This effect can beobserved in Figure 1, where the red petals in (a) appear brighter thanthe blue petals in (d), even though the two images are pixelwise iso-luminants. By preserving the luminance values of the original colors,we avoid the undesirable occurrence of luminance polarity reversal be-tween pairs of colors. A consequence of this design decision is that ourapproach is not effective for enhancing contrast in images that alreadyspan essentially all the chrominance plane (Figure 12).
We believe our techniques can have a positive impact on the waydichromats interact with digital media, as it finally provides a practicalway of disambiguating colors without contradicting, as much as pos-sible, their memories about how the world looks like. Our results alsoprovide important information for guiding the design of visualizationsfor color-vision deficients. We hope they will inspire the design ofnew applications and interfaces for CVDs. We are currently extendingthese ideas to video sequences.
APPENDIX A: THE PROJECTION ONTO PLANE ΠThe orthographic projection matrix D (Equation 4) for each classof dichromacy is obtained by the following matrix composition:D = Mθ
−1Mb Mθ , where Mb is the matrix for orthographic projectiononto the L*b* plane. Thus, Equation 4 can be rewritten as:
�pi = Mb Mθ �qi =
⎛⎝ 1 0 0
0 0 00 0 1
⎞⎠
⎛⎝ 1 0 0
0 cos θ −sin θ0 sin θ cos θ
⎞⎠
⎛⎝ qiL∗
qia∗qib∗
⎞⎠
For each class of dichromacy, θ is the negative of the angle shown inFigure 2, as we need to align Π with the L*b* plane.
ACKNOWLEDGEMENTS
We are deeply thankful to our volunteers. We also thank Karl Raschefor making his code available, and the anonymous reviewers for theirinsightful comments. This work was sponsored by CAPES and CNPq(grants 305613/2007-3 and 142627/2007-0). Nvidia generously do-nated the GeForce 8800 GTX used in this research. Microsoft Brazilprovided additional support. The natural images (except Figure 4,which is from [24], and the green and red apples) are from [15]. TheInfoVis images are from http://commons.wikimedia.org. The SciVistest images were provided by Francisco Pinto, (except Flame). We aregrateful to Carlos Dietrich for the discussions about mass-spring sys-tems and for the base code to solvers on the CPU and GPU. BarbaraBellaver and Eduardo Pons produced the supplemental video.
REFERENCES
[1] H. Brettel, F. Vienot, and J. D. Mollon. Computerized simulation of colorappearance for dichromats. J. Opt. Soc. Am., 14(10):2647–2655, 1997.
[2] P. DeMarco, J. Pokorny, and V. C. Smith. Full-spectrum cone sensitivityfunctions for x-chromosome-linked anomalous trichromats. Journal Opt.Soc. of America A, 9:1465–1476, 1992.
[3] C. A. Dietrich, J. L. D. Comba, and L. P. Nedel. Storing and access-ing topology on the GPU: a case study on mass-spring systems, chapterShaderX 5, pages 565–578. 2006.
[4] R. Dougherty and A. Wade. Daltonize.(http://www.vischeck.com/daltonize), 2002. Accessed on Oct/06.
[5] J. Georgii and R. Westermann. Mass-spring systems on the gpu. Simul.Modelling Practice and Theory, 13:693–702, 2005.
[6] A. A. Gooch, S. C. Olsen, J. Tumblin, and B. Gooch. Color2gray:salience-preserving color removal. ACM Trans. Graph., 24(3):634–639,2005.
Naturalness (1.91) Contrast (1.68) Preference (1.24)-1.5
-1
-0.5
0
0.5
1
1.5
Pre
fere
nce
Sco
res
4 Protanopes, 4 Protanom. Natural imgs. 144 binary choices
Original
Rasche
MS
(a)Naturalness (1.66) Contrast (0.01) Preference (0.02)
-1.5
-1
-0.5
0
0.5
1
1.5
Pre
fere
nce
Sco
res
Original
Rasche
MS
(b)
Contrast (1.62) Preference (1.95)-0.4
-0.3
-0.2
-0.1
0
0.1
0.2
0.3
0.4
0.5
Pre
fere
nce
Sco
res
4 Protanopes, 4 Protanom. InfoVis imgs. 288 binary choices
Original
Rasche
MS
EMS
(c)Contrast (1.10) Preference (3.72)
-0.8
-0.6
-0.4
-0.2
0
0.2
0.4
0.6P
refe
ren
ce
Sco
res
Original
Rasche
MS
EMS
(d)
Contrast (0.52) Preference (1.02)-0.4
-0.3
-0.2
-0.1
0
0.1
0.2
0.3
0.4
0.5
0.6
Pre
fere
nce
Sco
res
4 Protanopes, 4 Protanom. SciVis imgs. 288 binary choices
Original
Rasche
MS
EMS
(e)Contrast (0.79) Preference (2.97)
-0.6
-0.4
-0.2
0
0.2
0.4
0.6
0.8
Pre
fere
nce
Sco
res
Original
Rasche
MS
EMS
(f)
Fig. 10. Average preference scores in a paired-comparison test, shownwith a 95% confidence intervals (vertical bars). The lengths of the in-tervals are due to the small number of subjects (6 or 8 per test). Leftcolumn shows the results for the protans. Right column shows the pref-erences of the deutans. First row: preferences considering only thenatural images. Middle row: preferences for the set of InfoVis images.Bottom row: preferences for the set of SciVis images. MS: proposedtechnique. EMS: proposed technique with exaggerated contrast.
[7] M. Grundland and N. A. Dodgson. Decolorize: Fast, contrast enhancing,color to grayscale conversion. Pattern Recogn., 40(11):2891–2896, 2007.
[8] G. Heath. The handicap of color blindness. Journal of the AmericanOptometric Association, 45(1):62–69, 1974.
[9] G. Iaccarino, D. Malandrino, M. D. Percio, and V. Scarano. Efficientedge-services for colorblind users. In Proc. of WWW ’06, pages 919–920, 2006.
[10] M. Ichikawa, K. Tanaka, S. Kondo, K. Hiroshima, K. Ichikawa, S. Tan-abe, and K. Fukami. Web-page color modification for barrier-free colorvision with genetic algorithm. Lecture Notes in Computer Science,2724:2134–2146, 2003.
[11] M. Ichikawa, K. Tanaka, S. Kondo, K. Hiroshima, K. Ichikawa, S. Tan-abe, and K. Fukami. Preliminary study on color modification for stillimages to realize barrier-free color vision. In IEEE SMC ’06, volume 1,pages 36–41, 2004.
[12] S. Ishihara. Tests for colour-blindness. Tokio: Kanehara Shuppan Co.,1979.
[13] L. Jefferson and R. Harvey. Accommodating color blind computer users.In Proc. of ASSETS ’06, pages 40–47, 2006.
[14] G. R. Kuhn, M. M. Oliveira, and L. A. F. Fernandes. An improved con-trast enhancing approach for color-to-grayscale mappings. The VisualComputer, 24(7-9):505–514, July 2008.
[15] D. Martin, C. Fowlkes, D. Tal, and J. Malik. A database of human seg-mented natural images and its application to evaluating segmentation al-gorithms and measuring ecological statistics. In Proc. 8th Int’l Conf.Computer Vision, volume 2, pages 416–423, July 2001.
Contrast (7.03) Preference (4.01)-0.5
-0.4
-0.3
-0.2
-0.1
0
0.1
0.2
0.3
0.4
0.5
Pre
fere
nce
Sco
res
23 Trichromats InfoVis imgs. 828 binary choices
Original
Rasche
MS
EMS
Contrast (6.88) Preference (1.99)-0.5
-0.4
-0.3
-0.2
-0.1
0
0.1
0.2
0.3
0.4
0.5
Pre
fere
nce
Sco
res
23 Trichromats SciVis imgs. 828 binary choices
Original
Rasche
MS
EMS
Fig. 11. Average preference scores for the same paired-comparisontest applied to 23 trichromats. Results for the set of: InfoVis images(left) and SciVis images (right).
(a) (b) (c) (d)
Fig. 12. Simulation of a Raleigh-Taylor instability problem (courtesy ofthe Lawrence Livermore National Labs). The colors span most of thered-green and yellow-blue axes of the L*a*b* chrominance plane (a). Insuch a case, our technique cannot enhance the dichromat’s perceivedcontrast. Simulated views of a protanope for the original and recoloredimages using our regular and exaggerated techniques (b)-(d).
[16] E. Montag. Louis Leon Thurstone in Monte Carlo: creating error barsfor the method of paired comparison. In Proc. SPIE, volume 5294, pages222–230, 2003.
[17] F. Mosteller. Remarks on the method of paired comparisons: A test ofsignificance for paired comparisons when equal standard deviations andequal correlations are assumed. Psychometrika, 16(2):207–218, 1951.
[18] Y. Nayatani. Simple estimation methods for the Helmholtz-Kohlrauscheffect. Color Res. Appl., 22:385–401, 1997.
[19] S. Nishisato. Elements of dual scaling: an introduction to practical dataanalysis. Lawrence Erlbaum Associates, New Jersey, 1994.
[20] M. M. Olsen and K. R. Harris. Color vision deficiency and color blind-ness: an introduction to the problem. Fern Ridge Press, 1988.
[21] H. Pfister, B. Lorensen, C. Bajaj, G. Kindlmann, W. Schroeder, L. S.Avila, K. Martin, R. Machiraju, and J. Lee. The transfer function bake-off. IEEE Comput. Graph. Appl., 21(3):16–22, 2001.
[22] K. Rasche. Detail preserving color transformation.(http://www.fx.clemson.edu/ rkarl/c2g.html), 2005.
[23] K. Rasche, R. Geist, and J. Westall. Detail preserving reproduction ofcolor images for monochromats and dichromats. IEEE Comput. Graph.Appl., 25(3):22–30, 2005.
[24] K. Rasche, R. Geist, and J. Westall. Re-coloring images for gamuts oflower dimension. Comput. Graph. Forum, 24(3):423–432, 2005.
[25] C. Rigden. The eye of the beholder - designing for colour-blind users.British Telecommunications Engineering, 17, 1999.
[26] L. T. Sharpe, A. Stockman, H. Jagle, and J. Nathans. Color Vision: FromGenes to Perception, chapter Opsin genes, cone photopigments, color vi-sion, and color blindness, pages 3–51. Cambridge University Press, 1999.
[27] D. Shepard. A two-dimensional interpolation function for irregularly-spaced data. In Proc. of the 23rd ACM Nat. Conf., pages 517–524, 1968.
[28] E. Tejada and T. Ertl. Large steps in GPU-based deformable bodies sim-ulation. Simulation Practice and Theory, Special Issue on ProgrammableGraphics Hardware:703–715, 2005.
[29] L. L. Thurstone. A law of comparative judgment. Psych. Rev., 34:273–286, 1927.
[30] F. Vienot, H. Brettel, and J. D. Mollon. Digital video colourmaps forchecking the legibility of displays by dichromats. Color Research andApplication, 24:243–252, 1999.
[31] K. Wakita and K. Shimamura. Smartcolor: disambiguation frameworkfor the colorblind. In Proc. of ASSETS ’05, pages 158–165, 2005.