an automated model for rooftop pv systems assessment in arcgis using lidar
TRANSCRIPT
http://www.aimspress.com/
Volume 3, Issue 3, 401–420
DOI:10.3934/energy.2015.3.401
Received 19 April 2015
Accepted 13 August 2015
Published 27 August 2015
Research article
An automated model for rooftop PV systems assessment in ArcGIS
using LIDAR
Mesude Bayrakci Boz 1,∗, Kirby Calvert2 and Jeffrey R. S. Brownson1
1 John & Willie Leone Department of Energy and Mineral Engineering, The PennsylvaniaState University, University Park, PA 16802, United States
2 Department of Geography, The Pennsylvania State University, University Park, PA 16802,United States
∗ Correspondence: Email:[email protected]; Tel: +1-814-321-1644.
Abstract: As photovoltaic (PV) systems have become less expensive, building rooftops havecome to be attractive for local power production. Identifying rooftops suitable for solar energysystems over large geographic areas is needed for cities to obtain more accurate assessments ofproduction potential and likely patterns of development. This paper presents a new methodfor extracting roof segments and locating suitable areas for PV systems using Light Detectionand Ranging (LIDAR) data and building footprints. Rooftop segments are created using sevenslope (tilt), five aspect (azimuth) classes and 6 different building types. Moreover, direct beamshading caused by nearby objects and the surrounding terrain is taken into account on a monthlybasis. Finally, the method is implemented as an ArcGIS model in ModelBuilder and a tool iscreated. In order to show its validity, the method is applied to city of Philadelphia, PA, USAwith the criteria of slope, aspect, shading and area used to locate suitable areas for PV systeminstallation. The results show that 33.7% of the buildings footprints areas and 48.6% of therooftop segments identified is suitable for PV systems. Overall, this study provides a replicablemodel using commercial software that is capable of extracting individual roof segments withmore detailed criteria across an urban area.
Keywords: GIS; LIDAR; rooftop segmentation; photovoltaic systems; site suitability
1. Introduction
More than 60% of people live in urban environments resulting in higher energy density ofconsumption in these areas, especially during the day [1]. In many localities, city governmentsand community leaders are developing and implementing strategic guidelines and policies in
401

402
order to coordinate energy efficiency improvements with higher rates of renewable energy usefor buildings. Renewable energy has received much attention since these forms of energy donot generate greenhouses gases, act as distributed generation (DG) system, assist in nationalenergy security, and improve long-term economic growth [2]. Among possible options to generaterenewable energy, photovoltaic (PV) systems have proven to be safe and sustainable [3]. PVsystems have the potential to meet urban energy demands while alleviating congestion on urbangrid infrastructures [4]. In order to facilitate informed planning and investment decisions, itis important to develop efficient and accurate geospatial frameworks from which to assess andclassify rooftops for PV systems across large urban areas. While rooftop assessment tools forPV are currently expanding, these tools need to be replicable and scalable to entire cities.
Although annual or monthly budgets for global horizontal solar irradiation are valuable ingeneral estimates of solar potential across urban areas, the amount of the solar resource is not thecritical parameter for determining project success. Indeed, the availability and feasibility of re-newable energy across space are subject to various limitations on technology implementation. Assuch, potential areas for renewable energy production are typically classified according to theselimitations. While Voivontas et al. [5], for example, have classified renewable energy potentialinto the four categories of theoretical, available, technical, and economic potential, Izquierdo etal. [6] have added social potential to this existing hierarchy. These classification systems havesince been implemented into a geographic information system (GIS) using Multi-Criteria Analy-sis (MCA), and have accordingly prompted further discussions about solar potential estimationsusing GIS [7, 8]. Several scholars have built upon this early work, taking into considerationfactors such as population, shading, and climate[9, 10]. In order to estimate and locate availableroof area for PV systems, different models have been developed which use aerial imagery andGIS tools [11, 3, 12, 13, 14, 15]. Denholm and Margolis [16] have designed a procedure using dataon floor space and concluded that the average roof availability in residential buildings of 27%and 22% for warmer regions and cooler regions, respectively. The availability for commercialbuildings is 60% for warmer regions and 65% for cooler regions.The solar potential models havebeen evaluated by Freitas et al. [17], Angelis Dimakis et al. [18] and Melius et al. [19].
As an alternative to sampling imagery or cadastral data, recent research has taken advantageof more widely available Light Detection and Ranging (LIDAR) technology in order to assesssolar potential. Lukac et al. [20] have created a rating of roof surfaces within Maribor, Slovenia,based on the surfaces solar potential and suitability for installation. To do so, they used LIDARto extract the urban topography by calculating normal vectors of the surfaces for each pointwithin each cell; they also took pyranometer measurements of global and diffuse solar irradi-ances. Finally they used spatial multi-resolution shadowing by nearbybuilding or surroundingterrain that is performed on the constructed regular grid using Suns position in Cartesian coor-dinates. Lukac et al. [21] have likewise demonstrated how to use graphics processing units basedon compute unified device architecture (CUDA) technology using LIDAR in order to calculatesolar potential within a reasonable time. Also, Huang et al. [22] have shown how suitable posi-tions for solar installation can be located by creating triangular irregular networks and digitalsurface models with LIDAR. Recognizing that conditions may not always be ideal, Jacques etal. [23] and Gooding et al. [24] have developed a methodology for assessing PV capacity usinglow-resolution LIDAR data. Other researchers have considered the varying surfaces available for
AIMS Energy Volume 3, Issue 3, 401–420

403
solar installation. While Voegtle at al. [25] have used triangular irregular networks to representsurfaces, Jochem et al. [26] have used LIDAR to calculate solar potential while taking intoaccount the shadowing effects of nearby objects and the effects of clouds. Santos et al. [27]have used LIDAR, GIS, and PVGIS to create elevation and digital surface models, which helpto determine power production. Shading has also been an area of consideration for researchers.Levinson et al. [28], for example, have used LIDAR and high-resolution orthophotos to charac-terize residential rooftop shading, with GIS used for elevation and shadow rasters. Kassner etal.[29] have used LIDAR data, CAD models, and GIS to calculate solar potential. Nguyen et al.[30] have developed a methodology for assessing PV potential using LIDAR data, MATLAB, andGIS. Li et al. [31] have used LIDAR, r.sun which is solar irradiation and irradiance model, and a3D city building model to calculate solar potential, finding that roof complexity is the dominantdeterminant of PV potential. Also, ESRI’s Solar Analyst Toolbox has been commonly used toestimate solar potential [32, 33, 34]. Finally, Melius et al. [19] suggest a new method that usesLIDAR and building data in order to estimate ideal rooftop space. They created roof planesbased on aspect, and calculated zonal average slope for these planes in ArcGIS. For the shading,hill shade tool in ArcGIS was applied for March 21, June 21, September 21 and December 21.Also, System Advisor Model (SAM) is used to estimate the total number of daylight hours arooftop in a specific region would need to be in sunlight to produce 80% generation. The resultsof this method include unshaded roof spaces and roof orientation information. The researchershave planned to apply this method to 120 U.S. cities by the end of 2014 and documentation ofit will be made available by the fall of 2015.
Although considerable progress has been made to provide spatial decision support for PVdevelopment in urban areas, the methodologies described in above are limited in terms of theircapacity to accurately represent urban surfaces. In many cases, assumptions about rooftoporientation and slope are required. Where LiDAR data have been used to fill these gaps, theother important challenge is automation. That is, research to date has been very site-specific andnot focused on establishing automated models that might be shared and used in other locations,by other researchers.
The purpose of this paper is to fill these gaps, while at the same time providing criticalinformation for the city of Philadelphia, PA, USA. An automated model using ArcGIS andthe Python programming language is developed to locate and classify rooftop segments acrossa large urban area for the purpose of large-area solar energy estimation and planning. LIDARdata are combined with building footprint data in order to obtain topographic data, characterizerooftops in terms of slope and aspect (or azimuth in the solar community) and estimate directbeam shading caused by nearby objects and surrounding terrain for each month. The model isused to identify suitable roofs based on a multi-criteria spatial analysis. Data processing andmulti-criteria spatial analysis has been integrated into a single model. The python script wasbuilt using ArcGIS ModelBuilder. The script was then applied using data from Philadelphia,PA. This model permits the methodology to be replicated in any city where appropriate dataare available, and where ArcGIS is available. In this study radiation data are not included andenergy production is not calculated, however we have selected initial example criteria for binningimportant solar PV parameters such as aspect (azimuth) and slope (tilt) based upon irradiancesensitivity noted in the solar literature. These criteria are easily modified and adapted to fit the
AIMS Energy Volume 3, Issue 3, 401–420

404
evaluation context of appropriate planning body, and as such future teams will be able to usethis model in customized research using different radiation models and PV technologies.
2. Data and Methodology
2.1. Case Study
The city of Philadelphia in PA, U.S.A (3957′12′′N 7510′12′′W ) was selected as a case study.Philadelphia has been chosen for this study for several reasons. First, there are many policies andprograms in place in Philadelphia such as Greenworks and SolarCityPartnership that encouragerenewable energy development in the city [35, 36]. Secondly, Philadelphia is a large urban area,all of whose necessary data is available online, and yet a comprehensive assessment of solarpotential has not yet been undertaken.
2.2. Data Collection and Processing
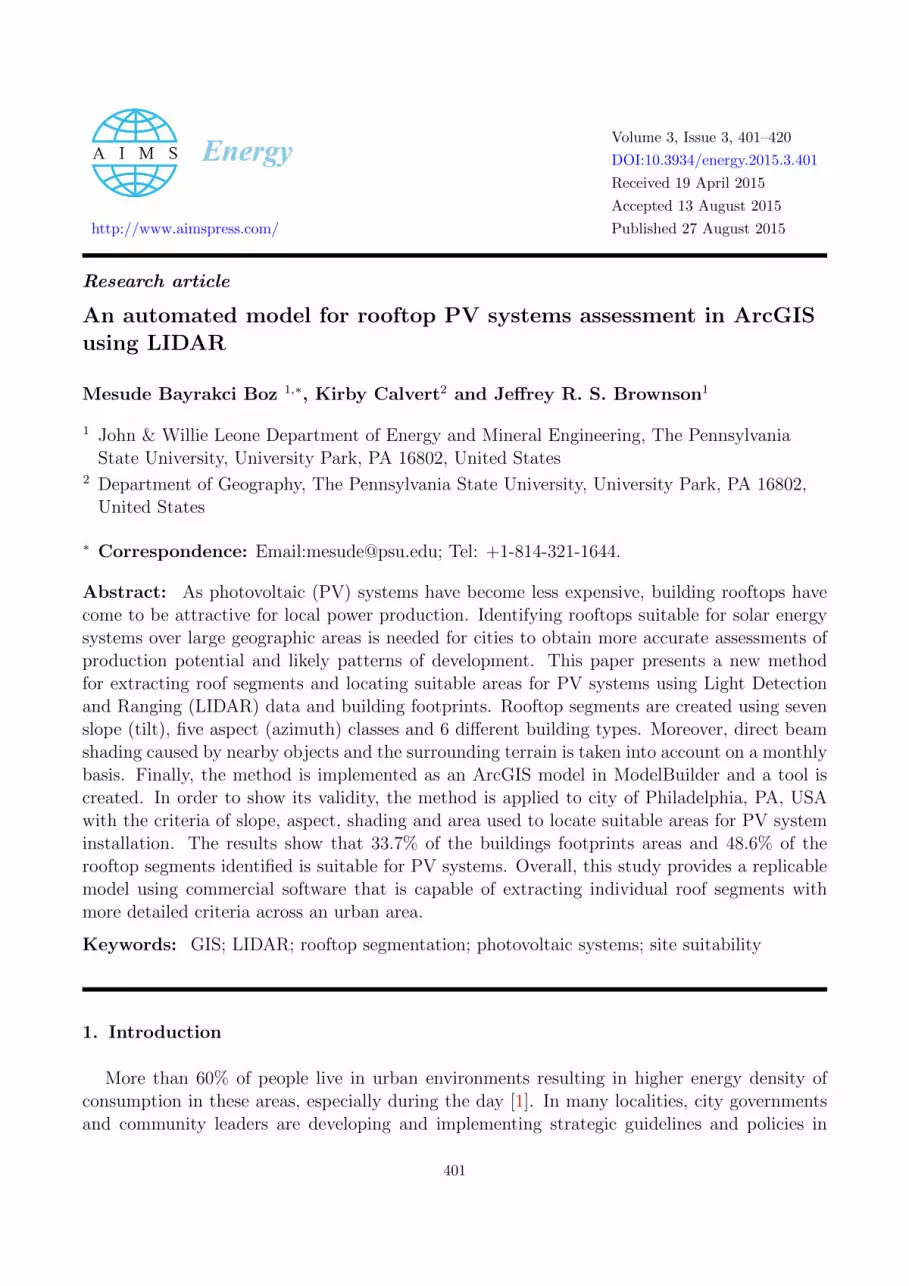
All data used in this study are summarized in Table 1. The city limits of Philadelphia wereused to clip all data. A LAS file is an industry format for the interchange of LIDAR data. Intotal, 1,041 LAS files were downloaded, and the files were combined into one LAS dataset usingArcGIS tools. Figure 1 shows all the LAS files and building footprint for Philadelphia,PA.
Table 1. Data sources for ArcGIS model.Dataset Data Source Data of Format Fields/Information
ReleaseCity Limits Data PASDA1 2000 Polygon Area and perimeter
1.Data collection performedover the City of Philadelphia, PA
in April of 2010LIDAR Data PASDA 2010 LAS files 2.Point density 6 points/m2
3.Point classification values;scan angle; additional RGB
values;scan direction;edge of flight line;
user data; point source ID;and waveform information
Building Footprint Data PASDA 2007 Polygon ID number, elevation,areaperimeter, source, length
Parcels Data PASDA 2013 Polygon ID, house number, areastreet direction, street name
Land Use Data PASDA 2010 Polygon 9 class: residential,commercial, industrial,
cultural/recreation,civic/institutions,
transportation,vacant/other,water,
park/open spaceAerial Photography PASDA 2010 Raster Consist of tiled orthogonal
images
1 Pennsylvania Spatial Data Access[37]
AIMS Energy Volume 3, Issue 3, 401–420
405
Figure 1. All LAS files and building polygons for Philadelphia, PA.
2.3. ArcGIS Model for Rooftop Segments Creation
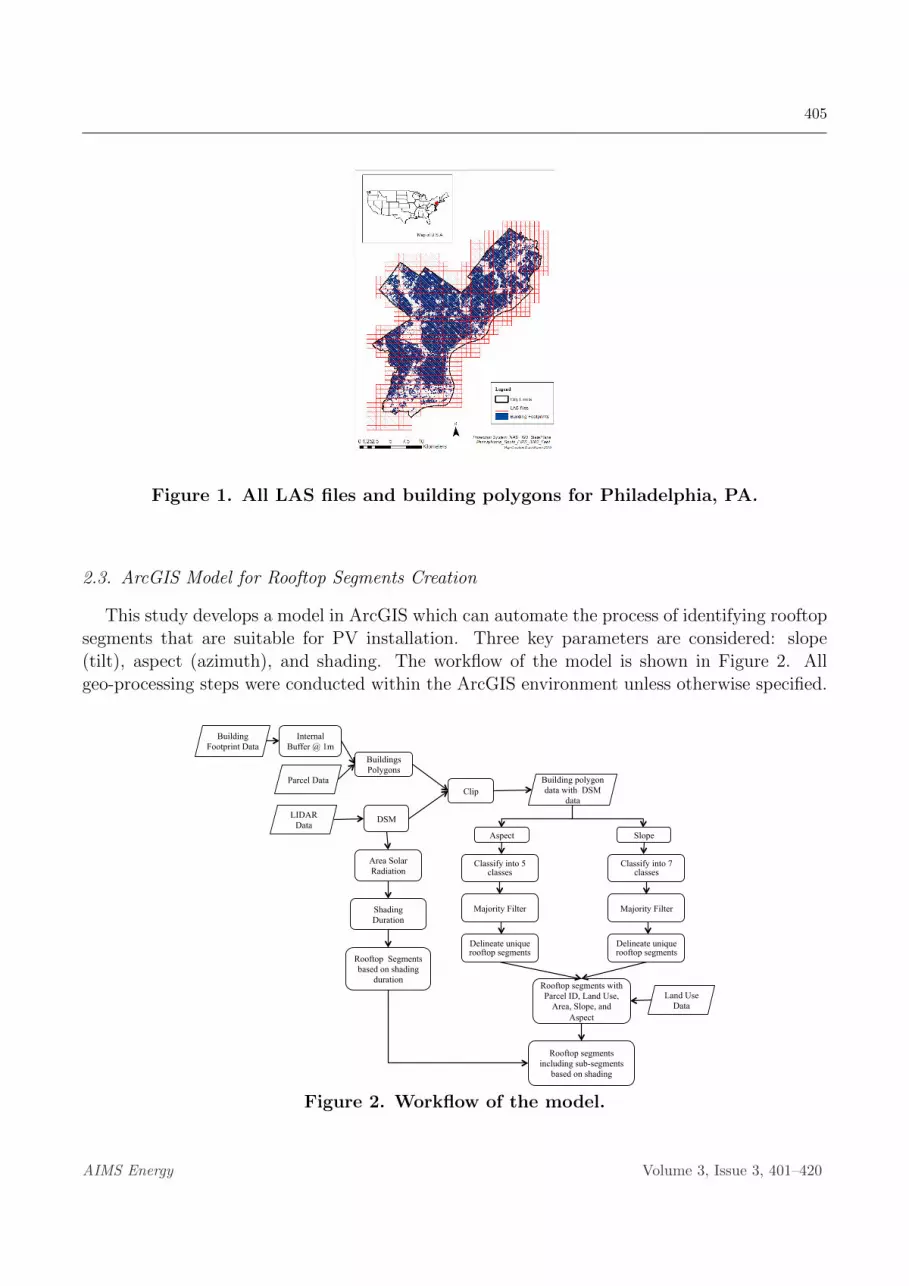
This study develops a model in ArcGIS which can automate the process of identifying rooftopsegments that are suitable for PV installation. Three key parameters are considered: slope(tilt), aspect (azimuth), and shading. The workflow of the model is shown in Figure 2. Allgeo-processing steps were conducted within the ArcGIS environment unless otherwise specified.
Rooftop segments with Parcel ID, Land Use,
Area, Slope, and Aspect
Building Footprint Data
Building polygon data with DSM
data
Aspect
Clip
Slope
Classify into 5 classes
Delineate unique rooftop segments
Delineate unique rooftop segments
Internal Buffer @ 1m
Parcel Data
LIDAR Data
Buildings Polygons
DSM
Classify into 7 classes
Land Use Data
Area Solar Radiation
Shading Duration
Rooftop Segments based on shading
duration
Rooftop segments including sub-segments
based on shading
Majority Filter Majority Filter
Figure 2. Workflow of the model.
AIMS Energy Volume 3, Issue 3, 401–420

406
The analysis is based on a digital surface model (DSM) with a 1 meter cell size which wasgenerated using maximum value within the cell (see Figure 3). The maximum value is usedsince it is best for biasing the result to higher elevations when making a DSM [38]. The DSMwas then processed in order to focus only on rooftops. First, a 1-meter buffer was applied tothe building footprint data. This helped to remove noise in data, since LIDAR data may not beaccurate near the roof edges, and also delineated a more appropriate surface since roof edges donot support PV panels. Indeed, there are standards for different type of roofs that say it shouldbe at least 3 foot wide clear access pathway from the ridge for firefighters to get the ridge ofthe roof for ventilation [39]. Next, the buffered building footprint data and parcels data wereintersected. As shown in Figure 3c, one parcel can contain many buildings. On the othe hand,one big building footprint can contain may building parcels too; the intersection process helpedto define each building separately. Finally, the output file from the intersection process was usedto clip DSM.
The criteria for classifying the and slope (tilt) and aspect (azimuth) in the rooftop orientationsmay be selected and modified according to the criteria of concern by the decision-making body.In our case study, we have deferred to the criteria affecting decadal decreases in irradiance (-10 %class) from the annual peak optimum, noted within the core research observations of Christensenand Barker from 2001 [40].
Legend12345
Legend1234567
¯
a) LIDAR points b) Digital Surface Model c) Building Footprints andParcels Intersection d) Slope
e)Aspect(Azimuth) f) Rooftop segments based on slope and aspect
g) Area solar radiation h) Rooftop segments taht includes subsegments based on shading
Low : 0
LegendHigh : 1
0 0.02 0.04 0.06 0.08Kilometers
Figure 3. Thumbnails showing various stages of data processing.
AIMS Energy Volume 3, Issue 3, 401–420

407
2.3.1. Slope (Tilt) Analysis
Slope refers to the steepness of a surface. A value of 0 degrees is equivalent to no slope (flat),while a value of 90 degrees indicates a surface that is completely vertical. The slope of a surface iscalculated using the maximum change in elevation from a given cell to its eight neighboring cells[41]. After calculating slope in the Spatial Analyst toolbox, a classification system was devisedto organize these results according to their suitability for PV system implementation (Table2). Although many previous studies usually identify two classes - flat (< 10 or 20) and slopedroof (> 10 or 20 − 60) - more accurate results can be obtained by using a more disaggregatedclassification rather than just two classes [42, 33]. These classifications are important whenidentifying suitable areas since the optimal slope of a surface for PV systems changes withlatitude. It is important to note that the calculation of slope might vary across a roof withthe same actual slope due to some error in input (LiDAR) data and algorithm function. This isbecause sometimes a pulse can hit an object in the sky or on the roof while LIDAR data are beingcollected. In order to minimize the possibility of this occurring, the Majority Filter was used toreplace cell values based on the majority of the cells contiguous eight neighboring cells. Next,since the file is raster format, the Raster to Polygon Tool in the Conversion Toolbox was usedto convert the file to polygon format with slope values. If the area of the polygon was smallerthan 10 square meters, the polygon was combined with the polygon next to it. The reason forcombining the polygons is that there is a minimum area requirement for PV installations. It candepend on total roof area and state rules, but it is usually around 10 square meters [43]. Theresults of the overall slope analysis can be seen in Figure 3d.
Table 2. Reclassification of slope values.
Slope Value (Degree) Class
0-10 Class 110-20 Class 220-30 Class 330-40 Class 440-50 Class 550-60 Class 660-90 Class 7
2.3.2. Aspect (Azimuth) Analysis
Aspect refers to the direction in which the slope faces. It is measured in degrees, movingclockwise from 0 to 360. A value of 0 is north, 90 is east, 180 is south and 270 is west. If agiven rooftop is flat, the aspect is given a value of -1.The aspect tool of the Spatial AnalystToolbox was used to obtain aspect values from DSM. The resulting aspect file was reclassifiedinto 5 classes. These classes are shown in Figure 4.
After classification, the majority filter was applied to remove data noise, so a single value for agiven roof segment was provided. Then a polygon layer was created based on the classifications.If the area was smaller than 10 square meters, it was combined with the polygon next to it as
AIMS Energy Volume 3, Issue 3, 401–420

408
described in previous section. The results of the overall slope analysis can be seen in Figure 3e.
East
North
West
South
45 o
135 o225 o
315 o
Figure 4. Reclassification of aspect (azimuth) values: Class 1(Flat),Class 2(North): 315-45 degrees, Class 3(East): 45-135 degrees, Class4(South):135-225 degrees, Class 5(West): 225-315 degrees.
2.3.3. Creation of Rooftop Segments
The slope polygon layer was divided into seven classes, the first class representing a flat roof.If the slope was greater than 60 degrees, the polygon was eliminated since it is not ideal for PVrooftop panels. Next, the slope polygon layer and aspect polygon layer were intersected usingthe intersect tool in the Analysis Toolbox. Land use and parcel shapefiles were intersected withthe aspect-slope output polygon layer. This resulted in the creation of a new polygon layer thatrepresents rooftop segments and includes polygon ID, parcel ID, aspect, slope, land use, andarea information (Figure 3f).
2.3.4. Shading Analysis
Shading analysis is an important step for calculating PV potential, since shading can sig-nificantly reduce a “systems” power generation. This type of analysis is used to determine theoptimal location for PV panels and to ensure sufficient energy production. Shadows cast bystructures vary in length and direction throughout the day and from season to season, makingit extremely difficult to perform shading analyses for each day of the year. However, it is possi-ble to estimate the average irradiation loss for each month of the year by using one day if theirradiation on that day is closest to the average for the month. In this study, the Area SolarRadiation (ASR) tool in ArcGIS was used to perform shading analysis. In the ASR model, theDigital Surface Model (DSM) serves as the input data; a specific period of time, time interval forcalculations, and latitude and longitude function as parameters; and the levels of irradiation, di-rect irradiation, and diffuse irradiation, as well as the number of sun hours, are outputs [44, 45].ASR is run for each hour during a day that is representative of each month. For this study,the 21st day of each month. This manner of calculation allows for the inclusion of solstices andequinoxes.
The DSM was created from all of the LIDAR data, without any clipping, in order to accountfor shading on roof surfaces was used as an input. The latitude and longitude values for Philadel-phia have been used as a input, therefore the shading times relate only to Philadelphia and thesevalues must be changed in order to apply the model to other cities. The ASR tool was used eachhour on the 21st day of each month. One of the outputs was the duration (hours) of direct solarirradiation on each grid cell in the DSM. This output file was subsequently reclassified to create
AIMS Energy Volume 3, Issue 3, 401–420
409
a file containing all cells with a duration between 0 and 0.5 hours or between 0.5 and 1 hours.These hours were reclassified: if the duration was between 0 and 0.5 hours, it was assigned avalue of 0 (shading, or no sun). If the duration was between 0.5 to 1 hours, it is assigned a valueof 1 (no shading, or solar access) (Figure3g). Next, the clip tool was used to focus these outputswith the rooftop polygons that had been created before and that intersected with the rooftoppolygon layer. Sub-segments based on shading were created in the rooftop segments layer, andthe shading field was added to the attribute table. Finally, a polygon layer that representsrooftops segments was created for each hour of 21st day of each month. Each rooftop segmentincludes the slope and aspect values and shows shading areas with sub-segments of roofs. Also,the area, the land use, and parcel ID numbers were available. Only, one layer has been shown(Figure 3h) for rooftop segments and all these layers will be used in the future.
The running process of all 1041 LAS files could take an inordinate amount of time to com-plete, so the City of Philadelphia was separated into 45 parts using a census tract. Each partcorresponds to around 20 LAS files. Therefore, these parts can run in different computers at thesame time. After all parts are modeled, they are stitched together in order to obtain final maps.
2.4. Suitable Roof Areas for PV Installation
Several filters can be applied for deciding suitable areas. The area, slope, aspect and solarirradiation and shading should be evaluated for selecting locations for solar PV panels. Differentfilters can be applied in order to decide these areas using the attributes that were created inthe previous sections. In this study, the desired requirements are as follows and summarized inTable 3:
• Area: The residential PV system size in the U.S.A is between 2-10 kWP DC while thecommercial PV systems size may be between 10 kWP DC and 1000 kWP DC [46, 47]. Theaverage area for 1 kWP DC is around 10 square meter [48]. Therefore, between 20 and 100square meter areas are chosen for residential size PV systems and between 100 and 10000square meter areas are chosen for commercial size PV systems.
• Aspect: Between 135 and 225 degree were selected roof segment polygon facing south,southeast, and southwest can collect higher energy and flat roof segments since most of PVpanels are installed in flat roofs due to the southward direction.
• Shading: Avoiding shade 100% of the time is not always possible given space constraintson buildings and land. However, the solar irradiance on a day is highest between 9 am and3 pm during the summer solstice and between 10 am and 2 pm during the winter solstice.Therefore, the roof segments that are not shaded during these times were selected.
• Slope: Philadelphia receives the most perpendicular sunlight when a PV is facing southand the slope is 5 degrees less than the latitude, 39 degrees [49]. However, this precisecondition is not always the best option, and different slope values can be used. Researchby Christensen and Barker [40] has determined that only -10% of irradiation (annual) islost between 20 and 60 slope at a latitude of 42N. Therefore, a rating assessment was madebased on slope. The polygons are categorized within a rating list of two categories;
– 20 < Slope ≤ 60 : Rate1– 0 ≤ Slope ≤ 20 : Rate2
AIMS Energy Volume 3, Issue 3, 401–420
410
The Raster Calculator and Boolean Operator AND were used to decide suitable locationsbased on these criteria. First, suitable polygons based on area and aspect were found and savedas a new file. Then the Raster calculator and Boolean Operator AND were used to decidethe polygons that fulfill shading requirements for winter and summer. Finally, each polygoncategorized based on its slope.
Table 3. Suitable Area for PV systems requirements.
Parameter Value
Area 20m2 ≤ Area ≤ 100m2 for residential PV system size100m2 < Area ≤ 10000m2 for commercial PV system size
Aspect 135o ≤ Aspect ≤ 225o or Flat
Shading No shading between 9.00 am to 3.00 pm at the summer solsticeNo shading between 10.00 am to 2.00 pm at the winter solstice
Slope 20 < Slope ≤ 60 : Rate10 ≤ Slope ≤ 20 : Rate2
3. Results and Discussion
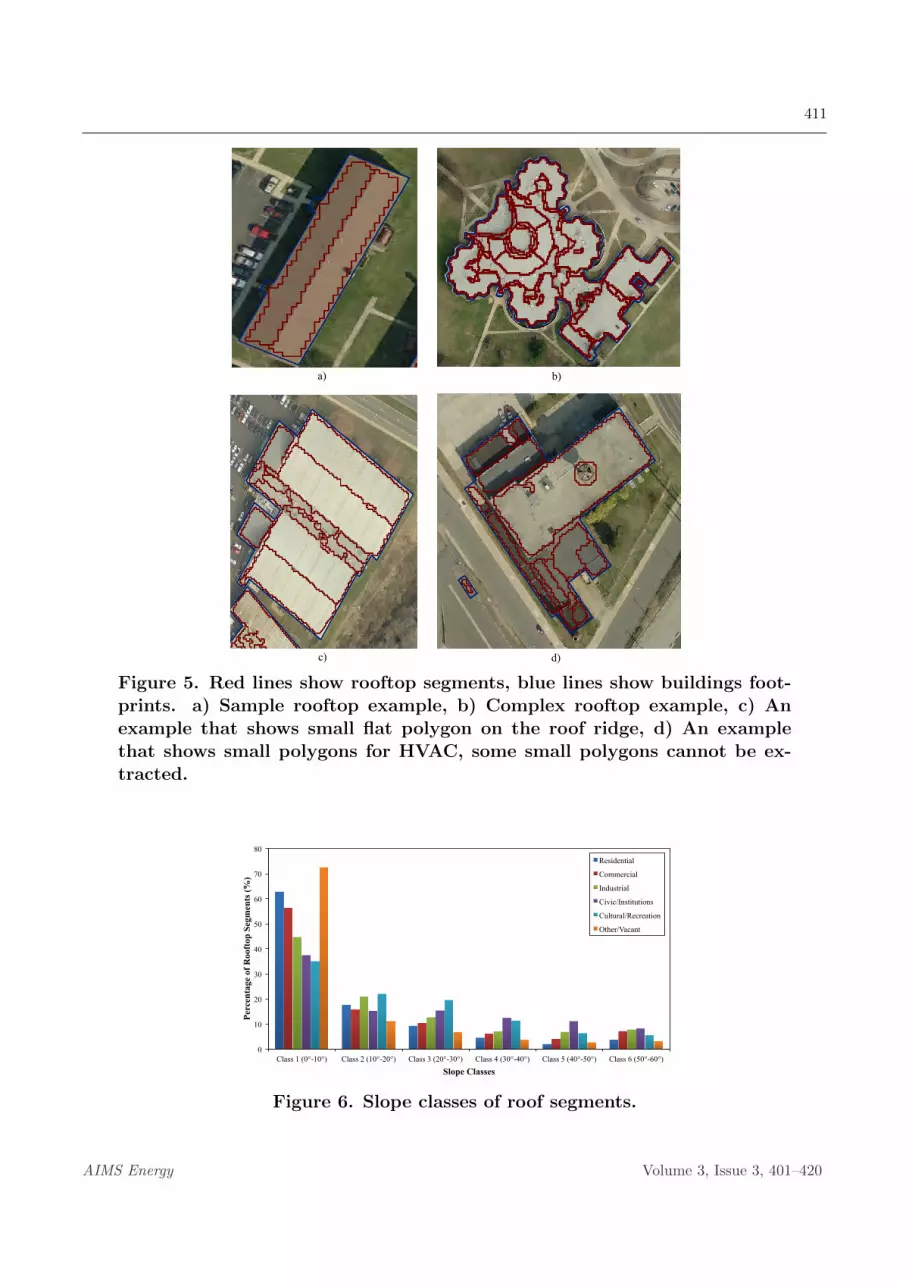
The first results obtained were those pertaining to the rooftop segments. The success ofthe roof segmentation process was verified by comparison to aerial imagery. 150 rooftop wereanalyzed and the results show that simple roof structures lead to the most precise results (Fig-ure 5a). For more complicated roofs, however, more polygons than necessary may be created(Figure 5b). The areas along roof ridges can cause problems in this regard. For example, slopecalculations may cause undesirable flat areas around roof ridges. This is because the pointsare positioned on the opposite sides of roof and have absolute heights, which lead to the falseidentification of slopes and create flat areas (Figure5c). Likewise, some very small chimneys andother features of the roofs may not be able to be represented as polygons (Figure5d). All theselimitations can be reduced with higher point densities.
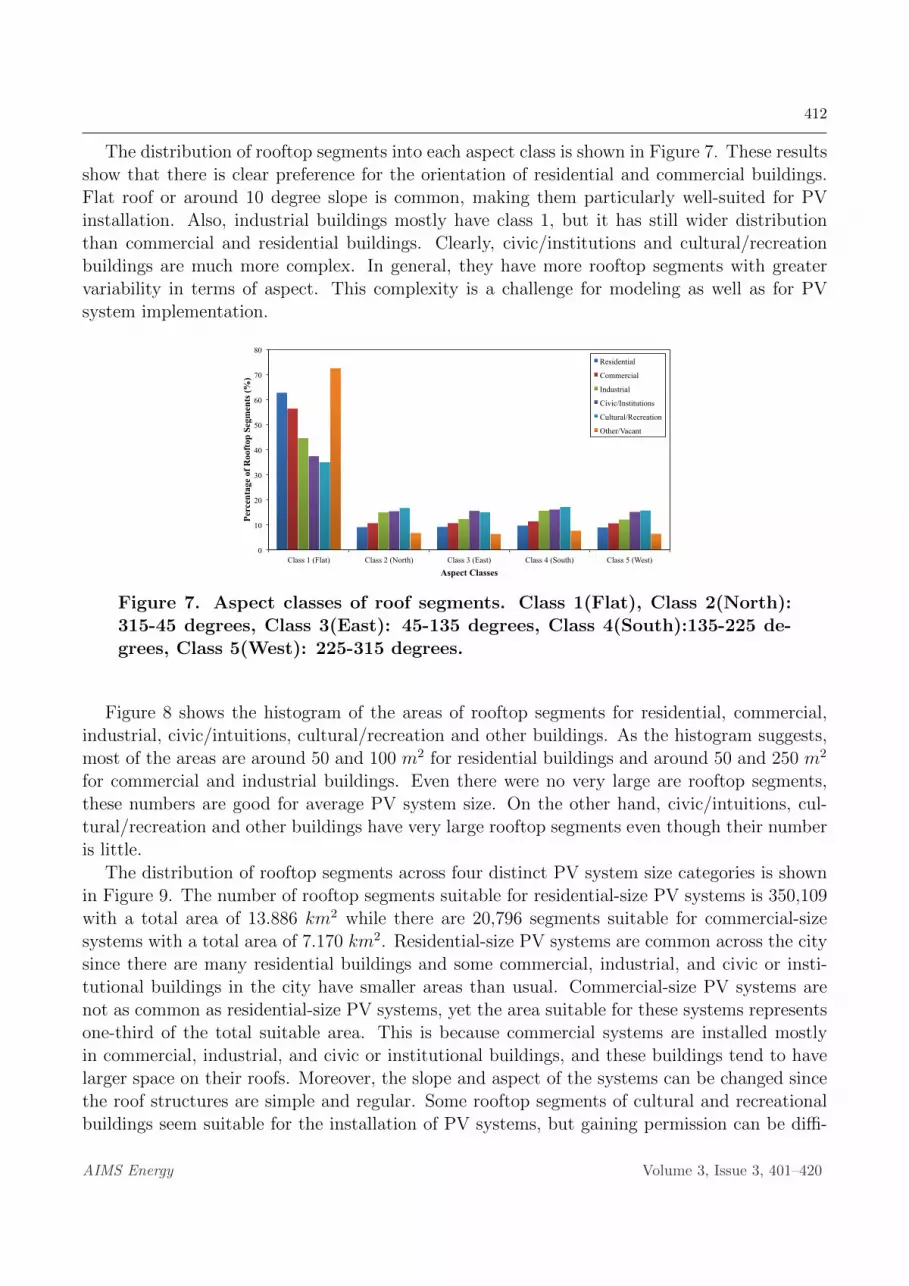
After the method was applied to Philadelphia, 1,059,801 rooftop segments were identified.The distribution of slope among rooftop segments is reported in Figure 6 for residential build-ings, commercial buildings, industrial buildings civic/intuitions, cultural/recreation and otherbuildings. Residential, commercial and industrial buildings mostly have flat or Class 2 rooftop.These low slopes enable PV system owners to adjust their panels with slope they want. Next,Slope Class 2 (10-20 degrees) is common in Philadelphia. Civic and cultural buildings, however,have many rooftop segments with steeper slopes, likely because these buildings were designedfor aesthetic purposes, with very complex structures.
AIMS Energy Volume 3, Issue 3, 401–420
411
a) b)
c) d)
Figure 5. Red lines show rooftop segments, blue lines show buildings foot-prints. a) Sample rooftop example, b) Complex rooftop example, c) Anexample that shows small flat polygon on the roof ridge, d) An examplethat shows small polygons for HVAC, some small polygons cannot be ex-tracted.
0
10
20
30
40
50
60
70
80
Class 1 (0°-10°) Class 2 (10°-20°) Class 3 (20°-30°) Class 4 (30°-40°) Class 5 (40°-50°) Class 6 (50°-60°)
Perc
enta
ge o
f Roo
ftop
Seg
men
ts (%
)
Slope Classes
Residential
Commercial
Industrial
Civic/Institutions
Cultural/Recreation
Other/Vacant
Figure 6. Slope classes of roof segments.
AIMS Energy Volume 3, Issue 3, 401–420
412
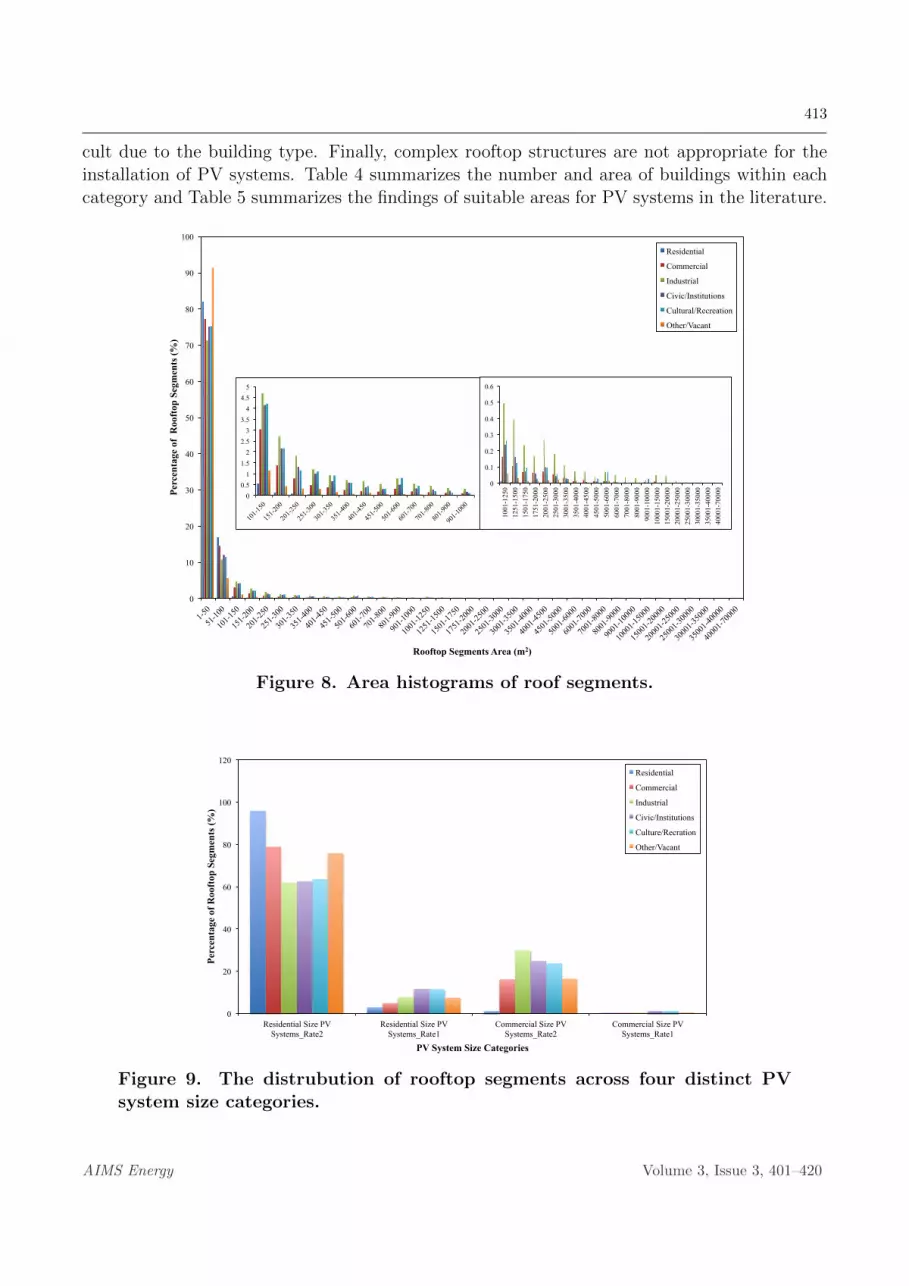
The distribution of rooftop segments into each aspect class is shown in Figure 7. These resultsshow that there is clear preference for the orientation of residential and commercial buildings.Flat roof or around 10 degree slope is common, making them particularly well-suited for PVinstallation. Also, industrial buildings mostly have class 1, but it has still wider distributionthan commercial and residential buildings. Clearly, civic/institutions and cultural/recreationbuildings are much more complex. In general, they have more rooftop segments with greatervariability in terms of aspect. This complexity is a challenge for modeling as well as for PVsystem implementation.
0
10
20
30
40
50
60
70
80
Class 1 (Flat) Class 2 (North) Class 3 (East) Class 4 (South) Class 5 (West)
Perc
enta
ge o
f Roo
ftop
Seg
men
ts (%
)
Aspect Classes
Residential
Commercial
Industrial
Civic/Institutions
Cultural/Recreation
Other/Vacant
Figure 7. Aspect classes of roof segments. Class 1(Flat), Class 2(North):315-45 degrees, Class 3(East): 45-135 degrees, Class 4(South):135-225 de-grees, Class 5(West): 225-315 degrees.
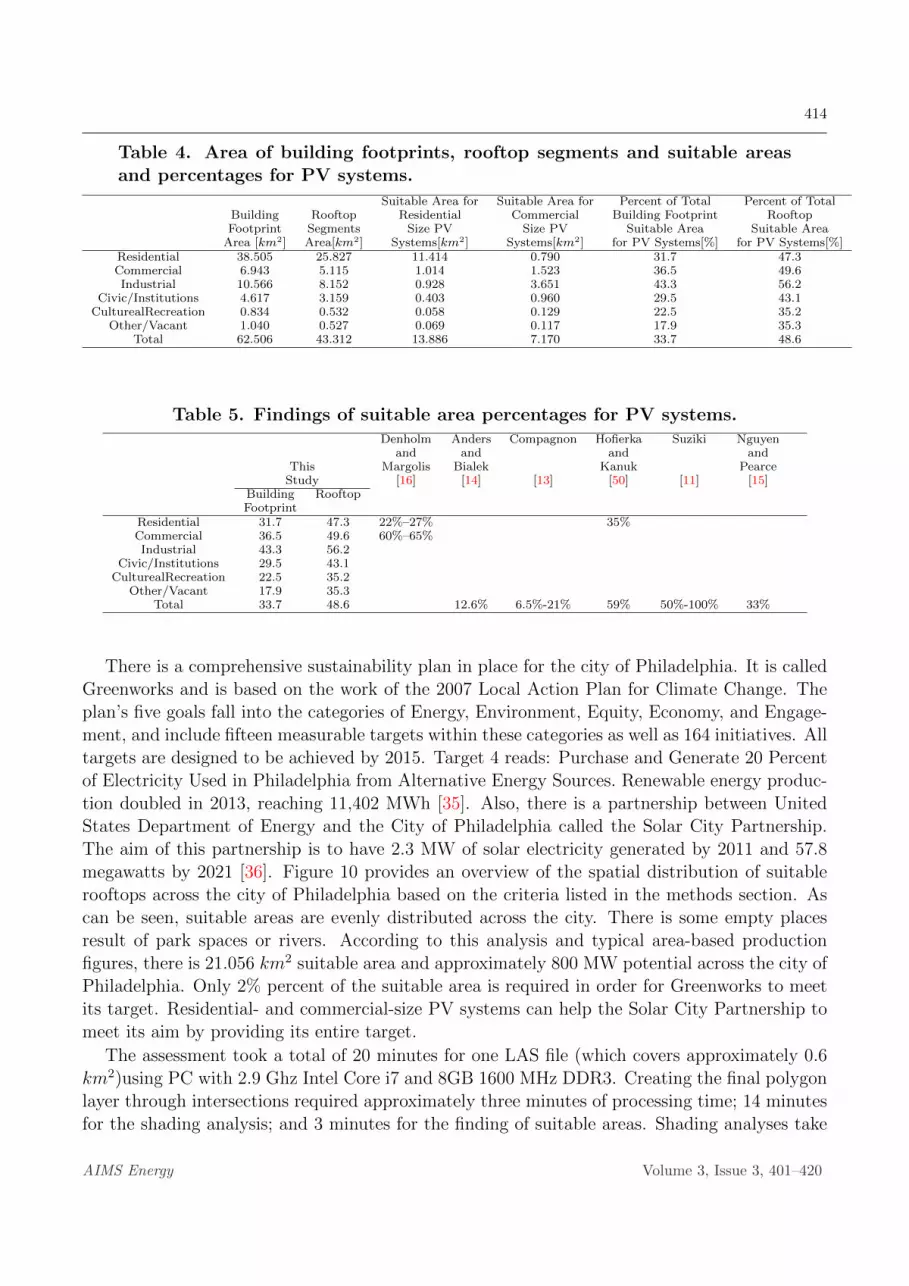
Figure 8 shows the histogram of the areas of rooftop segments for residential, commercial,industrial, civic/intuitions, cultural/recreation and other buildings. As the histogram suggests,most of the areas are around 50 and 100 m2 for residential buildings and around 50 and 250 m2
for commercial and industrial buildings. Even there were no very large are rooftop segments,these numbers are good for average PV system size. On the other hand, civic/intuitions, cul-tural/recreation and other buildings have very large rooftop segments even though their numberis little.
The distribution of rooftop segments across four distinct PV system size categories is shownin Figure 9. The number of rooftop segments suitable for residential-size PV systems is 350,109with a total area of 13.886 km2 while there are 20,796 segments suitable for commercial-sizesystems with a total area of 7.170 km2. Residential-size PV systems are common across the citysince there are many residential buildings and some commercial, industrial, and civic or insti-tutional buildings in the city have smaller areas than usual. Commercial-size PV systems arenot as common as residential-size PV systems, yet the area suitable for these systems representsone-third of the total suitable area. This is because commercial systems are installed mostlyin commercial, industrial, and civic or institutional buildings, and these buildings tend to havelarger space on their roofs. Moreover, the slope and aspect of the systems can be changed sincethe roof structures are simple and regular. Some rooftop segments of cultural and recreationalbuildings seem suitable for the installation of PV systems, but gaining permission can be diffi-
AIMS Energy Volume 3, Issue 3, 401–420
413
cult due to the building type. Finally, complex rooftop structures are not appropriate for theinstallation of PV systems. Table 4 summarizes the number and area of buildings within eachcategory and Table 5 summarizes the findings of suitable areas for PV systems in the literature.
0
10
20
30
40
50
60
70
80
90
100
1-50
51-10
0
101-1
50
151-2
00
201-2
50
251-3
00
301-3
50
351-4
00
401-4
50
451-5
00
501-6
00
601-7
00
701-8
00
801-9
00
901-1
000
1001
-1250
1251
-1500
1501
-1750
1751
-2000
2001
-2500
2501
-3000
3001
-3500
3501
-4000
4001
-4500
4501
-5000
5001
-6000
6001
-7000
7001
-8000
8001
-9000
9001
-1000
0
1000
1-150
00
1500
1-200
00
2000
1-250
00
2500
1-300
00
3000
1-350
00
3500
1-400
00
4000
1-700
00
Perc
enta
ge o
f R
ooft
op S
egm
ents
(%)
Rooftop Segments Area (m2)
Residential
Commercial
Industrial
Civic/Institutions
Cultural/Recreation
Other/Vacant
0 0.5
1 1.5
2 2.5
3 3.5
4 4.5
5
101-1
50
151-2
00
201-2
50
251-3
00
301-3
50
351-4
00
401-4
50
451-5
00
501-6
00
601-7
00
701-8
00
801-9
00
901-1
000
0
0.1
0.2
0.3
0.4
0.5
0.6
1001
-125
0 12
51-1
500
1501
-175
0 17
51-2
000
2001
-250
0 25
01-3
000
3001
-350
0 35
01-4
000
4001
-450
0 45
01-5
000
5001
-600
0 60
01-7
000
7001
-800
0 80
01-9
000
9001
-100
00
1000
1-15
000
1500
1-20
000
2000
1-25
000
2500
1-30
000
3000
1-35
000
3500
1-40
000
4000
1-70
000
Figure 8. Area histograms of roof segments.
0
20
40
60
80
100
120
Residential Size PV Systems_Rate2
Residential Size PV Systems_Rate1
Commercial Size PV Systems_Rate2
Commercial Size PV Systems_Rate1
Perc
enta
ge o
f Roo
ftop
Seg
men
ts (%
)
PV System Size Categories
Residential
Commercial
Industrial
Civic/Institutions
Culture/Recration
Other/Vacant
Figure 9. The distrubution of rooftop segments across four distinct PVsystem size categories.
AIMS Energy Volume 3, Issue 3, 401–420
414
Table 4. Area of building footprints, rooftop segments and suitable areasand percentages for PV systems.
Suitable Area for Suitable Area for Percent of Total Percent of TotalBuilding Rooftop Residential Commercial Building Footprint RooftopFootprint Segments Size PV Size PV Suitable Area Suitable Area
Area [km2] Area[km2] Systems[km2] Systems[km2] for PV Systems[%] for PV Systems[%]Residential 38.505 25.827 11.414 0.790 31.7 47.3Commercial 6.943 5.115 1.014 1.523 36.5 49.6Industrial 10.566 8.152 0.928 3.651 43.3 56.2
Civic/Institutions 4.617 3.159 0.403 0.960 29.5 43.1CulturealRecreation 0.834 0.532 0.058 0.129 22.5 35.2
Other/Vacant 1.040 0.527 0.069 0.117 17.9 35.3Total 62.506 43.312 13.886 7.170 33.7 48.6
Table 5. Findings of suitable area percentages for PV systems.Denholm Anders Compagnon Hofierka Suziki Nguyen
and and and andThis Margolis Bialek Kanuk Pearce
Study [16] [14] [13] [50] [11] [15]Building RooftopFootprint
Residential 31.7 47.3 22%–27% 35%Commercial 36.5 49.6 60%–65%Industrial 43.3 56.2
Civic/Institutions 29.5 43.1CulturealRecreation 22.5 35.2
Other/Vacant 17.9 35.3Total 33.7 48.6 12.6% 6.5%-21% 59% 50%-100% 33%
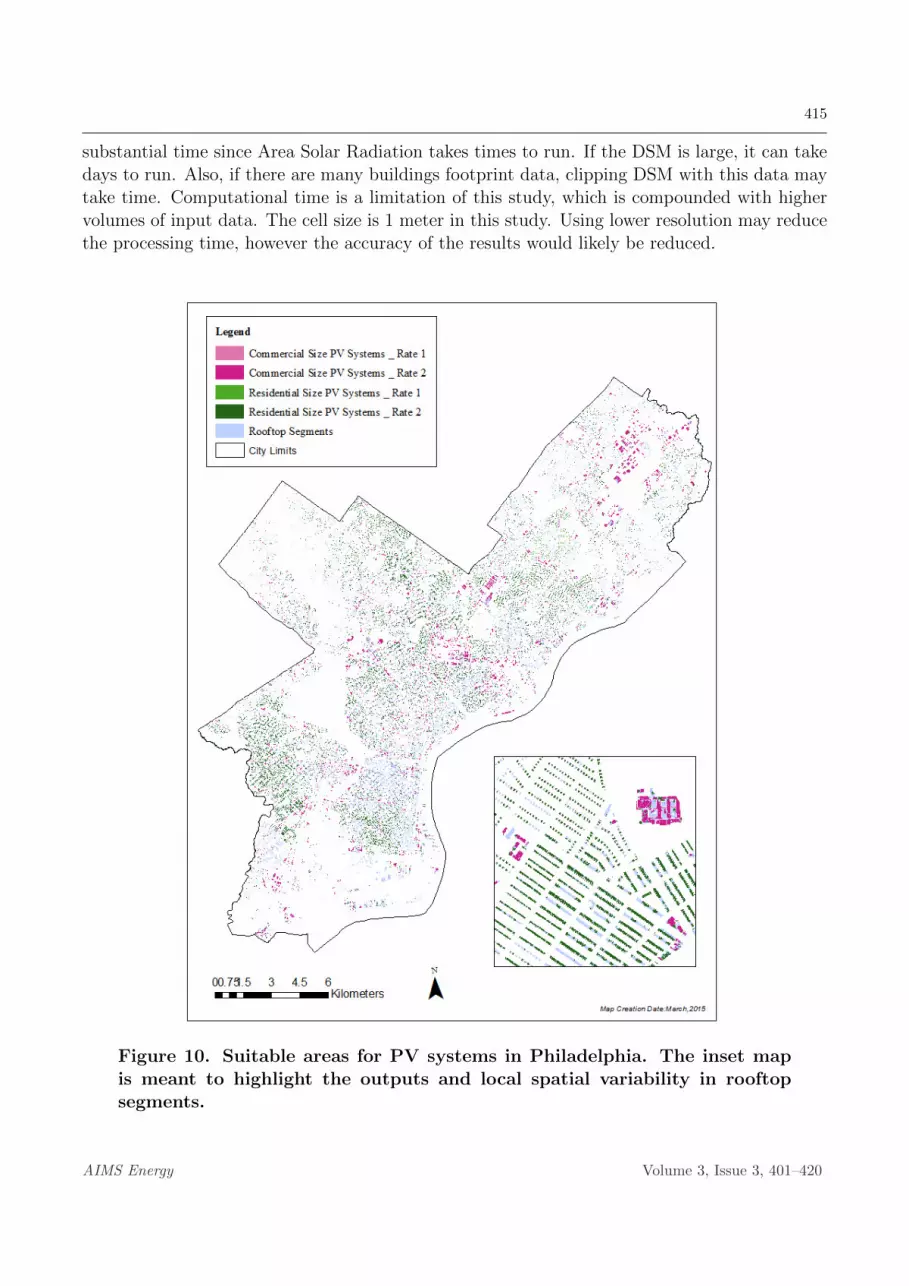
There is a comprehensive sustainability plan in place for the city of Philadelphia. It is calledGreenworks and is based on the work of the 2007 Local Action Plan for Climate Change. Theplan’s five goals fall into the categories of Energy, Environment, Equity, Economy, and Engage-ment, and include fifteen measurable targets within these categories as well as 164 initiatives. Alltargets are designed to be achieved by 2015. Target 4 reads: Purchase and Generate 20 Percentof Electricity Used in Philadelphia from Alternative Energy Sources. Renewable energy produc-tion doubled in 2013, reaching 11,402 MWh [35]. Also, there is a partnership between UnitedStates Department of Energy and the City of Philadelphia called the Solar City Partnership.The aim of this partnership is to have 2.3 MW of solar electricity generated by 2011 and 57.8megawatts by 2021 [36]. Figure 10 provides an overview of the spatial distribution of suitablerooftops across the city of Philadelphia based on the criteria listed in the methods section. Ascan be seen, suitable areas are evenly distributed across the city. There is some empty placesresult of park spaces or rivers. According to this analysis and typical area-based productionfigures, there is 21.056 km2 suitable area and approximately 800 MW potential across the city ofPhiladelphia. Only 2% percent of the suitable area is required in order for Greenworks to meetits target. Residential- and commercial-size PV systems can help the Solar City Partnership tomeet its aim by providing its entire target.
The assessment took a total of 20 minutes for one LAS file (which covers approximately 0.6km2)using PC with 2.9 Ghz Intel Core i7 and 8GB 1600 MHz DDR3. Creating the final polygonlayer through intersections required approximately three minutes of processing time; 14 minutesfor the shading analysis; and 3 minutes for the finding of suitable areas. Shading analyses take
AIMS Energy Volume 3, Issue 3, 401–420
415
substantial time since Area Solar Radiation takes times to run. If the DSM is large, it can takedays to run. Also, if there are many buildings footprint data, clipping DSM with this data maytake time. Computational time is a limitation of this study, which is compounded with highervolumes of input data. The cell size is 1 meter in this study. Using lower resolution may reducethe processing time, however the accuracy of the results would likely be reduced.
Figure 10. Suitable areas for PV systems in Philadelphia. The inset mapis meant to highlight the outputs and local spatial variability in rooftopsegments.
AIMS Energy Volume 3, Issue 3, 401–420

416
Also, census tract is used in order to create groups of LAS files. The census block datasborders are middle of the streets.Therefore, any building or vegetation is not split off and mostof shading is considered. However, the shading effects of very tall buildings to nearby buildingscan not be captured in a method of nature and it is unavoidable. Additionally, the horizon tothe south of city has not been modeled since Philadelphia, PA does not have any significanttopographic features to the south that would limit solar irradiation. If a city has significanttopographic features to the south, the DSM should be created for the surrounding area in orderto account for this macro-scale shading.
These results can be used with a techno-economic model such as SAM in order to calculatepower production and evaluate financial options. Additionally, all results can be summarized atdifferent scales (e.g. by focusing on a specific neighborhood, the area surrounding a specific hubin the electricity distribution system, or a specific rooftop). For this reason, the data generatedoffers a critical starting point for PV policy, planning and implementation decisions.
4. Conclusion
This study provides a method for extracting rooftop segments based on slope and aspect usingLIDAR data, ArcGIS tools, and building footprint data. The python programming languageis used to automate the model using ArcGIS. Additionally, it evaluates the extracted rooftopsegments considering shading from nearby objects and the general topography. Here, we appliedthe methodology to city of Philadelphia, with validation of 150 rooftop by comparison to aerialphotographs. This study identifies suitable roofs using a multi-criteria spatial analysis for PVsystems for Philadelphia. In order to identify suitable areas, area, slope, aspect, and shadingrequirements were defined and applied. It was found that 33.7% of building footprint data and48.6 % rooftop areas are suitable for PV systems.
Assessment of rooftop PV potential is a crucial step for electricity system operators, policy-makers, and homeowners who want to install PV systems on their roofs. By assessing rooftopPV potential and suitable areas for development across wide geographic areas as in this study,electricity operators and system planners have tools that can help them to predict future elec-tricity generation. By identifying clusters of suitable areas, or perhaps overlaying data generatedin this study with socioeconomic data, policymakers can create more logical and incentivizingpolicies and deploy financing schemes based on building type, usage, and PV potential. Finally,building owners can avoid high electricity costs by installing PV systems on the correct sides oftheir roofs. This study has developed a method to inform each of these stakeholder groups.
The presented method characterizes rooftop segments over a wide area and identify rooftopsthat are suitable for PV systems. Other researchers who wish to investigate different cities orregions and to create their own parameters for what constitutes a suitable area can use themethodology. Classification binning criteria for aspect and slope could further be adjusted toreflect refinements in the decision making process, such as additionally separating along thesolar noon demarcation or separating along financial criteria from PV power income on-site.This is outside of the realm of this paper, but demonstrates the potential for this new tool.The methodology can also be customized using different radiation models or power productionmethods, since neither of these are calculated in this study. Additionally, the methodology
AIMS Energy Volume 3, Issue 3, 401–420
417
can be used for other areas that require rooftop information. The method relies extensively onArcGIS which is the most commonly used commercial software especially among many of thestakeholders that might find this tool useful (e.g., city planners, utility managers, consultants),although the lack of ‘open source’ software is a limitation of this study. Another key limitationis the computation time to model shading.
Acknowledgments
We would like to thank you Frank Hardisty, Joseph Ranalli and Carolyn Fish. Also, wesincerely thank two anonymous reviewers for their comments and suggestions.
Conflict of Interest
All authors declare no conflicts of interest in this paper.
References
1. World Data Bank, Urban population, 2015. Available from:http://data.worldbank.org/indicator/SP.URB.TOTL.IN.ZS.
2. Nguyen HT, Pearce JM (2012) Incorporating shading losses in solar photovoltaic potentialassessment at the municipal scale. Solar Energy 86: 1245-1260.
3. Wiginton L, Nguyen H, Pearce JM (2010) Quantifying rooftop solar photovoltaic potentialfor regional renewable energy policy. Computers, Environment and Urban Systems 34:345-357.
4. Suna D, Polo AL, Haas R. Demand side Value of PV. Vienna University of Technology:Institute of Power Systems and Energy Economics Group, Report of IEE project ; 2006. 55p.
5. Voivontas D, Assimacopoulos D, Mourelatos A. et al. (1998) Evaluation of renewable energypotential using a GIS decision support system. Renewable energy 13: 333-344.
6. Izquierdo S, Rodrigues M, Fueyo N. (2008) A method for estimating the geographicaldistribution of the available roof surface area for large-scale photovoltaic energy-potentialevaluations. Solar Energy 82: 929-939.
7. Kabir MH, Endlicher W, Jagermeyr J. (2010) Calculation of bright roof-tops for solar pvapplications in dhaka megacity, bangladesh. Renewable Energy 35: 1760-1764.
8. Charabi Y, Gastli A. (2011) PV site suitability analysis using gis-based spatial fuzzy multi-criteria evaluation. Renewable Energy 36: 2554 – 2561.
9. Chaudhari M, Frantzis L, Hoff TE. PV grid connected market potential under a costbreakthrough scenario. Navigant Consulting, Inc. Retrieved on September ; 2004. p 93.Report No.: 2004-117373.
10. Paidipati J, Frantzis L, Sawyer H, at al. Rooftop photovoltaics market penetration scenarios.Golden (CO): National Renewable Energy Laboratory ; 2008 November. p 92. Report No.:NREL/SR-581-42306.
AIMS Energy Volume 3, Issue 3, 401–420
418
11. Suzuki S, Ito M, Kurokawa K. An analysis of pv resource in residential areas by meansof aerial photo images. in Proceedings of the 22nd European Photovoltaic Solar EnergyConference, 2007 September 3-7; Milan, Italy. (2007), p.3571-3575.
12. Gennusa ML, Lascari G, Rizzo G, et al. (2011) A model for predicting the potential diffusionof solar energy systems in complex urban environments. Energy Policy, 39: 5335-5343.
13. Compagnon R. (2004) Solar and daylight availability in the urban fabric. Energy andBuildings 36: 321-328.
14. Anders S, Bialek T. Technical potential for rooftop photovoltaics in the San Diego region.in Solar 2006: Renewable Energy - Key to Climate Recovery, 2006 July 9-13; Denver (CO).American Solar Energy Society (ASES) Curran Associates, Inc. (Mar 2007). p.8-13.
15. Nguyen HT, Pearce JM. (2013) Automated quantification of solar photovoltaic potential incities. International Review for Spatial Planning and Sustainable Development 1: 49-60.
16. Denholm P, Margolis R. Supply curves for rooftop solar PV-generated electricity for theUnited States. Golden(CO): National Renewable Energy Laboratory ; 2008 November. p 19.Report No.: NREL/TP-6A0-44073 .
17. Freitas S, Catita C, Redweik P, et al. (2015) Modelling solar potential in the urban envi-ronment: State-of-the-art review. Renewable and Sustainable Energy Reviews 41: 915-931.
18. Angelis-Dimakis A, Biberacher M, Dominguez J, et al. (2011) Methods and tools to evaluatethe availability of renewable energy sources. Renewable and Sustainable Energy Reviews 15:1182-1200.
19. Melius J, Margolis R. and Ong S. Estimating Rooftop Suitability for PV: A Review ofMethods, Patents, and Validation Techniques. Golden(CO): National Renewable EnergyLaboratory ; 2013 December. p 30. Report No.: NREL/TP-6A20-60593.
20. Lukac N, Zlaus D, Seme S, et al. (2013) Rating of roofs surfaces regarding their solarpotential and suitability for pv systems, based on lidar data. Applied Energy 102: 803-812.
21. Lukac N. and Zalik B. (2013) Gpu-based roofs’ solar potential estimation using lidar data.Computers & Geosciences, 52: 34-41.
22. Huang Y, Yu B, Hu Z, et al. Locating suitable roofs for utilization of solar energy indowntown area using airborne lidar data and object-based method: A case study of thelujiazui region, Shanghai. in 2012 Second International Workshop on Earth Observationand Remote Sensing Applications, 2012 June 8-11; Shanghai, China. IEEE, (2012). p.322-326.
23. Jacques DA, Gooding J, Giesekam JJ, et al. (2014) Methodology for the assessment of(PV) capacity over a city region using low-resolution lidar data and application to the cityof leeds (UK). Applied Energy 124: 28-34.
24. Gooding J, Crook R, Tomlin AS. (2015) Modelling of roof geometries from low-resolutionlidar data for city-scale solar energy applications using a neighbouring buildings method.Applied Energy 148: 93-104.
AIMS Energy Volume 3, Issue 3, 401–420

419
25. Voegtle T, Steinle E, Tovari D.(2005) Airborne laserscanning data for determination ofsuitable areas for photovoltaics. International Archives of the Photogrammetry, RemoteSensing and Spatial Information Sciences, 36: 215-220.
26. Jochem A, Hofle B, Rutzinger M, et al. (2009) Automatic roof plane detection and analysisin airborne lidar point clouds for solar potential assessment. Sensors 9: 5241-5262.
27. Santos T, Gomes N, Brito M, et al. Solar potential analysis in Lisbon using lidar data. inProc. in 31st EARSeL symposium and 35th general assembly Prague, 2011 May 30 -June 2;Prague, Czech Republic. European Association of Remote Sensing Laboratories (EARSeL),(2013). p.13-20.
28. Levinson R, Akbari H, Pomerantz M, et al. (2009) Solar access of residential rooftops infour California cities. Solar Energy 83: 2120-2135.
29. Kassner R, Koppe W, Schuttenberg T, et al. Analysis of the solar potential of roofs byusing official lidar data. in Proceedings of the International Society for Photogrammetry,Remote Sensing and Spatial Information Sciences, (ISPRS Congress), 2008 July 3-11; Bei-jing, China. XXIst ISPRS Congress Technical Commission IV, (2008). p. 399-404.
30. Nguyen HT, Pearce JM, Harrap R, et al. (2012) The application of lidar to assessment ofrooftop solar photovoltaic deployment potential in a municipal district unit. Sensors 12:4534-4558.
31. Li Z, Zhang Z, Davey K. (2015) Estimating geographical pv potential using lidar data forbuildings in downtown san francisco, Transactions in GIS Forthcoming 2015.
32. Gooding J, Edwards H, Giesekam J, et al. (2013) Solar city indicator: A methodology topredict city level pv installed capacity by combining physical capacity and socio-economicfactors. Solar Energy 95: 325-335.
33. Jo JH, Rose Z, Cross J, et al. (2015) Application of airborne lidar data and geographic in-formation systems (GIS) to develop a distributed generation system for the town of normal,IL. AIMS Energy 3: 173-183.
34. Kodysh JB, Omitaomu OA, Bhaduri BL, et al. (2013) Methodology for estimating solarpotential on multiple building rooftops for photovoltaic systems. Sustainable Cities andSociety 8: 31-41.
35. Freeh R, Wu S, Mayor’s Office of Sustainability, Greenworks Philadelphia Progress Report.Mayor’s Office of Sustainability, City of Philadelphia; 2015. p 58.
36. Solar energy, solar city partnership, 2015. Available from:http://www.phila.gov/green/solar.html.
37. Pennsylvania spatial data access, Data Access Wizard, 2015. Available from:http://www.pasda.psu.edu/uci/SearchPage.aspx.
38. ArcGIS Resources, Creating raster dems and dsms from large lidar point collections, 2014.Available from:http://resources.arcgis.com/en/help/main/10.2/index.html#//
015w0000004q000000.
AIMS Energy Volume 3, Issue 3, 401–420
420
39. Brooks B, Understanding the Cal Fire Solar Photovoltaic Installation Guideline. BrooksEngineering ; 2011 March. p 27.
40. Chistensen CB, Barker GM. Effects of tilt and azimuth on annual incident solar radiationfor united states locations. in Proceedings of Solar Forum 2001: Solar Energy: The Powerto Choose, 2001 April 21-25; Washington D.C, USA.
41. ArcGIS Resources, How slope works, 2014. Available from:http://resources.arcgis.com/en/help/main/10.2/index.html#/How_Slope_works/
009z000000vz000000/.
42. Alexander C, Smith-Voysey S, Jarvis C, et al. (2009) Integrating building footprints andlidar elevation data to classify roof structures and visualise buildings. Computers, Environ-ment and Urban Systems 33: 285-292.
43. California Energy Commission, Solar Ready. 2013 Residential Compliance Manual ; 2014.p 14.
44. Fu P, Rich PM. (2002) A geometric solar radiation model with applications in agricultureand forestry. Computers and Electronics in Agriculture 37: 25-35.
45. Fu P, Rich P. The solar analyst 1.0 manual. Helios Environmental Modeling Institute, LLC ;2000. p 49.
46. Feldman D, Barbose G, Margolis R. Photovoltaic (PV) pricing trends: historical, recent,and near-term projections. Sun Shot Department of Energy ; 2012 November. p 23. ReportNo: DOE/GO-102012-3839.
47. Goodrich A, James T, Woodhouse M. Residential, commercial, and utilityscale photovoltaic(PV) system prices in the United States: current drivers and cost-reduction opportunities.Golden(CO): National Renewable Energy Laboratory ; 2012 February. p 64. Report No:NREL/TP-6A20-53347.
48. Brooks W, Dunlop J. Photovoltaic (PV) installer resource guide. NABCEP, 2012 March.p 162.
49. Guide book for solar photovoltaic projects in Philadelphia. Mayor’s Office of SustainabilityCity of Philadelphia, Resources, 2011 March. p 87.
50. Hofierka J, Kanuk J. (2009) Assessment of photovoltaic potential in urban areas usingopen-source solar radiation tools. Renewable Energy 34: 2206-2214.
c© 2015, Mesude Bayrakci Boz, et al., licensee AIMSPress. This is an open access article distributed underthe terms of the Creative Commons Attribution License(http://creativecommons.org/licenses/by/4.0)
AIMS Energy Volume 3, Issue 3, 401–420