an assessment of the efficiency of operational risk ... - risk.net
TRANSCRIPT
Journal of Operational Risk 10(1), 127–156
Forum Paper
An assessment of the efficiency of operationalrisk management in Taiwan’s bankingindustry: an application of the stochasticfrontier approach
Hsiang-Hsi Liu and Mauricio Cortes
Graduate Institute of International Business, National Taipei University,151 University Road, Sanhsia District, New Taipei City 23701, Taiwan;emails: [email protected], [email protected]
(Received June 13, 2014; revised August 30, 2014; accepted September 1, 2014)
ABSTRACT
This paper discusses the importance of operational risk management for the efficiencyof Taiwanese banks. We demonstrate that by applying risk managerial strategies bankscan improve their performance, soundness and resilience, which is measured by theirrisk-adjusted return on capital. In order to perform this activity, a stochastic frontieranalysis is applied to Taiwanese bank data from 2008 to 2010. We find that absorp-tion capability, supervisory review and market discipline improve banks’ operationalefficiency, while leniency on governance risk management compliance and opacityincrease their technical inefficiency.
Keywords: banking industry; operational risk management; stochastic frontier approach; shockabsorption capability; Basel Committee.
Corresponding author: Hsiang-Hsi Liu Print ISSN 1744-6740 jOnline ISSN 1755-2710Copyright © 2015 Incisive Risk Information (IP) Limited
127
128 H.-H. Liu and M. Cortes
1 INTRODUCTION
A strong and resilient banking system is the foundation of sustainable economicgrowth, as banks are at the center of the credit and risk intermediation process betweensavers and investors. Moreover, banks provide critical services to consumers such assmall- and medium-sized enterprises and large corporate firms who rely on theseservices to conduct their daily business, both at a domestic and international level.Any weaknesses in the banking sector would rapidly transmit to the broader financialsystem and the real economy, resulting in contractions of liquidity and credit, which,in turn, would lead to a loss of confidence, risk aversion and economic paralysis.
Operational risk (OR) is defined as the risk of loss resulting from inadequate/failedinternal processes, people, systems or other external events. OR is the first risk thatany company faces and is one of the most dangerous threats to the banking industry.A newly established bank is confronted with OR before it gets involved in its firstmarket position or realizes its first credit transaction. It is a peril that can enhancesystemic risk and destroy the company, but its lethal hazards are concealed by lowfrequency and often overlooked by numerous low-severity but high-frequency eventsthat can generate a false sense of security. This can bog down the development andimplementation of appropriate risk management. However, banks recognized longago that risk management is their natural business; therefore, their operational riskmanagement (ORM) systems are innately more developed and refined than those inother economic sectors. Also, economies of scale can help banks to reduce costs bymanaging risk in a more efficient way, which can be offered as a service to otherfirms at an affordable price. Even though there are many ways to mitigate risk, manyfirms do not carefully manage their OR due to nescience, carelessness, a lack ofresources, overconfidence, negligence or greed. This leads to financial catastrophesthat may be avoided through risk awareness, training and the implementation of propermanagement systems.
Between January 1995 and December 2009, Taiwanese commercial banks regis-tered 323 operational events of great magnitude, accounting for more than NT$6.902million in losses (Fang and Lee 2010). This value may be an underestimation becausethe registration of such events was not a requirement until 2009. Prior to that date, theinformation was incomplete due to the absence of records and/or scarce disclosurefrom banks, which have a historical tendency to hide negative information in order to“save face”. During this time period, the number of events and the quality of the datamakes the analysis of OR difficult, especially in the case of extreme events, which areour greatest concern. If Taiwan is to ensure that its financial sector plays its full andproper role in supporting the growth of the overall economy, we must recognize thestrategic importance of ORM in building a service-driven supervisory culture that will
Journal of Operational Risk www.risk.net/journal
Efficiency of operational risk management in Taiwan’s banking industry 129
lead Taiwanese banks toward further competitiveness in a liberalized and globalizedworld.
This paper illustrates the importance of ORM for the efficiency of the Taiwanesebanking industry, demonstrating that the performance of some core risk managerialstrategies can influence the risk-adjusted return on capital behavior in a way thatcan improve the soundness and competitiveness of Taiwan’s banking industry. Theremaining parts of this study are organized as follows. The literature review is pre-sented in Section 2. In Section 3, we depict the hypothesis development for this study.Model specifications, data sources and our estimation method are described in Sec-tion 4. Section 5 presents the empirical results of our study. Section 6 concludes thepaper.
2 LITERATURE REVIEW
Previous research on OR has been conducted by several authors using differentapproaches. In order to strengthen the theoretical framework and the ideas of theseauthors, this paper reviews the most relevant facts with a special emphasis on the effi-ciency of the three pillars proposed by the Basel Committee on Banking Supervision:profitability, stability and continuity. The literature on bank efficiency is extensiveand varied, covering all types of efficiency. Mester (1996) reviewed the standardtechniques of efficiency measurement and discussed some of the issues that arise inapplying these standard techniques to banks. This led him to select the stochastic fron-tier approach (SFA), defined by Battese and Coelli (1995), for panel data on firms, inwhich the nonnegative technical inefficiency effects are assumed to be a function offirm-specific variables and time. The inefficiency effects are assumed to be indepen-dently distributed as truncations of normal distributions with constant variance butwith means that are a linear function of observable variables. This idea was furtherdescribed by Kumbhakar and Knox Lovell (2000), who inspired the structure of theSFA model used in our paper. Kraft and Tirtiroglu (1998) provided an example ofhow to apply the stochastic frontier methodology to estimate x-efficiency and scaleefficiency in the banking industry, and Kao and Liu (2009) further demonstrated thatthe stochastic data approach produces more reliable and informative results than theaverage data and interval data approaches.
Guill (2007) depicted how banks developed risk-adjusted return on capital(RAROC) as a performance measure that expresses return on investment, adjustedfor its risk, and how it relates to the economic capital consumed when undertakingthis investment. He also showed how RAROC improves the capital allocation acrossthe different functional areas in which capital is placed at risk for an expected returnabove the risk-free rate by determining the bank’s optimal capital structure. Thisallows banks to assign capital to business units based on the economic value added
www.risk.net/journal Journal of Operational Risk
130 H.-H. Liu and M. Cortes
by each unit. It is an indicator that combines profitability with stability, matching theefficiency parameters of the Basel Committee. Chapelle et al (2005) estimated theeffects of ORM actions on bank profitability through a measure of RAROC adaptedto OR. Their results suggest that substantial savings can be achieved through activemanagement techniques, although the effect of a reduction in the frequency or severityof operational losses depends on the calibration of aggregate loss distributions.
The studies of Rao (2005), Chiu and Chen (2009) and Chiu (2009) contributedto our understanding of the determinants of banks’ efficiency. Rao (2005) studiedcost efficiency and its relationship with the risk-return behavior of banks, finding thatlower liquidity and lower capitalization risks coupled with higher return on equitysignificantly improved the cost efficiency of banks; however, he did not consider thatthe effects of risk may dilute the cost reduction and even endanger a bank’s survival.Chiu and Chen (2009) estimated the scores related to bank efficiency, including inter-nal and external risk, and concluded that the mean efficiency score of publicly ownedbanks in Taiwan was still higher than that in mixed and privately owned banks between2002 and 2004. In addition, the influence of external environmental adjustment wasgreater on the efficiency of privately owned banks than mixed or publicly ownedbanks. Chiu (2009) studied the determinants of efficiency and productivity changeson commercial banks, finding that the equity-to-total-asset and loan-to-deposit ratioshave a significant positive relationship with banks’ technical efficiency. However,bank size and the overdue ratio have a significant negative relationship with the tech-nical efficiency of banks with no established financial holding company (FHC). Chiu(2009) also found that business diversification and the loan-to-deposit ratio have asignificant negative relationship with scale efficiency. Moreover, the overdue ratiohas a significant negative relationship with the productivity growth of FHCs, whilebusiness diversification has a significant negative relationship with both productivityand technological growth.
Campbell and Fraser (2001) used Tier 1 capital to rank the top 100 banks in theworld by size. They found that size was not strongly correlated to operational losses,and neither was the average size of each loss with the overall size of the bank. Yet,Uchida and Satake (2009) found that more efficient banks eventually become bettercapitalized, and higher capital levels tend to have a positive effect on efficiency levels.Moreover, Tier 1 increases banks’stamina, being the main buffer that allows a bank toabsorb the blow in case of a catastrophic event. Campbell and Fraser (2001) also foundthat there is no significant correlation between the size of losses and a bank’s level ofOR capital. There is also little correlation between the size of the losses reported fromyear to year. This emphasizes how much total OR losses are affected by single rarebut extreme loss events, which we estimate with different mathematical models thatare used to calculate the economic capital itemized in provisions (expected losses),regulatory capital (unexpected losses) and other capital buffers (self-insurance), as
Journal of Operational Risk www.risk.net/journal
Efficiency of operational risk management in Taiwan’s banking industry 131
explained by Manic (2007). Nevertheless, operational loss data typically exhibitsirregularities that complicate the mathematical modeling. In this regard, Embrechtset al (2004) demonstrated the singularities of operational loss data and the need toinclude extreme value theory for the tail calculation. Embrechts et al (2007) postulateda way to include tail dependencies among aggregate loss values into the OR estimationmodels, and Cope et al (2009) formulated a simulation process to partially solve thelack of data problem outlined in Section 1, concluding with some recommendationsfor regulatory authorities about possible changes to the regulatory framework.
To understand the error terms, Laxton (1978) presented the bias and the precisionof a model to estimate the probability of attainment of standards around large, isolatedsources based on the lognormal distribution of model-based to measurement-baseddesign value ratios. This model, combined with the physical concepts of divergenceexplained by Brewer (1999), can be used analogously to OR quantification models. Afinal concept for absorption capability was presented by the ProVention Consortiumand the joint workshop of the Research Task Force of the Basel Committee on BankingSupervision, the Centre for Economic Policy Research (London) and the Journal ofFinancial Intermediation, which demonstrated how a risk transfer mechanism (RTM)influences operational efficiency, as well as how to calculate its effect on a bank’s riskprofile.
The supervisory pillar has been addressed by Barth et al (2004), who suggested thatpolicies that rely on guidelines that force accurate information disclosure, empowerthe private-sector corporate control of banks and foster incentives for private agentsto exert corporate control work best to promote bank development, performance andstability. Sinha (2006), meanwhile, analyzed the prudential regulation as a market forcorporate control and corporate governance, and Laeven and Levine (2009) comparedbank governance, authorities’regulation and risk taking. On the other hand, the annualreport of the Operational Riskdata eXchangeAssociation (ORX) (2009) used the ratiooperational events per million incomes to quantify the lack of governance and/orsupervision in a way that allows for a fair comparison of all banks, disregarding theirsize and focusing on wealth production.Another approach considers the cost of capitalas an inefficiency factor relating to the institutions’governance and risk management.
Uchida and Satake (2009) explained that market discipline has garnered increasingattention as a mechanism to ensure bank soundness. They imply that depositors, whoare the largest creditors to banks, may be of primary importance in this mechanism byexerting disciplinary pressure on bank management in terms of efficiency improve-ments. Huang (2006) explained that information disclosure is a company’s main toolfor reducing the negative effects of market volatility and the overreaction of equityinvestors and deposit savers. He applied a checkbox approach to analyze the financialstatements of individual banks, quantitatively measuring the actual disclosure prac-tices of commercial banks from around the world in relation to their assets, liabilities,
www.risk.net/journal Journal of Operational Risk
132 H.-H. Liu and M. Cortes
funding, incomes and risk profiles. Further, the Universidad del Desarrollo (2010)developed the corporate transparency index (CTI) that opines on the role of regulatorauthorities, who request information but do not force disclosure results, in the reduc-tion of market discipline power. Together with the disclosure level demanded by themarket, some societies are more permissive and do not punish companies with lowcorporate transparency: such is the case in the Taiwanese banking industry. An ORapproach to the topic can be found in the ORX reports that used the ratio operationallosses per million incomes to quantify the delay in discovering weaknesses in pro-cesses or mischievous actions. Chernobai et al (2011) further examined the incidenceof operational losses among US financial institutions using publicly reported loss datafrom 1980 to 2005. They highlighted the correlation between OR and credit risk, aswell as the role of corporate governance and proper managerial incentives in mitigat-ing OR. On the other hand, Cope et al (2012) investigated the relationships betweenthe severity of operational loss events reported in the banking sector and variousregulatory, legal, geographical and economic indicators. They found evidence of asignificant correlation between internal fraud and constraints on executive power andthe prevalence of insider trading. In addition, legal losses were affected by measuresof shareholder and supervisor power.
3 HYPOTHESES DEVELOPMENT
Based on the background information we have obtained, the current situation of ORMin Taiwan and the literature outlined above, our hypothesis development is presentedas follows.
(H1) Shock absorption capability (SAC) strengthens banks’ output performance.
SAC refers to how well a bank responds to risk materialization by maintainingits profitability, soundness and resilience. OR events are unlike any other in finance.While credit deterioration can be followed by looking at a counterparty balance sheet,frauds and execution errors cannot. This unpredictability forces banks to hold a sig-nificant capital buffer in order to protect themselves against operational losses. Themain tool of absorption capability is economic capital, comprised of general provi-sions and capital buffer. Another tool that enhances SAC is RTM, which mitigatesthe effect of adverse events on company objectives. These elements can be measuredand combined to determine the SAC of bank i at time t , which allows us to scru-tinize the dependence level of the RAROC (as an output performance) on the SACand the kind of power law between them. A larger SAC should make stakeholders’returns more stable and provide a stronger guarantee of the bank’s resilience, whichsuggests that ORM is related to output performance. Therefore, we hypothesize thatSAC strengthens banks’ output performance.
Journal of Operational Risk www.risk.net/journal
Efficiency of operational risk management in Taiwan’s banking industry 133
(H2) Governance, risk control and compliance (GRC) reduce banks’ volatility.
A supervisory review is the comprehensive process by which supervisors review andevaluate an institution’s risk profile, such as the adequacy and reliability of the institu-tion’s internal capital adequacy assessment process, monitor its ongoing compliancewith standard regulations and identify any weaknesses or inadequacies and necessaryprudential measures (Committee of European Banking Supervisors (CEBS) 2006).For the supervisory authorities, the aim of this process is to maintain the integrity ofthe financial system, protecting stakeholders and ensuring confidence in the financialsystem; for the companies, it should be just the reporting step of the GRC process, theobjective of which is to create policies and drivers that are to be followed in each andevery circumstance. GRC will be defined to grasp the power effect of the supervisoryreview on RAROC (as an output performance). This reasoning leads to (H2).
(H3) Transparency improves banks’ performance.
A corporation is transparent when, through the disclosed information, stakeholderscan truly understand the state of the business: whether the organization’s activitiesare consistent with regard to stakeholders’ interests, whether these activities are insti-tutionalized (integrated into the organization’s values, policies and processes) andwhether the information can be verified and to what degree of objectivity. The avail-ability of information is a key determinant of allocative efficiency, allowing stake-holders to invest their resources in the proper place, business, etc, and thus propel eco-nomic growth. All economic agents need to generate revenues and avoid bankruptcy;the mutual constraints imposed on them in order to achieve these personal goals arecalled market discipline (Nal 2006). The CTI is used to refer to radical transparencyin the corporate governance of a bank. The CTI was developed by the Universidad delDesarrollo (2010) using similar concepts to those in Huang’s (2006) bank disclosureindex. We follow these but change our focus to the items most linked to OR. In a freemarket, transparency helps to reduce the occurrence and impact of operational events.This is because properly informed stakeholders and marketplace participants rewardcompanies that fulfill their needs in terms of profitability and safety and penalize thosewho do not. This forces banks to set their risk profiles according to cashflows thatsatisfy stakeholders’ requirements and implement internal processes that ensure thesecashflows. As transparency allows stakeholders to observe the most recent activities,making it a guideline for avoiding a negative effect on output performance, (H3) canbe developed.
(H4) OR capital requirements (ORK) decrease banks’ (technical) efficiency.
Banks need capital to run their businesses, pay their bills and invest in loans,securities, structured products, etc: activities that accelerate the economy. Of course,
www.risk.net/journal Journal of Operational Risk
134 H.-H. Liu and M. Cortes
some reserves are required to guarantee depositors’ withdrawals, own liquidity andearn public confidence; however, this should be a managerial decision instead ofa legal imposition. Excessive interventionism and overregulation may harm socialwelfare and private efficiency. Here, a bank’s (technical) efficiency can be definedas the situation in which a bank can allocate and operate its capital resources moreeffectively. According to Rime (2001), regulatory pressure induces banks to increasetheir capital, but this does not affect the level of risk.Van den Heuvel (2008) consideredthat capital requirements reduce the ability of banks to create liquidity, finding thatthe welfare cost of current capital adequacy regulation is equivalent to a permanentloss in consumption of between 0.1% and 1%. Constraints and interventions mightaffect the normal functioning of the market, reducing a company’s opportunity toachieve efficiency and international competitiveness. We conclude the factors aboveand develop (H4).
(H5) Leniency (LEN) boosts banks’ technical inefficiency.
Leniency refers to the reduction of the amount of effort used to adhere to laws,regulations, contracts, strategies and policies. Banking firms have to take a trade-offin their management and auditing processes: a low degree of leniency may lowertheir capital, raising costs and operational losses, but a high degree of leniency mayenable them to reap the benefits derived from reductions in the cost of their processes,and ease decision making by cutting bureaucracy and opaqueness gains. Regardless,leniency reduces the probability of discovering weaknesses in the processes or stop-ping potentially harmful activities. Therefore, we hypothesize that LEN will boostbanks’ technical inefficiency. This reasoning leads to (H5).
(H6) Scanty transparency (OPA) increases banks’ technical inefficiency.
The scanty or poor quality of publicly available information and limited legal andregulatory recourse frequently complicates efforts by financial stakeholders to ensurethat management is acting in their interests. A corporation is transparent when stake-holders can truly understand the state of the business: whether the organization’sactivities are consistent with regard to stakeholder interest, whether they are institu-tionalized (refer to the organization’s values, policies and processes) or whether theinformation can be verified, and to what degree of objectivity. Free access to infor-mation helps to prevent crises and reduces the impact of operational events throughmarket discipline. While opacity increases the potential severity of operational events(in the sense that less monitoring reduces the probability of discovering weak pro-cesses), potentially harmful activities or failures that take place before the risk severityhas swollen to a level that cannot be hidden anymore are a trigger of “black swans”(Taleb 2010). This leads to (H6), as scanty transparency strengthens the ability ofinformation to create a crisis and has a positive impact on operational inefficiency.
Journal of Operational Risk www.risk.net/journal
Efficiency of operational risk management in Taiwan’s banking industry 135
4 MODEL SPECIFICATIONS, DATA SOURCES AND ESTIMATIONMETHOD
In this study, the conceptual model, data sources and estimation method that areapplied to an empirical analysis can be discussed as follows.
4.1 Model setups
Consider the stochastic frontier function presented by Battese and Coelli (1995),reproduced in (4.1):
Yit D exp.Xit Iˇ C Vit � Uit /; (4.1)
where Yit is bank output, represented by its RAROC, and the vector Xit is inputsof known functions of managerial variables associated with the i th bank at the t thobservation, as described by
Xit D f .SACit ;GRCit ;CTIit /: (4.2)
Here,
� SACit is the shock absorption capability of bank i at time t , measured by itsTier 1 (new Taiwan (NT) dollars);
� GRCit is the governance, risk and compliance soundness of bank i at time t ,measured by its OR capital calculation approach (score);
� CTIit is the corporate transparency index of bank i at time t (points) (the CTI isused to refer to radical transparency in the corporate governance of a bank; theCTI was calculated based on the public disclosure of anticorruption programsand bank-by-bank reporting);
� i D 1; 2; : : : ; 36; and
� t D 2008; 2009; 2010.
The technical inefficiency effect, Uit , in the stochastic frontier model can bespecified by
Uit D Zitı CWit ; (4.3)
where the vector Zit of nonnegative random variables associated with the technicalinefficiency of firms over time is described by
Zit D f .ORKit ;LENit ;OPAit /; (4.4)
www.risk.net/journal Journal of Operational Risk
136 H.-H. Liu and M. Cortes
where
� ORKit is the OR compulsory capital requirements of bank i at time t (newTaiwan dollars);
� LENit is the risk supervision leniency of bank i at time t , measured by its rating(grade); and
� OPAit is the opacity of bank i at time t , measured by its deposits (new Taiwandollars).
Note thatWit lumps together the random inefficiency,Uit , and the random error term,Vit . Wit is conditional upon the observed value of .Vit � Uit /
The technical efficiency of production for the i th firm at the t th observation isdefined by
TEit D exp.�Uit / D exp.�ZitıWit /: (4.5)
In this way, the log transformation model is as follows.
Step 1
ln.RAROCit / D ˇ0 C ˇ1 ln.SACit /C ˇ2 ln.GRCit /C ˇ3 ln.CTIit /C Vit � Uit :(4.6)
Step 2
Uit D ı0 C ı1 ln.ORKit /C ı2 ln.LENit /C ı3 ln.OPAit /CWit : (4.7)
This approach allows us to simultaneously estimate the parameters of both theproduction function and the inefficiency function.
4.2 Variables definition, measurement and expected effects
The variables are outlined below and their numerical measurements discussed. Eachmeasurement process has been developed according to extent theories and practicalexperience. It is hoped that these measurements will provide statistical evidence forthe role of ORM activities in the performance of banks’ efficiency. The variables havebeen grouped in two steps. The first step describes the stochastic frontier through threemanagerial variables, and the second step calculates the inefficiency factors throughthree components. Combined, the two steps allow us to compute the efficiency scoresof each bank.
Journal of Operational Risk www.risk.net/journal
Efficiency of operational risk management in Taiwan’s banking industry 137
Step 1 Stochastic frontier model.
(1) Dependent variable (bank’s output, RAROCit as output).
RAROC is an output measure that expresses return on investment, adjusted forits risk. It is related to the economic capital consumed when undertaking thisinvestment. The general formula for RAROC is
RAROC Drevenues � expected losses
economic capital: (4.8)
The nominal return on the investment under consideration is first adjusted bysubtracting the expected losses that are assessed for a transaction of this type.The denominator also reflects the risk of the transaction, since it is the capitalinternally calculated as the amount of a bank’s own funds necessary to coverthe losses, along with the confidence interval required for this activity. Its mea-surement unit is the return rate of a bank’s profitability per NT dollar at risk.Here, we can highlight that economic capital is defined as the value-at-risk,not the total capital. If a bank increases its capital without increasing its riskexposure, it becomes more resilient, reducing its risk of failure and expectedlosses due to operational events. Thus, its RAROC should be higher: in otherwords, the bank should show a higher efficiency in its ORM system.
(2) Managerial variables (inputs).
(a) Shock absorption capability (SAC).
(i) Effects on dependent variable: SAC represents the buffer capacityof bank i at time t . It should be the sum of the monetary values ofeconomic capital, including provisions, regulatory capital and othercapital buffers, and RTM, including outsourcing, insurance, reinsur-ance, hedge, risk retention pools and securitization, plus a discountrate accounting for the default risk of the counterparty. This value isthe amount owned by the bank that would absorb any OR material-ization until it was exhausted, so the stakeholders would not sufferconsiderable reductions in their returns and the bank could remainsustainable. The Basel Committee has also addressed the problem ofliquidity by setting up the liquidity cover ratio (LCR), which is theminimum stock of liquid assets that should enable the bank to sur-vive until day thirty of a proposed stress scenario, and the net stablefunding ratio (NSFR), which is the minimum acceptable amount ofstable funding based on the liquidity characteristics of an institution’sassets and activities over a one-year horizon. Larger absorption capa-bility should make stakeholders’ returns more stable and provide a
www.risk.net/journal Journal of Operational Risk
138 H.-H. Liu and M. Cortes
stronger guarantee of the bank’s resilience; therefore, it is expectedthat SAC will have a positive sign (C).
(ii) Measurement: considering that OR is dominated by extreme eventsand own liquid capital is the main resource in the case of a catas-trophic event, Tier 1 is used in this study to measure bank i ’s loss-absorption capacity at time t . It is also a measure of size, whichplays an important role in banks’ continuity in a potential mergersand acquisitions (M&A) environment, as is expected in the mid-termin Taiwan. Its measurement unit is NT dollars.
(b) Governance, risk management and compliance (GRC).
(i) Effects on dependent variable: supervision refers to the way orga-nizations keep tabs on firms’ governance. From a financial perspec-tive, it can be defined as the interaction of managers, directors andshareholders to ensure that all financial stakeholders receive theirfair share of a company’s earnings and assets (Standard & Poor’s2008). Good corporate governance based on the principles of fair-ness, transparency, accountability and responsibility creates share-holder value, reduces nonfinancial risk in investment (the risk of lossof investor value due to mismanagement or abuse by block hold-ers) and increases compliance with standard regulations. Addressingthese areas of investor concern also promotes a culture of risk man-agement and long-term strategic thinking among companies, such asenterprise risk management and strategy-making processes. Hence,it is expected that GRC will have a positive sign (C).
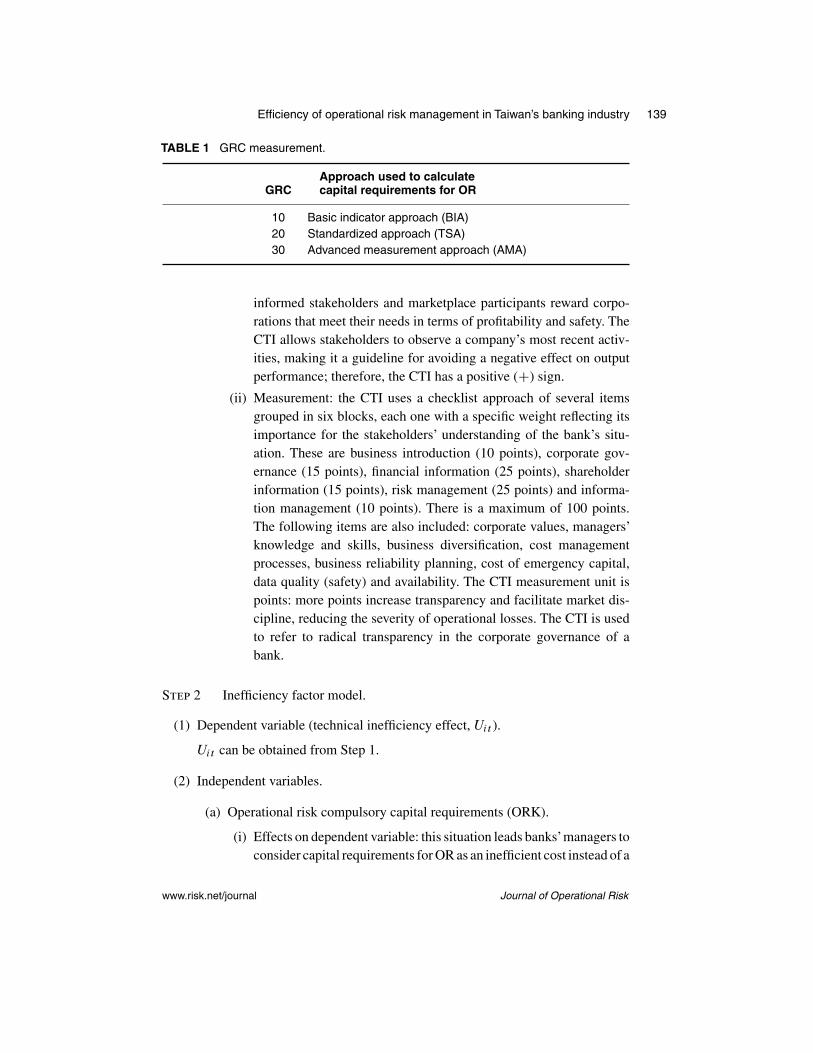
(ii) Measurement: for this research, consider that banks need to ful-fill general, qualitative and quantitative requirements before beingapproved to use any of the three approaches to calculate their capitalrequirements for OR. These requirements refer to the risk manage-ment and corporate governance knowledge and skills of the banks; thekind of approach that each bank used during the examination periodwill be defined as a measure of the variable GRC, as described inTable 1 on the facing page. The GRC measurement unit is points.More points allow the bank to reach a higher level of the OR assess-ment approach, which improves bank’s soundness through a betterGRC system. Therefore, it is expected that GRC will have a positivemeasure.
(c) Corporate transparency index (CTI).
(i) Effects on dependent variable: in a free market, transparency helpsreduce the occurrence and impact of operational events, since
Journal of Operational Risk www.risk.net/journal
Efficiency of operational risk management in Taiwan’s banking industry 139
TABLE 1 GRC measurement.
Approach used to calculateGRC capital requirements for OR
10 Basic indicator approach (BIA)20 Standardized approach (TSA)30 Advanced measurement approach (AMA)
informed stakeholders and marketplace participants reward corpo-rations that meet their needs in terms of profitability and safety. TheCTI allows stakeholders to observe a company’s most recent activ-ities, making it a guideline for avoiding a negative effect on outputperformance; therefore, the CTI has a positive (C) sign.
(ii) Measurement: the CTI uses a checklist approach of several itemsgrouped in six blocks, each one with a specific weight reflecting itsimportance for the stakeholders’ understanding of the bank’s situ-ation. These are business introduction (10 points), corporate gov-ernance (15 points), financial information (25 points), shareholderinformation (15 points), risk management (25 points) and informa-tion management (10 points). There is a maximum of 100 points.The following items are also included: corporate values, managers’knowledge and skills, business diversification, cost managementprocesses, business reliability planning, cost of emergency capital,data quality (safety) and availability. The CTI measurement unit ispoints: more points increase transparency and facilitate market dis-cipline, reducing the severity of operational losses. The CTI is usedto refer to radical transparency in the corporate governance of abank.
Step 2 Inefficiency factor model.
(1) Dependent variable (technical inefficiency effect, Uit ).
Uit can be obtained from Step 1.
(2) Independent variables.
(a) Operational risk compulsory capital requirements (ORK).
(i) Effects on dependent variable: this situation leads banks’managers toconsider capital requirements for OR as an inefficient cost instead of a
www.risk.net/journal Journal of Operational Risk
140 H.-H. Liu and M. Cortes
personal safeguard. Consequently, using the minimum legal require-ments to calculate accrued capital is a common practice within theindustry. In these circumstances, higher OR capital requirementsbecome inefficiency factors. This issue was studied by Campbelland Fraser (2011), who found a notable difference in ORK betweenbanks using BIA, TSA and AMA to calculate OR. Banks usingBIA have the highest requirements but maintain low levels of GRCand remain exposed to OR events, transforming the capital require-ment into an inefficiency factor rather than a buffer tool. Further,Van den Heuvel (2008) found that capital requirements reduce theability of banks to create liquidity, and Podlich and Wedow (2011)found that regulatory pressures induce banks to increase their capitalbut do not affect the level of risk. Therefore, a positive sign (C) isexpected.
(ii) Measurement: most banks do not make any effort to calculate theirspecial ORK needs and instead just multiply their OR assessmentcalculations by 8%, which is the Financial Services Commission’s(FSC’s) minimum regulatory requirement (except for banks thatpresent evidence of control or mitigation strategies that work ascapital buffers, allowing the bank to hold a lower value). In thispaper, we obtain each bank’s ORK by multiplying the bank’s totalcapital by 8%, based on its OR assessment. Increased regulationnot only increases operational and opportunity costs but also cre-ates a moral hazard for those banks that feel safer just because theyfulfill the requirements. Consequently, we employ banks’ ORK asa measure of this inefficiency factor. Its measurement unit is NTdollars.
(b) Leniency (LEN).
(i) Effects on dependent variable: for the top 100 banks in the world, thetotal number of operational events in the year is used as a measureof their leniency. The actual operational losses reported are largelyunpredictable, both in number and total scale. Larger banks tend tosuffer more, although the causality is not strong, and the averagesize of each loss is uncorrelated with the overall size of the bank(as measured by Tier 1 capital levels). There is also little correlationbetween the size of the losses reported from year to year. In addition,there is no significant causality between the size of losses and thebank’s level of OR capital, which emphasizes how much total ORlosses are affected by single rare but extreme loss events. That is
Journal of Operational Risk www.risk.net/journal
Efficiency of operational risk management in Taiwan’s banking industry 141
the reason why this factor is considered out of banks’ control anddoes not need to be adjusted or weighted by companies’ sizes, whileleniency tends to increase their value, as well as the banks’ technicalinefficiency; therefore, a positive sign (C) is expected.
(ii) Measurement: we should highlight that the leniency measurementunit is distinct from the GRC measurement. They are considered astwo different dimensions, ie, they are measured by different variables.It is true that high GRC does not mean low leniency, and vice versa.This situation is similar to the two-factor theory (Herzberg 1965),ie, no satisfaction does not mean unsatisfied. Hence, we considerleniency and GRC as two different dimensions here.
This also indicates that, for our hypothesis setups, (H6) is notexactly the inverse of (H3). It is necessary to identify (H6) in thispaper, and it can also be justified by the goodness-of-fit of theestimated model we construct and compute.
(c) Opacity (OPA).
(i) Effects on dependent variable: the total number of operational lossesin the year is used to measure the technical inefficiency derivedfrom blurriness in a bank’s operations in the top 100 banks in theworld. OPA helps to hide weaknesses, mistakes, failures, crimes andother risky activities. This increases the provability of single rarebut extreme loss events, which account for the largest amount ofoperational losses, thus bloating technical inefficiency. Therefore, apositive sign (C) is expected.
(ii) Measurement: in this paper, we use the measure of outstandingdeposits described by Uchida and Satake (2009) as an opacity vari-able (OPA), which drops with the general population’s confidence inthe bank. The OPA measurement unit is NT dollars. A lower levelof outstanding deposits increases a bank’s capital cost, because weuse outstanding deposits as a measure of opacity; therefore, a nega-tive sign (�) is expected. In addition, the withdrawal of outstandingdeposits may, among other effects triggered by opacity, deteriorate abank’s working capital and weaken savers’ confidence. As a result, itreduces a bank’s public ability to discover potential dangers for thecompany, amplifying its exposure and swelling the severity of suchdangers.
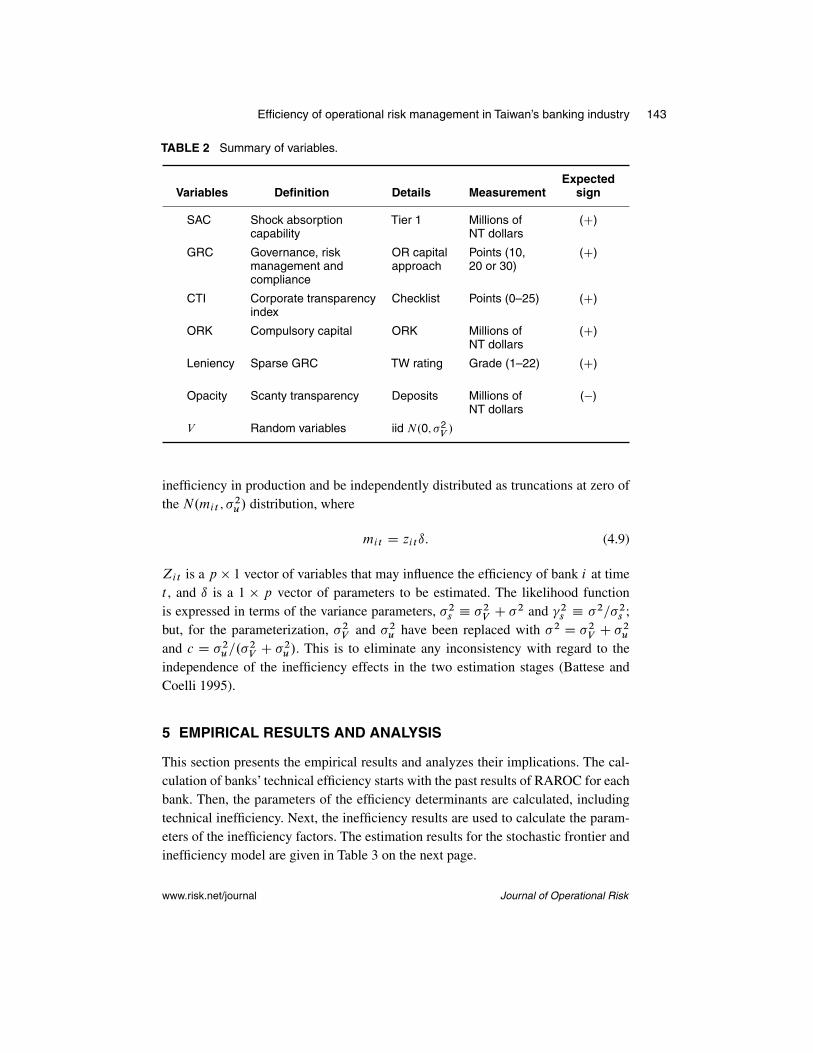
Based on the above information, the variables’ acronyms, definitions, details,measurements and expected signs are summarized in Table 2 on page 143.
www.risk.net/journal Journal of Operational Risk
142 H.-H. Liu and M. Cortes
4.3 Data collection and estimation method
4.3.1 Data collection
The scope of our research is panel data on bank performance, OR management andinefficiency factors associated with the statistical population of thirty-seven banks inTaiwan from 2008 to 2010. Due to the impact of the financial industry on the economy,there is a regulatory framework that facilitates finding reliable information; however,OR was not a requirement before 2008. Under the current supervisory regulation,all financial institutions must have ORM systems, so it was possible for us to obtaininformation for all thirty-seven Taiwanese banks, apart from Chinfon Bank, whichclosed in 2009, and HSBC, which took its place in 2010. It would not be fair tocompute their data as the same bank; therefore, only thirty-six banks were analyzed.At the time of writing, our samples are the largest possible, considering the issues ofdata availability.1
4.3.2 Estimation method
The method of maximum likelihood estimation (MLE) is proposed for simultaneousestimation of the parameters of the stochastic frontier and the model for the technicalinefficiency effects. The computer program Frontier 4.1, developed by Tim Coelli,was used to obtain MLEs of a subset of the stochastic frontier production function forbalanced panel data from thirty-six Taiwanese banks between 2008 and 2010, with atotal of 108 observations that have firm effects assumed to be distributed as truncatednormal random variables and are permitted to vary systematically with time. Theproducts of the individual probabilities intervene when independent observations arecombined in the calculation of the likelihood function, complicating the estimation,which leads us to use logarithms that transform the products into additions and thequotients into subtractions. Thus, the dependent variable is the natural logarithm ofthe production (RAROC) of the i th firm in the t th time period. Xit is a vector oftransformation of the managerial variables of the i th firm in the t th time period, andUi are nonnegative random variables, which are assumed to account for technical
1 The data used in this paper is mainly from the Financial Supervisory Commission Republic of China(www.fsc.gov.tw/ch/index.jsp). However, some important variables are unpublished and cannot beretrieved from any database or website. Hence, we had to select some variables that were similarto or derived from other variables but probably not as good as the model we had in mind at thebeginning. Therefore, although the needed data was unavailable, the final variables chosen for ourexperiment are complete. In addition, some of the data was computed by the authors; readers mayrequest data from the authors if they are considering further research. Even though some of the datahas been computed by the authors, the conclusion of our empirical studies is reasonably similar tothe results using realistic situations in Taiwan. Hence, the justification of the proposed data can beaccepted.
Journal of Operational Risk www.risk.net/journal
Efficiency of operational risk management in Taiwan’s banking industry 143
TABLE 2 Summary of variables.
ExpectedVariables Definition Details Measurement sign
SAC Shock absorption Tier 1 Millions of (C)capability NT dollars
GRC Governance, risk OR capital Points (10, (C)management and approach 20 or 30)compliance
CTI Corporate transparency Checklist Points (0–25) (C)index
ORK Compulsory capital ORK Millions of (C)NT dollars
Leniency Sparse GRC TW rating Grade (1–22) (C)
Opacity Scanty transparency Deposits Millions of (�)NT dollars
V Random variables iid N.0; �2V/
inefficiency in production and be independently distributed as truncations at zero ofthe N.mit ; �2u/ distribution, where
mit D zitı: (4.9)
Zit is a p � 1 vector of variables that may influence the efficiency of bank i at timet , and ı is a 1 � p vector of parameters to be estimated. The likelihood functionis expressed in terms of the variance parameters, �2s � �
2V C �
2 and �2s � �2=�2s ;but, for the parameterization, �2V and �2u have been replaced with �2 D �2V C �
2u
and c D �2u=.�2V C �
2u/. This is to eliminate any inconsistency with regard to the
independence of the inefficiency effects in the two estimation stages (Battese andCoelli 1995).
5 EMPIRICAL RESULTS AND ANALYSIS
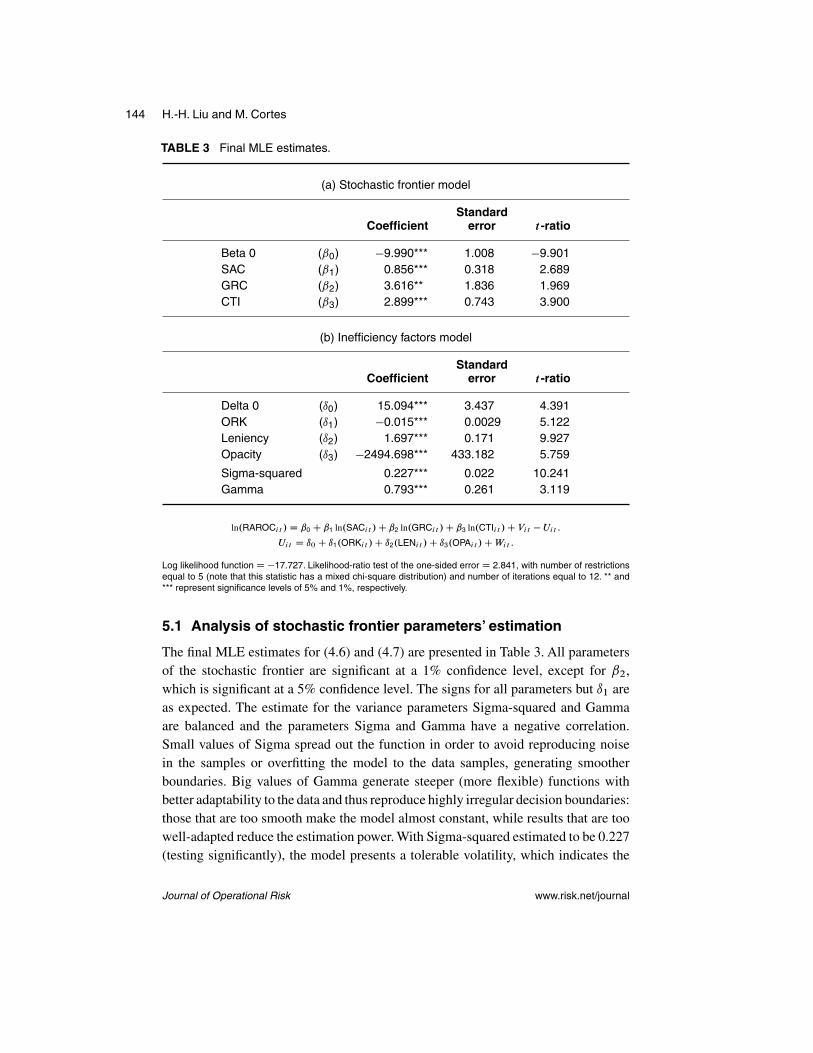
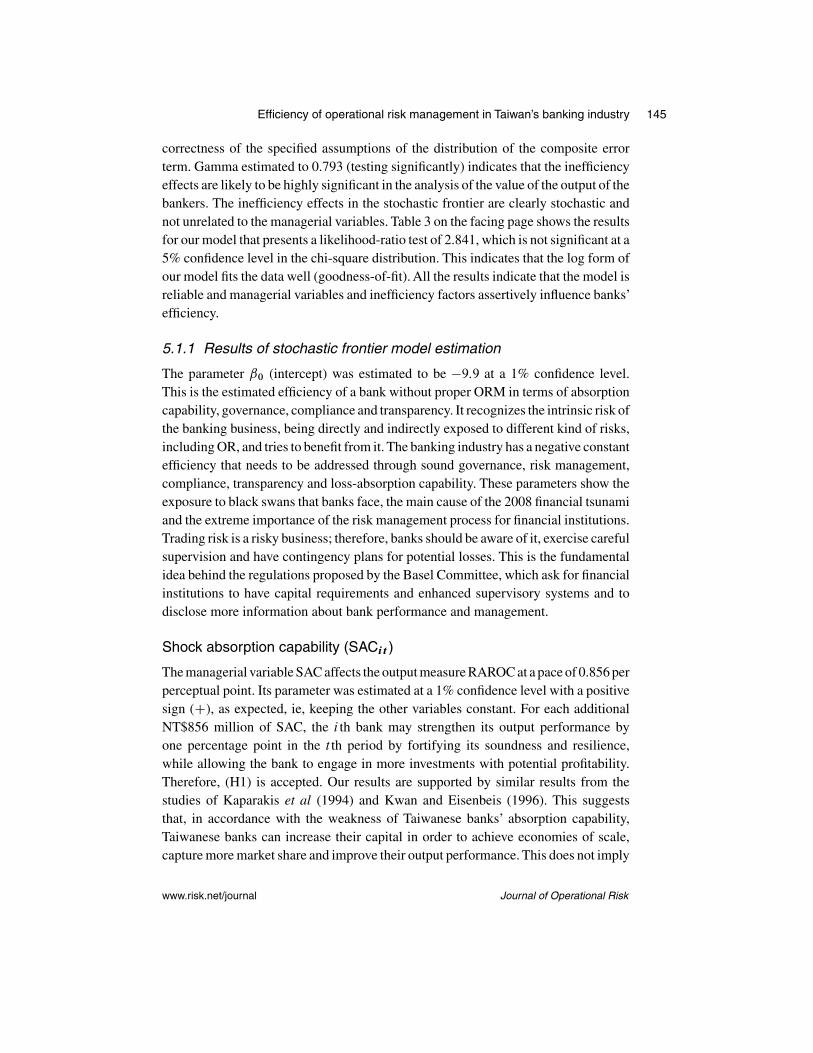
This section presents the empirical results and analyzes their implications. The cal-culation of banks’ technical efficiency starts with the past results of RAROC for eachbank. Then, the parameters of the efficiency determinants are calculated, includingtechnical inefficiency. Next, the inefficiency results are used to calculate the param-eters of the inefficiency factors. The estimation results for the stochastic frontier andinefficiency model are given in Table 3 on the next page.
www.risk.net/journal Journal of Operational Risk
144 H.-H. Liu and M. Cortes
TABLE 3 Final MLE estimates.
(a) Stochastic frontier model
StandardCoefficient error t-ratio
Beta 0 (ˇ0) �9.990*** 1.008 �9.901SAC (ˇ1) 0.856*** 0.318 2.689GRC (ˇ2) 3.616** 1.836 1.969CTI (ˇ3) 2.899*** 0.743 3.900
(b) Inefficiency factors model
StandardCoefficient error t-ratio
Delta 0 (ı0) 15.094*** 3.437 4.391ORK (ı1) �0.015*** 0.0029 5.122Leniency (ı2) 1.697*** 0.171 9.927Opacity (ı3) �2494.698*** 433.182 5.759
Sigma-squared 0.227*** 0.022 10.241Gamma 0.793*** 0.261 3.119
ln.RAROCit / D ˇ0 C ˇ1 ln.SACit /C ˇ2 ln.GRCit /C ˇ3 ln.CTIit /C Vit �Uit :
Uit D ı0 C ı1.ORKit /C ı2.LENit /C ı3.OPAit /CWit :
Log likelihood function D �17.727. Likelihood-ratio test of the one-sided error D 2.841, with number of restrictionsequal to 5 (note that this statistic has a mixed chi-square distribution) and number of iterations equal to 12. ** and*** represent significance levels of 5% and 1%, respectively.
5.1 Analysis of stochastic frontier parameters’ estimation
The final MLE estimates for (4.6) and (4.7) are presented in Table 3. All parametersof the stochastic frontier are significant at a 1% confidence level, except for ˇ2,which is significant at a 5% confidence level. The signs for all parameters but ı1 areas expected. The estimate for the variance parameters Sigma-squared and Gammaare balanced and the parameters Sigma and Gamma have a negative correlation.Small values of Sigma spread out the function in order to avoid reproducing noisein the samples or overfitting the model to the data samples, generating smootherboundaries. Big values of Gamma generate steeper (more flexible) functions withbetter adaptability to the data and thus reproduce highly irregular decision boundaries:those that are too smooth make the model almost constant, while results that are toowell-adapted reduce the estimation power. With Sigma-squared estimated to be 0.227(testing significantly), the model presents a tolerable volatility, which indicates the
Journal of Operational Risk www.risk.net/journal
Efficiency of operational risk management in Taiwan’s banking industry 145
correctness of the specified assumptions of the distribution of the composite errorterm. Gamma estimated to 0.793 (testing significantly) indicates that the inefficiencyeffects are likely to be highly significant in the analysis of the value of the output of thebankers. The inefficiency effects in the stochastic frontier are clearly stochastic andnot unrelated to the managerial variables. Table 3 on the facing page shows the resultsfor our model that presents a likelihood-ratio test of 2.841, which is not significant at a5% confidence level in the chi-square distribution. This indicates that the log form ofour model fits the data well (goodness-of-fit). All the results indicate that the model isreliable and managerial variables and inefficiency factors assertively influence banks’efficiency.
5.1.1 Results of stochastic frontier model estimation
The parameter ˇ0 (intercept) was estimated to be �9:9 at a 1% confidence level.This is the estimated efficiency of a bank without proper ORM in terms of absorptioncapability, governance, compliance and transparency. It recognizes the intrinsic risk ofthe banking business, being directly and indirectly exposed to different kind of risks,including OR, and tries to benefit from it. The banking industry has a negative constantefficiency that needs to be addressed through sound governance, risk management,compliance, transparency and loss-absorption capability. These parameters show theexposure to black swans that banks face, the main cause of the 2008 financial tsunamiand the extreme importance of the risk management process for financial institutions.Trading risk is a risky business; therefore, banks should be aware of it, exercise carefulsupervision and have contingency plans for potential losses. This is the fundamentalidea behind the regulations proposed by the Basel Committee, which ask for financialinstitutions to have capital requirements and enhanced supervisory systems and todisclose more information about bank performance and management.
Shock absorption capability (SACit)
The managerial variable SAC affects the output measure RAROC at a pace of 0.856 perperceptual point. Its parameter was estimated at a 1% confidence level with a positivesign (C), as expected, ie, keeping the other variables constant. For each additionalNT$856 million of SAC, the i th bank may strengthen its output performance byone percentage point in the t th period by fortifying its soundness and resilience,while allowing the bank to engage in more investments with potential profitability.Therefore, (H1) is accepted. Our results are supported by similar results from thestudies of Kaparakis et al (1994) and Kwan and Eisenbeis (1996). This suggeststhat, in accordance with the weakness of Taiwanese banks’ absorption capability,Taiwanese banks can increase their capital in order to achieve economies of scale,capture more market share and improve their output performance. This does not imply
www.risk.net/journal Journal of Operational Risk
146 H.-H. Liu and M. Cortes
that a larger size means greater efficiency; as we can see in Table 5 on page 150, King’sTown Bank has a very high RAROC, even though it is a small bank.
Governance, risk management and compliance (GRCit)
The managerial variable GRC affects the output measure RAROC at a pace of 3.6 perperceptual point. Its parameter was estimated at a 5% confidence level with a positivesign (C), as expected, ie, keeping the other variables constant. Each upgrading of3.6 points in the GRC score may improve bank i ’s efficiency at time t by 1% bybracing a bank’s managerial skills, developing its processes, reducing its mistakesand amplifying its endurance. Therefore, (H2) is accepted. The results of this paperare supported by similar results in Switzer (2007), who found that Canadian firmssubject to corporate governance, risk management and compliance experienced anincremental increase in market valuation. Our findings imply that since Taiwanesebanks have poor OR assessment systems they are required to upgrade their GRC inorder to control and mitigate their risks, gain competitiveness and improve efficiency.We also suggest that the Financial Examination Bureau (FEB) in Taiwan work handin hand on its financial rating (CAMELS) with each bank in order to foster banks’efficiency. The empirical results suggest that Taiwanese banks need to implement moredeveloped OR assessment approaches, such as AMA models. These models, beingcustomized, enable banks to better know themselves and manage their OR based onproper information and firm-interest decisions. More generally speaking, CAMELSratings are summary measures of the private supervisory information gathered duringonsite bank examinations on (C) capital adequacy, (A) asset quality, (M) management,(E) earnings, (L) liquidity and (S) sensitivity to market risk. All of these containinformation useful for both the supervisory and public monitoring of commercialbanks.
Transparency .CTIit/
The managerial variable CTI affects the output measure RAROC at a pace of 2.89per perceptual point. Its parameter was estimated at a 1% confidence level with apositive sign (C), as expected. In other words, each 2.89 items disclosed by thebank may enhance its operational efficiency by 1% by reducing the company’s riskthrough market discipline and improvements in risk management, which are requiredto generate, validate, disclose and update those items that are important contributionstoward improving efficiency. Therefore, (H3) is accepted. Our results are supportedby similar findings in Nier and Baumann (2006) and Belkhir (2013). This implies that,because of the opaqueness of the Taiwanese banking industry, Taiwanese banks needto improve their transparency in order to reduce their capital costs and enhance theiroperational efficiency. Also, the FSC should enhance their disclosure requirements,
Journal of Operational Risk www.risk.net/journal
Efficiency of operational risk management in Taiwan’s banking industry 147
because in a high-disclosure regime banks are less likely to take excessive risks (Nierand Baumann 2006), and when losses happen they are less costly (Peek and Rosengren2001). The reason for this is that the worst-run banks will see their funding base shrinkas a result of market discipline, and thus situations will not deteriorate to disaster levelin the first place. The key to market discipline, however, is information disclosure andtransparency. Cordella and Yeyati (2002) show that managers will choose lower riskex ante when the risk profile is observable to outsiders and ex post when a bankingcrisis occurs. For example, Hoggarth et al (2005) argue that disclosures reduce thelikelihood of runs on fundamentally sound banks.
5.1.2 Results of inefficiency factor model estimation
The parameter ı0 was estimated to 15.09 at a 1% confidence level, ie, there is latentoperational inefficiency in the banking business.As well asˇ0, it recognizes the natureof the business and the urgency of proper control and mitigation strategies to addressthe inefficiency factors.
Operational risk compulsory capital requirements (ORKit)
The inefficiency factor ORK affects the technical inefficiency measure Uit at a paceof �0:0146 per percentage point. Its parameter was estimated at a 1% confidencelevel with negative sign (�), ie, each additional NT$15 million may reduce a bank’stechnical inefficiency by 1%. This is contrary to expectations, suggesting that ORKcontributes negatively to banks’ inefficiency instead of increasing it, as was proposedoriginally. If we discard the characterization of ORK as an inefficient expense forTaiwanese banks’ current states of development, even when most of the time thecalculations do not answer to the specificity of each bank, its mere existence createsa buffer that would not otherwise be there. Therefore, (H4) is rejected. This resultis supported by similar results in Lindquist (2004) and Heid (2007). This result alsoimplies that Taiwanese banks do not need to rashly cut their ORK in an attempt toreduce costs, as this could raise its inefficiency by weakening their capital buffers,which serve as self-insurance against failures. A reason for this contradictory signcould be that when banks employ BIA to calculate ORK, their value is stronglycorrelated to a bank’s gross income, sometimes reflecting the evolution of “sales”instead of the OR exposure. Most Taiwanese banks use BIA with a lackadaisicalcalculation of its real exposures.
Leniency (LENit)
The inefficiency factor LEN affects the inefficiency measure Uit at a pace of 1.69 perperceptual point. Its parameter was estimated at 1% confidence level with positive
www.risk.net/journal Journal of Operational Risk
148 H.-H. Liu and M. Cortes
sign (C), as expected; ie, each 1.69 rating downgrade may boost a bank’s ineffi-ciency by 1%, shrinking its governance, risk management processes and regulationcompliance, and potentially causing the proliferation of errors and process failuresthat could boost the frequency of operational events. National and international agen-cies react to this augmentation in the OR by increasing the cost of capital for thebank in terms of interest spread, directly impacting a bank’s income statement. Thus,(H5) is accepted. The results of this paper are supported by similar results in Bellottiet al (2011) and Bannier and Hirsch (2010). This implies that the Taiwan RatingsCorporation plays an important role in the supervisory process; therefore, Taiwanesebanks need to tighten up their leniency with regard to the direct concerns of rat-ing agencies and creditors in order to reduce their spread and avoid an increase ininefficiency.
Opacity (OPAit)
The inefficiency factor OPA affects the inefficiency measureUit at a pace of�2496:9per perceptual point. Its parameter was estimated at a 1% confidence level with neg-ative sign (�), as expected; ie, each NT$2494.698 million withdrawal of outstandingdeposits may, among other effects triggered by opacity, increase a bank’s inefficiencyby 1% by increasing the bank’s cost of capital, deteriorating its working capital orweakening savers’ confidence. It reduces a company’s and the public’s ability todiscover potential dangers for the company, amplifying its exposure to black swansand increasing the severity of such dangers. Therefore, (H6) is accepted. Our resultsare supported by similar results in Park (1995), Goyal (2005), Maechler and McDill(2006), Chen and Hasan (2006) and Uchida and Satake (2009), all of who found thatbank runs can serve as an efficient mechanism for disciplining banks. Our resultsalso imply that Taiwanese outstanding depositors are exercising market discipline,forcing opaque banks to guarantee their funds through insurance, raise their interestrates to maintain the resources and thereby swell opaque and risky banks’ inefficiency.However, the strength of market discipline is related to the transparency of bank riskchoices, proportion of uninsured liabilities in the bank’s balance sheet and extent ofthe regulation safety net.
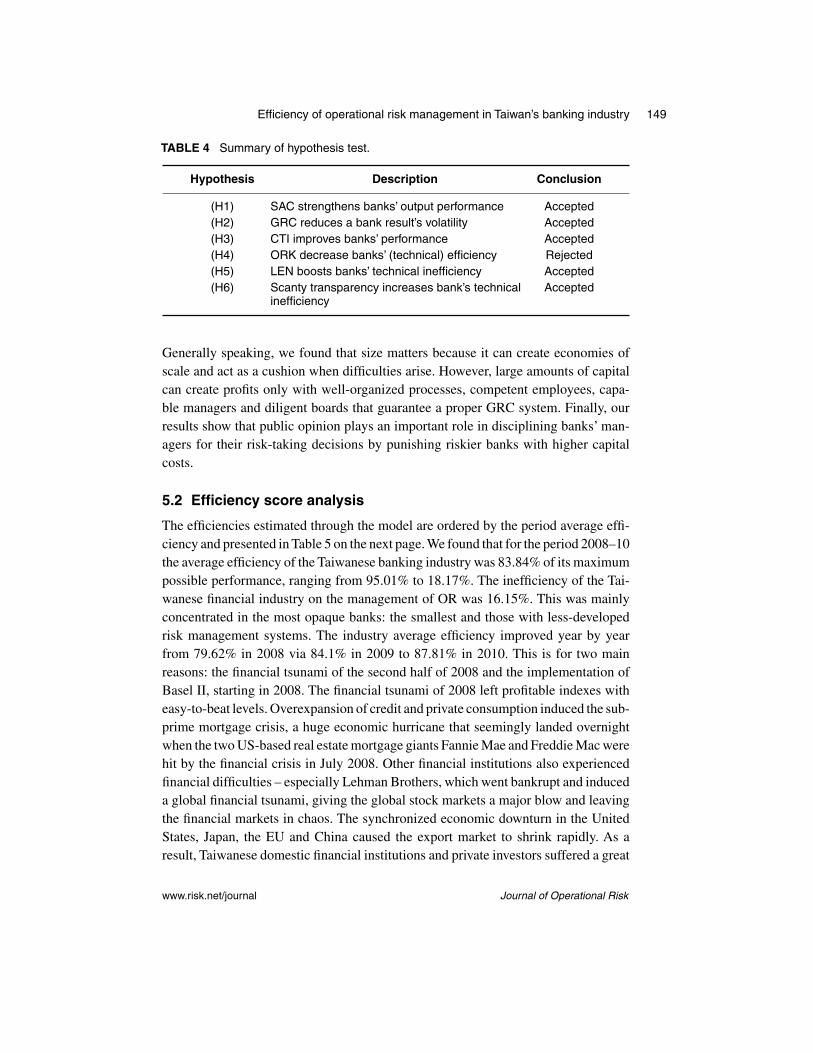
Based on the above discussions, the results of our operational efficiency modelpermit the acceptance of (H1), (H2) and (H3) about the positive relationship betweenBasel pillars and banking efficiency. The results of the inefficient model allow theacceptance of (H5) and (H6), but not (H4) due to the contrary sign. The hypotheses’test results are summarized in Table 4 on the facing page. Table 4 shows that theresults of the stochastic frontier model supported all of our hypotheses except for(H4), which was still significant at a 1% confidence level, proving the consistencyof the Basel Accords and their importance for the soundness of the banking industry.
Journal of Operational Risk www.risk.net/journal
Efficiency of operational risk management in Taiwan’s banking industry 149
TABLE 4 Summary of hypothesis test.
Hypothesis Description Conclusion
(H1) SAC strengthens banks’ output performance Accepted(H2) GRC reduces a bank result’s volatility Accepted(H3) CTI improves banks’ performance Accepted(H4) ORK decrease banks’ (technical) efficiency Rejected(H5) LEN boosts banks’ technical inefficiency Accepted(H6) Scanty transparency increases bank’s technical Accepted
inefficiency
Generally speaking, we found that size matters because it can create economies ofscale and act as a cushion when difficulties arise. However, large amounts of capitalcan create profits only with well-organized processes, competent employees, capa-ble managers and diligent boards that guarantee a proper GRC system. Finally, ourresults show that public opinion plays an important role in disciplining banks’ man-agers for their risk-taking decisions by punishing riskier banks with higher capitalcosts.
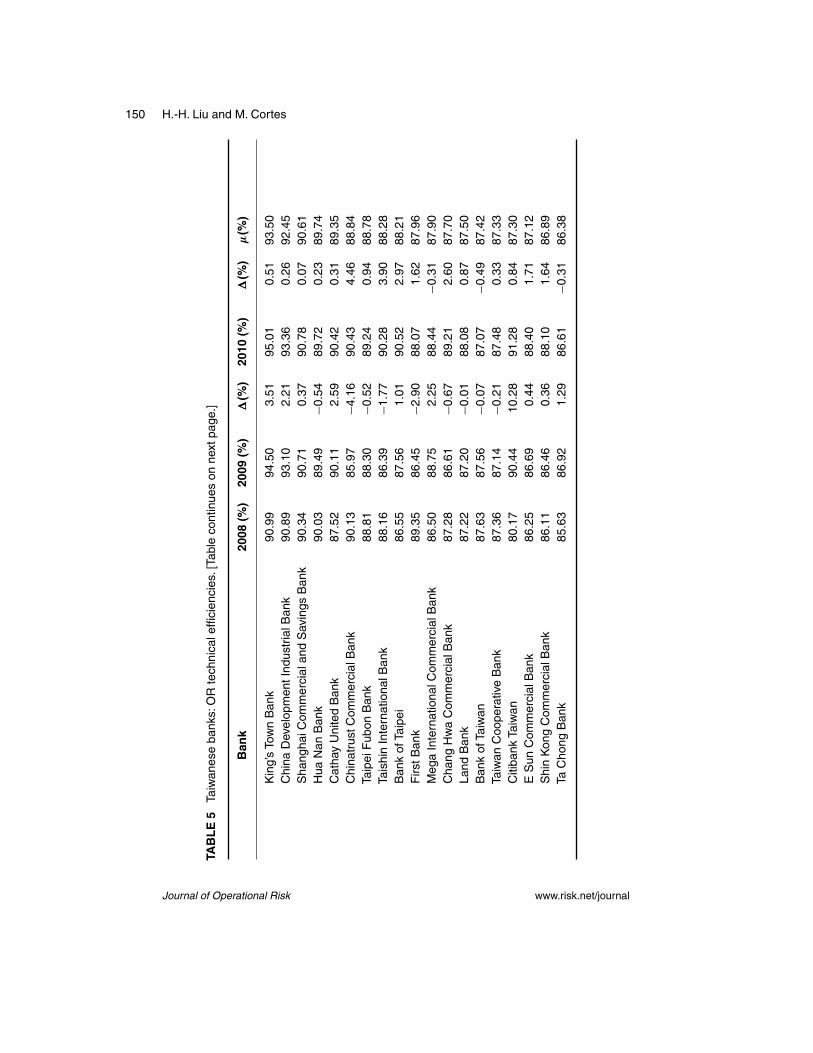
5.2 Efficiency score analysis
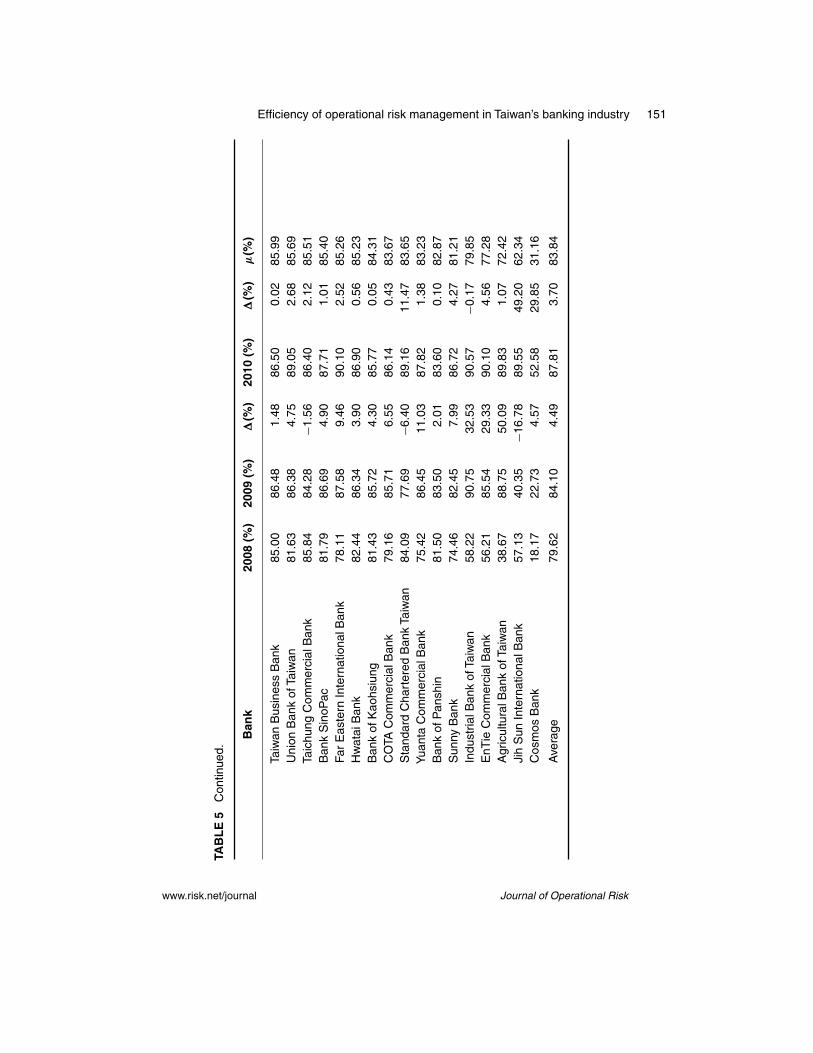
The efficiencies estimated through the model are ordered by the period average effi-ciency and presented in Table 5 on the next page. We found that for the period 2008–10the average efficiency of the Taiwanese banking industry was 83.84% of its maximumpossible performance, ranging from 95.01% to 18.17%. The inefficiency of the Tai-wanese financial industry on the management of OR was 16.15%. This was mainlyconcentrated in the most opaque banks: the smallest and those with less-developedrisk management systems. The industry average efficiency improved year by yearfrom 79.62% in 2008 via 84.1% in 2009 to 87.81% in 2010. This is for two mainreasons: the financial tsunami of the second half of 2008 and the implementation ofBasel II, starting in 2008. The financial tsunami of 2008 left profitable indexes witheasy-to-beat levels. Overexpansion of credit and private consumption induced the sub-prime mortgage crisis, a huge economic hurricane that seemingly landed overnightwhen the two US-based real estate mortgage giants Fannie Mae and Freddie Mac werehit by the financial crisis in July 2008. Other financial institutions also experiencedfinancial difficulties – especially Lehman Brothers, which went bankrupt and induceda global financial tsunami, giving the global stock markets a major blow and leavingthe financial markets in chaos. The synchronized economic downturn in the UnitedStates, Japan, the EU and China caused the export market to shrink rapidly. As aresult, Taiwanese domestic financial institutions and private investors suffered a great
www.risk.net/journal Journal of Operational Risk
150 H.-H. Liu and M. Cortes
TAB
LE
5Ta
iwan
ese
bank
s:O
Rte
chni
cale
ffici
enci
es.[
Tabl
eco
ntin
ues
onne
xtpa
ge.]
Ban
k20
08(%
)20
09(%
)�
(%)
2010
(%)
�(%
)�
(%)
Kin
g’s
Tow
nB
ank
90.9
994
.50
3.51
95.0
10.
5193
.50
Chi
naD
evel
opm
entI
ndus
tria
lBan
k90
.89
93.1
02.
2193
.36
0.26
92.4
5S
hang
haiC
omm
erci
alan
dS
avin
gsB
ank
90.3
490
.71
0.37
90.7
80.
0790
.61
Hua
Nan
Ban
k90
.03
89.4
9�
0.54
89.7
20.
2389
.74
Cat
hay
Uni
ted
Ban
k87
.52
90.1
12.
5990
.42
0.31
89.3
5C
hina
trus
tCom
mer
cial
Ban
k90
.13
85.9
7�
4.16
90.4
34.
4688
.84
Taip
eiF
ubon
Ban
k88
.81
88.3
0�
0.52
89.2
40.
9488
.78
Tais
hin
Inte
rnat
iona
lBan
k88
.16
86.3
9�
1.77
90.2
83.
9088
.28
Ban
kof
Taip
ei86
.55
87.5
61.
0190
.52
2.97
88.2
1F
irstB
ank
89.3
586
.45
�2.
9088
.07
1.62
87.9
6M
ega
Inte
rnat
iona
lCom
mer
cial
Ban
k86
.50
88.7
52.
2588
.44
�0.
3187
.90
Cha
ngH
wa
Com
mer
cial
Ban
k87
.28
86.6
1�
0.67
89.2
12.
6087
.70
Land
Ban
k87
.22
87.2
0�
0.01
88.0
80.
8787
.50
Ban
kof
Taiw
an87
.63
87.5
6�
0.07
87.0
7�
0.49
87.4
2Ta
iwan
Coo
pera
tive
Ban
k87
.36
87.1
4�
0.21
87.4
80.
3387
.33
Citi
bank
Taiw
an80
.17
90.4
410
.28
91.2
80.
8487
.30
ES
unC
omm
erci
alB
ank
86.2
586
.69
0.44
88.4
01.
7187
.12
Shi
nK
ong
Com
mer
cial
Ban
k86
.11
86.4
60.
3688
.10
1.64
86.8
9Ta
Cho
ngB
ank
85.6
386
.92
1.29
86.6
1�
0.31
86.3
8
Journal of Operational Risk www.risk.net/journal
Efficiency of operational risk management in Taiwan’s banking industry 151
TAB
LE
5C
ontin
ued.
Ban
k20
08(%
)20
09(%
)�
(%)
2010
(%)
�(%
)�
(%)
Taiw
anB
usin
ess
Ban
k85
.00
86.4
81.
4886
.50
0.02
85.9
9U
nion
Ban
kof
Taiw
an81
.63
86.3
84.
7589
.05
2.68
85.6
9Ta
ichu
ngC
omm
erci
alB
ank
85.8
484
.28
�1.
5686
.40
2.12
85.5
1B
ank
Sin
oPac
81.7
986
.69
4.90
87.7
11.
0185
.40
Far
Eas
tern
Inte
rnat
iona
lBan
k78
.11
87.5
89.
4690
.10
2.52
85.2
6H
wat
aiB
ank
82.4
486
.34
3.90
86.9
00.
5685
.23
Ban
kof
Kao
hsiu
ng81
.43
85.7
24.
3085
.77
0.05
84.3
1C
OTA
Com
mer
cial
Ban
k79
.16
85.7
16.
5586
.14
0.43
83.6
7S
tand
ard
Cha
rter
edB
ank
Taiw
an84
.09
77.6
9�
6.40
89.1
611
.47
83.6
5Yu
anta
Com
mer
cial
Ban
k75
.42
86.4
511
.03
87.8
21.
3883
.23
Ban
kof
Pan
shin
81.5
083
.50
2.01
83.6
00.
1082
.87
Sun
nyB
ank
74.4
682
.45
7.99
86.7
24.
2781
.21
Indu
stria
lBan
kof
Taiw
an58
.22
90.7
532
.53
90.5
7�
0.17
79.8
5E
nTie
Com
mer
cial
Ban
k56
.21
85.5
429
.33
90.1
04.
5677
.28
Agr
icul
tura
lBan
kof
Taiw
an38
.67
88.7
550
.09
89.8
31.
0772
.42
Jih
Sun
Inte
rnat
iona
lBan
k57
.13
40.3
5�
16.7
889
.55
49.2
062
.34
Cos
mos
Ban
k18
.17
22.7
34.
5752
.58
29.8
531
.16
Ave
rage
79.6
284
.10
4.49
87.8
13.
7083
.84
www.risk.net/journal Journal of Operational Risk
152 H.-H. Liu and M. Cortes
deal of financial loss, which was also partly attributable to the loss on investments inoffshore structured notes.
In 2009, to ensure financial market liquidity and prevent the economy from slump-ing any further, major countries proposed massive financial plans and eased theirmonetary policies. Under these measures, the global financial conditions stabilizedand stock markets started to rebound. In the latter half of 2009, world trade startedgrowing again following slow recovery in the global economy. In 2010, some busi-ness indicators reverted to precrisis standards. Emerging Asian economies enjoyedvast improvements in asset prices and a boom in equity and foreign exchange mar-kets. Taiwan’s export sales experienced consistent growth each quarter, thanks to themoderate recovery of developed economies and stronger growth observed in emerg-ing economies such as China. The liberalization on the cross-Strait economic policyand reduction of the inheritance tax caused domestic investments and consumption tothrive, thanks to the influx of foreign capital and shifting of Taiwanese capital back toTaiwan. Taiwan’s economic growth rate for 2010 was 10.82%, according to statisticspublished by the Directorate-General of Budget,Accounting and Statistics (DGBAS),due to the support of domestic and foreign demand.
The Basel II framework was approved in 2007 and implemented on January 1,2008. The FSC also implemented changes to banks’ minimum capital requirements,risk management systems and their disclosure of financial indicators and corporatepractice. These capital requirements focussed on the quality of equity and assets andled to a jump of 11.69% on the total Tier 1 of the banking industry between 2008and 2010: an increase from NT$1466 billion to NT$1637 billion. Banks were alsorequired by law to assess their OR and to implement OR management systems andstrategies. However, most just used the basic indicator approach, and a big gap inknowledge and expertise on the use of ORM tools still exists. The FSC established astandard format for corporate governance, business reviews, financial highlights andrisk management reports in which banks must disclose some of the items included inthe CTI of this study. Other items disclosed by international banks started to be revisedby investors and rating agencies, leading to important improvements in transparencywithin the industry.
Generally speaking, Table 5 on page 150 shows that banking efficiency improvedyear by year in Taiwan. King’s Town Bank was the most efficient bank during thethree periods studied (2010, 95.10%; 2009, 94.50%; 2008, 90.99%), followed by theChina Development Industrial Bank (2010, 93.36%; 2009, 93.10%; 2008, 90.89%).Even these banks’ lowest performances in 2008 surpassed the others’ efficiencies,except Citibank Taiwan in 2010 (91.28%). The least efficient bank over all threeyears was Cosmos Bank (2008, 18.17%; 2009, 22.73%; 2010, 52.58%), followed bythe Agricultural Bank of Taiwan in 2008 (38.67%), Jih Sun International Bank in2009 (40.34%) and the Bank of Panshin in 2010 (83.60%).
Journal of Operational Risk www.risk.net/journal
Efficiency of operational risk management in Taiwan’s banking industry 153
6 CONCLUDING REMARKS
The purpose of this paper was to demonstrate that the implementation of OR man-agerial systems in accordance with Basel parameters can improve business efficiencyin terms of performance, soundness and resilience, creating a competitive advan-tage and adding value to banks. Based on our empirical results, we found that shockabsorption capability, governance, risk management with compliance assessment andtransparency all positively affect a bank’s operational efficiency. This demonstratesthat the three pillars of the Basel Accords have a positive and significant relationshipwith banks’ efficiency in terms of performance, soundness and resilience. These find-ings also indicate that sparse governance and scanty transparency, risk managementand compliance all boost technical inefficiency, demonstrating that scarce compli-ance with Basel principles creates technical inefficiencies that negatively influence abank’s performance, soundness and resilience.
We found that shock absorption capability strengthens banks’ operational effi-ciency, and Taiwanese banks with larger capital positions have stronger absorptioncapabilities. This makes further capitalization and/or mergers that may strengthena bank’s financial muscle desirable. We also found that supervisory and regulatoryreviews improve a bank’s operational efficiency. However, the Taiwanese supervi-sory authority still has a long way to go; for example, they will first have to finishthe Basel II structure implementation-like CAMELS rating, and then continue withBasel III challenges, which must be completed by 2018. Taiwanese banks also need toconsiderably improve their governance, risk management and compliance processesif they want to be competitive in an open economy. The main challenge for the indus-try is to finally achieve independence; individual banks will need to develop theirrisk management processes and strategies as fast as possible in order to achieve this.Our paper also signifies that market discipline enhances banks’ output performance,narrowing bankers’ risk appetite and reducing their supervision burden.
Our empirical results further demonstrated that scarce compliance with Basel prin-ciples creates technical inefficiencies that negatively influence a bank’s performance,soundness and resilience. We found that sparse GRC boosts technical inefficiency,not only because of the proliferation of internal operational events but also becauseof the negative external reaction to those situations, reflected especially in the creditspread. Likewise, we found that scanty transparency increases technical inefficiency,not only because of the increase in the amount of operational events, but also becauseof the external reaction in those situations, especially in the loss of public confidencereflected in withdrawals or even bank runs. In conclusion, in order to improve theiroperational efficiency, Taiwanese banks should strengthen their capital and at the sametime upgrade their OR assessment approach to a more advanced model that is bet-ter developed internally. All this should enhance and promote transparency, helping
www.risk.net/journal Journal of Operational Risk
154 H.-H. Liu and M. Cortes
banks to keep high levels of capital buffers and work toward maintaining better creditratings.
DECLARATION OF INTEREST
The authors report no conflicts of interest. The authors alone are responsible for thecontent and writing of the paper.
REFERENCES
Bannier, C., and Hirsch, C. (2010). The economic function of credit rating agencies: whatdoes the watchlist tell us? Journal of Banking and Finance 34(12), 3037–3049.
Barth, J. R., Caprio Jr., G., and Levine, R. (2004). Bank regulation and supervision: whatworks best? Journal of Financial Intermediation 13(2), 205–248.
Battese, G., and Coelli, T. (1995). A model for technical inefficiency effects in a stochasticfrontier production function for panel data. Empirical Economics 20, 325–332.
Belkhir, M. (2013). Do subordinated debt holders discipline bank risk-taking? Evidencefrom risk management decisions. Journal of Financial Stability 9(4), 705–719.
Bellotti, T., Matousek, R., and Stewart, C. (2011). Are rating agencies’assignment opaque?Evidence from international banks. Expert Systems with Applications 38(4), 4206–4214.
Brewer, J. (1999). Divergence of a vector field. In Vector Calculus, Chapter 4, Wiley.Campbell, A., and Fraser, M. (2001). Capital counts. Incisive Media, 32–36.Chapelle, A., Crama, Y., Hauber, G., and Peters, J. (2005). Measuring and managing oper-
ational risk in the financial sector: an integrated framework. Working Paper. URL: http://ssrn.com/abstract=675186.
Chen, Y., and Hasan, I. (2006). The transparency of the banking system and the efficiencyof information-based bank runs. Journal of Financial Intermediation 15(3), 307–331.
Chernobai, A., Jorion, P., and Yu, F. (2011). The determinants of operational risk in U.S.financial institutions. Journal of Financial and Quantitative Analysis 46(6), 1683–1725.
Chiu, C. C. (2009). Effects of Financial Holding Company Act on bank efficiency andproductivity in Taiwan. Neurocomputing 72(16–18), 3490–3506.
Chiu,Y. H., and Chen,Y. C. (2009).The analysis of Taiwanese bank efficiency: incorporatingboth external environment risk and internal risk. Economic Modelling 26(2), 456–463.
Committee of European Banking Supervisors (CEBS) (2006). Guidelines on the applica-tion of the supervisory review process under Pillar 2. Internal Governance Guidelines,European Banking Authority.
Cope, E., Mignola, G., Antonini, G., and Ugoccioni, R. (2009). Challenges in measuringoperational from loss data. Working Paper, Intesa SanPaolo, Zurich Research Lab.
Cope, E. W., Piche, M. T., and Walter, J. S. (2012). Macroenvironmental determinants ofoperational loss severity. Journal of Banking and Finance 36(5), 1362–1380.
Cordella, T., andYeyati, E. (2002). Financial opening, deposit insurance, and risk in a modelof banking competition. European Economic Review 46(3), 471–485.
Embrechts, P., and Puccetti, G. (2007). Aggregating risk across matrix structured loss data:the case of operational risk. Applied Probability Trust 3(2), 1–21.
Journal of Operational Risk www.risk.net/journal
Efficiency of operational risk management in Taiwan’s banking industry 155
Embrechts, P., Furrer, H., and Kaufmann, R. (2004). Quantifying regulatory capital foroperational risk. Derivatives Use, Trading and Regulation 9(3), 217–233.
Fang, C., and Lee, W. (2010).The measurement of capital for operational risk in Taiwanesecommercial banks. The Journal of Operational Risk 5(2), 79–102.
Goyal, V. (2005). Market discipline of bank risk: evidence from subordinated debt contracts.Journal of Financial Intermediation 14(3), 318–350
Guill, G. (2007). Bankers Trust and the birth of modern risk management. Working Paper,The Wharton School, University of Pennsylvania.
Hausman, J., and McFadden, C. (1984). Specification tests for the multinomial logit model.Econometrica 52(6), 1219–1240.
Heid, F. (2007).The cyclical effects of the Basel II capital requirements. Journal of Bankingand Finance 31(12), 3885–3900.
Herzberg, F. (1965). The motivation to work among Finnish supervisors. PersonnelPsychology 18(4), 393–402.
Hoggarth, G., Jackson, P., and Nier, E. (2005). Banking crises and the design of safetynets. Journal of Banking and Finance 29(1), 143–159.
Huang, R. (2006). Bank disclosure index: global assessment of bank disclosure practices.Working Paper, International Finance Corporation.
ISO Working Group (2009). ISO CD31000: risk management. Committee Draft, Interna-tional Organization for Standardization.
Kao, C., and Liu, S. (2009). Stochastic data envelopment analysis in measuring the effi-ciency of Taiwan commercial banks. European Journal of Operational Research 196(1),312–322.
Kaparakis, E. I., Miller, S. M., and Noulas, A. G. (1994). Short-run cost inefficiency ofcommercial banks: a flexible stochastic frontier approach. Journal of Money, Credit andBanking 26(4), 875–893.
Kraft, E., and Tirtiroglu, D. (1998). Bank efficiency in Croatia: a stochastic-frontier analysis.Journal of Comparative Economics 26(2), 282–300.
Kumbhakar, S., and Knox Lovell, C. (2000). Stochastic Frontier Analysis. CambridgeUniversity Press.
Kwan, S., and Eisenbeis, R. A. (1996). An analysis of inefficiencies in banking: a stochasticcost frontier approach. Federal Reserve Bank of San Francisco Economic Review 2,17–25.
Laeven, L., and Levine, R. (2009). Bank governance, regulation and risk taking. Journal ofFinancial Economics 93(2), 259–275.
Laxton, R. R. (1978).The measure of diversity. Journal of Theoretical Biology 70(1), 51–67.Lindquist, K. G. (2004). Banks’ buffer capital: how important is risk? Journal of International
Money and Finance 23(3), 493–513.Maechler, A.M., and McDill, K.M.(2006).Dynamic depositor discipline in US banks.Journal
of Banking and Finance 30(7), 1871–1898.Manic, I. (2007). Mathematical models for estimation of operational risk and risk manage-
ment. Masters Thesis, Univerzitet u Novom Sadu.Mester, L. J. (1996). A study of bank efficiency taking into account risk-preferences. Journal
of Banking and Finance 20(6), 1025–1045.Nal, O. (2006). Strategic behaviors in financial markets and the market discipline mecha-
nism. PhD Thesis, Rice University.
www.risk.net/journal Journal of Operational Risk

156 H.-H. Liu and M. Cortes
Nier, E., and Baumann, U. (2006). Market discipline, disclosure and moral hazard inbanking. Journal of Financial Intermediation 15(3), 332–361.
Park, S. (1995). Market discipline by depositors: evidence from reduced-form equations.Quarterly Review of Economics and Finance 35, 497–514.
Peek, J., and Rosengren, E. (2001). Determinants of the Japan premium: actions speaklouder than words. Journal of International Economics 53(2), 283–305.
Podlich, N., and Wedow, M. (2011).Credit contagion between financial systems.DiscussionPaper 2011,15, Discussion Paper Series 2: Banking and Financial Studies, DeutscheBundesbank.
Rao, A. (2005). Cost frontier efficiency and risk–return analysis in an emerging market.International Review of Financial Analysis 14(3), 283–303.
Rime, B. (2001). Capital requirements and bank behavior: empirical evidence for Switzer-land. Journal of Banking and Finance 25(4), 789–805.
Sinha, R. (2006). Regulation: the market for corporate control and corporate governance.Global Finance Journal 16(3), 264–282.
Standard & Poor’s (2008). Criteria: GAMMA Scores. Standard & Poor’s Equity ResearchServices GAMMA Department, USA.
Switzer, L. N. (2007). Corporate governance, Sarbanes-Oxley, and small-cap firm perfor-mance. Quarterly Review of Economics and Finance 47(5), 651–666.
Taleb, N. (2010). The Black Swan, 2nd edn. Penguin.Uchida, H., and Satake, M. (2009). Market discipline and bank efficiency. Journal of
International Financial Markets, Institutions and Money 19(5), 792–802.Universidad del Desarrollo (2010). Corporative Transparency Index. School of Communi-
cations, Inteligencia de Negocios, Santiago de Chile.Van den Heuvel, S. J. (2008). The welfare cost of bank capital requirements. Journal of
Monetary Economics 55(2), 298–320.
Journal of Operational Risk www.risk.net/journal