an assessment of the economic and environmental potential of biomass production in an agricultural...
TRANSCRIPT

ARTICLE IN PRESS
0264-8377/$ - se
doi:10.1016/j.la
�CorrespondE-mail addr
Land Use Policy 25 (2008) 533–549
www.elsevier.com/locate/landusepol
An assessment of the economic and environmental potential of biomassproduction in an agricultural region
Brett A. Bryana,�, John Warda, Trevor Hobbsb
aPolicy and Economic Research Unit, CSIRO Land and Water, PMB 2, Glen Osmond, South Australia 5064, AustraliabCooperative Research Centre for Plant-based Management of Dryland Salinity, Department of Water, Land and Biodiversity Conservation, Pasadena
Natural Resource Centre, 5 Fitzgerald Road, Pasadena, South Australia 5042, Australia
Received 15 August 2006; received in revised form 10 October 2007; accepted 11 November 2007
Abstract
The establishment of deep-rooted perennial species and their processing for biomass-based products such as renewable energy can
have benefits for both local and global scale environmental objectives. In this study, we assess the potential economic viability of biomass
production in the South Australian River Murray Corridor and quantify the resultant benefits for local and global scale environmental
objectives. We model the spatial distribution of economically viable biomass production in a Geographic Information System and
quantify the model sensitivity and uncertainty using Monte Carlo analysis. The total potentially viable area for biomass production
under the Most Likely Scenario is 360,728 ha (57.7% of the dryland agricultural area), producing over 3million tonnes of green biomass
per annum, with a total Net Present Value over 100 years of A$ 88 million. The salinity in the River Murray could be reduced by 2.65EC
(mS/cm) over a 100-year timeframe, and over 96,000 ha of land with high wind erosion potential could be stabilised over a much shorter
period. With sufficient generating capacity, our Most Likely Scenario suggests that economically viable biomass production could reduce
carbon emissions by over 1.7million tonnes per annum through the production of renewable energy and a reduced reliance on coal-based
electricity generation. Our analyses suggest that biomass production is a potentially viable alternative agricultural system that can have
substantial local scale environmental benefits with complimentary global scale benefits for climate change mitigation.
r 2007 Elsevier Ltd. All rights reserved.
Keywords: Biomass production; Economic incentives; Climate change; Landscape scale; Natural resource management; Spatial analysis
Introduction
In many human-dominated regions, development ofnatural resources has resulted in environmental degrada-tion (Vitousek et al., 1997), and from an anthropocentricperspective, less productive and resilient ecosystems.Development in the South Australian River MurrayCorridor (or simply the Corridor) has occurred primarilyfor agriculture, usually involving both the broad acreclearance of deep-rooted native vegetation and replacementwith shallow-rooted, rainfed annual crops and pastures.The effects of this large-scale land clearance commonlyresults in the degradation of biological, land, and waterresources (Williams and Saunders, 2005). Natural resource
e front matter r 2007 Elsevier Ltd. All rights reserved.
ndusepol.2007.11.003
ing author. Tel.: +618 8303 8581; fax: +61 8 8303 8582.
ess: [email protected] (B.A. Bryan).
management (NRM) actions such as the establishment ofdeep-rooted perennials are required over broad areas toameliorate degrading processes such as wind erosion andsalinity (INRM Group, 2003). Actions involve substantialeconomic costs but may also provide significant economicand environmental benefits.Most land tends to be under private ownership in
Australia’s agricultural regions. Hence, in order to achieveenvironmental objectives, NRM actions are often requiredby private landholders. NRM actions often involve asignificant establishment cost to landholders and there mayalso be a long-term loss of revenue from agriculturalproduction (opportunity cost). However, most of thebenefits are realised over long time periods and there isusually some uncertainty involved. The benefits to thelandholder resulting from NRM actions may be insufficientto compensate for incurred costs (Bryan et al., 2007).

ARTICLE IN PRESSB.A. Bryan et al. / Land Use Policy 25 (2008) 533–549534
Rather, benefits tend to accrue predominately off-farm tothe wider community although the beneficiaries rarelyshare the costs of remedial NRM actions. Thus, privatelandholders are reluctant to undertake investment in NRMactions on the scale required to mitigate the processes ofenvironmental degradation, and public agencies rarelyhave the funding required to offset these private costs.
Market-based policy instruments such as auctions, capand trade systems, levies, credit systems, offsets, trusts, andother instruments have been investigated for their ability toencourage on-ground environmental management worksby private landholders (Sterner, 2003). In contrast to policyapproaches using explicit directives, as a general rule,market-based instruments (MBI) use the price signals ofmarkets and market-like mechanisms to influence thechoices made by land managers. Rather than relying onregulations to identify the best course of action, individualsare able to select actions that best meet environmentalobjectives. The potential advantage of MBI approaches isthat through flexible decision making, they can achieveenvironmental goals at lower cost.
In the context of the South Australian River MurrayCorridor, however, an array of factors may potentiallyimpede market-based instruments from encouraging landmanagement actions at a sufficient scale required toachieve environmental objectives (Connor and Bryan,2005; Ward and Trengove, 2005). Substantial establish-ment costs incurred by private landholders are likely to bethe major impediment (Ward et al., 2005). Market-basedinstruments most likely to facilitate broad-scale NRMactions are those that yield economic returns to thelandholder that sufficiently compensate the establishmentand opportunity costs by introducing positive incomestreams realised within a few years of establishment.Biomass production that integrates with existing agricul-tural activities offers the potential to provide significanteconomic returns (Bennell et al., 2004).
Biomass production based on deep-rooted perennialspecies may also make substantial contributions toenvironmental objectives (Tolbert and Wright, 1998). Inthe Corridor study area, large-scale plantings of deep-rooted species for biomass production are expected to havelimited biodiversity benefits, but can mitigate processes ofsalinity and wind erosion. Biodiversity benefits are limitedbecause of the lack of biological diversity typically found inthe monoculture plantation and repeated disturbancecaused by regular harvesting. Conversely, the deep-rootedperennials can reduce groundwater recharge and conse-quent saline groundwater intrusion into the River Murray,thereby reducing the potential contribution of drylandareas to river salt load. Establishment of deep-rootedperennials may also eliminate the impact of wind erosionthrough the soil-binding effect of the roots and themitigation of wind speed by standing biomass (Cleughand Bennell, 2002). In addition to local-scale environ-mental benefits, the production of renewable energy frombiomass can have global scale impacts (Schneider and
McCarl, 2003; Van Ierland and Lansink, 2003) in the formof climate change mitigation through the reduction incarbon emissions associated with coal-based energy gen-eration (IPCC, 1996; Sands and Leimbach, 2003). We notethat other environmental impacts of coal-based electricitygeneration such as sulphur, nitrogen, and mercury emissioncan also be avoided through biomass-based generationalthough we have not included these additional environ-mental benefits in this analysis.In this paper, we jointly examine the economic viability
and environmental benefits of biomass production in theCorridor study area based on deep-rooted perennialEucalyptus species. The focus of this analysis is thecommercial production of biomass for the supply offeedstock to an integrated tree processing plant andsubsequent processing into renewable electricity, activatedcharcoal, and eucalyptus oil. We conduct a detailed,spatially explicit analysis of the economic viability ofbiomass production in the Corridor study area. Uncer-tainty is made explicit through sensitivity analyses. Thelocal environmental benefits of biomass production arequantified in terms of wind erosion and salinity mitigation,as are the global-scale benefits for climate change throughcarbon emission reductions associated with the generationof renewable energy. This analysis enables the integrationof both economic and environmental processes that areheterogeneous over the landscape. The high spatialresolution enables the detailed analysis of farm-scaleproduction economics along with the analysis of land-scape-scale soil and hydrological processes such as winderosion and salinisation. In addition, we discuss the policystrategies and institutional design required to encouragethe adoption of biomass production at scales that makesubstantial contributions towards local and global scaleenvironmental objectives.
Assessing the economic and environmental benefits of
biomass
Recently, interest in the production of biomass andbioenergy has increased substantially in response to thethreat of climate change and the need to reduce carbonemissions (Hoffert et al., 2002; Steininger and Voraberger,2003; Walsh et al., 2003; Nord-Larsen and Talbot, 2004).In a global analysis of biomass energy futures, Hoogwijket al. (2005) estimate that biomass has the technicalpotential to supply energy at 2050 and 2100 equivalent toseveral times that currently is derived from crude oil.Renewable energy can be generated from a variety ofbiomass feedstock. These include both residues of agricul-tural crops such as sugarcane, corn and wheat (Askew andHolmes, 2002; Gallagher et al., 2003), and purpose-growntree species such as Salix spp., Populus spp., Eucalyptus
spp., and Acacia spp. (Varela et al., 2001) and herbaceousspecies (Hallam et al., 2001) such as switchgrass (Panicum
virgatum L.).

ARTICLE IN PRESSB.A. Bryan et al. / Land Use Policy 25 (2008) 533–549 535
The role of biomass production in environmentalmanagement has been the subject of some investigation.Biomass production has been found to have potential forenhancing post-disturbance landscapes such as contami-nated lands (Goor et al., 2001; Vandenhove et al., 2002)and mining sites (Bungart et al., 2000). Biomass is alsoexpected to have significant potential for enhancingagricultural landscapes (Updegraff et al., 2004; Skarbackand Becht, 2005). Specifically, the results of Bell (1999) andLefroy and Stirzaker (1999) suggest that biomass produc-tion based on deep-rooted perennial species can have abeneficial effect in restoring soil water balance and inmitigating dryland salinisation. Hence, deep-rootedperennial biomass plantings have significant potentialfor enhancing agricultural landscapes in the Corridorstudy area.
Several studies have assessed the economics of biomassproduction for renewable energy. Schneider and McCarl(2003) assess the role of biofuels in the context of theirpotential for emission reduction and conclude that biofuelscould play an important role if the carbon equivalent pricewas above $30/tonne (all dollar amounts are in Australiandollars). Walsh et al. (2003) found that at prices of $44/drytonne, switchgrass production for renewable energy wouldbe more profitable than current agricultural production onover 17million ha of agricultural land in the US and thatthis would supply 7.3% of US energy needs. Varela et al.(1999) and Miranda and Hale (2001) have assessed the fullsocial costs of biomass and other energy options. Montiet al. (2007) found that switchgrass production in Italy maybe viable at the high market prices that may be expectedover the next few years. Biomass and the associatedproduction of renewable energy and complimentaryproducts (oil, activated carbon) provides an importanteconomic incentive to offset the opportunity costs offoregone agricultural production and to encouragelarge-scale tree plantings (Walsh et al., 2003; Updegraffet al., 2004).
There have been few spatially explicit, integratedeconomic and environmental assessments of biomassproduction as a means of achieving multiple environmentaland economic objectives. Recent studies have used spatialplanning to estimate the potential of biomass production inthe landscape. Freppaz et al. (2003) combined GeographicInformation Systems (GIS) with mathematical program-ming to optimise the exploitation of forests for biomassproduction in the context of sustainable forest manage-ment. Varela et al. (2001) assess the potential for locationsand integration of a biomass energy plant in Spain using aGIS. The authors identify sites with the lowest environ-mental impacts and costs including production, storage,and transport costs and conclude that biomass energyproduction is a feasible energy generating approach inSpain. Schneider et al. (2001) use GIS to model potentialbiomass yields using a range of biophysical variablesassessing productivity against the spatial distribution ofland availability in Brazil with respect to the distribution of
land degradation, existing agriculture and endemic landcover types. Schneider et al. (2001) point to the potentialfor integrating biomass production models with other datasuch as transport and population to provide policy relevantadvice to the development of a biomass production policyin Brazil. Nelson et al. (2006) found that switchgrassproduction for renewable energy can generate botheconomic and water quality benefits of in northeastKansas. In a recent comprehensive regional ecologicaland economic assessment, Rosenberg (2007) found that theabandonment of agriculture for the uptake of large-scalebiomass production in the North American Great Plainsmay have significant environmental, economic, and socialbenefits. In this study, we undertake a spatially explicitassessment of the economic viability of biomass productionin the River Murray Corridor area in southern Australia,and quantify the associated benefits for multiple environ-mental objectives on a local and global scale.
Biomass production and processing in southern Australian
landscapes
As assessed in this study, farm-based biomass produc-tion involves the planting of oil mallee species at a densityof between 1000 and 2500 trees per hectare. There areseveral suitable species for integrated processing in theCorridor study area including Eucalyptus oleosa, Eucalyp-
tus polybractea, and Eucalyptus porosa (Bennell et al., 2004;Hobbs and Bennell, 2005). Biomass production cycles arecharacterised by an establishment phase of up to 6 yr untilfirst harvest and an optimal 3-yr rotation harvestingregime. At harvest, the trees are cut near ground leveland subsequently coppice from rootstock.There are significant opportunities for the expansion of
forest bioenergy in the low rainfall areas of southernAustralia (Raison, 2006). Rozakis et al. (2001) and Ellis(2001) provide an early assessment of the potential forbroad-scale Eucalyptus-based biomass production in thelow rainfall agricultural areas of South Australia. Bennellet al. (2004) found that growing eucalypts for biomass maybe at least comparable, if not better, in economic termsthan existing agricultural production as summarised bySadras (2004). Appraisals by Enecon (2001), Bennell et al.(2004), and Howard and Olszak (2004) indicate that thepositive returns on investment in biomass production inlow rainfall areas is reliant on an integrated and diversifiedproduction strategy. In this study, we focus on biomassproduction for supply of feedstock to an integrated treeprocessing plant for the generation of renewable energy,eucalyptus oil, and activated charcoal.Integrated tree processing has been subject to substantial
research interest (Enecon, 2001; Howard and Olszak, 2004;Ward and Trengove, 2005) and a trial 1MW plant has beenestablished at Narrogin, Western Australia (WA). Thedemonstration plant has the capacity to process20,000 tonnes of green biomass per year and produce7500MWh/yr of electricity (enough electricity to power

ARTICLE IN PRESSB.A. Bryan et al. / Land Use Policy 25 (2008) 533–549536
1000 homes). Production of biomass by farmers in WA hasthe complementary NRM benefit of mitigating drylandsalinity caused by land clearance and agricultural develop-ment. The Narrogin trial has demonstrated the potentialviability of the concept. The Oil Mallee Company who hada major role in supply of feedstock to the plant suggeststhat there is the potential for 10 integrated tree processingplants, each five times the size of the existing Narrogindemonstration plant in south-west WA. The results ofKumar et al. (2003) also indicate that larger plants mayachieve economies of scale.
Renewable energy
Electricity demand predictions (ETSA, 2004a, b) indicatethe annual increase of 3.4% for the River Murray region—a substantially higher rate of increased demand comparedto the rest of South Australia, and Australia as a whole.Currently, there is no local electricity generation facilitiesin the region and power generated in distant localitiessuffers substantial transmission losses (ETSA, 2004a, b).Hence, there are potential efficiency gains in the location ofsmall-scale electricity generation capacity in the Corridorstudy area.
In Australia, electricity providers need to meet Manda-tory Renewable Energy Targets (MRET). The MRETnational initiative (Commonwealth of Australia, 2001),implemented in 2001, places a legally enforceable obliga-tion on wholesale electricity retailers to provide anadditional 9500GWh (or 2% of 2001 levels) per annumof renewable energy by 2010–2020 (although recentAustralian Government policy announcements suggestthat this may soon be increased). The penalty for non-compliance is set at a non-tax deductible $40/MWh,redeemable if the MRET shortfalls are met by purchasingrenewable energy certificates (REC) within 3 yr. In lieu ofenforceable carbon emission levels, RECs represent asurrogate Australian Government initiative to promoterenewable energy generation. Akmal et al. (2004) predictwind and biomass (estimated at 33% of renewablegeneration in 2019–2020) to be the second largest sourcesof renewable energy behind hydro power. Biomass genera-tion based on woody perennial feedstock seems well placedto meet future MRET market demands in Australia.
Activated carbon
Charcoal produced from the first stage of processing thewoody perennial feedstock can be further activated bysteam to produce high value activated carbon. Bypreferentially adsorbing chemicals, ions, and odours,activated carbon’s primary applications are in potablewater purification and treatment, microcystin adsorption(blue green algae toxin removal), atrazine adsorption(pesticide removal), gas cleaning, and the removal ofodours in the food and beverage industry, and theextraction of gold from ore slurries (Enecon, 2001). The
total world market for activated carbon is estimated to be700,000 tonnes per annum and is increasing at a rate ofapproximately 4–5% per annum (Enecon, 2001). However,Bennell et al. (2004) are less optimistic about thecommercial prospects for activated carbon productsbecause of the potential for oversupply. Currently, carbonis sourced from UK, Dutch, and French carbon producers.Production and sale of activated carbon as powder,granules, or pellets is expected to contribute approximately65% of the estimated annual revenue from an integratedtree processing plant (Enecon, 2001).
Eucalyptus oil
Eucalyptus oil derived from mallee eucalypt species isused as a pharmaceutical product with potential use as anindustrial solvent (Enecon, 2001). Traditional worldmarkets for eucalyptus oil already exist in non-prescriptionpharmaceuticals, cleaning products, and perfumery. Cur-rently, the world market consumes 3000–5000 tonnes/yr ofeucalyptus oil (produced mainly from E. globulus), most ofwhich is produced in China, with approximately 200 tonnesproduced in Australia for specialty fragrance markets.Cineole (the active degreasing agent of eucalyptus oil) hasbeen found to be an effective degreaser (Enecon, 2001).Large volume availability of eucalyptus oil would facilitateaccess to a degreasing solvent market, substituting for thepetrochemical-based solvent, trichloroethane which isbeing phased out internationally due to its impact on theozone layer. The industrial solvent market exceeds1million tonnes per annum. The Enecon (2001) assessmentindicates an opportunity to develop an alternate andextensive solvent market using high grade, stable, andbiodegradable eucalyptus oil.
The commercial viability of the integrated tree processing
plant
Ward and Trengove (2005) analysed the economicviability of a 5MW integrated tree processing plant inthe study region, producing biomass-based electricity,activated carbon, and eucalyptus oil. On the farm-side,biomass productivity, production costs, and foregoneopportunity costs were quantified for three rainfall andsoil regions in the Corridor study area by Ward andTrengove (2005). Based on the revenue streams sum-marised below, they concluded that the plant was able toincur factory gate biomass costs of up to $47/tonne as amean for the three regions and maintain a 15% internalrate of return (mean break even for biomass producers wasestimated at $38/tonne). Net present value (NPV) over a15-yr life of plant at a 10% discount rate was estimated at$9.5 million.Biomass processing revenues were estimated as follows
(Ward and Trengove, 2005, pp. 25–26). With regard toelectricity generation, a 5MW plant has the potential togenerate 40,000MWh/yr at a net sales price of $22/MWh

ARTICLE IN PRESSB.A. Bryan et al. / Land Use Policy 25 (2008) 533–549 537
($60/MWh production costs minus $38/MWh return fromtradeable RECs). This is competitive with the averageelectricity pool price for 2006 in the study area of $28/MWh. The Australian Greenhouse Office (2003) estimatefor 2007 Australian pool prices is $47/MWh and $34/MWhin 2010, suggesting an ongoing competitive advantage. The5MW integrated tree processing plant has the capacity toproduce 2729 and 1090 tonnes of granulated and pelletedactivated carbon, respectively, both with an estimatedmarket value of $3000/tonne, in addition to 294 tonnes ofpowdered carbon valued at $1000/tonne. A total of1050 tonnes of eucalyptus oil can be produced with amarket value of $3000/tonne.
Description of the study area
The River Murray Corridor study area in SouthAustralia is defined as a 15 km buffer from the floodplain(defined as the area inundated by the 1956 1-in-100-yrflood) stretching from the Victorian/NSW border in theeast to Tailem Bend in the south (Fig. 1). The study areacovers an area of 1,217,000 ha including 108,000 ha offloodplain, 628,000 ha of cleared dryland agriculture,
Morgan
Mannum
Waik
Swan Reach
Tailem Bend
Blanchetown
Murray Bridge
350,000
350,000
400,000
400,000
6,100,000
6,150,000
6,200,000
6,250,000
0 10 20
Kilometres
Australia
Fig. 1. Location map of the South A
511,000 ha of remnant native vegetation, and 50,000 ha ofhigh-value irrigated agriculture. An area of 193,000 ha isprotected for nature conservation purposes and approxi-mately 956,000 ha is unreserved land privately owned.The Corridor study area covers a diverse range of
landscapes from the moist, cool, hilly eastern edge of theMt. Lofty Ranges in the south-west of the study area to thewarm dry plains of the Mallee in the north-east of the studyarea. Mean annual rainfall varies from 226mm/yr in thenorth-east to 662mm/yr in the south-west. Mean annualtemperature ranges from 13.2 1C in the southwest to16.8 1C in the north-east. Approximately 80,000 peoplereside in the Corridor study area, with major centreslocated in Fig. 1.Dryland agriculture is dominated by livestock grazing,
particularly sheep grazing, and cereals such as wheatand barley, with some smaller areas of oilseeds andlegumes (Bryan and Marvanek, 2004). Soils are commonlysandy and nutrient poor. Land clearance and agriculturalland use has exacerbated wind erosion of soils throughincreased exposure due to typical farming practices, andthrough the modification of soil structure. Hence, themitigation of wind erosion is a major environmental
Berri
Loxton
RenmarkerieKingston-On-Murray
450,000
450,000
500,000
500,000
6,100,000
6,150,000
6,200,000
6,250,000
Native Vegetation
1956 Floodplain
River Murray Dryland Corridor
Irrigated Areas
Towns
ustralian River Murray Corridor.

ARTICLE IN PRESS
Maintenance Costs
Opportunity Costs
Harvest CostsTransport CostsFertiliser Costs
Establishment Costs
Income
First Harvest
First third ofcrop
Second third ofcrop
Final third ofcrop
Second Harvest
First third of crop
Second third ofcrop
Final third ofcrop
CropEstablishment
First third of crop
Second third ofcrop
Final third ofcrop
Third Harvest
First third of crop
Year Cash Flow Agricultural Production
continued
10
11
12
1
3
2
5
4
6
7
9
8
Fig. 2. Agricultural production schedule and cash flow for oil mallee
production for integrated processing.
B.A. Bryan et al. / Land Use Policy 25 (2008) 533–549538
objective and is formalised in the regional target (INRMGroup, 2003):
By 2020, reduce the area of agricultural land at risk ofwind erosion during June each year by 40%.
Regional groundwater systems are naturally saline andflow towards the River Murray, delivering a natural influxof salt to the river. Land clearance and irrigationdevelopment has exacerbated this process through in-creased groundwater recharge (Cook et al., 2004). Increas-ing river salinity has important implications because thecity of Adelaide (approximately 1.1 million people) andmany rural South Australian towns rely on the RiverMurray for supplying much of the fresh water. Addressingthe environmental objective of river salinity mitigation isembodied in a Murray-Darling Basin wide target (MDBC,2001):
By 2020, have salinity of water in the River Murray less
than 800 EC (mS/cm) for 95% of the time at Morgan to
ensure drinking water standards.
Economic viability of biomass production
Production-side economic analysis of biomass in theCorridor study area involves calculation of the revenuefrom biomass and the costs of production over a specifictime frame. Based on the results of Bennell et al. (2004), theoptimal harvesting regime for oil mallee species in the studyarea is a 6-yr establishment period followed by 3-yearlyharvests. Plant material is harvested by coppicing nearground level. Oil mallees can regrow from coppicedrootstock. In normal production, the integrated treeprocessing plant needs a constant supply of 100,000 greentonnes of biomass each year. To provide this amount, weassume the staggered planting regime of one-third of thecrop planted at the beginning of year 1, one-third in year 2and the final third in year 3. We also assume a staggeredharvest after the 6-yr establishment period of one-third ofthe crop harvested each year and each hectare of landharvested every 3 yrs. Immediately following harvest thebiomass crops require fertilisation. The crops also requireminimal annual maintenance (Fig. 2).
In modelling the economic potential of biomass we needto characterise returns from and costs of production. Thisproduction regime involves irregular cash flow. Revenueand costs of biomass production are calculated for eachyear based on this production schedule and discountedback to NPV terms. Revenue from biomass productionoccurs first in year 6 and then regularly each year after thatas one-third of the crop is harvested each year. The costs ofbiomass production include establishment, maintenance,harvest, fertiliser, opportunity and transport costs. Differ-ent costs and returns occur at different times in the biomassproduction schedule (Fig. 2). The economic potential ofbiomass industries in the study area is assessed accordingto NPV or returns, Modified Internal Rate of Return
(MIRR) and Equal Annual Equivalent (EAE) returnswhich incorporate irregular cash flow and constant timepreference.Maps of the spatial variation in the economic measures
of biomass profitability are developed using the spatiallyvarying parameters of biomass productivity, opportunitycosts, transport costs, and scalar parameters includingharvest costs, maintenance costs, and fertiliser costs. Thespatial model of the profitability of biomass production iscreated in a GIS. A raster data structure is used based ongrid cells of 254m resolution (6.4516 ha—the resolution ofexisting salinity model outputs).Production-side economic assessment in this study is
necessarily highly parameterised. It involves specification ofa range of values for model parameters that significantlyaffect the results of the analysis. There is some uncertaintysurrounding all of the specified parameters. The economicassessment is conducted in two phases to cope with thisuncertainty. First, the Most Likely Scenario performs asingle analysis of the profitability of biomass productionusing the most likely parameter values. Second, a sensitivityanalysis quantifies the effects of parameter uncertainty onthe economic potential of biomass production.

ARTICLE IN PRESSB.A. Bryan et al. / Land Use Policy 25 (2008) 533–549 539
Biomass productivity
Economic returns to biomass production depend on siteproductivity and the price per tonne of biomass. Theprincipal model input is the GIS layer of green biomassproductivity of E. oleosa in m3/ha/yr. Based on extensivefield trial data, Bennell et al. (2004) produced a layercapturing the spatial distribution of stemwood productivitybased on experimental growth rates of E. oleosa. Originallycreated at a resolution of 5 km grid cells, this layer wasdownscaled using bilinear resampling to 254m grid cellresolution to match the other GIS data.
Revenue
To calculate the revenue from biomass (rt) at harvest atyear (t) for each grid cell (k), we first calculate theproduction (Pt) as a layer with values for green tonnes ofbiomass calculated for each grid cell. To do this, wemultiply the stemwood volume productivity at harvestspatial layer (s) by the cell area (a) and the time in yearssince last harvest (mt). A coppicing productivity multiplier(jt) is then applied, which attempts to capture theincreased productivity of the species after coppicingcompared with establishment productivity rates. A stem-wood fraction conversion factor (yt) is also applied, whichconverts the stemwood volumes into total tonnes of greenbiomass (wood, twigs, leaves inclusive). The values of jt
and yt are different before and after the first harvest (i.e.tX6 and tp8) due to the differing productivity ratescaused by coppiced regrowth. Values for jt and yt arederived from field-based empirical measurements. This isall divided by a harvest schedule staggering component (g).In this case, we use g ¼ 1/3 because we are harvesting athird of the area each year:
Pt ¼0 for to6;
s� a�mt � jt � yt � g for tX6;
(
where Pt is production (green tonnes of biomass), s isstemwood volume productivity (m3/ha/yr), a is cell area(6.4516 ha), mt is time since last harvest (years), jt iscoppicing productivity multiplier (green tonnes per m3), yt
is stemwood fraction conversion factor (scalar), g is harvestschedule staggering component (g ¼ 1/3), t is year.
For tX6 and tp8:
jt ¼ 1,
yt ¼ 1:9074,
mt ¼ 6.
For t48:
jt ¼ 1:5,
yt ¼ 1:7521,
mt ¼ 3.
Finally, the revenue in dollars for each cell is calculatedas a layer by multiplying the production in green tonnes ofbiomass of each grid cell by the factory gate price per greentonne in dollars (p):
rt ¼ Pt � p.
Costs of production
All costs are calculated as layers with values in dollarsfor each grid cell. Significant establishment costs areincurred from planting one-third of the biomass crop atthe beginning of years 1, 2, and 3 such that
ECt ¼ec� a� g for tX1; tp3;
0 for t43;
(
where ECt is total establishment costs for year t ($), ec isestablishment costs ($/ha).Maintenance costs are incurred every year (but only
occur for the total area of crop after year 3 due to staggeredplantings) and are calculated as
MCt ¼mc� a� t� g for tX1; tp3;
mc� a for t43;
(
where MCt is total maintenance costs for year t ($), mc ismaintenance costs ($/ha).Harvest costs occur first at year 6 and then every year after
that for one-third of the total crop area harvested each year:
HCt ¼ Pt � hc for all t,
where HCt is total harvest costs for year t ($), hc is harvestcosts ($ per green tonne of biomass).Fertiliser costs follow harvest and are calculated as
FCt ¼0 for to6;
fc� a� g for tX6;
(
where FCt is total fertiliser costs for year t ($), fc is fertilisercosts ($/ha).In this analysis, opportunity costs are also incurred each
year as the growing of biomass involves the conversion of allprior agricultural land uses. Opportunity costs are calcu-lated based on the current value of agricultural productionand are mapped in a sequence of steps. Initially, the spatialdistribution of dryland agriculture was quantified andmapped using the catchment scale land use mapping whichclassifies land parcels according to the Australian Land Useand Mapping Classification standard Version 4 (ALUMCV.4). ALUMC land use classes were then generalised to fivecategories of dryland land use: cereals; grazing; hay andsilage; legumes; and other minimal use.Each class was assigned an average gross margin (GM)
in present value terms for the region based on figures fromSadras (2004) and Bryan and Marvanek (2004):
�
Cereals $80/ha, � Grazing $37.50/ha,
ARTICLE IN PRESSB.A. Bryan et al. / Land Use Policy 25 (2008) 533–549540
�
Hay and silage $150/ha, � Legumes $120/ha, � Other minimal use $10/ha.Although soil quality and other factors have a stronginfluence, the primary driver of dryland agriculturalproductivity in the Corridor study area is rainfall. Thereexists a steep climatic gradient and similar drylandagriculture types can return very different gross marginsdepending on rainfall. Hence, in order to gain betterrepresentation of opportunity costs, average grossmargin figures were redistributed following the spatialdistribution of rainfall. Gross margin figures for eachgrid cell were adjusted using the ratio of the meanannual precipitation (modelled using BIOCLIM) of thecell to the geographic average mean annual precipitation(300mm/yr). As a result, agricultural land uses in drierclimates were attributed lower opportunity costs and landuses in moister climates were attributed higher opportunitycosts.
Annual opportunity costs of dryland agriculture asmodelled in this study range from $7.83/ha to $199.00/hawith a mean of $46.53 and a standard deviation of$22.54. The total economic returns to agriculture in grossmargin terms and hence, the total opportunity coststo dryland agriculture in the Corridor study area asestimated using the methods described above is $29.25mil-lion/yr. The aggregate gross margin value is in accordancewith the $21.4 million in returns to agriculture whenprofit was estimated at full equity (Bryan and Marvanek,2004). Opportunity costs are calculated for each cellby multiplying the opportunity costs per hectare bythe cell area: OCt ¼ oc� a for all t where OCt istotal opportunity costs for year t ($) and oc is opportunitycosts ($/ha).
Transport costs involve the costs incurred from truckinggreen biomass from each grid cell to a hypotheticalintegrated tree processing plant located at Kingston-on-Murray along the existing road system. Transport costswere calculated as a layer for the entire SA MDB INRMregion using a cost distance function in a GIS after Mollerand Nielsen (2007). To construct this layer a cost multiplierlayer was created using a variety of data sources tocharacterise the relative cost of traversing cells of differentsurfaces. The South Australian roads database was used toidentify sealed and unsealed roads. Areas of irrigated anddryland agriculture, flood plain, and remnant vegetationwere also identified. Transportation cost multipliers arelowest along sealed roads (1), slightly higher alongunsealed roads (1.2), and higher again over open paddocks(1.4). Transport is permitted across native vegetation andirrigated areas but the cost multiplier is high (3) and sotraversal of these surfaces is not favoured in the costdistance analysis. No travel across the flood plain ispermitted unless it is along a road. The cost multiplier layeris multiplied by a transport price (tp) based on currentcommercial rates to calculate for each grid cell the total
cost in dollars per tonne per kilometre ($/t/km) fortraversing the cell and this layer is used as input into costdistance analysis.Cost distance analysis is a global function in raster
GIS that is able to calculate the least expensive routefrom each cell to a target cell. Cost distance analysiscombines the cost of traversal layer in $/t/km withdistance measurement to the integrated tree processingplant at Kingston-on-Murray to calculate for each grid cellof the minimum cost of transport per green tonne ofbiomass to the integrated tree processing plant in dollarsper tonne (tc).To calculate the total transport cost layer, we multiply
this by the total production for each cell:
TCt ¼ Pt � tc for all t,
where TCt is total transport costs for year t ($), tc istransport costs ($ per green tonne of biomass).The six different types of costs involved in biomass
production (establishment costs, maintenance costs, har-vest costs, fertiliser costs, opportunity costs, and transportcosts) can be used to calculate total biomass productioncosts in year t (ct):
ct ¼ ECt þMCt þHCt þ FCt þOCt þ TCt.
Economic measures of biomass profitability
Three measures are used to assess the economic potentialof biomass based on the above revenue and cost layers.NPV is the total net returns to growing biomass (revenue-costs) discounted to present day dollars. The ModifiedInternal Rate of Return is the discount rate that results inthe NPV of growing biomass equalling zero or, in otherwords, the percentage rate of revenue over costs. EAE isthe equivalent annual payment required to return the NPVderived from growing biomass considering all of theirregular revenues and costs over time. Using thesemeasures, we can assess the profitability of growingbiomass compared to current agricultural practices. Byincorporating spatially varying data on production andcost parameters we can calculate the spatial distribution ofthe profitability of biomass for the study area.More formally, NPV can be calculated as
NPV ¼Xn
t¼1
ðrt � ctÞ
ð1þ iÞt,
where i is interest (discount) rate, rt is the revenue at year t,ct is costs at year t, n is the number of years.The Modified Internal Rate of Return assumes that all
accrued revenue will be reinvested and is a function of theratio of the present value of all costs (PVc) to the futurevalue of all returns (FVr) from biomass. MIRR iscalculated as
MIRR ¼
ffiffiffiffiffiffiffiffiffiffiffiffiffiffiffiffiffiffiFV r
PV c
� 1n
r,

ARTICLE IN PRESSB.A. Bryan et al. / Land Use Policy 25 (2008) 533–549 541
where
PV c ¼Xn
t¼1
ðctÞ
ð1þ iÞt
and
FV r ¼Xn
t¼1
ðrtÞð1þ iÞn�t.
Using the NPV of biomass production, the EqualAnnual Equivalent can be calculated as
EAE ¼ NPV �ið1þ iÞt
ð1þ iÞt � 1
Most Likely Scenario and sensitivity analysis
The Most Likely Scenario involves a single calculation ofthe economic measures of NPV, MIRR, and EAE over a100-yr time frame using the parameters in Table 1. Toestablish a suitable time frame, we adopt the findings ofCook et al. (2004), who estimate that salinity reductionfrom revegetation is maximised over a 100-yr time horizon.The sensitivity analysis employs a Monte Carlo simulationof the economic measures by running the model 1000 timesfor each of four different discount rates. For each iterationrandom parameter values are taken from the rangesspecified in Table 1. Economic measures are recalculatedover a time span of 20 yrs during each iteration. Hence, thesensitivity analysis tests the economic potential of biomassunder the full range of possible parameter values. Onethousand NPV grids were calculated for the 0%, 3%, 6%,and 9% discount rates using model runs with randomisedcost and revenue parameters. For each discount rate themean and upper and lower 95% confidence intervals werecalculated for each grid cell based on the 1000 iterations.
Table 1
Model parameters and parameter ranges used in the Most Likely Scenario an
Model
parameter
Symbol Units Most Likely
Scenario values
Sensitivity analysis
value range
Reas
Establishment
cost
ec $/ha 740 400–1200 Based
Time frame n Years 100 20 100 y
simu
Discount rate i % 7 0, 3, 6, 7, 9 Based
Maintenance
costs
mc $/ha 10 5–15 Based
Harvest cost hc $/t 12 7–20 Based
Transport
price
tp $/t/
km
0.046 0.04–0.07 Based
Fertiliser costs fc $/ha 40 30–50 Based
Biomass price p $/t 35 15–47 Based
Biomass
productivity
Pt t See Fig. 3 720% Based
Opportunity
costs
OCt $ See Fig. 3 730% Based
Economic parameters and parameter ranges were defined based on Bennell et
This enables the mapping of the spatial distribution of themost likely, the lowest and highest NPV returns reasonablyexpected from biomass production for each grid cell.Finally, the risk of biomass production is calculated foreach grid cell as the proportion of the 1000 runs for whichbiomass production returns a NPV less than zero at adiscount rate of 7%. The Monte Carlo iteration wasprogrammed within a GIS.
Most Likely Scenario
The Most Likely Scenario provided a detailed assess-ment of the relative effect of different costs and prices onthe viability of growing biomass in the study areacompared with existing agriculture. Biomass productivityof E. oleosa after the first harvest ranges from 24 to 115green tonnes of biomass per year per grid cell (6.4516 ha)with an average of 51 tonnes per cell. Biomass productivityis highest in the higher rainfall areas in the southern partsof the study area and in eastern Mt. Lofty Ranges (Fig. 3).The value of establishment costs involved in a planting
density of 1000 plants per hectare is the same for all cellsand was specified at $740/ha/yr. This equates to a presentvalue of $4468 for each grid cell. Maintenance costs arealso specified on a per hectare basis and are the same foreach grid cell. Specified in the Most Likely Scenario modelat a nominal $10/ha, the total present value of maintenancecosts is $860. Harvest costs vary spatially with biomassproductivity. Specified at $12/tonne, the total present valueof harvest costs of grid cells ranges between $3400 and$16,300. Fertiliser costs are based on area and so are thesame for each cell. Specified in the Most Likely Model at$40/ha this equates to a present value of $935 for each cell.Opportunity costs vary spatially according to land use andclimate. The present value of opportunity costs rangesfrom $771 per cell in the drier northern parts of the studyarea to $19,600 per cell under cereal cropping the southern
d the sensitivity analysis
oning behind parameter choice
on survey of commercial rates
ears used to provide long term estimate, 20 years used in Monte Carlo
lation to reduce computational load
on a reasonable estimate of variability
on survey of commercial rates
on Bennell et al. (2004) and commercial rates
on survey of commercial rates
on Bennell et al. (2004) and commercial rates
on Ward and Trengove (2005)
on a reasonable estimate of variability
on a reasonable estimate of variability
al. (2004) and a variety of other sources. t ¼ green tonnes of biomass.

ARTICLE IN PRESS
Transport Costs
$0.00 - $1.60
$1.60 - $2.80
$2.80 - $4.10
$4.10 - $5.60
$5.60 - $7.10
$7.10 - $8.30
$8.30 - $10.20
Dollars per Green Tonne of Biomass
Green Biomass Productivity
Per Hectare3.87 - 6.48
6.49 - 7.51
7.52 - 8.81
8.82 - 10.27
10.28 - 12.01
12.02 - 14.45
14.46 - 17.70
Opportunity CostsPublic Land
$7 - $14
$14 - $24
$24 - $38
$38 - $57
$57 - $81
$81 - $134
$134 - $199
$/ha
Green Tonnes
$0.00 - $1.60$1.60 - $2.80$2.80 - $4.10$4.10 - $5.60$5.60 - $7.10$7.10 - $8.30$8.30 - $10.20
Dollars per GreenTonne of Biomass
Transport Costs
Fig. 3. Spatial distribution of key economic model inputs including green
biomass productivity from Bennell et al. (2004).
B.A. Bryan et al. / Land Use Policy 25 (2008) 533–549542
areas (Fig. 3). Transport costs also vary spatially accordingto production and distance to the integrated tree processingplant at Kingston-on-Murray. Present value of transport
costs ranges from $0 for cells adjacent to the proposedprocessing plant at Kingston-on-Murray to $12,180 forgrid cells far from the plant (Fig. 3). Present value of totalcosts of biomass production for grid cells ranges from$11,600 to $46,200 over a time period of 100 yrs and at adiscount rate of 7%.Assessment of economic measures in the Most Likely
Scenario values reveals that biomass is more profitablethan current agriculture in most parts of the study area.The total NPV of biomass production ranges between aneconomic loss of $13,400 to a benefit of $10,500 comparedto returns from existing agriculture, with an average NPVbenefit of $40 per cell (Fig. 4). The MIRR ranges between6.5% and 7.4% (Fig. 4), which is acceptable, given thatopportunity costs of existing agriculture are included inthis analysis. EAE payments range from �$146 to $113/yr/ha. Areas with higher net economic returns to biomass arelocated in the Mt. Lofty Ranges to the west of Mannum,where productivity is higher relative to the opportunitycost of foregone production (Fig. 4).We can consider biomass production to be potentially
viable where the NPV of production, which includes theopportunity costs of existing agriculture, is greater thanzero. As a result, the total potentially viable area forbiomass production under the Most Likely Scenario is360,728 ha or 57.7% of the dryland area of the Corridor.Major foci of economically viable areas for biomass arelocated in the southern and north central parts of theCorridor (Fig. 4). The potential tonnage of green biomasssupplied by the economically viable area (3million tonnes)is some 30 times the required supply of 100,000 tonnes andthe total NPV over 100 yrs is around $88 million.
Sensitivity analysis
Sensitivity analysis of the biomass modelling usingMonte Carlo iteration and random perturbation of modelparameters reveals that there is robust and positiveeconomic potential for biomass production in the Corridorstudy area. The viability of biomass production is subjectto spatial variability and the parameter values used ineconomic modelling. Biomass production is not viableunder all parameter possibilities. It is important to under-stand where the most viable areas are and what parametervariation affects their viability. Fig. 5 presents the meanand the upper and lower 95% confidence intervals for theNPV of biomass production for each grid cell at 0%, 3%,6%, and 9% discount rates, These statistical maps havebeen calculated over 1000 Monte Carlo iterations anddemonstrate the average scenarios and the lower andhigher limits between which 90% of the simulatedeconomic returns from biomass production occur.The analysis of the statistical mean and 95% confidence
intervals calculated on the NPV from 1000 iterations atdifferent discount rates illustrate the uncertainty involvedin assessment of biomass profitability. The �95% con-fidence interval maps show that no grid cells are profitableunder all possible parameter values. The mean values

ARTICLE IN PRESS
EconomicallyViable Areas
Not Viable
Viable
0 4020
Kilometres
-$146 - -$89
-$89 - -$34
-$34 - -$12
-$12 - $5
$5 - $20
$20 - $45
$45 - $114
Equal Annual Equivalent($/ha)
Net Present Value
-$13,400 - -$8,200
-$8,200 - -$3,100
-$3,100 - -$1,100
-$1,100 - $500
$500 - $1,900
$1,900 - $4,100
$4,100 - $10,500
6.53% - 6.77%
6.78% - 6.85%
6.86% - 6.94%
6.95% - 7.02%
7.03% - 7.10%
7.11% - 7.21%
7.22% - 7.37%
Modified InternalRate of Return
Fig. 4. Economic indicators of the Most Likely Scenario of biomass production for the Corridor.
B.A. Bryan et al. / Land Use Policy 25 (2008) 533–549 543
suggest many, but not all parts of the study area are viablefor biomass production. The +95% confidence interval,indicates all areas are potentially viable and some areconsiderably more profitable than existing agriculture(Fig. 5). Therefore, there is no guarantee of the viabilityof biomass under all potential economic situations.However, biomass is likely to be viable in many areasunder typical cost and revenue situations.
Conservatively, a reliable and consistent supply of4100,000 tonnes of biomass per year can be expected witha factory gate price of biomass of $35 per green tonne. Atthis price biomass production becomes more profitablethan current agriculture over an area sufficient to producea supply of 4100,000 tonnes, the plant production thresh-old requirement for biomass feedstock. The internal rate ofreturn for the integrated tree processing plant at a factorygate price of $35 per green tonne is estimated at between15.75% and 22.23% (Ward and Trengove, 2005).
Variation in cost parameters tends to have only veryslight effects on the mean NPV of grid cells. Variation in
maintenance and fertiliser costs have no effect on meanNPV. Transport, establishment, harvest and opportunitycost parameter variation have a slight inverse relationshipwith mean NPV because the higher the costs, the lower thereturns. In all cases there is significant variation aboutthese trends. Variation in productivity of biomass within720% of the empirical levels found by Hobbs (unpub-lished data 2004) did not affect the mean NPV of grid cells.However, the factory gate price of biomass has a stronginfluence on the mean NPV returns from biomassproduction. Thus, the price of biomass is the single mostimportant factor affecting the profitability of biomassproduction in the Corridor study area.Taken conservatively at a 9% discount rate, there is
potentially a reliable supply of4100,000 tonnes of biomassper year when the factory gate price of biomass exceeds $35per green tonne. Supply is guaranteed at lower prices pertonne for lower discount rates. This leaves a satisfactorylevel of flexibility in factory gate price between this priceand the $47/tonne maximum price found by Ward and

ARTICLE IN PRESS
-95%
Confidence Interval
Mean +95%
Confidence Interval
Dis
co
un
t R
ate
0%
3%
6%
9%
High :$ -7,472
Low :$ -50,209
Native Vegetationor Irrigated Areas
Native Vegetationor Irrigated Areas
Native Vegetationor Irrigated Areas
High :$ 14,813
Low :$ -3,999
High :$ 74,984
Low :$ 2,593
0 8040
Kilometres
Fig. 5. Mean, lower and upper 95% confidence intervals of Net Present Value of biomass production summarised for 1000 model runs at each discount
rates of 0%, 3%, 6%, and 9%.
B.A. Bryan et al. / Land Use Policy 25 (2008) 533–549544
Trengove (2005) that still provides a 15% internal rate ofreturn to the processing plant. Hence, the price of $35/tonne for biomass is imputed as a starting price to allow foruncertainty and other variable effects such as imperfectinformation and risk aversion of landholders. We note thatothers (Bennell et al., 2004; Enecon, 2001) have used lowerprices per green tonne of biomass in their analyses.
The effect of varying people’s time preference is tomoderate the extremes of economic returns. Assessment ofthe mean, and upper and lower 95% confidence intervalgrids calculated from the 1000 models runs reveals that
under a lower discount rate the high and low returns aremore extreme. The other effect is that returns are generallylower at higher discount rates (Fig. 5).Risk of biomass production is the proportion of the 1000
model runs at 7% discount rate that the net returns frombiomass production of each cell is greater than existingagriculture (NPV 4$0). This measure captures the prob-ability that each grid cell will be viable (i.e. have an NPV4$0) given the range of parameters tested in the sensitivityanalysis. Risk probabilities range from a low of 30% to ahigh of 70% (Fig. 6). That is, even the most viable cells
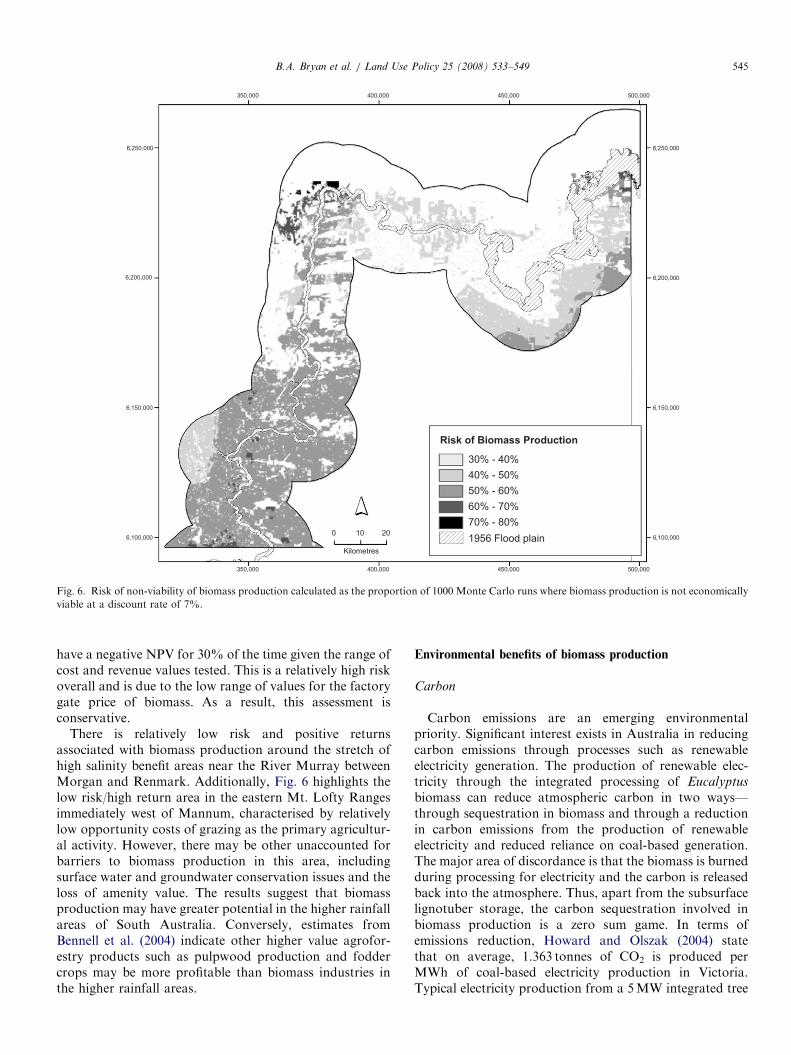
ARTICLE IN PRESS
350,000
350,000
400,000
400,000
450,000
450,000
500,000
500,000
6,100,000 6,100,000
6,150,000 6,150,000
6,200,000 6,200,000
6,250,000 6,250,000
0 10 20
Kilometres
Risk of Biomass Production
70% - 80%
60% - 70%
50% - 60%
40% - 50%
30% - 40%
1956 Flood plain
Fig. 6. Risk of non-viability of biomass production calculated as the proportion of 1000 Monte Carlo runs where biomass production is not economically
viable at a discount rate of 7%.
B.A. Bryan et al. / Land Use Policy 25 (2008) 533–549 545
have a negative NPV for 30% of the time given the range ofcost and revenue values tested. This is a relatively high riskoverall and is due to the low range of values for the factorygate price of biomass. As a result, this assessment isconservative.
There is relatively low risk and positive returnsassociated with biomass production around the stretch ofhigh salinity benefit areas near the River Murray betweenMorgan and Renmark. Additionally, Fig. 6 highlights thelow risk/high return area in the eastern Mt. Lofty Rangesimmediately west of Mannum, characterised by relativelylow opportunity costs of grazing as the primary agricultur-al activity. However, there may be other unaccounted forbarriers to biomass production in this area, includingsurface water and groundwater conservation issues and theloss of amenity value. The results suggest that biomassproduction may have greater potential in the higher rainfallareas of South Australia. Conversely, estimates fromBennell et al. (2004) indicate other higher value agrofor-estry products such as pulpwood production and foddercrops may be more profitable than biomass industries inthe higher rainfall areas.
Environmental benefits of biomass production
Carbon
Carbon emissions are an emerging environmentalpriority. Significant interest exists in Australia in reducingcarbon emissions through processes such as renewableelectricity generation. The production of renewable elec-tricity through the integrated processing of Eucalyptus
biomass can reduce atmospheric carbon in two ways—through sequestration in biomass and through a reductionin carbon emissions from the production of renewableelectricity and reduced reliance on coal-based generation.The major area of discordance is that the biomass is burnedduring processing for electricity and the carbon is releasedback into the atmosphere. Thus, apart from the subsurfacelignotuber storage, the carbon sequestration involved inbiomass production is a zero sum game. In terms ofemissions reduction, Howard and Olszak (2004) statethat on average, 1.363 tonnes of CO2 is produced perMWh of coal-based electricity production in Victoria.Typical electricity production from a 5MW integrated tree

ARTICLE IN PRESS
Table 2
Cross-tabulation of areas (ha) showing relationship between the economic
viability of biomass production (EAE/ha) with salinity benefits
EAE/ha Salinity (EC� 10�6)
0 1–299 300–1447 1448–12,772
p$0 2,582,800 68,650 14,194 7807
$0–$30 2,906,700 35,551 19,550 14,453
$30–$70 512,870 18,388 19,098 22,905
4$70 57,681 65 194 65
B.A. Bryan et al. / Land Use Policy 25 (2008) 533–549546
processing plant is approximately around 40,000MWh/yr(Enecon, 2001), which would offset about 55,000 tonnes ofCO2 per year. This is the equivalent of taking 10,500 carsoff the road (1 car ¼ 11,560 lbs or 5254 kg CO2/yr).
In the Most Likely Scenario presented above, biomassproduction is more economically viable than currentagriculture for over 360,000 ha. This area can producemore than 3million tonnes of biomass per annum, whichcan potentially supply more than 30� 5MW processingplants. This translates into a reduction in carbon dioxideemissions of around 1,650,000 tonnes per annum or theequivalent of taking 315,000 cars off the road. If thebiomass production displaces sheep grazing at a stockingunit rate of 2.5/ha, another 113,400 tonnes of CO2 may beoffset (or 21,649 cars). The introduction and integration oftradable carbon offsets, produced as a result of biomasselectricity generation, into the biomass revenue streamcould substantially enhance its economic viability.
Salinity
South Australia has a responsibility to meet salinitytargets under the Murray-Darling Basin Salinity Manage-ment Strategy (MDBC, 2001) set to ensure drinking waterquality standards. It has been documented that a sub-stantial proportion of the salt contribution to the RiverMurray originates from the dryland areas of the SouthAustralian River Murray Corridor (Barnett et al., 2002).Land clearance has increased the salt load contributionfrom the dryland areas of the Corridor study area. Theremoval of deep-rooted perennial native vegetation leads togreater leaching of salts from the soil profile, an increase insaline groundwater recharge and base flow, and an increasein the delivery of salt load to the river. Groundwater insome parts of the SA Murray-Darling Basin is saline,travels towards the River Murray as base flow, and isdischarged directly into the river. This process has beenwell documented in the SA River Murray (Cook et al.,2004). The widespread establishment of deep-rootedperennials may be able to contribute substantially toreversing this process through groundwater rechargereduction (Bell, 1999; Lefroy and Stirzaker, 1999). Wequantify potential river salinity benefits (calculated usingthe SIMPACT model by Bryan et al., 2005) achieved by theestablishment of deep-rooted perennial species for biomassproduction in the dryland areas of the Corridor study area.
Under the Most Likely Scenario, over 130,000 ha of landis viable for biomass production which can also contributelimited benefit to reducing the salinity of the River Murrayafter 100 years (Table 2). The total reduction in EC units(note 1EC ¼ 1micro-siemens/cm at 25 1C (mS/cm)) result-ing from planting of this area with biomass species is2.65 Ecs after 100 years.
The most profitable locations for biomass productionunder the Most Likely Scenario were found to be inter-spersed within existing irrigation areas. Biomass produc-tion in these areas may also have synergistic salinity
benefits by lowering ground aquifer water tables andreducing recharge whilst concurrently increasing biomassproduction through soil water mining.
Wind erosion
Soils in the Corridor study area have varying levels ofsusceptibility to wind erosion according to the level of claycontent in the soil profile. Sandy soils of low clay contentare common and tend to have an inherently highersusceptibility to erosion by wind. Land clearance hasexacerbated the problem of wind erosion on susceptiblesoils. Land clearance involves the removal of deep-rootedperennial native vegetation and replacement with shallow-rooted annual crops and pastures. Removal of the soil-binding action and wind speed mitigation provided bydeep-rooted perennials increases the risk of soil erosion.We can assume that the replanting of land with the deep-rooted perennial biomass species will mitigate soil winderosion through the permanent soil-binding action of theroot systems and the improved protection of the soil fromwind exposure. Hence, the large-scale planting of biomassspecies can help address regional wind erosion mitigationobjectives in the study area.Wind erosion potential is mapped into five classes from
high to low based on the clay content of the soil. There ismore than 7200 ha mapped as high wind erosion potentialin the study area which is considered to be unsuitable forcropping and a further 32,000 ha classed as moderatelyhigh which is only semi-arable.Over 96,000 ha of moderate, moderately high, and high
wind erosion potential land are economically viable forbiomass production in the Corridor study area (Table 3).This includes over 2000 ha of high wind erosion potentialand nearly 6000 ha of moderately high wind erosionpotential. Thus, biomass production has the potential toremediate around 53% of the land classified as having amoderate or greater potential for wind erosion in the studyarea.
Institutional design issues
Conservatively, the results of this analysis indicate thatbiomass production in many areas of the South AustralianRiver Murray Corridor is likely to provide returns similar

ARTICLE IN PRESS
Table 3
Cross-tabulation of areas (ha) showing relationship between the economic
viability of biomass production (EAE/ha) with Wind Erosion Potential
EAE/ha Wind erosion potential
High Mod. High Moderate Mod. Low Low
p$0 2568 10,607 71,185 141,660 41,325
$0–$30 2019 4833 77,734 154,110 58,926
$30–$70 226 961 11,020 29,086 16,033
4$70 0 0 13 748 5039
B.A. Bryan et al. / Land Use Policy 25 (2008) 533–549 547
to or marginally more profitable than existing agriculture.This analysis was based on the assumption that returnsfrom agriculture remain constant. This may not be the caseespecially in the light of estimates of increased tempera-tures and decreased rainfall associated with climate change(Luo et al., 2005b). Luo et al. (2005a) estimate a decrease ingrain yield of wheat between 3% and 58% in the regionunder their most likely climate change scenario. However,several factors may combine to negate the influence ofclimate change. Farmers are very adaptable and willundoubtedly adapt land management practices and agri-cultural systems to cope with climate change. In addition,improvements in technology such as drought-resistant cropgenotypes, pesticides and fertilisers may also combat theinfluence of climate change. Biomass production involvesthe plantation of locally adapted, deep-rooted tree specieswhich are much more suited to the dryer, warmerconditions anticipated under climate change scenarios.A warmer, dryer climate will also reduce the productivityof oil mallees although probably not as much as cerealcrops (Bryan et al., 2007). In addition, because oil malleesare a deep-rooted perennial species the likelihood of cropfailure is less compared to cereals. As such, as anagricultural enterprise, biomass is a much more resilientagricultural system. These considerations enhance thepicture of economic viability of biomass given theuncertainty of future conditions.
Carbon sequestration and trading also looms as anotherpotential economic incentive for biomass production in theCorridor study area. In the context of biomass production,there is potential to trade below ground carbon sequestra-tion and the carbon emission reductions achieved throughthe production of renewable electricity in an integrated treeprocessing plant. The additional income generated from apotential involvement in carbon trading could increasefurther the profitability of biomass.
However, the realisation of a viable biomass industryinvolves much more than demonstrating its potentialviability. A viable biomass industry in the Corridor iscontingent on the synchronised establishment of anIntegrated Tree Processing plant and contractual biomassproduction arrangements finalised with landholders.A substantial industry development initiative, nominallyled by the SA government or other relevant agencies suchas the Regional Development Board, is likely to hasten the
uptake of the biomass enterprise opportunity. Co-involve-ment by the private sector would further speed thedevelopment of a biomass industry. In Western Australia,involvement by the state government and a private powercompany provided momentum in the biomass industryincluding the establishment of the processing plant. Wehave already had enquiries from renewable energy compa-nies regarding this research so the future looks bright forthe establishment of biomass industry in the SA RiverMurray region.Concomitantly, establishment of a biomass industry
requires large-scale land use change. Demonstration ofeconomic viability may be necessary but not sufficient tosecure the uptake of biomass production by landholders ata scale to guarantee the plant supply. Land use changedemands significant extension work, education and in-formation provision to create the inertia required for large-scale land use conversion. Traditional agricultural produc-tions of cereals, wool and meat have well knownproduction costs coupled with access to established androbust markets. There is substantial risk involved inconversion to new and untested biomass crops for farmers.One way of reducing this risk is to establish contractualarrangements. There are several possible models includingprivate contractual arrangements between the commercialsector (e.g. energy companies) and landholders, farmer’sco-operatives, and other agroforestry models.Contractual arrangements may also remedy the delayed
cash flow problem; where the first returns from biomass areonly realised after first harvest at 6 yrs. Existingcontractual and management models have successfullyaddressed the cash flow timing constraints and impedi-ments that make perennial plantings unattractive tolandholders. Contracts guaranteeing fixed annual pay-ments may be required to encourage the conversion of landuse to biomass production. Contractual arrangements mayneed to be established that provide a regular payment tolandholders such as the Equal Annual Equivalent payment.
Conclusion
Biomass production was found to be potentiallyeconomically viable in the Corridor study area and themost profitable sites and under the Most Likely Scenariomodelled, could return a NPV of $88 million more thanexisting agricultural land uses over 100 yrs of simulation.Under the Most Likely Scenario, profitable areas werefound to produce many times the amount of biomassrequired to supply a single 5MW integrated tree processingplant. Hence, if the market for renewable energy, oil andactivated charcoal creates sufficient demand, farm produc-tion could support several 5MW or larger plants. Addi-tional environmental benefits would accrue from theseplantings and production costs may be reduced througheconomies of scale.Sensitivity analysis suggests that there is some risk
involved and sufficient biomass production was not
ARTICLE IN PRESSB.A. Bryan et al. / Land Use Policy 25 (2008) 533–549548
guaranteed under all reasonable economic model para-meter values to ensure a viable biomass industry in theregion. Offsetting this, the Eucalyptus species planted forbiomass production are more resilient that cereal crops andpastures to the drier, more erratic rainfall patterns expectedunder climate change scenarios.
Biomass production has the potential to reduce riversalinity and wind erosion and thereby contribute toregional environmental objectives. Whilst the river salinitybenefits of economically viable areas of biomass produc-tion under the Most Likely Scenario are limited (2.65EC),the wind erosion benefits are more substantial including thepotential to stabilise over 96,000 ha of land classified ashaving a moderate or higher wind erosion potential. Inaddition, the production of renewable energy from biomasscan have benefits for global scale climate change throughreducing over 1.7million tonnes of carbon dioxide emis-sions per annum from coal-based electricity generation.The environmental benefits of biomass production, sharedpublicly by the off-farm community, may be sufficient tojustify the effort and expenditure required by governmentto facilitate the establishment an integrated tree processingplant to support a biomass industry. Careful institutionaldesign is required however, to assuage risk to farmersthrough robust contractual arrangements and increaseadoption through farm extension.
Spatially heterogeneous economic and environmentalprocesses have been integrated in this analysis of biomassproduction as a land use policy for achieving local scaleenvironmental benefits with complementary impacts on theglobal scale process of climate change. The spatial analysistechniques used in this study enables analysis of productioneconomics at the scale of the farm-based decision makingunit and the quantification of the explicit areas in thelandscape where biomass production is profitable. At thiscommensurate scale of analysis, the landscape processes ofwind erosion and salinisation were able to be modelled andthe local-scale environmental impacts of biomass produc-tion evaluated in detail. The spatially explicit results of thisstudy can also be used to guide targeted informationprovision and extension by management agencies in thoseparts of the study area that are both more likely to beprofitable for biomass production and produce attendantenvironmental benefits.
Acknowledgements
The authors gratefully acknowledge financial assistancefor and guidance of this project by the South AustralianDepartment of Water, Land and Biodiversity Conservationand the CSIRO Flagship ‘Water for Healthy Country’.
References
Akmal, M., Thorpe, S., Dickson, A., Burg G., Klijn N., 2004. Australian
Energy: National and State Projections to 2019–20, ABARE eReport
04.11. Prepared for the Australian Government Department of
Industry, Tourism and Resources, Canberra.
Askew, M.F., Holmes, C.A., 2002. The potential for biomass and energy
crops in agriculture in Europe, in land use, policy and rural economy
terms. International Sugar Journal 104 (1247), 482 (Reprinted from
Aspects in Applied Biology 65, 365–374, 2001).
Australian Greenhouse Office (AGO), 2003. Greenhouse gas abatement
program website. /http://www.greenhouse.gov.au/ggap/round3/emis-
sion-factors.htmlS (accessed 8.9.2004).
Barnett, S.R., Yan, W., Watkins, N.R., Woods, J.A., Hyde, K.M., 2002.
Murray Darling Basin salinity audit: groundwater modelling to predict
future salt loads to the River Murray in South Australia. Department
of Primary Industries and Resources Report DWR 2001/017.
Bell, D.T., 1999. Australian trees for the rehabilitation of waterlogged and
salinity-damaged landscapes. Australian Journal of Botany 47 (5),
697–716.
Bennell, M., Hobbs, T., Ellis, M., 2004. FloraSearch species and industry
evaluation: low rainfall agroforestry options for southeastern Aus-
tralia. A report for the RIRDC/Land and Water Australia/FWPRDC/
MDBC Joint Venture Agroforestry Program. SA Department of
Water, Land and Biodiversity Conservation.
Bryan, B., Marvanek, S., 2004. Quantifying and valuing land use change
for Integrated Catchment Management evaluation in the Murray-
Darling Basin 1996/97–2000/01. Stage 2 Report to the Murray-Darling
Basin Commission, CSIRO Land and Water.
Bryan, B., Crossman, N., Shultz, T., Connor, J., Ward, J., 2005.
Systematic Regional Planning for Multiple Objective Natural Re-
source Management. Stage 2 Client Report for the River Murray
Dryland Corridor Project, CSIRO Land and Water. ISBN
0643091963, Folio S/05/225.
Bryan, B.A., Crossman, N.D., King, D., McNeill, J., Wang, E., Barrett, G.,
Ferris, M.M., Morrison, J.B, Pettit, C., Freudenberger, D., O’Leary, G.,
Fawcett, J., Meyer, W., 2007. Lower Murray Landscape Futures
Dryland Component: Vol. 3—Preliminary Analysis and Modelling.
CSIRO Water for a Healthy Country, 378pp.
Bungart, R., Bens, O., Huttl, R.F., 2000. Production of bioenergy in post-
mining landscapes in Lusatia—perspectives and challenges for alter-
native landuse systems. Ecological Engineering 16, S5–S16.
Cleugh, H., Bennell, M., 2002. Using windbreaks to protect soil, crops and
livestock and integrating agroforestry into low rainfall farming
systems. RIRDC Project No. CSL-10A and SAR-19A.
Commonwealth of Australia, 2001. Renewable Energy (Electricity) Act
2000, the Renewable Energy (Electricity) Regulations 2001.
Connor, J.D., Bryan, B.A., 2005. River Murray Dryland Corridor
Revegetation Policy Options. Policy and Economic Research Unit,
CSIRO Land and Water.
Cook, P.G., Leaney, F.W., Miles, M., 2004. Groundwater Recharge in the
North-East Mallee Region, South Australia. CSIRO Land and Water
Technical Report No. 25/04.
Ellis, M., 2001. The potential for biomass industries in the lower rainfall
agricultural areas of South Australia. A strategic approach to new
large scale revegetation opportunities. Land Management and
Revegetation Program, Sustainable Resources, PIRSA.
Enecon Pty Ltd., 2001. Integrated Tree Processing of Mallee Eucalypts.
A Report for the RIRDC/Land and Water Australia/FWPRDC Joint
Venture Agroforestry Program. RIRDC Publication No. 01/160.
RIRDC Project No. OIL-3A.
ETSA, 2004a. ETSA utilities’ charges-effective 1 July 2004. Website
/http://www.etsautilities.com.au/networktariffsv1.4S (accessed
17.8.2004).
ETSA, 2004b. Murraylands regional development plan. Website: /http://
www.etsautilities.com.au/pdf/ESDPIssue1.0.pdfS (accessed
17.8.2004).
Freppaz, D., Minciardi, R., Robba, M., Rovatti, M., Sacile, R.,
Taramasso, A., 2003. Optimizing forest biomass exploitation for
energy supply at a regional level. Biomass & Bioenergy 26 (1), 15–25.
Gallagher, P.W., Dikeman, M., Fritz, J., Wailes, E., Gauthier, W.,
Shapouri, H., 2003. Supply and social cost estimates for biomass from
ARTICLE IN PRESSB.A. Bryan et al. / Land Use Policy 25 (2008) 533–549 549
crop residues in the United States. Environmental and Resource
Economics 24 (4), 335–358.
Goor, F., Davydchuk, V., Ledent, J.F., 2001. Assessment of the potential
of Willow Src plants for energy production in areas contaminated by
radionuclide deposits: methodology and perspectives. Biomass &
Bioenergy 21 (4), 225–235.
Hallam, A., Anderson, I.C., Buxton, D.R., 2001. Comparative economic
analysis of perennial, annual, and intercrops for biomass production.
Biomass & Bioenergy 21 (6), 407–424.
Hobbs, T., Bennell, M., 2005. Plant biometrics and biomass productivity
in the River Murray Dryland Corridor. A Report for the SA Centre
for Natural Resource Management. Cooperative Research Centre for
Plant-based Management of Dryland Salinity.
Hoffert, M.I., Caldeira, K., Benford, G., Criswell, D.R., Green, C.,
Herzog, H., Jain, A.K., Kheshgi, H.S., Lackner, K.S., Lewis, J.S.,
Lightfoot, H.D., Manheimer, W., Mankins, J.C., Mauel, M.E.,
Perkins, L.J., Schlesinger, M.E., Volk, T., Wigley, T.M.L., 2002.
Advanced technology paths to global climate stability: energy for a
greenhouse planet. Science 298 (5595), 981–987.
Hoogwijk, M., Faaij, A., Eickhout, B., de Vries, B., Turkenburg, W.,
2005. Potential of biomass energy out to 2100, for four IPCC SRES
land-use scenarios. Biomass & Bioenergy 29 (4), 225–257.
Howard, B., Olszak, C., 2004. Fuelling landscape repair: a bioenergy
industry as a sustainable land-use and energy option for Australia.
A Report Prepared for the Australian Conservation Foundation and
Joint Venture Agroforestry Program, with the Assistance of the Myer
Foundation. RIRDC Publication No. 04/098. RIRDC Project No.
URS-1A.
INRM Group, 2003. Integrated Natural Resource Management Plan for
the South Australian Murray-Darling Basin. The Integrated Natural
Resource Management Group for the South Australian Murray-
Darling Basin Inc.
IPCC, 1996. Climate change 95: the science of climate change. In:
Houghton, J.T., et al. (Eds.), Contribution of Working Group I to the
Second Assessment Report of the Intergovernmental Panel on Climate
Change. Cambridge University Press, Cambridge.
Kumar, A., Cameron, J.B., Flynn, P.C., 2003. Biomass power cost and
optimum plant size in Western Canada. Biomass & Bioenergy 24 (6),
445–464.
Lefroy, E.C., Stirzaker, R.J., 1999. Agroforestry for water management in
the cropping zone of southern Australia. Agroforestry Systems 45
(1–3), 277–302.
Luo, Q., Bryan, B.A., Williams, M.A.J., Bellotti, W., 2005a. Spatial
analysis of environmental change impacts on wheat production in
Mid-Lower North, South Australia. Climatic Change 72 (1/2),
213–228.
Luo, Q., Jones, R., Williams, M., Bryan, B.A., Bellotti, W., 2005b.
Construction of probabilistic atmospheric change scenarios and their
application in risk analysis. Climate Research 29 (1), 41–52.
MDBC, 2001. Sasin Salinity Management Strategy 2001–2015. Murray-
Darling Basin Commission.
Miranda, M.L., Hale, B., 2001. Protecting the forest from the trees: the
social costs of energy production in Sweden. Energy Journal 26 (9),
869–889.
Moller, B., Nielsen, P.S., 2007. Analysing transport costs of Danish forest
wood chip resources by means of continuous cost surfaces. Biomass &
Bioenergy 31 (5), 291–298.
Monti, A., Fazio, S., Lychnaras, V., Soldatos, P., Venturi, G., 2007. A full
economic analysis of Switchgrass under different scenarios in Italy
estimated by BEE Model. Biomass & Bioenergy 31 (4), 177–185.
Nelson, R.G., Ascough II, J.C., Langemeier, M.R., 2006. Environmental
and economic analysis of switchgrass production for water quality
improvement in northeast Kansas. Journal of Environmental Manage-
ment 79 (4), 336–347.
Nord-Larsen, T., Talbot, B., 2004. Assessment of forest-fuel resources in
Denmark: technical and economic availability. Biomass & Bioenergy
27 (2), 97–109.
Raison, R.J., 2006. Opportunities and impediments to the expansion of
forest bioenergy in Australia. Biomass & Bioenergy 30 (12),
1021–1024.
Rosenberg, N.J., 2007. A Biomass Future for the North American Great
Plains: Toward Sustainable Land Use and Mitigation of Greenhouse
Warming. Advances in Global Change Research: Vol. 27. Springer.
Rozakis, S., Soldatos, P.G., Kallivroussis, L., Nicolaou, I., 2001. Multiple
criteria analysis of bio-energy projects: evaluation of bio-electricity
production in Farsala Plain, Greece. Journal of Geographic Informa-
tion and Decision Analysis 5 (1), 49–64.
Sadras, V., 2004. Development of multi-purpose biomass industries for the
South Australian Murray Mallee—Project Phase 1. CSIRO Land and
Water Client Report.
Sands, R.D., Leimbach, M., 2003. Modeling agriculture and land use in an
integrated assessment framework. Climatic Change 56 (1), 185–210.
Schneider, U.A., McCarl, B.A., 2003. Economic potential of biomass
based fuels for greenhouse gas emission mitigation. Environmental and
Resource Economics 24 (4), 291–312.
Schneider, L.C., Kinzig, A.P., Larson, E.D., Solorzano, L.A., 2001.
Method for Spatially Explicit Calculations of Potential Biomass Yields
and Assessment of Land Availability for Biomass Energy Production
in Northeastern Brazil. Agriculture, Ecosystems and Environment 84
(3), 207–226.
Skarback, E., Becht, P., 2005. Landscape perspective on energy forests.
Biomass & Bioenergy 28 (2), 151–159.
Steininger, K.W., Voraberger, H., 2003. Exploiting the medium term
biomass energy potentials in Austria: a comparison of costs and
macroeconomic impact. Environmental and Resource Economics 24
(4), 359–377.
Sterner, T., 2003. Policy Instruments for Environmental and Natural
Resource Management. Washington, Resources for the Future.
Tolbert, V.R., Wright, L.L., 1998. Environmental enhancement of US
biomass crop technologies: research results to date. Biomass &
Bioenergy 15 (1), 93–100.
Updegraff, K., Baughman, M.J., Taff, S.J., 2004. Environmental benefits
of cropland conversion to hybrid poplar: economic and policy
considerations. Biomass & Bioenergy 27 (5), 411–428.
Vandenhove, H., Goor, F., O’Brien, S., Grebenkov, A., Timofeyev, S.,
2002. Economic viability of short rotation coppice for energy
production for reuse of caesium-contaminated land in Belarus.
Biomass & Bioenergy 22 (6), 421–431.
Van Ierland, E., Lansink, A.O., 2003. Editorial introduction: economics of
sustainable energy and agriculture. Environmental and Resource
Economics 24 (4), 287–289.
Varela, M., Lechon, Y., Saez, R., 1999. Environmental and socioeconomic
aspects in the strategic analysis of a biomass power plant integration.
Biomass & Bioenergy 17 (5), 405–413.
Varela, M., Saez, R., Audus, H., 2001. Large-scale economic integration
of electricity from short-rotation woody crops. Solar Energy 70 (2),
95–107.
Vitousek, P.M., Mooney, H.A., Lubchenco, J., Melillo, J.M., 1997.
Human domination of earth’s ecosystems. Science 277 (5325),
494–499.
Walsh, M.E., Ugarte, D.G.D., Shapouri, H., Slinsky, S.P., 2003.
Bioenergy crop production in the United States—potential quantities,
land use changes, and economic impacts on the agricultural sector.
Environmental and Resource Economics 24 (4), 313–333.
Ward, J., Trengove, G., 2005. Developing re-vegetation strategies by
identifying biomass based enterprise opportunities in the mallee areas of
South Australia: CSIRO Client Report for South Australian Depart-
ment Water, Land, Biodiversity and Conservation. Folio S/04/1161.
Ward, J., Bryan, B.A., Gale, G., Hobbs, T., 2005. Market-based
instrument approaches to implementing priority revegetation in the
South Australian Murray-Darling Basin. CSIRO Land and Water
Client report.
Williams, J., Saunders, D., 2005. Land use and ecosystems. In: Goldie, J.,
Douglas, B., Furnass, B. (Eds.), In Search of Sustainability. CSIRO
Publishing, Victoria.