an appreciation of john nix - the institute of agricultural
TRANSCRIPT
DOI: 10.5836/ijam/2018-07-01
An appreciation of John Nix
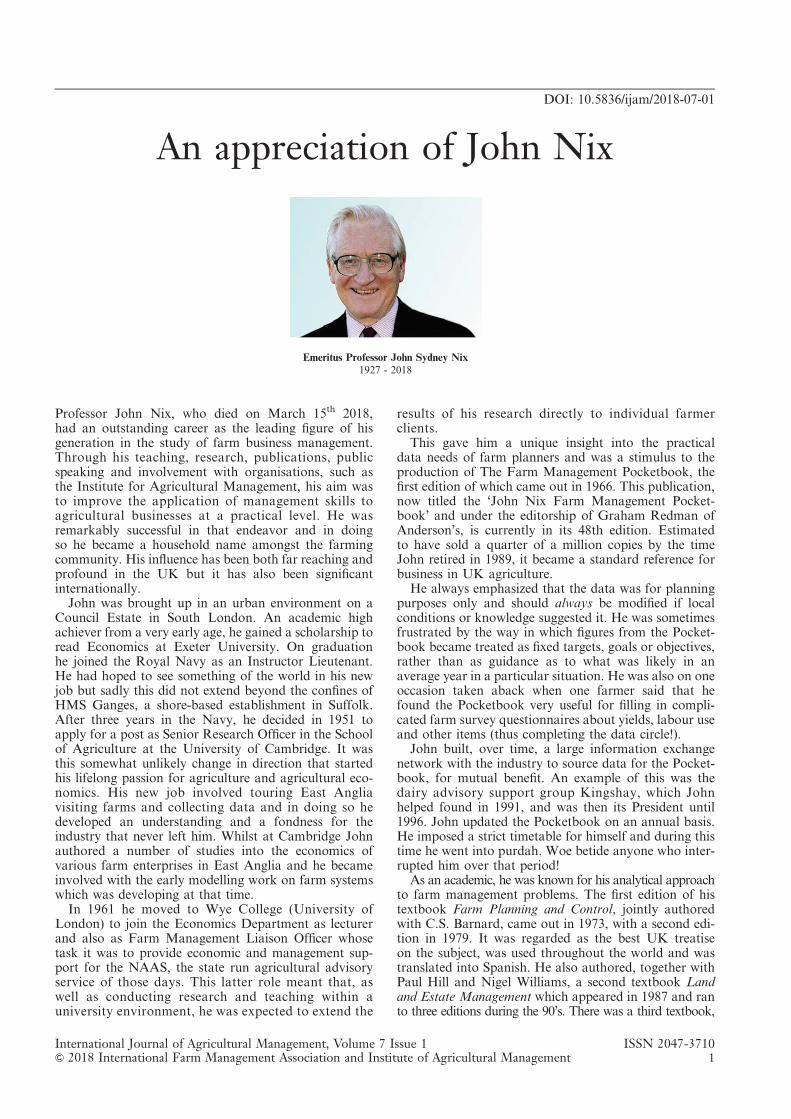
Professor John Nix, who died on March 15th 2018,had an outstanding career as the leading figure of hisgeneration in the study of farm business management.Through his teaching, research, publications, publicspeaking and involvement with organisations, such asthe Institute for Agricultural Management, his aim wasto improve the application of management skills toagricultural businesses at a practical level. He wasremarkably successful in that endeavor and in doingso he became a household name amongst the farmingcommunity. His influence has been both far reaching andprofound in the UK but it has also been significantinternationally.
John was brought up in an urban environment on aCouncil Estate in South London. An academic highachiever from a very early age, he gained a scholarship toread Economics at Exeter University. On graduationhe joined the Royal Navy as an Instructor Lieutenant.He had hoped to see something of the world in his newjob but sadly this did not extend beyond the confines ofHMS Ganges, a shore-based establishment in Suffolk.After three years in the Navy, he decided in 1951 toapply for a post as Senior Research Officer in the Schoolof Agriculture at the University of Cambridge. It wasthis somewhat unlikely change in direction that startedhis lifelong passion for agriculture and agricultural eco-nomics. His new job involved touring East Angliavisiting farms and collecting data and in doing so hedeveloped an understanding and a fondness for theindustry that never left him. Whilst at Cambridge Johnauthored a number of studies into the economics ofvarious farm enterprises in East Anglia and he becameinvolved with the early modelling work on farm systemswhich was developing at that time.
In 1961 he moved to Wye College (University ofLondon) to join the Economics Department as lecturerand also as Farm Management Liaison Officer whosetask it was to provide economic and management sup-port for the NAAS, the state run agricultural advisoryservice of those days. This latter role meant that, aswell as conducting research and teaching within auniversity environment, he was expected to extend the
results of his research directly to individual farmerclients.
This gave him a unique insight into the practicaldata needs of farm planners and was a stimulus to theproduction of The Farm Management Pocketbook, thefirst edition of which came out in 1966. This publication,now titled the ‘John Nix Farm Management Pocket-book’ and under the editorship of Graham Redman ofAnderson’s, is currently in its 48th edition. Estimatedto have sold a quarter of a million copies by the timeJohn retired in 1989, it became a standard reference forbusiness in UK agriculture.
He always emphasized that the data was for planningpurposes only and should always be modified if localconditions or knowledge suggested it. He was sometimesfrustrated by the way in which figures from the Pocket-book became treated as fixed targets, goals or objectives,rather than as guidance as to what was likely in anaverage year in a particular situation. He was also on oneoccasion taken aback when one farmer said that hefound the Pocketbook very useful for filling in compli-cated farm survey questionnaires about yields, labour useand other items (thus completing the data circle!).
John built, over time, a large information exchangenetwork with the industry to source data for the Pocket-book, for mutual benefit. An example of this was thedairy advisory support group Kingshay, which Johnhelped found in 1991, and was then its President until1996. John updated the Pocketbook on an annual basis.He imposed a strict timetable for himself and during thistime he went into purdah. Woe betide anyone who inter-rupted him over that period!
As an academic, he was known for his analytical approachto farm management problems. The first edition of histextbook Farm Planning and Control, jointly authoredwith C.S. Barnard, came out in 1973, with a second edi-tion in 1979. It was regarded as the best UK treatiseon the subject, was used throughout the world and wastranslated into Spanish. He also authored, together withPaul Hill and Nigel Williams, a second textbook Landand Estate Management which appeared in 1987 and ranto three editions during the 90’s. There was a third textbook,
Emeritus Professor John Sydney Nix1927 - 2018
International Journal of Agricultural Management, Volume 7 Issue 1 ISSN 2047-3710& 2018 International Farm Management Association and Institute of Agricultural Management 1
Farm Mechanisation for Profit with Bill Butterworthappearing in 1983.
In 1973, following the expansion of the economicsteaching at Wye, John was appointed as Head of theFarm Business Unit. He lost no time in developing atight unit with a strong focus on teaching and research.He was always supportive of his staff in the developmentof their own careers and encouraged them to explorewhatever avenues they felt might be productive. He wasa popular lecturer with a heavy teaching load both atundergraduate and postgraduate levels. His notes werelegendary, often consisting of a few ragged foolscapsheets with scribbles added year after year until almostillegible. One of his secretaries even found a discardedsheet and had it framed. He supervised many PhDstudents and a number of these became good lifelongfriends. Shortly after his retirement in 1989, he wasappointed Emeritus Professor and in 1995 he was madea Fellow of Wye College.
John’s personal success and that of the FBU at Wyeled to him being granted a personal chair in Farm Busi-ness Management in 1982, the first such chair in the UK.In 1984 he oversaw the introduction of the undergraduatedegree in Agricultural Business Management at Wye.This became highly successful and well regarded. Despitehis commitments within College, he always maintained aheavy programme of lectures at farmers’ meetings, con-ferences and other gatherings up and down the country.He was in demand as a speaker or advisor to manyorganisations associated with the industry. At one timehe was a regular on local television. His easy style andwillingness to explain things in simple language endearedhim to his audiences.
John had considerable influence within the Agricul-tural Economics Society and the Institute of Agricultural
Management. He was President of the AES in 1990-91and in 2011 the Society honoured him with its Award forExcellence in recognition of his outstanding contribu-tion to public policy and the farming industry. He was afounder member of the Farm Management Associationwhich was formed in 1965. He chaired the FMA from1978 to 1981 and edited the journal Farm Managementfrom 1971 to 1995. The organisation was later to becomethe Centre for Management in Agriculture and is nowknown as the Institute of Agricultural Management. TheInstitute honoured him with its first National Award in1982 and a Fellowship in 1993.
The large number of other awards which John receivedgive some indication of the very high regard in which hewas held in the industry as well academia: Companionof the British Institute of Management (1983), Fellow ofthe Royal Society of Arts (1984), Fellow of the RoyalAgricultural Society (1985), Agricultural Communica-tors Award (first recipient in 1999), The Farmers ClubCup (2005), NFU Lifetime Achievement Award (2006),Honorary Fellow of the Royal Agricultural Society ofEngland (2007) and the Farmers Weekly LifetimeAchievement Award (2014).
John’s life was one full of extraordinary achievementand impact within the subject of farm business manage-ment and on the agricultural industry. But for those thatknew him and worked with him it will be the extra-ordinary warmth of his personality, enthusiasm andfriendship that has left such a huge impression on somany of their lives. His first wife Mavis, by whom he hadtwo daughters and a son, died in 2004. In 2005 hemarried Sue who survives him.
James V.H. Jones and Paul Webster
ISSN 2047-3710 International Journal of Agricultural Management, Volume 7 Issue 12 & 2018 International Farm Management Association and Institute of Agricultural Management
James V.H. Jones and Paul Webster An appreciation of John Nix
REFEREED ARTICLEDOI: 10.5836/ijam/2018-07-03
Till death do us part: Exploring the Irishfarmer-farm relationship in later life
through the lens of ‘Insideness’SHANE FRANCIS CONWAY1*, JOHN McDONAGH1, MAURA FARRELL1 and ANNE KINSELLA2
ABSTRACTThe senior generation’s unwillingness to relinquish managerial duties and retire is a globally recognizedcharacteristic of intergenerational family farm transfer. This is despite the array of financial incentives putin place to stimulate and entice the process. Applying Rowles’ concept of ‘insideness’ as a theoreticalframework, this paper brings into focus the suitability and appropriateness of previous and existing farmtransfer policy strategies, by presenting an insightful, nuanced analysis of the deeply embedded attachmentolder farmers have with their farms, and how such a bond can stifle the necessary hand over of the farmbusiness to the next generation. This research employs a multi-method triangulation design, consisting ofa self-administered questionnaire and an Irish adaptation of the International FARMTRANSFERS Surveyin conjunction with complimentary Problem-Centred Interviews, to generate a comprehensive insight intothe intricate, multi-level farmer-farm relationship in later life. The overriding themes to emerge from thecontent analysis of the empirical research are farmer’s inherit desire to stay rooted in place in old age andalso to maintain legitimate connectedness within the farming community by remaining active and pro-ductive on the farm. Additionally, there is a strong sense of nostalgia attributed to the farm, as it is found torepresent a mosaic of the farmer’s achievements as well as being a landscape of memories. The paperconcludes by suggesting that a greater focus on the farmer-farm relationship has the potential to finallyunite farm transfer policy efforts with the mind-set of its targeted audience, after decades of disconnect.
KEYWORDS: family farming; insideness; succession; retirement; generational renewal; rural sustainability
1. Introduction
1.1 BackgroundThe survival, continuity and future prosperity of theagricultural sector, traditional family farm model andbroader sustainability of rural society ultimately dependson an age-diverse farming population. With a steadydecline in the number of young farm families reported asbeing key in the demoralization of rural communities inwhich the farm is located (Ball and Wiley, 2005; Goeller,2012), and the recent declaration by European Commis-sioner for Agriculture and Rural Development, PhilHogan, that a priority for future CAP reforms mustfocus on generational renewal (European Commission,2017), it is increasingly clear that a major challengepresents itself in the area of intergenerational familyfarm transfer. Intergenerational family farm transfer,encompassing three separate yet interrelated processesof succession, retirement and inheritance (Gasson andErrington, 1993), is an integral facet of farm management.While present attempts to confront the global demographic
trend of an ageing farming population and a low level ofland mobility (Ingram and Kirwan, 2011; Bogue, 2013;Chiswell, 2014; Fischer and Burton, 2014; Zagata andSutherland, 2015), have added significantly to existingknowledge in this field, there are numerous, intricateemotional facets affecting the older generation’s farmtransfer decision-making process, which for the mostpart have been neglected (Conway et al., 2016). Theoutcome; a derailment of the process in many cases (ibid).
This paper, drawing on gerontological geographer,Graham Rowles’ (1983a) concept of ‘insideness’, con-textualises the difficulty and reluctance to ‘step aside’ andretire from farming (Foskey, 2005; Lobley et al., 2010;Ingram and Kirwan, 2011; Fasina and Inegbedion, 2014)that continues to be the mainstay in many rural areasglobally. The paper probes into the subjective experiencesof farmers in the Republic of Ireland in later life andunearths a layer of understanding and attachment, bothimplicit and explicit, between farmer and farm, that weargue must be central to policies aimed at facilitatingfamily farm intergenerational transfer. Reinforcing the
1Discipline of Geography, National University of Ireland, Galway, University Road, Galway, Ireland.2Teagasc Agricultural Economics and Farms Surveys Department, Mellows Campus, Athenry, Co. Galway, Ireland.
*Corresponding author: Email: [email protected].
Original submitted March 20 2017; revision received January 07 2018; accepted April 18 2018.
International Journal of Agricultural Management, Volume 7 Issue 1 ISSN 2047-3710& 2018 International Farm Management Association and Institute of Agricultural Management 3
urgency, is the realisation that this phenomenon has resultedin significant socio-economic challenges for young peopleaspiring to embark on a career in farming (Kirkpatrick,2013), with adverse implications not only on the devel-opment trajectory of individual family farms and ruralcommunities, but also on the production efficiency andeconomic growth of the agri-food sector as a whole(ADAS, 2004; Ingram and Kirwan, 2011; Goeller, 2012).In the Republic of Ireland, young people’s entry intofarming is particularly inflexible, due to the fact that entryto the sector is predominately by inheritance or purchasinghighly inflated farmland (Gillmor, 1999; NESC, 1997;Hennessy and Rehman, 2007); entry via leasing of land orpartnership arrangements, common in many countriesthroughout the world, are not widely practiced (ibid).Such a cultural anomaly requires immediate policy inter-vention. A recent report on ‘Land Mobility and Succes-sion in Ireland’ claims the lack of land mobility (i.e.transfer of land from one farmer to another, or fromone generation to the next) currently experienced in theRepublic of Ireland is stifling agricultural growth bypreventing young ‘enthusiastic’ farmers gaining access toproductive assets (Bogue, 2013).
1.2 Policy interventionsIn response to rigidity in the agrarian system, the policyenvironment in the Republic of Ireland has exploredvarious mechanisms of financially stimulating and entic-ing farm transfer over the past four decades. Little changehowever, in attitude amongst the older generation towardsintergenerational transfer has come about to date, resultingin an on-going resistance or at best ambivalence towardthe process (Commins and Kelleher 1973; Ryan, 1995;Gillmor, 1999; Bika, 2007; Bogue, 2013; Leonard et al.,2017; Conway et al., 2017). Conway et al. (2016) arguehowever that such policy measures aimed at facilitatingland mobility from one generation to the next were exces-sively preoccupied with financial incentives and have ‘littleor no regard’ for the older farmer’s emotional welfare(p.166). In particular, Conway et al., (ibid) strongly criti-cised the eligibility requirements for farmers entering themost recent largely unsuccessful Early Retirement Schemefor farmers (ERS 3, June, 2007), which included a clausethat stated that ‘Persons intending to retire under the schemeshall cease agricultural activity forever’ (DAFM, 2007).This type of language and sentiment was completelyoblivious to the consciousness of many older farmers.Indeed Conway et al. (2016) found that the potential lossof one’s lifelong accumulation of symbolic capital, withassociated characteristics of identity, status, position andauthority, upon transferring managerial control and retir-ing is a dilemma that farmers find difficult to accept andultimately resist (ibid).
Equally it could be argued that the lack of any greatunderstanding of a farmer’s psyche is also clearly visiblein the various attempts to develop ‘answers’ usually inthe form of tax initiatives (Meehan, 2012; Leonard et al.,2017) or unconventional tenures like Joint Farming Ven-tures (JFVs) for example. While there is merit in suchstructures, they do not, we would argue, fully grasp theenormity of a farmer’s attachment to his/her farm. Speci-fically, not unlike elsewhere in the world, JFVs, includingarrangements such as farm partnerships, contract rearingand share farming (Turner and Hambly, 2005; ADAS, 2007;
Ingram and Kirwan, 2011), have recently been promotedwithin Irish policy discourses as strategies that act as astepping stone to successful farm transfer (DAFM, 2011;Hennessy, 2014), subsequently helping to alleviate con-cerns of an ageing farming population and maximizeproduction efficiency. Ingram and Kirwan (2011) notehowever that while it appears that some older farmers arewilling in principle to offer JFV arrangements, when itcomes to the reality of ‘handing over control (or partialcontrol) of a business that they have been in charge of forperhaps 40 or 50 years’ (p.294) they are often reluctant todo so. Indeed, research indicates that the older generationcan experience difficulty relinquishing managerial controland ownership of the family farm, even to their own children(Barclay et al., 2012; Price and Conn, 2012; Whiteheadet al., 2012; Conway et al., 2017). Kirkpatrick’s (2013)study in the USA explains however that ‘in many casesthe older farmers’ sense of place and purpose attached tothe family farm’ supersedes any fiscal incentives thatencourages ‘the handing over of the family farm to thenext generation’ (p.4).
Consequently, if tax relief schemes or JFVs arrange-ments are unable to progress the desire for generationalrenewal on the farm, what are the obstructions that con-tinue to frustrate or delay the process and how mightthese be addressed? It is to this and the concept of farmer-farm attachment that we now consider.
1.3 Farmer-farm attachmentThis paper brings into focus the suitability and appro-priateness of previous and existing farm transfer policystrategies, by generating a comprehensive insight into thedeeply embedded relationship older farmers have withtheir farms; emulating Shucksmith and Hermann’s (2002),contention of the need to examine ‘farmers’ own ways ofseeing the world’ (p.39). While Conway et al.’s (2016)research into the human side of farm transfer identified thecomplex psychodynamic and sociodynamic factors thatinfluence the farm transfer decision-making process,existing research in the field has yet to thoroughly describeor explain the level of emotional attachment placed on thefamily farm and its embodied contents (i.e. land, farm-house, livestock). These ‘embodied contents’ are often devel-oped over several generations, and as such the bond createdoften affects the older farmer’s ability to deal with andaccept the inevitable challenges and changes broughtabout by the ‘twin process’ of succession and retirement.Price and Conn (2012) previously argued that ‘allowingfor succession is an emotional rather than rational pro-cess (p.101), resulting in decisions on whether to imple-ment the process or not, being based more on ‘heart thanhead’ (Taylor et al., 1998, p.568). It is therefore arguedhere that an in-depth understanding and knowledge offarmer-farm attachment is necessary and will aid in themodification of existing policies and/or the developmentof novel strategies that sensitively deal with problematicissues surrounding intergenerational farm transfer. Per-haps most importantly of all is the contention of thisresearch that in fully understanding the farmer-farm con-nection and allowing this to inform the type of decisionsbeing made, this will not only enable greater intergenera-tional transfers to take place but more significantly willhelp secure the well-being of farmers as they age.
Furthermore, given that succession planning is a rela-tively uncommon practice within the farming community
ISSN 2047-3710 International Journal of Agricultural Management, Volume 7 Issue 14 & 2018 International Farm Management Association and Institute of Agricultural Management
Exploring the Irish farmer-farm relationship in later life Shane Francis Conway et al.
(Kimhi and Lopez, 1999; Burton and Fischer 2015), andthere seems to be a cultural expectation that ‘farmersdon’t retire’ (Conway et al., 2016, p.172), this paper hasglobal relevance and will be of particular interest tocountries throughout the European Union where thehigh age profile of the farming community and the lowrate of succession and retirement have been matters of con-cern and unease for decades (Commins and Kelleher 1973;Gasson and Errington, 1993; Bika, 2007; Hennessy andRehman, 2007; Zagata and Sutherland, 2015). Europeandemographic trends reveal an inversion of the age pyra-mid with those aged 65 years and over constituting thefastest growing sector of the farming community (Zagataand Sutherland, 2015). Preliminary results from Eurostat’smost recent Farm Structure Survey indicate that 6% offarmers were aged 35 and under in 2013, while over 55%were aged 55 and older (European Commission, 2013;European Commission, 2015). Furthermore, Eurostat’sFarm Structure Survey highlights that for each farmeryounger than 35 years of age, there were 9 farmers olderthan 55 years (European Commission, 2012; EuropeanCommission, 2015). The situation in the Republic of Irelandis closely analogous to that of its European counterparts;in 2010, only 6.2% of Irish landowners were under35 years of age whilst 51.4% were over 55 years old(CSO, 2012). Between 2000 and 2010, those over 65 yearsincreased by 31%, while those within the 55 to 65 agebracket increased by 26%, with a 52.8% reduction in theamount of farmers aged less than 35 years recorded (ibid).
The next section presents the theoretical frameworkadopted, followed by a description of the methodologicalapproach employed, while thereafter the empirical evi-dence is used to explore the ‘farmers’ own ways of seeingthe world’ (Shucksmith and Hermann’s 2002, p.39). Thelatter part of the paper expands on this evidence andexamines potential pathways that we argue should informthose policy makers and key stakeholders who have themeans and ability to deliver interventions and program-mes for older farmers. The directions for future researchare also discussed.
2. Theoretical approach
This study is driven by a theoretical gap in the under-standing of farmer-farm relationship in later life.A growing body of work has pointed out that personalexperience gives meaning to places and contributes toself-identity (Chaudhury, 2008). Arguably, a formativework in the area of place attachment and identity amongstrural elderly persons in old age is Rowles’s (1983a) con-cept of ‘insideness’ (after Relph, 1976). In considering thegeographies of later life, Rowles (1990) explains thatinsideness involves ‘an intimate involvement with a placethat is grounded in personal history and qualitatively dif-ferentiates this place from space outside’ (p.107). Rowles’(1983a) three-year, in-depth ethnographic research onelderly people living in a rural Appalachian community inthe U.S.A. conceptualized three key dimensions of placeattachment: physical, social and autobiographical inside-ness. Although direct application of these concepts will bediscussed in the results sections, it is instructive to defineeach here. Physical insideness is characterized by ‘famil-iarity and habitual routines of habitation within the homesetting’ (Oswald and Wahl, 2005, p.29), resulting in thesense that an individual is able to ‘wear the setting like a
glove’ (Rowles, 1983b, p.114). This ‘body awareness’ ofspace (Rowles and Ravdal, 2002; Rowles, 1993), resultsfrom an intimacy with one’s ‘physical configuration stem-ming from the rhythm and routine of using the space overmany years’ (Rowles, 1984, p.146). Physical insidenessis also considered to significantly contribute to generalsatisfaction and well-being in old age (Rowles, 2006).Rowles (1983a) suggests that the intimacy of physicalinsideness is supplemented by a sense of social insideness,or immersion. Social insideness is fostered and developedthrough ‘everyday social interaction and the performanceof particular social roles in a neighbourhood’ (Riley, 2012,p.763). Furthermore, social insideness is considered to beparticularly significant in old age, as one may need todraw on these long-term relationships in accommodatingdeclining physical capabilities and health in later life(Rowles, 2008; Riley, 2012). Finally, the third sense ofinsideness in later life is ‘autobiographical insideness’.Autobiographical insideness extends beyond the physicalsetting or social milieu to create an environment that has‘a temporal depth of meaning’ (Rowles, 1983a, p. 303).Peace et al. (2005) add that autobiographical insideness is‘based on time and space, a historical legacy of life livedwithin a particular environment’ (p.194). Autobiographi-cal insideness has been suggested to be the most relevantto describe older people’s attachment to place because it isembedded in memories of significant experiences, relation-ships and events over one’s lifetime (Rowles, 1993; Dixonand Durrheim, 2000; Burns et al., 2012). According toRowles (1983b) this provides ‘a sense of identity and anever-present source of reinforcement for a biographyinterpreted from the retrospective vista of a life review’(p.114). Older people with strong ties to place may feelmore mastery as well as a greater sense of security andbelonging (Burns et al., 2012; Lecovich, 2014).
The three senses of insideness, expressing different,yet inextricably intertwined aspects of the rural elderlypopulations’ affinity with their home environment, havebeen extensively drawn upon by rural geographers,gerontological experts and occupational therapists inves-tigating the importance of space and place-identity in oldage (Dixon and Durrheim, 2000; Seamon, 2014; Degnen,2016). In a farming context, Riley (2012) previouslyemployed the concept of insideness to explore the chal-lenges and issues surrounding the occupational cessationand retirement relocation of retired farming couples in theUnited Kingdom, however there have been no studies car-ried out to date which have explicitly explored Rowles’sthree interrelated constructs of place attachment in laterlife amongst older, active and productive members of thefarming community. While it is acknowledged that theconcept of insideness does not cover every facet dictatingthe farm transfer decision-making process, it does con-tribute to identifying current needs and priorities withinpolicy and research by providing insight into the subjectiveexperience of farmers growing old on the farm, rather thanrelying solely on aggregate data. This aids in the inter-pretation of existing quantitative results in the field andthereby increases policy relevance.
3. Methodology
This research employs a multi-method triangulation designused by Conway et al., (2016), in conjunction with apreliminary exploration of data obtained from an Irish
International Journal of Agricultural Management, Volume 7 Issue 1 ISSN 2047-3710& 2018 International Farm Management Association and Institute of Agricultural Management 5
Shane Francis Conway et al. Exploring the Irish farmer-farm relationship in later life
adaptation of the International FARMTRANSFERSSurvey in an attempt to obtain a complete picture of theintricate, multi-level farmer-farm attachment in later lifeand the suitability of previous farm transfer policy strat-egies. A detailed survey was initially undertaken with324 farmers aged 55 and over in attendance at a series of‘Transferring the Family Farm’ clinics (TFFC) hosted byTeagasc (the Agriculture and Food Development Author-ity in Ireland) to investigate the attitudes and behaviouralintentions of the farming community towards successionand retirement. The reasoning for specifically focussing onfarmers aged 55 and over is that one of the terms and con-ditions for farmers intending to retire under the 2007 EarlyRetirement Scheme (ERS 3) was that participants musthave been ‘between his/her 55th and 66th birthday’ to beeligible (DAFM, 2007). Over 2,800 farmers attended theseclinics held at 11 different locations throughout the Republicof Ireland in September and October 2014. Sixty percent(n=194) of questionnaire respondents also gave theirconsent to be interviewed in more depth at a later date.
In order to validate, strengthen reliability and build onthe data gathered at the TFFC, the second phase of datacollection involved a list of copyright questions derivedfrom the International FARMTRANSFERS Survey,refined for Irish conditions, being included in the 2014Land Use/Mobility Farm Survey conducted by Teagasc(see footnote 1). Lobley and Baker (2012) explain thatthe FARMTRANSFERS project is an internationalcollaborative effort around a common research instru-ment that ‘yields a range of (largely quantitative) datarelating to the pattern, process and speed of successionand retirement which provides a firm base for futureinquiries utilising different methodologies’ (p.15). Todate, the survey, based on an original design developedby the late Professor Andrew Errington of the Universityof Plymouth in in 1991 (Errington and Tranter, 1991),has been replicated in 10 countries and 8 states in theU.S.A. and completed by over 15,600 farmers through-out the world (Lobley and Baker, 2012).
The FARMTRANSFERS data collected from a stra-tified random sample of 309 farmers aged 51 and over
included in the 2014 Land Use/Mobility Farm Survey andChoice Experiment analysis, representing over 80,000 farmsnationally, combined with the 43,000 invitations sent out byTeagasc to each of their farmer clients to attend the TFFC,provides a thoroughly comprehensive nationally represen-tative sample of the Irish farming population across abroad spectrum of farming operations, typologies, geogra-phical location and scale. Such an expansive sample of Irishfarmers is important due to the fact that different farmingregions exist around the country, where boundaries spanunevenly across county perimeters. The largest concentra-tion of small sized farms occurs in the Western and Borderregions for example, with the largest farms in the South-East, Mid-East and Dublin areas (Lafferty et al., 1999).
The next phase of data collection involved a Problem-Centred Interview (PCI) approach, to peel back thelayers and broaden the two farmer survey responses andin doing so, inform possible new policies. Witzel (2000)explains that PCI can be combined with questionnairesin order to ‘solve the problems arising in connection withsamples and to relate the results generated by differentprocedures’ (p.3). Following frequency distribution andcross-tabulation analysis of aggregate data obtained atthe TFFC and the FARMTRANSFERS survey on theStatistical Packages for Social Sciences (SPSS) pro-gramme, in conjunction with an additional review ofrelevant literature in the field, it was possible to drawn upa specific PCI guideline containing preformulated ques-tions on the issues that were identified to be subjectivelysignificant to the sample farming population. A 10%(n=19) sample of farmers recruited at the TFFC for theinterview phase of data collection were sourced using asystematic sampling technique (see Table 1) and subse-quently interviewed from May until August 2015.
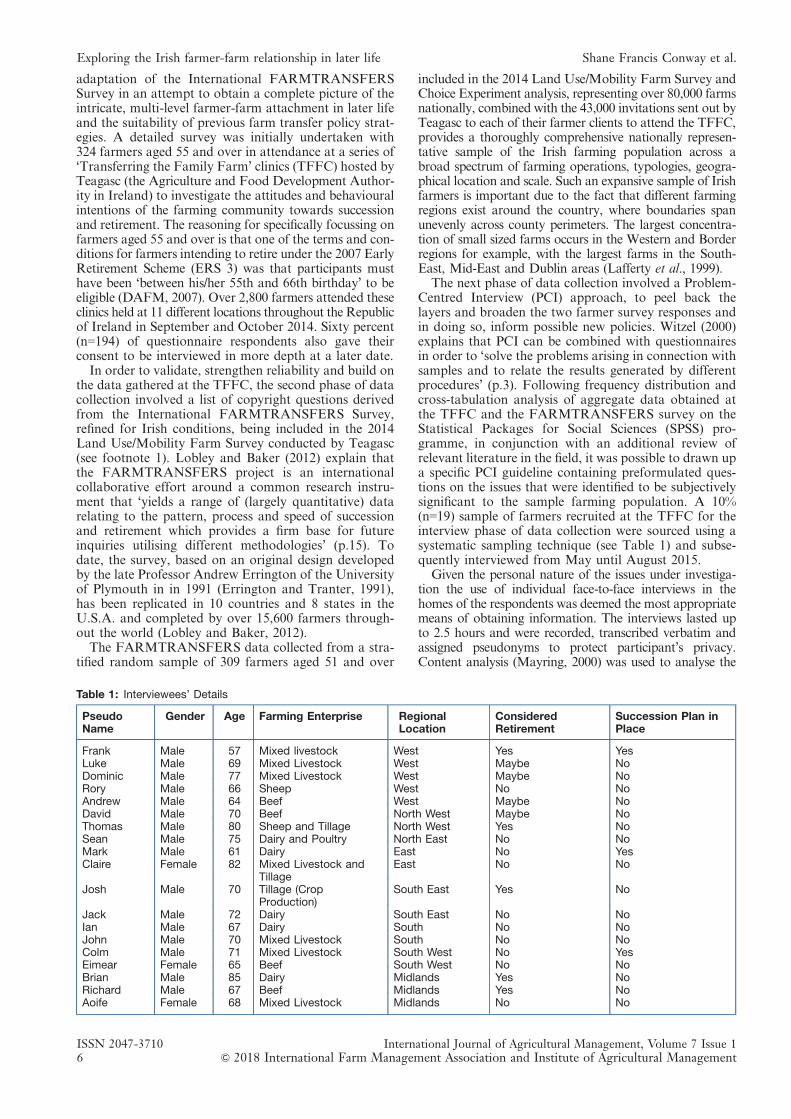
Given the personal nature of the issues under investiga-tion the use of individual face-to-face interviews in thehomes of the respondents was deemed the most appropriatemeans of obtaining information. The interviews lasted upto 2.5 hours and were recorded, transcribed verbatim andassigned pseudonyms to protect participant’s privacy.Content analysis (Mayring, 2000) was used to analyse the
Table 1: Interviewees’ Details
PseudoName
Gender Age Farming Enterprise RegionalLocation
ConsideredRetirement
Succession Plan inPlace
Frank Male 57 Mixed livestock West Yes YesLuke Male 69 Mixed Livestock West Maybe NoDominic Male 77 Mixed Livestock West Maybe NoRory Male 66 Sheep West No NoAndrew Male 64 Beef West Maybe NoDavid Male 70 Beef North West Maybe NoThomas Male 80 Sheep and Tillage North West Yes NoSean Male 75 Dairy and Poultry North East No NoMark Male 61 Dairy East No YesClaire Female 82 Mixed Livestock and
TillageEast No No
Josh Male 70 Tillage (CropProduction)
South East Yes No
Jack Male 72 Dairy South East No NoIan Male 67 Dairy South No NoJohn Male 70 Mixed Livestock South No NoColm Male 71 Mixed Livestock South West No YesEimear Female 65 Beef South West No NoBrian Male 85 Dairy Midlands Yes NoRichard Male 67 Beef Midlands Yes NoAoife Female 68 Mixed Livestock Midlands No No
ISSN 2047-3710 International Journal of Agricultural Management, Volume 7 Issue 16 & 2018 International Farm Management Association and Institute of Agricultural Management
Exploring the Irish farmer-farm relationship in later life Shane Francis Conway et al.
data collected and identify categories and themes. Relevantquotes from the interviews were then integrated into thevarious themes in order to support particular findings.
4. Results and Discussion
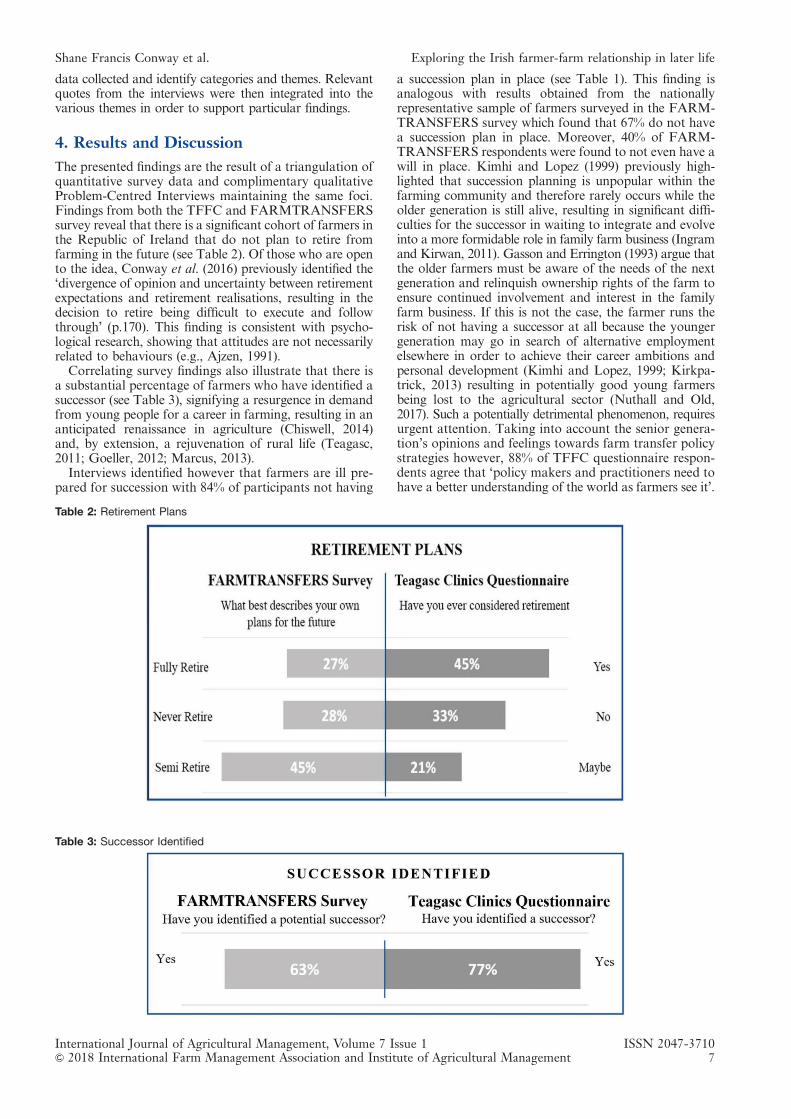
The presented findings are the result of a triangulation ofquantitative survey data and complimentary qualitativeProblem-Centred Interviews maintaining the same foci.Findings from both the TFFC and FARMTRANSFERSsurvey reveal that there is a significant cohort of farmers inthe Republic of Ireland that do not plan to retire fromfarming in the future (see Table 2). Of those who are opento the idea, Conway et al. (2016) previously identified the‘divergence of opinion and uncertainty between retirementexpectations and retirement realisations, resulting in thedecision to retire being difficult to execute and followthrough’ (p.170). This finding is consistent with psycho-logical research, showing that attitudes are not necessarilyrelated to behaviours (e.g., Ajzen, 1991).
Correlating survey findings also illustrate that there isa substantial percentage of farmers who have identified asuccessor (see Table 3), signifying a resurgence in demandfrom young people for a career in farming, resulting in ananticipated renaissance in agriculture (Chiswell, 2014)and, by extension, a rejuvenation of rural life (Teagasc,2011; Goeller, 2012; Marcus, 2013).
Interviews identified however that farmers are ill pre-pared for succession with 84% of participants not having
a succession plan in place (see Table 1). This finding isanalogous with results obtained from the nationallyrepresentative sample of farmers surveyed in the FARM-TRANSFERS survey which found that 67% do not havea succession plan in place. Moreover, 40% of FARM-TRANSFERS respondents were found to not even have awill in place. Kimhi and Lopez (1999) previously high-lighted that succession planning is unpopular within thefarming community and therefore rarely occurs while theolder generation is still alive, resulting in significant diffi-culties for the successor in waiting to integrate and evolveinto a more formidable role in family farm business (Ingramand Kirwan, 2011). Gasson and Errington (1993) argue thatthe older farmers must be aware of the needs of the nextgeneration and relinquish ownership rights of the farm toensure continued involvement and interest in the familyfarm business. If this is not the case, the farmer runs therisk of not having a successor at all because the youngergeneration may go in search of alternative employmentelsewhere in order to achieve their career ambitions andpersonal development (Kimhi and Lopez, 1999; Kirkpa-trick, 2013) resulting in potentially good young farmersbeing lost to the agricultural sector (Nuthall and Old,2017). Such a potentially detrimental phenomenon, requiresurgent attention. Taking into account the senior genera-tion’s opinions and feelings towards farm transfer policystrategies however, 88% of TFFC questionnaire respon-dents agree that ‘policy makers and practitioners need tohave a better understanding of the world as farmers see it’.
Table 2: Retirement Plans
Table 3: Successor Identified
International Journal of Agricultural Management, Volume 7 Issue 1 ISSN 2047-3710& 2018 International Farm Management Association and Institute of Agricultural Management 7
Shane Francis Conway et al. Exploring the Irish farmer-farm relationship in later life
Winter (1997) previously highlighted that ‘for too longthe policy debate has been conducted with little referenceto farmers or to their view of the world’ (p.377). Further-more, 88% of farmers surveyed at the TTFC who havenot considered retiring from farming in the future agreethat ‘the lifestyle quality from being a farmer is fargreater than any financial incentive to leave farming.’When asked more specifically about the suitability of theterms and conditions of the 2007 ERS 3, interviewsreveal that there exists a clear disconnect between suchpolicy measures and the mind-set of respondents:
‘Ceasing all farming activity was a ridiculous rule. Itwas almost as if you couldn’t even own a pair ofwellingtons anymore and that is crazy. A lot of the rulesand regulations brought into farming here in Irelandtend to be half baked’. (Josh, aged 70)
‘Asking farmers to stop farming forever was verymuch a very backward step, because I think it would endup creating depression amongst farmers. Cutting afarmer adrift from their farm at that stage of their lifewould leave them in a very lonely place’. (Frank, aged 57)
‘I thought that last retirement scheme was a disaster.I mean requesting that we couldn’t do bits and piecesaround our farms, it was bureaucracy gone mad. It wasa no brainer that it wouldn’t work and whoever cameup with that scheme hadn’t a clue about farming. Weare talking about a way of life here, how could we beexpected to cease agricultural activity forever?’. (Colm,aged 71)
As such, while certain processes of contemporary ruralrestructuring may have impacted on the economic andsocial landscape of farming in the Republic of Ireland(Kinsella et al., 2000; Ní Laoire, 2005), empirical researchfindings indicate that there still exists an overwhelmingsignificance of ‘intrinsic’ farming values over profit maxi-misation in Irish agriculture (Price and Conn, 2012;Duesberg et al., 2013; Conway et al., 2016; Duesberget al., 2017). It is therefore imperative that existing andfuture policies and programmes encouraging interge-nerational farm transfer take into account the emotionalvalue attached to the farm and farming occupation ‘beyondthe economic’ (Pile, 1990, p.147).
The overriding themes of farmer-farm attachmentto emerge from the content analysis of the empiricalresearch were (i) rooted in place (ii) legitimate connect-edness and (iii) sense of nostalgia. These themes will nowbe discussed in the next sections, to provide a detailedinsight into the level of insideness that the older gene-ration of the farming community attach to their farm.Interestingly, despite the patriarchal prominence offarming highlighted in previous research (Gasson andErrington, 1993, Brandth, 2002; Price and Evans, 2006),empirical findings in this study did not uncover any greatvariation between male and female farmer-farm relation-ships. This may be explained by Bourdieu’s concept ofhabitus (Bourdieu, 1977). Through regular practice in asocial setting (such as the farm in the context of thisresearch), Bourdieu explains that individuals develophabitus, ‘the set of dispositions or learned behaviourswhich provides individuals with a sense of how to act andrespond in the course of their daily lives’ (Blackledge,2001, p.349). Habitus thus functions as an ‘internal com-pass’, orientating and guiding one’s social behaviour and
practices of everyday life (Panagiotopoulos, 1990; Maclean,et al., 2010). Research respondents, of both genders,were found to share common deep-seated dispositionstowards their farms, having lived there for most, if notall of their lives. We thus seemed unnecessary in thisparticular research to differentiate whether study parti-cipants were male or female. Instead we opted to utilize agender-neutral ‘labelling’ approach to identify farmerswho participated in this study.
4.1 Rooted in placeResults from the empirical research illustrate the deep-rooted familiarity farmers have with their farms. Exploringthe interplay between people and place within agri-culture, Gray (1999) previously used the phrase ‘beingat home on the hills’ to capture ‘the special, sensualand intimate attachment people feel towards the hills inwhich they spend so much time, a feeling of being in theirproper place’ (p.441). Such a close acquaintanceshipwas evident from the TFFC survey results, with 92% ofrespondents agreeing that they spend most of their timeat home on their farms. The motif of insideness is appro-priate here as it suggests that older people develop anintense sense of familiarity and belonging in their homeenvironment late in life, which is notably distinct fromthe outside world (ibid). When asked what their liveswould be like if they no longer lived on the farm, inter-viewees found it hard to visualise what this might belike or that it might ever happen, for example:
‘I can’t see myself retiring and heading off to CostaBrava or the likes of for the rest of my life, oh no,I certainly can’t. I find that when I go away somewhereon holidays for a few days with my wife, that I’d beanxious to get back to the farm, I’d be really missing ityou see. I suppose I am kind of institutionalised on thefarm at this stagey I’d be way out of my depth livingsomewhere else’. (Andrew, aged 64)
‘I know the older we get, we might not able to lookafter ourselves, or the mind might go and then of courseyou’d have to be shipped off to a nursing home, butwhile I am alive and well I’m staying put on the farm.You see if it is somewhere where you have been bornand lived all your life, it’s hard not to be hugelyattached to the place, it’s part of who I am now, I don’twant to be anywhere else’. (David, aged 70)
These findings illustrate that the older generation havebecome almost ‘physiologically melded’ into the farmenvironment over time (Rowles, 1984, p.146). Suchrootedness is referred to as physical insideness (Rowles,1983a). This innate intimacy or ‘body awareness’ (Rowlesand Ravdal, 2002) of the farm space, is also found toequip farmers with an intricate understanding of theenvironmental conditions and limitations of their land,confirming previous research (Gray, 1998; Burton, 2004;Yarwood and Evans, 2006; Burton et al., 2008).
‘I know this place like the back of my hand. My fatherlord rest him taught me all he knew about the farm andmy son now looks up to me to teach him all I know.I know all the fields that need an extra bit of slurry inthe spring and what fields are best to fatten the bullocksover the summer. No books or computers can teach you
ISSN 2047-3710 International Journal of Agricultural Management, Volume 7 Issue 18 & 2018 International Farm Management Association and Institute of Agricultural Management
Exploring the Irish farmer-farm relationship in later life Shane Francis Conway et al.
things like that. The point I am trying to make is youcannot underestimate a lifetime of experience on thefarm’. (Luke, aged 69)
These findings suggest that the criteria of previousearly retirement schemes (ERS 3), which stressed that‘continued participation in farming is not permitted’(DAFM, 2007), may in fact have had negative effects onfarm performance by creating critical shortages of expe-rienced personnel who hold an invaluable store of locallyspecific lay and tacit knowledge developed over yearsof regularized interaction and experience workingon the farm (Conway et al., 2016). Interviews alsoidentified that the idiosyncratic ‘rhythms, routines, andrituals’ (Rowles et al., 2003, p.172) of farm life, shapedand internalised by the daily and seasonal labour-intensive demands of working on the farm, fosters aheightened sense of physical insideness for the oldergeneration:
‘I’m always working the land. I’d be spreading fertil-izer and fixing fences and bringing the cows inand out of the milking parlour twice a day. I hopeto spend the rest of my days keeping busy on thefarmy at least while I am fit and able to do so’.(Jack, aged 72)
‘In a way, you are pretty much married to the farmybecause you can’t just decide that you are going to takeoff for six weeks and walk around Borneo or theHimalayas, no, no, there’s always work to be done onthe farm, 365 days a year’. (Josh, aged 70)
Riley (2011) previously explained that integrating withand tending to the needs of animals plays a central rolein organizing and structuring the day-to-day and annuallives of farmers, with many claiming that such tasks arewhat ‘they got out of bed for’ (p.23). Glover (2011) addthat the farm represents ‘who the farmer is’ (p.9). Thecessation of occupational engagement upon retirementhowever ‘not only left voids in terms of time and emptyroutine structures, but also the loss of a lens throughwhich they channelled very particular understandings of,and relationships with, specific places and practices’(Riley, 2011, p.23). Riley (2012) also noted that retireesfelt ‘lost’ upon ceasing their ‘association with, andeveryday routines and actions within’, the farm space(p.770). Interviews identified that the familiarity andhabitual routines within the farm environment also offerstherapeutic benefits to older farmers, in an almostsanctuary-like setting:
‘Space is the most wonderful thing in the world to have.If there was something or another bothering me, I findthere is nothing better than to just walk up the fieldsearly in the morning or late in the evening, and lookback across the land, and watch all my lovely cattlegrazing and thrivingy your head would be a lot clearerafter that’. (Aoife, aged 68)
‘I love every inch of this place, it makes me feel good.I love being able to walk through the fields, checking onmy crops and just enjoying the nature all around me, it’squite therapeutic for me in fact. As I have lived here mywhole life I probably take it for granted sometimes justhow special it really is’. (Josh, aged 70)
Rossier (2012) previously noted that keeping active onthe farm may ‘improve the quality of life, and serve tocrate meaning’ (p.84), while Price and Conn (2012) addthat farmers ‘engage with animals and nature in a spatialarena where legacy, culture belonging home and workare intertwined’ (p.95). Similarly, from an Australianperspective, Guillifer and Thomson (2006) explain thatthe emotional bond that farmers have developed withtheir land over their lifetime, acts as a source of ‘identity,refuge and comfort’ in old age (p.91).
The general satisfaction and well-being that elderlyfarmers attribute to the ‘physical insideness’ of the farmspace and associated routines (Riley, 2012), offers poten-tial for understanding why many are unwilling to recog-nize or accept their physical limitations on the farm(Peters et al., 2008) and instead, continue to traversespaces that would appear to be beyond their level ofphysiological competence (Ponzetti, 2003), with subse-quent risks to their health and safety. Such a phenom-enon requires immediate policy intervention, as almosthalf of all farm fatalities in Ireland and many otherEuropean Union member states involve farmers aged 65and over (HSA, 2013).
4.2 Legitimate connectednessResearch findings also reveal that the farm provides thefarmer with a sense of legitimate social connectednesswithin the farming community. Seventy-eight percent ofquestionnaire respondents at the TTFC agree that farm-ing provides them with a sense of belonging and aposition in society. Riley (2012) explains that ‘just as theboundaries of work, home and leisure are often indi-visible on the farm, so too are the nature of socialinteractions taking place there’, as they are woven intothe everyday activities and routines of the farm (p.770).Furthermore, 71% of TFFC questionnaire respondentsalso agree with the notion that farming is not only theirjob, but also their lifestyle, pastime and social outlet.Interviews reveal the manner in which the farm and itspractices provides a fulcrum around which social inter-actions can take place:
‘I became more and more involved in various farmingorganisations and activities in the area when myhusband, lord have mercy on him, passed away. Thefarm ties me in with these groups you see, we are allfarmers there, we have a common ground. I find that it’sgreat to mix with like-minded people on an on-goingbasisy it has helped me cope with his loss in a way’.(Eimear, aged 65)
‘I don’t do anything else only farm and go to the localmart once or twice a week. Even if I’m not selling orbuying sheep I’d still go to the mart, I enjoy the socialaspect of it you see. I always go into the canteen whenI’m at the mart and sit down and have a chat with thelads about farming and the weathery. things like that’.(Rory, aged 66)
‘I have been actively involved in breeding Texel sheepon the farm for the last 30 years. I love the buzz out ofbreeding, finding the next big thing at the pedigreesales, meeting and competing with the other breedersfor prizesy ah it’s a great pastime to have as well aseverything else’. (Frank, aged 57)
International Journal of Agricultural Management, Volume 7 Issue 1 ISSN 2047-3710& 2018 International Farm Management Association and Institute of Agricultural Management 9
Shane Francis Conway et al. Exploring the Irish farmer-farm relationship in later life
Rowles’s (1983a) concept of ‘social insideness’, whichis fostered and developed through ‘everyday socialexchanges and relationships’ and ‘a sense of being wellknown and knowing others’ (Burns et al., 2012, p.3) isevident here. Social Insideness provides farmers with asense of belonging by allowing them to integrate andbecome a part of the ‘social fabric of the community’(Rowles, 1983a, p.302), thus enhancing their emotiveattachment to the farm in old age. Social insideness isconsidered to be particularly significant in later life, asone may need to draw on these long-term relationshipsfor help and social support if they happen to experienceage related physical impairments and disabilities (Pon-zetti, 2003; Riley, 2012). Sutherland and Burton (2011)previously noted that farmers feel that they can ‘count onthe neighbour in an emergency’ (p.246). Researchfindings also illustrate the considerable social significanceattributed to being approved and recognised as a ‘goodfarmer’ in a community of like-minded farmers, reiter-ating previous research (Burton; 2004; Burton et al.,2008). Seventy-one percent of respondents at the TFFCagreed that it was important to be viewed as an activeand productive farmer amongst their peers to maintaintheir status in the farming community with Glover (2011)pointing to the fact that a ‘farmer’s status is measured inthe size and production levels of the farm’ (p.7). Theperceived loss of social insideness and the subsequentdistancing and/or hiatus from previously familiar socialnetworks brought about by retirement is brought to lightin the following interview extracts:
‘It would certainly be a shock to the system not to bedairy farming anymore. It would be hard not to see themilk lorry driving into the yard in the morningsy andif I was no longer able to talk the same talk with otherdairy farmers about milk yields, butterfat and proteinand all that. I’d hate to be out of the loop so that’s whyI need to stay in touch and continue dairying with myson’. (Brian, aged 85)
‘I feel very much part of the farming communityherey ah there really is a great group of farmers in ourarea. We are also involved in a few Teagasc discussiongroups around here. I think they are a great idea tothrash out ideas with farmers similar to yourself andalso for the social aspect too of course. That’s why it isimportant to stay actively involved in farming, other-wise you’d be cut adrift from these sorta things’. (John,aged 70)
These findings illustrate that it is almost impossible tountangle a farmer’s everyday social interactions fromeveryday practices on the farm. Riley (2012) previouslyexplained that the ‘indivisibility of social and occupa-tional spaces’ within the farming community however,leaves farmers feeling isolated or like ‘an outsider’ withinpreviously ‘familiar and comfortable spaces’ followingretirement (p.769). The perceived loss of legitimate socialinsideness brought about by retirement, is reported to beeven more pronounced for those who are unable todraw on successors in connecting to these spaces (ibid).More specifically, Riley (2011) found that the common-ality of owning and tending to animals are essentialrequirements to be a ‘proper’ part of livestock-relatedgatherings, such as auctions and agricultural shows. Thelack of active and corporeal engagement with livestock
upon ‘stepping aside’ from the farm however, irrevocablychanges the nature of these pre-existing settings ofsocial inclusion (ibid). Conway et al. (2016) also notedthat many older famers believed that they would beseen or perceived differently by other farmers if theybecame a ‘retired farmer’. The farm thus provides anarena in which the older generation can preserve theirlegitimacy as an active and productive farmer in societyin later life.
4.3 Sense of nostalgiaA farmer’s relationship with their farm extends beyondthe physical setting and social milieu to represent a spaceand environment that has ‘a temporal depth of meaning’(Rowles, 1983a, p.303). Eighty-two percent of farmerssurveyed at the TFFC could trace their family’s occu-pancy of the farm back two generations or more, afinding previously identified by Potter and Lobley (1996)who noted that farming tends to be ‘the most hereditaryof professions’ (p.286). Furthermore, findings from theTFFC found that 87% of farmers surveyed think that ‘itis important that their farm stays in their family’s owner-ship in the future’. The temporal aspect of the farmer-farm based relationship is reflected in Rowles’s (1983a)notion of autobiographical insideness. Often unspokenand taken for granted, autobiographical insideness isdeveloped through acquisition of place-associated mem-ories of significant life experiences, relationships andevents in one’s personal history (Rowles, 1993) whichoffers ‘a sense of familiarity, connection and self-identity’in old age (Riley, 2012, p.764). Interviews reveal that theancestral lineage of the farm, passed down throughgenerations, provide farmers with an ingrained sense ofautobiographical insideness as custodians of their family’sland in its present history:
‘I inherited the place here from my father, just like hedid from his father before. You are tied into a longfamily history when you are brought up on a farm yousee. But I am only a spoke in the wheel of this farm’sstory, I am only a caretaker, so I hope to hand it over tomy son one day and fingers crossed it stays in the familyforever more after that’. (David, aged 70)
Price and Conn (2012) explain that farmers have‘a desire to maintain the farm in the family as a result offeelings of responsibility to past generations’ (p.100). Thefarm therefore is not just a piece of land or a workplace(Burton, 2004), but rather ‘the physical manifestation ofgenerations of knowledge; knowledge developed andused over time’ (Gill, 2013, p.79) by both the farmerthemselves and by those who have lived and workedthere before (Glover, 2011). The inherent desire not tokeep the farm in the family is evident in findings from theFARMTRANSFERS survey which found that only 4%of respondent’s ‘desired succession and inheritanceoutcome’ was to ‘sell the farm to divide assets equally’.Irish farmer’s profound historical connection to theirland is aptly illustrated in the following extract takenfrom world-renowned author and playwright John B.Keane’s play in 1965 entitled ‘The Field’: ‘I watchedthis field for forty years and my father before me watchedit for forty more. I know every rib of grass andevery thistle and every whitethorn bush that bounds it’.
ISSN 2047-3710 International Journal of Agricultural Management, Volume 7 Issue 110 & 2018 International Farm Management Association and Institute of Agricultural Management
Exploring the Irish farmer-farm relationship in later life Shane Francis Conway et al.
This captivating portrait of the deeply embeddedattachment to farmland in rural Ireland in the mid-20th century, remains relevant to this day (Banovic,et al., 2015), with less than 1% of the total land area inthe Republic of Ireland put on the open market annually(Hennessy, 2006; Irish Farmers Journal, 2012). Findingsfrom the TFFC questionnaire confirm such a bond, with88% respondents agreeing that they ‘have an emotional/sentimental attachment to their land and animals’. Morespecifically, interview conversations reveal the nature ofsuch intricate relationships:
‘You form an attachment to the animals in the sensethat you know how to live with every single one of them,they all have their own temperament and per-sonality you see. I know the one’s that will come tothe gate first when they see me coming and I’d be ableto tell straight away if any of them were sick or offform... so you see I need to check on my stock everyday, every single day without exception. I’d be lostwithout them and they wouldn’t survive without me, it’sas simple as that’. (Luke, aged 69)
‘I can still remember the dairy cows that we had whenI was 6 or 7 years of age... I can remember them alldripping milk as they walked into the old parlour wehad on the farm.y We had a couple of Kerrys, a fewShorthorns, three Ayrshires, oh and a couple of Jerseysfor the butter fat, so there was a good mix of breedsthere. I remember them all, fond memories indeedythose very cows are the foundation of the fantastic weeherd we have on our farm today’. (Brian, aged 85)
The level of emotional attachment that farmers placeon their farm and animals was previously brought tolight by Glover (2010) who highlighted the extremelydistressing experiences of farmers who had lost theirentire dairy herds in the 2001 Foot and Mouth Diseasecrisis. Riley (2011) explains that a dairy herd not onlyacts ‘as biographical markers through which farmersmay narrate not only their own life’ (p.25) but it alsorepresents an embodiment of the farm history, ‘with theefforts and achievements of several generations inscribedupon them’ (p.21). Similarly, Gray (1998) pointed tohow sheep farmers in the Scottish Borders investedconsiderable time establishing flocks whose ‘character-istics embody the natural qualities of the ground onwhich they graze’ (p.351) through decades of selectivebreeding on their farm. Consequently, such distinctivebreeding skills and practices define the personhood andlifetime’s work of the farmer (ibid), which in turn, addsfurther to their personal accumulation of symboliccapital (Conway et al., 2016). Eighty-seven percent ofquestionnaire respondents at the TFFC agree thatthe farm represents years of hard work and what theyhave managed to achieve over their lifetime. Inter-views reveal that the farm is a central site of auto-biographical insideness as it represents a mosaic of thefarmer’s achievements as well as being a landscape ofmemories:
‘Myself and my wife have been farming here for the last34 years. We came from very humble beginnings andwe make a lot of strides here through the years. Wetake pride in the fact that we have built slatted sheds,reclaimed land, picked stones, moved ditches, put in
fences, dug out roadways and established a good herd ofcows. We have left our mark on the farm, just like myown father and mother did’. (Ian, aged 67)
Riley (2012) previously noted the ‘emotional challengeof ‘ending the line there’ (p.774). This is especially thecase when a successor is not in situ to take over the farm(ibid). Research findings indicate that the deep-seatedsense of autobiographical attachment older farmers havewith their farms can override and stifle various colla-borative farming policy efforts aiming to facilitate landmobility from one generation to the next. This reluctanceto ‘let go’ and/or alter the status quo of the farm isexplained by Ingram and Kirwan (2011) who explainthat the older generation are ‘clearly attached to theirfarms, having put a lot of effort and investment over theyears into building up the business’ (p.295) and aretherefore reluctant to ‘let go’ and/or alter the status quoof the farm:
‘Unfortunately, we have no one to take over from usthough so we will be looking to lease out some of theland soon. But I would hate for someone to come in andmess it all up. Oh that would be a huge disappointment,so we will be having a damn good look at the way theperson who wants to lease our land looks after theirfarm first before we’d even consider leasing it to them’.(Ian, aged 67)
Ambivalence towards the succession process is alsoevident in the U.S.A., with programmes encouragingfarm transfer reporting that they have ‘approximately 20beginning farmers for every existing farmer’ (Whiteheadet al., 2012, p.216). Price and Conn (2012) explainhowever that there is ‘something about growing up onthe farm that leads farmers to often imbue a sense ofpride of being born to farm, a sense of destiny, of it beingin their blood and this is clearly hard to pull away from’(p.105).
5. Conclusion
This paper provides an in-depth, nuanced understandingof the complex farmer-farm relationships in later life. Asthe average age of the farming population is increasingworldwide, this investigation is very timely. The sig-nificant contribution of this paper to current needs andpriorities within policy and research lies in its empiricalinsights, which demonstrate the appropriateness of uti-lizing the three dimensions of Rowles’s (1983a) conceptof insideness; physical, social and autobiographical, inbringing into focus the level of attachment older farmersplace on their farms, and how such a bond can stifle thenecessary hand over of the farm business to the nextgeneration.
The prominent themes of rooted in place, legitimateconnectedness and a sense of nostalgia, that emerge fromthe triangulation of quantitative and qualitative data,illustrate that farming is more than an economic activity.The so-called ‘soft issues’ i.e. the emotional issues, iden-tified in this research, are the issues that distort anddominate the older generation’s decisions on the futuretrajectory of the farm. Such issues have resulted inintractable challenges for succession and retirement policy
International Journal of Agricultural Management, Volume 7 Issue 1 ISSN 2047-3710& 2018 International Farm Management Association and Institute of Agricultural Management 11
Shane Francis Conway et al. Exploring the Irish farmer-farm relationship in later life
over the past forty years. These really are the ‘hard issues’.As every farmer and farm is somewhat unique, this studyacknowledges that there are no uniform or easily prescri-bed solutions to resolving this complex conundrum.However, we do advocate that family farm policy makersand practitioners re-examine their dominant focus oneconomic-based incentives and become more aware andknowledgeable of the intrinsic farmer-farm relationshipidentified in this study. This we argue will be crucialwhen reforming and developing future initiatives andstrategies that seek to encourage the transfer of farmprocess by rightly considering interventions that maintainthe quality of life of those concerned. Conway et al. (2016)previously noted the development of strategies ‘concerningthe human dynamics of family farm transfer (had) thepotential to greatly ease the stresses of the process’ (p.174).More fundamentally still, we follow Conway et al. (2017)in recommending that a concerted effort is made to pro-vide extension advisory specialists on the ground withsupplementary training in ‘facilitation/communication’skills, in addition to their current ‘technical’ orientation.Such an understanding of the intrinsic link to farmattachment in old age will particularly equip theseprofessionals with the necessary credibility, skill andreverence needed to empathise with elderly farmers andtheir individual needs.
On a related aspect, and while not central to what thisparticular study has focused on, is the issue of occupa-tional health and safety on the farm. The insight into thesenior generation’s deeply-embedded sense of insidenesstowards their respective farms developed during thisresearch suggests that there is much to be learned fromthe farmer-farm relationship that would benefit this verysignificant contemporary challenge. Farming is reportedto be one of the most hazardous occupations in terms ofthe incidence and seriousness of accidental injuries(Glasscock, et al., 2007). Moreover, agriculture exhibitsdisproportionately high fatality rates, when comparedto other sectors (ibid). The general satisfaction and well-being that the older generation of the farming com-munity attribute to the labour-intensive demands ofworking on the farm in later life, appears to be part ofthe farming psyche. An insight into the intrinsic link tofarm attachment in old age and the importance attri-buted to the habitual routines within the farm setting,will provide the Health and Safety Authority (HSA) andmember organisations of the HSA Farm Safety Part-nership Advisory committee in the Republic of Irelandwith an invaluable understanding of the various actionstaken by (or should be taken by) older farmers to handleage-related physical limitations and barriers on theirfarms. This knowledge will aid in the development of aneffective health and safety service tailored specifically tothe needs of older farmers.
More fundamentally, this study recommends is theestablishment of a national voluntary organisation thatspecifically represents the needs of the senior generationof the farming community in rural areas, equivalent tothat of younger people in rural Ireland i.e. Macra naFeirme (see footnote 2). There are no such bodies orservices currently in existence in the Republic of Ireland.Suited to the older generation’s own interests and needsidentified in this research, (and by Conway et al., 2016),such a voluntary organisation, funded annually by theGovernment and through membership, would provide
the older generation with a fulcrum around which theycan remain embedded ‘inside’ their farms and socialcircles in later life. A significant obstacle to the inter-generational farm transfer process is the rigid inflexibilityof the occupational role, where older farmers wish toremain ‘rooted in place’ on the farm and in many cases,have developed few interests outside of farming, due tothe ‘dense intertwining of occupational and social spaces’within the farming community (Riley, 2012, p.769).A nationwide voluntary organisation, with a network ofclubs in every county across the country, would allowolder farmers to integrate within the social fabric of alocal age peer group, whilst also providing them withopportunities to develop a pattern of farming activitiessuited to advancing age. This would contribute to theiroverall sense of insideness, and, therefore, sense of self-worth, amidst the gradual diminishment of their physicalcapacities on the farm in later life. Collaborating withtheir younger counterparts in Macra na Feirme on variouscampaigns and activities would also allow the seniorgeneration to retain a sense of purpose and value in oldage. Similar to Macra na Feirme, this body for olderfarmers, with their added wealth of experience, would actas a social partner farm organisation together with theIrish Farmers Association (IFA) for example, that wouldallow this generation to have regular access to governmentministers and senior civil servants, thus providing themwith a voice to raise issues of concern. Indeed, such agroup could be invaluable with regard to the developmentof future farm transfer strategies that would truly becognisant of the human side of the process of intergenera-tional renewal. An established organisation for olderfarmers would also allow this sector of society to have arepresentative on important committees such as the Boardof Teagasc, similar to their younger counterparts.
Finally, although this study is limited to the Republicof Ireland, and findings may be dependent on the cul-tural and institutional milieu that govern Irish farmtransfers, its association with the International FARM-TRANSFERS project, provides a solid database uponwhich future research can begin to build, and generalconclusions can be based. Indeed, such is the complexityof the farmer and farming traditions that a multi-layeredpicture comparing farmer’s succession and retirementplans, with patterns obtained from other participatingcountries and states in the U.S.A. would be invaluable.As Hofstede (1984) points out ‘culture determines theidentity of a human group in the same way as personalitydetermines the identity of an individual’ (p.22). Difficul-ties around intergenerational family farm transfer andan ageing farming population are not unique to anyone country but are recognised at all levels, national,European Union and beyond. Consequently, this study,while reflecting the Irish experience, will begin a muchbroader international conversation on farmers, their place,view, concerns and challenges in the context of the futureprosperity of the agricultural sector and ultimately thefuture sustainability of rural families, communities andenvironments on which we all depend. Further involvementin the International FARMTRANSFERS project will alsoensure the internationalisation of research findings to keystakeholders outside of academia. In summation, a greaterfocus on the farmer-farm relationship has the potential tofinally unite farm transfer policy efforts with the mind-set ofits targeted audience, after decades of disconnect.
ISSN 2047-3710 International Journal of Agricultural Management, Volume 7 Issue 112 & 2018 International Farm Management Association and Institute of Agricultural Management
Exploring the Irish farmer-farm relationship in later life Shane Francis Conway et al.
Footnote
1. The survey was undertaken within a memorandumof understanding between Dr Shane Francis Conway,Postdoctoral Researcher at NUI Galway, Anne Kinsella,Senior Research Officer at the Teagasc Agricultural Eco-nomics and Farms Surveys Department and the Inter-national FARMTRANSFERS project’s Co-Directors,Professor Matt Lobley, at the Centre for Rural PolicyResearch, University of Exeter, United Kingdom andJohn R. Baker, Attorney at Law at the BeginningFarmer Centre, Iowa State University, U.S.A.2. Macra na Feirme is a voluntary, rural youth orga-nisation in the Republic of Ireland for people betweenthe ages of 17 and 35. Founded in 1944, the organisationnow has approximately 200 clubs in 31 regions aroundthe country. One of the organisation’s main aims is tohelp young farmers get established in farming and assistthem through learning and skills development.
Ethical approval
Ethical approval for this research was obtained from theResearch Ethics Committee at the National Universityof Ireland, Galway.
About the authors
Dr Shane Francis Conway is a Postdoctoral Researcherin the Discipline of Geography’s Rural Studies ResearchCluster at the National University of Ireland, Galway
Dr John McDonagh is a Senior Lecturer in RuralGeography in the Discipline of Geography, NationalUniversity of Ireland, Galway.
Dr Maura Farrell is a Lecturer in Rural Geography andDirector of the MA in Rural Sustainability in theDiscipline of Geography, National University of Ireland,Galway.
Anne Kinsella is a Senior Research Economist at Teagasc,the Agriculture and Food Development Authority inIreland, where she specialises in area of production eco-nomics and farm level agricultural economics research.
Acknowledgement
We are grateful to all the farmers who took part in thisresearch. Funding for this project was provided by theNational University of Ireland, Galway, College of Arts,Social Sciences, and Celtic Studies Doctoral ResearchScholarship Scheme and the Geographical Society ofIreland postgraduate travel award bursary. We wouldalso like to thank Teagasc, the agriculture and fooddevelopment authority in Ireland, for accommodatingthe collection of some of the data used within this research.
BIBLIOGRAPHY
ADAS (Agricultural Development and Advisory Service). (2004).Entry to and Exit from Farming in the United Kingdom (RMP2037) (Report prepared for: The Department for Environ-ment, Food and Rural Affairs).
ADAS (Agricultural Development and Advisory Service). (2007).Study of Joint Venture Farming. Defra, London.
Ball, A. and Wiley, A. (2005). The aspirations of farm parentsand pre-adolescent children for generational succession ofthe family farm’. Journal of Agricultural Education, 46(2).36–46.
Banovic, M., Duesberg, S., Renwick, A., Keane, M. and Bogue,P. (2015). The field: Land mobility measures as seen throughthe eyes of Irish farmers. Proceedings of the 89th AnnualConference of the Agricultural Economics Society, Universityof Warwick, England. Agricultural Economics Society.
Barclay, E., Reeve, I. and Foskey, R. (2012). Australian farmers’attitudes towards succession and inheritance. In: Lobley, M.,Baker, J.R. and Whitehead, I. (Eds.), Keeping it in the Family:International Perspectives on Succession and Retirement onFamily Farms (Ashgate), pp. 21–36.
Bika, Z. (2007). The territorial impact of the farmers’ earlyretirement scheme. Sociologia Ruralis, 47(3), 246–272.
Blackledge, A. (2001). The wrong sort of capital?: Bangladeshiwomen and their children’s schooling in Birmingham, UK.The International Journal of Bilingualism, 5(3), 345–369.
Bogue, P. (2013). Land Mobility and Succession in Ireland.Research report commissioned by Macra na Feırme inpartnership with the Irish Farmers Association. The Agri-cultural Trust and the Department of Agriculture, Food andthe Marine.
Bourdieu, P. (1977). Outline of a Theory of Practice. (R. Nice,Trans.), Cambridge University Press, Cambridge, England.
Brandth, B. (2002). Gender Identity in European Family Farming.Sociologia Ruralis, 42(3), 181–200.
Burns, V.F., Lavoie, J.P. and Rose, D. (2012). Revisiting therole of neighbourhood change in social exclusion andinclusion of older people. Journal of Aging Research, 2012(2012), 1–12
Burton, R.J.F., Kuczera, C. and Schwarz, G. (2008). Exploringfarmers’ cultural resistance to voluntary agri-environmentalschemes. Sociologia Ruralis 48(1), 16–37.
Burton, R.J.F. and Fischer, H. (2015). The Succession Crisis inEuropean Agriculture. Sociologia Ruralis 55(2), 155–166
Chaudhury, H. (2008). Remembering home: Rediscovering theself in dementia. Baltimore, MD: Johns Hopkins. UniversityPress.
Chiswell, H.M. (2014). The Importance of Next GenerationFarmers: A Conceptual Framework to Bring the PotentialSuccessor into Focus. Geography Compass, 8, 300–312.
Commins, P. and Kelleher, C. (1973). Farm Inheritance andSuccession. Macra Na Feirme, Irish Farm Centre, Dublin,Ireland.
Conway, S.F., McDonagh, J., Farrell, M. and Kinsella, A. (2016).Cease agricultural activity forever? Underestimating theimportance of symbolic capital. Journal of Rural Studies, 44,164–176.
Conway, S.F., McDonagh, J., Farrell, M. and Kinsella, A. (2017).Uncovering obstacles: The exercise of symbolic power in thecomplex arena of intergenerational family farm transfer.Journal of Rural Studies, 54, 60–75.
DAFM (Department of Agriculture, Food and the Marine). (2007).Terms and Conditions for Early Retirement Scheme (ERS3).
DAFM (Department of Agriculture, Food and the Marine). (2011).Farm Partnerships Reference Paper.
Degnen, C. (2016). Socialising place attachment: Place, socialmemory and embodied affordances. Ageing and Society, 36,1645–1667.
Dixon, J. and Durrheim, K. (2000). Displacing place-identity:A discursive approach to locating self and other. BritishJournal of Social Psychology, 39, 27–44.
Duesberg, S., O’Connor, D. and Nı Dhubhain, A. (2013). To plantor not to plant—Irish farmers’ goals and values with regardto afforestation. Land Use Policy, 32, 155–164.
Duesberg, S., Bogue, P. and Renwick, A. (2017). Retirementfarming or sustainable growth–land transfer choices forfarmers without a successor. Land Use Policy, 61, 526–535.
Errington, A.J. and Tranter, R.B. (1991). Getting out of Farming?Part two: The farmers. (Reading University Farm Manage-ment Unit, Study No. 27).
International Journal of Agricultural Management, Volume 7 Issue 1 ISSN 2047-3710& 2018 International Farm Management Association and Institute of Agricultural Management 13
Shane Francis Conway et al. Exploring the Irish farmer-farm relationship in later life
European Commission. (2012). Generational renewal in EUagriculture: Statistical background. EU Agricultural Eco-nomic Briefs, Brief number 6, June 2012.
European Commission. (2013). Structure and Dynamics of EUFarms: Changes, Trends and Policy Relevance. EU Agri-cultural Economics Briefs (9), October 2013.
European Commission. (2015). EU Farms and Farmers in 2013:an Update. EU Agricultural and Farm Economics Briefs (9),November 2015.
European Commission. (2017). Speech by Commissioner PhilHogan at Mountbellew Agricultural College, 17 February,2017. url: https://ec.europa.eu/ireland/news/commissioner-hogan-mountbellew-agriculture-college_en
Fasina, O. and Inegbedion, S. (2014). Farm Succession plansamong poultry farmers in Ogun state. Russian Journal ofAgricultural and Socio-Economic Sciences, 1(25), 28–35.
Fischer, H. and Burton, R.J.F. (2014). Understanding FarmSuccession as Socially Constructed. Endogenous Cycles.Sociologia Ruralis, 54, 417–438.
Foskey, R. (2005). Older Farmers and Retirement: a Report forthe Rural Industries and Development Corporation. Kingston,ACT: RIRDC Publication No 05/006.
Gasson, R. and Errington, A. (1993). The farm family business.Wallingford, CAB-International.
Gill, F. (2013). Succession planning and temporality: the influ-ence of the past and the future. Time and Society, 22(1), 76–91
Gillmor, D.A. (1999). The scheme of early retirement fromfarming in the Republic of Ireland. Irish Geography 32(2),78–86.
Glasscock, D.J., Rasmussen, K. and Carstensen, O. (2007).Psychosocial factors and safety behaviour as predictorsof accidental work injuries in farming. Work and Stress:An International Journal of Work, Health and Organisations,20(2), 173–189.
Glover, J.L. (2010). Capital Usage in Adverse Situations:Applying Bourdieu’s Theory of Capital to Family FarmBusinesses. Journal of Family and Economic Issues, 31(4),485–497.
Glover, J.L. (2011). Resilient Family Firms in the Rural Land-scape: The Role of Symbolic Capital. Conference Paperpresented at the 34th ISBE conference Sheffield.
Goeller, D. (2012). Facilitating succession and retirement in USagriculture: the case of Nebraska. In: Lobley, M., Baker, J.and Whitehead, I. (Eds.), Keeping it in the Family: Interna-tional Perspectives on Succession and Retirement on FamilyFarms (Ashgate), pp. 149–164.
Gray, J. (1998). Family farms in the Scottish borders: a practicaldefinition by hill farmers. Journal of Rural Studies 14(3),241–356.
Gray, J. (1999). Open spaces and dwelling places: Being athome on hill farms in the Scottish borders. American Eth-nologist, 26, 440–460.
Guillifer, J. and Thomson, T. (2006). Subjective realities of oldermale farmers: Self-perceptions of ageing and work. RuralSociety, 16, 80–97.
Hennessy, T. (2006). The agricultural land market: Situation andoutlook. The Property Valuer Summer Edition, 20–21.
Hennessy, T.C. and Rehman, T. (2007). An investigation intofactors affecting the occupational choices of nominatedfarm heirs in Ireland. Journal of Agricultural Economics 58(1),61–75.
Hennessy, T.C. (2014). CAP 2014-2020 Tools to Enhance FamilyFarming: Opportunities and Limits.
Health Service Executive. (2013). Farm Safety Action Plan2013-2015.
Hofstede, G. (1984). Culture’s consequences: International dif-ferences in work-related values. (Abridged edition). BeverlyHills, California: Sage.
Ingram, J. and Kirwan, J. (2011). Matching new entrants andretiring farmers through farm joint ventures: insights from thefresh start initiative in Cornwall, UK. Land Use Policy 28(4),917–927.
Irish Farmers Journal, 2012 – Agricultural Land Price Report2011.
Kimhi, A. and Lopez, R. (1999). A Note on Farmers’ Retirementand Succession Considerations: Evidence from a HouseholdSurvey. Journal of Agricultural Economics 50(1), 154–162.
Kinsella, J., Wilson, S., de Jong, F. and Renting, H. (2000).Pluriactivity as a livelihood strategy in Irish farm householdsand its role in rural development. Sociology Ruralis, 40(4),481–496.
Kirkpatrick, J. (2013). Retired Farmer - An Elusive Concept,Choices - The Magazine of Food, Farm, and ResourceIssues, 2nd Quarter 2013.
Lafferty, S., Commins, P. and Walsh, J.A. (1999). Irish Agri-culture in Transition - A Census Atlas of Agriculture in theRepublic of Ireland, Teagasc, Dublin.
Lecovich, E. (2014). Aging in place: From theory to practice.Anthropological Notebooks, 20(1), 21–33.
Leonard, B., Kinsella, A., O’Donoghue, C., Farrell, M. andMahon, M. (2017). Policy drivers of farm succession andinheritance. Land Use Policy, 61, 147–159.
Lobley, M., Baker, J.R. and Whitehead, I. (2010). Farm suc-cession and retirement: some international comparisons.Journal Agricultural Food Systems Community Develop-ment, 1(1), 49–64.
Lobley, M. and Baker, J. (2012). Succession and retirement infamily farm businesses. In: Lobley, M., Baker, J. and White-head, I. (Eds.), Keeping it in the Family: International Per-spectives on Succession and Retirement on Family Farms(Ashgate), pp. 1–19.
Maclean, M., Harvey, C. and Chia, R. (2010). Dominant Cor-porate Agents and the Power Elite in France and Britain.Organization Studies, 31(3), 327–348.
Marcus, A. (2013). The New Agricultural College and the NewAgricultural History. Agricultural History, 87(4), 525–533.
Mayring, P. (2000). Qualitative content analysis. Forum Qual SocRes, 1(2).
Meehan, A. (2012). Land for Dairying - New Legal andTax Models in an Irish Context Nuffield Scholarship Study,2012.
Nı Laoire, C. (2005). ‘You’re not a man at all!’: Masculinity,responsibility and staying on the land in contemporaryIreland. Irish Journal of Sociology, 14(2), 94–104.
Nuthall, P.L. and Old, K.M. (2016). Farm owners’ reluctance toembrace family succession and the implications for exten-sion: the case of family farms in New Zealand. The Journal ofAgricultural Education and Extension, 23(1), 39–60
Oswald, F. and Wahl, H.W. (2005). Dimensions of the meaning ofhome. In: Rowles, G.D. and Chaudhury, H. (Eds.), Home andIdentity in Late Life: International Perspectives, New York:Springer, pp. 21–45.
Panagiotopoulos, N. (1990). The theory of practice of PierreBourdieu. Review of Social Research, 78, 32–65.
Peace, S., Holland, C. and Kellaher, L. (2005). Making spacefor identity. In: Andrews, G.J. and Phillips, D.R. (Eds.),Ageing and place: Perspectives, policy, practice. New York:Routledge, pp. 188–204.
Peters, K.E., Gupta, S., Stoller, N. and Mueller, B. (2008).Implications of the aging process: opportunities for preven-tion in the farming community. Journal of Agromedicine,13(2):111–118.
Pile, S. (1990). The Private Farmer - Transformation and Legit-imating in Advanced Capitalist Agriculture. Dartmouth,Aldershot.
Ponzetti, J. (2003). Growing Old in Rural Communities: A VisualMethodology for Studying Place Attachment. Journal ofRural Community Psychology, E6(1).
Price, L. and Evans, N. (2009). From stress to distress: con-ceptualizing the British family farming patriarchal way of life.Journal of Rural Studies, 25, 1–11.
Price, L. and Conn, R. (2012). ‘Keeping the name on the land’:patrilineal succession in Northern Irish family farming.In: Lobley, M., Baker, J. and Whitehead, I. (Eds.), Keeping it
ISSN 2047-3710 International Journal of Agricultural Management, Volume 7 Issue 114 & 2018 International Farm Management Association and Institute of Agricultural Management
Exploring the Irish farmer-farm relationship in later life Shane Francis Conway et al.
in the Family: International Perspectives on Succession andRetirement on Family Farms (Ashgate), pp. 93–110.
Relph, E. (1976). Place and Placelessness. London: Pion.Riley, M. (2011). ’Letting them go’ - agricultural retirement and
human-livestock relations. Geoforum, 42(1): 16–27.Riley, M. (2012). ‘Moving on’? Exploring the geographies of
retirement adjustment amongst farming couples. Social &Cultural Geography, 13(7): 759–781.
Rossier, R. (2012). Farm succession in Switzerland: fromgeneration to generation. In: Lobley, M., Baker, J. and White-head, I. (Eds.), Keeping it in the Family: International Per-spectives on Succession and Retirement on Family Farms(Ashgate), pp. 75–91.
Rowles, G.D. (1983a). Place and personal identity in old age:observations from Appalachia. Journal of EnvironmentalPsychology, 3, 299–313.
Rowles, G.D. (1983b). Geographical dimensions of socialsupport in rural Appalachia. In: Rowles, G.D. and Ohta, R.J.(Eds.), Aging and Milieu: Environmental Perspectives onGrowing Old. New York: Academic Press, pp.111–130.
Rowles, G.D. (1983c). Between worlds: a relocation dilemma forthe Appalachian elderly. International Journal on Aging andHuman Development, 17, 301–314.
Rowles, G.D. (1984). Aging in rural environments. In Altman, I.,Wohlwill, J. and Lawton, M.P. (Eds.), Human Behaviour andEnvironment: The Elderly and the Physical Environment.(pp.129–152). New York: Plenum Press.
Rowles, G.D. (1990). Place attachment among small townelderly. Journal of Rural Community Psychology. 11:103–120.
Rowles, G.D. (1993). Evolving images of place in aging and‘Aging in place’. Generations, 17(2), 65–70.
Rowles, G.D. and Ravdal, H. (2002). Aging, place, and meaningin the face of changing circumstances. In Weiss, RSBass, SA (Eds.), Challenges of the third age: Meaningand purpose in later life (pp. 81–114). New York: OxfordUniversity Press.
Rowles, G.D., Oswald, F. and Hunter, E.G. (2003). Interior livingenvironments in old age, in Wahl, H., Scheidt, R. andWindley, P. (Eds.), Aging in Contexts: Socio-Physical Envir-onments. New York: Springer, p. 167–194.
Rowles, G.D. (2006). A house is not a home: but can it becomeone. In: Wahl, H., Brenner, H., Mollenkopf, D., Rothenbacher, D.
and Rott, C. (Eds.), The Many Faces of Health, Competenceand Well-Being in Old Age: Integrating Epidemiological,Psychological and Social Perspectives. Netherlands:Springer, pp. 25–32.
Rowles, G.D. (2008). Place in occupational science: a lifecourse perspective on the role of environmental contextin the quest for meaning. Journal of Occupational Science,15, 127–135.
Ryan, M. (1995). Early Retirement for farmers: The OCEDObserver, 194, 24.
Seamon, D. (2014). Physical and Virtual Environments: Meaningof Place and Space. In Schell, B. and Scafa, M. (Eds.),Willard and Spackman’s Occupational Therapy. (12th Edn.)Philadelphia: Wippincot, Williams & Wilkens, pp. 202–214.
Shucksmith, M. and Hermann, V. (2002). Future changes inBritish agriculture: projecting divergent farm householdbehaviour. Journal of Agricultural Economics, 53: 37–50.
Sutherland, Lee-Ann, Rob, J.F. and Burton (2011). GoodFarmers, Good Neighbours? The Role of Cultural Capital inSocial Capital Development in a Scottish Farming Commu-nity. Sociologia Ruralis 51: 238–255.
Taylor, J., Norris, J. and Howard, W. (1998). Succession pat-terns of farmer and successor in Canadian farm families.Rural Sociology, 63(4), 553–573.
Turner, M. and Hambly, J. (2005). Agricultural restructuring: Thepotential role of joint venture arrangements. University ofExeter, Centre for Rural Research, Annual Review 2004.
Whitehead, I., Lobley, M. and Baker, J. (2012). From generationto generation: drawing the threads together. In: Lobley, M.,Baker, J. and Whitehead, I. (Eds.), Keeping it in the Family:International Perspectives on Succession and Retirement onFamily Farms (Ashgate), pp. 213–240.
Winter, M. (1997). New policies and new skills: Agriculturalchange and technology transfer., Sociologia Ruralis, 37(3):363–381.
Witzel, A. (2000). The problem-centered interview. Forum QualSoc Res, 1(1). Art. 22.
Yarwood, R. and Evans, N. (2006). A Lleyn sweep for localsheep? Breed societies and the geographies of Welsh live-stock. Environment and Planning, 38(7), 1307–1326.
Zagata, L. and Sutherland, L.A. (2015). Deconstructing the‘young farmer problem in Europe’: Towards a researchagenda. Journal of Rural Studies 38: 39–51.
International Journal of Agricultural Management, Volume 7 Issue 1 ISSN 2047-3710& 2018 International Farm Management Association and Institute of Agricultural Management 15
Shane Francis Conway et al. Exploring the Irish farmer-farm relationship in later life
REFEREED ARTICLEDOI: 10.5836/ijam/2018-07-16
Identifying and prioritizing opportunitiesfor improving efficiency on the farm:
holistic metrics and benchmarking withData Envelopment Analysis
A.D. SOTERIADES1, K. ROWLAND2, D.J. ROBERTS3 and A.W. STOTT4
ABSTRACTEfficiency benchmarking is a well-established way of measuring and improving farm performance. Anincreasingly popular efficiency benchmarking tool within agricultural research is Data EnvelopmentAnalysis (DEA). However, the literature currently lacks sufficient demonstration of how DEA could betuned to the needs of the farm advisor/extension officer, rather than of the researcher. Also, the literature isflooded with DEA terminology that may discourage the non-academic practitioner from adopting DEA.This paper aims at making DEA more accessible to farm consultants/extension officers by explaining themethod step-by-step, visually and with minimal use of specialised terminology and mathematics. Then,DEA’s potential for identifying cost-reducing and profit-making opportunities for farmers is demonstratedwith a series of examples drawn from commercial UK dairy farm data. Finally, three DEA methods forstudying efficiency change and trends over time are also presented. Main challenges are discussed (e.g. dataavailability), as well as ideas for extending DEA’s applicability in the agricultural industry, such as the use ofcarbon footprints and other farm sustainability indicators in DEA analyses.
KEYWORDS: commercial dairy farms; farm management; efficiency; benchmarking; Data Envelopment Analysis
1. Introduction
A commonly used measure of efficiency is stated in theratio of output to input (Cooper et al., 2007) and is widelyused in benchmarking procedures to identify best-practicemanagement for a given farming system (Fraser andCordina, 1999). Such procedures, henceforth referred toas ‘efficiency benchmarking’, are instrumental for guid-ing farmers on how to reduce costs and resource use,increase profitability and minimize environmental impactsof production (Fraser and Cordina, 1999). This paperdemonstrates how an efficiency benchmarking tool thatis well-established in agricultural research may be usedto solve actual problems facing (dairy) farm managers.
Limitations of conventional efficiencybenchmarkingIn the farming industry, benchmarking is typically effec-ted by reporting average values (e.g. of input use, pro-duction, costs and prices, input-output ratios) from a
group of farms with similar characteristics, so that farmersfrom that group may compare these values to their ownperformance (AHDB Dairy, 2014; Kingshay, 2017). Thistype of more ‘conventional’ benchmarking is myopic andperformance indicators such as simple single ratios maymislead when performance and profitability are deter-mined by interrelated multifactorial processes (Cooperet al., 2007). For example, good feed efficiency may beachieved at the expense of inefficient use of labour andnitrogen fertilizer, and at higher replacement rates, result-ing in higher costs/lower profits and higher environmentalimpacts. Moreover, some of these multifactorial processeshave public good dimensions, which consumers andsociety increasingly expect farmers to account for, andthey may even reward their delivery if objective metricscan be found that prove contribution while ensuringthat the farmer is not left at a disadvantage (Foresight,2011). Although the agricultural industry is increasinglyresponding to these demands with novel tools account-ing for carbon foot-printing data (Alltech E-CO2, 2017;SAC Consulting, 2017) or other environmental, social and
1Corresponding Author: Bangor University, Thoday Building, Deiniol Road, Bangor, Gwynedd, LL57 2UW, UK. Email: [email protected] Farming & Conservation Ltd, Bridge Farm, West Bradley, Glastonbury, Somerset, BA6 8LU.3 Scotland’s Rural College, Barony Campus, Parkgate, Dumfries, DG1 3NE, UK.4 Scotland’s Rural College, Peter Wilson Building, Kings Buildings, West Mains Road, Edinburgh EH9 3JG, UK.
Original submitted June 2017; revision received April 2018; accepted April 2018.
ISSN 2047-3710 International Journal of Agricultural Management, Volume 7 Issue 116 & 2018 International Farm Management Association and Institute of Agricultural Management
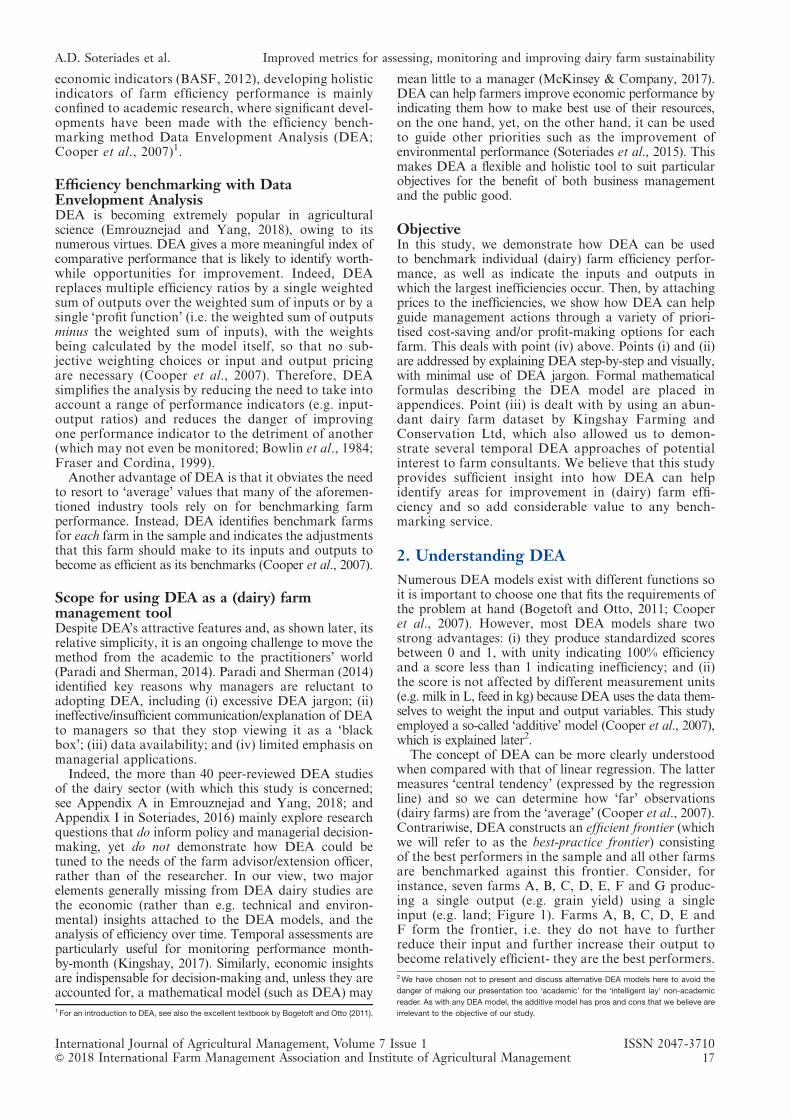
economic indicators (BASF, 2012), developing holisticindicators of farm efficiency performance is mainlyconfined to academic research, where significant devel-opments have been made with the efficiency bench-marking method Data Envelopment Analysis (DEA;Cooper et al., 2007)1.
Efficiency benchmarking with DataEnvelopment AnalysisDEA is becoming extremely popular in agriculturalscience (Emrouznejad and Yang, 2018), owing to itsnumerous virtues. DEA gives a more meaningful index ofcomparative performance that is likely to identify worth-while opportunities for improvement. Indeed, DEAreplaces multiple efficiency ratios by a single weightedsum of outputs over the weighted sum of inputs or by asingle ‘profit function’ (i.e. the weighted sum of outputsminus the weighted sum of inputs), with the weightsbeing calculated by the model itself, so that no sub-jective weighting choices or input and output pricingare necessary (Cooper et al., 2007). Therefore, DEAsimplifies the analysis by reducing the need to take intoaccount a range of performance indicators (e.g. input-output ratios) and reduces the danger of improvingone performance indicator to the detriment of another(which may not even be monitored; Bowlin et al., 1984;Fraser and Cordina, 1999).
Another advantage of DEA is that it obviates the needto resort to ‘average’ values that many of the aforemen-tioned industry tools rely on for benchmarking farmperformance. Instead, DEA identifies benchmark farmsfor each farm in the sample and indicates the adjustmentsthat this farm should make to its inputs and outputs tobecome as efficient as its benchmarks (Cooper et al., 2007).
Scope for using DEA as a (dairy) farmmanagement toolDespite DEA’s attractive features and, as shown later, itsrelative simplicity, it is an ongoing challenge to move themethod from the academic to the practitioners’ world(Paradi and Sherman, 2014). Paradi and Sherman (2014)identified key reasons why managers are reluctant toadopting DEA, including (i) excessive DEA jargon; (ii)ineffective/insufficient communication/explanation of DEAto managers so that they stop viewing it as a ‘blackbox’; (iii) data availability; and (iv) limited emphasis onmanagerial applications.
Indeed, the more than 40 peer-reviewed DEA studiesof the dairy sector (with which this study is concerned;see Appendix A in Emrouznejad and Yang, 2018; andAppendix I in Soteriades, 2016) mainly explore researchquestions that do inform policy and managerial decision-making, yet do not demonstrate how DEA could betuned to the needs of the farm advisor/extension officer,rather than of the researcher. In our view, two majorelements generally missing from DEA dairy studies arethe economic (rather than e.g. technical and environ-mental) insights attached to the DEA models, and theanalysis of efficiency over time. Temporal assessments areparticularly useful for monitoring performance month-by-month (Kingshay, 2017). Similarly, economic insightsare indispensable for decision-making and, unless they areaccounted for, a mathematical model (such as DEA) may
mean little to a manager (McKinsey & Company, 2017).DEA can help farmers improve economic performance byindicating them how to make best use of their resources,on the one hand, yet, on the other hand, it can be usedto guide other priorities such as the improvement ofenvironmental performance (Soteriades et al., 2015). Thismakes DEA a flexible and holistic tool to suit particularobjectives for the benefit of both business managementand the public good.
ObjectiveIn this study, we demonstrate how DEA can be usedto benchmark individual (dairy) farm efficiency perfor-mance, as well as indicate the inputs and outputs inwhich the largest inefficiencies occur. Then, by attachingprices to the inefficiencies, we show how DEA can helpguide management actions through a variety of priori-tised cost-saving and/or profit-making options for eachfarm. This deals with point (iv) above. Points (i) and (ii)are addressed by explaining DEA step-by-step and visually,with minimal use of DEA jargon. Formal mathematicalformulas describing the DEA model are placed inappendices. Point (iii) is dealt with by using an abun-dant dairy farm dataset by Kingshay Farming andConservation Ltd, which also allowed us to demon-strate several temporal DEA approaches of potentialinterest to farm consultants. We believe that this studyprovides sufficient insight into how DEA can helpidentify areas for improvement in (dairy) farm effi-ciency and so add considerable value to any bench-marking service.
2. Understanding DEA
Numerous DEA models exist with different functions soit is important to choose one that fits the requirements ofthe problem at hand (Bogetoft and Otto, 2011; Cooperet al., 2007). However, most DEA models share twostrong advantages: (i) they produce standardized scoresbetween 0 and 1, with unity indicating 100% efficiencyand a score less than 1 indicating inefficiency; and (ii)the score is not affected by different measurement units(e.g. milk in L, feed in kg) because DEA uses the data them-selves to weight the input and output variables. This studyemployed a so-called ‘additive’ model (Cooper et al., 2007),which is explained later2.
The concept of DEA can be more clearly understoodwhen compared with that of linear regression. The lattermeasures ‘central tendency’ (expressed by the regressionline) and so we can determine how ‘far’ observations(dairy farms) are from the ‘average’ (Cooper et al., 2007).Contrariwise, DEA constructs an efficient frontier (whichwe will refer to as the best-practice frontier) consistingof the best performers in the sample and all other farmsare benchmarked against this frontier. Consider, forinstance, seven farms A, B, C, D, E, F and G produc-ing a single output (e.g. grain yield) using a singleinput (e.g. land; Figure 1). Farms A, B, C, D, E andF form the frontier, i.e. they do not have to furtherreduce their input and further increase their output tobecome relatively efficient- they are the best performers.
1 For an introduction to DEA, see also the excellent textbook by Bogetoft and Otto (2011).
2We have chosen not to present and discuss alternative DEA models here to avoid the
danger of making our presentation too ‘academic’ for the ‘intelligent lay’ non-academic
reader. As with any DEA model, the additive model has pros and cons that we believe are
irrelevant to the objective of our study.
International Journal of Agricultural Management, Volume 7 Issue 1 ISSN 2047-3710& 2018 International Farm Management Association and Institute of Agricultural Management 17
A.D. Soteriades et al. Improved metrics for assessing, monitoring and improving dairy farm sustainability
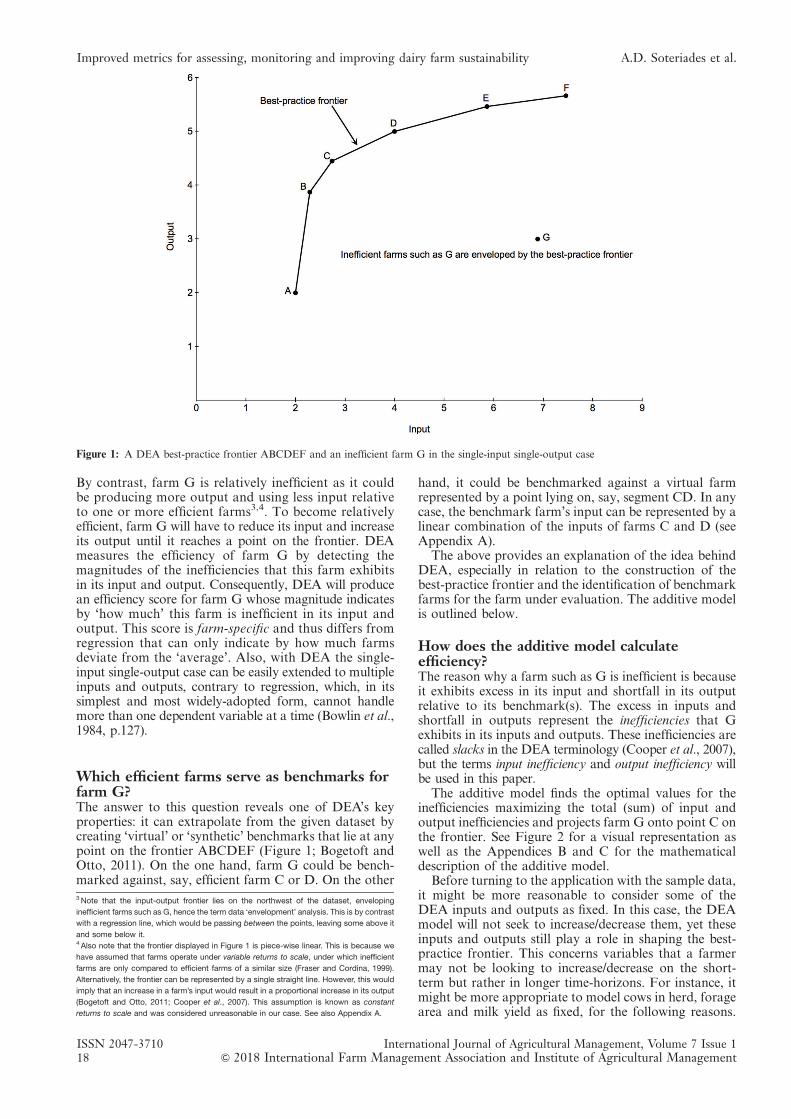
By contrast, farm G is relatively inefficient as it couldbe producing more output and using less input relativeto one or more efficient farms3,4. To become relativelyefficient, farm G will have to reduce its input and increaseits output until it reaches a point on the frontier. DEAmeasures the efficiency of farm G by detecting themagnitudes of the inefficiencies that this farm exhibitsin its input and output. Consequently, DEA will producean efficiency score for farm G whose magnitude indicatesby ‘how much’ this farm is inefficient in its input andoutput. This score is farm-specific and thus differs fromregression that can only indicate by how much farmsdeviate from the ‘average’. Also, with DEA the single-input single-output case can be easily extended to multipleinputs and outputs, contrary to regression, which, in itssimplest and most widely-adopted form, cannot handlemore than one dependent variable at a time (Bowlin et al.,1984, p.127).
Which efficient farms serve as benchmarks forfarm G?The answer to this question reveals one of DEA’s keyproperties: it can extrapolate from the given dataset bycreating ‘virtual’ or ‘synthetic’ benchmarks that lie at anypoint on the frontier ABCDEF (Figure 1; Bogetoft andOtto, 2011). On the one hand, farm G could be bench-marked against, say, efficient farm C or D. On the other
hand, it could be benchmarked against a virtual farmrepresented by a point lying on, say, segment CD. In anycase, the benchmark farm’s input can be represented by alinear combination of the inputs of farms C and D (seeAppendix A).
The above provides an explanation of the idea behindDEA, especially in relation to the construction of thebest-practice frontier and the identification of benchmarkfarms for the farm under evaluation. The additive modelis outlined below.
How does the additive model calculateefficiency?The reason why a farm such as G is inefficient is becauseit exhibits excess in its input and shortfall in its outputrelative to its benchmark(s). The excess in inputs andshortfall in outputs represent the inefficiencies that Gexhibits in its inputs and outputs. These inefficiencies arecalled slacks in the DEA terminology (Cooper et al., 2007),but the terms input inefficiency and output inefficiency willbe used in this paper.
The additive model finds the optimal values for theinefficiencies maximizing the total (sum) of input andoutput inefficiencies and projects farm G onto point C onthe frontier. See Figure 2 for a visual representation aswell as the Appendices B and C for the mathematicaldescription of the additive model.
Before turning to the application with the sample data,it might be more reasonable to consider some of theDEA inputs and outputs as fixed. In this case, the DEAmodel will not seek to increase/decrease them, yet theseinputs and outputs still play a role in shaping the best-practice frontier. This concerns variables that a farmermay not be looking to increase/decrease on the short-term but rather in longer time-horizons. For instance, itmight be more appropriate to model cows in herd, foragearea and milk yield as fixed, for the following reasons.
Figure 1: A DEA best-practice frontier ABCDEF and an inefficient farm G in the single-input single-output case
3 Note that the input-output frontier lies on the northwest of the dataset, enveloping
inefficient farms such as G, hence the term data ‘envelopment’ analysis. This is by contrast
with a regression line, which would be passing between the points, leaving some above it
and some below it.4 Also note that the frontier displayed in Figure 1 is piece-wise linear. This is because we
have assumed that farms operate under variable returns to scale, under which inefficient
farms are only compared to efficient farms of a similar size (Fraser and Cordina, 1999).
Alternatively, the frontier can be represented by a single straight line. However, this would
imply that an increase in a farm’s input would result in a proportional increase in its output
(Bogetoft and Otto, 2011; Cooper et al., 2007). This assumption is known as constant
returns to scale and was considered unreasonable in our case. See also Appendix A.
ISSN 2047-3710 International Journal of Agricultural Management, Volume 7 Issue 118 & 2018 International Farm Management Association and Institute of Agricultural Management
Improved metrics for assessing, monitoring and improving dairy farm sustainability A.D. Soteriades et al.
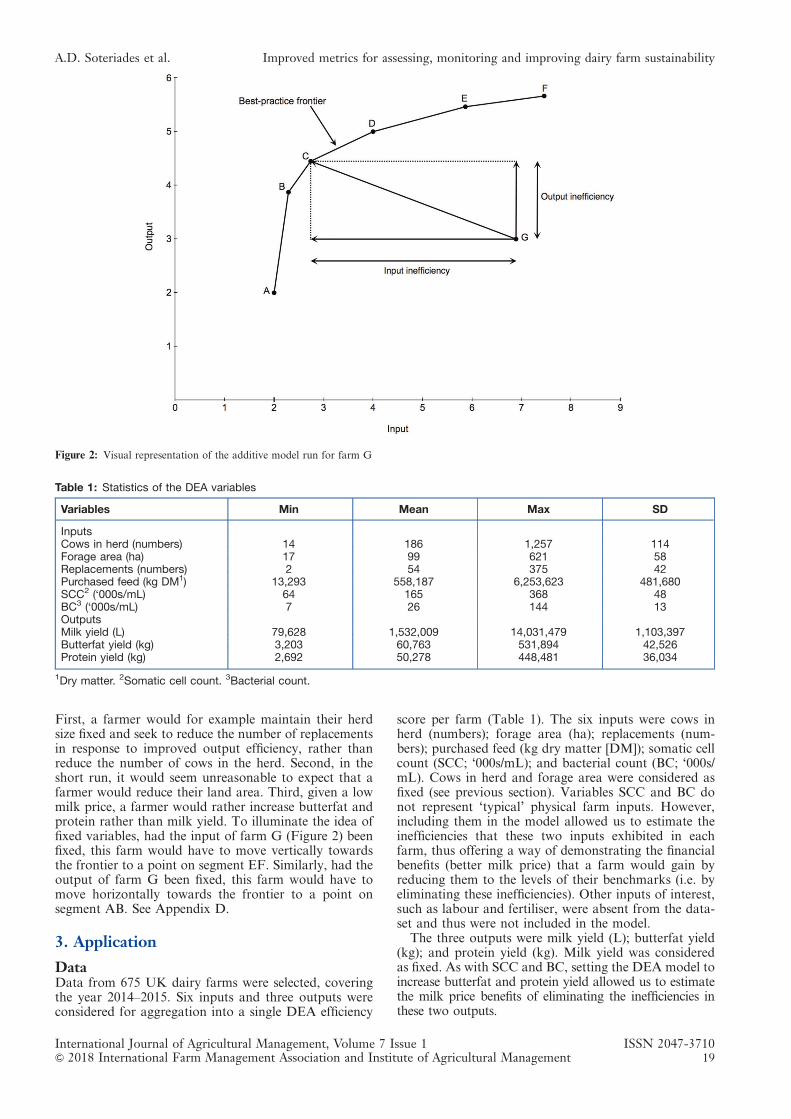
First, a farmer would for example maintain their herdsize fixed and seek to reduce the number of replacementsin response to improved output efficiency, rather thanreduce the number of cows in the herd. Second, in theshort run, it would seem unreasonable to expect that afarmer would reduce their land area. Third, given a lowmilk price, a farmer would rather increase butterfat andprotein rather than milk yield. To illuminate the idea offixed variables, had the input of farm G (Figure 2) beenfixed, this farm would have to move vertically towardsthe frontier to a point on segment EF. Similarly, had theoutput of farm G been fixed, this farm would have tomove horizontally towards the frontier to a point onsegment AB. See Appendix D.
3. Application
DataData from 675 UK dairy farms were selected, coveringthe year 2014–2015. Six inputs and three outputs wereconsidered for aggregation into a single DEA efficiency
score per farm (Table 1). The six inputs were cows inherd (numbers); forage area (ha); replacements (num-bers); purchased feed (kg dry matter [DM]); somatic cellcount (SCC; ‘000s/mL); and bacterial count (BC; ‘000s/mL). Cows in herd and forage area were considered asfixed (see previous section). Variables SCC and BC donot represent ‘typical’ physical farm inputs. However,including them in the model allowed us to estimate theinefficiencies that these two inputs exhibited in eachfarm, thus offering a way of demonstrating the financialbenefits (better milk price) that a farm would gain byreducing them to the levels of their benchmarks (i.e. byeliminating these inefficiencies). Other inputs of interest,such as labour and fertiliser, were absent from the data-set and thus were not included in the model.
The three outputs were milk yield (L); butterfat yield(kg); and protein yield (kg). Milk yield was consideredas fixed. As with SCC and BC, setting the DEA model toincrease butterfat and protein yield allowed us to estimatethe milk price benefits of eliminating the inefficiencies inthese two outputs.
Figure 2: Visual representation of the additive model run for farm G
Table 1: Statistics of the DEA variables
Variables Min Mean Max SD
InputsCows in herd (numbers) 14 186 1,257 114Forage area (ha) 17 99 621 58Replacements (numbers) 2 54 375 42Purchased feed (kg DM1) 13,293 558,187 6,253,623 481,680SCC2 (‘000s/mL) 64 165 368 48BC3 (‘000s/mL) 7 26 144 13OutputsMilk yield (L) 79,628 1,532,009 14,031,479 1,103,397Butterfat yield (kg) 3,203 60,763 531,894 42,526Protein yield (kg) 2,692 50,278 448,481 36,034
1Dry matter. 2Somatic cell count. 3Bacterial count.
International Journal of Agricultural Management, Volume 7 Issue 1 ISSN 2047-3710& 2018 International Farm Management Association and Institute of Agricultural Management 19
A.D. Soteriades et al. Improved metrics for assessing, monitoring and improving dairy farm sustainability
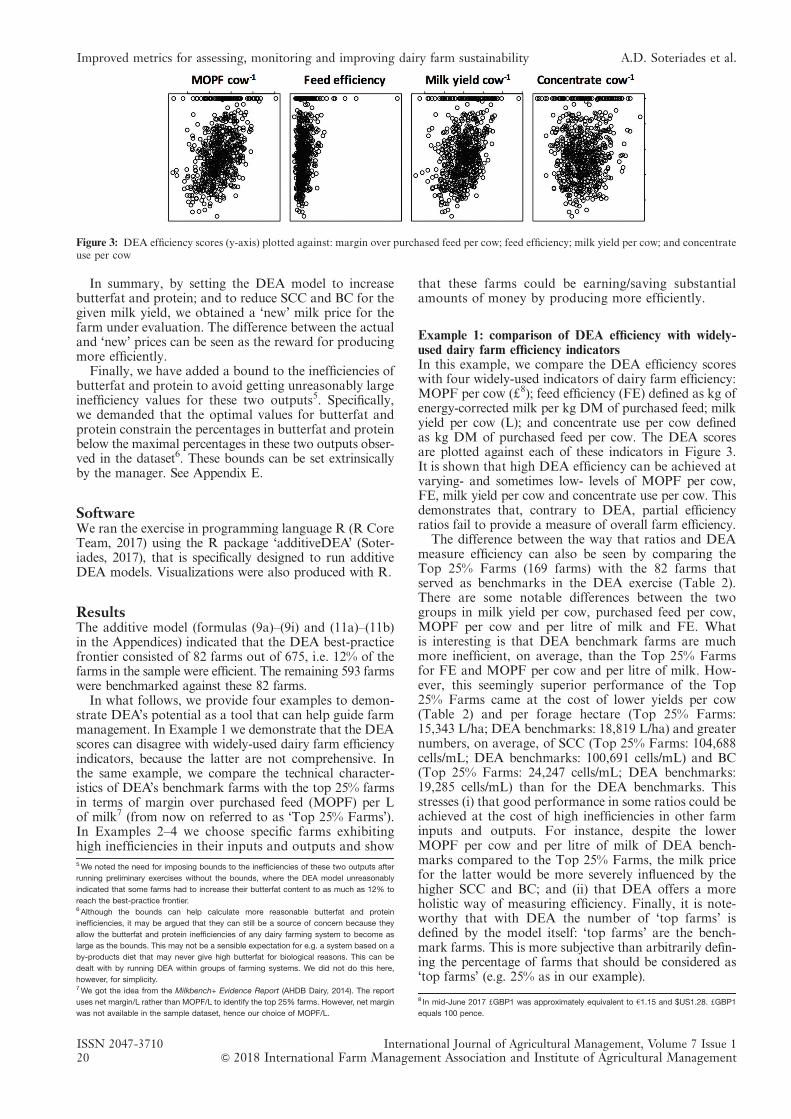
In summary, by setting the DEA model to increasebutterfat and protein; and to reduce SCC and BC for thegiven milk yield, we obtained a ‘new’ milk price for thefarm under evaluation. The difference between the actualand ‘new’ prices can be seen as the reward for producingmore efficiently.
Finally, we have added a bound to the inefficiencies ofbutterfat and protein to avoid getting unreasonably largeinefficiency values for these two outputs5. Specifically,we demanded that the optimal values for butterfat andprotein constrain the percentages in butterfat and proteinbelow the maximal percentages in these two outputs obser-ved in the dataset6. These bounds can be set extrinsicallyby the manager. See Appendix E.
SoftwareWe ran the exercise in programming language R (R CoreTeam, 2017) using the R package ‘additiveDEA’ (Soter-iades, 2017), that is specifically designed to run additiveDEA models. Visualizations were also produced with R.
ResultsThe additive model (formulas (9a)–(9i) and (11a)–(11b)in the Appendices) indicated that the DEA best-practicefrontier consisted of 82 farms out of 675, i.e. 12% of thefarms in the sample were efficient. The remaining 593 farmswere benchmarked against these 82 farms.
In what follows, we provide four examples to demon-strate DEA’s potential as a tool that can help guide farmmanagement. In Example 1 we demonstrate that the DEAscores can disagree with widely-used dairy farm efficiencyindicators, because the latter are not comprehensive. Inthe same example, we compare the technical character-istics of DEA’s benchmark farms with the top 25% farmsin terms of margin over purchased feed (MOPF) per Lof milk7 (from now on referred to as ‘Top 25% Farms’).In Examples 2–4 we choose specific farms exhibitinghigh inefficiencies in their inputs and outputs and show
that these farms could be earning/saving substantialamounts of money by producing more efficiently.
Example 1: comparison of DEA efficiency with widely-used dairy farm efficiency indicatorsIn this example, we compare the DEA efficiency scoreswith four widely-used indicators of dairy farm efficiency:MOPF per cow (d8); feed efficiency (FE) defined as kg ofenergy-corrected milk per kg DM of purchased feed; milkyield per cow (L); and concentrate use per cow definedas kg DM of purchased feed per cow. The DEA scoresare plotted against each of these indicators in Figure 3.It is shown that high DEA efficiency can be achieved atvarying- and sometimes low- levels of MOPF per cow,FE, milk yield per cow and concentrate use per cow. Thisdemonstrates that, contrary to DEA, partial efficiencyratios fail to provide a measure of overall farm efficiency.
The difference between the way that ratios and DEAmeasure efficiency can also be seen by comparing theTop 25% Farms (169 farms) with the 82 farms thatserved as benchmarks in the DEA exercise (Table 2).There are some notable differences between the twogroups in milk yield per cow, purchased feed per cow,MOPF per cow and per litre of milk and FE. Whatis interesting is that DEA benchmark farms are muchmore inefficient, on average, than the Top 25% Farmsfor FE and MOPF per cow and per litre of milk. How-ever, this seemingly superior performance of the Top25% Farms came at the cost of lower yields per cow(Table 2) and per forage hectare (Top 25% Farms:15,343 L/ha; DEA benchmarks: 18,819 L/ha) and greaternumbers, on average, of SCC (Top 25% Farms: 104,688cells/mL; DEA benchmarks: 100,691 cells/mL) and BC(Top 25% Farms: 24,247 cells/mL; DEA benchmarks:19,285 cells/mL) than for the DEA benchmarks. Thisstresses (i) that good performance in some ratios could beachieved at the cost of high inefficiencies in other farminputs and outputs. For instance, despite the lowerMOPF per cow and per litre of milk of DEA bench-marks compared to the Top 25% Farms, the milk pricefor the latter would be more severely influenced by thehigher SCC and BC; and (ii) that DEA offers a moreholistic way of measuring efficiency. Finally, it is note-worthy that with DEA the number of ‘top farms’ isdefined by the model itself: ‘top farms’ are the bench-mark farms. This is more subjective than arbitrarily defin-ing the percentage of farms that should be considered as‘top farms’ (e.g. 25% as in our example).
Figure 3: DEA efficiency scores (y-axis) plotted against: margin over purchased feed per cow; feed efficiency; milk yield per cow; and concentrateuse per cow
5We noted the need for imposing bounds to the inefficiencies of these two outputs after
running preliminary exercises without the bounds, where the DEA model unreasonably
indicated that some farms had to increase their butterfat content to as much as 12% to
reach the best-practice frontier.6 Although the bounds can help calculate more reasonable butterfat and protein
inefficiencies, it may be argued that they can still be a source of concern because they
allow the butterfat and protein inefficiencies of any dairy farming system to become as
large as the bounds. This may not be a sensible expectation for e.g. a system based on a
by-products diet that may never give high butterfat for biological reasons. This can be
dealt with by running DEA within groups of farming systems. We did not do this here,
however, for simplicity.7We got the idea from the Milkbench+ Evidence Report (AHDB Dairy, 2014). The report
uses net margin/L rather than MOPF/L to identify the top 25% farms. However, net margin
was not available in the sample dataset, hence our choice of MOPF/L.
8 In mid-June 2017 dGBP1 was approximately equivalent to h1.15 and $US1.28. dGBP1
equals 100 pence.
ISSN 2047-3710 International Journal of Agricultural Management, Volume 7 Issue 120 & 2018 International Farm Management Association and Institute of Agricultural Management
Improved metrics for assessing, monitoring and improving dairy farm sustainability A.D. Soteriades et al.
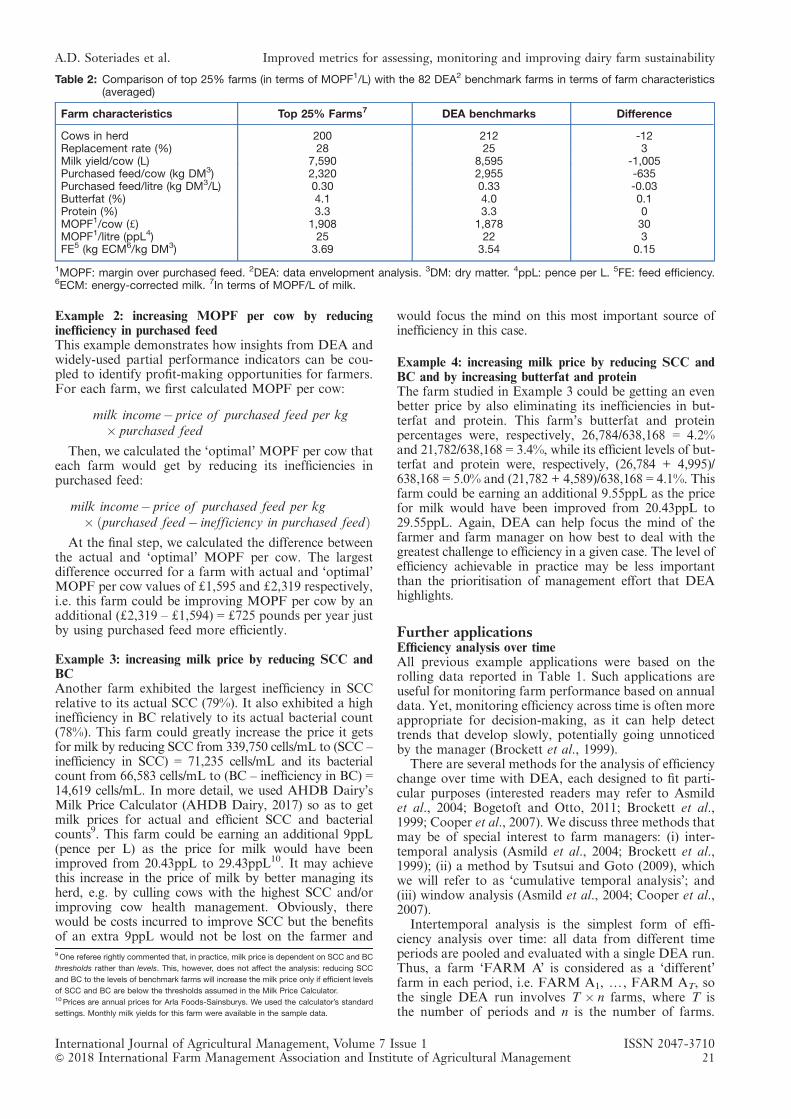
Example 2: increasing MOPF per cow by reducinginefficiency in purchased feedThis example demonstrates how insights from DEA andwidely-used partial performance indicators can be cou-pled to identify profit-making opportunities for farmers.For each farm, we first calculated MOPF per cow:
milk income� price of purchased feed per kg� purchased feed
Then, we calculated the ‘optimal’ MOPF per cow thateach farm would get by reducing its inefficiencies inpurchased feed:
milk income� price of purchased feed per kg� purchased feed � inefficiency in purchased feedð Þ
At the final step, we calculated the difference betweenthe actual and ‘optimal’ MOPF per cow. The largestdifference occurred for a farm with actual and ‘optimal’MOPF per cow values of d1,595 and d2,319 respectively,i.e. this farm could be improving MOPF per cow by anadditional (d2,319 – d1,594) = d725 pounds per year justby using purchased feed more efficiently.
Example 3: increasing milk price by reducing SCC andBCAnother farm exhibited the largest inefficiency in SCCrelative to its actual SCC (79%). It also exhibited a highinefficiency in BC relatively to its actual bacterial count(78%). This farm could greatly increase the price it getsfor milk by reducing SCC from 339,750 cells/mL to (SCC –inefficiency in SCC) = 71,235 cells/mL and its bacterialcount from 66,583 cells/mL to (BC – inefficiency in BC) =14,619 cells/mL. In more detail, we used AHDB Dairy’sMilk Price Calculator (AHDB Dairy, 2017) so as to getmilk prices for actual and efficient SCC and bacterialcounts9. This farm could be earning an additional 9ppL(pence per L) as the price for milk would have beenimproved from 20.43ppL to 29.43ppL10. It may achievethis increase in the price of milk by better managing itsherd, e.g. by culling cows with the highest SCC and/orimproving cow health management. Obviously, therewould be costs incurred to improve SCC but the benefitsof an extra 9ppL would not be lost on the farmer and
would focus the mind on this most important source ofinefficiency in this case.
Example 4: increasing milk price by reducing SCC andBC and by increasing butterfat and proteinThe farm studied in Example 3 could be getting an evenbetter price by also eliminating its inefficiencies in but-terfat and protein. This farm’s butterfat and proteinpercentages were, respectively, 26,784/638,168 = 4.2%and 21,782/638,168 = 3.4%, while its efficient levels of but-terfat and protein were, respectively, (26,784 + 4,995)/638,168 = 5.0% and (21,782 + 4,589)/638,168 = 4.1%. Thisfarm could be earning an additional 9.55ppL as the pricefor milk would have been improved from 20.43ppL to29.55ppL. Again, DEA can help focus the mind of thefarmer and farm manager on how best to deal with thegreatest challenge to efficiency in a given case. The level ofefficiency achievable in practice may be less importantthan the prioritisation of management effort that DEAhighlights.
Further applicationsEfficiency analysis over timeAll previous example applications were based on therolling data reported in Table 1. Such applications areuseful for monitoring farm performance based on annualdata. Yet, monitoring efficiency across time is often moreappropriate for decision-making, as it can help detecttrends that develop slowly, potentially going unnoticedby the manager (Brockett et al., 1999).
There are several methods for the analysis of efficiencychange over time with DEA, each designed to fit parti-cular purposes (interested readers may refer to Asmildet al., 2004; Bogetoft and Otto, 2011; Brockett et al.,1999; Cooper et al., 2007). We discuss three methods thatmay be of special interest to farm managers: (i) inter-temporal analysis (Asmild et al., 2004; Brockett et al.,1999); (ii) a method by Tsutsui and Goto (2009), whichwe will refer to as ‘cumulative temporal analysis’; and(iii) window analysis (Asmild et al., 2004; Cooper et al.,2007).
Intertemporal analysis is the simplest form of effi-ciency analysis over time: all data from different timeperiods are pooled and evaluated with a single DEA run.Thus, a farm ‘FARM A’ is considered as a ‘different’farm in each period, i.e. FARM A1, y, FARM AT, sothe single DEA run involves T � n farms, where T isthe number of periods and n is the number of farms.
Table 2: Comparison of top 25% farms (in terms of MOPF1/L) with the 82 DEA2 benchmark farms in terms of farm characteristics(averaged)
Farm characteristics Top 25% Farms7 DEA benchmarks Difference
Cows in herd 200 212 -12Replacement rate (%) 28 25 3Milk yield/cow (L) 7,590 8,595 -1,005Purchased feed/cow (kg DM3) 2,320 2,955 -635Purchased feed/litre (kg DM3/L) 0.30 0.33 -0.03Butterfat (%) 4.1 4.0 0.1Protein (%) 3.3 3.3 0MOPF1/cow (d) 1,908 1,878 30MOPF1/litre (ppL4) 25 22 3FE5 (kg ECM6/kg DM3) 3.69 3.54 0.15
1MOPF: margin over purchased feed. 2DEA: data envelopment analysis. 3DM: dry matter. 4ppL: pence per L. 5FE: feed efficiency.6ECM: energy-corrected milk. 7In terms of MOPF/L of milk.
9One referee rightly commented that, in practice, milk price is dependent on SCC and BC
thresholds rather than levels. This, however, does not affect the analysis: reducing SCC
and BC to the levels of benchmark farms will increase the milk price only if efficient levels
of SCC and BC are below the thresholds assumed in the Milk Price Calculator.10 Prices are annual prices for Arla Foods-Sainsburys. We used the calculator’s standard
settings. Monthly milk yields for this farm were available in the sample data.
International Journal of Agricultural Management, Volume 7 Issue 1 ISSN 2047-3710& 2018 International Farm Management Association and Institute of Agricultural Management 21
A.D. Soteriades et al. Improved metrics for assessing, monitoring and improving dairy farm sustainability
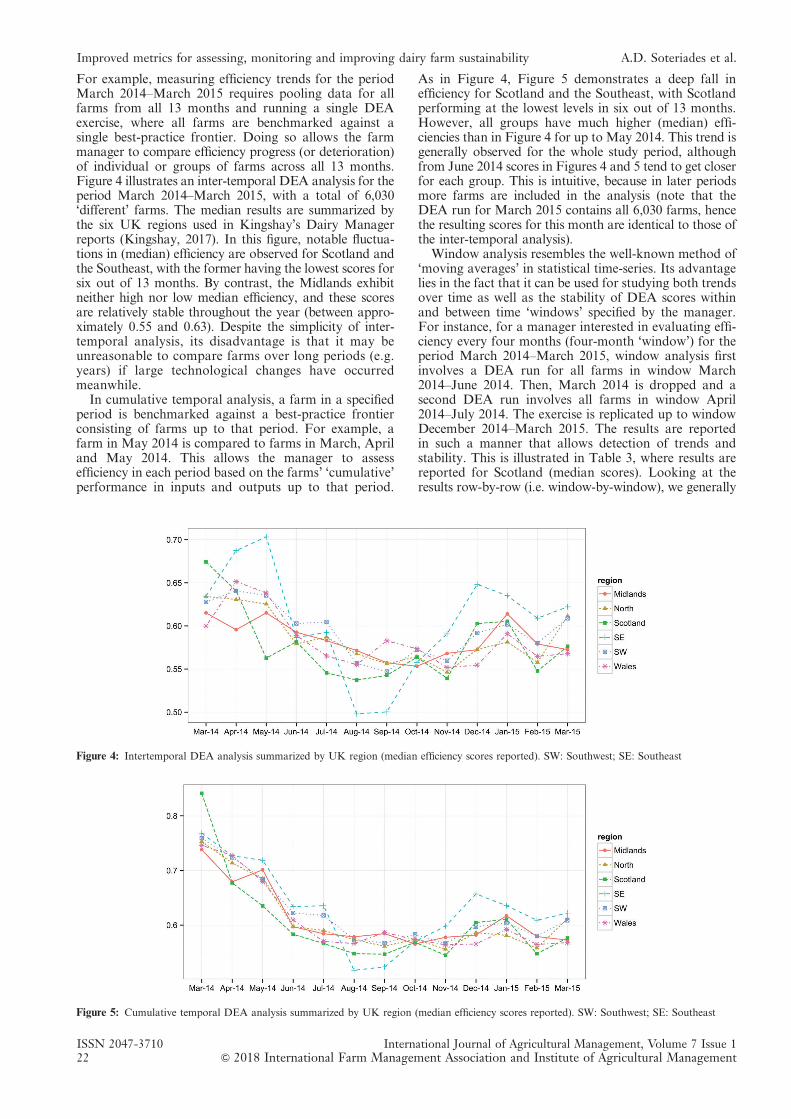
For example, measuring efficiency trends for the periodMarch 2014–March 2015 requires pooling data for allfarms from all 13 months and running a single DEAexercise, where all farms are benchmarked against asingle best-practice frontier. Doing so allows the farmmanager to compare efficiency progress (or deterioration)of individual or groups of farms across all 13 months.Figure 4 illustrates an inter-temporal DEA analysis for theperiod March 2014–March 2015, with a total of 6,030‘different’ farms. The median results are summarized bythe six UK regions used in Kingshay’s Dairy Managerreports (Kingshay, 2017). In this figure, notable fluctua-tions in (median) efficiency are observed for Scotland andthe Southeast, with the former having the lowest scores forsix out of 13 months. By contrast, the Midlands exhibitneither high nor low median efficiency, and these scoresare relatively stable throughout the year (between appro-ximately 0.55 and 0.63). Despite the simplicity of inter-temporal analysis, its disadvantage is that it may beunreasonable to compare farms over long periods (e.g.years) if large technological changes have occurredmeanwhile.
In cumulative temporal analysis, a farm in a specifiedperiod is benchmarked against a best-practice frontierconsisting of farms up to that period. For example, afarm in May 2014 is compared to farms in March, Apriland May 2014. This allows the manager to assessefficiency in each period based on the farms’ ‘cumulative’performance in inputs and outputs up to that period.
As in Figure 4, Figure 5 demonstrates a deep fall inefficiency for Scotland and the Southeast, with Scotlandperforming at the lowest levels in six out of 13 months.However, all groups have much higher (median) effi-ciencies than in Figure 4 for up to May 2014. This trend isgenerally observed for the whole study period, althoughfrom June 2014 scores in Figures 4 and 5 tend to get closerfor each group. This is intuitive, because in later periodsmore farms are included in the analysis (note that theDEA run for March 2015 contains all 6,030 farms, hencethe resulting scores for this month are identical to those ofthe inter-temporal analysis).
Window analysis resembles the well-known method of‘moving averages’ in statistical time-series. Its advantagelies in the fact that it can be used for studying both trendsover time as well as the stability of DEA scores withinand between time ‘windows’ specified by the manager.For instance, for a manager interested in evaluating effi-ciency every four months (four-month ‘window’) for theperiod March 2014–March 2015, window analysis firstinvolves a DEA run for all farms in window March2014–June 2014. Then, March 2014 is dropped and asecond DEA run involves all farms in window April2014–July 2014. The exercise is replicated up to windowDecember 2014–March 2015. The results are reportedin such a manner that allows detection of trends andstability. This is illustrated in Table 3, where results arereported for Scotland (median scores). Looking at theresults row-by-row (i.e. window-by-window), we generally
Figure 5: Cumulative temporal DEA analysis summarized by UK region (median efficiency scores reported). SW: Southwest; SE: Southeast
Figure 4: Intertemporal DEA analysis summarized by UK region (median efficiency scores reported). SW: Southwest; SE: Southeast
ISSN 2047-3710 International Journal of Agricultural Management, Volume 7 Issue 122 & 2018 International Farm Management Association and Institute of Agricultural Management
Improved metrics for assessing, monitoring and improving dairy farm sustainability A.D. Soteriades et al.
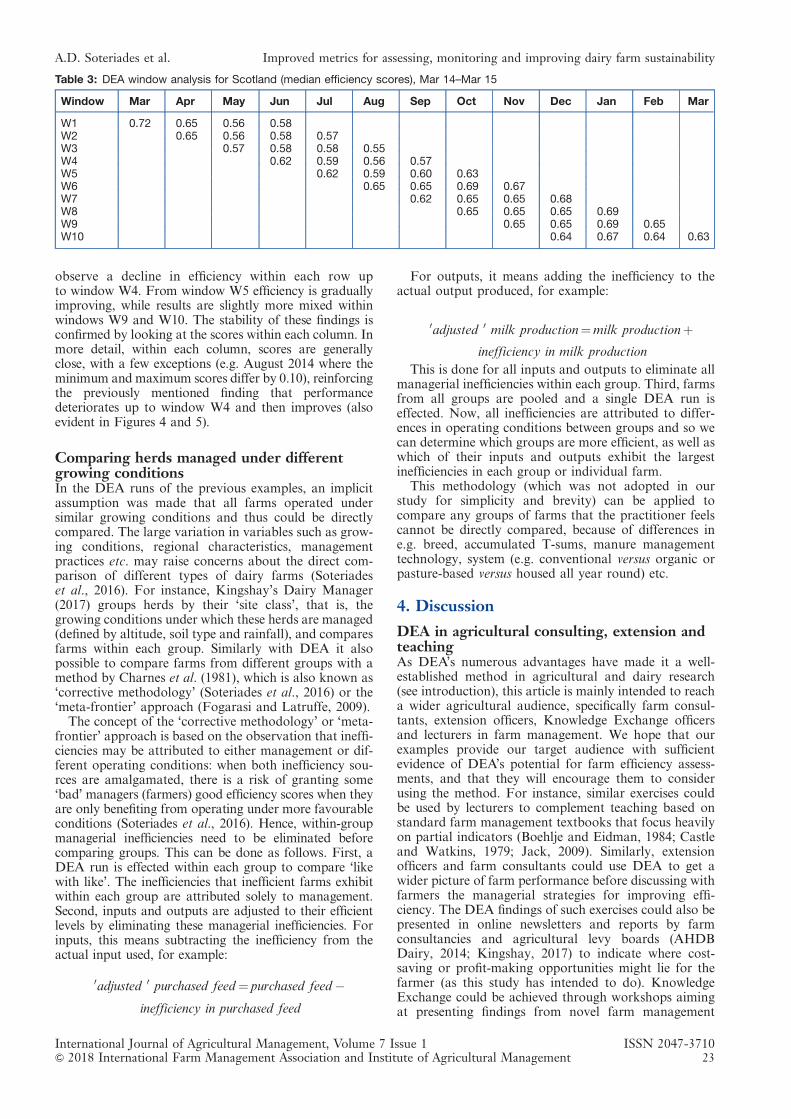
observe a decline in efficiency within each row upto window W4. From window W5 efficiency is graduallyimproving, while results are slightly more mixed withinwindows W9 and W10. The stability of these findings isconfirmed by looking at the scores within each column. Inmore detail, within each column, scores are generallyclose, with a few exceptions (e.g. August 2014 where theminimum and maximum scores differ by 0.10), reinforcingthe previously mentioned finding that performancedeteriorates up to window W4 and then improves (alsoevident in Figures 4 and 5).
Comparing herds managed under differentgrowing conditionsIn the DEA runs of the previous examples, an implicitassumption was made that all farms operated undersimilar growing conditions and thus could be directlycompared. The large variation in variables such as grow-ing conditions, regional characteristics, managementpractices etc. may raise concerns about the direct com-parison of different types of dairy farms (Soteriadeset al., 2016). For instance, Kingshay’s Dairy Manager(2017) groups herds by their ‘site class’, that is, thegrowing conditions under which these herds are managed(defined by altitude, soil type and rainfall), and comparesfarms within each group. Similarly with DEA it alsopossible to compare farms from different groups with amethod by Charnes et al. (1981), which is also known as‘corrective methodology’ (Soteriades et al., 2016) or the‘meta-frontier’ approach (Fogarasi and Latruffe, 2009).
The concept of the ‘corrective methodology’ or ‘meta-frontier’ approach is based on the observation that ineffi-ciencies may be attributed to either management or dif-ferent operating conditions: when both inefficiency sou-rces are amalgamated, there is a risk of granting some‘bad’ managers (farmers) good efficiency scores when theyare only benefiting from operating under more favourableconditions (Soteriades et al., 2016). Hence, within-groupmanagerial inefficiencies need to be eliminated beforecomparing groups. This can be done as follows. First, aDEA run is effected within each group to compare ‘likewith like’. The inefficiencies that inefficient farms exhibitwithin each group are attributed solely to management.Second, inputs and outputs are adjusted to their efficientlevels by eliminating these managerial inefficiencies. Forinputs, this means subtracting the inefficiency from theactual input used, for example:
0adjusted 0 purchased feed¼ purchased feed�inefficiency in purchased feed
For outputs, it means adding the inefficiency to theactual output produced, for example:
0adjusted 0 milk production¼milk productionþinefficiency in milk production
This is done for all inputs and outputs to eliminate allmanagerial inefficiencies within each group. Third, farmsfrom all groups are pooled and a single DEA run iseffected. Now, all inefficiencies are attributed to differ-ences in operating conditions between groups and so wecan determine which groups are more efficient, as well aswhich of their inputs and outputs exhibit the largestinefficiencies in each group or individual farm.
This methodology (which was not adopted in ourstudy for simplicity and brevity) can be applied tocompare any groups of farms that the practitioner feelscannot be directly compared, because of differences ine.g. breed, accumulated T-sums, manure managementtechnology, system (e.g. conventional versus organic orpasture-based versus housed all year round) etc.
4. Discussion
DEA in agricultural consulting, extension andteachingAs DEA’s numerous advantages have made it a well-established method in agricultural and dairy research(see introduction), this article is mainly intended to reacha wider agricultural audience, specifically farm consul-tants, extension officers, Knowledge Exchange officersand lecturers in farm management. We hope that ourexamples provide our target audience with sufficientevidence of DEA’s potential for farm efficiency assess-ments, and that they will encourage them to considerusing the method. For instance, similar exercises couldbe used by lecturers to complement teaching based onstandard farm management textbooks that focus heavilyon partial indicators (Boehlje and Eidman, 1984; Castleand Watkins, 1979; Jack, 2009). Similarly, extensionofficers and farm consultants could use DEA to get awider picture of farm performance before discussing withfarmers the managerial strategies for improving effi-ciency. The DEA findings of such exercises could also bepresented in online newsletters and reports by farmconsultancies and agricultural levy boards (AHDBDairy, 2014; Kingshay, 2017) to indicate where cost-saving or profit-making opportunities might lie for thefarmer (as this study has intended to do). KnowledgeExchange could be achieved through workshops aimingat presenting findings from novel farm management
Table 3: DEA window analysis for Scotland (median efficiency scores), Mar 14–Mar 15
Window Mar Apr May Jun Jul Aug Sep Oct Nov Dec Jan Feb Mar
W1 0.72 0.65 0.56 0.58W2 0.65 0.56 0.58 0.57W3 0.57 0.58 0.58 0.55W4 0.62 0.59 0.56 0.57W5 0.62 0.59 0.60 0.63W6 0.65 0.65 0.69 0.67W7 0.62 0.65 0.65 0.68W8 0.65 0.65 0.65 0.69W9 0.65 0.65 0.69 0.65W10 0.64 0.67 0.64 0.63
International Journal of Agricultural Management, Volume 7 Issue 1 ISSN 2047-3710& 2018 International Farm Management Association and Institute of Agricultural Management 23
A.D. Soteriades et al. Improved metrics for assessing, monitoring and improving dairy farm sustainability
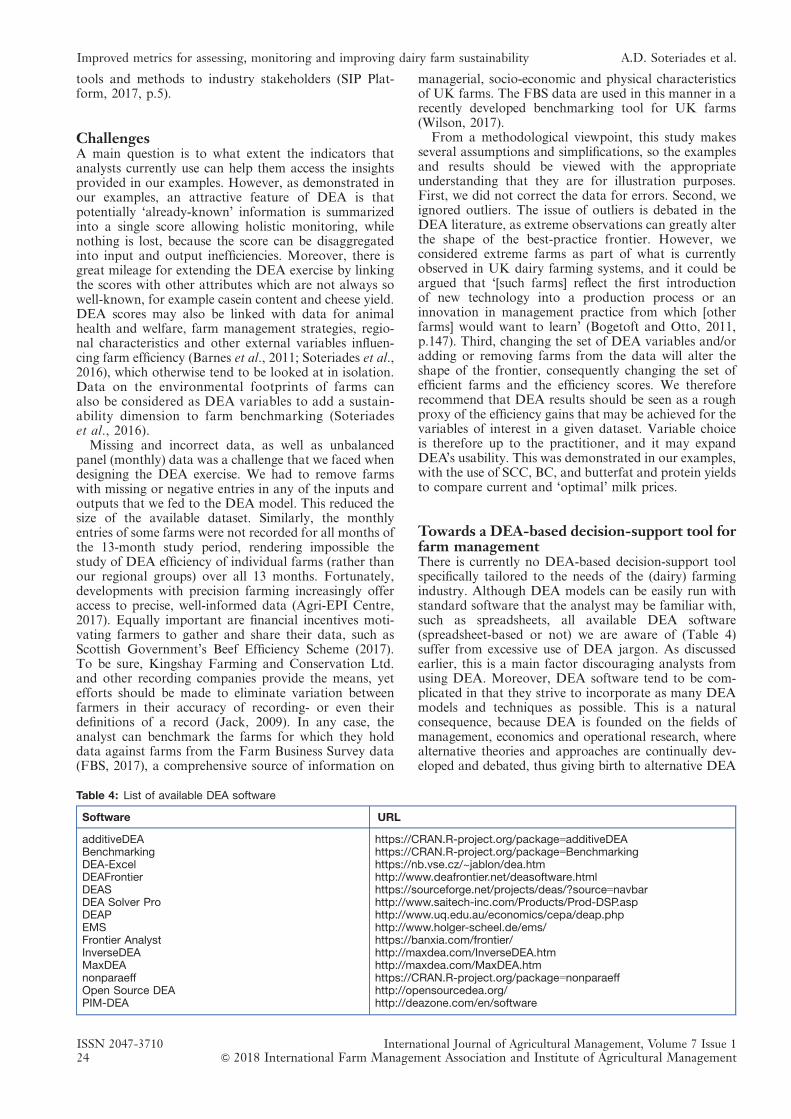
tools and methods to industry stakeholders (SIP Plat-form, 2017, p.5).
ChallengesA main question is to what extent the indicators thatanalysts currently use can help them access the insightsprovided in our examples. However, as demonstrated inour examples, an attractive feature of DEA is thatpotentially ‘already-known’ information is summarizedinto a single score allowing holistic monitoring, whilenothing is lost, because the score can be disaggregatedinto input and output inefficiencies. Moreover, there isgreat mileage for extending the DEA exercise by linkingthe scores with other attributes which are not always sowell-known, for example casein content and cheese yield.DEA scores may also be linked with data for animalhealth and welfare, farm management strategies, regio-nal characteristics and other external variables influen-cing farm efficiency (Barnes et al., 2011; Soteriades et al.,2016), which otherwise tend to be looked at in isolation.Data on the environmental footprints of farms canalso be considered as DEA variables to add a sustain-ability dimension to farm benchmarking (Soteriadeset al., 2016).
Missing and incorrect data, as well as unbalancedpanel (monthly) data was a challenge that we faced whendesigning the DEA exercise. We had to remove farmswith missing or negative entries in any of the inputs andoutputs that we fed to the DEA model. This reduced thesize of the available dataset. Similarly, the monthlyentries of some farms were not recorded for all months ofthe 13-month study period, rendering impossible thestudy of DEA efficiency of individual farms (rather thanour regional groups) over all 13 months. Fortunately,developments with precision farming increasingly offeraccess to precise, well-informed data (Agri-EPI Centre,2017). Equally important are financial incentives moti-vating farmers to gather and share their data, such asScottish Government’s Beef Efficiency Scheme (2017).To be sure, Kingshay Farming and Conservation Ltd.and other recording companies provide the means, yetefforts should be made to eliminate variation betweenfarmers in their accuracy of recording- or even theirdefinitions of a record (Jack, 2009). In any case, theanalyst can benchmark the farms for which they holddata against farms from the Farm Business Survey data(FBS, 2017), a comprehensive source of information on
managerial, socio-economic and physical characteristicsof UK farms. The FBS data are used in this manner in arecently developed benchmarking tool for UK farms(Wilson, 2017).
From a methodological viewpoint, this study makesseveral assumptions and simplifications, so the examplesand results should be viewed with the appropriateunderstanding that they are for illustration purposes.First, we did not correct the data for errors. Second, weignored outliers. The issue of outliers is debated in theDEA literature, as extreme observations can greatly alterthe shape of the best-practice frontier. However, weconsidered extreme farms as part of what is currentlyobserved in UK dairy farming systems, and it could beargued that ‘[such farms] reflect the first introductionof new technology into a production process or aninnovation in management practice from which [otherfarms] would want to learn’ (Bogetoft and Otto, 2011,p.147). Third, changing the set of DEA variables and/oradding or removing farms from the data will alter theshape of the frontier, consequently changing the set ofefficient farms and the efficiency scores. We thereforerecommend that DEA results should be seen as a roughproxy of the efficiency gains that may be achieved for thevariables of interest in a given dataset. Variable choiceis therefore up to the practitioner, and it may expandDEA’s usability. This was demonstrated in our examples,with the use of SCC, BC, and butterfat and protein yieldsto compare current and ‘optimal’ milk prices.
Towards a DEA-based decision-support tool forfarm managementThere is currently no DEA-based decision-support toolspecifically tailored to the needs of the (dairy) farmingindustry. Although DEA models can be easily run withstandard software that the analyst may be familiar with,such as spreadsheets, all available DEA software(spreadsheet-based or not) we are aware of (Table 4)suffer from excessive use of DEA jargon. As discussedearlier, this is a main factor discouraging analysts fromusing DEA. Moreover, DEA software tend to be com-plicated in that they strive to incorporate as many DEAmodels and techniques as possible. This is a naturalconsequence, because DEA is founded on the fields ofmanagement, economics and operational research, wherealternative theories and approaches are continually dev-eloped and debated, thus giving birth to alternative DEA
Table 4: List of available DEA software
Software URL
additiveDEA https://CRAN.R-project.org/package=additiveDEABenchmarking https://CRAN.R-project.org/package=BenchmarkingDEA-Excel https://nb.vse.cz/~jablon/dea.htmDEAFrontier http://www.deafrontier.net/deasoftware.htmlDEAS https://sourceforge.net/projects/deas/?source=navbarDEA Solver Pro http://www.saitech-inc.com/Products/Prod-DSP.aspDEAP http://www.uq.edu.au/economics/cepa/deap.phpEMS http://www.holger-scheel.de/ems/Frontier Analyst https://banxia.com/frontier/InverseDEA http://maxdea.com/InverseDEA.htmMaxDEA http://maxdea.com/MaxDEA.htmnonparaeff https://CRAN.R-project.org/package=nonparaeffOpen Source DEA http://opensourcedea.org/PIM-DEA http://deazone.com/en/software
ISSN 2047-3710 International Journal of Agricultural Management, Volume 7 Issue 124 & 2018 International Farm Management Association and Institute of Agricultural Management
Improved metrics for assessing, monitoring and improving dairy farm sustainability A.D. Soteriades et al.
models and methodologies to satisfy different needs(Bogetoft and Otto, 2011; Cooper et al., 2007). To besure, this may be of little concern to the farm analyst, whowould rather focus their mind on specific objectives thatcould be dealt with specific DEA models and methods.
That said, it would be bold to assume that the farmanalyst would benchmark farms using DEA themselves.As discussed earlier, we are well-aware that our study is apremature and simplified introduction to DEA for farmbenchmarking and that many issues were not addressedin our examples. We envisage that this study will evolveto the development of a DEA-based decision-supporttool for farm management, following the guidelines intwo recent and particularly inspiring papers on thedesign of decision-support systems for agriculture (Roseet al, 2016, 2018).
5. Conclusion
DEA can help identify inefficient producers as well asindicate the inputs and outputs in which the largestinefficiencies occur for each farm. That way DEA canhelp guide management actions through a variety ofcost-saving and/or profit-making options for each farm.We showed that detection- and elimination- of input andoutput inefficiencies can notably increase milk price andreduce the costs of concentrate use for inefficient UKdairy farms. We also demonstrated three simple waysof studying efficiency change over time with DEA to helpdetect trends in the technical performance of differentfarms or farm groups. Our DEA exercise could be exten-ded to include other important variables such as labour,fertilizer use, greenhouse gas emissions, nitrogen andphosphorous surpluses etc. to account for objectives rele-vant to both business management and the public good.This flexibility characterizing DEA increases its impor-tance in the context of a post- ‘Brexit’ UK, where a sig-nificant challenge will be to improve competitiveness inthe world market (BSAS, 2017).
About the authors
A. D. Soteriades is a mathematician with a PhD insustainable dairy farming (University of Edinburgh,Scotland’s Rural College, French National Institute ofAgricultural Research). His expertise is in farm bench-marking and sustainability metrics (including Life CycleAssessment) with mathematical methods from the fieldsof operational research and statistics. He is currently aPostdoctoral Research Fellow in Bangor University, run-ning UK dairy and beef farm intensification scenarios.
K. Rowland is a Senior Farm Services manager forKingshay Farming & Conservation Ltd., Bridge Farm,West Bradley, Glastonbury, Somerset, UK. She specia-lizes in data analysis of UK dairy production systems.
Prof. D. Roberts is Knowledge Exchange Director/Regional Dean at Scotland’s Rural College (SRUC),Dumfries, UK. His research interests are in FarmManagement Research, especially dairy farming systems;Knowledge Exchange to a wide range of stakeholdersincluding agricultural businesses, policy makers and thegeneral public; and links between agriculture and schooleducation at both primary and secondary level.
Prof. A. W. Stott is Interim Vice Principal Researchat Scotland’s Rural College (SRUC), Edinburgh, UK.
He heads SRUC’s Future Farming Systems ResearchGroup. His research interests are in whole-farm modelingand trade-offs in sustainable farming systems.
Acknowledgement
A.D. Soteriades gratefully acknowledges financial sup-port provided by the A.G. Leventis Foundation, SRUC,INRA (PHASE division), and the Welsh Governmentand Higher Education Funding Council for Walesthrough the Sêr Cymru National Research Network forLow Carbon, Energy and Environment (NRN-LCEE).A.W. Stott and D.J. Roberts were supported by theScottish Government Environment, Agriculture and FoodStrategic Research Programme. A warm thank you tothree anonymous reviewers, as well as to R. Simpson andD. Forbes (Kingshay Farming and Conservation Ltd) fortheir invaluable comments.
Competing interests
None.
Ethics statement
We hereby state that have paid due regard to ethical con-siderations relating to the work reported and the workcontains no defamatory or unlawful statements.
REFERENCES
Agri-EPI Centre (2017). Agri-EPI Centre: The Agricultural Engi-neering Precision Innovation Centre. https://www.agri-epicentre.com/ [accessed 4 May 2018].
AHDB Dairy (2017). Milk Price Calculator. Agriculture andHorticulture Development Board. https://dairy.ahdb.org.uk/market-information/milk-price-calculator [accessed 4 May2018].
AHDB Dairy (2014). Milkbench+ Evidence Report. Agricultureand Horticulture Development Board, Kenilworth. https://dairy.ahdb.org.uk/non_umbraco/download.aspx?media=16646[accessed 4 May 2018].
Alltech E-CO2 (2017). Products & Services. http://www.alltech-e-co2.com/products-and-services/ [accessed 15 June 2017].
Asmild, M., Paradi, J.C., Aggarwall, V. and Schaffnit, C. (2004).Combining DEA window analysis with the Malmquist indexapproach in a study of the Canadian banking industry.Journal of Productivity Analysis 21 (1) 67–89. doi:10.1023/B:PROD.0000012453.91326.ec
Barnes, A.P., Rutherford, K.M.D., Langford, F.M. and Haskell,M.J. (2011). The effect of lameness prevalence on technicalefficiency at the dairy farm level: an adjusted data envel-opment analysis approach. Journal of Dairy Science 94 (11)5449–5457. doi:10.3168/jds.2011-4262
BASF (2012). AgBalance. BASF – The Chemical Company.https://agriculture.basf.com/en/Crop-Protection/AgBalance.html [accessed 4 May 2018].
Boehlje, M. and Eidman, V.R. (1984). Farm management. Wiley,New York.
Bogetoft, P. and Otto, L. (2011). Benchmarking with DEA, SFA,and R. Springer, New York.
Bowlin, W.F., Charnes, A., Cooper, W.W. and Sherman, H.D.(1984). Data envelopment analysis and regression approa-ches to efficiency estimation and evaluation. Annals ofOperations Research 2 (1) 113–138. doi:10.1007/BF01874735
Brockett, P.L., Golany, B. and Li, S. (1999). Analysis of inter-temporal efficiency trends using rank statistics with anapplication evaluating the macro economic performanceof OECD nations. Journal of Productivity Analysis 11 (2) 169–182. doi:10.1023/A:1007788117626
International Journal of Agricultural Management, Volume 7 Issue 1 ISSN 2047-3710& 2018 International Farm Management Association and Institute of Agricultural Management 25
A.D. Soteriades et al. Improved metrics for assessing, monitoring and improving dairy farm sustainability
BSAS (2017). Challenges and opportunities facing UK livestockproduction and animal science research. British Societyof Animal Science, Penicuik, UK. http://bsas.org.uk/sites/default/files/bsas_brexit_briefing_final_2.pdf
Castle, M.E. and Watkins, P. (1979). Modern milk production: itsprinciples and applications for students and farmers. Faberand Faber, New York.
Charnes, A., Cooper, W.W. and Rhodes, E. (1981). Evaluatingprogram and managerial efficiency: an application of dataenvelopment analysis to program follow through. Manage-ment Science 27 (6) 668–697. doi:10.1287/mnsc.27.6.668
Cooper, W.W., Seiford, L. and Tone, K. (2007). Data Envelop-ment Analysis. A comprehensive text with models, applica-tions, references and DEA-Solver software. Springer Science+Business Media, LLC, New York.
Emrouznejad, A. and Yang, G. (2018). A survey and analysis ofthe first 40 years of scholarly literature in DEA: 1978–2016.Socio-Economic Planning Sciences 61 4–8. doi:10.1016/j.seps.2017.01.008
FBS (2017). Farm Business Survey. http://www.farmbusinesssurvey.co.uk/ [accessed 4 May 2018].
Fogarasi, J. and Latruffe, L. (2009). Technical efficiency in dairyfarming: a comparison of France and Hungary in 2001-2006.Studies in Agricultural Economics 110 75–84. https://core.ac.uk/display/6499393
Foresight (2011). The Future of Food and Farming. Final ProjectReport. The Government Office for Science, London. https://www.gov.uk/government/uploads/system/uploads/attachment_data/file/288329/11-546-future-of-food-and-farming-report.pdf
Fraser, I. and Cordina, D. (1999). An application of data envel-opment analysis to irrigated dairy farms in Northern Victoria,Australia. Agricultural Systems 59 (3) 267–282. doi:10.1016/S0308-521X(99)00009-8
Jack, L. (2009). Benchmarking in food and farming: creatingsustainable change. Gower Publishing Limited, Farnham.
Kingshay (2017). Kingshay Dairy Manager. https://www.dairymanager.net/DMHome [accessed 4 May 2018 2017].
McKinsey & Company (2017). From research to consulting:analytics in the agriculture industry. http://www.mckinsey.com/careers/meet-our-people/careers-blog/delphine [accessed4 May 2018].
Paradi, J.C. and Sherman, H.D. (2014). Seeking greater prac-titioner and managerial use of DEA for benchmarking. DataEnvelopment Analysis Journal 1 (1) 29–55. doi:10.1561/103.00000004
R Core Team (2017). R: a language and environment for statis-tical computing. R Foundation for Statistical Computing,Vienna. https://www.r-project.org/ [accessed 4 May 2018].
Rose, D.C., Parker, C., Fodey, J., Park, C., Sutherland, W.J. andDicks, L.V. (2018). Involving stakeholders in agriculturaldecision support systems: improving user-centred design.International Journal of Agricultural Management 6 (3–4)80–89. doi:10.5836/ijam/2017-06-80
Rose, D.C., Sutherland, W.J., Parker, C., Lobley, M., Winter, M.,Morris, C., Twining, S., Ffoulkes, C., Amano, T. and Dicks,L.V. (2016). Decision support tools for agriculture: towardseffective design and delivery. Agricultural Systems 149 165–174. doi:10.1016/j.agsy.2016.09.009
SAC Consulting (2017). AgRe Calc. http://www.agrecalc.com/[accessed 4 May 2018].
Scottish Government (2017). Beef Efficiency Scheme. https://www.ruralpayments.org/publicsite/futures/topics/all-schemes/beef-efficiency-scheme/ [accessed 4 May 2018].
SIP Platform (2017). The newsletter of the Sustainable Intensi-fication Research Platform. Issue 7 - Autumn 2017. http://www.siplatform.org.uk/sites/default/files/newsletter_pdf/SIPSCENE_7th_Edition_FINAL.pdf [accessed 4 May 2018].
Soteriades, A.D. (2017). additiveDEA. https://cran.r-project.org/package=additiveDEA [accessed 4 May 2018].
Soteriades, A.D. (2016). Trade-offs in sustainable dairy farmingsystems. The University of Edinburgh, Edinburgh. https://www.era.lib.ed.ac.uk/handle/1842/18753
Soteriades, A.D., Faverdin, P., March, M. and Stott, A.W. (2015).Improving efficiency assessments using additive dataenvelopment analysis models: an application to contrastingdairy farming systems. Agricultural and Food Science 24 (3)235–248. http://ojs.tsv.fi/index.php/AFS/article/view/49446
Soteriades, A.D., Faverdin, P., Moreau, S., Charroin, T.,Blanchard, M. and Stott, A.W. (2016). An approach to holi-stically assess (dairy) farm eco-efficiency by combining lifecycle analysis with data envelopment analysis models andmethodologies. Animal 10 (11) 1899–1910. doi:10.1017/S1751731116000707
Tsutsui, M. and Goto, M. (2009). A multi-division efficiencyevaluation of U.S. electric power companies using a weightedslacks-based measure. Socio-Economic Planning Sciences43 (3) 201–208. doi:10.1016/j.seps.2008.05.002
Wilson, P. (2017). Science, Policy and Practice Note 8. Bench-marking Sustainable Intensification. http://www.siplatform.org.uk/sites/default/files/imce_uploads/Note%208%20%27Benchmarking%27.pdf [accessed 4 May 2018].
ISSN 2047-3710 International Journal of Agricultural Management, Volume 7 Issue 126 & 2018 International Farm Management Association and Institute of Agricultural Management
Improved metrics for assessing, monitoring and improving dairy farm sustainability A.D. Soteriades et al.
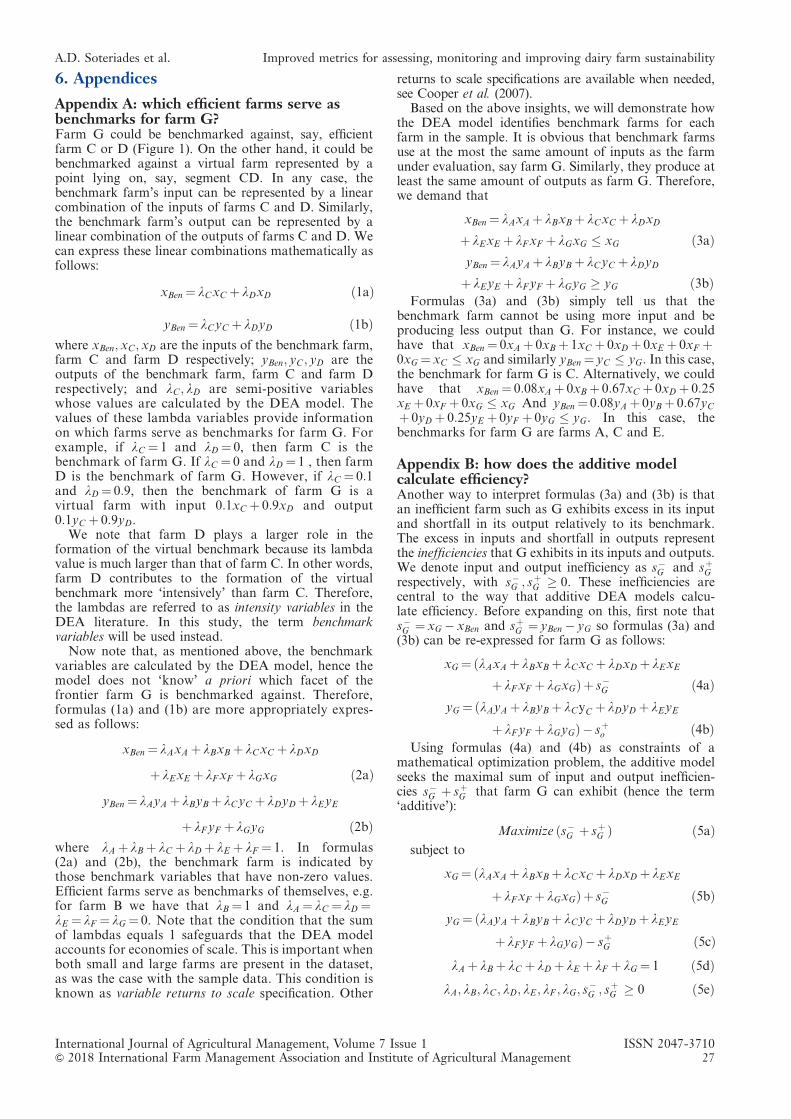
6. Appendices
Appendix A: which efficient farms serve asbenchmarks for farm G?Farm G could be benchmarked against, say, efficientfarm C or D (Figure 1). On the other hand, it could bebenchmarked against a virtual farm represented by apoint lying on, say, segment CD. In any case, thebenchmark farm’s input can be represented by a linearcombination of the inputs of farms C and D. Similarly,the benchmark farm’s output can be represented by alinear combination of the outputs of farms C and D. Wecan express these linear combinations mathematically asfollows:
xBen ¼ lCxC þ lDxD ð1aÞ
yBen ¼ lCyC þ lDyD ð1bÞwhere xBen; xC ; xD are the inputs of the benchmark farm,farm C and farm D respectively; yBen; yC ; yD are theoutputs of the benchmark farm, farm C and farm Drespectively; and lC ; lD are semi-positive variableswhose values are calculated by the DEA model. Thevalues of these lambda variables provide informationon which farms serve as benchmarks for farm G. Forexample, if lC ¼ 1 and lD ¼ 0, then farm C is thebenchmark of farm G. If lC ¼ 0 and lD ¼ 1 , then farmD is the benchmark of farm G. However, if lC ¼ 0:1and lD ¼ 0:9, then the benchmark of farm G is avirtual farm with input 0:1xC þ 0:9xD and output0:1yC þ 0:9yD.
We note that farm D plays a larger role in theformation of the virtual benchmark because its lambdavalue is much larger than that of farm C. In other words,farm D contributes to the formation of the virtualbenchmark more ‘intensively’ than farm C. Therefore,the lambdas are referred to as intensity variables in theDEA literature. In this study, the term benchmarkvariables will be used instead.
Now note that, as mentioned above, the benchmarkvariables are calculated by the DEA model, hence themodel does not ‘know’ a priori which facet of thefrontier farm G is benchmarked against. Therefore,formulas (1a) and (1b) are more appropriately expres-sed as follows:
xBen ¼ lAxA þ lBxB þ lCxC þ lDxD
þ lExE þ lFxF þ lGxG ð2aÞyBen ¼ lAyA þ lByB þ lCyC þ lDyD þ lEyE
þ lFyF þ lGyG ð2bÞwhere lA þ lB þ lC þ lD þ lE þ lF ¼ 1. In formulas(2a) and (2b), the benchmark farm is indicated bythose benchmark variables that have non-zero values.Efficient farms serve as benchmarks of themselves, e.g.for farm B we have that lB ¼ 1 and lA ¼ lC ¼ lD ¼lE ¼ lF ¼ lG ¼ 0. Note that the condition that the sumof lambdas equals 1 safeguards that the DEA modelaccounts for economies of scale. This is important whenboth small and large farms are present in the dataset,as was the case with the sample data. This condition isknown as variable returns to scale specification. Other
returns to scale specifications are available when needed,see Cooper et al. (2007).
Based on the above insights, we will demonstrate howthe DEA model identifies benchmark farms for eachfarm in the sample. It is obvious that benchmark farmsuse at the most the same amount of inputs as the farmunder evaluation, say farm G. Similarly, they produce atleast the same amount of outputs as farm G. Therefore,we demand that
xBen ¼ lAxA þ lBxB þ lCxC þ lDxD
þ lExE þ lFxF þ lGxG � xG ð3aÞyBen ¼ lAyA þ lByB þ lCyC þ lDyD
þ lEyE þ lFyF þ lGyG � yG ð3bÞFormulas (3a) and (3b) simply tell us that the
benchmark farm cannot be using more input and beproducing less output than G. For instance, we couldhave that xBen ¼ 0xA þ 0xB þ 1xC þ 0xD þ 0xE þ 0xF þ0xG ¼ xC � xG and similarly yBen ¼ yC � yG. In this case,the benchmark for farm G is C. Alternatively, we couldhave that xBen ¼ 0:08xA þ 0xB þ 0:67xC þ 0xD þ 0:25xE þ 0xF þ 0xG � xG And yBen ¼ 0:08yA þ 0yB þ 0:67yCþ 0yD þ 0:25yE þ 0yF þ 0yG � yG. In this case, thebenchmarks for farm G are farms A, C and E.
Appendix B: how does the additive modelcalculate efficiency?Another way to interpret formulas (3a) and (3b) is thatan inefficient farm such as G exhibits excess in its inputand shortfall in its output relatively to its benchmark.The excess in inputs and shortfall in outputs representthe inefficiencies that G exhibits in its inputs and outputs.We denote input and output inefficiency as s�G and sþGrespectively, with s�G ; sþG � 0. These inefficiencies arecentral to the way that additive DEA models calcu-late efficiency. Before expanding on this, first note thats�G ¼ xG � xBen and sþG ¼ yBen � yG so formulas (3a) and(3b) can be re-expressed for farm G as follows:
xG ¼ðlAxA þ lBxB þ lCxC þ lDxD þ lExE
þ lFxF þ lGxGÞþ s�G ð4aÞyG ¼ lAyA þ lByB þ lCyC þ lDyD þ lEyEð
þ lFyF þ lGyGÞ� sþo ð4bÞUsing formulas (4a) and (4b) as constraints of a
mathematical optimization problem, the additive modelseeks the maximal sum of input and output inefficien-cies s�G þ sþG that farm G can exhibit (hence the term‘additive’):
Maximize ðs�G þ sþG Þ ð5aÞsubject to
xG ¼ðlAxA þ lBxB þ lCxC þ lDxD þ lExE
þ lFxF þ lGxGÞþ s�G ð5bÞyG ¼ lAyA þ lByB þ lCyC þ lDyD þ lEyEð
þ lFyF þ lGyGÞ� sþG ð5cÞlA þ lB þ lC þ lD þ lE þ lF þ lG ¼ 1 ð5dÞ
lA; lB; lC ; lD; lE ; lF ; lG; s�G ; sþG � 0 ð5eÞ
International Journal of Agricultural Management, Volume 7 Issue 1 ISSN 2047-3710& 2018 International Farm Management Association and Institute of Agricultural Management 27
A.D. Soteriades et al. Improved metrics for assessing, monitoring and improving dairy farm sustainability

Problem (5a)-(5e) finds the optimal values for theinefficiencies and benchmark variables maximizings�G þ sþG and projects farm G onto point C on thefrontier (i.e. lC ¼ 1 and all other lambdas are zero). SeeFigure 2 for a visual representation of problem (5a)-(5e)for farm G.
Now we point out some shortcomings of the additivemodel and propose adjustments to enhance its applic-ability in the context of dairy farm efficiency. Note thatthe optimal sum s��
G þ sþ�G (‘*’ denotes optimality), i.e.
the score of the additive model for farm G, represents themaximal sum of inefficiencies in inputs and outputs thatG exhibits. This has three drawbacks: (i) the additivemodel produces a score of total inefficiency rather thanefficiency; (ii) the inefficiency score is not readilyinterpretable as it represents a sum of inefficiencies ininputs and outputs potentially measured in differentunits. For instance, the sum of inefficiency in milkproduction plus inefficiency in fertilizer use is clearly notintuitive; consequently, (iii) the optimal solution isaffected by the different measurement units in whichinputs and outputs are measured.
Problems (ii)-(iii) can be easily overcome by replacingthe sum in (5a) with
s�GxG
þ sþGyG
ð6ÞIn (6) the different measurement units cancel because
the inefficiencies are scaled by the actual input andoutput. In other words, the sum in (6) is units invariantand thus deals with problem (iii). The sum in (6) isinterpreted as the proportion in input excess in xG plusthe proportion in output shortfall relatively to yG. Inmore detail, a ratio of, say s�G
xG¼ 0:60 means that the input
of farm G is in excess by 60%, i.e. it could be usingxG � s�G ¼ xG � 0:60xG ¼ 0:40xG ¼ 40% of its input xG.On the output side, a ratio of
sþGyG
¼ 0:60 means thatfarm G could be producing yG þ sþG ¼ yG þ 0:60yG ¼1:60yG ¼ 160% of its output yG.
However, we are still faced with problem (i), althoughthis can also be easily dealt with. First note from (5b)that s�G cannot exceed xG, i.e.
s�GxG
� 1. However, we notefrom (5c) that this is not the case with sþG , i.e. we mayhave that
sþGyG41 . Nevertheless, in real life applications it
might be unreasonable to have output slacks larger thanthe actual output because in such a case the farm underevaluation would have to at least double its output tobecome efficient- an enormous increase. Hence, we maydemand that sþG � bG, where is an upper bound definedby the user, with bG � yG (Cooper et al., 2007, ch.13). Bysafeguarding that s�G
xG� 1 And
sþGyG
� 1, we have for theoptimal solution to (5a)-(5e) that 0 � 1
2s��GxG
þ sþ�GyG
� �� 1
and so
0 � 1� 12
s��G
xGþ sþ�
G
yG
� �� 1 ð7Þ
Thus, the inefficiency score (6) is converted to anefficiency score (7) that is bounded by 0 and 1, with 1
indicating full efficiency (zero input and output ineffi-ciencies) and a score less than 1 indicating inefficiency(non-zero input and output inefficiencies). The adjustedadditive model for farm G becomes:
Minimize 1� 12
s�GxG
þ sþGyG
� �� �ð8aÞ
subject to
xG ¼ðlAxA þ lBxB þ lCxC þ lDxD þ lExE
þ lFxF þ lGxGÞþ s�G ð8bÞyG ¼ lAyA þ lByB þ lCyC þ lDyD þ lEyEð
þ lFyF þ lGyGÞ� sþG ð8cÞlA þ lB þ lC þ lD þ lE þ lF þ lG ¼ 1 ð8dÞ
sþG � bG ð8eÞbG � yG ð8fÞ
lA; lB; lC ; lD; lE ; lF ; lG; s�G ; sþG � 0 ð8gÞ
Appendix C: the general caseWe consider the general case where there are dairy farmseach using inputs to produce outputs, denoted asxi i¼ 1; . . . ;mð Þ and yr r¼ 1; . . . ; sð Þ respectively. Theefficiency score for the farm under evaluation, denotedas FARMO, is given by the following generalization ofproblem (8a)-(8g):
r� ¼Minimizelj ;sio ;sro 1� 1mþ s
Xm
i¼ 1
sioxio
þXs
r¼ 1
sroyro
� �� �ð9aÞ
subject to
xio ¼Xn
j¼ 1xijlj þ sio; i¼ 1; . . . ;m ð9bÞ
yro ¼Xn
j¼ 1yrjlj � sro; r¼ 1; . . . ; s ð9cÞXn
j¼ 1lj ¼ 1 ð9dÞ
sro � bro; r¼ 1; . . . ; s ð9eÞbro � yro; r¼ 1; . . . ; s ð9fÞ
sio; sro; lj � 0ði¼ 1; . . . ;m; r¼ 1; . . . ; s; j¼ 1; . . . ; nÞð9gÞwhere xio and yro are the inputs and outputs of FARMOrespectively; sio and sro are the input and outputinefficiencies of FARMO respectively; and bro is theuser-defined upper bound of sro.
Appendix D: fixed variablesFixed inputs and outputs can be included in model (9a)-(9g) by adding the following two constraints:
xfixedko �Xn
j¼ 1xfixedkj lj ; k¼ 1; . . . ; number of fixed inputs ð9hÞ
yfixedlo �Xn
j¼ 1yfixedlo lj ; l¼ 1; . . . ; number of fixed outputs ð9iÞ
ISSN 2047-3710 International Journal of Agricultural Management, Volume 7 Issue 128 & 2018 International Farm Management Association and Institute of Agricultural Management
Improved metrics for assessing, monitoring and improving dairy farm sustainability A.D. Soteriades et al.
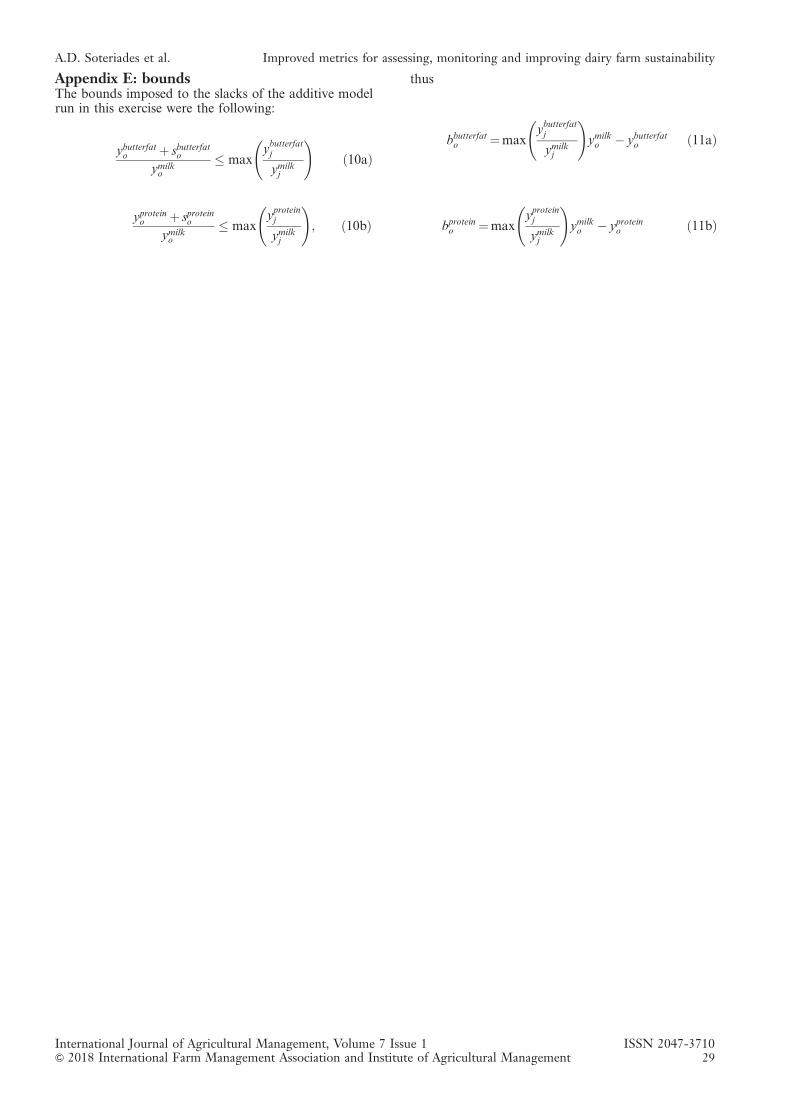
Appendix E: boundsThe bounds imposed to the slacks of the additive modelrun in this exercise were the following:
ybutterfato þ sbutterfato
ymilko
� maxybutterfatj
ymilkj
!ð10aÞ
yproteino þ sproteino
ymilko
� maxyproteinj
ymilkj
!; ð10bÞ
thus
bbutterfato ¼maxybutterfatj
ymilkj
!ymilko � ybutterfato ð11aÞ
bproteino ¼maxyproteinj
ymilkj
!ymilko � yproteino ð11bÞ
International Journal of Agricultural Management, Volume 7 Issue 1 ISSN 2047-3710& 2018 International Farm Management Association and Institute of Agricultural Management 29
A.D. Soteriades et al. Improved metrics for assessing, monitoring and improving dairy farm sustainability
REFEREED ARTICLEDOI: 10.5836/ijam/2018-07-30
Farmers’ spending on variable inputstends to maximise crop yields, not profitMARK A. READER1*, CESAR REVOREDO-GIHA2, RACHEL J. LAWRENCE1, IAN D. HODGE1
and BEN GA LANG1
ABSTRACTWe estimate the marginal returns to spending on Crop Variable Inputs (CVI) (such as fertilizers and cropprotection), to explore whether observed spending maximises physical or economic returns to farmers.Data are taken from the Farm Business Survey for 2004-2013, where gross margins and input spending areavailable, in over 10,300 crops of conventional winter wheat or oilseed rape in England and Wales.Marginal spending on CVIs generate financial returns significantly less than d1 per marginal pound spent.This suggests that expenditure on CVIs exceeds an economic optimum that would maximise profit.However marginal physical products (crop yields) are positive, but small and significantly different fromzero. This suggests that, on average, farmers approximately maximise yields. These results hold across awide range of alternative economic models and two crop species. Similar results have been reported inestimations for Indian grain production and for maize in China. In practice, farmers are making decisionson input use in advance of having information on a variety of factors, including future yield, productquality and price, making it difficult to optimise input levels according to expected profit. Farmers may beconsistently optimistic, prefer to avoid risk, or deliberately seek to maximise yields. Some farmers may puton the standard recommended application irrespective of input or expected output price. It is also possiblethat advice may sometimes aim to maximise yield, influenced by an incentive to encourage greater sales.Excessive input use both reduces private profits and is a cause of environmental damage. There are thuspotential private as well as social benefits to be gained from optimising levels of input use.
KEYWORDS: marginal products; marginal profit; farm variable inputs; fertiliser; crop protection; agriculturalproductivity
1. Introduction
Crop production incurs a mix of fixed and variablecosts - such as the costs of seeds, fertilizer and pesticides- the levels of which vary in direct proportion to thelevel of production. Crop profitability critically dependson the costs of these variable inputs (Lawes and Gilbert1879; Barnard and Nix 1979; Cato, cited in Campbell2000; Van Alfen 2014), termed the Variable Costs ofProduction.
Typically, in agricultural production fixed costs accountfor about 60 per cent of total costs and variable costsabout 40 per cent (Lang 2015). While fixed costs are bydefinition not readily altered from year to year, farmershave control over the levels of variable inputs and hencethe level of variable costs. Thus decisions as to what levelof variable inputs to apply are a significant determinantof the profitability of crop production. For example, inthe 2012 harvest year, in production of (non-organic)winter wheat in England, variable costs (VC) accountedfor 41 per cent of crop economic output (CEO). Theresulting Gross Margin (GM=CEO-VC) was 59 per cent
of crop economic output. After deducting 60 per centof crop economic output for fixed costs, this results in anegative net profit in wheat production, for this yearbefore taking account of subsidies (Lang 2015).
In classic production economics, profit will be max-imised when, for each individual input, the Value of theMarginal Product (VMP) (the revenue gained by thefarmer from the sale of the output generated by the lastunit of input) is equal to the Marginal Cost (MC) (thecost of the last unit of input). Prior to this point, furtherunits of input will increase profit, beyond this point costswill exceed revenue. In order to maximise profit, thenfarmers may be expected to follow this rule (Nelson andIbach 1957; Barnard and Nix 1979; Olson 2004; IFIA2007; Defra 2010).
In practice, the position is more complex. Farmershave to decide ex ante on the levels of inputs to apply,in advance of knowing the conditions under which pro-duction will take place or the price at which their productwill be sold. In this context, farmers may simply followa standard recommendation, irrespective of the currentor expected circumstances, or they may take a risk averse
1Department of Land Economy, University of Cambridge, England, CB3 9EP.2 SRUC, Edinburgh.
*Corresponding Author: Mark A. Reader, Tel.: +44(0)1223337163, Fax: +44 1223 337130, www.landecon.cam.ac.uk, Email: [email protected].
Original submitted October 21 2016; revision received May 31 2017; accepted April 18 2018.
ISSN 2047-3710 International Journal of Agricultural Management, Volume 7 Issue 130 & 2018 International Farm Management Association and Institute of Agricultural Management
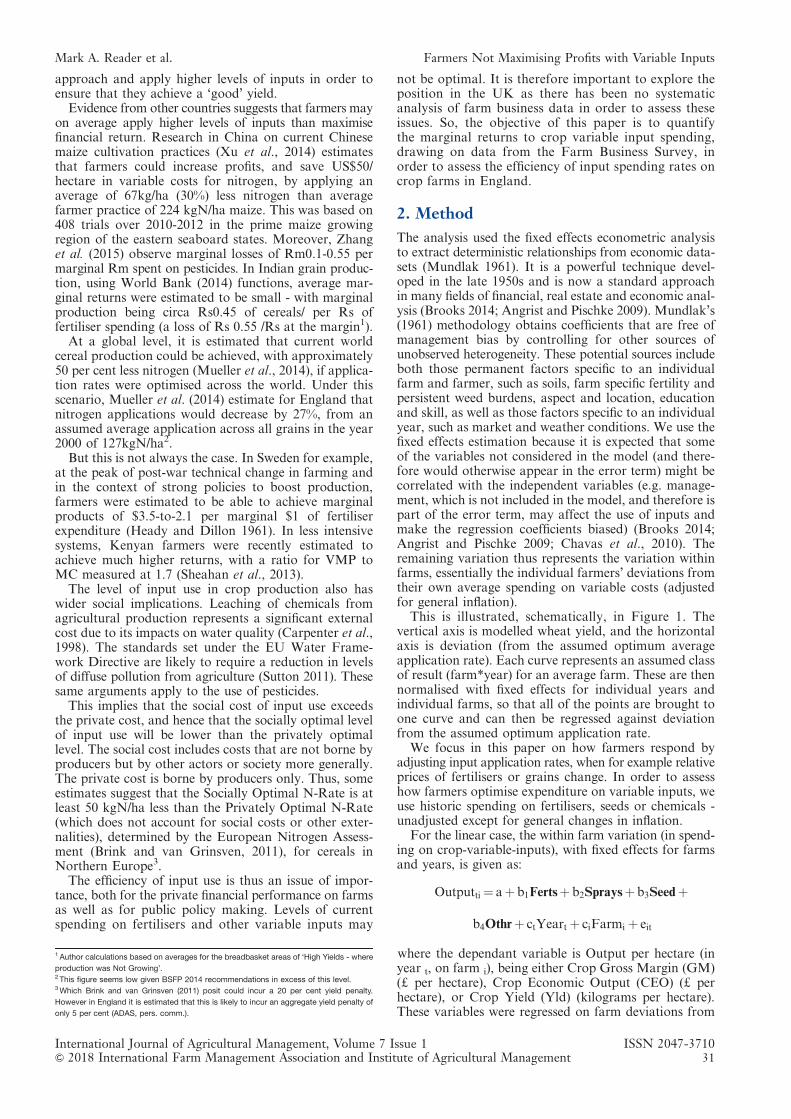
approach and apply higher levels of inputs in order toensure that they achieve a ‘good’ yield.
Evidence from other countries suggests that farmers mayon average apply higher levels of inputs than maximisefinancial return. Research in China on current Chinesemaize cultivation practices (Xu et al., 2014) estimatesthat farmers could increase profits, and save US$50/hectare in variable costs for nitrogen, by applying anaverage of 67kg/ha (30%) less nitrogen than averagefarmer practice of 224 kgN/ha maize. This was based on408 trials over 2010-2012 in the prime maize growingregion of the eastern seaboard states. Moreover, Zhanget al. (2015) observe marginal losses of Rm0.1-0.55 permarginal Rm spent on pesticides. In Indian grain produc-tion, using World Bank (2014) functions, average mar-ginal returns were estimated to be small - with marginalproduction being circa Rs0.45 of cereals/ per Rs offertiliser spending (a loss of Rs 0.55 /Rs at the margin1).
At a global level, it is estimated that current worldcereal production could be achieved, with approximately50 per cent less nitrogen (Mueller et al., 2014), if applica-tion rates were optimised across the world. Under thisscenario, Mueller et al. (2014) estimate for England thatnitrogen applications would decrease by 27%, from anassumed average application across all grains in the year2000 of 127kgN/ha2.
But this is not always the case. In Sweden for example,at the peak of post-war technical change in farming andin the context of strong policies to boost production,farmers were estimated to be able to achieve marginalproducts of $3.5-to-2.1 per marginal $1 of fertiliserexpenditure (Heady and Dillon 1961). In less intensivesystems, Kenyan farmers were recently estimated toachieve much higher returns, with a ratio for VMP toMC measured at 1.7 (Sheahan et al., 2013).
The level of input use in crop production also haswider social implications. Leaching of chemicals fromagricultural production represents a significant externalcost due to its impacts on water quality (Carpenter et al.,1998). The standards set under the EU Water Frame-work Directive are likely to require a reduction in levelsof diffuse pollution from agriculture (Sutton 2011). Thesesame arguments apply to the use of pesticides.
This implies that the social cost of input use exceedsthe private cost, and hence that the socially optimal levelof input use will be lower than the privately optimallevel. The social cost includes costs that are not borne byproducers but by other actors or society more generally.The private cost is borne by producers only. Thus, someestimates suggest that the Socially Optimal N-Rate is atleast 50 kgN/ha less than the Privately Optimal N-Rate(which does not account for social costs or other exter-nalities), determined by the European Nitrogen Assess-ment (Brink and van Grinsven, 2011), for cereals inNorthern Europe3.
The efficiency of input use is thus an issue of impor-tance, both for the private financial performance on farmsas well as for public policy making. Levels of currentspending on fertilisers and other variable inputs may
not be optimal. It is therefore important to explore theposition in the UK as there has been no systematicanalysis of farm business data in order to assess theseissues. So, the objective of this paper is to quantifythe marginal returns to crop variable input spending,drawing on data from the Farm Business Survey, inorder to assess the efficiency of input spending rates oncrop farms in England.
2. Method
The analysis used the fixed effects econometric analysisto extract deterministic relationships from economic data-sets (Mundlak 1961). It is a powerful technique devel-oped in the late 1950s and is now a standard approachin many fields of financial, real estate and economic anal-ysis (Brooks 2014; Angrist and Pischke 2009). Mundlak’s(1961) methodology obtains coefficients that are free ofmanagement bias by controlling for other sources ofunobserved heterogeneity. These potential sources includeboth those permanent factors specific to an individualfarm and farmer, such as soils, farm specific fertility andpersistent weed burdens, aspect and location, educationand skill, as well as those factors specific to an individualyear, such as market and weather conditions. We use thefixed effects estimation because it is expected that someof the variables not considered in the model (and there-fore would otherwise appear in the error term) might becorrelated with the independent variables (e.g. manage-ment, which is not included in the model, and therefore ispart of the error term, may affect the use of inputs andmake the regression coefficients biased) (Brooks 2014;Angrist and Pischke 2009; Chavas et al., 2010). Theremaining variation thus represents the variation withinfarms, essentially the individual farmers’ deviations fromtheir own average spending on variable costs (adjustedfor general inflation).
This is illustrated, schematically, in Figure 1. Thevertical axis is modelled wheat yield, and the horizontalaxis is deviation (from the assumed optimum averageapplication rate). Each curve represents an assumed classof result (farm*year) for an average farm. These are thennormalised with fixed effects for individual years andindividual farms, so that all of the points are brought toone curve and can then be regressed against deviationfrom the assumed optimum application rate.
We focus in this paper on how farmers respond byadjusting input application rates, when for example relativeprices of fertilisers or grains change. In order to assesshow farmers optimise expenditure on variable inputs, weuse historic spending on fertilisers, seeds or chemicals -unadjusted except for general changes in inflation.
For the linear case, the within farm variation (in spend-ing on crop-variable-inputs), with fixed effects for farmsand years, is given as:
Outputti ¼ aþ b1Fertsþ b2Spraysþ b3Seedþ
b4Othrþ ctYeart þ ciFarmi þ eit
where the dependant variable is Output per hectare (inyear t, on farm i), being either Crop Gross Margin (GM)(d per hectare), Crop Economic Output (CEO) (d perhectare), or Crop Yield (Yld) (kilograms per hectare).These variables were regressed on farm deviations from
1 Author calculations based on averages for the breadbasket areas of ‘High Yields - where
production was Not Growing’.2 This figure seems low given BSFP 2014 recommendations in excess of this level.3Which Brink and van Grinsven (2011) posit could incur a 20 per cent yield penalty.
However in England it is estimated that this is likely to incur an aggregate yield penalty of
only 5 per cent (ADAS, pers. comm.).
International Journal of Agricultural Management, Volume 7 Issue 1 ISSN 2047-3710& 2018 International Farm Management Association and Institute of Agricultural Management 31
Mark A. Reader et al. Farmers Not Maximising Profits with Variable Inputs
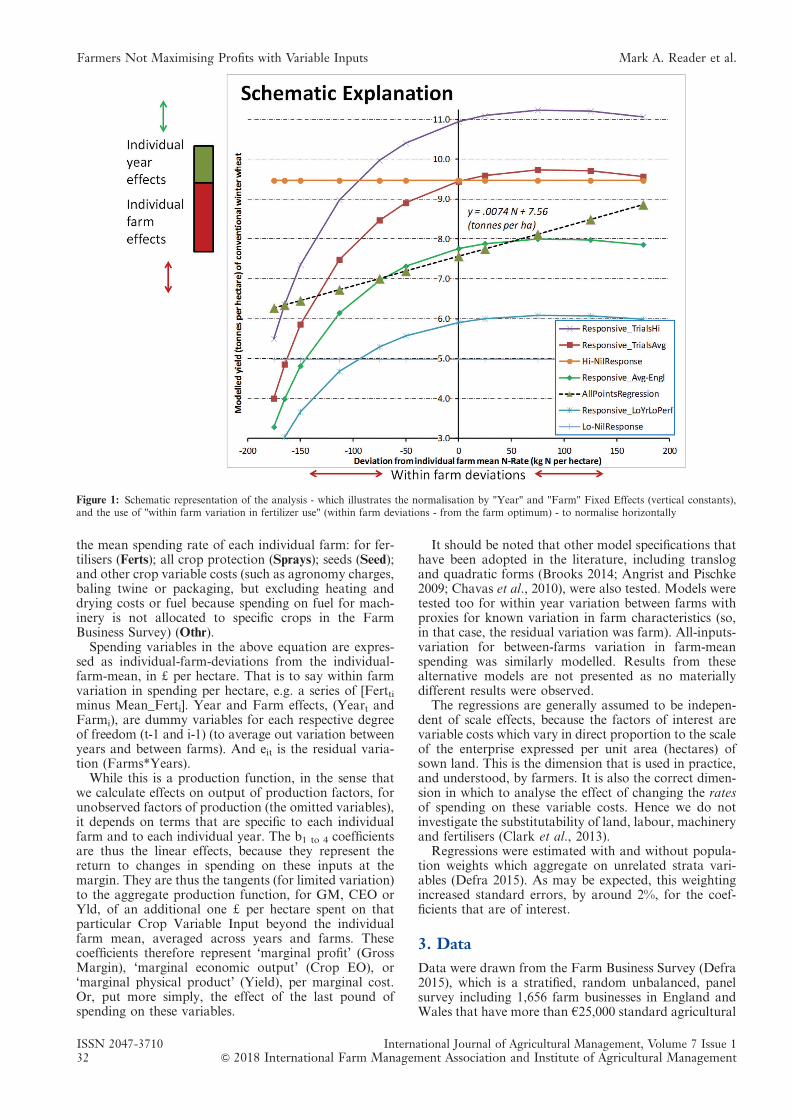
the mean spending rate of each individual farm: for fer-tilisers (Ferts); all crop protection (Sprays); seeds (Seed);and other crop variable costs (such as agronomy charges,baling twine or packaging, but excluding heating anddrying costs or fuel because spending on fuel for mach-inery is not allocated to specific crops in the FarmBusiness Survey) (Othr).
Spending variables in the above equation are expres-sed as individual-farm-deviations from the individual-farm-mean, in d per hectare. That is to say within farmvariation in spending per hectare, e.g. a series of [Ferttiminus Mean_Ferti]. Year and Farm effects, (Yeart andFarmi), are dummy variables for each respective degreeof freedom (t-1 and i-1) (to average out variation betweenyears and between farms). And eit is the residual varia-tion (Farms*Years).
While this is a production function, in the sense thatwe calculate effects on output of production factors, forunobserved factors of production (the omitted variables),it depends on terms that are specific to each individualfarm and to each individual year. The b1 to 4 coefficientsare thus the linear effects, because they represent thereturn to changes in spending on these inputs at themargin. They are thus the tangents (for limited variation)to the aggregate production function, for GM, CEO orYld, of an additional one d per hectare spent on thatparticular Crop Variable Input beyond the individualfarm mean, averaged across years and farms. Thesecoefficients therefore represent ‘marginal profit’ (GrossMargin), ‘marginal economic output’ (Crop EO), or‘marginal physical product’ (Yield), per marginal cost.Or, put more simply, the effect of the last pound ofspending on these variables.
It should be noted that other model specifications thathave been adopted in the literature, including translogand quadratic forms (Brooks 2014; Angrist and Pischke2009; Chavas et al., 2010), were also tested. Models weretested too for within year variation between farms withproxies for known variation in farm characteristics (so,in that case, the residual variation was farm). All-inputs-variation for between-farms variation in farm-meanspending was similarly modelled. Results from thesealternative models are not presented as no materiallydifferent results were observed.
The regressions are generally assumed to be indepen-dent of scale effects, because the factors of interest arevariable costs which vary in direct proportion to the scaleof the enterprise expressed per unit area (hectares) ofsown land. This is the dimension that is used in practice,and understood, by farmers. It is also the correct dimen-sion in which to analyse the effect of changing the ratesof spending on these variable costs. Hence we do notinvestigate the substitutability of land, labour, machineryand fertilisers (Clark et al., 2013).
Regressions were estimated with and without popula-tion weights which aggregate on unrelated strata vari-ables (Defra 2015). As may be expected, this weightingincreased standard errors, by around 2%, for the coef-ficients that are of interest.
3. Data
Data were drawn from the Farm Business Survey (Defra2015), which is a stratified, random unbalanced, panelsurvey including 1,656 farm businesses in England andWales that have more than h25,000 standard agricultural
Figure 1: Schematic representation of the analysis - which illustrates the normalisation by "Year" and "Farm" Fixed Effects (vertical constants),and the use of "within farm variation in fertilizer use" (within farm deviations - from the farm optimum) - to normalise horizontally
ISSN 2047-3710 International Journal of Agricultural Management, Volume 7 Issue 132 & 2018 International Farm Management Association and Institute of Agricultural Management
Farmers Not Maximising Profits with Variable Inputs Mark A. Reader et al.
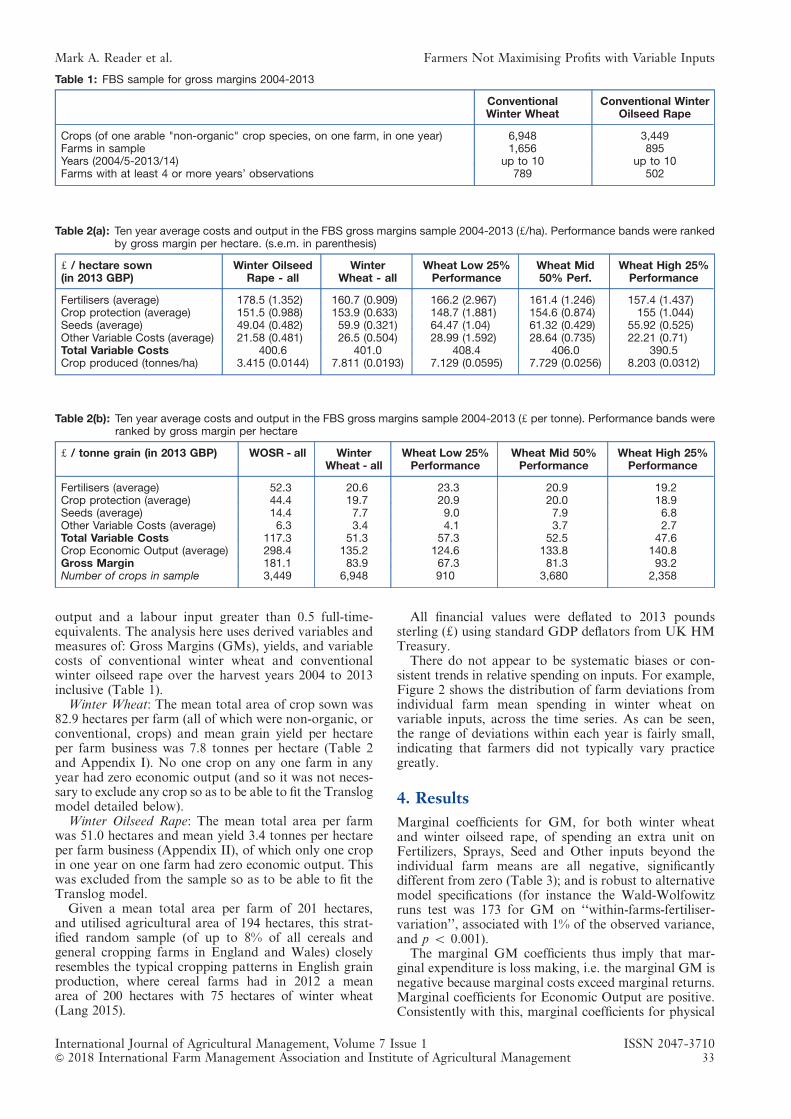
output and a labour input greater than 0.5 full-time-equivalents. The analysis here uses derived variables andmeasures of: Gross Margins (GMs), yields, and variablecosts of conventional winter wheat and conventionalwinter oilseed rape over the harvest years 2004 to 2013inclusive (Table 1).
Winter Wheat: The mean total area of crop sown was82.9 hectares per farm (all of which were non-organic, orconventional, crops) and mean grain yield per hectareper farm business was 7.8 tonnes per hectare (Table 2and Appendix I). No one crop on any one farm in anyyear had zero economic output (and so it was not neces-sary to exclude any crop so as to be able to fit the Translogmodel detailed below).
Winter Oilseed Rape: The mean total area per farmwas 51.0 hectares and mean yield 3.4 tonnes per hectareper farm business (Appendix II), of which only one cropin one year on one farm had zero economic output. Thiswas excluded from the sample so as to be able to fit theTranslog model.
Given a mean total area per farm of 201 hectares,and utilised agricultural area of 194 hectares, this strat-ified random sample (of up to 8% of all cereals andgeneral cropping farms in England and Wales) closelyresembles the typical cropping patterns in English grainproduction, where cereal farms had in 2012 a meanarea of 200 hectares with 75 hectares of winter wheat(Lang 2015).
All financial values were deflated to 2013 poundssterling (d) using standard GDP deflators from UK HMTreasury.
There do not appear to be systematic biases or con-sistent trends in relative spending on inputs. For example,Figure 2 shows the distribution of farm deviations fromindividual farm mean spending in winter wheat onvariable inputs, across the time series. As can be seen,the range of deviations within each year is fairly small,indicating that farmers did not typically vary practicegreatly.
4. Results
Marginal coefficients for GM, for both winter wheatand winter oilseed rape, of spending an extra unit onFertilizers, Sprays, Seed and Other inputs beyond theindividual farm means are all negative, significantlydifferent from zero (Table 3); and is robust to alternativemodel specifications (for instance the Wald-Wolfowitzruns test was 173 for GM on ‘‘within-farms-fertiliser-variation’’, associated with 1% of the observed variance,and p o 0.001).
The marginal GM coefficients thus imply that mar-ginal expenditure is loss making, i.e. the marginal GM isnegative because marginal costs exceed marginal returns.Marginal coefficients for Economic Output are positive.Consistently with this, marginal coefficients for physical
Table 1: FBS sample for gross margins 2004-2013
ConventionalWinter Wheat
Conventional WinterOilseed Rape
Crops (of one arable "non-organic" crop species, on one farm, in one year) 6,948 3,449Farms in sample 1,656 895Years (2004/5-2013/14) up to 10 up to 10Farms with at least 4 or more years’ observations 789 502
Table 2(a): Ten year average costs and output in the FBS gross margins sample 2004-2013 (d/ha). Performance bands were rankedby gross margin per hectare. (s.e.m. in parenthesis)
d / hectare sown(in 2013 GBP)
Winter OilseedRape - all
WinterWheat - all
Wheat Low 25%Performance
Wheat Mid50% Perf.
Wheat High 25%Performance
Fertilisers (average) 178.5 (1.352) 160.7 (0.909) 166.2 (2.967) 161.4 (1.246) 157.4 (1.437)Crop protection (average) 151.5 (0.988) 153.9 (0.633) 148.7 (1.881) 154.6 (0.874) 155 (1.044)Seeds (average) 49.04 (0.482) 59.9 (0.321) 64.47 (1.04) 61.32 (0.429) 55.92 (0.525)Other Variable Costs (average) 21.58 (0.481) 26.5 (0.504) 28.99 (1.592) 28.64 (0.735) 22.21 (0.71)Total Variable Costs 400.6 401.0 408.4 406.0 390.5Crop produced (tonnes/ha) 3.415 (0.0144) 7.811 (0.0193) 7.129 (0.0595) 7.729 (0.0256) 8.203 (0.0312)
Table 2(b): Ten year average costs and output in the FBS gross margins sample 2004-2013 (d per tonne). Performance bands wereranked by gross margin per hectare
d / tonne grain (in 2013 GBP) WOSR - all WinterWheat - all
Wheat Low 25%Performance
Wheat Mid 50%Performance
Wheat High 25%Performance
Fertilisers (average) 52.3 20.6 23.3 20.9 19.2Crop protection (average) 44.4 19.7 20.9 20.0 18.9Seeds (average) 14.4 7.7 9.0 7.9 6.8Other Variable Costs (average) 6.3 3.4 4.1 3.7 2.7Total Variable Costs 117.3 51.3 57.3 52.5 47.6Crop Economic Output (average) 298.4 135.2 124.6 133.8 140.8Gross Margin 181.1 83.9 67.3 81.3 93.2Number of crops in sample 3,449 6,948 910 3,680 2,358
International Journal of Agricultural Management, Volume 7 Issue 1 ISSN 2047-3710& 2018 International Farm Management Association and Institute of Agricultural Management 33
Mark A. Reader et al. Farmers Not Maximising Profits with Variable Inputs
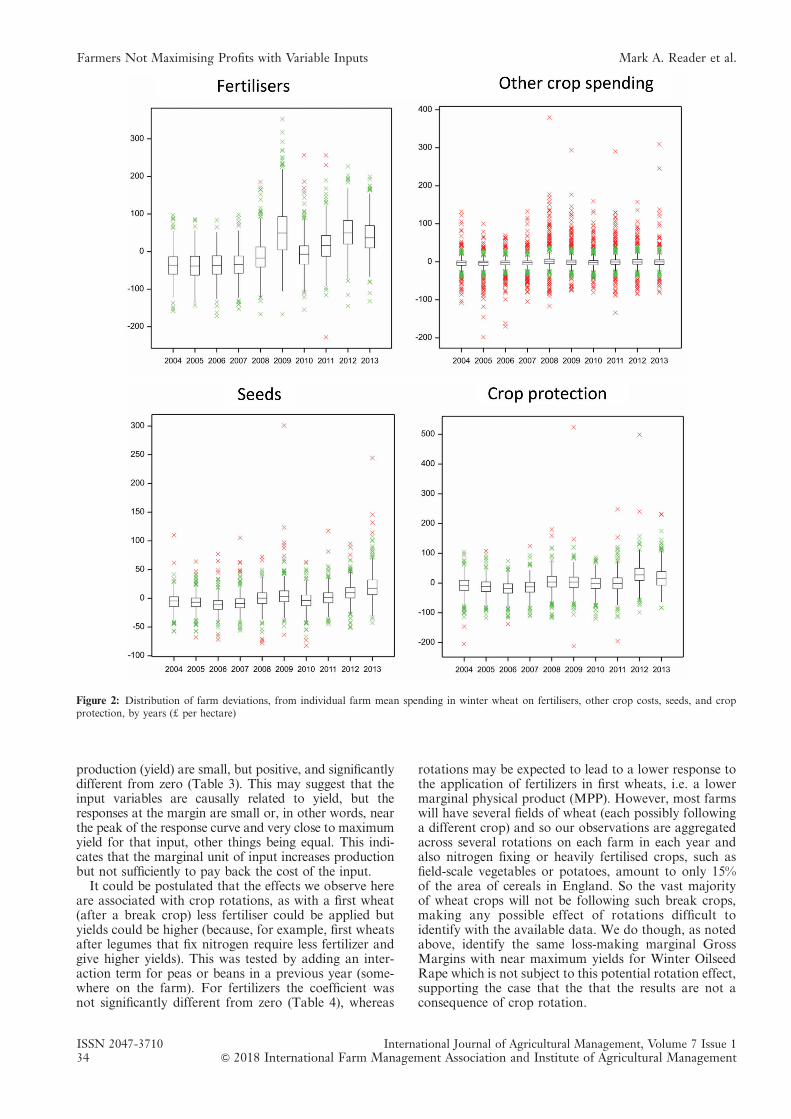
production (yield) are small, but positive, and significantlydifferent from zero (Table 3). This may suggest that theinput variables are causally related to yield, but theresponses at the margin are small or, in other words, nearthe peak of the response curve and very close to maximumyield for that input, other things being equal. This indi-cates that the marginal unit of input increases productionbut not sufficiently to pay back the cost of the input.
It could be postulated that the effects we observe hereare associated with crop rotations, as with a first wheat(after a break crop) less fertiliser could be applied butyields could be higher (because, for example, first wheatsafter legumes that fix nitrogen require less fertilizer andgive higher yields). This was tested by adding an inter-action term for peas or beans in a previous year (some-where on the farm). For fertilizers the coefficient wasnot significantly different from zero (Table 4), whereas
rotations may be expected to lead to a lower response tothe application of fertilizers in first wheats, i.e. a lowermarginal physical product (MPP). However, most farmswill have several fields of wheat (each possibly followinga different crop) and so our observations are aggregatedacross several rotations on each farm in each year andalso nitrogen fixing or heavily fertilised crops, such asfield-scale vegetables or potatoes, amount to only 15%of the area of cereals in England. So the vast majorityof wheat crops will not be following such break crops,making any possible effect of rotations difficult toidentify with the available data. We do though, as notedabove, identify the same loss-making marginal GrossMargins with near maximum yields for Winter OilseedRape which is not subject to this potential rotation effect,supporting the case that the that the results are not aconsequence of crop rotation.
Figure 2: Distribution of farm deviations, from individual farm mean spending in winter wheat on fertilisers, other crop costs, seeds, and cropprotection, by years (d per hectare)
ISSN 2047-3710 International Journal of Agricultural Management, Volume 7 Issue 134 & 2018 International Farm Management Association and Institute of Agricultural Management
Farmers Not Maximising Profits with Variable Inputs Mark A. Reader et al.
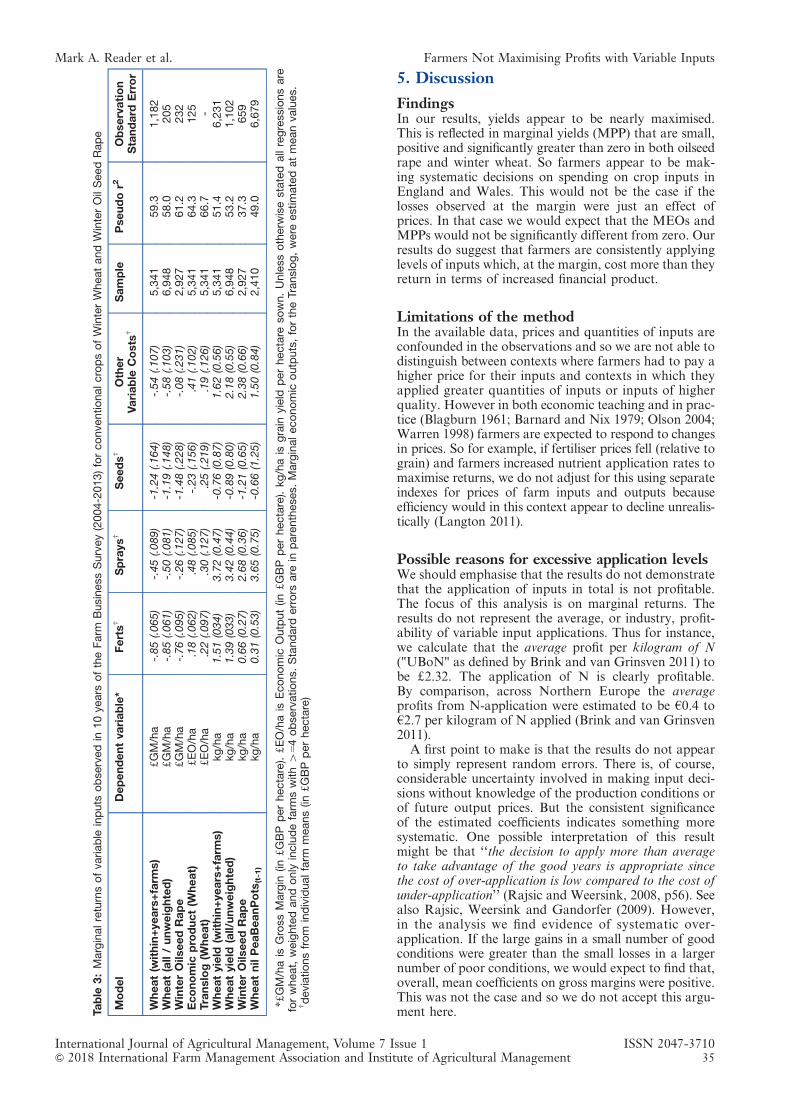
5. Discussion
FindingsIn our results, yields appear to be nearly maximised.This is reflected in marginal yields (MPP) that are small,positive and significantly greater than zero in both oilseedrape and winter wheat. So farmers appear to be mak-ing systematic decisions on spending on crop inputs inEngland and Wales. This would not be the case if thelosses observed at the margin were just an effect ofprices. In that case we would expect that the MEOs andMPPs would not be significantly different from zero. Ourresults do suggest that farmers are consistently applyinglevels of inputs which, at the margin, cost more than theyreturn in terms of increased financial product.
Limitations of the methodIn the available data, prices and quantities of inputs areconfounded in the observations and so we are not able todistinguish between contexts where farmers had to pay ahigher price for their inputs and contexts in which theyapplied greater quantities of inputs or inputs of higherquality. However in both economic teaching and in prac-tice (Blagburn 1961; Barnard and Nix 1979; Olson 2004;Warren 1998) farmers are expected to respond to changesin prices. So for example, if fertiliser prices fell (relative tograin) and farmers increased nutrient application rates tomaximise returns, we do not adjust for this using separateindexes for prices of farm inputs and outputs becauseefficiency would in this context appear to decline unrealis-tically (Langton 2011).
Possible reasons for excessive application levelsWe should emphasise that the results do not demonstratethat the application of inputs in total is not profitable.The focus of this analysis is on marginal returns. Theresults do not represent the average, or industry, profit-ability of variable input applications. Thus for instance,we calculate that the average profit per kilogram of N("UBoN" as defined by Brink and van Grinsven 2011) tobe d2.32. The application of N is clearly profitable.By comparison, across Northern Europe the averageprofits from N-application were estimated to be h0.4 toh2.7 per kilogram of N applied (Brink and van Grinsven2011).
A first point to make is that the results do not appearto simply represent random errors. There is, of course,considerable uncertainty involved in making input deci-sions without knowledge of the production conditions orof future output prices. But the consistent significanceof the estimated coefficients indicates something moresystematic. One possible interpretation of this resultmight be that ‘‘the decision to apply more than averageto take advantage of the good years is appropriate sincethe cost of over-application is low compared to the cost ofunder-application’’ (Rajsic and Weersink, 2008, p56). Seealso Rajsic, Weersink and Gandorfer (2009). However,in the analysis we find evidence of systematic over-application. If the large gains in a small number of goodconditions were greater than the small losses in a largernumber of poor conditions, we would expect to find that,overall, mean coefficients on gross margins were positive.This was not the case and so we do not accept this argu-ment here.T
able
3:Marginalreturnsofvariable
inputs
observedin
10years
oftheFarm
BusinessSurvey(2004-2013)forconventionalcropsofWinterWheatandWinterOilSeedRape
Model
Dependentvariable*
Fertsw
Spraysw
Seedsw
Other
Variable
Costs
wSample
Pseudor2
Observation
Standard
Error
Wheat(w
ithin+years+farm
s)
dGM/ha
-.85(.065)
-.45(.089)
-1.24(.164)
-.54(.107)
5,341
59.3
1,182
Wheat(all/unweighted)
dGM/ha
-.85(.061)
-.50(.081)
-1.19(.148)
-.58(.103)
6,948
58.0
205
WinterOilseedRape
dGM/ha
-.76(.095)
-.26(.127)
-1.48(.228)
-.08(.231)
2,927
61.2
232
Economic
product(W
heat)
dEO/ha
.18(.062)
.48(.085)
-.23(.156)
.41(.102)
5,341
64.3
125
Translog(W
heat)
dEO/ha
.22(.097)
.30(.127)
.25(.219)
.19(.126)
5,341
66.7
-Wheatyield
(within+years+farm
s)
kg/ha
1.51(034)
3.72(0.47)
-0.76(0.87)
1.62(0.56)
5,341
51.4
6,231
Wheatyield
(all/unweighted)
kg/ha
1.39(033)
3.42(0.44)
-0.89(0.80)
2.18(0.55)
6,948
53.2
1,102
WinterOilseedRape
kg/ha
0.66(0.27)
2.68(0.36)
-1.21(0.65)
2.38(0.66)
2,927
37.3
659
WheatnilPeaBeanPots
(t-1)
kg/ha
0.31(0.53)
3.65(0.75)
-0.66(1.25)
1.50(0.84)
2,410
49.0
6,679
*dGM/hais
GrossMargin
(indGBP
perhectare).dEO/hais
Economic
Output(in
dGBP
perhectare).kg/hais
grain
yield
perhectare
sown.Unlessotherw
isestatedallregressionsare
forwheat,weightedandonly
includefarm
swith4
=4observations.Standard
errors
are
inparentheses.Marginaleconomic
outputs,fortheTranslog,were
estimatedatmeanvalues.
w deviationsfrom
individualfarm
means(in
dGBPperhectare)
International Journal of Agricultural Management, Volume 7 Issue 1 ISSN 2047-3710& 2018 International Farm Management Association and Institute of Agricultural Management 35
Mark A. Reader et al. Farmers Not Maximising Profits with Variable Inputs
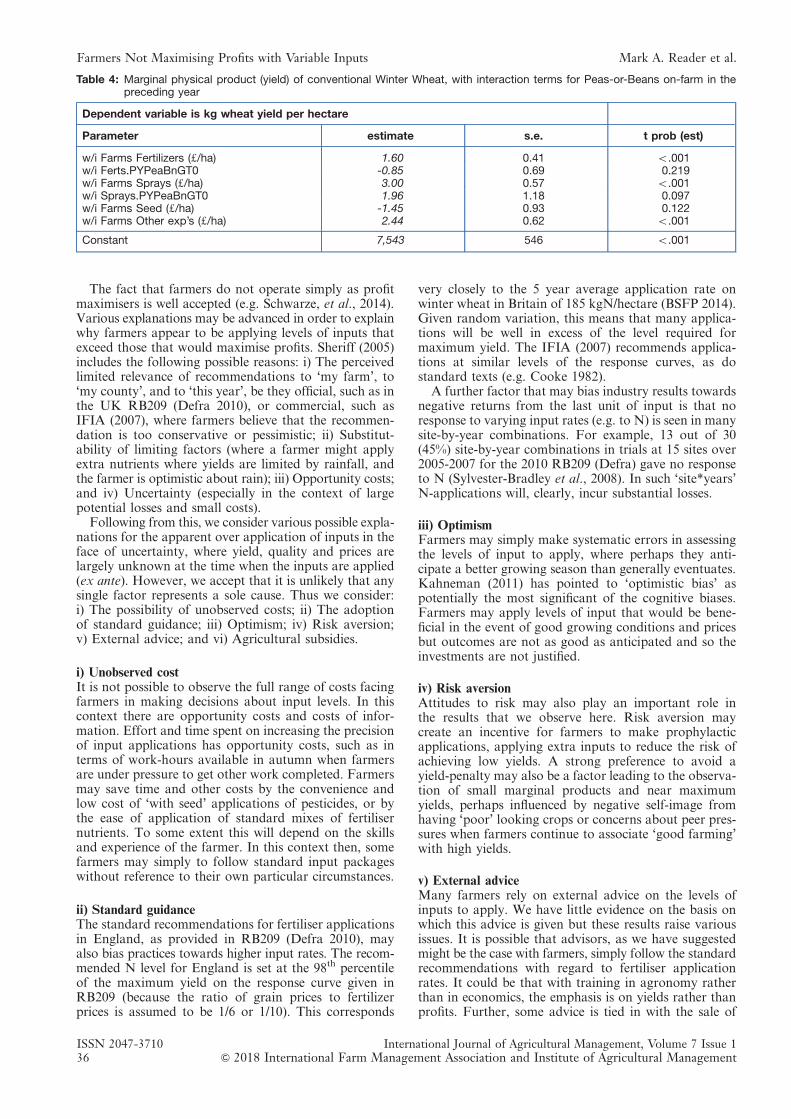
The fact that farmers do not operate simply as profitmaximisers is well accepted (e.g. Schwarze, et al., 2014).Various explanations may be advanced in order to explainwhy farmers appear to be applying levels of inputs thatexceed those that would maximise profits. Sheriff (2005)includes the following possible reasons: i) The perceivedlimited relevance of recommendations to ‘my farm’, to‘my county’, and to ‘this year’, be they official, such as inthe UK RB209 (Defra 2010), or commercial, such asIFIA (2007), where farmers believe that the recommen-dation is too conservative or pessimistic; ii) Substitut-ability of limiting factors (where a farmer might applyextra nutrients where yields are limited by rainfall, andthe farmer is optimistic about rain); iii) Opportunity costs;and iv) Uncertainty (especially in the context of largepotential losses and small costs).
Following from this, we consider various possible expla-nations for the apparent over application of inputs in theface of uncertainty, where yield, quality and prices arelargely unknown at the time when the inputs are applied(ex ante). However, we accept that it is unlikely that anysingle factor represents a sole cause. Thus we consider:i) The possibility of unobserved costs; ii) The adoptionof standard guidance; iii) Optimism; iv) Risk aversion;v) External advice; and vi) Agricultural subsidies.
i) Unobserved costIt is not possible to observe the full range of costs facingfarmers in making decisions about input levels. In thiscontext there are opportunity costs and costs of infor-mation. Effort and time spent on increasing the precisionof input applications has opportunity costs, such as interms of work-hours available in autumn when farmersare under pressure to get other work completed. Farmersmay save time and other costs by the convenience andlow cost of ‘with seed’ applications of pesticides, or bythe ease of application of standard mixes of fertilisernutrients. To some extent this will depend on the skillsand experience of the farmer. In this context then, somefarmers may simply to follow standard input packageswithout reference to their own particular circumstances.
ii) Standard guidanceThe standard recommendations for fertiliser applicationsin England, as provided in RB209 (Defra 2010), mayalso bias practices towards higher input rates. The recom-mended N level for England is set at the 98th percentileof the maximum yield on the response curve given inRB209 (because the ratio of grain prices to fertilizerprices is assumed to be 1/6 or 1/10). This corresponds
very closely to the 5 year average application rate onwinter wheat in Britain of 185 kgN/hectare (BSFP 2014).Given random variation, this means that many applica-tions will be well in excess of the level required formaximum yield. The IFIA (2007) recommends applica-tions at similar levels of the response curves, as dostandard texts (e.g. Cooke 1982).
A further factor that may bias industry results towardsnegative returns from the last unit of input is that noresponse to varying input rates (e.g. to N) is seen in manysite-by-year combinations. For example, 13 out of 30(45%) site-by-year combinations in trials at 15 sites over2005-2007 for the 2010 RB209 (Defra) gave no responseto N (Sylvester-Bradley et al., 2008). In such ‘site*years’N-applications will, clearly, incur substantial losses.
iii) OptimismFarmers may simply make systematic errors in assessingthe levels of input to apply, where perhaps they anti-cipate a better growing season than generally eventuates.Kahneman (2011) has pointed to ‘optimistic bias’ aspotentially the most significant of the cognitive biases.Farmers may apply levels of input that would be bene-ficial in the event of good growing conditions and pricesbut outcomes are not as good as anticipated and so theinvestments are not justified.
iv) Risk aversionAttitudes to risk may also play an important role inthe results that we observe here. Risk aversion maycreate an incentive for farmers to make prophylacticapplications, applying extra inputs to reduce the risk ofachieving low yields. A strong preference to avoid ayield-penalty may also be a factor leading to the observa-tion of small marginal products and near maximumyields, perhaps influenced by negative self-image fromhaving ‘poor’ looking crops or concerns about peer pres-sures when farmers continue to associate ‘good farming’with high yields.
v) External adviceMany farmers rely on external advice on the levels ofinputs to apply. We have little evidence on the basis onwhich this advice is given but these results raise variousissues. It is possible that advisors, as we have suggestedmight be the case with farmers, simply follow the standardrecommendations with regard to fertiliser applicationrates. It could be that with training in agronomy ratherthan in economics, the emphasis is on yields rather thanprofits. Further, some advice is tied in with the sale of
Table 4: Marginal physical product (yield) of conventional Winter Wheat, with interaction terms for Peas-or-Beans on-farm in thepreceding year
Dependent variable is kg wheat yield per hectare
Parameter estimate s.e. t prob (est)
w/i Farms Fertilizers (d/ha) 1.60 0.41 o.001w/i Ferts.PYPeaBnGT0 -0.85 0.69 0.219w/i Farms Sprays (d/ha) 3.00 0.57 o.001w/i Sprays.PYPeaBnGT0 1.96 1.18 0.097w/i Farms Seed (d/ha) -1.45 0.93 0.122w/i Farms Other exp’s (d/ha) 2.44 0.62 o.001
Constant 7,543 546 o.001
ISSN 2047-3710 International Journal of Agricultural Management, Volume 7 Issue 136 & 2018 International Farm Management Association and Institute of Agricultural Management
Farmers Not Maximising Profits with Variable Inputs Mark A. Reader et al.
inputs. This context raises the further possibility thatadvisors whose incomes rely on the sales of inputs mayconsciously or unconsciously have an incentive to recom-mend higher levels of input use than would otherwise bethe case. This is an issue that deserves further exploration.
vi) Agricultural subsidiesDirect payments to farmers in Europe are of the orderof h230 per hectare, each year, under the EU CommonAgricultural Policy (CAP). While input suppliers, andfor tenant farmers landlords, may capture some of thissupport (e.g. O’Neill and Hanrahan, 2016), the increasedincome may affect farmer behaviour. The guaranteedincome might reduce farmers’ degree of risk aversion,offsetting the previous effect, or potentially reduce theirmarginal utility of income. In this context a farmer mightopt for a simpler approach, applying standard levels ofinputs rather than making the extra effort to maximisenet profit. The net effect of CAP subsidies on input levelsthus seems uncertain.
Further work is needed in order to assess the relevanceand importance of these possible alternative explanationsfor the observed results.
6. Conclusions
The analysis has provided robust evidence that farmersare systematically applying rates of inputs that exceedthe rates that would maximise their profits. In contrast,their decisions appear to enable them to come close toapplying levels of inputs that maximise yields. Theimplication is that farmers could increase profits byapplying lower levels of inputs. At the same time, theenvironmental impacts of input uses indicate that therecan also be potential social benefits associated fromlower rates of input use through reduced external costsborne by other actors, such as pollution. We haveoutlined possible explanations for the observed results.Some of these could indicate that the private gains mightbe hard to achieve, such as where ‘over-applications’arise from costs that have not been identified in thisanalysis. Others could indicate ways in which profit-ability could be increased, such as if the results areexplained by an excessive degree of optimism. Furtherwork is required to sort through these various alternativeexplanations.
There is also a cautionary implication of the analysisfor the adoption of price incentives as a means of shiftingfarmer decisions closer towards a social optimum. Iffarmers are not reacting accurately to the prices that theycurrently face in the market, there can be little expecta-tion that they would react accurately to prices altered inorder to promote social or environmental objectives. Thisis not to say that environmental taxes would not pushfarm level decisions in a desired direction, rather that wecannot expect such policies to deliver ‘optimal’ outcomes.
At this stage, we have not attempted to estimate thetotal losses associated with this apparent over-applicationof inputs. Aggregate losses, to farmers and to society,should be estimated from the areas under the whole ofthe production function. It will be interesting to derivethe size of industry losses from these effects at themargin. Strip trials and ‘field mosaics’, which will provideclearer information on the production functions, arebeing actively explored by NIABTAG, AHDB Cereals
and ADAS (ADAS 2017; Sylvester-Bradley 2014). Vastand increasing quantities of data are being generatedthrough precision farming, such as the field mosaics ofTru-Harvest/ ClimateCorp/ AgriData-Deere in the USA.Researchers need to clarify and disseminate the methodsand algorithms for farm-level-optimisation using the big-data that is now available.
In conclusion, further analysis is required to under-stand better the ways in which farmers make decisionsand the incentives that they and their advisors face.There are potential private and social benefits to begained from better farm level decision making and this isan important goal for policy and research.
About the authors
Mark Reader is Research Assistant in Rural Economyat the University of Cambridge. He gained First ClassHonours in Agricultural Science at The University ofWestern Australia in 1987, and carried out researchin plant sciences in Peru, South Africa, Australia andthe UK. Having won a post in the Department ofLand Economy (Cambridge) he has, since 2003,researched and taught on farm economics and theagri-environment, publishing among others www.farmbusinesssurvey.co.uk.
Cesar Revoredo-Giha is a senior Food Marketing Econ-omist and team leader in Food Marketing Research atSRUC (Scotland). He is an applied economist specialis-ing in the industrial organization of food markets, inter-national trade and econometrics. Before joining SRUChe worked while pursuing his PhD on Agricultural andResource Economics at the University of California-Davis, followed by positions at the University of Georgiaand at the University of Cambridge.
Rachel Lawrence is Research and CommunicationsOfficer in the Rural Business Unit at the University ofCambridge. She has a First Class Honours degree inNatural Sciences from Durham University and is involvedin the collection, analysis and communication of the FarmBusiness Survey.
Ian Hodge is Professor of Rural Economy at theUniversity of Cambridge, a Fellow of Hughes Hall,and Fellow of the Royal Institution of CharteredSurveyors. He trained at the universities of Readingand Newcastle and was head of the Dept of LandEconomy from 2002 to 2012. He published in 2016‘‘The Governance of the Countryside: Property, Planningand Policy’’ (Cambridge University Press).
Ben Lang is Senior Research Associate and Manager ofthe Rural Business Unit (RBU) in the Department ofLand Economy. And a member of the (DEFRA) FarmBusiness Survey Technical Group, and of the RuralBusiness Research Management Group. He is also onthe Costings Committee of the Central Association ofAgricultural Valuers (CAAV-UK).
Acknowledgement
The authors are very grateful to two anonymous peerreviewers, who were very helpful. But we are responsiblefor any errors or omissions.
International Journal of Agricultural Management, Volume 7 Issue 1 ISSN 2047-3710& 2018 International Farm Management Association and Institute of Agricultural Management 37
Mark A. Reader et al. Farmers Not Maximising Profits with Variable Inputs
REFERENCES
ADAS. (2017). Yield Enhancement Network. www.yen.adas.co.uk [A cooperative project in the UK with many industryparticipants].
Angrist, J.D. and Pischke, J-S. (2009). Mostly HarmlessEconometrics, Princeton University Press: Princeton
Barnard, C.S., Nix and John, S. (1979). Farm Planning andControl. 2nd Edition. Cambridge University Press: Cambridge
Blagburn, C.H. (1961). Farm Planning and Management, Long-mans: London.
Brink, C. and van Grinsven H. (2011). Costs and Benefits ofNitrogen in the Environment. Ch. 22 in Sutton, M.A., et al.(eds.) ‘‘The European Nitrogen Assessment’’, CambridgeUniversity Press: Cambridge
Brooks, C. (2014). Introductory Econometrics for Finance.3rd Edition. Cambridge University Press: Cambridge
BSFP. (2014). British Survey of Fertiliser Practice. Defra: YorkCampbell, B. (2000). Review of ‘‘Cato On Farming (De Agri-
cultura): A Modern Translation with Commentary’’. TheClassical Review, 50(1):73–75
Carpenter, S.R., Caraco, N.F., Correll, D.L., Howarth, R.W.,Sharpley, A.N. and Smith, V.H. (1998). Nonpoint Pollution ofSurface Waters with Phosphorus and Nitrogen. EcologicalApplications. 8:559–568. dx.doi.org/10.1890/1051-0761
Chavas, J-P., Chambers, R.G. and Pope, R.D. (2010) Produc-tion Economics and Farm Management: A Century of Con-tributions. American Journal of Agricultural Economics, 92(2):356–375. http://dx.doi.org/10.1093/ajae/aaq004
Clark, J.S., Cechura, L. and Thibodeau, D.R. (2013). Simulta-neous Estimation of Cost and Distance Function ShareEquations. Canadian Journal of Agricultural Economics, 61:559–581
Cooke, G.W. (1982). Fertilizing for Maximum Yield. 3rd Edition.Granada: St Albans
Defra - Department for Food, Environment and Rural Affairs.(2010). Fertiliser Manual (RB209). ‘‘Fertiliser Recommenda-tions for Agricultural and Horticultural Crops (RB209)’’. TheStationery Office: London
Defra - Department for Food, Environment and Rural Affairs.(2015). Farm Business Survey. www.gov.uk/government/collections/farm-business-survey Defra: London and York
Heady, E.O. and Dillon, J.L. (1961). Agricultural ProductionFunctions. 2012 reprint. Kalyani Publishers: Ludhiana
IFIA - International Fertilizer Industry Association. (2007).Fertiliser Best Management Practices. IFA Internationalworkshop, Brussels, 7–9 March 2007.
Kahneman, D. (2011) Thinking, Fast and Slow. Penguin Books:London.
Lang, B. (2015). Crop Production in England - 2013/14. RuralBusiness Unit, University of Cambridge
Langton, S. (2011). Cereals Farms: Economic Performance andLinks with Environmental Performance. Defra AgriculturalChange and Environment Observatory Report No. 25. Defra:London.
Lawes, J.B. and Gilbert, J.H. (1879). Agricultural, Botanical,and Chemical Results of Experiments on the Mixed Herbage
of Permanent Meadow, Conducted for More than TwentyYears in Succession on the Same Land. Proceedings of theRoyal Society of London, 29:230–234. www.jstor.org/stable/113766
Mueller, N.D., West, P.C., Gerber, J.S., MacDonald, G.M.,Polasky, S. and Foley, J.A. (2014). A Tradeoff Frontier forGlobal Nitrogen Use and Cereal Production.. EnvironmentalResearch Letters, 9(5):1–8. http://dx.doi.org/10.1088/1748-9326/9/5/054002
Mundlak, Y. (1961). Empirical Production Function Free ofManagement Bias. Journal of Farm Economics, 43(1):44–56
Nelson, L.B. and Ibach, D.B. (1957). The Economics of Fertili-zers. Soil, USDA Yearbook. pp 267–276
Olson, K.D. (2004). Farm Management: Principles and Strate-gies. Iowa State Press: Ames
O’Neill, S. and Hanrahan, K. (2016) The capitalization of coup-led and decoupled CAP payments into land rental rates.Agricultural Economics, 47(3): 285–294
Rajsic, P. and Weersink, M. (2008). Do Farmers Waste Fertilizer?Agricultural Systems, 97:56–67
Rajsic, P., Weersink, A. and Gandorfer, M. (2009). Risk andNitrogen Application Levels. Canadian Journal of AgriculturalEconomics, 57:223–239
Schwarze, J., Holst, G.S. and Mu�hoff, O. (2014). Do farmersact like perfectly rational profit maximisers? Results of anextralaboratory experiment. International Journal of Agricul-tural Management, 4(1): 11–20
Sheahan, M., Black, R. and Jayne, T.S. (2013). Are Kenyanfarmers under-utilizing fertilizer? Implications for input inten-sification strategies and research. Food Policy, 41:39–52
Sheriff, G. (2005). Efficient Waste? Why Farmers Over-ApplyNutrients and the Implications for Policy Design. Review ofAgricultural Economics, 27(4):542–557
Sutton, M.A., et al. (2011). The European Nitrogen Assessment.Cambridge University Press: Cambridge
Sylvester-Bradley, R. (2014). Learning about Nitrogen Farm-by-Farm. www.croptecshow.com (accessed 9th March 2015)
Sylvester-Bradley, R., Kindred, D.R., J. Blake, J., Dyer, C.J.and Sinclair, A.H. (2008). Optimising Fertiliser Nitrogen forModern Wheat and Barley Crops. HGCA Project ReportNo. 438.
Van Alfen, N. (2014). Encyclopedia of Agriculture and Food Sys-tems. 2nd Edition. Elsevier Publishers: UK. 2,752pp
Warren, M.F. (1998). Financial management for farmers and ruralmanagers. (4th ed.). Blackwell Science: Oxford.
World Bank. (2014). Republic of India - Accelerating AgriculturalProductivity Growth. World Bank (Agriculture, Irrigation andNatural Resources Sustainable Development) SOUTH ASIA,Report No: 88093-IN: Delhi.
Xu, X., He, P., Pampolino, M.F., Johnston, A.M., Qiu, S., Zhao, S.,Chuan, L. and Zhou, W. (2014). Fertilizer Recommendationfor Maize in China based on Yield Response and AgronomicEfficiency. Field Crops Research, 157:27–34. http://dx.doi.org/10.1016/j.fcr.2013.12.013
Zhang, C., Guanming, C., Shen, J. and Hu, R. (2015). Produc-tivity Effect and Overuse of Pesticide in Crop Production inChina. Journal of Integrative Agriculture, 14(9):1903–1910.
ISSN 2047-3710 International Journal of Agricultural Management, Volume 7 Issue 138 & 2018 International Farm Management Association and Institute of Agricultural Management
Farmers Not Maximising Profits with Variable Inputs Mark A. Reader et al.
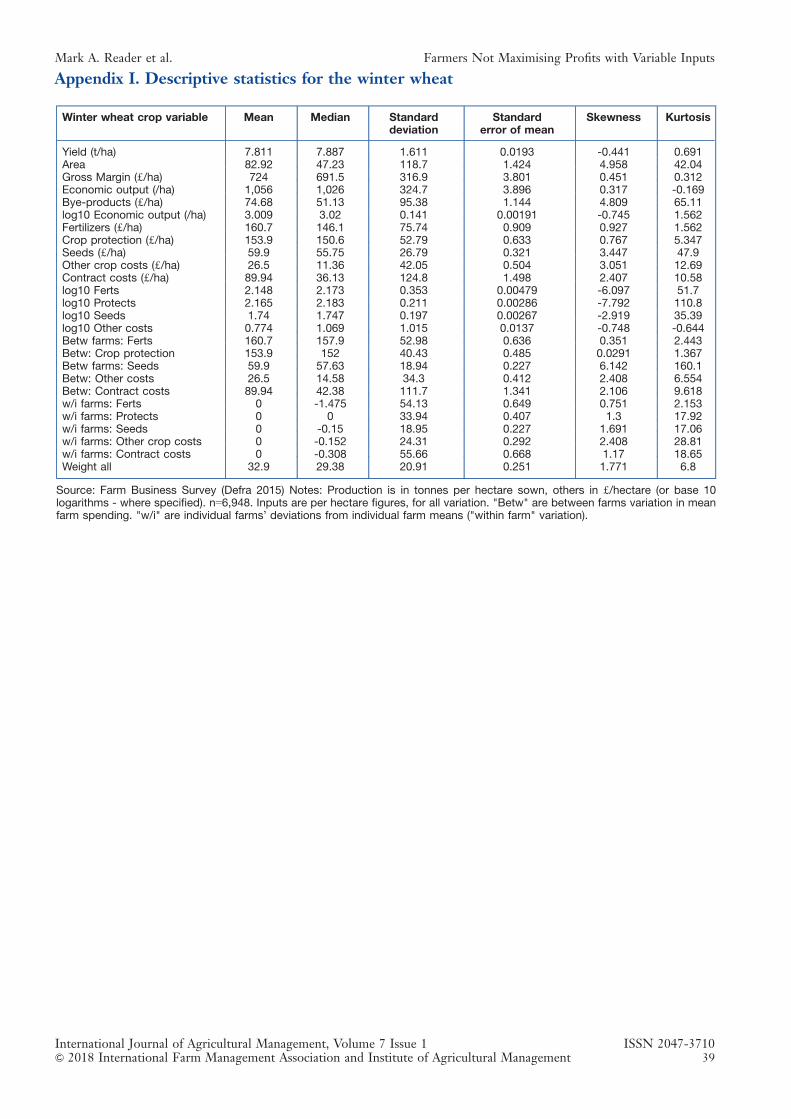
Winter wheat crop variable Mean Median Standarddeviation
Standarderror of mean
Skewness Kurtosis
Yield (t/ha) 7.811 7.887 1.611 0.0193 -0.441 0.691Area 82.92 47.23 118.7 1.424 4.958 42.04Gross Margin (d/ha) 724 691.5 316.9 3.801 0.451 0.312Economic output (/ha) 1,056 1,026 324.7 3.896 0.317 -0.169Bye-products (d/ha) 74.68 51.13 95.38 1.144 4.809 65.11log10 Economic output (/ha) 3.009 3.02 0.141 0.00191 -0.745 1.562Fertilizers (d/ha) 160.7 146.1 75.74 0.909 0.927 1.562Crop protection (d/ha) 153.9 150.6 52.79 0.633 0.767 5.347Seeds (d/ha) 59.9 55.75 26.79 0.321 3.447 47.9Other crop costs (d/ha) 26.5 11.36 42.05 0.504 3.051 12.69Contract costs (d/ha) 89.94 36.13 124.8 1.498 2.407 10.58log10 Ferts 2.148 2.173 0.353 0.00479 -6.097 51.7log10 Protects 2.165 2.183 0.211 0.00286 -7.792 110.8log10 Seeds 1.74 1.747 0.197 0.00267 -2.919 35.39log10 Other costs 0.774 1.069 1.015 0.0137 -0.748 -0.644Betw farms: Ferts 160.7 157.9 52.98 0.636 0.351 2.443Betw: Crop protection 153.9 152 40.43 0.485 0.0291 1.367Betw farms: Seeds 59.9 57.63 18.94 0.227 6.142 160.1Betw: Other costs 26.5 14.58 34.3 0.412 2.408 6.554Betw: Contract costs 89.94 42.38 111.7 1.341 2.106 9.618w/i farms: Ferts 0 -1.475 54.13 0.649 0.751 2.153w/i farms: Protects 0 0 33.94 0.407 1.3 17.92w/i farms: Seeds 0 -0.15 18.95 0.227 1.691 17.06w/i farms: Other crop costs 0 -0.152 24.31 0.292 2.408 28.81w/i farms: Contract costs 0 -0.308 55.66 0.668 1.17 18.65Weight all 32.9 29.38 20.91 0.251 1.771 6.8
Source: Farm Business Survey (Defra 2015) Notes: Production is in tonnes per hectare sown, others in d/hectare (or base 10logarithms - where specified). n=6,948. Inputs are per hectare figures, for all variation. "Betw" are between farms variation in meanfarm spending. "w/i" are individual farms’ deviations from individual farm means ("within farm" variation).
Appendix I. Descriptive statistics for the winter wheat
International Journal of Agricultural Management, Volume 7 Issue 1 ISSN 2047-3710& 2018 International Farm Management Association and Institute of Agricultural Management 39
Mark A. Reader et al. Farmers Not Maximising Profits with Variable Inputs
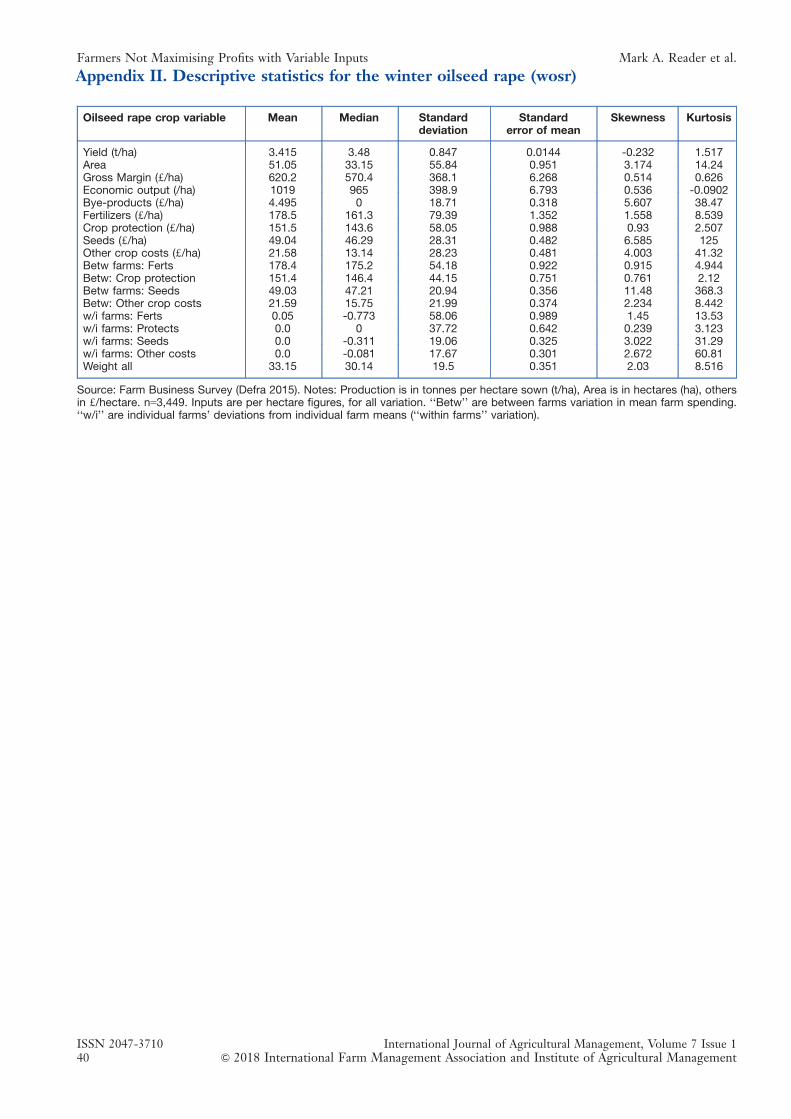
Oilseed rape crop variable Mean Median Standarddeviation
Standarderror of mean
Skewness Kurtosis
Yield (t/ha) 3.415 3.48 0.847 0.0144 -0.232 1.517Area 51.05 33.15 55.84 0.951 3.174 14.24Gross Margin (d/ha) 620.2 570.4 368.1 6.268 0.514 0.626Economic output (/ha) 1019 965 398.9 6.793 0.536 -0.0902Bye-products (d/ha) 4.495 0 18.71 0.318 5.607 38.47Fertilizers (d/ha) 178.5 161.3 79.39 1.352 1.558 8.539Crop protection (d/ha) 151.5 143.6 58.05 0.988 0.93 2.507Seeds (d/ha) 49.04 46.29 28.31 0.482 6.585 125Other crop costs (d/ha) 21.58 13.14 28.23 0.481 4.003 41.32Betw farms: Ferts 178.4 175.2 54.18 0.922 0.915 4.944Betw: Crop protection 151.4 146.4 44.15 0.751 0.761 2.12Betw farms: Seeds 49.03 47.21 20.94 0.356 11.48 368.3Betw: Other crop costs 21.59 15.75 21.99 0.374 2.234 8.442w/i farms: Ferts 0.05 -0.773 58.06 0.989 1.45 13.53w/i farms: Protects 0.0 0 37.72 0.642 0.239 3.123w/i farms: Seeds 0.0 -0.311 19.06 0.325 3.022 31.29w/i farms: Other costs 0.0 -0.081 17.67 0.301 2.672 60.81Weight all 33.15 30.14 19.5 0.351 2.03 8.516
Source: Farm Business Survey (Defra 2015). Notes: Production is in tonnes per hectare sown (t/ha), Area is in hectares (ha), othersin d/hectare. n=3,449. Inputs are per hectare figures, for all variation. ‘‘Betw’’ are between farms variation in mean farm spending.‘‘w/i’’ are individual farms’ deviations from individual farm means (‘‘within farms’’ variation).
Appendix II. Descriptive statistics for the winter oilseed rape (wosr)
ISSN 2047-3710 International Journal of Agricultural Management, Volume 7 Issue 140 & 2018 International Farm Management Association and Institute of Agricultural Management
Farmers Not Maximising Profits with Variable Inputs Mark A. Reader et al.
REFEREED ARTICLEDOI: 10.5836/ijam/2018-07-41
Envisaging future New Zealand dairy farmsystems: A scenario analysis approach
ANNE ELIZABETH DOOLEY1,n, MEKA DHANANJAY APPARAO1, IONA ANNE McCARTHY1,TERRY PARMINTER2 and NICOLA MARY SHADBOLT1
ABSTRACTDesigning future farming systems which are resilient in an increasingly volatile and uncertainenvironment can be challenging. Scenario planning to inform farm systems design can help addressthis challenge. In the first phase of this wider scenario planning project, three distinct future worldscenarios were developed. In this second phase of the scenario planning project, dairy farm systems forthese future scenarios were developed over two workshops: a farmer workshop followed by an industryworkshop where participants used mental models to conceptualise the future farm systems for eachscenario. In general, the farm systems were most diverse under the consumer-driven Consumer isKing (CK) scenario, and least diverse under the Government Dictates (GD) scenario (political chaoswith trade dictated by governments). There was considerable overlap between farm systems underthe CK and the highly regulatory Regulation Rules (RR) scenarios, but very little farm system overlapbetween the GD scenario and the other two scenarios. These future farm systems descriptionswill play an important role in informing the quantitative modelling phase of this project. Theapproaches used to identify and describe the conceptual future farm systems were considered to beeffective.
KEYWORDS: farm management; dairying; New Zealand; scenario analysis; mental models; World Café
1. Introduction
Farm businesses are complex and operate in increasinglyvolatile business and natural environments. Farm busi-ness owners’ and managers’ goals and objectives, and theresources available to the business, also evolve over timein response to changing business environments and socialnorms, and the development of new technologies andknowledge. What is certain is that farm systems will beadapted in future, and will differ from those of today.However, it is uncertain what these future farm systemswill be.
Predicting or designing future farming systems whichare resilient in an increasingly volatile and uncertain envi-ronment can be challenging. Farm systems modellingapproaches often extrapolate the future from the currentsituation, however, this approach is relatively simplisticand not necessarily realistic given the uncertainty andvolatility inherent in the industry. A scenario analysisapproach (Schoemaker, 1993; 1995), which was developedby Shell to help with their strategic planning because ofthe inherent future uncertainty (Cornelius, Van de Putteand Romani, 2005), is useful where there is considerablevolatility and uncertainty. This approach has been used in
an agricultural context both overseas (Demeter, et al.,2009; Forum for the Future, 2012; Dairy Australia, 2013)and in New Zealand (Parminter, Nolan and Bodeker,2003).
The Centre of Excellence in Farm Business Manage-ment (CEFBM) used this approach in their Dairy FarmSystems for the Future project to design and evaluatepossible future New Zealand dairy farm systems in 2025to 2030; and in the process informing farmers, industryand researchers; developing a rigorous approach forevaluating farming systems; and building capability andcollaboration in farm system design and analysis, all ofwhich are CEFBM goals.
This research had three phases. In the first phase,scenario analysis was used to develop three possible,plausible futures that dairying operated under, plus abase scenario extrapolated from the present dairy farmbusiness environment. Since most of New Zealand’sdairy products are exported, a global perspective wastaken. The three scenarios arrived at were: ‘Consumeris King’ (CK) in which a wide range of dairy productsare produced in direct response to consumer demand,‘Regulation Rules’ (RR) in which there are considerablygreater regulatory requirements on dairy farm businesses,
1Massey University, Palmerston North, New Zealand.2KapAg, Paraparaumu, New Zealand.nCorresponding author: Anne Elizabeth Dooley, Institute of Agriculture and Environment PN433, Massey University, Private Bag 11222, Palmerston North 4442, New Zealand. Phone: +64 6 9517827,
Email: [email protected].
Original submitted August 2017; revision received December 2017; accepted February 2018.
International Journal of Agricultural Management, Volume 7 Issue 1 ISSN 2047-3710& 2018 International Farm Management Association and Institute of Agricultural Management 41
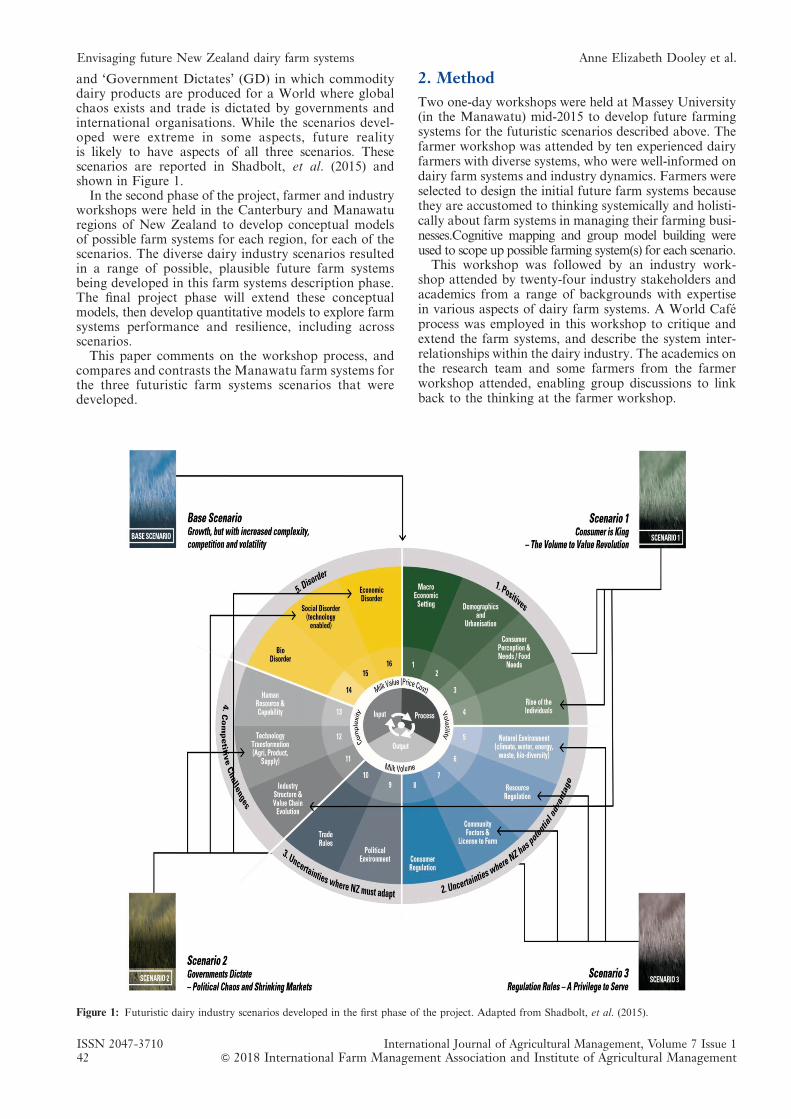
and ‘Government Dictates’ (GD) in which commoditydairy products are produced for a World where globalchaos exists and trade is dictated by governments andinternational organisations. While the scenarios devel-oped were extreme in some aspects, future realityis likely to have aspects of all three scenarios. Thesescenarios are reported in Shadbolt, et al. (2015) andshown in Figure 1.
In the second phase of the project, farmer and industryworkshops were held in the Canterbury and Manawaturegions of New Zealand to develop conceptual modelsof possible farm systems for each region, for each of thescenarios. The diverse dairy industry scenarios resultedin a range of possible, plausible future farm systemsbeing developed in this farm systems description phase.The final project phase will extend these conceptualmodels, then develop quantitative models to explore farmsystems performance and resilience, including acrossscenarios.
This paper comments on the workshop process, andcompares and contrasts the Manawatu farm systems forthe three futuristic farm systems scenarios that weredeveloped.
2. Method
Two one-day workshops were held at Massey University(in the Manawatu) mid-2015 to develop future farmingsystems for the futuristic scenarios described above. Thefarmer workshop was attended by ten experienced dairyfarmers with diverse systems, who were well-informed ondairy farm systems and industry dynamics. Farmers wereselected to design the initial future farm systems becausethey are accustomed to thinking systemically and holisti-cally about farm systems in managing their farming busi-nesses.Cognitive mapping and group model building wereused to scope up possible farming system(s) for each scenario.
This workshop was followed by an industry work-shop attended by twenty-four industry stakeholders andacademics from a range of backgrounds with expertisein various aspects of dairy farm systems. A World Caféprocess was employed in this workshop to critique andextend the farm systems, and describe the system inter-relationships within the dairy industry. The academics onthe research team and some farmers from the farmerworkshop attended, enabling group discussions to linkback to the thinking at the farmer workshop.
Figure 1: Futuristic dairy industry scenarios developed in the first phase of the project. Adapted from Shadbolt, et al. (2015).
ISSN 2047-3710 International Journal of Agricultural Management, Volume 7 Issue 142 & 2018 International Farm Management Association and Institute of Agricultural Management
Envisaging future New Zealand dairy farm systems Anne Elizabeth Dooley et al.
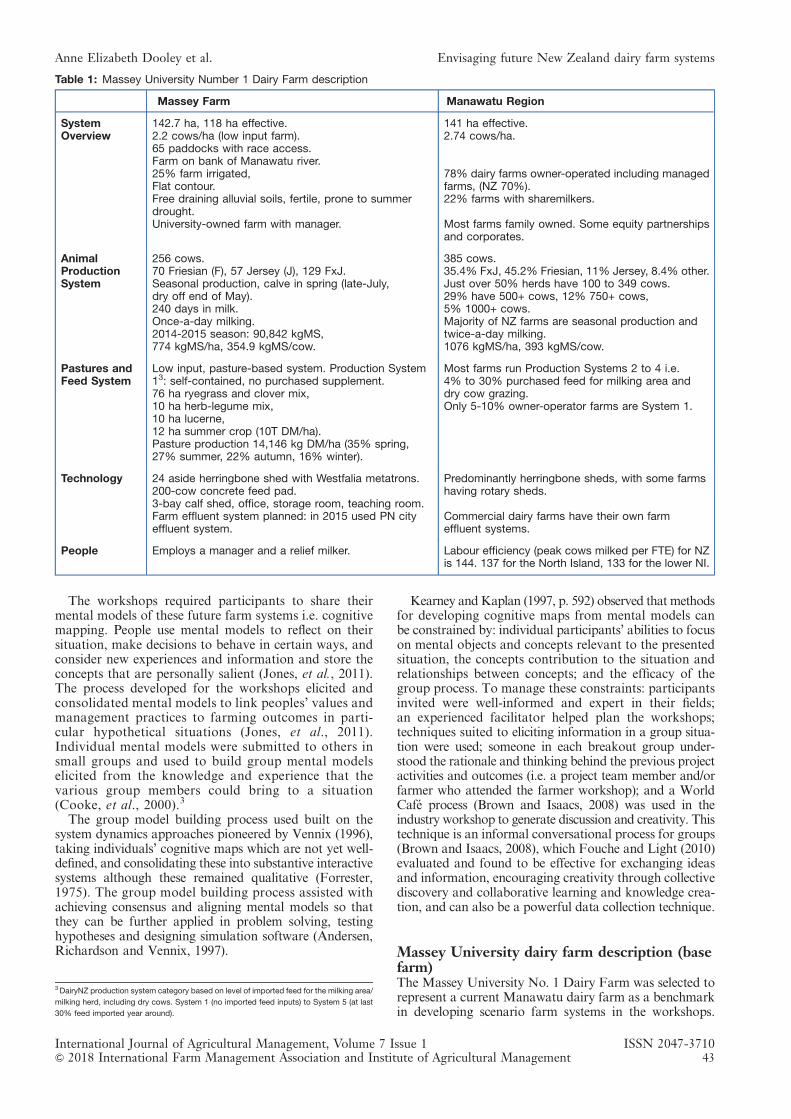
The workshops required participants to share theirmental models of these future farm systems i.e. cognitivemapping. People use mental models to reflect on theirsituation, make decisions to behave in certain ways, andconsider new experiences and information and store theconcepts that are personally salient (Jones, et al., 2011).The process developed for the workshops elicited andconsolidated mental models to link peoples’ values andmanagement practices to farming outcomes in parti-cular hypothetical situations (Jones, et al., 2011).Individual mental models were submitted to others insmall groups and used to build group mental modelselicited from the knowledge and experience that thevarious group members could bring to a situation(Cooke, et al., 2000).3
The group model building process used built on thesystem dynamics approaches pioneered by Vennix (1996),taking individuals’ cognitive maps which are not yet well-defined, and consolidating these into substantive interactivesystems although these remained qualitative (Forrester,1975). The group model building process assisted withachieving consensus and aligning mental models so thatthey can be further applied in problem solving, testinghypotheses and designing simulation software (Andersen,Richardson and Vennix, 1997).
Kearney andKaplan (1997, p. 592) observed that methodsfor developing cognitive maps from mental models canbe constrained by: individual participants’ abilities to focuson mental objects and concepts relevant to the presentedsituation, the concepts contribution to the situation andrelationships between concepts; and the efficacy of thegroup process. To manage these constraints: participantsinvited were well-informed and expert in their fields;an experienced facilitator helped plan the workshops;techniques suited to eliciting information in a group situa-tion were used; someone in each breakout group under-stood the rationale and thinking behind the previous projectactivities and outcomes (i.e. a project team member and/orfarmer who attended the farmer workshop); and a WorldCafé process (Brown and Isaacs, 2008) was used in theindustry workshop to generate discussion and creativity. Thistechnique is an informal conversational process for groups(Brown and Isaacs, 2008), which Fouche and Light (2010)evaluated and found to be effective for exchanging ideasand information, encouraging creativity through collectivediscovery and collaborative learning and knowledge crea-tion, and can also be a powerful data collection technique.
Massey University dairy farm description (basefarm)The Massey University No. 1 Dairy Farm was selected torepresent a current Manawatu dairy farm as a benchmarkin developing scenario farm systems in the workshops.
Table 1: Massey University Number 1 Dairy Farm description
Massey Farm Manawatu Region
SystemOverview
142.7 ha, 118 ha effective.2.2 cows/ha (low input farm).65 paddocks with race access.Farm on bank of Manawatu river.25% farm irrigated,Flat contour.Free draining alluvial soils, fertile, prone to summerdrought.University-owned farm with manager.
141 ha effective.2.74 cows/ha.
78% dairy farms owner-operated including managedfarms, (NZ 70%).22% farms with sharemilkers.
Most farms family owned. Some equity partnershipsand corporates.
AnimalProductionSystem
256 cows.70 Friesian (F), 57 Jersey (J), 129 FxJ.Seasonal production, calve in spring (late-July,dry off end of May).240 days in milk.Once-a-day milking.2014-2015 season: 90,842 kgMS,774 kgMS/ha, 354.9 kgMS/cow.
385 cows.35.4% FxJ, 45.2% Friesian, 11% Jersey, 8.4% other.Just over 50% herds have 100 to 349 cows.29% have 500+ cows, 12% 750+ cows,5% 1000+ cows.Majority of NZ farms are seasonal production andtwice-a-day milking.1076 kgMS/ha, 393 kgMS/cow.
Pastures andFeed System
Low input, pasture-based system. Production System13: self-contained, no purchased supplement.76 ha ryegrass and clover mix,10 ha herb-legume mix,10 ha lucerne,12 ha summer crop (10T DM/ha).Pasture production 14,146 kg DM/ha (35% spring,27% summer, 22% autumn, 16% winter).
Most farms run Production Systems 2 to 4 i.e.4% to 30% purchased feed for milking area anddry cow grazing.Only 5-10% owner-operator farms are System 1.
Technology 24 aside herringbone shed with Westfalia metatrons.200-cow concrete feed pad.3-bay calf shed, office, storage room, teaching room.Farm effluent system planned: in 2015 used PN cityeffluent system.
Predominantly herringbone sheds, with some farmshaving rotary sheds.
Commercial dairy farms have their own farmeffluent systems.
People Employs a manager and a relief milker. Labour efficiency (peak cows milked per FTE) for NZis 144. 137 for the North Island, 133 for the lower NI.
3DairyNZ production system category based on level of imported feed for the milking area/
milking herd, including dry cows. System 1 (no imported feed inputs) to System 5 (at last
30% feed imported year around).
International Journal of Agricultural Management, Volume 7 Issue 1 ISSN 2047-3710& 2018 International Farm Management Association and Institute of Agricultural Management 43
Anne Elizabeth Dooley et al. Envisaging future New Zealand dairy farm systems
This farm, which had some atypical attributes, was con-sidered as the base case or status quo farm with respect toits more generic attributes, rather than specifically. Table 1describes the base farm as at 2015, with some statistics(Massey University, 2015). Information from industrysources for dairy farms in the region at that time (2015) isalso provided to provide context (DairyNZ, 2016; LICand DairyNZ, 2015), particularly where the Massey farmis atypical. Milk price in New Zealand is highly volatile,and in 2014/2015 was low, averaging NZ$4.694 per kgmilksolids5 (MS) in 2015 values.
Farmer workshopThe Manawatu farmer workshop was attended by10 farmers who were pre-allocated to one of threegroups, sent information on a futuristic scenario, andasked to consider possible future dairy farm systems fortheir scenario. A description of the current ‘base case’ orstatus quo Massey University dairy farm was provided tofarmers (Massey University, 2015), and revisited by thegroup at the beginning of the workshop to set the scene.Farmers were then asked to work together in their groupsto consider their future scenario, and using post-it notess,to write down the ideas, objects and concepts that could bepart of an adapted farm system which could operate viablyfor their scenario in 2025 to 2030. An academic who hadworked on the scenario analysis phase was present witheach group to help facilitate, make notes, and explainbackground as required. The workshop facilitator circu-lated around the groups. These sessions were recorded.
Farmers were asked for ideas about on-farm produc-tion activities, resources, technologies and human capa-bilities that they expected would be required for theirsystem. Then each group worked together to connecttheir concepts together into a diagram showing hier-archical dependencies and inter-relationships for theirprimary system. In addition, they described how thefarm system linked to the market and wider industrycustomers. In doing so, they were asked to considerinternal consistency i.e. whether two ideas could co-existin a system. In the CK and RR groups, farmers couldnot agree on a single system, so two possible systemsdiffering in size were developed.
At the end of the day, each group presented their dairyfarm system and the wider group had the opportunity toprovide additional input. This session was video recor-ded, with the recording later transcribed. The systems foreach scenario were written up in table format by theme,and in a narrative form.
Industry workshopThe industry workshop was held a week later and atten-ded by 24 participants (4 dairy farmers from the farmerworkshop, 12 academics from different disciplines plusthe project team, and 8 dairy industry stakeholders e.g.farm consultants, DairyNZ6, Landcorp Farming7 andFonterra8 representatives). These participants each had
their own strengths: farmers and consultants had astrong understanding of farm systems; academics couldoffer possibilities particularly in their disciplines, andindustry people could identify possibilities from a broa-der perspective and identify farm and industry interac-tions required to achieve these. Participants worked ingroups of four participants from different backgrounds,with groups moving between the three scenarios. Num-bers were sufficient for 6 groups, so two rooms, each withthe three scenarios set out were used.
A description of one of each of the farmer-developedfarm systems along with some scenario background wasprovided at each of the three group tables in the room.The system description was in the format of a large table(2xA3 sheets) on flip-chart paper. A narrative of thesystem and a table summary of all three industry scenarioswere available for reference. For each system, groups wereasked to provide critical comment, and suggest improve-ments or new ideas, and supporting services, R&D andtechnology needed to make this work. Post-it notess onflip-chart-paper were used to add ideas to the farm systemwith lines drawn to link ideas. Groups contributed to thesystems for all scenarios, spending 40 minutes on eachscenario. When moving to the next system, one groupmember remained behind to link information betweengroups, sharing and explaining ideas from those whohad previously contributed to the system and answeringqueries (World Café approach).
After lunch, participants had a free hour to considerthe systems, adding individual ideas on post-it notes andsuggesting new ideas for farm systems. At the workshopconclusion, the last group working with each systemscenario presented the final dairy farm system versionwith research, information, systems and services neededto all participants, followed by group discussion addingfurther input, ideas and feedback on each dairy farmsystem. This session was recorded. Results were writtenup as previously described.
3. Results and Discussion
The farm systems are first compared with an overview ofthe key points, followed by a description of each of thethree systems. The effectiveness of the method is thendiscussed.
Farm systems comparisonA comparison of the conceptualised farm systems underthe three scenarios which integrates farmer and industryfeedback is shown in Table 2. There is considerable over-lap between the CK and RR systems with respect to thefeatures and attributes of the farm system. In contrast,the GD system features have little commonality withthe other two scenario systems. Farm systems are mostdiverse under the CK scenario, and least diverse underthe GD scenario.
There is greater diversity in the animal productionsystem in terms of cow numbers, breed type, productionvolume and other factors within the CK scenario, fol-lowed by the RR scenario. In contrast, the animal pro-duction system is largely homogenous under the GDscenario, with a lower milk price driving significantincreases in farm size, cow numbers, pasture production(based on GM technology) and milk production, and a
4 At the time of writing (December 2017), $NZ1 was approximately equivalent to d0.52,
h0.59 and $US0.70.5Milksolids (MS) = milkfat plus protein. In NZ, payment is made on these components less
a volume charge.6 DairyNZ is an industry-good dairy farming R, D and E organisation funded by NZ dairy
farmer levies.7 Landcorp Farming Ltd is NZ’s state-owned farming company and largest farmer with over
141 farms owned and leased. Over 78,000 cows are milked on Landcorp dairy farms.8 Fonterra Co-operative Group Ltd, NZ’s largest dairy company, is a farmer-owned
cooperative supplied by about 85% of NZ dairy farmers.
ISSN 2047-3710 International Journal of Agricultural Management, Volume 7 Issue 144 & 2018 International Farm Management Association and Institute of Agricultural Management
Envisaging future New Zealand dairy farm systems Anne Elizabeth Dooley et al.
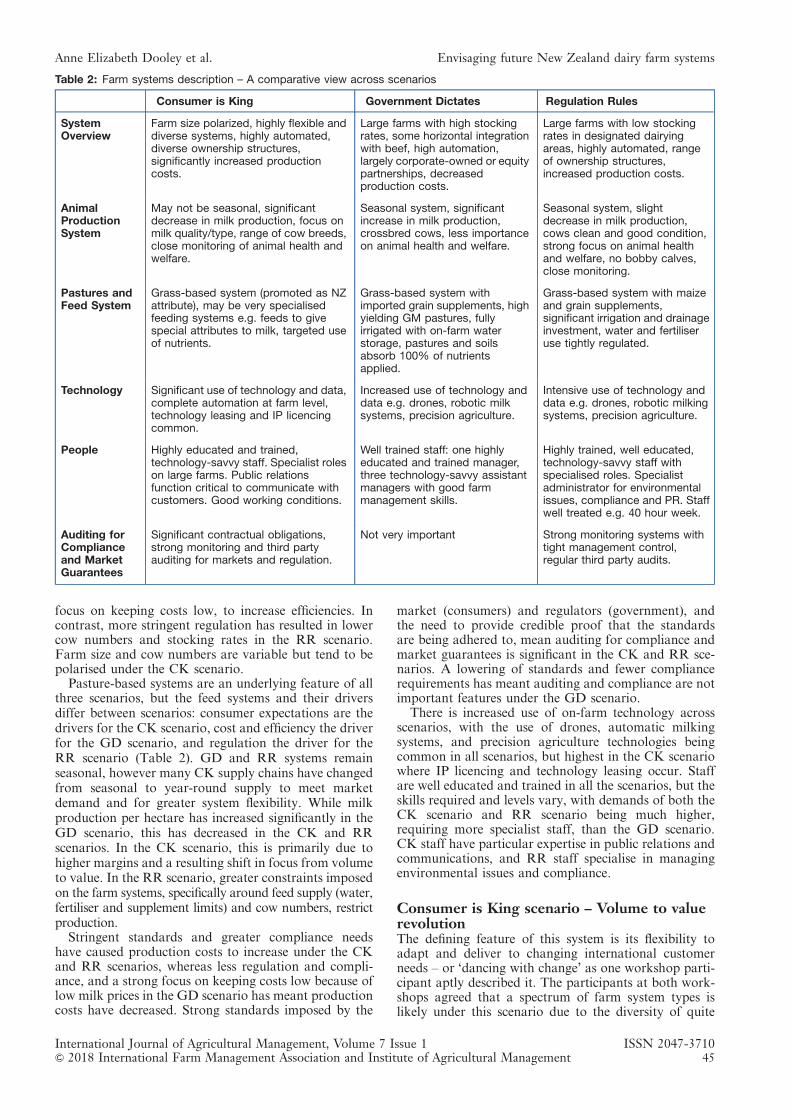
focus on keeping costs low, to increase efficiencies. Incontrast, more stringent regulation has resulted in lowercow numbers and stocking rates in the RR scenario.Farm size and cow numbers are variable but tend to bepolarised under the CK scenario.
Pasture-based systems are an underlying feature of allthree scenarios, but the feed systems and their driversdiffer between scenarios: consumer expectations are thedrivers for the CK scenario, cost and efficiency the driverfor the GD scenario, and regulation the driver for theRR scenario (Table 2). GD and RR systems remainseasonal, however many CK supply chains have changedfrom seasonal to year-round supply to meet marketdemand and for greater system flexibility. While milkproduction per hectare has increased significantly in theGD scenario, this has decreased in the CK and RRscenarios. In the CK scenario, this is primarily due tohigher margins and a resulting shift in focus from volumeto value. In the RR scenario, greater constraints imposedon the farm systems, specifically around feed supply (water,fertiliser and supplement limits) and cow numbers, restrictproduction.
Stringent standards and greater compliance needshave caused production costs to increase under the CKand RR scenarios, whereas less regulation and compli-ance, and a strong focus on keeping costs low because oflow milk prices in the GD scenario has meant productioncosts have decreased. Strong standards imposed by the
market (consumers) and regulators (government), andthe need to provide credible proof that the standardsare being adhered to, mean auditing for compliance andmarket guarantees is significant in the CK and RR sce-narios. A lowering of standards and fewer compliancerequirements has meant auditing and compliance are notimportant features under the GD scenario.
There is increased use of on-farm technology acrossscenarios, with the use of drones, automatic milkingsystems, and precision agriculture technologies beingcommon in all scenarios, but highest in the CK scenariowhere IP licencing and technology leasing occur. Staffare well educated and trained in all the scenarios, but theskills required and levels vary, with demands of both theCK scenario and RR scenario being much higher,requiring more specialist staff, than the GD scenario.CK staff have particular expertise in public relations andcommunications, and RR staff specialise in managingenvironmental issues and compliance.
Consumer is King scenario – Volume to valuerevolutionThe defining feature of this system is its flexibility toadapt and deliver to changing international customerneeds – or ‘dancing with change’ as one workshop parti-cipant aptly described it. The participants at both work-shops agreed that a spectrum of farm system types islikely under this scenario due to the diversity of quite
Table 2: Farm systems description – A comparative view across scenarios
Consumer is King Government Dictates Regulation Rules
SystemOverview
Farm size polarized, highly flexible anddiverse systems, highly automated,diverse ownership structures,significantly increased productioncosts.
Large farms with high stockingrates, some horizontal integrationwith beef, high automation,largely corporate-owned or equitypartnerships, decreasedproduction costs.
Large farms with low stockingrates in designated dairyingareas, highly automated, rangeof ownership structures,increased production costs.
AnimalProductionSystem
May not be seasonal, significantdecrease in milk production, focus onmilk quality/type, range of cow breeds,close monitoring of animal health andwelfare.
Seasonal system, significantincrease in milk production,crossbred cows, less importanceon animal health and welfare.
Seasonal system, slightdecrease in milk production,cows clean and good condition,strong focus on animal healthand welfare, no bobby calves,close monitoring.
Pastures andFeed System
Grass-based system (promoted as NZattribute), may be very specialisedfeeding systems e.g. feeds to givespecial attributes to milk, targeted useof nutrients.
Grass-based system withimported grain supplements, highyielding GM pastures, fullyirrigated with on-farm waterstorage, pastures and soilsabsorb 100% of nutrientsapplied.
Grass-based system with maizeand grain supplements,significant irrigation and drainageinvestment, water and fertiliseruse tightly regulated.
Technology Significant use of technology and data,complete automation at farm level,technology leasing and IP licencingcommon.
Increased use of technology anddata e.g. drones, robotic milksystems, precision agriculture.
Intensive use of technology anddata e.g. drones, robotic milkingsystems, precision agriculture.
People Highly educated and trained,technology-savvy staff. Specialist roleson large farms. Public relationsfunction critical to communicate withcustomers. Good working conditions.
Well trained staff: one highlyeducated and trained manager,three technology-savvy assistantmanagers with good farmmanagement skills.
Highly trained, well educated,technology-savvy staff withspecialised roles. Specialistadministrator for environmentalissues, compliance and PR. Staffwell treated e.g. 40 hour week.
Auditing forComplianceand MarketGuarantees
Significant contractual obligations,strong monitoring and third partyauditing for markets and regulation.
Not very important Strong monitoring systems withtight management control,regular third party audits.
International Journal of Agricultural Management, Volume 7 Issue 1 ISSN 2047-3710& 2018 International Farm Management Association and Institute of Agricultural Management 45
Anne Elizabeth Dooley et al. Envisaging future New Zealand dairy farm systems
specific products and attributes required to meet cus-tomer requirements. Some farms are organised as clustersproducing specific milk types for the production ofspecific milk products, hence farm systems within acluster are similar. Each cluster is operating in an inde-pendent and identity preserved value chain, delivering toa distinct high value niche market. Some farms run splitsystems, and are part of more than one value chain.There is still a market for non-specific milk in whichsurplus or non-conforming milk can be supplied, althoughreturns are lower.
Economies of size are less important than previously,since farmers have traded volume for value. Across farmtypes, productivity in terms of milksolids production percow and per hectare has decreased or remained constant,with the focus being on milk quality or milk attributes.However, MS returns per kilogram have increasedconsiderably. Average farm size (in terms of hectaresand cows) has decreased in many cases, however farmsize is variable and tends to be polarised. Small farmswith 50 to 100 cows supplying high value milk (e.g. withnutraceutical applications) co-exist with larger farms,some of which produce milk for less specialised products.Smaller farms are predominantly owner-operated, withthe owner having a high level of control over milk orproduct quality which is critical in these supply chains.Larger farms producing specialised milk rely on con-siderable automation to ensure milk quality and othercustomer specifications are met, hence economies ofscale and size are important here. These larger, highly-automated farms often have multiple owners or areequity partnerships, with highly skilled management andemployees.
Greater engagement between farmers and consumershas resulted in contracts between farmers and consumers,resulting in groups of consumers investing in farms. Ano-ther feature is other supply chain players (i.e. processors,owners of inputs or product/brand IP) share in the on-farm investment, reducing the capital investment requiredby farmers. This is frequently in the form of a ‘toll-processor’ who contracts a cluster of farmers, controlswhat goes in and out of the farming system and specifiesproduction methods to meet market requirements forspecialist products.
Often, specific product attributes desired by the con-sumer are obtained from cow-specific traits or as a resultof specific feeding and management regimes, or a com-bination thereof. This has made genetics and feedingof cows more complex, with farms operating within avalue-chain having similar cow genetics or feeding regi-mes to produce milk with specific attributes desiredby the consumer. In some situations, the unique geneticsrequired means stock replacements are bred on specialistbreeding farms and supplied as an input.
Farms are largely pasture-based, with irrigation sys-tems in place. Supplements fed, or nutrients used, canaffect milk attributes and are implemented to influencethe end product being made. Animal health and wel-fare are a top priority, and cows are in good conditionthroughout. Intense quality assurance systems to validateproduct attributes and system claims, along with robusttraceability mechanisms are the norm. With significantshrinking of barriers between consumer and farmer, thefarm is more visible and exposed. Farmers are proactiveon social media and other platforms to remain relevant
to their customers. Consequently, people on farms requiregood communication and public relations skills, in addi-tion to farming skills.
There is significant uptake and adoption of technologyat the farm level and this happens along two dimensions:technologies that improve efficiency in feed, pasture andstock management, and monitoring, information man-agement and communication technologies such as variousmeasurement and surveillance tools, including monitoringdevices such as on-farm webcams which customers canaccess. Almost all farms use drones, robotic milkingsystems, precision agriculture tools and other technologiesstill currently under development. Data is a core feature ofthe farm system and integral to decision making, as well asa tool for monitoring and validation of claims. The greaterreturns generated compensate for the increased costs e.g.labour, compliance, capital. The big risk that farms face isthe increasing fickleness of consumers affecting demandfor their specialised milk or milk products.
Government Dictates scenario – Political chaosand shrinking marketsThe most likely farm system under this scenario wasidentified as being a large farm of around 260 hectares,having around 1,200 cows and stocked at a high rateof 4.6 cows/ha. Being efficiency driven and subject to lessregulation, both cows and pastures are genetically modi-fied. Pastures produce around 25 tonnes DM/ha, andthe resulting milk yield is close to 2,200 kgMS/ha. Tosupport this high level of production, most farms arefully irrigated, and precision agriculture ensures efficientand balanced use of fertiliser and related inputs. This hascontrolled nitrogen leaching to a large extent, and crea-ted a carbon-dioxide sink as well. However, grazing ofpasture is not as viable as it was previously due to soildamage risk from high stocking rates, and some farmshave adopted a cut and carry model. As a result, crop-ping science and related technology (e.g. harvesting)have become important.
Farms operate either as independent farms, or as partof a larger collective with individual large farms beingnested within a larger structure of farms. Farms areeither family owned (some with domestic or internationalequity partners), or corporate owned. Farms are alsomore horizontally and vertically integrated than before.There has been horizontal integration into beef opera-tions, i.e. dairy farmers operating a beef operation inparallel to their dairy operation to raise surplus calvesfrom the dairy farms. Vertical integration has been down-stream with some very large farm businesses or groups oflarge farm businesses owning processing assets.
For efficiency on the large dairy farms, farm systemsoperate to a pre-defined set of rules or a ‘recipe’, withdecisions and problems being solved by staff within thescope of this recipe. Each farm is managed by no morethan 4 employees, typically consisting of 1 manager and3 assistant managers, all of whom are highly qualified,and work no more than 40 hours per week. Staff are goodproblem solvers and have diverse yet complementary skillssuch as agriculture, IT and engineering. Although traditi-onal skills such as pasture management and stockmanshipare still relevant, much of the focus is on more softanalytical work. Farm consultants are still relevant andpossess diverse skills.
ISSN 2047-3710 International Journal of Agricultural Management, Volume 7 Issue 146 & 2018 International Farm Management Association and Institute of Agricultural Management
Envisaging future New Zealand dairy farm systems Anne Elizabeth Dooley et al.
There is extensive adoption of on-farm technologies(e.g. drones, satellites, milking systems) and farms arehighly automated. Milking systems are largely robotic ona rotary platform, but small mobile automated milkingmachines are also used. Milking frequency is variable,ranging from once- to thrice-a day. Micro-managementof herds is common with cows grouped into smaller herds.The predominant breed is kiwi-cross (Friesian x Jersey),but genetic modification has also led to cows with othergenetics producing more concentrated milk resulting inlower transportation costs.
Although regulation is not a constraint, the focus onefficiency has generated positive environmental benefits.On the energy front, farmers are able to meet 100% oftheir energy needs from on-farm renewable energysystems, and sometimes produce a surplus to require-ment which is sold. Finally, the dairy industry has asingle large dairy processor which could be a co-operative, private investor-owned firm or a state-ownedenterprise.
Regulation Rules scenario – A privilege to serveUnder this scenario, significant regulatory limits havebeen set which farms need to operate within. This hasmeant most of the farms struggling to comply and remainviable have exited the industry. Regulation has ensureddairying is restricted to designated dairying areas, andthere are limits on stocking rate set at about 2 cows/ha.Due to the stringent guidelines and ‘boundaries’ to farm-ing practices set by regulation, there is less flexibility onhow the farm system can operate.
Due to the need for strong monitoring and controlmechanisms, farms are polarised into smaller farms withtighter management control, and larger farms with highautomation and/or specialist compliance staff. Typically,farm sizes are about 300 cows at the lower end and 800cows at the higher end. But in general, most farms are atthe larger end due to intensification of capital, increasingcosts and constraints from regulation.
There is a decrease is MS production per hectaredue to the constraints imposed. In parallel, there is asignificant increase in production costs, mainly due to thecosts of support services such as certification, science andtechnology R&D, third party audits, and increased costsof animal welfare, food safety and environmental com-pliance. Farm ownership is diverse, and includes familyownership, equity partnerships, overseas investment, andjoint ventures. However, the need for more capital onfarm (with equity as a source of capital) has led to manyfarms being corporate owned.
Farms are almost entirely pasture-based, but also pro-duce maize silage for ‘inside’ feeding, mainly to ensurepastures are not damaged by pugging, which is unaccep-table. To mitigate any risk of damage to the soil andregional system, limits have been imposed on the amountof cropping that can be done. Feed inputs (quantity andfeed types) are also regulated with unsustainable feedssuch as palm kernel expeller being banned.
Although most farms are irrigated and nutrient appli-cation is permitted, there are extremely stringent limitssuch as a cap on nutrients, and low specified levels ofleaching and water allocation per hectare allowed. Allwaterways are planted to avoid soil erosion and provideshade for stock. Farms also have to manage air pollution
to contain unacceptable farming odours. There is astrong impetus on animal health and welfare. Cows lookgood, are clean, maintain excellent body conditionthroughout the season and are very healthy.
There is a decrease in labour and an increase in mecha-nisation. Farm staff are highly educated, especially in ITand environmental issues. Larger farms employ a speci-alist administrator to manage technology/data, com-pliance, PR and marketing, while smaller farms havegrouped together forming a cooperative to employ acompliance manager, as well as invest in, and share,resources. It is mandatory to provide good workingconditions and a healthy work environment for all staff.Retaining staff is important because of the investment instaff training, and to preserve local communities andcontribute to the positive image of farming.
Technology use is intense with: drones to check onpasture, stock, effluent and water; robotic milking systems;and GPS and self-driven tractors. Good data is importantas well, and is used for decision making and to supportmonitoring and compliance functions. This data is storedin the cloud and can be accessed from anywhere, includingby third parties for compliance.
Farms are also using scientific techniques and on-farmR&D to inform, validate or disprove the rationale for theincreased and changing regulation. A large segment offarms under this scenario are ‘triple A’ rated. These farmshave chosen to deliver a product produced in a systemwhich goes above and beyond regulatory requirements,reflecting a ‘privilege to serve’ attitude. These farmsactively promote their ‘triple A’ status through profes-sional PR and marketing and are successful in achievingcomparatively higher returns as a result. Farms alsomaintain a high degree of connectivity, with both thecommunity (e.g. ‘adopt a cow’-programs, public accessdays) and with regulatory and political bodies (e.g. viaFederated Farmers training on political involvement).
Method EvaluationWith research, there is a trade-off between cost and timerequired, and the ability to explore the research topic.In this research, we also had a small window of opportu-nity in terms of farmer availability e.g. while cows weredried off, just prior to next season’s calving. Hence thiswork was completed with only two workshops. A thirdworkshop to develop more system specifics would havebeen beneficial.
One challenge was to develop futuristic systems for thescenarios that were robust in terms of the systems, butwere forward thinking. There can be a tendency for peopleto largely consider current and developing technologiesand capabilities and apply these in a futuristic context, asopposed to re-thinking systems envisioning future tech-nologies and capabilities. There was some tendency forthis to occur. However, technologies take time to becomecommonplace, and the timeframe was such that knowntechnologies currently under development require sometime to become commonplace so systems were not unrea-listic. External factors were largely predetermined by thescenarios.
To develop robust systems, the first workshop waswith farmers accustomed to considering farming systemsfrom a systemic viewpoint. Farmers only worked onone scenario and devoted most of the workshop to this.
International Journal of Agricultural Management, Volume 7 Issue 1 ISSN 2047-3710& 2018 International Farm Management Association and Institute of Agricultural Management 47
Anne Elizabeth Dooley et al. Envisaging future New Zealand dairy farm systems
Pre-allocating farmers to a scenario enabled informa-tion on that scenario to be provided in advance. Mostfarmers had read the material and some farmers hadobviously thought about possible systems e.g. turnedup with notes. Unfortunately some farmers were unableto attend at short notice, so one farmer worked on ascenario with no prior information. More time thananticipated was required at the beginning of the work-shop for groups to discuss their futuristic scenario, withsome challenging the scenarios, but once the scenariowas established the farmers turned their attention topossible systems.
Participants invited to both workshops were selectedon their forward thinking, knowledge of the industry,and future possibilities. Participants at the industry work-shop came from various backgrounds and were allocatedto groups to create a mix of knowledge and roles. Forboth workshops, groups were planned to minimise theinfluence of dominant personalities i.e. stronger personal-ities together. Most groups worked well due to themanageable group size and mix, however, there wereinstances where one or two group members dominatedand quieter members did not contribute to the extent theycould have. Better knowledge of individuals’ strengths andpersonalities in assigning them to groups would have beenhelpful, but is not always possible, and excluding peoplewould not be productive since they all had expertise tooffer and were willing to attend. A trained facilitator foreach group could have helped but accessing expertise andextra cost prohibit this possibility.
The short timeframe between the two workshops meantthere was no opportunity to write up the farmer workshopand get the information to participants in advance. Fewparticipants read the reading materials supplied at theworkshop. More time between workshops would haveallowed some reading material to be provided in advance,but limited the availability of some key participants. The40 minutes of time allocated for each group to discuss andadd to a scenario system at the industry workshop wasinsufficient for some groups because of the time requiredto understand the future scenarios and farmer developedfarm systems. However, providing a session for extraindividual contributions which most participated in,followed by a group session at the end allowed peopleto provide further ideas, and participate in furtherdiscussion and debate. Consequently, the impacts of asignificant number of the challenges discussed wereaddressed in this way.
Ideally, it would have been advantageous to have hadaccessible on-line sharing and wider farmer feedbackpost-workshop to further develop the systems for thoseinterested as had been planned: there was interestexpressed in this. This may have prompted further devel-opment of systems as people responded to others’ com-ments and ideas are reflected on. However, suitabletechnology for this was not readily available at the time.
4. Conclusions
It was identified that the future farm system would bemost diverse under the CK scenario and least diverseunder the GD scenario. Moreover, farm systems underthe CK and RR scenarios showed a fair degree of overlap,while there was very little overlap between the farmsystem under the GD scenario and the other two scenarios.
From a systems design perspective, this suggests that itwould be more feasible to adapt farm systems from CKto RR or vice-versa should the future business environmentchange, than it would be to adapt farm systems from GDto either of the other two scenarios.
The research demonstrated that a scenario planningprocess that involves developing team mental modelscan be a robust method to arrive at conceptual models offuture farm systems specific to predetermined future sce-narios. The conceptual farm systems models were devel-oped to assist in designing future farm systems by informingthe development of quantitative models that are needed tofurther explore farm systems performance and resilience,including across scenarios. In the next stage of this scenarioplanning project, it is expected that the commonalitybetween systems, how well systems perform acrossscenarios, and the flexibility to adapt systems betweenfuture scenarios will be explored quantitatively.
About the authors
Elizabeth Dooley is a Senior Research Officer for theCentre of Excellence in Farm Business Management atMassey University.
Dhananjay Apparao is a Researcher at Massey Universitywith interests in agribusiness and farm management.
Iona McCarthy is a Senior Lecturer in the School ofEconomics and Finance at Massey University. Ionapredominantly teaches and conducts research in areasrelating to valuation and property management withparticular interest in rural issues. She also contributes tofarm management teaching.
Terry Parminter has been working in agricultural exten-sion and community development for over 30 years.He has a PhD (2009) in Management Systems from theUniversity of Waikato and manages his own consultancybusiness operating from the Kapiti Coast in New Zealand.
Nicola Shadbolt is the Professor of Farm and AgriBusi-ness Management at Massey University.
Acknowledgements
This report was prepared for DairyNZ Incorporatedwith funding from New Zealand dairy farmers throughDairyNZ and the Ministry for Primary Industries underthe Primary Growth Partnership. We would also like tothank the following: farmers, industry people and aca-demics who attended the workshops; Guy Trafford whocontributed to research planning; Eva Schroer-merkerwho assisted with the industry workshop preparation;and paper reviewers for their suggestions. This journalpaper builds on research presented at the IFMA21conference and provided in the conference paper.
REFERENCES
Andersen, D.F., Richardson, G.P. and Vennix, J.A.M., (1997).Group model building: adding more science to the craft.System Dynamics Review, 13(2), pp. 187–201.
Brown, J. and Isaacs, D., (2008). The World Cafe: awakeningcollective intelligence and committed action. In: M. Tovey,ed. 2008. Collective intelligence: Creating a prosperous worldat peace. [e-book] Oakton, Virginia: Earth Intelligence Network.Available at: ohttp://www.oss.net/dynamaster/file_archive/
ISSN 2047-3710 International Journal of Agricultural Management, Volume 7 Issue 148 & 2018 International Farm Management Association and Institute of Agricultural Management
Envisaging future New Zealand dairy farm systems Anne Elizabeth Dooley et al.
080227/8580f18843bf5c10f17c38f7ad9fdf71/Complete_022508-C%20FINAL%201420.pdf4 [Accessed 18 November 2016].pp. 47–54.
Cooke, N.J., Salas, E., Cannon-Bowers, J.A. and Stout, R.,(2000). Measuring team knowledge. Human Factors, 42,pp. 151–173.
Cornelius, P., Van de Putte, A. and Romani, M., (2005). Threedecades of scenario planning in Shell. California Manage-ment Review, 48(1), pp. 92–109.
Dairy Australia, (2013). Horizon 2020 project - Future scenariosfor the Australian dairy industry. [pdf] Australia: DairyAustralia and the Geoffrey Gardiner Dairy Foundation. Avai-lable at: ohttps://www.dairyaustralia.com.au/about-dairy-australia/about-the-industry/recent-industry-topics/horizon-2020-future-dairy-scenarios4 [Accessed 18 November 2016].
DairyNZ, (2016). DairyNZ economic survey 2014-15. Hamilton,New Zealand: DairyNZ.
Demeter, R.M., Meuwissen, M.P.M., Oude Lansink, A.G.J.M.and Van Arendonk, J.A.M., (2009). Scenarios for a futuredairy chain in the Netherlands. NJAS - Wageningen Journalof Life Sciences, 56(4), pp. 301–323. http://dx.doi.org/10.1016/S1573-5214(09)80002-X
Forrester, J.W., (1975). Collected papers of Jay W Forrester.Portland: Productivity Press.
Forum for the Future, (2012). Dairy 2020: Scenarios for asustainable UK dairy industry. [pdf] London: Forum forthe Future. Available at: ohttp://www.forumforthefuture.org/sites/default/files/project/downloads/dairy-2020-scenarios.pdf4 [Accessed 18 November 2016].
Fouche, C. and Light, G., (2011). An invitation to dialogue:‘The World Cafe’ in social work. Qualitative Social Work,10(1), pp. 28–48. http://dx.doi.org/10.1177/1473325010376016.
Jones, N.A., Ross, H., Lynam, T., Perez, P. and Leitch, A.,(2011). Mental models: an interdisciplinary synthesis of the-ory and methods. Ecology and Society, 16(1), p. 46.
Kearney, A.R. and Kaplan, S., (1997). Toward a methodology forthe measurement of knowledge structures of ordinary peo-ple: the conceptual content cognitive map (3CM). Envir-onmental Science and Behaviour, 29(5), pp. 579–617.
LIC and DairyNZ, (2015). New Zealand dairy statistics 2014-15.Hamilton, New Zealand: Livestock Improvement Ltd andDairyNZ.
Massey University, (2015). Massey No.1 dairy farm fact sheet.[pdf] Palmerston North, New Zealand: Massey University.Available at: ohttp://www.massey.ac.nz/massey/learning/colleges/college-of-sciences/research/agriculture-environment-research/agriculture/agricultural-environmental-systems/project-dairy-1/data/data_home.cfm4 [Accessed23 June 2015].
Parminter, T., Nolan, I. and Bodeker, P., (2003). Use of scenariosin industry consultation: Dairy InSight’s Future Focus project.In: Proceedings of the Agricultural and Resource EconomicsSociety (Inc.) Ninth Annual Conference. Blenheim, NewZealand, July 2003. Lincoln, New Zealand: Agribusiness andEconomics Research Unit, Lincoln University.
Schoemaker, P.L.H., (1993). Multiple scenario development: Itsconceptual and behavioral foundation,. Strategic Manage-ment Journal, 14(3), pp. 193–213. http://dx.doi.org/10.1002/smj.4250140304
Schoemaker, P.J.H., (1995). Scenario planning: a tool for stra-tegic thinking,. Sloan Management Review, 36(2), pp. 25–40.
Shadbolt, N., Hunter, S., Apparao, D., Dooley, E., Bicknell, K.and Trafford, G., (2015). Dairy industry scenarios: Informingdairy farm systems for the future. [pdf] Palmerston North,New Zealand: Centre of Excellence in Farm Business Man-agement and KPMG. Available at: ohttp://www.onefarm.ac.nz/system/files/resource_downloads/OneFarm%20Scenarios%20Report%20_FINAL_0.pdf4 [Accessed 20 June 2017].
Vennix, J.A.M., (1996). Group model building: facilitating teamlearning using system dynamics. Chichester: John Wiley andSons.
International Journal of Agricultural Management, Volume 7 Issue 1 ISSN 2047-3710& 2018 International Farm Management Association and Institute of Agricultural Management 49
Anne Elizabeth Dooley et al. Envisaging future New Zealand dairy farm systems
REFEREED ARTICLEDOI: 10.5836/ijam/2018-07-50
How current environmental and weatherconditions affect time critical decision
making on Irish dairy farmsSTUART GREEN1,2*, FIONA CAWKWELL2 and EDWARD DWYER3
ABSTRACTIn order to understand how current environmental conditions affect farmer decision making the levels ofgrass and soil condition are examined in the decision on when to turn cattle out from winter housing tospring grazing on Irish dairy farms. Five years of satellite derived Normalised Difference Vegetation IndexMODIS data, as a proxy for grass growth data, were used along with daily rainfall data and turn out datesfrom 199 dairy farms. Using GIS analysis conditions at the time of turn out were determined at the dateand location of the event. A panel analysis shows that farmers respond to early growth but not immediately,gaining three and half days extra grazing for every week that grass growth is early. The inertia in decisionmaking around a preferred date was shown by using the previous year’s turn out date in the model. We canaccurately predict when turn out occurs with a RMSE of 10 days, compared to average on farm range of datesover the 2008-2012 period of 25 days.
KEYWORDS: NDVI; Remote Sensing; Panel Data; Herd Management; Rainfall
1. Introduction
The decision on when to release cattle from winterhousing for daytime spring grazing is a critical one onIrish dairy farms which impacts on the length of time aherd are grazing and grazing season length affects farmprofits, with research demonstrating that extending thegrazing reduces costs (Kinsella et al., 2010). In a surveyof Irish Dairy farmers in 2008 Creighton et al. (2011)found the average grazing season length was 245 daysand with respect to turn out dates fodder availability andsoil condition were the main factors in the timing of thedecision. Field trials have shown that early grazingoptions across a wide range of stocking densities improveanimal and sward performance and are to be recom-mended in dairy systems (O’Donovan et al., 2004).However the situation for specialist beef production inIreland is not as clear, with work suggesting that theeffect on profitability is only marginal and only for sometypes of beef production system (McGee et al., 2014).
In order to understand why farmers do not engage inthe management practices that would allow for a longerseason, the issues around adoption of extended grazinghave been examined by O’Shea et al. (2015) within thecontext of technical adoption theory. Survey results (207respondents) were analysed as a binary probit model of
adoption/non-adoption of extended grazing (definedrelative to regional average). Agricultural educationand off-farm employment had the most significant posi-tive relationship with participating in extended grazingand past participation in agri-environment schemes hadthe strongest negative affect on the choice of extendedgrazing.
An ordinary least squares (OLS) analysis of one year(2009) of the data set presented in this paper, by Läppleet al. (2012), found that geographic region and soil statuswere strongly associated with length of grazing seasonbut that farm size, stocking density or grazing methodhad no relationship with grazing season length.
Use of satellite data in observing grasslandHere we use daily satellite observations as proxy forgrass growth. Remote Sensing, RS, optical satellitesystems record reflected sunlight in different wavelengthranges from the earth’s surface. The reflected light isdetermined by the landcover. In the case of vegetatedsurfaces, the amounts red and near infra-red lightrecorded in each pixel of the image are strongly relatedto the amount of biomass at the earth’s surface repre-sented by the pixel. Normalised Difference VegetationIndices, NDVI, is the ratio of red and near infra red,
1Teagasc, REDP, Ashtown, Dublin 15, Ireland.2Dept. of Geography, University College Cork, Cork, Ireland.3 EurOcean, Avenida D. Carlos I, 126-2º 1249-074 Lisbon, Portugal.
*Corresponding Author: Stuart Green, Teagasc, Ashtown, Dublin 15, Ireland. Tel: +353-1-8059955. Email: [email protected].
Original submitted July 19 2017; accepted February 13 2018.
ISSN 2047-3710 International Journal of Agricultural Management, Volume 7 Issue 150 & 2018 International Farm Management Association and Institute of Agricultural Management
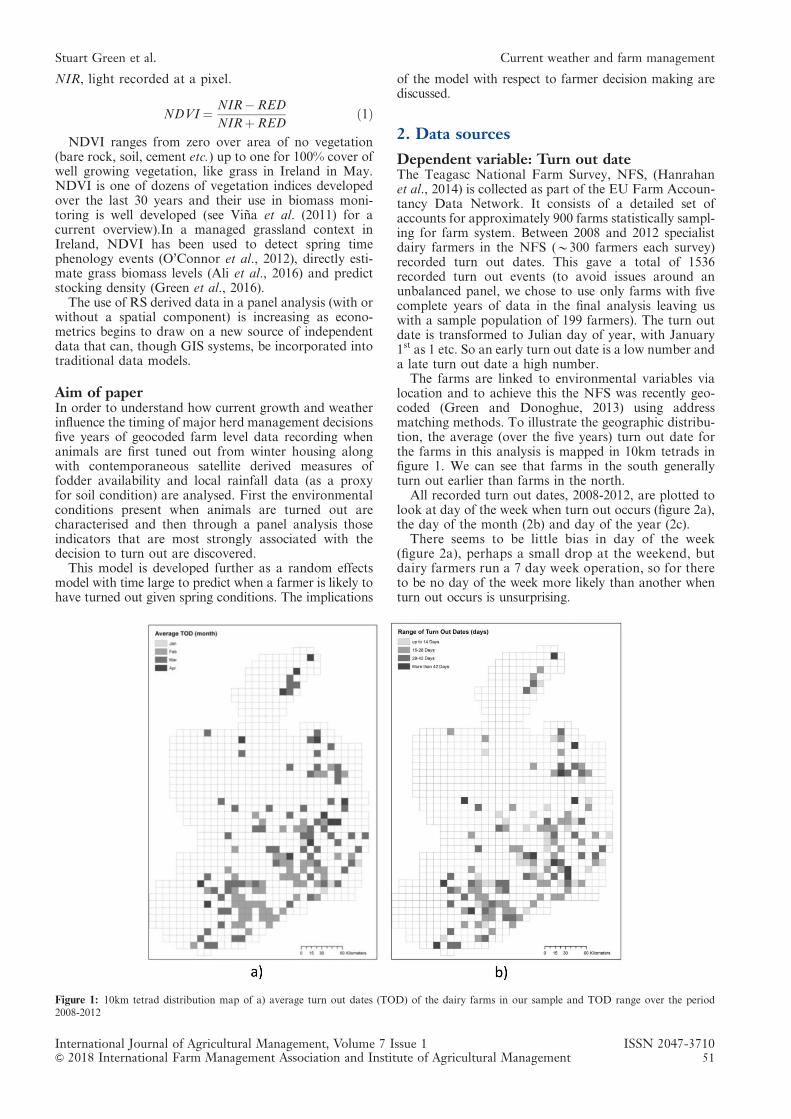
NIR, light recorded at a pixel.
NDVI ¼ NIR�REDNIRþRED
ð1ÞNDVI ranges from zero over area of no vegetation
(bare rock, soil, cement etc.) up to one for 100% cover ofwell growing vegetation, like grass in Ireland in May.NDVI is one of dozens of vegetation indices developedover the last 30 years and their use in biomass moni-toring is well developed (see Viña et al. (2011) for acurrent overview).In a managed grassland context inIreland, NDVI has been used to detect spring timephenology events (O’Connor et al., 2012), directly esti-mate grass biomass levels (Ali et al., 2016) and predictstocking density (Green et al., 2016).
The use of RS derived data in a panel analysis (with orwithout a spatial component) is increasing as econo-metrics begins to draw on a new source of independentdata that can, though GIS systems, be incorporated intotraditional data models.
Aim of paperIn order to understand how current growth and weatherinfluence the timing of major herd management decisionsfive years of geocoded farm level data recording whenanimals are first tuned out from winter housing alongwith contemporaneous satellite derived measures offodder availability and local rainfall data (as a proxyfor soil condition) are analysed. First the environmentalconditions present when animals are turned out arecharacterised and then through a panel analysis thoseindicators that are most strongly associated with thedecision to turn out are discovered.
This model is developed further as a random effectsmodel with time large to predict when a farmer is likely tohave turned out given spring conditions. The implications
of the model with respect to farmer decision making arediscussed.
2. Data sources
Dependent variable: Turn out dateThe Teagasc National Farm Survey, NFS, (Hanrahanet al., 2014) is collected as part of the EU Farm Accoun-tancy Data Network. It consists of a detailed set ofaccounts for approximately 900 farms statistically sampl-ing for farm system. Between 2008 and 2012 specialistdairy farmers in the NFS (B300 farmers each survey)recorded turn out dates. This gave a total of 1536recorded turn out events (to avoid issues around anunbalanced panel, we chose to use only farms with fivecomplete years of data in the final analysis leaving uswith a sample population of 199 farmers). The turn outdate is transformed to Julian day of year, with January1st as 1 etc. So an early turn out date is a low number anda late turn out date a high number.
The farms are linked to environmental variables vialocation and to achieve this the NFS was recently geo-coded (Green and Donoghue, 2013) using addressmatching methods. To illustrate the geographic distribu-tion, the average (over the five years) turn out date forthe farms in this analysis is mapped in 10km tetrads infigure 1. We can see that farms in the south generallyturn out earlier than farms in the north.
All recorded turn out dates, 2008-2012, are plotted tolook at day of the week when turn out occurs (figure 2a),the day of the month (2b) and day of the year (2c).
There seems to be little bias in day of the week(figure 2a), perhaps a small drop at the weekend, butdairy farmers run a 7 day week operation, so for thereto be no day of the week more likely than another whenturn out occurs is unsurprising.
Figure 1: 10km tetrad distribution map of a) average turn out dates (TOD) of the dairy farms in our sample and TOD range over the period2008-2012
International Journal of Agricultural Management, Volume 7 Issue 1 ISSN 2047-3710& 2018 International Farm Management Association and Institute of Agricultural Management 51
Stuart Green et al. Current weather and farm management
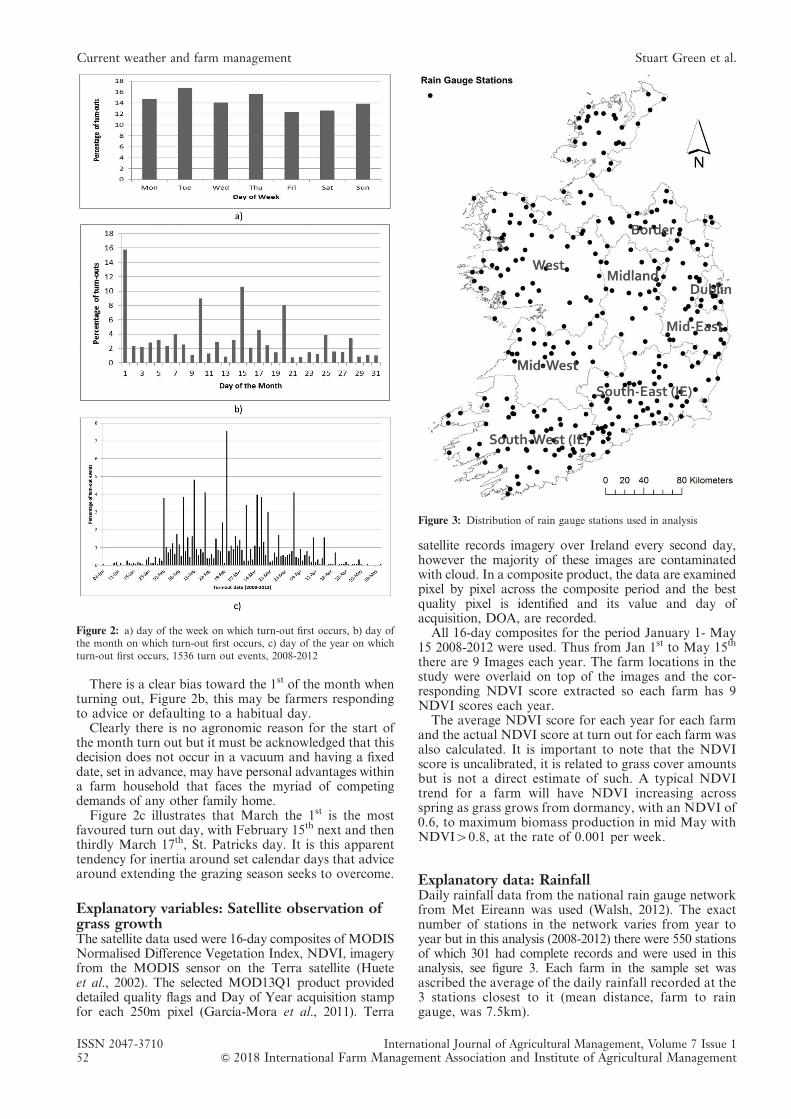
There is a clear bias toward the 1st of the month whenturning out, Figure 2b, this may be farmers respondingto advice or defaulting to a habitual day.
Clearly there is no agronomic reason for the start ofthe month turn out but it must be acknowledged that thisdecision does not occur in a vacuum and having a fixeddate, set in advance, may have personal advantages withina farm household that faces the myriad of competingdemands of any other family home.
Figure 2c illustrates that March the 1st is the mostfavoured turn out day, with February 15th next and thenthirdly March 17th, St. Patricks day. It is this apparenttendency for inertia around set calendar days that advicearound extending the grazing season seeks to overcome.
Explanatory variables: Satellite observation ofgrass growthThe satellite data used were 16-day composites of MODISNormalised Difference Vegetation Index, NDVI, imageryfrom the MODIS sensor on the Terra satellite (Hueteet al., 2002). The selected MOD13Q1 product provideddetailed quality flags and Day of Year acquisition stampfor each 250m pixel (García-Mora et al., 2011). Terra
satellite records imagery over Ireland every second day,however the majority of these images are contaminatedwith cloud. In a composite product, the data are examinedpixel by pixel across the composite period and the bestquality pixel is identified and its value and day ofacquisition, DOA, are recorded.
All 16-day composites for the period January 1- May15 2008-2012 were used. Thus from Jan 1st to May 15th
there are 9 Images each year. The farm locations in thestudy were overlaid on top of the images and the cor-responding NDVI score extracted so each farm has 9NDVI scores each year.
The average NDVI score for each year for each farmand the actual NDVI score at turn out for each farm wasalso calculated. It is important to note that the NDVIscore is uncalibrated, it is related to grass cover amountsbut is not a direct estimate of such. A typical NDVItrend for a farm will have NDVI increasing acrossspring as grass grows from dormancy, with an NDVI of0.6, to maximum biomass production in mid May withNDVI40.8, at the rate of 0.001 per week.
Explanatory data: RainfallDaily rainfall data from the national rain gauge networkfrom Met Eireann was used (Walsh, 2012). The exactnumber of stations in the network varies from year toyear but in this analysis (2008-2012) there were 550 stationsof which 301 had complete records and were used in thisanalysis, see figure 3. Each farm in the sample set wasascribed the average of the daily rainfall recorded at the3 stations closest to it (mean distance, farm to raingauge, was 7.5km).
Figure 2: a) day of the week on which turn-out first occurs, b) day ofthe month on which turn-out first occurs, c) day of the year on whichturn-out first occurs, 1536 turn out events, 2008-2012
Figure 3: Distribution of rain gauge stations used in analysis
ISSN 2047-3710 International Journal of Agricultural Management, Volume 7 Issue 152 & 2018 International Farm Management Association and Institute of Agricultural Management
Current weather and farm management Stuart Green et al.
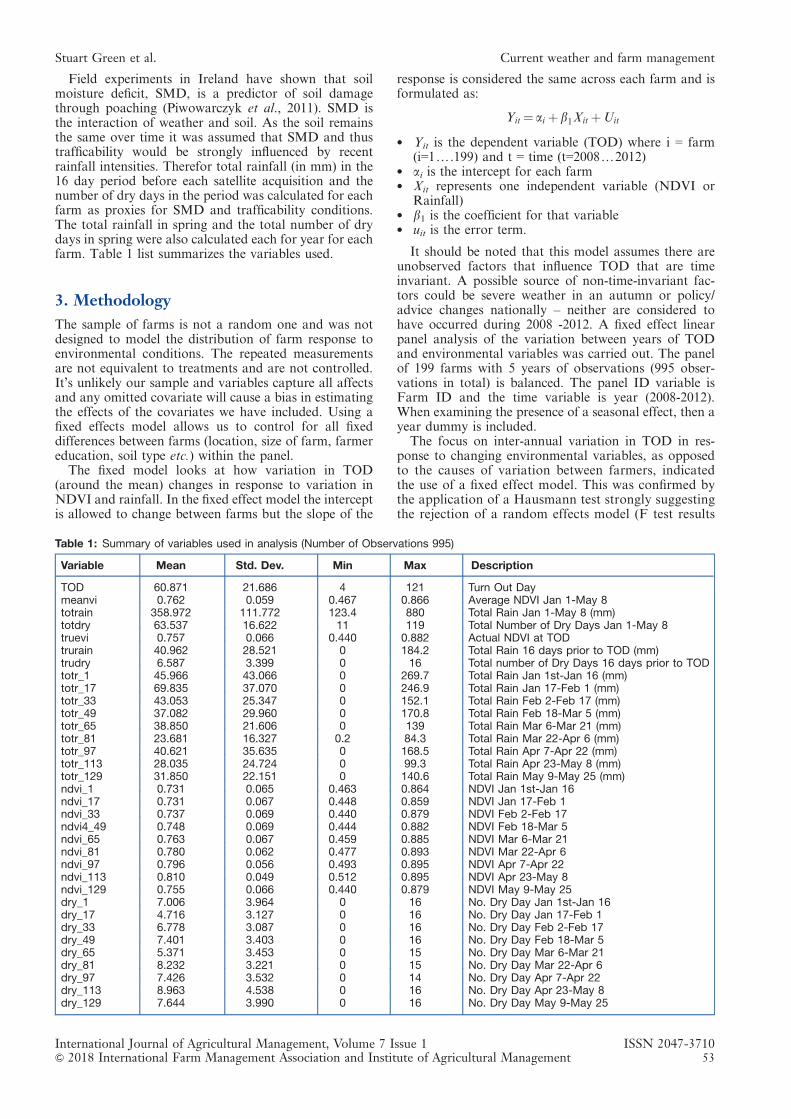
Field experiments in Ireland have shown that soilmoisture deficit, SMD, is a predictor of soil damagethrough poaching (Piwowarczyk et al., 2011). SMD isthe interaction of weather and soil. As the soil remainsthe same over time it was assumed that SMD and thustrafficability would be strongly influenced by recentrainfall intensities. Therefor total rainfall (in mm) in the16 day period before each satellite acquisition and thenumber of dry days in the period was calculated for eachfarm as proxies for SMD and trafficability conditions.The total rainfall in spring and the total number of drydays in spring were also calculated each for year for eachfarm. Table 1 list summarizes the variables used.
3. Methodology
The sample of farms is not a random one and was notdesigned to model the distribution of farm response toenvironmental conditions. The repeated measurementsare not equivalent to treatments and are not controlled.It’s unlikely our sample and variables capture all affectsand any omitted covariate will cause a bias in estimatingthe effects of the covariates we have included. Using afixed effects model allows us to control for all fixeddifferences between farms (location, size of farm, farmereducation, soil type etc.) within the panel.
The fixed model looks at how variation in TOD(around the mean) changes in response to variation inNDVI and rainfall. In the fixed effect model the interceptis allowed to change between farms but the slope of the
response is considered the same across each farm and isformulated as:
Yit ¼ ai þ b1Xit þUit
� Yit is the dependent variable (TOD) where i = farm(i=1y.199) and t = time (t=2008y2012)
� ai is the intercept for each farm� Xit represents one independent variable (NDVI or
Rainfall)� b1 is the coefficient for that variable� uit is the error term.
It should be noted that this model assumes there areunobserved factors that influence TOD that are timeinvariant. A possible source of non-time-invariant fac-tors could be severe weather in an autumn or policy/advice changes nationally – neither are considered tohave occurred during 2008 -2012. A fixed effect linearpanel analysis of the variation between years of TODand environmental variables was carried out. The panelof 199 farms with 5 years of observations (995 obser-vations in total) is balanced. The panel ID variable isFarm ID and the time variable is year (2008-2012).When examining the presence of a seasonal effect, then ayear dummy is included.
The focus on inter-annual variation in TOD in res-ponse to changing environmental variables, as opposedto the causes of variation between farmers, indicatedthe use of a fixed effect model. This was confirmed bythe application of a Hausmann test strongly suggestingthe rejection of a random effects model (F test results
Table 1: Summary of variables used in analysis (Number of Observations 995)
Variable Mean Std. Dev. Min Max Description
TOD 60.871 21.686 4 121 Turn Out Daymeanvi 0.762 0.059 0.467 0.866 Average NDVI Jan 1-May 8totrain 358.972 111.772 123.4 880 Total Rain Jan 1-May 8 (mm)totdry 63.537 16.622 11 119 Total Number of Dry Days Jan 1-May 8truevi 0.757 0.066 0.440 0.882 Actual NDVI at TODtrurain 40.962 28.521 0 184.2 Total Rain 16 days prior to TOD (mm)trudry 6.587 3.399 0 16 Total number of Dry Days 16 days prior to TODtotr_1 45.966 43.066 0 269.7 Total Rain Jan 1st-Jan 16 (mm)totr_17 69.835 37.070 0 246.9 Total Rain Jan 17-Feb 1 (mm)totr_33 43.053 25.347 0 152.1 Total Rain Feb 2-Feb 17 (mm)totr_49 37.082 29.960 0 170.8 Total Rain Feb 18-Mar 5 (mm)totr_65 38.850 21.606 0 139 Total Rain Mar 6-Mar 21 (mm)totr_81 23.681 16.327 0.2 84.3 Total Rain Mar 22-Apr 6 (mm)totr_97 40.621 35.635 0 168.5 Total Rain Apr 7-Apr 22 (mm)totr_113 28.035 24.724 0 99.3 Total Rain Apr 23-May 8 (mm)totr_129 31.850 22.151 0 140.6 Total Rain May 9-May 25 (mm)ndvi_1 0.731 0.065 0.463 0.864 NDVI Jan 1st-Jan 16ndvi_17 0.731 0.067 0.448 0.859 NDVI Jan 17-Feb 1ndvi_33 0.737 0.069 0.440 0.879 NDVI Feb 2-Feb 17ndvi4_49 0.748 0.069 0.444 0.882 NDVI Feb 18-Mar 5ndvi_65 0.763 0.067 0.459 0.885 NDVI Mar 6-Mar 21ndvi_81 0.780 0.062 0.477 0.893 NDVI Mar 22-Apr 6ndvi_97 0.796 0.056 0.493 0.895 NDVI Apr 7-Apr 22ndvi_113 0.810 0.049 0.512 0.895 NDVI Apr 23-May 8ndvi_129 0.755 0.066 0.440 0.879 NDVI May 9-May 25dry_1 7.006 3.964 0 16 No. Dry Day Jan 1st-Jan 16dry_17 4.716 3.127 0 16 No. Dry Day Jan 17-Feb 1dry_33 6.778 3.087 0 16 No. Dry Day Feb 2-Feb 17dry_49 7.401 3.403 0 16 No. Dry Day Feb 18-Mar 5dry_65 5.371 3.453 0 15 No. Dry Day Mar 6-Mar 21dry_81 8.232 3.221 0 15 No. Dry Day Mar 22-Apr 6dry_97 7.426 3.532 0 14 No. Dry Day Apr 7-Apr 22dry_113 8.963 4.538 0 16 No. Dry Day Apr 23-May 8dry_129 7.644 3.990 0 16 No. Dry Day May 9-May 25
International Journal of Agricultural Management, Volume 7 Issue 1 ISSN 2047-3710& 2018 International Farm Management Association and Institute of Agricultural Management 53
Stuart Green et al. Current weather and farm management
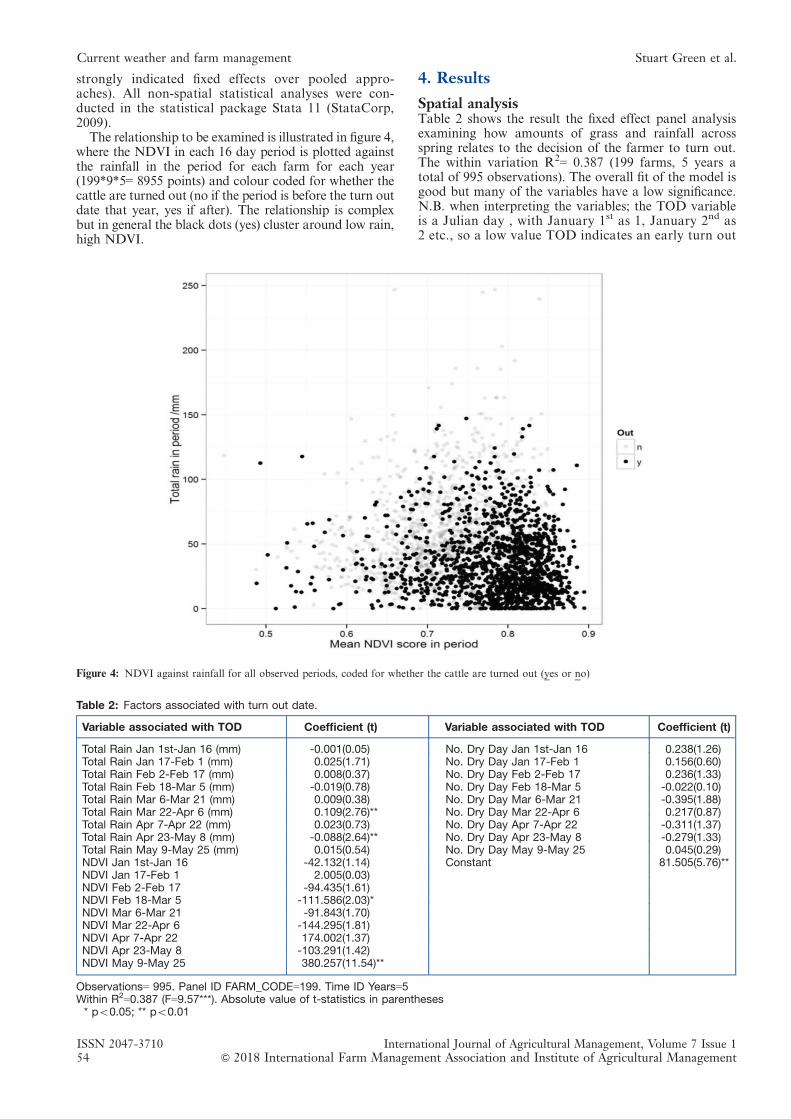
strongly indicated fixed effects over pooled appro-aches). All non-spatial statistical analyses were con-ducted in the statistical package Stata 11 (StataCorp,2009).
The relationship to be examined is illustrated in figure 4,where the NDVI in each 16 day period is plotted againstthe rainfall in the period for each farm for each year(199*9*5= 8955 points) and colour coded for whether thecattle are turned out (no if the period is before the turn outdate that year, yes if after). The relationship is complexbut in general the black dots (yes) cluster around low rain,high NDVI.
4. Results
Spatial analysisTable 2 shows the result the fixed effect panel analysisexamining how amounts of grass and rainfall acrossspring relates to the decision of the farmer to turn out.The within variation R2= 0.387 (199 farms, 5 years atotal of 995 observations). The overall fit of the model isgood but many of the variables have a low significance.N.B. when interpreting the variables; the TOD variableis a Julian day , with January 1st as 1, January 2nd as2 etc., so a low value TOD indicates an early turn out
Figure 4: NDVI against rainfall for all observed periods, coded for whether the cattle are turned out (yes or no)
Table 2: Factors associated with turn out date.
Variable associated with TOD Coefficient (t) Variable associated with TOD Coefficient (t)
Total Rain Jan 1st-Jan 16 (mm) -0.001(0.05) No. Dry Day Jan 1st-Jan 16 0.238(1.26)Total Rain Jan 17-Feb 1 (mm) 0.025(1.71) No. Dry Day Jan 17-Feb 1 0.156(0.60)Total Rain Feb 2-Feb 17 (mm) 0.008(0.37) No. Dry Day Feb 2-Feb 17 0.236(1.33)Total Rain Feb 18-Mar 5 (mm) -0.019(0.78) No. Dry Day Feb 18-Mar 5 -0.022(0.10)Total Rain Mar 6-Mar 21 (mm) 0.009(0.38) No. Dry Day Mar 6-Mar 21 -0.395(1.88)Total Rain Mar 22-Apr 6 (mm) 0.109(2.76)** No. Dry Day Mar 22-Apr 6 0.217(0.87)Total Rain Apr 7-Apr 22 (mm) 0.023(0.73) No. Dry Day Apr 7-Apr 22 -0.311(1.37)Total Rain Apr 23-May 8 (mm) -0.088(2.64)** No. Dry Day Apr 23-May 8 -0.279(1.33)Total Rain May 9-May 25 (mm) 0.015(0.54) No. Dry Day May 9-May 25 0.045(0.29)NDVI Jan 1st-Jan 16 -42.132(1.14) Constant 81.505(5.76)**NDVI Jan 17-Feb 1 2.005(0.03)NDVI Feb 2-Feb 17 -94.435(1.61)NDVI Feb 18-Mar 5 -111.586(2.03)*NDVI Mar 6-Mar 21 -91.843(1.70)NDVI Mar 22-Apr 6 -144.295(1.81)NDVI Apr 7-Apr 22 174.002(1.37)NDVI Apr 23-May 8 -103.291(1.42)NDVI May 9-May 25 380.257(11.54)**
Observations= 995. Panel ID FARM_CODE=199. Time ID Years=5Within R2=0.387 (F=9.57***). Absolute value of t-statistics in parentheses* po0.05; ** po0.01
ISSN 2047-3710 International Journal of Agricultural Management, Volume 7 Issue 154 & 2018 International Farm Management Association and Institute of Agricultural Management
Current weather and farm management Stuart Green et al.
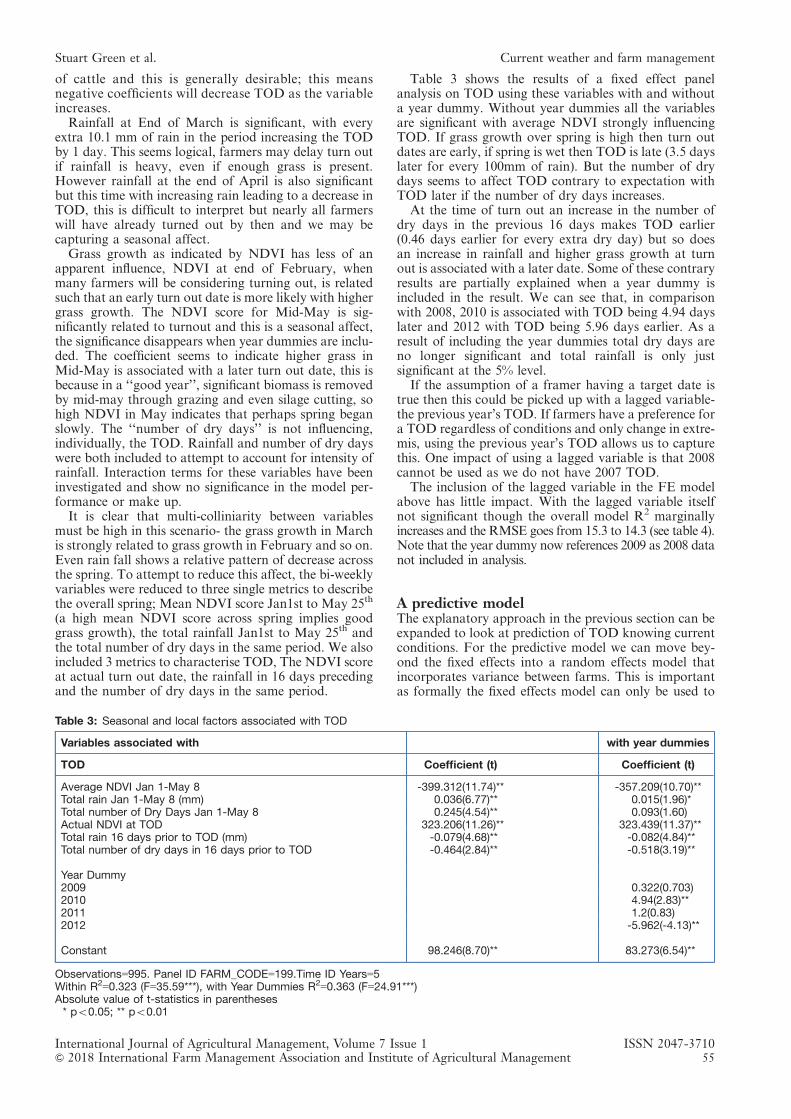
of cattle and this is generally desirable; this meansnegative coefficients will decrease TOD as the variableincreases.
Rainfall at End of March is significant, with everyextra 10.1 mm of rain in the period increasing the TODby 1 day. This seems logical, farmers may delay turn outif rainfall is heavy, even if enough grass is present.However rainfall at the end of April is also significantbut this time with increasing rain leading to a decrease inTOD, this is difficult to interpret but nearly all farmerswill have already turned out by then and we may becapturing a seasonal affect.
Grass growth as indicated by NDVI has less of anapparent influence, NDVI at end of February, whenmany farmers will be considering turning out, is relatedsuch that an early turn out date is more likely with highergrass growth. The NDVI score for Mid-May is sig-nificantly related to turnout and this is a seasonal affect,the significance disappears when year dummies are inclu-ded. The coefficient seems to indicate higher grass inMid-May is associated with a later turn out date, this isbecause in a ‘‘good year’’, significant biomass is removedby mid-may through grazing and even silage cutting, sohigh NDVI in May indicates that perhaps spring beganslowly. The ‘‘number of dry days’’ is not influencing,individually, the TOD. Rainfall and number of dry dayswere both included to attempt to account for intensity ofrainfall. Interaction terms for these variables have beeninvestigated and show no significance in the model per-formance or make up.
It is clear that multi-colliniarity between variablesmust be high in this scenario- the grass growth in Marchis strongly related to grass growth in February and so on.Even rain fall shows a relative pattern of decrease acrossthe spring. To attempt to reduce this affect, the bi-weeklyvariables were reduced to three single metrics to describethe overall spring; Mean NDVI score Jan1st to May 25th
(a high mean NDVI score across spring implies goodgrass growth), the total rainfall Jan1st to May 25th andthe total number of dry days in the same period. We alsoincluded 3 metrics to characterise TOD, The NDVI scoreat actual turn out date, the rainfall in 16 days precedingand the number of dry days in the same period.
Table 3 shows the results of a fixed effect panelanalysis on TOD using these variables with and withouta year dummy. Without year dummies all the variablesare significant with average NDVI strongly influencingTOD. If grass growth over spring is high then turn outdates are early, if spring is wet then TOD is late (3.5 dayslater for every 100mm of rain). But the number of drydays seems to affect TOD contrary to expectation withTOD later if the number of dry days increases.
At the time of turn out an increase in the number ofdry days in the previous 16 days makes TOD earlier(0.46 days earlier for every extra dry day) but so doesan increase in rainfall and higher grass growth at turnout is associated with a later date. Some of these contraryresults are partially explained when a year dummy isincluded in the result. We can see that, in comparisonwith 2008, 2010 is associated with TOD being 4.94 dayslater and 2012 with TOD being 5.96 days earlier. As aresult of including the year dummies total dry days areno longer significant and total rainfall is only justsignificant at the 5% level.
If the assumption of a framer having a target date istrue then this could be picked up with a lagged variable-the previous year’s TOD. If farmers have a preference fora TOD regardless of conditions and only change in extre-mis, using the previous year’s TOD allows us to capturethis. One impact of using a lagged variable is that 2008cannot be used as we do not have 2007 TOD.
The inclusion of the lagged variable in the FE modelabove has little impact. With the lagged variable itselfnot significant though the overall model R2 marginallyincreases and the RMSE goes from 15.3 to 14.3 (see table 4).Note that the year dummy now references 2009 as 2008 datanot included in analysis.
A predictive modelThe explanatory approach in the previous section can beexpanded to look at prediction of TOD knowing currentconditions. For the predictive model we can move bey-ond the fixed effects into a random effects model thatincorporates variance between farms. This is importantas formally the fixed effects model can only be used to
Table 3: Seasonal and local factors associated with TOD
Variables associated with with year dummies
TOD Coefficient (t) Coefficient (t)
Average NDVI Jan 1-May 8 -399.312(11.74)** -357.209(10.70)**Total rain Jan 1-May 8 (mm) 0.036(6.77)** 0.015(1.96)*Total number of Dry Days Jan 1-May 8 0.245(4.54)** 0.093(1.60)Actual NDVI at TOD 323.206(11.26)** 323.439(11.37)**Total rain 16 days prior to TOD (mm) -0.079(4.68)** -0.082(4.84)**Total number of dry days in 16 days prior to TOD -0.464(2.84)** -0.518(3.19)**
Year Dummy2009 0.322(0.703)2010 4.94(2.83)**2011 1.2(0.83)2012 -5.962(-4.13)**
Constant 98.246(8.70)** 83.273(6.54)**
Observations=995. Panel ID FARM_CODE=199.Time ID Years=5Within R2=0.323 (F=35.59***), with Year Dummies R2=0.363 (F=24.91***)Absolute value of t-statistics in parentheses* po0.05; ** po0.01
International Journal of Agricultural Management, Volume 7 Issue 1 ISSN 2047-3710& 2018 International Farm Management Association and Institute of Agricultural Management 55
Stuart Green et al. Current weather and farm management
infer relationships of within the sample where as a ran-dom effects model allows for inference and thus pr-ediction from the larger population from which thesample was drawn (due to the assumption of a normaldistribution to the residual term). This allows us toinclude x and y location and soil type (dummy variablefor well drained or poorly drained recorded in the NFS)in our model as a between farm affect The result of therandom effects models (maximum likelihood) also showthe much bigger impact of using the lagged TOD var-iable, table 5
This random effects model, shows the influence oflocation and soil drainage found in other studies withDry soil associated with TOD being 4.5 days earlier andnorthernliness (y coordinate) leading to TOD being1 day later for every 16km north. The other terms aresimilar to the FE coefficients. If the TOD_lag is intro-duced we can see the R2
fit of the model increase sig-nificantly but the x and y coordinates are no longersignificant as the TOD variation is captured in the lagged
variable. This model allows us to predict a TOD for theNFS farmers using the equation:
TOD¼ 66:236þDSM: � 2:581ð Þþmeanndvi:
� 375:260ð Þþ totr: 0:0313ð Þþ totdry: 0:13ð Þþ
truendvi: 313:487ð Þþ trurain: � 0:097ð Þþ
TOD lag:ð0:487ÞPredicted TOD and actual TOD for the period are
shown in figure 5. Note that in the TOD_lag model theconstant value (66.2) is 28 days earlier than the modelwithout the lagged variable (94.2). The lagged coefficientis 0.487. If we apply the coefficient to the mean TOD weget 29.7 days, this is not a coincidence as the lagged vari-able within the random effects model is moving variationfrom the alpha term fixed in time into a time variantvariable. It would be preferable to have an independenttest set to test this predictive power fully.
Table 4: Seasonal and local factors associated with TOD in a fixed effects model with a lagged TOD variable added
Variables associated with with year dummies
TOD Coefficient (t)
Average NDVI Jan 1-May 8 -344.342(9.55)**Total rain Jan 1-May 8 (mm) 0.012(1.34)Total number of Dry Days Jan 1-May 8 0.037(0.54)Actual NDVI at TOD 301.930(10.34)**Total rain 16 days prior to TOD (mm) -0.072(3.82)**Total number of dry days in 16 days prior to TOD -0.227(1.16)TOD_lag 0.017(0.5)Year Dummy2010 4.57(2.77)**2011 0.930(0.63)2012 -6.475(-3.75)**
Constant 83.841(6.13)**
Observations=796. Panel ID FARM_CODE=199. Time ID Years=4Year Dummies R2=0.382 (F=22.51)Absolute value of t-statistics in parentheses* po0.05; ** po0.01
Table 5: Seasonal and local factors associated with TOD in a random effects model with a lagged TOD variable added
Variables associated with i) ii) with lag
TOD Coefficient (t) Coefficient (t)
X Coor -0.0000141(-1.03) -0.00000677(0.77)Y Coor 0.0000627(7.00)** 0.00000924 (1.56)Dry Soil Dummy -4.230995 (2.97)** -2.581223(3.02)**Average NDVI Jan 1-May 8 -503.589(23.22)** -375.260(17.86)**Total rain Jan 1-May 8 (mm) 0.038(7.4)** 0.0313 (6.37)**Total number of Dry Days Jan 1-May 8 0.250(6.56)** 0.130(3.92)**Actual NDVI at TOD 427.206(22.73)** 313.487(16.84)**Total rain 16 days prior to TOD (mm) -0.102(-5.95)** -0.097(5.53)**Total number of dry days in 16 days prior to TOD -0.489(3.01)** -0.199(1.18)
TOD_Lag 0.4868 (20.9)**
Constant 94.168(10.83)** 66.239(9.63)**
Observations=995. Panel ID FARM_CODE=199. Time ID Years=5Overall R2=0.589, with TOD lagObservations=796. Panel ID FARM_CODE=199. Time ID Years=4R2=0.745Absolute value of t-statistics in parentheses* po0.05; ** po0.01
ISSN 2047-3710 International Journal of Agricultural Management, Volume 7 Issue 156 & 2018 International Farm Management Association and Institute of Agricultural Management
Current weather and farm management Stuart Green et al.
5. Discussion
Better overall growth in spring seems to be related toearlier turn out dates but an opposite, equal effect ispresent locally at turn out, more grass on the farm atturn out is related to a later turn out. It is important toremember the strong seasonal effects; grass grows overtime, all things being equal, the longer you wait the moregrass there will be and less rain will fall as spring turns tosummer. However we have hypothesised that farmershave a target grass level at their farm they want to achievebefore turn out.
Farmers respond to overall conditions, to a ‘‘bad’’spring, like 2010, or to a ‘‘good’’ spring like 2012 andadjust their turn out dates but they do not do so opti-mally, there is a lag in the response, shown by the posi-tive relationship between NDVI at turn out and TOD. Ina good year they are letting the grass grow too far beforeresponding quickly enough to a good spring.
If the response of farmers to good conditions wasoptimal then the coefficient of NDVI at turn out datewould be zero in table 4, all else being equal the amountof grass at turn out on the farm should always be thesame. The size of the coefficient is an indicator of howfarm from optimal the group of farmers are.
The increase rainfall at turn out being related to earlyTOD could be a seasonal effect, there is more rainfallearly in the season and could indicate that farmers aremore driven by available grass growth than soil con-ditions when considering an early turn out. A soil drai-nage dummy was included in earlier analysis and did notprove significant. The increase in the number of dry daysat turn out being associated with earlier turn out is how-ever an indicator that farmers are responding to localweather conditions when deciding to turn out. An inter-action term between rainfall and dry days at turn out wasinvestigated and not found significant.
It is likely that better knowledge of soils and drainageon the NFS farms would add considerable nuance to the
picture of weather conditions and turn out date as woulda more sophisticated handling of the rainfall data (thenumber of days over which to sum rain to get a picture ofsoil trafficability would vary considerably by soil type).
Our picture of NDVI and growth is also crude butbetter resolution satellite imagery, and better geolocationof the NFS farms (mapped parcels rather than locationof farmhouse) will allow us in the near future to be ableto characterise the grass growth at field scale rather thanin the generally location of the farm.
The predictive capabilities of the model seem good, atleast for the NFS sample, in the absence of previousTOD for all farms then any national TOD prediction willdepend upon the random effects coefficients in table 5.A comparison of the predictive capabilities is shown intable 6. The RMSE of 10.8 days when compared to anintra-farm average TOD variation of 25 days suggeststhis model could provide useful high resolution mea-surements of impact on TOD of current spring con-ditions on the farms in the NFS and wider.
6. Conclusion
Farmers are responding to general springtime growthconditions and measurements of NDVI over spring bysatellite can quantify the size of the response on turn outdates at the farm. Nationally, on average, turnout date
Figure 5: Predicted TOD against actual TOD (Julian days) for the model data
Table 6: Comparison of the internal predictive capabilities ofthe four models
Model R2 predict RMSE onprediction (days)
Fixed Effects 0.501 15.32FE+ TOD lag 0.549 14.3Random effects 0.581 14RE+TOD lag 0.742 10.8
International Journal of Agricultural Management, Volume 7 Issue 1 ISSN 2047-3710& 2018 International Farm Management Association and Institute of Agricultural Management 57
Stuart Green et al. Current weather and farm management
gets a day later for every 16km further north of the southcoast. Farmers seem to have a lag in their response togood conditions, waiting until there is more grass than isnormal at their farm before turning out and turning outearly in poor years to low levels of grass cover. The numberof dry days in the run up to turning out and the totalamount of rainfall are associated with changes in TOD.
National seasonal effects dominate over local weatherconditions and for every extra 0.01 in the average springNDVI value score at the farm location turnout was 3.6days earlier but this early turnout was associated with ahigher actual NDVI on the day, that showed effectivelythe turn-out was 3.3 days later than it could have been.As 0.01 NDVI equates to a week’s growth typically itshowed that farmers do respond to good conditions butnot as quickly as they could. The rainfall data implied thatsoil condition was of secondary importance to grass levels,especially in poor springs and year dummies showed thatseasonal effects are national- 2010 was a cold spring causedturn out dates to be 4.6 days later, whereas the warm springof 2012 allowed cattle to be turned out 5.6 days earlier.
The inertia in decision making around a preferred datewas shown by using the previous year’s TOD in themodel. By using this along with the other data we canaccurately predict when Turn out occurs with a RMSEof 10 days (compare to the average on farm inter-annualrange of dates of 25 days).
This work has quantified some of the real-time factorsthat farmers do take into account when making deci-sions. It’s also shown there is still considerable capacityfor increased exploitation of grassland resources withincurrent management systems and stocking densities.
About the authors
Stuart Green is a senior research officer in The IrishAgriculture and Food Development Authority, Teagasc,specialising in remote sensing of grasslands.
Fiona Cawkwell is a lecturer in the Geography in Uni-versity College Cork and director of the remote sensingand GIS Msc.
Edward Dwyer is the Executive Director of EuroceanFoundation secretariat based in Lisbon, Portugal. Prior tothat position he was the Deputy-Director of the Coastal
and Marine Research Centre at University College Cork,Ireland.
BIBLIOGRAPHY
Ali, I., Cawkwell, F., Dwyer, E. and Green, S. (2016). IEEEJournal of Selected Topics in Applied Earth Observationsand Remote Sensing, PP, 1-16. http://dx.doi.org/10.1109/jstars.2016.2561618
Creighton, P., Kennedy, E., Shalloo, L., Boland, T.M. andO’ Donovan, M. (2011). Grass and Forage Science, 66, 251-264. http://dx.doi.org/10.1111/j.1365-2494.2011.00784.x
Garcıa-Mora, T.J., Mas, J.-F. and Hinkley, E.A. (2011). In Inter-national Journal of Digital Earth, Vol. 5 Taylor & Francis,pp. 63-87 http://dx.doi.org/10.1080/17538947.2011.565080.
Green, S., Cawkwell, F. and Dwyer, E. (2016). InternationalJournal Applied Earth Observation & Geoinformation, 52,166–174. http://dx.doi.org/10.1016/j.jag.2016.06.012.
Green, S. and Donoghue, C. (2013). ISPRS International Journalof Geo-Information, 2, 50-66. http://dx.doi.org/10.3390/ijgi2010050.
Hanrahan, K., Hennessy, T., Kinsella, A. and Moran, B. (2014).Agricultural Economics & Farm Surveys Department, REDP,Teagasc.
Huete, A., Didan, K., Miura, T., Rodriguez, E.P., Gao, X. andFerreira, L.G. (2002). Remote sensing of environment, 83,195-213. http://dx.doi.org/10.1016/S0034-4257(02)00096-2.
Kinsella, A., Laepple, D., Moran, B. and Hennessy, T. (2010).TResearch, 5, 30-31.
Lapple, D., Hennessy, T. and O’Donovan, M. (2012). Journal ofDairy Science, 95, 188-195. http://dx.doi.org/10.3168/jds.2011-4512.
McGee, M., Drennan, M.J. and Crosson, P. (2014). Irish Journalof Agricultural and Food Research, 53, 1-9
O’Connor, B., Dwyer, E., Cawkwell, F. and Eklundh, L. (2012).ISPRS Journal of Photogrammetry and Remote Sensing, 68,79-94. http://dx.doi.org/10.1016/j.isprsjprs.2012.01.004.
O’Donovan, M., Delaby, L. and Peyraud, J.L. (2004). Animalresearch, 53, 489-502. https://doi.org/10.1051/animres:2004036
O’Shea, R., Bougard, M., Breen, J., O’Donoghue, C. and Ryan,M. (2015). In 89th Annual Conference of the AgriculturalEconomics Society, University of Warwick, England
Piwowarczyk, A., Giuliani, G. and Holden, N.M. (2011). Soil Useand Management, 27, 255-263. http://dx.doi.org/10.1111/j.1475-2743.2011.00339.x.
Vina, A., Gitelson, A.A., Nguy-Robertson, A.L. and Peng, Y.(2011). Remote Sensing of Environment, 115, 3468-3478.http://dx.doi.org/10.1016/j.rse.2011.08.010.
Walsh, S. (2012). In National Hydrology Conference. OPW,Dublin, Athlone, Ireland
ISSN 2047-3710 International Journal of Agricultural Management, Volume 7 Issue 158 & 2018 International Farm Management Association and Institute of Agricultural Management
Current weather and farm management Stuart Green et al.
REFEREED ARTICLESDOI: 10.5836/ijam/2018-07-59
Not all risks are equalCATHERINE E. MILNE1, JIAYI LIU2 and ADAM BUTLER2
ABSTRACTAnalysis of a survey of Scottish farmers (162) confirmed that they do not perceive all types of risk to beequal. Choices with potential negative ethical or health & safety consequences were perceived to be riskierthan those that might have negative financial and social outcomes. A negative relationship was foundbetween perceived riskiness and stated likelihood of taking a risky course of action with one exception -where a health & safety harm might arise. The findings could assist the development of behaviouralmodels with greater predictive powers. In addition, the study suggests that risk awareness is not the mostlimiting factor for improving health & safety in the Scottish farming industry.
KEYWORDS: decision; choice; risk preferences; risk perceptions; ordinal mixed-effects model.
1. Introduction
Risk and uncertainty are well known and widelyresearched characteristics of agricultural activity that arefundamental to the choice made in many farm manage-ment decisions. Despite the considerable wealth of litera-ture much is still to be learnt and there remain calls forresearchers to undertake more studies to gain a betterunderstanding of the decisions made by farmers (OECD,2009; Ohlmer et al., 1998; Webster, 2003). The develop-ment of better farm level decision support and dedicatedrisk management tools are among the leading study areas.However, these commonly promote a risk managementprocess that considers each risk independently such asdescribed by Theuvsen (2013), or focus on a single objec-tive function such as a socially desirable outcome, farmoutput or farm profit maximisation (for examples seePaulson et al. (2016), Arribas et al. (2017), Jones et al.(2017), Mosnier et al. (2017) and Liu et al. (2017)). Thusthey do not address the common situations where farmmanagement decisions must balance competing sets of, ormultiple, risks. An alternative approach has been the studyof farmer behaviour and their previous decision choicesto identify factors associated with particular actions seefor example Mase et al. (2017) and Hamilton-Webb et al.(2017). Such studies however largely overlook the avail-able alternatives at the decision point and therefore alsomiss the influence of preferences for options with differentrisk profiles and expected values. (The term ‘risk’ is usedhere to encompass all situations where there is potentialfor negative consequences.) Cases where farmers must relylargely on their own judgement and subjective assessmentof the risks are currently poorly understood and rarelystudied (Hardaker and Lien, 2010). Yet there is a longstanding recognition that risk perceptions have importantimpacts on the choices people make and their likelyresponse to policy interventions (Slovic, 1987; Tversky and
Kahneman, 1974). As noted 30 years ago by Slovic(1987) there is a need to understand how people thinkabout and respond to risk or ‘well intended policies may beineffective’.
The purpose of this study is to investigate the know-ledge gap that exists about the subjective risk preferencesof farmers. The aim is to provide some new insights thatcan contribute to the development of better predictivemodels of farmer decision choices and thereby enablebetter policy design. The two main objectives are todetermine the relative preferences of farmers to dif-ferent types of risk and to investigate the relationshipbetween the perceived riskiness of an action and thelikelihood that they would engage in the action i.e. takethe risk.
The study follows a novel approach in the context offarm management and builds on the approaches ofWeber et al. (2002) and Blais and Weber (2006) byexploring the risk perceptions of and likelihood of risktaking by Scottish farmers. The statistical methodologyused differs from previous studies in that the Likert scaleresponse data is treated as ordinal rather than numeric,thus importantly for the statistical analysis it assumes aflexible distance between scale points (Agresti, 2002;Allen and Seaman, 2007). It involved the development,administration and analysis of data from a survey ofScottish farmers, though the method could be used withother groups and the findings provide insights that arenot bounded by geographic region.
2. Study methods
The study consisted of primary data collection using apaper questionnaire from a sample of farmers followedby the development of statistical models to determinewhether or not farmers differentiated between different
1Corresponding author: Dr Cath Milne, SRUC, Peter Wilson Building, West Mains Road, Edinburgh EH9 3JG. Tel: 0131 535 4481, Fax: 0131 535 4345 SRUC, Email: [email protected] Biomathematics and Statistics Scotland, JCMB, Kings Buildings, West Mains Road, Edinburgh EH9 3JZ.
Original submitted April 27 2017; revision received March 08 2018; accepted April 18 2018.
International Journal of Agricultural Management, Volume 7 Issue 1 ISSN 2047-3710& 2018 International Farm Management Association and Institute of Agricultural Management 59
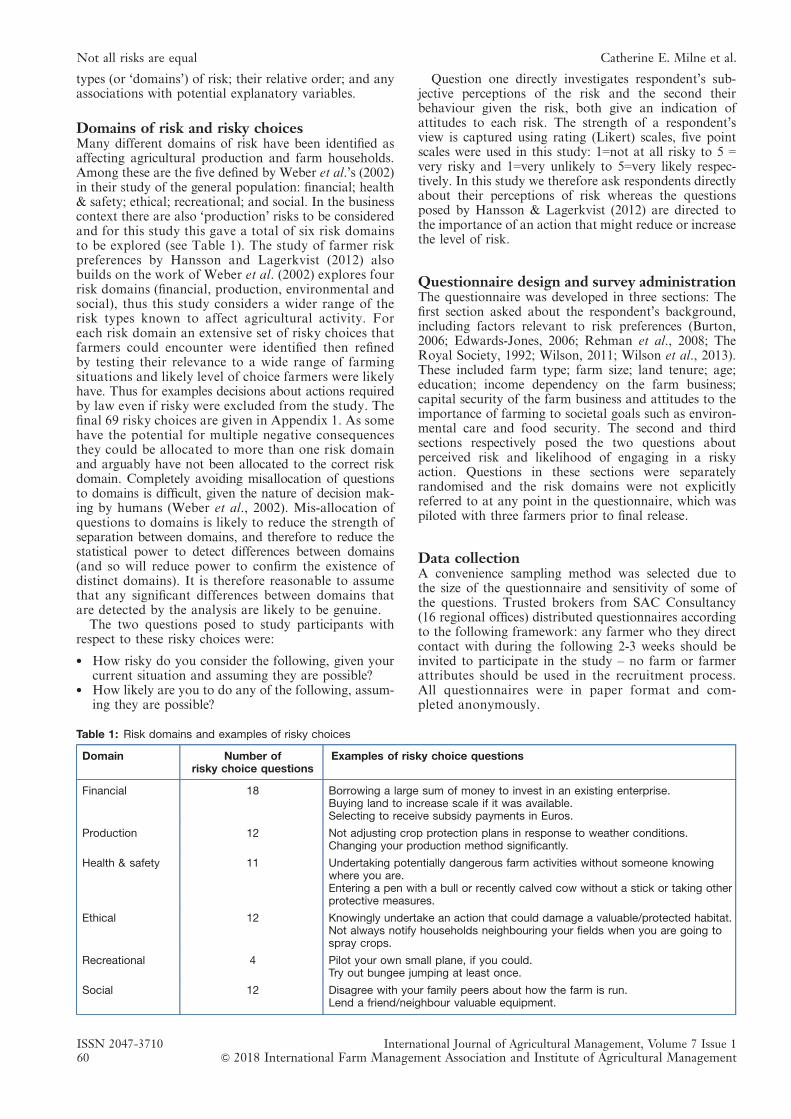
types (or ‘domains’) of risk; their relative order; and anyassociations with potential explanatory variables.
Domains of risk and risky choicesMany different domains of risk have been identified asaffecting agricultural production and farm households.Among these are the five defined by Weber et al.’s (2002)in their study of the general population: financial; health& safety; ethical; recreational; and social. In the businesscontext there are also ‘production’ risks to be consideredand for this study this gave a total of six risk domainsto be explored (see Table 1). The study of farmer riskpreferences by Hansson and Lagerkvist (2012) alsobuilds on the work of Weber et al. (2002) explores fourrisk domains (financial, production, environmental andsocial), thus this study considers a wider range of therisk types known to affect agricultural activity. Foreach risk domain an extensive set of risky choices thatfarmers could encounter were identified then refinedby testing their relevance to a wide range of farmingsituations and likely level of choice farmers were likelyhave. Thus for examples decisions about actions requiredby law even if risky were excluded from the study. Thefinal 69 risky choices are given in Appendix 1. As somehave the potential for multiple negative consequencesthey could be allocated to more than one risk domainand arguably have not been allocated to the correct riskdomain. Completely avoiding misallocation of questionsto domains is difficult, given the nature of decision mak-ing by humans (Weber et al., 2002). Mis-allocation ofquestions to domains is likely to reduce the strength ofseparation between domains, and therefore to reduce thestatistical power to detect differences between domains(and so will reduce power to confirm the existence ofdistinct domains). It is therefore reasonable to assumethat any significant differences between domains thatare detected by the analysis are likely to be genuine.
The two questions posed to study participants withrespect to these risky choices were:
� How risky do you consider the following, given yourcurrent situation and assuming they are possible?
� How likely are you to do any of the following, assum-ing they are possible?
Question one directly investigates respondent’s sub-jective perceptions of the risk and the second theirbehaviour given the risk, both give an indication ofattitudes to each risk. The strength of a respondent’sview is captured using rating (Likert) scales, five pointscales were used in this study: 1=not at all risky to 5 =very risky and 1=very unlikely to 5=very likely respec-tively. In this study we therefore ask respondents directlyabout their perceptions of risk whereas the questionsposed by Hansson & Lagerkvist (2012) are directed tothe importance of an action that might reduce or increasethe level of risk.
Questionnaire design and survey administrationThe questionnaire was developed in three sections: Thefirst section asked about the respondent’s background,including factors relevant to risk preferences (Burton,2006; Edwards-Jones, 2006; Rehman et al., 2008; TheRoyal Society, 1992; Wilson, 2011; Wilson et al., 2013).These included farm type; farm size; land tenure; age;education; income dependency on the farm business;capital security of the farm business and attitudes to theimportance of farming to societal goals such as environ-mental care and food security. The second and thirdsections respectively posed the two questions aboutperceived risk and likelihood of engaging in a riskyaction. Questions in these sections were separatelyrandomised and the risk domains were not explicitlyreferred to at any point in the questionnaire, which waspiloted with three farmers prior to final release.
Data collectionA convenience sampling method was selected due tothe size of the questionnaire and sensitivity of some ofthe questions. Trusted brokers from SAC Consultancy(16 regional offices) distributed questionnaires accordingto the following framework: any farmer who they directcontact with during the following 2-3 weeks should beinvited to participate in the study – no farm or farmerattributes should be used in the recruitment process.All questionnaires were in paper format and com-pleted anonymously.
Table 1: Risk domains and examples of risky choices
Domain Number ofrisky choice questions
Examples of risky choice questions
Financial 18 Borrowing a large sum of money to invest in an existing enterprise.Buying land to increase scale if it was available.Selecting to receive subsidy payments in Euros.
Production 12 Not adjusting crop protection plans in response to weather conditions.Changing your production method significantly.
Health & safety 11 Undertaking potentially dangerous farm activities without someone knowingwhere you are.Entering a pen with a bull or recently calved cow without a stick or taking otherprotective measures.
Ethical 12 Knowingly undertake an action that could damage a valuable/protected habitat.Not always notify households neighbouring your fields when you are going tospray crops.
Recreational 4 Pilot your own small plane, if you could.Try out bungee jumping at least once.
Social 12 Disagree with your family peers about how the farm is run.Lend a friend/neighbour valuable equipment.
ISSN 2047-3710 International Journal of Agricultural Management, Volume 7 Issue 160 & 2018 International Farm Management Association and Institute of Agricultural Management
Not all risks are equal Catherine E. Milne et al.
Model developmentThe statistical methodology used in this paper is closelyrelated to Weber et al. (2002) and Blais and Weber(2006), but differs in one crucial respect: we treat thetwo risk related response variables (five-point Likertscale) as ordinal categorical data, rather than as con-tinuous data. This is an important difference, because itmeans that in this paper we make no assumption thatthe gaps between points on the Likert scale are equal.The scores allocated to categories of the Likert scaleprovide a ranking but the values themselves (1, 2, 3, 4and 5) are labels rather than measured values and so areessentially arbitrary, as there is no reason to believethat the gaps between consecutive scores will necessa-rily be equal on an absolute scale. The treatment of theresponse variables as ordinal, rather than numeric,therefore improves the defensibility of the methodolo-gical approach.
To establish whether or not farmers differentiatedbetween different risk domains with respect to both theirrisk perceptions and likelihood of engaging in a riskychoice an ordinal mixed-effects model was developed.This model also provided estimated values on the relativeperceived riskiness of each domain and how likelyrespondents were to engage in those activities. Finallythe model was developed further to test for associationswith contextual factors (farm or farmer backgroundcharacteristics). All statistical models were implementedby using the clmm function in the R ‘ordinal’ package,which fits mixed-effects models with one or more randomeffects for ordinal data. The test of the overall domaineffect and other explanatory variables were carried outby the likelihood ratio test, and paired Wald tests werethen use to further test for differences between specificpairs of domains.
To make interpretation of the result from the modelseasier a data transformation was applied prior toanalysis. This involved reversing the direction of thefive-point Likert scale relating to the likelihood thatrespondents would take a risky choice, thus a score of1 equated to ‘very likely’ and a score of 5 represented‘very unlikely’ and represent the likelihood of respon-dents not taking a risky choice. Thus the signs of thecoefficients (see below) from the models would bealigned. (During the piloting phase of the survey it wasestablished that the scale direction used in the analysiswas difficult for respondents and therefore inappro-priate.)
Ordinal mixed-effects models were estimated, withunstructured thresholds, using the clmm function in theOrdinal package for R (Christensen, 2015). This type ofmodel is an extension of linear models, such as ANOVA(Agresti, 2002; McCullagh, 1980; Tutz and Hennevogl,1996) and it has two key characteristics:
1. Response variables are treated as being an ordinal,rather than a numeric, variable. This is done byassuming that the values of the ordinal variable yrepresent intervals on a latent continuous variable z(which can be thought of as representing the under-lying variable that the Likert scale is trying to quan-tify), and assuming that this latent variable z - ratherthan the observed score y - that is related to the expla-natory variable. The values of y can be computed
deterministically from the values of z through theequation
y¼ Iðzoa2Þþ 2 Iða2ozoa3Þþ 3 Iða3ozoa4Þþ4 Iða4ozoa5Þþ 5 Iðz4a5Þ; ð1Þ
where I(x) is the indicator function (so that I(x) = 1if x is true, and I(x) = 0 otherwise). The unknowncut-points a2, a3, a4 and a5 are estimated as part ofthe model fitting algorithm.
2. Random effects as well as explanatory variables (or‘‘fixed effects’’) are included in the model to captureunexplained sources of variation within the model,including that which could arise from a lack of variableindependence.
Thus the final form of the model was
Zij ¼ bDðiÞ þUi þVj þWjDðiÞ þ Eij ; ð2Þwhere zij denotes the response to question i by farmer jand bD(i) denotes the domain effect (fixed-effect) asso-ciated with question i. Three random effects are includedhere to deal with the multilevel structure in the designof this study. 1) Ui is the question-specific random effect;2) Vj is the farmer-specific random effect; 3) WjD(i) is therandom effect capturing the interaction between domainand farmer. Finally, Eij is the unexplained random errorassociated with question i and farmer j. All these threerandom effects and the random error are assumed to benormally distributed with a mean of zero and an unknownvariance (estimated from the data as part of the modelfitting).
To confirm whether farmers do (or do not) differ-entiate between the risk domains the model was runtwice, first for ‘risk perception’ and second for ‘the likeli-hood of not taking a risky choice’. A likelihood ratio test,using a single p-value (Equation 2) then determineswhether the model that allows for differences betweenrisk domains is better supported by the data than thesimpler ‘base’ model which does not (and hence assumesall risk domains are equivalent). If a statistically signifi-cant association is found, it is then meaningful to furthertest for differences (paired Wald test) between pairs ofrisk domains and establish their relative ordering. Thisis achieved by comparing the bD(i) coefficients of a ‘base’and a ‘comparator’, testing whether bcomparator- bbase issignificantly different from zero, and, if so, the magni-tude and sign of this difference. A positive coefficientindicates that scores for the comparator group are higherthan those for the base group; a negative value indicatesthat scores for the comparator group are lower thanthose for the base group.
Contextual factors such as age, education, farm size aswell as general attitudes may provide some explanationof either risk perception or the likelihood of not takingrisks. To test for any associations the model was devel-oped by replacing the domain variable by each of thecontextual factors in sequence and including domain as arandom effect. The model was run for associations withboth risk perception and the likelihood of not taking arisk. As respondents’ opinions about the importance ofagriculture to societal goals were ordinal in nature (on a5-point Likert scale: score 1-not at all important to score5-very important) it would be possible to treat thesecontextual factors as either continuous or categorical.
International Journal of Agricultural Management, Volume 7 Issue 1 ISSN 2047-3710& 2018 International Farm Management Association and Institute of Agricultural Management 61
Catherine E. Milne et al. Not all risks are equal
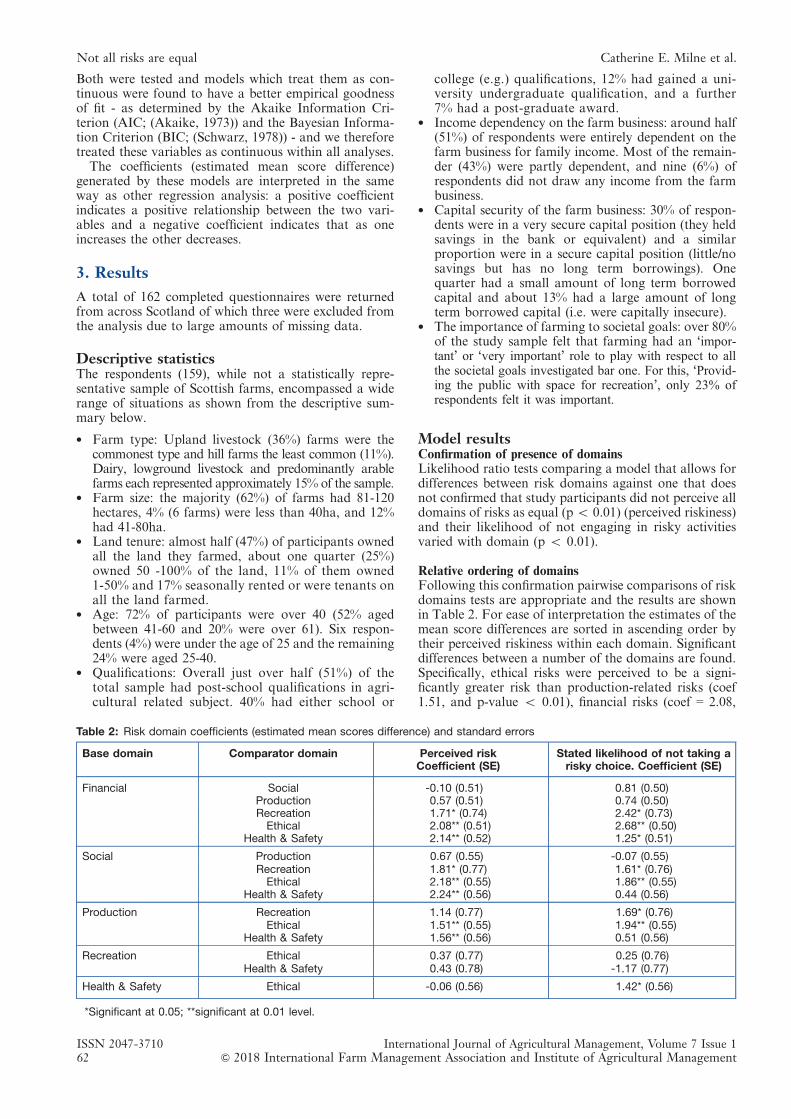
Both were tested and models which treat them as con-tinuous were found to have a better empirical goodnessof fit - as determined by the Akaike Information Cri-terion (AIC; (Akaike, 1973)) and the Bayesian Informa-tion Criterion (BIC; (Schwarz, 1978)) - and we thereforetreated these variables as continuous within all analyses.
The coefficients (estimated mean score difference)generated by these models are interpreted in the sameway as other regression analysis: a positive coefficientindicates a positive relationship between the two vari-ables and a negative coefficient indicates that as oneincreases the other decreases.
3. Results
A total of 162 completed questionnaires were returnedfrom across Scotland of which three were excluded fromthe analysis due to large amounts of missing data.
Descriptive statisticsThe respondents (159), while not a statistically repre-sentative sample of Scottish farms, encompassed a widerange of situations as shown from the descriptive sum-mary below.
� Farm type: Upland livestock (36%) farms were thecommonest type and hill farms the least common (11%).Dairy, lowground livestock and predominantly arablefarms each represented approximately 15% of the sample.
� Farm size: the majority (62%) of farms had 81-120hectares, 4% (6 farms) were less than 40ha, and 12%had 41-80ha.
� Land tenure: almost half (47%) of participants ownedall the land they farmed, about one quarter (25%)owned 50 -100% of the land, 11% of them owned1-50% and 17% seasonally rented or were tenants onall the land farmed.
� Age: 72% of participants were over 40 (52% agedbetween 41-60 and 20% were over 61). Six respon-dents (4%) were under the age of 25 and the remaining24% were aged 25-40.
� Qualifications: Overall just over half (51%) of thetotal sample had post-school qualifications in agri-cultural related subject. 40% had either school or
college (e.g.) qualifications, 12% had gained a uni-versity undergraduate qualification, and a further7% had a post-graduate award.
� Income dependency on the farm business: around half(51%) of respondents were entirely dependent on thefarm business for family income. Most of the remain-der (43%) were partly dependent, and nine (6%) ofrespondents did not draw any income from the farmbusiness.
� Capital security of the farm business: 30% of respon-dents were in a very secure capital position (they heldsavings in the bank or equivalent) and a similarproportion were in a secure capital position (little/nosavings but has no long term borrowings). Onequarter had a small amount of long term borrowedcapital and about 13% had a large amount of longterm borrowed capital (i.e. were capitally insecure).
� The importance of farming to societal goals: over 80%of the study sample felt that farming had an ‘impor-tant’ or ‘very important’ role to play with respect to allthe societal goals investigated bar one. For this, ‘Provid-ing the public with space for recreation’, only 23% ofrespondents felt it was important.
Model resultsConfirmation of presence of domainsLikelihood ratio tests comparing a model that allows fordifferences between risk domains against one that doesnot confirmed that study participants did not perceive alldomains of risks as equal (p o 0.01) (perceived riskiness)and their likelihood of not engaging in risky activitiesvaried with domain (p o 0.01).
Relative ordering of domainsFollowing this confirmation pairwise comparisons of riskdomains tests are appropriate and the results are shownin Table 2. For ease of interpretation the estimates of themean score differences are sorted in ascending order bytheir perceived riskiness within each domain. Significantdifferences between a number of the domains are found.Specifically, ethical risks were perceived to be a signi-ficantly greater risk than production-related risks (coef1.51, and p-value o 0.01), financial risks (coef = 2.08,
Table 2: Risk domain coefficients (estimated mean scores difference) and standard errors
Base domain Comparator domain Perceived riskCoefficient (SE)
Stated likelihood of not taking arisky choice. Coefficient (SE)
Financial Social -0.10 (0.51) 0.81 (0.50)Production 0.57 (0.51) 0.74 (0.50)Recreation 1.71* (0.74) 2.42* (0.73)Ethical 2.08** (0.51) 2.68** (0.50)
Health & Safety 2.14** (0.52) 1.25* (0.51)
Social Production 0.67 (0.55) -0.07 (0.55)Recreation 1.81* (0.77) 1.61* (0.76)Ethical 2.18** (0.55) 1.86** (0.55)
Health & Safety 2.24** (0.56) 0.44 (0.56)
Production Recreation 1.14 (0.77) 1.69* (0.76)Ethical 1.51** (0.55) 1.94** (0.55)
Health & Safety 1.56** (0.56) 0.51 (0.56)
Recreation Ethical 0.37 (0.77) 0.25 (0.76)Health & Safety 0.43 (0.78) -1.17 (0.77)
Health & Safety Ethical -0.06 (0.56) 1.42* (0.56)
*Significant at 0.05; **significant at 0.01 level.
ISSN 2047-3710 International Journal of Agricultural Management, Volume 7 Issue 162 & 2018 International Farm Management Association and Institute of Agricultural Management
Not all risks are equal Catherine E. Milne et al.
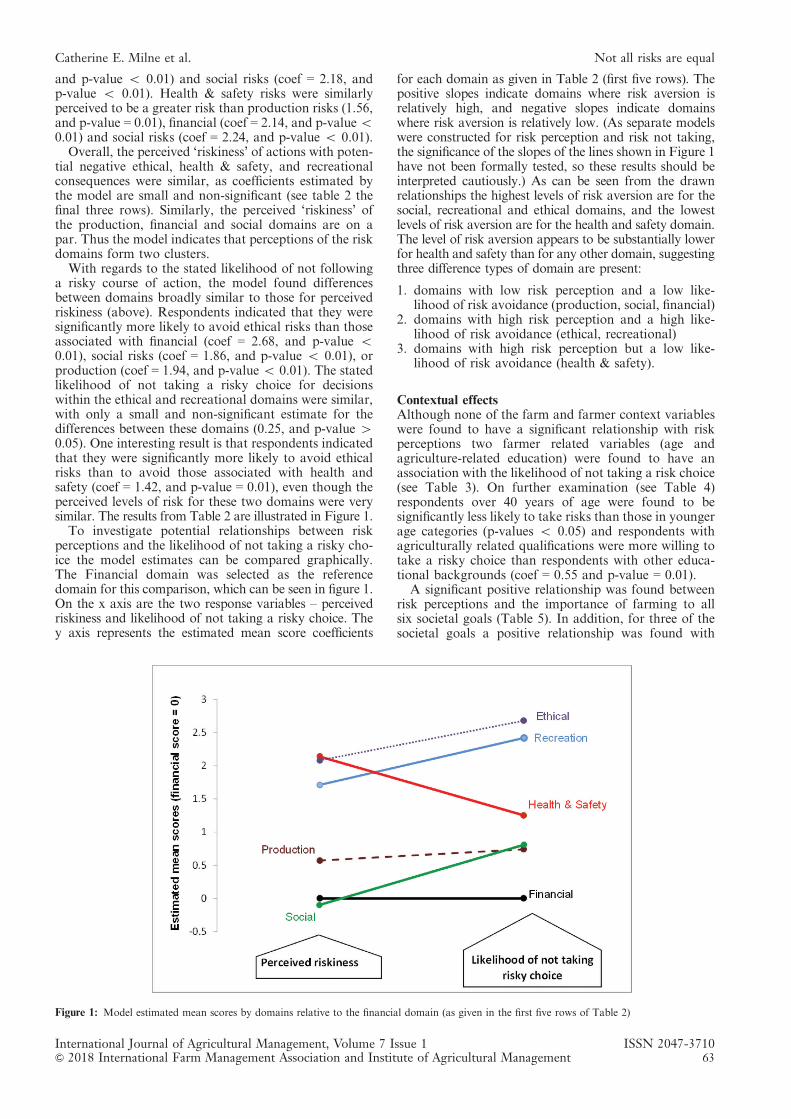
and p-value o 0.01) and social risks (coef = 2.18, andp-value o 0.01). Health & safety risks were similarlyperceived to be a greater risk than production risks (1.56,and p-value = 0.01), financial (coef = 2.14, and p-valueo0.01) and social risks (coef = 2.24, and p-value o 0.01).
Overall, the perceived ‘riskiness’ of actions with poten-tial negative ethical, health & safety, and recreationalconsequences were similar, as coefficients estimated bythe model are small and non-significant (see table 2 thefinal three rows). Similarly, the perceived ‘riskiness’ ofthe production, financial and social domains are on apar. Thus the model indicates that perceptions of the riskdomains form two clusters.
With regards to the stated likelihood of not followinga risky course of action, the model found differencesbetween domains broadly similar to those for perceivedriskiness (above). Respondents indicated that they weresignificantly more likely to avoid ethical risks than thoseassociated with financial (coef = 2.68, and p-value o0.01), social risks (coef = 1.86, and p-value o 0.01), orproduction (coef = 1.94, and p-value o 0.01). The statedlikelihood of not taking a risky choice for decisionswithin the ethical and recreational domains were similar,with only a small and non-significant estimate for thedifferences between these domains (0.25, and p-value 40.05). One interesting result is that respondents indicatedthat they were significantly more likely to avoid ethicalrisks than to avoid those associated with health andsafety (coef = 1.42, and p-value = 0.01), even though theperceived levels of risk for these two domains were verysimilar. The results from Table 2 are illustrated in Figure 1.
To investigate potential relationships between riskperceptions and the likelihood of not taking a risky cho-ice the model estimates can be compared graphically.The Financial domain was selected as the referencedomain for this comparison, which can be seen in figure 1.On the x axis are the two response variables – perceivedriskiness and likelihood of not taking a risky choice. They axis represents the estimated mean score coefficients
for each domain as given in Table 2 (first five rows). Thepositive slopes indicate domains where risk aversion isrelatively high, and negative slopes indicate domainswhere risk aversion is relatively low. (As separate modelswere constructed for risk perception and risk not taking,the significance of the slopes of the lines shown in Figure 1have not been formally tested, so these results should beinterpreted cautiously.) As can be seen from the drawnrelationships the highest levels of risk aversion are for thesocial, recreational and ethical domains, and the lowestlevels of risk aversion are for the health and safety domain.The level of risk aversion appears to be substantially lowerfor health and safety than for any other domain, suggestingthree difference types of domain are present:
1. domains with low risk perception and a low like-lihood of risk avoidance (production, social, financial)
2. domains with high risk perception and a high like-lihood of risk avoidance (ethical, recreational)
3. domains with high risk perception but a low like-lihood of risk avoidance (health & safety).
Contextual effectsAlthough none of the farm and farmer context variableswere found to have a significant relationship with riskperceptions two farmer related variables (age andagriculture-related education) were found to have anassociation with the likelihood of not taking a risk choice(see Table 3). On further examination (see Table 4)respondents over 40 years of age were found to besignificantly less likely to take risks than those in youngerage categories (p-values o 0.05) and respondents withagriculturally related qualifications were more willing totake a risky choice than respondents with other educa-tional backgrounds (coef = 0.55 and p-value = 0.01).
A significant positive relationship was found betweenrisk perceptions and the importance of farming to allsix societal goals (Table 5). In addition, for three of thesocietal goals a positive relationship was found with
Figure 1: Model estimated mean scores by domains relative to the financial domain (as given in the first five rows of Table 2)
International Journal of Agricultural Management, Volume 7 Issue 1 ISSN 2047-3710& 2018 International Farm Management Association and Institute of Agricultural Management 63
Catherine E. Milne et al. Not all risks are equal
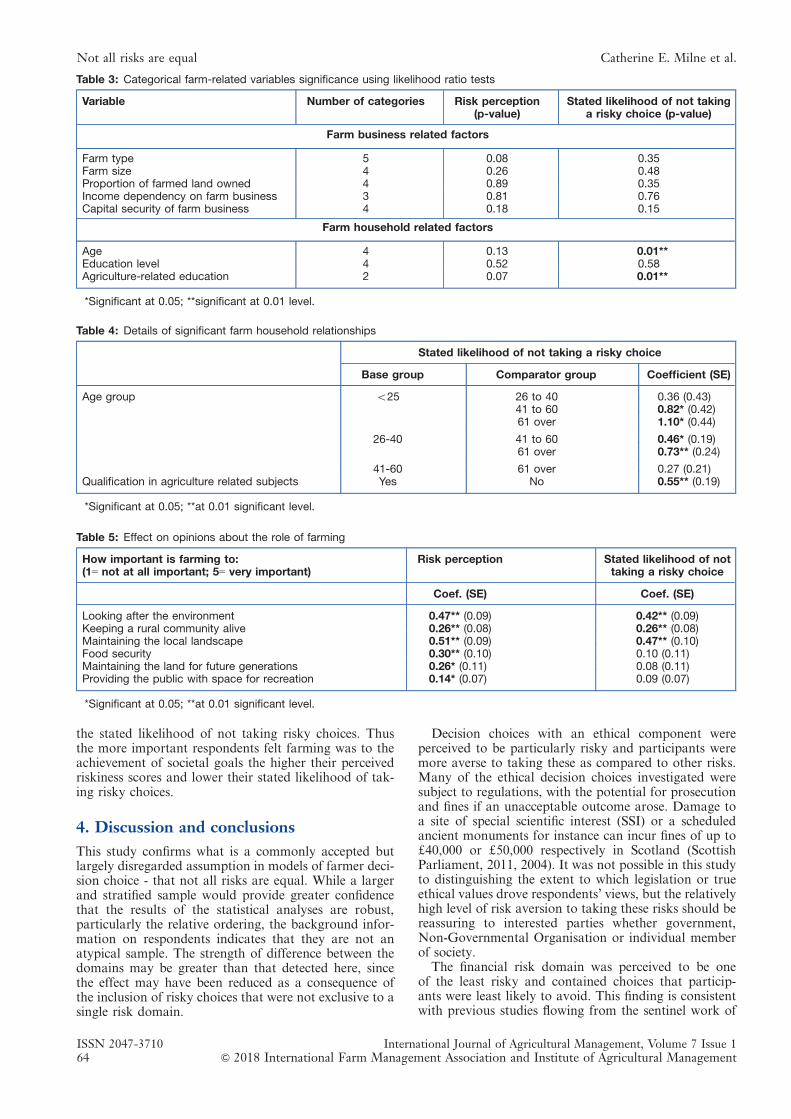
the stated likelihood of not taking risky choices. Thusthe more important respondents felt farming was to theachievement of societal goals the higher their perceivedriskiness scores and lower their stated likelihood of tak-ing risky choices.
4. Discussion and conclusions
This study confirms what is a commonly accepted butlargely disregarded assumption in models of farmer deci-sion choice - that not all risks are equal. While a largerand stratified sample would provide greater confidencethat the results of the statistical analyses are robust,particularly the relative ordering, the background infor-mation on respondents indicates that they are not anatypical sample. The strength of difference between thedomains may be greater than that detected here, sincethe effect may have been reduced as a consequence ofthe inclusion of risky choices that were not exclusive to asingle risk domain.
Decision choices with an ethical component wereperceived to be particularly risky and participants weremore averse to taking these as compared to other risks.Many of the ethical decision choices investigated weresubject to regulations, with the potential for prosecutionand fines if an unacceptable outcome arose. Damage toa site of special scientific interest (SSI) or a scheduledancient monuments for instance can incur fines of up tod40,000 or d50,000 respectively in Scotland (ScottishParliament, 2011, 2004). It was not possible in this studyto distinguishing the extent to which legislation or trueethical values drove respondents’ views, but the relativelyhigh level of risk aversion to taking these risks should bereassuring to interested parties whether government,Non-Governmental Organisation or individual memberof society.
The financial risk domain was perceived to be oneof the least risky and contained choices that particip-ants were least likely to avoid. This finding is consistentwith previous studies flowing from the sentinel work of
Table 3: Categorical farm-related variables significance using likelihood ratio tests
Variable Number of categories Risk perception(p-value)
Stated likelihood of not takinga risky choice (p-value)
Farm business related factors
Farm type 5 0.08 0.35Farm size 4 0.26 0.48Proportion of farmed land owned 4 0.89 0.35Income dependency on farm business 3 0.81 0.76Capital security of farm business 4 0.18 0.15
Farm household related factors
Age 4 0.13 0.01**Education level 4 0.52 0.58Agriculture-related education 2 0.07 0.01**
*Significant at 0.05; **significant at 0.01 level.
Table 4: Details of significant farm household relationships
Stated likelihood of not taking a risky choice
Base group Comparator group Coefficient (SE)
Age group o25 26 to 40 0.36 (0.43)41 to 60 0.82* (0.42)61 over 1.10* (0.44)
26-40 41 to 60 0.46* (0.19)61 over 0.73** (0.24)
41-60 61 over 0.27 (0.21)Qualification in agriculture related subjects Yes No 0.55** (0.19)
*Significant at 0.05; **at 0.01 significant level.
Table 5: Effect on opinions about the role of farming
How important is farming to:(1= not at all important; 5= very important)
Risk perception Stated likelihood of nottaking a risky choice
Coef. (SE) Coef. (SE)
Looking after the environment 0.47** (0.09) 0.42** (0.09)Keeping a rural community alive 0.26** (0.08) 0.26** (0.08)Maintaining the local landscape 0.51** (0.09) 0.47** (0.10)Food security 0.30** (0.10) 0.10 (0.11)Maintaining the land for future generations 0.26* (0.11) 0.08 (0.11)Providing the public with space for recreation 0.14* (0.07) 0.09 (0.07)
*Significant at 0.05; **at 0.01 significant level.
ISSN 2047-3710 International Journal of Agricultural Management, Volume 7 Issue 164 & 2018 International Farm Management Association and Institute of Agricultural Management
Not all risks are equal Catherine E. Milne et al.
Gasson (1973) highlighting that profit generation is notthe only and is often not the primary goal of farmers.Furthermore, it accentuates the call made by OECD(2009) for holistic studies of farmer behaviour that gobeyond financial optimisation if better models are to bedeveloped.
With most respondents considering that farming hasan important role to play in wider societal goals and theirpreference to particularly avoid ethical and health &safety risks the results indicate a positive attitude toissues that in other business environments might be ter-med ‘corporate social responsibility’. However, there isanecdotal evidence that this does not translate intopractice in all cases. The study findings therefore suggestthat barriers may be preventing farmers acting in linewith their risk preferences in many situations. Forinstance where legislation or markets require farmersto engage in hazardous activities such as tagging calvesand clipping cattle which resulted in injuries to 24% ofrespondents in a survey of Scottish farmers (Lindsayet al., 2004). This supports the viewpoint that there hasbeen too great a focus on farmer attitudes, behaviourand choice in recent years (Burton, 2004; Shove, 2010).Defining these barriers and finding solutions that areeffective in commercial conditions could lead to greaterconsistency between attitudes and behaviours as well asgreater progress towards the desired goals of bothfarmers and society. One hypothesis worthy of investiga-tion would be that the level of perceived or actual controlplays a key role. This might also explain why the threetypes of risk domain emerged from the statistical modelas there can be greater opportunities to implementmitigating actions with respect to production, financialand social risks as compared to the ethical and recrea-tional risks explored in the study (domain types 1 and 2).Furthermore, anecdotal evidence suggests that farmersfeel they are unable to avoid some health & safety risks.For example, many farmers are sole workers and con-sequently it was difficult for them to ensure they were not‘Undertaking potentially dangerous farm activities with-out someone knowing where you are’. Similarly farmerscommonly must operate in close vicinity of recentlycalved cows in order to comply with regulations requir-ing calves to be tagged within a few days of birth. Theapparent acceptance of such risks (type 3 domains ofrisk) is a concern but since decisions that presentedhealth & safety risks were perceived amongst the riskiestchoices the results indicate there is a good level of health& safety awareness. Consequently, while education remainsessential, this study suggests that other approaches arelikely to be required if the annual level of agriculture rela-ted fatalities, which has changed little in more than tenyears, is to be improved (the average rate of fatality per100,000 workers was 9.2 for the five years to 2002/3 andaveraged 9.9 for the five year period to 2012/13 (HSC,2001; HSE, 2014, 2004, 2003, 2002).
A mixture modelling approach of the data collected iscurrently being undertaken to explore the domains andassociated risky choices in greater depth, including issuesassociated with the fact that many risky choices cannotreadily be assigned to a single domain. A key question inthis work is whether the assumed domain structure accu-rately describes that perceived by farmers. In addition,further investigation of relationships between farm-farmhousehold factors and risk preferences is planned since,
arguably, more may have been expected than were foundin this analysis.
Confirmation that farmers hold heterogeneous, ascompared to constant, risk preferences opens new resea-rch pathways for those interested in improving policyeffectiveness and potential responses of farmer managersto changes in their operating environment. Specifically,where decision choices are holistically being examinedthe inclusion of heterogeneous risk preferences may improvethe explanatory and/or predictive power of models, parti-cularly in cases where balancing multiple and competinggoals strongly feature.
About the authors
Catherine Milne leads the Farm Management ResearchTeam at SRUC. The focus of her current research isfarmer decision making and supporting the adoption ofinnovations, particularly with respect to improving ani-mal health.
Jiayi Liu is a statistician working at Biomathematicsand Statistics Scotland, primarily in the area of social-economic applications. She provides statistical supportto academics from our partner institutes and to membersof EPIC- the Scottish Government's Centre of Expertiseon Animal Disease Outbreaks.
Adam Butler is a senior statistician with Biomathematicsand Statistics Scotland, who works primarily on theapplication of statistical methods to applied problems inecology, environmental science and agriculture, and onthe development of novel statistical methodologies todeal with problems that arise in these areas.
Acknowledgement
The authors are grateful to the funding support for thisstudy from both Scottish Government (Scottish Govern-ment Rural Affairs and the Environment Portfolio Stra-tegic Research Programme 2011–2016) and the AppliedQualitative Methods in Economics Network (AQMeN).We would also like to thank the many farmers, SRUCconsultants and Dr Paul Norris (Edinburgh University)for all their help with the study.
5. References
Agresti, A. (2002). Categorical data analysis, Second. ed, Wileyseries in probability and statistics. Wiley, New Jersey.
Akaike, H. (1973). Information theory and an extension of themaximum likelihood principle, in: Petrov, B.N., and Csaki,B.F. (Eds.), Second International Symposium on InformationTheory. Budapest, pp. 267–281.
Allen, I.E. and Seaman, C.A. (2007). Likert scales and dataanalysis. Quality Progress, 40, 64–65.
Arribas, I., Louhichi, K., Perni, A., Vila, J. and Gomez-y-Paloma,S. (2017). Modelling Farmers’ Behaviour Toward Risk in aLarge Scale Positive Mathematical Programming (PMP)Model, in: Tsounis, N and Vlachve, A (Eds.), Advancesin Applied Economic Research: Proceedings of the 2016International Conference on Applied Economics. Springer,Cham, Nicosia, pp. 625–643. https://doi.org/10.1007/978-3-319-48454-9_42
Blais, A.R. and Weber, E. (2006). A Domain-Specific Risk-Taking (DOSPERT) scale for adult populations. Judgementand Decision Making, 1, 33–47. https://doi.org/10.1037/t13084-000
International Journal of Agricultural Management, Volume 7 Issue 1 ISSN 2047-3710& 2018 International Farm Management Association and Institute of Agricultural Management 65
Catherine E. Milne et al. Not all risks are equal
Burton, R.J.F. (2006). An alternative to farmer age as an indi-cator of life-cycle stage: The case for a farm family ageindex. Journal of Rural Studies, 22, 485–492. https://doi.org/10.1016/j.jrurstud.2006.02.005
Burton, R.J.F. (2004). Reconceptualising the ‘‘behaviouralapproach’’ in agricultural studies: a socio-psychologicalperspective. Journal of Rural Studies, 20, 359–371.
Christensen, R.H.B. (2015). Ordinal: Regression Models forOrdinal Data [R package ordinal version 2015.6-28]. URLhttps://cran.r-project.org/web/packages/ordinal/index.html (accessed 3.7.18).
Edwards-Jones, G. (2006). Modelling farmer decision-making:concepts, progress and challenges. Animal Science, 82,783–790. https://doi.org/10.1017/ASC2006112
Gasson, R. (1973). Goals and values of farmers. Journal ofAgricultural Economics, 24, 521–524. https://doi.org/10.1111/j.1477-9552.1973.tb00952.x
Hamilton-Webb, A., Manning, L., Naylor, R. and Conway, J.(2017). The relationship between risk experience and riskresponse: a study of farmers and climate change. Journalof Risk Research, 20, 1379–1393. https://doi.org/10.1080/13669877.2016.1153506
Hansson, H. and Lagerkvist, C.J. (2012). Measuring farmers’preferences for risk: a domain-specific risk preference scale.Journal of Risk Research, 15, 737–753. https://doi.org/10.1080/13669877.2012.657217
Hardaker, J.B. and Lien, G. (2010). Probabilities for decisionanalysis in agriculture and rural resource economics: Theneed for a paradigm change. Agricultural Systems, 103,345–350.
HSC. (2001). Health and safety statistics 2000/01. HMSO,Norwich.
HSE. (2014). Health and safety in agriculture in Great Britain2014.
HSE. (2004). Health and safety statistics highlights 2003/4.HSE. (2003). Health and safety statistics highlights 2002/3.HSE. (2002). Basic guide to the Control of Substances Hazar-
dous to Health (COSHH) Regulations.Jones, J.W., Antle, J.M., Basso, B., Boote, K.J., Conant, R.T.,
Foster, I., Godfray, H.C.J., Herrero, M., Howitt, R.E., Jans-sen, S., Keating, B.A., Munoz-Carpena, R., Porter, C.H.,Rosenzweig, C. and Wheeler, T.R. (2017). Toward a newgeneration of agricultural system data, models, and knowl-edge products: State of agricultural systems science. Agri-cultural Systems, 155, 269–288. https://doi.org/10.1016/J.AGSY.2016.09.021
Lindsay, S., Selvaraj, S., Macdonald, J.W. and Godden, D.J.(2004). Injuries to Scottish farmers while tagging and clippingcattle: a cross-sectional survey. Occupational Medicine (Chic.Ill), 54, 86–91. https://doi.org/10.1093/occmed/kqh032
Liu, Y., Langemeier, M.R., Small, I.M., Joseph, L. and Fry, W.E.(2017). Risk Management Strategies using Precision Agri-culture Technology to Manage Potato Late Blight. AgronomyJournal, 109, 562. https://doi.org/10.2134/agronj2016.07.0418
Mase, A.S., Gramig, B.M. and Prokopy, L.S. (2017). Climatechange beliefs, risk perceptions, and adaptation behavioramong Midwestern U.S. crop farmers. Climate Risk Man-agement, 15, 8–17. https://doi.org/10.1016/J.CRM.2016.11.004
McCullagh, P. (1980). Regression models for ordinal data.Jounal of the Royal Statistics Society B, 42, 109–142.
Mosnier, C., Duclos, A., Agabriel, J. and Gac, A. (2017). Orfee: Abio-economic model to simulate integrated and intensivemanagement of mixed crop-livestock farms and their green-house gas emissions. Agricultural Systems, 157, 202–215.https://doi.org/10.1016/J.AGSY.2017.07.005
OECD. (2009). Managing Risk in Agriculture. A hollistic approach.OECD Publishing.
Ohlmer, B., Olson, K. and Brehmer, B. (1998). Understandingfarmers’ decision making processes and improving man-agerial assistance. Agricultural Economics, 18, 273–290.https://doi.org/10.1016/S0169-5150(97)00052-2
Paulson, N., Schnitkey, G. and Kelly, P. (2016). Evaluating themarginal risk management benefits of the supplementalcoverage option. Agricultural Finance Review, 76, 411–424.https://doi.org/10.1108/AFR-03-2016-0022
Rehman, T., Garforth, C., McKerney, K., Yates, C. and Rana, R.(2008). Farmers’ behavioural inclinations and their influcenceon the anticipated response to the reform of the CommonAgricultural Policy in England. Journal of Farm Management13, 1–29.
Schwarz, G.E. (1978). Estimating the dimension of a model.Annuls of Statistics, 6, 461–464. https://doi.org/10.1214/aos/1176344136
Scottish Parliament. (2011). Historic Environment (Amendment)(Scotland) Act 2011. Statute Law Database.
Scottish Parliament. (2004). Nature Conservation (Scotland) Act2004. Statute Law Database.
Shove, E. (2010). Beyond the ABC: climate change policy andtheories of social change. Environment and Planning, A 42,1273–1285.
Slovic, P. (1987). Perception of risk. Science, 80, 236, 280–285.https://doi.org/10.1126/science.3563507
The Royal Society. (1992). Risk: analysis, perception and man-agement. The Royal Society, London.
Theuvsen, L. (2013). Risk and Risk management in Agriculture.Problems of World Agriculture, 28, 162–174.
Tutz, G. and Hennevogl, W. (1996). Random effects in ordinalregression models. Computational Statistics and DataAnalysis, 22, 537–557. https://doi.org/10.1016/0167-9473(96)00004-7
Tversky, A. and Kahneman, D. (1974). Judgment under Uncer-tainty: Heuristics and Biases. Science New Series, 185,1124–1131.
Weber, E.U., Blais, A.R. and Betz, N.E. (2002). A domain-specific risk-attitude scale: measuring risk perceptions andrisk behaviors. Journal of Behavioral Decision Making, 15,263–290.
Webster, J.P.H. (2003). New times, new challenges for farmmanagement. Farm Management, 11, 553–566.
Wilson, P. (2011). Decomposing variation in dairy profitability:the impact of output, inputs, prices, labour and manage-ment. Journal of Agricultural Science, 149, 507–517. https://doi.org/10.1017/S0021859610001176
Wilson, P., Harper, N. and Darling, R. (2013). Explaining variationin farm and farm business performance in respect to farmerbehavioural segmentation analysis: Implications for land usepolicies. Land Use Policy, 30, 147–156. https://doi.org/10.1016/J.LANDUSEPOL.2012.03.006
ISSN 2047-3710 International Journal of Agricultural Management, Volume 7 Issue 166 & 2018 International Farm Management Association and Institute of Agricultural Management
Not all risks are equal Catherine E. Milne et al.
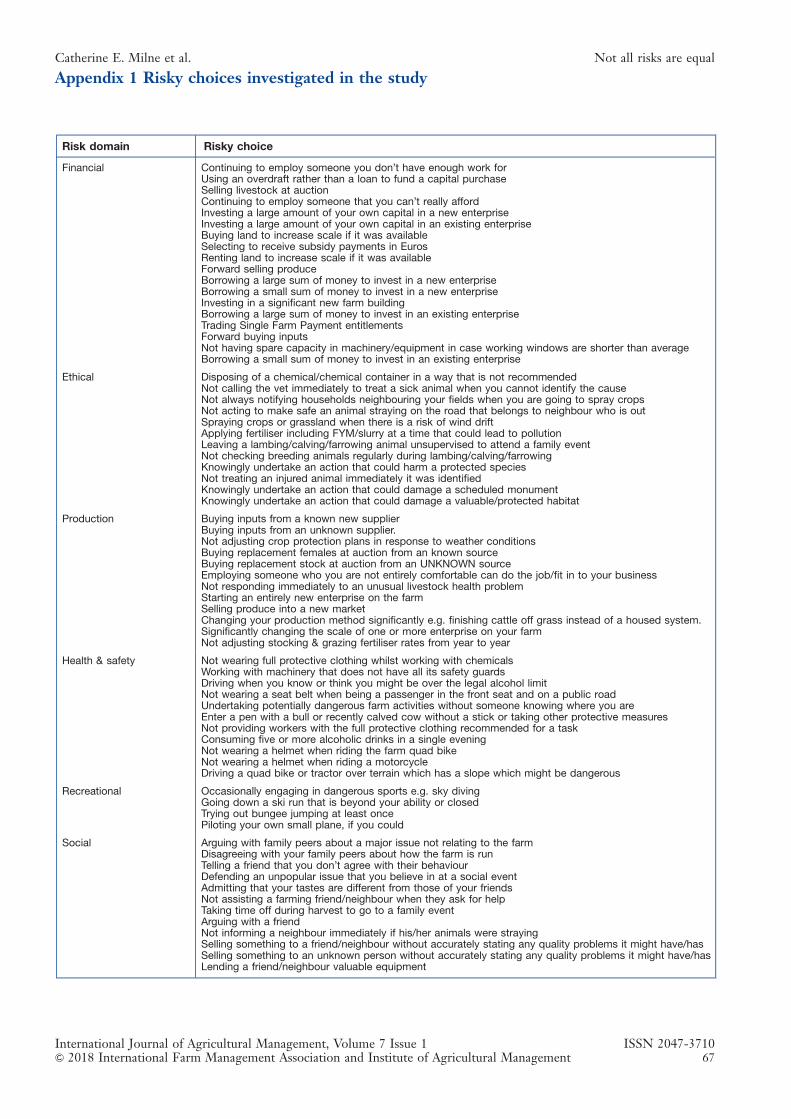
Appendix 1 Risky choices investigated in the study
Risk domain Risky choice
Financial Continuing to employ someone you don’t have enough work forUsing an overdraft rather than a loan to fund a capital purchaseSelling livestock at auctionContinuing to employ someone that you can’t really affordInvesting a large amount of your own capital in a new enterpriseInvesting a large amount of your own capital in an existing enterpriseBuying land to increase scale if it was availableSelecting to receive subsidy payments in EurosRenting land to increase scale if it was availableForward selling produceBorrowing a large sum of money to invest in a new enterpriseBorrowing a small sum of money to invest in a new enterpriseInvesting in a significant new farm buildingBorrowing a large sum of money to invest in an existing enterpriseTrading Single Farm Payment entitlementsForward buying inputsNot having spare capacity in machinery/equipment in case working windows are shorter than averageBorrowing a small sum of money to invest in an existing enterprise
Ethical Disposing of a chemical/chemical container in a way that is not recommendedNot calling the vet immediately to treat a sick animal when you cannot identify the causeNot always notifying households neighbouring your fields when you are going to spray cropsNot acting to make safe an animal straying on the road that belongs to neighbour who is outSpraying crops or grassland when there is a risk of wind driftApplying fertiliser including FYM/slurry at a time that could lead to pollutionLeaving a lambing/calving/farrowing animal unsupervised to attend a family eventNot checking breeding animals regularly during lambing/calving/farrowingKnowingly undertake an action that could harm a protected speciesNot treating an injured animal immediately it was identifiedKnowingly undertake an action that could damage a scheduled monumentKnowingly undertake an action that could damage a valuable/protected habitat
Production Buying inputs from a known new supplierBuying inputs from an unknown supplier.Not adjusting crop protection plans in response to weather conditionsBuying replacement females at auction from an known sourceBuying replacement stock at auction from an UNKNOWN sourceEmploying someone who you are not entirely comfortable can do the job/fit in to your businessNot responding immediately to an unusual livestock health problemStarting an entirely new enterprise on the farmSelling produce into a new marketChanging your production method significantly e.g. finishing cattle off grass instead of a housed system.Significantly changing the scale of one or more enterprise on your farmNot adjusting stocking & grazing fertiliser rates from year to year
Health & safety Not wearing full protective clothing whilst working with chemicalsWorking with machinery that does not have all its safety guardsDriving when you know or think you might be over the legal alcohol limitNot wearing a seat belt when being a passenger in the front seat and on a public roadUndertaking potentially dangerous farm activities without someone knowing where you areEnter a pen with a bull or recently calved cow without a stick or taking other protective measuresNot providing workers with the full protective clothing recommended for a taskConsuming five or more alcoholic drinks in a single eveningNot wearing a helmet when riding the farm quad bikeNot wearing a helmet when riding a motorcycleDriving a quad bike or tractor over terrain which has a slope which might be dangerous
Recreational Occasionally engaging in dangerous sports e.g. sky divingGoing down a ski run that is beyond your ability or closedTrying out bungee jumping at least oncePiloting your own small plane, if you could
Social Arguing with family peers about a major issue not relating to the farmDisagreeing with your family peers about how the farm is runTelling a friend that you don’t agree with their behaviourDefending an unpopular issue that you believe in at a social eventAdmitting that your tastes are different from those of your friendsNot assisting a farming friend/neighbour when they ask for helpTaking time off during harvest to go to a family eventArguing with a friendNot informing a neighbour immediately if his/her animals were strayingSelling something to a friend/neighbour without accurately stating any quality problems it might have/hasSelling something to an unknown person without accurately stating any quality problems it might have/hasLending a friend/neighbour valuable equipment
International Journal of Agricultural Management, Volume 7 Issue 1 ISSN 2047-3710& 2018 International Farm Management Association and Institute of Agricultural Management 67
Catherine E. Milne et al. Not all risks are equal
REFEREED ARTICLEDOI: 10.5836/ijam/2018-07-68
PerfCuma: A framework to managethe sustainable development of
small cooperativesPHILIPPE JEANNEAUX1*, MATHIEU CAPITAINE1 and ANAIS MAUCLAIR1
ABSTRACTAgricultural cooperatives evolve in a context with complexity and changes of their legal, social and businessenvironment. Strategic management could be a relevant approach to help cooperative members to improvethe global performance and the social responsibility of their cooperatives. To formalize and to managetheir strategy, we propose as an accompaniment a method entitled PerfCuma. The theoretical frameworkis based on the concept of systemic approach to change. The method is organized in four steps: i) an in-depthstakeholder’s analysis of the cooperative situation (including sustainability) and the cooperative goals;ii) formalizing the strategy by defining strategic lines. We use the cognitive map approach to model thecomplexity to understand the strong drivers of the strategy; iii) drawing up the balanced scorecard and anaction plan to manage the strategy; iv) monitoring the implementation of the strategy. A test of the methodon five Cooperatives for the Use of Agricultural Equipment (Cuma) has been successful. The method isnow unfolded in France.
KEYWORDS: strategic management; causal map; balanced scorecard; cooperative; systemic approach to change;Corporate social responsibility
1. Introduction
For 40 years in France, the prices of agricultural com-modities have been falling at an annual rate of close to2% in constant euros. At the same time, French farmershave produced more. Production has increased in volumeby just under 25% (from 1980 to 2014) thanks to cropproduction (Insee.fr: Annual national accounts). But thisgrowth has not been enough to stop the downward trendin French total agricultural income. There has been adownward trend in the value of farm production (fromIndex 100 in 1980 to Index 78 in 2013), whereas thevalue of farm expenditure has been constant (from Index100 in 1980 to Index 100 in 2013). Nevertheless, theagricultural income per farmer has increased over thisperiod (from Index 100 in 1980 to Index 160 in 2013).Farmers have succeeded in improving their income perworker because they have developed their competitiveadvantage through a cost leadership strategy (Porter,2008). To reduce their production costs, farmers havedeveloped numerous methods, such as specialization,extension, and modernization, to increase labour pro-ductivity (from Index 100 in 1980 to 306 in 2013). Theirmain objective has been to fight against the decreasingFrench total agricultural income. The number of farmershas dramatically decreased over the last 40 years. Theyhave specialized their farms and organized regrouping
of land. In 40 years farm land per worker has risen bynearly three times. In this context agricultural produc-tion is becoming increasingly complex. Farm sizes haveincreased, and this phenomenon has been accompaniedby a saturation of working capacity (Madelrieux andDedieu, 2008). In order to produce more with fewerworkers, farmers have continued to invest in their fixedassets over the last 40 years. The French gross fixedcapital (GFCF) consists of fixed asset acquisitions andcorresponds to an investment of about 10 billion eurosa year. Because technologies and assets are costly,farmers try to pool their agricultural equipment toreduce their average production costs. In France, for along time, many farmers have joined cooperatives toshare use of agricultural equipment (Cuma). There are13,000 Cumas in France, and one in two farmers is amember (225,000 farmers are involved in this kind ofcooperative). The Cuma gathers farmers together tobuy agricultural equipment, to obtain specific subsidies,to improve their competitiveness, and to organize theirwork for higher efficiency. Every type of farmer is involvedin these cooperatives. However, the biggest farms, thosewhich have chosen the legal status of company, and thosewhose managers are under 50 years of age, are moreinvolved in Cumas.
Meanwhile, due to environmental, health, and eco-nomic crises, the supervision of agricultural production
1Universite Clermont Auvergne, VetAgro Sup, UMR Territoires, F-63170 Aubiere, France.
*Corresponding author: Email: [email protected].
Original submitted April 19 2018; accepted April 19 2018.
ISSN 2047-3710 International Journal of Agricultural Management, Volume 7 Issue 168 & 2018 International Farm Management Association and Institute of Agricultural Management
by the public authorities has intensified. Farms are fac-ing rapid changes in the Common Agricultural Policy(CAP) 1 with the reorientation of first pillar subsidies tothe second pillar, and the gradual disappearance of sup-port mechanisms and market regulation. The supervisionof farms by upstream and downstream actors2 has alsoincreased, especially with the strengthening of specifica-tions and regulations in relation to production, and theconsolidation of contractual relationships between pro-ducers and collectors/processors. Farmers are operatingin an increasingly competitive environment, one fromwhich they had previously been relatively protected.Just as happened in the industrial sector, farms may beforced to progressively improve their technical, economic,environmental, and social performance in order to main-tain their activity (Pretty, 2008); (Darnhofer et al., 2010).Cooperatives for the use of agricultural equipment (Cuma)can help them to meet these challenges. The complexcompetitive environment poses a number of issues forboth cooperative members and the advisors supportingthem: how to obtain and maintain competitive advan-tage; how to integrate new developments into everyday business activities; and how to develop the capacityto guarantee a response to downstream demand whilemaintaining or improving the performance level, espe-cially in the case of a Cuma and its member farms.The specific issue faced by Cumas is to define andimplement a collective, shared, and structured strategy.The challenge is to create new collective capabilities tohelp cooperative members to remain viable and sustain-able, i.e. to be able to cope with their changing andcomplex environment.
These issues are typically addressed by business man-agement specialists in terms of strategic management andstrategy of the firm. The challenge is to have a commonapproach and a management tool to implement andto control the strategy (Freeman, 2010); (Kaplan andNorton, 1996); (Stacey, 2007). The strategic managementapproach remains marginal and is poorly developed infarms and Cumas in France. Often, if it exists, it is notorganized and not formalized. The Cuma is a specificcooperative, generally without professional staff becauseit is small: from 4 to 60 members (average 25 members)with a turnover of between h10,000 and h200,000 (averageh49,000). Although marginal from an economic point ofview, Cumas have major implications for the competi-tiveness of farms. We assume that strategic managementcould be a relevant approach to help farmers to managetheir Cuma, to improve its overall performance, and thusthe overall performance of the Cuma.
In France, few original studies of farm managementand Cuma management have been carried out in the areaof management science (Jeanneaux and Blasquiet-Revol,2012), while a large body of literature exists in the Englishlanguage on strategic management as it applies tofarming: For example, 15 handbooks dealing with farmmanagement have been published since the early 1980s
(Barnard and Nix, 1979, Kay, 1986, Turner and Taylor,1998, Casavant and Infanger, 1999, Olson, 2004), but noFrench farm management handbook has addressed farmmanagement as a continuous process (planning, imple-mentation, control, action). French farm managementacademics have ignored this literature for the last 30 yearsand have not published in the English language. Agri-cultural economics is more developed in France thanFarm management science, especially because the FrenchNational Institute for Agricultural Research (INRA)has paid less attention to this subject. In France, farmmanagement has been largely influenced by economicconcepts. Even today, farm management methods arebased on an economic diagnosis using a comparativebenchmarking analysis between farms. The best farmsare considered to be those which are the most profitable,based on the assumption that farmers are only motivatedby profit with a substantive rationality (Simon, 1982).The objective of the present French system is to iden-tify the factors which explain how to be more profit-able, and to give advice to use these levers (Chombartde Lauwe et al., 1969). Of course, other approachesconsider farmers as agents with bounded rationalitywho try to obtain a situation that is not Pareto optimal(Simon, 1982). In reality farmers can have numerousgoals, which are in competition with each other, andthe advisor in a systemic approach has to make a dia-gnosis of the whole farm to understand how to helpthe farmer to be satisfied (Marshall et al., 1994). Theseapproaches based on diagnosis are static, use historicaland obsolete data, and are not designed to help farmersto be more adaptive. A notable exception in Franceis Hémidy et al., (1996) who, in the mid-1990s, pro-posed the implementation of a strategic managementapproach in farming.
To develop strategic management in farming, the chal-lenge is to be able to give advisors the ability to initiateand support farmers in their development of strategy.
The objective and originality of this paper is to presentthe outline of a methodological framework to assist inthe implementation of strategic management within Cumasin a complex world where sustainable development is amain issue; in other words, to help cooperative membersto formalize and to manage a strategy in order to bemore sustainable and more resilient.
As Bossel and the Balaton group consider (Bossel,1999; Bossel 2000): ‘‘Human society is a complex adaptivesystem embedded in another complex adaptive system - thenatural environment - on which it depends for support.These systems coevolve in mutual interaction, and theyeach consist of a myriad of subsystems that coevolve inmutual interaction. There is permanent change and evolu-tion. Moreover, this ability for change and evolution mustbe maintained if the systems are to remain viable (ableto cope with their changing system environment) and sus-tainable. The sustainability goal translates more accuratelyinto a goal of sustainable development’’.
Sustainability is a dynamic concept. Societies and theirenvironments change, technologies and cultures change,values and aspirations change, and a sustainable societymust allow and sustain such change, i.e. it must allowcontinuous, viable, and vigorous development, which iswhat we mean by sustainable development.
This methodological framework has been developedas part of 2 research projects named PerfEA (i.e. overall
1 The EU’s Common Agricultural Policy (CAP) is the system of agricultural subsidies and
programmes. It covers farming, environmental measures and rural development, and
controls EU agricultural markets. It is the EU’s single largest common policy and accounts
for over 40% of the entire EU budget. Since 2003, the CAP has been divided into two
‘Pillars’: production support and rural development.2Upstream actors correspond to agricultural input (fertilizers, pesticides, concentratesy)
suppliers. Downstream actors correspond to agricultural commodities processors and/or
purchasers (dairy and cheese processors, millers, slaughterersy). Upstream and down-
stream actors are often the same and have a lot of influence on farmers’ decision.
International Journal of Agricultural Management, Volume 7 Issue 1 ISSN 2047-3710& 2018 International Farm Management Association and Institute of Agricultural Management 69
Philippe Jeanneaux et al. PerfCuma: A framework to manage small cooperatives
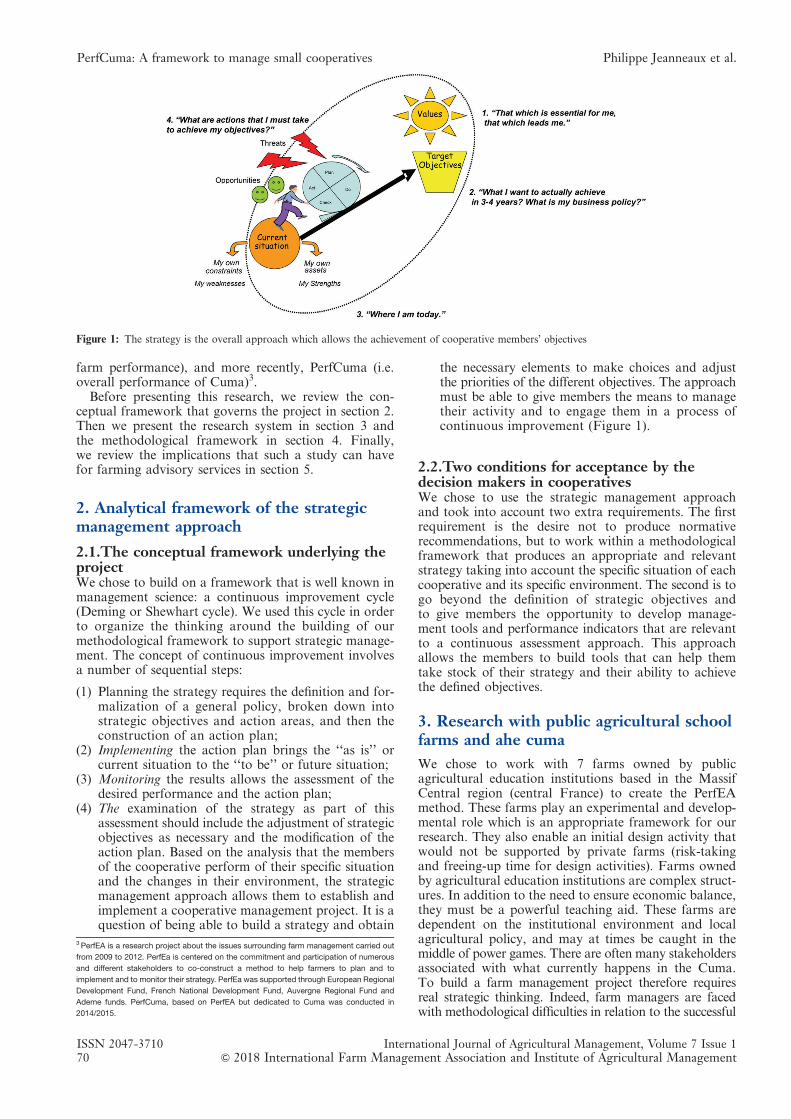
farm performance), and more recently, PerfCuma (i.e.overall performance of Cuma)3.
Before presenting this research, we review the con-ceptual framework that governs the project in section 2.Then we present the research system in section 3 andthe methodological framework in section 4. Finally,we review the implications that such a study can havefor farming advisory services in section 5.
2. Analytical framework of the strategicmanagement approach
2.1.The conceptual framework underlying theprojectWe chose to build on a framework that is well known inmanagement science: a continuous improvement cycle(Deming or Shewhart cycle). We used this cycle in orderto organize the thinking around the building of ourmethodological framework to support strategic manage-ment. The concept of continuous improvement involvesa number of sequential steps:
(1) Planning the strategy requires the definition and for-malization of a general policy, broken down intostrategic objectives and action areas, and then theconstruction of an action plan;
(2) Implementing the action plan brings the ‘‘as is’’ orcurrent situation to the ‘‘to be’’ or future situation;
(3) Monitoring the results allows the assessment of thedesired performance and the action plan;
(4) The examination of the strategy as part of thisassessment should include the adjustment of strategicobjectives as necessary and the modification of theaction plan. Based on the analysis that the membersof the cooperative perform of their specific situationand the changes in their environment, the strategicmanagement approach allows them to establish andimplement a cooperative management project. It is aquestion of being able to build a strategy and obtain
the necessary elements to make choices and adjustthe priorities of the different objectives. The approachmust be able to give members the means to managetheir activity and to engage them in a process ofcontinuous improvement (Figure 1).
2.2.Two conditions for acceptance by thedecision makers in cooperativesWe chose to use the strategic management approachand took into account two extra requirements. The firstrequirement is the desire not to produce normativerecommendations, but to work within a methodologicalframework that produces an appropriate and relevantstrategy taking into account the specific situation of eachcooperative and its specific environment. The second is togo beyond the definition of strategic objectives andto give members the opportunity to develop manage-ment tools and performance indicators that are relevantto a continuous assessment approach. This approachallows the members to build tools that can help themtake stock of their strategy and their ability to achievethe defined objectives.
3. Research with public agricultural schoolfarms and ahe cuma
We chose to work with 7 farms owned by publicagricultural education institutions based in the MassifCentral region (central France) to create the PerfEAmethod. These farms play an experimental and develop-mental role which is an appropriate framework for ourresearch. They also enable an initial design activity thatwould not be supported by private farms (risk-takingand freeing-up time for design activities). Farms ownedby agricultural education institutions are complex struct-ures. In addition to the need to ensure economic balance,they must be a powerful teaching aid. These farms aredependent on the institutional environment and localagricultural policy, and may at times be caught in themiddle of power games. There are often many stakeholdersassociated with what currently happens in the Cuma.To build a farm management project therefore requiresreal strategic thinking. Indeed, farm managers are facedwith methodological difficulties in relation to the successful
Figure 1: The strategy is the overall approach which allows the achievement of cooperative members’ objectives
3 PerfEA is a research project about the issues surrounding farm management carried out
from 2009 to 2012. PerfEa is centered on the commitment and participation of numerous
and different stakeholders to co-construct a method to help farmers to plan and to
implement and to monitor their strategy. PerfEa was supported through European Regional
Development Fund, French National Development Fund, Auvergne Regional Fund and
Ademe funds. PerfCuma, based on PerfEA but dedicated to Cuma was conducted in
2014/2015.
ISSN 2047-3710 International Journal of Agricultural Management, Volume 7 Issue 170 & 2018 International Farm Management Association and Institute of Agricultural Management
PerfCuma: A framework to manage small cooperatives Philippe Jeanneaux et al.
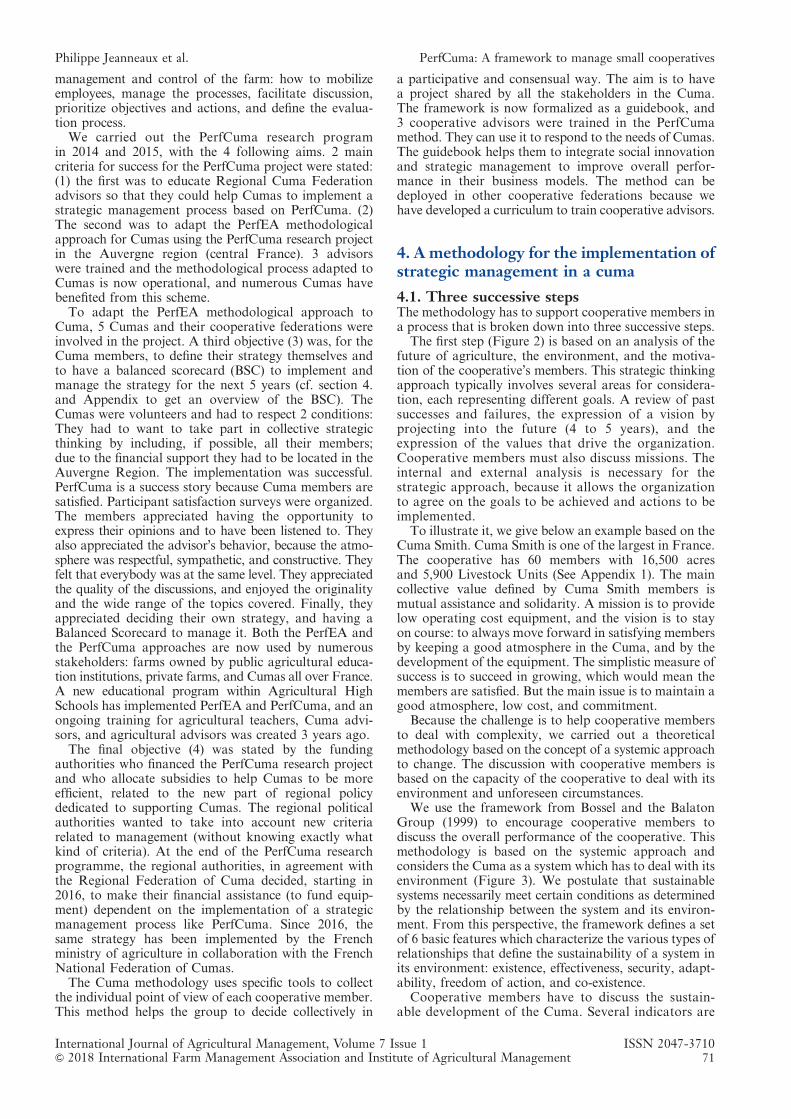
management and control of the farm: how to mobilizeemployees, manage the processes, facilitate discussion,prioritize objectives and actions, and define the evalua-tion process.
We carried out the PerfCuma research programin 2014 and 2015, with the 4 following aims. 2 maincriteria for success for the PerfCuma project were stated:(1) the first was to educate Regional Cuma Federationadvisors so that they could help Cumas to implement astrategic management process based on PerfCuma. (2)The second was to adapt the PerfEA methodologicalapproach for Cumas using the PerfCuma research projectin the Auvergne region (central France). 3 advisorswere trained and the methodological process adapted toCumas is now operational, and numerous Cumas havebenefited from this scheme.
To adapt the PerfEA methodological approach toCuma, 5 Cumas and their cooperative federations wereinvolved in the project. A third objective (3) was, for theCuma members, to define their strategy themselves andto have a balanced scorecard (BSC) to implement andmanage the strategy for the next 5 years (cf. section 4.and Appendix to get an overview of the BSC). TheCumas were volunteers and had to respect 2 conditions:They had to want to take part in collective strategicthinking by including, if possible, all their members;due to the financial support they had to be located in theAuvergne Region. The implementation was successful.PerfCuma is a success story because Cuma members aresatisfied. Participant satisfaction surveys were organized.The members appreciated having the opportunity toexpress their opinions and to have been listened to. Theyalso appreciated the advisor’s behavior, because the atmo-sphere was respectful, sympathetic, and constructive. Theyfelt that everybody was at the same level. They appreciatedthe quality of the discussions, and enjoyed the originalityand the wide range of the topics covered. Finally, theyappreciated deciding their own strategy, and having aBalanced Scorecard to manage it. Both the PerfEA andthe PerfCuma approaches are now used by numerousstakeholders: farms owned by public agricultural educa-tion institutions, private farms, and Cumas all over France.A new educational program within Agricultural HighSchools has implemented PerfEA and PerfCuma, and anongoing training for agricultural teachers, Cuma advi-sors, and agricultural advisors was created 3 years ago.
The final objective (4) was stated by the fundingauthorities who financed the PerfCuma research projectand who allocate subsidies to help Cumas to be moreefficient, related to the new part of regional policydedicated to supporting Cumas. The regional politicalauthorities wanted to take into account new criteriarelated to management (without knowing exactly whatkind of criteria). At the end of the PerfCuma researchprogramme, the regional authorities, in agreement withthe Regional Federation of Cuma decided, starting in2016, to make their financial assistance (to fund equip-ment) dependent on the implementation of a strategicmanagement process like PerfCuma. Since 2016, thesame strategy has been implemented by the Frenchministry of agriculture in collaboration with the FrenchNational Federation of Cumas.
The Cuma methodology uses specific tools to collectthe individual point of view of each cooperative member.This method helps the group to decide collectively in
a participative and consensual way. The aim is to havea project shared by all the stakeholders in the Cuma.The framework is now formalized as a guidebook, and3 cooperative advisors were trained in the PerfCumamethod. They can use it to respond to the needs of Cumas.The guidebook helps them to integrate social innovationand strategic management to improve overall perfor-mance in their business models. The method can bedeployed in other cooperative federations because wehave developed a curriculum to train cooperative advisors.
4. A methodology for the implementation ofstrategic management in a cuma
4.1. Three successive stepsThe methodology has to support cooperative members ina process that is broken down into three successive steps.
The first step (Figure 2) is based on an analysis of thefuture of agriculture, the environment, and the motiva-tion of the cooperative’s members. This strategic thinkingapproach typically involves several areas for considera-tion, each representing different goals. A review of pastsuccesses and failures, the expression of a vision byprojecting into the future (4 to 5 years), and theexpression of the values that drive the organization.Cooperative members must also discuss missions. Theinternal and external analysis is necessary for thestrategic approach, because it allows the organizationto agree on the goals to be achieved and actions to beimplemented.
To illustrate it, we give below an example based on theCuma Smith. Cuma Smith is one of the largest in France.The cooperative has 60 members with 16,500 acresand 5,900 Livestock Units (See Appendix 1). The maincollective value defined by Cuma Smith members ismutual assistance and solidarity. A mission is to providelow operating cost equipment, and the vision is to stayon course: to always move forward in satisfying membersby keeping a good atmosphere in the Cuma, and by thedevelopment of the equipment. The simplistic measure ofsuccess is to succeed in growing, which would mean themembers are satisfied. But the main issue is to maintain agood atmosphere, low cost, and commitment.
Because the challenge is to help cooperative membersto deal with complexity, we carried out a theoreticalmethodology based on the concept of a systemic approachto change. The discussion with cooperative members isbased on the capacity of the cooperative to deal with itsenvironment and unforeseen circumstances.
We use the framework from Bossel and the BalatonGroup (1999) to encourage cooperative members todiscuss the overall performance of the cooperative. Thismethodology is based on the systemic approach andconsiders the Cuma as a system which has to deal with itsenvironment (Figure 3). We postulate that sustainablesystems necessarily meet certain conditions as determinedby the relationship between the system and its environ-ment. From this perspective, the framework defines a setof 6 basic features which characterize the various types ofrelationships that define the sustainability of a system inits environment: existence, effectiveness, security, adapt-ability, freedom of action, and co-existence.
Cooperative members have to discuss the sustain-able development of the Cuma. Several indicators are
International Journal of Agricultural Management, Volume 7 Issue 1 ISSN 2047-3710& 2018 International Farm Management Association and Institute of Agricultural Management 71
Philippe Jeanneaux et al. PerfCuma: A framework to manage small cooperatives
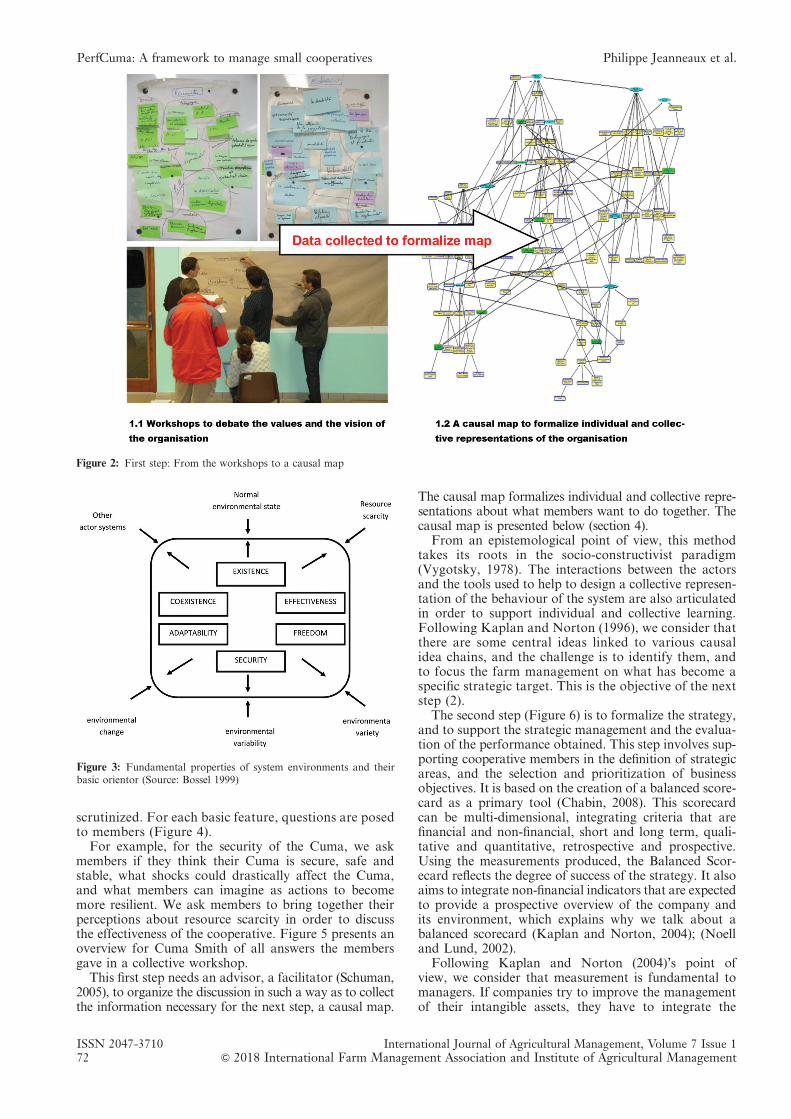
scrutinized. For each basic feature, questions are posedto members (Figure 4).
For example, for the security of the Cuma, we askmembers if they think their Cuma is secure, safe andstable, what shocks could drastically affect the Cuma,and what members can imagine as actions to becomemore resilient. We ask members to bring together theirperceptions about resource scarcity in order to discussthe effectiveness of the cooperative. Figure 5 presents anoverview for Cuma Smith of all answers the membersgave in a collective workshop.
This first step needs an advisor, a facilitator (Schuman,2005), to organize the discussion in such a way as to collectthe information necessary for the next step, a causal map.
The causal map formalizes individual and collective repre-sentations about what members want to do together. Thecausal map is presented below (section 4).
From an epistemological point of view, this methodtakes its roots in the socio-constructivist paradigm(Vygotsky, 1978). The interactions between the actorsand the tools used to help to design a collective represen-tation of the behaviour of the system are also articulatedin order to support individual and collective learning.Following Kaplan and Norton (1996), we consider thatthere are some central ideas linked to various causalidea chains, and the challenge is to identify them, andto focus the farm management on what has become aspecific strategic target. This is the objective of the nextstep (2).
The second step (Figure 6) is to formalize the strategy,and to support the strategic management and the evalua-tion of the performance obtained. This step involves sup-porting cooperative members in the definition of strategicareas, and the selection and prioritization of businessobjectives. It is based on the creation of a balanced score-card as a primary tool (Chabin, 2008). This scorecardcan be multi-dimensional, integrating criteria that arefinancial and non-financial, short and long term, quali-tative and quantitative, retrospective and prospective.Using the measurements produced, the Balanced Scor-ecard reflects the degree of success of the strategy. It alsoaims to integrate non-financial indicators that are expectedto provide a prospective overview of the company andits environment, which explains why we talk about abalanced scorecard (Kaplan and Norton, 2004); (Noelland Lund, 2002).
Following Kaplan and Norton (2004)’s point ofview, we consider that measurement is fundamental tomanagers. If companies try to improve the managementof their intangible assets, they have to integrate the
Figure 3: Fundamental properties of system environments and theirbasic orientor (Source: Bossel 1999)
Figure 2: First step: From the workshops to a causal map
ISSN 2047-3710 International Journal of Agricultural Management, Volume 7 Issue 172 & 2018 International Farm Management Association and Institute of Agricultural Management
PerfCuma: A framework to manage small cooperatives Philippe Jeanneaux et al.
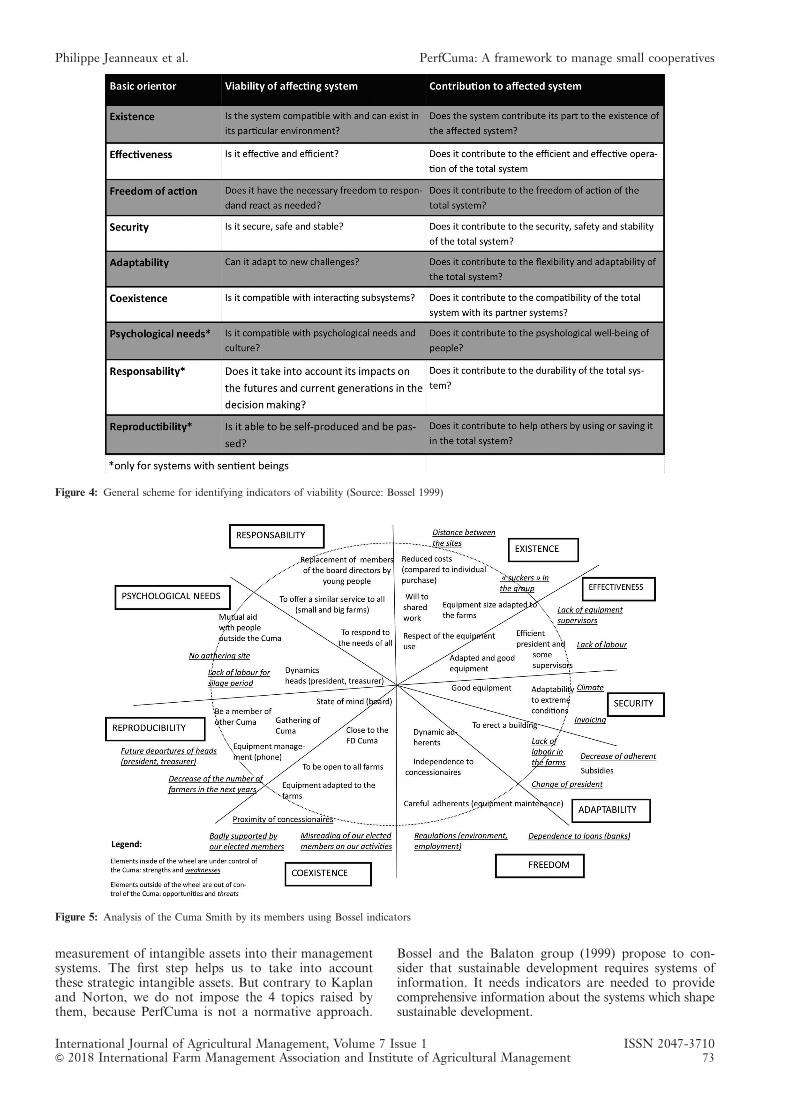
measurement of intangible assets into their managementsystems. The first step helps us to take into accountthese strategic intangible assets. But contrary to Kaplanand Norton, we do not impose the 4 topics raised bythem, because PerfCuma is not a normative approach.
Bossel and the Balaton group (1999) propose to con-sider that sustainable development requires systems ofinformation. It needs indicators are needed to providecomprehensive information about the systems which shapesustainable development.
Figure 4: General scheme for identifying indicators of viability (Source: Bossel 1999)
Figure 5: Analysis of the Cuma Smith by its members using Bossel indicators
International Journal of Agricultural Management, Volume 7 Issue 1 ISSN 2047-3710& 2018 International Farm Management Association and Institute of Agricultural Management 73
Philippe Jeanneaux et al. PerfCuma: A framework to manage small cooperatives
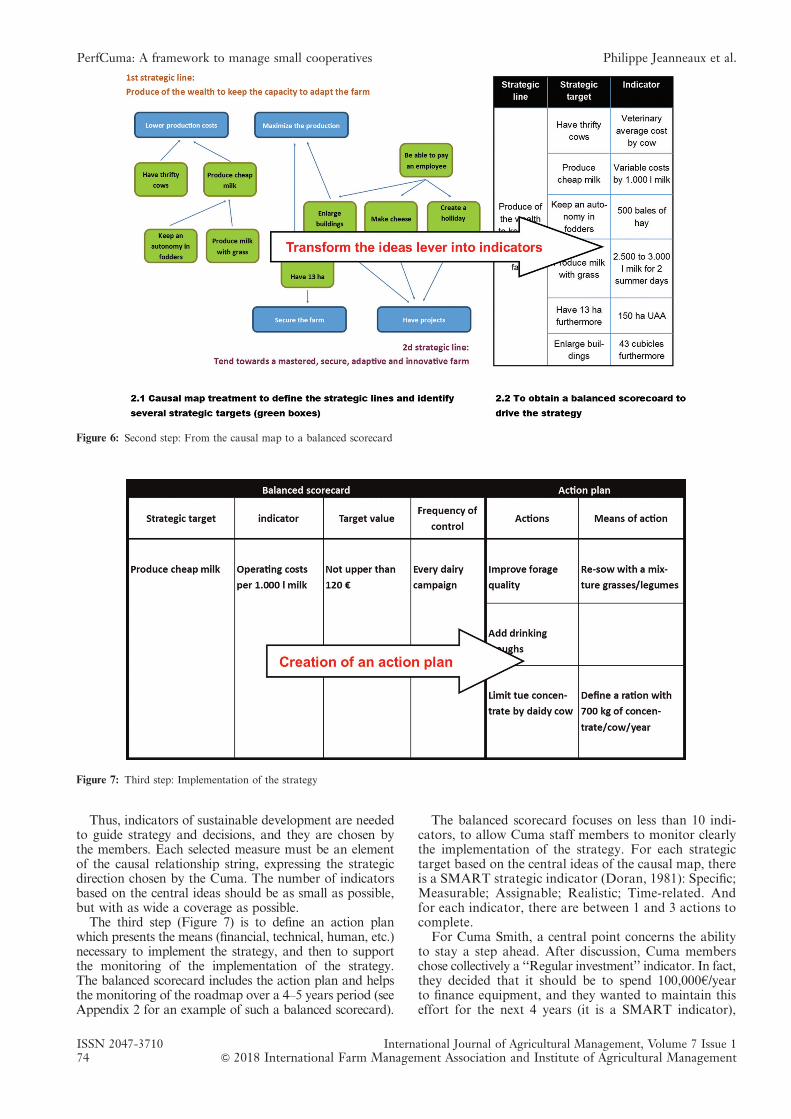
Thus, indicators of sustainable development are neededto guide strategy and decisions, and they are chosen bythe members. Each selected measure must be an elementof the causal relationship string, expressing the strategicdirection chosen by the Cuma. The number of indicatorsbased on the central ideas should be as small as possible,but with as wide a coverage as possible.
The third step (Figure 7) is to define an action planwhich presents the means (financial, technical, human, etc.)necessary to implement the strategy, and then to supportthe monitoring of the implementation of the strategy.The balanced scorecard includes the action plan and helpsthe monitoring of the roadmap over a 4–5 years period (seeAppendix 2 for an example of such a balanced scorecard).
The balanced scorecard focuses on less than 10 indi-cators, to allow Cuma staff members to monitor clearlythe implementation of the strategy. For each strategictarget based on the central ideas of the causal map, thereis a SMART strategic indicator (Doran, 1981): Specific;Measurable; Assignable; Realistic; Time-related. Andfor each indicator, there are between 1 and 3 actions tocomplete.
For Cuma Smith, a central point concerns the abilityto stay a step ahead. After discussion, Cuma memberschose collectively a ‘‘Regular investment’’ indicator. In fact,they decided that it should be to spend 100,000h/yearto finance equipment, and they wanted to maintain thiseffort for the next 4 years (it is a SMART indicator),
Figure 6: Second step: From the causal map to a balanced scorecard
Figure 7: Third step: Implementation of the strategy
ISSN 2047-3710 International Journal of Agricultural Management, Volume 7 Issue 174 & 2018 International Farm Management Association and Institute of Agricultural Management
PerfCuma: A framework to manage small cooperatives Philippe Jeanneaux et al.
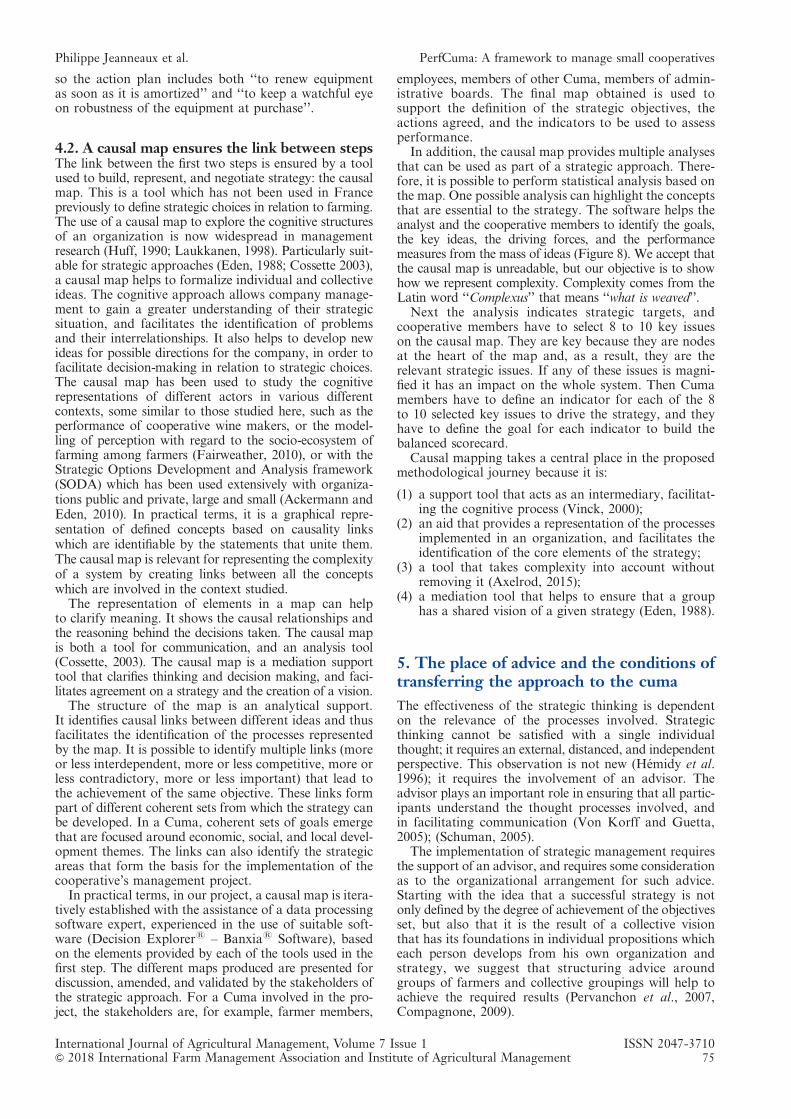
so the action plan includes both ‘‘to renew equipmentas soon as it is amortized’’ and ‘‘to keep a watchful eyeon robustness of the equipment at purchase’’.
4.2. A causal map ensures the link between stepsThe link between the first two steps is ensured by a toolused to build, represent, and negotiate strategy: the causalmap. This is a tool which has not been used in Francepreviously to define strategic choices in relation to farming.The use of a causal map to explore the cognitive structuresof an organization is now widespread in managementresearch (Huff, 1990; Laukkanen, 1998). Particularly suit-able for strategic approaches (Eden, 1988; Cossette 2003),a causal map helps to formalize individual and collectiveideas. The cognitive approach allows company manage-ment to gain a greater understanding of their strategicsituation, and facilitates the identification of problemsand their interrelationships. It also helps to develop newideas for possible directions for the company, in order tofacilitate decision-making in relation to strategic choices.The causal map has been used to study the cognitiverepresentations of different actors in various differentcontexts, some similar to those studied here, such as theperformance of cooperative wine makers, or the model-ling of perception with regard to the socio-ecosystem offarming among farmers (Fairweather, 2010), or with theStrategic Options Development and Analysis framework(SODA) which has been used extensively with organiza-tions public and private, large and small (Ackermann andEden, 2010). In practical terms, it is a graphical repre-sentation of defined concepts based on causality linkswhich are identifiable by the statements that unite them.The causal map is relevant for representing the complexityof a system by creating links between all the conceptswhich are involved in the context studied.
The representation of elements in a map can helpto clarify meaning. It shows the causal relationships andthe reasoning behind the decisions taken. The causal mapis both a tool for communication, and an analysis tool(Cossette, 2003). The causal map is a mediation supporttool that clarifies thinking and decision making, and faci-litates agreement on a strategy and the creation of a vision.
The structure of the map is an analytical support.It identifies causal links between different ideas and thusfacilitates the identification of the processes representedby the map. It is possible to identify multiple links (moreor less interdependent, more or less competitive, more orless contradictory, more or less important) that lead tothe achievement of the same objective. These links formpart of different coherent sets from which the strategy canbe developed. In a Cuma, coherent sets of goals emergethat are focused around economic, social, and local devel-opment themes. The links can also identify the strategicareas that form the basis for the implementation of thecooperative’s management project.
In practical terms, in our project, a causal map is itera-tively established with the assistance of a data processingsoftware expert, experienced in the use of suitable soft-ware (Decision Explorers – Banxias Software), basedon the elements provided by each of the tools used in thefirst step. The different maps produced are presented fordiscussion, amended, and validated by the stakeholders ofthe strategic approach. For a Cuma involved in the pro-ject, the stakeholders are, for example, farmer members,
employees, members of other Cuma, members of admin-istrative boards. The final map obtained is used tosupport the definition of the strategic objectives, theactions agreed, and the indicators to be used to assessperformance.
In addition, the causal map provides multiple analysesthat can be used as part of a strategic approach. There-fore, it is possible to perform statistical analysis based onthe map. One possible analysis can highlight the conceptsthat are essential to the strategy. The software helps theanalyst and the cooperative members to identify the goals,the key ideas, the driving forces, and the performancemeasures from the mass of ideas (Figure 8). We accept thatthe causal map is unreadable, but our objective is to showhow we represent complexity. Complexity comes from theLatin word ‘‘Complexus’’ that means ‘‘what is weaved’’.
Next the analysis indicates strategic targets, andcooperative members have to select 8 to 10 key issueson the causal map. They are key because they are nodesat the heart of the map and, as a result, they are therelevant strategic issues. If any of these issues is magni-fied it has an impact on the whole system. Then Cumamembers have to define an indicator for each of the 8to 10 selected key issues to drive the strategy, and theyhave to define the goal for each indicator to build thebalanced scorecard.
Causal mapping takes a central place in the proposedmethodological journey because it is:
(1) a support tool that acts as an intermediary, facilitat-ing the cognitive process (Vinck, 2000);
(2) an aid that provides a representation of the processesimplemented in an organization, and facilitates theidentification of the core elements of the strategy;
(3) a tool that takes complexity into account withoutremoving it (Axelrod, 2015);
(4) a mediation tool that helps to ensure that a grouphas a shared vision of a given strategy (Eden, 1988).
5. The place of advice and the conditions oftransferring the approach to the cuma
The effectiveness of the strategic thinking is dependenton the relevance of the processes involved. Strategicthinking cannot be satisfied with a single individualthought; it requires an external, distanced, and independentperspective. This observation is not new (Hémidy et al.1996); it requires the involvement of an advisor. Theadvisor plays an important role in ensuring that all partic-ipants understand the thought processes involved, andin facilitating communication (Von Korff and Guetta,2005); (Schuman, 2005).
The implementation of strategic management requiresthe support of an advisor, and requires some considerationas to the organizational arrangement for such advice.Starting with the idea that a successful strategy is notonly defined by the degree of achievement of the objectivesset, but also that it is the result of a collective visionthat has its foundations in individual propositions whicheach person develops from his own organization andstrategy, we suggest that structuring advice aroundgroups of farmers and collective groupings will help toachieve the required results (Pervanchon et al., 2007,Compagnone, 2009).
International Journal of Agricultural Management, Volume 7 Issue 1 ISSN 2047-3710& 2018 International Farm Management Association and Institute of Agricultural Management 75
Philippe Jeanneaux et al. PerfCuma: A framework to manage small cooperatives
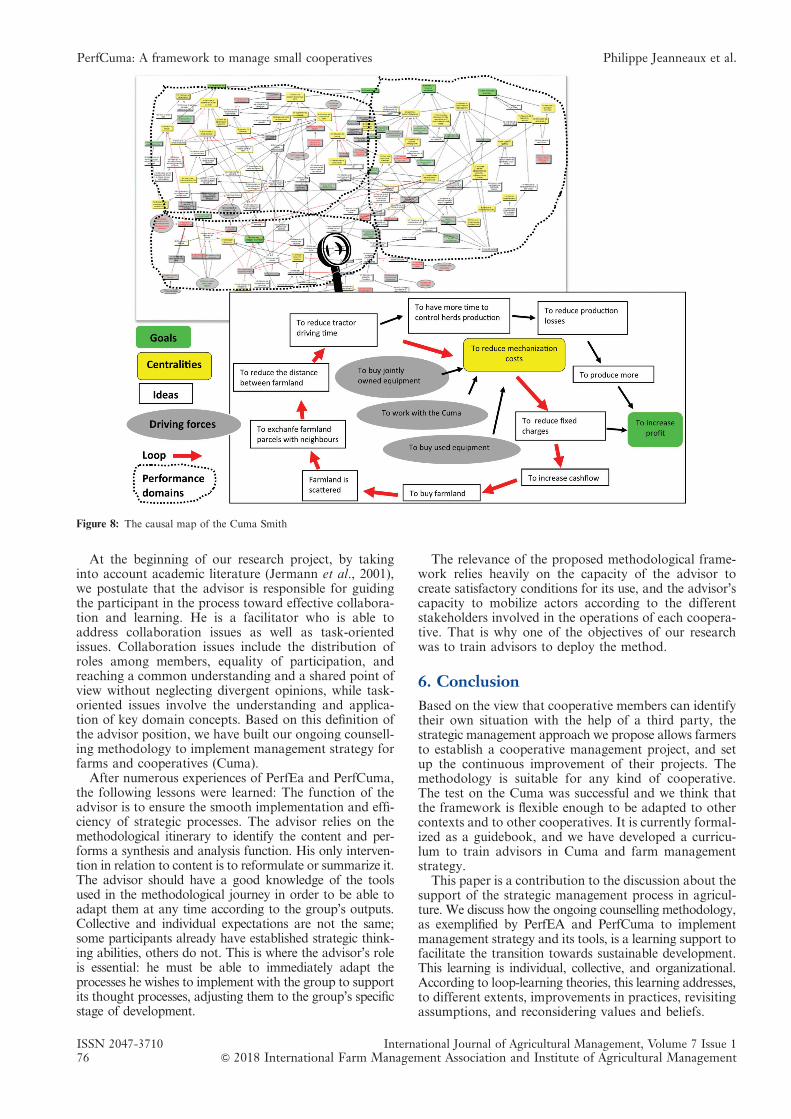
At the beginning of our research project, by takinginto account academic literature (Jermann et al., 2001),we postulate that the advisor is responsible for guidingthe participant in the process toward effective collabora-tion and learning. He is a facilitator who is able toaddress collaboration issues as well as task-orientedissues. Collaboration issues include the distribution ofroles among members, equality of participation, andreaching a common understanding and a shared point ofview without neglecting divergent opinions, while task-oriented issues involve the understanding and applica-tion of key domain concepts. Based on this definition ofthe advisor position, we have built our ongoing counsell-ing methodology to implement management strategy forfarms and cooperatives (Cuma).
After numerous experiences of PerfEa and PerfCuma,the following lessons were learned: The function of theadvisor is to ensure the smooth implementation and effi-ciency of strategic processes. The advisor relies on themethodological itinerary to identify the content and per-forms a synthesis and analysis function. His only interven-tion in relation to content is to reformulate or summarize it.The advisor should have a good knowledge of the toolsused in the methodological journey in order to be able toadapt them at any time according to the group’s outputs.Collective and individual expectations are not the same;some participants already have established strategic think-ing abilities, others do not. This is where the advisor’s roleis essential: he must be able to immediately adapt theprocesses he wishes to implement with the group to supportits thought processes, adjusting them to the group’s specificstage of development.
The relevance of the proposed methodological frame-work relies heavily on the capacity of the advisor tocreate satisfactory conditions for its use, and the advisor’scapacity to mobilize actors according to the differentstakeholders involved in the operations of each coopera-tive. That is why one of the objectives of our researchwas to train advisors to deploy the method.
6. Conclusion
Based on the view that cooperative members can identifytheir own situation with the help of a third party, thestrategic management approach we propose allows farmersto establish a cooperative management project, and setup the continuous improvement of their projects. Themethodology is suitable for any kind of cooperative.The test on the Cuma was successful and we think thatthe framework is flexible enough to be adapted to othercontexts and to other cooperatives. It is currently formal-ized as a guidebook, and we have developed a curricu-lum to train advisors in Cuma and farm managementstrategy.
This paper is a contribution to the discussion about thesupport of the strategic management process in agricul-ture. We discuss how the ongoing counselling methodology,as exemplified by PerfEA and PerfCuma to implementmanagement strategy and its tools, is a learning support tofacilitate the transition towards sustainable development.This learning is individual, collective, and organizational.According to loop-learning theories, this learning addresses,to different extents, improvements in practices, revisitingassumptions, and reconsidering values and beliefs.
Figure 8: The causal map of the Cuma Smith
ISSN 2047-3710 International Journal of Agricultural Management, Volume 7 Issue 176 & 2018 International Farm Management Association and Institute of Agricultural Management
PerfCuma: A framework to manage small cooperatives Philippe Jeanneaux et al.
This work might be extended to the expected develop-ment in the environmental certification of farms, or theincreased focus on sustainable development and corporatesocial responsibility. The strategic management approachcould emerge as a lever for action with regard to publicagricultural and environmental policy, both in terms of theadaptation of farmers to changing public policies, and interms of the conditionality of public support.
The approach of providing advice to farmers and agri-cultural cooperatives in the area of strategic managementshould be considered as a learning aid that will strengthenthe capacity for the strategic thinking of individuals andcollective groupings, as well as strengthening their ability tointegrate sustainable development issues into their activity.
About the authors
Philippe Jeanneaux is a full Professor of AgriculturalEconomics.Mathieu Capitaine is a Lecturer in Agronomy.Anaıs Mauclair is a research engineer. They work at Vet-Agro Sup Clermont (France), a national graduate schoolof agronomy, specialized in the development of agricul-ture, food industry and rural areas. They analyse farmmanagement, farmers’ decision-making and factors deter-mining the overall farm performance.
REFERENCES
Ackermann, F. and Eden, C. (2010). Strategic Options Devel-opment and Analysis. Systems Approaches to ManagingChange: A Practical Guide. Reynolds, M and Holwel, S.London, Springer, the Open University: 135–190. http://dx.doi.org/10.1007/978-1-84882-809-4_4
Axelrod, R. (Ed.). (2015). Structure of decision: The cognitivemaps of political elites. Princeton university press.
Barnard, C.S. and Nix, J. (1979). Farm planning and control.Cambridge, New York, Cambridge University Press.
Bossel, H. (1999). Indicators for Sustainable Development:Theory, Method, Applications: a Report to the Balaton Group.Winnipeg, Manitoba, International Institute for SustainableDevelopment.
Bossel, H. (2000). ‘‘Policy assessment and simulation ofactor orientation for sustainable development.’’ EcologicalEconomics, special issue: The human actor in ecological-economic models, 35(3): 337–355.
Casavant, K.L. and Infanger, C.L. (1999). Agricultural Eco-nomics & management. Upper Saddle River - New Jersey,Prentice Hall.
Chombart de Lauwe, J., Poitevin, J. and Tirel, J.-C. (1969).Nouvelle gestion des exploitations agricoles. Paris, Dunod.
Compagnone, C. (2009). Conseil collectif et collectifs de pro-duction de connaissances. Conseil et developpement enagriculture. Quelles nouvelles pratiques ? Compagnone, C.,Auricoste, C. and Lemery, B. Dijon, Educagri editions, Edi-tions Quae: 19–35.
Cossette, P. (2003). ‘‘Methode systematique d’aide a la formu-lation de la vision strategique : illustration aupres d’un pro-prietaire dirigeant.’’ Revue de l’entrepreneuriat, 2(1): 18.
Darnhofer, I., Bellon, S., Dedieu, B. and Milestad, R. (2010).‘‘Adaptiveness to enhance the sustainability of farming sys-tems. A review.’’ Agronomy for Sustainable Development,SpringerVerlag/EDP Sciences/INRA, 2010, 30(3). http://dx.doi.org/10.1051/agro/2009053
Doran, G.T. (1981). ‘‘There’s a S.M.A.R.T. way to write manage-ment’s goals and objectives.’’ Management Review, 70(11):35–36.
Eden, C. (1988). ‘‘Cognitive Mapping - A Review.’’ EuropeanJournal of Operational Research, (36): 1–13. http://dx.doi.org/10.1016/0377-2217(88)90002-1
Fairweather, J. (2010). ‘‘Farmer models of socio-ecologicsystems: Application of causal mapping across multiple
locations.’’ Ecological Modelling, 221(3): 555–562. http://dx.doi.org/10.1016/j.ecolmodel.2009.10.026
Freeman, R.E. (2010). Strategic management: A stakeholderapproach, Cambridge University Press.
Hemidy, L., Boiteux, J. and Cartel, H. (1996). Aide a la decisionet accompagnement strategique : l’experience du CDERde la Marne. Communication pour le colloque INRA/ Pour laterre et les Hommes, 50 ans de recherches a l’INRA, Laon.
Huff, A. (1990). Mapping Strategic Thought. New York, Wiley &Sons. http://dx.doi.org/10.5465/AMR.1992.4279590
Jeanneaux, P. and Blasquiet-Revol, H. (2012). ‘‘La gestion del’exploitation agricole: un etat des lieux des recherchesfrancaises.’’ Gerer et Comprendre, ESKA, (107): 29–40.http://dx.doi.org/10.3917/geco.107.0029
Jermann, P., Soller, A. and Muehlenbrock, M. (2001). From mirror-ing to guiding: A review of the state of art technology forsupporting collaborative learning. European Conference onComputer-Supported Collaborative Learning EuroCSCL-2001.Dillenbourg, P., Eurel-ings, A. and Hakkarainen, K. Maastricht,Netherlands: 324–331.
Kaplan, R. and Norton, D. (1996). ‘‘Using the Balanced Score-card As a Strategic Management System.’’ Harvard Busi-ness Review (1996-1).
Kaplan, R. and Norton, P. (2004). Strategy Maps - converting intan-gible assets into tangible outcomes. Boston, Massachusetts,Harvard business School Press. http://dx.doi.org/10.5465/AME.2004.1383587
Kay, R.D. (1986). Farm management: planning, control, andimplementation. New York, McGraw-Hill.
Laukkanen, M. (1998). Conducting Causal Mapping Research:Opportunities and Challenges. Managerial and Organiza-tional Cognition - Theory, Methods and Research. Eden, C.and Spender, J.-C. London, Sage Publication: 168–191.
Madelrieux, S. and Dedieu, B. (2008). ‘‘Qualification and assess-ment of work organisation in livestock farms.’’ Animal, 2(3):435–446. http://dx.doi.org/10.1017/S175173110700122X
Marshall, E., Bonneviale, J.-R. and Francfort, I. (1994). Fonc-tionnement et diagnostic global de l’exploitation agricole. Unemethode interdisciplinaire pour la formation et le developpe-ment. Dijon, Enesad-Sed.
Noell, C. and Lund, M. (2002). The balances Scorecard (BSC)for Danish Farm - Vague framework or functional instrument,Farm management Proceedings of NJF Seminar, N˚345, Oslo.
Olson, K.D. (2004). Farm Management: Principles and Strate-gies. Iowa, Blackwell Publishing Co.
Pervanchon, F., De Torcy, B. and Delepine, F.-X. (2007). ‘‘DossierFormation : Autonomie de decision et demarche strategique.’’Travaux & Innovations (140).
Porter, M.E. (2008). Competitive advantage: Creating and sus-taining superior performance. Simon and Schuster.
Pretty, J. (2008). ‘‘Agricultural sustainability: concepts, princi-ples and evidence.’’ Philosophical Transactions of theRoyal Society of London B: Biological Sciences, 363(1491):447–465. http://dx.doi.org/10.1098/rstb.2007.2163
Schuman, S., (Ed.). (2005). The IAF Handbook of Group Facilitation:Best Practices from the Leading Organization in Facilitation.San Francisco, International Association of Facilitators -Jossey-Bass.
Simon, H. (1982). Models of Bounded Rationality. Boston,MIT Press.
Stacey, R.D. (2007). Strategic management and organisationaldynamics: The challenge of complexity to ways of thinkingabout organisations, Pearson education.
Turner, J. and Taylor, M. (1998). Applied farm management.Oxford, Malden, Mass, Blackwell Science.
Vinck, D. (2000). Approches sociologiques de la cognition etprise en compte des objets intermediaires. Ecole d’ete del’ARCO : mediation technique et cognition, cognition situee,individuelle et collective, Bonas.
Von Korff, Y. and Guetta, I. (2005). Description du travail defacilitateur professionnel, http://www.iaf-world.org/files/public/IAF_Fr_description_IG.3_doc.pdf.
Vygotsky, L.S. (1978). Mind in society. Cambridge, MA: HarvardUniversity Press.
International Journal of Agricultural Management, Volume 7 Issue 1 ISSN 2047-3710& 2018 International Farm Management Association and Institute of Agricultural Management 77
Philippe Jeanneaux et al. PerfCuma: A framework to manage small cooperatives
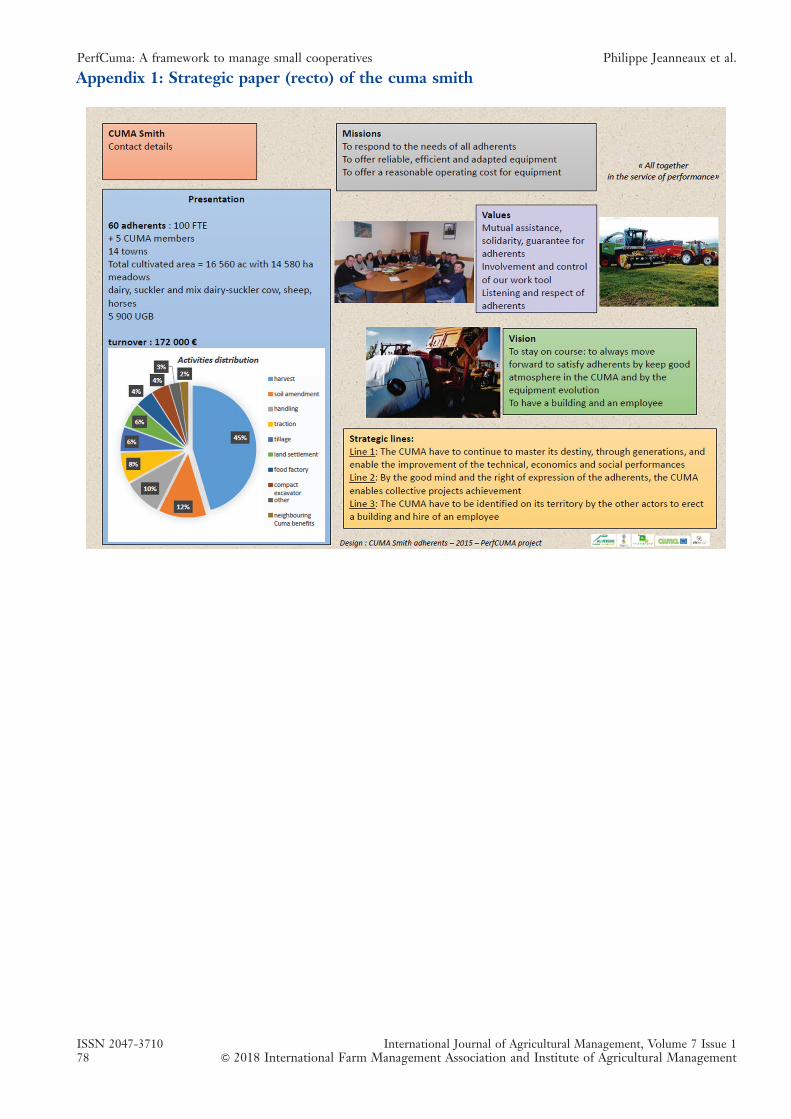
Appendix 1: Strategic paper (recto) of the cuma smith
ISSN 2047-3710 International Journal of Agricultural Management, Volume 7 Issue 178 & 2018 International Farm Management Association and Institute of Agricultural Management
PerfCuma: A framework to manage small cooperatives Philippe Jeanneaux et al.
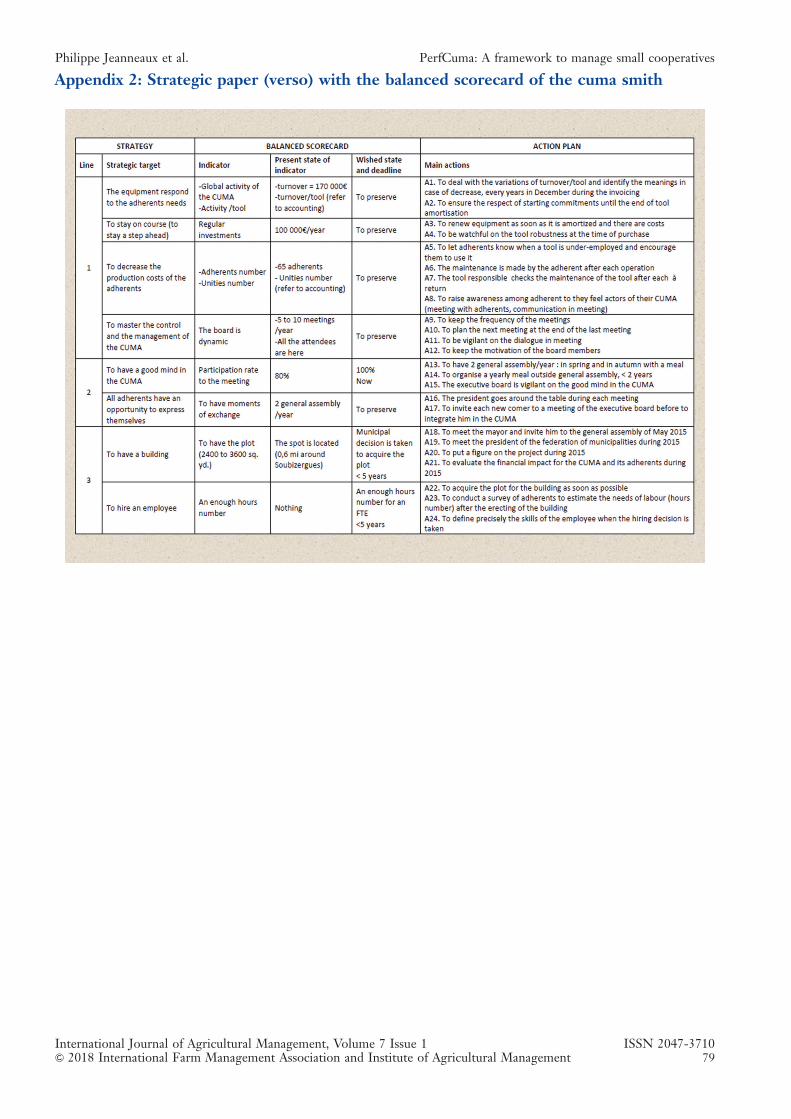
Appendix 2: Strategic paper (verso) with the balanced scorecard of the cuma smith
International Journal of Agricultural Management, Volume 7 Issue 1 ISSN 2047-3710& 2018 International Farm Management Association and Institute of Agricultural Management 79
Philippe Jeanneaux et al. PerfCuma: A framework to manage small cooperatives
REVIEW OF ‘STATE-OF-THE-ART’ OF RESEARCH
DOI: 10.5836/ijam/2018-07-79
Farm labor management trendsin Florida, USA – challenges
and opportunitiesFRITZ M ROKA1 and ZHENGFEI GUAN2
ABSTRACTReliance on foreign guest workers, rising minimum wages, and corporate social responsibility are threetrends emerging within the Florida agricultural economy, particularly among labor-intensive specialty cropfarms. These trends are creating higher costs and pushing employers into new management relationships withtheir farmworkers. On one hand, higher costs compromise the competitive position of agricultural operations.On the other hand, new management strategies could increase overall worker productivity, offset someadministrative costs associated with labor management, and create new avenues of market access for theirproducts. The success to which agricultural employers adjust to these trends with cost effective managementstrategies likely will determine their long-term economic success.
KEYWORDS: farmworkers; specialty crops; H-2A; corporate social responsibility; minimum wage
Introduction
The definition of ‘‘specialty crops’’ is enshrined into U.S.law as part of the Specialty Crops Competitiveness Act of2004 (7 U.S.C. 1621 note) and includes fruits, vegetables,tree nuts, and nursery crops (USDA, 2014). For specialtycrop producers in Florida, particularly fruit and vegetablegrowers, the production and harvest of specialty crops islabor intensive and, hence, they depend on a significantnumber of seasonal and migrant farmworkers. Specialtycrop producers are facing increasing challenges with respectto both the availability and cost of farm labor services.The goal of this paper is to present a comprehensive pictureof the farm labor trends as well as discuss potential man-agement options to maintain economic viability of Floridagrowers. While mechanization of production and harvest-ing jobs could ultimately resolve many farm labor concerns,at this time those technologies are not commercially avai-lable. In the near term, which we define as the next five toten years, growers still have to rely on hand labor and mustadjust and accommodate their labor management practicesto secure an adequate supply of workers in a cost-effectivemanner. Insights gained through this analysis should carryover to other states and production regions facing similarfarm labor challenges.
Florida specialty crop growers and their affiliated farmlabor contractors face three interrelated trends withrespect to farm labor: 1) increasing reliance on foreignguest workers; 2) rising minimum wages; and, 3) evolv-ing supply chain relationships, which require growersto be accountable to the precepts of corporate socialresponsibility. Each trend, separately and collectively,can be viewed as both a challenge and opportunity tolong-term economic sustainability of the state’s agricul-tural economy. This paper begins with a description ofFlorida’s specialty crops and historical patterns of farmlabor management. We discuss guest workers, minimumwages, and corporate social responsibility separately andat the end of the paper, discuss how these trends arelinked and potential ways to mitigate costs and maximizebenefits in a changing farm labor market.
Agriculture and farm labor managementin Florida
Florida is second only to California in the productionof U.S. specialty crops. In 2013, citrus, fresh vegetable,strawberry, and blueberry production combined to deliver$5 billion of farm gate sales, representing 60% of Florida’s
1Corresponding author: Fritz M. Roka, University of Florida, Southwest Florida Research & Education Center, 2685 State Road, 29 North, Immokalee, Florida, USA. Tel: 01.239.658.3428,
Email: [email protected] Zhengfei Guan, University of Florida, Gulf Coast Research and Education Center, 14625 CR 672, Wimauma, Florida, USA. Tel: 01.813.419.6590, Email: [email protected].
Original submitted September 29 2017; revision received February 08 2018; accepted January 22 2018.
International Journal of Agricultural Management, Volume 7 Issue 1 ISSN 2047-3710& 2018 International Farm Management Association and Institute of Agricultural Management 79
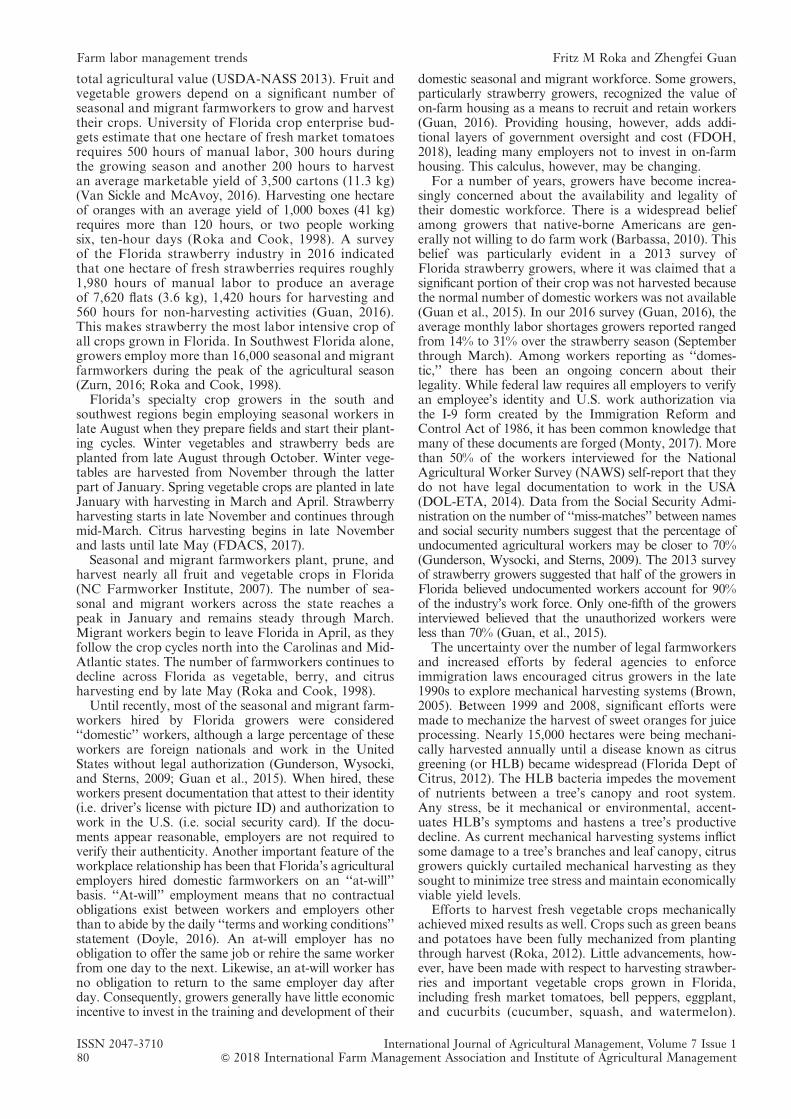
total agricultural value (USDA-NASS 2013). Fruit andvegetable growers depend on a significant number ofseasonal and migrant farmworkers to grow and harvesttheir crops. University of Florida crop enterprise bud-gets estimate that one hectare of fresh market tomatoesrequires 500 hours of manual labor, 300 hours duringthe growing season and another 200 hours to harvestan average marketable yield of 3,500 cartons (11.3 kg)(Van Sickle and McAvoy, 2016). Harvesting one hectareof oranges with an average yield of 1,000 boxes (41 kg)requires more than 120 hours, or two people workingsix, ten-hour days (Roka and Cook, 1998). A surveyof the Florida strawberry industry in 2016 indicatedthat one hectare of fresh strawberries requires roughly1,980 hours of manual labor to produce an averageof 7,620 flats (3.6 kg), 1,420 hours for harvesting and560 hours for non-harvesting activities (Guan, 2016).This makes strawberry the most labor intensive crop ofall crops grown in Florida. In Southwest Florida alone,growers employ more than 16,000 seasonal and migrantfarmworkers during the peak of the agricultural season(Zurn, 2016; Roka and Cook, 1998).
Florida’s specialty crop growers in the south andsouthwest regions begin employing seasonal workers inlate August when they prepare fields and start their plant-ing cycles. Winter vegetables and strawberry beds areplanted from late August through October. Winter vege-tables are harvested from November through the latterpart of January. Spring vegetable crops are planted in lateJanuary with harvesting in March and April. Strawberryharvesting starts in late November and continues throughmid-March. Citrus harvesting begins in late Novemberand lasts until late May (FDACS, 2017).
Seasonal and migrant farmworkers plant, prune, andharvest nearly all fruit and vegetable crops in Florida(NC Farmworker Institute, 2007). The number of sea-sonal and migrant workers across the state reaches apeak in January and remains steady through March.Migrant workers begin to leave Florida in April, as theyfollow the crop cycles north into the Carolinas and Mid-Atlantic states. The number of farmworkers continues todecline across Florida as vegetable, berry, and citrusharvesting end by late May (Roka and Cook, 1998).
Until recently, most of the seasonal and migrant farm-workers hired by Florida growers were considered‘‘domestic’’ workers, although a large percentage of theseworkers are foreign nationals and work in the UnitedStates without legal authorization (Gunderson, Wysocki,and Sterns, 2009; Guan et al., 2015). When hired, theseworkers present documentation that attest to their identity(i.e. driver’s license with picture ID) and authorization towork in the U.S. (i.e. social security card). If the docu-ments appear reasonable, employers are not required toverify their authenticity. Another important feature of theworkplace relationship has been that Florida’s agriculturalemployers hired domestic farmworkers on an ‘‘at-will’’basis. ‘‘At-will’’ employment means that no contractualobligations exist between workers and employers otherthan to abide by the daily ‘‘terms and working conditions’’statement (Doyle, 2016). An at-will employer has noobligation to offer the same job or rehire the same workerfrom one day to the next. Likewise, an at-will worker hasno obligation to return to the same employer day afterday. Consequently, growers generally have little economicincentive to invest in the training and development of their
domestic seasonal and migrant workforce. Some growers,particularly strawberry growers, recognized the value ofon-farm housing as a means to recruit and retain workers(Guan, 2016). Providing housing, however, adds addi-tional layers of government oversight and cost (FDOH,2018), leading many employers not to invest in on-farmhousing. This calculus, however, may be changing.
For a number of years, growers have become increa-singly concerned about the availability and legality oftheir domestic workforce. There is a widespread beliefamong growers that native-borne Americans are gen-erally not willing to do farm work (Barbassa, 2010). Thisbelief was particularly evident in a 2013 survey ofFlorida strawberry growers, where it was claimed that asignificant portion of their crop was not harvested becausethe normal number of domestic workers was not available(Guan et al., 2015). In our 2016 survey (Guan, 2016), theaverage monthly labor shortages growers reported rangedfrom 14% to 31% over the strawberry season (Septemberthrough March). Among workers reporting as ‘‘domes-tic,’’ there has been an ongoing concern about theirlegality. While federal law requires all employers to verifyan employee’s identity and U.S. work authorization viathe I-9 form created by the Immigration Reform andControl Act of 1986, it has been common knowledge thatmany of these documents are forged (Monty, 2017). Morethan 50% of the workers interviewed for the NationalAgricultural Worker Survey (NAWS) self-report that theydo not have legal documentation to work in the USA(DOL-ETA, 2014). Data from the Social Security Admi-nistration on the number of ‘‘miss-matches’’ between namesand social security numbers suggest that the percentage ofundocumented agricultural workers may be closer to 70%(Gunderson, Wysocki, and Sterns, 2009). The 2013 surveyof strawberry growers suggested that half of the growers inFlorida believed undocumented workers account for 90%of the industry’s work force. Only one-fifth of the growersinterviewed believed that the unauthorized workers wereless than 70% (Guan, et al., 2015).
The uncertainty over the number of legal farmworkersand increased efforts by federal agencies to enforceimmigration laws encouraged citrus growers in the late1990s to explore mechanical harvesting systems (Brown,2005). Between 1999 and 2008, significant efforts weremade to mechanize the harvest of sweet oranges for juiceprocessing. Nearly 15,000 hectares were being mechani-cally harvested annually until a disease known as citrusgreening (or HLB) became widespread (Florida Dept ofCitrus, 2012). The HLB bacteria impedes the movementof nutrients between a tree’s canopy and root system.Any stress, be it mechanical or environmental, accent-uates HLB’s symptoms and hastens a tree’s productivedecline. As current mechanical harvesting systems inflictsome damage to a tree’s branches and leaf canopy, citrusgrowers quickly curtailed mechanical harvesting as theysought to minimize tree stress and maintain economicallyviable yield levels.
Efforts to harvest fresh vegetable crops mechanicallyachieved mixed results as well. Crops such as green beansand potatoes have been fully mechanized from plantingthrough harvest (Roka, 2012). Little advancements, how-ever, have been made with respect to harvesting strawber-ries and important vegetable crops grown in Florida,including fresh market tomatoes, bell peppers, eggplant,and cucurbits (cucumber, squash, and watermelon).
ISSN 2047-3710 International Journal of Agricultural Management, Volume 7 Issue 180 & 2018 International Farm Management Association and Institute of Agricultural Management
Farm labor management trends Fritz M Roka and Zhengfei Guan
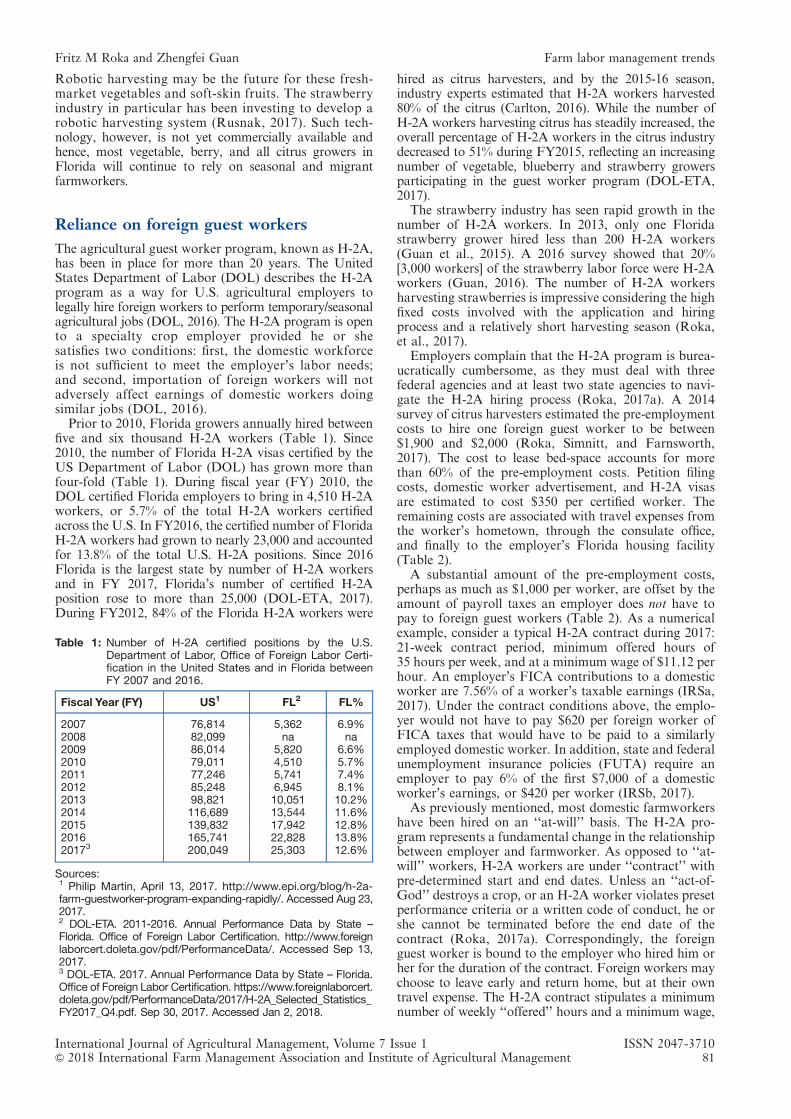
Robotic harvesting may be the future for these fresh-market vegetables and soft-skin fruits. The strawberryindustry in particular has been investing to develop arobotic harvesting system (Rusnak, 2017). Such tech-nology, however, is not yet commercially available andhence, most vegetable, berry, and all citrus growers inFlorida will continue to rely on seasonal and migrantfarmworkers.
Reliance on foreign guest workers
The agricultural guest worker program, known as H-2A,has been in place for more than 20 years. The UnitedStates Department of Labor (DOL) describes the H-2Aprogram as a way for U.S. agricultural employers tolegally hire foreign workers to perform temporary/seasonalagricultural jobs (DOL, 2016). The H-2A program is opento a specialty crop employer provided he or shesatisfies two conditions: first, the domestic workforceis not sufficient to meet the employer’s labor needs;and second, importation of foreign workers will notadversely affect earnings of domestic workers doingsimilar jobs (DOL, 2016).
Prior to 2010, Florida growers annually hired betweenfive and six thousand H-2A workers (Table 1). Since2010, the number of Florida H-2A visas certified by theUS Department of Labor (DOL) has grown more thanfour-fold (Table 1). During fiscal year (FY) 2010, theDOL certified Florida employers to bring in 4,510 H-2Aworkers, or 5.7% of the total H-2A workers certifiedacross the U.S. In FY2016, the certified number of FloridaH-2A workers had grown to nearly 23,000 and accountedfor 13.8% of the total U.S. H-2A positions. Since 2016Florida is the largest state by number of H-2A workersand in FY 2017, Florida’s number of certified H-2Aposition rose to more than 25,000 (DOL-ETA, 2017).During FY2012, 84% of the Florida H-2A workers were
hired as citrus harvesters, and by the 2015-16 season,industry experts estimated that H-2A workers harvested80% of the citrus (Carlton, 2016). While the number ofH-2A workers harvesting citrus has steadily increased, theoverall percentage of H-2A workers in the citrus industrydecreased to 51% during FY2015, reflecting an increasingnumber of vegetable, blueberry and strawberry growersparticipating in the guest worker program (DOL-ETA,2017).
The strawberry industry has seen rapid growth in thenumber of H-2A workers. In 2013, only one Floridastrawberry grower hired less than 200 H-2A workers(Guan et al., 2015). A 2016 survey showed that 20%[3,000 workers] of the strawberry labor force were H-2Aworkers (Guan, 2016). The number of H-2A workersharvesting strawberries is impressive considering the highfixed costs involved with the application and hiringprocess and a relatively short harvesting season (Roka,et al., 2017).
Employers complain that the H-2A program is burea-ucratically cumbersome, as they must deal with threefederal agencies and at least two state agencies to navi-gate the H-2A hiring process (Roka, 2017a). A 2014survey of citrus harvesters estimated the pre-employmentcosts to hire one foreign guest worker to be between$1,900 and $2,000 (Roka, Simnitt, and Farnsworth,2017). The cost to lease bed-space accounts for morethan 60% of the pre-employment costs. Petition filingcosts, domestic worker advertisement, and H-2A visasare estimated to cost $350 per certified worker. Theremaining costs are associated with travel expenses fromthe worker’s hometown, through the consulate office,and finally to the employer’s Florida housing facility(Table 2).
A substantial amount of the pre-employment costs,perhaps as much as $1,000 per worker, are offset by theamount of payroll taxes an employer does not have topay to foreign guest workers (Table 2). As a numericalexample, consider a typical H-2A contract during 2017:21-week contract period, minimum offered hours of35 hours per week, and at a minimum wage of $11.12 perhour. An employer’s FICA contributions to a domesticworker are 7.56% of a worker’s taxable earnings (IRSa,2017). Under the contract conditions above, the emplo-yer would not have to pay $620 per foreign worker ofFICA taxes that would have to be paid to a similarlyemployed domestic worker. In addition, state and federalunemployment insurance policies (FUTA) require anemployer to pay 6% of the first $7,000 of a domesticworker’s earnings, or $420 per worker (IRSb, 2017).
As previously mentioned, most domestic farmworkershave been hired on an ‘‘at-will’’ basis. The H-2A pro-gram represents a fundamental change in the relationshipbetween employer and farmworker. As opposed to ‘‘at-will’’ workers, H-2A workers are under ‘‘contract’’ withpre-determined start and end dates. Unless an ‘‘act-of-God’’ destroys a crop, or an H-2A worker violates presetperformance criteria or a written code of conduct, he orshe cannot be terminated before the end date of thecontract (Roka, 2017a). Correspondingly, the foreignguest worker is bound to the employer who hired him orher for the duration of the contract. Foreign workers maychoose to leave early and return home, but at their owntravel expense. The H-2A contract stipulates a minimumnumber of weekly ‘‘offered’’ hours and a minimum wage,
Table 1: Number of H-2A certified positions by the U.S.Department of Labor, Office of Foreign Labor Certi-fication in the United States and in Florida betweenFY 2007 and 2016.
Fiscal Year (FY) US1 FL2 FL%
2007 76,814 5,362 6.9%2008 82,099 na na2009 86,014 5,820 6.6%2010 79,011 4,510 5.7%2011 77,246 5,741 7.4%2012 85,248 6,945 8.1%2013 98,821 10,051 10.2%2014 116,689 13,544 11.6%2015 139,832 17,942 12.8%2016 165,741 22,828 13.8%20173 200,049 25,303 12.6%
Sources:1 Philip Martin, April 13, 2017. http://www.epi.org/blog/h-2a-farm-guestworker-program-expanding-rapidly/. Accessed Aug 23,2017.2 DOL-ETA. 2011-2016. Annual Performance Data by State –Florida. Office of Foreign Labor Certification. http://www.foreignlaborcert.doleta.gov/pdf/PerformanceData/. Accessed Sep 13,2017.3 DOL-ETA. 2017. Annual Performance Data by State – Florida.Office of Foreign Labor Certification. https://www.foreignlaborcert.doleta.gov/pdf/PerformanceData/2017/H-2A_Selected_Statistics_FY2017_Q4.pdf. Sep 30, 2017. Accessed Jan 2, 2018.
International Journal of Agricultural Management, Volume 7 Issue 1 ISSN 2047-3710& 2018 International Farm Management Association and Institute of Agricultural Management 81
Fritz M Roka and Zhengfei Guan Farm labor management trends
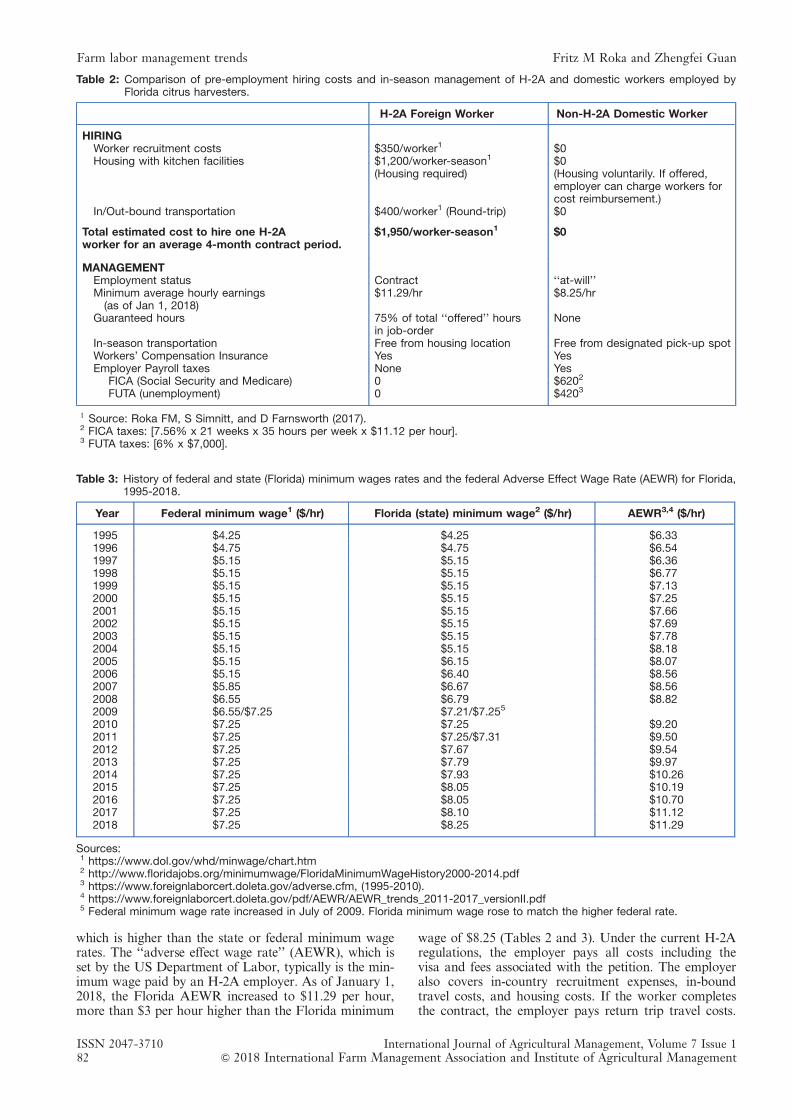
which is higher than the state or federal minimum wagerates. The ‘‘adverse effect wage rate’’ (AEWR), which isset by the US Department of Labor, typically is the min-imum wage paid by an H-2A employer. As of January 1,2018, the Florida AEWR increased to $11.29 per hour,more than $3 per hour higher than the Florida minimum
wage of $8.25 (Tables 2 and 3). Under the current H-2Aregulations, the employer pays all costs including thevisa and fees associated with the petition. The employeralso covers in-country recruitment expenses, in-boundtravel costs, and housing costs. If the worker completesthe contract, the employer pays return trip travel costs.
Table 2: Comparison of pre-employment hiring costs and in-season management of H-2A and domestic workers employed byFlorida citrus harvesters.
H-2A Foreign Worker Non-H-2A Domestic Worker
HIRINGWorker recruitment costs $350/worker1 $0Housing with kitchen facilities $1,200/worker-season1 $0
(Housing required) (Housing voluntarily. If offered,employer can charge workers forcost reimbursement.)
In/Out-bound transportation $400/worker1 (Round-trip) $0
Total estimated cost to hire one H-2A $1,950/worker-season1 $0worker for an average 4-month contract period.
MANAGEMENTEmployment status Contract ‘‘at-will’’Minimum average hourly earnings(as of Jan 1, 2018)
$11.29/hr $8.25/hr
Guaranteed hours 75% of total ‘‘offered’’ hoursin job-order
None
In-season transportation Free from housing location Free from designated pick-up spotWorkers’ Compensation Insurance Yes YesEmployer Payroll taxes None Yes
FICA (Social Security and Medicare) 0 $6202
FUTA (unemployment) 0 $4203
1 Source: Roka FM, S Simnitt, and D Farnsworth (2017).2 FICA taxes: [7.56% x 21 weeks x 35 hours per week x $11.12 per hour].3 FUTA taxes: [6% x $7,000].
Table 3: History of federal and state (Florida) minimum wages rates and the federal Adverse Effect Wage Rate (AEWR) for Florida,1995-2018.
Year Federal minimum wage1 ($/hr) Florida (state) minimum wage2 ($/hr) AEWR3,4 ($/hr)
1995 $4.25 $4.25 $6.331996 $4.75 $4.75 $6.541997 $5.15 $5.15 $6.361998 $5.15 $5.15 $6.771999 $5.15 $5.15 $7.132000 $5.15 $5.15 $7.252001 $5.15 $5.15 $7.662002 $5.15 $5.15 $7.692003 $5.15 $5.15 $7.782004 $5.15 $5.15 $8.182005 $5.15 $6.15 $8.072006 $5.15 $6.40 $8.562007 $5.85 $6.67 $8.562008 $6.55 $6.79 $8.822009 $6.55/$7.25 $7.21/$7.255
2010 $7.25 $7.25 $9.202011 $7.25 $7.25/$7.31 $9.502012 $7.25 $7.67 $9.542013 $7.25 $7.79 $9.972014 $7.25 $7.93 $10.262015 $7.25 $8.05 $10.192016 $7.25 $8.05 $10.702017 $7.25 $8.10 $11.122018 $7.25 $8.25 $11.29
Sources:1 https://www.dol.gov/whd/minwage/chart.htm2 http://www.floridajobs.org/minimumwage/FloridaMinimumWageHistory2000-2014.pdf3 https://www.foreignlaborcert.doleta.gov/adverse.cfm, (1995-2010).4 https://www.foreignlaborcert.doleta.gov/pdf/AEWR/AEWR_trends_2011-2017_versionII.pdf5 Federal minimum wage rate increased in July of 2009. Florida minimum wage rose to match the higher federal rate.
ISSN 2047-3710 International Journal of Agricultural Management, Volume 7 Issue 182 & 2018 International Farm Management Association and Institute of Agricultural Management
Farm labor management trends Fritz M Roka and Zhengfei Guan
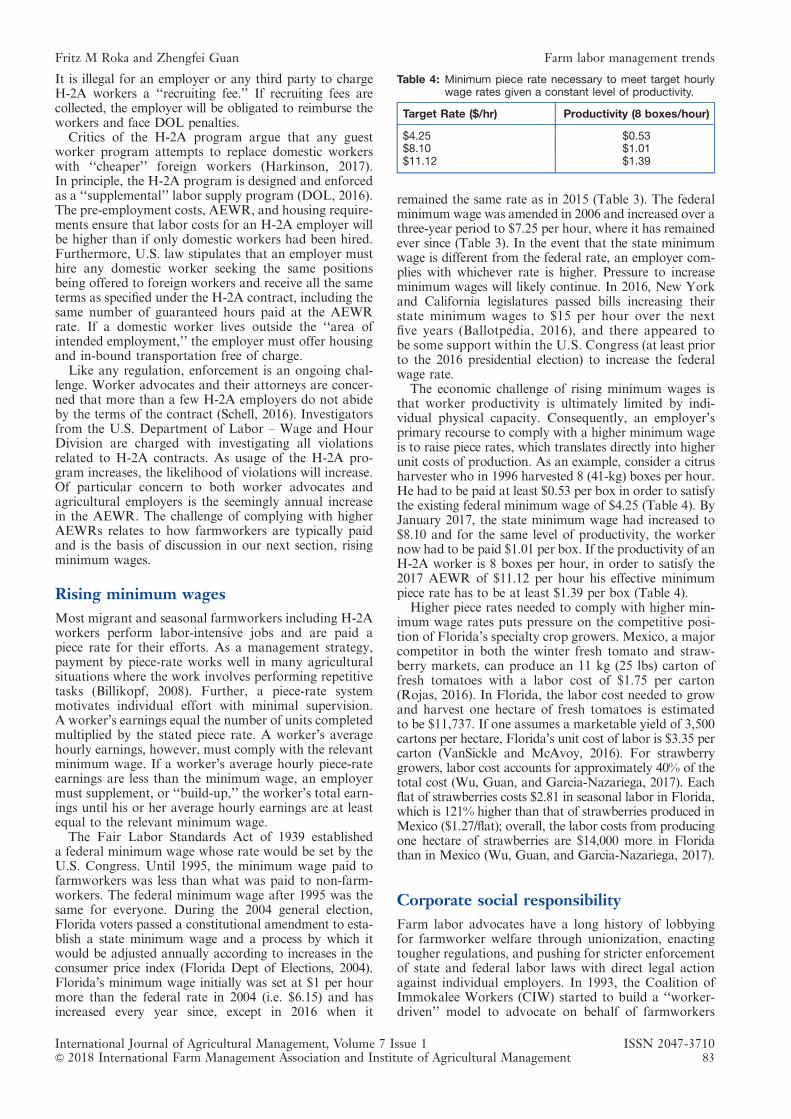
It is illegal for an employer or any third party to chargeH-2A workers a ‘‘recruiting fee.’’ If recruiting fees arecollected, the employer will be obligated to reimburse theworkers and face DOL penalties.
Critics of the H-2A program argue that any guestworker program attempts to replace domestic workerswith ‘‘cheaper’’ foreign workers (Harkinson, 2017).In principle, the H-2A program is designed and enforcedas a ‘‘supplemental’’ labor supply program (DOL, 2016).The pre-employment costs, AEWR, and housing require-ments ensure that labor costs for an H-2A employer willbe higher than if only domestic workers had been hired.Furthermore, U.S. law stipulates that an employer musthire any domestic worker seeking the same positionsbeing offered to foreign workers and receive all the sameterms as specified under the H-2A contract, including thesame number of guaranteed hours paid at the AEWRrate. If a domestic worker lives outside the ‘‘area ofintended employment,’’ the employer must offer housingand in-bound transportation free of charge.
Like any regulation, enforcement is an ongoing chal-lenge. Worker advocates and their attorneys are concer-ned that more than a few H-2A employers do not abideby the terms of the contract (Schell, 2016). Investigatorsfrom the U.S. Department of Labor – Wage and HourDivision are charged with investigating all violationsrelated to H-2A contracts. As usage of the H-2A pro-gram increases, the likelihood of violations will increase.Of particular concern to both worker advocates andagricultural employers is the seemingly annual increasein the AEWR. The challenge of complying with higherAEWRs relates to how farmworkers are typically paidand is the basis of discussion in our next section, risingminimum wages.
Rising minimum wages
Most migrant and seasonal farmworkers including H-2Aworkers perform labor-intensive jobs and are paid apiece rate for their efforts. As a management strategy,payment by piece-rate works well in many agriculturalsituations where the work involves performing repetitivetasks (Billikopf, 2008). Further, a piece-rate systemmotivates individual effort with minimal supervision.A worker’s earnings equal the number of units completedmultiplied by the stated piece rate. A worker’s averagehourly earnings, however, must comply with the relevantminimum wage. If a worker’s average hourly piece-rateearnings are less than the minimum wage, an employermust supplement, or ‘‘build-up,’’ the worker’s total earn-ings until his or her average hourly earnings are at leastequal to the relevant minimum wage.
The Fair Labor Standards Act of 1939 establisheda federal minimum wage whose rate would be set by theU.S. Congress. Until 1995, the minimum wage paid tofarmworkers was less than what was paid to non-farm-workers. The federal minimum wage after 1995 was thesame for everyone. During the 2004 general election,Florida voters passed a constitutional amendment to esta-blish a state minimum wage and a process by which itwould be adjusted annually according to increases in theconsumer price index (Florida Dept of Elections, 2004).Florida’s minimum wage initially was set at $1 per hourmore than the federal rate in 2004 (i.e. $6.15) and hasincreased every year since, except in 2016 when it
remained the same rate as in 2015 (Table 3). The federalminimum wage was amended in 2006 and increased over athree-year period to $7.25 per hour, where it has remainedever since (Table 3). In the event that the state minimumwage is different from the federal rate, an employer com-plies with whichever rate is higher. Pressure to increaseminimum wages will likely continue. In 2016, New Yorkand California legislatures passed bills increasing theirstate minimum wages to $15 per hour over the nextfive years (Ballotpedia, 2016), and there appeared tobe some support within the U.S. Congress (at least priorto the 2016 presidential election) to increase the federalwage rate.
The economic challenge of rising minimum wages isthat worker productivity is ultimately limited by indi-vidual physical capacity. Consequently, an employer’sprimary recourse to comply with a higher minimum wageis to raise piece rates, which translates directly into higherunit costs of production. As an example, consider a citrusharvester who in 1996 harvested 8 (41-kg) boxes per hour.He had to be paid at least $0.53 per box in order to satisfythe existing federal minimum wage of $4.25 (Table 4). ByJanuary 2017, the state minimum wage had increased to$8.10 and for the same level of productivity, the workernow had to be paid $1.01 per box. If the productivity of anH-2A worker is 8 boxes per hour, in order to satisfy the2017 AEWR of $11.12 per hour his effective minimumpiece rate has to be at least $1.39 per box (Table 4).
Higher piece rates needed to comply with higher min-imum wage rates puts pressure on the competitive posi-tion of Florida’s specialty crop growers. Mexico, a majorcompetitor in both the winter fresh tomato and straw-berry markets, can produce an 11 kg (25 lbs) carton offresh tomatoes with a labor cost of $1.75 per carton(Rojas, 2016). In Florida, the labor cost needed to growand harvest one hectare of fresh tomatoes is estimatedto be $11,737. If one assumes a marketable yield of 3,500cartons per hectare, Florida’s unit cost of labor is $3.35 percarton (VanSickle and McAvoy, 2016). For strawberrygrowers, labor cost accounts for approximately 40% of thetotal cost (Wu, Guan, and Garcia-Nazariega, 2017). Eachflat of strawberries costs $2.81 in seasonal labor in Florida,which is 121% higher than that of strawberries produced inMexico ($1.27/flat); overall, the labor costs from producingone hectare of strawberries are $14,000 more in Floridathan in Mexico (Wu, Guan, and Garcia-Nazariega, 2017).
Corporate social responsibility
Farm labor advocates have a long history of lobbyingfor farmworker welfare through unionization, enactingtougher regulations, and pushing for stricter enforcementof state and federal labor laws with direct legal actionagainst individual employers. In 1993, the Coalition ofImmokalee Workers (CIW) started to build a ‘‘worker-driven’’ model to advocate on behalf of farmworkers
Table 4: Minimum piece rate necessary to meet target hourlywage rates given a constant level of productivity.
Target Rate ($/hr) Productivity (8 boxes/hour)
$4.25 $0.53$8.10 $1.01$11.12 $1.39
International Journal of Agricultural Management, Volume 7 Issue 1 ISSN 2047-3710& 2018 International Farm Management Association and Institute of Agricultural Management 83
Fritz M Roka and Zhengfei Guan Farm labor management trends
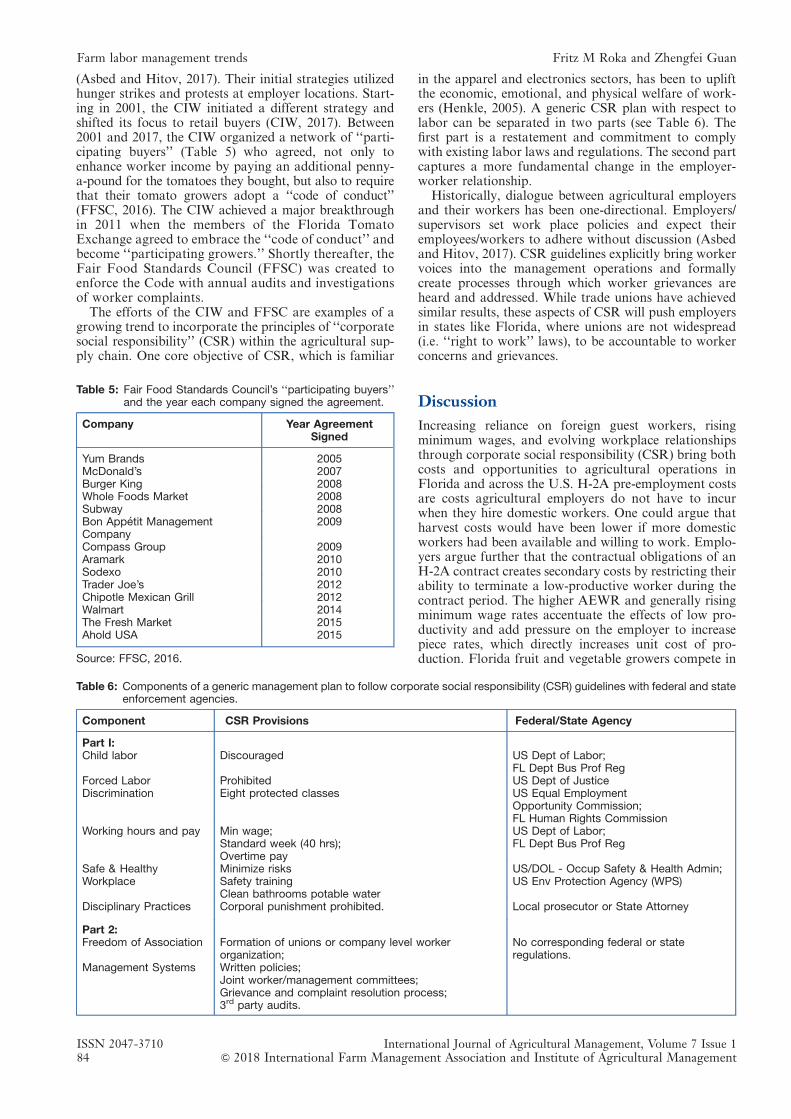
(Asbed and Hitov, 2017). Their initial strategies utilizedhunger strikes and protests at employer locations. Start-ing in 2001, the CIW initiated a different strategy andshifted its focus to retail buyers (CIW, 2017). Between2001 and 2017, the CIW organized a network of ‘‘parti-cipating buyers’’ (Table 5) who agreed, not only toenhance worker income by paying an additional penny-a-pound for the tomatoes they bought, but also to requirethat their tomato growers adopt a ‘‘code of conduct’’(FFSC, 2016). The CIW achieved a major breakthroughin 2011 when the members of the Florida TomatoExchange agreed to embrace the ‘‘code of conduct’’ andbecome ‘‘participating growers.’’ Shortly thereafter, theFair Food Standards Council (FFSC) was created toenforce the Code with annual audits and investigationsof worker complaints.
The efforts of the CIW and FFSC are examples of agrowing trend to incorporate the principles of ‘‘corporatesocial responsibility’’ (CSR) within the agricultural sup-ply chain. One core objective of CSR, which is familiar
in the apparel and electronics sectors, has been to upliftthe economic, emotional, and physical welfare of work-ers (Henkle, 2005). A generic CSR plan with respect tolabor can be separated in two parts (see Table 6). Thefirst part is a restatement and commitment to complywith existing labor laws and regulations. The second partcaptures a more fundamental change in the employer-worker relationship.
Historically, dialogue between agricultural employersand their workers has been one-directional. Employers/supervisors set work place policies and expect theiremployees/workers to adhere without discussion (Asbedand Hitov, 2017). CSR guidelines explicitly bring workervoices into the management operations and formallycreate processes through which worker grievances areheard and addressed. While trade unions have achievedsimilar results, these aspects of CSR will push employersin states like Florida, where unions are not widespread(i.e. ‘‘right to work’’ laws), to be accountable to workerconcerns and grievances.
Discussion
Increasing reliance on foreign guest workers, risingminimum wages, and evolving workplace relationshipsthrough corporate social responsibility (CSR) bring bothcosts and opportunities to agricultural operations inFlorida and across the U.S. H-2A pre-employment costsare costs agricultural employers do not have to incurwhen they hire domestic workers. One could argue thatharvest costs would have been lower if more domesticworkers had been available and willing to work. Emplo-yers argue further that the contractual obligations of anH-2A contract creates secondary costs by restricting theirability to terminate a low-productive worker during thecontract period. The higher AEWR and generally risingminimum wage rates accentuate the effects of low pro-ductivity and add pressure on the employer to increasepiece rates, which directly increases unit cost of pro-duction. Florida fruit and vegetable growers compete in
Table 6: Components of a generic management plan to follow corporate social responsibility (CSR) guidelines with federal and stateenforcement agencies.
Component CSR Provisions Federal/State Agency
Part I:Child labor Discouraged US Dept of Labor;
FL Dept Bus Prof RegForced Labor Prohibited US Dept of JusticeDiscrimination Eight protected classes US Equal Employment
Opportunity Commission;FL Human Rights Commission
Working hours and pay Min wage;Standard week (40 hrs);Overtime pay
US Dept of Labor;FL Dept Bus Prof Reg
Safe & HealthyWorkplace
Minimize risksSafety trainingClean bathrooms potable water
US/DOL - Occup Safety & Health Admin;US Env Protection Agency (WPS)
Disciplinary Practices Corporal punishment prohibited. Local prosecutor or State Attorney
Part 2:Freedom of Association Formation of unions or company level worker
organization;No corresponding federal or stateregulations.
Management Systems Written policies;Joint worker/management committees;Grievance and complaint resolution process;3rd party audits.
Table 5: Fair Food Standards Council’s ‘‘participating buyers’’and the year each company signed the agreement.
Company Year AgreementSigned
Yum Brands 2005McDonald’s 2007Burger King 2008Whole Foods Market 2008Subway 2008Bon Appetit ManagementCompany
2009
Compass Group 2009Aramark 2010Sodexo 2010Trader Joe’s 2012Chipotle Mexican Grill 2012Walmart 2014The Fresh Market 2015Ahold USA 2015
Source: FFSC, 2016.
ISSN 2047-3710 International Journal of Agricultural Management, Volume 7 Issue 184 & 2018 International Farm Management Association and Institute of Agricultural Management
Farm labor management trends Fritz M Roka and Zhengfei Guan
global markets. Added costs from importing foreignworkers, managing higher minimum wage rates, and/oradjusting to CSR practices force unit costs of productionhigher and erode the competitive position of Floridagrowers.
Offsetting some of the costs associated with guestworkers and higher minimum wages are benefits, some ofwhich could be significant. In addition to the direct costoffsets of not paying social security and unemploymenttaxes to foreign workers, the same contractual obliga-tions that reduce in-season flexibility to terminate work-ers, allows for a more efficient hiring process. Employersprior to entering the H-2A program complained of highworker turnover rates (Roka, 2017b). When relying ondomestic workers, they had to process two to four timesthe number of job applicants throughout the season inorder to secure a sufficient number of workers. With thecontractual format of the H-2A program, an employerprocesses and hires only the number of workers needed.In addition, the contractual certainty of an H-2A work-force allows an employer to plan more efficiently howto manage workers across the entire contract period.More importantly, H-2A employers have the opportunityto ‘‘build’’ workforce productivity over time. That is, themost productive H-2A workers are identified and invitedback the following year. Over successive years, an H-2Aemployer can increase the productivity of his or her overallworkforce and create additional efficiencies that are derivedfrom a workforce that is familiar and comfortable with theoperational environment of the company (Roka, 2017b).
The trend of increasing numbers of H-2A workers inthe Florida specialty crop industries is expected tocontinue. On one hand, this trend reflects the gravity oflabor shortage problems and the serious economic con-sequence of not having enough labor to grow and harvestthe crops (Guan and Wu, 2018). On the other hand, it sug-gests having a stable and secure labor force under contracthas a value to specialty crop growers. As an example,consider strawberries. Strawberry yields fluctuate and aresubject to high uncertainties over the season. Further, thecrop is highly perishable and fruit prices are sensitive tosupply. Berries need to be harvested every two to threedays and shipped to the market in a relatively short time(Wu, Guan, and Whitaker, 2015). Fruit perishability,volatile yields, and market prices create risks, which canbe mitigated to some extent by having a stable and securelabor force to ensure timely harvest, and handling that iscritical for strawberry growers. Guan and Wu (2018)proposed a model to quantify the economic value of theavailability and stability of labor force, which justifies thegrowth of the H-2A hiring within the strawberry industry.
The principles of corporate social responsibility (CSR)are becoming more integrated into agricultural opera-tions. CSR is being driven by retail companies, which aremandating adoption of CSR guidelines throughout theirsupply chain. For agricultural producers within such asupply chain, market access of their products will bedependent on their adoption of CSR principles. The CIW/FFSC model aggressively enforces its code of conduct.Those growers who violate the code are debarred fromthe Fair Food Program and unable to sell their fruit to‘‘participating buyers,’’ many of whom are their primarybuyers (Asbed and Hitov, 2017).
The cost of adopting many CSR components shouldbe minimal, as federal and state laws already require
many of these components. CSR certification, however,will involve the costs associated with third-party auditsand additional record keeping requirements that are partof any certification process (Roka, 2016). Probably, thebiggest challenge for many agricultural employers toadopt CSR principles will be adjusting their managementpolices to be more inclusive of worker input and imple-menting a worker grievance system which will empowerworkers to challenge long-standing employer policies(Asbed and Hitov, 2017).
Potential benefits of CSR certification are two-fold.First, some evidence exists that working conditionsare correlated directly to worker productivity (Billikopf1999; 2001). If the culture of CSR enhances the workplaceenvironment, then one should expect an improvement inoverall productivity and/or cost efficiency. Any improve-ment in worker productivity offsets to some degreethe adverse cost implications of higher minimum wages.A second benefit could be in the form of market accessbeyond the punitive consequences found in the CIW/FFPmodel. Florida tomato and citrus growers often cite U.S.regulations, particularly with respect to agricultural labor,as creating a competitive disadvantage with foreigngrowers. If social responsibility or social justice idealsresonate sufficiently among US and foreign consumers,retail brands and their affiliate suppliers who embraceCSR may realize benefits in terms of greater marketshare and perhaps, at higher prices. At the very least,widespread demand for production under CSR princi-ples will force foreign agricultural producers to adopt aCSR framework and thereby incur additional costsassociated with CSR compliance that may not be requi-red by their respective governments.
Concluding comments
Farm labor trends in the United States suggest that gro-wers will have to hire more H-2A foreign guest workers,pay higher wages, and comply with more robust CSRrules and practices. These trends are challenging growersto rethink their traditional labor management policies.Pre-employment costs to hire guest workers and risingminimum wage rates push total costs higher and coulderode the competitive position of Florida fruit and vege-table growers as they compete in an increasingly globalmarketplace. Recognizing the evolving trends shouldhelp employers to adjust appropriately to the changingconditions. Those employers who embrace the potentialpositive aspects of these changes may actually enhancetheir future economic sustainability. For example, thestructure of the current H-2A guest worker program pro-vides incentives for employers to recruit, train, and retaintheir most productive workers. The principles guidingcorporate social accountability could foster a more colla-borative working environment by increasing the engage-ment between company supervisors and workers, whichin turn could increase the likelihood of improving overallefficiency within the farming operation.
To address ongoing changes in the farm labor market,specialty crop growers in Florida will need to innovateand adjust to the new market, policy, and productionenvironments. In particular, the development of labor-saving technologies is a necessity to bring down thecost of production, which is essential to keep any indu-stry competitive in the face of global competition.
International Journal of Agricultural Management, Volume 7 Issue 1 ISSN 2047-3710& 2018 International Farm Management Association and Institute of Agricultural Management 85
Fritz M Roka and Zhengfei Guan Farm labor management trends
Labor cost-saving systems and technologies include notonly mechanical/robotic harvesting devices, which replacemanual labor, but also new production systems, such asnew plant cultivars, bed designs, or other changes, whichcould enhance the productivity of manual labor. Thesesolutions, however, are often beyond the capabilities ofindividual growers. Even for the largest corporations, thesetechnological innovations may be beyond their controlbecause their expertise and overall business plan is onproduction and marketing of their crops and not inresearch and development. Research projects often takea long time to develop a useful and cost-effective pro-duct. Public funds from state and federal governmentswill be needed to develop the new technologies to increaselabor efficiencies.
At the policy level, government officials may negotiateor re-negotiate trade agreements more favorable for U.S.growers. Buyers of foreign grown fruit and vegetablescould also encourage adoption of good labor manage-ment practices to make it consistent among all sources ofproducts, imported or domestically produced. Whetherthis would occur and the extent to which such practicescan be effective depend on the degree of social awarenessamong consumers and market forces behind consumerpreferences.
About the authors
Fritz Roka is an associate professor of Food and ResourceEconomics with the University of Florida, Institute ofFood and Agricultural Sciences, at the Southwest Researchand Education Center. Dr. Roka’s research and extensionprograms focus on farm management and agriculturallabor management associated with seasonal and migrantfarmworkers.
Zhengfei Guan is an assistant professor of Food andResource Economics with the University of Florida, Insti-tute of Food and Agricultural Sciences, at the Gulf CoastResearch and Education Center. Dr. Guan’s research andextension programs focus on farm management, agricul-tural labor and market analysis of specialty crops.
Acknowledgements
Funding support came in part from the University ofFlorida Citrus Initiative and from a USDA SpecialtyCrop State Block Grant, Finding Viable Labor Solutions.
REFERENCES
Asbed, Greg and Steve Hitov. (2017). Preventing forced laborin corporate supply chains: the fair food program andworker-driven social responsibility.Wake Forest Law Review,52(2017), 497–531.
Barbassa, Juliana. (2010). Farmworkers’ challenge: Take ourjobs! Associated Press. http://www.nbcnews.com/id/37906555/ns/business-us_business/t/farm-workerschallenge-take-our-jobs/#.Wl5YJa6nHcs. Accessed Jan 5, 2018.
Ballotpedia. (2016). California ‘‘Fair Wage Act of 2016’’. https://ballotpedia.org/California_%22Fair_Wage_Act_of_2016%22_$15_Minimum_Wage_Initiative_(2016). Accessed Feb 4,2017.
Billikopf, G.E. (2008). Designing an effective piece rate. Uni-versity of California, Agricultural Labor Management. https://nature.berkeley.edu/ucce50/ag-labor/7research/7calag06.htm.Accessed Jan 8, 2017.
Billikopf, G.E. (2001). Interpersonal communication topsconcerns of farm supervisors. California Agriculture, 55(5),40–43. Retrieved from http://ucanr.edu/repositoryfiles/ca5505p40-68932.pdf. Accessed September 19, 2017.
Billikopf, G.E. (1999). Farmworkers positive about their jobs, butsuggest improvements. California Agriculture, 53(1), 33–36.Retrieved from http://ucanr.edu/repositoryfiles/ca5301p33-67360.pdf. Accessed September 19, 2017.
Brown, G.K. (2005). New mechanical harvester for the Floridajuice industry. HortTechnology, 15(1), 69–72.
Carlton, M. (2016). Director of Labor Relations Florida Fruitand Vegetable Association, personal communication, Sep-tember 12, 2016.
Coalition of Immokalee Workers (CIW). (2017). Fair Food Pro-gram. http://www.fairfoodprogram.org/ Accessed Feb 4,2017.
Department of Labor (DOL). (2016). Employment Law Guide:Work Authorization for Non-U.S. Citizens: Temporary Agri-cultural Workers (H-2A Visas). https://webapps.dol.gov/elaws/elg/taw.htm Accessed September 14, 2017.
Department of Labor – Employment and Training Agency (DOL-ETA). 2011-2016. Annual Performance Data by State –Florida. Office of Foreign Labor Certification. http://www.foreignlaborcert.doleta.gov/pdf/PerformanceData/. AccessedJan 15, 2017.
Department of Labor – Employment and Training Agency (DOL-ETA). (2017). Annual Performance Data by State – Florida.Office of Foreign Labor Certification. https://www.foreignlaborcert.doleta.gov/pdf/PerformanceData/2017/H-2A_Selected_Statistics_FY2017_Q4.pdf. Sep 30, 2017. AccessedJan 2, 2018.
Doyle, Alison. (2016). What does employment at will mean? TheBalance, Oct 27, (2016). https://www.thebalance.com/what-does-employment-at-will-mean-2060493. Accessed Jan 10,2018.
Employment and Training Administration. (2014). The NationalAgricultural Workers Survey. United States Department ofLabor. http://www.doleta.gov/agworker/naws.cfm. AccessedSeptember 13, 2017.
Fair Food Standards Council (FFSC). (2016). Fair Food Pro-gram, 2015 Annual Report. http://fairfoodstandards.org/15SOTP-Web.pdf. Accessed September 18, 2017.
Florida Department of Agriculture and Consumer Sciences(FDACS). (2017). Florida Crops Seasonal Availability / TypicalHarvest Times. http://www.freshfromflorida.com/Divisions-Offices/Marketing-and-Development/Consumer-Resources/Buy-Fresh-From-Florida/Crops-in-Season. Accessed Jan 10,2018.
Florida Department of Citrus. (2012). Citrus Mechanical Har-vested Acreage. http://citrusmh.ifas.ufl.edu/index.asp?s=2&p=2. Accessed Oct 16, 2012.
Florida Department of Elections. (2004). Florida Minimum WageConstitutional Amendment. http://dos.elections.myflorida.com/initiatives/fulltext/pdf/37732-1.pdf Accessed Feb 4,2017.
Florida Department of Health (FDOH). (2018). Migrant Farm-worker Housing. http://www.floridahealth.gov/environmental-health/migrant-farmworker-housing/index.html. AccessedMarch 8, 2018.
Guan, Z. and Wu, F. (2018). Modeling the Choice betweenForeign Guest Workers or Domestic Workers Working Paper,Gulf Coast Research and Education Center, University ofFlorida.
Guan, Z. (2016). Strawberry Industry Labor Survey, 2016.Unpublished data, Gulf Coast Research and EducationCenter, University of Florida.
Guan, Z., Wu, F., Roka, F.M. and Whidden, A. (2015). Agricul-tural labor and immigration reform. Choices, 30(4), 1–9.
Gunderson, M.A., Wysocki, A. and Sterns, JA. (2009). A Func-tional Evaluation of Business Models in Fresh Producein the United States. In Postharvest Handling, 129–152.Elsevier Inc.
Harkinson, Josh. (2017). Trump’s plan to make America greatagain using cheap foreign labor. Mother Jones, Mar 14, 2017.
ISSN 2047-3710 International Journal of Agricultural Management, Volume 7 Issue 186 & 2018 International Farm Management Association and Institute of Agricultural Management
Farm labor management trends Fritz M Roka and Zhengfei Guan
http://www.motherjones.com/politics/2017/03/trump-guestworker-h2a-visa-farmworkers-immigration/. Accessed Jan 15,2018.
Henkle, D. (2005). GAP Inc. sees supplier ownership of com-pliance with workplace standards as an essential elementof socially responsible sourcing. Journal of OrganizationalExcellence (Winter 2005):17–25.
IRSa. (2017). Employer Social Security and Medicare Rates.https://www.irs.gov/individuals/international-taxpayers/federal-unemployment-tax Accessed 22 April 2017.
IRSb. (2017). Federal FUTA Rates. https://www.ssa.gov/oact/progdata/taxRates.html. Accessed 22 April 2017.
Martin, Philip. (2017). H-2A Farm Guest Workers ProgramExpanding Rapidly. http://www.epi.org/blog/h-2a-farm-guestworker-program-expanding-rapidly/ Accessed September 14,2017.
Monty, J.M. (2017). Employment verification nightmares: fake(-9s, bad social security numbers, and reverification catch-22. HR Hero Line, July 12, 2017. http://www.hrhero.com/hl/articles/2017/07/12/employment-verification-nightmares-fake-i-9s-bad-social-security-numbers-and-reverification-catch-22/. Accessed Jan 15, 2018.
NC Farmworker Institute. (2007). United States FarmworkerFactsheet. https://www.saf-unite.org/content/united-states-farmworker-factsheet. Accessed Jan 10, 2018.
Rojas, M.J. (2016). Costos de produccion y de comercializacionde jitomate (Solanum Lycopersicum L.) bajo condiciones deinvernadero en ocopulco, Chiautla, Mexico. http://ri.uaemex.mx/bitstream/handle/20.500.11799/65808/Tesis%20Manuel%2006%20junio%202016.-split-merge.pdf?sequence=5. Acces-sed Aug 31, 2017.
Roka, F.M. (2017a). Navigating the H-2A Program. CitrusIndustry Magazine, 99(9), 12–15.
Roka, F.M. (2017b). Competing perspectives on the H-2A visaprogram. Unpublished data.
Roka, F.M. (2016). SA8000: Social accountability coming to afarm near you. 2016 Proceedings of the Florida TomatoInstitute PRO. 532, 21–23.
Roka, F.M. (2012). Outlook on Agricultural Labor in Florida,2012-13. http://www.fred.ifas.ufl.edu/pdf/webinar/labor_roka.pdf. Dec 6, 2012.
Roka, F.M. and Cook, D. (1998). Farmworkers in SouthwestFlorida. Final report to the Southwest Regional PlanningCouncil, North Fort Myers, FL, October 1998, 48 pp. http://www.spikowski.com/documents-Lee/FarmworkersinSWFlorida.pdf. Accessed Feb 1, 2017.
Roka, F.M., Simnitt, S. and Farnsworth, D. (2017). Pre-employment costs associated with H-2A agricultural workersand the effects of the ‘60-minute rule.’ International Food andAgribusiness Management Review, 20(3), 335–346.
Rusnak, Paul. (2017). Robotic strawberry picker ramping upfor rollout. Growing Produce, June 13, 2017. http://www.growingproduce.com/fruits/berries/robotic-strawberry-picker-ramping-up-for-rollout/. Accessed Jan 15, 2018.
Schell, Greg. (2016). Attorney, Migrant Farmworker JusticeProject. Personal Communication. April 27, 2016.
United States Department of Agriculture National Agricul-tural Statistics Service. (USDA-NASS). (2013). Florida Agri-cultural Facts. Retrieved from http://www.nass.usda.gov/Statistics_by_State/[state]/Publications/FLQuickFactSheet.pdf. Accessed Feb 1, 2017.
United States Department of Agriculture (USDA). (2014). Defi-nition of specialty crops. https://nifa.usda.gov/sites/default/files/resources/definition_of_specialty_crops.pdf. AccessedSep 7, 2017.
VanSickle, J. and McAvoy, E. (2016). Production Budget forTomatoes Grown in Southwest Florida and in the Palmetto-Ruskin Areas of Florida. http://www.fred.ifas.ufl.edu/extension/commodity-production-budgets/. Accessed September 19,2017.
Wu, F., Guan, Z. and Garcia-Nazariega, M. (2017). Comparisonof Labor Costs between Florida and Mexican StrawberryIndustries. EDIS FE 1013. Gainesville, FL: University ofFlorida, Institute of Food and Agricultural Sciences. In Press.
Wu, F., Guan, Z. and Whitaker, V. (2015). Optimizing yield dis-tribution under biological and economic constraints: Floridastrawberries as a model for perishable commodities. Agri-cultural Systems, 141, 113–120.
Zurn, M.A. (2016). Migrant and seasonal farmworker (MSFW)outreach plan. Draft report to the Southwest Florida Work-force Development Board Inc, Career Source SouthwestFlorida, July 21, 2016.
International Journal of Agricultural Management, Volume 7 Issue 1 ISSN 2047-3710& 2018 International Farm Management Association and Institute of Agricultural Management 87
Fritz M Roka and Zhengfei Guan Farm labor management trends
VIEWPOINTDOI: 10.5836/ijam/2018-07-01
Agricultural break pointJOHN VARLEY1
It is clear that we are at an agricultural break point,potentially on a scale not seen since at least the 1970s: forthe first time in more than 40 years, the UK governmenthas an opportunity to take control of agricultural policy.However, while most commentators are focusing onBrexit, there are other linked disruptors that may shapethe future for those who own and manage land-basedbusinesses:
1. consumers, markets and trade;2. competitiveness and productivity;3. rural economy priorities;4. environmental awareness.
Consumers, markets and trade
Consumers have always wanted inexpensive, high-qualityand safe food, and they now have more informationabout it at their fingertips. They more than governmentshave the power to change industries, as can be seen in thesuccessful pressuring of Primark to think harder aboutconditions in its factories in Asia. Social media andconnectivity are also driving shifts in consumer thinkingand behaviour; my youngest daughter is 18 and has beena committed vegan since watching the documentaryCowspiracy, for instance.
Over the past 50 years or so, spending on food hasfallen from around 40% to 11% of household income(British Nutrition Foundation, 2017). For some, though,11% is still too high, and Policy Exchange, a right-wingthink tank, claims that UK food prices remain higherthan in a pure market. There is emerging opinion (eg.Lightfoot et al., 2017) that a significant cause of perceivedhigher prices has been the combination of tariffs andagricultural support, increasing costs and subsidisinginefficient methods of production.
But some fear that lower prices will come at theexpense of lowering standards. In the EU, the EuropeanFood Standards Agency has adopted an approach basedon the precautionary principle, leading to a divergencebetween producers in and outside the union; for example,the EU bans products such as chlorinated chicken,hormone-treated beef and genetic modification, whichare permitted elsewhere.
There is pressure for the UK to adopt a more objective,scientific and evidence-led approach to food standardsonce it leaves the EU, though this may bring bothopportunity and risk. What we should expect is muchmore transparency and accreditation to help consumers
make informed choices. The British Red Tractor2 schemeis already looking at slurry capacity on dairy farms andthere is talk of a Green Tractor label considering widerenvironmental outcomes. But is this enough?
At Clinton Devon Estates, in the South West ofEngland, we are funding research to understand and reducethe environmental impacts of our business, includingmonitoring the links between our farming practices andwater quality downstream, with a view to making thedata available publicly. We take our responsibilities notto pollute water very seriously, and know that societyincreasingly expects such a protective approach to theenvironment.
Competitiveness and productivity
In 2015/16, more than half of the UK’s farms earned lessthan d20,000, and 42% made no profit at all; income perworker remains only d19,000 a year (Defra 2017). Thesestatistics would make most investors that are not lookingfor tax breaks steer well clear.
Total income from UK farming is d3.6 bn, includingsubsidies of d3.1 bn (Defra 2018a) or 87% of totalincome. The existing financial model for agriculture doesnot appear robust and neither does it offer confidence forthe future – especially if direct subsidies will be reducedand the outcome of new international trade agreementsremains uncertain.
British farmers used to be among the most productivein the world, especially in the 1970s. In recent decades,however, productivity has stagnated and is now belowthat of numerous other countries and many farms todayare not sustainable without substantial subsidy. Mana-ging the withdrawal of farming support is thereforegoing to be central for the new domestic policy. The goalshould be to create a highly productive, dynamic farmingsector that is more specialised and capable of competingin global markets.
The low productivity of UK agriculture cannot beblamed entirely on the EU’s Common Agricultural Policy(CAP): other member states have seen better perfor-mance, despite the negative influences of the regime.Cuts to investment in research and development, highland prices, energy costs and an ageing and non-specialistworkforce have all had an impact. As a sector, we need todemonstrate active leadership in addressing these issues.Technology, skills, new business models and innovationwill surely have a role to play.
1Corresponding author: Estate Director at Clinton Devon Estates. Email: [email protected] https://www.redtractor.org.uk/?src=landing
Original submitted October 2018; accepted October 2018.
International Journal of Agricultural Management, Volume 7 Issue 2 ISSN 2047-3710& 2018 International Farm Management Association and Institute of Agricultural Management 1
We need to establish the next generation of farmingleaders, with succession based on merit and entrantsencouraged from new backgrounds. The median age ofBritish farmers is 60 (Defra, 2018) compared to 40 inthe workforce as a whole. But bringing young peopleinto farming is not straightforward, given the high costof buying or renting land, expensive rural housingand poor career paths. An irony of one of the coreobjectives of the CAP, ‘‘the creation and maintenanceof employment’’, is that UK employment in agriculturehas fallen dramatically from more than 3% of theworkforce in 1960 to just above 1% today (Lightfootet al., 2017).
Subsidies allow investment in mechanisation, substi-tuting capital for labour. CAP support proportionatelybenefits larger farms, which grow more rapidly thansmaller ones. Since 2005 the number of smaller farmshas shrunk, with the average size of holdings rising from69 ha to 80 ha. As technology and machinery get moreexpensive, there is pressure on the larger farms to growand spread costs. The smaller farms, on marginal land,may have neither the capital nor the opportunity to takeon more land. CAP support is in many cases the onlydriver of on-farm investment. Without the policy or anew business model, the consequences for farm viability,or improved performance, may be bleak.
There is nevertheless an opportunity to evolve newforms of collaboration between farming enterprises,different types of ownership, landlords and tenants andnon-farming enterprises to drive benefits and invest-ment in skills and capital. At Clinton Devon, we havecommissioned legal opinion on a concept called a ‘‘coopera-tive contracting agreement’’, where a landlord and oneor more tenants form an LLP, or similar, to establish anew kind of business partnership valuing relative inputsincluding land ownership, tenancy valuation and assets,and enabling all parties to take a role in the governanceof a professionally managed farming operation.
The industry should be benchmarking itself againstnot just the most efficient farming enterprises globallybut also against other industries, being the best in classfor procurement, business processes, human resources,skills and financing. We need to upskill and ensure thatfarmers have the knowledge to make more informeddecisions, increasing productivity and competitiveness.We also need to focus on health, safety and well-being:agriculture is in the spotlight for its woeful record inserious work-related injury, fatalities and mental health.
The opportunity to change work practices also appliesto animal health, in which the UK is a leader, althoughthere is much more to do. We need to embed animalhealth along with workplace safety in our business-as-usual practices. This should be a unique selling point,a clear example of the high standards for which we strivethat can be used to differentiate our products.
As business leaders, we should be commissioningresearch and development and knowledge transfer, pro-viding the tools to help farming enterprises make thetransition to new business models and developing centresof academic excellence. Our local colleges and univer-sities should be rising to the challenge, reinventing them-selves to be ready to support future industry models withscience and evidence rather than unguided research orcourses, pointing the most able students to careers inagriculture – careers in a globally competitive business
that exploits emerging technology, artificial intelligenceand science.
Qualifications and licensed training must also becomeprerequisites for some agricultural roles, perhaps leadingto the introduction of the ‘‘Chartered Farmer’’? Fores-ters, environmentalists and other professions involvedin land management provide a route to chartered status.For farming, chartered farmer would recognise theimportance and professionalism of the farmer’s roleand, whilst not every farmer would be expected to seekchartered status (as continuous professional developmentwould be the underlying benefit of repositioning farmingas a profession), the farming industry would be seen asbeing one worthy of attracting highly motivated andqualified individuals and offering life-long learning insatisfying and rewarding careers.
Rural economy priorities
There are obvious synergies between agriculture andrural economies. But agriculture is no longer the biggestemployer, and in terms of gross value added (GVA),agriculture, forestry and fishing combined represent just2% of the overall rural economy and 0.55% nationally.However, is GVA the right measure?
My experience is that, in Devon, policymakers haveundervalued agriculture’s contribution to the localeconomy. After the 2001 foot-and-mouth disease out-break, our estate struggled to get the then South Westof England Regional Development Agency to takeseriously the need to support land-based business in therecovery. There was a level of ignorance then, and evennow some Local Enterprise Partnerships (LEPs) andlocal authorities view agriculture and forestry as some-thing other than a real business: their plans need torecognise the value of land-based business to the economy,support joined up strategies to attract investment anddevelop the skills required to sustain and grow successfulfarming and forestry enterprises.
Valuing natural capital is gaining traction, which ispotentially a big disruptor, both in policy and marketterms. The challenge is how value can be generated fromthe natural capital that farmers in rural areas provide,including the value created from food and fibre produc-tion, renewable energy generation, wildlife, air pollutionremoval, waste water cleaning, flood protection andeducation. The value of day trips alone to the naturalenvironment is estimated to be d6.5 bn – not far belowthe entire GVA of agriculture. Many of these visits are toexperience an environment delivered by farmers – so willfarmers get paid for it?
Environmental awareness
Agriculture dominates land use in the UK. Farmers,foresters and land managers can shape the environmen-tal costs and benefits resulting from their work andmake a huge difference to the value and quality of thiscountry’s natural capital. The challenge is to decoupleagricultural production from environmental degrada-tion, so that agriculture can continue to meet increasingdemand for food without putting undue pressure onnatural resources.
Agriculture’s contribution of 0.55% of UK GVAcontrasts with its generation of 10% of total greenhouse
ISSN 2047-3710 International Journal of Agricultural Management, Volume 7 Issue 22 & 2018 International Farm Management Association and Institute of Agricultural Management
Agricultural break point John Varley
gas emissions. Other significant environmental impactsfrom UK agriculture are associated with water pollution,air pollution, soil degradation and the impact on bio-diversity; indeed, in 2017 agriculture became England’snumber one polluter of water.
The costs to society of cleaning up these impacts arehuge and are met by taxpayers by, for instance, an extrad100 m on water bills, and the government is looking toreform agricultural policy after Brexit to reduce these.Soil degradation is already in the spotlight, with anestimated 2.2 m tonnes of soil eroded each year in UKcatchments, costing d1 bn.
At Clinton Devon, we are working with the localcatchment partnership to install sediment traps, monitoroutcomes and host farm visits. It is widely argued thatthere has been a decline in on-farm biodiversity as aresult of increasingly homogenous landscapes. Whileentering Mid-Tier Stewardship, Clinton Devon farms areusing the options to complement and support our ownnature improvement strategy and optimise outcomes forwildlife. Our recent management contract with Velcourtto run the in-hand organic dairy is novel in that, as wellas agreeing financial performance targets, we have includeddevelopment of goals for biodiversity, the environment,animal health and employee satisfaction. These are beingjointly agreed and reviewed annually, ensuring that thefarm is achieving year on year improvement in biodiver-sity, animal health and employee engagement. The firstformal targets will be in place from April 2019.
We have also just let a farm not for the highest rentbut on a balanced scorecard of financial return andalignment of objectives for Cirl buntings3, improved soilquality and education. We have also invested in com-prehensive soil and bird and butterfly surveys to bench-mark agreed targets over the course of our partnershipwith the tenant. This is now our model for all newtenancies, and we are undertaking soil analysis on somealready tenanted land to identify improvements as well.
We need to understand what we are stewards of todayby commissioning audits and working on a landscape orcatchment scale across farm boundaries, to be ready toprovide what society wants. In 2016, at Clinton Devon,we undertook a comprehensive audit of 3,108 speciesacross the Pebblebed Heaths Site of Special ScientificInterest4. We now have baseline evidence to improvefuture conservation management. Recently, we published
our Wildlife Prospectus – Space for Nature which iden-tified all the important areas for biodiversity across theEstate, along with our key partnership projects. Fromthis we have developed 13 priorities for action thatwe are discussing with our farm tenants, commercialpartners and stakeholders with a view to implementingintegrated, landscape-scale conservation improvementschemes.
Opportunity
These four areas of disruption present a once-in-a-generation opportunity for reform and putting agricul-ture and land-based businesses back into the heart ofthe rural economy where they belong. Many feel it isour collective role to challenge the policymakers andpoliticians to own the problem on behalf of farmers byensuring continuity and stability. But isn’t it our role toquestion our own business models and transform them tobe fit for the future?
About the author
With UK agriculture facing many disruptions, includingBrexit, John Varley OBE TD, Estate Director at ClintonDevon Estates (10,000 ha rural estate and propertybusiness centred on land holdings in north and eastDevon in the South West of England), considers howemerging trends may shape land-based rural businessesover the next few years.
REFERENCES
British Nutrition Foundation (2017). 75 years of Family Food.https://www.nutrition.org.uk/nutritioninthenews/new-reports/75yearsfamilyfood.html
Defra (2018a). The Future of Farming and Environment EvidenceCompendium. https://assets.publishing.service.gov.uk/government/uploads/system/uploads/attachment_data/file/683972/future-farming-environment-evidence.pdf
Defra (2018b). Agriculture in the United Kingdom 2017. Defra,London.
Defra (2017). Agriculture in the United Kingdom 2016. Defra,London.
Lightfoot, W., Burke, J., Harvey, N., Dupont, J., Howard, R.,Lowe, R., Norrie, R. and Taylor, M. (2017). Farming Tomor-row: British agriculture after Brexit. Policy Exchange,London.
3 A bird confined to South West England which, after a dramatic decline in numbers up to the
late 1980s, has seen a significant expansion in numbers thanks to changes in agricultural land
management practices.4 https://www.pebblebedheaths.org.uk/
International Journal of Agricultural Management, Volume 7 Issue 2 ISSN 2047-3710& 2018 International Farm Management Association and Institute of Agricultural Management 3
John Varley Agricultural break point
REFEREED ARTICLEDOI: 10.5836/ijam/2018-07-04
Evaluating the multiple benefits ofmulti-layered agroforestry systems
EMMA S. PILGRIM1,2*, JULIET OSBORNE2 and MICHAEL WINTER1
ABSTRACTGlobally, the contribution of own-growers’ to food security is over-looked. We explore a novel temperate,own-growing, agroforestry method that originates from Britain; the forest garden. Inspired by ancienttropical multi-layered homegardens, forest gardens integrate nature and food production. Consequently,they have spread globally despitebeing little researched.We sub-sampled 51 British forest gardens described as: Mature (X15 years old), Young (p10 years old)
or Mixed (Young forest garden with an experienced manager). Using a semi-structured telephone ques-tionnaire, we characterise forest gardens as: diverse food systems containing on average 64.2 (±6.65) pre-dominantly perennial plant species; spread over at least four layers. Typically, they arep0.8 ha; on sloping,low value agricultural land.Forest gardeners are principally motivated by environmental protection and a lifestyle that enhances
well-being. Their diet is broadened by foraging wild plants and common garden species, considered adelicacy in other cultures; thereby reducing their reliance on environmentally challenging annual crops.Forest gardens, like homegardens, could deliver social, economic and environmental benefits. They also
illustrate that exploring ancient cultures and techniques can provide ideas and solutions to our modernfood conundrums. However, combing a holistic academic approach with forest and homegarden practitionerknowledge will enhance our understanding of their alternative crops.
KEYWORDS: perennial; crops; sustainable food production; food security; ethnobotany
1. Introduction
The need for diverse environmentally sensitive produc-tion methods (Pilgrim et al., 2010; Godfray and Garnett,2014; Gunton et al., 2016) is growing with the globalpopulation (United Nations, 2013). Concurrently, ourdesire to know the origin of what is on our plate, whilstimproving our health and well-being (Winter 2018), hasfuelled a burgeoning public interest in growing-your-ownfood (Crouch and Ward, 1994; van den Berg et al., 2010;Coley et al., 2011; Breeze et al., 2012; Goodman et al.,2012; Edmondson et al., 2014). Considering there are anestimated, 800 million worldwide own-growers, in urbanareas alone, producing food, in anything from pots tovegetable plots (Edmondson et al., 2014), they can makea huge contribution to our global food supply.
One advantage of producing food on a smaller scale,is that we can be more inventive with what and how wegrow. The forest garden (Hart, 1993), is a good exampleof this. Described as a low maintenance method, thatpromotes wildlife and food production (Hart, 1993;Crawford, 2010), it is gaining worldwide popularity thoughit has been little researched (Hathaway, 2015). They aredesigned to mimic young woodlands, containing a widevariety of predominantly perennial crops with either edible,
medicinal or practical uses, or any combination of thethree (Crawford, 2010). Food is provided throughout theyear by growing early, mid, and late crops (Mollison,1994; Hart, 2001). The forest gardener’s ancient foragingbased diet (Coppolino, 2016), enables this, consumingplants others consider weeds e.g. Allium triquetrum, aninvasive garlic substitute (Plants for a future, 2016) andAegopodium podagraria, an introduced Roman delicacyand pernicious weed (Wong, 2012). Forest gardenersbroaden their diet by seeking inspiration from other cul-tures e.g. the north American ‘first nations’ who consumedover 200 plant species (Muckle 2014); Fushia berries,enjoyed by Incas; and Hemerocallis common in Asiancuisine (Wong, 2012).
It is a ‘closed’ system whereby the plants provide thenutrients. Species in the Fabaceae family and non-legumessuch as Alnus species provide nitrogen. Symphytum speciesare commonly planted around crop trees as their deeproots are believed to accumulate potassium, a mineralrequired to promote flowering and subsequently fruit ornut growth. Mulching is a common practice with thedual benefit of retaining soil moisture and the recyclingof nutrients from dead plant material.
Intriguingly, plants are stacked in layers (Figure 1)enabling more species to be planted in a small area.
1Centre for Rural Policy and Research, Lazenby House, Prince of Wales Road, University of Exeter, EX4 4PJ.2 Environmental Sustainability Institute, University of Exeter, Penryn Campus, Penryn, Cornwall, TR10 9FE.
*Corresponding author: ORCID ID: 0000-0002-4079-5675, Tel: +44 1392 725 011, Email: [email protected].
Original submitted April 2017; revision received June 2018; accepted October 2018.
ISSN 2047-3710 International Journal of Agricultural Management, Volume 7 Issue 24 & 2018 International Farm Management Association and Institute of Agricultural Management
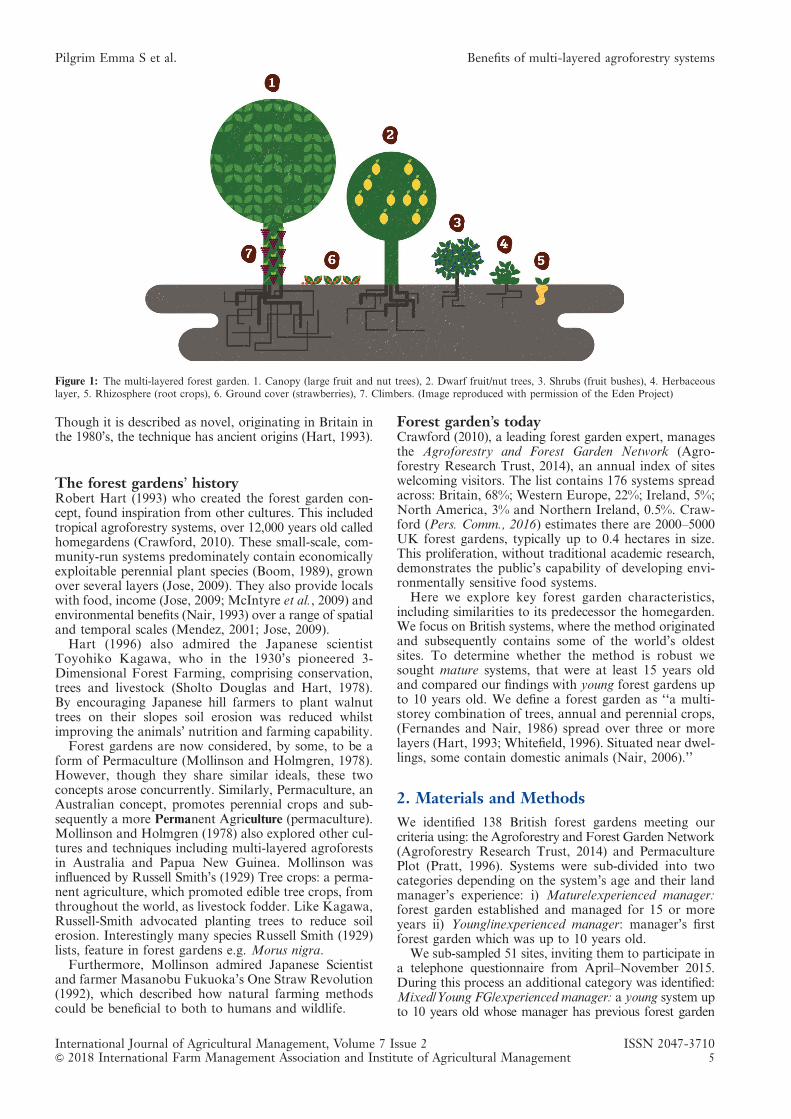
Though it is described as novel, originating in Britain inthe 1980’s, the technique has ancient origins (Hart, 1993).
The forest gardens’ historyRobert Hart (1993) who created the forest garden con-cept, found inspiration from other cultures. This includedtropical agroforestry systems, over 12,000 years old calledhomegardens (Crawford, 2010). These small-scale, com-munity-run systems predominately contain economicallyexploitable perennial plant species (Boom, 1989), grownover several layers (Jose, 2009). They also provide localswith food, income (Jose, 2009; McIntyre et al., 2009) andenvironmental benefits (Nair, 1993) over a range of spatialand temporal scales (Mendez, 2001; Jose, 2009).
Hart (1996) also admired the Japanese scientistToyohiko Kagawa, who in the 1930’s pioneered 3-Dimensional Forest Farming, comprising conservation,trees and livestock (Sholto Douglas and Hart, 1978).By encouraging Japanese hill farmers to plant walnuttrees on their slopes soil erosion was reduced whilstimproving the animals’ nutrition and farming capability.
Forest gardens are now considered, by some, to be aform of Permaculture (Mollinson and Holmgren, 1978).However, though they share similar ideals, these twoconcepts arose concurrently. Similarly, Permaculture, anAustralian concept, promotes perennial crops and sub-sequently a more Permanent Agriculture (permaculture).Mollinson and Holmgren (1978) also explored other cul-tures and techniques including multi-layered agroforestsin Australia and Papua New Guinea. Mollinson wasinfluenced by Russell Smith’s (1929) Tree crops: a perma-nent agriculture, which promoted edible tree crops, fromthroughout the world, as livestock fodder. Like Kagawa,Russell-Smith advocated planting trees to reduce soilerosion. Interestingly many species Russell Smith (1929)lists, feature in forest gardens e.g. Morus nigra.
Furthermore, Mollinson admired Japanese Scientistand farmer Masanobu Fukuoka’s One Straw Revolution(1992), which described how natural farming methodscould be beneficial to both to humans and wildlife.
Forest garden’s todayCrawford (2010), a leading forest garden expert, managesthe Agroforestry and Forest Garden Network (Agro-forestry Research Trust, 2014), an annual index of siteswelcoming visitors. The list contains 176 systems spreadacross: Britain, 68%; Western Europe, 22%; Ireland, 5%;North America, 3% and Northern Ireland, 0.5%. Craw-ford (Pers. Comm., 2016) estimates there are 2000–5000UK forest gardens, typically up to 0.4 hectares in size.This proliferation, without traditional academic research,demonstrates the public’s capability of developing envi-ronmentally sensitive food systems.
Here we explore key forest garden characteristics,including similarities to its predecessor the homegarden.We focus on British systems, where the method originatedand subsequently contains some of the world’s oldestsites. To determine whether the method is robust wesought mature systems, that were at least 15 years oldand compared our findings with young forest gardens upto 10 years old. We define a forest garden as ‘‘a multi-storey combination of trees, annual and perennial crops,(Fernandes and Nair, 1986) spread over three or morelayers (Hart, 1993; Whitefield, 1996). Situated near dwel-lings, some contain domestic animals (Nair, 2006).’’
2. Materials and Methods
We identified 138 British forest gardens meeting ourcriteria using: the Agroforestry and Forest Garden Network(Agroforestry Research Trust, 2014) and PermaculturePlot (Pratt, 1996). Systems were sub-divided into twocategories depending on the system’s age and their landmanager’s experience: i) Mature/experienced manager:forest garden established and managed for 15 or moreyears ii) Young/inexperienced manager: manager’s firstforest garden which was up to 10 years old.
We sub-sampled 51 sites, inviting them to participate ina telephone questionnaire from April–November 2015.During this process an additional category was identified:Mixed/Young FG/experienced manager: a young system upto 10 years old whose manager has previous forest garden
Figure 1: The multi-layered forest garden. 1. Canopy (large fruit and nut trees), 2. Dwarf fruit/nut trees, 3. Shrubs (fruit bushes), 4. Herbaceouslayer, 5. Rhizosphere (root crops), 6. Ground cover (strawberries), 7. Climbers. (Image reproduced with permission of the Eden Project)
International Journal of Agricultural Management, Volume 7 Issue 2 ISSN 2047-3710& 2018 International Farm Management Association and Institute of Agricultural Management 5
Pilgrim Emma S et al. Benefits of multi-layered agroforestry systems
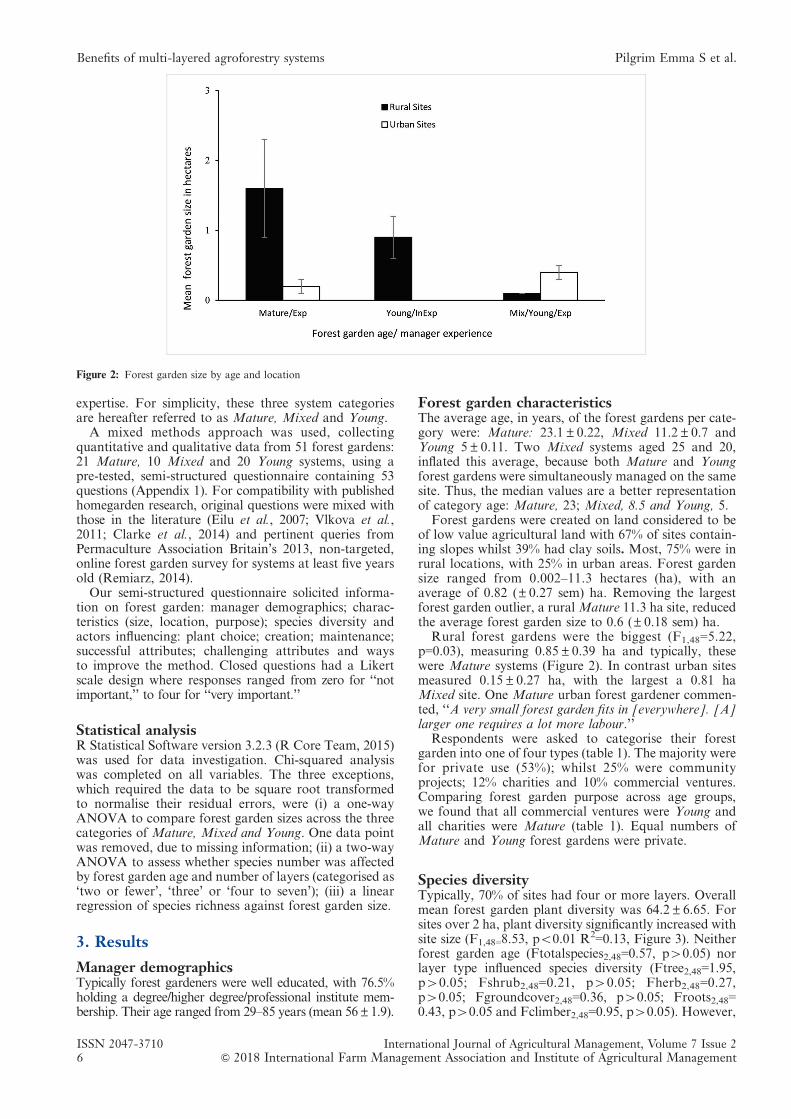
expertise. For simplicity, these three system categoriesare hereafter referred to as Mature, Mixed and Young.
A mixed methods approach was used, collectingquantitative and qualitative data from 51 forest gardens:21 Mature, 10 Mixed and 20 Young systems, using apre-tested, semi-structured questionnaire containing 53questions (Appendix 1). For compatibility with publishedhomegarden research, original questions were mixed withthose in the literature (Eilu et al., 2007; Vlkova et al.,2011; Clarke et al., 2014) and pertinent queries fromPermaculture Association Britain’s 2013, non-targeted,online forest garden survey for systems at least five yearsold (Remiarz, 2014).
Our semi-structured questionnaire solicited informa-tion on forest garden: manager demographics; charac-teristics (size, location, purpose); species diversity andactors influencing: plant choice; creation; maintenance;successful attributes; challenging attributes and waysto improve the method. Closed questions had a Likertscale design where responses ranged from zero for ‘‘notimportant,’’ to four for ‘‘very important.’’
Statistical analysisR Statistical Software version 3.2.3 (R Core Team, 2015)was used for data investigation. Chi-squared analysiswas completed on all variables. The three exceptions,which required the data to be square root transformedto normalise their residual errors, were (i) a one-wayANOVA to compare forest garden sizes across the threecategories of Mature, Mixed and Young. One data pointwas removed, due to missing information; (ii) a two-wayANOVA to assess whether species number was affectedby forest garden age and number of layers (categorised as‘two or fewer’, ‘three’ or ‘four to seven’); (iii) a linearregression of species richness against forest garden size.
3. Results
Manager demographicsTypically forest gardeners were well educated, with 76.5%holding a degree/higher degree/professional institute mem-bership. Their age ranged from 29–85 years (mean 56±1.9).
Forest garden characteristicsThe average age, in years, of the forest gardens per cate-gory were: Mature: 23.1±0.22, Mixed 11.2±0.7 andYoung 5±0.11. Two Mixed systems aged 25 and 20,inflated this average, because both Mature and Youngforest gardens were simultaneously managed on the samesite. Thus, the median values are a better representationof category age: Mature, 23; Mixed, 8.5 and Young, 5.
Forest gardens were created on land considered to beof low value agricultural land with 67% of sites contain-ing slopes whilst 39% had clay soils. Most, 75% were inrural locations, with 25% in urban areas. Forest gardensize ranged from 0.002–11.3 hectares (ha), with anaverage of 0.82 (±0.27 sem) ha. Removing the largestforest garden outlier, a ruralMature 11.3 ha site, reducedthe average forest garden size to 0.6 (±0.18 sem) ha.
Rural forest gardens were the biggest (F1,48=5.22,p=0.03), measuring 0.85±0.39 ha and typically, thesewere Mature systems (Figure 2). In contrast urban sitesmeasured 0.15±0.27 ha, with the largest a 0.81 haMixed site. One Mature urban forest gardener commen-ted, ‘‘A very small forest garden fits in [everywhere]. [A]larger one requires a lot more labour.’’
Respondents were asked to categorise their forestgarden into one of four types (table 1). The majority werefor private use (53%); whilst 25% were communityprojects; 12% charities and 10% commercial ventures.Comparing forest garden purpose across age groups,we found that all commercial ventures were Young andall charities were Mature (table 1). Equal numbers ofMature and Young forest gardens were private.
Species diversityTypically, 70% of sites had four or more layers. Overallmean forest garden plant diversity was 64.2±6.65. Forsites over 2 ha, plant diversity significantly increased withsite size (F1,48=8.53, po0.01 R2=0.13, Figure 3). Neitherforest garden age (Ftotalspecies2,48=0.57, p40.05) norlayer type influenced species diversity (Ftree2,48=1.95,p40.05; Fshrub2,48=0.21, p40.05; Fherb2,48=0.27,p40.05; Fgroundcover2,48=0.36, p40.05; Froots2,48=0.43, p40.05 and Fclimber2,48=0.95, p40.05). However,
Figure 2: Forest garden size by age and location
ISSN 2047-3710 International Journal of Agricultural Management, Volume 7 Issue 26 & 2018 International Farm Management Association and Institute of Agricultural Management
Benefits of multi-layered agroforestry systems Pilgrim Emma S et al.
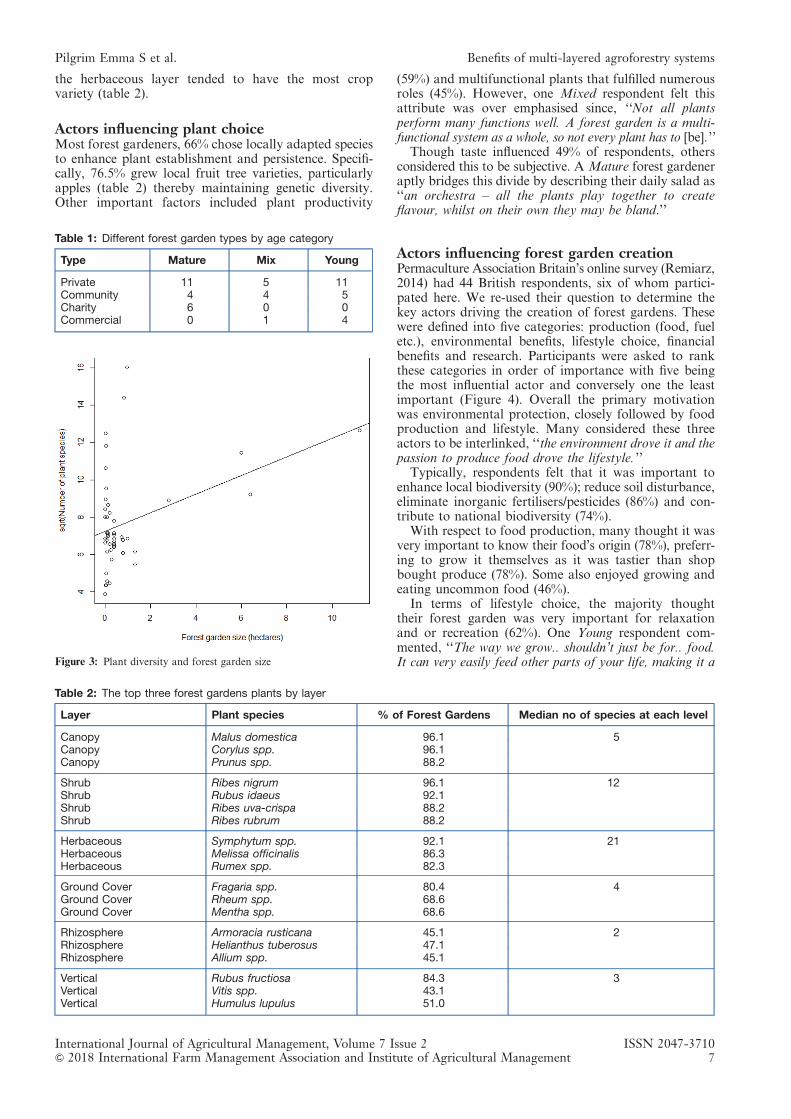
the herbaceous layer tended to have the most cropvariety (table 2).
Actors influencing plant choiceMost forest gardeners, 66% chose locally adapted speciesto enhance plant establishment and persistence. Specifi-cally, 76.5% grew local fruit tree varieties, particularlyapples (table 2) thereby maintaining genetic diversity.Other important factors included plant productivity
(59%) and multifunctional plants that fulfilled numerousroles (45%). However, one Mixed respondent felt thisattribute was over emphasised since, ‘‘Not all plantsperform many functions well. A forest garden is a multi-functional system as a whole, so not every plant has to [be].’’
Though taste influenced 49% of respondents, othersconsidered this to be subjective. A Mature forest gardeneraptly bridges this divide by describing their daily salad as‘‘an orchestra – all the plants play together to createflavour, whilst on their own they may be bland.’’
Actors influencing forest garden creationPermaculture Association Britain’s online survey (Remiarz,2014) had 44 British respondents, six of whom partici-pated here. We re-used their question to determine thekey actors driving the creation of forest gardens. Thesewere defined into five categories: production (food, fueletc.), environmental benefits, lifestyle choice, financialbenefits and research. Participants were asked to rankthese categories in order of importance with five beingthe most influential actor and conversely one the leastimportant (Figure 4). Overall the primary motivationwas environmental protection, closely followed by foodproduction and lifestyle. Many considered these threeactors to be interlinked, ‘‘the environment drove it and thepassion to produce food drove the lifestyle.’’
Typically, respondents felt that it was important toenhance local biodiversity (90%); reduce soil disturbance,eliminate inorganic fertilisers/pesticides (86%) and con-tribute to national biodiversity (74%).
With respect to food production, many thought it wasvery important to know their food’s origin (78%), preferr-ing to grow it themselves as it was tastier than shopbought produce (78%). Some also enjoyed growing andeating uncommon food (46%).
In terms of lifestyle choice, the majority thoughttheir forest garden was very important for relaxationand or recreation (62%). One Young respondent com-mented, ‘‘The way we grow.. shouldn’t just be for.. food.It can very easily feed other parts of your life, making it a
Table 1: Different forest garden types by age category
Type Mature Mix Young
Private 11 5 11Community 4 4 5Charity 6 0 0Commercial 0 1 4
Figure 3: Plant diversity and forest garden size
Table 2: The top three forest gardens plants by layer
Layer Plant species % of Forest Gardens Median no of species at each level
Canopy Malus domestica 96.1 5Canopy Corylus spp. 96.1Canopy Prunus spp. 88.2
Shrub Ribes nigrum 96.1 12Shrub Rubus idaeus 92.1Shrub Ribes uva-crispa 88.2Shrub Ribes rubrum 88.2
Herbaceous Symphytum spp. 92.1 21Herbaceous Melissa officinalis 86.3Herbaceous Rumex spp. 82.3
Ground Cover Fragaria spp. 80.4 4Ground Cover Rheum spp. 68.6Ground Cover Mentha spp. 68.6
Rhizosphere Armoracia rusticana 45.1 2Rhizosphere Helianthus tuberosus 47.1Rhizosphere Allium spp. 45.1
Vertical Rubus fructiosa 84.3 3Vertical Vitis spp. 43.1Vertical Humulus lupulus 51.0
International Journal of Agricultural Management, Volume 7 Issue 2 ISSN 2047-3710& 2018 International Farm Management Association and Institute of Agricultural Management 7
Pilgrim Emma S et al. Benefits of multi-layered agroforestry systems
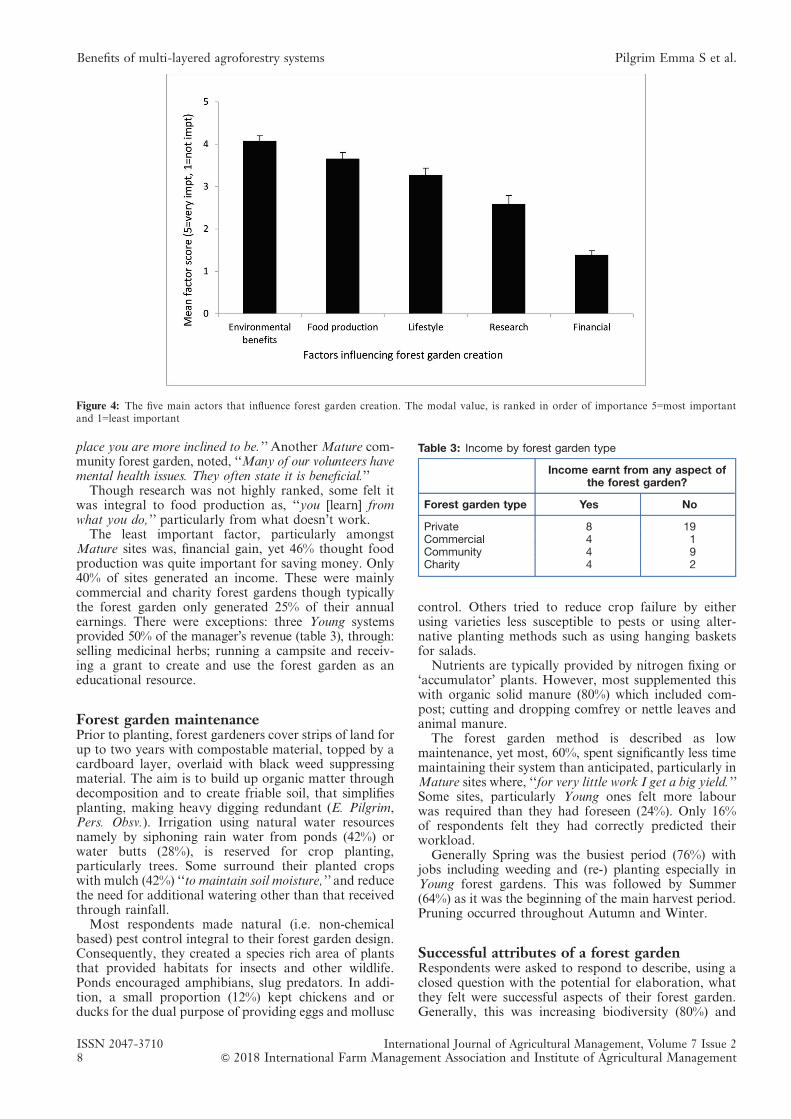
place you are more inclined to be.’’ Another Mature com-munity forest garden, noted, ‘‘Many of our volunteers havemental health issues. They often state it is beneficial.’’
Though research was not highly ranked, some felt itwas integral to food production as, ‘‘you [learn] fromwhat you do,’’ particularly from what doesn’t work.
The least important factor, particularly amongstMature sites was, financial gain, yet 46% thought foodproduction was quite important for saving money. Only40% of sites generated an income. These were mainlycommercial and charity forest gardens though typicallythe forest garden only generated 25% of their annualearnings. There were exceptions: three Young systemsprovided 50% of the manager’s revenue (table 3), through:selling medicinal herbs; running a campsite and receiv-ing a grant to create and use the forest garden as aneducational resource.
Forest garden maintenancePrior to planting, forest gardeners cover strips of land forup to two years with compostable material, topped by acardboard layer, overlaid with black weed suppressingmaterial. The aim is to build up organic matter throughdecomposition and to create friable soil, that simplifiesplanting, making heavy digging redundant (E. Pilgrim,Pers. Obsv.). Irrigation using natural water resourcesnamely by siphoning rain water from ponds (42%) orwater butts (28%), is reserved for crop planting,particularly trees. Some surround their planted cropswith mulch (42%) ‘‘to maintain soil moisture,’’ and reducethe need for additional watering other than that receivedthrough rainfall.
Most respondents made natural (i.e. non-chemicalbased) pest control integral to their forest garden design.Consequently, they created a species rich area of plantsthat provided habitats for insects and other wildlife.Ponds encouraged amphibians, slug predators. In addi-tion, a small proportion (12%) kept chickens and orducks for the dual purpose of providing eggs and mollusc
control. Others tried to reduce crop failure by eitherusing varieties less susceptible to pests or using alter-native planting methods such as using hanging basketsfor salads.
Nutrients are typically provided by nitrogen fixing or‘accumulator’ plants. However, most supplemented thiswith organic solid manure (80%) which included com-post; cutting and dropping comfrey or nettle leaves andanimal manure.
The forest garden method is described as lowmaintenance, yet most, 60%, spent significantly less timemaintaining their system than anticipated, particularly inMature sites where, ‘‘for very little work I get a big yield.’’Some sites, particularly Young ones felt more labourwas required than they had foreseen (24%). Only 16%of respondents felt they had correctly predicted theirworkload.
Generally Spring was the busiest period (76%) withjobs including weeding and (re-) planting especially inYoung forest gardens. This was followed by Summer(64%) as it was the beginning of the main harvest period.Pruning occurred throughout Autumn and Winter.
Successful attributes of a forest gardenRespondents were asked to respond to describe, using aclosed question with the potential for elaboration, whatthey felt were successful aspects of their forest garden.Generally, this was increasing biodiversity (80%) and
Figure 4: The five main actors that influence forest garden creation. The modal value, is ranked in order of importance 5=most importantand 1=least important
Table 3: Income by forest garden type
Income earnt from any aspect ofthe forest garden?
Forest garden type Yes No
Private 8 19Commercial 4 1Community 4 9Charity 4 2
ISSN 2047-3710 International Journal of Agricultural Management, Volume 7 Issue 28 & 2018 International Farm Management Association and Institute of Agricultural Management
Benefits of multi-layered agroforestry systems Pilgrim Emma S et al.
plant establishment (80%). Most, 62% were very satisfiedwith the system commenting, ‘‘It’s fabulous to go.. andpick things. Ay more inspiring way to invent a meal’’;‘‘you don’t get massive gluts; just lots of produce overa longer season which is more enjoyable’’ and, ‘‘it’s abiological pension plan.’’ However less than half felt thatfood production exceeded expectations (46%).
Challenging attributes of a forest gardenA forest garden’s design and the manager(s)’s horticul-tural experience is pivotal to its success. Consequentlydesign, plant choice and maintenance caused somedissatisfaction. During the interview selection process,it became clear that several potential Mature sites hadfailed in the early years through poor planning. Thisincluded planting trees planted too close together, affec-ting light and humidity levels in the lower layers whichpromoted plant-fungal infections.
Mature forest gardens, particularly had to learn throughtrial and error as they were experimenting with cropspecies when plant availability and information werelimited, ‘‘There’s.. more information.. now.. about whatto grow or do. In many ways [it’s] more exciting andenjoyable.’’ Other Mixed forest gardeners felt the paucityof advice, had affected their expectations, ‘‘Things flowerbut not fruit [so] I feel I don’ty get the required know-ledge of.. care.’’
Some felt food production was insufficient comment-ing, ‘‘for a family [it’s] fine. I wouldn’t set it up to feed lotsof people.’’ Two Mature managers, preferred allotmentsfor growing food. Some hadn’t anticipated that it tookat least five years before their trees bore large quantitiesof crops. Forest gardeners with horticultural expertiseensured that there were other additional crops to fill thevoid whilst the trees matured.
Not all respondents enjoyed the unusual produce, ‘‘It’sa good way of growing fruit. For vegetables, you need tolike eating wild.’’ Similarly Mature foraging proponentsonly believe forest gardens will become more widespreadwhen the public accepts different food resources, ‘‘Weneed to treat foraging as window shopping; seeing plantsy..in the local community as.... food.’’ Another Matureforest gardener further explained, ‘‘many wild plants arebitter to our palate because modern food processingmethods have accustomed us to sweeter flavours.’’
Participants’ felt that their greatest unforeseen chal-lenges were: the unpredictability of the weather (68%);pests, particularly grazing deer/rabbits, killing/damagingyoung trees, (58%) and weeds, particularly grassessmothering plants (56%). Whilst some challenges seemobvious, they reflect the range of participant knowledgeand expectation.
Improving the methodThe forest garden’s maintenance often proved challen-ging, particularly for community types. Most responsi-bility lay with, at most, a few individuals. Consequently,suggestions for improving the forest garden methodincluded having: an additional pair of hands (37.3%);more time to spend in it (33.3%) and money (11.8%).However, assistance was a double-edged sword. Theindividual(s) required gardening/horticultural knowledgeto prevent damaging precious plants or failing that directsupervision which took up time.
4. Discussion
Forest garden characteristicsWe provide the first academic assessment of forestgardens. Typically, they are created by well-educated,middle-aged people with similar socio-economic back-grounds, whose primary motive is environmental protec-tion. Most sites are privately owned, indicating thatthe forest gardeners have earnt a disposable income tobuy both the land and the plants. Community venturestypically received temporary start-up grants as no localgovernment scheme existed for planting agroforests exists.
Most forest gardens were rural. Mature systems, esta-blished for 15 years or more years, were targeted toevaluate their vast experience as well as determine themethod’s robustness. Characteristically, these pioneerMature sites are bigger than Young ones. Consequently,larger plots are more likely to be available in rurallocations compared with urban areas. However, ourYoung and Mixed sites were also predominantly rural;perhaps reflecting our selection methods. Future studieswould benefit from exploring more urban locations.
Interestingly, Mixed sites were smaller than Mature orYoung ones (Figure 2). This suggested that experiencedforest gardens realised, like their homegarden counter-parts that smaller systems, measuring up to 0.4 ha(Fernandes and Nair, 1986) have a greater chance ofsuccess. Homegardens are also carefully structured: eachcomponent has a specific space and function (Fernandesand Nair, 1986). System design and management is crucialfor successful plant establishment and production. Eachforest garden is unique, as they are purposefully designedfor each specific location making replication of fruitfuldesigns difficult. Vargas Poveda (2016) began addressingthis, by developing six simplified forest garden arche-types defined by the system’s primary purpose: environ-ment enhancement, production, community involvement,education, recreation and health. These were based onthe 10 eldest, most renowned temperate forest gardens,all UK based.
Most forest gardens were established on land con-sidered to be of poor agricultural value i.e. they were notsuitable for growing traditional annual crops. However,forest gardens can be hugely productive. One Mature 26-year-old Scottish site, produced over 16 tonnes of foodfrom 0.08 ha (James, 2017). Their 2013-2016 harvestcomprised 52% top fruit (predominately apples), 28%vegetables, 12% soft fruit, 4% salads, 2% nuts and 2%herbs (G. Bell, Pers. Comm., 2017).
Plant choiceBoth forest gardens and homegardens are highly diverse(Nair, 2006), containing at least 64, predominantly per-ennial (Boom, 1989) crop species, spread over at leastfour layers (Jose, 2009). Provincial species, that thrive intheir local environment are favoured, thus demonstratingthat forest gardens, like homegardens conserve geneticdiversity (Eilu et al., 2007; Clarke et al., 2014), parti-cularly apple tree varieties, difficult to source elsewhere.
The crop composition is similar between forest gardensites as respondents selected species recommended bytheir role models, Hart (1993) and Crawford (2010).Consequently, like homegardens (Eilu et al., 2007)certain plant traits were considered more important thanothers. Plant function was valued more than its aesthetic
International Journal of Agricultural Management, Volume 7 Issue 2 ISSN 2047-3710& 2018 International Farm Management Association and Institute of Agricultural Management 9
Pilgrim Emma S et al. Benefits of multi-layered agroforestry systems
qualities (Eilu et al., 2007). Multi-functional plants, withat least two attributes are sought (Eilu et al., 2007)though more cautiously in forest gardens than home-gardens. This may reflect the difference in plant knowl-edge exchange between the two systems; in homegardensplant expertise is passed down the generations. Con-trastingly, much of this information in the westernhemisphere has been lost so respondents experimentedwith plants they’ve learnt about from books/videos/sitevisits rather than first-hand experience.
Forest gardens contain a mixture of exotic and nativeplants and are akin to homegardens owned by highincome earners (Eilu et al., 2007; Clarke et al., 2014).This reflects the British flora’s paucity, including ediblespecies, compared with tropical countries. Typical forestgarden exotics are common British garden plants.Crawford (2010) has particularly promoted non-natives;convinced they are more adaptable to climate changethan conventional crops.
Forest gardeners believed like their homegarden coun-terparts, that the food they produced was tastier andmore nutritious, than shop bought produce (Vlkovaet al., 2011). Freshness was key, as food was pickedimmediately before consumption, something unachieva-ble with supermarket produce.
The mixed success of perennial vegetables and forag-ing is due to participant expectation. The food theyfound unpalatable could be attributed to our modernrelatively restricted diet. The austerity measures requiredduring World War One saw a decline in crop diversity,including exotic species, typical in Victorian allotmentslast century (Wong, 2012).
Those with limited botanical/horticultural knowledgeweren’t confident foraging. Many preferred growing dif-ferent, sweeter tasting soft-fruits including Queen Victoria’sfavourite Chilean guava, Myrtus ugni (Wong, 2012).Though conventional soft fruits were common (table 2),Japanese wineberry, Rubus phoenicolasius, was oftenrecommended. This Asian species, has raspberry flavourberries enclosed in their calyx until ripe, limiting birdpredation.
Actors influencing forest garden creationAs the primary motivator for the forest garden was envi-ronmental production, most respondents were delightedthat the system increased wildlife diversity on their sites.Like homegardens the structural and ecological gradientsaffiliated with agroforestry provided a greater varietyof habitats to enable wildlife to flourish (Vlkova et al.,2011; Clarke et al., 2014). This also enhances ecosystemservice delivery: soil nutrient cycling, pollinator diversityand biological pest control (Clarke et al., 2014), boostingfood production and restoration of degraded land e.g.improved grassland (Fern, 1997) and sand dunes. Thisdemonstrates that with a little imagination you can growfood almost anywhere.
Participants lead a non-competitive and non-commerciallife, enhancing their well-being (Crouch and Ward,1994). This is particularly relevant now, when moderntechnology’s proliferation inhibits quality leisure timeaway from our daily pressures. Consequently, doctors inNew Zealand, Australia and the United States, prescribe‘‘Green prescriptions’’ to encourage people outdoors(Hilpern, 2015). Given the benefits people derive from
trees (Bloomfield, 2014), forest gardens would be excep-tionally well placed for this. Most respondents, like theirhomegarden counterparts highly valued the sites as rela-xation spaces and for cultural traditions (Clarke et al.,2014) e.g. apple wassailing, a custom in Southern England’scider orchards, where trees are blessed to encourage agood harvest.
Whilst Mature forest gardeners acknowledged the finan-cial benefits of own-growing, few strived for economicindependence. Contrastingly, commercial viability wasimportant for Young and Mixed sites. Young forestgardens have greater capacity for economic success,benefiting from the knowledge and experience of Maturesites. This functional shift reflects the public’s changein attitude following a harsh economic climate, whilstrecent processed food scares made us question what weeat (Pilgrim, 2014). Foraging is increasingly popular,particularly amongst those with a disposable income,with many top chefs promoting wild plants, which ironi-cally are free. The resurgence in ‘natural’ plant-basedmedicinal remedies provided one Young site with a liveli-hood. Forest garden crops, both native and exotic, havea high economic value relative to allotment produce;Berberis sp. fruits add flavour to breakfast cereals andcandied Angelica sylvestris stem for cake decorations.Product price could be influenced by supply and demand;being only readily available in organic health food stores,and high-end supermarkets (E. Pilgrim, Pers. Obsv.),sought by people with the knowledge to use them. However,it’s premature to judge their financial success as commercialforest gardens had an age range from 4–8 years.
MaintenanceIt is unclear how much labour is required to maintainforest gardens as without a legal obligation to do so, fewrecord this information. Due to the system’s complexity,all the forest gardens benefitted from volunteers. Manyoffered fresh produce in exchange for help. Vargas Poveda(2016) suggests labour could be reduced by groupingplants by harvest period.
One successful food producer (James, 2017), attribut-ing their efficiency to living on site, warning, ‘‘if you don’tlive in permaculture [it] won’t work.’’ This isn’t possiblefor all forest gardens, particularly community ventures.Whilst some bought the land to inhabit, factors beyondtheir control prohibited this; namely local objectioneither from the council, neighbours/others, wary of theirunorthodox methods. Whilst such reactions to Maturesystems were common, one Young forest garden has re-located due to complications over land classification i.e.the land is designated for agricultural use only so nodomestic dwellings are permitted. Another commentedthat their immediate neighbours remain sceptical thoughvisitors come from surrounding towns and villages.Consequently, for many forest gardens their currentprimary product is education, with the aim to allay fearsby demonstrating the system’s benefits.
Potential benefits of forest gardensTwo Mature forest gardens provide their local food bankwith fresh produce; illustrating their potential role forimproving nutrition amongst our society’s neediest.Consequently, forest gardens could: like allotments inthe aftermath of world war one, restore and or nurture
ISSN 2047-3710 International Journal of Agricultural Management, Volume 7 Issue 210 & 2018 International Farm Management Association and Institute of Agricultural Management
Benefits of multi-layered agroforestry systems Pilgrim Emma S et al.
community mental and physical health (Crouch andWard, 1994). This includes integrating the immigrantpopulation for the benefit of society and the environment(Lapina, 2015). This will require the successful combina-tion of: a robust system design, a cohesive managementteam, and supporters/helpers that share similar aims/values. Typically, unsuccessful community venturesfailed to get consistent local support, leading to overalldisillusionment. Thus, new community ventures require:local council support, to gain access to suitable sites;early engagement with the local community, to meettheir needs and; contact with successful ventures tobenefit from their experience.
Potentially forest gardens, like homegardens, can deliversocial, economic and environmental benefits. Globalinterest in forest gardens has inspired the Food ForestInternational Research Network (FFIRN) to promotecollaborative investigation. However, our understand-ing of this method and their alternative crops will beenhanced by combing a holistic academic approach withboth homegarden and forest garden practitioner knowledge.
Conclusion
We need diverse environmentally sensitive productionmethods. Globally, we are heavily reliant annual crops,particularly rice, wheat, maize and potato to meet ourdaily needs. As these need replanting yearly, they increasethe risk of damage the soil and the environment. Byseeking alternative food resources, including perennialcrops, we can both broaden our diet and the potential offinding more sustainable methods of food production.
We have focused on own-growing methods as, givenits global resurgence, we believe that this sector of societycan make a vital contribution to the food supply; some-thing that has previously been overlooked. The forestgarden, with its curious blend of old and new methods,demonstrates that by exploring ancient cultures andtechniques we can find ideas and potential solutions tosolve our modern food conundrums. Through this systemwe have also been introduced to a wide variety of differ-ent crops and cultural uses of plants that can broadenour diet and plant knowledge for the benefit of mankind.
About the authors
Emma S. Pilgrim is an ecologist and Research Fellow inthe Centre for Rural Policy Research at the University ofExeter. Her research interests focus on integrating naturewith food production and investigating alternative foodresources.
Juliet Osborne is Professor of Applied Ecology in and thenew Director of the University of Exeter’s EnvironmentSustainability Institute. Her research investigates howinsects and plants interact within the environment. Thisincludes their role in ecosystem service provision throughcrop pollination and pest regulation. By working closelywith farmers, beekeepers and conservation organisa-tions, she also helps to conserve and promote beepopulations.
Michael Winter is Professor of Land Economy andSociety in Centre for Rural Policy Research. He is a ruralpolicy specialist and social scientist with expertise cover-ing a wide range of environmental issues particularly
applying inter-disciplinary approaches to policy-relevantresearch. His current research focuses on the governanceof sustainable agro-food systems, food security, farmerenvironmental attitudes and decision-making.
Acknowledgement
We thank all participants for their time and enthusiasm.
Funding: This work, undertaken as a Daphne JacksonFellowship, held by ESP, was funded by the Biotechnol-ogy and Biological Sciences Research Council, grantnumber SL-06535.
Original Research: We confirm that this work is alloriginal research carried out by the authors.
Conflict of Interest: The authors declare that they haveno conflict of interest. We also confirm that the workdescribed has not been published before. The manuscriptis not under consideration for publication anywhere elseand its publication has been approved by all co-authors.
Ethical approval: All procedures performed in studiesinvolving human participants were in accordance withthe ethical standards of the University of Exeter’s Collegeof Social Sciences ethical research committee and withthe 1964 Helsinki declaration and its later amendmentsor comparable ethical standards.
Informed consent: Informed consent was obtained fromall individual participants included in the study.
REFERENCES
Agroforestry Research Trust. (2014). The agroforestry researchtrust.
Bloomfield, D. (2014). A dose of nature: addressing chronichealth conditions by using the environment. p. 5.
Boom, B.M. (1989). Use of plant resources by the Chacobo.In: Posey, D.A. and Balee, W. (Eds.), Resource managementin Amazonia: indigenous and folk strategies. pp. 78–114.
Breeze, T.D., Roberts, S.P.M. and Potts, S.G. (2012). Thedecline of England’s bees: policy review and recommenda-tions. London, p. 44.
Clarke, L.W., Li, L., Jenerette, G.D. and Yu, Z. (2014). Drivers ofplant biodiversity and ecosystem service production in homegardens across the Beijing Municipality of China. UrbanEcosystems, 17, 741–760.
Coley, D., Howard, M. and Winter, M. (2011). Food miles: timefor a re-think. British Food Journal, 113, 919–934.
Coppolino, A. (2016). Foraging for food is a return to our ancestralroots CBC News Kitchener-Waterloo. CBC-Radio Canada.
Crawford, M. (2010). Creating a forest garden: working withnature to grow edible crops. Green Books, Dartington.
Crouch, D. and Ward, C. (1994). The allotment: its landscapeand culture. Mushroom Bookshop, Nottingham.
Edmondson, J.L., Davies, Z.G., Gaston, K.J. and Leake, J.R.(2014). Urban cultivation in allotments maintains soil qualitiesadversely affected by conventional agriculture. Journal ofApplied Ecology, 51, 880–889.
Eilu, G., Oriekot, J. and Tushabe, H. (2007). Conservation ofindigenous plants outside protected areas in Tororo District,Eastern Uganda. African Journal of Ecology, 45, 73–78.
Fern, K. (1997). Plants for a future: edible & useful plants for ahealthier world. Permanent, Clanfield.
Fernandes, E.C.M. and Nair, P.K.R. (1986). An evaluation of thestructure and function of tropical homegardens. AgriculturalSystems, 21, 279–310.
International Journal of Agricultural Management, Volume 7 Issue 2 ISSN 2047-3710& 2018 International Farm Management Association and Institute of Agricultural Management 11
Pilgrim Emma S et al. Benefits of multi-layered agroforestry systems
Fukuoka, M. (1992). One straw revolution. Other India Press,India.
Godfray, H. and Garnett, T. (2014). Food security and sustain-able intensification. Philosophical Transactions of the RoyalSociety B-Biological Sciences 369.
Goodman, D., DuPuis, E.M. and Goodman, M.K. (2012). Alter-native food networks: knowledge, practice, and politics.Routledge, London.
Gunton, R., Firbank, L., Inman, A. and Winter, D. (2016). Howscalable is sustainable intensification? Nature Plants 2.
Hart, R. (1993). The forest garden. The Institute of Social Inno-vations, London.
Hart, R. (1996). Beyond the forest garden. Gaia Books, London.Hart, R. (2001). Forest gardening: Rediscovering nature and
community in a post-industrial age. Green Earth Books,Dartington.
Hathaway, M. (2015). Agroecology and permaculture: addres-sing key ecological problems by rethinking and redesigningagricultural systems. Journal of Environmental Studies andSciences, 6, 239–250.
Hilpern, K. (2015). Why your GP may be recommending a doseof the great outdoors in 2016 Independent.
James, S. (2017). Measuring the infinite. Permaculture Maga-zine. Sustainability Centre, East Meon, pp. 41–43.
Jose, S. (2009). Agroforestry for ecosystem services and environ-mental benefits: an overview. Agroforestry Systems, 76, 1–10.
Lapina, L. (2015). ‘Cultivating integration’. Migrant practices ofmultidirectional space- making in Integration gardens. RC21:The Ideal City: between myth and reality. Representations,policies, contradictions and challenges for tomorrow’s urbanlife, Urbino, Italy.
McIntyre, B.D., Herren, H.R., Wakhungu, J. and Watson, R.T.(2009). Agriculture at a crossroads: International Assessmentof Agricultural Science and Technology for DevelopmentVolume IV North America and Europe. Island Press, Washington.
Mendez, E. (2001). An assessment of tropical homegardens asexamples of sustainable local agroforestry systems. Agro-ecosystem sustainability: developing practical strategies. CRCPress Boca Raton Florida pp. 51–56.
Mollison, B. (1994). Introduction to permaculture. Tagari Pub-lications, Tyalgum.
Mollison, B. and Holmgren, D. (1978). Permaculture one: a per-ennial agriculture for human settlements. Trasworld Publishers.
Muckle, R.J. (2014). The First Nations of British Columbia: AnAnthropological Overview. Vancouver: UBC Press.
Nair, P.K.R. (1993) An introduction to agroforestry. KluwerAcademic Press/ICRAF, Dordrecht, The Netherlands.
Nair, P.K.R. (2006). Advances in Agroforestry Volume 3: TropicalHomegardens: A time-tested example of SustainableAgroforestry.
Pilgrim, E.S. (2014). Dining on forest food: lesson from the tro-pics. BES Forest Ecology Group.
Pilgrim, E.S., Macleod, C.J.A., Blackwell, M.S.A., Bol, R.,Hogan, D.V., Chadwick, D.R., Cardenas, L., Misselbrook, T.H.Haygarth, P.M., Brazier, R.E., Hobbs, P., Hodgson, C., Jarvis,S., Dungait, J., Murray, P.J. and Firbank, L.G. (2010). Inter-actions among agricultural production and other ecosystemsservices delivered from European temperate grassland sys-tems. Advances in Agronomy, 109, 117–154.
Plants for a future. (2016). Plants for a future database search.Pratt, S. (1996). The permaculture plot. Permanent Publications.R Core Team (2015). R: A language and environment for sta-
tistical computing R Foundation for Statistical Computing.Vienna, Austria.
Remiarz, T. (2014). Forest garden research: finding the baseline.Permaculture Association Britain.
Russell Smith, J. (1929). Tree Crops A Permanent Agriculture.Harcourt, Brace and Company, New York.
Sholto Douglas, J. and Hart, R.A.d.J. (1978). Forest farming:towards a solution to problems of world hunger and con-servation. Rodale Press.
United Nations. (2013). World population prospects, the 2012revision. New York.
van den Berg, A.E., van Winsum-Westra, M., de Vries, S. andvan Dillen, S.M.E. (2010). Allotment gardening and health:a comparative survey among allotment gardeners and theirneighbors without an allotment. Environmental Health, 9, 12.
Vargas Poveda, C. (2016). Forest garden archetypes: classifi-cations based on real examples to provide guidance andinspiration. Department of Geosciences and Natural ResourceManagement. Copenhagen.
Vlkova, M., Polesny, Z., Verner, V., Banout, J., Dvorak, M., Havlik,J., Lojka, B., Ehl, P. and Krausova, J. (2011). Ethnobotanicalknowledge and agrobiodiversity in subsistence farming: casestudy of home gardens in Phong My commune, central Viet-nam. Genetic Resources and Crop Evolution, 58, 629–644.
Whitefield, P. (1996). How to make a forest garden. PermanentPublications, Clanfield.
Winter, M. (2018) Changing Food Cultures: Challenges andOpportunities for UK Agriculture, Exeter: University of Exeterand Nuffield Farming Scholarships Trust.
Wong, J. (2012). James Wong’s homegrown revolution: growyour own amazing edibles from saffron to sweet potatoes inany back garden Weidenfield and Nicolson.
ISSN 2047-3710 International Journal of Agricultural Management, Volume 7 Issue 212 & 2018 International Farm Management Association and Institute of Agricultural Management
Benefits of multi-layered agroforestry systems Pilgrim Emma S et al.
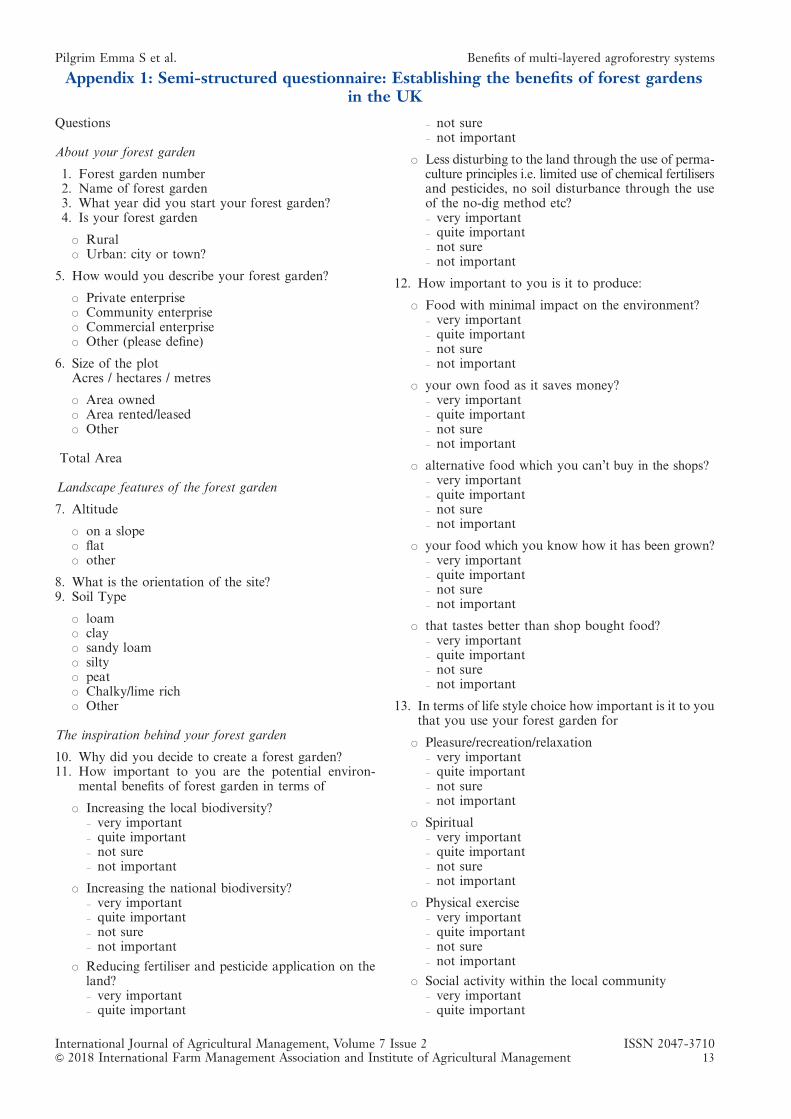
Appendix 1: Semi-structured questionnaire: Establishing the benefits of forest gardensin the UK
Questions
About your forest garden
1. Forest garden number2. Name of forest garden3. What year did you start your forest garden?4. Is your forest garden
J RuralJ Urban: city or town?
5. How would you describe your forest garden?
J Private enterpriseJ Community enterpriseJ Commercial enterpriseJ Other (please define)
6. Size of the plotAcres / hectares / metres
J Area ownedJ Area rented/leasedJ Other
Total Area
Landscape features of the forest garden
7. Altitude
J on a slopeJ flatJ other
8. What is the orientation of the site?9. Soil Type
J loamJ clayJ sandy loamJ siltyJ peatJ Chalky/lime richJ Other
The inspiration behind your forest garden
10. Why did you decide to create a forest garden?11. How important to you are the potential environ-
mental benefits of forest garden in terms of
J Increasing the local biodiversity?– very important– quite important– not sure– not important
J Increasing the national biodiversity?– very important– quite important– not sure– not important
J Reducing fertiliser and pesticide application on theland?– very important– quite important
– not sure– not important
J Less disturbing to the land through the use of perma-culture principles i.e. limited use of chemical fertilisersand pesticides, no soil disturbance through the useof the no-dig method etc?– very important– quite important– not sure– not important
12. How important to you is it to produce:
J Food with minimal impact on the environment?– very important– quite important– not sure– not important
J your own food as it saves money?– very important– quite important– not sure– not important
J alternative food which you can’t buy in the shops?– very important– quite important– not sure– not important
J your food which you know how it has been grown?– very important– quite important– not sure– not important
J that tastes better than shop bought food?– very important– quite important– not sure– not important
13. In terms of life style choice how important is it to youthat you use your forest garden for
J Pleasure/recreation/relaxation– very important– quite important– not sure– not important
J Spiritual– very important– quite important– not sure– not important
J Physical exercise– very important– quite important– not sure– not important
J Social activity within the local community– very important– quite important
International Journal of Agricultural Management, Volume 7 Issue 2 ISSN 2047-3710& 2018 International Farm Management Association and Institute of Agricultural Management 13
Pilgrim Emma S et al. Benefits of multi-layered agroforestry systems
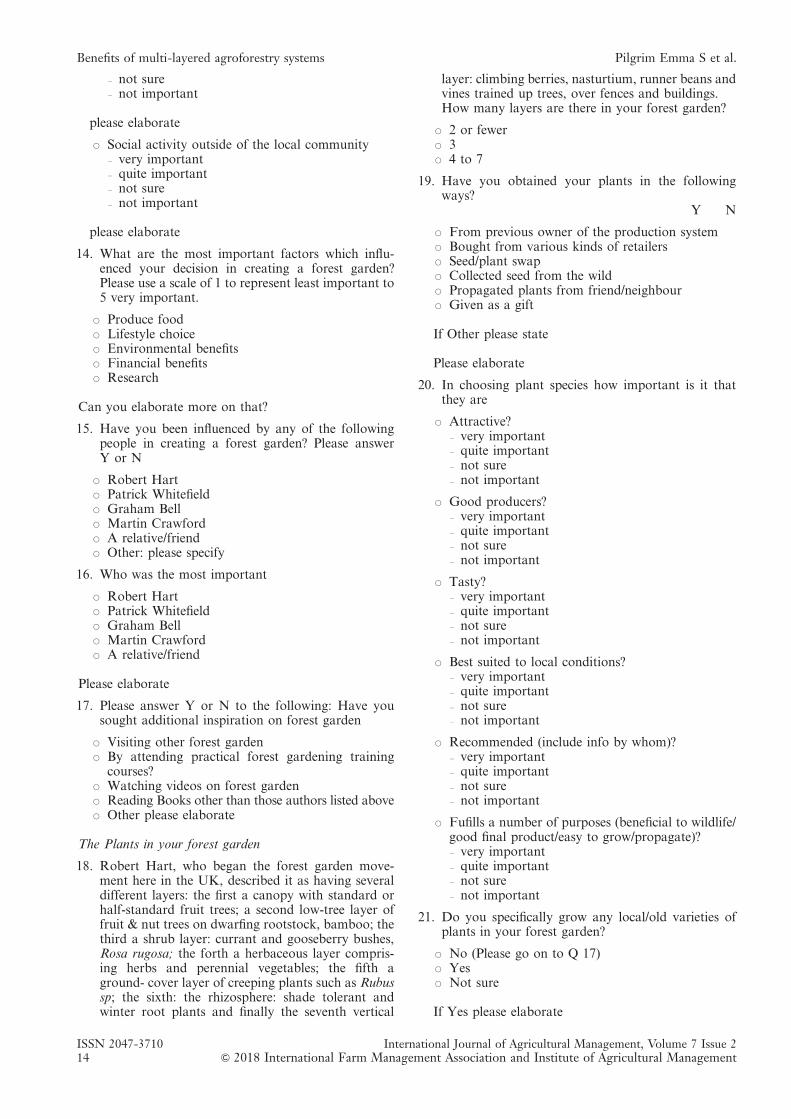
– not sure– not important
please elaborate
J Social activity outside of the local community– very important– quite important– not sure– not important
please elaborate
14. What are the most important factors which influ-enced your decision in creating a forest garden?Please use a scale of 1 to represent least important to5 very important.
J Produce foodJ Lifestyle choiceJ Environmental benefitsJ Financial benefitsJ Research
Can you elaborate more on that?
15. Have you been influenced by any of the followingpeople in creating a forest garden? Please answerY or N
J Robert HartJ Patrick WhitefieldJ Graham BellJ Martin CrawfordJ A relative/friendJ Other: please specify
16. Who was the most important
J Robert HartJ Patrick WhitefieldJ Graham BellJ Martin CrawfordJ A relative/friend
Please elaborate
17. Please answer Y or N to the following: Have yousought additional inspiration on forest garden
J Visiting other forest gardenJ By attending practical forest gardening training
courses?J Watching videos on forest gardenJ Reading Books other than those authors listed aboveJ Other please elaborate
The Plants in your forest garden
18. Robert Hart, who began the forest garden move-ment here in the UK, described it as having severaldifferent layers: the first a canopy with standard orhalf-standard fruit trees; a second low-tree layer offruit & nut trees on dwarfing rootstock, bamboo; thethird a shrub layer: currant and gooseberry bushes,Rosa rugosa; the forth a herbaceous layer compris-ing herbs and perennial vegetables; the fifth aground- cover layer of creeping plants such as Rubussp; the sixth: the rhizosphere: shade tolerant andwinter root plants and finally the seventh vertical
layer: climbing berries, nasturtium, runner beans andvines trained up trees, over fences and buildings.How many layers are there in your forest garden?
J 2 or fewerJ 3J 4 to 7
19. Have you obtained your plants in the followingways?
Y N
J From previous owner of the production systemJ Bought from various kinds of retailersJ Seed/plant swapJ Collected seed from the wildJ Propagated plants from friend/neighbourJ Given as a gift
If Other please state
Please elaborate
20. In choosing plant species how important is it thatthey are
J Attractive?– very important– quite important– not sure– not important
J Good producers?– very important– quite important– not sure– not important
J Tasty?– very important– quite important– not sure– not important
J Best suited to local conditions?– very important– quite important– not sure– not important
J Recommended (include info by whom)?– very important– quite important– not sure– not important
J Fufills a number of purposes (beneficial to wildlife/good final product/easy to grow/propagate)?– very important– quite important– not sure– not important
21. Do you specifically grow any local/old varieties ofplants in your forest garden?
J No (Please go on to Q 17)J YesJ Not sure
If Yes please elaborate
ISSN 2047-3710 International Journal of Agricultural Management, Volume 7 Issue 214 & 2018 International Farm Management Association and Institute of Agricultural Management
Benefits of multi-layered agroforestry systems Pilgrim Emma S et al.
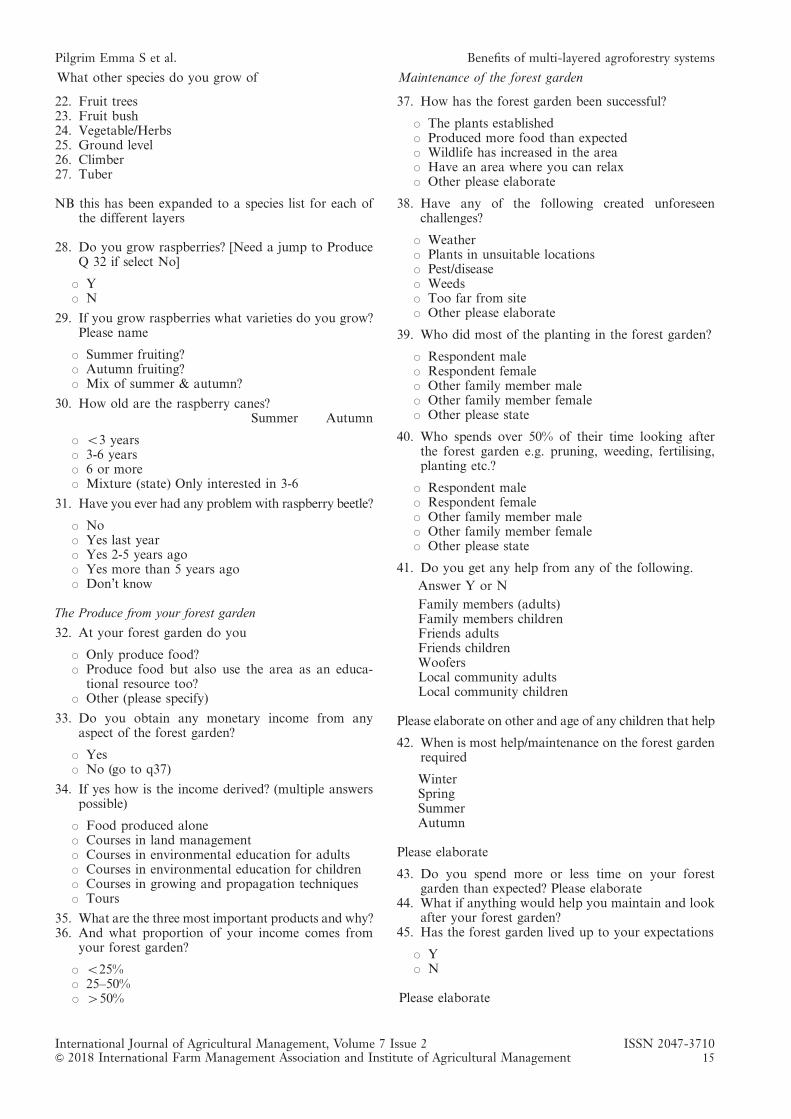
What other species do you grow of
22. Fruit trees23. Fruit bush24. Vegetable/Herbs25. Ground level26. Climber27. Tuber
NB this has been expanded to a species list for each ofthe different layers
28. Do you grow raspberries? [Need a jump to ProduceQ 32 if select No]
J YJ N
29. If you grow raspberries what varieties do you grow?Please name
J Summer fruiting?J Autumn fruiting?J Mix of summer & autumn?
30. How old are the raspberry canes?Summer Autumn
J o3 yearsJ 3-6 yearsJ 6 or moreJ Mixture (state) Only interested in 3-6
31. Have you ever had any problem with raspberry beetle?
J NoJ Yes last yearJ Yes 2-5 years agoJ Yes more than 5 years agoJ Don’t know
The Produce from your forest garden
32. At your forest garden do you
J Only produce food?J Produce food but also use the area as an educa-
tional resource too?J Other (please specify)
33. Do you obtain any monetary income from anyaspect of the forest garden?
J YesJ No (go to q37)
34. If yes how is the income derived? (multiple answerspossible)
J Food produced aloneJ Courses in land managementJ Courses in environmental education for adultsJ Courses in environmental education for childrenJ Courses in growing and propagation techniquesJ Tours
35. What are the three most important products and why?36. And what proportion of your income comes from
your forest garden?
J o25%J 25–50%J 450%
Maintenance of the forest garden
37. How has the forest garden been successful?
J The plants establishedJ Produced more food than expectedJ Wildlife has increased in the areaJ Have an area where you can relaxJ Other please elaborate
38. Have any of the following created unforeseenchallenges?
J WeatherJ Plants in unsuitable locationsJ Pest/diseaseJ WeedsJ Too far from siteJ Other please elaborate
39. Who did most of the planting in the forest garden?
J Respondent maleJ Respondent femaleJ Other family member maleJ Other family member femaleJ Other please state
40. Who spends over 50% of their time looking afterthe forest garden e.g. pruning, weeding, fertilising,planting etc.?
J Respondent maleJ Respondent femaleJ Other family member maleJ Other family member femaleJ Other please state
41. Do you get any help from any of the following.Answer Y or NFamily members (adults)Family members childrenFriends adultsFriends childrenWoofersLocal community adultsLocal community children
Please elaborate on other and age of any children that help
42. When is most help/maintenance on the forest gardenrequired
WinterSpringSummerAutumn
Please elaborate
43. Do you spend more or less time on your forestgarden than expected? Please elaborate
44. What if anything would help you maintain and lookafter your forest garden?
45. Has the forest garden lived up to your expectations
J YJ N
Please elaborate
International Journal of Agricultural Management, Volume 7 Issue 2 ISSN 2047-3710& 2018 International Farm Management Association and Institute of Agricultural Management 15
Pilgrim Emma S et al. Benefits of multi-layered agroforestry systems
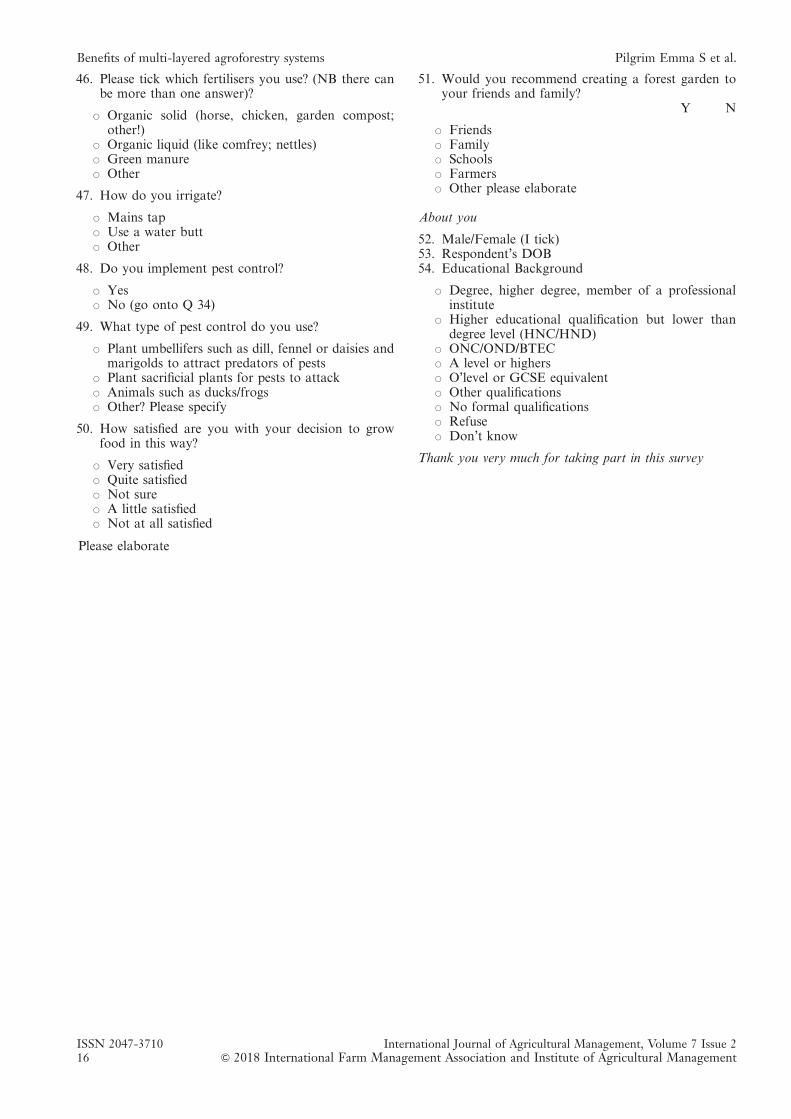
46. Please tick which fertilisers you use? (NB there canbe more than one answer)?
J Organic solid (horse, chicken, garden compost;other!)
J Organic liquid (like comfrey; nettles)J Green manureJ Other
47. How do you irrigate?
J Mains tapJ Use a water buttJ Other
48. Do you implement pest control?
J YesJ No (go onto Q 34)
49. What type of pest control do you use?
J Plant umbellifers such as dill, fennel or daisies andmarigolds to attract predators of pests
J Plant sacrificial plants for pests to attackJ Animals such as ducks/frogsJ Other? Please specify
50. How satisfied are you with your decision to growfood in this way?
J Very satisfiedJ Quite satisfiedJ Not sureJ A little satisfiedJ Not at all satisfied
Please elaborate
51. Would you recommend creating a forest garden toyour friends and family?
Y N
J FriendsJ FamilyJ SchoolsJ FarmersJ Other please elaborate
About you
52. Male/Female (I tick)53. Respondent’s DOB54. Educational Background
J Degree, higher degree, member of a professionalinstitute
J Higher educational qualification but lower thandegree level (HNC/HND)
J ONC/OND/BTECJ A level or highersJ O’level or GCSE equivalentJ Other qualificationsJ No formal qualificationsJ RefuseJ Don’t know
Thank you very much for taking part in this survey
ISSN 2047-3710 International Journal of Agricultural Management, Volume 7 Issue 216 & 2018 International Farm Management Association and Institute of Agricultural Management
Benefits of multi-layered agroforestry systems Pilgrim Emma S et al.
REFEREED ARTICLEDOI: 10.5836/ijam/2018-07-17
Are farmer personality traits associatedwith farm profitability? Results from asurvey of dairy farmers in England and
WalesNIALL O’LEARY1, RICHARD TRANTER2* and RICHARD BENNETT2
ABSTRACTAlthough the personality of the manager has been shown to predict performance in many fields, inagriculture, this relationship has not been studied in detail. In the study presented here, 59 dairy farmmanagers in England and Wales completed psychological assessments; on 40 of 53 measures, farmers werefound to be distinct from the general working population norm. Significant correlations to farm profit-ability for four of the 53 measures were found. Almost 40% of the variation in farm profitability waspredicted by a simple linear model with just three of these personality measures: ‘Detail Conscious’ and‘Leadership’ measures positively and, ‘Relaxed’, negatively, predicted farm profitability. Though obser-vational, and not demonstrating cause and effect, the associations are strong. These three measures are,thus, candidate variables for personality measures that drive farmer and farm manager performance.Longitudinal, or intervention studies, may demonstrate causality in the future. In the interim, being cogni-sant of these attributes during the hiring and training of farm staff, particularly those with managementroles, may well result in improvements in farm profitability.
KEYWORDS: farm profitability; farmer personality; management; talent; performance; psychology
1. Introduction
That more than 40% of the variation in job performancecan be predicted by personality and intelligence has beenestablished in numerous meta-analyses and reviews (e.g.Hunter and Hunter, 1984; Schmidt and Hunter, 2004;O’Boyle et al., 2010; Schmitt, 2014). Assessing humanattributes has, thus, become a focus in Industrial andOrganisational Psychology with General Cognitive Ability(GCA) consistently found to predict more variation in jobperformance than any other attribute (Reeve and Hakel,2002). GCA, IQ, ‘g’ or intelligence is generally describedas consisting of two components: fluid and crystallisedintelligence (Nuthall, 2001). Fluid (non-verbal) intelligenceis thought to be largely genetic, relating to the capacity tosolve problems in novel situations. Crystallised (verbal)intelligence relates to learned and cultural intelligence andfamiliarity with the situation at hand (numerical, verbaland social ability).
Personality has also been found to be generally inde-pendent of GCA and to have incremental predictiveability over GCA for job performance (Schmitt, 2014).
Personality, in particular measures from the Five-FactorModel (FFM) of individual personality, has been shownin these reviews of studies from a range of sectors(though not including agriculture) to predict up to 25%of the variation in job performance. This indicatespersonality is a major predictor of job performance,although coming somewhat behind that of GCA (40%)(Schmitt, 2014).
The Five-Factor Model (FFM)/Big 5 is the predomi-nant personality model in psychology and has surpassedother theories, such as the Myers Briggs Type Indicator,in research contexts. The main components within theFFM are agreeableness, conscientiousness, neuroticism(emotional stability), extraversion, and openness (McCrae& Costa, 1985). Of these, conscientious and emotionalstability have been found to be predictors of capabilityin a wide range of sectors. The remaining three can beimportant to a lesser extent depending on the context.Openness and agreeableness are advantageous duringtraining for example (Poropat, 2009).
Nuthall (2009) adapted FFM theory to create 25 ques-tions to assess 40 New Zealand farmers’ ‘management style’.
1 Animal and Grassland Research and Innovation Centre, Teagasc, Moorepark, Fermoy, Co Cork, Ireland.2 School of Agriculture, Policy and Development, University of Reading, P O Box 237, Earley Gate, Reading RG6 6AR, United Kingdom.
*Corresponding author: Telephone: +44(0)118 378 8155, Email: [email protected].
Original submitted March 2018; revision received October 2018; accepted October 2018.
International Journal of Agricultural Management, Volume 7 Issue 2 ISSN 2047-3710& 2018 International Farm Management Association and Institute of Agricultural Management 17
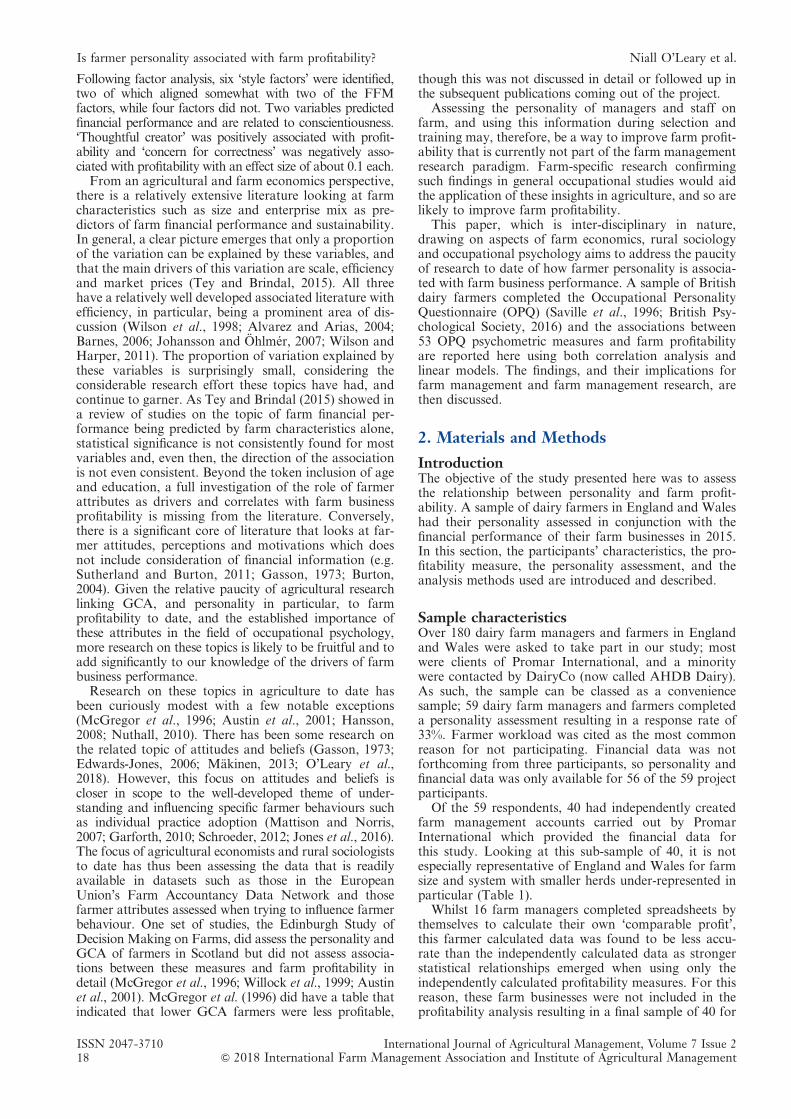
Following factor analysis, six ‘style factors’ were identified,two of which aligned somewhat with two of the FFMfactors, while four factors did not. Two variables predictedfinancial performance and are related to conscientiousness.‘Thoughtful creator’ was positively associated with profit-ability and ‘concern for correctness’ was negatively asso-ciated with profitability with an effect size of about 0.1 each.
From an agricultural and farm economics perspective,there is a relatively extensive literature looking at farmcharacteristics such as size and enterprise mix as pre-dictors of farm financial performance and sustainability.In general, a clear picture emerges that only a proportionof the variation can be explained by these variables, andthat the main drivers of this variation are scale, efficiencyand market prices (Tey and Brindal, 2015). All threehave a relatively well developed associated literature withefficiency, in particular, being a prominent area of dis-cussion (Wilson et al., 1998; Alvarez and Arias, 2004;Barnes, 2006; Johansson and Öhlmér, 2007; Wilson andHarper, 2011). The proportion of variation explained bythese variables is surprisingly small, considering theconsiderable research effort these topics have had, andcontinue to garner. As Tey and Brindal (2015) showed ina review of studies on the topic of farm financial per-formance being predicted by farm characteristics alone,statistical significance is not consistently found for mostvariables and, even then, the direction of the associationis not even consistent. Beyond the token inclusion of ageand education, a full investigation of the role of farmerattributes as drivers and correlates with farm businessprofitability is missing from the literature. Conversely,there is a significant core of literature that looks at far-mer attitudes, perceptions and motivations which doesnot include consideration of financial information (e.g.Sutherland and Burton, 2011; Gasson, 1973; Burton,2004). Given the relative paucity of agricultural researchlinking GCA, and personality in particular, to farmprofitability to date, and the established importance ofthese attributes in the field of occupational psychology,more research on these topics is likely to be fruitful and toadd significantly to our knowledge of the drivers of farmbusiness performance.
Research on these topics in agriculture to date hasbeen curiously modest with a few notable exceptions(McGregor et al., 1996; Austin et al., 2001; Hansson,2008; Nuthall, 2010). There has been some research onthe related topic of attitudes and beliefs (Gasson, 1973;Edwards-Jones, 2006; Mäkinen, 2013; O’Leary et al.,2018). However, this focus on attitudes and beliefs iscloser in scope to the well-developed theme of under-standing and influencing specific farmer behaviours suchas individual practice adoption (Mattison and Norris,2007; Garforth, 2010; Schroeder, 2012; Jones et al., 2016).The focus of agricultural economists and rural sociologiststo date has thus been assessing the data that is readilyavailable in datasets such as those in the EuropeanUnion’s Farm Accountancy Data Network and thosefarmer attributes assessed when trying to influence farmerbehaviour. One set of studies, the Edinburgh Study ofDecision Making on Farms, did assess the personality andGCA of farmers in Scotland but did not assess associa-tions between these measures and farm profitability indetail (McGregor et al., 1996; Willock et al., 1999; Austinet al., 2001). McGregor et al. (1996) did have a table thatindicated that lower GCA farmers were less profitable,
though this was not discussed in detail or followed up inthe subsequent publications coming out of the project.
Assessing the personality of managers and staff onfarm, and using this information during selection andtraining may, therefore, be a way to improve farm profit-ability that is currently not part of the farm managementresearch paradigm. Farm-specific research confirmingsuch findings in general occupational studies would aidthe application of these insights in agriculture, and so arelikely to improve farm profitability.
This paper, which is inter-disciplinary in nature,drawing on aspects of farm economics, rural sociologyand occupational psychology aims to address the paucityof research to date of how farmer personality is associa-ted with farm business performance. A sample of Britishdairy farmers completed the Occupational PersonalityQuestionnaire (OPQ) (Saville et al., 1996; British Psy-chological Society, 2016) and the associations between53 OPQ psychometric measures and farm profitabilityare reported here using both correlation analysis andlinear models. The findings, and their implications forfarm management and farm management research, arethen discussed.
2. Materials and Methods
IntroductionThe objective of the study presented here was to assessthe relationship between personality and farm profit-ability. A sample of dairy farmers in England and Waleshad their personality assessed in conjunction with thefinancial performance of their farm businesses in 2015.In this section, the participants’ characteristics, the pro-fitability measure, the personality assessment, and theanalysis methods used are introduced and described.
Sample characteristicsOver 180 dairy farm managers and farmers in Englandand Wales were asked to take part in our study; mostwere clients of Promar International, and a minoritywere contacted by DairyCo (now called AHDB Dairy).As such, the sample can be classed as a conveniencesample; 59 dairy farm managers and farmers completeda personality assessment resulting in a response rate of33%. Farmer workload was cited as the most commonreason for not participating. Financial data was notforthcoming from three participants, so personality andfinancial data was only available for 56 of the 59 projectparticipants.
Of the 59 respondents, 40 had independently createdfarm management accounts carried out by PromarInternational which provided the financial data forthis study. Looking at this sub-sample of 40, it is notespecially representative of England and Wales for farmsize and system with smaller herds under-represented inparticular (Table 1).
Whilst 16 farm managers completed spreadsheets bythemselves to calculate their own ‘comparable profit’,this farmer calculated data was found to be less accu-rate than the independently calculated data as strongerstatistical relationships emerged when using only theindependently calculated profitability measures. For thisreason, these farm businesses were not included in theprofitability analysis resulting in a final sample of 40 for
ISSN 2047-3710 International Journal of Agricultural Management, Volume 7 Issue 218 & 2018 International Farm Management Association and Institute of Agricultural Management
Is farmer personality associated with farm profitability? Niall O’Leary et al.
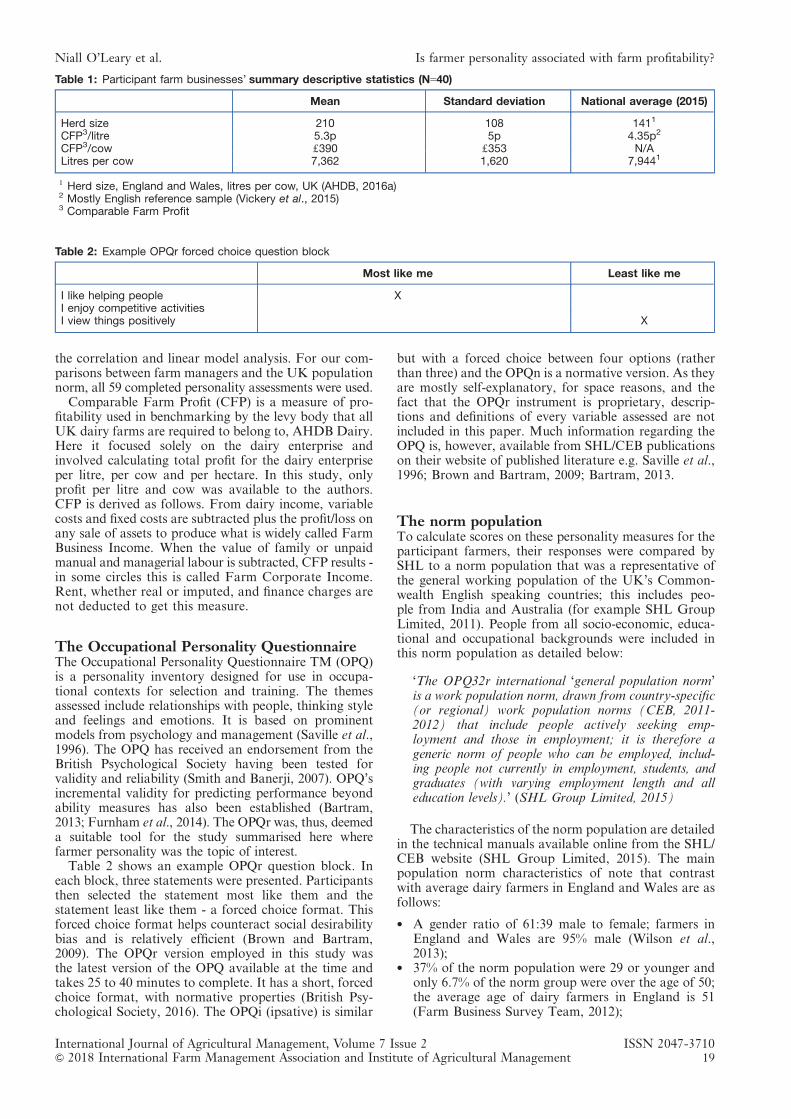
the correlation and linear model analysis. For our com-parisons between farm managers and the UK populationnorm, all 59 completed personality assessments were used.
Comparable Farm Profit (CFP) is a measure of pro-fitability used in benchmarking by the levy body that allUK dairy farms are required to belong to, AHDB Dairy.Here it focused solely on the dairy enterprise andinvolved calculating total profit for the dairy enterpriseper litre, per cow and per hectare. In this study, onlyprofit per litre and cow was available to the authors.CFP is derived as follows. From dairy income, variablecosts and fixed costs are subtracted plus the profit/loss onany sale of assets to produce what is widely called FarmBusiness Income. When the value of family or unpaidmanual and managerial labour is subtracted, CFP results -in some circles this is called Farm Corporate Income.Rent, whether real or imputed, and finance charges arenot deducted to get this measure.
The Occupational Personality QuestionnaireThe Occupational Personality Questionnaire TM (OPQ)is a personality inventory designed for use in occupa-tional contexts for selection and training. The themesassessed include relationships with people, thinking styleand feelings and emotions. It is based on prominentmodels from psychology and management (Saville et al.,1996). The OPQ has received an endorsement from theBritish Psychological Society having been tested forvalidity and reliability (Smith and Banerji, 2007). OPQ’sincremental validity for predicting performance beyondability measures has also been established (Bartram,2013; Furnham et al., 2014). The OPQr was, thus, deemeda suitable tool for the study summarised here wherefarmer personality was the topic of interest.
Table 2 shows an example OPQr question block. Ineach block, three statements were presented. Participantsthen selected the statement most like them and thestatement least like them - a forced choice format. Thisforced choice format helps counteract social desirabilitybias and is relatively efficient (Brown and Bartram,2009). The OPQr version employed in this study wasthe latest version of the OPQ available at the time andtakes 25 to 40 minutes to complete. It has a short, forcedchoice format, with normative properties (British Psy-chological Society, 2016). The OPQi (ipsative) is similar
but with a forced choice between four options (ratherthan three) and the OPQn is a normative version. As theyare mostly self-explanatory, for space reasons, and thefact that the OPQr instrument is proprietary, descrip-tions and definitions of every variable assessed are notincluded in this paper. Much information regarding theOPQ is, however, available from SHL/CEB publicationson their website of published literature e.g. Saville et al.,1996; Brown and Bartram, 2009; Bartram, 2013.
The norm populationTo calculate scores on these personality measures for theparticipant farmers, their responses were compared bySHL to a norm population that was a representative ofthe general working population of the UK’s Common-wealth English speaking countries; this includes peo-ple from India and Australia (for example SHL GroupLimited, 2011). People from all socio-economic, educa-tional and occupational backgrounds were included inthis norm population as detailed below:
‘The OPQ32r international ‘general population norm’is a work population norm, drawn from country-specific(or regional) work population norms (CEB, 2011-2012) that include people actively seeking emp-loyment and those in employment; it is therefore ageneric norm of people who can be employed, includ-ing people not currently in employment, students, andgraduates (with varying employment length and alleducation levels).’ (SHL Group Limited, 2015)
The characteristics of the norm population are detailedin the technical manuals available online from the SHL/CEB website (SHL Group Limited, 2015). The mainpopulation norm characteristics of note that contrastwith average dairy farmers in England and Wales are asfollows:
� A gender ratio of 61:39 male to female; farmers inEngland and Wales are 95% male (Wilson et al.,2013);
� 37% of the norm population were 29 or younger andonly 6.7% of the norm group were over the age of 50;the average age of dairy farmers in England is 51(Farm Business Survey Team, 2012);
Table 1: Participant farm businesses’ summary descriptive statistics (N=40)
Mean Standard deviation National average (2015)
Herd size 210 108 1411
CFP3/litre 5.3p 5p 4.35p2
CFP3/cow d390 d353 N/ALitres per cow 7,362 1,620 7,9441
1 Herd size, England and Wales, litres per cow, UK (AHDB, 2016a)2 Mostly English reference sample (Vickery et al., 2015)3 Comparable Farm Profit
Table 2: Example OPQr forced choice question block
Most like me Least like me
I like helping people XI enjoy competitive activitiesI view things positively X
International Journal of Agricultural Management, Volume 7 Issue 2 ISSN 2047-3710& 2018 International Farm Management Association and Institute of Agricultural Management 19
Niall O’Leary et al. Is farmer personality associated with farm profitability?
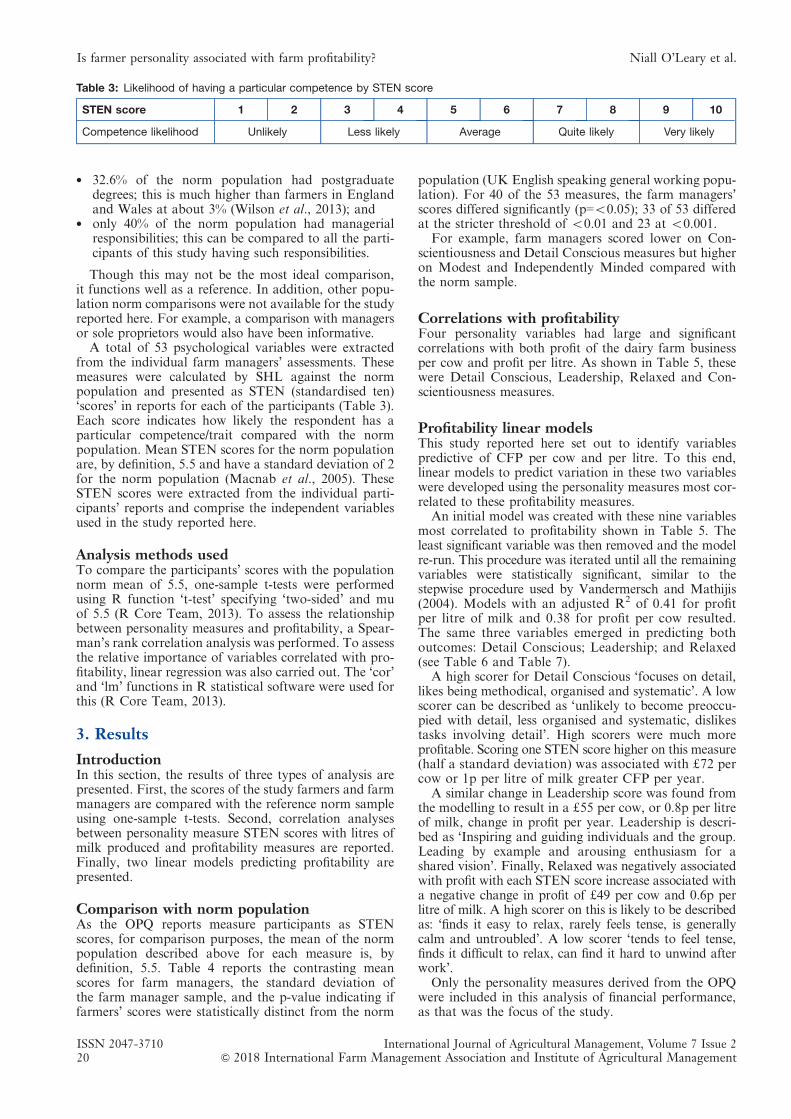
� 32.6% of the norm population had postgraduatedegrees; this is much higher than farmers in Englandand Wales at about 3% (Wilson et al., 2013); and
� only 40% of the norm population had managerialresponsibilities; this can be compared to all the parti-cipants of this study having such responsibilities.
Though this may not be the most ideal comparison,it functions well as a reference. In addition, other popu-lation norm comparisons were not available for the studyreported here. For example, a comparison with managersor sole proprietors would also have been informative.
A total of 53 psychological variables were extractedfrom the individual farm managers’ assessments. Thesemeasures were calculated by SHL against the normpopulation and presented as STEN (standardised ten)‘scores’ in reports for each of the participants (Table 3).Each score indicates how likely the respondent has aparticular competence/trait compared with the normpopulation. Mean STEN scores for the norm populationare, by definition, 5.5 and have a standard deviation of 2for the norm population (Macnab et al., 2005). TheseSTEN scores were extracted from the individual parti-cipants’ reports and comprise the independent variablesused in the study reported here.
Analysis methods usedTo compare the participants’ scores with the populationnorm mean of 5.5, one-sample t-tests were performedusing R function ‘t-test’ specifying ‘two-sided’ and muof 5.5 (R Core Team, 2013). To assess the relationshipbetween personality measures and profitability, a Spear-man’s rank correlation analysis was performed. To assessthe relative importance of variables correlated with pro-fitability, linear regression was also carried out. The ‘cor’and ‘lm’ functions in R statistical software were used forthis (R Core Team, 2013).
3. Results
IntroductionIn this section, the results of three types of analysis arepresented. First, the scores of the study farmers and farmmanagers are compared with the reference norm sampleusing one-sample t-tests. Second, correlation analysesbetween personality measure STEN scores with litres ofmilk produced and profitability measures are reported.Finally, two linear models predicting profitability arepresented.
Comparison with norm populationAs the OPQ reports measure participants as STENscores, for comparison purposes, the mean of the normpopulation described above for each measure is, bydefinition, 5.5. Table 4 reports the contrasting meanscores for farm managers, the standard deviation ofthe farm manager sample, and the p-value indicating iffarmers’ scores were statistically distinct from the norm
population (UK English speaking general working popu-lation). For 40 of the 53 measures, the farm managers’scores differed significantly (p=o0.05); 33 of 53 differedat the stricter threshold of o0.01 and 23 at o0.001.
For example, farm managers scored lower on Con-scientiousness and Detail Conscious measures but higheron Modest and Independently Minded compared withthe norm sample.
Correlations with profitabilityFour personality variables had large and significantcorrelations with both profit of the dairy farm businessper cow and profit per litre. As shown in Table 5, thesewere Detail Conscious, Leadership, Relaxed and Con-scientiousness measures.
Profitability linear modelsThis study reported here set out to identify variablespredictive of CFP per cow and per litre. To this end,linear models to predict variation in these two variableswere developed using the personality measures most cor-related to these profitability measures.
An initial model was created with these nine variablesmost correlated to profitability shown in Table 5. Theleast significant variable was then removed and the modelre-run. This procedure was iterated until all the remainingvariables were statistically significant, similar to thestepwise procedure used by Vandermersch and Mathijis(2004). Models with an adjusted R2 of 0.41 for profitper litre of milk and 0.38 for profit per cow resulted.The same three variables emerged in predicting bothoutcomes: Detail Conscious; Leadership; and Relaxed(see Table 6 and Table 7).
A high scorer for Detail Conscious ‘focuses on detail,likes being methodical, organised and systematic’. A lowscorer can be described as ‘unlikely to become preoccu-pied with detail, less organised and systematic, dislikestasks involving detail’. High scorers were much moreprofitable. Scoring one STEN score higher on this measure(half a standard deviation) was associated with d72 percow or 1p per litre of milk greater CFP per year.
A similar change in Leadership score was found fromthe modelling to result in a d55 per cow, or 0.8p per litreof milk, change in profit per year. Leadership is descri-bed as ‘Inspiring and guiding individuals and the group.Leading by example and arousing enthusiasm for ashared vision’. Finally, Relaxed was negatively associatedwith profit with each STEN score increase associated witha negative change in profit of d49 per cow and 0.6p perlitre of milk. A high scorer on this is likely to be describedas: ‘finds it easy to relax, rarely feels tense, is generallycalm and untroubled’. A low scorer ‘tends to feel tense,finds it difficult to relax, can find it hard to unwind afterwork’.
Only the personality measures derived from the OPQwere included in this analysis of financial performance,as that was the focus of the study.
Table 3: Likelihood of having a particular competence by STEN score
STEN score 1 2 3 4 5 6 7 8 9 10
Competence likelihood Unlikely Less likely Average Quite likely Very likely
ISSN 2047-3710 International Journal of Agricultural Management, Volume 7 Issue 220 & 2018 International Farm Management Association and Institute of Agricultural Management
Is farmer personality associated with farm profitability? Niall O’Leary et al.
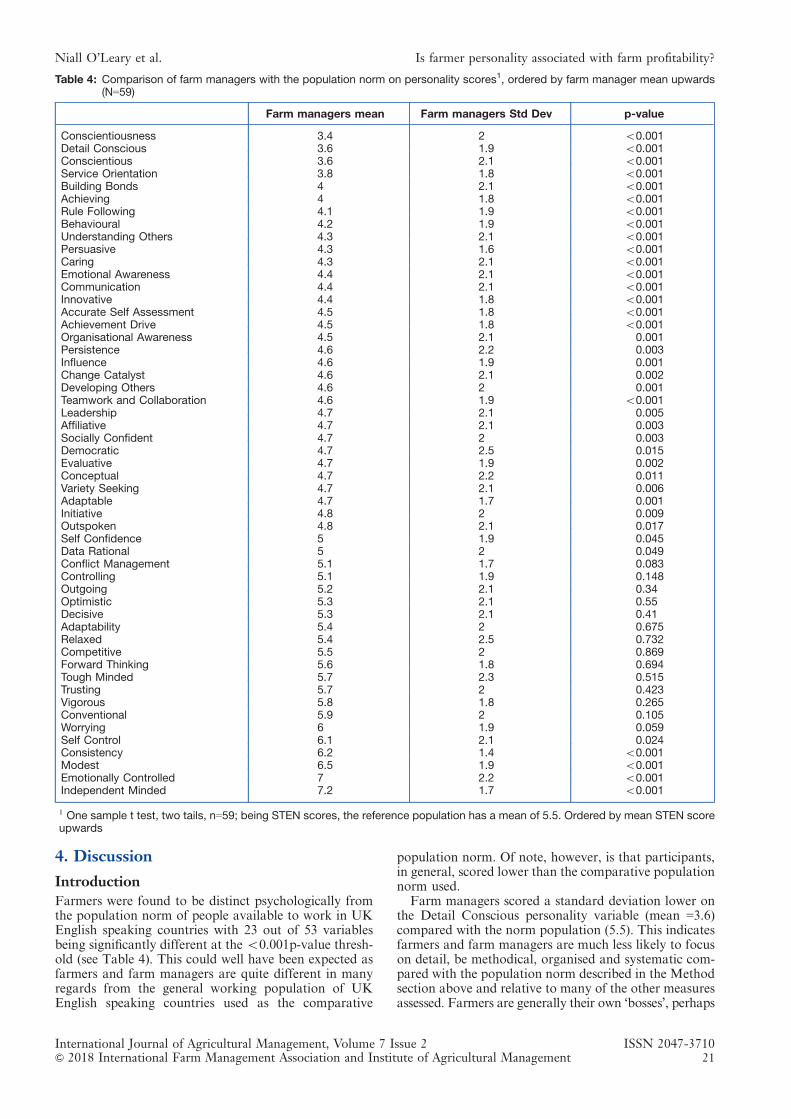
4. Discussion
IntroductionFarmers were found to be distinct psychologically fromthe population norm of people available to work in UKEnglish speaking countries with 23 out of 53 variablesbeing significantly different at the o0.001p-value thresh-old (see Table 4). This could well have been expected asfarmers and farm managers are quite different in manyregards from the general working population of UKEnglish speaking countries used as the comparative
population norm. Of note, however, is that participants,in general, scored lower than the comparative populationnorm used.
Farm managers scored a standard deviation lower onthe Detail Conscious personality variable (mean =3.6)compared with the norm population (5.5). This indicatesfarmers and farm managers are much less likely to focuson detail, be methodical, organised and systematic com-pared with the population norm described in the Methodsection above and relative to many of the other measuresassessed. Farmers are generally their own ‘bosses’, perhaps
Table 4: Comparison of farm managers with the population norm on personality scores1, ordered by farm manager mean upwards(N=59)
Farm managers mean Farm managers Std Dev p-value
Conscientiousness 3.4 2 o0.001Detail Conscious 3.6 1.9 o0.001Conscientious 3.6 2.1 o0.001Service Orientation 3.8 1.8 o0.001Building Bonds 4 2.1 o0.001Achieving 4 1.8 o0.001Rule Following 4.1 1.9 o0.001Behavioural 4.2 1.9 o0.001Understanding Others 4.3 2.1 o0.001Persuasive 4.3 1.6 o0.001Caring 4.3 2.1 o0.001Emotional Awareness 4.4 2.1 o0.001Communication 4.4 2.1 o0.001Innovative 4.4 1.8 o0.001Accurate Self Assessment 4.5 1.8 o0.001Achievement Drive 4.5 1.8 o0.001Organisational Awareness 4.5 2.1 0.001Persistence 4.6 2.2 0.003Influence 4.6 1.9 0.001Change Catalyst 4.6 2.1 0.002Developing Others 4.6 2 0.001Teamwork and Collaboration 4.6 1.9 o0.001Leadership 4.7 2.1 0.005Affiliative 4.7 2.1 0.003Socially Confident 4.7 2 0.003Democratic 4.7 2.5 0.015Evaluative 4.7 1.9 0.002Conceptual 4.7 2.2 0.011Variety Seeking 4.7 2.1 0.006Adaptable 4.7 1.7 0.001Initiative 4.8 2 0.009Outspoken 4.8 2.1 0.017Self Confidence 5 1.9 0.045Data Rational 5 2 0.049Conflict Management 5.1 1.7 0.083Controlling 5.1 1.9 0.148Outgoing 5.2 2.1 0.34Optimistic 5.3 2.1 0.55Decisive 5.3 2.1 0.41Adaptability 5.4 2 0.675Relaxed 5.4 2.5 0.732Competitive 5.5 2 0.869Forward Thinking 5.6 1.8 0.694Tough Minded 5.7 2.3 0.515Trusting 5.7 2 0.423Vigorous 5.8 1.8 0.265Conventional 5.9 2 0.105Worrying 6 1.9 0.059Self Control 6.1 2.1 0.024Consistency 6.2 1.4 o0.001Modest 6.5 1.9 o0.001Emotionally Controlled 7 2.2 o0.001Independent Minded 7.2 1.7 o0.001
1 One sample t test, two tails, n=59; being STEN scores, the reference population has a mean of 5.5. Ordered by mean STEN scoreupwards
International Journal of Agricultural Management, Volume 7 Issue 2 ISSN 2047-3710& 2018 International Farm Management Association and Institute of Agricultural Management 21
Niall O’Leary et al. Is farmer personality associated with farm profitability?
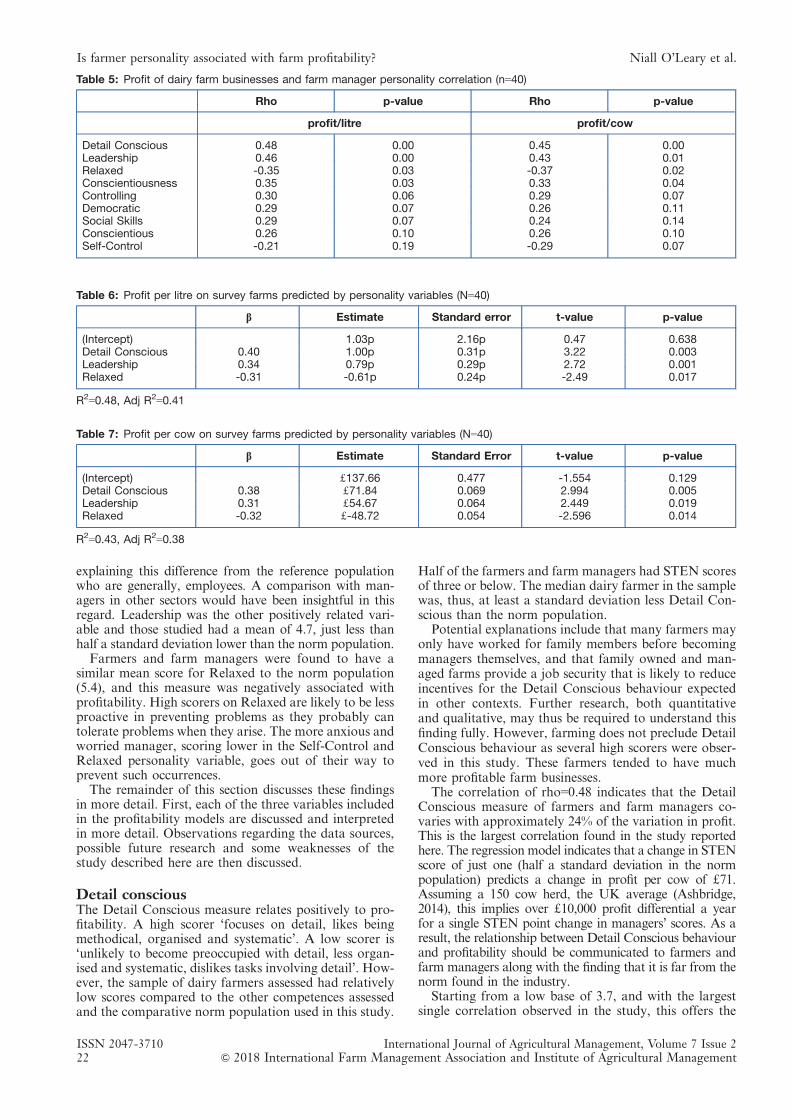
explaining this difference from the reference populationwho are generally, employees. A comparison with man-agers in other sectors would have been insightful in thisregard. Leadership was the other positively related vari-able and those studied had a mean of 4.7, just less thanhalf a standard deviation lower than the norm population.
Farmers and farm managers were found to have asimilar mean score for Relaxed to the norm population(5.4), and this measure was negatively associated withprofitability. High scorers on Relaxed are likely to be lessproactive in preventing problems as they probably cantolerate problems when they arise. The more anxious andworried manager, scoring lower in the Self-Control andRelaxed personality variable, goes out of their way toprevent such occurrences.
The remainder of this section discusses these findingsin more detail. First, each of the three variables includedin the profitability models are discussed and interpretedin more detail. Observations regarding the data sources,possible future research and some weaknesses of thestudy described here are then discussed.
Detail consciousThe Detail Conscious measure relates positively to pro-fitability. A high scorer ‘focuses on detail, likes beingmethodical, organised and systematic’. A low scorer is‘unlikely to become preoccupied with detail, less organ-ised and systematic, dislikes tasks involving detail’. How-ever, the sample of dairy farmers assessed had relativelylow scores compared to the other competences assessedand the comparative norm population used in this study.
Half of the farmers and farm managers had STEN scoresof three or below. The median dairy farmer in the samplewas, thus, at least a standard deviation less Detail Con-scious than the norm population.
Potential explanations include that many farmers mayonly have worked for family members before becomingmanagers themselves, and that family owned and man-aged farms provide a job security that is likely to reduceincentives for the Detail Conscious behaviour expectedin other contexts. Further research, both quantitativeand qualitative, may thus be required to understand thisfinding fully. However, farming does not preclude DetailConscious behaviour as several high scorers were obser-ved in this study. These farmers tended to have muchmore profitable farm businesses.
The correlation of rho=0.48 indicates that the DetailConscious measure of farmers and farm managers co-varies with approximately 24% of the variation in profit.This is the largest correlation found in the study reportedhere. The regression model indicates that a change in STENscore of just one (half a standard deviation in the normpopulation) predicts a change in profit per cow of d71.Assuming a 150 cow herd, the UK average (Ashbridge,2014), this implies over d10,000 profit differential a yearfor a single STEN point change in managers’ scores. As aresult, the relationship between Detail Conscious behaviourand profitability should be communicated to farmers andfarm managers along with the finding that it is far from thenorm found in the industry.
Starting from a low base of 3.7, and with the largestsingle correlation observed in the study, this offers the
Table 6: Profit per litre on survey farms predicted by personality variables (N=40)
b Estimate Standard error t-value p-value
(Intercept) 1.03p 2.16p 0.47 0.638Detail Conscious 0.40 1.00p 0.31p 3.22 0.003Leadership 0.34 0.79p 0.29p 2.72 0.001Relaxed -0.31 -0.61p 0.24p -2.49 0.017
R2=0.48, Adj R2=0.41
Table 5: Profit of dairy farm businesses and farm manager personality correlation (n=40)
Rho p-value Rho p-value
profit/litre profit/cow
Detail Conscious 0.48 0.00 0.45 0.00Leadership 0.46 0.00 0.43 0.01Relaxed -0.35 0.03 -0.37 0.02Conscientiousness 0.35 0.03 0.33 0.04Controlling 0.30 0.06 0.29 0.07Democratic 0.29 0.07 0.26 0.11Social Skills 0.29 0.07 0.24 0.14Conscientious 0.26 0.10 0.26 0.10Self-Control -0.21 0.19 -0.29 0.07
Table 7: Profit per cow on survey farms predicted by personality variables (N=40)
b Estimate Standard Error t-value p-value
(Intercept) d137.66 0.477 -1.554 0.129Detail Conscious 0.38 d71.84 0.069 2.994 0.005Leadership 0.31 d54.67 0.064 2.449 0.019Relaxed -0.32 d-48.72 0.054 -2.596 0.014
R2=0.43, Adj R2=0.38
ISSN 2047-3710 International Journal of Agricultural Management, Volume 7 Issue 222 & 2018 International Farm Management Association and Institute of Agricultural Management
Is farmer personality associated with farm profitability? Niall O’Leary et al.
greatest potential return for achieving farm financialperformance improvements. If farmers and farm man-agers could become more Detail Conscious, largeimprovements in performance may follow. The modelssuggest that effecting a two or three point change in thisscore could have large benefits. As a consequence,expending effort to achieve this is likely to represent agood return on investment for farmers and farmmanagers.
Conscientiousness and related measuresHere we outline the differences between Conscientious-ness, Conscientious and Detail Conscientious measuresdiscussed in this study. Conscientiousness is one of thefive factors constituting the Five Factor Model (McCraeand Costa, 1985), also known as the Big Five or NEOfive. The scores Conscientious and Detail Conscious existwithin the ‘Conscientiousness’ factorial space (Brown andBartram, 2009). Conscientious and Detail Conscious,therefore, measure specific aspects of ‘Conscientiousness’.
The broader measure, Conscientiousness, is describedas ‘Taking responsibility for personal performance.Meeting commitments and adopting an organisedapproach to one’s work’. Possessing this measure corre-lated with profit per litre, and per cow, significantly (0.35and 0.33). In contrast, a high scorer for Conscientious, anaspect of Conscientiousness, is described as someone who‘focuses on getting things finished, persists until the job isdone’ and a low scorer as someone who ‘sees deadlines asflexible, prepared to leave some tasks unfinished’. Con-scientious correlated (0.26) to both profit measures butwas not statistically significant (p=0.10). Having comparedthese three measures (Detail Conscientious, Conscientiousand Conscientiousness) it appears that it is the attention todetail aspect, rather than completing and finishing that ismost associated with profitability.
LeadershipLeadership is described as: ‘Inspiring and guiding indi-viduals and a group. Leading by example and arousingenthusiasm for a shared vision’. The important role ofLeadership in farm profitability is, for the first time,supported empirically among farmers and farm man-agers by our findings. The regression models predict that,if two farmers only differed in their Leadership measureby one STEN score, half a standard deviation, the onethat scored higher would achieve d55 more profit percow or just under d8,000 more per year for a 150 cow herd.
RelaxedThe variable Relaxed had a large negative correlationwith profitability, and was included in the final models.A high scorer on the Relaxed measure ‘finds it easy torelax, rarely feels tense, is generally calm and untroubled’and a low scorer ‘tends to feel tense, finds it difficult torelax, can find it hard to unwind after work’. A constantdrive to succeed manifests as tenseness and an always-onapproach appears beneficial in dairy farming, financiallyat least. This finding was somewhat contradictory toexpectations. Relaxed exists in the factorial space ofEmotional Stability (Bartram, 2013), which is thought tobe an important positive predictor of performance, ingeneral, while these results indicate that some aspects of
emotional stability are not beneficial from a farm finan-cial perspective.
Data quality and future researchFuture research in this area should include the OPQr, oralternative psychological inventory, a reputable GCAmeasure and quality financial data with a larger fullyrepresentative sample and with varying populations offarmers. Controlling for business size may also beadvisable. The OPQr instrument has been proven to beeffective for use with farmers and farm managers.However, non-proprietary alternatives should be con-sidered. The OPQs’ opaqueness, due to its proprietarynature, is a significant impediment from a researchperspective and it would be relatively expensive forfarmers and farm managers to use the tool themselves.This is likely to reduce potential benefits from theapplication of the findings in practical contexts.
5. Conclusions
Three personality measures predicted around 40% of thevariation in farm financial performance in a relativelysmall sample of 40 dairy farmers and farm managers inEngland and Wales over 2015. A wide range of scores onthese variables existed among the farmers and farmmanagers, and the mean scores of some key attributesare distinct from the national norm population used forcomparison in the study summarised here. Hiring andtraining of farm managers, and other farm staff, is likelyto be improved by increased assessment of such persona-lity measures in the process. Training providers, farmconsultants and farm managers should also consider howto achieve this.
Increasing Detail Conscious behaviour is the mostexciting opportunity arising, as there appears to be aneed to increase this beneficial trait from a low baseamong dairy farmers and managers in England andWales. The effectiveness of training at targeting DetailConscious behaviour, and Leadership, at improvingfarm business financial performance also requires moreinvestigation. Further research, with larger, more repre-sentative and diverse samples of farmers and managersfrom sectors other than dairying focusing on DetailConscious, Leadership and Relaxed measures is requiredto verify the very promising, and rather innovative,findings of the study presented here.
About the authors
Dr. Niall O’Leary, is a Research Officer at the Mooreparkresearch station of Teagasc, the Agriculture and FoodDevelopment Authority of Ireland, where he is workingon Precision Livestock Technology. His PhD thesis, fromthe University of Reading, was about what attributesmake a successful farmer. His family are dairy farmers inCo Kerry, Ireland.
Professor Richard Tranter, is Professor of Rural Econ-omy and Director of the Centre for Agricultural Strategyat the University of Reading. He is an agricultural eco-nomist, with 40 years’ experience in rural land use andfarm economics and structural issues. In recent years,much of his research has concentrated on the decision-making behaviour of farmers.
International Journal of Agricultural Management, Volume 7 Issue 2 ISSN 2047-3710& 2018 International Farm Management Association and Institute of Agricultural Management 23
Niall O’Leary et al. Is farmer personality associated with farm profitability?
Professor Richard Bennett, is Professor of AgriculturalEconomics and Research Dean for Food at the Uni-versity of Reading. He has a lifelong interest in animalhealth and welfare and has carried out many researchprojects examining farmers’ attitudes towards this, andtheir reaction to the introduction of new legislation inthis sphere.
Acknowledgement
The data used in this paper were originally collected for aproject by Promar International for AHDB Dairy,focusing on the Emotional Social Intelligence of farmers.The role of Neil Adams of Promar International andJames Hanbury of Exeter Leadership in the originalproject, made this paper possible, and is acknowledgedwith much gratitude by the authors. Whilst the originalproject was in progress, the lead author was employed ona parallel project which received support from theKnowledge Transfer Partnership’s programme, overseenby Innovate UK (Swindon), the UK’s innovation agencywhich is supported by 16 other public sector fundingorganisations.
REFERENCES
AHDB Dairy (2016). Dairy statistics, Kenilworth. http://dairy.ahdb.org.uk/resources-library/market-information/dairy-statistics/dairy-statistics-an-insiders-guide-2016/#.WXdMzhXyv-s
Alvarez, A. and Arias, C. (2004). Technical efficiency and farmsize: a conditional analysis. Agricultural Economics. vol. 30,no. 3, pp. 241–250. DOI: 10.1016/S0169-5150(04)00024-6.
Ashbridge, I. (2014). Opportunity Agriculture: the next decade,The Oxford Farming Conference. https://www.ofc.org.uk/sites/ofc/files/research/ofcreportonline.pdf [Accessed 8January 2018].
Austin, E.J., Deary, I.J. and Willock, J. (2001). Personality andintelligence as predictors of economic behaviour in Scottishfarmers. European Journal of Personality. vol. 15, pp. S123–S137. DOI: 10.1002/per.421.
Barnes, A.P. (2006). Does multi-functionality affect technicalefficiency? A non-parametric analysis of the Scottish dairyindustry. Journal of Environmental Management. vol. 80,no. 4, pp. 287–294. DOI: 10.1016/j.jenvman.2005.09.020.
Bartram, D. (2013). Scalar Equivalence of OPQ32: Big FiveProfiles of 31 Countries. Journal of Cross-Cultural Psychology.vol. 44, no. 1, pp. 61–83. DOI: 10.1177/0022022111430258.
British Psychological Society (2016). Test Review Summary:Occupational Personality Questionnaire (OPQ32). https://ptc.bps.org.uk/test-registration-test-reviews/search-registered-tests/viewtestsummary/185 [Accessed 21 March 2016].
Brown, A. and Bartram, D. (2009). OPQ: Supplement to theOPQ32 Technical Manual. SHL Group Limited. London.www.shl.com [Accessed 1 October 2015].
Burton, R. (2004). Reconceptualising the ‘behavioural approach’in agricultural studies: a socio-psychological perspective.Journal of Rural Studies. vol. 20, no. 3, pp. 359–371.
Edwards-Jones, G. (2006). Modelling farmer decision-making:concepts, progress and challenges. Animal Science. vol. 82,no. 6, p. 783–790. DOI: 10.1017/ASC2006112.
Farm Business Survey Team (2012). Data Builder User Guide.Rural Business Research. http://farmbusinesssurvey.co.uk/DataBuilder/Default.aspx?module=UGExampleFarmersAgeType [Accessed 24 August 2012].
Furnham, A., Race, M-C. and Rosen, A. (2014). Emotionalintelligence and the Occupational Personality Questionnaire(OPQ). Frontiers in Psychology. vol. 5, pp. 1–8. DOI: 10.3389/fpsyg.2014.00935.
Garforth, C. (2010). Motivating farmers: insights from socialpsychology. In: Annual meeting - National Mastitis Council.
Reading. pp. 60–67. http://www.nmconline.org/articles/gar-forth2010.pdf [Accessed 24 May 2012].
Gasson, R. (1973). Goals and values of farmers. Journal ofAgricultural Economics. vol. 23, no. 3, pp. 521–537. DOI:10.1111/j.1477-9552.1973.tbo0950.x.
Hansson, H. (2008). How can farmer managerial capacitycontribute to improved farm performance? A study of dairyfarms in Sweden. Food Economics - Acta Agricultural Scan-dinavica, Section C. vol. 5, no. 1, pp. 44–61. DOI: 10.1080/16507540802172808.
Hunter, J.E. and Hunter, R.F. (1984). Validity and utility ofalternative predictors of job performance. PsychologicalBulletin. vol. 96, no. 1, pp. 72–98. DOI: 10.1037/0033-2909.96.1.72.
Johansson, H. and Ohlmer, B. (2007). What is the effect ofoperational managerial practices on dairy farm efficiency?Some results from Sweden. pp. 1–29. http://ageconsearch.umn.edu/bitstream/9845/1/sp07jo02.pdf
Jones, P.J., Tranter, R.B., Blanco-Penedo, I., Fall, N., Fourichon,C., Hogeveen, H., Krieger, M.C. and Sundrum, A. (2016).Assessing, and understanding, European organic dairy farmers’intentions to improve herd health. Preventive VeterinaryMedicine. vol.133, pp. 84–96. DOI: 10.1016/j.prevetmed.2016.08.005.
Macnab, D., Bakker, S. and Fitzsimmons, G.W. (2005) CareerValues Scale Manual and User’s Guide. Edmonton, Canada:Psychometrics Canada Ltd.
Makinen, H. (2013). Farmers’ managerial thinking and man-agement process effectiveness as factors of financial suc-cess on Finnish dairy farms. Agricultural and Food Science.vol. 22, pp. 452–465. https://journal.fi/afs/article/view/8147
Mattison, E.H.A. and Norris, K. (2007). Policy Analysis Intentionsof UK Farmers toward Biofuel Crop Production: Implicationsfor Policy Targets and Land Use Change. EnvironmentalScience & Technology. vol. 41, no. 16, pp. 5589–5594. DOI:10.1021/es062211v.
McCrae, R.R. and Costa, P.T. (1985). Updating Norman’s‘Adequate Taxonomy’: intelligence and personality dimen-sions in natural language and in questionnaires. Journal ofPersonality and Social Psychology. vol. 49, no. 3, pp. 710–721. DOI: 10.1037/0022-3514.49.3.710.
McGregor, M., Willock, J., Dent, B., Deary, I., Sutherland, A.,Gibson, G., Morgan, O. and Grieve, B. (1996). Links betweenpsychological factors and farmer decision making. FarmManagement. vol. 9, no. 5, pp. 228–239. http://researchgate.net/publication/255687361_Links_Between_Psychological_Factors_and_Farmer_Decision_Making
Nuthall, P.L. (2001). Managerial ability – a review of its basis andpotential improvement using psychological concepts. Agri-cultural Economics. vol.24, pp. 247–262.
Nuthall, P.L. (2009). Modelling the origins of managerial ability inagricultural production. Australian Journal of Agricultural andResource Economics. vol. 53, no. 3, pp. 419–436.
Nuthall, P.L. (2010). Should Farmers’ Locus of Control beused in Extension? The Journal of Agricultural Educationand Extension. vol. 16, no. 3, pp. 281–296. DOI: 10.1080/1389224X.2010.489768.
O’Boyle, E.H., Humphrey, R.H., Pollack, J.M., Hawver, T.H. andStory, P.A. (2011). The relation between emotional intelligenceand job performance: a meta-analysis. Journal of Organiza-tional Behavior. vol. 32, pp. 788–818. DOI: 10.1002/job.714.
O’Leary, N.W., Bennett, R.M., Tranter, R.B. and Jones, P.J.(2018). The extent that certain dairy farmer attitudes andbehaviors are associated with farm business profitability.Journal of Dairy Science. vol. 101, in press.
Poropat, A.E. (2009). A meta-analysis of the five-factor model ofpersonality and academic performance. Psychological Bul-letin. vol. 135, no. 2, pp. 322–338.
R Core Team (2013). R: A language and environment for sta-tistical computing. Vienna, Austria: R Foundation for Statis-tical Computing. https://www.eea.europa.eu/data-and-maps/indicators/oxygen-consuming-substances-in-rivers/r-development-core-team-2006
ISSN 2047-3710 International Journal of Agricultural Management, Volume 7 Issue 224 & 2018 International Farm Management Association and Institute of Agricultural Management
Is farmer personality associated with farm profitability? Niall O’Leary et al.
Reeve, C.L. and Hakel, M.D. (2002). Asking the Right QuestionsAbout g. Human Performance. vol. 15, no. 1-2, pp. 47–74.DOI: 10.1080/08959285.2002.9668083.
Saville, P., Sik, G., Nyfield, G., Hackston, J. and MacIver, R.(1996). A demonstration of the validity of the OccupationalPersonality Questionnaire (OPQ) in the measurement of jobcompetencies across time and in separate organisations.Applied Psychology – An International Review. vol. 45, no. 3,pp. 243–262. DOI: 10.1080/026999496378639.
Schmidt, F.L. and Hunter, J. (2004). General Mental Ability in theWorld of Work: Occupational Attainmnent and Job Perfor-mance. Journal of Personality and Social Psychology. vol. 86,no. 1, pp. 162–173. DOI: 10.1037/0022-3514.86.1.162.
Schmitt, N. (2014). Personality and Cognitive Ability as Pre-dictors of Effective Performance at Work. Annual Reviewof Organizational Psychology and Organizational Behavior.vol 1, no. 1, pp. 45–65. DOI: 10.1146/annurev-orgpsych-031413-091255.
Schroeder, L.A. (2012). Assessing farmers’ acceptance andperception of agri-environment schemes by ex-post appli-cation of the ‘Theory of Planned Behaviour’ – a case study inEngland, in Capri (Italy), 126th EAAE Seminar, 27-29 June.
SHL Group Limited (2015). OPQ32r Technical Manual Supple-ment: OPQ32r International Norms. London. http://central.shl.com/en-gb/TheLibrary/Pages/Library.aspx [Accessed 1October 2015).
Smith, M. and Banerji, N. (2007). British Psychological SocietyPsychological Testing Centre Test Reviews. OccupationalPersonality Questionnaire (OPQ32). pp. 1–12. http://www.swissassessment.ch/files/british_psychological_society.pdf
Sutherland, L. and Burton, R. (2011). Good farmers, goodneighbours? The role of cultural capital in social farmingcommunity. Sociologia Ruralis. vol. 51, pp. 238–255.
Tey, Y.S. and Brindal, M. (2015). Factors Influencing FarmProfitability. In: Sustainable Agriculture Reviews. vol. 15pp. 235–257. Ed: Lichtfouse, E. DOI: 10.1007/978-94-007-5961-9.
Vandermersch, M. and Mathijs, E. (2004). The impact of man-agement attitudes on financial performance of Flemish dairyfarms. Journal of Farm Management. vol. 11, no. 11, pp.637–648.
Vickery, A., Billen, J., Howe, J. and Finnan, G. (2015). Milk costof production 2015 survey. https://www.oldmillgroup.co.uk/wp-content/uploads/Old-Mill-Dairy-COP.pdf [Accessed 25July 2017].
Willock, J., Deary, I.J., McGregor, M.M., Sutherland, A.,Edwards-Jones, G., Morgan, O., Dent, B., Grieve, R., Gib-son, G. and Austin, E. (1999). Farmers’ attitudes, objectives,behaviors and personality traits: the Edinburgh study ofdecision making on farms. Journal of Vocational Behavior.vol. 54, no. 1, pp. 5–36. DOI: 10.1006/jvbe.1998.1642.
Wilson, P., Hadley, D., Ramsden, S. and Kaltsas, I. (1998).Measuring and explaining technical efficiency in UK potatoproduction. Journal of Agricultural Economics. vol. 49, no.3, pp. 294–305. DOI: 10.1111/j.1477-95521998.tb01273x/epdt.
Wilson, P. and Harper, N. (2011). Explaining variation in farm andfarm business performance in respect to farmer segmenta-tion analysis, 85th Annual Conference of the AgriculturalEconomics Society, 18 April. pp. 1–23. http://ideas.repec.org/p/ags/aesc11/108783.html [Accessed 24 May 2012).
Wilson, P., Harper, N. and Darling, R. (2013). Explaining variationin farm and farm business performance in respect to farmerbehavioural segmentation analysis: implications for land usepolicies. Land Use Policy. vol. 30, no. 1, pp. 147–156. DOI:10.1016/j.landusepol.2012.03.006.
International Journal of Agricultural Management, Volume 7 Issue 2 ISSN 2047-3710& 2018 International Farm Management Association and Institute of Agricultural Management 25
Niall O’Leary et al. Is farmer personality associated with farm profitability?
REFEREED ARTICLEDOI: 10.5836/ijam/2018-07-26
Socioeconomic drivers of land mobilityin Irish agriculture
CATHAL GEOGHEGAN1,2 and CATHAL O’DONOGHUE2
ABSTRACTLand mobility is becoming an increasingly important issue for European agriculture given the so-called‘‘greying’’ of the farming population. This is especially the case in Ireland where meeting current andfuture policy goals will pose challenges to current agricultural land use and land structures. One of themost important of these policy goals is Food Harvest 2020 (FH2020), which envisages an increase in dairymilk volume of 50% by the year 2020. In order to facilitate this expansion, changes in Irish agriculturalland use and land structures may be required.Increased land mobility may be required to reach the FH2020 target. Currently, Ireland has the lowest rateof agricultural land rental in Europe and less than 1% of farmland is transferred by sale or inheritanceannually. Although efforts have been made by policy makers to improve rates of land mobility, littleimprovement has occurred.Given the current land structures, our analysis concludes that dairy farmers will require more land than iscurrently available to meet FH2020 targets. This extra land may come from non-dairy farmers. Cattlefarmers are seen as most likely to transfer to dairy farming in the future but structural and demographicissues may mean that a far smaller amount of switching between cattle and dairy systems will occur than isexpected by policy makers. This may impinge upon future growth in the Irish agri-food industry. In orderto achieve policy objectives, better incentives may have to be developed to encourage the mobility of landbetween farmers.
KEYWORDS: Ireland: land use; land tenure: dairy: socio-economic determinants
1. Introduction
The removal of the milk quota for EU farmers in 2015represents both a period of change but also opportunityfor European farmers. Unlimited milk production allowsEU countries that possess a comparative advantage interms of dairy production to fully capitalise on thatadvantage for the first time in over 30 years. One suchcountry is Ireland, where a combination of a grass-basedfeeding system and large amounts of productive landshould allow great scope for increased dairy production.Despite continued milk price volatility in recent years,net margins for Irish dairy farms continue to outperformall other domestic farm systems (Dillon et al., 2017a).Irish public policy targets such as Food Harvest 2020(FH2020) and Food Wise 2025 envisage an increase indairy milk volume of 50% by the year 2020, followed bycontinued industry growth in subsequent years (DAFF,2010a). This is based on an expected increase in demandfor dairy products as a result of global population growthand rising per capita disposable incomes (DAFF, 2010b).This increased global demand is expected to lead tohigher, albeit more volatile, prices for dairy products.
However, doubts have already been expressed con-cerning the likelihood of achieving FH2020 targets through
increased herd size or increased milk yield without changesin Irish farm structures (Läpple and Hennessy, 2012).Meeting these targets, as well as fulfilling climate changeand environmental obligations, will pose challenges tocurrent land use and land structures. Land use changemay require adjustments in what we formally consideragricultural land use change. Change may mean movingfrom agriculture to forestry, but may also mean a changein the mix of agricultural activities on a farm, for example,from cattle to dairy. Structural land change may involvechanges in farm size and farm fragmentation.
Growth in the dairy sector will require changes to landuse and land structures, which may prove difficult givenIreland’s low level of land sales (O’Neill and Hanrahan,2012) and land leasing (Ciaian et al., 2010). While therehas been some increase in the average farm size overtime, the rate of change is quite slow. Much of thisincrease has been via non-contiguous parcels, with theaverage land parcel number per farm increasing overtime (Kearney, 2010). Measures to increase land mobilityi.e. the transfer of agricultural land whether permanentlyor temporarily, have been introduced including incenti-vised land leasing, the removal of barriers associatedwith farm partnerships and farm consolidation stamprelief (Land Mobility Service, 2014).
1Corresponding author: Teagasc Rural Economy and Development Programme, Phone: +35391 845822, Email: [email protected] University of Ireland, Galway.
Original submitted January 2017; revision received June 2018; accepted July 2018.
ISSN 2047-3710 International Journal of Agricultural Management, Volume 7 Issue 226 & 2018 International Farm Management Association and Institute of Agricultural Management
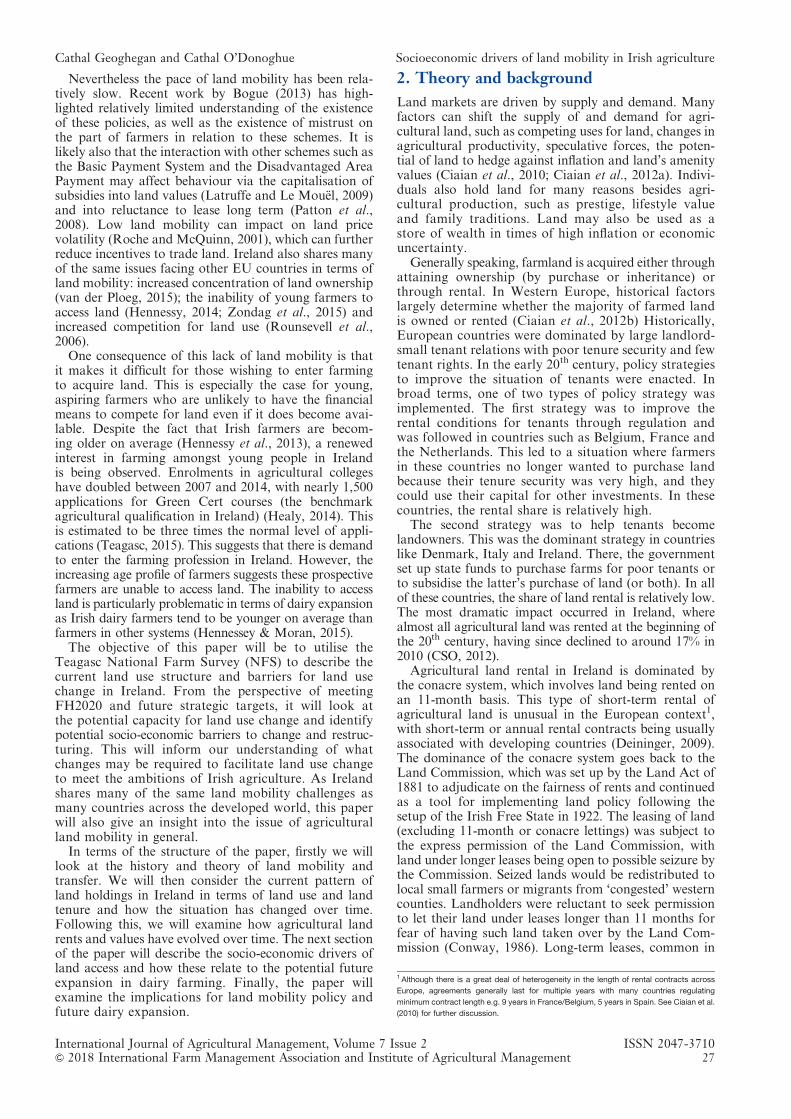
Nevertheless the pace of land mobility has been rela-tively slow. Recent work by Bogue (2013) has high-lighted relatively limited understanding of the existenceof these policies, as well as the existence of mistrust onthe part of farmers in relation to these schemes. It islikely also that the interaction with other schemes such asthe Basic Payment System and the Disadvantaged AreaPayment may affect behaviour via the capitalisation ofsubsidies into land values (Latruffe and Le Mouël, 2009)and into reluctance to lease long term (Patton et al.,2008). Low land mobility can impact on land pricevolatility (Roche and McQuinn, 2001), which can furtherreduce incentives to trade land. Ireland also shares manyof the same issues facing other EU countries in terms ofland mobility: increased concentration of land ownership(van der Ploeg, 2015); the inability of young farmers toaccess land (Hennessy, 2014; Zondag et al., 2015) andincreased competition for land use (Rounsevell et al.,2006).
One consequence of this lack of land mobility is thatit makes it difficult for those wishing to enter farmingto acquire land. This is especially the case for young,aspiring farmers who are unlikely to have the financialmeans to compete for land even if it does become avai-lable. Despite the fact that Irish farmers are becom-ing older on average (Hennessy et al., 2013), a renewedinterest in farming amongst young people in Irelandis being observed. Enrolments in agricultural collegeshave doubled between 2007 and 2014, with nearly 1,500applications for Green Cert courses (the benchmarkagricultural qualification in Ireland) (Healy, 2014). Thisis estimated to be three times the normal level of appli-cations (Teagasc, 2015). This suggests that there is demandto enter the farming profession in Ireland. However, theincreasing age profile of farmers suggests these prospectivefarmers are unable to access land. The inability to accessland is particularly problematic in terms of dairy expansionas Irish dairy farmers tend to be younger on average thanfarmers in other systems (Hennessey & Moran, 2015).
The objective of this paper will be to utilise theTeagasc National Farm Survey (NFS) to describe thecurrent land use structure and barriers for land usechange in Ireland. From the perspective of meetingFH2020 and future strategic targets, it will look atthe potential capacity for land use change and identifypotential socio-economic barriers to change and restruc-turing. This will inform our understanding of whatchanges may be required to facilitate land use changeto meet the ambitions of Irish agriculture. As Irelandshares many of the same land mobility challenges asmany countries across the developed world, this paperwill also give an insight into the issue of agriculturalland mobility in general.
In terms of the structure of the paper, firstly we willlook at the history and theory of land mobility andtransfer. We will then consider the current pattern ofland holdings in Ireland in terms of land use and landtenure and how the situation has changed over time.Following this, we will examine how agricultural landrents and values have evolved over time. The next sectionof the paper will describe the socio-economic drivers ofland access and how these relate to the potential futureexpansion in dairy farming. Finally, the paper willexamine the implications for land mobility policy andfuture dairy expansion.
2. Theory and background
Land markets are driven by supply and demand. Manyfactors can shift the supply of and demand for agri-cultural land, such as competing uses for land, changes inagricultural productivity, speculative forces, the poten-tial of land to hedge against inflation and land’s amenityvalues (Ciaian et al., 2010; Ciaian et al., 2012a). Indivi-duals also hold land for many reasons besides agri-cultural production, such as prestige, lifestyle valueand family traditions. Land may also be used as astore of wealth in times of high inflation or economicuncertainty.
Generally speaking, farmland is acquired either throughattaining ownership (by purchase or inheritance) orthrough rental. In Western Europe, historical factorslargely determine whether the majority of farmed landis owned or rented (Ciaian et al., 2012b) Historically,European countries were dominated by large landlord-small tenant relations with poor tenure security and fewtenant rights. In the early 20th century, policy strategiesto improve the situation of tenants were enacted. Inbroad terms, one of two types of policy strategy wasimplemented. The first strategy was to improve therental conditions for tenants through regulation andwas followed in countries such as Belgium, France andthe Netherlands. This led to a situation where farmersin these countries no longer wanted to purchase landbecause their tenure security was very high, and theycould use their capital for other investments. In thesecountries, the rental share is relatively high.
The second strategy was to help tenants becomelandowners. This was the dominant strategy in countrieslike Denmark, Italy and Ireland. There, the governmentset up state funds to purchase farms for poor tenants orto subsidise the latter’s purchase of land (or both). In allof these countries, the share of land rental is relatively low.The most dramatic impact occurred in Ireland, wherealmost all agricultural land was rented at the beginning ofthe 20th century, having since declined to around 17% in2010 (CSO, 2012).
Agricultural land rental in Ireland is dominated bythe conacre system, which involves land being rented onan 11-month basis. This type of short-term rental ofagricultural land is unusual in the European context1,with short-term or annual rental contracts being usuallyassociated with developing countries (Deininger, 2009).The dominance of the conacre system goes back to theLand Commission, which was set up by the Land Act of1881 to adjudicate on the fairness of rents and continuedas a tool for implementing land policy following thesetup of the Irish Free State in 1922. The leasing of land(excluding 11-month or conacre lettings) was subject tothe express permission of the Land Commission, withland under longer leases being open to possible seizure bythe Commission. Seized lands would be redistributed tolocal small farmers or migrants from ‘congested’ westerncounties. Landholders were reluctant to seek permissionto let their land under leases longer than 11 months forfear of having such land taken over by the Land Com-mission (Conway, 1986). Long-term leases, common in
1 Although there is a great deal of heterogeneity in the length of rental contracts across
Europe, agreements generally last for multiple years with many countries regulating
minimum contract length e.g. 9 years in France/Belgium, 5 years in Spain. See Ciaian et al.
(2010) for further discussion.
International Journal of Agricultural Management, Volume 7 Issue 2 ISSN 2047-3710& 2018 International Farm Management Association and Institute of Agricultural Management 27
Cathal Geoghegan and Cathal O’Donoghue Socioeconomic drivers of land mobility in Irish agriculture
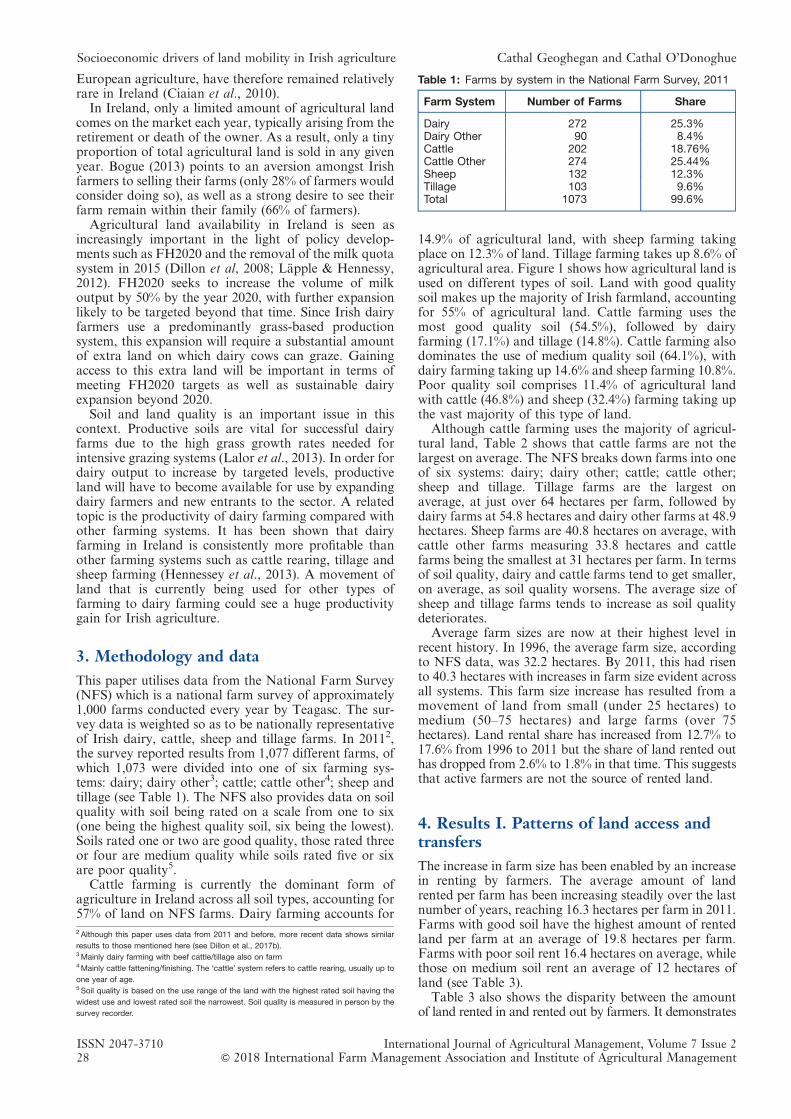
European agriculture, have therefore remained relativelyrare in Ireland (Ciaian et al., 2010).
In Ireland, only a limited amount of agricultural landcomes on the market each year, typically arising from theretirement or death of the owner. As a result, only a tinyproportion of total agricultural land is sold in any givenyear. Bogue (2013) points to an aversion amongst Irishfarmers to selling their farms (only 28% of farmers wouldconsider doing so), as well as a strong desire to see theirfarm remain within their family (66% of farmers).
Agricultural land availability in Ireland is seen asincreasingly important in the light of policy develop-ments such as FH2020 and the removal of the milk quotasystem in 2015 (Dillon et al, 2008; Läpple & Hennessy,2012). FH2020 seeks to increase the volume of milkoutput by 50% by the year 2020, with further expansionlikely to be targeted beyond that time. Since Irish dairyfarmers use a predominantly grass-based productionsystem, this expansion will require a substantial amountof extra land on which dairy cows can graze. Gainingaccess to this extra land will be important in terms ofmeeting FH2020 targets as well as sustainable dairyexpansion beyond 2020.
Soil and land quality is an important issue in thiscontext. Productive soils are vital for successful dairyfarms due to the high grass growth rates needed forintensive grazing systems (Lalor et al., 2013). In order fordairy output to increase by targeted levels, productiveland will have to become available for use by expandingdairy farmers and new entrants to the sector. A relatedtopic is the productivity of dairy farming compared withother farming systems. It has been shown that dairyfarming in Ireland is consistently more profitable thanother farming systems such as cattle rearing, tillage andsheep farming (Hennessey et al., 2013). A movement ofland that is currently being used for other types offarming to dairy farming could see a huge productivitygain for Irish agriculture.
3. Methodology and data
This paper utilises data from the National Farm Survey(NFS) which is a national farm survey of approximately1,000 farms conducted every year by Teagasc. The sur-vey data is weighted so as to be nationally representativeof Irish dairy, cattle, sheep and tillage farms. In 20112,the survey reported results from 1,077 different farms, ofwhich 1,073 were divided into one of six farming sys-tems: dairy; dairy other3; cattle; cattle other4; sheep andtillage (see Table 1). The NFS also provides data on soilquality with soil being rated on a scale from one to six(one being the highest quality soil, six being the lowest).Soils rated one or two are good quality, those rated threeor four are medium quality while soils rated five or sixare poor quality5.
Cattle farming is currently the dominant form ofagriculture in Ireland across all soil types, accounting for57% of land on NFS farms. Dairy farming accounts for
14.9% of agricultural land, with sheep farming takingplace on 12.3% of land. Tillage farming takes up 8.6% ofagricultural area. Figure 1 shows how agricultural land isused on different types of soil. Land with good qualitysoil makes up the majority of Irish farmland, accountingfor 55% of agricultural land. Cattle farming uses themost good quality soil (54.5%), followed by dairyfarming (17.1%) and tillage (14.8%). Cattle farming alsodominates the use of medium quality soil (64.1%), withdairy farming taking up 14.6% and sheep farming 10.8%.Poor quality soil comprises 11.4% of agricultural landwith cattle (46.8%) and sheep (32.4%) farming taking upthe vast majority of this type of land.
Although cattle farming uses the majority of agricul-tural land, Table 2 shows that cattle farms are not thelargest on average. The NFS breaks down farms into oneof six systems: dairy; dairy other; cattle; cattle other;sheep and tillage. Tillage farms are the largest onaverage, at just over 64 hectares per farm, followed bydairy farms at 54.8 hectares and dairy other farms at 48.9hectares. Sheep farms are 40.8 hectares on average, withcattle other farms measuring 33.8 hectares and cattlefarms being the smallest at 31 hectares per farm. In termsof soil quality, dairy and cattle farms tend to get smaller,on average, as soil quality worsens. The average size ofsheep and tillage farms tends to increase as soil qualitydeteriorates.
Average farm sizes are now at their highest level inrecent history. In 1996, the average farm size, accordingto NFS data, was 32.2 hectares. By 2011, this had risento 40.3 hectares with increases in farm size evident acrossall systems. This farm size increase has resulted from amovement of land from small (under 25 hectares) tomedium (50–75 hectares) and large farms (over 75hectares). Land rental share has increased from 12.7% to17.6% from 1996 to 2011 but the share of land rented outhas dropped from 2.6% to 1.8% in that time. This suggeststhat active farmers are not the source of rented land.
4. Results I. Patterns of land access andtransfers
The increase in farm size has been enabled by an increasein renting by farmers. The average amount of landrented per farm has been increasing steadily over the lastnumber of years, reaching 16.3 hectares per farm in 2011.Farms with good soil have the highest amount of rentedland per farm at an average of 19.8 hectares per farm.Farms with poor soil rent 16.4 hectares on average, whilethose on medium soil rent an average of 12 hectares ofland (see Table 3).
Table 3 also shows the disparity between the amountof land rented in and rented out by farmers. It demonstrates
Table 1: Farms by system in the National Farm Survey, 2011
Farm System Number of Farms Share
Dairy 272 25.3%Dairy Other 90 8.4%Cattle 202 18.76%Cattle Other 274 25.44%Sheep 132 12.3%Tillage 103 9.6%Total 1073 99.6%
2Although this paper uses data from 2011 and before, more recent data shows similar
results to those mentioned here (see Dillon et al., 2017b).3Mainly dairy farming with beef cattle/tillage also on farm4Mainly cattle fattening/finishing. The ‘cattle’ system refers to cattle rearing, usually up to
one year of age.5 Soil quality is based on the use range of the land with the highest rated soil having the
widest use and lowest rated soil the narrowest. Soil quality is measured in person by the
survey recorder.
ISSN 2047-3710 International Journal of Agricultural Management, Volume 7 Issue 228 & 2018 International Farm Management Association and Institute of Agricultural Management
Socioeconomic drivers of land mobility in Irish agriculture Cathal Geoghegan and Cathal O’Donoghue
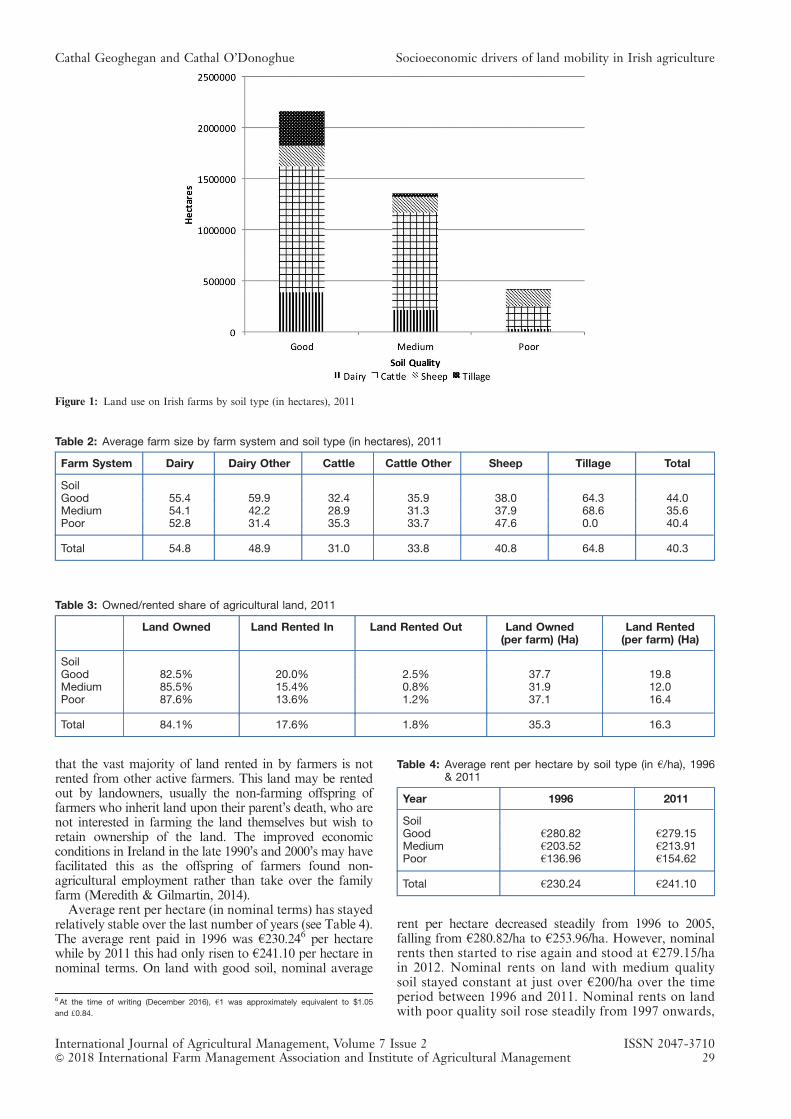
that the vast majority of land rented in by farmers is notrented from other active farmers. This land may be rentedout by landowners, usually the non-farming offspring offarmers who inherit land upon their parent’s death, who arenot interested in farming the land themselves but wish toretain ownership of the land. The improved economicconditions in Ireland in the late 1990’s and 2000’s may havefacilitated this as the offspring of farmers found non-agricultural employment rather than take over the familyfarm (Meredith & Gilmartin, 2014).
Average rent per hectare (in nominal terms) has stayedrelatively stable over the last number of years (see Table 4).The average rent paid in 1996 was h230.246 per hectarewhile by 2011 this had only risen to h241.10 per hectare innominal terms. On land with good soil, nominal average
rent per hectare decreased steadily from 1996 to 2005,falling from h280.82/ha to h253.96/ha. However, nominalrents then started to rise again and stood at h279.15/hain 2012. Nominal rents on land with medium qualitysoil stayed constant at just over h200/ha over the timeperiod between 1996 and 2011. Nominal rents on landwith poor quality soil rose steadily from 1997 onwards,
Figure 1: Land use on Irish farms by soil type (in hectares), 2011
Table 2: Average farm size by farm system and soil type (in hectares), 2011
Farm System Dairy Dairy Other Cattle Cattle Other Sheep Tillage Total
SoilGood 55.4 59.9 32.4 35.9 38.0 64.3 44.0Medium 54.1 42.2 28.9 31.3 37.9 68.6 35.6Poor 52.8 31.4 35.3 33.7 47.6 0.0 40.4
Total 54.8 48.9 31.0 33.8 40.8 64.8 40.3
Table 3: Owned/rented share of agricultural land, 2011
Land Owned Land Rented In Land Rented Out Land Owned(per farm) (Ha)
Land Rented(per farm) (Ha)
SoilGood 82.5% 20.0% 2.5% 37.7 19.8Medium 85.5% 15.4% 0.8% 31.9 12.0Poor 87.6% 13.6% 1.2% 37.1 16.4
Total 84.1% 17.6% 1.8% 35.3 16.3
Table 4: Average rent per hectare by soil type (in h/ha), 1996& 2011
Year 1996 2011
SoilGood h280.82 h279.15Medium h203.52 h213.91Poor h136.96 h154.62
Total h230.24 h241.10
6At the time of writing (December 2016), h1 was approximately equivalent to $1.05
and d0.84.
International Journal of Agricultural Management, Volume 7 Issue 2 ISSN 2047-3710& 2018 International Farm Management Association and Institute of Agricultural Management 29
Cathal Geoghegan and Cathal O’Donoghue Socioeconomic drivers of land mobility in Irish agriculture
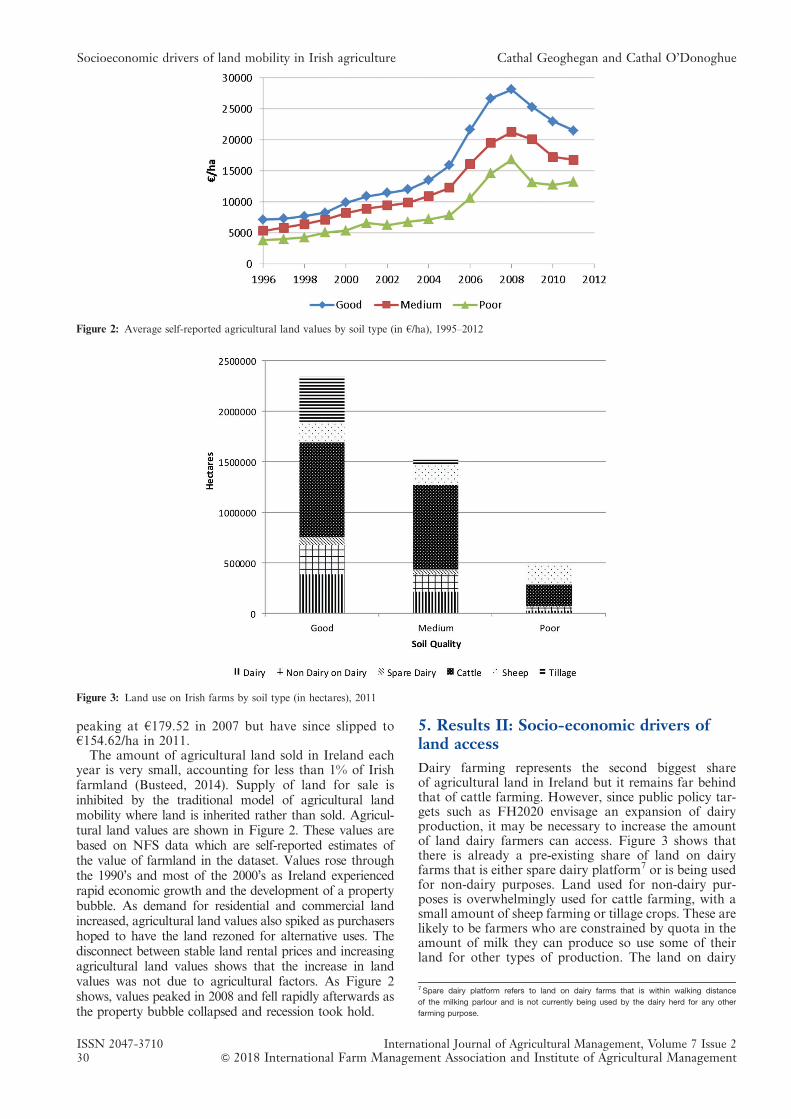
peaking at h179.52 in 2007 but have since slipped toh154.62/ha in 2011.
The amount of agricultural land sold in Ireland eachyear is very small, accounting for less than 1% of Irishfarmland (Busteed, 2014). Supply of land for sale isinhibited by the traditional model of agricultural landmobility where land is inherited rather than sold. Agricul-tural land values are shown in Figure 2. These values arebased on NFS data which are self-reported estimates ofthe value of farmland in the dataset. Values rose throughthe 1990’s and most of the 2000’s as Ireland experiencedrapid economic growth and the development of a propertybubble. As demand for residential and commercial landincreased, agricultural land values also spiked as purchasershoped to have the land rezoned for alternative uses. Thedisconnect between stable land rental prices and increasingagricultural land values shows that the increase in landvalues was not due to agricultural factors. As Figure 2shows, values peaked in 2008 and fell rapidly afterwards asthe property bubble collapsed and recession took hold.
5. Results II: Socio-economic drivers ofland access
Dairy farming represents the second biggest shareof agricultural land in Ireland but it remains far behindthat of cattle farming. However, since public policy tar-gets such as FH2020 envisage an expansion of dairyproduction, it may be necessary to increase the amountof land dairy farmers can access. Figure 3 shows thatthere is already a pre-existing share of land on dairyfarms that is either spare dairy platform7 or is being usedfor non-dairy purposes. Land used for non-dairy pur-poses is overwhelmingly used for cattle farming, with asmall amount of sheep farming or tillage crops. These arelikely to be farmers who are constrained by quota in theamount of milk they can produce so use some of theirland for other types of production. The land on dairy
Figure 2: Average self-reported agricultural land values by soil type (in h/ha), 1995–2012
Figure 3: Land use on Irish farms by soil type (in hectares), 2011
7 Spare dairy platform refers to land on dairy farms that is within walking distance
of the milking parlour and is not currently being used by the dairy herd for any other
farming purpose.
ISSN 2047-3710 International Journal of Agricultural Management, Volume 7 Issue 230 & 2018 International Farm Management Association and Institute of Agricultural Management
Socioeconomic drivers of land mobility in Irish agriculture Cathal Geoghegan and Cathal O’Donoghue
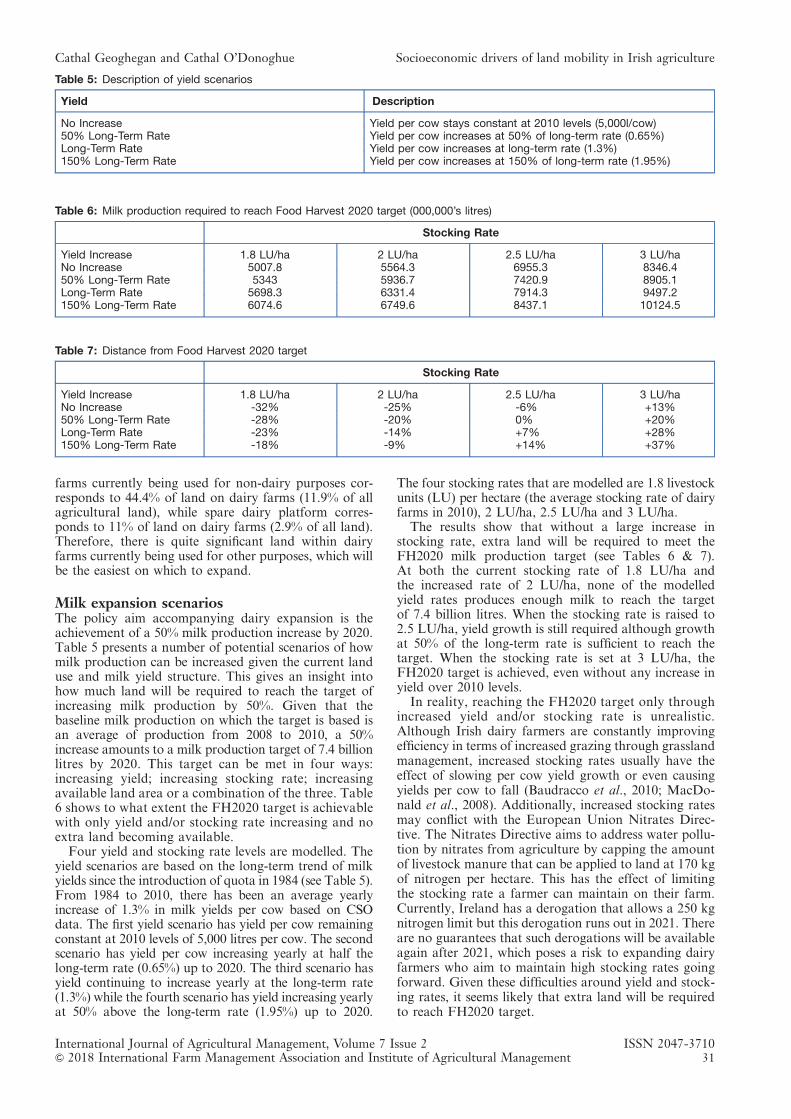
farms currently being used for non-dairy purposes cor-responds to 44.4% of land on dairy farms (11.9% of allagricultural land), while spare dairy platform corres-ponds to 11% of land on dairy farms (2.9% of all land).Therefore, there is quite significant land within dairyfarms currently being used for other purposes, which willbe the easiest on which to expand.
Milk expansion scenariosThe policy aim accompanying dairy expansion is theachievement of a 50% milk production increase by 2020.Table 5 presents a number of potential scenarios of howmilk production can be increased given the current landuse and milk yield structure. This gives an insight intohow much land will be required to reach the target ofincreasing milk production by 50%. Given that thebaseline milk production on which the target is based isan average of production from 2008 to 2010, a 50%increase amounts to a milk production target of 7.4 billionlitres by 2020. This target can be met in four ways:increasing yield; increasing stocking rate; increasingavailable land area or a combination of the three. Table6 shows to what extent the FH2020 target is achievablewith only yield and/or stocking rate increasing and noextra land becoming available.
Four yield and stocking rate levels are modelled. Theyield scenarios are based on the long-term trend of milkyields since the introduction of quota in 1984 (see Table 5).From 1984 to 2010, there has been an average yearlyincrease of 1.3% in milk yields per cow based on CSOdata. The first yield scenario has yield per cow remainingconstant at 2010 levels of 5,000 litres per cow. The secondscenario has yield per cow increasing yearly at half thelong-term rate (0.65%) up to 2020. The third scenario hasyield continuing to increase yearly at the long-term rate(1.3%) while the fourth scenario has yield increasing yearlyat 50% above the long-term rate (1.95%) up to 2020.
The four stocking rates that are modelled are 1.8 livestockunits (LU) per hectare (the average stocking rate of dairyfarms in 2010), 2 LU/ha, 2.5 LU/ha and 3 LU/ha.
The results show that without a large increase instocking rate, extra land will be required to meet theFH2020 milk production target (see Tables 6 & 7).At both the current stocking rate of 1.8 LU/ha andthe increased rate of 2 LU/ha, none of the modelledyield rates produces enough milk to reach the targetof 7.4 billion litres. When the stocking rate is raised to2.5 LU/ha, yield growth is still required although growthat 50% of the long-term rate is sufficient to reach thetarget. When the stocking rate is set at 3 LU/ha, theFH2020 target is achieved, even without any increase inyield over 2010 levels.
In reality, reaching the FH2020 target only throughincreased yield and/or stocking rate is unrealistic.Although Irish dairy farmers are constantly improvingefficiency in terms of increased grazing through grasslandmanagement, increased stocking rates usually have theeffect of slowing per cow yield growth or even causingyields per cow to fall (Baudracco et al., 2010; MacDo-nald et al., 2008). Additionally, increased stocking ratesmay conflict with the European Union Nitrates Direc-tive. The Nitrates Directive aims to address water pollu-tion by nitrates from agriculture by capping the amountof livestock manure that can be applied to land at 170 kgof nitrogen per hectare. This has the effect of limitingthe stocking rate a farmer can maintain on their farm.Currently, Ireland has a derogation that allows a 250 kgnitrogen limit but this derogation runs out in 2021. Thereare no guarantees that such derogations will be availableagain after 2021, which poses a risk to expanding dairyfarmers who aim to maintain high stocking rates goingforward. Given these difficulties around yield and stock-ing rates, it seems likely that extra land will be requiredto reach FH2020 target.
Table 5: Description of yield scenarios
Yield Description
No Increase Yield per cow stays constant at 2010 levels (5,000l/cow)50% Long-Term Rate Yield per cow increases at 50% of long-term rate (0.65%)Long-Term Rate Yield per cow increases at long-term rate (1.3%)150% Long-Term Rate Yield per cow increases at 150% of long-term rate (1.95%)
Table 6: Milk production required to reach Food Harvest 2020 target (000,000’s litres)
Stocking Rate
Yield Increase 1.8 LU/ha 2 LU/ha 2.5 LU/ha 3 LU/haNo Increase 5007.8 5564.3 6955.3 8346.450% Long-Term Rate 5343 5936.7 7420.9 8905.1Long-Term Rate 5698.3 6331.4 7914.3 9497.2150% Long-Term Rate 6074.6 6749.6 8437.1 10124.5
Table 7: Distance from Food Harvest 2020 target
Stocking Rate
Yield Increase 1.8 LU/ha 2 LU/ha 2.5 LU/ha 3 LU/haNo Increase -32% -25% -6% +13%50% Long-Term Rate -28% -20% 0% +20%Long-Term Rate -23% -14% +7% +28%150% Long-Term Rate -18% -9% +14% +37%
International Journal of Agricultural Management, Volume 7 Issue 2 ISSN 2047-3710& 2018 International Farm Management Association and Institute of Agricultural Management 31
Cathal Geoghegan and Cathal O’Donoghue Socioeconomic drivers of land mobility in Irish agriculture
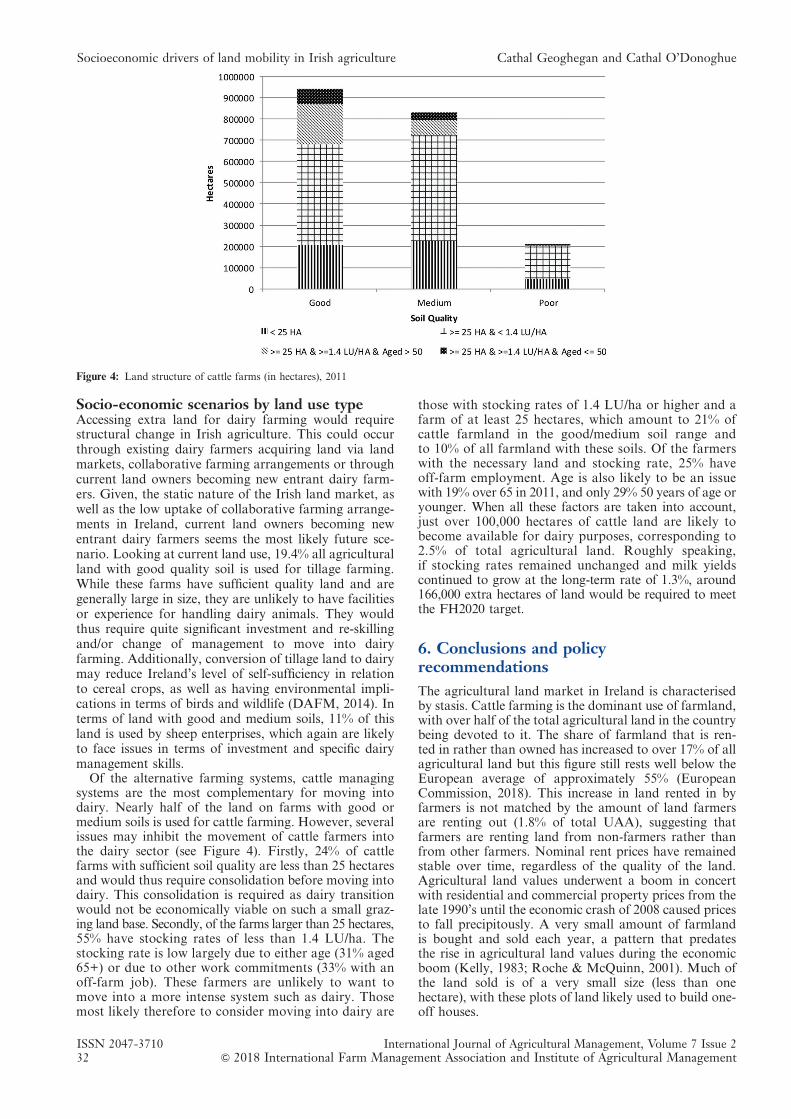
Socio-economic scenarios by land use typeAccessing extra land for dairy farming would requirestructural change in Irish agriculture. This could occurthrough existing dairy farmers acquiring land via landmarkets, collaborative farming arrangements or throughcurrent land owners becoming new entrant dairy farm-ers. Given, the static nature of the Irish land market, aswell as the low uptake of collaborative farming arrange-ments in Ireland, current land owners becoming newentrant dairy farmers seems the most likely future sce-nario. Looking at current land use, 19.4% all agriculturalland with good quality soil is used for tillage farming.While these farms have sufficient quality land and aregenerally large in size, they are unlikely to have facilitiesor experience for handling dairy animals. They wouldthus require quite significant investment and re-skillingand/or change of management to move into dairyfarming. Additionally, conversion of tillage land to dairymay reduce Ireland’s level of self-sufficiency in relationto cereal crops, as well as having environmental impli-cations in terms of birds and wildlife (DAFM, 2014). Interms of land with good and medium soils, 11% of thisland is used by sheep enterprises, which again are likelyto face issues in terms of investment and specific dairymanagement skills.
Of the alternative farming systems, cattle managingsystems are the most complementary for moving intodairy. Nearly half of the land on farms with good ormedium soils is used for cattle farming. However, severalissues may inhibit the movement of cattle farmers intothe dairy sector (see Figure 4). Firstly, 24% of cattlefarms with sufficient soil quality are less than 25 hectaresand would thus require consolidation before moving intodairy. This consolidation is required as dairy transitionwould not be economically viable on such a small graz-ing land base. Secondly, of the farms larger than 25 hectares,55% have stocking rates of less than 1.4 LU/ha. Thestocking rate is low largely due to either age (31% aged65+) or due to other work commitments (33% with anoff-farm job). These farmers are unlikely to want tomove into a more intense system such as dairy. Thosemost likely therefore to consider moving into dairy are
those with stocking rates of 1.4 LU/ha or higher and afarm of at least 25 hectares, which amount to 21% ofcattle farmland in the good/medium soil range andto 10% of all farmland with these soils. Of the farmerswith the necessary land and stocking rate, 25% haveoff-farm employment. Age is also likely to be an issuewith 19% over 65 in 2011, and only 29% 50 years of age oryounger. When all these factors are taken into account,just over 100,000 hectares of cattle land are likely tobecome available for dairy purposes, corresponding to2.5% of total agricultural land. Roughly speaking,if stocking rates remained unchanged and milk yieldscontinued to grow at the long-term rate of 1.3%, around166,000 extra hectares of land would be required to meetthe FH2020 target.
6. Conclusions and policyrecommendations
The agricultural land market in Ireland is characterisedby stasis. Cattle farming is the dominant use of farmland,with over half of the total agricultural land in the countrybeing devoted to it. The share of farmland that is ren-ted in rather than owned has increased to over 17% of allagricultural land but this figure still rests well below theEuropean average of approximately 55% (EuropeanCommission, 2018). This increase in land rented in byfarmers is not matched by the amount of land farmersare renting out (1.8% of total UAA), suggesting thatfarmers are renting land from non-farmers rather thanfrom other farmers. Nominal rent prices have remainedstable over time, regardless of the quality of the land.Agricultural land values underwent a boom in concertwith residential and commercial property prices from thelate 1990’s until the economic crash of 2008 caused pricesto fall precipitously. A very small amount of farmlandis bought and sold each year, a pattern that predatesthe rise in agricultural land values during the economicboom (Kelly, 1983; Roche & McQuinn, 2001). Much ofthe land sold is of a very small size (less than onehectare), with these plots of land likely used to build one-off houses.
Figure 4: Land structure of cattle farms (in hectares), 2011
ISSN 2047-3710 International Journal of Agricultural Management, Volume 7 Issue 232 & 2018 International Farm Management Association and Institute of Agricultural Management
Socioeconomic drivers of land mobility in Irish agriculture Cathal Geoghegan and Cathal O’Donoghue
In terms of dairy expansion, there is a not insignificantamount of land that dairy farmers can immediatelyexpand onto following the removal of quota restrictions.This land consists of land on dairy farms currently usedfor non-dairy farming purposes. Given the increasedstocking rates and/or increased milk yield that would benecessary to reach FH2020 targets, it is almost certainthat additional land will be required in the future bydairy farmers. This corresponds with the findings ofLäpple and Hennessy (2012) who found that achievingthe FH2020 target of a 50% increase in milk output oncurrent dairy farms’ land base is unlikely. Cattle farmersare likely to be in the best position in terms of skills andland quality to transfer to dairy farming but multiplehurdles may prevent this from happening. Small farmsize, low stocking rates and age-related concerns meanthat in actuality, only a small number of cattle farmersmay be likely to switch to dairy farming. The farmlandaccounted for by these farmers corresponds to 2.5% oftotal agricultural land.
The environmental effect of increasing dairy produc-tion must also be considered. Ireland has internationalobligations in terms of greenhouse gas (GHG) emissionsreduction and water quality maintenance through theNitrates Directive. Dillon et al. (2016) report that althoughthe economically top-performing dairy farms emit lessGHG emissions than their less intensive counterparts, thesame top performing farms have a higher nitrogen surplusper hectare on average. Given that the most economicallyproductive farmers are also the most intensive andtherefore the most likely to expand following quotaremoval, achieving environmentally sustainable dairyproduction may prove difficult. Changing land use fromother forms of farming to dairy may also have otherenvironmental implications including increasing overallGHG emissions from agriculture (Donnelan et al., 2014),increasing the risk of flood generation at the local scale(Williams et al., 2012), and reducing farmland biodiversity(Sheridan et al., 2011).
While immediate and significant dairy expansionfollowing quota removal seems feasible given currentland structures, medium and long-term growth in milkproduction will require more land to become availablethan currently seems likely. In order to achieve policytargets, increased land mobility will have to be facili-tated. The low levels of renting and thin transaction mar-ket show a bias amongst Irish farmers toward owning theland that they farm. This is despite increased governmentinterest in the area and a land market found to be theleast regulated in the EU (Swinnen et al., 2014). How-ever, relatively little is known about the attitudes ofIrish farmers to land mobility. It must also be notedthat policies leading to effective changes in tenure sys-tems are very politically sensitive and difficult to achieve(Swinnen et al., 2016). More work is required to deter-mine why Irish farmers are more averse to entering theland market than their European counterparts and toidentify new policy options that can make land mobilitymore attractive to farmers.
About the authors
Cathal Geoghegan Cathal Geoghegan is a PhD candi-date at Teagasc, Athenry and National University ofIreland, Galway (NUIG), Ireland. He holds an MA in
Economic Policy and Planning from NUIG. His researchinterests include agricultural economics, choice modelingand behavioural economics.
Prof. Cathal O’Donoghue Dean of Arts of NationalUniversity of Ireland, Galway. His research interests rangefrom welfare economics to agricultural and economicpolicy. He has published widely in economic and agri-cultural journals. He is also the president of the Inter-national Microsimulation Association.
REFERENCES
Baudracco, J., Lopez-Villalobos, N., Holmes, C.W. and Mac-donald, K.A. (2010). Effects of stocking rate, supplemen-tation, genotype and their interactions on grazing dairysystems: a review. New Zealand Journal of AgriculturalResearch, 53(2), 109–133. DOI: 10.1080/00288231003777665
Binfield, J., Donnellan, T. and Hanrahan, K. (2008). ‘‘An exam-ination of milk quota expansion at EU member state level withspecific emphasis on Ireland’’, in ‘‘Modelling Agricultural andRural Development Policies-Selected Papers from the 107thSeminar of the European Association of Agricultural Eco-nomists’’, EAAE, Seville, pp. 978–92. Retrieved from: http://ageconsearch.umn.edu/bitstream/6467/2/cp08bi16.pdf
Bogue, P. (2013). Land mobility and succession in Ireland.Dublin: Macra na Feirme.
Busteed, S. (2014, March 20). Land price report: Price steadybut vulnerable as national average slips. Irish Farmers Jour-nal. Retrieved from: http://www.farmersjournal.ie/land-price-report-national-average-falls-to-9-400-acre-155920/
Central Statistics Office (2012). Census of agriculture 2010.Dublin: CSO.
Conway, A.G. (1986). Land leasing – findings of a study in thewest region of the Republic of Ireland. Irish Journal of Agri-cultural Economics and Rural Sociology, 11, 1–18. Retrievedfrom: http://www.jstor.org/stable/25556545
Ciaian, P., Kancs, d’A. and Swinnen, J. (2010). EU land marketsand the common agricultural policy. Brussels: Centre forEuropean Policy Studies.
Ciaian, P., Kancs, d’A., Swinnen, J., Van Herck, K. and Vranken,L. (2012a). Institutional factors affecting agricultural landmarkets (Factor Markets Working Paper 16). Brussels: Cen-tre for European Policy Studies. Retrieved from: http://aei.pitt.edu/58519/1/Factor_Markets_16.pdf
Ciaian, P., Kancs, d’A., Swinnen, J., Van Herck, K. and Vranken,L. (2012b). Key issues and developments in farmland rentalmarkets in EU member states and candidate countries(Factor Markets Working Paper 13). Brussels: Centre forEuropean Policy Studies. Retrieved from: http://aei.pitt.edu/58516/1/Factor_Markets_13.pdf
Deininger, K. (2009). Monitoring and evaluation of land policiesand land reform. In H.P. Binswanger-Mhkize, C. Bourguignon,R. van den Brink (Eds.), Agricultural land redistribution:Toward greater consensus (pp. 397–439). Washington D.C.:World Bank.
Department of Agriculture, Fisheries & Food (2010a). FoodHarvest 2020: A vision for Irish agri-food and fisheries.Dublin: DAFF.
Department of Agriculture, Fisheries & Food (2010b). Roadmapfor implementation of Food Harvest 2020 in the dairy sector.Dublin: DAFF.
Department of Agriculture, Food & the Marine (2014). Ruraldevelopment programme 2014-2020: Approprioate assess-ment. Dublin: DAFM.
Dillon, E.J., Donnellan, T., Hanrahan, K., Houlihane, T., Loughrey,J., Mckeon, M., Moran, B. and Thorne, F. (2017a). Outlook2018: Economic prospects for agriculture. Athenry: Teagasc.
Dillon, E.J., Hennessy, T., Buckley, C., Donnellan, T., Hanrahan,K., Moran, B. and Ryan, M. (2016). Measuring progress inagricultural sustainability to support policy-making. Interna-tional Journal of Agricultural Sustainability, 14(1), 31–44. DOI:10.1080/14735903.2015.1012413
International Journal of Agricultural Management, Volume 7 Issue 2 ISSN 2047-3710& 2018 International Farm Management Association and Institute of Agricultural Management 33
Cathal Geoghegan and Cathal O’Donoghue Socioeconomic drivers of land mobility in Irish agriculture
Dillon, E.J., Moran, B. and Donnelan, T. (2017b). Teagascnational farm survey results 2016. Athenry: Teagasc.
Dillon, P.A.T., Hennessy, T., Shalloo, L., Thorne, F. and Horan, B.(2008). Future outlook for the Irish dairy industry: A studyof international competitiveness, influence of internationaltrade reform and requirement for change. International Jour-nal of Dairy Technology, 61, 16–29. DOI: 10.1111/j.1471-0307.2008.00374.x
Donnellan, T., Hanrahan, K. and Breen, J.P. (2014). Develop-ment and application of economic and environmental mod-els of greenhouse gas emissions from agriculture: Somedifficult choices for policy makers. In C. Zopounidis, N.Kalogeras, K. Mattas, G. van Dijk, Baourakis, G. (Eds.), Agri-cultural Cooperative Management and Policy (pp. 243–263).Cham: Springer.
European Commission (2018). Agricultural capital and landvalue. Brussels: European Commisssion. Retrieved from:https://ec.europa.eu/agriculture/sites/agriculture/files/statistics/facts-figures/agricultural-capital-land-value.pdf
Healy, A. (2014, November, 21). Agricultural education givesmost to society, Teagasc study finds. The Irish Times.Retrieved from: http://www.irishtimes.com/news/education/agricultural-education-gives-most-to-society-teagasc-study-finds-1.2009147
Hennessy, T. (2014). CAP 2014–2020 Tools to enhance familyfarming: opportunities and limits. Directorate-General forInternal Policies. Policy Department B: Structural and Cohe-sion Policies–Agriculture, Brussels. Retrieved from: http://www.europarl.europa.eu/RegData/etudes/note/join/2014/529051/IPOL-AGRI_NT(2014)529051_EN.pdf
Hennessy, T., Moran, B., Kinsella, A. and Quinlan, G. (2013).Teagasc national farm survey results 2012. Athenry: Teagasc.
Hennessy, T. and Moran, B. (2015). Teagasc national farm sur-vey results 2014. Athenry: Teagasc.
Kearney, B. (2010). The past, present and future of Irish agri-culture. Dublin: The Institute of International and EuropeanAffairs. Retrieved from: www.iiea.com/documents/iiea-paper-for-brendan-kearney
Kelly, P.W. (1983). Farmland transfers in the Republic of Ireland.Irish Journal of Agricultural Economics and Rural Sociology,9, 161–172. Retrieved from: http://www.jstor.org/stable/25556502
Lalor, S., Wall, D. and Humphreys, J. (2013). Growing moregrass with soil fertility management. In D. Berry, S. Butlerand P. Dillon (Eds.), Moorepark’13 Irish dairying: Harvestingthe potential. (pp. 52–53). Fermoy: Teagasc. Retrieved from:https://www.teagasc.ie/media/website/publications/2013/2788/Moorepark2013.pdf
Lapple, D. and Hennessy, T. (2012). The capacity to expand milkproduction in Ireland following the removal of milk quotas.Irish Journal of Agricultural and Food Research, 1–11.Retrieved from: http://www.jstor.org/stable/41756842
Latruffe, L. and Le Mouel, C. (2009). Capitalization of govern-ment support in agricultural land prices: What do we know?
Journal of Economic Surveys, 23, 659–691. DOI: 10.1111/j.1467-6419.2009.00575.x
Land Mobility Service (2014). A guide to the land mobility ser-vice. Dublin: Macra na Feirme.
Macdonald, K.A., Penno, J.W., Lancaster, J.A.S. and Roche, J.R. (2008). Effect of stocking rate on pasture production, milkproduction, and reproduction of dairy cows in pasture-basedsystems. Journal of Dairy Science, 91(5), 2151–2163. DOI:10.3168/jds.2007-0630
Meredith, D. &. Gilmartin, M. (2014) Changing rural Ireland.In C. O’Donoghue, R. Conneely, D. Frost, B. Leonard, andMeridith, D. (Eds.), Rural economic development in Ireland(pp. 34–47). Oak Park: Teagasc.
O’Neill, S. and Hanrahan, K. (2012). Decoupling of agriculturalsupport payments: The impact on land market participationdecisions. European Review of Agricultural Economics, 39,639–659. DOI: 10.1093/erae/jbr064
Patton, M., Kostov, P., McErlean, S. and Moss, J. (2008). Asses-sing the influence of direct payments on the rental value ofagricultural land. Food Policy, 33, 397–405. DOI: 10.1016/j.foodpol.2008.01.001
Roche, M.J. and McQuinn, K. (2001). Testing for specula-tion in agricultural land in Ireland. European Review ofAgricultural Economics, 28, 95–115. DOI: 10.1093/erae/28.2.95
Rounsevell, M.D.A., Reginster, I., Araujo, M.B., Carter, T.R.,Dendoncker, N., Ewert, F., House, J.I., Kankaanpaa, S.,Leemans, R. and Metzger, M.J.M. &. Schmit, C. (2006).A coherent set of future land use change scenarios forEurope. Agriculture, Ecosystems & Environment, 114(1),57–68. DOI: 10.1016/j.agee.2005.11.027
Sheridan, H., McMahon, B.J., Carnus, T., Finn, J.A., Anderson,A., Helden, A.J., Kinsella, A. and Purvis, G. (2011). Pastoralfarmland habitat diversity in south-east Ireland. Agriculture,Ecosystems & Environment, 144(1), 130–135. DOI: 10.1016/j.agee.2011.07.011
Swinnen, J.F., Van Herck, K. and Vranken, L. (2014). Landmarket regulations in Europe (LICOS Discussion Paper 354/2014). Leuven: LICOS Centre for Institutions and EconomicPerformance. Retrieved from: https://feb.kuleuven.be/drc/licos/publications/dp/dp354
Swinnen, J., Van Herck, K. and Vranken, L. (2016). The diversityof land markets and regulations in Europe, and (some of) itscauses. The Journal of Development Studies, 52(2), 186–205.DOI: 10.1080/00220388.2015.1060318
Teagasc (2013). Action plan to facilitate increase in collaborativefarming arrangements. Fermoy: Teagasc.
Teagasc (2015). Annual report 2014 and financial statements.Oak Park: Teagasc.
Williams, L., Harrison, S. and O’Hagan, A.M. (2012). The use ofwetlands for flood attenuation. Dublin: An Taisce.
Zondag, M.J., Koppert, S., de Lauwere, C., Sloot, P. and Pauer,A. (2015). Needs of young farmers. Luxembourg: Publica-tions Office of the European Union.
ISSN 2047-3710 International Journal of Agricultural Management, Volume 7 Issue 234 & 2018 International Farm Management Association and Institute of Agricultural Management
Socioeconomic drivers of land mobility in Irish agriculture Cathal Geoghegan and Cathal O’Donoghue