an assessment of independent component analysis for detection of military targets from hyperspectral...
TRANSCRIPT
Journal Identification = JAG Article Identification = 415 Date: July 23, 2011 Time: 10:4 am
At
Ka
b
a
ARA
KHSSAIR
1
tpimsidtm2
i
m
0d
International Journal of Applied Earth Observation and Geoinformation 13 (2011) 730–740
Contents lists available at ScienceDirect
International Journal of Applied Earth Observation andGeoinformation
jo u rn al hom epage: www.elsev ier .com/ locate / jag
n assessment of independent component analysis for detection of militaryargets from hyperspectral images
.C. Tiwaria,∗, M.K. Aroraa, D. Singhb
Department of Civil Engineering, IIT Roorkee, Roorkee 247667, IndiaDepartment of Electronics and Computer Engineering, IIT Roorkee, Roorkee 247667, India
r t i c l e i n f o
rticle history:eceived 13 March 2010ccepted 26 March 2011
eywords:yperspectral imagespectral variabilitypectral matching algorithmsnomaly detectors
ndependent component analysisOC space
a b s t r a c t
Hyperspectral data acquired over hundreds of narrow contiguous wavelength bands are extremely suit-able for target detection due to their high spectral resolution. Though spectral response of every materialis expected to be unique, but in practice, it exhibits variations, which is known as spectral variability.Most target detection algorithms depend on spectral modelling using a priori available target spectra Inpractice, target spectra is, however, seldom available a priori. Independent component analysis (ICA) isa new evolving technique that aims at finding out components which are statistically independent oras independent as possible. The technique therefore has the potential of being used for target detectionapplications. A assessment of target detection from hyperspectral images using ICA and other algorithmsbased on spectral modelling may be of immense interest, since ICA does not require a priori target infor-mation. The aim of this paper is, thus, to assess the potential of ICA based algorithm vis a vis otherprevailing algorithms for military target detection. Four spectral matching algorithms namely Orthog-onal Subspace Projection (OSP), Constrained Energy Minimisation (CEM), Spectral Angle Mapper (SAM)and Spectral Correlation Mapper (SCM), and four anomaly detection algorithms namely OSP anomaly
detector (OSPAD), Reed–Xiaoli anomaly detector (RXD), Uniform Target Detector (UTD) and a combi-nation of Reed–Xiaoli anomaly detector and Uniform Target Detector (RXD–UTD) were considered. Theexperiments were conducted using a set of synthetic and AVIRIS hyperspectral images containing aircraftsas military targets. A comparison of true positive and false positive rates of target detections obtainedfrom ICA and other algorithms plotted on a receiver operating curves (ROC) space indicates the superiorperformance of the ICA over other algorithms.. Introduction
Hyperspectral data, due to its high spectral resolution, appearo be the most attractive for various target detection applicationsarticularly the military targets. The spectral response of an object
n the natural world, however, does not exhibit a unique and deter-inistic signature, and may vary due to atmospheric interference,
ensor noise, composition of the material, its location, surround-ngs, etc. This is known as spectral variability, which may also occurue to coarseness of the spatial resolution of the sensor. Full pixelarget observations are, usually, corrupted by external noise, instru-
ental noise and atmospheric interference (Manolakis and Shaw,
002).Three families of mathematical models have been proposedn the literature to characterize the above spectral variability
∗ Corresponding author.E-mail addresses: [email protected], [email protected] (K.C. Tiwari),
[email protected] (M.K. Arora), [email protected] (D. Singh).
303-2434/$ – see front matter © 2011 Elsevier B.V. All rights reserved.oi:10.1016/j.jag.2011.03.007
© 2011 Elsevier B.V. All rights reserved.
(Manolakis et al., 2003). These models are: probability densitymodels, subspace models and linear mixing models. In probabilitydensity models, the observed spectrum is modelled as multi-variate normal distribution for the target and non-target classesboth. In subspace models, the spectral variability is restrictedto a limited number of bands instead of the complete bandspace. On the other hand, the linear mixing model assumes thatthe observed reflectance spectrum can be generated as a linearcombination of a small number of deterministic spectral sig-natures of constituents known as the end members. Besides, avariety of other spectral variability models for extracting informa-tion from hyperspectral imaging have been proposed by severalother researchers (Chang, 2001, 2003). These spectral modelsmay facilitate development of several algorithms for extractinginformation such as target detection from hyperspectral dataand can be grouped into two categories namely, spectral match-
ing algorithms and anomaly detection algorithms (Manolakis,2004).Spectral matching algorithms are based on matching the knownspectra of the targets of interest available from spectral libraries
Journal Identification = JAG Article Identification = 415 Date: July 23, 2011 Time: 10:4 am
K.C. Tiwari et al. / International Journal of Applied Earth Observation and Geoinformation 13 (2011) 730–740 731
iment
wttdAgbplp
nrs2dbntltb(dsagsc
bsdfdstt
2
miw
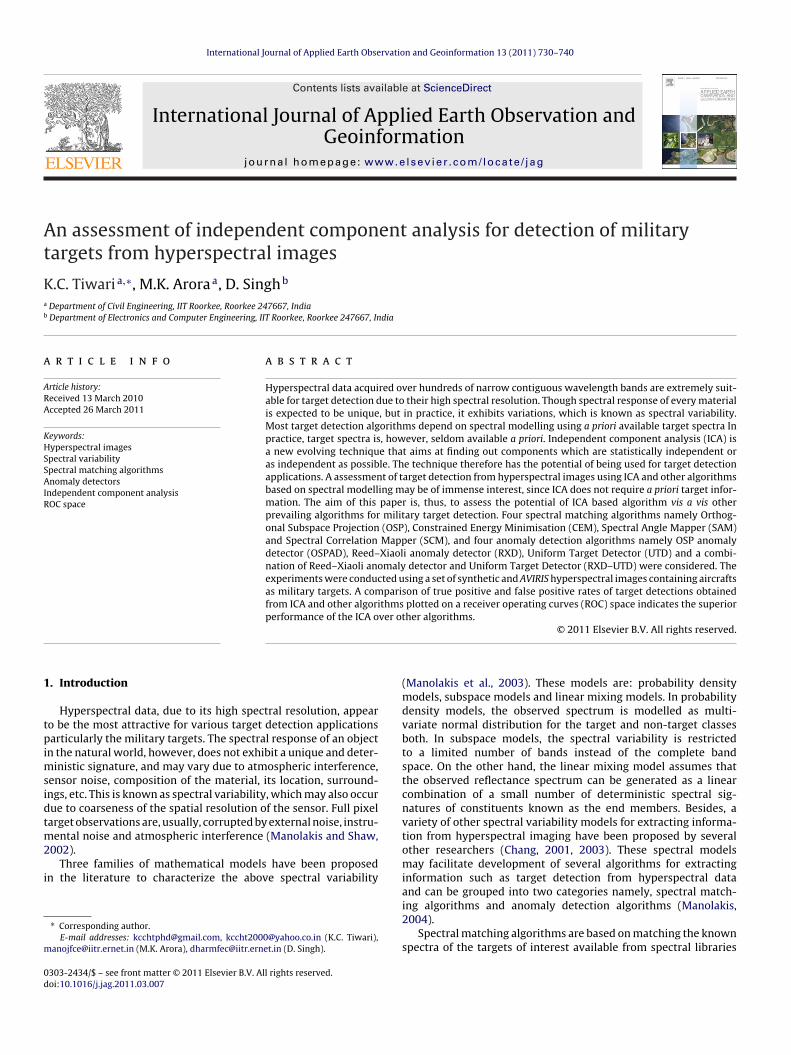
Fig. 1. Exper
ith the corresponding spectra from hyperspectral images. Spec-ral matching can be performed under the domain of any of thehree spectral variability models. Anomaly detection algorithmso not require knowledge of spectra of targets of interest a priori.nomaly detection is carried out with reference to a local back-round (i.e., by considering only a part of the image) or globalackground (i.e., by considering the whole image together). Everyixel, the spectral response of which does not fit a model of the
ocal or global background, is treated as a candidate to be a targetixel.
Independent component analysis (ICA) is an evolving new tech-ique for target detection. The goal of ICA is to find a linearepresentation of non-Gaussian data so that the components aretatistically independent (Hyvarinen and Oja, 2000; Zhang and Zhu,009). The most common approach to seek statistical indepen-ence between random data is to minimize the mutual informationetween them. ICA results in statistically independent compo-ents and therefore the targets are likely to appear in one of theransformed independent components. In a target detection prob-em, most of the man-made targets in natural environment can bereated as statistically independent entities. Thus, ICA appears toe suitable technique for target detection from hyperspectral dataZhang and Zhu, 2009; Stefan and Varshney, 2004). Further, the ICAoes not require any a priori information about the targets and maytill be able to segment independent sources, thus, detecting smallnd even hidden/camouflage targets. An alternative method of tar-et detection in hyperspectral imagery combining ICA with localingularity too has been reported and found to perform superior toonventional RX algorithm (Wang et al., 2006).
The aim of this paper was to assess the performance of an ICAased algorithm (FastICA) for military target detection from hyper-pectral images vis a vis some of the spectral matching and anomalyetection algorithms. The study shall be restricted to detection ofully resolved small targets only. The term ‘small target’ has beenefined as follows, if the total number of pixels contributed by aingle instance of a target in the image does not exceed 0.5% of theotal pixels in the image ignoring the spatial resolution, it has beenermed small target.
. Experimental data
Two different hyperspectral datasets were selected keeping inind the availability of reference information about the targets
n these datasets. The first dataset was synthetically generatedhereas the second dataset consists of an AVIRIS image.
al data sets.
2.1. Dataset I: synthetic image
To keep the experiments computationally simple, only 30 bandsof synthetic images that matched the characteristics of the AVIRISsensor were generated. Accordingly, the first 30 bands of the AVIRISdata set (band numbers 7 to 32 and 36 to 39) after removing badbands and water absorption bands were selected as reference forgenerating the synthetic data. Further, to ensure spectral variabilitywithin the artificial military targets, and between these targets andthe background, the following procedure was adopted.
First, each synthetic image was generated in five different seg-ments each containing one target. The size of four of these segmentswas kept as 140 × 60 pixels whereas the size of the central segmentwas kept as 80 × 80 pixels. Next, the spectral reflectance values(intensities) of pixels in each segment were generated through auniformly distributed random number generator applied withinthe same radiometric range as that of the AVIRIS image. A smalltarget approximating the shape of an aircraft covering 18 pixelswas inserted in each of these segments by replacing the existingintensities of these pixels in the synthetic image with reflectancevalues much higher than the mean reflectance values in that seg-ment. The top left coordinates of five such targets consisting of 18pixels are (30, 70), (70, 170), (170, 130), (130, 30) and (100, 100).The number of pixels of the target was restricted to 18 pixels only sothat it constitutes less than 0.5% of the total number of pixels in thecorresponding segment. A 200 × 200 pixels synthetic image, thusgenerated, corresponding to the first band of AVIRIS image and con-taining five small targets is shown in Fig. 1(a). These targets weregiven IDs as P1–P5.
2.2. Dataset II: AVIRIS image
An archived hyperspectral image (size: 400 × 400 pixels, 224bands) from the AVIRIS sensor acquired over a naval air station inSan Diego, California was used. The image is available as exam-ple data in the ENVI image processing software. After removingwater absorption and bad bands, only 189 bands were consideredfor the analysis. Due to the effects of illumination from source andthe atmosphere, the raw radiance spectra captured by any hyper-spectral sensor need to be converted into reflectance spectra foreffective comparison with laboratory spectra. The available imagehad already been converted to a reflectance image. Therefore, for
the present case, a 200 × 200 pixels reflectance image containingfive targets (aircrafts) were extracted for the study (Fig. 1(b)). Thepositions of these five targets (aircrafts) are centered at coordinates(244, 145), (232, 137), (199, 158), (89, 11) and (70, 22). These targets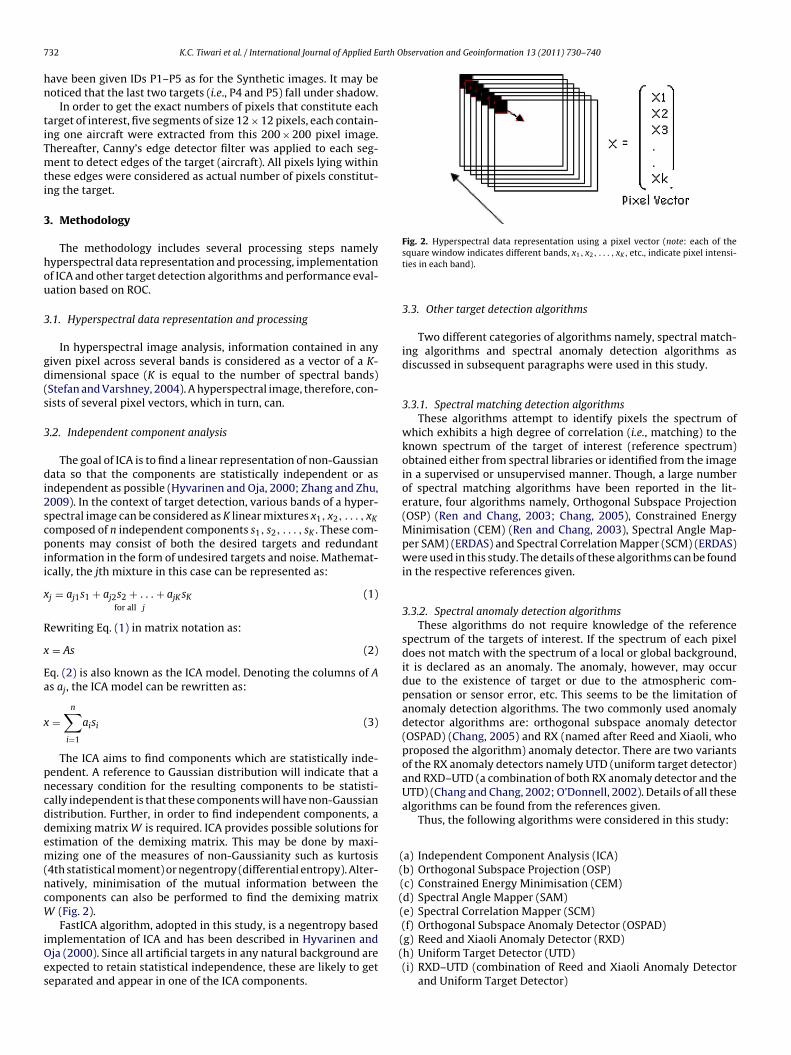
Journal Identification = JAG Article Identification = 415 Date: July 23, 2011 Time: 10:4 am
7 arth Observation and Geoinformation 13 (2011) 730–740
hn
tiTmti
3
hou
3
gd(s
3
di2scpii
x
R
x
Ea
x
pncddem(ncW
iOes
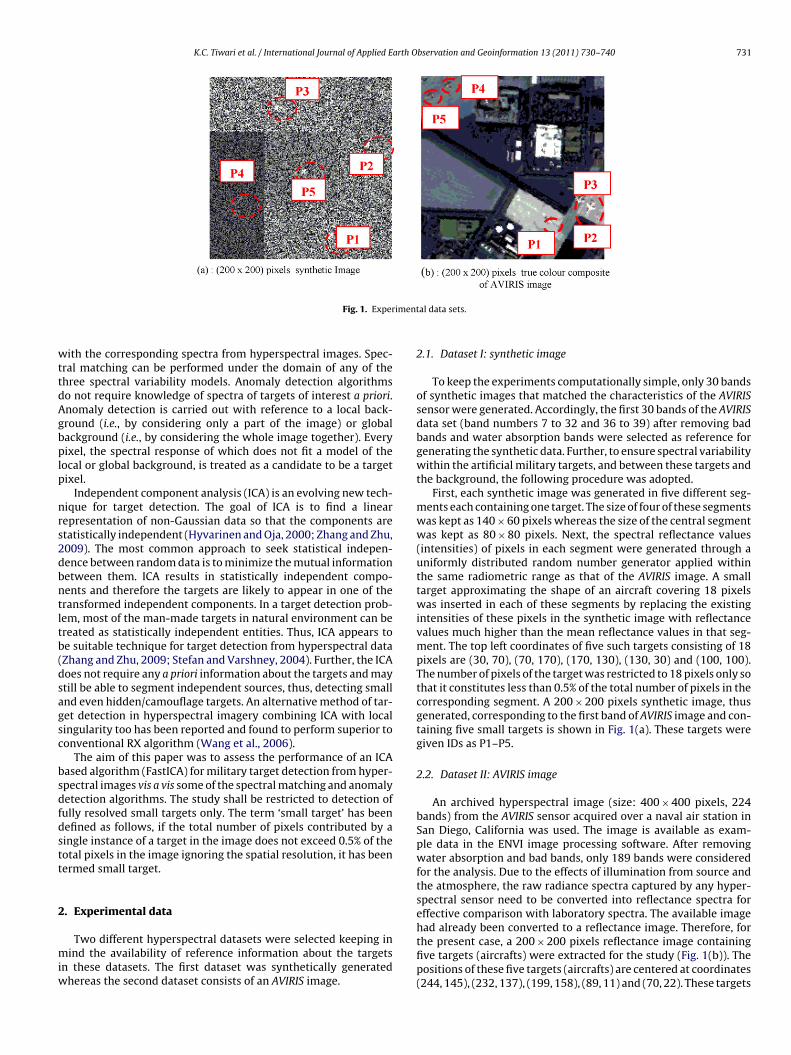
Fig. 2. Hyperspectral data representation using a pixel vector (note: each of the
(((((
32 K.C. Tiwari et al. / International Journal of Applied E
ave been given IDs P1–P5 as for the Synthetic images. It may beoticed that the last two targets (i.e., P4 and P5) fall under shadow.
In order to get the exact numbers of pixels that constitute eacharget of interest, five segments of size 12 × 12 pixels, each contain-ng one aircraft were extracted from this 200 × 200 pixel image.hereafter, Canny’s edge detector filter was applied to each seg-ent to detect edges of the target (aircraft). All pixels lying within
hese edges were considered as actual number of pixels constitut-ng the target.
. Methodology
The methodology includes several processing steps namelyyperspectral data representation and processing, implementationf ICA and other target detection algorithms and performance eval-ation based on ROC.
.1. Hyperspectral data representation and processing
In hyperspectral image analysis, information contained in anyiven pixel across several bands is considered as a vector of a K-imensional space (K is equal to the number of spectral bands)Stefan and Varshney, 2004). A hyperspectral image, therefore, con-ists of several pixel vectors, which in turn, can.
.2. Independent component analysis
The goal of ICA is to find a linear representation of non-Gaussianata so that the components are statistically independent or as
ndependent as possible (Hyvarinen and Oja, 2000; Zhang and Zhu,009). In the context of target detection, various bands of a hyper-pectral image can be considered as K linear mixtures x1, x2, . . . , xK
omposed of n independent components s1, s2, . . . , sK . These com-onents may consist of both the desired targets and redundant
nformation in the form of undesired targets and noise. Mathemat-cally, the jth mixture in this case can be represented as:
j = aj1s1 + aj2s2 + . . . + ajK sKfor all j
(1)
ewriting Eq. (1) in matrix notation as:
= As (2)
q. (2) is also known as the ICA model. Denoting the columns of As aj , the ICA model can be rewritten as:
=n∑
i=1
aisi (3)
The ICA aims to find components which are statistically inde-endent. A reference to Gaussian distribution will indicate that aecessary condition for the resulting components to be statisti-ally independent is that these components will have non-Gaussianistribution. Further, in order to find independent components, aemixing matrix W is required. ICA provides possible solutions forstimation of the demixing matrix. This may be done by maxi-izing one of the measures of non-Gaussianity such as kurtosis
4th statistical moment) or negentropy (differential entropy). Alter-atively, minimisation of the mutual information between theomponents can also be performed to find the demixing matrix
(Fig. 2).FastICA algorithm, adopted in this study, is a negentropy based
mplementation of ICA and has been described in Hyvarinen andja (2000). Since all artificial targets in any natural background arexpected to retain statistical independence, these are likely to geteparated and appear in one of the ICA components.
((
square window indicates different bands, x1, x2, . . . , xK , etc., indicate pixel intensi-ties in each band).
3.3. Other target detection algorithms
Two different categories of algorithms namely, spectral match-ing algorithms and spectral anomaly detection algorithms asdiscussed in subsequent paragraphs were used in this study.
3.3.1. Spectral matching detection algorithmsThese algorithms attempt to identify pixels the spectrum of
which exhibits a high degree of correlation (i.e., matching) to theknown spectrum of the target of interest (reference spectrum)obtained either from spectral libraries or identified from the imagein a supervised or unsupervised manner. Though, a large numberof spectral matching algorithms have been reported in the lit-erature, four algorithms namely, Orthogonal Subspace Projection(OSP) (Ren and Chang, 2003; Chang, 2005), Constrained EnergyMinimisation (CEM) (Ren and Chang, 2003), Spectral Angle Map-per SAM) (ERDAS) and Spectral Correlation Mapper (SCM) (ERDAS)were used in this study. The details of these algorithms can be foundin the respective references given.
3.3.2. Spectral anomaly detection algorithmsThese algorithms do not require knowledge of the reference
spectrum of the targets of interest. If the spectrum of each pixeldoes not match with the spectrum of a local or global background,it is declared as an anomaly. The anomaly, however, may occurdue to the existence of target or due to the atmospheric com-pensation or sensor error, etc. This seems to be the limitation ofanomaly detection algorithms. The two commonly used anomalydetector algorithms are: orthogonal subspace anomaly detector(OSPAD) (Chang, 2005) and RX (named after Reed and Xiaoli, whoproposed the algorithm) anomaly detector. There are two variantsof the RX anomaly detectors namely UTD (uniform target detector)and RXD–UTD (a combination of both RX anomaly detector and theUTD) (Chang and Chang, 2002; O’Donnell, 2002). Details of all thesealgorithms can be found from the references given.
Thus, the following algorithms were considered in this study:
a) Independent Component Analysis (ICA)b) Orthogonal Subspace Projection (OSP)c) Constrained Energy Minimisation (CEM)d) Spectral Angle Mapper (SAM)e) Spectral Correlation Mapper (SCM)(f) Orthogonal Subspace Anomaly Detector (OSPAD)g) Reed and Xiaoli Anomaly Detector (RXD)
h) Uniform Target Detector (UTD)(i) RXD–UTD (combination of Reed and Xiaoli Anomaly Detectorand Uniform Target Detector)
Journal Identification = JAG Article Identification = 415 Date: July 23, 2011 Time: 10:4 am
K.C. Tiwari et al. / International Journal of Applied Earth Observation and Geoinformation 13 (2011) 730–740 733
If Ye s
Compare al gorithms by plottin g TP, TN, FP, FN on ROC space
is informa tion sufficie nt for ROC analysis
Next consider AVIRIS
data Obtain TP, TN, FP , FN
Syntheti c Data or AVIRIS Da ta
Obtain all ICA com ponents Assess spectral variabilit y for further analysis
Assign unique component IDs
Apply target det ection algorithms Visuall y identi fy components
cont aining ta rget s
Use hi stog ram threshold ing to segregate target pixels from the
Recover tar get pixels in different compone nts
If No
t for im
3
tw
haaTcHth
L
tTccbsadlaflbPodcs
Fig. 3. Flowchar
.4. Performance evaluation of target detection algorithms
For a comparative assessment of the performance of the variousarget detection algorithms, an ROC curve analysis was consideredhich has been discussed here briefly.
The mathematical framework for detector design is a binaryypothesis testing problem, which can be solved using a variety ofpproaches. However, likelihood ratio (LR) test is usually preferreds it minimizes the risk associated with the incorrect decisions.hus, for a given spectrum, x, the target detection problem can beast as a selection between two competing hypotheses, namely,0: target absent and H1 target present. If p(x|H0) and p(x|H1) are
he conditional probability density functions of x under the twoypotheses, the LR is given by:
R(x) = p(x|target present)p(x|target absent)
(4)
If LR(x), also known as detection statistic, exceeds a certainhreshold �, then the target present hypothesis is selected as true.hus, the LR test accepts the most likely hypothesis as true. If theonditional probability densities in Eq. (4) are known, then thisase is called a simple hypothesis and an optimal threshold cane selected easily. Naturally, the selection of threshold should beuch as to keep the number detection errors (both target missesnd false target detections) low and the number of correct targetetections as high as possible. Therefore, a trade-off lies between a
ow threshold which keeps the number of correct detections (usu-lly denoted by PD) high, and a high threshold which keeps thealse alarms, i.e., false target detections (usually denoted by PFA)ow. For any given detector, the trade off between PD and PFA cane described using the receiver operating (ROC) curves which plotD(�) and PFA(�) as a function of all possible values of the thresh-
ld �. Therefore, ROC curves provide a means of evaluating theetector performance independent of the threshold. Various termsommonly associated with the ROC analysis and relevant to thistudy have been summarised as:plementation.
True positives (TP) = number of correct detectionsTrue negatives (TN) = number of correct rejectionsFalse positives (FP) = number of false detections/false alarm (alsoknown as, Type I error)False negatives (FN) = number missed detection (also known as,Type II error)True positive rate (TPR) = i.e., hit rate = TPR = TP/P = TP/(TP + FN)False positive rate (FPR) = i.e., false alarm rate = FPR = FP/N =FP/(FP + TN)
Often, values of the threshold � may not be explicitly knownand in such cases, a comparison between the detectors can becarried out using an ROC plot obtained by plotting true positiverates along the y-axis and false positive rate along the x-axis andby determining the position of individual detectors on the ROCspace. The lower left point (0, 0) represents a detection algorithm,which has neither any true positive rate nor any false positiverate, and is therefore of no use. Similarly, opposite of this, i.e.,upper right point (1, 1) gives the same true positive and falsepositive and hence is irrelevant. The perfect detection thereforeis the one represented by top left point (0, 1) which has zerofalse positive rate and the highest true positive rate. Similarly, theopposite of this, i.e., the point (1, 0) has the highest false positiverate and zero true positive rate and therefore indicates the worstperformance.
3.5. Implementation of algorithms used
The sequence of implementation steps on both sets of data isgiven in Fig. 3 and elaborated below:
(i) First, the experiments were carried out with synthetic data fol-lowed by AVIRIS data. In each case, all the ICA components were
obtained and unique component IDs were assigned to themfor further analysis. Next, all the ICA components containingany instance of the five targets (fully or partially) were visu-ally identified and segregated. Since, no single ICA component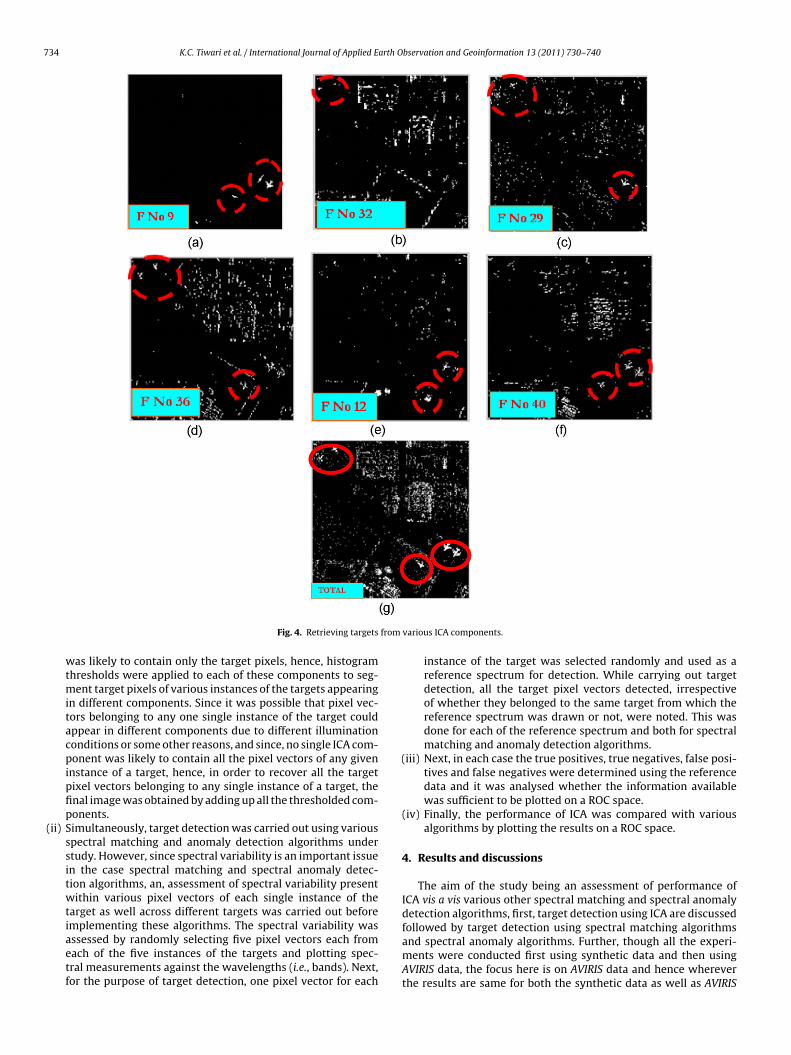
Journal Identification = JAG Article Identification = 415 Date: July 23, 2011 Time: 10:4 am
734 K.C. Tiwari et al. / International Journal of Applied Earth Observation and Geoinformation 13 (2011) 730–740
from
(
Fig. 4. Retrieving targets
was likely to contain only the target pixels, hence, histogramthresholds were applied to each of these components to seg-ment target pixels of various instances of the targets appearingin different components. Since it was possible that pixel vec-tors belonging to any one single instance of the target couldappear in different components due to different illuminationconditions or some other reasons, and since, no single ICA com-ponent was likely to contain all the pixel vectors of any giveninstance of a target, hence, in order to recover all the targetpixel vectors belonging to any single instance of a target, thefinal image was obtained by adding up all the thresholded com-ponents.
(ii) Simultaneously, target detection was carried out using variousspectral matching and anomaly detection algorithms understudy. However, since spectral variability is an important issuein the case spectral matching and spectral anomaly detec-tion algorithms, an, assessment of spectral variability presentwithin various pixel vectors of each single instance of thetarget as well across different targets was carried out beforeimplementing these algorithms. The spectral variability was
assessed by randomly selecting five pixel vectors each fromeach of the five instances of the targets and plotting spec-tral measurements against the wavelengths (i.e., bands). Next,for the purpose of target detection, one pixel vector for eachvarious ICA components.
instance of the target was selected randomly and used as areference spectrum for detection. While carrying out targetdetection, all the target pixel vectors detected, irrespectiveof whether they belonged to the same target from which thereference spectrum was drawn or not, were noted. This wasdone for each of the reference spectrum and both for spectralmatching and anomaly detection algorithms.
iii) Next, in each case the true positives, true negatives, false posi-tives and false negatives were determined using the referencedata and it was analysed whether the information availablewas sufficient to be plotted on a ROC space.
(iv) Finally, the performance of ICA was compared with variousalgorithms by plotting the results on a ROC space.
4. Results and discussions
The aim of the study being an assessment of performance ofICA vis a vis various other spectral matching and spectral anomalydetection algorithms, first, target detection using ICA are discussedfollowed by target detection using spectral matching algorithms
and spectral anomaly algorithms. Further, though all the experi-ments were conducted first using synthetic data and then usingAVIRIS data, the focus here is on AVIRIS data and hence whereverthe results are same for both the synthetic data as well as AVIRIS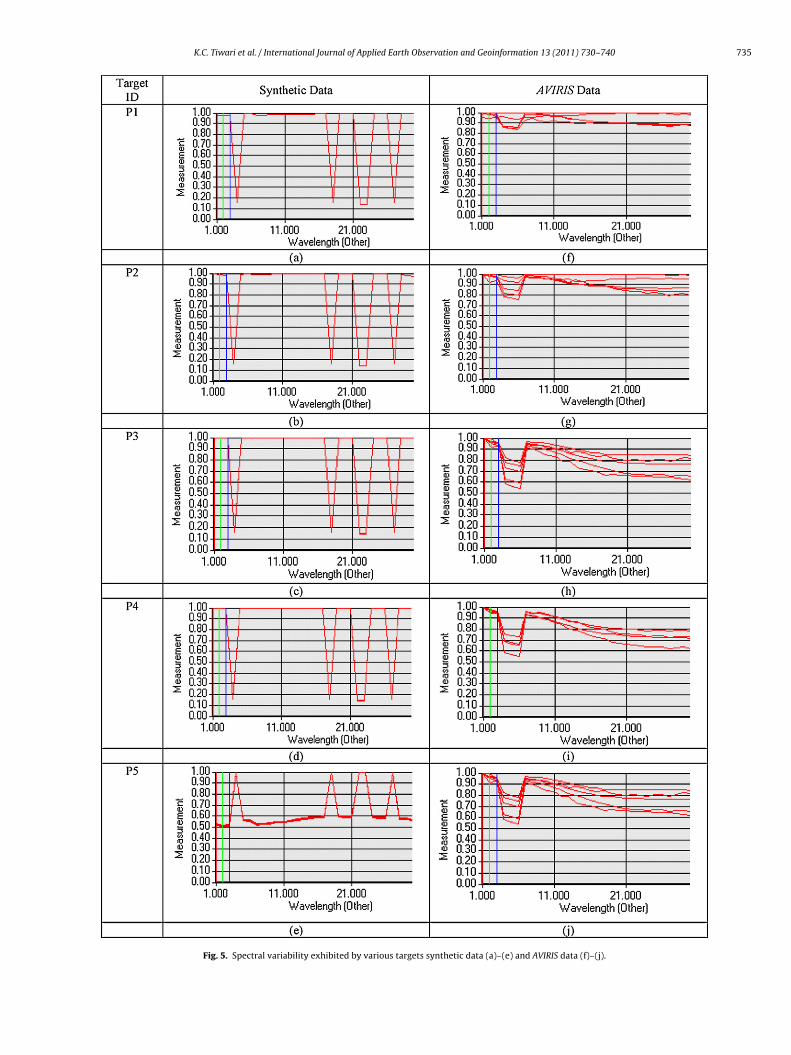
Journal Identification = JAG Article Identification = 415 Date: July 23, 2011 Time: 10:4 am
K.C. Tiwari et al. / International Journal of Applied Earth Observation and Geoinformation 13 (2011) 730–740 735
Fig. 5. Spectral variability exhibited by various targets synthetic data (a)–(e) and AVIRIS data (f)–(j).
Journal Identification = JAG Article Identification = 415 Date: July 23, 2011 Time: 10:4 am
736 K.C. Tiwari et al. / International Journal of Applied Earth Observation and Geoinformation 13 (2011) 730–740
g algo
dp
4
i1t
Fig. 6. Target detection using spectral matchin
ata, results for only AVIRIS data are discussed. An ROC based com-arative analysis is discussed at the end.
.1. Target detection using ICA
ICA resulted in 30 components for synthetic data correspond-ng to each band of synthetic data. For AVIRIS data, however, only87 components out of 189 bands were retained rejecting the lastwo components due to the large number of iterations involved in
rithms in synthetic data (TD, target detector).
data processing. Each of these components were assigned a uniquecomponent ID for further analysis.
Next, the components containing targets were found by visualinspection for both the datasets. For the synthetic data, four ICAcomponents were found to contain the targets but no single compo-
nent was found to contain all five targets. Each of these components,however, also contained certain redundant information. It was,therefore, necessary to extract those pixels, which constituted thetarget. This was done through segmentation. A histogram of the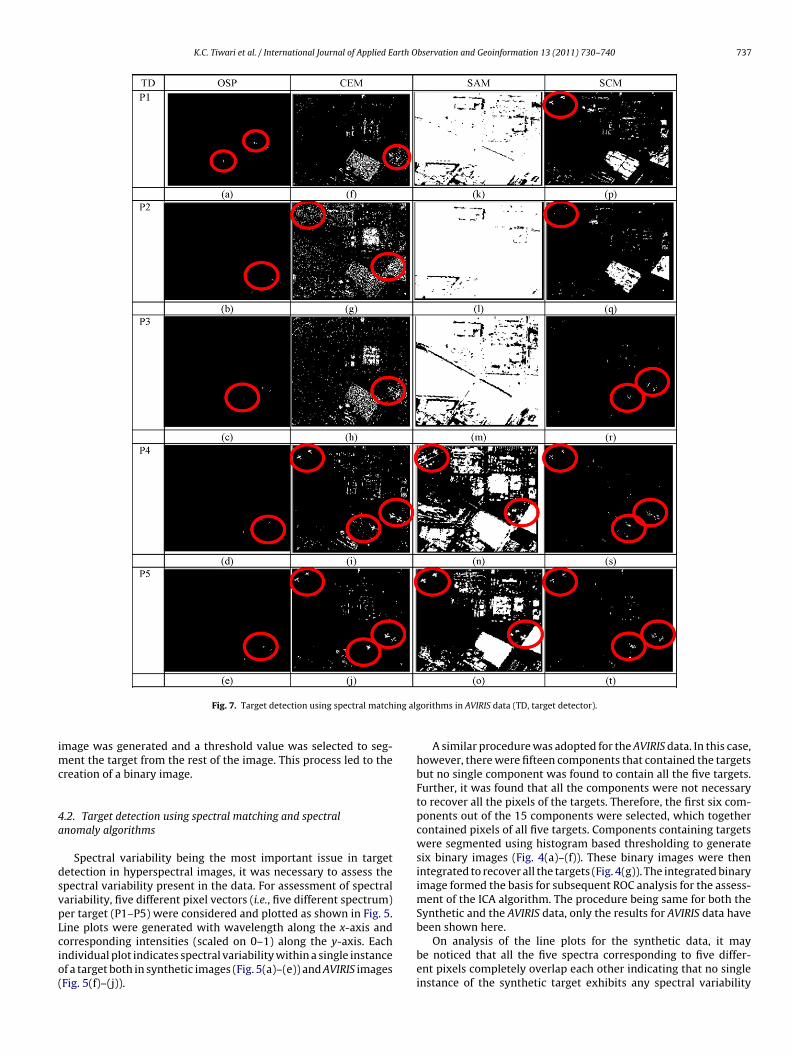
Journal Identification = JAG Article Identification = 415 Date: July 23, 2011 Time: 10:4 am
K.C. Tiwari et al. / International Journal of Applied Earth Observation and Geoinformation 13 (2011) 730–740 737
ing alg
imc
4a
dsvpLcio(
Fig. 7. Target detection using spectral match
mage was generated and a threshold value was selected to seg-ent the target from the rest of the image. This process led to the
reation of a binary image.
.2. Target detection using spectral matching and spectralnomaly algorithms
Spectral variability being the most important issue in targetetection in hyperspectral images, it was necessary to assess thepectral variability present in the data. For assessment of spectralariability, five different pixel vectors (i.e., five different spectrum)er target (P1–P5) were considered and plotted as shown in Fig. 5.ine plots were generated with wavelength along the x-axis and
orresponding intensities (scaled on 0–1) along the y-axis. Eachndividual plot indicates spectral variability within a single instancef a target both in synthetic images (Fig. 5(a)–(e)) and AVIRIS imagesFig. 5(f)–(j)).orithms in AVIRIS data (TD, target detector).
A similar procedure was adopted for the AVIRIS data. In this case,however, there were fifteen components that contained the targetsbut no single component was found to contain all the five targets.Further, it was found that all the components were not necessaryto recover all the pixels of the targets. Therefore, the first six com-ponents out of the 15 components were selected, which togethercontained pixels of all five targets. Components containing targetswere segmented using histogram based thresholding to generatesix binary images (Fig. 4(a)–(f)). These binary images were thenintegrated to recover all the targets (Fig. 4(g)). The integrated binaryimage formed the basis for subsequent ROC analysis for the assess-ment of the ICA algorithm. The procedure being same for both theSynthetic and the AVIRIS data, only the results for AVIRIS data havebeen shown here.
On analysis of the line plots for the synthetic data, it maybe noticed that all the five spectra corresponding to five differ-ent pixels completely overlap each other indicating that no singleinstance of the synthetic target exhibits any spectral variability
Journal Identification = JAG Article Identification = 415 Date: July 23, 2011 Time: 10:4 am
7 arth O
wgnda
pfiPossmfitTssociafSCbaoaP
odetmsfotmwam
38 K.C. Tiwari et al. / International Journal of Applied E
ithin itself. Similarly when the spectra of different synthetic tar-ets (P1–P5) are considered, limited or no spectral variability isoticed (Fig. 5(a)–(e)). On the other hand, spectral variability is evi-ent both within each single instance of the AVIRIS target as wells across its different instances (Fig. 5(f)–(j)).
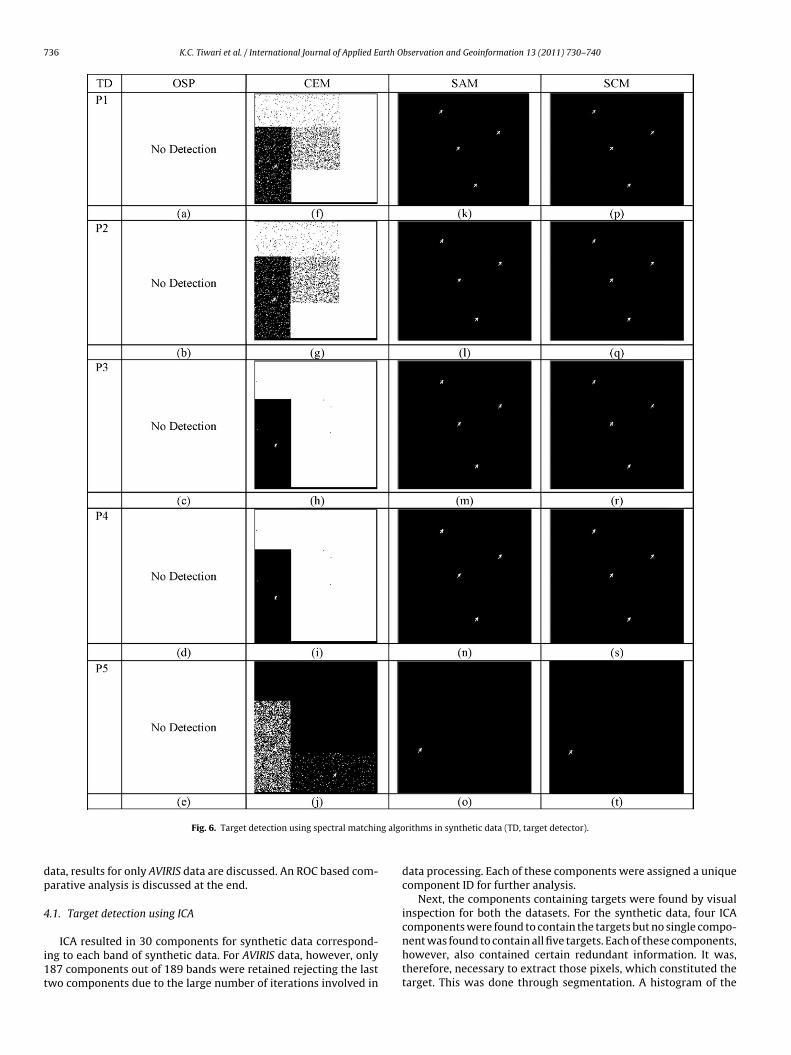
After examining spectral variability, one spectrum (pixel vector)er target P1–P5 of synthetic data was drawn randomly and, thus,ve different reference spectra, one each corresponding to targets1–P5 were considered. The results of target detection achievedn implementation of the four spectral matching algorithms onynthetic data using each of the five reference spectrums (corre-ponding to targets P1–P5) are shown in Fig. 6. The four spectralatching algorithms implemented are shown on the top row of the
gure while the left column shows the ID of the target from whichhe reference spectrum was drawn to implement the algorithm.he results were produced as binary images with 1 (white pixel)howing a match with the reference spectrum and 0 (black pixel)howing a mismatch. Once the detections were made using vari-us spectral matching algorithms, detected pixels per image wereompared with the true target pixels already noted as describedn Section 2 to arrive at the deductions made here. OSP fails inll the cases as shown in Fig. 6(a)–(e) and CEM produces lots ofalse alarms as shown in Fig. 6(f)–(j). Both SAM (Fig. 6(k)–(n)) andCM, Fig. 6(p)–(s) appears to perform much better than OSP andEM. However, it can also be noticed that both SAM and SCM haveeen able to detect targets P1–P4 using reference spectrum fromny of the targets P1–P4. But the fifth target P5 is detected usingnly its own spectra (Fig. 6(o) and (t)). The reason for this may bettributed to greater spectral variability exhibited by the spectra of5 as shown in Fig. 5(e).
A similar procedure was adopted for AVIRIS data. Here again,ne spectrum (pixel vector) per target P1–P5 of AVIRIS data wasrawn randomly and, thus, five different reference spectra, oneach corresponding to target P1–P5 were considered. The results ofarget detection achieved on implementation of the four spectral
atching algorithms on AVIRIS data using each of the five referencepectra (corresponding to targets P1–P5) are shown in Fig. 7. Theour spectral matching algorithms implemented have been shownn the top row of the figure while the left column shows the ID ofhe target from which the reference spectrum was drawn to imple-
ent the algorithm. The results were produced as binary imagesith 1 (white pixel) showing a match with the reference spectrum
nd 0 (black pixel) showing a mismatch. Once the detections wereade using various spectral matching algorithms, detected pixels
Fig. 8. Target detection using ano
bservation and Geoinformation 13 (2011) 730–740
per image were compared with the true target pixels already notedas described in Section 2 to arrive at TP, FP, TN and FN (refer ROCanalysis discussed in Section 3 and later in this section). These val-ues are given in Table 2. Certain deductions have been made asdiscussed here after analysis of the values obtained for TP, FP, TNand FN and on visual examination of the results.
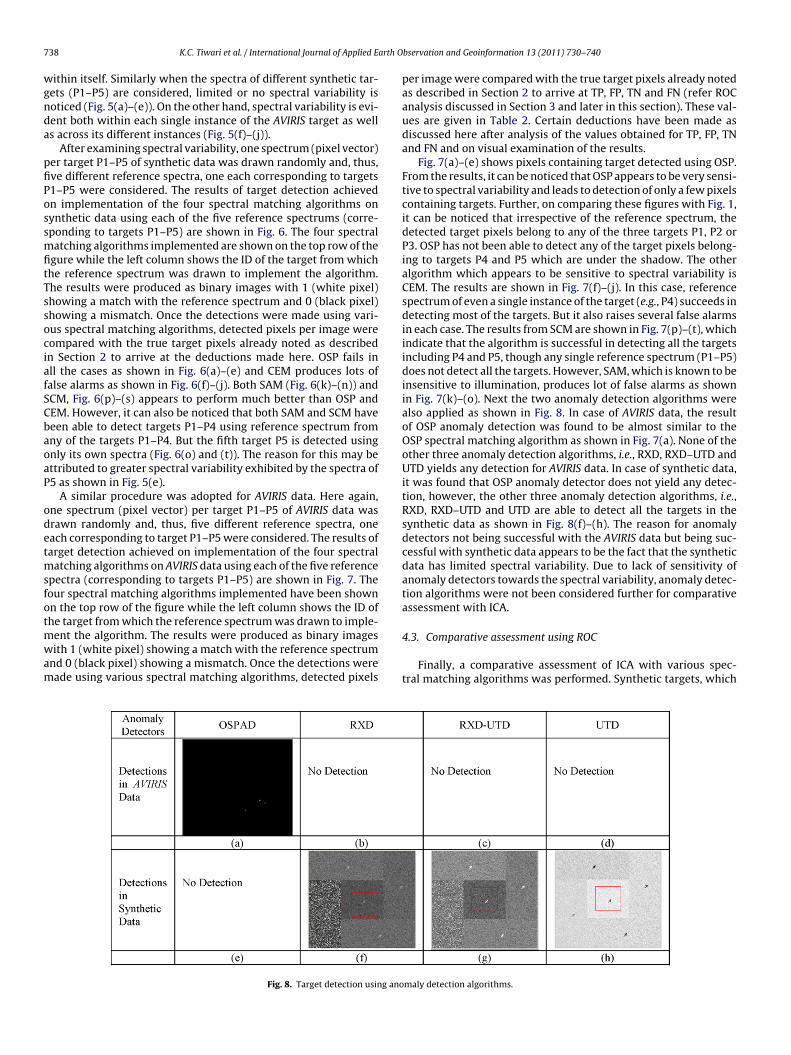
Fig. 7(a)–(e) shows pixels containing target detected using OSP.From the results, it can be noticed that OSP appears to be very sensi-tive to spectral variability and leads to detection of only a few pixelscontaining targets. Further, on comparing these figures with Fig. 1,it can be noticed that irrespective of the reference spectrum, thedetected target pixels belong to any of the three targets P1, P2 orP3. OSP has not been able to detect any of the target pixels belong-ing to targets P4 and P5 which are under the shadow. The otheralgorithm which appears to be sensitive to spectral variability isCEM. The results are shown in Fig. 7(f)–(j). In this case, referencespectrum of even a single instance of the target (e.g., P4) succeeds indetecting most of the targets. But it also raises several false alarmsin each case. The results from SCM are shown in Fig. 7(p)–(t), whichindicate that the algorithm is successful in detecting all the targetsincluding P4 and P5, though any single reference spectrum (P1–P5)does not detect all the targets. However, SAM, which is known to beinsensitive to illumination, produces lot of false alarms as shownin Fig. 7(k)–(o). Next the two anomaly detection algorithms werealso applied as shown in Fig. 8. In case of AVIRIS data, the resultof OSP anomaly detection was found to be almost similar to theOSP spectral matching algorithm as shown in Fig. 7(a). None of theother three anomaly detection algorithms, i.e., RXD, RXD–UTD andUTD yields any detection for AVIRIS data. In case of synthetic data,it was found that OSP anomaly detector does not yield any detec-tion, however, the other three anomaly detection algorithms, i.e.,RXD, RXD–UTD and UTD are able to detect all the targets in thesynthetic data as shown in Fig. 8(f)–(h). The reason for anomalydetectors not being successful with the AVIRIS data but being suc-cessful with synthetic data appears to be the fact that the syntheticdata has limited spectral variability. Due to lack of sensitivity ofanomaly detectors towards the spectral variability, anomaly detec-tion algorithms were not been considered further for comparativeassessment with ICA.
4.3. Comparative assessment using ROC
Finally, a comparative assessment of ICA with various spec-tral matching algorithms was performed. Synthetic targets, which
maly detection algorithms.
Journal Identification = JAG Article Identification = 415 Date: July 23, 2011 Time: 10:4 am
K.C. Tiwari et al. / International Journal of Applied Earth Observation and Geoinformation 13 (2011) 730–740 739
Table 1Number of pixels constituting the actual targets and background pixels.
Target ID P1 P2 P3 P4 P5
eds
bdp12aAaaalsi
(dIfs(ettip
TN
Number of target pixels 32 32 40 45 45Number of background pixels 112 112 104 99 99
xhibited limited spectral variability and the spectral anomalyetection algorithms, which appeared to lack sensitivity towardspectral variability were not considered for comparison with ICA.
For comparative assessment, it is necessary to have exact num-ers of pixels that constitute each target of interest as referenceata. As discussed in Section 2, to generate reference data for com-arative assessment, five segments of size 12 × 12 pixels (total44 pixels), each containing one aircraft were extracted from this00 × 200 pixel image. Thereafter, Canny’s edge detector filter waspplied to each segment to detect edges of the target (aircraft).ll pixels lying within these edges were assumed to constitute thectual number of target pixels. All the pixels outside the edges weressumed to constitute background pixels. The numbers of targetnd background pixels thus determined are shown in Table 1. Theocation for each of these pixels constituting the target was alsoimultaneously recorded for reference. In all subsequent compar-sons, the same set of 12 × 12 pixels was considered for analysis.
One reference spectrum was drawn from each of the targetsP1–P5) and each these reference spectra were used separately foretection of targets using different spectral matching algorithms.
t was also mentioned that in some cases reference spectra drawnrom a target (say P1) not only succeeded in detecting pixels of theame target but also succeeded in detecting pixels of other targetsi.e., P1 as well as P2–P5). In case of some of the algorithms, how-ver, it failed to detect even the same target. The binary images of
hese detection results have already been discussed earlier. Herehe same is extended for comparison with ICA, All correctly andncorrectly detected pixels (within the same segment of 12 × 12ixels from which the reference data were generated) were notedable 2umber of true positives (TP) and false positives (FP) for various algorithms.
Target detectionalgorithms
Target ID Referencespectrum P1
Referencespectrum P2
TP FP TP FP
OSP
P1 0 0 0 0
P2 0 0 0 0
P3 3 0 3 0
P4 3 0 3 0
P5 2 0 4 0
CEM
P1 5 12 2 24P2 5 12 12 24P3 20 80 18 75P4 36 24 36 34P5 30 24 30 34
SAM
P1 32 112 32 11P2 32 112 32 11P3 40 104 40 10P4 45 99 45 99P5 45 99 45 99
SCM
P1 22 2 2 2
P2 24 2 3 2
P3 28 90 2 90P4 26 18 2 2
P5 27 54 2 74
ICA
No reference spectrum applicableP1 20 10 Not applicableP2 29 0P3 32 7P4 41 3P5 42 2
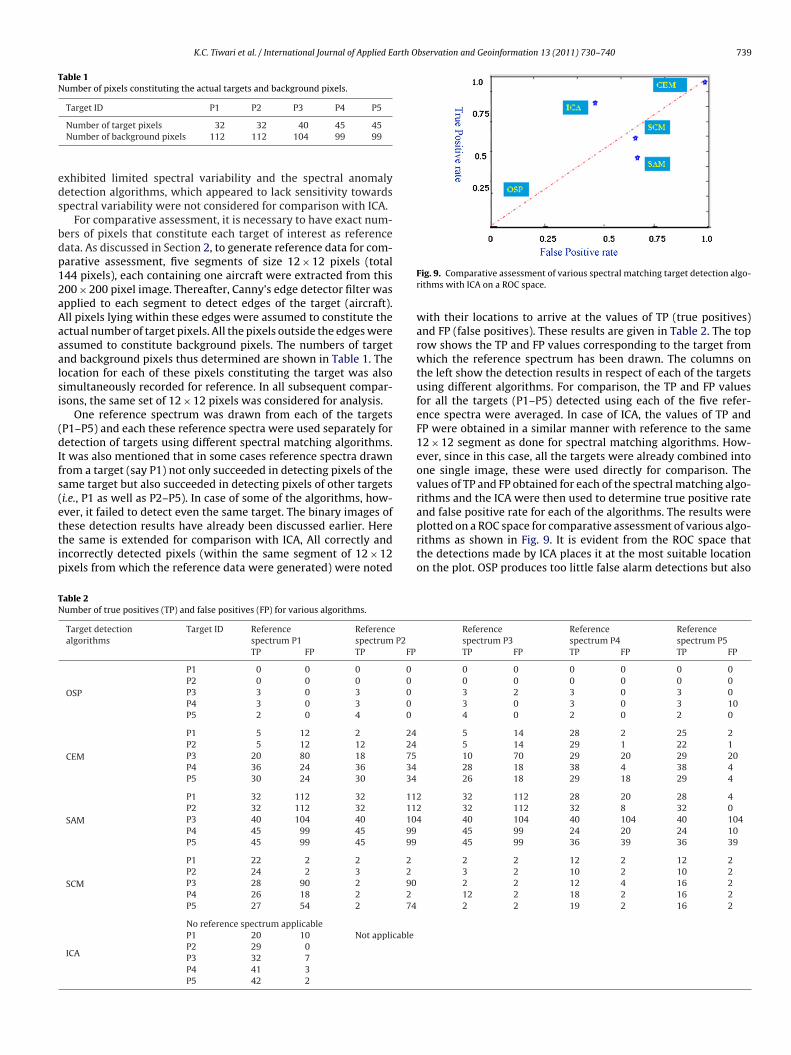
Fig. 9. Comparative assessment of various spectral matching target detection algo-rithms with ICA on a ROC space.
with their locations to arrive at the values of TP (true positives)and FP (false positives). These results are given in Table 2. The toprow shows the TP and FP values corresponding to the target fromwhich the reference spectrum has been drawn. The columns onthe left show the detection results in respect of each of the targetsusing different algorithms. For comparison, the TP and FP valuesfor all the targets (P1–P5) detected using each of the five refer-ence spectra were averaged. In case of ICA, the values of TP andFP were obtained in a similar manner with reference to the same12 × 12 segment as done for spectral matching algorithms. How-ever, since in this case, all the targets were already combined intoone single image, these were used directly for comparison. Thevalues of TP and FP obtained for each of the spectral matching algo-rithms and the ICA were then used to determine true positive rateand false positive rate for each of the algorithms. The results were
plotted on a ROC space for comparative assessment of various algo-rithms as shown in Fig. 9. It is evident from the ROC space thatthe detections made by ICA places it at the most suitable locationon the plot. OSP produces too little false alarm detections but alsoReferencespectrum P3
Referencespectrum P4
Referencespectrum P5
TP FP TP FP TP FP
0 0 0 0 0 00 0 0 0 0 03 2 3 0 3 03 0 3 0 3 104 0 2 0 2 0
5 14 28 2 25 2 5 14 29 1 22 1 10 70 29 20 29 20 28 18 38 4 38 4 26 18 29 18 29 4
2 32 112 28 20 28 42 32 112 32 8 32 04 40 104 40 104 40 104
45 99 24 20 24 10 45 99 36 39 36 39
2 2 12 2 12 23 2 10 2 10 2
2 2 12 4 16 212 2 18 2 16 2
2 2 19 2 16 2

Journal Identification = JAG Article Identification = 415 Date: July 23, 2011 Time: 10:4 am
7 arth O
gtnipir
5
IpnaUs
ttt
fadiiTwptih
sfch
ddOdh
40 K.C. Tiwari et al. / International Journal of Applied E
ives too little true positive detections. In target detection applica-ions, detection of a few true positive pixels as made by OSP mayot substantiate a target. Similarly, CEM produces high true pos-
tive rates but also produces equally high false positive rates. Theerformances of SCM and SAM have also not been found to be sat-
sfactory as both these algorithms produced high false positivesates.
. Conclusions
The aim of this paper was to assess the applicability of anCA based algorithm for military target detection and its com-arative assessment with four spectral matching algorithms,amely OSP, CEM, SAM and SCM, and four anomaly detectionlgorithms, namely OSP anomaly detector, RXD, RXD–UTD andTD. A set of synthetic and AVIRIS images were used for the
tudy.The spectral variability analysis showed that targets in a syn-
hetic image had limited or nil spectral variability while the AVIRISargets exhibited significant spectral variability both within eacharget as well as across different targets.
This was further corroborated through the difference in per-ormance of various spectral matching and anomaly detectionlgorithms. From the results on target detection from AVIRISataset, it appears that OSP is very sensitive to spectral variabil-
ty and therefore while the number of true positive pixels detecteds low, the numbers of false positive pixels are also extremely low.herefore, the high sensitivity of OSP may be useful in applicationshere only presence is to be substantiated such as detection ofresence of gases. Both CEM and SCM were also found to be sensi-ive to spectral variability but the numbers of false positive pixelsn the case of CEM was the highest. The performance of SAM was,owever, found to be the poorest.
The experiments were conducted in a similar manner for theynthetic data which exhibits little spectral variability. Here, OSPails completely and CEM produces a lot of false positives. In thisase, both SAM and SCM produce the most appropriate results withigh true positive pixels and almost nil false positive pixels.
In case of anomaly detectors for AVIRIS data, the OSPAD pro-uced results similar to OSP but RXD, RXD–UTD and UTD failed to
etect any target. On the other hand, for synthetic data, however,SP anomaly detector failed completely. All the other anomalyetectors although successful in detecting the targets also producedigh false positive pixels.bservation and Geoinformation 13 (2011) 730–740
In summary, in case of targets which are likely to show spectralvariability, OSP, SCM and CEM are likely to perform better. Anomalydetectors are likely to fail in such cases. On the other hand, in case oflimited or no spectral variability, SAM and SCM are likely to performbetter and may be preferred. Anomaly detectors are also likely tobe successful though with high false positives.
Finally, to assess the ICA algorithm with other spectral matchingalgorithms, ROC curves were generated. From the location of ICA onthe ROC plot, it is evident that the performance of ICA is superiorto other spectral matching algorithms. Further, ICA has an addi-tional advantage in the sense that it does not require any a prioriinformation.
References
Chang, S.S., 2001. Unsupervised target detection in hyperspectral images using pro-jection pursuits. IEEE Transactions on Geosciences and Remote Sensing 39 (7),1380–1391.
Chang, C.I., 2003. Hyperspectral Imaging—Techniques for Spectral Detection andClassification. Plenum Publishers, New York, USA.
Chang, C.I., 2005. Orthogonal subspace projection (OSP) revisited: a comprehensivestudy and analysis. IEEE Transactions on Geoscience and Remote Sensing 43 (3),502–518.
Chang, C.I., Chang, S.S., 2002. Anomaly detection and classification for hyperspec-tral imagery. IEEE Transactions on Geoscience and Remote Sensing 40 (6),1314–1325.
ERDAS Imagine Spectral Analysis Users Guide, ERDAS Imagine V 8.6.Hyvarinen, A., Oja, E., 2000. Independent Component Analysis: Algorithms
and Applications. Neural Networks Research Centre, Helsinki Universityof Technology, Neural Networks, http://www.cs.helsinki.fi/u/ahyvarin/papers/NN00new.pdf.
Manolakis, D., 2004. Detection Algorithms for Hyperspectral Imaging Applications:A Signal Processing Perspective. MIT Lincoln Laboratory, 0-7803-8350-8/04/$20.00© 2004/IEEE.
Manolakis, D., Shaw, G.A., 2002. Detector algorithm for hyper spectral imaging appli-cation. IEEE Signal Processing Magazine 19 (1), 23–43.
Manolakis, D., Marden, D., Shaw, G.A., 2003. Hyperspectral image processing forautomatic target detection applications. Lincoln Laboratory Journal 14 (1),79–115.
O’Donnell, E., 2002. Final Report on Implementation of the Rx Algorithm. ENVI, Inc.,USA.
Ren, D.Q., Chang, C.I., 2003. A comparative assessment for orthogonal subspace pro-jection and constrained energy minimisation. IEEE Transactions on Geoscienceand Remote Sensing 41 (6), 1525–1529.
Stefan, A.R., Varshney, P.K., 2004. Further Results in Use of IndependentComponents Analysis for Target Detection in Hyperspectral Images.,http://www.cs.uno.edu/stefan/.
Wang, C., Zhang, J., Gu, Y., 2006. Target detection for hyperspectral images using
ICA-based feature extraction. In: IEEE International Conference on Geoscienceand Remote Sensing Symposium, IGARSS 2006 , pp. 850–853.Zhang, J., Zhu, F., 2009. Target detection approach for hyperspectral imagery basedon independent component analysis and local singularity. In: Fifth InternationalConference on Natural Computation, vol. 2 , pp. 603–607.