amelie ewert stephan schmid mascha brost huw davies luc
TRANSCRIPT
Small Electric Vehicles
Amelie EwertStephan SchmidMascha BrostHuw DaviesLuc Vinckx Editors
An International View on Light Three- and Four-Wheelers

Small Electric Vehicles
Amelie Ewert • Stephan Schmid • Mascha Brost •
Huw Davies • Luc VinckxEditors
Small Electric VehiclesAn International View on LightThree- and Four-Wheelers
123
EditorsAmelie EwertGerman Aerospace Center e.V. (DLR)Stuttgart, Baden-Württemberg, Germany
Mascha BrostGerman Aerospace Center e.V. (DLR)Stuttgart, Baden-Württemberg, Germany
Luc VinckxElephant Consult B.V.B.A.Tervuren, Belgium
Stephan SchmidGerman Aerospace Center e.V. (DLR)Stuttgart, Baden-Württemberg, Germany
Huw DaviesInstitute for Future Transport and CitiesCoventry UniversityCoventry, UK
ISBN 978-3-030-65842-7 ISBN 978-3-030-65843-4 (eBook)https://doi.org/10.1007/978-3-030-65843-4
© The Editor(s) (if applicable) and The Author(s) 2021. This book is an open access publication.Open Access This book is licensed under the terms of the Creative Commons Attribution 4.0International License (http://creativecommons.org/licenses/by/4.0/), which permits use, sharing, adap-tation, distribution and reproduction in any medium or format, as long as you give appropriate credit tothe original author(s) and the source, provide a link to the Creative Commons license and indicate ifchanges were made.The images or other third party material in this book are included in the book’s Creative Commonslicense, unless indicated otherwise in a credit line to the material. If material is not included in the book’sCreative Commons license and your intended use is not permitted by statutory regulation or exceeds thepermitted use, you will need to obtain permission directly from the copyright holder.The use of general descriptive names, registered names, trademarks, service marks, etc. in this publi-cation does not imply, even in the absence of a specific statement, that such names are exempt from therelevant protective laws and regulations and therefore free for general use.The publisher, the authors and the editors are safe to assume that the advice and information in thisbook are believed to be true and accurate at the date of publication. Neither the publisher nor theauthors or the editors give a warranty, expressed or implied, with respect to the material containedherein or for any errors or omissions that may have been made. The publisher remains neutral with regardto jurisdictional claims in published maps and institutional affiliations.
Graphic: DLR, CC-BY 3.0
This Springer imprint is published by the registered company Springer Nature Switzerland AGThe registered company address is: Gewerbestrasse 11, 6330 Cham, Switzerland
Preface
With a growing number of electric vehicles (EVs) worldwide, the EV stock ofpassenger cars reached 5.1 million in 2018 with battery electric vehicles (BEVs)holding 64 % (IEA 2018). Especially, the sales numbers and models available onthe market of larger vehicles, i.e. large cars, SUVs or pick-ups, grew significantly inthe past years. This is problematic from an ecological point of view, as they requiremore energy for operation than small and lightweight electric vehicles (SEVs) andare in most cases a less efficient transport option. SEVs offer the same benefits thatcome with the deployment of BEVs, such as no emission of exhaust pollutants, butthey beyond that require less critical raw materials for the production of batteriesand overall emit less greenhouse gases (GHGs) than large vehicles or vehicles withinternal combustion engine (ICEs). SEVs are an alternative especially in urbanareas. Due to their small size, they occupy less space and could therefore help in thedevelopment of attractive city centres. In order to holistically evaluate the potentialof SEVs for optimized land use, it is important to consider which transportationmodes might be substituted.
While figures of SEVs in China are growing rapidly with 50 million electricthree-wheelers and an estimated 5 million low-speed electric vehicles (LSEVs) in2019, other countries show by far smaller numbers. Especially, considering worldmarkets such as the USA and Europe, SEVs have only limited success. Differentrules for homologation complicate a comparison of world markets and the intro-duction of vehicle models into new markets.
This book should give a first overview of different SEV types of vehicles andtheir possible applications. It aims for an international view on chances andobstacles for SEVs as well as new research, pilot projects and developments in thearea. The present status of SEV technologies, the market situation and main hin-dering factors for market success as well as options to attain a higher market shareincluding new mobility concepts will be highlighted.
The book is realized against the background of the International Hybrid andElectric Vehicles Technology Collaboration Programme (IEA-HEV) in the frame-work of the International EnergyAgencywithin theTask 32 on small electric vehicles.
v
Definition of Small Electric Vehicles The term small electric vehicles comprisesin this book three- and four-wheel vehicles which are powered by a locallyemission-free drive. Depending on the regional background, they are classifieddifferently, e.g. as low- and medium-speed vehicles, low-speed electric vehicle orkei cars. According to EU regulation (No. 168/2013), they belong to one of theL-categories L2e, L5e-L7e. Additionally, electric cargo bikes and vehicles of cat-egories M1 or N1 which do not exceed 3.5 m, a maximum drive power of 55 kWand an unladen weight of up to 1200 kg, are in the scope.
Review Process The contributions in this book were reviewed by experts in thefield in a double-blind two-step process. The editorial team greatly appreciates thereviewers who contributed their knowledge and expertise to the book’s editorialprocess over the past six months. The editors would like to express their sinceregratitude to all reviewers for their cooperation and dedication in 2020 including:
Adrian Braumandl, Karlsruher Institut für Technologie (KIT)Annick Roetynck, LEVA-EUProf. Dr.-Ing. Alexander Müller, Hochschule EsslingenChristian Ulrich, Deutsches Zentrum für Luft- und Raumfahrt e.V.Christian Wachter, Deutsches Zentrum für Luft- und Raumfahrt e.V.Christina Wolking, Technische Universität BerlinDeğer Saygın, SHURA Energy Transition CenterFlorian KleinerFriederike Pfeifer, IKEM—Institut für Klimaschutz, Energie und MobilitätGabriele Grea, Università BocconiJ. R. Reyes Garcia, University of TwenteJörg Sonnleitner, Universität StuttgartMarc Figuls, FACTUALPaul NieuwenhuisProf. Peter Wells, Cardiff UniversityDr. Richard Barrett, University of Liverpool in LondonSebastian Sigle, Deutsches Zentrum für Luft- und Raumfahrt e.V.Susanne Balm, Amsterdam University of Applied SciencesSylvia Stieler, IMU InstitutProf. Dr.-Ing. Volker Blees, Hochschule RheinMainWerner Kraft, Deutsches Zentrum für Luft- und Raumfahrt e.V.
Stuttgart, Germany Amelie EwertStuttgart, Germany Stephan SchmidStuttgart, Germany Mascha BrostCoventry, UK Huw DaviesTervuren, Belgium Luc Vinckx
vi Preface
Contents
Introducing SEVs
Small Electric Vehicles—Benefits and Drawbacks for SustainableUrban Development . . . . . . . . . . . . . . . . . . . . . . . . . . . . . . . . . . . . . . . . 3Amelie Ewert, Mascha Brost, and Stephan Schmid
Courses of Action for Improving the Safety of the Powered Cycle . . . . . 17Luc Vinckx and Huw Davies
Velomobiles and Urban Mobility: Opportunities and Challenges . . . . . . 29Geoffrey Rose and Alex Liang
The UK Approach to Greater Market Acceptance of Powered LightVehicles (PLVs) . . . . . . . . . . . . . . . . . . . . . . . . . . . . . . . . . . . . . . . . . . . 41Huw Davies, Allan Hutchinson, Richard Barrett, Tony Campbell,and Andy Eastlake
Case Studies and Applications of SEVs
The ELVITEN Project as Promoter of LEVs in Urban Mobility: Focuson the Italian Case of Genoa . . . . . . . . . . . . . . . . . . . . . . . . . . . . . . . . . 55Francesco Edoardo Misso, Irina Di Ruocco, and Cino Repetto
Small Electric Vehicles in Commercial Transportation: EmpiricalStudy on Acceptance, Adoption Criteria and Economic and EcologicalImpact on a Company Level . . . . . . . . . . . . . . . . . . . . . . . . . . . . . . . . . 69Tim Hettesheimer, Cornelius Moll, Kerstin Jeßberger, and Saskia Franz
An Energy Efficiency Comparison of Electric Vehiclesfor Rural–Urban Logistics . . . . . . . . . . . . . . . . . . . . . . . . . . . . . . . . . . . 85Andreas Daberkow, Stephan Groß, Christopher Fritscher, and Stefan Barth
vii
Electrification of Urban Three-Wheeler Taxis in Tanzania:Combining the User’s Perspective and Technical FeasibilityChallenges . . . . . . . . . . . . . . . . . . . . . . . . . . . . . . . . . . . . . . . . . . . . . . . 97Mirko Goletz, Daniel Ehebrecht, Christian Wachter, Deborah Tolk,Barbara Lenz, Meike Kühnel, Frank Rinderknecht, and Benedikt Hanke
Impact Studies and Effects of SEV Deployment
Small Electric Vehicles (SEV)—Impacts of an Increasing SEV Fleeton the Electric Load and Grid . . . . . . . . . . . . . . . . . . . . . . . . . . . . . . . . 115Tobias Gorges, Claudia Weißmann, and Sebastian Bothor
Fields of Applications and Transport-Related Potentials of SmallElectric Vehicles in Germany . . . . . . . . . . . . . . . . . . . . . . . . . . . . . . . . . 127Christine Eisenmann, Johannes Gruber, Mascha Brost, Amelie Ewert,Sylvia Stieler, and Katja Gicklhorn
Vehicle Concepts and Technologies
KYBURZ Small Electric Vehicles: A Case Studyin Successful Deployment . . . . . . . . . . . . . . . . . . . . . . . . . . . . . . . . . . . . 143Erik Wilhelm, Wilfried Hahn, and Martin Kyburz
BICAR—Urban Light Electric Vehicle . . . . . . . . . . . . . . . . . . . . . . . . . . 157Hans-Jörg Dennig, Adrian Burri, and Philipp Ganz
Conception and Development of a Last Mile Vehiclefor Urban Areas . . . . . . . . . . . . . . . . . . . . . . . . . . . . . . . . . . . . . . . . . . . 167Andreas Höfer, Erhard Esl, Daniel Türk, and Veronika Hüttinger
Development of the Safe Light Regional Vehicle (SLRV):A Lightweight Vehicle Concept with a Fuel Cell Drivetrain . . . . . . . . . . 179Michael Kriescher, Sebastian Scheibe, and Tilo Maag
viii Contents
List of Figures
Small Electric Vehicles—Benefits and Drawbacks for SustainableUrban Development
Fig. 1 Prospects for more SEVs in cities . . . . . . . . . . . . . . . . . . . . . . . . . 7Fig. 2 Obstacles if more SEVs would operate in urban areas . . . . . . . . . 7Fig. 3 Vehicle weight depending on the range in kWh, range values
based on different driving cycles, for passenger cars: NEDCcombined . . . . . . . . . . . . . . . . . . . . . . . . . . . . . . . . . . . . . . . . . . . 9
Fig. 4 Land use of different vehicle models . . . . . . . . . . . . . . . . . . . . . . 10Fig. 5 Purchase prices of the top five new registrations of EV models in
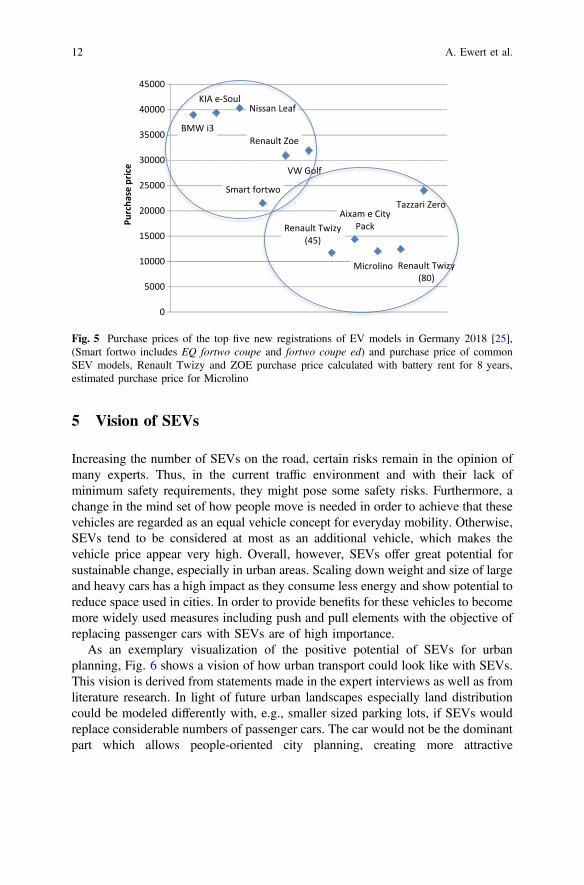
Germany 2018 [25], (Smart fortwo includes EQ fortwo coupe andfortwo coupe ed) and purchase price of common SEV models,Renault Twizy and ZOE purchase price calculated with batteryrent for 8 years, estimated purchase price for Microlino . . . . . . . . . . . 12
Fig. 6 Vision for SEVs in urban areas. . . . . . . . . . . . . . . . . . . . . . . . . . . 13
Courses of Action for Improving the Safety of the Powered Cycle
Fig. 1 Podbike (Norway) pedal cycle with pedal assistance (250 W)is announced for 2020 [3] . . . . . . . . . . . . . . . . . . . . . . . . . . . . . . . 19
Velomobiles and Urban Mobility: Opportunities and Challenges
Fig. 1 Side and front view of a velomobile (own image) . . . . . . . . . . . . 30Fig. 2 Matrix of personal mobility options. Source Modified
from [7] . . . . . . . . . . . . . . . . . . . . . . . . . . . . . . . . . . . . . . . . . . . . 34
The UK Approach to Greater Market Acceptance of Powered LightVehicles (PLVs)
Fig. 1 Examples of the types of vehicle that MCIA believes wouldcome under the scope of micromobility (own visualisation) . . . . . 46
ix
The ELVITEN Project as Promoter of LEVs in Urban Mobility:Focus on the Italian Case of Genoa
Fig. 1 Thousands of registrations of BEVs (battery electric vehicles)and PHEVs (plug-in hybrid electric vehicles) in Italy [3] . . . . . . . 57
Fig. 2 Trend of the electric two-wheeled vehicles Italian market,2016–2019 [5] . . . . . . . . . . . . . . . . . . . . . . . . . . . . . . . . . . . . . . . 58
Fig. 3 Total trips per month for all pilot cities. Source ELVITENproject, 2020 . . . . . . . . . . . . . . . . . . . . . . . . . . . . . . . . . . . . . . . . . 62
Fig. 4 Evolution by city of the total number of trips monitored(from May 2019 to February 2020). Source ELVITEN project,elaboration by authors . . . . . . . . . . . . . . . . . . . . . . . . . . . . . . . . . . 62
Fig. 5 Evolution by city of the number of trips monitored (March2020). Source ELVITEN project, elaboration by authors . . . . . . . 62
Fig. 6 Average distance per trip by city (up to February 2020).Source ELVITEN project, elaboration by authors . . . . . . . . . . . . . 63
Fig. 7 Trip catchment area in Genoa. Source elaborationby authors . . . . . . . . . . . . . . . . . . . . . . . . . . . . . . . . . . . . . . . . . . . 63
Fig. 8 Average number of trips per users. Source ELVITEN project,elaboration by authors . . . . . . . . . . . . . . . . . . . . . . . . . . . . . . . . . . 64
Fig. 9 Trips by timeslot. ELVITEN project, elaboration by authors . . . . 64Fig. 10 Trips by day of the week. ELVITEN project, elaboration
by authors . . . . . . . . . . . . . . . . . . . . . . . . . . . . . . . . . . . . . . . . . . . 64
Small Electric Vehicles in Commercial Transportation: EmpiricalStudy on Acceptance, Adoption Criteria and Economic and EcologicalImpact on a Company Level
Fig. 1 Exemplary representation of swap bodies used as micro-hubs.Source Dachser Neuss Swap Bodies. Licensed underCC BY-SA3.0 (https://creativecommons.org/licenses/by-sa/3.0/deed.de). Cut out. Original version:https://de.wikipedia.org/wiki/Datei:Dachser_Neuss_Swap_Bodies.JPG. . . . . . . . . . . . . . . . 72
Fig. 2 Knowledge and applicability of SEVs in companies(own representation) . . . . . . . . . . . . . . . . . . . . . . . . . . . . . . . . . . . 75
Fig. 3 Applicability of SEVs in companies according to size . . . . . . . . . 76Fig. 4 Applicability of SEVs according to sectors . . . . . . . . . . . . . . . . . . 76Fig. 5 Motives for the (possible) application of SEVs. . . . . . . . . . . . . . . 77Fig. 6 Barriers to the use of SEVs. . . . . . . . . . . . . . . . . . . . . . . . . . . . . . 77Fig. 7 Willingness of LSPs to implement cargo bicycles
in combination with micro-hubs . . . . . . . . . . . . . . . . . . . . . . . . . . 79Fig. 8 Results of economical, ecological, and processing time
calculations . . . . . . . . . . . . . . . . . . . . . . . . . . . . . . . . . . . . . . . . . . 80
x List of Figures

An Energy Efficiency Comparison of Electric Vehiclesfor Rural–Urban Logistics
Fig. 1 Heilbronn landscape [19] and rural–urban locationof Heilbronn-Franconia region [18]. . . . . . . . . . . . . . . . . . . . . . . . 87
Fig. 2 Volkswagen e-up! load-up! with cargo compartment (left andmiddle) and a typical example of parcel and mail transport withan internal combustion-engine-powered transporter (right) . . . . . . 87
Fig. 3 LIDAR-Scan of the VW e-up! load-up!; left: exterior; centre:cargo compartment; right: pharmaceutical cargo containers,“Postbehälter Typ 2” and VDA/Euronorm . . . . . . . . . . . . . . . . . . 88
Fig. 4 e-up! load-up!, removable roof box (middle), fixed high roofcompartment (right). . . . . . . . . . . . . . . . . . . . . . . . . . . . . . . . . . . . 89
Fig. 5 Driving route between the UAS Heilbronn campus [ownillustration with map material from © 2020 GeoCzech, Inc.] andchart with street and traffic type characteristics(top left) . . . . . . . . . . . . . . . . . . . . . . . . . . . . . . . . . . . . . . . . . . . . 90
Fig. 6 Simulated flow velocity profiles for roof concepts from Fig. 5.Driving route between the UAS Heilbronn campus [ownillustration with map material from © 2020 GeoCzech, Inc.]and chart with street and traffic type characteristics (top left)Fig. 4 . . . . . . . . . . . . . . . . . . . . . . . . . . . . . . . . . . . . . . . . . . . . . . 92
Fig. 7 Energy consumption and range calculation results . . . . . . . . . . . . 94
Electrification of Urban Three-Wheeler Taxis in Tanzania:Combining the User’s Perspective and Technical FeasibilityChallenges
Fig. 1 Moto-taxi in Dar es Salaam. Photo taken during field trip Feb.2019 © DLR/Benedikt Hanke. . . . . . . . . . . . . . . . . . . . . . . . . . . . 99
Fig. 2 Kilometres covered per vehicle during the test sorted by distancecovered (left).Map ofDar es Salaam’s city centre and it’s outskirtswith tracks of the GPS measurement campaign (right, figure usesmap data from “© OpenStreetMap contributors,CC-BY-SA,www.openstreetmap.org/copyright”). . . . . . . . . . . . . . . . . 101
Fig. 3 Generated Dar es Salaam-drive cycle . . . . . . . . . . . . . . . . . . . . . . 107Fig. 4 Simulation results: range, energy demand, and battery weight
for the generated drive cycle . . . . . . . . . . . . . . . . . . . . . . . . . . . . . 108Fig. 5 Battery demand for battery electric vehicles with lithium ion
batteries of the different scenarios with and without opportunitycharging (left). Utilization of charging points as well as numberof vehicles at stations normalized to the vehicles under test in agiven test week (right) . . . . . . . . . . . . . . . . . . . . . . . . . . . . . . . . . 109
List of Figures xi
Small Electric Vehicles (SEV)—Impacts of an Increasing SEV Fleeton the Electric Load and Grid
Fig. 1 Exemplary SEV and BEV charging profile (Charging after four“Business” trips, see Table 2) . . . . . . . . . . . . . . . . . . . . . . . . . . . . 120
Fig. 2 Total load reduction in Scenario 3 compared to Scenario 1(Early adopter, outlying district)—H0 BDEW household loadprofile according to [26]; Distribution of charging timespanaccording to [28]. . . . . . . . . . . . . . . . . . . . . . . . . . . . . . . . . . . . . . 121
Fields of Applications and Transport-Related Potentials of SmallElectric Vehicles in Germany
Fig. 1 Share of private trips and mileages on private trips that can besubstituted by SEVs (maximum potential) . . . . . . . . . . . . . . . . . . 133
Fig. 2 Proportion of private trips that could be substituted by SEVs,differentiated by previous modes of transport (maximumpotential) . . . . . . . . . . . . . . . . . . . . . . . . . . . . . . . . . . . . . . . . . . . . 133
Fig. 3 Persons who could have used SEVs on the survey day,differentiated by different SEV models and age groups(maximum potential) . . . . . . . . . . . . . . . . . . . . . . . . . . . . . . . . . . . 134
Fig. 4 Share of commercial transport trips and mileages on commercialtrips that can be substituted by SEVs(maximum potential) . . . . . . . . . . . . . . . . . . . . . . . . . . . . . . . . . . . 135
Fig. 5 Proportion of commercial transport trips that could besubstituted by SEVs, differentiated by trip purposes(maximum potential) . . . . . . . . . . . . . . . . . . . . . . . . . . . . . . . . . . . 136
KYBURZ Small Electric Vehicles: A Case Study in SuccessfulDeployment
Fig. 1 KYBURZ Fleet management infrastructure for securely storingand processing data. . . . . . . . . . . . . . . . . . . . . . . . . . . . . . . . . . . . 144
Fig. 2 Distribution of daily driving distance for the week of the 10th tothe 14th of June 2019 . . . . . . . . . . . . . . . . . . . . . . . . . . . . . . . . . . 145
Fig. 3 Deployment of DXPs in Switzerland . . . . . . . . . . . . . . . . . . . . . . 146Fig. 4 Piaggio Liberty 125 cc internal combustion engine (ICE)
incumbent delivery vehicle (left) and the KYBURZ DXPelectric delivery vehicle (right) . . . . . . . . . . . . . . . . . . . . . . . . . . . 146
Fig. 5 Measured on-road energy consumption of the DXP in variousmarkets compared with the ICE incumbent, showinga significant: energy-saving potential by switching to electricdelivery vehicles . . . . . . . . . . . . . . . . . . . . . . . . . . . . . . . . . . . . . . 148
Fig. 6 Compare the KYBURZ DXCargo with conventional paneldelivery trucks . . . . . . . . . . . . . . . . . . . . . . . . . . . . . . . . . . . . . . . 149
xii List of Figures
Fig. 7 Cargo van-based deliveries occupy almost 700 m2 area per routeversus DXC-based deliveries with one vehicle. A DXC fleetwith six vehicles, capable of delivering the same amount ofcargo as one big van, would save 100 m2 per route . . . . . . . . . . . 150
Fig. 8 A typical delivery route shows over 50 stops in postal serviceper day . . . . . . . . . . . . . . . . . . . . . . . . . . . . . . . . . . . . . . . . . . . . . 150
Fig. 9 Average time savings recorded for real postal routes betweenservices using conventional versus three-wheeled SEVsfor delivery . . . . . . . . . . . . . . . . . . . . . . . . . . . . . . . . . . . . . . . . . . 151
Fig. 10 DXP vehicles stop an average of 57 times per route, resultingin substantial time and cost savings . . . . . . . . . . . . . . . . . . . . . . . 151
Fig. 11 Total cost of ownership for the DXP is 0.02 CHF lower thanfor the ICE . . . . . . . . . . . . . . . . . . . . . . . . . . . . . . . . . . . . . . . . . . 152
Fig. 12 KYBURZ SecondLife project refurbishment halland production line . . . . . . . . . . . . . . . . . . . . . . . . . . . . . . . . . . . . 153
Fig. 13 Majority of the KYBURZ DXPs are refurbished, and thosewhich are recycled result in good yields . . . . . . . . . . . . . . . . . . . . 153
BICAR—Urban Light Electric Vehicle
Fig. 1 BICAR—Main features: 1. weather protection incl.wiper system; 2. solar powered; 3. safety belt system;4. three-wheel-tilting chassis; 5. needs only 1.2 m2 parkingspace; 6. robust tubular frame . . . . . . . . . . . . . . . . . . . . . . . . . . . . 158
Fig. 2 Layout (numbers in mm) including tilting view and differentseat positions (blue: 5% F, green: 95% M) . . . . . . . . . . . . . . . . . . 161
Fig. 3 Structure and stressed areas (right) . . . . . . . . . . . . . . . . . . . . . . . . 162Fig. 4 Isometric views of the front chassis . . . . . . . . . . . . . . . . . . . . . . . 163Fig. 5 Isometric view of the rear suspension with strut (brakes
not shown) . . . . . . . . . . . . . . . . . . . . . . . . . . . . . . . . . . . . . . . . . . 164
Conception and Development of a Last Mile Vehicle for Urban Areas
Fig. 1 Product development process for the development of a cargovehicle for urban areas starting from the definition of thetransportation task (step 1) leading to the prototyping and testing(step 7) as well as to the overall vehicle integration(step 8) . . . . . . . . . . . . . . . . . . . . . . . . . . . . . . . . . . . . . . . . . . . . . 169
Fig. 2 Description of the different cargo delivery situations that can befound in Chinese megacities today . . . . . . . . . . . . . . . . . . . . . . . . 170
Fig. 3 Key vehicle requirements derived from six fields of research . . . . 171Fig. 4 Visualization of six different small electric vehicle concept
for the last mile delivery . . . . . . . . . . . . . . . . . . . . . . . . . . . . . . . . 172
List of Figures xiii
Fig. 5 1. Overall vehicle view; 2. Rear part and cargo area;3. Front part vehicle assembly; 4. Middle vehicle part incl.battery storage and handle bars (folded position);5. BLDC wheel hub motor . . . . . . . . . . . . . . . . . . . . . . . . . . . . . . 174
Fig. 6 Truck integration and four step setup process . . . . . . . . . . . . . . . . 175
Development of the Safe Light Regional Vehicle (SLRV):A Lightweight Vehicle Concept with a Fuel Cell Drivetrain
Fig. 1 Overview of the SLRV concept . . . . . . . . . . . . . . . . . . . . . . . . . . 180Fig. 2 SLRV vehicle body with metal sandwich construction—weight
90 kg . . . . . . . . . . . . . . . . . . . . . . . . . . . . . . . . . . . . . . . . . . . . . . 181Fig. 3 Arrangement of the crash-test facility at the institute of vehicle
concepts [3] . . . . . . . . . . . . . . . . . . . . . . . . . . . . . . . . . . . . . . . . . 182Fig. 4 Deformation behaviour of the body during the pole crash,
0–280 mm intrusion; view from above . . . . . . . . . . . . . . . . . . . . . 183Fig. 5 Force–displacement curve of the pole crash . . . . . . . . . . . . . . . . . 184Fig. 6 Left: Experimental set-up for the frontal crash test, with sled
2 fixed; Right: sled 1 in motion . . . . . . . . . . . . . . . . . . . . . . . . . . 185Fig. 7 Behaviour of the SLRV body in a frontal crash test . . . . . . . . . . . 185Fig. 8 Force–displacement curve of the frontal crash test with
the SLRV body in white . . . . . . . . . . . . . . . . . . . . . . . . . . . . . . . . 186Fig. 9 Appearance of a slight deformation in the tunnel area . . . . . . . . . 187Fig. 10 Drivetrain concept of the SLRV . . . . . . . . . . . . . . . . . . . . . . . . . . 188Fig. 11 SLRV research vehicle, November 2019, the drivetrain is still
being developed . . . . . . . . . . . . . . . . . . . . . . . . . . . . . . . . . . . . . . 188
xiv List of Figures
List of Tables
Small Electric Vehicles—Benefits and Drawbacks for SustainableUrban Development
Table 1 Alternative terms for SEVs in different countriesand limitation of parameters [1, 7–10] . . . . . . . . . . . . . . . . . . . . . 6
Courses of Action for Improving the Safety of the Powered Cycle
Table 1 Comparison of key legal parameters between different vehiclecategories for four-wheeled vehicles . . . . . . . . . . . . . . . . . . . . . . . 20
Table 2 Some reasonable estimates to calculate the power needfor an L1eA at top speed . . . . . . . . . . . . . . . . . . . . . . . . . . . . . . . 24
Table 3 Output of the calculation (based on the input from Table 2) . . . . . 25
Velomobiles and Urban Mobility: Opportunities and Challenges
Table 1 Typical characteristics of various mobility devices(HP = Human-powered, EA = Electric assist. SourceManufacturer’s web sites). . . . . . . . . . . . . . . . . . . . . . . . . . . . . . . 32
Table 2 Speed comparison between typical bicycles and velomobiles(Std = standard, BP = best practice) . . . . . . . . . . . . . . . . . . . . . . . 32
Table 3 Kinetic energy generated for bikes and velomobiles. . . . . . . . . . . 33
The ELVITEN Project as Promoter of LEVs in Urban Mobility:Focus on the Italian Case of Genoa
Table 1 Solutions deployed in Genoa . . . . . . . . . . . . . . . . . . . . . . . . . . . . 61Table 2 Evolution by city of the number of trips
per month monitored . . . . . . . . . . . . . . . . . . . . . . . . . . . . . . . . . . 65
xv
Small Electric Vehicles in Commercial Transportation: EmpiricalStudy on Acceptance, Adoption Criteria and Economic and EcologicalImpact on a Company Level
Table 1 Logistics parameters . . . . . . . . . . . . . . . . . . . . . . . . . . . . . . . . . . . 73Table 2 Techno-economic parameters of vehicles . . . . . . . . . . . . . . . . . . . 74Table 3 Further techno-economic parameters. . . . . . . . . . . . . . . . . . . . . . . 74
An Energy Efficiency Comparison of Electric Vehiclesfor Rural–Urban Logistics
Table 1 Characteristics of different street and traffic types [22] . . . . . . . . . 90Table 2 Substitute parameters used equally for all assessed vehicles . . . . . 91Table 3 Aerodynamic parameters of compared vehicles . . . . . . . . . . . . . . 91Table 4 Comparison of the calculated values . . . . . . . . . . . . . . . . . . . . . . 93
Electrification of Urban Three-Wheeler Taxis in Tanzania:Combining the User’s Perspective and Technical FeasibilityChallenges
Table 1 Vehicles under test (VUT) and coincidence factorof moto-taxis at the stations . . . . . . . . . . . . . . . . . . . . . . . . . . . . . 102
Table 2 Summary of survey results among moto-taxi drivers(n = 105) . . . . . . . . . . . . . . . . . . . . . . . . . . . . . . . . . . . . . . . . . . . 105
Table 3 Results of the market analysis of three-wheeled vehicles(as of January 2019). . . . . . . . . . . . . . . . . . . . . . . . . . . . . . . . . . . 106
Table 4 Vehicles under test (VUT) and charging points requiredfor minimal battery size . . . . . . . . . . . . . . . . . . . . . . . . . . . . . . . . 110
Small Electric Vehicles (SEV)—Impacts of an Increasing SEV Fleeton the Electric Load and Grid
Table 1 Overview of SEV use and development . . . . . . . . . . . . . . . . . . . . 118Table 2 Overview of SEV electricity consumption
and charging time. . . . . . . . . . . . . . . . . . . . . . . . . . . . . . . . . . . . . 118Table 3 Scenario parameters (without substitution) . . . . . . . . . . . . . . . . . . 119Table 4 Maximum charging load—Scenario perspective . . . . . . . . . . . . . . 121Table 5 Peak demand increase in hypothetical branches*—Scenario
perspective . . . . . . . . . . . . . . . . . . . . . . . . . . . . . . . . . . . . . . . . . . 121
Fields of Applications and Transport-Related Potentials of SmallElectric Vehicles in Germany
Table 1 Vehicle and usage characteristics of various SEV models, suitedprimarily for passenger transport . . . . . . . . . . . . . . . . . . . . . . . . . 131
xvi List of Tables
Table 2 Vehicle and usage characteristics of various SEV models, suitedprimarily for commercial transport . . . . . . . . . . . . . . . . . . . . . . . . 131
Table 3 Sharing services with SEVs in Europe . . . . . . . . . . . . . . . . . . . . . 138
KYBURZ Small Electric Vehicles: A Case Study in SuccessfulDeployment
Table 1 Physical characteristics of the delivery vehicles . . . . . . . . . . . . . . 146Table 2 Life cycle modeling inputs for the DXP SEV . . . . . . . . . . . . . . . 147Table 3 Life cycle modeling results for the DXP SEV, compared to the
incumbent ICE the DXP exhibits far superior performance . . . . . 147Table 4 Assumptions for calculating the total cost of ownership
comparison . . . . . . . . . . . . . . . . . . . . . . . . . . . . . . . . . . . . . . . . . . 152
BICAR—Urban Light Electric Vehicle
Table 1 Overview of selected light electric vehicles (LEVs)with weather protection . . . . . . . . . . . . . . . . . . . . . . . . . . . . . . . . 159
Conception and Development of a Last Mile Vehiclefor Urban Areas
Table 1 Technical key features of the vehicle concept . . . . . . . . . . . . . . . 174
List of Tables xvii

Introducing SEVs
Small Electric Vehicles—Benefitsand Drawbacks for SustainableUrban Development
Amelie Ewert, Mascha Brost, and Stephan Schmid
Abstract Small electric vehicles (SEVs) have the potential to contribute to climateprotection, efficient land use, and mitigation of air pollution in cities. Even though,they show many benefits that could enhance urban quality of life, they are not yetwidely used. In this paper, benefits as well as drawbacks for these vehicles arediscussed by combining literature research and outcomes of a mixed-methodapproach with expert interviews and an online survey. Resulting from these argu-ments, a vision for SEVs in urban areas is drawn showing them integrated in a mixof various transport modes. Environmental benefits are derived, for example, fromtheir lower weight and low maximum speed making them a more energy-efficienttransport option than heavier cars. Additionally, the small vehicle size lowers landuse for SEVs and, e.g., allows for less parking areas needed. However, they alsohold constraints that need to be dealt with in different ways. On the one hand, thelower safety compared to passenger cars is an issue that is further worsened bycurrent traffic regulations. On the other hand, costs in terms of purchase prices seemto be an issue for SEVs.
Keywords Small electric vehicles � Vehicle concepts � Sustainable transport
1 Introduction
Cities are growing worldwide due to an increasing population, and simultaneously,motorization intensifies. Challenges such as local environmental pollution, a lack ofspace, and saturation of existing infrastructure are thereby becoming more pressing.The urgency to act and the need for new forms of mobility sets the tone not only forpolitics, urban, and transport planning but also leads some companies to offer newsolutions. One contribution to climate protection and to cope with local challenges
A. Ewert (&) � M. Brost � S. SchmidGerman Aerospace Center (DLR), Institute of Vehicle Concepts,Pfaffenwaldring 38-40, 70569 Stuttgart, Germanye-mail: [email protected]
© The Author(s) 2021A. Ewert et al. (eds.), Small Electric Vehicles,https://doi.org/10.1007/978-3-030-65843-4_1
3
is the deployment of small and lightweight electric vehicles when replacing heaviercars and being applied together with other ecological transport modes like publictransport.
This paper discusses benefits and drawbacks that could result through a morewidespread usage of SEVs in cities. Adding to a literature-based research is resultsfrom qualitative and quantitative methods in a mixed-method approach. Analysesinclude expert interviews and an online survey. The results show that these vehiclesbring many advantages within urban areas. In addition to other aspects, especiallylower land use due to the small vehicle size offers potential by conversion of trafficareas and increased air quality. If SEVs would replace vehicles with internalcombustion engines (ICE), significantly fewer air pollutants could be emitted. Dueto their lower weight and maximum speed, they are even more energy-efficient thanmost normal battery electric vehicles (BEV).
Nevertheless, the survey showed that there are many hurdles to be overcome.These drawbacks affect the development of the vehicle technology and transportplanning within the cities. These include, for example, safety aspects, e.g., as thevehicles are very light which is often connected to lower passenger safety and crashtests are not required by EU law for type approval of this vehicle category. Anexample for drawbacks regarding city planning is that most cities are not designedfor these vehicles and therefore do not offer advantages in use, such as privilegeduse of lanes or parking spaces. In a global comparison in some world regions, thereis a large market for SEVs such as the Asian countries China, Japan, or India [1].Europe and the United States, however, only show small sales numbers [2, 3].
In the following, the term SEV will first be narrowed down and explained. Then,advantages and limitations of the vehicles are presented using literature researchsupported by the results of a qualitative and quantitative survey. For the last section,a future vision of how urban mobility could look like is drawn including all types ofmobility.
SEV definition. SEVs in this chapter are referred to three- and four-wheeled Lclass vehicles according to EU Regulation No. 168/2013. They also include electricvehicles of categories M1 or N1 which do not exceed 3.5 m, a maximum drivepower of 55 kW, and an unladen weight of up to 1200 kg.
2 Mixed-Method-Approach
Adding to desk-based research, collecting data and existing literature on benefitsand drawbacks of SEVs a mixed-method-approach consisting of quantitative andqualitative empirical social research was carried out. For the qualitative approach,semi-structured expert interviews were conducted. This way, it was possible toderive exclusive knowledge from professionals with different backgrounds bygiving insights to practical application, experiences, and research. The evaluationapproach is based on a concept of Meuser and Nagel [4] and follows the approachof qualitative content analysis. In a repetitive process, successive categories are
4 A. Ewert et al.
formed. The content of the interviews is encoded by paraphrasing individual textpassages with the same content. They are classified thematically with categorieswhich are congruent with the key questions. Further, sub-codes comprise partialaspects. Then, statements can be compared and conceptualized. Ultimately, a theoryis created by inductively generalizing statements on the basis of individual findings[5]. While the interviews were being conducted, at the same time, the target groupsfilled out a standardized online survey. Combining these methods in a concurrenttriangulation similarities, divergences and additional information could be derivedand thus ensure higher validity of information. For both methods the same researchquestions were applied following a parallel design QUAL + QUAN [6]. The surveytook place from March to October 2018 on three main topics:
• Knowledge about SEVs within municipalities and the urban population• Target groups and usage concepts• Obstacles and chances for SEVs.
The survey collects assessments of international experts from municipalities,research institutes, consultants, associations, and manufacturers. In total, 32 tele-phone interviews were held, and the online questionnaire had a sample of 90 withrespondents from Asia, USA, and Europe. For both methods, results are not rep-resentative due to the limited number of experts.
3 Definition of Small Electric Vehicles
Literature contains a vast array of descriptions, definitions, and categorizations ofSEVs and differs regionally. Some of the designations are listed in Table 1 withrespective regulations. The categories often include not only type approval forvehicles with electric drive but also vehicles with ICE. In Japan, for example, theterm new Mobility vehicles is used which includes Kei cars that have been in usesince the 1950s. In this publication, the term SEV is applied as a superordinate term.
European regulation. There are various country-specific categories which inturn have different designations and regulations for type approval. For the vehiclesin the scope of this paper, the European regulatory framework for L-categoryvehicles (L2e, L5e, L6e, and L7e) is defined in Regulation No. 168/2013. Micro-and subcompact electric vehicles with four wheels could in certain cases also bepart of category M1, passenger cars, that are laid out in 2007/46/EC. M1 is definedas a light category of motorized vehicles. Some technical parameters of cars in thissegment are limited, e.g., number of passenger seats must not exceed 8, but have nofurther requirements regarding, e.g., mass, maximum speed (minimum speed is25 km/h), or measurements. Even though there are differences between the M1category and L7e such as the maximum mass, required crash tests, and width, somevehicles that fulfill requirements of both categories can be registered as either M1 orL7e [8, 11, 12].
Small Electric Vehicles—Benefits and Drawbacks … 5
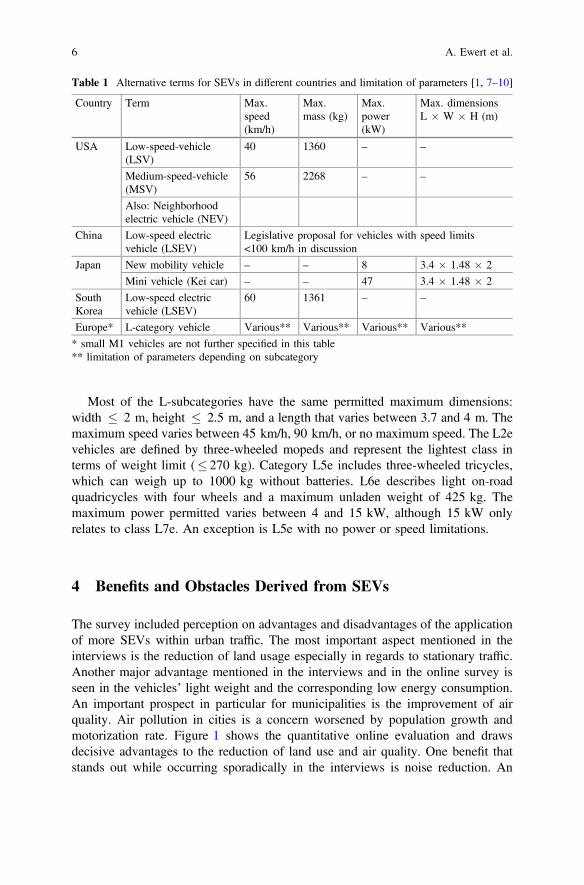
Most of the L-subcategories have the same permitted maximum dimensions:width � 2 m, height � 2.5 m, and a length that varies between 3.7 and 4 m. Themaximum speed varies between 45 km/h, 90 km/h, or no maximum speed. The L2evehicles are defined by three-wheeled mopeds and represent the lightest class interms of weight limit (� 270 kg). Category L5e includes three-wheeled tricycles,which can weigh up to 1000 kg without batteries. L6e describes light on-roadquadricycles with four wheels and a maximum unladen weight of 425 kg. Themaximum power permitted varies between 4 and 15 kW, although 15 kW onlyrelates to class L7e. An exception is L5e with no power or speed limitations.
4 Benefits and Obstacles Derived from SEVs
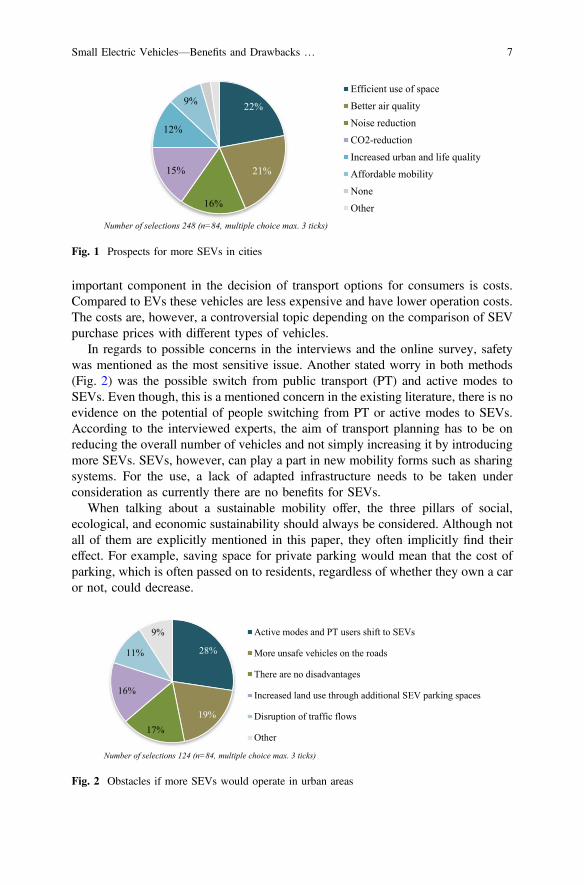
The survey included perception on advantages and disadvantages of the applicationof more SEVs within urban traffic. The most important aspect mentioned in theinterviews is the reduction of land usage especially in regards to stationary traffic.Another major advantage mentioned in the interviews and in the online survey isseen in the vehicles’ light weight and the corresponding low energy consumption.An important prospect in particular for municipalities is the improvement of airquality. Air pollution in cities is a concern worsened by population growth andmotorization rate. Figure 1 shows the quantitative online evaluation and drawsdecisive advantages to the reduction of land use and air quality. One benefit thatstands out while occurring sporadically in the interviews is noise reduction. An
Table 1 Alternative terms for SEVs in different countries and limitation of parameters [1, 7–10]
Country Term Max.speed(km/h)
Max.mass (kg)
Max.power(kW)
Max. dimensionsL � W � H (m)
USA Low-speed-vehicle(LSV)
40 1360 – –
Medium-speed-vehicle(MSV)
56 2268 – –
Also: Neighborhoodelectric vehicle (NEV)
China Low-speed electricvehicle (LSEV)
Legislative proposal for vehicles with speed limits<100 km/h in discussion
Japan New mobility vehicle – – 8 3.4 � 1.48 � 2
Mini vehicle (Kei car) – – 47 3.4 � 1.48 � 2
SouthKorea
Low-speed electricvehicle (LSEV)
60 1361 – –
Europe* L-category vehicle Various** Various** Various** Various**
* small M1 vehicles are not further specified in this table** limitation of parameters depending on subcategory
6 A. Ewert et al.
important component in the decision of transport options for consumers is costs.Compared to EVs these vehicles are less expensive and have lower operation costs.The costs are, however, a controversial topic depending on the comparison of SEVpurchase prices with different types of vehicles.
In regards to possible concerns in the interviews and the online survey, safetywas mentioned as the most sensitive issue. Another stated worry in both methods(Fig. 2) was the possible switch from public transport (PT) and active modes toSEVs. Even though, this is a mentioned concern in the existing literature, there is noevidence on the potential of people switching from PT or active modes to SEVs.According to the interviewed experts, the aim of transport planning has to be onreducing the overall number of vehicles and not simply increasing it by introducingmore SEVs. SEVs, however, can play a part in new mobility forms such as sharingsystems. For the use, a lack of adapted infrastructure needs to be taken underconsideration as currently there are no benefits for SEVs.
When talking about a sustainable mobility offer, the three pillars of social,ecological, and economic sustainability should always be considered. Although notall of them are explicitly mentioned in this paper, they often implicitly find theireffect. For example, saving space for private parking would mean that the cost ofparking, which is often passed on to residents, regardless of whether they own a caror not, could decrease.
22%
21%
16%
15%
12%
9%Efficient use of space
Better air quality
Noise reduction
CO2-reduction
Increased urban and life quality
Affordable mobility
None
Other
Number of selections 248 (n=84, multiple choice max. 3 ticks)
Fig. 1 Prospects for more SEVs in cities
28%
19%17%
16%
11%
9% Active modes and PT users shift to SEVs
More unsafe vehicles on the roads
There are no disadvantages
Increased land use through additional SEV parking spaces
Disruption of traffic flows
Other
Number of selections 124 (n=84, multiple choice max. 3 ticks)
Fig. 2 Obstacles if more SEVs would operate in urban areas
Small Electric Vehicles—Benefits and Drawbacks … 7
4.1 Potential for Environmental Benefits
The switch from ICE vehicles to electrically propelled vehicles itself holds manybenefits especially in urban areas. SEVs and BEV have a positive effect on globalclimate and air quality. Charging of batteries using electricity generated onrenewable energies increases the positive effects and does not simply shift the CO2
tax geographically from the city to energy production plants based on fossil fuels[13]. However, low energy consumption is still important to mitigate negativeimpact from renewable energy generation and due to limited available energyamount.
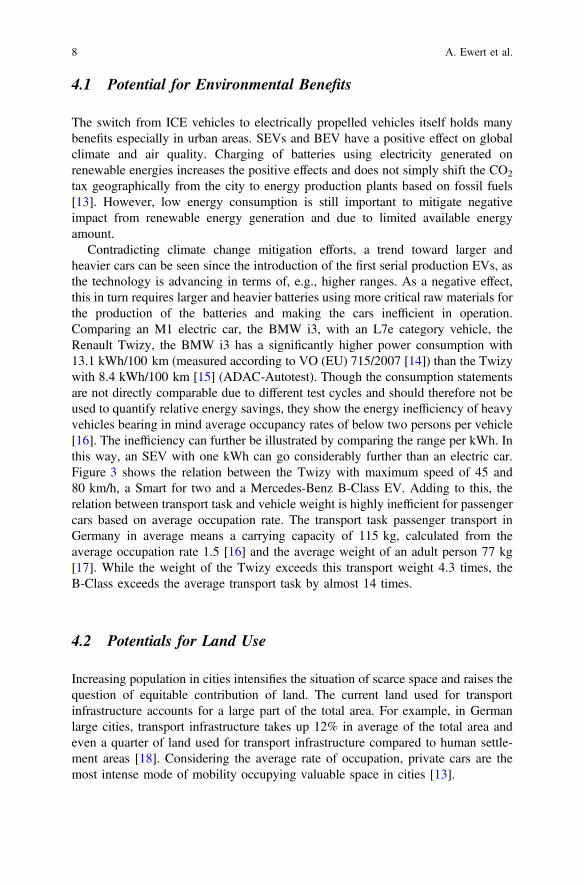
Contradicting climate change mitigation efforts, a trend toward larger andheavier cars can be seen since the introduction of the first serial production EVs, asthe technology is advancing in terms of, e.g., higher ranges. As a negative effect,this in turn requires larger and heavier batteries using more critical raw materials forthe production of the batteries and making the cars inefficient in operation.Comparing an M1 electric car, the BMW i3, with an L7e category vehicle, theRenault Twizy, the BMW i3 has a significantly higher power consumption with13.1 kWh/100 km (measured according to VO (EU) 715/2007 [14]) than the Twizywith 8.4 kWh/100 km [15] (ADAC-Autotest). Though the consumption statementsare not directly comparable due to different test cycles and should therefore not beused to quantify relative energy savings, they show the energy inefficiency of heavyvehicles bearing in mind average occupancy rates of below two persons per vehicle[16]. The inefficiency can further be illustrated by comparing the range per kWh. Inthis way, an SEV with one kWh can go considerably further than an electric car.Figure 3 shows the relation between the Twizy with maximum speed of 45 and80 km/h, a Smart for two and a Mercedes-Benz B-Class EV. Adding to this, therelation between transport task and vehicle weight is highly inefficient for passengercars based on average occupation rate. The transport task passenger transport inGermany in average means a carrying capacity of 115 kg, calculated from theaverage occupation rate 1.5 [16] and the average weight of an adult person 77 kg[17]. While the weight of the Twizy exceeds this transport weight 4.3 times, theB-Class exceeds the average transport task by almost 14 times.
4.2 Potentials for Land Use
Increasing population in cities intensifies the situation of scarce space and raises thequestion of equitable contribution of land. The current land used for transportinfrastructure accounts for a large part of the total area. For example, in Germanlarge cities, transport infrastructure takes up 12% in average of the total area andeven a quarter of land used for transport infrastructure compared to human settle-ment areas [18]. Considering the average rate of occupation, private cars are themost intense mode of mobility occupying valuable space in cities [13].
8 A. Ewert et al.
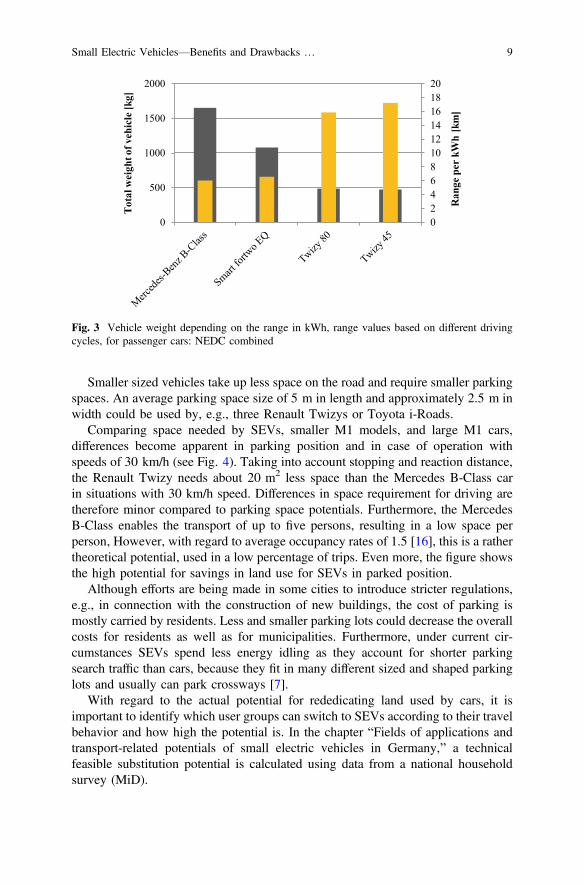
Smaller sized vehicles take up less space on the road and require smaller parkingspaces. An average parking space size of 5 m in length and approximately 2.5 m inwidth could be used by, e.g., three Renault Twizys or Toyota i-Roads.
Comparing space needed by SEVs, smaller M1 models, and large M1 cars,differences become apparent in parking position and in case of operation withspeeds of 30 km/h (see Fig. 4). Taking into account stopping and reaction distance,the Renault Twizy needs about 20 m2 less space than the Mercedes B-Class carin situations with 30 km/h speed. Differences in space requirement for driving aretherefore minor compared to parking space potentials. Furthermore, the MercedesB-Class enables the transport of up to five persons, resulting in a low space perperson, However, with regard to average occupancy rates of 1.5 [16], this is a rathertheoretical potential, used in a low percentage of trips. Even more, the figure showsthe high potential for savings in land use for SEVs in parked position.
Although efforts are being made in some cities to introduce stricter regulations,e.g., in connection with the construction of new buildings, the cost of parking ismostly carried by residents. Less and smaller parking lots could decrease the overallcosts for residents as well as for municipalities. Furthermore, under current cir-cumstances SEVs spend less energy idling as they account for shorter parkingsearch traffic than cars, because they fit in many different sized and shaped parkinglots and usually can park crossways [7].
With regard to the actual potential for rededicating land used by cars, it isimportant to identify which user groups can switch to SEVs according to their travelbehavior and how high the potential is. In the chapter “Fields of applications andtransport-related potentials of small electric vehicles in Germany,” a technicalfeasible substitution potential is calculated using data from a national householdsurvey (MiD).
02468101214161820
0
500
1000
1500
2000
Ran
ge p
er k
Wh
[km
]
Tot
al w
eigh
t of v
ehic
le [k
g]
Fig. 3 Vehicle weight depending on the range in kWh, range values based on different drivingcycles, for passenger cars: NEDC combined
Small Electric Vehicles—Benefits and Drawbacks … 9
4.3 Safety as a Large Drawback
Although the reduced size and weight bring many benefits for the user, munici-palities, and the environment, they have a higher safety risk to occupants, especiallyin the event of a collision with larger vehicles. This is reflected by the results of thequantitative survey, where concern about more unsafe vehicles on the road is thesecond leading obstacle for SEVs in the opinion of the participants. In this case,occupants of the vehicle with the lowest mass sustain the highest damage [7].Besides disadvantages for lightweight vehicles due to physical laws that determineaccident dynamics of collisions with unequal opponents, safety features of bothlightweight and heavy vehicles influence the extent of lesions in case of a collision.
On the one hand, SEVs are not equipped with extensive safety equipment due tothe necessity of lightweight design and cost. In many countries and also accordingto EU regulations, crash tests for SEVs are not required by law. Therefore, thevehicles are equipped with minimal safety features [19]. Besides the lack ofmandatory crash tests, there are safety requirements that are laid down in EURegulation No. 168/2013 and the delegated EU Regulation No. 3/2014.
On the other hand, safety structures of heavy cars are not optimized for collisionswith very lightweight vehicles and usually relatively rigid. Deformation of struc-tures that would reduce impact forces by transforming kinetic energy into defor-mation energy is therefore limited. This cannot be compensated by structures ofSEVs and thus leads to high deceleration of occupants in the lightweight vehicle,causing more severe injuries. High speeds of passenger cars add to the risks in caseof an accident.
Extended safety features like airbags as standard equipment, improvement ofvehicle structures and active safety features like emergency brake assistants could
Fig. 4 Land use of different vehicle models
10 A. Ewert et al.
enhance safety of SEVs. Even more than technological measures, regulation couldimprove the situation for SEV occupants. When both SEVs and fast, heavy cars aremixed in high speed traffic, the safety risk is higher. The reduction of the maximumspeed allowed, e.g., in inner-urban areas or city highways, would improve thesituation. This would not only protect SEV occupants, but also vulnerable roadusers like mopeds, bicycles, or pedestrians. Scientific investigations show a directlink between reduction in average speed and decrease in accident numbers andcrash severity, e.g., [20–23]. The extent of safety increase varies depending oninitial speed and further parameters like infrastructure characteristics. For urbanroads, speeding is one key factor in traffic accidents with impacts on both frequencyof crashes and severity of injuries [24].
Safety issues of transport modes like bicycles and mopeds are more severecompared to SEVs; however, in contrast to SEVs, they are sold and used in largevolumes. It is common consent that safety could be increased by optimized trafficregulation and infrastructural measures rather than with enhanced safety structuresof these kinds of vehicles. This is similar for SEVs, even though the safety potentialof vehicle technology is considerably higher and should therefore be furtherdeveloped additional to regulative and infrastructural measures.
4.4 Costs of SEVs
The aspect of costs, in particular with regard to the purchase price, was discusseddiversely in the qualitative analysis. In a comparison of costs, it is always veryimportant to distinguish between the different types of vehicles. For example, thecost of owning or buying an SEV to offer in a sharing business is very highcompared to e-scooters, bicycles, and some second-hand cars. Particularly incomparison with lower-priced cars, the purchase price can have a negative effect onthe purchase decision, as SEVs often appear expensive with regard to limitedflexibility in the transport of people and goods. However, compared to new cars,especially BEVs, they are relatively less expensive (Fig. 5).
For manufactures, the production costs for small series vehicles are significantlymore expensive than mass production. However, in order to offer a vehicle to abroader user group, an attractive price is necessary. Manufacturers are thereforeoften faced with a dilemma. For example, by setting higher safety standards, theycould offer a safer and high-quality product, but would have to set the selling pricevery high. For large companies developing a model for a small series vehicle in theirportfolio often does not make sense as the economic risk is too high to invest in.
In the qualitative analysis, it became clear that the current situation is notfavorable for SEVs in many countries, i.e., high speed limits in cities, no advan-tages in regards to parking or use of lanes, few incentives, few models on themarket. In comparison with cars for many people, this leaves SEVs with fewrewards to people considering them as relatively expensive.
Small Electric Vehicles—Benefits and Drawbacks … 11
5 Vision of SEVs
Increasing the number of SEVs on the road, certain risks remain in the opinion ofmany experts. Thus, in the current traffic environment and with their lack ofminimum safety requirements, they might pose some safety risks. Furthermore, achange in the mind set of how people move is needed in order to achieve that thesevehicles are regarded as an equal vehicle concept for everyday mobility. Otherwise,SEVs tend to be considered at most as an additional vehicle, which makes thevehicle price appear very high. Overall, however, SEVs offer great potential forsustainable change, especially in urban areas. Scaling down weight and size of largeand heavy cars has a high impact as they consume less energy and show potential toreduce space used in cities. In order to provide benefits for these vehicles to becomemore widely used measures including push and pull elements with the objective ofreplacing passenger cars with SEVs are of high importance.
As an exemplary visualization of the positive potential of SEVs for urbanplanning, Fig. 6 shows a vision of how urban transport could look like with SEVs.This vision is derived from statements made in the expert interviews as well as fromliterature research. In light of future urban landscapes especially land distributioncould be modeled differently with, e.g., smaller sized parking lots, if SEVs wouldreplace considerable numbers of passenger cars. The car would not be the dominantpart which allows people-oriented city planning, creating more attractive
BMW i3
KIA e-SoulNissan Leaf
Smart fortwo
Renault Zoe
VW Golf
Renault Twizy (45)
Aixam e City Pack
Microlino Renault Twizy (80)
Tazzari Zero
0
5000
10000
15000
20000
25000
30000
35000
40000
45000
Purc
hase
pric
e
Fig. 5 Purchase prices of the top five new registrations of EV models in Germany 2018 [25],(Smart fortwo includes EQ fortwo coupe and fortwo coupe ed) and purchase price of commonSEV models, Renault Twizy and ZOE purchase price calculated with battery rent for 8 years,estimated purchase price for Microlino
12 A. Ewert et al.

surroundings with higher living standards. The introduction of SEVs into themobility mix offers a high degree of diversification. The wider the range of mobilitysolutions available, the better the overall transport system can develop and har-monize with requirements of inhabitants. Therefore, SEVs can be used either asprivate passenger cars or within sharing schemes.
References
1. International Energy Agency: Global EV Outlook 2019: Scaling-up the transition to electricmobility. OECD (2019)
2. ACEM: Motorcycle, moped and quadricycle registrations in the European Union—2010–2018. Available https://www.acem.eu/market-data (2019). Accessed 8 March 2019
3. Hurst, D., Wheelock, C.: Neighborhood Electric Vehicles—Low-Speed Electric Vehicles forConsumer and Fleet Markets. PikeResearch, Boulder, Colorado, Research Report (2011)
4. Meuser, M., Nagel, U.: Das Experteninterview—konzeptionelle Grundlagen und methodischeAnlage. In: Pickel, S., Pickel, G., Lauth, H.-J., Jahn, D. (eds.) Methoden der vergleichendenPolitik- und Sozialwissenschaft, pp. 465–479. VS Verlag für Sozialwissenschaften,Wiesbaden (2009)
Fig. 6 Vision for SEVs in urban areas
Small Electric Vehicles—Benefits and Drawbacks … 13
5. Ewert, A., Brost, M.K., Schmid, S.A.: Framework Conditions and Potential Measures forsmall electric vehicles on a Municipal Level. WEVJ 11(1), 1 (2020). https://doi.org/10.3390/wevj11010001
6. Baur, N., Blasius, J. (eds.): Handbuch Methoden der empirischen Sozialforschung.Springer VS, Wiesbaden (2014)
7. Honey, E., Lee, H., Suh, I.-S.: Future urban transportation technologies for sustainability withan emphasis on growing mega cities: a strategic proposal on introducing a new micro electricvehicle statement. WTR 3, p. 13 (2014). https://doi.org/10.7165/wtr2014.3.3.139
8. European Parliament and European Council: Regulation (EU) No 168/2013 (2013)9. National Highway Traffic Safety Administration (NHTSA): 49 CFR 571—Federal Motor
Vehicle Standards (2004)10. Fraunhofer, I.A.O.: Standortanalyse Japan. Automobilindustrie und zukünftige
Mobilitätsinnovationen. e-mobil BW GmbH—Landesagentur für neue Mobilitätslösungenund Automotive Baden-Württemberg. Available https://www.e-mobilbw.de/files/e-mobil/content/DE/Publikationen/PDF/PDF_2018/18020_Studie-Standortanalyse-Japan_RZ-Web.pdf (2018). Accessed 13 March 2018
11. Morche, D., Schmitt, F., Genuit, K., Elsen, O., Kampker, A., Friedrich, B.:Fahrzeugkonzeption für die Elektromobilität. In: Kampker, A., Vallée, D., Schnettler, A.(eds.) Elektromobilität, pp. 149–234. Springer, Berlin, Heidelberg (2013)
12. European Commission: 2007/46/EC, p. 160 (2007)13. Santucci, M., Pieve, M., Pierini, M.: Electric L-category vehicles for smart urban mobility.
Transp. Res. Part F: Traffic Psychol. Behav. 14, 3651–3660 (2016)14. BMW AG, The i3. https://www.bmw.de/de/neufahrzeuge/bmw-i/i3/2020/bmw-i3-ueberblick.
html (2020). Accessed 25 April 201615. Thomas, J: Renault Twizy im Test: Ein Elektroauto macht Ernst. In: Auto Motor Und Sport,
25 July 2012. https://www.auto-motor-und-sport.de/test/renault-twizy-im-test-ein-elektroauto-macht-ernst/. Accessed 09 May 2018
16. infas Institut für angewandte Sozialwissenschaft GmbH, Mobilität in Deutschland. Kurzreport.Verkehrsaufkommen - Struktur - Trends, Bonn, Ausgabe September 2019. Available http://www.mobilitaet-in-deutschland.de/pdf/infas_Mobilitaet_in_Deutschland_2017_Kurzreport.pdf(2019). Accessed 9 Oct 2019
17. Statistisches Bundesamt, “Mikrozensus - Fragen zur Gesundheit 2017. Available https://www.destatis.de/DE/Themen/Gesellschaft-Umwelt/Gesundheit/Gesundheitszustand-Relevantes-Verhalten/Publikationen/Downloads-Gesundheitszustand/koerpermasse-5239003179004.pdf?__blob=publicationFile (2018)
18. Destatis, Bodenfläche nach Art der tatsächlichen Nutzung. Fachserie 3 Reihe 5.1 (2019)19. Pavlovic, A., Fragassa, C.: General considerations on regulations and safety requirements for
quadricycles. Int. J. Qual. Res. 9(4), 657–674 (2015)20. International Transport Forum: Speed and Crash Risk. Available https://www.itf-oecd.org/
sites/default/files/docs/speed-crash-risk.pdf (2018). Accessed 06 May 202021. Nilsson, G.: Traffic Safety Dimensions and the Power Model to Describe the Effect of Speed
on Safety. Lund University (2004)22. Taylor, M., Lynam, D.A., Baruya, A.: The effect of drivers’ speed on the frequency of
accidents. Transport Research Laboratory, Crowthome, TRL Report TRL421 (2000)23. Gitelman, V., Doveh, E., Bekhor, S.: The relationship between free-flow travel speeds,
infrastructure characteristics and accidents, on single-carriageway roads. Presented at theWorld Conference on Transport Research—WTCR 2016, Shanghai. https://doi.org/10.1016/j.trpro.2017.05.398 (2017)
14 A. Ewert et al.
24. Branzi, V., Domenichini, L., La Torre, F.: Drivers’ speed behaviour in real and simulatedurban roads—A validation study. Transp. Res. Part F: Traffic Psychol. Behav. 49, 1–17(2017). https://doi.org/10.1016/j.trf.2017.06.001
25. Kraftfahrt-Bundesamt, Neuzulassungen von Kraftfahrzeugen und Kraftfahrzeuganhängernnach Herstellern und Handelsnamen, Jahr 2018 (FZ 4). https://www.kba.de/DE/Statistik/Fahrzeuge/Neuzulassungen/MarkenHersteller/n_markenHersteller_inhalt.html?nn=2601598(2019). Accessed 12 July 2020
Open Access This chapter is licensed under the terms of the Creative Commons Attribution 4.0International License (http://creativecommons.org/licenses/by/4.0/), which permits use, sharing,adaptation, distribution and reproduction in any medium or format, as long as you give appropriatecredit to the original author(s) and the source, provide a link to the Creative Commons license andindicate if changes were made.The images or other third party material in this chapter are included in the chapter’s Creative
Commons license, unless indicated otherwise in a credit line to the material. If material is notincluded in the chapter’s Creative Commons license and your intended use is not permitted bystatutory regulation or exceeds the permitted use, you will need to obtain permission directly fromthe copyright holder.
Small Electric Vehicles—Benefits and Drawbacks … 15
Courses of Action for Improvingthe Safety of the Powered Cycle
Luc Vinckx and Huw Davies
Abstract This paper explores the possibility to include a number of safety featuresfrom passenger cars in powered cycles with three or four wheels, whilst complyingwith the legal definitions and requirements, and also the legal conditions to use thebicycle lanes. The differences between technical specifications contained within EUlaw for pedal cycle with pedal assistance, powered cycles, quadricycles and pas-senger cars will be explained. Further, examples of traffic code rules with respect tothe use of bicycle lanes in different countries will be discussed. Finally, the need fornew safety criteria for powered cycles, replacing the existing power limit, ishighlighted. In addition to the above, the need for a different technical approach todeal with the stability of 1 m wide e-bikes with a vehicle height similar to amainstream passenger car will be discussed.
Keywords Safety � Regulation � Powered cycle
1 How to Increase Bicycle Use and at the Same TimeReduce Casualties and Injuries Resulting from BicycleAccidents
A modal shift from passenger cars to the increased use of bicycles, e-bikes andpowered cycles will help to improve air quality and at the same time reducecongestion resulting from passenger car use. The provision of a dedicated infras-tructure, for example bicycle lanes, has an important role to play in this evolution.However, even with aggressive growth in infrastructure provision, it is likely that
L. Vinckx (&)Elephant Consult BVBA, Olmenstraat 31/1, 3080 Tervuren, Belgiume-mail: [email protected]
H. DaviesAutomotive Systems Engineering, Research Institute for Future Transport and Cities,Coventry University, Coventry, UKe-mail: [email protected]
© The Author(s) 2021A. Ewert et al. (eds.), Small Electric Vehicles,https://doi.org/10.1007/978-3-030-65843-4_2
17
there will be no dedicated bicycle lane for part of a given trip. On one hand, suchsituations lead to the so-called “black spots”, where there is an increase in conflictwith other road users that would result in accidents with the potential for higherinjury outcome (e.g. collisions with passenger cars). On the other hand, a number oftravellers, upon realising this situation and in order to avoid the risk, prefer to usetheir car for the entire trip. If a modal shift away from passenger cars is to berealised, then there is need to respond to these safety concerns.
At present, road safety policy—the courses of action, regulatory measures, laws,etc.—is restrictive in terms of providing appropriate solutions to the above prob-lems. In this paper, a simple solution is proposed that will support OEMs to includea number of safety features from passenger cars in powered cycles with three orfour wheels, whilst complying with the legal definitions and requirements, and alsothe legal conditions to use bicycle lanes. This further leverages the existingopportunity for powered cycles with three or four wheels to be driven on bicyclelanes and provides a similar safety level as other vehicle types (quadricycles, tri-cycles, passenger cars) allowing them to safely use existing road space used bypassenger cars.
This paper is structured as follows: Sect. 2 discusses the present EU system ofvehicle classification, highlighting the difference between passenger car classifi-cation and the classification of lightweight vehicles (L-category and assisted pedalcycles). Section 3 summarises the present situation regarding access to dedicatebicycle infrastructure across a number of EU member-states. Section 4 bringstogether vehicle classification and infrastructure access requirements to develop anew proposal that would support the goal of modal shift from passenger cars.Section 5 then concludes.
2 EU Classification of Vehicles
The EU Regulation 168/2013 [1] defines two different types of vehicles with pedalsand a small electric motor. These are highlighted below:
• ‘Pedal cycles with pedal assistance’ which are equipped with an auxiliaryelectric motor having a maximum continuous rated power of less than or equalto 250 W, where the output of the motor is cut off when the cyclist stopspedalling and is otherwise progressively reduced and finally cut off before thevehicle speed reaches 25 km/h;
• ‘Powered cycle (L1e-A)’ as a vehicle designed to pedal, equipped with anauxiliary propulsion with the primary aim to aid pedalling with a maximumpower of 1 kW and a maximum width of 1 m. The output of the auxiliarypropulsion is cut off at a vehicle speed � 25 km/h.
The pedal cycle with pedal assistance is excluded from vehicle type approvalaccording to (EU) 168/2013, but it is subject to the machinery directive 2006/42/EC
18 L. Vinckx and H. Davies
[2]. Compliance with the objectives of the machinery directive can be provenby complying with a number of EN standards. The powered cycle is subject toEuropean type approval laid down in (EU) 168/2013 and a number of “delegatedacts”. Further, to the above, both the ‘pedal cycles with pedal assistance’ and the‘powered cycle’ can have two, three or four wheels.
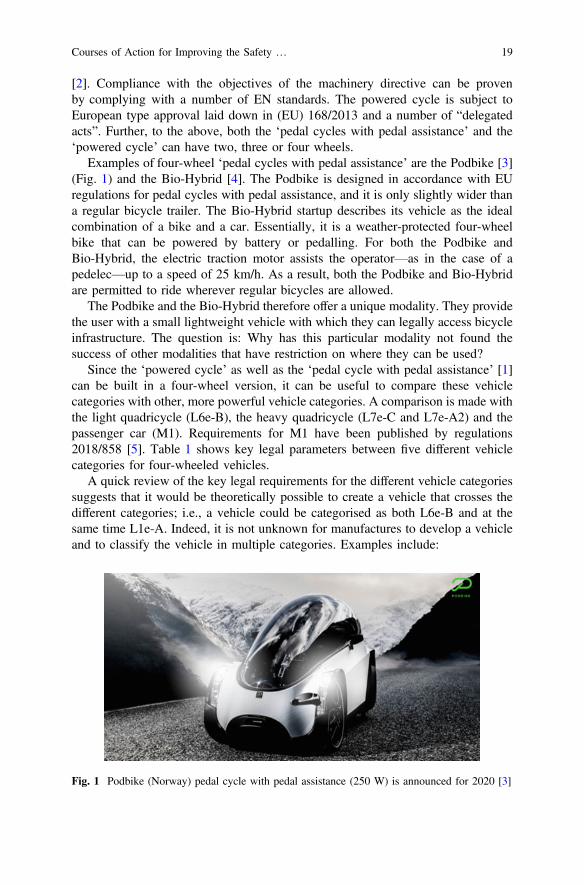
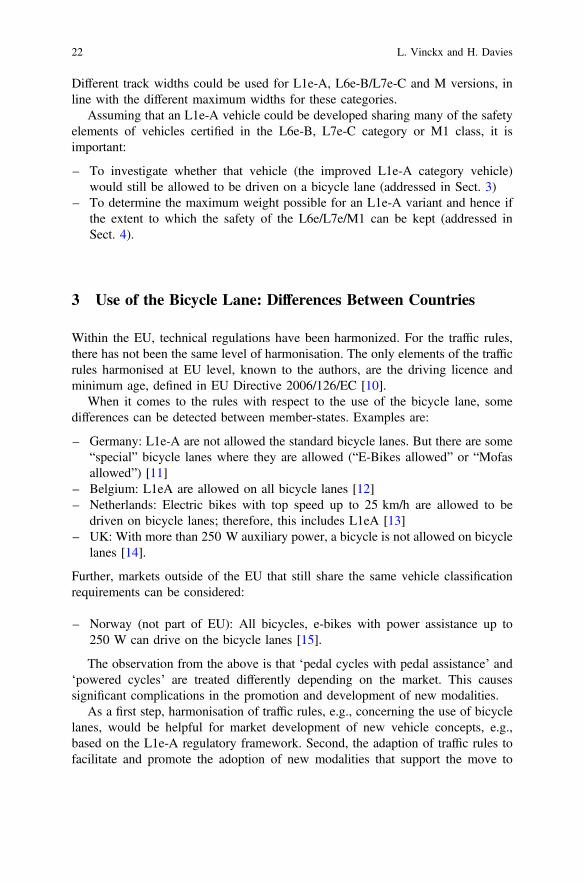
Examples of four-wheel ‘pedal cycles with pedal assistance’ are the Podbike [3](Fig. 1) and the Bio-Hybrid [4]. The Podbike is designed in accordance with EUregulations for pedal cycles with pedal assistance, and it is only slightly wider thana regular bicycle trailer. The Bio-Hybrid startup describes its vehicle as the idealcombination of a bike and a car. Essentially, it is a weather-protected four-wheelbike that can be powered by battery or pedalling. For both the Podbike andBio-Hybrid, the electric traction motor assists the operator—as in the case of apedelec—up to a speed of 25 km/h. As a result, both the Podbike and Bio-Hybridare permitted to ride wherever regular bicycles are allowed.
The Podbike and the Bio-Hybrid therefore offer a unique modality. They providethe user with a small lightweight vehicle with which they can legally access bicycleinfrastructure. The question is: Why has this particular modality not found thesuccess of other modalities that have restriction on where they can be used?
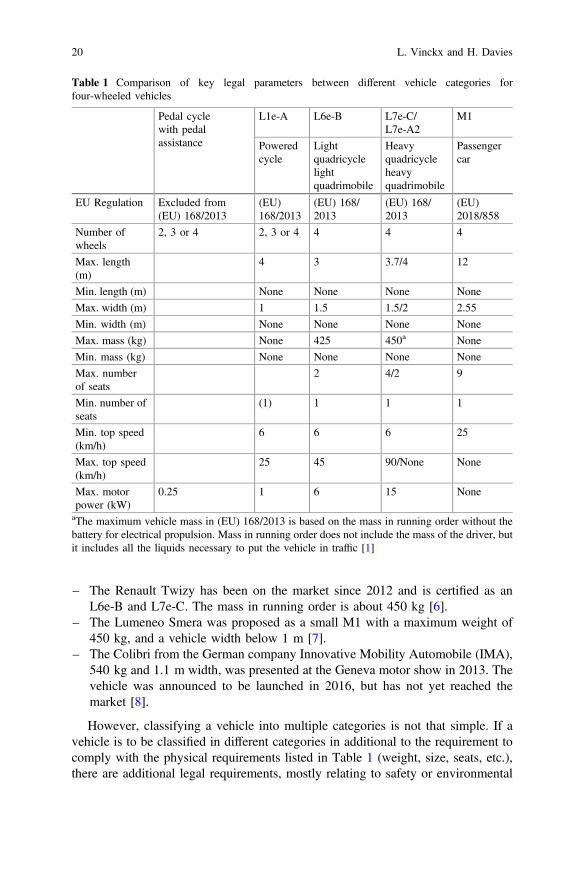
Since the ‘powered cycle’ as well as the ‘pedal cycle with pedal assistance’ [1]can be built in a four-wheel version, it can be useful to compare these vehiclecategories with other, more powerful vehicle categories. A comparison is made withthe light quadricycle (L6e-B), the heavy quadricycle (L7e-C and L7e-A2) and thepassenger car (M1). Requirements for M1 have been published by regulations2018/858 [5]. Table 1 shows key legal parameters between five different vehiclecategories for four-wheeled vehicles.
A quick review of the key legal requirements for the different vehicle categoriessuggests that it would be theoretically possible to create a vehicle that crosses thedifferent categories; i.e., a vehicle could be categorised as both L6e-B and at thesame time L1e-A. Indeed, it is not unknown for manufactures to develop a vehicleand to classify the vehicle in multiple categories. Examples include:
Fig. 1 Podbike (Norway) pedal cycle with pedal assistance (250 W) is announced for 2020 [3]
Courses of Action for Improving the Safety … 19
– The Renault Twizy has been on the market since 2012 and is certified as anL6e-B and L7e-C. The mass in running order is about 450 kg [6].
– The Lumeneo Smera was proposed as a small M1 with a maximum weight of450 kg, and a vehicle width below 1 m [7].
– The Colibri from the German company Innovative Mobility Automobile (IMA),540 kg and 1.1 m width, was presented at the Geneva motor show in 2013. Thevehicle was announced to be launched in 2016, but has not yet reached themarket [8].
However, classifying a vehicle into multiple categories is not that simple. If avehicle is to be classified in different categories in additional to the requirement tocomply with the physical requirements listed in Table 1 (weight, size, seats, etc.),there are additional legal requirements, mostly relating to safety or environmental
Table 1 Comparison of key legal parameters between different vehicle categories forfour-wheeled vehicles
Pedal cyclewith pedalassistance
L1e-A L6e-B L7e-C/L7e-A2
M1
Poweredcycle
Lightquadricyclelightquadrimobile
Heavyquadricycleheavyquadrimobile
Passengercar
EU Regulation Excluded from(EU) 168/2013
(EU)168/2013
(EU) 168/2013
(EU) 168/2013
(EU)2018/858
Number ofwheels
2, 3 or 4 2, 3 or 4 4 4 4
Max. length(m)
4 3 3.7/4 12
Min. length (m) None None None None
Max. width (m) 1 1.5 1.5/2 2.55
Min. width (m) None None None None
Max. mass (kg) None 425 450a None
Min. mass (kg) None None None None
Max. numberof seats
2 4/2 9
Min. number ofseats
(1) 1 1 1
Min. top speed(km/h)
6 6 6 25
Max. top speed(km/h)
25 45 90/None None
Max. motorpower (kW)
0.25 1 6 15 None
aThe maximum vehicle mass in (EU) 168/2013 is based on the mass in running order without thebattery for electrical propulsion. Mass in running order does not include the mass of the driver, butit includes all the liquids necessary to put the vehicle in traffic [1]
20 L. Vinckx and H. Davies
performance. For classification as M1, a vehicle needs to be certified, according toUN ECE Regulation 94 on “protection of the occupants in the event of a frontalcollision”, UN ECE Regulation 95 on “the protection of the occupants in the eventof a lateral collision” and UN ECE Regulation 127 on “pedestrian safety perfor-mance”. These three regulations are considered as “defining” a vehicle platform.This means that if an existing vehicle is not compliant with the three regulations, itis almost impossible to adapt the existing platform accordingly. In this regard, itseems difficult to comply with these regulations for vehicles respecting the maxi-mum weight for the L6e-B and L7e-C categories, especially for two-seaters in theside-by-side format, with standard side doors and a roof.
For reasons of completeness, it has to be mentioned that one-seater vehicleswithout a roof or standards side doors (with vertical hinges) can be certified as L6e,L7e and M1. However, even as an L-category vehicle (L6e and L7e) considerationof crashworthiness is an essential for success in the market place—for example, anumber of OEMs in the L6e and L7e market space subject their product on avoluntary basis to crash testing to provide confidence to the consumer [9].
Many other regulations apply on a mandatory basis to the different vehiclecategories mentioned in this article, but they do not impact the basic mechanicalstructure of the vehicle platform. Of course, they might add weight and thereforeadding or mandating these technologies might lead to a non-compliance of themaximum weight for L6e-B and L7e-C.
The requirement to consider crashworthiness has a penalty in terms of vehiclemass. Energy absorbing structures, safety equipment and the need to design avehicle to include crush space all increase vehicle mass. Further, the inclusion ofcrashworthiness considerations in light and heavy quadricycles leads to a require-ment for higher motor power in order to overcome the increase in mass.
The Renault Twizy, Lumeneo Smera and Colibri represent market acceptablesolutions in the light and heavy quadricycle categories. The Podbike and SchaefflerBio-Hybrid represent solutions in the ‘pedal cycles with pedal assistance’ category.When looking at these five vehicles or prototypes, belonging to two different“families”, it appears that a common bodywork, with a width not more than 1 mcould be used in both groups. For the L1e-A, the overall maximum width is 1 m,for L6e-B and L7e-C the maximum width is 1.5 m and for M1 the maximum widthis 2.55 m.
From the argumentation above, it becomes clear that a car based on an e-bikepowertrain is possible.
The concern is that three- or four-wheel e-bikes are not yet being promoted asvehicles allowed to be used on bicycle lanes. This could be seen as a new modality:They can use bicycle lanes wherever present, but are forced to use the car laneswhen there is no bicycle lane. The latter is a concern to users and can be a reason fornot using a bike, but a car. A solution would be to include the safety elements of thelight and heavy quadricycles in an L1e-A vehicle. It is possible to develop a familyof vehicles, using the same bodywork with a maximum width of one metre.Different variants of this vehicle could be certified in different vehicle classes.
Courses of Action for Improving the Safety … 21
Different track widths could be used for L1e-A, L6e-B/L7e-C and M versions, inline with the different maximum widths for these categories.
Assuming that an L1e-A vehicle could be developed sharing many of the safetyelements of vehicles certified in the L6e-B, L7e-C category or M1 class, it isimportant:
– To investigate whether that vehicle (the improved L1e-A category vehicle)would still be allowed to be driven on a bicycle lane (addressed in Sect. 3)
– To determine the maximum weight possible for an L1e-A variant and hence ifthe extent to which the safety of the L6e/L7e/M1 can be kept (addressed inSect. 4).
3 Use of the Bicycle Lane: Differences Between Countries
Within the EU, technical regulations have been harmonized. For the traffic rules,there has not been the same level of harmonisation. The only elements of the trafficrules harmonised at EU level, known to the authors, are the driving licence andminimum age, defined in EU Directive 2006/126/EC [10].
When it comes to the rules with respect to the use of the bicycle lane, somedifferences can be detected between member-states. Examples are:
– Germany: L1e-A are not allowed the standard bicycle lanes. But there are some“special” bicycle lanes where they are allowed (“E-Bikes allowed” or “Mofasallowed”) [11]
– Belgium: L1eA are allowed on all bicycle lanes [12]– Netherlands: Electric bikes with top speed up to 25 km/h are allowed to be
driven on bicycle lanes; therefore, this includes L1eA [13]– UK: With more than 250 W auxiliary power, a bicycle is not allowed on bicycle
lanes [14].
Further, markets outside of the EU that still share the same vehicle classificationrequirements can be considered:
– Norway (not part of EU): All bicycles, e-bikes with power assistance up to250 W can drive on the bicycle lanes [15].
The observation from the above is that ‘pedal cycles with pedal assistance’ and‘powered cycles’ are treated differently depending on the market. This causessignificant complications in the promotion and development of new modalities.
As a first step, harmonisation of traffic rules, e.g., concerning the use of bicyclelanes, would be helpful for market development of new vehicle concepts, e.g.,based on the L1e-A regulatory framework. Second, the adaption of traffic rules tofacilitate and promote the adoption of new modalities that support the move to
22 L. Vinckx and H. Davies
cleaner and more sustainability mobility would be beneficial. At this point, thequestion arises how these requirements/rules should look like.
4 Calculation of the Maximum Mass of a Powered Cycle
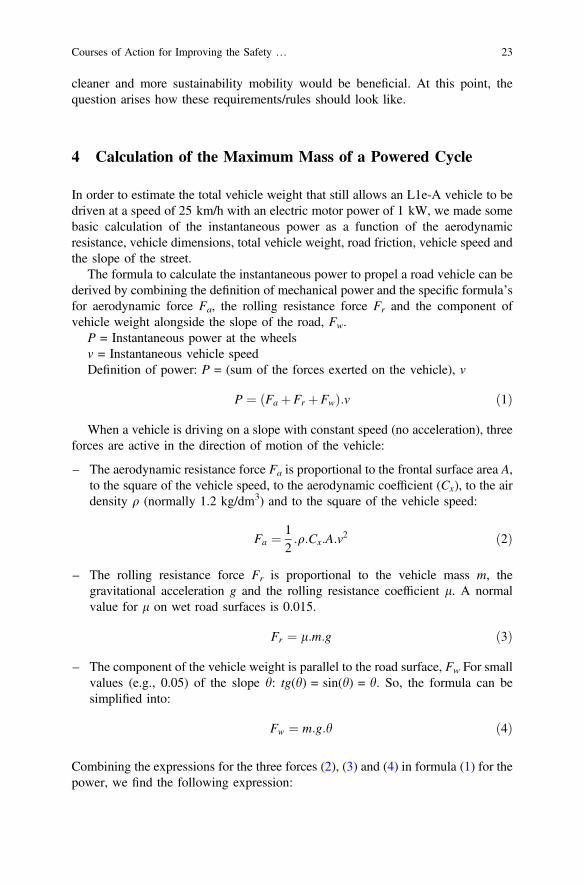
In order to estimate the total vehicle weight that still allows an L1e-A vehicle to bedriven at a speed of 25 km/h with an electric motor power of 1 kW, we made somebasic calculation of the instantaneous power as a function of the aerodynamicresistance, vehicle dimensions, total vehicle weight, road friction, vehicle speed andthe slope of the street.
The formula to calculate the instantaneous power to propel a road vehicle can bederived by combining the definition of mechanical power and the specific formula’sfor aerodynamic force Fa, the rolling resistance force Fr and the component ofvehicle weight alongside the slope of the road, Fw.
P = Instantaneous power at the wheelsv = Instantaneous vehicle speedDefinition of power: P = (sum of the forces exerted on the vehicle), v
P ¼ Fa þFr þFwð Þ:v ð1Þ
When a vehicle is driving on a slope with constant speed (no acceleration), threeforces are active in the direction of motion of the vehicle:
– The aerodynamic resistance force Fa is proportional to the frontal surface area A,to the square of the vehicle speed, to the aerodynamic coefficient (Cx), to the airdensity q (normally 1.2 kg/dm3) and to the square of the vehicle speed:
Fa ¼ 12:q:Cx:A:v
2 ð2Þ
– The rolling resistance force Fr is proportional to the vehicle mass m, thegravitational acceleration g and the rolling resistance coefficient l. A normalvalue for l on wet road surfaces is 0.015.
Fr ¼ l:m:g ð3Þ
– The component of the vehicle weight is parallel to the road surface, Fw For smallvalues (e.g., 0.05) of the slope h: tg(h) = sin(h) = h. So, the formula can besimplified into:
Fw ¼ m:g:h ð4Þ
Combining the expressions for the three forces (2), (3) and (4) in formula (1) for thepower, we find the following expression:
Courses of Action for Improving the Safety … 23

P ¼ Fa þFr þFwð Þ ¼ Fa ¼ 12:q:Cx:A:v
3 þ l:m:g:vþ h:m:g:v ð5Þ
Another way to write the formula could be:
P ¼ Pa þPr þPw ð6Þ
This formula reads as follows: The instantaneous mechanical power is the sum of:
– The power necessary to compensate the aerodynamic resistance,– plus the power necessary to compensate the rolling resistance,– plus the power to compensate the weight component in case of a slope.
The final power output of the electric motor needs to take into account the parasiticlosses in the powertrain. With p the parasitic losses and Pem the power of theelectric motor, our aim is:
P\ 1� pð Þ:Pem ð7Þ
This formula can be easily implemented in a spreadsheet. In Table 2, one particularset of input values is proposed. The calculation is done with a total mass of 500 kg,assuming that with this mass, sufficient safety technology can be integrated toguarantee a “safety level” similar to the quadricycles and small cars. The corre-sponding output results are given in Table 3. The output shows that the “heavy”version of the powered cycle L1e-A is able to drive at 25 km/h on a slope of 5%with a total mass of 550 kg.
The conclusion from the calculation: If a narrow vehicle (vehicle width <1 m)can be certified as an L6e, L7e or M1, the bodywork can be used as the basis for anL1e-A vehicle.
Table 2 Some reasonableestimates to calculate thepower need for an L1eA attop speed
Parameter Estimate Units
Vehicle speed v 7 m/s
25 km/h
Frontal surface A 1.5 m2
Aerodynamic coefficient Cx 0.4 –
Total mass (vehicle, passenger,luggage) m
550 kg
Rolling resistance l 0.015 –
Gravitational acceleration g 9.81 m/s2
Slope h 0.05 (rad)
Parasitic losses p 0.15 –
24 L. Vinckx and H. Davies
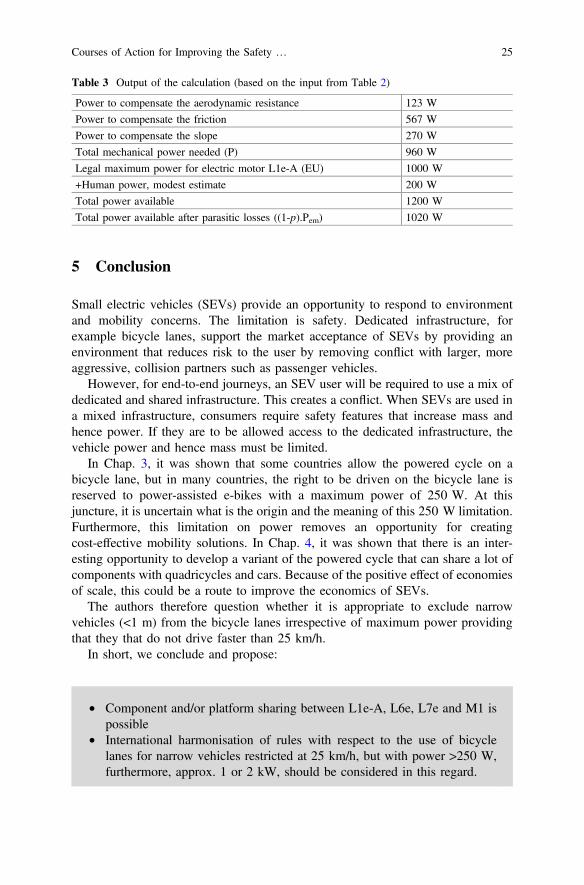
5 Conclusion
Small electric vehicles (SEVs) provide an opportunity to respond to environmentand mobility concerns. The limitation is safety. Dedicated infrastructure, forexample bicycle lanes, support the market acceptance of SEVs by providing anenvironment that reduces risk to the user by removing conflict with larger, moreaggressive, collision partners such as passenger vehicles.
However, for end-to-end journeys, an SEV user will be required to use a mix ofdedicated and shared infrastructure. This creates a conflict. When SEVs are used ina mixed infrastructure, consumers require safety features that increase mass andhence power. If they are to be allowed access to the dedicated infrastructure, thevehicle power and hence mass must be limited.
In Chap. 3, it was shown that some countries allow the powered cycle on abicycle lane, but in many countries, the right to be driven on the bicycle lane isreserved to power-assisted e-bikes with a maximum power of 250 W. At thisjuncture, it is uncertain what is the origin and the meaning of this 250 W limitation.Furthermore, this limitation on power removes an opportunity for creatingcost-effective mobility solutions. In Chap. 4, it was shown that there is an inter-esting opportunity to develop a variant of the powered cycle that can share a lot ofcomponents with quadricycles and cars. Because of the positive effect of economiesof scale, this could be a route to improve the economics of SEVs.
The authors therefore question whether it is appropriate to exclude narrowvehicles (<1 m) from the bicycle lanes irrespective of maximum power providingthat they that do not drive faster than 25 km/h.
In short, we conclude and propose:
• Component and/or platform sharing between L1e-A, L6e, L7e and M1 ispossible
• International harmonisation of rules with respect to the use of bicyclelanes for narrow vehicles restricted at 25 km/h, but with power >250 W,furthermore, approx. 1 or 2 kW, should be considered in this regard.
Table 3 Output of the calculation (based on the input from Table 2)
Power to compensate the aerodynamic resistance 123 W
Power to compensate the friction 567 W
Power to compensate the slope 270 W
Total mechanical power needed (P) 960 W
Legal maximum power for electric motor L1e-A (EU) 1000 W
+Human power, modest estimate 200 W
Total power available 1200 W
Total power available after parasitic losses ((1-p).Pem) 1020 W
Courses of Action for Improving the Safety … 25
• The power limit of 250 W as a safety criterion should be replaced by adifferent criterion. More research is needed to identify the need andeventually to develop such a criterion.
References
1. Regulation EU No 168/2013 of the European Parliament and of the Council of 15 January2013 on the approval and market surveillance of two- or three-wheel vehicles andquadricycle. Official Journal of the European Union, L60
2. Machinery Directive. Directive 2006/42/EC of European Parliament and of the Council of 17May 2006 on machinery, and amending Directive 95/16/EC (recast). Official Journal of theEuropean Union, L157
3. Forus Lab: Pre-Order Podbike for Delivery in Europe, https://www.podbike.com/en/pre-order-podbike-delivery-in-eu-and-eea/ (2020). Last accessed 1 Sept 2020
4. Schaeffler Bio-Hybrid GmbH: Schaeffler Bio-Hybrid GmbH with world premiere at CES2019. https://www.schaeffler.com/remotedocuments/en_2/_global/download_pdf_rtf/pdf/pressrelease_85726913.pdf (2018). Last accessed 1 Sept 2020
5. Regulation EU No 2018/858 of the European Parliament and of the Council of 30 May 2018on the approval and market surveillance of motor vehicles and their trailers and of systems,components and separate technical units intended for such vehicles, amending Regulations(EC) No 715/2007 and (EC) No 595/2009 and repealing Directive 2007/46/EC
6. Renault: https://www.renault.fr/vehicules-electriques/twizy.html. Last accessed 1 Sept 20207. Lumeneo Smera: https://www.avem.fr/actualite-la-lumeneo-smera-au-mondial-de-paris-2010-
1760.html. Last accessed 1 Sept 20208. Colibri, I.M.A.: https://ecosummit.net/uploads/eco13_151013_1620_thomasdelossantos_
innovativemobility.pdf. Last accessed 1 Sept 20209. Davies, H., Turrell, O.: Ped-elec: development of a new value chain approach to the provision
of an urban mobility solution. Paper presented at 32nd Electric Vehicle Symposium (EVS32)Lyon, France, May 19–22 (2019)
10. Directive 2006/126/EC of the European Parliament and of the Council of 20 december 2006on driving licences (Recast). Official Journal of the European Union, L403
11. § 39 Verkehrszeichen (Straßenverkehrs-Ordnung) v. 06.03.2013, BGBl. I, p. 367, https://dejure.org/gesetze/StVO/39.htm. Last accessed 1 Sept 2020
12. FOD Mobiliteit en Vervoer: FAQ elektrische fietsen. https://mobilit.belgium.be/nl/wegverkeer/wetgeving_en_reglementering/faq_elektrische_fietsen (2015). Last accessed 1Sept 2020
13. Visser A.: Onbekende categorie e-bikes met meer power. https://www.tweewieler.nl/elektrische-fietsen/nieuws/2018/02/elektrische-fietsen-met-hoog-motorvermogen-bezig-aan-opmars-10133805?_ga=2.17703609.1060690443.1598957087-1867613040.1598957087(2018). Last accessed 1 Sept 2020
14. UK Government: Electric bikes: licensing, tax and insurance. https://www.gov.uk/electric-bike-rules (2020). Last accessed 1 Sept 2020
15. Forskrift om krav til sykkel, 01.04.1990, https://lovdata.no/dokument/SF/forskrift/1990-02-19-119. Last accessed 1 Sept 2020
26 L. Vinckx and H. Davies

Open Access This chapter is licensed under the terms of the Creative Commons Attribution 4.0International License (http://creativecommons.org/licenses/by/4.0/), which permits use, sharing,adaptation, distribution and reproduction in any medium or format, as long as you give appropriatecredit to the original author(s) and the source, provide a link to the Creative Commons license andindicate if changes were made.The images or other third party material in this chapter are included in the chapter’s Creative
Commons license, unless indicated otherwise in a credit line to the material. If material is notincluded in the chapter’s Creative Commons license and your intended use is not permitted bystatutory regulation or exceeds the permitted use, you will need to obtain permission directly fromthe copyright holder.
Courses of Action for Improving the Safety … 27

Velomobiles and Urban Mobility:Opportunities and Challenges
Geoffrey Rose and Alex Liang
Abstract As the transport challenges facing urban areas intensify, innovativesolutions are required to address the social, economic and environmental impactsarising from overreliance on private motor vehicles. Velomobiles offer a range ofadvantages but do not feature on the radar screen of urban transport policy makers.This chapter explores the challenges and opportunities of increased adoption ofvelomobiles as an urban mobility option. A scan of existing velomobiles is used todefine typical characteristics of these vehicles and place them into perspectiveagainst relevant travel options before they are assessed in the context of typicalvehicle regulations and facility design guidelines. The opportunities and challengesassociated with greater adoption of velomobiles in the context of urban travel areexamined through the lenses of technology adoption and the sociotechnical framingof independent travel options. Shared mobility is identified as one potential way ofbroadening the base for velomobile adoption in urban areas.
Keywords HPV/human-powered vehicles � Velomobiles � Vehicle classification �Infrastructure design guidelines � Shared mobility
1 Introduction
As urban populations are growing in many cities, the pressure on urban transportsystems is intensifying. Those pressures are compounded by the reliance oncar-based mobility—the prevailing transport monoculture in many cities [1]. Theemphasis on in-active transport, and the inevitable traffic congestion and emissions,results in lower productivity and considerable negative external costs that are notdirectly born by users [2, 3]. Responses to these challenges within the transportindustry have presented opportunities for disruptive technologies. Disruptivetechnologies influence and add value to established markets, often displacing older
G. Rose (&) � A. LiangMonash Institute of Transport Studies, Monash University, Melbourne 3800, Australiae-mail: [email protected]
© The Author(s) 2021A. Ewert et al. (eds.), Small Electric Vehicles,https://doi.org/10.1007/978-3-030-65843-4_3
29
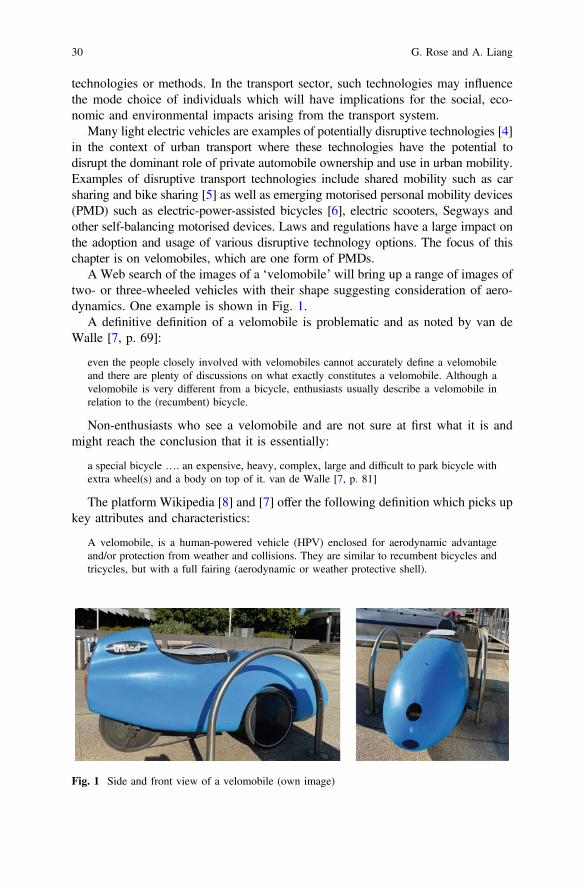
technologies or methods. In the transport sector, such technologies may influencethe mode choice of individuals which will have implications for the social, eco-nomic and environmental impacts arising from the transport system.
Many light electric vehicles are examples of potentially disruptive technologies [4]in the context of urban transport where these technologies have the potential todisrupt the dominant role of private automobile ownership and use in urban mobility.Examples of disruptive transport technologies include shared mobility such as carsharing and bike sharing [5] as well as emerging motorised personal mobility devices(PMD) such as electric-power-assisted bicycles [6], electric scooters, Segways andother self-balancing motorised devices. Laws and regulations have a large impact onthe adoption and usage of various disruptive technology options. The focus of thischapter is on velomobiles, which are one form of PMDs.
A Web search of the images of a ‘velomobile’ will bring up a range of images oftwo- or three-wheeled vehicles with their shape suggesting consideration of aero-dynamics. One example is shown in Fig. 1.
A definitive definition of a velomobile is problematic and as noted by van deWalle [7, p. 69]:
even the people closely involved with velomobiles cannot accurately define a velomobileand there are plenty of discussions on what exactly constitutes a velomobile. Although avelomobile is very different from a bicycle, enthusiasts usually describe a velomobile inrelation to the (recumbent) bicycle.
Non-enthusiasts who see a velomobile and are not sure at first what it is andmight reach the conclusion that it is essentially:
a special bicycle …. an expensive, heavy, complex, large and difficult to park bicycle withextra wheel(s) and a body on top of it. van de Walle [7, p. 81]
The platform Wikipedia [8] and [7] offer the following definition which picks upkey attributes and characteristics:
A velomobile, is a human-powered vehicle (HPV) enclosed for aerodynamic advantageand/or protection from weather and collisions. They are similar to recumbent bicycles andtricycles, but with a full fairing (aerodynamic or weather protective shell).
Fig. 1 Side and front view of a velomobile (own image)
30 G. Rose and A. Liang
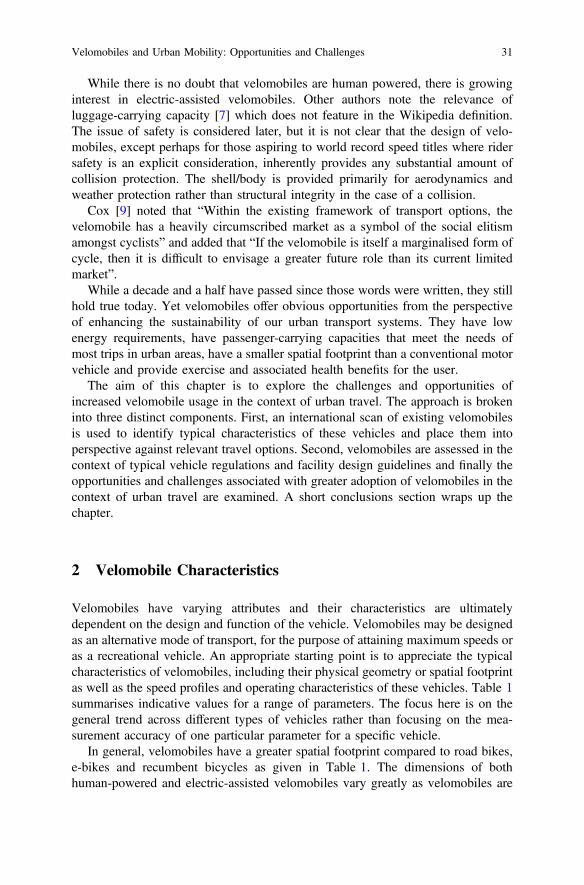
While there is no doubt that velomobiles are human powered, there is growinginterest in electric-assisted velomobiles. Other authors note the relevance ofluggage-carrying capacity [7] which does not feature in the Wikipedia definition.The issue of safety is considered later, but it is not clear that the design of velo-mobiles, except perhaps for those aspiring to world record speed titles where ridersafety is an explicit consideration, inherently provides any substantial amount ofcollision protection. The shell/body is provided primarily for aerodynamics andweather protection rather than structural integrity in the case of a collision.
Cox [9] noted that “Within the existing framework of transport options, thevelomobile has a heavily circumscribed market as a symbol of the social elitismamongst cyclists” and added that “If the velomobile is itself a marginalised form ofcycle, then it is difficult to envisage a greater future role than its current limitedmarket”.
While a decade and a half have passed since those words were written, they stillhold true today. Yet velomobiles offer obvious opportunities from the perspectiveof enhancing the sustainability of our urban transport systems. They have lowenergy requirements, have passenger-carrying capacities that meet the needs ofmost trips in urban areas, have a smaller spatial footprint than a conventional motorvehicle and provide exercise and associated health benefits for the user.
The aim of this chapter is to explore the challenges and opportunities ofincreased velomobile usage in the context of urban travel. The approach is brokeninto three distinct components. First, an international scan of existing velomobilesis used to identify typical characteristics of these vehicles and place them intoperspective against relevant travel options. Second, velomobiles are assessed in thecontext of typical vehicle regulations and facility design guidelines and finally theopportunities and challenges associated with greater adoption of velomobiles in thecontext of urban travel are examined. A short conclusions section wraps up thechapter.
2 Velomobile Characteristics
Velomobiles have varying attributes and their characteristics are ultimatelydependent on the design and function of the vehicle. Velomobiles may be designedas an alternative mode of transport, for the purpose of attaining maximum speeds oras a recreational vehicle. An appropriate starting point is to appreciate the typicalcharacteristics of velomobiles, including their physical geometry or spatial footprintas well as the speed profiles and operating characteristics of these vehicles. Table 1summarises indicative values for a range of parameters. The focus here is on thegeneral trend across different types of vehicles rather than focusing on the mea-surement accuracy of one particular parameter for a specific vehicle.
In general, velomobiles have a greater spatial footprint compared to road bikes,e-bikes and recumbent bicycles as given in Table 1. The dimensions of bothhuman-powered and electric-assisted velomobiles vary greatly as velomobiles are
Velomobiles and Urban Mobility: Opportunities and Challenges 31
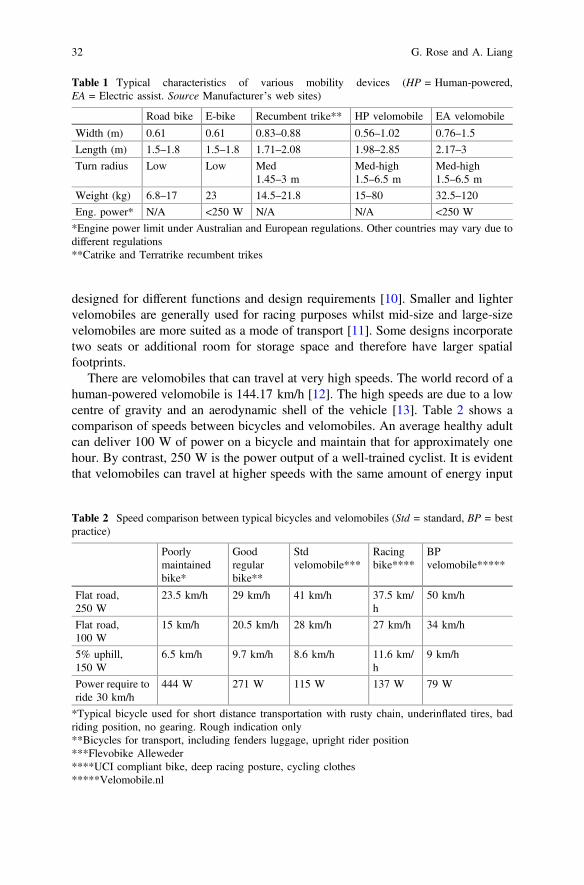
designed for different functions and design requirements [10]. Smaller and lightervelomobiles are generally used for racing purposes whilst mid-size and large-sizevelomobiles are more suited as a mode of transport [11]. Some designs incorporatetwo seats or additional room for storage space and therefore have larger spatialfootprints.
There are velomobiles that can travel at very high speeds. The world record of ahuman-powered velomobile is 144.17 km/h [12]. The high speeds are due to a lowcentre of gravity and an aerodynamic shell of the vehicle [13]. Table 2 shows acomparison of speeds between bicycles and velomobiles. An average healthy adultcan deliver 100 W of power on a bicycle and maintain that for approximately onehour. By contrast, 250 W is the power output of a well-trained cyclist. It is evidentthat velomobiles can travel at higher speeds with the same amount of energy input
Table 1 Typical characteristics of various mobility devices (HP = Human-powered,EA = Electric assist. Source Manufacturer’s web sites)
Road bike E-bike Recumbent trike** HP velomobile EA velomobile
Width (m) 0.61 0.61 0.83–0.88 0.56–1.02 0.76–1.5
Length (m) 1.5–1.8 1.5–1.8 1.71–2.08 1.98–2.85 2.17–3
Turn radius Low Low Med1.45–3 m
Med-high1.5–6.5 m
Med-high1.5–6.5 m
Weight (kg) 6.8–17 23 14.5–21.8 15–80 32.5–120
Eng. power* N/A <250 W N/A N/A <250 W
*Engine power limit under Australian and European regulations. Other countries may vary due todifferent regulations**Catrike and Terratrike recumbent trikes
Table 2 Speed comparison between typical bicycles and velomobiles (Std = standard, BP = bestpractice)
Poorlymaintainedbike*
Goodregularbike**
Stdvelomobile***
Racingbike****
BPvelomobile*****
Flat road,250 W
23.5 km/h 29 km/h 41 km/h 37.5 km/h
50 km/h
Flat road,100 W
15 km/h 20.5 km/h 28 km/h 27 km/h 34 km/h
5% uphill,150 W
6.5 km/h 9.7 km/h 8.6 km/h 11.6 km/h
9 km/h
Power require toride 30 km/h
444 W 271 W 115 W 137 W 79 W
*Typical bicycle used for short distance transportation with rusty chain, underinflated tires, badriding position, no gearing. Rough indication only**Bicycles for transport, including fenders luggage, upright rider position***Flevobike Alleweder****UCI compliant bike, deep racing posture, cycling clothes*****Velomobile.nl
32 G. Rose and A. Liang
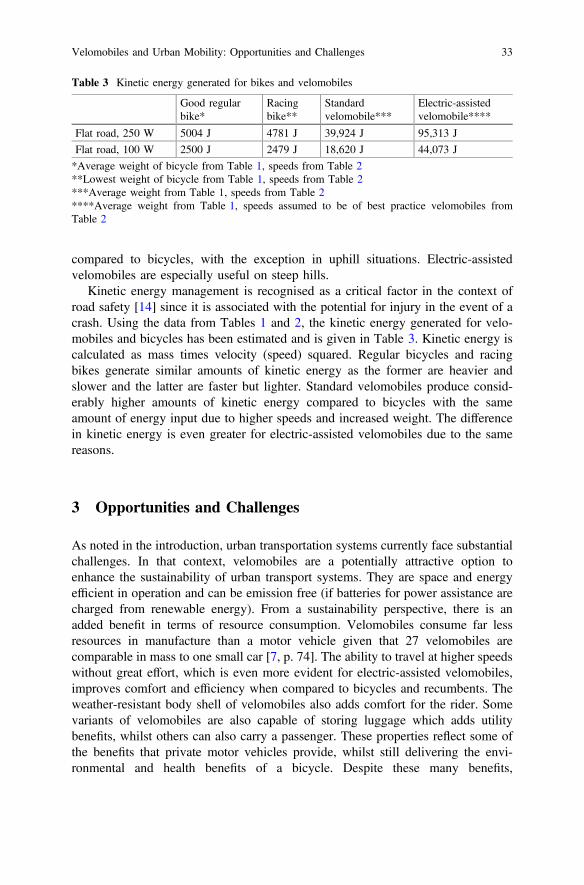
compared to bicycles, with the exception in uphill situations. Electric-assistedvelomobiles are especially useful on steep hills.
Kinetic energy management is recognised as a critical factor in the context ofroad safety [14] since it is associated with the potential for injury in the event of acrash. Using the data from Tables 1 and 2, the kinetic energy generated for velo-mobiles and bicycles has been estimated and is given in Table 3. Kinetic energy iscalculated as mass times velocity (speed) squared. Regular bicycles and racingbikes generate similar amounts of kinetic energy as the former are heavier andslower and the latter are faster but lighter. Standard velomobiles produce consid-erably higher amounts of kinetic energy compared to bicycles with the sameamount of energy input due to higher speeds and increased weight. The differencein kinetic energy is even greater for electric-assisted velomobiles due to the samereasons.
3 Opportunities and Challenges
As noted in the introduction, urban transportation systems currently face substantialchallenges. In that context, velomobiles are a potentially attractive option toenhance the sustainability of urban transport systems. They are space and energyefficient in operation and can be emission free (if batteries for power assistance arecharged from renewable energy). From a sustainability perspective, there is anadded benefit in terms of resource consumption. Velomobiles consume far lessresources in manufacture than a motor vehicle given that 27 velomobiles arecomparable in mass to one small car [7, p. 74]. The ability to travel at higher speedswithout great effort, which is even more evident for electric-assisted velomobiles,improves comfort and efficiency when compared to bicycles and recumbents. Theweather-resistant body shell of velomobiles also adds comfort for the rider. Somevariants of velomobiles are also capable of storing luggage which adds utilitybenefits, whilst others can also carry a passenger. These properties reflect some ofthe benefits that private motor vehicles provide, whilst still delivering the envi-ronmental and health benefits of a bicycle. Despite these many benefits,
Table 3 Kinetic energy generated for bikes and velomobiles
Good regularbike*
Racingbike**
Standardvelomobile***
Electric-assistedvelomobile****
Flat road, 250 W 5004 J 4781 J 39,924 J 95,313 J
Flat road, 100 W 2500 J 2479 J 18,620 J 44,073 J
*Average weight of bicycle from Table 1, speeds from Table 2**Lowest weight of bicycle from Table 1, speeds from Table 2***Average weight from Table 1, speeds from Table 2****Average weight from Table 1, speeds assumed to be of best practice velomobiles fromTable 2
Velomobiles and Urban Mobility: Opportunities and Challenges 33
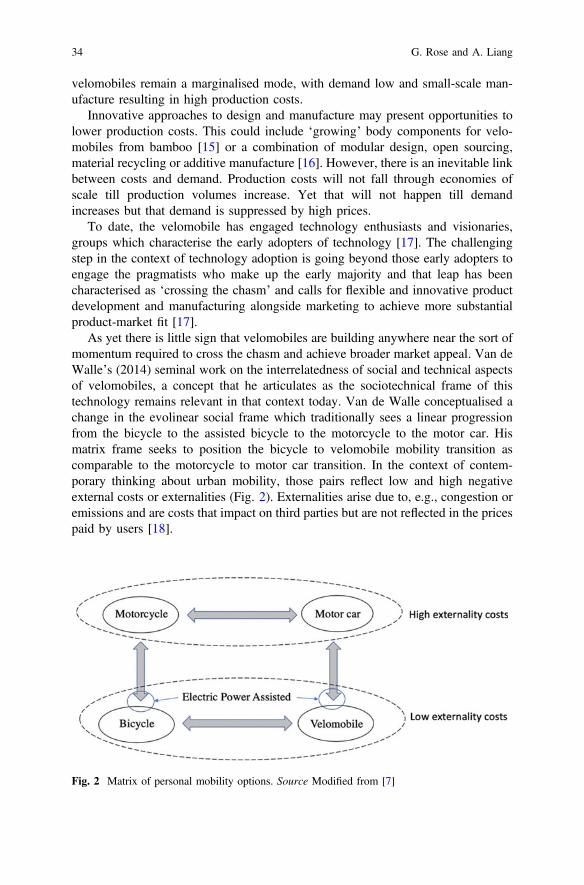
velomobiles remain a marginalised mode, with demand low and small-scale man-ufacture resulting in high production costs.
Innovative approaches to design and manufacture may present opportunities tolower production costs. This could include ‘growing’ body components for velo-mobiles from bamboo [15] or a combination of modular design, open sourcing,material recycling or additive manufacture [16]. However, there is an inevitable linkbetween costs and demand. Production costs will not fall through economies ofscale till production volumes increase. Yet that will not happen till demandincreases but that demand is suppressed by high prices.
To date, the velomobile has engaged technology enthusiasts and visionaries,groups which characterise the early adopters of technology [17]. The challengingstep in the context of technology adoption is going beyond those early adopters toengage the pragmatists who make up the early majority and that leap has beencharacterised as ‘crossing the chasm’ and calls for flexible and innovative productdevelopment and manufacturing alongside marketing to achieve more substantialproduct-market fit [17].
As yet there is little sign that velomobiles are building anywhere near the sort ofmomentum required to cross the chasm and achieve broader market appeal. Van deWalle’s (2014) seminal work on the interrelatedness of social and technical aspectsof velomobiles, a concept that he articulates as the sociotechnical frame of thistechnology remains relevant in that context today. Van de Walle conceptualised achange in the evolinear social frame which traditionally sees a linear progressionfrom the bicycle to the assisted bicycle to the motorcycle to the motor car. Hismatrix frame seeks to position the bicycle to velomobile mobility transition ascomparable to the motorcycle to motor car transition. In the context of contem-porary thinking about urban mobility, those pairs reflect low and high negativeexternal costs or externalities (Fig. 2). Externalities arise due to, e.g., congestion oremissions and are costs that impact on third parties but are not reflected in the pricespaid by users [18].
Fig. 2 Matrix of personal mobility options. Source Modified from [7]
34 G. Rose and A. Liang
One technology, which has made progress in crossing the chasm, is theelectric-power-assisted bicycle even though van de Walle’s assessment in 2004 wasnot optimistic:
practice tells us that the users of ‘assisted bicycles’ remain marginal actors to the bicyclesociotechnical frame. The assisted bicycle is in a similar process as the recumbent bicycle tobecome accepted as legitimate variant of a new bicycle sociotechnical frame, modified fromthe old established one that excluded the assisted bicycle. [7, pp. 72]
The electric-power-assisted bicycle, or e-bike, has grown substantially in marketshare in the last decade and a half [19] and is being viewed positively for theopportunities that it present to enhance urban transport options [6]. Concerns havebeen expressed about the impact on e-bikes on levels of physical activity. However,the results of recent research are very positive indicating substantial increases inphysical activity for users who switch from a car and limited net losses from thoseswitching from cycling because of increases in overall travel distance [20]. Whilstin some respects, the e-bike highlights that opportunities remain from mobilityoptions to gather traction, and there are other factors which are likely to act asbarriers to growth in velomobile adoption and use.
Velomobiles typically meet the regulations associated with bicycles orPedalelecs [21]. Consequently they face lower regulatory barriers than if theircharacteristics meant they were reclassified as quadricycles, mopeds or motorvehicles since they would therefore need to meet tighter design regulations. InAustralia, as in Europe, they are classified as bicycles so long as the auxiliary poweris less than 250 watts, and the maximum power-assisted speed is restricted to 25kph. However, velomobile riders would be required to wear a bicycle helmet inAustralia which is one jurisdiction that has mandatory helmet legislation. Eventhough some velomobiles can travel at high speeds, they would be forbidden fromoperating on urban freeways in many countries including Australia.
As velomobiles are classified as bicycles, the facility design guidelines thatapply to bicycles need careful consideration. Velomobiles are generally wider thanbicycles but can still fit in standard bicycle lanes and shared-use paths, although themanoeuvring space and lateral clearance is lower [22]. Cycling infrastructure istypically designed for bicycles which have a smaller spatial footprint compared tovelomobiles. Although it is legal to operate velomobiles in the same locations asbicycles, it may be difficult to move efficiently or safely due to their physicalcharacteristics and the existing infrastructure. A typical velomobile will fit in abicycle lane but the standard lateral clearance that is used for manoeuvring, which isprovided for regular bicycles, may not be adequate for velomobiles. Shared-usepaths allow individuals to travel in both directions which may be a concern becauseof the increased width of velomobiles. Existing infrastructure may not be adequateto cater for velomobiles overtaking other users of the shared-use path or the con-current use of a mixture velomobiles and bicycles.
Safety is also an important consideration since collisions may have seriousconsequences. Velomobiles are capable of travelling at higher speeds than bicyclesand with significantly less effort as given in Table 2. Hence, one potential barrier
Velomobiles and Urban Mobility: Opportunities and Challenges 35
for velomobiles is likely to be real or perceived issues with safety. Little is knownabout the safety performance of velomobiles although examination of single vehiclevelomobile crashes in Germany highlights speed as a contributing factor [23].
The weight of velomobiles is generally greater than bicycles and recumbents,particularly electric-assisted velomobiles. Speed and weight both influence theamount of kinetic energy which would need to be dissipated in the event of a crash.Managing the dissipation of kinetic energy in that case is critical in determining therisk of serious or fatal injuries [14, 24]. Crash rates are not solely a function ofhigher speed but rather increases in variances of speed [25], and hence, there couldbe greater concerns where there is a mix of users such as pedestrians, cyclists andvelomobile riders. The braking regulations for bicycles also apply to velomobilesbut may not be suitable due to the greater speeds of velomobiles. This raisespotential safety issues as velomobiles may need brakes to be of higher capabilitiesto ensure that the rider can stop in the event of an incident.
Since the existing infrastructure is geared towards bicycles, bicycle paths andshared-use paths which may be under designed for the speed and braking capa-bilities of velomobiles. Bicycles are able to make sharper turns as they have asmaller turn radius and travel at lower speeds. Velomobiles may require largercurve radii, and additional sight distance may need to be provided along shared-usepaths to create a safe environment for all users. Of course, this is dependent onwhere velomobiles are ridden and travel surveys do not currently provide insight inthat context because of the low incidence of velomobile use in the population. Theirclassification as bicycles means they can legally be ridden on bicycle facilities.However, incompatibilities can arise between their performance characteristics(e.g., maximum speeds) and the design characteristics of those facilities, forexample, in relation to the horizontal curve radii which are designed on theexpectation of lower maximum speeds.
One other area which may present a barrier to greater adoption relates to parking.While classified as bicycles, the larger spatial footprint of velomobiles makes themincompatible with common bicycle parking infrastructure. This is partially illus-trated by the example provided in Fig. 1 where the capacity of the bicycle parkinghoops is reduced by the parked velomobile. The suspension systems of velomobilescan be designed to facilitate vertical parking and storage [13] and that may presentother opportunities to overcome parking challenges.
The infrastructure issues raised above are potential barriers to use, but thechallenge of stimulating demand remains. Cox [9] highlighted the need to explorethe possibilities for sociable velomobiles to encourage adoption. Reflecting emer-gence of the shared economy, some commentators see shared mobility, such as carsharing and bike sharing [5], as one of the three pillars to underpin the transition toa sustainable transport system along with electrification and automation [1]. In thatcontext, the emergence of shared mobility options based on a velomobile may assistin helping this innovative form of urban mobility to gain momentum. One exampleis Veemo (Velometro Mobility), a one-way sharing network of three-wheeled,electric-assisted velomobiles being developed in Vancouver [26]. Veemo bringstogether a new vehicle with a shared vehicle mobility platform to offer a new option
36 G. Rose and A. Liang
in the context of shared mobility. Systems such as that may help to ‘normalise’velomobiles within the context of urban mobility. This is analogous to what sys-tems of shared electric scooters have done in cities around the world to normalisethis type of mobility option which has helped to stimulate private ownership ofe-scooters where users perceive that to be a regular part of their urban mobilitysystem. The emergence of shared velomobile systems may help to advance thenormalisation of velomobile technology in the context of urban travel.
4 Conclusion
Velomobiles have the potential to provide a mode choice alternative in urbanenvironments since they provide some of the benefits of both bicycles and motorvehicles. Human-powered and electric-assisted velomobiles have varying physicaland operational characteristics. In comparison with bicycles, they have a largerspatial footprint, can travel faster with less energy and are heavier. They have theadvantage of still being classified as bicycles (depending on their characteristics).Therefore, the same regulations and laws that apply to regular bicycles currentlyapply to velomobiles. There are many implications for velomobiles regardingexisting infrastructure and facility design guidelines as these are designed to caterfor the performance envelope of regular bicycles. High speeds and a larger spatialfootprint, combined with the lack of appropriate infrastructure, raise safety issuesboth on road and on shared-use paths. The challenge as new velomobile entre-preneurs emerge is determining whether the community and the transport profes-sion will continue to regard them in the same category as bicycles particularly whenthe spatial footprint makes them incompatible with many existing bicycle facilities.Current regulatory frameworks which are based on vehicle descriptions rather thanperformance-based standard present a risk for disruptive technologies like velo-mobiles. The short-term risk for even current velomobile developers is that regu-latory responses to other innovative modes may have unintended consequences forthe use of velomobiles by placing new restrictions on where and when current, butless common vehicles, are permitted to operate. The emergence of velomobiles asthe basis for systems of shared mobility may be a valuable stimulus for velomobileadoption. Shared-use systems could play a part in helping velomobile technologyto cross the chasm to wider adoption and emerge as a more mainstream urbantravel option.
Velomobiles and Urban Mobility: Opportunities and Challenges 37
References
1. Sperling, D., Gordon, D.: Two Billion Cars: Driving Towards Sustainability, p. 304. OxfordUniversity Press, New York (2009)
2. Barth, M., Boriboonsomsin, K.: Real-world carbon dioxide impacts of traffic congestion.Transp. Res. Record: J. Transp. Res. Board 2058(1), 163–171 (2008)
3. Weisbrod, G., Vary, D., Treyz, G.: Measuring economic costs of urban traffic congestion tobusiness. Transp. Res. Record: J. Transp. Res. Board 1839, 98–106 (2003)
4. Christensen, C. M.: The innovator’s dilemma: when new technologies cause great firms tofail. Harvard Business School Press, Boston, Mass (1997)
5. Shaheen, S., Cohen, A., Chan, N., Bansal, A.: Chapter 13—sharing strategies: carsharing,shared micromobility (bikesharing and scooter sharing), transportation network companies,microtransit, and other innovative mobility modes. In: Transportation, Land Use, andEnvironmental Planning, pp. 237–262. E. Deakin, Elsevier (2020)
6. Rose, G.: E-bikes and urban transportation: emerging issues and unresolved questions.Transportation 39, 81–96 (2012)
7. van De Walle, F.: The Velomobile as a vehicle for more sustainable transportation. In: RoyalInstitute of Technology Department for infrastructure (2004)
8. Wikipedia: Velomobile. https://en.wikipedia.org/wiki/Velomobile (2020). Accessed 26 April2020
9. Cox, P.: Framing consumption: social impediments to velomobile adoption. In: Proceedingsof the 5th European Velomobile Seminar: Towards Commercial Velomobiles (2004)
10. Pehan, S., Kegl, B.: Efficient Velomobile Design. Appl. Mech. Mater. 806, 232–239 (2015)11. Hiles, D.: 30 Iconic velomobile designs from the past 85 years. https://www.icebike.org/30-
iconic-velomobile-designs-from-the-past-85-years/ (2015). Accessed 4 Sept 201812. International Human Powered Vehicle Association: Official speed records. http://www.ihpva.
org/hpvarech.htm (2020). Accessed 26 April 202013. Sørensen, P.H.: VELOMOBILE: Redefined. University of Stavanger, Norway (2014)14. Corben, B., Cameron, M., Senserrick, T., Rechnitzer, G.: Development of the visionary
research model—application to the car/pedestrian conflict. Monash University AccidentResearch Centre, Report No. 229 (2004)
15. Vittouris, A., Richardson M.: Designing vehicles for natural production: growing avelomobile from bamboo. In: Proceedings, Australasian Transport Research Forum (2011)
16. Richardson, M.: Fab Velo. PhD in Industrial Design. Monash University (2013)17. Moore, G.A.: Crossing the Chasm, pp 288. HarperCollins (2014)18. Cowie, J.: The economics of transport—A theoretical and applied perspective, pp 384.
Routledge (2010)19. Jones, T., Harms, L., Heinen, E.: Motives, perceptions and experiences of electric bicycle
owners and implications for health, wellbeing and mobility. J. Transp. Geogr. 53, 41–49(2016)
20. Castro, A., Gaupp-Berghausen, M., Dons, E., Standaert, A., Laeremans, M., Clark, A.,Anaya-Boig, E., Cole-Hunter, T., Avila-Palencia, I., Rojas-Rueda, D., Nieuwenhuijsen, M.,Gerike, R., Panis, L. I., de Nazelle, A., Brand, C., Raser, E., Kahlmeier S., Götschi, T.:Physical activity of electric bicycle users compared to conventional bicycle users andnon-cyclists: insights based on health and transport data from an online survey in sevenEuropean cities. In: Transportation Research Interdisciplinary Perspectives 1 (2019)
21. Lieswyn, J., Fowler, M., Koorey, G., Wilke, A., Crimp, S.: Regulations and safety for electricbikes and other low-powered vehicles. NZ Transport Agency Research Report 621, 1–182(2017)
22. Austroads Guide to Road Design: Part 6A: Pedestrian and Cyclist Paths, Austroads (2017)23. Bunte, H., Hipp, C.: Recumbent bikes—trikes—velomobiles: An analysis of (single vehicle)
crashes. In: Proceedings, International Cycling Safety Conference 2015, 15–16 Sept 2015,Hannover, Germany, pp. 25 (2015)
38 G. Rose and A. Liang
24. Corben, B., van Nes, N., Candappa, N., Logan, D. B., Archer, J.: Intersection study—Task 3report. Monash University Accident Research Centre, Report No. 316c. http://www.monash.edu/__data/assets/pdf_file/0006/217617/muarc316c.pdf (2010)
25. Garber, N. J., Gadirau, R.: Speed variance and its influence on accidents. In: AAA Foundationfor Traffic Safety, Washington DC (1988)
26. Velometro Mobility Incorporated: https://www.velometro.com/veemo/ (2020). Accessed 29April 2020
Open Access This chapter is licensed under the terms of the Creative Commons Attribution 4.0International License (http://creativecommons.org/licenses/by/4.0/), which permits use, sharing,adaptation, distribution and reproduction in any medium or format, as long as you give appropriatecredit to the original author(s) and the source, provide a link to the Creative Commons license andindicate if changes were made.The images or other third party material in this chapter are included in the chapter’s Creative
Commons license, unless indicated otherwise in a credit line to the material. If material is notincluded in the chapter’s Creative Commons license and your intended use is not permitted bystatutory regulation or exceeds the permitted use, you will need to obtain permission directly fromthe copyright holder.
Velomobiles and Urban Mobility: Opportunities and Challenges 39
The UK Approach to Greater MarketAcceptance of Powered Light Vehicles(PLVs)
Huw Davies, Allan Hutchinson, Richard Barrett, Tony Campbell,and Andy Eastlake
Abstract This paper summarises the UK activity for powered light vehicles(PLVs) with the purpose of driving market acceptance. If alternative vehicle con-cepts are to emerge from the margins and transition into the main stream, there is aneed to think differently. This opportunity has motivated a number of UK organ-isations to come together as a working group and identify a way forward. Wecontend that thinking differently requires a reshaping of the whole value chain.Each of the partners has contributed to this activity and we describe the develop-ment of a pathway towards the realisation of a UK PLV market. Research andpolicy development requirements for the UK market are defined, supported by adiscussion on two specific segments of the PLV market—light freight vehicles andmicromobility.
Keywords Powered light vehicles � UK transport policy � Freight vehicles �Micromobility � Transition pathways
H. Davies (&)Institute for Future Transport and Cities, Coventry University, Coventry, UKe-mail: [email protected]
A. HutchinsonSchool of Engineering, Computing and Mathematics, Oxford Brookes University, Oxford,UK
R. BarrettSchool of Engineering, Liverpool University, Liverpool, UK
T. CampbellMotor Cycle Industry Association (MCIA), Coventry, UK
A. EastlakeLow Carbon Vehicle Partnership, London, UK
© The Author(s) 2021A. Ewert et al. (eds.), Small Electric Vehicles,https://doi.org/10.1007/978-3-030-65843-4_4
41
1 Introduction
In the UK, surface transport is the largest sector contributor to GHG emissions [1],urban road speeds have reduced by almost 5% in the past 4 years to 18.7 mph [2],whilst nine out of ten Londoners say air pollution is at crisis level [3]. In respondingto the problems of climate change, congestion and air quality, it is increasinglyrecognised that there is a need to re-evaluate our transport options and energysources for them.
Smaller, lighter, and more energy efficient vehicles are seen as an alternative totraditional mobility options, especially where a move towards other existing formsof transport or a reduction in transport provision is not a viable alternative. Thedichotomy is that these alternative concepts are currently perceived as inferior totraditional mobility solutions, resulting in marginalisation and disbenefits to thesupplying industry. Further, those vehicle concepts that are more radical inapproach also have the issue of public perception to overcome, including func-tionality issues and concerns about safety.
Transforming the individual vehicle we drive today will require several changesin a holistic sense:
• electric variants;• the creation of an environment whereby smaller more efficient vehicles can
provide a defined benefit;• changing society to see the value of the most appropriate vehicle for a particular
journey;• supporting suppliers to invest in the development and manufacture of alternative
smaller vehicles.
It is the purpose of the UK PLV Working Group to support these changes andprovide a forum for co-ordination of activities in this area.
2 Background
Within the UK, and when compared to a number of EU member states, the marketpenetration of smaller vehicles—those below the M1 passenger car classification—has been limited. Collectively, this category of vehicles is referred to as L-categoryand consists of powered 2 and 3 wheel vehicles, quadricycles, and microcars. Thisincludes motorbikes and scooters which account for the largest part of the currentL-category market.
Although there are relatively few L-category vehicles compared to M and Ncategories (passenger and goods vehicles) in the UK, they are much smaller, lighter,take up less road space and offer innovative alternatives for mobility, particularly incities. This engenders the L-category to those concerned with finding solutions to
42 H. Davies et al.
the current externalities around road transport, in particular the pressure on cuttingenergy consumption, improving local air quality and reducing local congestion.
Recognising this, in 2015, a study into the potential of the L-category market forthe UK automotive industry was initiated. This study linked the LowCVP, the UKDfT, and six UK universities: Loughborough, Cardiff, Coventry, Oxford Brookes,Queen’s Belfast, and Warwick. The study was broad ranging and recognised thatthe issue of L-category vehicles was a combination of producer, consumer, andsocietal interests. Hence, the impacts and benefits were equally wide ranging andconsidered: air quality and GHG; economic activity including cost to the industry aswell as the consumer; and public health including road safety. The result of thisstudy was the launch of the report “Powered Light Vehicles: Opportunities for LowCarbon ‘L-Category’ Vehicles in the UK” in 2019 [4].
The main conclusion of the Consortium was that PLVs—with either an electricor highly efficient internal combustion engine powertrain—create an opportunity toprovide an important contribution to reduction in polluting emissions and energyconsumption, both during the manufacture and subsequent operation of thesevehicles in the UK. Furthermore, PLVs offer potential growth opportunities for theUK industry, building on the existing engineering capabilities of the automotivesector and, in particular, the motorcycle, motorsports, and niche vehicle sectors,which are well-positioned to exploit opportunities for this category of vehicle.The PLV consortium assessment also identified a number of challenges to themanufacture and use of PLVs in the UK. These relate to the delineation of regu-lations relating to sit-on and sit-in vehicles, and the incorporation of PLVs intoexisting UK and EU policy frameworks. The full series of reports written byconsortium members are available for further background information and can bedownloaded from the LowCVP website: www.LowCVP.org.uk/PLV.
Further to the above activity, the UK Motor Cycle Industry Association (MCIA)has also played an active role in support of the PLV sector in the UK. The MCIA isthe Trade Association representing the PLV industry (also known as L-Categoryvehicles) and has created this strategy to highlight the benefits of incorporatingPLVs into the transport mix. As part of its remit, and summarised in the jointpublication with the LowCVP “The Route to Tomorrow’s Journeys: Powered LightVehicles – Practical, Efficient & Safe Transport for All”, are the results of a numberof studies investigating the benefits to the UK of supporting the PLV sector [5]. Thebenefits of these have been explained in full, including the impressive results of thecongestion impact and air quality study. Unsurprisingly, the results showed thatwith a greater shift to electric PLVs (L-category vehicles that have battery electricdrivetrains), fewer NOX emissions will be recorded (from 0.48 kg/day for thechosen baseline scenario to 0.42 kg/day with a 10% modal shift). Reductions werealso seen in the scenarios showing the modal shift for PM10 and PM2.5 (from 0.093to 0.087 kg/day and 0.051 to 0.048 kg/day, respectively). Emissions relate to thecarbon intensity of the electricity grid, and the increasingly renewable content of theUK grid mix (50% in 2019 [6]) means that considerable further reductions may beanticipated in future. Furthermore, the modelled scenarios also found that con-gestion levels decreased, resulting in reduced delays and shorter journey times for
The UK Approach to Greater Market … 43
everyone across nine real world junctions (a 20% modal shift gave an 18.4 sreduction in delay averaged across all junctions improving to 39.8 s for a 50%modal shift).
Realising the joint interest in the promotion of PLV in the UK, the MCIApartnered with LowCVP in the UK launch of the “The Route to Tomorrow’sJourneys: Powered Light Vehicles – Practical, Efficient & Safe Transport for All”and “Powered Light Vehicles: Opportunities for Low Carbon ‘L-Category’Vehicles in the UK” at the London Transport Museum in 2019. The launch was inresponse to the UK Government publication of the “Future of Mobility: UrbanStrategy” [7]. This strategy document recognised that the rise of motor transport hasbrought substantial benefits, the strategy document also warned that high levels ofprivate car ownership and use have also brought serious challenges. In response thevision articulated in the strategy:
cleaner transport, automation, new business models and new modes of travel [that] promiseto transform how people, goods and services move.
To support that UK Government vision and to position PLV as part of thatvision, a new UK PLV working group was established in 2019. The working groupis chaired by Coventry University with the MCIA as the secretariat and has theLowCVP, Oxford Brookes University and Liverpool University as permanentmembers. This group looks to take forward the previous recommendations anddiscussion points from both the PLV consortium and the MCIA activities. Thegroup has set itself the following mission statement:
Movement of individuals and goods facilitates production and trade, enhances labourmobility and provides customers with access to goods. Reducing transport-related climateemissions will require transformational changes in thinking, policy, technology andinvestment to enact. Lighter and smaller vehicles are a key part of the solution (poweredlight vehicles – PLVs), but struggle to find UK market acceptance. Developing collabo-rations in research and policy development is a timely intervention to support this.
3 Path to System Transformation
PLVs can play a valuable role in the local transport mix. The recent UK MCIApolicy document The Route to Tomorrow’s Journeys, refers to a modal shift awayfrom single-occupancy cars and lightly laden vans, towards transport modes thattake up less road space and use less energy. The key is to encourage the use of ‘theright vehicle for the right journey’ and to support transport users in makingappropriate choices. However, this transition to the right vehicle for the rightjourney has proven difficult to realise. It is the inter-relationships between thedifferent parts of the mobility system that can create a resistance to change, resultingin customer lock-in, for example, the economies of scale resulting from the massadoption of one type of transport modality can cascade through the system rein-forcing the existing support structures and locking out modalities that rely on
44 H. Davies et al.
alternative structures. It is understanding and managing these relationships, or howcomponent changes impact upon them, that is key to transformation of our mobilitysystem. For PLVs to move from niche to mainstream, acceptance will requireconcurrent changes in different parts of the system.
Before alternative mobility solutions, such as the wide spread adoption of PLVs,become widely accepted and economically competitive, they are required toovercome such barriers as technology inter-relatedness, vested interests, legalframeworks that fit the use of historical and present technologies, and the limita-tions imposed by the evolved consensus over how technology should be designedlimiting the vision of business and governments [8]. Existing regulation for PLVapplication is complex and because traffic laws are defined on national level, dif-ferent rules are applied across European member states and the UK. Drivinglicences, for example, are regulated on EU level, but exceptions are permitted formember states for some parameters, for example minimum driving age [9]. Basedon this understanding, an exclusively technology-focused approach is unlikely toprovide the change required, but it can be an important component.
In response to the research challenge, the PLV Working Group seeks to engagethe engineering with the social, economic and planning aspects of the market. Theobjective is to use a multidisciplinary approach to understand the risk to investmentin the emerging PLV value chain in the UK and in the EU. This understanding willinform the development of a framework that will support and strengthen the for-mulation of technology and public policy to reduce investment risk and strengthenthe development, deployment, and diffusion of PLV technologies.
Policy instruments themselves may address a number of market imperfections.However, the way in which national and local governments use these instruments ishighly contextualised. First, there is an enormous diversity of policy measures withregards to PLVs in the UK. This alone is indicative of the fact that there is greatuncertainty over what works. Second, in terms of socio-technical transitions, theunderlying imperative is to stimulate the change process, and yet the uncertaintyover policy tools may hinder or even obstruct the change process, because thepolicy development is primarily evidence based. This presents a number of prob-lems when discussing PLVs. The first is that there is a paucity of evidence uponwhich to base policy. The second is the variation in vehicle types that exist indifferent regions due to regulatory frameworks.
It is the inter-relationships between the different parts of the mobility system thatcan create resistance to change. It is understanding and managing these relation-ships, or how component changes impact upon them, that is key to transformationof the mobility system. For PLVs to move from niche to mainstream, acceptancewill require concurrent changes in different parts of the system. To demonstrate this,two cases are presented from the UK perspective. One, the case of micromobility, isused to demonstrate where existing policy creates customer lock-in, by excludingalternative forms of emerging mobility acceptable to the market place. The other,light freight vehicles, is used to demonstrate where a potential market shift could besupported by appropriate co-ordination of technology and public policy.
The UK Approach to Greater Market … 45
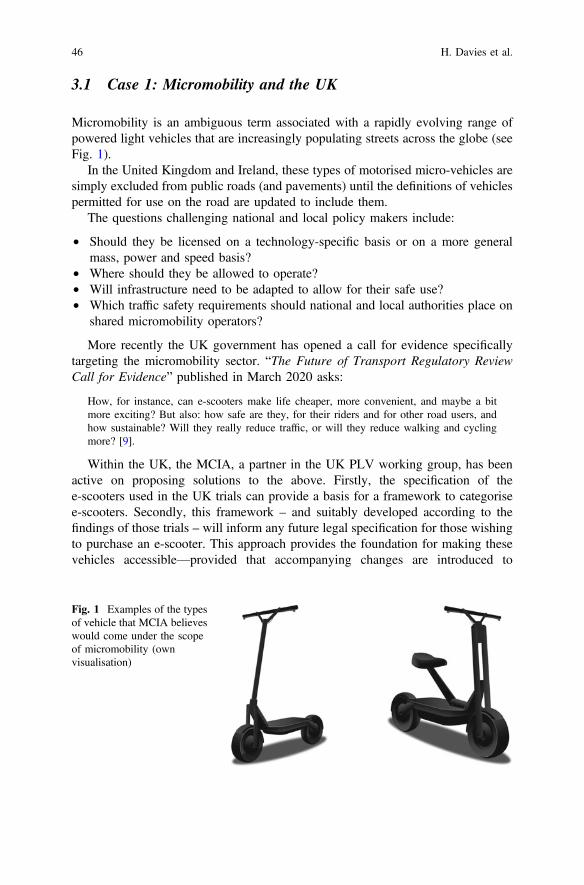
3.1 Case 1: Micromobility and the UK
Micromobility is an ambiguous term associated with a rapidly evolving range ofpowered light vehicles that are increasingly populating streets across the globe (seeFig. 1).
In the United Kingdom and Ireland, these types of motorised micro-vehicles aresimply excluded from public roads (and pavements) until the definitions of vehiclespermitted for use on the road are updated to include them.
The questions challenging national and local policy makers include:
• Should they be licensed on a technology-specific basis or on a more generalmass, power and speed basis?
• Where should they be allowed to operate?• Will infrastructure need to be adapted to allow for their safe use?• Which traffic safety requirements should national and local authorities place on
shared micromobility operators?
More recently the UK government has opened a call for evidence specificallytargeting the micromobility sector. “The Future of Transport Regulatory ReviewCall for Evidence” published in March 2020 asks:
How, for instance, can e-scooters make life cheaper, more convenient, and maybe a bitmore exciting? But also: how safe are they, for their riders and for other road users, andhow sustainable? Will they really reduce traffic, or will they reduce walking and cyclingmore? [9].
Within the UK, the MCIA, a partner in the UK PLV working group, has beenactive on proposing solutions to the above. Firstly, the specification of thee-scooters used in the UK trials can provide a basis for a framework to categorisee-scooters. Secondly, this framework – and suitably developed according to thefindings of those trials – will inform any future legal specification for those wishingto purchase an e-scooter. This approach provides the foundation for making thesevehicles accessible—provided that accompanying changes are introduced to
Fig. 1 Examples of the typesof vehicle that MCIA believeswould come under the scopeof micromobility (ownvisualisation)
46 H. Davies et al.
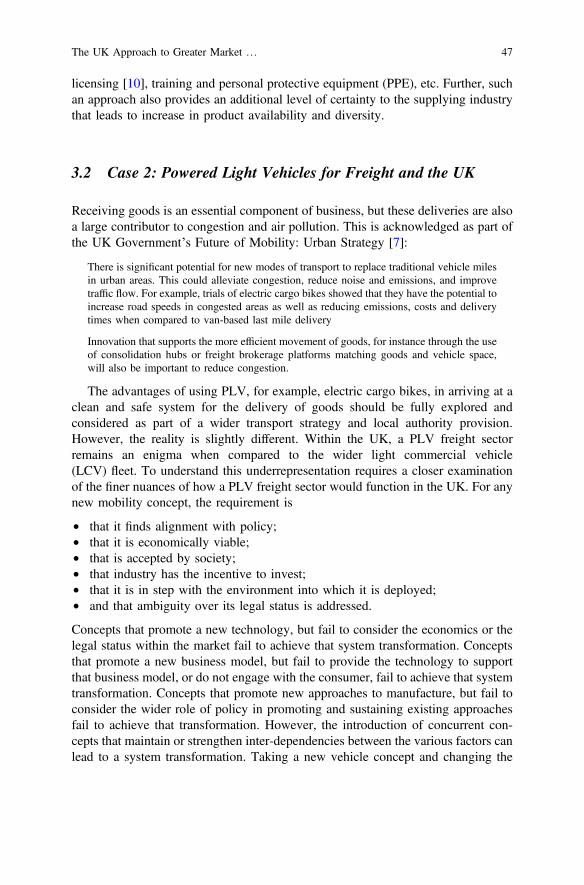
licensing [10], training and personal protective equipment (PPE), etc. Further, suchan approach also provides an additional level of certainty to the supplying industrythat leads to increase in product availability and diversity.
3.2 Case 2: Powered Light Vehicles for Freight and the UK
Receiving goods is an essential component of business, but these deliveries are alsoa large contributor to congestion and air pollution. This is acknowledged as part ofthe UK Government’s Future of Mobility: Urban Strategy [7]:
There is significant potential for new modes of transport to replace traditional vehicle milesin urban areas. This could alleviate congestion, reduce noise and emissions, and improvetraffic flow. For example, trials of electric cargo bikes showed that they have the potential toincrease road speeds in congested areas as well as reducing emissions, costs and deliverytimes when compared to van-based last mile delivery
Innovation that supports the more efficient movement of goods, for instance through the useof consolidation hubs or freight brokerage platforms matching goods and vehicle space,will also be important to reduce congestion.
The advantages of using PLV, for example, electric cargo bikes, in arriving at aclean and safe system for the delivery of goods should be fully explored andconsidered as part of a wider transport strategy and local authority provision.However, the reality is slightly different. Within the UK, a PLV freight sectorremains an enigma when compared to the wider light commercial vehicle(LCV) fleet. To understand this underrepresentation requires a closer examinationof the finer nuances of how a PLV freight sector would function in the UK. For anynew mobility concept, the requirement is
• that it finds alignment with policy;• that it is economically viable;• that is accepted by society;• that industry has the incentive to invest;• that it is in step with the environment into which it is deployed;• and that ambiguity over its legal status is addressed.
Concepts that promote a new technology, but fail to consider the economics or thelegal status within the market fail to achieve that system transformation. Conceptsthat promote a new business model, but fail to provide the technology to supportthat business model, or do not engage with the consumer, fail to achieve that systemtransformation. Concepts that promote new approaches to manufacture, but fail toconsider the wider role of policy in promoting and sustaining existing approachesfail to achieve that transformation. However, the introduction of concurrent con-cepts that maintain or strengthen inter-dependencies between the various factors canlead to a system transformation. Taking a new vehicle concept and changing the
The UK Approach to Greater Market … 47
retail environment to account for the different unit cost can succeed. Taking a newmobility concept and changing the regulatory environment can engage with theconsumer and succeed.
In the UK context, PLVs used for freight can be considered a new product.Indeed, with their radically different composition (payload, performance, cost base,etc.) and the substantial change, this requires to business systems and accompa-nying value chains, it can be argued that PLVs would also constitute a newindustry. In this context, success requires that technology change has to be part-nered by a change to business models, and of course needs customer acceptance.This has higher risk and generates resistance to change.
In response, the acceptance and the success of PLVs for freight will dependstrongly on identifying effective use cases that provides user friendly and economicviable operation. New policy and legislative measures can then be introduced thatwill support the provision of these use cases. For example, the introduction ofspecial operational specifics of L-category traffic regulations like use of bicyclelanes, pedestrian zones or reverse one-way driving. These are presently excluded inthe UK for most of the PLV solutions that would be suitable for the type of freightdeliveries envisaged by the UK Government strategy document. Further, enablingsuch special operational specifics, and ensuring there is a level of stability asso-ciated with these changes, would also have the benefit of supporting the freightsector in identifying and quantifying risks with new business models that caninform its business planning and forward investment. Factors influencing economicoperations include appropriate licensing arrangements, financial incentives andoperational motivations such as privileged access, low running costs, and so on.
At present, business models around the use of PLV for freight are generallyinsufficient, which restrict the development of this sector outside of their core(niche) markets. Current and evolving policy frameworks, that enable specialoperational specifics, will speed up the adoption and expansion of the PLV forfreight. To support this requires regulatory change, which will have the outcome ofcreating new market spaces. The UK PLV Working Group will be active in thisarea.
4 Discussion
Replace existing modalities with PLVs has the potential to generate a range ofpositive outcomes, from clean air to reduced congestion. Hence, there is strategicvalue in the support of PLVs and this has been recognised in the UK strategy forurban mobility. However, with such a complex system as road transport, theinterventions in support of a move to PLVs must be planned and must beco-ordinated in order to support wider market acceptance. This paper has sum-marised the UK activity for PLVs with the purpose of driving market acceptance.
48 H. Davies et al.
It has also been shown how the activity links to the UK strategy for future urbanmobility. Further to the above, a result of this activity has been the identification ofa number of key recommendations and discussion points. These are summarisedbelow:
Key recommendations:
• Raise awareness among key stakeholder within the UK value chain• Undertake whole life-cycle assessments of PLVs• Make representations at EU level to include PLVs in fleet averages,• Implement technical R&D projects needed to optimise systems applicable PLVs• Conduct UK focused end-user research to build on the insights from early
adopters• Re-assess UK low-carbon vehicle purchase incentives to include PLVs.
Discussion points:
• Currently only M, N, and O category vehicles are supported by the NationalSmall Series Type Approval (NSSTA) in the UK. To assist small UK companiesin entering the PLV market, the UK Department for Transport (DfT), along withthe Vehicle Certification Agency (VCA), is to consult stakeholders on creating aNSSTA for PLVs.
• Improve regulatory delineation between open “sit-on” and enclosed “sit-in”L-category powered light vehicles. The former (scooters, motorcycles, quad-bikes) are already an established market, whereas the latter has neither a clearidentity for consumers (e.g. safety standards) nor the best legal framework (e.g.suitable drive cycle/crash test procedures) to flourish.
• New regulations are needed for a minimum safety cell performance: frontal andside impact crash tests performance (appropriate for the class), rollover test, seatwith whiplash protection. Impact test for pedestrians (enhancement of existingfunctional safety regulations). Further accident research performed onL-category PLVs to review and amend the initial test proposed for the frontal,lateral, and roll-over load cases.
• Funded research is undertaken to ensure that future vehicles of all sizes are ableto detect PLVs in their AEB sensing algorithms. Along with funded research inthe development of AEB, city, inter-city and pedestrian safety and fundedresearch into the implementation of an integrated safety test protocol ofL-category PLVs.
To deliver against these recommendations and to support ongoing discussion, aUK PLV working group has been established. To date the working group hasfocused on two emerging PLV sectors: micro-mobility and freight.
• For micro-mobility, an emerging consumer demand is at present tempered by agap in the classification of the product. A recommendation for classification thatextends the existing L-category topology is proposed. Adoption by Government
The UK Approach to Greater Market … 49
would enable the appropriate discussion around category definition—taking intoaccount concerns around safety in addition to congestion and emission benefits—which would in turn lead to increased consumer confidence and industryparticipation.
• For freight, the issue is that the business models around PLVs are generallyinsufficient outside of specific niche applications. The adoption of PLVs willdepend strongly on expanding the effective use case through a combination ofproduct innovation and creating new market spaces through a change in sur-rounding conditions, such as creating specific regulations like use of bicyclelanes, pedestrian zones or reverse one-way driving. An effective use of thesespecific regulations may be viewed as a key enabler for new delivery services.
5 Next Steps
Following on from the recently announced UK government call for evidence ontransport regulation and specifically targeting the micromobility sector [9], a furtherpublication of 26 March 2020 “Decarbonising Transport, Setting the Challenge”[11] states:
We will use our cars less and be able to rely on a convenient, cost-effective and coherentpublic transport network. From motorcycles to HGVs, all road vehicles will be zeroemission. Technological advances, including new modes of transport and mobility inno-vation, will change the way vehicles are used. Our goods will be delivered through anintegrated, efficient and sustainable delivery system
The strategic position of the UK government—outlined in the call for evidenceon transport regulation and the decarbonisation challenge—creates a clear oppor-tunity for the development of a robust and optimised PLV market within the futureof UK transport and will form a continuing basis for further coordination of theUK PLV group.
References
1. Committee on Climate change: Reducing UK emission—2019 progress report to parliament.https://www.theccc.org.uk/publication/reducing-uk-emissions-2019-progress-report-to-parliament/ (2019). Last Accessed 6 Nov 2019
2. Department for Transport: Transport Statistics Great Britain 2017, https://assets.publishing.service.gov.uk/government/uploads/system/uploads/attachment_data/file/664323/tsgb-2017-print-ready-version.pdf (2017). Last Accessed 20 Sep 2018
3. London.Gov: 9/10 Londoners say air pollution is at ‘crisis’ levels. https://www.london.gov.uk/press-releases/mayoral/londoners-poll-air-pollution-is-at-crisis-levels (2017). Last Accessed13 Nov 2017
50 H. Davies et al.
4. LowCVP: Micro vehicles: opportunities for low carbon ‘L-Category’ vehicles in the UK.https://www.lowcvp.org.uk/assets/reports/LowCVP_Powered_Light_Vehicles_2019.pdf&usg=AOvVaw0MLVstf3OX_PqdfrhtvPwC (2019). Last Accessed 1 May 2020
5. MCIA: The route to tomorrow’s journeys: powered light vehicles—practical, efficient & safetransport for all. https://mcia.co.uk/attachment/ead15463-d738-4dd0-a43d-bc48ca633fb7(2019). Last Accessed 1 May 2020
6. Raugei, M., Kamran, M., Hutchinson, A.: A prospective net energy and environmentallife-cycle assessment of the UK electricity grid. Energies 13(9), 2207 (2020)
7. DfT: Future of mobility: urban strategy. https://assets.publishing.service.gov.uk/government/uploads/system/uploads/attachment_data/file/846593/future-of-mobility-strategy.pdf (2019).Last Accessed 1 May 2020
8. Sanden, B.A., Azar, C.: Near-term technology policies for long-term climate targets—economy wide versus technology specific approaches. Energy Policy 33, 1557–1576 (2005)
9. DfT: Future of transport regulatory review: call for evidence. https://assets.publishing.service.gov.uk/government/uploads/system/uploads/attachment_data/file/873363/future-of-transport-regulatory-review-call-for-evidence.pdf (2020). Last Accessed 5 May 2020
10. Directive 2006/126/EC of the European Parliament and of the Council of 20 December 2006on driving licences
11. DfT: Decarbonising transport: setting the challenge’. https://assets.publishing.service.gov.uk/government/uploads/system/uploads/attachment_data/file/878642/decarbonising-transport-setting-the-challenge.pdf (2020). Last Accessed 5 May 2020
Open Access This chapter is licensed under the terms of the Creative Commons Attribution 4.0International License (http://creativecommons.org/licenses/by/4.0/), which permits use, sharing,adaptation, distribution and reproduction in any medium or format, as long as you give appropriatecredit to the original author(s) and the source, provide a link to the Creative Commons license andindicate if changes were made.The images or other third party material in this chapter are included in the chapter’s Creative
Commons license, unless indicated otherwise in a credit line to the material. If material is notincluded in the chapter’s Creative Commons license and your intended use is not permitted bystatutory regulation or exceeds the permitted use, you will need to obtain permission directly fromthe copyright holder.
The UK Approach to Greater Market … 51

Case Studies and Applications of SEVs
The ELVITEN Project as Promoterof LEVs in Urban Mobility: Focuson the Italian Case of Genoa
Francesco Edoardo Misso, Irina Di Ruocco, and Cino Repetto
Abstract One of the growing innovations in the electric vehicle market concernslight electric vehicles (LEVs), promoted at local and national level by many ini-tiatives, such as the European project ELVITEN, involving six cities, which isanalysed in the present paper in relation to the Genoa pilot case study. In Italy,LEVs have been increasingly successful, as the number of their registrations shows(+76% in 2019 compared to 2018). In this context, the city of Genoa, where aconsiderable fleet of mopeds and motorcycles (214,499 in its metropolitan area in2018) circulates, lends itself well to the experimentation of two-wheeled LEVs. Themonitoring of the use of LEVs within the framework of the ELVITEN project hasshown that the average daily round trips recorded in the metropolitan area of Genoaare equal to 15–20 km, thus reinforcing the idea that LEVs represent a validalternative to Internal Combustion Engine (ICE) private vehicles. Moreover, thecharacteristics of the travel monitored and the users’ feedback highlight that thequestion of range anxiety is less present than expected. Finally, and contrary to ourexpectations, the data analysis indicates that the use of LEVs in Genoa during twomonths of Covid-19 pandemic lockdown—March and April 2020—shows adecrease of 21%, while the average decrease recorded by the six cities globallyconsidered is 51%.
Keywords LEVs � E-mobility � Genoa
1 The ELVITEN Project
The new frontiers of mobility include a number of new transport models, startingfrom the use of electric vehicles, micro-mobility or soft mobility systems up toelectric self-driven vehicles, allowing environmentally friendly transit. Such mod-els, which play an important role in the smart mobility scenario, require a solid
F. E. Misso (&) � I. Di Ruocco � C. RepettoT Bridge S.p.A, Via G. Garibaldi 7/10, 16124 Genoa, Italye-mail: [email protected]
© The Author(s) 2021A. Ewert et al. (eds.), Small Electric Vehicles,https://doi.org/10.1007/978-3-030-65843-4_5
55
digitalisation. In this line, many cities have adopted new transport systems based onelectric mobility, encouraging the use of light electric vehicles (LEV).The ELVITEN project1 (Electrified L-category Vehicles Integrated into Transportand Electricity Networks) aims at the diffusion and simultaneous integration ofLEVs (e-bicycles, e-scooters, e-tricycles and quadricycles) in order to offer a newconcept of sustainable urban transport system for people mobility (work, tourism,and leisure) and goods delivery. The ELVITEN project moved its first steps in 2017thanks to Horizon 2020 funding. The project involves 21 partners, coordinated bythe lead partner ICCS (Institute of Communication and Computer Systems) inAthens, including T Bridge that has the role of the coordinator for developing theICT tools supporting the experimentation.
The ELVITEN project methodology proposes, implements, and demonstratesinnovative deployment schemes to address in a comprehensive way all major issuesrelated to the market entry of LEVs. These issues are poor user awareness due to alow level of information on vehicle performance and functionality, consumerconcerns such as range anxiety, and inadequate mobility planning for LEVs ofexisting paid infrastructure networks and inadequate planning for the integration ofLEVs into urban transport networks.
The approach of the project includes the preparation, usage, and analysis phases,analysing the mobility demand in six pilot cities (Berlin in Germany, Bari, Genoaand Rome in Italy, Malaga in Spain, and Trikala in Greece) and the identification ofthe usage schemes and potential number of users on the basis of each city’smobility conditions. In order to create profiles of potential ELVITEN users in eachcity, the project provides a focus on the following clusters of LEV users: systematicurban commuters, occasional urban travellers, and light delivery companies.
The actions are carried out in the demonstration cities and are related to the useof vehicles (e.g. parking lots or charging areas) focusing on the most strategic areassuch as covered areas close to, for example, railway stations or shopping centres.
The ongoing activities include the set-up of a platform and applications formobile devices through which citizens can, among others, access ELVITEN ser-vices, book charging points, and use sharing services in an integrated logic.
To summarise, the ELVITEN project aims at:
• testing how to enhance/reinforce electric vehicle use in the six pilot cities,reducing pollutant emissions as well as traffic congestion, targeting both carsand light vehicles (motorcycles, pedal-assisted bicycles, tri- and quadricycles);
• increasing LEV usage in urban areas, through the development of replicableusage schemes;
• deploying LEV innovative parking and charging services, to facilitate LEVowners;
• empowering LEV sharing and rental services;• developing support ICT tools to motivate the usage of LEVs instead of ICE
vehicles;
1www.elviten-project.eu/it/ [1].
56 F. E. Misso et al.
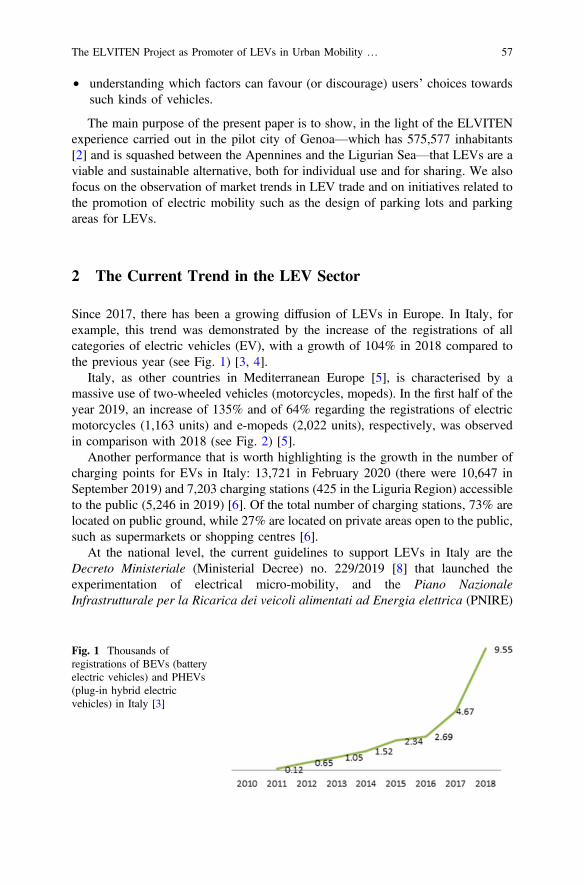
• understanding which factors can favour (or discourage) users’ choices towardssuch kinds of vehicles.
The main purpose of the present paper is to show, in the light of the ELVITENexperience carried out in the pilot city of Genoa—which has 575,577 inhabitants[2] and is squashed between the Apennines and the Ligurian Sea—that LEVs are aviable and sustainable alternative, both for individual use and for sharing. We alsofocus on the observation of market trends in LEV trade and on initiatives related tothe promotion of electric mobility such as the design of parking lots and parkingareas for LEVs.
2 The Current Trend in the LEV Sector
Since 2017, there has been a growing diffusion of LEVs in Europe. In Italy, forexample, this trend was demonstrated by the increase of the registrations of allcategories of electric vehicles (EV), with a growth of 104% in 2018 compared tothe previous year (see Fig. 1) [3, 4].
Italy, as other countries in Mediterranean Europe [5], is characterised by amassive use of two-wheeled vehicles (motorcycles, mopeds). In the first half of theyear 2019, an increase of 135% and of 64% regarding the registrations of electricmotorcycles (1,163 units) and e-mopeds (2,022 units), respectively, was observedin comparison with 2018 (see Fig. 2) [5].
Another performance that is worth highlighting is the growth in the number ofcharging points for EVs in Italy: 13,721 in February 2020 (there were 10,647 inSeptember 2019) and 7,203 charging stations (425 in the Liguria Region) accessibleto the public (5,246 in 2019) [6]. Of the total number of charging stations, 73% arelocated on public ground, while 27% are located on private areas open to the public,such as supermarkets or shopping centres [6].
At the national level, the current guidelines to support LEVs in Italy are theDecreto Ministeriale (Ministerial Decree) no. 229/2019 [8] that launched theexperimentation of electrical micro-mobility, and the Piano NazionaleInfrastrutturale per la Ricarica dei veicoli alimentati ad Energia elettrica (PNIRE)
Fig. 1 Thousands ofregistrations of BEVs (batteryelectric vehicles) and PHEVs(plug-in hybrid electricvehicles) in Italy [3]
The ELVITEN Project as Promoter of LEVs in Urban Mobility … 57
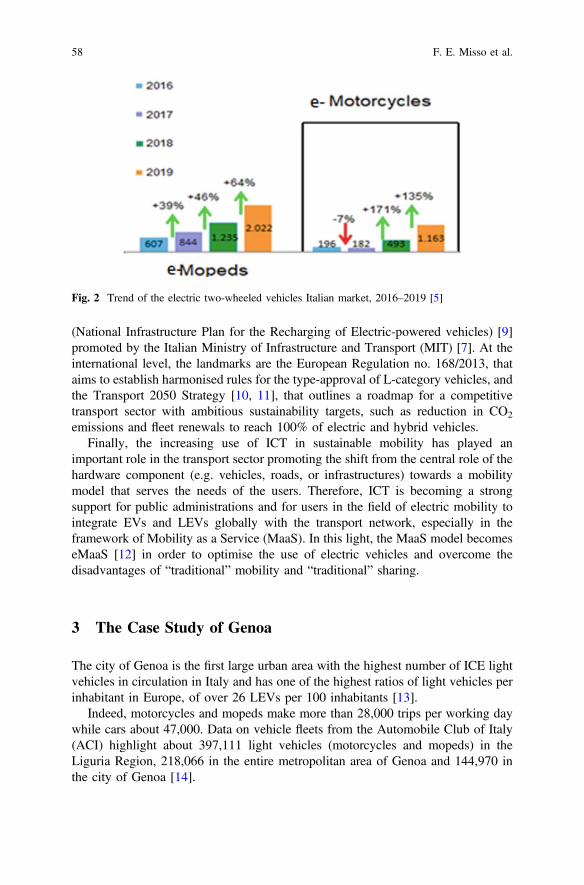
(National Infrastructure Plan for the Recharging of Electric-powered vehicles) [9]promoted by the Italian Ministry of Infrastructure and Transport (MIT) [7]. At theinternational level, the landmarks are the European Regulation no. 168/2013, thataims to establish harmonised rules for the type-approval of L-category vehicles, andthe Transport 2050 Strategy [10, 11], that outlines a roadmap for a competitivetransport sector with ambitious sustainability targets, such as reduction in CO2
emissions and fleet renewals to reach 100% of electric and hybrid vehicles.Finally, the increasing use of ICT in sustainable mobility has played an
important role in the transport sector promoting the shift from the central role of thehardware component (e.g. vehicles, roads, or infrastructures) towards a mobilitymodel that serves the needs of the users. Therefore, ICT is becoming a strongsupport for public administrations and for users in the field of electric mobility tointegrate EVs and LEVs globally with the transport network, especially in theframework of Mobility as a Service (MaaS). In this light, the MaaS model becomeseMaaS [12] in order to optimise the use of electric vehicles and overcome thedisadvantages of “traditional” mobility and “traditional” sharing.
3 The Case Study of Genoa
The city of Genoa is the first large urban area with the highest number of ICE lightvehicles in circulation in Italy and has one of the highest ratios of light vehicles perinhabitant in Europe, of over 26 LEVs per 100 inhabitants [13].
Indeed, motorcycles and mopeds make more than 28,000 trips per working daywhile cars about 47,000. Data on vehicle fleets from the Automobile Club of Italy(ACI) highlight about 397,111 light vehicles (motorcycles and mopeds) in theLiguria Region, 218,066 in the entire metropolitan area of Genoa and 144,970 inthe city of Genoa [14].
Fig. 2 Trend of the electric two-wheeled vehicles Italian market, 2016–2019 [5]
58 F. E. Misso et al.
Still, the use of electric scooters and quadricycles is low, and this is due to thepersistence of psychological and technological barriers, such as asymmetric infor-mation, range anxiety, and charging operations (ELVITEN project, 2017, alsobased on previous experiences).
Moreover, the topographic characteristics of Genoa, with considerable differ-ences in altitude and traffic-restricted streets in the historical centre, make this city,among the other European and Italian cities, suitable to be chosen as a pilot case toexperiment the spread of electric vehicles in the framework of the ELVITENproject.
Since 2013, the City of Genoa has put in place several actions, which testify tothe strong commitment of the city in the field of LEVs. Thanks to projects in whichGenoa is the protagonist, these measures include the spread of the network ofcharging points and the launch of LEVs such as two-, three-, and four-wheelvehicles on the metropolitan territory.
ELVITEN is surely an example of such projects. It follows the legacy of the Ele.C.Tra. “Electric City Transport” project, funded by the IEE programme (IntelligentEnergy—Europe) in 2013 and completed at the end of 2015. It included eleveninternational partners and the three important pilot cities Genoa, Florence, andBarcelona that, with another seven cities around Europe, laid the foundations for thedevelopment of light electric vehicles. From the very beginning, the relevance ofthe stakeholders’ networking and the role of physical (e.g. charging points) andimmaterial (e.g. policies and raising citizens’ awareness) actions to be done wasclear.
Finally, the city of Genoa renewed its membership of the Covenant of Mayors in2018, a pact between eleven cities in order to reduce greenhouse gas emissions byat least 40% by 2030.
3.1 The ELVITEN Project in Genoa
The experimentation with electric vehicles deals with different activities such as themonitoring of the range anxiety, in particular, and users’ confidence in LEVs, ingeneral, the question of recharging, the diffusion of sharing and the development ofe-roaming and ICT tools.
In Genoa, the project promotes the use of LEVs, thanks to Kyburz, the supplierof ten electric L5e-A vehicles (tricycles), and private suppliers of one e-scooter andsix e-quadricycles. Kyburz’ tricycles have been conferred to public and privatesubjects in the Genoa area and are currently being used.
The testing in Genoa involves many ELVITEN partners such as:
• The Municipality of Genoa, which provides free parking for LEVs with thepossibility of advanced booking and “bonuses” for virtuous behaviour;
• T Bridge, coordinating technical activities and developing ICT solutions;• Quaeryon and Softeco, concerning ICT activities and
The ELVITEN Project as Promoter of LEVs in Urban Mobility … 59
• Duferco Energy, which provides the charging infrastructure and a dedicated app(“D-Mobility”).
The pilot test started in May 2019 and the monitoring of the trips of thedemonstration vehicles is still ongoing. For this purpose, each vehicle is equippedwith a data logger (blackbox) in order to track every trip start, duration, and route.
The Genoese experimentation includes the implementation in strategic areas ofthe city of four charging points for two-, three-, and four-wheeled vehicles, whichare integrated with the existing infrastructure. This measure promotes the devel-opment of a charging network in the city and the incentive for the adaptation ofcharging sockets in both public and private spaces.
The creation of the hubs has triggered a process of urban transformation, con-verting existing urban spaces to new functions. Parking spaces have been convertedinto a multimodal hub promoting inter-modality allowing citizens to use local and/or private public transport and EVs.
Genoa has also initiated a process of civic involvement by linking mobility to thecitizen. A plurality of ICT solutions is currently in phase of testing or development,such as:
• the booking of the charging points in the four Genoa hubs, thanks to the DufercoEnergy “D-Mobility” mobile app, which allows the citizen to search, select, andbook a charging point available, pay and monitor the charging;
• the monitoring of the EV fleet of tricycles with the blackboxes of the vehicleproducer (Kyburz) and the following analysis made by the ELVITEN respon-sible partners;
• the booking and management of “positive incentives” to be given to citizens fortheir virtuous behaviours with regard to electric mobility, also to be used inother services proposed by the municipality and integrated in future in a widerrewarding logic for Smart-City citizens. For example, the possibility of offeringfree tickets for the local municipal museums is currently in progress. The systemis implemented by the platform “Myeppi”®,2 an outcome of the previousEuropean project MOVEUS owned by Genoa Municipality, Quaeryon andSofteco, which has been adapted and customised for the ELVITEN needs.
For each ELVITEN Demonstration City, four types of specific solutions havebeen defined to carry out the demonstration through SERVICES, ICT TOOLS (e.g.apps, booking and brokering services), POLICIES promoted by public bodies andSPECIFIC COMMUNICATION/PROMOTION INITIATIVES.
The specific expected results, partially implemented, for Genoa are synthesisedin Table 1.
2www.myeppi.com.
60 F. E. Misso et al.
3.2 Focus on Genoa Data
The ELVITEN trips data (see Fig. 3) were collected before the COVID-19 period,showing the number of trips per month for all pilots up to February 2020. The totalnumber of trips registered is 26,798 trips, of which 532 are active users. These areidentified users who also participated in compilation of the questionnaires that weresubmitted by LEV-users during the monitoring activity of the project. The diagramshows a slow increase in the number of users after January.
The trip data collected by month presents an increasing peak of displacements inOctober 2019, highlighting that the testing of LEVs progressively increased as thedemonstration was carried on. The winter period shows a not surprising decrease inthe use of LEVs.
In the framework of the pilot experimentations, almost 1,000 questionnaireswere filled out by LEV owners and users of shared vehicles. They highlighted that88% of users of all pilot cities were satisfied with travelling on their LEVs andpointed out strong confidence in the use of LEVs as an alternative to ICE vehicles.
In Genoa, during the pilot period (up to February 2020, before the COVID-19pandemic), more than 2,500 trips were made with the monitored ELVITEN LEVs(see Fig. 4) and 260 in March 2020 (see Fig. 5). These intermediate results, whichare aligned with the other cities involved despite the poor attitude to use EVs inGenoa, show a good response of the citizens.
Table 1 Solutions deployed in Genoa
Services Creation of a widespread charging point network via theinstallation of four e-charging hubs, including coveredshelters for electric bicycles and by integrating chargingpoints in private areas, open for public useIntegration of the charge network with the existinginfrastructureOffering of ten three-wheelers by Kyburz for free use by locallogistics companies
ICT Tools Brokering service for the shared three-wheelers and forbooking of charging points (“D-Mobility” app)Management system for the e-charging hubsLEV fleet monitoring tool and digital coach app
Policies Genoa Municipality provides free parking in downtownparking areas for LEVs, with the possibility of advancebooking“Bonuses” for virtuous behaviour, as collected by theIncentive Management App (platform “Myeppi”®)
Specific communication/promotion initiatives
Genoa organises a permanent exhibition, in which LEVproviders present their products and inform visitors about thestate of art of LEVsLEVs are offered to citizens for free testing
Source ELVITEN project, elaboration by authors
The ELVITEN Project as Promoter of LEVs in Urban Mobility … 61
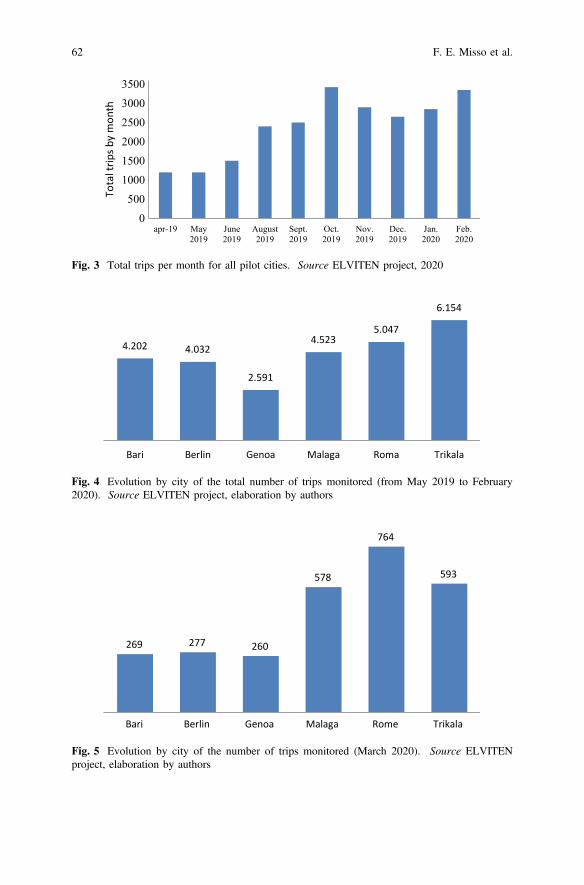
0
500
1000
1500
2000
2500
3000
3500
apr-19 May2019
June2019
August2019
Sept.2019
Oct.2019
Nov.2019
Dec.2019
Jan.2020
Feb.2020
Tota
l trip
s by
mon
th
Fig. 3 Total trips per month for all pilot cities. Source ELVITEN project, 2020
4.202 4.032
2.591
4.5235.047
6.154
Bari Berlin Genoa Malaga Roma Trikala
Fig. 4 Evolution by city of the total number of trips monitored (from May 2019 to February2020). Source ELVITEN project, elaboration by authors
269 277 260
578
764
593
Bari Berlin Genoa Malaga Rome Trikala
Fig. 5 Evolution by city of the number of trips monitored (March 2020). Source ELVITENproject, elaboration by authors
62 F. E. Misso et al.
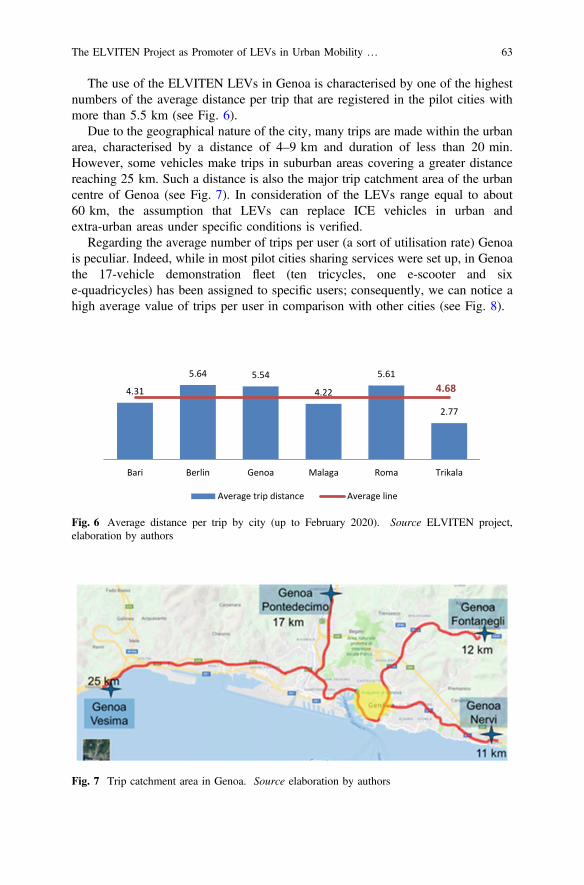
The use of the ELVITEN LEVs in Genoa is characterised by one of the highestnumbers of the average distance per trip that are registered in the pilot cities withmore than 5.5 km (see Fig. 6).
Due to the geographical nature of the city, many trips are made within the urbanarea, characterised by a distance of 4–9 km and duration of less than 20 min.However, some vehicles make trips in suburban areas covering a greater distancereaching 25 km. Such a distance is also the major trip catchment area of the urbancentre of Genoa (see Fig. 7). In consideration of the LEVs range equal to about60 km, the assumption that LEVs can replace ICE vehicles in urban andextra-urban areas under specific conditions is verified.
Regarding the average number of trips per user (a sort of utilisation rate) Genoais peculiar. Indeed, while in most pilot cities sharing services were set up, in Genoathe 17-vehicle demonstration fleet (ten tricycles, one e-scooter and sixe-quadricycles) has been assigned to specific users; consequently, we can notice ahigh average value of trips per user in comparison with other cities (see Fig. 8).
Fig. 7 Trip catchment area in Genoa. Source elaboration by authors
4.31
5.64 5.54
4.22
5.61
2.77
Bari Berlin Genoa Malaga Roma Trikala
Average trip distance Average line
4.68
Fig. 6 Average distance per trip by city (up to February 2020). Source ELVITEN project,elaboration by authors
The ELVITEN Project as Promoter of LEVs in Urban Mobility … 63
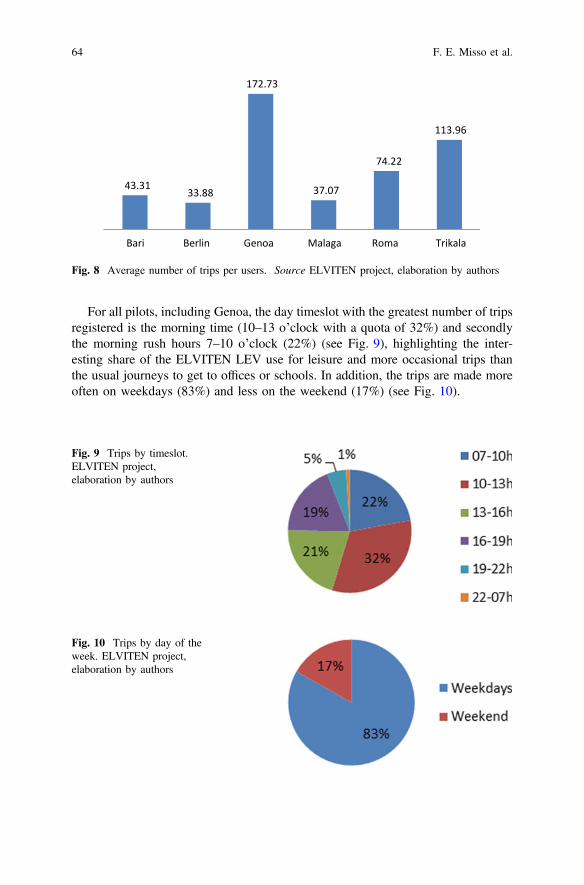
For all pilots, including Genoa, the day timeslot with the greatest number of tripsregistered is the morning time (10–13 o’clock with a quota of 32%) and secondlythe morning rush hours 7–10 o’clock (22%) (see Fig. 9), highlighting the inter-esting share of the ELVITEN LEV use for leisure and more occasional trips thanthe usual journeys to get to offices or schools. In addition, the trips are made moreoften on weekdays (83%) and less on the weekend (17%) (see Fig. 10).
Fig. 10 Trips by day of theweek. ELVITEN project,elaboration by authors
43.3133.88
172.73
37.07
74.22
113.96
Bari Berlin Genoa Malaga Roma Trikala
Fig. 8 Average number of trips per users. Source ELVITEN project, elaboration by authors
Fig. 9 Trips by timeslot.ELVITEN project,elaboration by authors
64 F. E. Misso et al.

Finally, the monitoring of the number of trips carried out by LEVs in March andApril 2020 (see Table 2) shows that in most of the pilot cities, the travel numberdecreased but not markedly, despite the spread of COVID-19 and the consequentblockage of travel. The figures for Genoa, in particular, show that despite a 21%decrease, it is lower than the other cities involved (average of 51%).
4 Conclusions: Challenges of LEVs
The first results of the still ongoing ELVITEN project allow us to collect, analyse,and give relevant insights into the use of LEVs in everyday mobility. First, thespecific pilot case of Genoa is showing that the consumers’ concerns about thefeeling of uncertainty with regard to the possible need to re-charge the vehicleduring the trips (range anxiety) is less present than expected. Indeed, users whoevaluated LEVs positively (88% of total pilot city users who filled in the ques-tionnaires submitted) expressed that today the challenges facing LEVs are mostlyrelated to the three following issues, listed approximately in order of priority fromthe citizens’ point of view: cost, charging infrastructure and range. Only 3% ofshared LEV users and 3% of the owners believe that the range anxiety is the mostcritical challenge to overcome today in order to make possible and convenient theuse of LEVs.
The evidence that the range anxiety is not the first challenge to be tackled in anurban context, such as Genoa, also concern the distance covered per trip, which, aspreviously highlighted, in Genoa is relatively higher than those usually covered bysuch vehicles (an average of 5.5 km, with trips reaching 25 km).
The results of the still ongoing ELVITEN experience are showing that workingtowards putting in place an integrated system of charging infrastructure (in Genoaby four new charging hubs in the most attractive points of the city) and incentives(set of policies offered and reward systems for the users) supports the use of LEVs.
Table 2 Evolution by city of the number of trips per month monitored
City Average trips/Month (startpilot—Feb 2020)
Trips inMarch 2020
Trips inApril 2020*
Δ % (March–April 2020) (%)
Bari 326 269 5 −98
Berlin 328 277 283 2
Genoa 218 260 206 −21
Malaga 377 578 157 −73
Rome 571 764 295 −61
Trikala 511 593 397 −33
Total 2,331 2,741 1,343 −51
*until 28 AprilSource ELVITEN project, elaboration by authors
The ELVITEN Project as Promoter of LEVs in Urban Mobility … 65
In this light, the characteristics of LEV trips, in terms of, for example, number,distance covered, or utilisation rate, are not strongly affected by the impacts of theconstraints due to the COVID-19 pandemic.
Acknowledgements This paper and the research behind it would not have been possible withoutthe participation of T Bridge in the ELVITEN project. We thank our project partners (https://www.elviten-project.eu/en/about/) for allowing us to use the project data to produce this paper. Wewould also like to thank our colleagues Michele Solari and Simone Porru from T Bridge, theDuferco Energy project partner, who have undoubtedly contributed to the interpretation of the datain this paper.Funding for this research was provided by the HORIZON 2020 project “ELVITEN”.
References
1. ELVITEN homepage: https://www.elviten-project.eu/it/. Last Accessed 22 April 20202. ISTAT homepage: http://dati.istat.it. Last Accessed 22 April 20203. Motus-e Homepage: (2019). https://www.motus-e.org. Last Accessed 22 April 20204. The European House Ambrosetti, Motus-e (in collaboration with): La filiera della mobilità
elettrica “Made in Italy”. (2019). https://www.motus-e.org/wp-content/uploads/2019/07/1907_Executive-Summary_La-filiera-e-Moblity-in-Italia.pdf
5. ANCMA Homepage: http://www.ancma.it/statistiche/. Associazione Nazionale CicloMotociclo e Accessori. Last Accessed 22 April 2020
6. Motus-e.: Le Infrastrutture di ricarica pubbliche in Italia (2020) https://www.motus-e.org/wp-content/uploads/2020/03/Report-IdR_Marzo_MOTUS-E.pdf
7. MIT Homepage: http://dati.mit.gov.it. Last Accessed 22 April 20208. Il Ministro delle Infrastutture e dei Trasporti: (2019) M_INF.GABINETTO.REG_DECRETI.
R.0000229.04-06-2019. http://www.mit.gov.it/sites/default/files/media/notizia/2019-06/schema%20DM%20micromobilit%C3%A0%20229_2019%20%283%29.pdf. Last Accessed24 Aug 2020
9. Il Ministro delle Infrastutture e dei Trasporti: (2012) Piano Nazionale Infrastutturale per laRicarica die veicoli alimentati ad energia Elettrica. http://www.governo.it/sites/governo.it/files/PNire.pdf. Last Accessed 24 Aug 2020
10. Regulation (EU) No 168/2013 of the European Parliament and of the Council of 15 January2013 on the approval and market surveillance of two- or three-wheel vehicles andquadricycles. https://eur-lex.europa.eu/legal-content/EN/ALL/?uri=CELEX%3A32013R0168.Last Accessed 24 Aug 2020
11. European Commission: Transport 2050: Commission outlines ambitious plan to increasemobility and reduce emissions. (2011). https://ec.europa.eu/commission/presscorner/detail/en/IP_11_372. Last Accessed 24 Aug 2020
12. Reyes Garcia, J.R., Lenz, G., Haveman, S.P., Bonnema, G.M.: State of the art of electricMobility as a Service (eMaaS): an overview of ecosystems and system architectures. In: 32ndInternational Electric Vehicle Symposium (EVS32) (2019)
66 F. E. Misso et al.
13. ACI Homepage: (2019) http://www.aci.it/ ACI Automobile Club d’Italia. Last Accessed 22April 2020
14. Automobile Club d’Italia: Autoritratto 2019. (2019) http://www.aci.it/laci/studi-e-ricerche/dati-e-statistiche/autoritratto/autoritratto-2019.html. Last Accessed 03 July 2020
Open Access This chapter is licensed under the terms of the Creative Commons Attribution 4.0International License (http://creativecommons.org/licenses/by/4.0/), which permits use, sharing,adaptation, distribution and reproduction in any medium or format, as long as you give appropriatecredit to the original author(s) and the source, provide a link to the Creative Commons license andindicate if changes were made.The images or other third party material in this chapter are included in the chapter’s Creative
Commons license, unless indicated otherwise in a credit line to the material. If material is notincluded in the chapter’s Creative Commons license and your intended use is not permitted bystatutory regulation or exceeds the permitted use, you will need to obtain permission directly fromthe copyright holder.
The ELVITEN Project as Promoter of LEVs in Urban Mobility … 67
Small Electric Vehicles in CommercialTransportation: Empirical Studyon Acceptance, Adoption Criteriaand Economic and Ecological Impacton a Company Level
Tim Hettesheimer, Cornelius Moll, Kerstin Jeßberger,and Saskia Franz
Abstract Small electric vehicles (SEVs) in commercial transportation have thepotential to reduce traffic and its impacts, especially in urban areas. Companies,however, are still reluctant to implement SEVs. Therefore, the aim of this contri-bution is to shed light on the acceptance of motives for and obstacles to the use ofSEVs in commercial transportation. Since the use of SEVs is often discussed in thecontext of innovative city logistics concepts, such as micro-hubs, our aim is also, toexplore the acceptance, economic, and ecological potentials of SEVs in combina-tion with micro-hubs. We use a multi-method approach and combine an onlinesurvey with in-depth interviews as well as a total cost of ownership (TCO) and CO2
calculation. Analyzing 350 responses to an online survey revealed that around halfthe companies surveyed have no knowledge of SEVs. This implies high unex-ploited potential, since 25% of these companies can imagine using them. In-depthinterviews with logistics service providers (LSPs) or logistics departments fromdifferent sectors revealed that six of the 13 interviewed LSPs would be willing toimplement this concept.
Keywords SEVs � Commercial transportation � TCO � CEP
T. Hettesheimer (&) � C. MollFraunhofer Institute for Systems and Innovation Research ISI,Breslauer Straße 48, 76139 Karlsruhe, Germanye-mail: [email protected]
K. JeßbergerJulius-Maximilians-Universität Würzburg, Sanderring 2, 97070 Würzburg, Germany
S. FranzKarlsruhe Institute of Technology (KIT), Kaiserstraße 12, 76131 Karlsruhe, Germany
© The Author(s) 2021A. Ewert et al. (eds.), Small Electric Vehicles,https://doi.org/10.1007/978-3-030-65843-4_6
69
1 Introduction
Urbanization, economic growth, and structural economic changes have led to asteady increase in road transportation, especially in urban areas [1]. Approximately,50% of urban traffic is caused by commercial vehicles [2]. This results in heavycongestion, air pollution, and greenhouse gas emissions in urban areas [3, 4]. Whenconsidering goods transport, it is striking that this only accounts for between 20 and30% of total urban traffic, but is responsible for 80% of inner-city traffic jamsduring rush hours, for example, due to the double parking of delivery vehicles [5].This situation could worsen in the future. Between 2000 and 2017, the number ofcourier, express, and parcel deliveries (CEP) in Germany doubled from 1.7 to3.4 billion and, according to estimates, these are expected to increase further to 5billion deliveries by 2025 [6]. In this context, the potential use of SEVs in com-mercial transportation and in the CEP industry in particular is a subject ofincreasing interest [5, 7]. SEVs are much smaller compared to conventionaldelivery vans or trucks and require less space while in traffic or parking.Furthermore, they are lighter, more agile and, when being powered electrically,more energy efficient than conventional vehicles. Consequently, SEVs have thepotential to reduce traffic and its impact, especially in urban areas.
While there are already a number of SEVs on city streets in private transport,they are still the exception for commercial transport services. The total userpotential for commercial transport in Germany has already been estimated, forexample, by Brost et al. [7], using data from the mobility survey “Mobility inGermany (MiD) 2017”. However, this analysis based on so-called “regular pro-fessional trips” only allows an estimation of the maximum technically possiblepotential (such as driving range or load volume). Furthermore, it is important tonote that company-specific criteria have a decisive influence on the user potential[7]. This contribution therefore focuses on a company-specific analysis of userpotential. For this purpose, the results of a survey of more than 350 companies and14 company-specific interviews are combined. This combination of the survey andthe interviews allows for a cross-company view as well as a company-specificperspective on acceptance, potentials and obstacles for the use of SEVs in variouscommercial applications. This approach supports the aim of this contribution toassess the acceptance and company-specific reasons for or against the use of SEVsin commercial transport in general. In addition, due to the high relevance of CEPservice providers for efficient urban traffic, an in-depth analysis was conducted onthe acceptance and willingness of logistic service providers (LSPs) or logisticsdepartments to use innovative concepts such as SEVs in combination withmicro-hubs and on how this concept could contribute to the profitability andenvironmental impact of innovative city logistics concepts.
SEV definition. In this study, we showed the companies different SEV classi-fications in advance to give them an impression of the different characteristics of theindividual classes. This was done using the following exemplary models: KEP10
70 T. Hettesheimer et al.
(L1e) as a two-wheeled cargo bike, three- and four-wheeled cargo bikes such as theCargo Cruiser (L2e) or Loadster, the Paxter (L6e), and light electric vehicles suchas Twizy Cargo and Microlino (L7e).
2 Materials and Methods
For the analyses of the general potential, an online survey was conducted of 4,000companies on the distribution and applicability of SEVs in companies. The geo-graphical focus is the “Technologieregion Karlsruhe”.1 Companies of varying sizefrom different sectors of industry were surveyed. The analysis covers the responsesof more than 350 companies (return rate of *7.5%).
In addition, interviews were conducted with 14 companies from industries thatare considered the most suitable for SEVs in the literature. This involves installationservice (1 company interviewed), painting trade (3), chimney sweeps (2), cleaningservice (1), nursing service (1), CEP service (1), pharmacy (2), internal factorytraffic (1), and delivery service (2). In some sectors, several companies wereinterviewed to find out whether and how the situation differs between companies inthe same sector.
To answer the question about the acceptance of SEVs in combination withmicro-hubs and how this concept could contribute to the profitability of innovativecity logistics concepts, 13 semi-structured interviews were conducted with expertsfrom different LSPs or logistics departments, supplemented by a total cost ofownership (TCO) calculation, an environmental analysis of CO2-emissions and aprocessing time analysis. In the interviews, besides evaluating the acceptance ofLSPs to use innovative city logistics concepts, we derived logistics and economicdata regarding the current transportations structures of the LSPs. The interviewconsisted of almost 50 questions. The data derived were used to calculate the TCO,processing times, and environmental impact (CO2 emissions) of combining SEVswith micro-hubs.
When applying the TCO method, all relevant processes and procedures of acurrent and a future scenario or concept has to be analyzed and respective costshave to be specified. Since our interviews showed, that the CEP service industry ismost likely to implement micro-hubs with cargo bicycles, we assumed that theoriginal distribution structure is transformed to a micro-hub concept. In the statusquo, a conventional delivery van starts the distribution of parcels to customers froma regional distribution center outside of an urban center. In the new concept, abattery-electric heavy-duty truck (HDT) transports two swap bodies (see Fig. 1),used as micro-hubs, from the regional distribution center to an urban center, while
1The region around the city of Karlsruhe, which is an industrial and technological center in thesouthern part of Germany, comprising approximately 3,240 km² and 1.3 million inhabitants.
Small Electric Vehicles in Commercial Transportation … 71
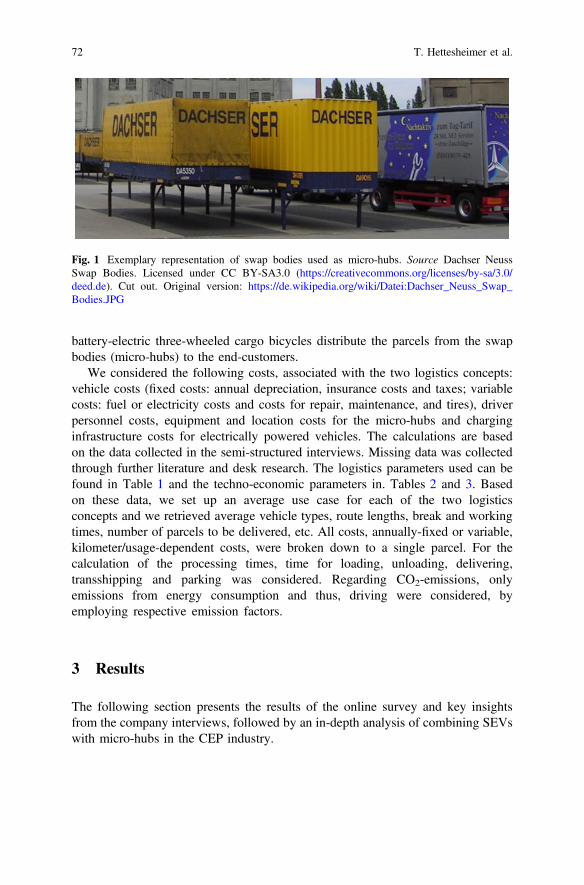
battery-electric three-wheeled cargo bicycles distribute the parcels from the swapbodies (micro-hubs) to the end-customers.
We considered the following costs, associated with the two logistics concepts:vehicle costs (fixed costs: annual depreciation, insurance costs and taxes; variablecosts: fuel or electricity costs and costs for repair, maintenance, and tires), driverpersonnel costs, equipment and location costs for the micro-hubs and charginginfrastructure costs for electrically powered vehicles. The calculations are basedon the data collected in the semi-structured interviews. Missing data was collectedthrough further literature and desk research. The logistics parameters used can befound in Table 1 and the techno-economic parameters in. Tables 2 and 3. Basedon these data, we set up an average use case for each of the two logisticsconcepts and we retrieved average vehicle types, route lengths, break and workingtimes, number of parcels to be delivered, etc. All costs, annually-fixed or variable,kilometer/usage-dependent costs, were broken down to a single parcel. For thecalculation of the processing times, time for loading, unloading, delivering,transshipping and parking was considered. Regarding CO2-emissions, onlyemissions from energy consumption and thus, driving were considered, byemploying respective emission factors.
3 Results
The following section presents the results of the online survey and key insightsfrom the company interviews, followed by an in-depth analysis of combining SEVswith micro-hubs in the CEP industry.
Fig. 1 Exemplary representation of swap bodies used as micro-hubs. Source Dachser NeussSwap Bodies. Licensed under CC BY-SA3.0 (https://creativecommons.org/licenses/by-sa/3.0/deed.de). Cut out. Original version: https://de.wikipedia.org/wiki/Datei:Dachser_Neuss_Swap_Bodies.JPG
72 T. Hettesheimer et al.
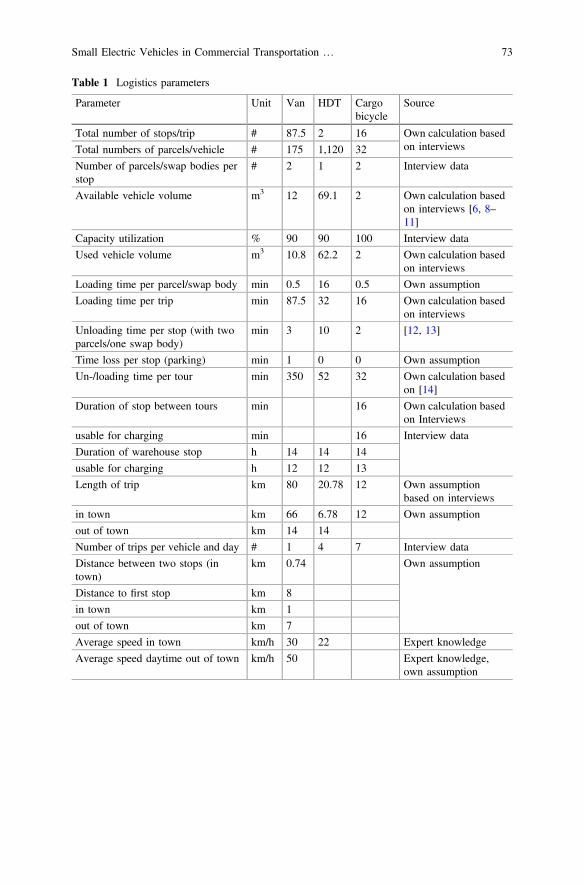
Table 1 Logistics parameters
Parameter Unit Van HDT Cargobicycle
Source
Total number of stops/trip # 87.5 2 16 Own calculation basedon interviewsTotal numbers of parcels/vehicle # 175 1,120 32
Number of parcels/swap bodies perstop
# 2 1 2 Interview data
Available vehicle volume m3 12 69.1 2 Own calculation basedon interviews [6, 8–11]
Capacity utilization % 90 90 100 Interview data
Used vehicle volume m3 10.8 62.2 2 Own calculation basedon interviews
Loading time per parcel/swap body min 0.5 16 0.5 Own assumption
Loading time per trip min 87.5 32 16 Own calculation basedon interviews
Unloading time per stop (with twoparcels/one swap body)
min 3 10 2 [12, 13]
Time loss per stop (parking) min 1 0 0 Own assumption
Un-/loading time per tour min 350 52 32 Own calculation basedon [14]
Duration of stop between tours min 16 Own calculation basedon Interviews
usable for charging min 16 Interview data
Duration of warehouse stop h 14 14 14
usable for charging h 12 12 13
Length of trip km 80 20.78 12 Own assumptionbased on interviews
in town km 66 6.78 12 Own assumption
out of town km 14 14
Number of trips per vehicle and day # 1 4 7 Interview data
Distance between two stops (intown)
km 0.74 Own assumption
Distance to first stop km 8
in town km 1
out of town km 7
Average speed in town km/h 30 22 Expert knowledge
Average speed daytime out of town km/h 50 Expert knowledge,own assumption
Small Electric Vehicles in Commercial Transportation … 73
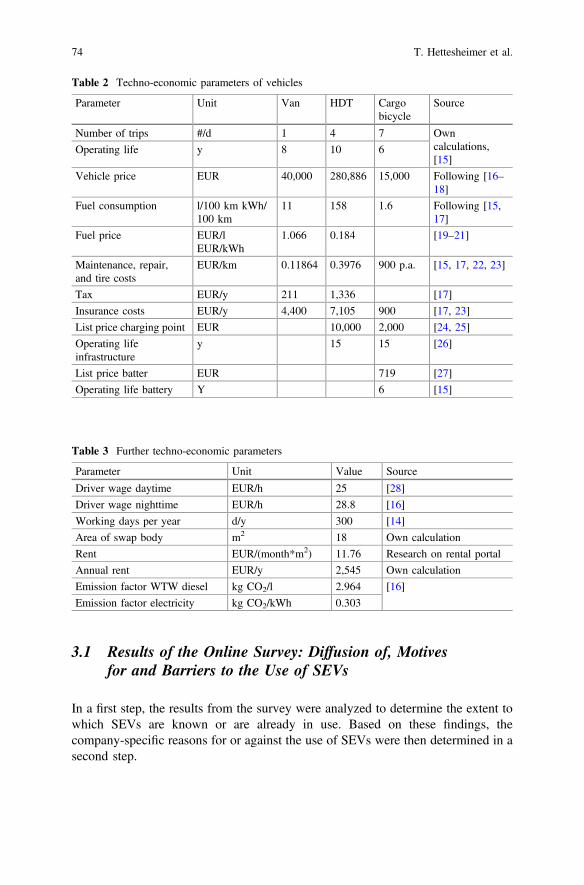
3.1 Results of the Online Survey: Diffusion of, Motivesfor and Barriers to the Use of SEVs
In a first step, the results from the survey were analyzed to determine the extent towhich SEVs are known or are already in use. Based on these findings, thecompany-specific reasons for or against the use of SEVs were then determined in asecond step.
Table 2 Techno-economic parameters of vehicles
Parameter Unit Van HDT Cargobicycle
Source
Number of trips #/d 1 4 7 Owncalculations,[15]
Operating life y 8 10 6
Vehicle price EUR 40,000 280,886 15,000 Following [16–18]
Fuel consumption l/100 km kWh/100 km
11 158 1.6 Following [15,17]
Fuel price EUR/lEUR/kWh
1.066 0.184 [19–21]
Maintenance, repair,and tire costs
EUR/km 0.11864 0.3976 900 p.a. [15, 17, 22, 23]
Tax EUR/y 211 1,336 [17]
Insurance costs EUR/y 4,400 7,105 900 [17, 23]
List price charging point EUR 10,000 2,000 [24, 25]
Operating lifeinfrastructure
y 15 15 [26]
List price batter EUR 719 [27]
Operating life battery Y 6 [15]
Table 3 Further techno-economic parameters
Parameter Unit Value Source
Driver wage daytime EUR/h 25 [28]
Driver wage nighttime EUR/h 28.8 [16]
Working days per year d/y 300 [14]
Area of swap body m2 18 Own calculation
Rent EUR/(month*m2) 11.76 Research on rental portal
Annual rent EUR/y 2,545 Own calculation
Emission factor WTW diesel kg CO2/l 2.964 [16]
Emission factor electricity kg CO2/kWh 0.303
74 T. Hettesheimer et al.
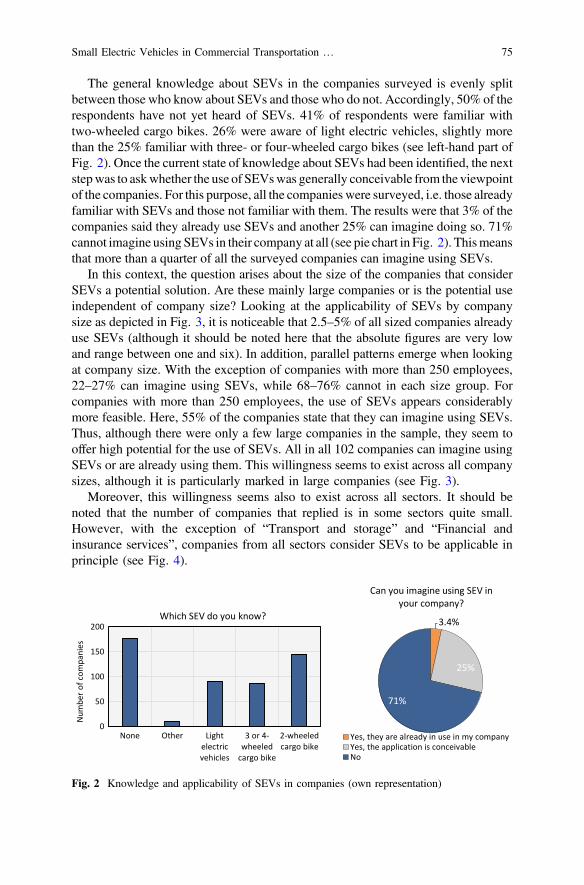
The general knowledge about SEVs in the companies surveyed is evenly splitbetween those who know about SEVs and those who do not. Accordingly, 50% of therespondents have not yet heard of SEVs. 41% of respondents were familiar withtwo-wheeled cargo bikes. 26% were aware of light electric vehicles, slightly morethan the 25% familiar with three- or four-wheeled cargo bikes (see left-hand part ofFig. 2). Once the current state of knowledge about SEVs had been identified, the nextstepwas to askwhether the use of SEVswas generally conceivable from the viewpointof the companies. For this purpose, all the companies were surveyed, i.e. those alreadyfamiliar with SEVs and those not familiar with them. The results were that 3% of thecompanies said they already use SEVs and another 25% can imagine doing so. 71%cannot imagine using SEVs in their company at all (see pie chart in Fig. 2). Thismeansthat more than a quarter of all the surveyed companies can imagine using SEVs.
In this context, the question arises about the size of the companies that considerSEVs a potential solution. Are these mainly large companies or is the potential useindependent of company size? Looking at the applicability of SEVs by companysize as depicted in Fig. 3, it is noticeable that 2.5–5% of all sized companies alreadyuse SEVs (although it should be noted here that the absolute figures are very lowand range between one and six). In addition, parallel patterns emerge when lookingat company size. With the exception of companies with more than 250 employees,22–27% can imagine using SEVs, while 68–76% cannot in each size group. Forcompanies with more than 250 employees, the use of SEVs appears considerablymore feasible. Here, 55% of the companies state that they can imagine using SEVs.Thus, although there were only a few large companies in the sample, they seem tooffer high potential for the use of SEVs. All in all 102 companies can imagine usingSEVs or are already using them. This willingness seems to exist across all companysizes, although it is particularly marked in large companies (see Fig. 3).
Moreover, this willingness seems also to exist across all sectors. It should benoted that the number of companies that replied is in some sectors quite small.However, with the exception of “Transport and storage” and “Financial andinsurance services”, companies from all sectors consider SEVs to be applicable inprinciple (see Fig. 4).
0
50
100
150
200
None Other Lightelectricvehicles
3 or 4-wheeled
cargo bike
2-wheeledcargo bike
Num
ber o
f com
pani
es
Which SEV do you know? 3.4%
25%
71%
Can you imagine using SEV in your company?
Yes, they are already in use in my companyYes, the application is conceivableNo
Fig. 2 Knowledge and applicability of SEVs in companies (own representation)
Small Electric Vehicles in Commercial Transportation … 75
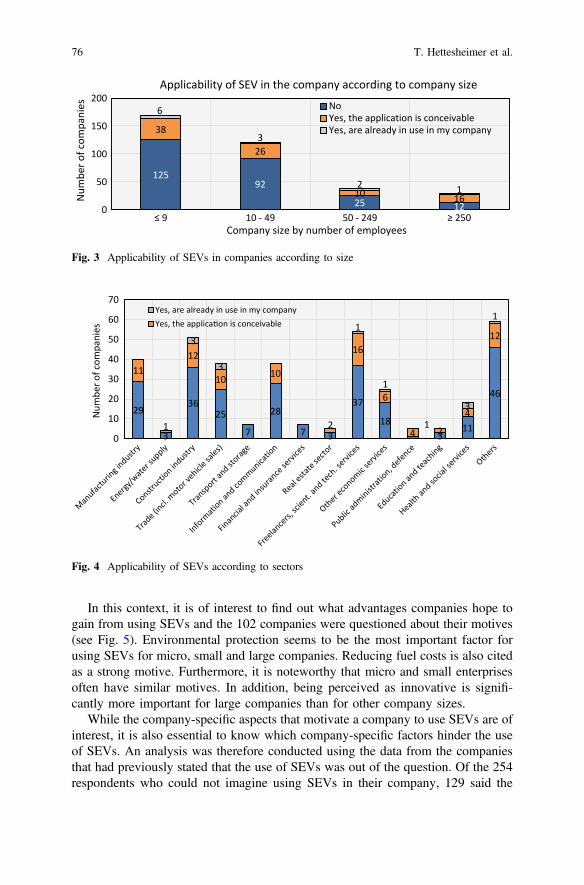
In this context, it is of interest to find out what advantages companies hope togain from using SEVs and the 102 companies were questioned about their motives(see Fig. 5). Environmental protection seems to be the most important factor forusing SEVs for micro, small and large companies. Reducing fuel costs is also citedas a strong motive. Furthermore, it is noteworthy that micro and small enterprisesoften have similar motives. In addition, being perceived as innovative is signifi-cantly more important for large companies than for other company sizes.
While the company-specific aspects that motivate a company to use SEVs are ofinterest, it is also essential to know which company-specific factors hinder the useof SEVs. An analysis was therefore conducted using the data from the companiesthat had previously stated that the use of SEVs was out of the question. Of the 254respondents who could not imagine using SEVs in their company, 129 said the
12592
25 12
38
26
10 16
6
3
2 1
0
50
100
150
200
≤ 9 10 - 49 50 - 249 ≥ 250
Num
ber o
f com
pani
es
Company size by number of employees
Applicability of SEV in the company according to company size
NoYes, the application is conceivableYes, are already in use in my company
Fig. 3 Applicability of SEVs in companies according to size
29
3
3625
7
28
7 3
37
18 1 3
11
46
11
1
12
10 10
2
16
6
4 2
4
123
3
1
1
3
1
0
10
20
30
40
50
60
70
Num
ber o
f com
pani
es
Yes, are already in use in my companyYes, the applica on is conceivable
Fig. 4 Applicability of SEVs according to sectors
76 T. Hettesheimer et al.
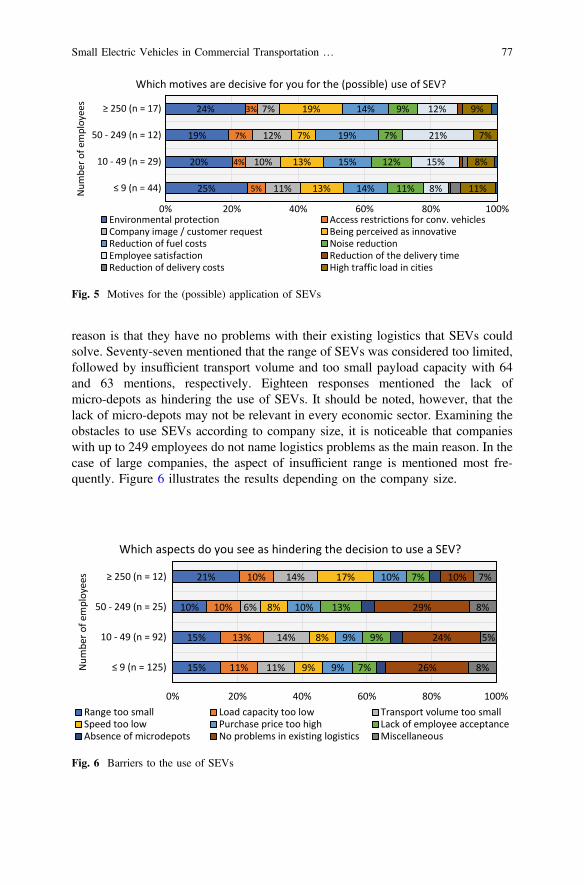
reason is that they have no problems with their existing logistics that SEVs couldsolve. Seventy-seven mentioned that the range of SEVs was considered too limited,followed by insufficient transport volume and too small payload capacity with 64and 63 mentions, respectively. Eighteen responses mentioned the lack ofmicro-depots as hindering the use of SEVs. It should be noted, however, that thelack of micro-depots may not be relevant in every economic sector. Examining theobstacles to use SEVs according to company size, it is noticeable that companieswith up to 249 employees do not name logistics problems as the main reason. In thecase of large companies, the aspect of insufficient range is mentioned most fre-quently. Figure 6 illustrates the results depending on the company size.
25%
20%
19%
24%
5%
4%
7%
3%
11%
10%
12%
7%
13%
13%
7%
19%
14%
15%
19%
14%
11%
12%
7%
9%
8%
15%
21%
12%
11%
8%
7%
9%
0% 20% 40% 60% 80% 100%
≤ 9 (n = 44)
10 - 49 (n = 29)
50 - 249 (n = 12)
≥ 250 (n = 17)
Num
ber o
f em
ploy
ees
Which motives are decisive for you for the (possible) use of SEV?
Environmental protection Access restrictions for conv. vehiclesCompany image / customer request Being perceived as innovativeReduction of fuel costs Noise reductionEmployee satisfaction Reduction of the delivery timeReduction of delivery costs High traffic load in cities
Fig. 5 Motives for the (possible) application of SEVs
15%
15%
10%
21%
11%
13%
10%
10%
11%
14%
6%
14%
9%
8%
8%
17%
9%
9%
10%
10%
7%
9%
13%
7%
26%
24%
29%
10%
8%
5%
8%
7%
0% 20% 40% 60% 80% 100%
≤ 9 (n = 125)
10 - 49 (n = 92)
50 - 249 (n = 25)
≥ 250 (n = 12)
Num
ber o
f em
ploy
ees
Which aspects do you see as hindering the decision to use a SEV?
Range too small Load capacity too low Transport volume too smallSpeed too low Purchase price too high Lack of employee acceptanceAbsence of microdepots No problems in existing logistics Miscellaneous
Fig. 6 Barriers to the use of SEVs
Small Electric Vehicles in Commercial Transportation … 77
3.2 Supplementary Findings from Interviewswith Companies from Potentially SEV-Relevant Sectors
In order to gain a better understanding of the results of the online survey and whySEVs are considered or not considered by companies in a particular sector, sup-portive in-depth interviews were conducted with companies from sectors whereSEVs might be a relevant option. A brief summary of the most important results ofthe interviews is presented below.
The statements of the interviewed companies showed that especially nursingservices, CEP services, pharmacies, and internal factory traffic seem to be suitablefor SEVs. The installation and chimney-sweeping sectors could integrate and useSEVs to some extent in their everyday work. Delivery services are, in principle,also suitable for SEVs in urban areas. Delivery speed is of enormous importancehere, especially in the gastronomic sector, and SEVs are not always the fastestoption.
It must be emphasized that it is difficult to make a general statement about thesuitability of SEVs for an entire sector, as the requirements of companies in thesame sector can already be very diverse and therefore a company-specific evalua-tion should always be made. For example, in the painting business, there are quitedifferent requirements for the range and cargo weight of vehicles. Furthermore,interview partners from the chimney-sweep sector stated that the structure of theirworking districts varies widely. For example, one district has a diameter of 5.5 kmand can be easily covered on foot. In contrast, other districts, which includesingle-family houses, for example, can be up to 17 km wide and would be suitablefor SEVs.
An application of SEVs in the field of nursing services is quite conceivable. Theadvantages mentioned were more efficient and faster trips as well as reduced timeneeded to find a parking lot. Another major advantage is that employees without acategory B driver’s license could also use them if necessary. Using SEVs couldtherefore enlarge the pool of potential job applicants, as possession of a category Bdriving license would no longer be essential. This may also be an issue for othersectors.
In the installation sector, SEVs seem to be particularly suitable for customerservices, while their loading volume is considered too small for cleaning services.They cannot transport ladders and larger machines, for example. In addition, otherobstacles were also mentioned that are independent of the sector, such as the factthat company cars are sometimes also used privately and SEVs do not meet theserequirements, and the lack of charging infrastructure at home. The potential lack ofweather protection and lower performance in winter were also criticized. It shouldbe mentioned that the results of the interviews are to be regarded as exemplary andnot representative due to the different framework conditions of companies, evenwithin the same sector.
78 T. Hettesheimer et al.
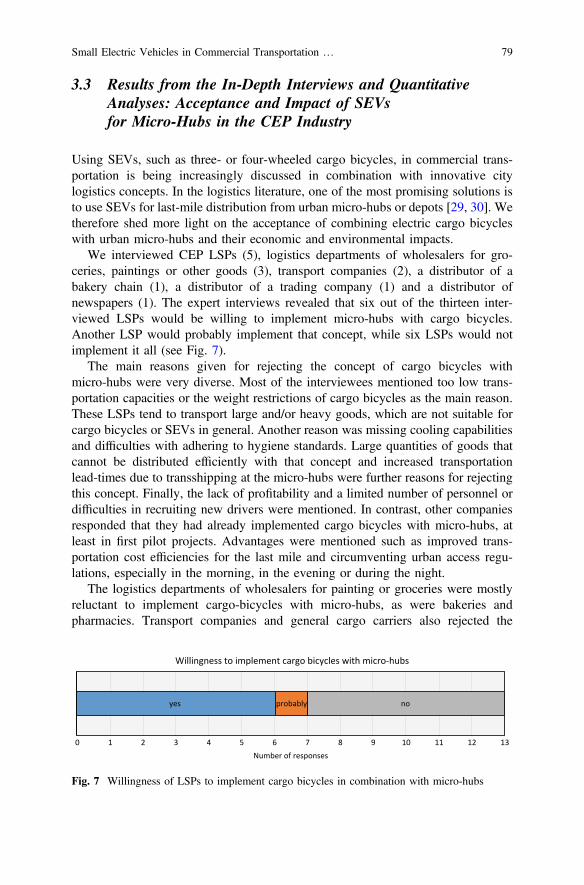
3.3 Results from the In-Depth Interviews and QuantitativeAnalyses: Acceptance and Impact of SEVsfor Micro-Hubs in the CEP Industry
Using SEVs, such as three- or four-wheeled cargo bicycles, in commercial trans-portation is being increasingly discussed in combination with innovative citylogistics concepts. In the logistics literature, one of the most promising solutions isto use SEVs for last-mile distribution from urban micro-hubs or depots [29, 30]. Wetherefore shed more light on the acceptance of combining electric cargo bicycleswith urban micro-hubs and their economic and environmental impacts.
We interviewed CEP LSPs (5), logistics departments of wholesalers for gro-ceries, paintings or other goods (3), transport companies (2), a distributor of abakery chain (1), a distributor of a trading company (1) and a distributor ofnewspapers (1). The expert interviews revealed that six out of the thirteen inter-viewed LSPs would be willing to implement micro-hubs with cargo bicycles.Another LSP would probably implement that concept, while six LSPs would notimplement it all (see Fig. 7).
The main reasons given for rejecting the concept of cargo bicycles withmicro-hubs were very diverse. Most of the interviewees mentioned too low trans-portation capacities or the weight restrictions of cargo bicycles as the main reason.These LSPs tend to transport large and/or heavy goods, which are not suitable forcargo bicycles or SEVs in general. Another reason was missing cooling capabilitiesand difficulties with adhering to hygiene standards. Large quantities of goods thatcannot be distributed efficiently with that concept and increased transportationlead-times due to transshipping at the micro-hubs were further reasons for rejectingthis concept. Finally, the lack of profitability and a limited number of personnel ordifficulties in recruiting new drivers were mentioned. In contrast, other companiesresponded that they had already implemented cargo bicycles with micro-hubs, atleast in first pilot projects. Advantages were mentioned such as improved trans-portation cost efficiencies for the last mile and circumventing urban access regu-lations, especially in the morning, in the evening or during the night.
The logistics departments of wholesalers for painting or groceries were mostlyreluctant to implement cargo-bicycles with micro-hubs, as were bakeries andpharmacies. Transport companies and general cargo carriers also rejected the
yes probably no
0 1 2 3 4 5 6 7 8 9 10 11 12 13Number of responses
Willingness to implement cargo bicycles with micro-hubs
Fig. 7 Willingness of LSPs to implement cargo bicycles in combination with micro-hubs
Small Electric Vehicles in Commercial Transportation … 79
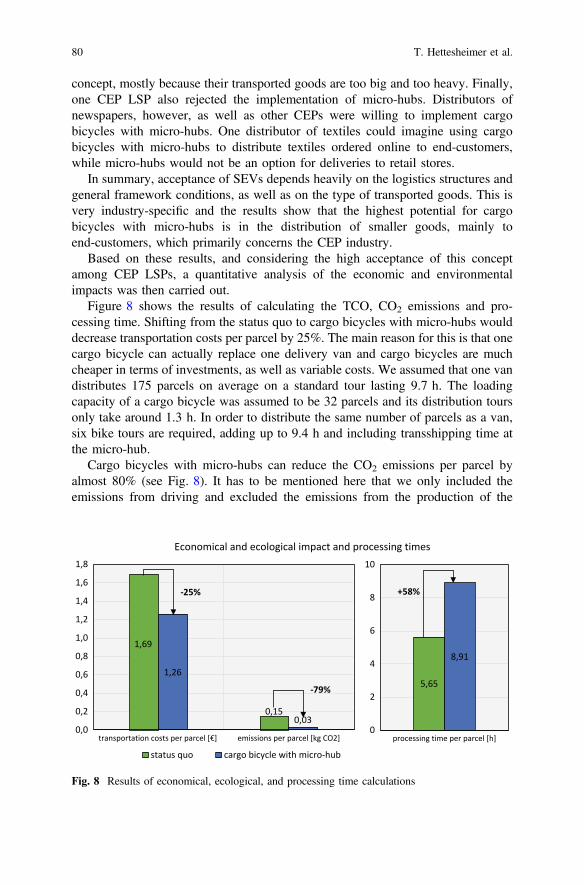
concept, mostly because their transported goods are too big and too heavy. Finally,one CEP LSP also rejected the implementation of micro-hubs. Distributors ofnewspapers, however, as well as other CEPs were willing to implement cargobicycles with micro-hubs. One distributor of textiles could imagine using cargobicycles with micro-hubs to distribute textiles ordered online to end-customers,while micro-hubs would not be an option for deliveries to retail stores.
In summary, acceptance of SEVs depends heavily on the logistics structures andgeneral framework conditions, as well as on the type of transported goods. This isvery industry-specific and the results show that the highest potential for cargobicycles with micro-hubs is in the distribution of smaller goods, mainly toend-customers, which primarily concerns the CEP industry.
Based on these results, and considering the high acceptance of this conceptamong CEP LSPs, a quantitative analysis of the economic and environmentalimpacts was then carried out.
Figure 8 shows the results of calculating the TCO, CO2 emissions and pro-cessing time. Shifting from the status quo to cargo bicycles with micro-hubs woulddecrease transportation costs per parcel by 25%. The main reason for this is that onecargo bicycle can actually replace one delivery van and cargo bicycles are muchcheaper in terms of investments, as well as variable costs. We assumed that one vandistributes 175 parcels on average on a standard tour lasting 9.7 h. The loadingcapacity of a cargo bicycle was assumed to be 32 parcels and its distribution toursonly take around 1.3 h. In order to distribute the same number of parcels as a van,six bike tours are required, adding up to 9.4 h and including transshipping time atthe micro-hub.
Cargo bicycles with micro-hubs can reduce the CO2 emissions per parcel byalmost 80% (see Fig. 8). It has to be mentioned here that we only included theemissions from driving and excluded the emissions from the production of the
1,69
0,15
1,26
0,030,0
0,2
0,4
0,6
0,8
1,0
1,2
1,4
1,6
1,8
transportation costs per parcel [€] emissions per parcel [kg CO2]
status quo cargo bicycle with micro-hub
-25%
-79% 5,65
8,91
0
2
4
6
8
10
processing time per parcel [h]
+58%
Economical and ecological impact and processing times
Fig. 8 Results of economical, ecological, and processing time calculations
80 T. Hettesheimer et al.
vehicles. Nevertheless, this represents a huge reduction. This is because electricdrivetrains are much more energy-efficient than conventional internal combustionengines and electricity has a much lower CO2 emission factor than diesel. Reducingthe emissions to zero would only be possible using 100% renewable electricity,which is currently not the case (calculations are based on Germany’s power mix).Finally, average processing times would increase by almost 60%. The processingtime starts when a parcel leaves the regional distribution center and ends when it isdelivered to the recipient. Thus, for the status quo, the parcel in the van is more orless directly on its way or at least on its final distribution tour to the recipient. Forthe micro-hub case, however, we assume that the micro-depots have to be dis-tributed by the HDT (2 per HDT-tour), which takes extra time, as does trans-shipping at the micro-hub and only then can the cargo bicycle tour start from themicro-hub.
To sum up, from an economic and environmental perspective, electric cargobicycles in combination with micro-hubs offer major benefits. Costs can be reducedby 25%, while CO2 emissions can be reduced by 79%. The only drawback is thehigher processing time involved, which increases by 58%.
4 Summary and Conclusions
SEVs can contribute to more sustainable commercial transportation due to theirreduced size, lower noise emissions, and lower CO2 emissions. However, so far,only half of the companies surveyed know about them. Nevertheless, a quarter ofthese companies can imagine using SEVs, so there is a large user potential for SEVsin commercial transport. This potential is found in all sizes of companies, butespecially in large ones. The main reasons for potentially using SEVs are notprimarily monetary. Environmental protection and employee satisfaction are rankedfirst and second here. Thus, policy makers could use this intrinsic motivation topromote the diffusion of SEVs and thus reduce THG emissions. The reasons givenfor not using an SEV include no logistical advantage for the company andconstruction-related criteria such as transport weight, range or load volume. In orderto activate the as yet unexploited potential, it is therefore advisable for SEV sellersto further inform companies about the existence and advantages of SEVs. Inaddition, the trial use of SEVs could offer the opportunity to show potential areas ofapplication in companies that have not yet considered them.
The acceptance of electric cargo bikes in combination with innovative citylogistics concepts, such as micro-hubs, is very high. Almost half of the interviewedLSPs would be willing to implement such a concept. However, acceptance dependsto a large extent on the characteristics of the transported goods and thus, on the typeand sector of the LSP. Bearing in mind, that electric cargo bikes would not be ableto transport the bulk goods of many of the interviewees, the acceptance is high.The CEP industry, in particular, shows high acceptance of this concept, whichoffers economic and environmental benefits, but increased average processing
Small Electric Vehicles in Commercial Transportation … 81
times. The necessity of fast deliveries, however, is arguable. Consequently, forLSPs, electric cargo bicycles in a micro-hub concept represent an economically andenvironmentally beneficial solution with the potential to decrease urban traffic andmake our cities greener.
Acknowledgements This contribution was written in the framework of the ProfilregionMobilitätssysteme Karlsruhe, which is funded by the State Ministry of Economic Affairs, Labourand Housing in Baden-Württemberg, and as a national High Performance Center by theFraunhofer-Gesellschaft.
References
1. Fu, J., Jenelius, E.: Transport efficiency of off-peak urban goods deliveries: a Stockholm pilotstudy case studies on transport policy 6, 156–66 (2018)
2. Kampker, A., Deutskens, C., Maue, A., Hollah, A.: Elektromobile Logistik. In: Deckert, D.(ed.) CSR und Logistik. Spannungsfelder Green Logistics und City-Logistik, 1st edn,pp. 293–308. Springer Gabler (Management Series Corporate Social Responsibility), Berlin,Heidelberg (2016)
3. EEA: National emissions reported to the convention on long-range transboundary airpollution (LRTAP Convention). European Environment Agency, Copenhagen (2018)
4. Holguín-Veras, J., et al.: Direct impacts of off-hour deliveries on urban freight emissions.Transp. Res. Part D: Transp. Environ. 61, 84–103 (2018)
5. Prümm, D., Kauschke, P., Peiseler, H.: Aufbruch auf der letzten Meile. PricewaterhouseCoopersGmbH Wirtschaftsprüfungsgesellschaft, Neue Wege für die Städtische Logistik (2017)
6. Rumscheidt, S.: Die letzte Meile als Herausforderung für den Handel - ifo Schnelldienst 72(1), 46–49 (2019)
7. Brost, M., Ewert, A., Schmid, S., Eisenmann, C., Gruber, J., Klauenberg, J.: ElektrischeKlein-und Leichtfahrzeuge: Chancen und Potenziale für Baden-Württemberg. Studie imAuftrag der e-mobil BW (2019)
8. BIEK: Innovationen auf der letzten Meile: Kurier-, Express- Paketdienste (2017)9. Graf, H.-W.: Optimierung des Wechselbrückentransports - ein Spezialfall der Tourenplanung
Große Netze der Logistik: Die Ergebnisse des Sonderforschungsbereichs 559 ed P Buchholzand U Clausen (Berlin: Springer), pp. 101–28 (2009)
10. RYTLE GmbH: MOVR: Technische Daten, (2019). https://rytle.de/movr/. Last Accessed 2Oct 2019
11. KRONE GmbH & Co. KG: Dry Box: Typ: WK7,3 STG (2018)12. Holguín-Veras, J., et al.: The New York City off-hour delivery program: a business and
community-friendly sustainability program. Interfaces 48, 70–86 (2018)13. Bogdanski, R.: Quantitative Untersuchung der konsolidierten Zustellung auf der letzten Meile
(2019)14. Arndt, W.-H.: Trends im urbanen Lieferverkehr Lieferkonzepte in Quartieren - die letzte
Meile nachhaltig gestalten: Lösungen mit Lastenrädern, Cargo Cruisern und Mikro-Hubs edW-H Arndt and T Klein (Berlin Difu), pp. 5–9 (2018)
15. Moll, C.: Nachhaltige Dienstleistungsinnovationen in der Logistik: Ein Ansatz zurEntwicklung von Entscheidungsmodellen. Springer Fachmedien Wiesbaden, Wiesbaden(2019)
16. Rosenberger, T., et al.: Der Lastauto Omnibus Katalog 2018. EuroTransportMedia Verlags-und Veranstaltungs-GmbH, Stuttgart (2017)
17. Mercedes-Benz, A.G.: Der neue Sprinter - Kastenwagen Tourer Fahrgestelle: Preisliste.Gültig ab 8. Februar 2018. Daimler AG (2018)
82 T. Hettesheimer et al.
18. Wietschel, M., et al.: Machbarkeitsstudie zur Ermittlung der Potentiale desHybrid-Oberleitungs-Lkw. Fraunhofer ISI, Karlsruhe (2017)
19. IEA: World Energy Outlook 2018, International Energy Agency (2018)20. Bundesverband der Energie und Wasserwirtschaft e. V., BDEW (2019) BDEW-
Strompreisanalyse Juli 2019: Haushalte und Industrie, Berlin21. Gerbert, P., et al.: Klimapfade für Deutschland, BCG and Prognos AG (2018)22. Onat, N.C., Kucukvar, M., Tatari, O.: Conventional, hybrid, plug-in hybrid or electric
vehicles? State-based comparative carbon and energy footprint analysis in the United States.Appl. Energy 150, 36–49 (2015)
23. citkar GmbH: Loadster: Der Loadster All-Inclusive, (2019). https://loadster.org/produkt/loadster-all-inclusive/. Last Accessed 6 Nov 2019
24. Hacker, F., Waldenfels, R., Mottschall, M.: Wirtschaftlichkeit von Elektromobilität ingewerblichen Anwendungen: Betrachtung von Gesamtnutzungskosten, ökonomischenPotenzialen und möglicher CO2-Minderung, Öko-Instiut e.V (2015)
25. NPE: Ladeinfrastruktur für Elektrofahrzeuge in Deutschland: Statusbericht undHandlungsempfehlungen 2015, Berlin (2015)
26. Urban-e GmbH & Co.KG: Urban-e: Cargo eBikes for professionals!: KEP10, (2019). https://www.urban-e.eu/. Last Accessed 2 Oct 2019
27. Schroeder, A., Traber, T.: The economics of fast charging infrastructure for electric vehicles.Energy Policy 43, 136–144 (2012)
28. Holguín-Veras, J., et al.: Fostering unassisted off-hour deliveries: the role of incentives.Transp. Res. Part A: Policy Pract. 102, 172–187 (2017)
29. Bienzeisler, B., Bauer, M., Mauch, L.: Screening City-Logistik. Europaweites Screeningaktueller City-Logistik-Konzepte, Fraunhofer IAO (2018)
30. Dolati Neghabadi, P., Evrard Samuel, K., Espinouse, M.-L.: Systematic literature review oncity logistics: overview, classification and analysis. Int. J. Prod. Res. 57(3), 865–887 (2019)
Open Access This chapter is licensed under the terms of the Creative Commons Attribution 4.0International License (http://creativecommons.org/licenses/by/4.0/), which permits use, sharing,adaptation, distribution and reproduction in any medium or format, as long as you give appropriatecredit to the original author(s) and the source, provide a link to the Creative Commons license andindicate if changes were made.The images or other third party material in this chapter are included in the chapter’s Creative
Commons license, unless indicated otherwise in a credit line to the material. If material is notincluded in the chapter’s Creative Commons license and your intended use is not permitted bystatutory regulation or exceeds the permitted use, you will need to obtain permission directly fromthe copyright holder.
Small Electric Vehicles in Commercial Transportation … 83
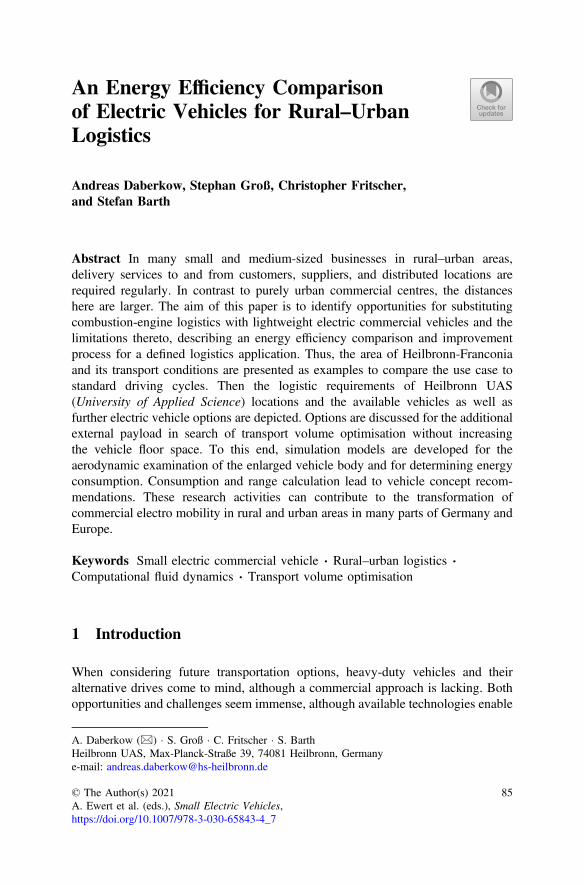
An Energy Efficiency Comparisonof Electric Vehicles for Rural–UrbanLogistics
Andreas Daberkow, Stephan Groß, Christopher Fritscher,and Stefan Barth
Abstract In many small and medium-sized businesses in rural–urban areas,delivery services to and from customers, suppliers, and distributed locations arerequired regularly. In contrast to purely urban commercial centres, the distanceshere are larger. The aim of this paper is to identify opportunities for substitutingcombustion-engine logistics with lightweight electric commercial vehicles and thelimitations thereto, describing an energy efficiency comparison and improvementprocess for a defined logistics application. Thus, the area of Heilbronn-Franconiaand its transport conditions are presented as examples to compare the use case tostandard driving cycles. Then the logistic requirements of Heilbronn UAS(University of Applied Science) locations and the available vehicles as well asfurther electric vehicle options are depicted. Options are discussed for the additionalexternal payload in search of transport volume optimisation without increasingthe vehicle floor space. To this end, simulation models are developed for theaerodynamic examination of the enlarged vehicle body and for determining energyconsumption. Consumption and range calculation lead to vehicle concept recom-mendations. These research activities can contribute to the transformation ofcommercial electro mobility in rural and urban areas in many parts of Germany andEurope.
Keywords Small electric commercial vehicle � Rural–urban logistics �Computational fluid dynamics � Transport volume optimisation
1 Introduction
When considering future transportation options, heavy-duty vehicles and theiralternative drives come to mind, although a commercial approach is lacking. Bothopportunities and challenges seem immense, although available technologies enable
A. Daberkow (&) � S. Groß � C. Fritscher � S. BarthHeilbronn UAS, Max-Planck-Straße 39, 74081 Heilbronn, Germanye-mail: [email protected]
© The Author(s) 2021A. Ewert et al. (eds.), Small Electric Vehicles,https://doi.org/10.1007/978-3-030-65843-4_7
85
change towards more sustainable transport for the vast majority (76%, [1]) ofcommercial vehicles in Europe. The sub-3500 kg-N1-class of commercial vehiclesdefined by EU regulations [2] does not cover long-distance freight shipping andonly handles local to rural individual end-customer supply. This class with payloadscomparable to passenger cars still lacks alternative powertrains (<2% [1]), despitethe continuously rising share of electric passenger car production (12% of theGerman Car Industry by April 2020, [3]). Road logistics powertrain electrificationhas slowly been growing [4]; particularly on shorter tracks, electric commercialvehicles have come into mass use [5], due to stricter emission limits. Moreover,battery electric vehicles (BEV) hold the potential of logistics cost reduction [6].
The possibility of concept transfer from passenger BEVs to rural transportersand application of the ecological imperatives begs the question of how to select themost appropriate vehicle for the particular application, which is answered in thefollowing paragraphs.
1.1 Developments in Rural BEV Application
In the field of inner-city delivery traffic with light commercial vehicles [7, 8], asalso for heavy commercial vehicles on the “last mile” in urban distribution traffic [9,10], there have already been numerous developments, investigations, and studies.Delivery services are increasingly employing electric vehicles in cities [11, 12].
The range of electrically powered commercial vehicles limits their use initially tourban areas. Hardly any scientific publications have investigated the potential ofcommercial BEVs in rural–urban areas. The “eMiniVanH” project established bythe Ministry of Economic Affairs Baden-Wuerttemberg aims to fill this gap.
Important features of vehicles used in rural–urban areas are longer distances andhigher driving speeds. Daberkow and Häussler [13] describe the usability of lightelectric passenger cars in this rural–urban area, as a first investigation. They rangein variety from specially developed research vehicles [14, 15] to models alreadyavailable on the market from well-known vehicle manufacturers. A collection ofsome small electrical vehicles is given by Brost et al. [16].
The application of such vehicles in courier and parcel delivery services creates ademand for a daily range of 30–800 km [17, p. 171]. By limiting these drivingprofiles to more task-related parcel services, the range requirement shrinks to 30–360 km, with average speeds up to 60 kmh−1, soon to be covered by commonBEVs.
N1 light-duty BEVs try to enter a most competitive market segment, whicheliminated several small companies and small series of large OEMs. Therefore, thefollowing legally highway-suitable vehicles are all considered, and chosen asrepresentative types for further discussion because they differ significantly in sizeand load volume: the Renault Kangoo Zero Emission (2013–2017), an electrifiedhigh roof station wagon; the Streetscooter Work Box (2015–2020), solely batteryelectric, developed for Deutsche Post AG; the Volkswagen e-up! load-up! (2013–
86 A. Daberkow et al.

2016), an electric light-duty variant of a mini car; and finally, the Volkswagen e-up!(since 2020), with its extended range facelift. From these types, a vehicle is chosenmatching the use case, which can replace a combustion vehicle most efficiently.
1.2 Facility Test Environment in Heilbronn-FranconiaRegion
The “eMiniVanH” project deals exemplarily with freight traffic between theHeilbronn UAS locations. The state of Baden-Wuerttemberg lies along the Frenchborder and is located in the southwest of Germany. The Heilbronn-Franconiaregion, see Fig. 1, covers an area of 4765 km2 with a population of roughly 0.9million, and its administrative seat is Heilbronn (population 130,000), see [18].
Heilbronn-Franconia is an important economic region. Large manufacturers likeAUDI AG as well as large suppliers like Robert Bosch GmbH contribute to theeconomic wealth of the region.
Individual mobility and public transportation are key aspects of the region. UAShas purchased and operates a VW e-up! load-up! model as representative of a smallelectric commercial vehicle, see Fig. 2 left and middle.
This special vehicle has a continuous cargo area instead of the rear row of seats.With 60 kW drive power and an installed battery capacity of 18.7 kWh, thiscompact vehicle (length 3540 mm according to VW AG [20]) is eminently suited tourban as well as rural areas. The initial tests were made for parcel and mail transportsubstitution (see Fig. 2 on the right). As the standard freight consists of a few post
Fig. 1 Heilbronn landscape [19] and rural–urban location of Heilbronn-Franconia region [18]
Fig. 2 Volkswagen e-up! load-up! with cargo compartment (left and middle) and a typicalexample of parcel and mail transport with an internal combustion-engine-powered transporter(right)
An Energy Efficiency Comparison of Electric Vehicles … 87
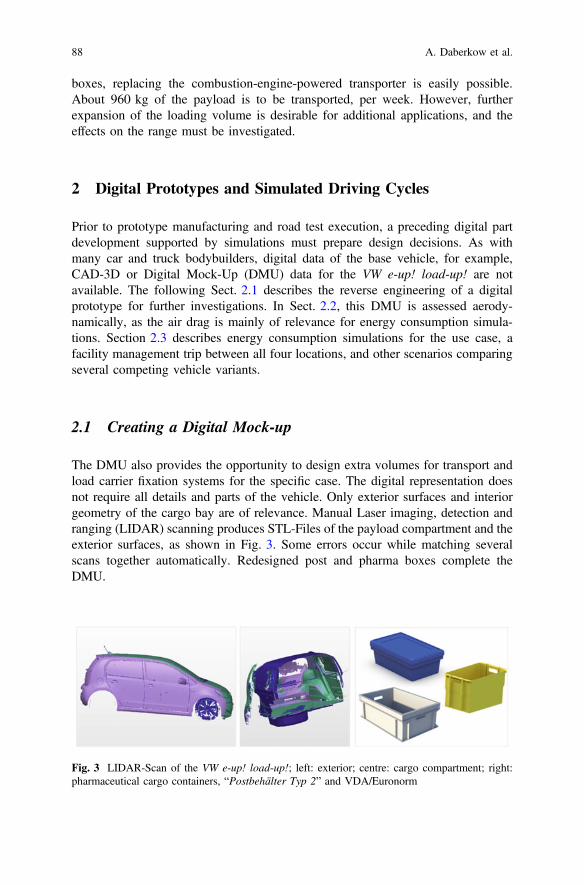
boxes, replacing the combustion-engine-powered transporter is easily possible.About 960 kg of the payload is to be transported, per week. However, furtherexpansion of the loading volume is desirable for additional applications, and theeffects on the range must be investigated.
2 Digital Prototypes and Simulated Driving Cycles
Prior to prototype manufacturing and road test execution, a preceding digital partdevelopment supported by simulations must prepare design decisions. As withmany car and truck bodybuilders, digital data of the base vehicle, for example,CAD-3D or Digital Mock-Up (DMU) data for the VW e-up! load-up! are notavailable. The following Sect. 2.1 describes the reverse engineering of a digitalprototype for further investigations. In Sect. 2.2, this DMU is assessed aerody-namically, as the air drag is mainly of relevance for energy consumption simula-tions. Section 2.3 describes energy consumption simulations for the use case, afacility management trip between all four locations, and other scenarios comparingseveral competing vehicle variants.
2.1 Creating a Digital Mock-up
The DMU also provides the opportunity to design extra volumes for transport andload carrier fixation systems for the specific case. The digital representation doesnot require all details and parts of the vehicle. Only exterior surfaces and interiorgeometry of the cargo bay are of relevance. Manual Laser imaging, detection andranging (LIDAR) scanning produces STL-Files of the payload compartment and theexterior surfaces, as shown in Fig. 3. Some errors occur while matching severalscans together automatically. Redesigned post and pharma boxes complete theDMU.
Fig. 3 LIDAR-Scan of the VW e-up! load-up!; left: exterior; centre: cargo compartment; right:pharmaceutical cargo containers, “Postbehälter Typ 2” and VDA/Euronorm
88 A. Daberkow et al.
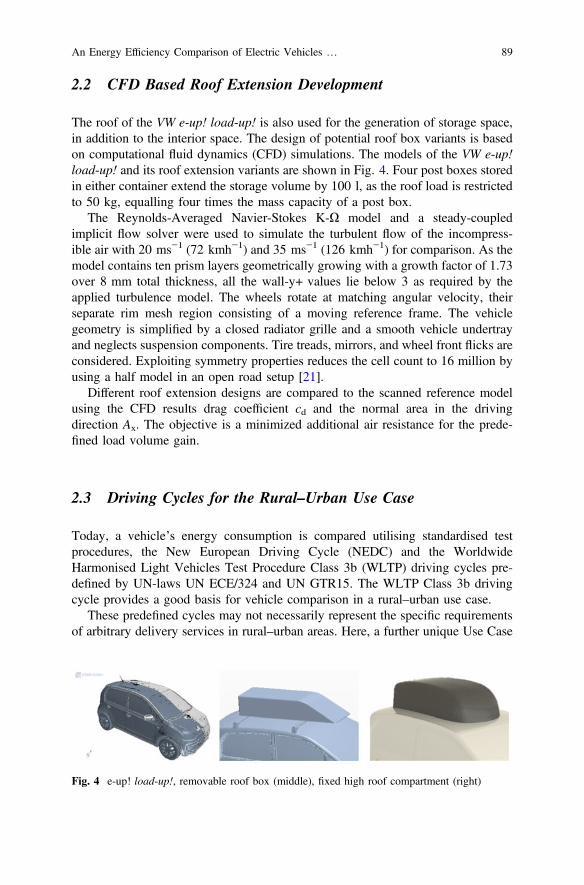
2.2 CFD Based Roof Extension Development
The roof of the VW e-up! load-up! is also used for the generation of storage space,in addition to the interior space. The design of potential roof box variants is basedon computational fluid dynamics (CFD) simulations. The models of the VW e-up!load-up! and its roof extension variants are shown in Fig. 4. Four post boxes storedin either container extend the storage volume by 100 l, as the roof load is restrictedto 50 kg, equalling four times the mass capacity of a post box.
The Reynolds-Averaged Navier-Stokes K-X model and a steady-coupledimplicit flow solver were used to simulate the turbulent flow of the incompress-ible air with 20 ms−1 (72 kmh−1) and 35 ms−1 (126 kmh−1) for comparison. As themodel contains ten prism layers geometrically growing with a growth factor of 1.73over 8 mm total thickness, all the wall-y+ values lie below 3 as required by theapplied turbulence model. The wheels rotate at matching angular velocity, theirseparate rim mesh region consisting of a moving reference frame. The vehiclegeometry is simplified by a closed radiator grille and a smooth vehicle undertrayand neglects suspension components. Tire treads, mirrors, and wheel front flicks areconsidered. Exploiting symmetry properties reduces the cell count to 16 million byusing a half model in an open road setup [21].
Different roof extension designs are compared to the scanned reference modelusing the CFD results drag coefficient cd and the normal area in the drivingdirection Ax. The objective is a minimized additional air resistance for the prede-fined load volume gain.
2.3 Driving Cycles for the Rural–Urban Use Case
Today, a vehicle’s energy consumption is compared utilising standardised testprocedures, the New European Driving Cycle (NEDC) and the WorldwideHarmonised Light Vehicles Test Procedure Class 3b (WLTP) driving cycles pre-defined by UN-laws UN ECE/324 and UN GTR15. The WLTP Class 3b drivingcycle provides a good basis for vehicle comparison in a rural–urban use case.
These predefined cycles may not necessarily represent the specific requirementsof arbitrary delivery services in rural–urban areas. Here, a further unique Use Case
Fig. 4 e-up! load-up!, removable roof box (middle), fixed high roof compartment (right)
An Energy Efficiency Comparison of Electric Vehicles … 89
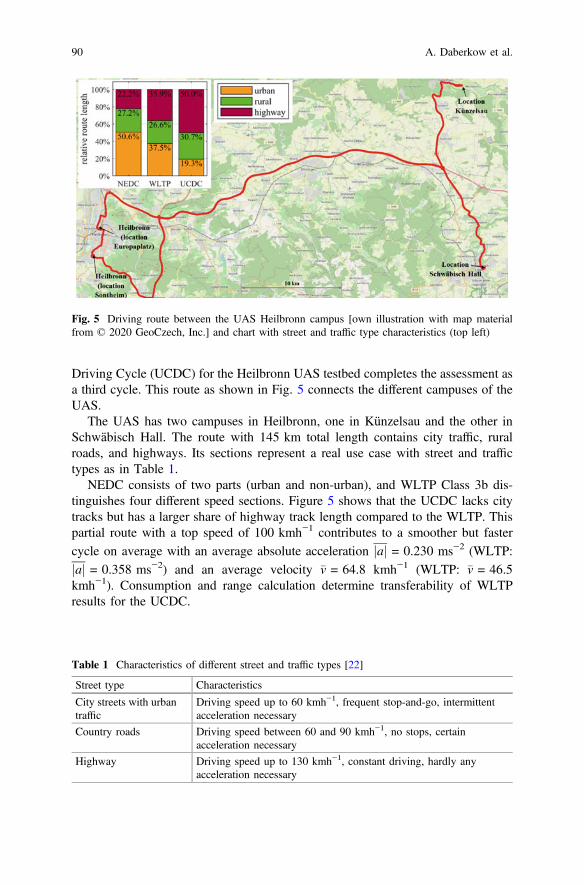
Driving Cycle (UCDC) for the Heilbronn UAS testbed completes the assessment asa third cycle. This route as shown in Fig. 5 connects the different campuses of theUAS.
The UAS has two campuses in Heilbronn, one in Künzelsau and the other inSchwäbisch Hall. The route with 145 km total length contains city traffic, ruralroads, and highways. Its sections represent a real use case with street and traffictypes as in Table 1.
NEDC consists of two parts (urban and non-urban), and WLTP Class 3b dis-tinguishes four different speed sections. Figure 5 shows that the UCDC lacks citytracks but has a larger share of highway track length compared to the WLTP. Thispartial route with a top speed of 100 kmh−1 contributes to a smoother but fastercycle on average with an average absolute acceleration aj j = 0.230 ms−2 (WLTP:aj j = 0.358 ms−2) and an average velocity �v = 64.8 kmh−1 (WLTP: �v = 46.5kmh−1). Consumption and range calculation determine transferability of WLTPresults for the UCDC.
Fig. 5 Driving route between the UAS Heilbronn campus [own illustration with map materialfrom © 2020 GeoCzech, Inc.] and chart with street and traffic type characteristics (top left)
Table 1 Characteristics of different street and traffic types [22]
Street type Characteristics
City streets with urbantraffic
Driving speed up to 60 kmh−1, frequent stop-and-go, intermittentacceleration necessary
Country roads Driving speed between 60 and 90 kmh−1, no stops, certainacceleration necessary
Highway Driving speed up to 130 kmh−1, constant driving, hardly anyacceleration necessary
90 A. Daberkow et al.
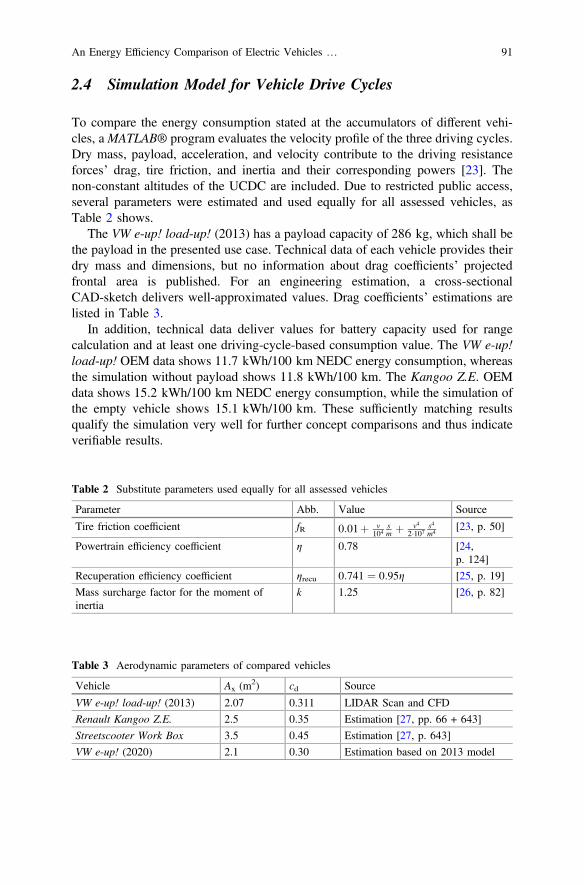
2.4 Simulation Model for Vehicle Drive Cycles
To compare the energy consumption stated at the accumulators of different vehi-cles, aMATLAB® program evaluates the velocity profile of the three driving cycles.Dry mass, payload, acceleration, and velocity contribute to the driving resistanceforces’ drag, tire friction, and inertia and their corresponding powers [23]. Thenon-constant altitudes of the UCDC are included. Due to restricted public access,several parameters were estimated and used equally for all assessed vehicles, asTable 2 shows.
The VW e-up! load-up! (2013) has a payload capacity of 286 kg, which shall bethe payload in the presented use case. Technical data of each vehicle provides theirdry mass and dimensions, but no information about drag coefficients’ projectedfrontal area is published. For an engineering estimation, a cross-sectionalCAD-sketch delivers well-approximated values. Drag coefficients’ estimations arelisted in Table 3.
In addition, technical data deliver values for battery capacity used for rangecalculation and at least one driving-cycle-based consumption value. The VW e-up!load-up! OEM data shows 11.7 kWh/100 km NEDC energy consumption, whereasthe simulation without payload shows 11.8 kWh/100 km. The Kangoo Z.E. OEMdata shows 15.2 kWh/100 km NEDC energy consumption, while the simulation ofthe empty vehicle shows 15.1 kWh/100 km. These sufficiently matching resultsqualify the simulation very well for further concept comparisons and thus indicateverifiable results.
Table 2 Substitute parameters used equally for all assessed vehicles
Parameter Abb. Value Source
Tire friction coefficient fR 0:01þ v104
sm þ v4
2�107s4m4
[23, p. 50]
Powertrain efficiency coefficient η 0.78 [24,p. 124]
Recuperation efficiency coefficient ηrecu 0:741 ¼ 0:95g [25, p. 19]
Mass surcharge factor for the moment ofinertia
k 1.25 [26, p. 82]
Table 3 Aerodynamic parameters of compared vehicles
Vehicle Ax (m2) cd Source
VW e-up! load-up! (2013) 2.07 0.311 LIDAR Scan and CFD
Renault Kangoo Z.E. 2.5 0.35 Estimation [27, pp. 66 + 643]
Streetscooter Work Box 3.5 0.45 Estimation [27, p. 643]
VW e-up! (2020) 2.1 0.30 Estimation based on 2013 model
An Energy Efficiency Comparison of Electric Vehicles … 91
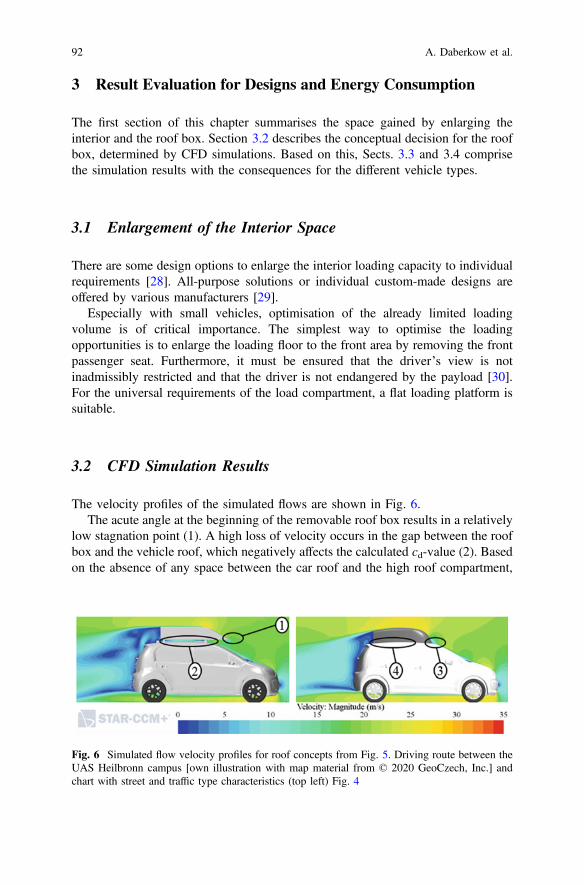
3 Result Evaluation for Designs and Energy Consumption
The first section of this chapter summarises the space gained by enlarging theinterior and the roof box. Section 3.2 describes the conceptual decision for the roofbox, determined by CFD simulations. Based on this, Sects. 3.3 and 3.4 comprisethe simulation results with the consequences for the different vehicle types.
3.1 Enlargement of the Interior Space
There are some design options to enlarge the interior loading capacity to individualrequirements [28]. All-purpose solutions or individual custom-made designs areoffered by various manufacturers [29].
Especially with small vehicles, optimisation of the already limited loadingvolume is of critical importance. The simplest way to optimise the loadingopportunities is to enlarge the loading floor to the front area by removing the frontpassenger seat. Furthermore, it must be ensured that the driver’s view is notinadmissibly restricted and that the driver is not endangered by the payload [30].For the universal requirements of the load compartment, a flat loading platform issuitable.
3.2 CFD Simulation Results
The velocity profiles of the simulated flows are shown in Fig. 6.The acute angle at the beginning of the removable roof box results in a relatively
low stagnation point (1). A high loss of velocity occurs in the gap between the roofbox and the vehicle roof, which negatively affects the calculated cd-value (2). Basedon the absence of any space between the car roof and the high roof compartment,
Fig. 6 Simulated flow velocity profiles for roof concepts from Fig. 5. Driving route between theUAS Heilbronn campus [own illustration with map material from © 2020 GeoCzech, Inc.] andchart with street and traffic type characteristics (top left) Fig. 4
92 A. Daberkow et al.
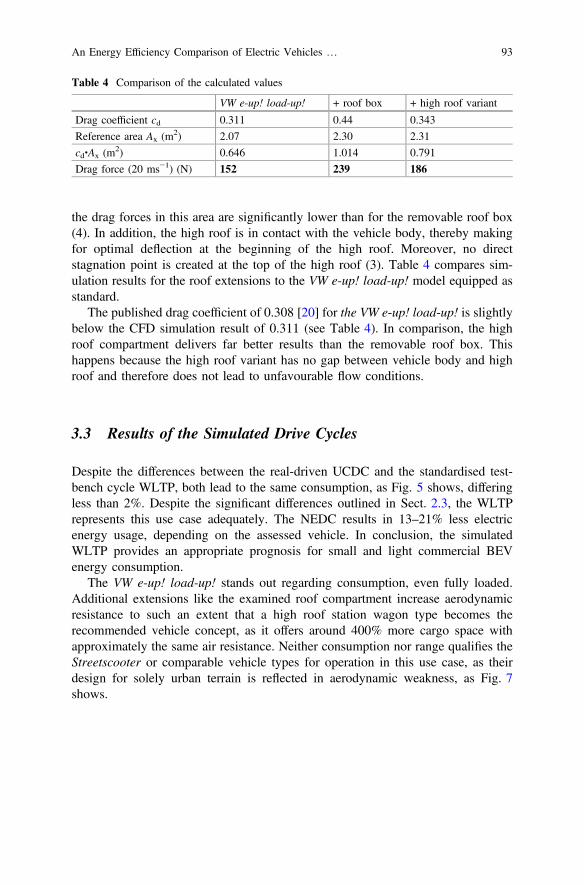
the drag forces in this area are significantly lower than for the removable roof box(4). In addition, the high roof is in contact with the vehicle body, thereby makingfor optimal deflection at the beginning of the high roof. Moreover, no directstagnation point is created at the top of the high roof (3). Table 4 compares sim-ulation results for the roof extensions to the VW e-up! load-up! model equipped asstandard.
The published drag coefficient of 0.308 [20] for the VW e-up! load-up! is slightlybelow the CFD simulation result of 0.311 (see Table 4). In comparison, the highroof compartment delivers far better results than the removable roof box. Thishappens because the high roof variant has no gap between vehicle body and highroof and therefore does not lead to unfavourable flow conditions.
3.3 Results of the Simulated Drive Cycles
Despite the differences between the real-driven UCDC and the standardised test-bench cycle WLTP, both lead to the same consumption, as Fig. 5 shows, differingless than 2%. Despite the significant differences outlined in Sect. 2.3, the WLTPrepresents this use case adequately. The NEDC results in 13–21% less electricenergy usage, depending on the assessed vehicle. In conclusion, the simulatedWLTP provides an appropriate prognosis for small and light commercial BEVenergy consumption.
The VW e-up! load-up! stands out regarding consumption, even fully loaded.Additional extensions like the examined roof compartment increase aerodynamicresistance to such an extent that a high roof station wagon type becomes therecommended vehicle concept, as it offers around 400% more cargo space withapproximately the same air resistance. Neither consumption nor range qualifies theStreetscooter or comparable vehicle types for operation in this use case, as theirdesign for solely urban terrain is reflected in aerodynamic weakness, as Fig. 7shows.
Table 4 Comparison of the calculated values
VW e-up! load-up! + roof box + high roof variant
Drag coefficient cd 0.311 0.44 0.343
Reference area Ax (m2) 2.07 2.30 2.31
cd∙Ax (m2) 0.646 1.014 0.791
Drag force (20 ms−1) (N) 152 239 186
An Energy Efficiency Comparison of Electric Vehicles … 93
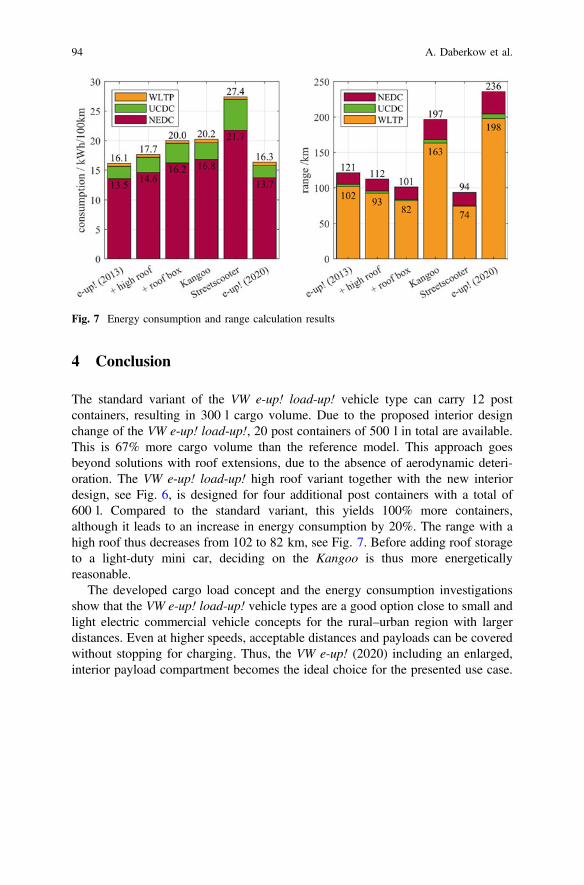
4 Conclusion
The standard variant of the VW e-up! load-up! vehicle type can carry 12 postcontainers, resulting in 300 l cargo volume. Due to the proposed interior designchange of the VW e-up! load-up!, 20 post containers of 500 l in total are available.This is 67% more cargo volume than the reference model. This approach goesbeyond solutions with roof extensions, due to the absence of aerodynamic deteri-oration. The VW e-up! load-up! high roof variant together with the new interiordesign, see Fig. 6, is designed for four additional post containers with a total of600 l. Compared to the standard variant, this yields 100% more containers,although it leads to an increase in energy consumption by 20%. The range with ahigh roof thus decreases from 102 to 82 km, see Fig. 7. Before adding roof storageto a light-duty mini car, deciding on the Kangoo is thus more energeticallyreasonable.
The developed cargo load concept and the energy consumption investigationsshow that the VW e-up! load-up! vehicle types are a good option close to small andlight electric commercial vehicle concepts for the rural–urban region with largerdistances. Even at higher speeds, acceptable distances and payloads can be coveredwithout stopping for charging. Thus, the VW e-up! (2020) including an enlarged,interior payload compartment becomes the ideal choice for the presented use case.
Fig. 7 Energy consumption and range calculation results
94 A. Daberkow et al.
References
1. Adolf, J., Balzer, C., Haase, F., Lenz, B., Lischke, A., Knitschky, G.: Shell commercialvehicle study. Shell Deutschland Oil GmbH, Hamburg. https://bit.ly/3ej0M6B (2016)
2. N.N.: Commission Regulation (EU) No. 678/2011 of 2011/07/143. VDA-Homepage. https://bit.ly/3cYWUq4. Accessed 2020/04/264. Witzig, J., Wenger, M., Januschevski, R.: Elektrischer Zentralantrieb für Nutzfahrzeuge. In:
MTZ—Motortechnische Zeitschrift, vol. 10 (2018)5. Burkert, A.: Elektroantrieb im Nutzfahrzeug. In: MTZ—Motortechnische Zeitschrift, vol.
06 (2019)6. Kampker, A., Deutskens, C., Müller, P., Müller, T.: Reduzierung der Gesamtbetriebskosten
durch den Einsatz von Elektrofahrzeugen. In: ATZ—Automobiltechnische Zeitschrift, vol.03 (2015)
7. Gumpoltsberger, G., Pollmeyer, S., Neu, A., Hirzmann, G.: Plattform für urbane undautomatisierte Elektrofahrzeuge. In: ATZ—Automobiltechnische Zeitschrift, vol. 03 (2017)
8. Höfer, A., Esl, E., Türk, D.-A., Hüttinger, V.: Innovative Fahrzeugkonzepte für Shanghaisletzte Meile. In: ATZ—Automobiltechnische Zeitschrift, vol. 06 (2015)
9. Zellinger, M., Wohlfarth, E.: Lokal emissionsfreier und leiser Güterverkehr mit demMercedes-Benz eActros. In: MTZ—Motortechnische Zeitschrift, vol. 06 (2018)
10. Schäfer, P.: Volvo Trucks stellt zwei schwere Elektro-Lkw vor. In: Springer-Professionals.https://bit.ly/2KK6UHG. Accessed 2020/04/26
11. Schlott, S.: Entwicklungspfade zum CO2-neutralen Güterverkehr. In: MTZ—Motortechnische Zeitschrift, vol. 05 (2020)
12. Schäfer, P.: UPS bestellt 10.000 Elektro-Transporter von Arrival. In: Springer Professionals.https://bit.ly/3aTpyHK. Accessed 2020/04/26
13. Daberkow, A., Häussler, S.: Electric car operation in mixed urban-regional areas. In: 13thEAEC FISITA conference, 13–16th June, Valencia (2011)
14. Pautzke, F., Schäfer, C., Rischel, W., Zöllner, H., Woeste, G.: Zweckgerichtete Entwicklungeines elektro-Kleintransporter. In: ATZ—Automobiltechnische Zeitschrift, vol. 03 (2011)
15. Lesemann, M., Welfers, T., Mohrmann, B., Eckstein, L.: Konzeption und Aufbau eineselektrischen Lieferfahrzeugs. In: ATZ—Automobiltechnische Zeitschrift, vol. 09 (2014)
16. Brost, M., Ewert, A., Schmid, S., Eisenmann, C., Gruber, J., Klauenberg, J., Stieler, S.:Elektrische Klein- und Leichtfahrzeuge—Chancen und Potenziale für Baden-Württemberg
17. Ludanek, H.: Fahrzeuganforderungen bei leichten Nutzfahrzeugen für den inner- undaußerstädtischen Lieferverkehr. In: Karosseriebautage Hamburg, Springer-Vieweg,Wiesbaden (2017)
18. Lage der Region Heilbronn-Franken in Deutschland. By TUBS—Own work, CC BY-SA 3.0.https://commons.wikimedia.org/w/index.php?curid=6334766. Accessed 2020/08/21
19. Heilbronn and surroundings seen from the Michaelsberg. By K. Jähne—Own work, CCBY-SA 3.0. https://commons.wikimedia.org/w/index.php?curid=7992303. Accessed 2020/08/21
20. N.N.: Selbststudienprogramm SSP Der e-up! Volkswagen, Wolfsburg (2014)21. External Aerodynamics with STAR-CCM + Best Practice Guidelines (v2019.02),
Siemens AG (2019)22. Commission Regulation (EU) No. 427/2016, Real Driving Emissions (RDE)23. Braess, H.-H., Seiffert, U.: Vieweg Handbuch Kraftfahrzeugtechnik. Springer Vieweg,
Wiesbaden (2013)24. Grunditz, E.A.: Design and assessment of battery electric vehicle powertrain, with respect to
performance, energy consumption and electric motor thermal capability. Thesis for the degreeof Doctor of Philosophy, Chalmers University of Technology, Göteborg, Sweden 2016
25. Kurzweil, P., Dietlmeier, O.K.: Elektrochemische Speicher. Springer Vieweg, Wiesbaden(2015)
An Energy Efficiency Comparison of Electric Vehicles … 95
26. Mitschke, M., Wallentowitz, H.: Dynamik der Kraftfahrzeuge. Springer Vieweg, Wiesbaden(2014)
27. Schütz, T.: Hucho—Aerodynamik des Automobils. Springer Vieweg, Wiesbaden (2008)28. Hoepke, E.: Nutzfahrzeugtechnik. Springer Vieweg, Wiesbaden (2016)29. Diercks, J.: Servicesicherung und Kostensenkung durch Logistik. Gabler Verlag, Wiesbaden
(1985)30. StVZO § 19 Abs. 2, StVO § 22 Abs. 1 and § 23 Abs. 1 (German Law)
Open Access This chapter is licensed under the terms of the Creative Commons Attribution 4.0International License (http://creativecommons.org/licenses/by/4.0/), which permits use, sharing,adaptation, distribution and reproduction in any medium or format, as long as you give appropriatecredit to the original author(s) and the source, provide a link to the Creative Commons license andindicate if changes were made.The images or other third party material in this chapter are included in the chapter’s Creative
Commons license, unless indicated otherwise in a credit line to the material. If material is notincluded in the chapter’s Creative Commons license and your intended use is not permitted bystatutory regulation or exceeds the permitted use, you will need to obtain permission directly fromthe copyright holder.
96 A. Daberkow et al.
Electrification of Urban Three-WheelerTaxis in Tanzania: Combiningthe User’s Perspective and TechnicalFeasibility Challenges
Mirko Goletz , Daniel Ehebrecht , Christian Wachter ,Deborah Tolk , Barbara Lenz , Meike Kühnel ,Frank Rinderknecht, and Benedikt Hanke
Abstract This study assesses the feasibility of electric three-wheelers asmoto-taxis in Dar es Salaam, Tanzania from a socioeconomic and technical point ofview. The analysis is based on three pillars: (i) the acceptance of users (themoto-taxi drivers) for adoption, (ii) the vehicle specifications incl. battery type andsize, and (iii) the role of the charging infrastructure. Findings are based on datafrom empirical field-work; methods used are qualitative and quantitative dataanalysis and modelling. Main findings include that moto-taxi drivers, who we see asmost important adopters, are open towards electric mobility. They request howeverthat vehicles should have similar driving characteristics than their currentfuel-vehicles. As the market is very price sensitive, keeping the vehicle cost is ofhigh importance. A high potential to lower these costs is seen by offering oppor-tunity charging spots around the city. If such an infrastructure is being implementedthe combination with suitable, cost competitive vehicles makes the transformationof the vehicle market towards electrification possible.
Keywords E-mobility � Charging infrastructure � Opportunity charging � Informaltransport � Moto-taxi
M. Goletz (&) � D. Ehebrecht � B. LenzDLR-Institute of Transport Research, Rudower Chaussee 7, 12489 Berlin, Germanye-mail: [email protected]
D. Tolk � M. Kühnel � B. HankeDLR-Institute of Networked Energy Systems, Carl-Von-Ossietzky-Str. 15,26129 Oldenburg, Germany
C. Wachter � F. RinderknechtDLR-Institute of Vehicle Concepts, Pfaffenwaldring 38-40, 70569 Stuttgart, Germany
© The Author(s) 2021A. Ewert et al. (eds.), Small Electric Vehicles,https://doi.org/10.1007/978-3-030-65843-4_8
97
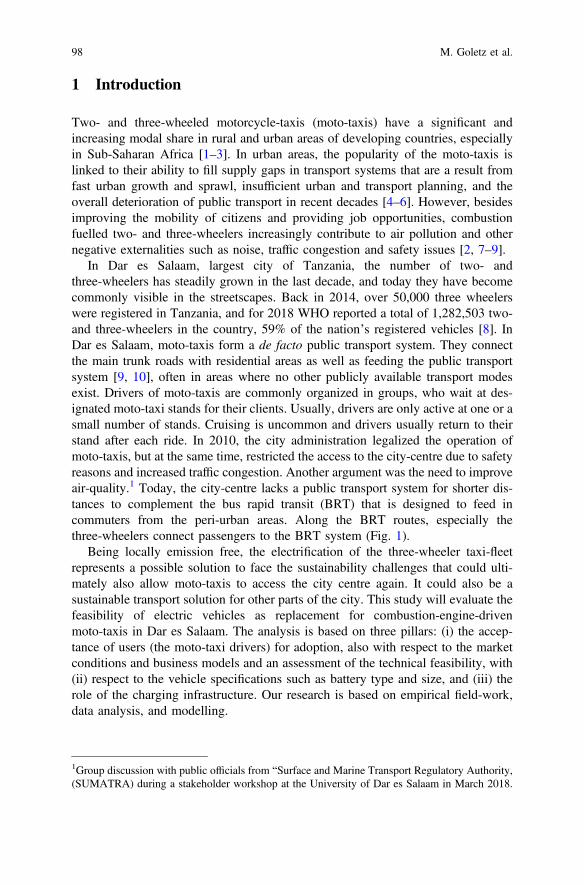
1 Introduction
Two- and three-wheeled motorcycle-taxis (moto-taxis) have a significant andincreasing modal share in rural and urban areas of developing countries, especiallyin Sub-Saharan Africa [1–3]. In urban areas, the popularity of the moto-taxis islinked to their ability to fill supply gaps in transport systems that are a result fromfast urban growth and sprawl, insufficient urban and transport planning, and theoverall deterioration of public transport in recent decades [4–6]. However, besidesimproving the mobility of citizens and providing job opportunities, combustionfuelled two- and three-wheelers increasingly contribute to air pollution and othernegative externalities such as noise, traffic congestion and safety issues [2, 7–9].
In Dar es Salaam, largest city of Tanzania, the number of two- andthree-wheelers has steadily grown in the last decade, and today they have becomecommonly visible in the streetscapes. Back in 2014, over 50,000 three wheelerswere registered in Tanzania, and for 2018 WHO reported a total of 1,282,503 two-and three-wheelers in the country, 59% of the nation’s registered vehicles [8]. InDar es Salaam, moto-taxis form a de facto public transport system. They connectthe main trunk roads with residential areas as well as feeding the public transportsystem [9, 10], often in areas where no other publicly available transport modesexist. Drivers of moto-taxis are commonly organized in groups, who wait at des-ignated moto-taxi stands for their clients. Usually, drivers are only active at one or asmall number of stands. Cruising is uncommon and drivers usually return to theirstand after each ride. In 2010, the city administration legalized the operation ofmoto-taxis, but at the same time, restricted the access to the city-centre due to safetyreasons and increased traffic congestion. Another argument was the need to improveair-quality.1 Today, the city-centre lacks a public transport system for shorter dis-tances to complement the bus rapid transit (BRT) that is designed to feed incommuters from the peri-urban areas. Along the BRT routes, especially thethree-wheelers connect passengers to the BRT system (Fig. 1).
Being locally emission free, the electrification of the three-wheeler taxi-fleetrepresents a possible solution to face the sustainability challenges that could ulti-mately also allow moto-taxis to access the city centre again. It could also be asustainable transport solution for other parts of the city. This study will evaluate thefeasibility of electric vehicles as replacement for combustion-engine-drivenmoto-taxis in Dar es Salaam. The analysis is based on three pillars: (i) the accep-tance of users (the moto-taxi drivers) for adoption, also with respect to the marketconditions and business models and an assessment of the technical feasibility, with(ii) respect to the vehicle specifications such as battery type and size, and (iii) therole of the charging infrastructure. Our research is based on empirical field-work,data analysis, and modelling.
1Group discussion with public officials from “Surface and Marine Transport Regulatory Authority,(SUMATRA) during a stakeholder workshop at the University of Dar es Salaam in March 2018.
98 M. Goletz et al.
In result, we find a high level of acceptance of electric mobility amongstmoto-taxi drivers, who currently own the vast majority of three-wheelers in Dar esSalaam. These findings however only hold if the electric vehicles fulfil the fol-lowing criteria: driving characteristics (top-speed, passenger capacity) that aresimilar to the combustion fuelled three-wheelers, a sufficient range and cost com-petitiveness. To date, no such vehicles exist on the international three-wheelermarket, and if, they would be too costly, mainly due to the battery cost that increasewith capacity. This is an obstacle for a quick adoption. We therefore continue toanalyse how battery sizing can be interlinked with charging infrastructure: Ifopportunity charging spots are installed at dedicated moto-taxi stands, the currentlyexisting adoption barriers could be reduced. This could ultimately help to fastenadoption of electric three-wheelers in Dar es Salaam.
2 Methods and Data Collection
The study builds on a mixed methods approach that relies on empirical field workfor data collection, modelling of the vehicle and power train as well as the batterystorage and charging infrastructure.
Fig. 1 Moto-taxi in Dar es Salaam. Photo taken during field trip Feb. 2019 © DLR/BenediktHanke
Electrification of Urban Three-Wheeler Taxis in Tanzania… 99
2.1 Data Collection
Four methods for data collection were applied during two field stays in Dar es Salaam(November to December 2018, February 2019): (1) A paper-pencil survey among atotal of 105 drivers at four different moto-taxi stands, located in the subwards ofMikocheni, Sinza and Mbezi was carried out. Questionnaire items included socioe-conomic profiles of drivers, vehicle data, information on vehicle ownership, incomeand operation costs, as well as service characteristics such as the estimated number oftrips per working day and regular operating hours. (2) Group discussions with rep-resentatives of two out of the four moto-taxi associations were conducted. Theexchange served to assess the drivers’ acceptance of E-mobility and to unveil potentialbenefits as well as obstacles linked to an implementation of electric three-wheelers inthe city. (3) Explorative, open interviews with key stakeholders from public author-ities, research institutions and private companies were conducted to assess regulatoryframeworks and technical feasibility of implementingE-mobility inDar esSalaamandto inquire about battery recycling capacities and the local vehicle market. (4) A GPStracking campaign, over a period of one full week in each case, was carried out amongthree-wheeler taxi operators at the four different moto-taxi stands in order to gathervehicle driving profiles. The tracking was conducted with 1 s resolution in time usingthe DLR Moving Lab.2 The drivers were asked to take notes for clarification ofmeasurement artefacts and for additional information (passengers carried per trip,refuelling). During the measurement campaign 65 individual vehicle profiles, eachrepresenting one week of driving activity, with over 18 million individual data pointscovering 33,637 km were collected (see Fig. 2).
2.2 Modelling of Vehicle and Power Train
The design of the power train for an electric three-wheeler followed a multi-stepapproach and included the following steps:
1. Internet-based market research of available electric three-wheelers (carried outin January 2019) on a global scale, to understand what vehicles are available andasses if they are suitable to be used for the use-case as moto-taxi in Dar esSalaam.
2. A workshop with moto-taxi drivers (February 2019, c.f. 2.1) with the aim toidentify needs, expectations and barriers about using electric three-wheelers.
3. Development of a power train concept reflecting the inputs from step 2.4. Set up of a simulation model for three-wheelers with the power train concept
developed in step 3 that simulates the energy demand.
2https://movinglab.dlr.de/en/.
100 M. Goletz et al.
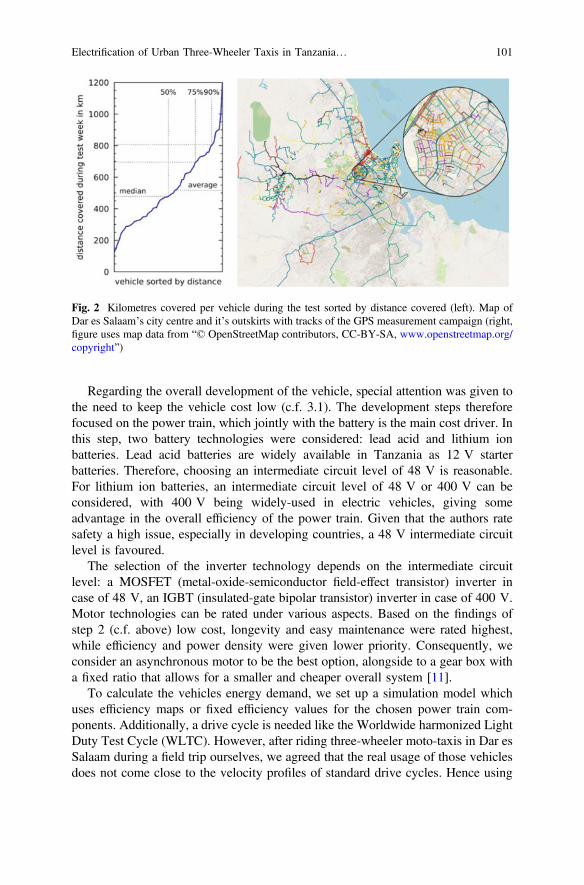
Regarding the overall development of the vehicle, special attention was given tothe need to keep the vehicle cost low (c.f. 3.1). The development steps thereforefocused on the power train, which jointly with the battery is the main cost driver. Inthis step, two battery technologies were considered: lead acid and lithium ionbatteries. Lead acid batteries are widely available in Tanzania as 12 V starterbatteries. Therefore, choosing an intermediate circuit level of 48 V is reasonable.For lithium ion batteries, an intermediate circuit level of 48 V or 400 V can beconsidered, with 400 V being widely-used in electric vehicles, giving someadvantage in the overall efficiency of the power train. Given that the authors ratesafety a high issue, especially in developing countries, a 48 V intermediate circuitlevel is favoured.
The selection of the inverter technology depends on the intermediate circuitlevel: a MOSFET (metal-oxide-semiconductor field-effect transistor) inverter incase of 48 V, an IGBT (insulated-gate bipolar transistor) inverter in case of 400 V.Motor technologies can be rated under various aspects. Based on the findings ofstep 2 (c.f. above) low cost, longevity and easy maintenance were rated highest,while efficiency and power density were given lower priority. Consequently, weconsider an asynchronous motor to be the best option, alongside to a gear box witha fixed ratio that allows for a smaller and cheaper overall system [11].
To calculate the vehicles energy demand, we set up a simulation model whichuses efficiency maps or fixed efficiency values for the chosen power train com-ponents. Additionally, a drive cycle is needed like the Worldwide harmonized LightDuty Test Cycle (WLTC). However, after riding three-wheeler moto-taxis in Dar esSalaam during a field trip ourselves, we agreed that the real usage of those vehiclesdoes not come close to the velocity profiles of standard drive cycles. Hence using
Fig. 2 Kilometres covered per vehicle during the test sorted by distance covered (left). Map ofDar es Salaam’s city centre and it’s outskirts with tracks of the GPS measurement campaign (right,figure uses map data from “© OpenStreetMap contributors, CC-BY-SA, www.openstreetmap.org/copyright”)
Electrification of Urban Three-Wheeler Taxis in Tanzania… 101
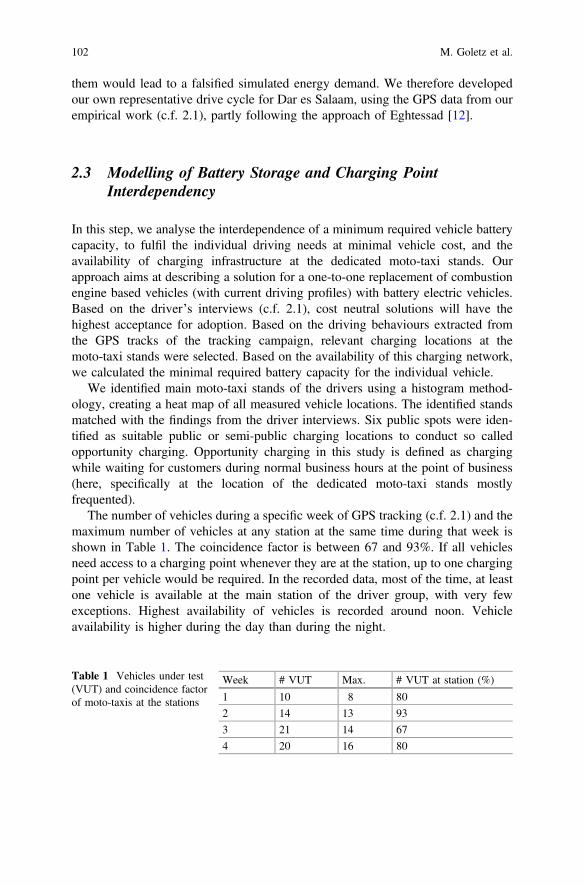
them would lead to a falsified simulated energy demand. We therefore developedour own representative drive cycle for Dar es Salaam, using the GPS data from ourempirical work (c.f. 2.1), partly following the approach of Eghtessad [12].
2.3 Modelling of Battery Storage and Charging PointInterdependency
In this step, we analyse the interdependence of a minimum required vehicle batterycapacity, to fulfil the individual driving needs at minimal vehicle cost, and theavailability of charging infrastructure at the dedicated moto-taxi stands. Ourapproach aims at describing a solution for a one-to-one replacement of combustionengine based vehicles (with current driving profiles) with battery electric vehicles.Based on the driver’s interviews (c.f. 2.1), cost neutral solutions will have thehighest acceptance for adoption. Based on the driving behaviours extracted fromthe GPS tracks of the tracking campaign, relevant charging locations at themoto-taxi stands were selected. Based on the availability of this charging network,we calculated the minimal required battery capacity for the individual vehicle.
We identified main moto-taxi stands of the drivers using a histogram method-ology, creating a heat map of all measured vehicle locations. The identified standsmatched with the findings from the driver interviews. Six public spots were iden-tified as suitable public or semi-public charging locations to conduct so calledopportunity charging. Opportunity charging in this study is defined as chargingwhile waiting for customers during normal business hours at the point of business(here, specifically at the location of the dedicated moto-taxi stands mostlyfrequented).
The number of vehicles during a specific week of GPS tracking (c.f. 2.1) and themaximum number of vehicles at any station at the same time during that week isshown in Table 1. The coincidence factor is between 67 and 93%. If all vehiclesneed access to a charging point whenever they are at the station, up to one chargingpoint per vehicle would be required. In the recorded data, most of the time, at leastone vehicle is available at the main station of the driver group, with very fewexceptions. Highest availability of vehicles is recorded around noon. Vehicleavailability is higher during the day than during the night.
Table 1 Vehicles under test(VUT) and coincidence factorof moto-taxis at the stations
Week # VUT Max. # VUT at station (%)
1 10 8 80
2 14 13 93
3 21 14 67
4 20 16 80
102 M. Goletz et al.
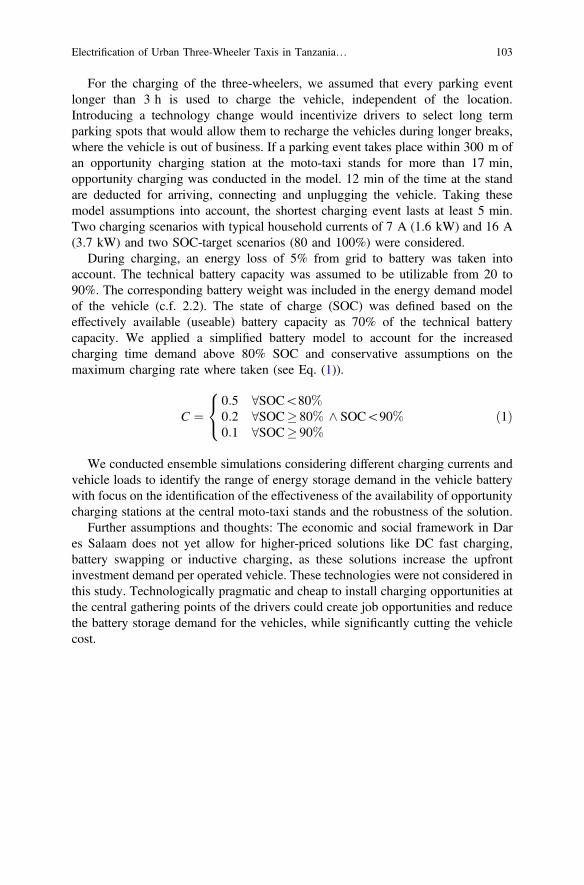
For the charging of the three-wheelers, we assumed that every parking eventlonger than 3 h is used to charge the vehicle, independent of the location.Introducing a technology change would incentivize drivers to select long termparking spots that would allow them to recharge the vehicles during longer breaks,where the vehicle is out of business. If a parking event takes place within 300 m ofan opportunity charging station at the moto-taxi stands for more than 17 min,opportunity charging was conducted in the model. 12 min of the time at the standare deducted for arriving, connecting and unplugging the vehicle. Taking thesemodel assumptions into account, the shortest charging event lasts at least 5 min.Two charging scenarios with typical household currents of 7 A (1.6 kW) and 16 A(3.7 kW) and two SOC-target scenarios (80 and 100%) were considered.
During charging, an energy loss of 5% from grid to battery was taken intoaccount. The technical battery capacity was assumed to be utilizable from 20 to90%. The corresponding battery weight was included in the energy demand modelof the vehicle (c.f. 2.2). The state of charge (SOC) was defined based on theeffectively available (useable) battery capacity as 70% of the technical batterycapacity. We applied a simplified battery model to account for the increasedcharging time demand above 80% SOC and conservative assumptions on themaximum charging rate where taken (see Eq. (1)).
C ¼0:5 8SOC\80%0:2 8SOC� 80%0:1 8SOC� 90%
^ SOC\90%
8<
:ð1Þ
We conducted ensemble simulations considering different charging currents andvehicle loads to identify the range of energy storage demand in the vehicle batterywith focus on the identification of the effectiveness of the availability of opportunitycharging stations at the central moto-taxi stands and the robustness of the solution.
Further assumptions and thoughts: The economic and social framework in Dares Salaam does not yet allow for higher-priced solutions like DC fast charging,battery swapping or inductive charging, as these solutions increase the upfrontinvestment demand per operated vehicle. These technologies were not considered inthis study. Technologically pragmatic and cheap to install charging opportunities atthe central gathering points of the drivers could create job opportunities and reducethe battery storage demand for the vehicles, while significantly cutting the vehiclecost.
Electrification of Urban Three-Wheeler Taxis in Tanzania… 103
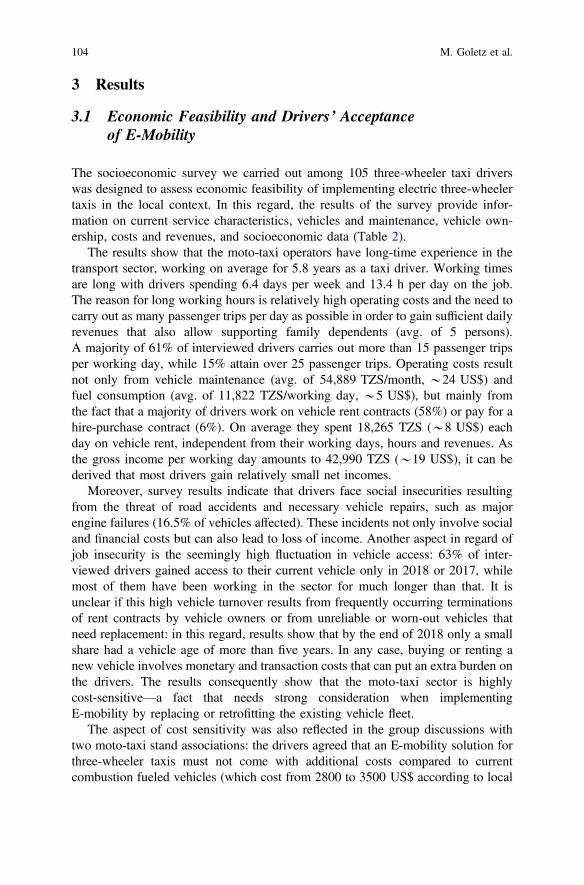
3 Results
3.1 Economic Feasibility and Drivers’ Acceptanceof E-Mobility
The socioeconomic survey we carried out among 105 three-wheeler taxi driverswas designed to assess economic feasibility of implementing electric three-wheelertaxis in the local context. In this regard, the results of the survey provide infor-mation on current service characteristics, vehicles and maintenance, vehicle own-ership, costs and revenues, and socioeconomic data (Table 2).
The results show that the moto-taxi operators have long-time experience in thetransport sector, working on average for 5.8 years as a taxi driver. Working timesare long with drivers spending 6.4 days per week and 13.4 h per day on the job.The reason for long working hours is relatively high operating costs and the need tocarry out as many passenger trips per day as possible in order to gain sufficient dailyrevenues that also allow supporting family dependents (avg. of 5 persons).A majority of 61% of interviewed drivers carries out more than 15 passenger tripsper working day, while 15% attain over 25 passenger trips. Operating costs resultnot only from vehicle maintenance (avg. of 54,889 TZS/month, *24 US$) andfuel consumption (avg. of 11,822 TZS/working day, *5 US$), but mainly fromthe fact that a majority of drivers work on vehicle rent contracts (58%) or pay for ahire-purchase contract (6%). On average they spent 18,265 TZS (*8 US$) eachday on vehicle rent, independent from their working days, hours and revenues. Asthe gross income per working day amounts to 42,990 TZS (*19 US$), it can bederived that most drivers gain relatively small net incomes.
Moreover, survey results indicate that drivers face social insecurities resultingfrom the threat of road accidents and necessary vehicle repairs, such as majorengine failures (16.5% of vehicles affected). These incidents not only involve socialand financial costs but can also lead to loss of income. Another aspect in regard ofjob insecurity is the seemingly high fluctuation in vehicle access: 63% of inter-viewed drivers gained access to their current vehicle only in 2018 or 2017, whilemost of them have been working in the sector for much longer than that. It isunclear if this high vehicle turnover results from frequently occurring terminationsof rent contracts by vehicle owners or from unreliable or worn-out vehicles thatneed replacement: in this regard, results show that by the end of 2018 only a smallshare had a vehicle age of more than five years. In any case, buying or renting anew vehicle involves monetary and transaction costs that can put an extra burden onthe drivers. The results consequently show that the moto-taxi sector is highlycost-sensitive—a fact that needs strong consideration when implementingE-mobility by replacing or retrofitting the existing vehicle fleet.
The aspect of cost sensitivity was also reflected in the group discussions withtwo moto-taxi stand associations: the drivers agreed that an E-mobility solution forthree-wheeler taxis must not come with additional costs compared to currentcombustion fueled vehicles (which cost from 2800 to 3500 US$ according to local
104 M. Goletz et al.
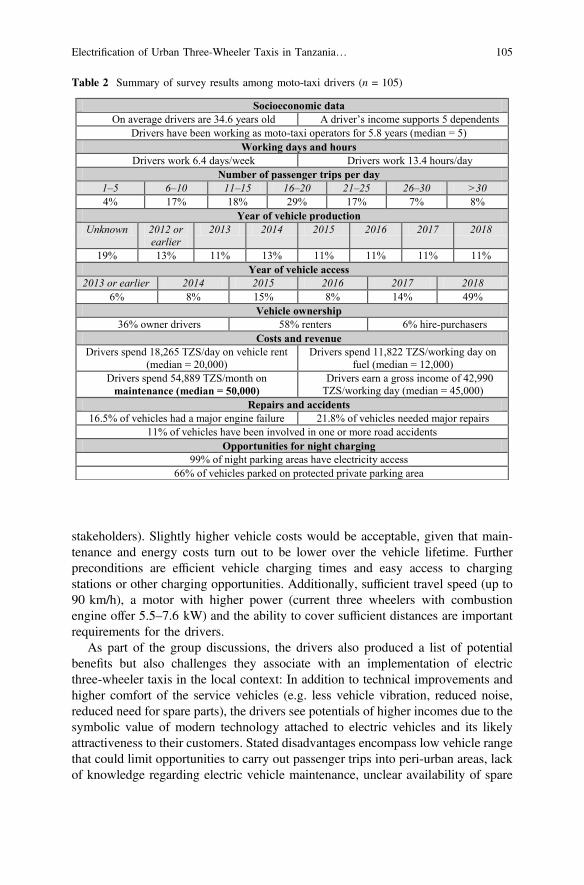
stakeholders). Slightly higher vehicle costs would be acceptable, given that main-tenance and energy costs turn out to be lower over the vehicle lifetime. Furtherpreconditions are efficient vehicle charging times and easy access to chargingstations or other charging opportunities. Additionally, sufficient travel speed (up to90 km/h), a motor with higher power (current three wheelers with combustionengine offer 5.5–7.6 kW) and the ability to cover sufficient distances are importantrequirements for the drivers.
As part of the group discussions, the drivers also produced a list of potentialbenefits but also challenges they associate with an implementation of electricthree-wheeler taxis in the local context: In addition to technical improvements andhigher comfort of the service vehicles (e.g. less vehicle vibration, reduced noise,reduced need for spare parts), the drivers see potentials of higher incomes due to thesymbolic value of modern technology attached to electric vehicles and its likelyattractiveness to their customers. Stated disadvantages encompass low vehicle rangethat could limit opportunities to carry out passenger trips into peri-urban areas, lackof knowledge regarding electric vehicle maintenance, unclear availability of spare
Table 2 Summary of survey results among moto-taxi drivers (n = 105)
Socioeconomic dataOn average drivers are 34.6 years old A driver’s income supports 5 dependents
Drivers have been working as moto-taxi operators for 5.8 years (median = 5)Working days and hours
Drivers work 6.4 days/week Drivers work 13.4 hours/dayNumber of passenger trips per day
1–5 6–10 11–15 16–20 21–25 26–30 >304% 17% 18% 29% 17% 7% 8%
Year of vehicle productionUnknown 2012 or
earlier2013 2014 2015 2016 2017 2018
19% 13% 11% 13% 11% 11% 11% 11%Year of vehicle access
2013 or earlier 2014 2015 2016 2017 20186% 8% 15% 8% 14% 49%
Vehicle ownership36% owner drivers 58% renters 6% hire-purchasers
Costs and revenueDrivers spend 18,265 TZS/day on vehicle rent
(median = 20,000)Drivers spend 11,822 TZS/working day on
fuel (median = 12,000)Drivers spend 54,889 TZS/month on
maintenance (median = 50,000)Drivers earn a gross income of 42,990
TZS/working day (median = 45,000)Repairs and accidents
16.5% of vehicles had a major engine failure 21.8% of vehicles needed major repairs11% of vehicles have been involved in one or more road accidents
Opportunities for night charging99% of night parking areas have electricity access
66% of vehicles parked on protected private parking area
Electrification of Urban Three-Wheeler Taxis in Tanzania… 105
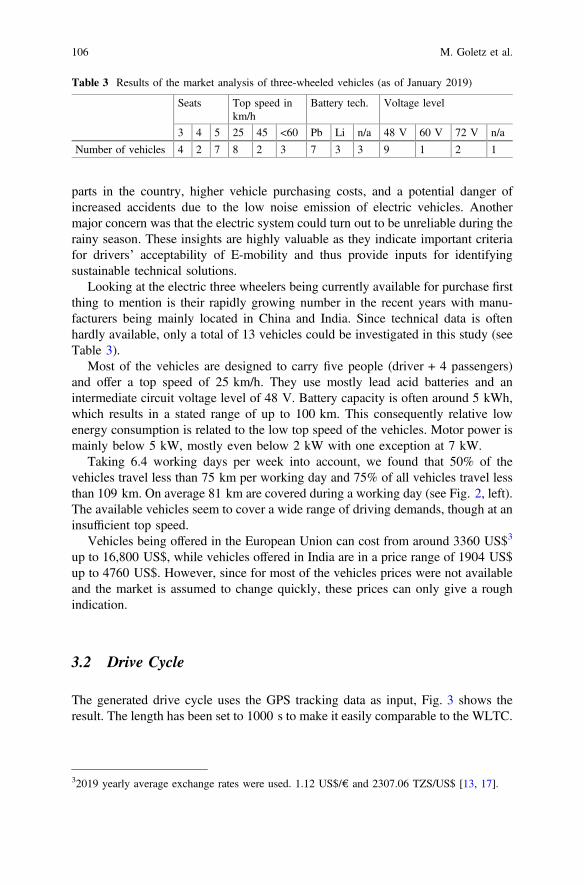
parts in the country, higher vehicle purchasing costs, and a potential danger ofincreased accidents due to the low noise emission of electric vehicles. Anothermajor concern was that the electric system could turn out to be unreliable during therainy season. These insights are highly valuable as they indicate important criteriafor drivers’ acceptability of E-mobility and thus provide inputs for identifyingsustainable technical solutions.
Looking at the electric three wheelers being currently available for purchase firstthing to mention is their rapidly growing number in the recent years with manu-facturers being mainly located in China and India. Since technical data is oftenhardly available, only a total of 13 vehicles could be investigated in this study (seeTable 3).
Most of the vehicles are designed to carry five people (driver + 4 passengers)and offer a top speed of 25 km/h. They use mostly lead acid batteries and anintermediate circuit voltage level of 48 V. Battery capacity is often around 5 kWh,which results in a stated range of up to 100 km. This consequently relative lowenergy consumption is related to the low top speed of the vehicles. Motor power ismainly below 5 kW, mostly even below 2 kW with one exception at 7 kW.
Taking 6.4 working days per week into account, we found that 50% of thevehicles travel less than 75 km per working day and 75% of all vehicles travel lessthan 109 km. On average 81 km are covered during a working day (see Fig. 2, left).The available vehicles seem to cover a wide range of driving demands, though at aninsufficient top speed.
Vehicles being offered in the European Union can cost from around 3360 US$3
up to 16,800 US$, while vehicles offered in India are in a price range of 1904 US$up to 4760 US$. However, since for most of the vehicles prices were not availableand the market is assumed to change quickly, these prices can only give a roughindication.
3.2 Drive Cycle
The generated drive cycle uses the GPS tracking data as input, Fig. 3 shows theresult. The length has been set to 1000 s to make it easily comparable to the WLTC.
Table 3 Results of the market analysis of three-wheeled vehicles (as of January 2019)
Seats Top speed inkm/h
Battery tech. Voltage level
3 4 5 25 45 <60 Pb Li n/a 48 V 60 V 72 V n/a
Number of vehicles 4 2 7 8 2 3 7 3 3 9 1 2 1
32019 yearly average exchange rates were used. 1.12 US$/€ and 2307.06 TZS/US$ [13, 17].
106 M. Goletz et al.

It has been purposely separated into four sections which represent typical drivingsituations. To reflect the different road conditions, the rolling resistance coefficientis varied depending on the intended driving scenario of a section.
The first section represents a trip from a residential area to a main road, forexample to feed the BRT system. The roads in residential areas are mainly smalland gravel roads, which results in a maximum speed of 31 km/h. The secondsection is a trip on an asphalted main road from the suburbs to the city centre. Here,higher speeds up to 86 km/h can be reached. Despite having a very small portion inthe measured trips, this maximum speed has been added on drivers’ demand thatwish for a fast vehicle and was the highest measured speed in the GPS data. Thethird section is a trip inside the city centre with a limited maximum speed of 52 km/h on asphalted roads. The last section is a trip through a residential area with a verybumpy dirt road. To model the higher energy demand for that kind of road, therolling resistance coefficient has been significantly increased.
3.3 Energy Demand
Figure 4 shows the results for a simulated vehicle with full load (300 kg, equalsapprox. one driver plus three passengers) or half load (150 kg, one driver plus onepassenger) performing the generated drive cycle (see Fig. 3). The simulation hasbeen conducted for a vehicle using lead acid or lithium ion batteries which leads toa different overall weight of the vehicle. Battery size was varied in steps of 2 kWhin a range from 4 to 16 kWh.4
0.000.020.040.060.080.100.120.140.160.18
0102030405060708090
0 100 200 300 400 500 600 700 800 900 1000
rolli
ng re
sist
ance
coef
ficie
nt
spee
d in
km
/h
time in seconds
gravel roadasphalted road
off road
Fig. 3 Generated Dar es Salaam-drive cycle
4This is not the technical but the usable battery capacity. To calculate battery weight, the energydensity has been multiplied with 1.5 (lithium ion) or 1.1 (lead acid) to cover the additional weightof housing, cooling etc.
Electrification of Urban Three-Wheeler Taxis in Tanzania… 107
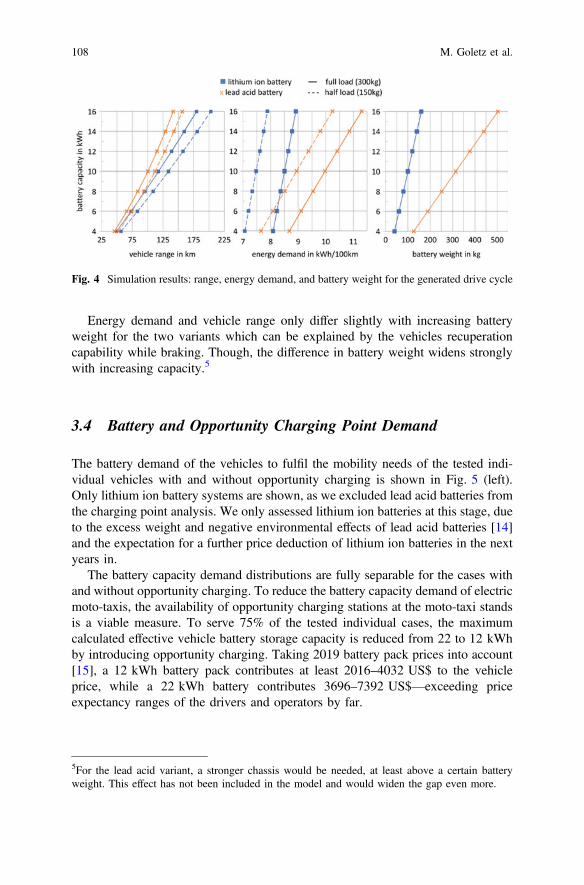
Energy demand and vehicle range only differ slightly with increasing batteryweight for the two variants which can be explained by the vehicles recuperationcapability while braking. Though, the difference in battery weight widens stronglywith increasing capacity.5
3.4 Battery and Opportunity Charging Point Demand
The battery demand of the vehicles to fulfil the mobility needs of the tested indi-vidual vehicles with and without opportunity charging is shown in Fig. 5 (left).Only lithium ion battery systems are shown, as we excluded lead acid batteries fromthe charging point analysis. We only assessed lithium ion batteries at this stage, dueto the excess weight and negative environmental effects of lead acid batteries [14]and the expectation for a further price deduction of lithium ion batteries in the nextyears in.
The battery capacity demand distributions are fully separable for the cases withand without opportunity charging. To reduce the battery capacity demand of electricmoto-taxis, the availability of opportunity charging stations at the moto-taxi standsis a viable measure. To serve 75% of the tested individual cases, the maximumcalculated effective vehicle battery storage capacity is reduced from 22 to 12 kWhby introducing opportunity charging. Taking 2019 battery pack prices into account[15], a 12 kWh battery pack contributes at least 2016–4032 US$ to the vehicleprice, while a 22 kWh battery contributes 3696–7392 US$—exceeding priceexpectancy ranges of the drivers and operators by far.
Fig. 4 Simulation results: range, energy demand, and battery weight for the generated drive cycle
5For the lead acid variant, a stronger chassis would be needed, at least above a certain batteryweight. This effect has not been included in the model and would widen the gap even more.
108 M. Goletz et al.
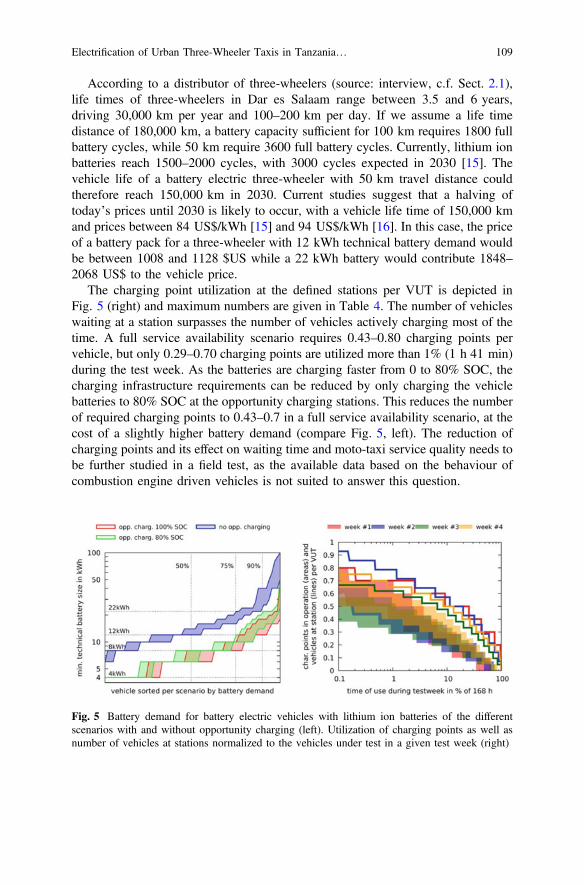
According to a distributor of three-wheelers (source: interview, c.f. Sect. 2.1),life times of three-wheelers in Dar es Salaam range between 3.5 and 6 years,driving 30,000 km per year and 100–200 km per day. If we assume a life timedistance of 180,000 km, a battery capacity sufficient for 100 km requires 1800 fullbattery cycles, while 50 km require 3600 full battery cycles. Currently, lithium ionbatteries reach 1500–2000 cycles, with 3000 cycles expected in 2030 [15]. Thevehicle life of a battery electric three-wheeler with 50 km travel distance couldtherefore reach 150,000 km in 2030. Current studies suggest that a halving oftoday’s prices until 2030 is likely to occur, with a vehicle life time of 150,000 kmand prices between 84 US$/kWh [15] and 94 US$/kWh [16]. In this case, the priceof a battery pack for a three-wheeler with 12 kWh technical battery demand wouldbe between 1008 and 1128 $US while a 22 kWh battery would contribute 1848–2068 US$ to the vehicle price.
The charging point utilization at the defined stations per VUT is depicted inFig. 5 (right) and maximum numbers are given in Table 4. The number of vehicleswaiting at a station surpasses the number of vehicles actively charging most of thetime. A full service availability scenario requires 0.43–0.80 charging points pervehicle, but only 0.29–0.70 charging points are utilized more than 1% (1 h 41 min)during the test week. As the batteries are charging faster from 0 to 80% SOC, thecharging infrastructure requirements can be reduced by only charging the vehiclebatteries to 80% SOC at the opportunity charging stations. This reduces the numberof required charging points to 0.43–0.7 in a full service availability scenario, at thecost of a slightly higher battery demand (compare Fig. 5, left). The reduction ofcharging points and its effect on waiting time and moto-taxi service quality needs tobe further studied in a field test, as the available data based on the behaviour ofcombustion engine driven vehicles is not suited to answer this question.
Fig. 5 Battery demand for battery electric vehicles with lithium ion batteries of the differentscenarios with and without opportunity charging (left). Utilization of charging points as well asnumber of vehicles at stations normalized to the vehicles under test in a given test week (right)
Electrification of Urban Three-Wheeler Taxis in Tanzania… 109

4 Conclusions
The results of our study show that the electrification of three-wheeled moto-taxis inDar es Salaam is possible, but subject to several constrains and barriers. Driversshow a high willingness to adopt electric vehicles; however, they require them to(a) at least deliver the same income than fossil-fuelled vehicles and (b) have similardriving characteristics. Besides, they expect electric three-wheelers to have a pos-itive effect on the driving comfort for themselves and for their passengers.
From a socio-technological point of view, our analysis shows that currentlyavailable electric three-wheelers cannot be used as a one-to-one replacement. Thisis mainly due to the limited capability of the drive train, that limits the top speedand range that is requested by the drivers. Also, the current prices are notcompetitive.
Regarding technical specifications, safety issues lead us to recommend 48 Vintermediate circuit voltage that is less likely to cause harm in case of maintenanceand accidents. Lead acid batteries would be able to serve a capacity of up to 8 kWh,but due to the negative long-term environmental implications as a result fromimproper handling and disposal, lead-acid cannot be recommended. Above 8 kWh,due to their higher energy density, lithium ion batteries should be favoured.
Availability of infrastructure for opportunity charging reduces the demand forvehicle battery capacity. Charging infrastructure can therefore support the earlyadoption of electric moto-taxi by reducing overall vehicle cost. Charging pointswith household typical currents are sufficient to achieve this goal, with 0.43–0.7charging points per vehicle being required.
Economic factors play an important role for the adoption of electric mobility,especially in the very cost sensitive Tanzanian vehicle market. Current lithium ionbattery prices are too high for a wide adoption, but a price decrease is expected inthe next 10 years. We therefore conclude that the combination of suitable, costcompetitive vehicles and available opportunity charging infrastructure can make atransformation of the vehicle market towards electrification possible. In the future,policy makers should carefully reflect that changes to the structure of the informalmoto-taxi market could require their interventions: In a market where driverorganizations prevail, it can be assumed that these organizations will set upcharging infrastructure, because this can help them reduce their cost and maintain
Table 4 Vehicles under test (VUT) and charging points required for minimal battery size
Week # VUT # Charging points100% SOC
# Charging points80% SOC
# Chargingpoints > 1%utilization
1 10 7–8 70–80% 7 70% 4–7 40–70%
2 14 8–10 57–71% 8–9 57–64% 4–7 29–50%
3 21 9–14 43–67% 9–11 43–52% 6–11 29–52%
4 20 11–16 55–80% 11–13 55–65% 8–12 40–60%
110 M. Goletz et al.
the control to the access to the market. However, if technologies such as e-hailing(Uber, Bolt, SafeBoda) continue to take over market shares of the moto-taxi market[18], this may lead to a reduced amount of drivers who organize themselves inorganizations and at designated stations. A publicly available charging infrastruc-ture would then become more relevant for drivers who seek to buy electric vehicles,which policy makers should reflect when they want to speed up the adoptionprocess.
The results we present here were generated for the city of Dar es Salaam.However, similar conditions, in which moto-taxis fill gaps of urban transport, existin many cities of Sub-Sahara-Africa. Especially under similar driving patterns, ourresults are transferable to other places. We would expect that this is the case in citieswhere drivers are organized in organizations with designated stations and wheremorning and afternoon peak demand exists, allowing for opportunity charging withsimilar frequencies. Furthermore, the distances vehicles drive should be similar,which we expect to be the case when similar conditions related to land use andtransport infrastructure are in place.
References
1. Diaz Olvera, L., Plat, D., Pochet, P., Sahabana, M.: Motorized two-wheelers in sub-SaharanAfrican cities: public and private use. In: Presented at the 12th world conference on transportresearch, Lisbon, Portugal, 11–15 July 2010
2. Ehebrecht, D., Heinrichs, D., Lenz, B.: Motorcycle-taxis in sub-Saharan Africa: currentknowledge, implications for the debate on ‘informal’ transport and research needs.J. Transp. Geogr. 69, 242–256 (2018)
3. Starkey, P.: The benefits and challenges of increasing motorcycle use for rural access. In:Presented at the international conference on transport and road research, Mombasa, Kenya,16–18 March 2016
4. Evans, J., O’Brien, J., Ch Ng, B.: Towards a geography of informal transport: mobility,infra-structure and urban sustainability from the back of a motorbike. Trans. Inst. Br. Geogr.43(4), 674–688 (2018). https://doi.org/10.1111/tran.12239
5. Klopp, J.: Towards a political economy of transportation policy and practice in Nairobi.Urban Forum 23(1), 1–21 (2012). https://doi.org/10.1007/s12132-011-9116-y
6. Kumar: Understanding the emerging role of motorcycles in African cities. A politicaleconomy perspective. Sub-Saharan Africa transport policy program (SSATP), DiscussionPaper 13. World Bank, Washington, DC, p. 9 (2011)
7. Adiang, C.M., Monkam, D., Njeugna, E., Gokhale, S.: Projecting impacts of two-wheelers onurban air quality of Douala, Cameroon. Transp. Res. D 52, 49–63 (2017)
8. Global Status Report on Road Safety: World Health Organization—management ofnoncommunicable diseases, disability, violence and injury prevention (NVI), p. 258.Geneva, Switzerland (2018). ISBN 978-92-4-156568-4
9. Joseph, L., Neven, A., Martens, K., Kweka, O., Wets, G., Janssens, D.: Measuringindividuals’ travel behaviour by use of a GPS-based smartphone application in Dar es Salaam,Tanzania. J. Transp. Geogr. (2019). https://doi.org/10.1016/j.jtrangeo.2019.102477
Electrification of Urban Three-Wheeler Taxis in Tanzania… 111
10. Goletz, M., Ehebrecht, D.: How can GPS/GNSS tracking data be used to improve ourunderstanding of informal transport? A discussion based on a feasibility study from Dar esSalaam. J. Transp. Geogr. (2018). Available online https://doi.org/10.1016/j.jtrangeo.2018.08.015 (in press)
11. Reupold, P.: Lösungsraumanalyse für Hauptantriebsstränge in batterieelektrischenStraßenfahrzeugen. Dissertation, Technische Universität München, München (2014)
12. Eghtessad, M.: Optimale Antriebsstrangkonfigurationen für Elektrofahrzeuge. Dissertation,Technische Universität Braunschweig, Braunschweig (2014). ISBN 978-3-8440-2782-2
13. Exchange USD—EURO: 1.12 $/€, annual average 2019. https://www.statista.com/statistics/412794/euro-to-u-s-dollar-annual-average-exchange-rate/. Accessed 24 Apr 2020
14. United Nations Environmental Programme (UNEP): Lead acid batteries. https://www.unenvironment.org/explore-topics/chemicals-waste/what-we-do/emerging-issues/lead-acid-batteries. Accessed 30 Apr 2020
15. Ierides, M., del Valle, R., Fernandez, D., Bax, L., Jacques, P., Stassin, F., Meeus, M.:Advanced materials for clean and sustainable energy and mobility—EMIRI key R&Ipriorities. Energy Materials Industrial Research Initiative (EMIRI) Technology Roadmap,p. 292 (2019)
16. Battery requirements for future automotive applications. European Council for AutomotiveR&D (eucar), p. 4 (2019). https://www.eucar.be/battery-requirements-for-future-automotive-applications/. Accessed 29 Apr 2020
17. Exchange TZS—USD: 2307.06 TZS/US$, annual average from 365 daily values. https://www.exchangerates.org.uk/USD-TZS-spot-exchange-rates-history-2019.html. Accessed 24Apr 2020
18. Wadud, Z.: The effects of e-ride hailing on motorcycle ownership in an emerging-countrymegacity. Transport. Res. A: Pol. 137, 301–312 (2020). ISSN 0965-8564. https://doi.org/10.1016/j.tra.2020.05.002
Open Access This chapter is licensed under the terms of the Creative Commons Attribution 4.0International License (http://creativecommons.org/licenses/by/4.0/), which permits use, sharing,adaptation, distribution and reproduction in any medium or format, as long as you give appropriatecredit to the original author(s) and the source, provide a link to the Creative Commons license andindicate if changes were made.The images or other third party material in this chapter are included in the chapter’s Creative
Commons license, unless indicated otherwise in a credit line to the material. If material is notincluded in the chapter’s Creative Commons license and your intended use is not permitted bystatutory regulation or exceeds the permitted use, you will need to obtain permission directly fromthe copyright holder.
112 M. Goletz et al.

Impact Studies and Effects of SEVDeployment
Small Electric Vehicles (SEV)—Impactsof an Increasing SEV Fleeton the Electric Load and Grid
Tobias Gorges, Claudia Weißmann, and Sebastian Bothor
Abstract Heading towards climate neutrality, the electrification of the transportsector has significant impact on the electric grid infrastructure. Among othervehicles, the increasing number of new technologies, mobility offers, and serviceshas an impact on the grid infrastructure. The purpose of this case study therefore isto examine and highlight the small electric vehicle (SEV) impact on the electricload and grid. A data-based analysis model with high charging demand in an energynetwork is developed that includes renewable energy production and a chargingprocess of a whole SEV fleet during the daily electricity demand peak for the city ofStuttgart (Germany). Key figures are gathered and analysed from official statisticsand open data sources. The resulting load increase due to the SEV development isdetermined and the impact on the electric grid in comparison to battery electricvehicles (BEV) is assessed for two district types. The case study shows that if SEVsreplace BEVs, the effects on the grid peak load are considered significant. However,the implementation of a load management system may have an even higherinfluence on peak load reduction. Finally, recommendations for the future nationaland international development of SEV fleets are summarized.
Keywords Grid peak load � SEV � BEV � Electric grid � Grid stability
T. Gorges (&)MHP Management- und IT-Beratung, Berlin, Germanye-mail: [email protected]
C. WeißmannMHP Management- und IT-Beratung, Frankfurt am Main, Germany
S. BothorMHP Management- und IT-Beratung, Ludwigsburg, Germany
© The Author(s) 2021A. Ewert et al. (eds.), Small Electric Vehicles,https://doi.org/10.1007/978-3-030-65843-4_9
115
1 Introduction
Heading towards climate neutrality, which the German Government is aiming toachieve by 2050, the electrification of the transport sector has a significant impacton the electric grid infrastructure. Besides the increasing number of existing electricvehicles, new technologies, mobility services as well as small electric vehicles(SEV) need to be considered to assess the total impact on the grid infrastructure.
In the last few years, the fleet of SEVs increased by total number and type ofvehicles. SEVs are emerging particularly in urban areas and are being more andmore frequently rolled out as part of mobility-as-a-service approaches [1]. Thegrowing SEV trend is predicted to continue up until 2030. Hence, this chapter willfocus specifically on SEVs and their impact on the grid as well as the additionalelectricity demand and other factors of increasing grid stability uncertainty.
To examine and highlight the SEV impact on the grid infrastructure, the loadcapacity of a SEV fleet and its impact on the electric grid in 2020 and 2030 iscalculated based on certain assumption in this study. Therefore, the charging pro-cess of the whole SEV fleet is modelled during the daily electricity peak demand.Vehicle replacement effects are taken into account and scenarios considering thefleet of battery electric vehicles (BEV) are modelled in this analysis.
To assess the SEV impact on the grid infrastructure, a data-based analysis modelis set up and key figures like peak loads are gathered and analysed from officialstatistics and open data sources. As a study area the city of Stuttgart has beenchosen, located in southern Germany and surrounded by a highly industrializedurbanized region with high electricity demand.
The determined charging capacity is compared with the load curve of a trans-mission system operator and the resulting load increase due to the SEV develop-ment is then calculated. Further, three scenarios are modelled by the modification ofvariables, hence the impacts on the grid infrastructure can be derived and recom-mendations for the future national and international development of SEV fleets canbe drawn.
To conclude, this chapter derives answers to the following key questions: Howmuch additional load capacity from SEVs considering the assumed development inthe upcoming years can be expected by 2030? What are the impact differencesbetween a purely BEV fleet and a mixed vehicle fleet of BEVs replaced by SEVs?Finally, how large is the difference in peak electric load between an SEVreplacement in a BEV fleet versus load management?
116 T. Gorges et al.
2 Status Quo SEV and Grip Impact
Recent studies currently consider both mobility concepts and vehicle conceptswhen assessing ways to advance the transport system as a whole. Both concepts aredriven by the current trends in mobility, such as: electric mobility, shared economy,digitalization, and autonomous driving [2–5].
However, the introduction of new concepts often is accompanied with chal-lenges concerning the integration into the existing system such as the infrastructure.Due to this reason, an ever increasing amount of impact assessment research on theintegration of new concepts in the mobility sector and their design is continuouslypublished. The impact as well as the design of the proposed concepts is predom-inantly modelled. For instance, Alazzawi et al. determine the optimal fleet size of ashared autonomous vehicle concept for Milan [6].
The integration of electric mobility into the grid is one major research field. Thecentral challenge of this field is: stabilization of the grid with consideration to theranging power demand and production as well as additional spatial and time-relateddifference [7–10].
For instance, Morais et al. consider different scenarios of EV’s impact in thepower demand curve in a smart grid with vehicle-to-grid capabilities [11].Bastida-Molina et al. assess charging strategies for light electric vehicles to exploitthe existing electric generation system as best as possible [12]. Research on gridimpact has predominantly been based on conventional-sized vehicle concepts andtheir battery characteristics. However, the impact and integration potential of dif-ferent electrified vehicle concepts to ensure grid stability and especially peak loaddemand should have also been assessed.
Foresight, electrified autonomous vehicles and their already predicted impact oninfrastructure, processes and culture [13, 14] would trigger a change of travelbehaviour and travel choices [15, 16] to have a potential impact on SEVs. SEV, asnew vehicle concept and pointed out in the preface and in the chapter “Smallelectric vehicles—benefits and drawbacks” of this book differ from BEVs, forexample, in terms of their vehicle weight and thus battery and load capacity.Therefore, they have a certain potential for improving existing challenges of currenttransport systems. Hence, this chapter focuses on a prediction of the impact of anSEV fleet on the grid.
3 Method
The current available SEV concepts and their characteristics, such as seatingcapacity, maximum velocity, required driving licence, weather protection, pre-dominant use (passenger or goods transport), volume of goods, determine theparameter set for the assessment of the potential for trip usage. This methodology isan adaptation of the approach used in the SEV study by Brost et al. [17] and data
Small Electric Vehicles (SEV)—Impacts of an Increasing SEV … 117

retrieved from a mobility study in Germany (Mobilität in Deutschland (MiD), 2017)[18]. The identified trips with SEV potential are clustered by trip purpose. Mobilityprofiles throughout the day are developed serving as basis for the energy calcula-tions. Besides the SEV fleet, the BEV fleet and its size in 2030 are calculated for thestudy location, Stuttgart in Germany. The results are integrated into a scenarioanalysis in chapter The UK Approach to Greater Market Acceptance of PoweredLight Vehicles (PLVs).
Trip distances that are derived from the MiD are assumed to be equivalent in thefuture and differ between the three categorized trip purposes. It is assumed that anSEV can be assigned to one of these three predominant trip purpose categories, thetotal number of SEVs on each trip purpose is then determined. Numbers of SEVs inStuttgart are predicted to rise up to a stock of 2800 by 2030 which equals more than35,500 driven passenger-kilometres per day, as listed by Table 1. As only limiteddata on the SEV market and its future development is available, the SEV fleet sizefor 2030 is calculated using the same ramp-up time of BEVs.
In a second step, the corresponding electricity consumption and charging time iscalculated in order to create a representative charging load profile for the scenarioanalysis (see Table 2).
The average electricity consumption of an SEV is 7.5 kWh/100 km and it istypically charged with a standard shockproof plug at 2.4 kW [17]. In comparisonwith this charging standard, an average BEV has a much higher consumption rate ofabout 20 kWh/100 km due to higher mass and speed [19]. BEVs can be charged viacharging stations with higher loads.
In a third step, the calculated load profiles are applied to electricity grid branchesfor the assessment of the SEV impact. Different SEV usage scenarios and thus anincrease of charging load are considered. As SEVs have a different impact on thegrid than BEVs, the peak demand from SEVs and therefore necessary gridimprovements and other measures are dependent on SEV usage.
Table 1 Overview of SEV use and development
Trippurpose
Trip distance(km)
Number of SEVs by 2020 Number of SEVs by 2030
Business 20.1 30 665
Shopping 9.1 58 1264
Leisure 13.0 38 823
Table 2 Overview of SEV electricity consumption and charging time
Trip purpose Trip consumption (kWh) Equivalent charging time (min)
Business 1.51 38
Shopping 0.68 17
Leisure 0.98 24
118 T. Gorges et al.
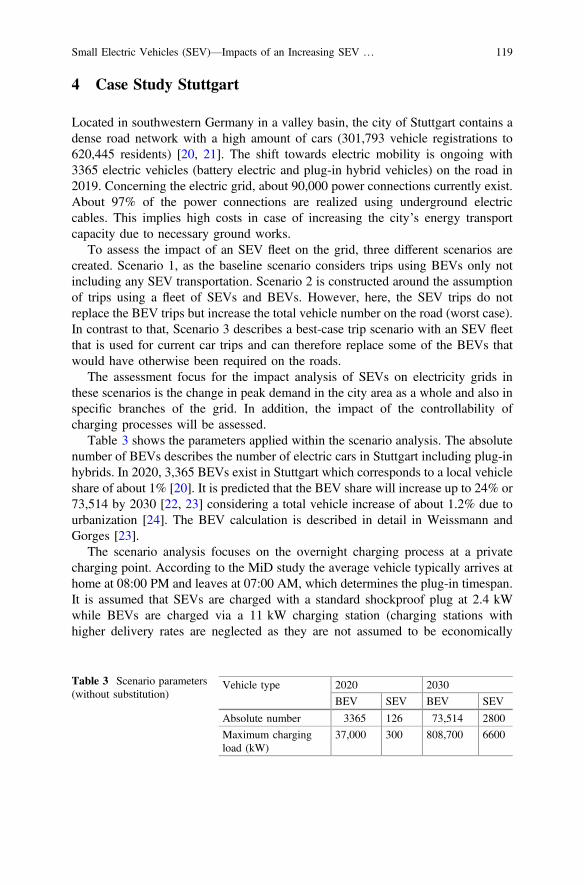
4 Case Study Stuttgart
Located in southwestern Germany in a valley basin, the city of Stuttgart contains adense road network with a high amount of cars (301,793 vehicle registrations to620,445 residents) [20, 21]. The shift towards electric mobility is ongoing with3365 electric vehicles (battery electric and plug-in hybrid vehicles) on the road in2019. Concerning the electric grid, about 90,000 power connections currently exist.About 97% of the power connections are realized using underground electriccables. This implies high costs in case of increasing the city’s energy transportcapacity due to necessary ground works.
To assess the impact of an SEV fleet on the grid, three different scenarios arecreated. Scenario 1, as the baseline scenario considers trips using BEVs only notincluding any SEV transportation. Scenario 2 is constructed around the assumptionof trips using a fleet of SEVs and BEVs. However, here, the SEV trips do notreplace the BEV trips but increase the total vehicle number on the road (worst case).In contrast to that, Scenario 3 describes a best-case trip scenario with an SEV fleetthat is used for current car trips and can therefore replace some of the BEVs thatwould have otherwise been required on the roads.
The assessment focus for the impact analysis of SEVs on electricity grids inthese scenarios is the change in peak demand in the city area as a whole and also inspecific branches of the grid. In addition, the impact of the controllability ofcharging processes will be assessed.
Table 3 shows the parameters applied within the scenario analysis. The absolutenumber of BEVs describes the number of electric cars in Stuttgart including plug-inhybrids. In 2020, 3,365 BEVs exist in Stuttgart which corresponds to a local vehicleshare of about 1% [20]. It is predicted that the BEV share will increase up to 24% or73,514 by 2030 [22, 23] considering a total vehicle increase of about 1.2% due tourbanization [24]. The BEV calculation is described in detail in Weissmann andGorges [23].
The scenario analysis focuses on the overnight charging process at a privatecharging point. According to the MiD study the average vehicle typically arrives athome at 08:00 PM and leaves at 07:00 AM, which determines the plug-in timespan.It is assumed that SEVs are charged with a standard shockproof plug at 2.4 kWwhile BEVs are charged via a 11 kW charging station (charging stations withhigher delivery rates are neglected as they are not assumed to be economically
Table 3 Scenario parameters(without substitution)
Vehicle type 2020 2030
BEV SEV BEV SEV
Absolute number 3365 126 73,514 2800
Maximum chargingload (kW)
37,000 300 808,700 6600
Small Electric Vehicles (SEV)—Impacts of an Increasing SEV … 119
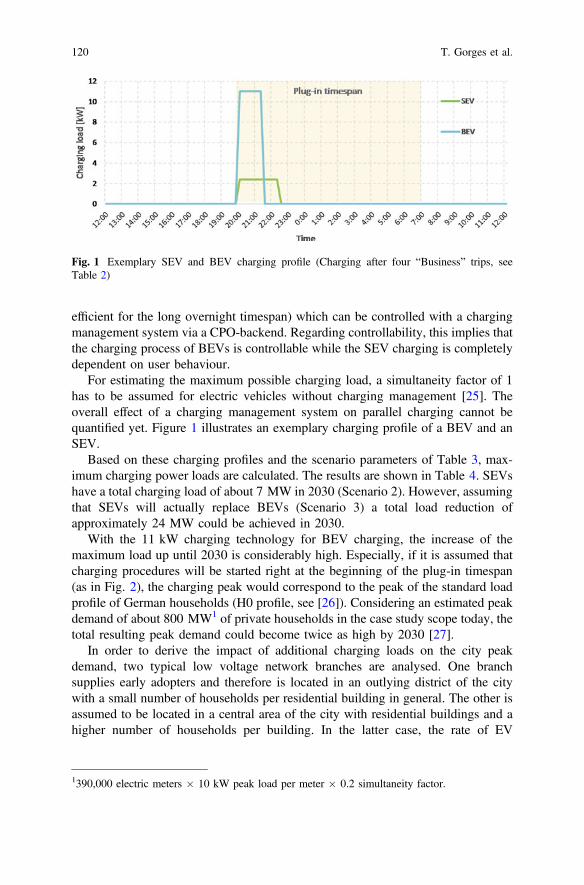
efficient for the long overnight timespan) which can be controlled with a chargingmanagement system via a CPO-backend. Regarding controllability, this implies thatthe charging process of BEVs is controllable while the SEV charging is completelydependent on user behaviour.
For estimating the maximum possible charging load, a simultaneity factor of 1has to be assumed for electric vehicles without charging management [25]. Theoverall effect of a charging management system on parallel charging cannot bequantified yet. Figure 1 illustrates an exemplary charging profile of a BEV and anSEV.
Based on these charging profiles and the scenario parameters of Table 3, max-imum charging power loads are calculated. The results are shown in Table 4. SEVshave a total charging load of about 7 MW in 2030 (Scenario 2). However, assumingthat SEVs will actually replace BEVs (Scenario 3) a total load reduction ofapproximately 24 MW could be achieved in 2030.
With the 11 kW charging technology for BEV charging, the increase of themaximum load up until 2030 is considerably high. Especially, if it is assumed thatcharging procedures will be started right at the beginning of the plug-in timespan(as in Fig. 2), the charging peak would correspond to the peak of the standard loadprofile of German households (H0 profile, see [26]). Considering an estimated peakdemand of about 800 MW1 of private households in the case study scope today, thetotal resulting peak demand could become twice as high by 2030 [27].
In order to derive the impact of additional charging loads on the city peakdemand, two typical low voltage network branches are analysed. One branchsupplies early adopters and therefore is located in an outlying district of the citywith a small number of households per residential building in general. The other isassumed to be located in a central area of the city with residential buildings and ahigher number of households per building. In the latter case, the rate of EV
Fig. 1 Exemplary SEV and BEV charging profile (Charging after four “Business” trips, seeTable 2)
1390,000 electric meters � 10 kW peak load per meter � 0.2 simultaneity factor.
120 T. Gorges et al.
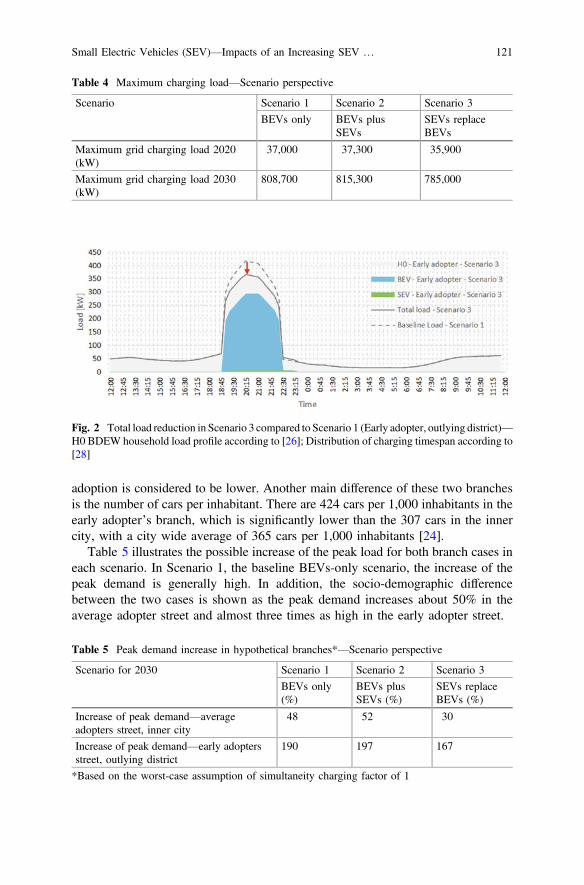
adoption is considered to be lower. Another main difference of these two branchesis the number of cars per inhabitant. There are 424 cars per 1,000 inhabitants in theearly adopter’s branch, which is significantly lower than the 307 cars in the innercity, with a city wide average of 365 cars per 1,000 inhabitants [24].
Table 5 illustrates the possible increase of the peak load for both branch cases ineach scenario. In Scenario 1, the baseline BEVs-only scenario, the increase of thepeak demand is generally high. In addition, the socio-demographic differencebetween the two cases is shown as the peak demand increases about 50% in theaverage adopter street and almost three times as high in the early adopter street.
Table 4 Maximum charging load—Scenario perspective
Scenario Scenario 1 Scenario 2 Scenario 3
BEVs only BEVs plusSEVs
SEVs replaceBEVs
Maximum grid charging load 2020(kW)
37,000 37,300 35,900
Maximum grid charging load 2030(kW)
808,700 815,300 785,000
Fig. 2 Total load reduction in Scenario 3 compared to Scenario 1 (Early adopter, outlying district)—H0 BDEW household load profile according to [26]; Distribution of charging timespan according to[28]
Table 5 Peak demand increase in hypothetical branches*—Scenario perspective
Scenario for 2030 Scenario 1 Scenario 2 Scenario 3
BEVs only(%)
BEVs plusSEVs (%)
SEVs replaceBEVs (%)
Increase of peak demand—averageadopters street, inner city
48 52 30
Increase of peak demand—early adoptersstreet, outlying district
190 197 167
*Based on the worst-case assumption of simultaneity charging factor of 1
Small Electric Vehicles (SEV)—Impacts of an Increasing SEV … 121
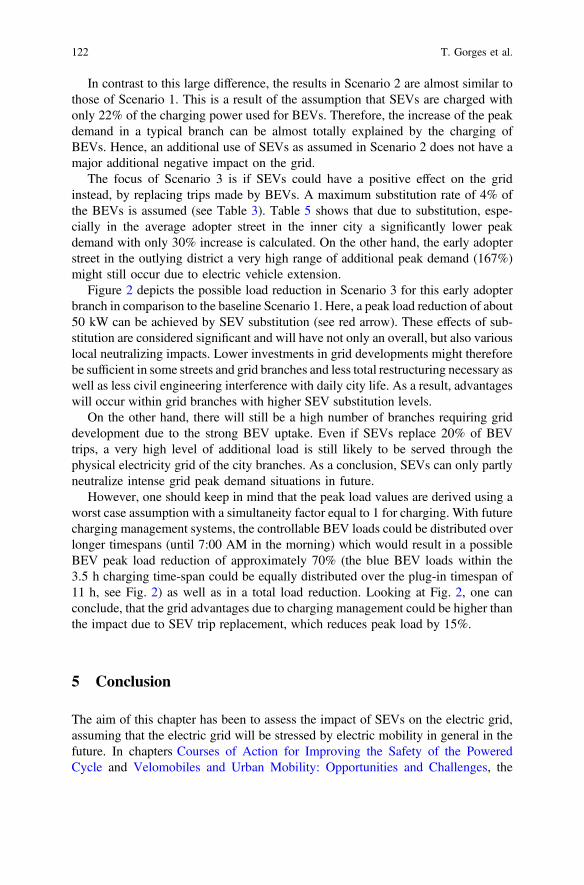
In contrast to this large difference, the results in Scenario 2 are almost similar tothose of Scenario 1. This is a result of the assumption that SEVs are charged withonly 22% of the charging power used for BEVs. Therefore, the increase of the peakdemand in a typical branch can be almost totally explained by the charging ofBEVs. Hence, an additional use of SEVs as assumed in Scenario 2 does not have amajor additional negative impact on the grid.
The focus of Scenario 3 is if SEVs could have a positive effect on the gridinstead, by replacing trips made by BEVs. A maximum substitution rate of 4% ofthe BEVs is assumed (see Table 3). Table 5 shows that due to substitution, espe-cially in the average adopter street in the inner city a significantly lower peakdemand with only 30% increase is calculated. On the other hand, the early adopterstreet in the outlying district a very high range of additional peak demand (167%)might still occur due to electric vehicle extension.
Figure 2 depicts the possible load reduction in Scenario 3 for this early adopterbranch in comparison to the baseline Scenario 1. Here, a peak load reduction of about50 kW can be achieved by SEV substitution (see red arrow). These effects of sub-stitution are considered significant and will have not only an overall, but also variouslocal neutralizing impacts. Lower investments in grid developments might thereforebe sufficient in some streets and grid branches and less total restructuring necessary aswell as less civil engineering interference with daily city life. As a result, advantageswill occur within grid branches with higher SEV substitution levels.
On the other hand, there will still be a high number of branches requiring griddevelopment due to the strong BEV uptake. Even if SEVs replace 20% of BEVtrips, a very high level of additional load is still likely to be served through thephysical electricity grid of the city branches. As a conclusion, SEVs can only partlyneutralize intense grid peak demand situations in future.
However, one should keep in mind that the peak load values are derived using aworst case assumption with a simultaneity factor equal to 1 for charging. With futurecharging management systems, the controllable BEV loads could be distributed overlonger timespans (until 7:00 AM in the morning) which would result in a possibleBEV peak load reduction of approximately 70% (the blue BEV loads within the3.5 h charging time-span could be equally distributed over the plug-in timespan of11 h, see Fig. 2) as well as in a total load reduction. Looking at Fig. 2, one canconclude, that the grid advantages due to charging management could be higher thanthe impact due to SEV trip replacement, which reduces peak load by 15%.
5 Conclusion
The aim of this chapter has been to assess the impact of SEVs on the electric grid,assuming that the electric grid will be stressed by electric mobility in general in thefuture. In chapters Courses of Action for Improving the Safety of the PoweredCycle and Velomobiles and Urban Mobility: Opportunities and Challenges, the
122 T. Gorges et al.
status quo of SEVs is described. Feasible SEV trip purposes have been identified toderive the potential for SEVs to replace BEVs.
A scenario analysis has been conducted for the city of Stuttgart to calculate theSEV grid impact in chapter The UK Approach to Greater Market Acceptance ofPowered Light Vehicles (PLVs), focusing two city districts with differentsocio-demographic conditions. Within the scenario scope, a BEV-only extension(as a baseline) has been compared to a BEV increase with additional SEVs and aBEV increase utilizing SEVs to replace a certain percentage of trips.
The analysis shows that the impact of electric vehicles on the total grid load ingeneral is very high, implying the requirement for essential measures to secure gridstability in the long run. The negative effect of additional SEV load is howevernegligible (Scenario 2) as the occurring electric vehicle peak loads in 2030 are mainlydriven by BEV charging. This is a result of themuch higher absolute number of BEVscompared to SEVs as well as much lower load peaks of singular SEVs (2.4 kW)compared to singular BEVs (11 kW). Moreover, SEVs may have a positive effect ongrid stability when used to replace BEV trips (Scenario 3). Especially, in outlying citydistricts with early adopters to electric mobility and likewise an accelerated BEV andSEV increase, this effect is significant. Nevertheless, the analysis also has pointed outthat charging management as another grid stabilization measure may have a higherimpact (70% BEV peak load reduction) on total peak load reduction than SEVsubstitution effects as the assumed share of SEVs in 2030 is still rather low.
There are certainly some limitations of this chapter due to a lack of SEV data incomparison to existing BEV data. Nevertheless, the authors conducted this study asaccurately as possible with the available data. With an increasing data quantity andquality on current and future SEV fleets, the assumptions of the chapter, such as thedefined vehicle characteristics and fleet size, as well as their impact on the electric gridcould be verified and assessed in more detail respectively. For example, there couldoccur amuch higher SEV extension in reality, due to the fact that SEV extension is notlinked to the development of proper charging infrastructure like BEV extension.
Another aspect that should be considered in future research is the low control-lability of the SEV charging processes via shockproof wall sockets. Based on theassumption that SEV will be mainly charged at low power (3.7–7.2 kW) at wallsockets, charging controllability is only possible if there is an available controlsignal from the grid operator or aggregator. As charging controllability is a pre-requisite for the best utilization of BEV local or wider grid services, just as con-gestion management or ancillary services are, the SEV contribution to this type ofgrid stability measure is currently little to none. A possible improvement for SEVscould be an adaptation of BEV backend technology to control the charging processby grid operator signals. With a significant SEV fleet, likewise another positive grideffect could be created.
Finally, as the number and popularity of SEVs increases, more information onthe usage of SEVs should become available (such as specific trip characteristics andchanging mobility behaviour) and could be considered in future research. Alignedwith the changing mobility sector in general, this, however, will be a continuousresearch topic.
Small Electric Vehicles (SEV)—Impacts of an Increasing SEV … 123
References
1. Giesecke, R., Surakka, T., Hakonen, M.: Conceptualising mobility as a service. In: 2016 11thInternational conference on ecological vehicles and renewable energies, EVER 2016, January2018 (2016). https://doi.org/10.1109/EVER.2016.7476443
2. Burns, L.D., Jordan, W.C., Scarborough, B.A.: Program on sustainable mobility the EarthInstitute, Columbia University, pp. 1–43 (2013)
3. Fagnant, D.J., Kockelman, K.: Preparing a nation for autonomous vehicles: opportunities,barriers and policy recommendations for capitalizing on self-driven vehicles. Transp. Res. 77(Part A), 167–181 (2015)
4. Fagnant, D., Kockelman, K.M.: The travel and environmental implications of sharedautonomous vehicles, using agent-based model scenarios. Transp. Res. Part C 40, 1–13(2014). https://doi.org/10.1016/j.trc.2013.12.001
5. Jaekel, M., Bronnert, K.: Die digitale Evolution moderner Großstädte (2013). https://doi.org/10.1007/978-3-658-00171-1
6. Alazzawi, S., Hummel, M., Kordt, P., Sickenberger, T., Wieseotte, C., Wohak, O.: Simulatingthe impact of shared, autonomous vehicles on urban mobility—a case study of Milan. 2, 94–76 (2018). https://doi.org/10.29007/2n4h
7. BDEW: Elektromobilität braucht Netzinfrastruktur. Netzanschluss und-integration vonElektromobilität. https://www.bdew.de/media/documents/Stn_20170615_Netztintegration-Elektromobilitaet.pdf (2017)
8. Bundesnetzagentur: Bericht zum Zustand und Ausbau der Verteilernetze 2018 (2018)9. Friedl, G., Walcher, F., Stäglich, J., Fritz, T., Manteuffel, D.: Blackout—e-mobilität setzt
Netzbetreiber unter Druck (2018)10. Nobis, P., Fischhaber, S.: Belastung der Stromnetze durch Elektromobilität. Belastung Der
Stromnetze Durch Elektromobilität, 3 (2015)11. Morais, H., Sousa, T., Vale, Z., Faria, P.: Evaluation of the electric vehicle impact in the
power demand curve in a smart grid environment. Energy Convers. Manag. 82, 268–282(2014). https://doi.org/10.1016/j.enconman.2014.03.032
12. Bastida-Molina, P., Hurtado-Pérez, E., Pérez-Navarro, Á., et al.: Light electric vehiclecharging strategy for low impact on the grid. Environ. Sci. Pollut. Res. (2020)
13. Bauer, G.S., Greenblatt, J.B., Gerke, B.F.: Cost, energy, and environmental impact ofautomated electric taxi fleets in Manhattan. Environ. Sci. Technol. 52(8), 4920–4928 (2018).https://doi.org/10.1021/acs.est.7b04732
14. Sprei, F.: Disrupting mobility. Energy Res. Soc. Sci. 37, 238–242 (2018). https://doi.org/10.1016/j.erss.2017.10.029
15. Fraunhofer IAO, Horváth Partners: The value of time—Nutzerbezogene Service-Potenzialedurch autonomes Fahren, vol. 80, issue April (2016)
16. Soteropoulos, A., Berger, M., Ciari, F.: Impacts of automated vehicles on travel behaviourand land use: an international review of modelling studies. Transp. Rev. 39(1), 29–49 (2019).https://doi.org/10.1080/01441647.2018.1523253
17. Brost, M., Ewert, A., Schmid, S., Stieler, S., Eisenmann, C., Klauenberg, J., Gruber, J.:Elektrische Klein- und Leichtfahrzeuge - Chancen und Potentiale für Baden-Württemberg onbehalf of e-mobil BW (2019)
18. Nobis, C., Kuhnimhof, T.: Mobilität in Deutschland—MiD Ergebnisbericht (2018)19. ADAC: Aktuelle Elektroautos im Test: So hoch ist der Stromverbrauch. https://www.adac.de/
rund-ums-fahrzeug/tests/elektromobilitaet/stromverbrauch-elektroautos-adac-test/ (2020).Accessed 31.07.2020
20. Kraftfahrbundesamt: Bestand am 1. Januar 2019 nach Zulassungsbezirken und Gemeinden.Bestand an Kraftfahrzeugen Und Kraftfahrzeuganhängern Nach Zulassungs-bezirken. https://www.kba.de/DE/Statistik/Fahrzeuge/Bestand/ZulassungsbezirkeGemeinden/zulassungsbezirke_node.html (2019). Accessed 31.07.2020
124 T. Gorges et al.
21. Statistisches Amt Stuttgart: Fortgeschriebene Einwohnerzahl in Stuttgart 2019 nachStaatsangehörigkeit und Geschlecht. https://www.stuttgart.de/item/show/688662/1 (2019).Accessed 31.07.2020
22. Gerbert, P., Herhold, P., Burchardt, J., Schönberger, S., Rechenmacher, F., Kirchner, A.,Kemmler, A., Wünsch, M.: Klimapfade für Deutschland. In: BDI—Bundesverband derDeutschen Industrie e. V., BCG—The Boston Consulting Group, Prognos. https://bdi.eu/publikation/news/klimapfade-fuer-deutschland/ (2018). Accessed 31.07.2020
23. Weissmann, C., Gorges, T.: Entwicklung eines Planungstools zum regionalenLadeinfrastrukturausbau. In: Realisierung Utility 4.0, Band 2: Praxis der digitalenEnergie-wirtschaft von den Grundlagen bis zur Verteilung im Smart Grid (1. Auflage).Springer Vieweg (2019)
24. Statistisches Amt Stuttgart: Statistikatlas Stuttgart. https://statistik.stuttgart.de/statistiken/statistikatlas/atlas/atlas.html?indikator=i0&select=00 (2019). Accessed 31.07.2020
25. DIN 18015-1: Elektrische Anlagen in Wohngebäuden—Teil 1: Planungsgrundlagen (2018)26. Meier, H., Fünfgeld, C., Adam, T., Schieferdecker, B.: Repräsentative VDEW-Lastprofile.
Forschungsbericht (1999)27. Stuttgart Netze GmbH: Elektromobilität in Stuttgart nutzen. https://www.stuttgart-netze.de/
netz-nutzen/themen/elektromobilitaet/ (2020). Accessed 31.07.202028. Eckstein, S., Buddeke, M., Merten, F.: Europäischer Lastgang 2050. Projektbericht zum
Arbeitspaket 4: Regenerative Stromerzeugung und Speicherbedarf in 2050—Restore 2050(2015)
Open Access This chapter is licensed under the terms of the Creative Commons Attribution 4.0International License (http://creativecommons.org/licenses/by/4.0/), which permits use, sharing,adaptation, distribution and reproduction in any medium or format, as long as you give appropriatecredit to the original author(s) and the source, provide a link to the Creative Commons license andindicate if changes were made.The images or other third party material in this chapter are included in the chapter’s Creative
Commons license, unless indicated otherwise in a credit line to the material. If material is notincluded in the chapter’s Creative Commons license and your intended use is not permitted bystatutory regulation or exceeds the permitted use, you will need to obtain permission directly fromthe copyright holder.
Small Electric Vehicles (SEV)—Impacts of an Increasing SEV … 125
Fields of Applicationsand Transport-Related Potentialsof Small Electric Vehicles in Germany
Christine Eisenmann, Johannes Gruber, Mascha Brost,Amelie Ewert, Sylvia Stieler, and Katja Gicklhorn
Abstract The possible applications of small electric vehicles, i.e., electric cargobikes and three- and four-wheeled L-class vehicles in transport, are discussed, andpotential business models are presented. Moreover, transport-related potentials areanalyzed. Therefore, we have utilized a multi-method approach: we conductedqualitative interviews with experts and professionals in the field of light and smallelectric vehicles and carried out quantitative analyses with the national householdtravel survey mobility in Germany 2017. Our results show that, theoretically, smallelectric vehicles could be used for 20–50% of private trips (depending on themodel). On these trips, however, they would not only replace car trips, but also tripson public transport or by bicycle and on foot. In commercial transport, thesevehicles are particularly suitable for service trips and some last-mile deliveries. Ifsmall electric vehicles were to replace a significant share of the transport volumes ofmotorized passenger and commercial transport, they could contribute to climateprotection.
Keywords Small electric vehicles � Mobility in Germany MiD �Transport impacts � User potentials � LEV applications
C. Eisenmann (&) � J. GruberGerman Aerospace Center (DLR), Institute of Transport Research,Rudower Chaussee 7, 12489 Berlin, Germanye-mail: [email protected]
M. Brost � A. EwertGerman Aerospace Center (DLR), Institute of Vehicle Concepts, Wankelstaße 5,70563 Stuttgart, Germany
S. StielerIMU Institut, Hasenbergstraße 49, 70176 Stuttgart, Germany
K. Gicklhorne-Mobil BW GmbH, Leuschnerstraße 45, 70176 Stuttgart, Germany
© The Author(s) 2021A. Ewert et al. (eds.), Small Electric Vehicles,https://doi.org/10.1007/978-3-030-65843-4_10
127
1 Introduction
Climate change, congestion, air pollution, and increasing transport volumes areputting pressure on cities and municipalities worldwide to enhance sustainabletransport and mobility. Politicians, decision makers, and transport researchers areaiming to reduce land use, satisfy people’s desire for mobility and goods avail-ability, and improve air quality and the quality of life in cities. Small and lightelectric vehicles (SEVs) are seen as a feasible factor in meeting these challenges [1–3]. The global market is developing dynamically in regard to SEV sales, particu-larly in Asian countries like China and India [4]. In Europe, however, sales are verylow, and SEVs are not widely available [5]. Moreover, at present, the frameworkconditions in Germany might hinder a broader market adoption of SEVs [6].Applying supporting measures could foster a more widespread use. Therefore, it isimportant to analyze the possible potential of SEVs in respect to their impact ontransport. Against this background, our contribution addresses the following threetopics:
1. Transport impacts: What is the share of transport demand in passenger transportand commercial transport that could be substituted by SEVs? On which tripscould SEVs be used?
2. User potentials: For which user groups are SEVs suitable in terms ofsocio-demographic characteristics?
3. Applications and business models: What are the possible applications of SEVsin passenger transport and commercial transport? Which business models mightbe conceivable and suitable for SEVs?
SEV Definition The presented analyses focus on three-wheeled (L2e and L5e) andfour-wheeled (L6e and L7e) SEVs according to EU regulation No. 168/2013 aswell as electric cargo bikes. Cargo bikes can be two-, three- or four-wheeled withand without insurance tags.
2 Materials and Methods
We utilized a multi-method approach to answer our research questions: we con-ducted qualitative expert interviews amongst SEV experts and professionals andcarried out quantitative analyses with national household travel survey (NHTS)data. We have furthermore compared and contrasted our results with scientificliterature. For the present publication, the NHTS data analysis is focused onGermany. The expert interviews, in contrast, refer to the German Federal StateBaden-Württemberg appropriate to the primary study.
128 C. Eisenmann et al.
2.1 Qualitative Expert Interviews
SEVs are rarely used in Germany. Hence, statistics on the, e.g., employment effectsand economic impacts of SEVs in Germany do not exist yet. In order to broaden ourfindings from literature and travel survey analyses, we have conducted elevenexpert interviews. We developed an interview guideline, which we have used as abasis for each interview. For a comprehensive view, the interviewed experts cover awide range of expertise: from entrepreneurs of small, medium-sized, and globalcorporations to scientists and representatives of the state government ofBaden-Württemberg. This included expertise in the production and sale of SEVs aswell as the assessment of the legal framework in the study. The interviews wererecorded and analyzed for congruence. Our conclusions are based on accordingstatements. The content-related statements from the experts helped to evaluate thequantitative findings from data analysis and to formulate recommendations foraction. In accordance with the sponsor (e-mobil BW GmbH) of the study, theinterviews serve for a first exploration of the research field.
2.2 Quantitative Data Analyses with the NHTS Mobilityin Germany
The NHTS Mobility in Germany (MiD) The MiD is a nationwide, compre-hensive survey on travel behavior and transport demand of the German residentialpopulation [7]. The current survey was conducted in 2017; former surveys dateback to 2002 and 2008.
The MiD is a one-day survey, i.e., each participant reported their mobility on agiven day, i.e., the survey day. The field phase of the MiD 2017 took place betweenMay 2016 and September 2017. Therefore, a mixed-mode approach was applied:the participants took part in the survey either by paper and pencil questionnaire orby web questionnaire. A total of around 316,000 individuals from 156,000households participated and reported 961,000 trips on their respective survey days.
The MiD 2017 survey offers various levels of data analysis. The central com-ponent is the trip data set, which contains all trips made by the survey participantson their survey days. This data set contains, for example, trip-specific informationon departure and arrival time, purpose, modes of transport, distance travelled, andaccompaniment by other persons.
If the survey participants make regular trips due to their profession (e.g., mailcarrier, craftsmen, bus drivers, elderly care services), information on these trips wascollected at a lower level of detail (e.g., only the total distance travelled of allbusiness-related trips on the survey day).
It should be noted that no conclusions can be drawn from the one-day surveydata of the MiD 2017 on the travel behavior of individuals and SEV user potential
Fields of Applications and Transport-Related Potentials … 129
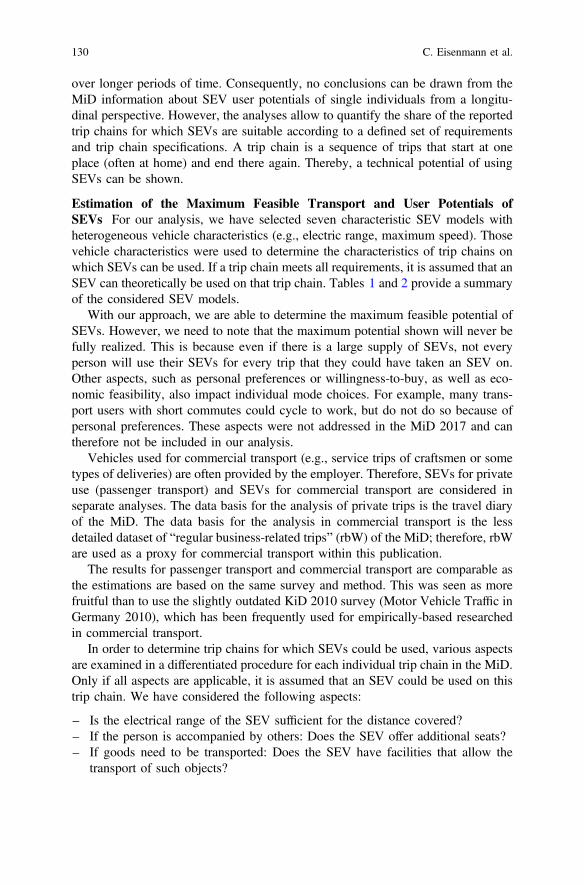
over longer periods of time. Consequently, no conclusions can be drawn from theMiD information about SEV user potentials of single individuals from a longitu-dinal perspective. However, the analyses allow to quantify the share of the reportedtrip chains for which SEVs are suitable according to a defined set of requirementsand trip chain specifications. A trip chain is a sequence of trips that start at oneplace (often at home) and end there again. Thereby, a technical potential of usingSEVs can be shown.
Estimation of the Maximum Feasible Transport and User Potentials ofSEVs For our analysis, we have selected seven characteristic SEV models withheterogeneous vehicle characteristics (e.g., electric range, maximum speed). Thosevehicle characteristics were used to determine the characteristics of trip chains onwhich SEVs can be used. If a trip chain meets all requirements, it is assumed that anSEV can theoretically be used on that trip chain. Tables 1 and 2 provide a summaryof the considered SEV models.
With our approach, we are able to determine the maximum feasible potential ofSEVs. However, we need to note that the maximum potential shown will never befully realized. This is because even if there is a large supply of SEVs, not everyperson will use their SEVs for every trip that they could have taken an SEV on.Other aspects, such as personal preferences or willingness-to-buy, as well as eco-nomic feasibility, also impact individual mode choices. For example, many trans-port users with short commutes could cycle to work, but do not do so because ofpersonal preferences. These aspects were not addressed in the MiD 2017 and cantherefore not be included in our analysis.
Vehicles used for commercial transport (e.g., service trips of craftsmen or sometypes of deliveries) are often provided by the employer. Therefore, SEVs for privateuse (passenger transport) and SEVs for commercial transport are considered inseparate analyses. The data basis for the analysis of private trips is the travel diaryof the MiD. The data basis for the analysis in commercial transport is the lessdetailed dataset of “regular business-related trips” (rbW) of the MiD; therefore, rbWare used as a proxy for commercial transport within this publication.
The results for passenger transport and commercial transport are comparable asthe estimations are based on the same survey and method. This was seen as morefruitful than to use the slightly outdated KiD 2010 survey (Motor Vehicle Traffic inGermany 2010), which has been frequently used for empirically-based researchedin commercial transport.
In order to determine trip chains for which SEVs could be used, various aspectsare examined in a differentiated procedure for each individual trip chain in the MiD.Only if all aspects are applicable, it is assumed that an SEV could be used on thistrip chain. We have considered the following aspects:
– Is the electrical range of the SEV sufficient for the distance covered?– If the person is accompanied by others: Does the SEV offer additional seats?– If goods need to be transported: Does the SEV have facilities that allow the
transport of such objects?
130 C. Eisenmann et al.
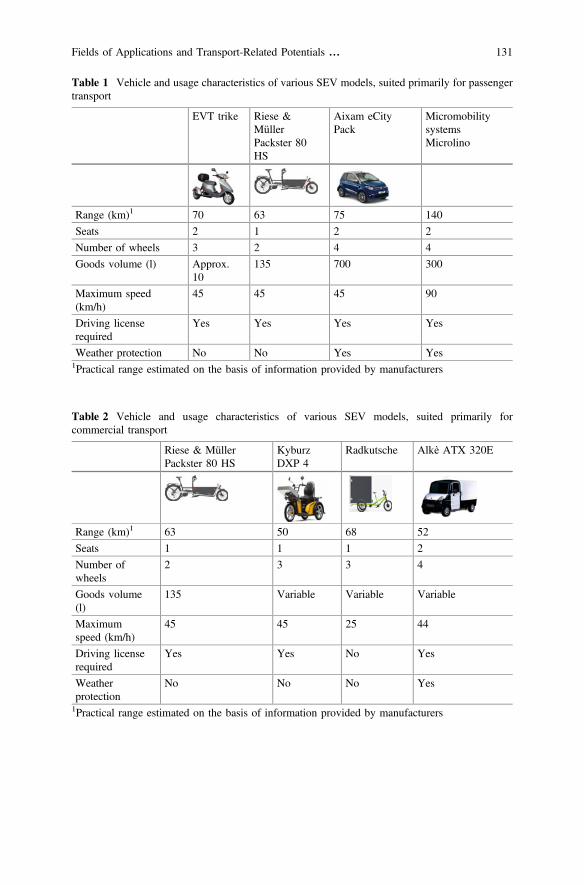
Table 1 Vehicle and usage characteristics of various SEV models, suited primarily for passengertransport
EVT trike Riese &MüllerPackster 80HS
Aixam eCityPack
MicromobilitysystemsMicrolino
Range (km)1 70 63 75 140
Seats 2 1 2 2
Number of wheels 3 2 4 4
Goods volume (l) Approx.10
135 700 300
Maximum speed(km/h)
45 45 45 90
Driving licenserequired
Yes Yes Yes Yes
Weather protection No No Yes Yes1Practical range estimated on the basis of information provided by manufacturers
Table 2 Vehicle and usage characteristics of various SEV models, suited primarily forcommercial transport
Riese & MüllerPackster 80 HS
KyburzDXP 4
Radkutsche Alkè ATX 320E
Range (km)1 63 50 68 52
Seats 1 1 1 2
Number ofwheels
2 3 3 4
Goods volume(l)
135 Variable Variable Variable
Maximumspeed (km/h)
45 45 25 44
Driving licenserequired
Yes Yes No Yes
Weatherprotection
No No No Yes
1Practical range estimated on the basis of information provided by manufacturers
Fields of Applications and Transport-Related Potentials … 131
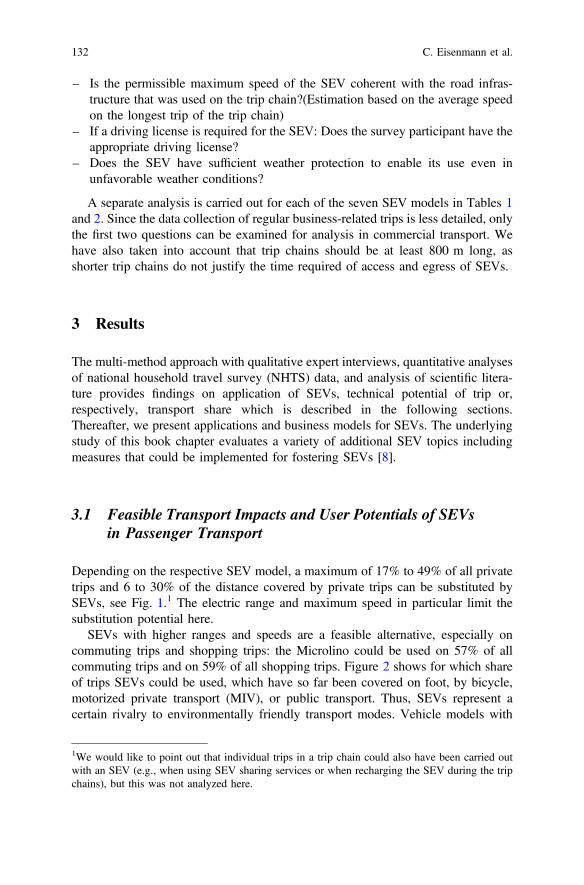
– Is the permissible maximum speed of the SEV coherent with the road infras-tructure that was used on the trip chain?(Estimation based on the average speedon the longest trip of the trip chain)
– If a driving license is required for the SEV: Does the survey participant have theappropriate driving license?
– Does the SEV have sufficient weather protection to enable its use even inunfavorable weather conditions?
A separate analysis is carried out for each of the seven SEV models in Tables 1and 2. Since the data collection of regular business-related trips is less detailed, onlythe first two questions can be examined for analysis in commercial transport. Wehave also taken into account that trip chains should be at least 800 m long, asshorter trip chains do not justify the time required of access and egress of SEVs.
3 Results
The multi-method approach with qualitative expert interviews, quantitative analysesof national household travel survey (NHTS) data, and analysis of scientific litera-ture provides findings on application of SEVs, technical potential of trip or,respectively, transport share which is described in the following sections.Thereafter, we present applications and business models for SEVs. The underlyingstudy of this book chapter evaluates a variety of additional SEV topics includingmeasures that could be implemented for fostering SEVs [8].
3.1 Feasible Transport Impacts and User Potentials of SEVsin Passenger Transport
Depending on the respective SEV model, a maximum of 17% to 49% of all privatetrips and 6 to 30% of the distance covered by private trips can be substituted bySEVs, see Fig. 1.1 The electric range and maximum speed in particular limit thesubstitution potential here.
SEVs with higher ranges and speeds are a feasible alternative, especially oncommuting trips and shopping trips: the Microlino could be used on 57% of allcommuting trips and on 59% of all shopping trips. Figure 2 shows for which shareof trips SEVs could be used, which have so far been covered on foot, by bicycle,motorized private transport (MIV), or public transport. Thus, SEVs represent acertain rivalry to environmentally friendly transport modes. Vehicle models with
1We would like to point out that individual trips in a trip chain could also have been carried outwith an SEV (e.g., when using SEV sharing services or when recharging the SEV during the tripchains), but this was not analyzed here.
132 C. Eisenmann et al.
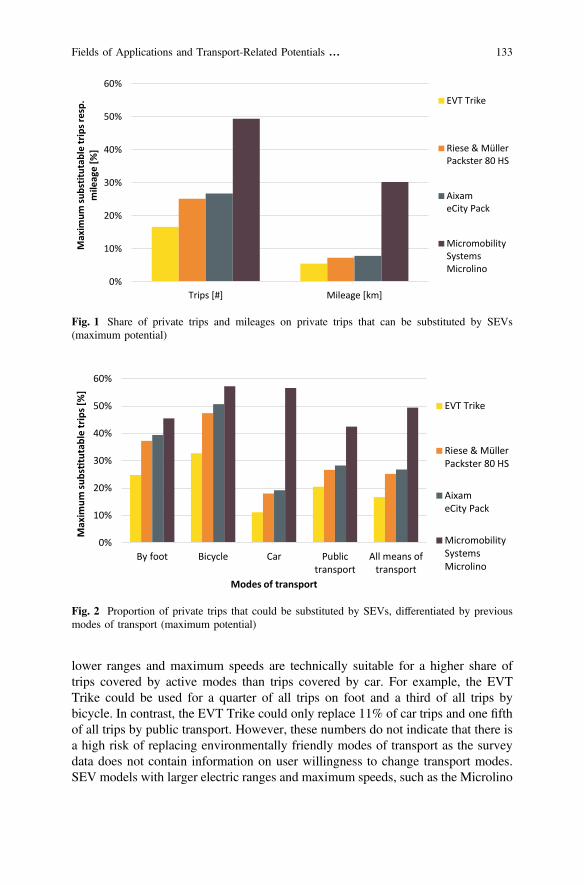
lower ranges and maximum speeds are technically suitable for a higher share oftrips covered by active modes than trips covered by car. For example, the EVTTrike could be used for a quarter of all trips on foot and a third of all trips bybicycle. In contrast, the EVT Trike could only replace 11% of car trips and one fifthof all trips by public transport. However, these numbers do not indicate that there isa high risk of replacing environmentally friendly modes of transport as the surveydata does not contain information on user willingness to change transport modes.SEV models with larger electric ranges and maximum speeds, such as the Microlino
0%
10%
20%
30%
40%
50%
60%
Trips [#] Mileage [km]
Max
imum
subs
titut
able
trip
s res
p.
mile
age
[%]
EVT Trike
Riese & MüllerPackster 80 HS
AixameCity Pack
MicromobilitySystemsMicrolino
Fig. 1 Share of private trips and mileages on private trips that can be substituted by SEVs(maximum potential)
0%
10%
20%
30%
40%
50%
60%
By foot Bicycle Car Publictransport
All means oftransport
Max
imum
subs
tuta
ble
trip
s [%
]
Modes of transport
EVT Trike
Riese & MüllerPackster 80 HS
AixameCity Pack
MicromobilitySystemsMicrolino
Fig. 2 Proportion of private trips that could be substituted by SEVs, differentiated by previousmodes of transport (maximum potential)
Fields of Applications and Transport-Related Potentials … 133
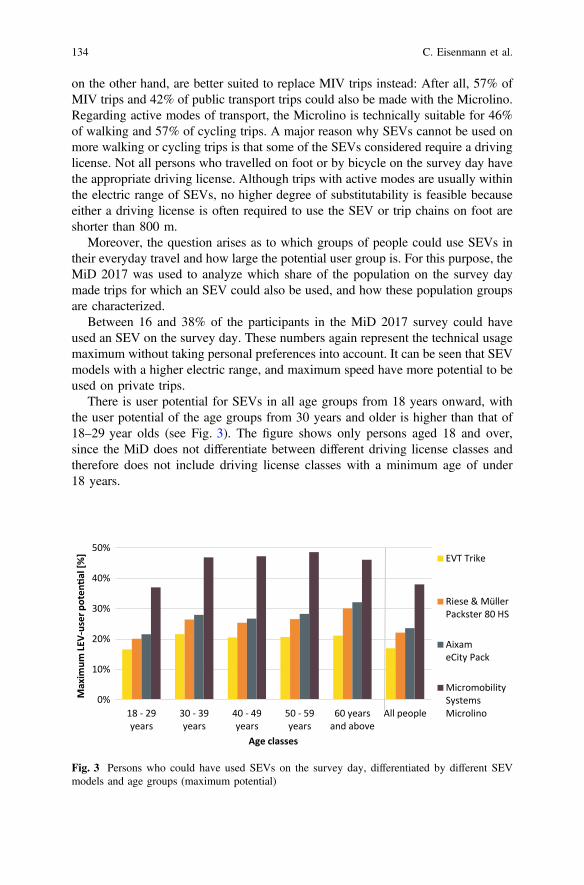
on the other hand, are better suited to replace MIV trips instead: After all, 57% ofMIV trips and 42% of public transport trips could also be made with the Microlino.Regarding active modes of transport, the Microlino is technically suitable for 46%of walking and 57% of cycling trips. A major reason why SEVs cannot be used onmore walking or cycling trips is that some of the SEVs considered require a drivinglicense. Not all persons who travelled on foot or by bicycle on the survey day havethe appropriate driving license. Although trips with active modes are usually withinthe electric range of SEVs, no higher degree of substitutability is feasible becauseeither a driving license is often required to use the SEV or trip chains on foot areshorter than 800 m.
Moreover, the question arises as to which groups of people could use SEVs intheir everyday travel and how large the potential user group is. For this purpose, theMiD 2017 was used to analyze which share of the population on the survey daymade trips for which an SEV could also be used, and how these population groupsare characterized.
Between 16 and 38% of the participants in the MiD 2017 survey could haveused an SEV on the survey day. These numbers again represent the technical usagemaximum without taking personal preferences into account. It can be seen that SEVmodels with a higher electric range, and maximum speed have more potential to beused on private trips.
There is user potential for SEVs in all age groups from 18 years onward, withthe user potential of the age groups from 30 years and older is higher than that of18–29 year olds (see Fig. 3). The figure shows only persons aged 18 and over,since the MiD does not differentiate between different driving license classes andtherefore does not include driving license classes with a minimum age of under18 years.
0%
10%
20%
30%
40%
50%
18 - 29years
30 - 39years
40 - 49years
50 - 59years
60 yearsand above
All people
Max
imum
LEV-
user
pot
enal
[%]
Age classes
EVT Trike
Riese & MüllerPackster 80 HS
AixameCity Pack
MicromobilitySystemsMicrolino
Fig. 3 Persons who could have used SEVs on the survey day, differentiated by different SEVmodels and age groups (maximum potential)
134 C. Eisenmann et al.
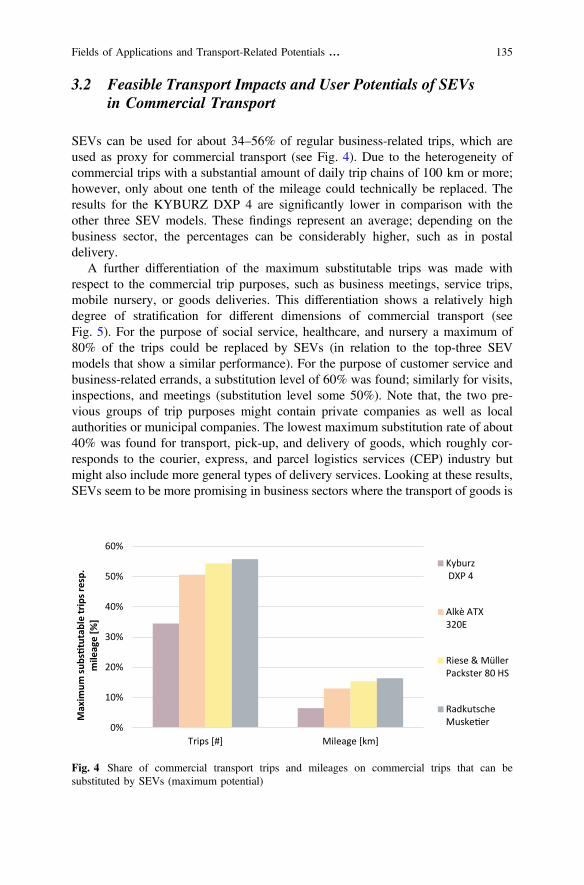
3.2 Feasible Transport Impacts and User Potentials of SEVsin Commercial Transport
SEVs can be used for about 34–56% of regular business-related trips, which areused as proxy for commercial transport (see Fig. 4). Due to the heterogeneity ofcommercial trips with a substantial amount of daily trip chains of 100 km or more;however, only about one tenth of the mileage could technically be replaced. Theresults for the KYBURZ DXP 4 are significantly lower in comparison with theother three SEV models. These findings represent an average; depending on thebusiness sector, the percentages can be considerably higher, such as in postaldelivery.
A further differentiation of the maximum substitutable trips was made withrespect to the commercial trip purposes, such as business meetings, service trips,mobile nursery, or goods deliveries. This differentiation shows a relatively highdegree of stratification for different dimensions of commercial transport (seeFig. 5). For the purpose of social service, healthcare, and nursery a maximum of80% of the trips could be replaced by SEVs (in relation to the top-three SEVmodels that show a similar performance). For the purpose of customer service andbusiness-related errands, a substitution level of 60% was found; similarly for visits,inspections, and meetings (substitution level some 50%). Note that, the two pre-vious groups of trip purposes might contain private companies as well as localauthorities or municipal companies. The lowest maximum substitution rate of about40% was found for transport, pick-up, and delivery of goods, which roughly cor-responds to the courier, express, and parcel logistics services (CEP) industry butmight also include more general types of delivery services. Looking at these results,SEVs seem to be more promising in business sectors where the transport of goods is
0%
10%
20%
30%
40%
50%
60%
Trips [#] Mileage [km]
Max
imum
subs
tuta
ble
trip
s res
p.
mile
age
[%]
Kyburz DXP 4
Alkè ATX320E
Riese & MüllerPackster 80 HS
RadkutscheMuske er
Fig. 4 Share of commercial transport trips and mileages on commercial trips that can besubstituted by SEVs (maximum potential)
Fields of Applications and Transport-Related Potentials … 135
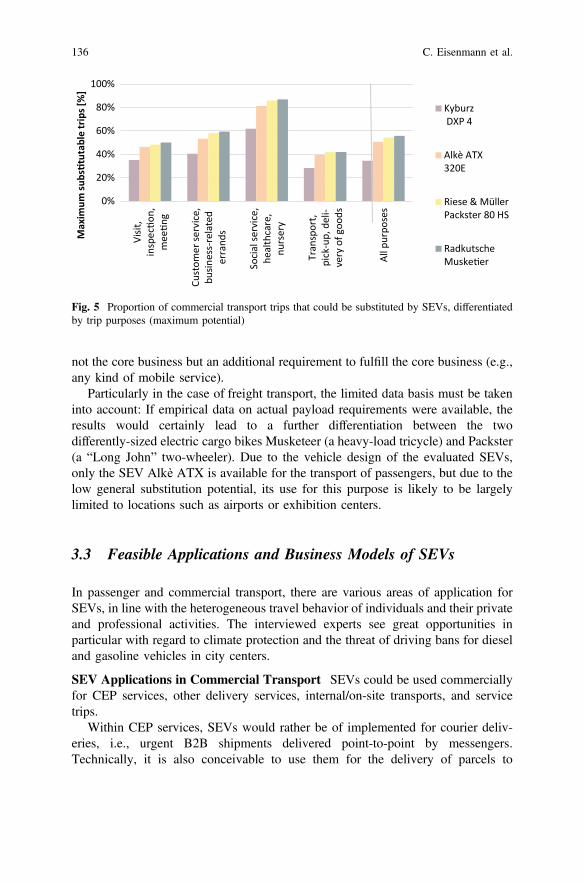
not the core business but an additional requirement to fulfill the core business (e.g.,any kind of mobile service).
Particularly in the case of freight transport, the limited data basis must be takeninto account: If empirical data on actual payload requirements were available, theresults would certainly lead to a further differentiation between the twodifferently-sized electric cargo bikes Musketeer (a heavy-load tricycle) and Packster(a “Long John” two-wheeler). Due to the vehicle design of the evaluated SEVs,only the SEV Alkè ATX is available for the transport of passengers, but due to thelow general substitution potential, its use for this purpose is likely to be largelylimited to locations such as airports or exhibition centers.
3.3 Feasible Applications and Business Models of SEVs
In passenger and commercial transport, there are various areas of application forSEVs, in line with the heterogeneous travel behavior of individuals and their privateand professional activities. The interviewed experts see great opportunities inparticular with regard to climate protection and the threat of driving bans for dieseland gasoline vehicles in city centers.
SEV Applications in Commercial Transport SEVs could be used commerciallyfor CEP services, other delivery services, internal/on-site transports, and servicetrips.
Within CEP services, SEVs would rather be of implemented for courier deliv-eries, i.e., urgent B2B shipments delivered point-to-point by messengers.Technically, it is also conceivable to use them for the delivery of parcels to
0%
20%
40%
60%
80%
100%
Visit
,in
spec
on,
mee
ng
Cust
omer
serv
ice,
busin
ess-
rela
ted
erra
nds
Soci
al se
rvic
e,he
alth
care
,nu
rser
y
Tran
spor
t,pi
ck-u
p, d
eli-
very
of g
oods
All p
urpo
ses
Max
imum
subs
tuta
ble
trip
s [%
]
Kyburz DXP 4
Alkè ATX320E
Riese & MüllerPackster 80 HS
RadkutscheMuske er
Fig. 5 Proportion of commercial transport trips that could be substituted by SEVs, differentiatedby trip purposes (maximum potential)
136 C. Eisenmann et al.
end-users (B2C). However, currently only a few of the available SEVs, such as theALKE ATX, offer a sufficient carrying capacity. It is therefore less likely that SEVswill be used to a large degree in the parcel mass market, given the currentregulation.
In contrast, SEVs could be used more frequently for other time-critical deliveryservices, especially for the delivery of prepared meals, as only a modest transportcapacity is required here. Furthermore, SEVs could be used by retailers (or theircontractors) for instant or time-window delivery options. However, due to lowwillingness-to-pay by customers, the feasibility of this business model might be achallenge.
SEVs are also suitable for internal or on-site commercial transports; this includestransport on larger company sites or residential facilities as well as transportbetween different sites of an organization or local authority. As these trips are oftenscheduled regularly with a homogeneous volume of goods, they can be adaptedmore easily to the limited ranges and loading capacities of SEVs.
Service trips are a heterogeneous group of trips within commercial transport inwhich the primary focus is not the transportation of goods, but the execution ofservices at the point of destination. These services require the transport of tools,spare parts, or other working materials. Some SEVs are well suited for service tripsthat only require moderate payloads and daily mileages, such as city cleaning andgardening, janitorial and facility services, technicians, craftsmen or nursingservices.
SEV Applications in Passenger Transport In passenger transport, SEVs couldbe used for everyday mobility in the same way as other privately owned means oftransport, such as the car. SEVs could, if the model characteristics allow it, be usedon entire trip chains, e.g., from home to work, then to sport and back home in theevening. Particularly on shorter trip chains, SEVs are a comfortable transportsolution independent of the present topography and often have weather protection.Many SEV models also offer the possibility of transporting goods, making themsuitable for (smaller) shopping. Due to the lower land usage compared to the car,SEVs are also an interesting alternative means of transport in urban areas withlimited parking space.
Another area of application is as mobility option for tourists. Especially incar-free tourism areas, e.g., nature parks, SEVs are an alternative to the bicycle orcar for the mobility of tourists.
Moreover, SEVs could also be used in passenger transport on trip stages. This isfeasible, for example, on the first or last mile of a public transport trip, i.e., on thestage between the public transport stop and the start or destination of the trip. Insuch an area of application, it would be conceivable that SEVs could be offered insharing concepts. Similar to current bike-sharing concepts, parking facilities couldbe installed at public transport stops, so that a simple and quick transfer to and frompublic transport is guaranteed.
Fields of Applications and Transport-Related Potentials … 137
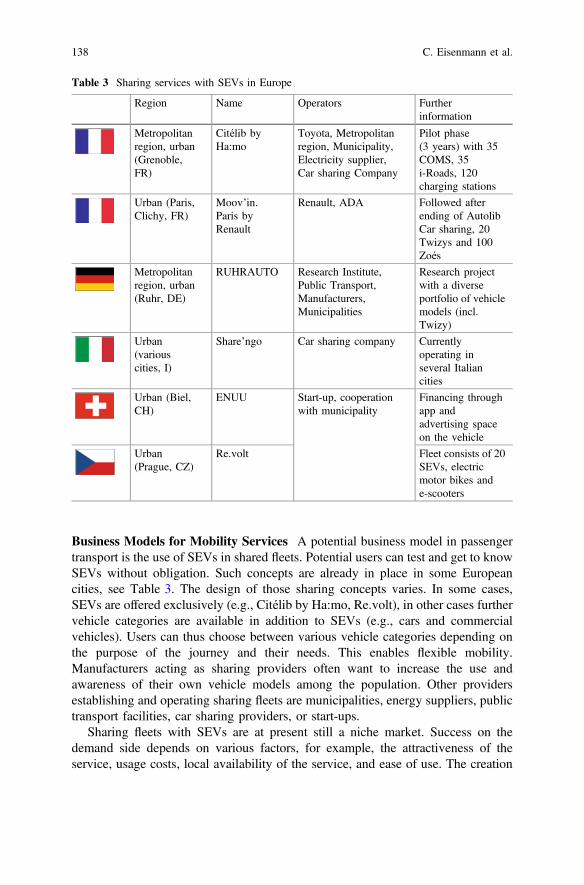
Business Models for Mobility Services A potential business model in passengertransport is the use of SEVs in shared fleets. Potential users can test and get to knowSEVs without obligation. Such concepts are already in place in some Europeancities, see Table 3. The design of those sharing concepts varies. In some cases,SEVs are offered exclusively (e.g., Citélib by Ha:mo, Re.volt), in other cases furthervehicle categories are available in addition to SEVs (e.g., cars and commercialvehicles). Users can thus choose between various vehicle categories depending onthe purpose of the journey and their needs. This enables flexible mobility.Manufacturers acting as sharing providers often want to increase the use andawareness of their own vehicle models among the population. Other providersestablishing and operating sharing fleets are municipalities, energy suppliers, publictransport facilities, car sharing providers, or start-ups.
Sharing fleets with SEVs are at present still a niche market. Success on thedemand side depends on various factors, for example, the attractiveness of theservice, usage costs, local availability of the service, and ease of use. The creation
Table 3 Sharing services with SEVs in Europe
Region Name Operators Furtherinformation
Metropolitanregion, urban(Grenoble,FR)
Citélib byHa:mo
Toyota, Metropolitanregion, Municipality,Electricity supplier,Car sharing Company
Pilot phase(3 years) with 35COMS, 35i-Roads, 120charging stations
Urban (Paris,Clichy, FR)
Moov’in.Paris byRenault
Renault, ADA Followed afterending of AutolibCar sharing, 20Twizys and 100Zoés
Metropolitanregion, urban(Ruhr, DE)
RUHRAUTO Research Institute,Public Transport,Manufacturers,Municipalities
Research projectwith a diverseportfolio of vehiclemodels (incl.Twizy)
Urban(variouscities, I)
Share’ngo Car sharing company Currentlyoperating inseveral Italiancities
Urban (Biel,CH)
ENUU Start-up, cooperationwith municipality
Financing throughapp andadvertising spaceon the vehicle
Urban(Prague, CZ)
Re.volt Fleet consists of 20SEVs, electricmotor bikes ande-scooters
138 C. Eisenmann et al.
of significant demand is fundamental to the development of financially successfulbusiness models. Furthermore, when selecting SEV models for sharing, it isimportant to ensure that they are robust in use and resistant to external damage, sothat the maintenance and servicing costs remain manageable. The resale andresidual value of SEVs from sharing fleets in the secondary market determine thesuccess of the business model. Moreover, one sharing fleet operator pointed out inour interview that the requirements for the robustness and reliability of the vehicleswhen used in sharing fleets are higher than for private use. This should be taken intoaccount when designing SEVs. At present, no conclusions can be drawn regardingthe profitability of this business model. Sharing services offered by car manufac-turers with fleets of cars are currently aimed primarily at offering their own mobilityservices, strengthening the bond with their own customer base, and thus reducingcompetition from other mobility-service providers [9]. Furthermore, the stronggrowth in subscribers is giving the impression of a strong growth in demand forsharing services.
4 Conclusions and Outlook
Our results show that, technically, SEVs could be used for 20–50% of private trips(depending on the SEV model and only counting trips that are parts of trip chains, ifSEVs are suitable for the entire trip chain). This technical potential includes cartrips, as well as trips on public transport or by bicycle and on foot. The potential isrestricted by the criteria used for the analysis such as availability of weather pro-tection and average speed on the longest trip of the trip chain. Extended futureanalysis could also analyze single trips in order to account for options such as carsharing and recharging during trip chains, thereby deriving an even higher potential.Within commercial transport, SEVs have been found to be particularly suitable forservice-oriented activities such as healthcare, craftsmen, or municipal services.Concerning deliveries, time-critical point-to-point (courier) shipments or fooddeliveries seem to be more feasible than standard parcel deliveries.
If SEVs were to replace a significant share of the transport volumes of motorizedpassenger and commercial transport, they could contribute to climate protection.Due to the lower weight and lower speeds of SEVs compared to cars, less energy isrequired for their operation.
The presented analysis of the MiD was accompanied by expert interviews thatincluded questions regarding any possible measures to foster SEVs. Many expertsstated that, if a wider application of SEVs with the replacement of specific modes isdesired, boundary conditions need to be actively shaped accordingly. Since SEVshave already been on the market for more than 12 years without gaining a highmarket share, significant shifts in transport modes seem unlikely unless parameters,such as regulation, taxes, boundary conditions of use, vehicle technology, variety ofmodels or prices, change fundamentally.
Fields of Applications and Transport-Related Potentials … 139
Future studies and real-world settings could evaluate how measures could fosterSEVs as part of a sustainable transport system. According to the authors, measuresshould focus on areas of application, where public transport and active modescannot offer attractive solutions, e.g., due to very low or disperse transport demandor to the physical constraints of users.
References
1. Honey, E., Lee, H., Suh, I.-S.: Future urban transportation technologies for sustainability withan emphasis on growing mega cities: a strategic proposal on introducing a new micro electricvehicle statement. WTR (3), 13 (2014). https://doi.org/10.7165/wtr2014.3.3.139
2. Santucci, M., Pieve, M., Pierini, M.: Electric L-category vehicles for smart urban mobility.Trans. Res. Part F Traffic Psychol Behav 14, 3651–3660 (2016)
3. Bauer, W., Wagner, S., Edel, F., Stegmüller, S., Nagl, E.: Mikromobilität. Nutzerbedarfe undMarktpotenziale im Personenverkehr. Stuttgart, Germany: Fraunhofer-Institut fürArbeitswirtschaft und Organisation IAO (2017)
4. International Energy Agency: Global EV Outlook 2019: Scaling-Up the Transition to ElectricMobility. OECD (2019)
5. ACEM: Motorcycle, Moped and Quadricycle Registrations in the European Union—2010–2018. (2019). Accessed 08 Mar 2019. [Online] Available: https://www.acem.eu/market-data
6. Ewert, A., Brost, M.K., Schmid, S.A.: Framework conditions and potential measures for smallelectric vehicles on a municipal level. WEVJ 11(1), 1 (2020). https://doi.org/10.3390/wevj11010001
7. Nobis, C., Kuhnimhof, T.: Mobilität in Deutschland—MiD Ergebnisbericht. Study from infas,DLR, IVT and infas 360 on behalf of the German Ministry of Transport and DigitalInfrastructure.
8. Brost, M., Ewert, A., Schmid, S., Eisenmann, C., Gruber, J., Klauenberg, J., Stieler, S.:Elektrische Klein- und Leichtfahrzeuge. Chancen und Potenziale für Baden-Württemberg onBehalf of E-mobil BW. Stuttgart, Germany (2019)
9. Zeit Online: Carsharing: BMW und Daimler stecken Milliardenbetrag in Mobilitätsfirma.ZEIT ONLINE, 22 Feb 2019. https://www.zeit.de/mobilitaet/2019–02/carsharing-bmw-daimler-investition-mobilitaetsfirma-elektroautos. Accessed 30 Apr 2019
Open Access This chapter is licensed under the terms of the Creative Commons Attribution 4.0International License (http://creativecommons.org/licenses/by/4.0/), which permits use, sharing,adaptation, distribution and reproduction in any medium or format, as long as you give appropriatecredit to the original author(s) and the source, provide a link to the Creative Commons license andindicate if changes were made.The images or other third party material in this chapter are included in the chapter’s Creative
Commons license, unless indicated otherwise in a credit line to the material. If material is notincluded in the chapter’s Creative Commons license and your intended use is not permitted bystatutory regulation or exceeds the permitted use, you will need to obtain permission directly fromthe copyright holder.
140 C. Eisenmann et al.

Vehicle Concepts and Technologies
KYBURZ Small Electric Vehicles:A Case Study in Successful Deployment
Erik Wilhelm, Wilfried Hahn, and Martin Kyburz
Abstract This paper is written from the perspective of a Swiss OEM which hasbeen active in the small electric vehicle (SEV) market since 1991 and has put over22,000 SEVs on the road around the world. KYBURZ Switzerland AG identifiedseveral important niche markets for SEVs and today sells vehicles to improve themobility of senior citizens (e.g. KYBURZ Plus), to increase the efficiency of postaland logistics companies (e.g., KYBURZ DXP), and to imbue drivers with passionfor electric vehicles (e.g., KYBURZ eRod). Most KYBURZ vehicles are currentlyhomologated in the category L2e, L6e, or L7e. The company has also developed aFleet Management product which gives its customers detailed insights into theperformance of their electric as well as conventionally powered vehicles.Anonymized datasets from this Fleet Management system will be drawn upon inthis paper to examine questions regarding their application, i.e., environmental andeconomic aspects. The unique feature which the authors from KYBURZ bring withthis paper is that all their investigations are performed with real data gained fromthe field experience. The primary focus of this paper is on last-mile mobility ser-vices for postal organizations which help to increase efficiency and meet sustain-ability goals.
Keywords Electric postal vehicles � Large-scale deployment � Total cost
1 Introduction
The Swiss OEM KYBURZ offers a Fleet Management product which gives itscustomers detailed insights into the performance of their electric as well as con-ventionally powered vehicles. Anonymized datasets from this Fleet Managementsystem will be drawn upon in this paper to examine the following questions:
E. Wilhelm (&) � W. Hahn � M. KyburzKyburz Switzerland AG, Solarweg 1, Freienstein-Teufen 8427, Switzerlande-mail: [email protected]
© The Author(s) 2021A. Ewert et al. (eds.), Small Electric Vehicles,https://doi.org/10.1007/978-3-030-65843-4_11
143
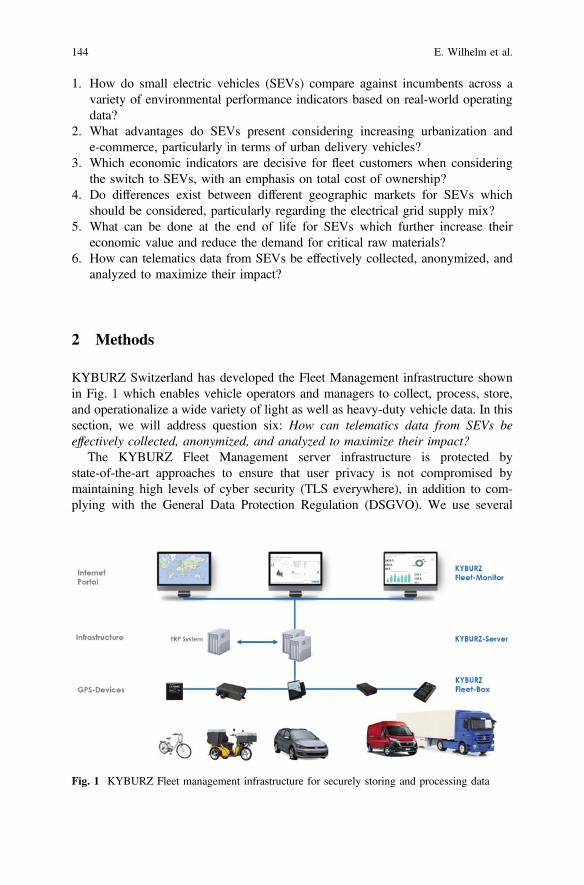
1. How do small electric vehicles (SEVs) compare against incumbents across avariety of environmental performance indicators based on real-world operatingdata?
2. What advantages do SEVs present considering increasing urbanization ande-commerce, particularly in terms of urban delivery vehicles?
3. Which economic indicators are decisive for fleet customers when consideringthe switch to SEVs, with an emphasis on total cost of ownership?
4. Do differences exist between different geographic markets for SEVs whichshould be considered, particularly regarding the electrical grid supply mix?
5. What can be done at the end of life for SEVs which further increase theireconomic value and reduce the demand for critical raw materials?
6. How can telematics data from SEVs be effectively collected, anonymized, andanalyzed to maximize their impact?
2 Methods
KYBURZ Switzerland has developed the Fleet Management infrastructure shownin Fig. 1 which enables vehicle operators and managers to collect, process, store,and operationalize a wide variety of light as well as heavy-duty vehicle data. In thissection, we will address question six: How can telematics data from SEVs beeffectively collected, anonymized, and analyzed to maximize their impact?
The KYBURZ Fleet Management server infrastructure is protected bystate-of-the-art approaches to ensure that user privacy is not compromised bymaintaining high levels of cyber security (TLS everywhere), in addition to com-plying with the General Data Protection Regulation (DSGVO). We use several
Fig. 1 KYBURZ Fleet management infrastructure for securely storing and processing data
144 E. Wilhelm et al.
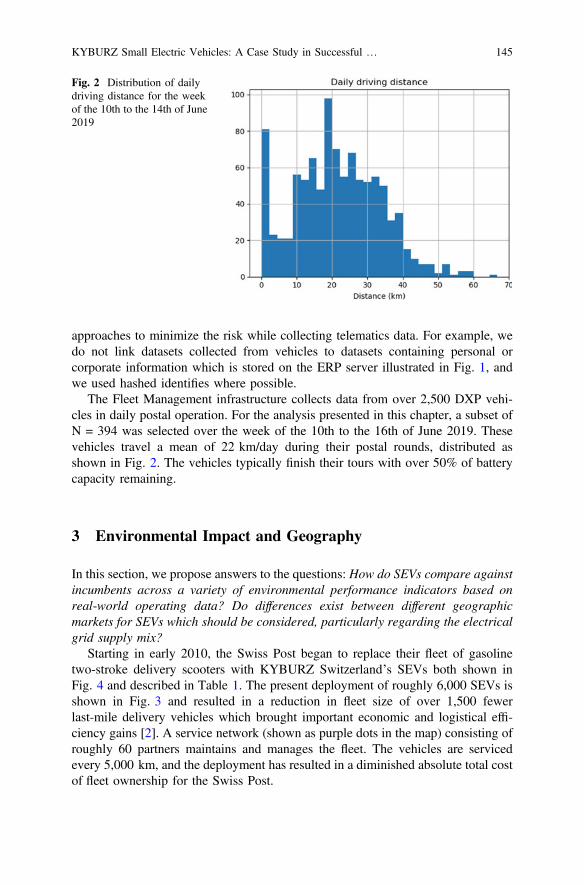
approaches to minimize the risk while collecting telematics data. For example, wedo not link datasets collected from vehicles to datasets containing personal orcorporate information which is stored on the ERP server illustrated in Fig. 1, andwe used hashed identifies where possible.
The Fleet Management infrastructure collects data from over 2,500 DXP vehi-cles in daily postal operation. For the analysis presented in this chapter, a subset ofN = 394 was selected over the week of the 10th to the 16th of June 2019. Thesevehicles travel a mean of 22 km/day during their postal rounds, distributed asshown in Fig. 2. The vehicles typically finish their tours with over 50% of batterycapacity remaining.
3 Environmental Impact and Geography
In this section, we propose answers to the questions: How do SEVs compare againstincumbents across a variety of environmental performance indicators based onreal-world operating data? Do differences exist between different geographicmarkets for SEVs which should be considered, particularly regarding the electricalgrid supply mix?
Starting in early 2010, the Swiss Post began to replace their fleet of gasolinetwo-stroke delivery scooters with KYBURZ Switzerland’s SEVs both shown inFig. 4 and described in Table 1. The present deployment of roughly 6,000 SEVs isshown in Fig. 3 and resulted in a reduction in fleet size of over 1,500 fewerlast-mile delivery vehicles which brought important economic and logistical effi-ciency gains [2]. A service network (shown as purple dots in the map) consisting ofroughly 60 partners maintains and manages the fleet. The vehicles are servicedevery 5,000 km, and the deployment has resulted in a diminished absolute total costof fleet ownership for the Swiss Post.
Fig. 2 Distribution of dailydriving distance for the weekof the 10th to the 14th of June2019
KYBURZ Small Electric Vehicles: A Case Study in Successful … 145
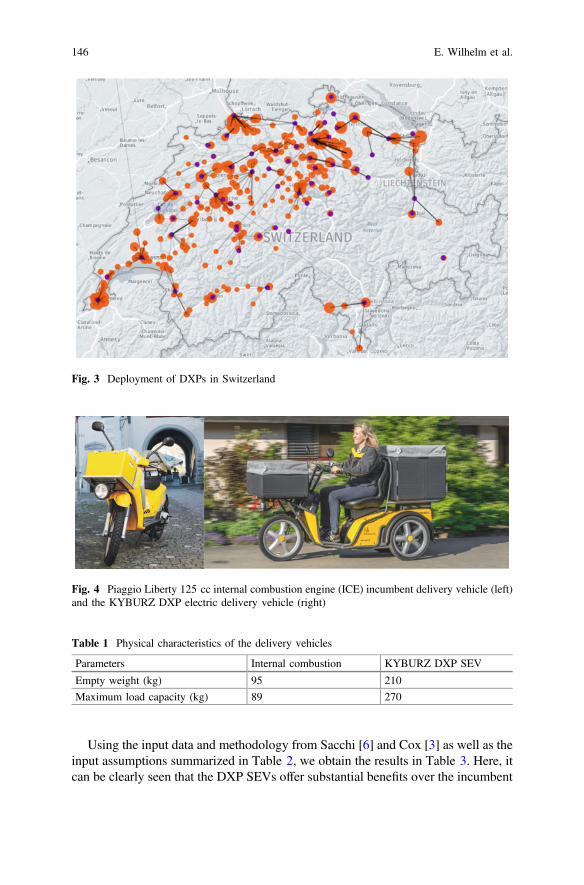
Using the input data and methodology from Sacchi [6] and Cox [3] as well as theinput assumptions summarized in Table 2, we obtain the results in Table 3. Here, itcan be clearly seen that the DXP SEVs offer substantial benefits over the incumbent
Fig. 3 Deployment of DXPs in Switzerland
Fig. 4 Piaggio Liberty 125 cc internal combustion engine (ICE) incumbent delivery vehicle (left)and the KYBURZ DXP electric delivery vehicle (right)
Table 1 Physical characteristics of the delivery vehicles
Parameters Internal combustion KYBURZ DXP SEV
Empty weight (kg) 95 210
Maximum load capacity (kg) 89 270
146 E. Wilhelm et al.
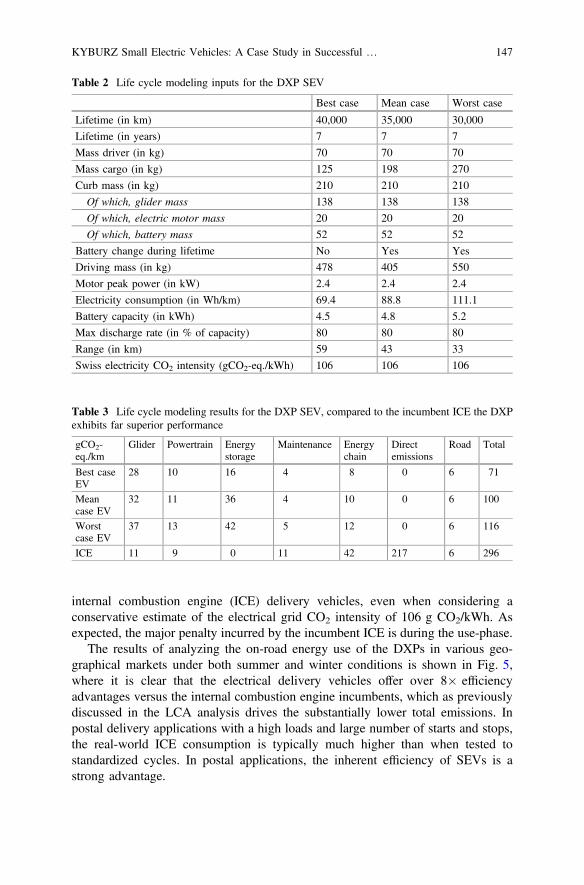
internal combustion engine (ICE) delivery vehicles, even when considering aconservative estimate of the electrical grid CO2 intensity of 106 g CO2/kWh. Asexpected, the major penalty incurred by the incumbent ICE is during the use-phase.
The results of analyzing the on-road energy use of the DXPs in various geo-graphical markets under both summer and winter conditions is shown in Fig. 5,where it is clear that the electrical delivery vehicles offer over 8� efficiencyadvantages versus the internal combustion engine incumbents, which as previouslydiscussed in the LCA analysis drives the substantially lower total emissions. Inpostal delivery applications with a high loads and large number of starts and stops,the real-world ICE consumption is typically much higher than when tested tostandardized cycles. In postal applications, the inherent efficiency of SEVs is astrong advantage.
Table 2 Life cycle modeling inputs for the DXP SEV
Best case Mean case Worst case
Lifetime (in km) 40,000 35,000 30,000
Lifetime (in years) 7 7 7
Mass driver (in kg) 70 70 70
Mass cargo (in kg) 125 198 270
Curb mass (in kg) 210 210 210
Of which, glider mass 138 138 138
Of which, electric motor mass 20 20 20
Of which, battery mass 52 52 52
Battery change during lifetime No Yes Yes
Driving mass (in kg) 478 405 550
Motor peak power (in kW) 2.4 2.4 2.4
Electricity consumption (in Wh/km) 69.4 88.8 111.1
Battery capacity (in kWh) 4.5 4.8 5.2
Max discharge rate (in % of capacity) 80 80 80
Range (in km) 59 43 33
Swiss electricity CO2 intensity (gCO2-eq./kWh) 106 106 106
Table 3 Life cycle modeling results for the DXP SEV, compared to the incumbent ICE the DXPexhibits far superior performance
gCO2-eq./km
Glider Powertrain Energystorage
Maintenance Energychain
Directemissions
Road Total
Best caseEV
28 10 16 4 8 0 6 71
Meancase EV
32 11 36 4 10 0 6 100
Worstcase EV
37 13 42 5 12 0 6 116
ICE 11 9 0 11 42 217 6 296
KYBURZ Small Electric Vehicles: A Case Study in Successful … 147
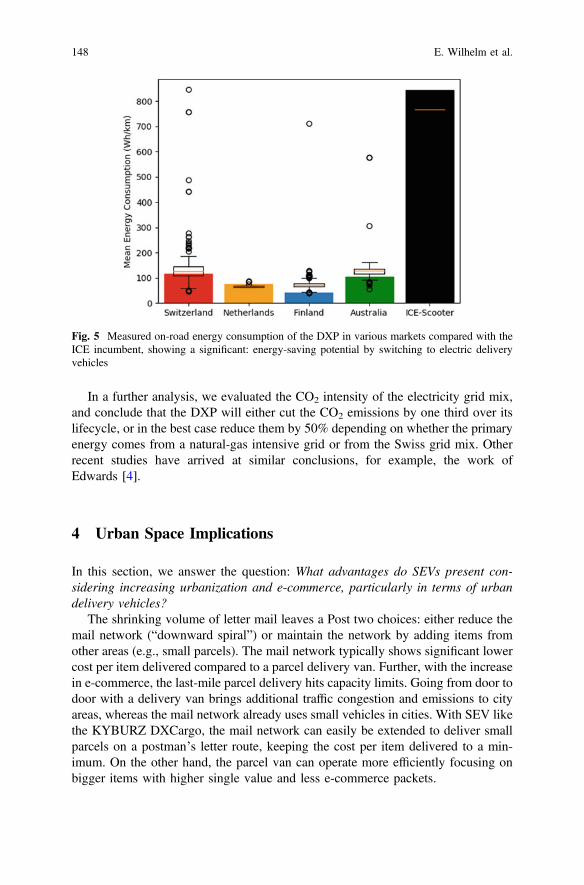
In a further analysis, we evaluated the CO2 intensity of the electricity grid mix,and conclude that the DXP will either cut the CO2 emissions by one third over itslifecycle, or in the best case reduce them by 50% depending on whether the primaryenergy comes from a natural-gas intensive grid or from the Swiss grid mix. Otherrecent studies have arrived at similar conclusions, for example, the work ofEdwards [4].
4 Urban Space Implications
In this section, we answer the question: What advantages do SEVs present con-sidering increasing urbanization and e-commerce, particularly in terms of urbandelivery vehicles?
The shrinking volume of letter mail leaves a Post two choices: either reduce themail network (“downward spiral”) or maintain the network by adding items fromother areas (e.g., small parcels). The mail network typically shows significant lowercost per item delivered compared to a parcel delivery van. Further, with the increasein e-commerce, the last-mile parcel delivery hits capacity limits. Going from door todoor with a delivery van brings additional traffic congestion and emissions to cityareas, whereas the mail network already uses small vehicles in cities. With SEV likethe KYBURZ DXCargo, the mail network can easily be extended to deliver smallparcels on a postman’s letter route, keeping the cost per item delivered to a min-imum. On the other hand, the parcel van can operate more efficiently focusing onbigger items with higher single value and less e-commerce packets.
Fig. 5 Measured on-road energy consumption of the DXP in various markets compared with theICE incumbent, showing a significant: energy-saving potential by switching to electric deliveryvehicles
148 E. Wilhelm et al.
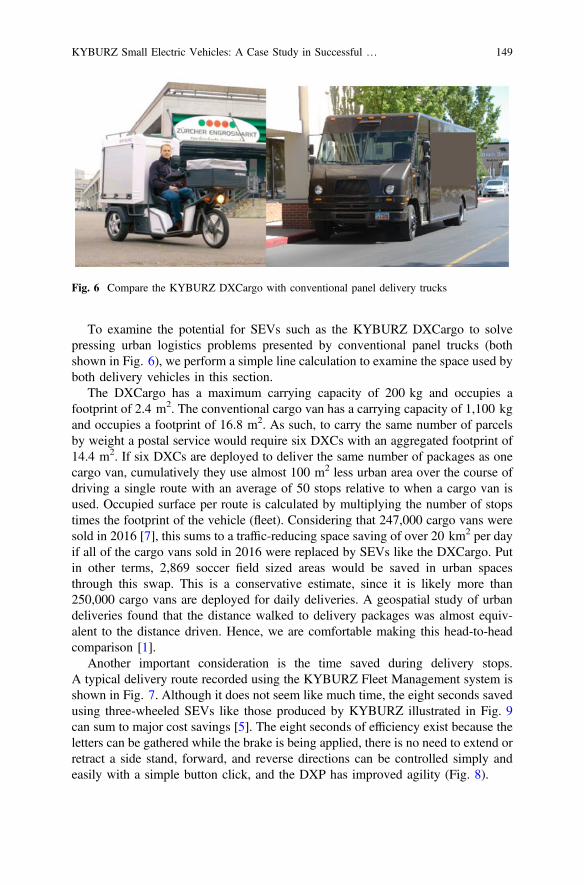
To examine the potential for SEVs such as the KYBURZ DXCargo to solvepressing urban logistics problems presented by conventional panel trucks (bothshown in Fig. 6), we perform a simple line calculation to examine the space used byboth delivery vehicles in this section.
The DXCargo has a maximum carrying capacity of 200 kg and occupies afootprint of 2.4 m2. The conventional cargo van has a carrying capacity of 1,100 kgand occupies a footprint of 16.8 m2. As such, to carry the same number of parcelsby weight a postal service would require six DXCs with an aggregated footprint of14.4 m2. If six DXCs are deployed to deliver the same number of packages as onecargo van, cumulatively they use almost 100 m2 less urban area over the course ofdriving a single route with an average of 50 stops relative to when a cargo van isused. Occupied surface per route is calculated by multiplying the number of stopstimes the footprint of the vehicle (fleet). Considering that 247,000 cargo vans weresold in 2016 [7], this sums to a traffic-reducing space saving of over 20 km2 per dayif all of the cargo vans sold in 2016 were replaced by SEVs like the DXCargo. Putin other terms, 2,869 soccer field sized areas would be saved in urban spacesthrough this swap. This is a conservative estimate, since it is likely more than250,000 cargo vans are deployed for daily deliveries. A geospatial study of urbandeliveries found that the distance walked to delivery packages was almost equiv-alent to the distance driven. Hence, we are comfortable making this head-to-headcomparison [1].
Another important consideration is the time saved during delivery stops.A typical delivery route recorded using the KYBURZ Fleet Management system isshown in Fig. 7. Although it does not seem like much time, the eight seconds savedusing three-wheeled SEVs like those produced by KYBURZ illustrated in Fig. 9can sum to major cost savings [5]. The eight seconds of efficiency exist because theletters can be gathered while the brake is being applied, there is no need to extend orretract a side stand, forward, and reverse directions can be controlled simply andeasily with a simple button click, and the DXP has improved agility (Fig. 8).
Fig. 6 Compare the KYBURZ DXCargo with conventional panel delivery trucks
KYBURZ Small Electric Vehicles: A Case Study in Successful … 149
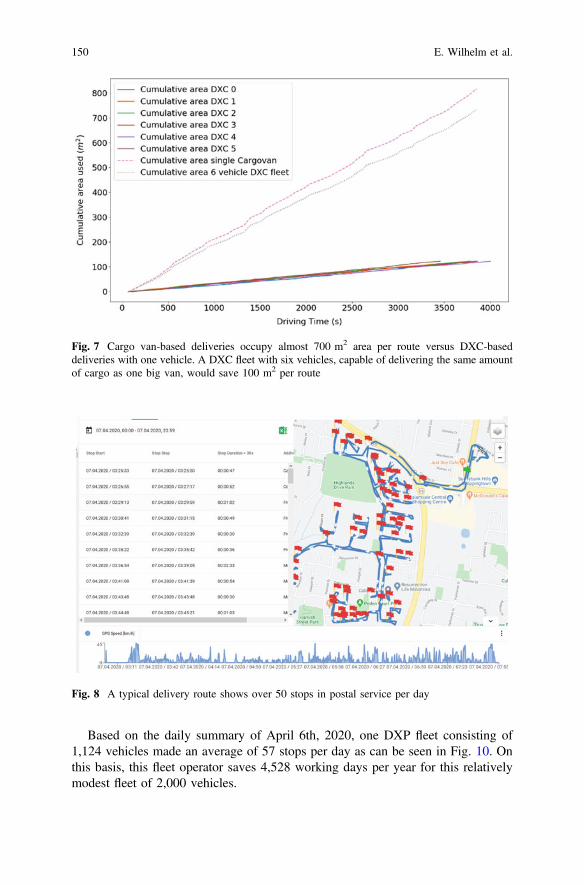
Based on the daily summary of April 6th, 2020, one DXP fleet consisting of1,124 vehicles made an average of 57 stops per day as can be seen in Fig. 10. Onthis basis, this fleet operator saves 4,528 working days per year for this relativelymodest fleet of 2,000 vehicles.
Fig. 7 Cargo van-based deliveries occupy almost 700 m2 area per route versus DXC-baseddeliveries with one vehicle. A DXC fleet with six vehicles, capable of delivering the same amountof cargo as one big van, would save 100 m2 per route
Fig. 8 A typical delivery route shows over 50 stops in postal service per day
150 E. Wilhelm et al.
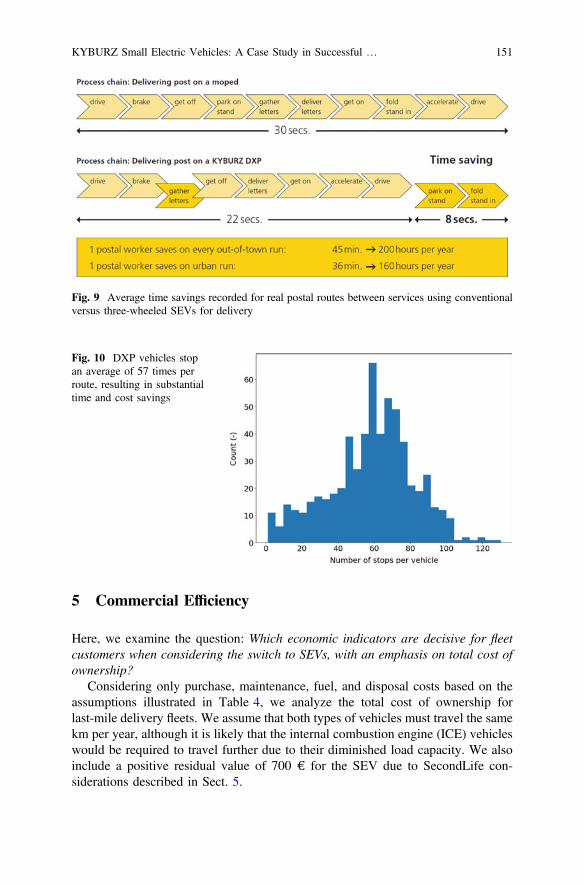
5 Commercial Efficiency
Here, we examine the question: Which economic indicators are decisive for fleetcustomers when considering the switch to SEVs, with an emphasis on total cost ofownership?
Considering only purchase, maintenance, fuel, and disposal costs based on theassumptions illustrated in Table 4, we analyze the total cost of ownership forlast-mile delivery fleets. We assume that both types of vehicles must travel the samekm per year, although it is likely that the internal combustion engine (ICE) vehicleswould be required to travel further due to their diminished load capacity. We alsoinclude a positive residual value of 700 € for the SEV due to SecondLife con-siderations described in Sect. 5.
Fig. 9 Average time savings recorded for real postal routes between services using conventionalversus three-wheeled SEVs for delivery
Fig. 10 DXP vehicles stopan average of 57 times perroute, resulting in substantialtime and cost savings
KYBURZ Small Electric Vehicles: A Case Study in Successful … 151
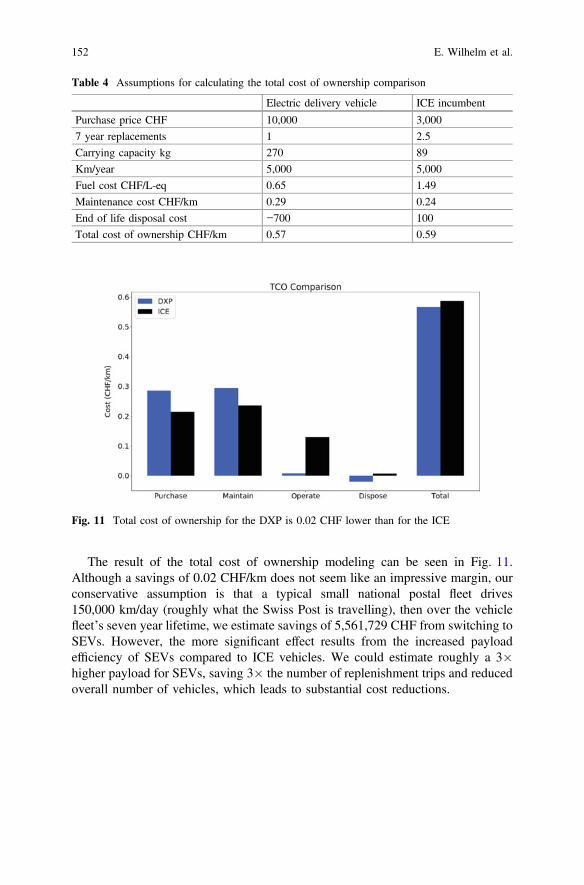
The result of the total cost of ownership modeling can be seen in Fig. 11.Although a savings of 0.02 CHF/km does not seem like an impressive margin, ourconservative assumption is that a typical small national postal fleet drives150,000 km/day (roughly what the Swiss Post is travelling), then over the vehiclefleet’s seven year lifetime, we estimate savings of 5,561,729 CHF from switching toSEVs. However, the more significant effect results from the increased payloadefficiency of SEVs compared to ICE vehicles. We could estimate roughly a 3�higher payload for SEVs, saving 3� the number of replenishment trips and reducedoverall number of vehicles, which leads to substantial cost reductions.
Table 4 Assumptions for calculating the total cost of ownership comparison
Electric delivery vehicle ICE incumbent
Purchase price CHF 10,000 3,000
7 year replacements 1 2.5
Carrying capacity kg 270 89
Km/year 5,000 5,000
Fuel cost CHF/L-eq 0.65 1.49
Maintenance cost CHF/km 0.29 0.24
End of life disposal cost −700 100
Total cost of ownership CHF/km 0.57 0.59
Fig. 11 Total cost of ownership for the DXP is 0.02 CHF lower than for the ICE
152 E. Wilhelm et al.
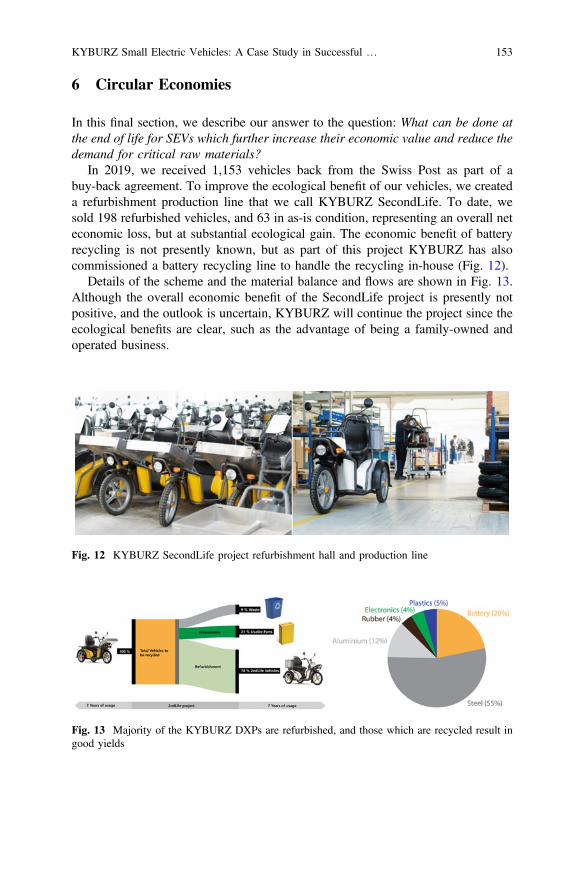
6 Circular Economies
In this final section, we describe our answer to the question: What can be done atthe end of life for SEVs which further increase their economic value and reduce thedemand for critical raw materials?
In 2019, we received 1,153 vehicles back from the Swiss Post as part of abuy-back agreement. To improve the ecological benefit of our vehicles, we createda refurbishment production line that we call KYBURZ SecondLife. To date, wesold 198 refurbished vehicles, and 63 in as-is condition, representing an overall neteconomic loss, but at substantial ecological gain. The economic benefit of batteryrecycling is not presently known, but as part of this project KYBURZ has alsocommissioned a battery recycling line to handle the recycling in-house (Fig. 12).
Details of the scheme and the material balance and flows are shown in Fig. 13.Although the overall economic benefit of the SecondLife project is presently notpositive, and the outlook is uncertain, KYBURZ will continue the project since theecological benefits are clear, such as the advantage of being a family-owned andoperated business.
Fig. 12 KYBURZ SecondLife project refurbishment hall and production line
Fig. 13 Majority of the KYBURZ DXPs are refurbished, and those which are recycled result ingood yields
KYBURZ Small Electric Vehicles: A Case Study in Successful … 153
7 Summary and Conclusions
To conclude, in this short chapter, we describe our successful deployment of SEVsin the form of the KYBURZ DXP, and draw the following conclusions:
1. Telematics data is extremely valuable for companies in the SEV market wishingto better understand their products,
2. SEVs are at least one third, and perhaps as much as 50% less CO2 emitting thantheir ICE-based competitors,
3. The use of SEVs in package delivery operations in urban environments couldeasily save over 20 km2 per operation day, reducing congestion andpoint-source emissions,
4. The total cost of SEV ownership is lower than ICE-based competitors due toreduced replacement rates, greater carrying capacity, and increased operationalefficiency,
5. Though it is presently economically irrational, the ecological advantages fromrefurbishing SEVs for second life deployments means KYBURZ will pursuethis approach.
References
1. Allen, J.P.: Understanding the impact of e-commerce on last-mile light goods vehicle activityin urban areas: the case of London. Desirable Trans. Futures (Special Edition), 6–26 (2017)
2. Baeriswyl, M.: Personalzeitung Swiss Post. Retrieved from Die Post (2017). www.post.ch/online-zeitung
3. Cox, B.B.: The environmental burdens of passenger cars: today and tomorrow (2018).Retrieved from PSI Reports: https://www.psi.ch/sites/default/files/import/ta/PublicationTab/Cox_2018.pdf
4. Edwards, J.: Comparative analysis of the carbon footprints of conventional and online retailing:a “last mile” perspective. Int. J. Phys. Distrib. Logist Manage 40 (2010). https://doi.org/10.1108/09600031011018055
5. Kyburz Switzerland AG: DXP 5.0 Brochure (2020). Retrieved from Kyburz Switzerlandhttps://kyburz-switzerland.ch/library/Reduced_Size_Broschuere_Kyburz_DXP_p1-12_7a18.pdf
6. Sacchi, R.B.: Carculator: an open-source tool for prospective environmental and economic lifecycle assessment of vehicles. When, Where and How can battery-electric vehicles help reducegreenhouse gas emissions? Renew Sustain Energy Rev, In Review (2019)
7. Williams, G.: Ford Transit tops European and global sales league for cargo vans (2016).Retrieved from Business Vans: https://www.businessvans.co.uk/van-news/ford-transit-tops-european-and-global-sales-league-for-cargo-vans/
154 E. Wilhelm et al.

Open Access This chapter is licensed under the terms of the Creative Commons Attribution 4.0International License (http://creativecommons.org/licenses/by/4.0/), which permits use, sharing,adaptation, distribution and reproduction in any medium or format, as long as you give appropriatecredit to the original author(s) and the source, provide a link to the Creative Commons license andindicate if changes were made.The images or other third party material in this chapter are included in the chapter’s Creative
Commons license, unless indicated otherwise in a credit line to the material. If material is notincluded in the chapter’s Creative Commons license and your intended use is not permitted bystatutory regulation or exceeds the permitted use, you will need to obtain permission directly fromthe copyright holder.
KYBURZ Small Electric Vehicles: A Case Study in Successful … 155
BICAR—Urban Light Electric Vehicle
Hans-Jörg Dennig , Adrian Burri, and Philipp Ganz
Abstract This paper describes the technical features of the light electric vehicle(L2e-category) named BICAR. This specially designed vehicle is an all-in-oneemissions-free micro-mobility solution providing a cost-effective and sustainablemobility system while supporting the transition towards a low carbon society (smartand sustainable city concept). The BICAR represents part of a multimodal system,complementing public transport with comfort and safety, relieving inner-city con-gestion and solving the “first and last mile” issue. The BICAR is the lightest andsmallest three-wheel vehicle with weather protection. Due to the space-savingdesign, six to nine BICARS will fit into a single standard parking space. Safety isincreased by an elevated driving position and a tilting mechanism when cornering.The BICAR achieves a range of 40–60 km depending on the battery packageconfiguration in urban transport at a speed of 45 km/h. It features a luggage storageplace and exchangeable, rechargeable batteries. The BICAR can be driven withouta helmet thanks to the safety belt system, which is engineered for street approvedtests. The BICAR has an integrated telematic box connected to the vehicle elec-tronics and communicating with the dedicated mobile application, through whichthe BICAR can be geo-localised, reserved, locked/unlocked and remotelymaintained.
Keywords L2e � Shared mobility � Light electric vehicle (LEV) � Cradle tocradle � Solar cell � Urban transport
H.-J. Dennig (&) � A. Burri � P. GanzZPP Centre for Product and Process Development, ZHAW ZurichUniversity of Applied Sciences, Winterthur, Switzerlande-mail: [email protected]
© The Author(s) 2021A. Ewert et al. (eds.), Small Electric Vehicles,https://doi.org/10.1007/978-3-030-65843-4_12
157
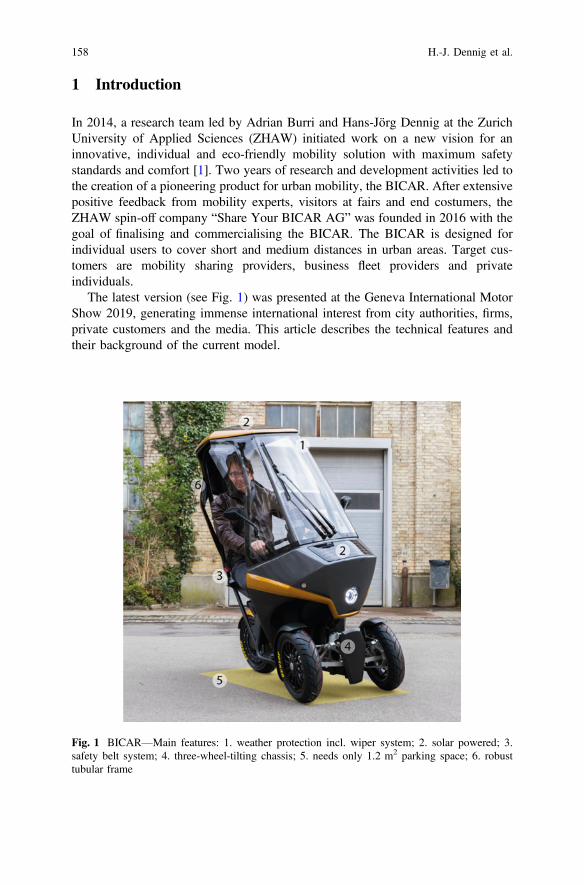
1 Introduction
In 2014, a research team led by Adrian Burri and Hans-Jörg Dennig at the ZurichUniversity of Applied Sciences (ZHAW) initiated work on a new vision for aninnovative, individual and eco-friendly mobility solution with maximum safetystandards and comfort [1]. Two years of research and development activities led tothe creation of a pioneering product for urban mobility, the BICAR. After extensivepositive feedback from mobility experts, visitors at fairs and end costumers, theZHAW spin-off company “Share Your BICAR AG” was founded in 2016 with thegoal of finalising and commercialising the BICAR. The BICAR is designed forindividual users to cover short and medium distances in urban areas. Target cus-tomers are mobility sharing providers, business fleet providers and privateindividuals.
The latest version (see Fig. 1) was presented at the Geneva International MotorShow 2019, generating immense international interest from city authorities, firms,private customers and the media. This article describes the technical features andtheir background of the current model.
Fig. 1 BICAR—Main features: 1. weather protection incl. wiper system; 2. solar powered; 3.safety belt system; 4. three-wheel-tilting chassis; 5. needs only 1.2 m2 parking space; 6. robusttubular frame
158 H.-J. Dennig et al.
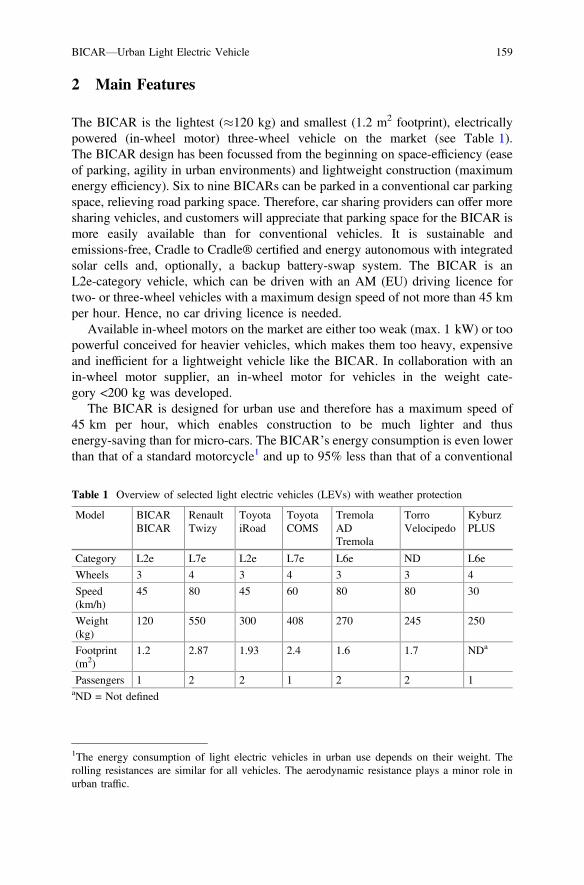
2 Main Features
The BICAR is the lightest (�120 kg) and smallest (1.2 m2 footprint), electricallypowered (in-wheel motor) three-wheel vehicle on the market (see Table 1).The BICAR design has been focussed from the beginning on space-efficiency (easeof parking, agility in urban environments) and lightweight construction (maximumenergy efficiency). Six to nine BICARs can be parked in a conventional car parkingspace, relieving road parking space. Therefore, car sharing providers can offer moresharing vehicles, and customers will appreciate that parking space for the BICAR ismore easily available than for conventional vehicles. It is sustainable andemissions-free, Cradle to Cradle® certified and energy autonomous with integratedsolar cells and, optionally, a backup battery-swap system. The BICAR is anL2e-category vehicle, which can be driven with an AM (EU) driving licence fortwo- or three-wheel vehicles with a maximum design speed of not more than 45 kmper hour. Hence, no car driving licence is needed.
Available in-wheel motors on the market are either too weak (max. 1 kW) or toopowerful conceived for heavier vehicles, which makes them too heavy, expensiveand inefficient for a lightweight vehicle like the BICAR. In collaboration with anin-wheel motor supplier, an in-wheel motor for vehicles in the weight cate-gory <200 kg was developed.
The BICAR is designed for urban use and therefore has a maximum speed of45 km per hour, which enables construction to be much lighter and thusenergy-saving than for micro-cars. The BICAR’s energy consumption is even lowerthan that of a standard motorcycle1 and up to 95% less than that of a conventional
Table 1 Overview of selected light electric vehicles (LEVs) with weather protection
Model BICARBICAR
RenaultTwizy
ToyotaiRoad
ToyotaCOMS
TremolaADTremola
TorroVelocipedo
KyburzPLUS
Category L2e L7e L2e L7e L6e ND L6e
Wheels 3 4 3 4 3 3 4
Speed(km/h)
45 80 45 60 80 80 30
Weight(kg)
120 550 300 408 270 245 250
Footprint(m2)
1.2 2.87 1.93 2.4 1.6 1.7 NDa
Passengers 1 2 2 1 2 2 1aND = Not defined
1The energy consumption of light electric vehicles in urban use depends on their weight. Therolling resistances are similar for all vehicles. The aerodynamic resistance plays a minor role inurban traffic.
BICAR—Urban Light Electric Vehicle 159
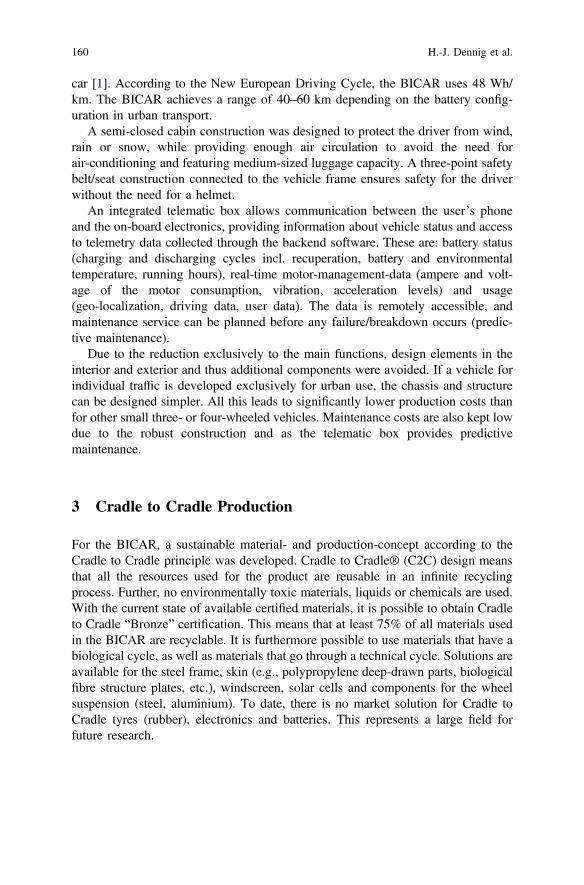
car [1]. According to the New European Driving Cycle, the BICAR uses 48 Wh/km. The BICAR achieves a range of 40–60 km depending on the battery config-uration in urban transport.
A semi-closed cabin construction was designed to protect the driver from wind,rain or snow, while providing enough air circulation to avoid the need forair-conditioning and featuring medium-sized luggage capacity. A three-point safetybelt/seat construction connected to the vehicle frame ensures safety for the driverwithout the need for a helmet.
An integrated telematic box allows communication between the user’s phoneand the on-board electronics, providing information about vehicle status and accessto telemetry data collected through the backend software. These are: battery status(charging and discharging cycles incl. recuperation, battery and environmentaltemperature, running hours), real-time motor-management-data (ampere and volt-age of the motor consumption, vibration, acceleration levels) and usage(geo-localization, driving data, user data). The data is remotely accessible, andmaintenance service can be planned before any failure/breakdown occurs (predic-tive maintenance).
Due to the reduction exclusively to the main functions, design elements in theinterior and exterior and thus additional components were avoided. If a vehicle forindividual traffic is developed exclusively for urban use, the chassis and structurecan be designed simpler. All this leads to significantly lower production costs thanfor other small three- or four-wheeled vehicles. Maintenance costs are also kept lowdue to the robust construction and as the telematic box provides predictivemaintenance.
3 Cradle to Cradle Production
For the BICAR, a sustainable material- and production-concept according to theCradle to Cradle principle was developed. Cradle to Cradle® (C2C) design meansthat all the resources used for the product are reusable in an infinite recyclingprocess. Further, no environmentally toxic materials, liquids or chemicals are used.With the current state of available certified materials, it is possible to obtain Cradleto Cradle “Bronze” certification. This means that at least 75% of all materials usedin the BICAR are recyclable. It is furthermore possible to use materials that have abiological cycle, as well as materials that go through a technical cycle. Solutions areavailable for the steel frame, skin (e.g., polypropylene deep-drawn parts, biologicalfibre structure plates, etc.), windscreen, solar cells and components for the wheelsuspension (steel, aluminium). To date, there is no market solution for Cradle toCradle tyres (rubber), electronics and batteries. This represents a large field forfuture research.
160 H.-J. Dennig et al.
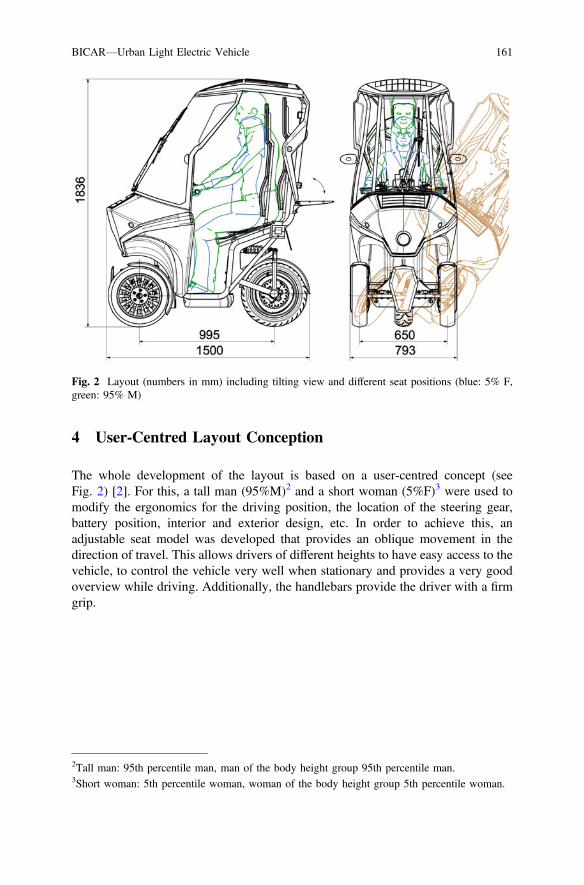
4 User-Centred Layout Conception
The whole development of the layout is based on a user-centred concept (seeFig. 2) [2]. For this, a tall man (95%M)2 and a short woman (5%F)3 were used tomodify the ergonomics for the driving position, the location of the steering gear,battery position, interior and exterior design, etc. In order to achieve this, anadjustable seat model was developed that provides an oblique movement in thedirection of travel. This allows drivers of different heights to have easy access to thevehicle, to control the vehicle very well when stationary and provides a very goodoverview while driving. Additionally, the handlebars provide the driver with a firmgrip.
Fig. 2 Layout (numbers in mm) including tilting view and different seat positions (blue: 5% F,green: 95% M)
2Tall man: 95th percentile man, man of the body height group 95th percentile man.3Short woman: 5th percentile woman, woman of the body height group 5th percentile woman.
BICAR—Urban Light Electric Vehicle 161
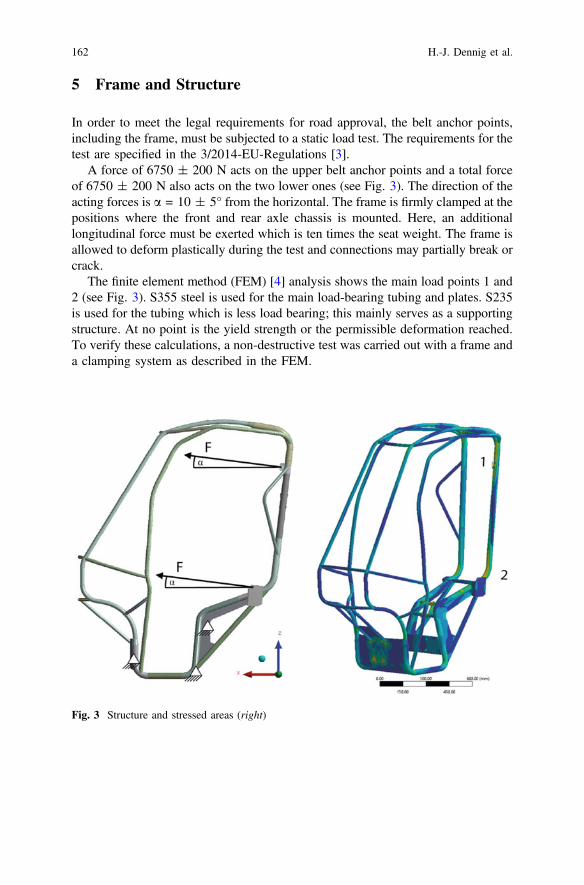
5 Frame and Structure
In order to meet the legal requirements for road approval, the belt anchor points,including the frame, must be subjected to a static load test. The requirements for thetest are specified in the 3/2014-EU-Regulations [3].
A force of 6750 ± 200 N acts on the upper belt anchor points and a total forceof 6750 ± 200 N also acts on the two lower ones (see Fig. 3). The direction of theacting forces is a = 10 ± 5° from the horizontal. The frame is firmly clamped at thepositions where the front and rear axle chassis is mounted. Here, an additionallongitudinal force must be exerted which is ten times the seat weight. The frame isallowed to deform plastically during the test and connections may partially break orcrack.
The finite element method (FEM) [4] analysis shows the main load points 1 and2 (see Fig. 3). S355 steel is used for the main load-bearing tubing and plates. S235is used for the tubing which is less load bearing; this mainly serves as a supportingstructure. At no point is the yield strength or the permissible deformation reached.To verify these calculations, a non-destructive test was carried out with a frame anda clamping system as described in the FEM.
Fig. 3 Structure and stressed areas (right)
162 H.-J. Dennig et al.
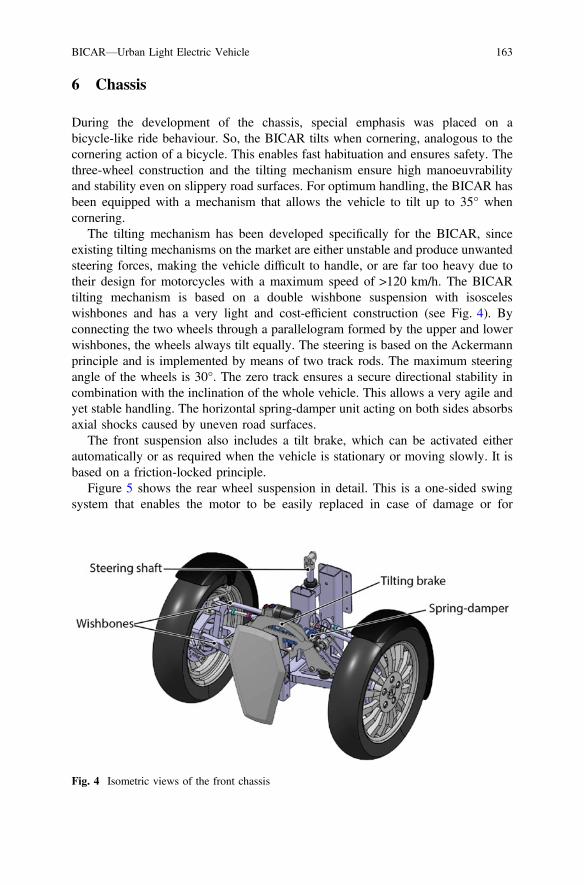
6 Chassis
During the development of the chassis, special emphasis was placed on abicycle-like ride behaviour. So, the BICAR tilts when cornering, analogous to thecornering action of a bicycle. This enables fast habituation and ensures safety. Thethree-wheel construction and the tilting mechanism ensure high manoeuvrabilityand stability even on slippery road surfaces. For optimum handling, the BICAR hasbeen equipped with a mechanism that allows the vehicle to tilt up to 35° whencornering.
The tilting mechanism has been developed specifically for the BICAR, sinceexisting tilting mechanisms on the market are either unstable and produce unwantedsteering forces, making the vehicle difficult to handle, or are far too heavy due totheir design for motorcycles with a maximum speed of >120 km/h. The BICARtilting mechanism is based on a double wishbone suspension with isosceleswishbones and has a very light and cost-efficient construction (see Fig. 4). Byconnecting the two wheels through a parallelogram formed by the upper and lowerwishbones, the wheels always tilt equally. The steering is based on the Ackermannprinciple and is implemented by means of two track rods. The maximum steeringangle of the wheels is 30°. The zero track ensures a secure directional stability incombination with the inclination of the whole vehicle. This allows a very agile andyet stable handling. The horizontal spring-damper unit acting on both sides absorbsaxial shocks caused by uneven road surfaces.
The front suspension also includes a tilt brake, which can be activated eitherautomatically or as required when the vehicle is stationary or moving slowly. It isbased on a friction-locked principle.
Figure 5 shows the rear wheel suspension in detail. This is a one-sided swingsystem that enables the motor to be easily replaced in case of damage or for
Fig. 4 Isometric views of the front chassis
BICAR—Urban Light Electric Vehicle 163
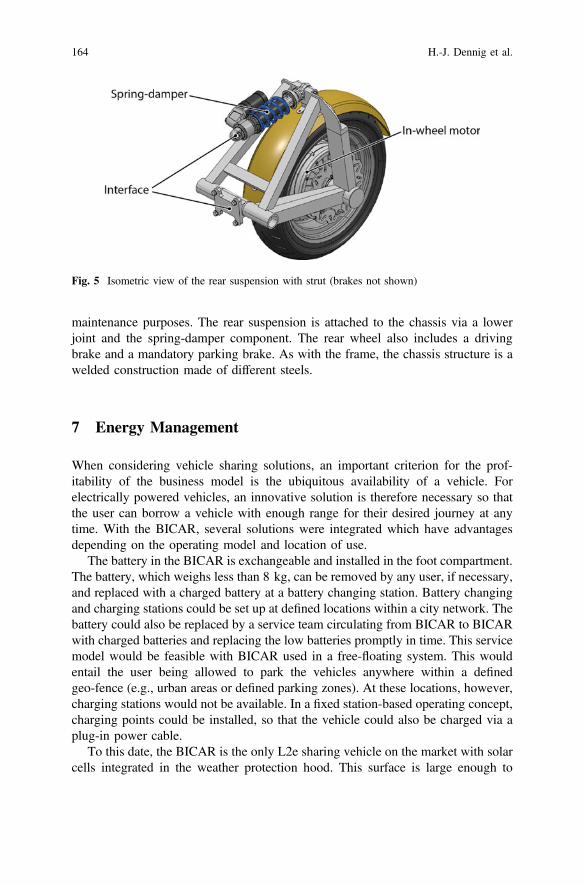
maintenance purposes. The rear suspension is attached to the chassis via a lowerjoint and the spring-damper component. The rear wheel also includes a drivingbrake and a mandatory parking brake. As with the frame, the chassis structure is awelded construction made of different steels.
7 Energy Management
When considering vehicle sharing solutions, an important criterion for the prof-itability of the business model is the ubiquitous availability of a vehicle. Forelectrically powered vehicles, an innovative solution is therefore necessary so thatthe user can borrow a vehicle with enough range for their desired journey at anytime. With the BICAR, several solutions were integrated which have advantagesdepending on the operating model and location of use.
The battery in the BICAR is exchangeable and installed in the foot compartment.The battery, which weighs less than 8 kg, can be removed by any user, if necessary,and replaced with a charged battery at a battery changing station. Battery changingand charging stations could be set up at defined locations within a city network. Thebattery could also be replaced by a service team circulating from BICAR to BICARwith charged batteries and replacing the low batteries promptly in time. This servicemodel would be feasible with BICAR used in a free-floating system. This wouldentail the user being allowed to park the vehicles anywhere within a definedgeo-fence (e.g., urban areas or defined parking zones). At these locations, however,charging stations would not be available. In a fixed station-based operating concept,charging points could be installed, so that the vehicle could also be charged via aplug-in power cable.
To this date, the BICAR is the only L2e sharing vehicle on the market with solarcells integrated in the weather protection hood. This surface is large enough to
Fig. 5 Isometric view of the rear suspension with strut (brakes not shown)
164 H.-J. Dennig et al.
recharge up to a third of the battery capacity. This additional charging facilitydirectly reduces service operations and frequency of battery changes, thus reducingoperating costs. The power absorbed by the solar panels depends on the geo-graphical location of the site, season, local weather and the local building archi-tecture (shading of streets). In favourable locations (Southern Europe, South Asia,Central America), the BICAR can be operated all year round as a 100% energyself-sufficient solution, using only solar power.
8 Conclusion
Share your BICAR AG develops and sells new electric mobility solutions optimisedfor short and medium distances in urban areas. The technology of the BICARdescribed here is the result of several years of work and technical adjustment afternumerous tests with users, customers and experts. Share your BICAR does not actas a sharing provider but as a vehicle manufacturer. For more information: seewww.bicar.ch.
At the beginning of the developments, it was not clear whether a vehicle likeBICAR with its main functions (see Fig. 1; Chapter “Small Electric Vehicles—Benefits and Drawbacks for Sustainable Urban Development”) is satisfactory anddrivable from the users’ point of view. The construction of several prototypes, thepresentation at the Geneva Motor Show 2019 and the subsequent test drives withnumerous people have proven this.
The weather protection, the agile and safe driving (belt system, 3-wheel chassis)could be tested in numerous rides. In this context, it was confirmed that especiallyin urban areas, the use of the BICAR can offer an added value. This article describesthe use of the BICAR for sharing providers. Of course, the BICAR can also be usedfor business fleets or private use.
References
1. Dennig DH-J, Sauter-Servaes DT, Hoppe DM, Burri A (2016) World light electric vehiclesummit Barcelona, 20 and 21 September, p 8
2. Mueller A, Maier T, Dennig H-J (2011) Holistic and user-centered layout conception of anelectric vehicle (E-Car). Stuttgart, pp 93–106
3. Regulation (EU) No 3/2014. Vehicle functional safety requirements for the approval of two- orthree-wheel vehicles and quadricycles, October 24, 2013
4. Steinke, P.: Finite-elemente-methode, 2. Springer, Berlin, Heidelberg, New York (2007)
BICAR—Urban Light Electric Vehicle 165

Open Access This chapter is licensed under the terms of the Creative Commons Attribution 4.0International License (http://creativecommons.org/licenses/by/4.0/), which permits use, sharing,adaptation, distribution and reproduction in any medium or format, as long as you give appropriatecredit to the original author(s) and the source, provide a link to the Creative Commons license andindicate if changes were made.The images or other third party material in this chapter are included in the chapter’s Creative
Commons license, unless indicated otherwise in a credit line to the material. If material is notincluded in the chapter’s Creative Commons license and your intended use is not permitted bystatutory regulation or exceeds the permitted use, you will need to obtain permission directly fromthe copyright holder.
166 H.-J. Dennig et al.
Conception and Development of a LastMile Vehicle for Urban Areas
Andreas Höfer, Erhard Esl, Daniel Türk, and Veronika Hüttinger
Abstract In megacities, increasing globalization effects are leading to rapidlyincreasing prosperity and augmented purchasing power, and thus to a growing needfor punctual, cost-effective, and environmentally friendly delivery of goods.A smart, small electric vehicle concept is presented that targets on meeting therequirements for the delivery of goods in urban areas and that is designed especiallyfor the delivery on the last mile. This last mile vehicle (LMV) for cargo trans-portation is attached to a truck. Whenever it is needed, for example to deliver goodsinto narrow streets, in pedestrian areas or in case of traffic jams, it can be unfoldedand unloaded from the truck and hereby guarantees a flexible and punctual deliveryof goods. This flexible on-time delivery is possible because the last mile vehicle isdesigned, so that the legal regulations of the non-motorized vehicle lane, that iseverywhere to be found in Asia, are met. The vehicle is designed with three wheels,a range of 40-60 km and an electric drive train with a continuous power of2 � 250 W that enables a maximum speed up to 40 km/h of the vehicle. The drivetrain consists of a battery pack that can be charged electrically from the truck, twoinverters, and two electric wheel hub motors. The LMV has been designed andconstructed as a prototype and has been tested on non-public roads to prove thevehicle concept. For Europe, it can be classified as an L2e vehicle and with slightmodifications; it can be applied on European roads as well.
Keywords Last mile vehicle � Small electric vehicle � Smart mobility �Connected car
A. Höfer (&) � E. Esl � D. Türk � V. HüttingerTechnical University of Munich (TUM), Boltzmannstr. 15,85748 Garching bei München, Germanye-mail: [email protected]
© The Author(s) 2021A. Ewert et al. (eds.), Small Electric Vehicles,https://doi.org/10.1007/978-3-030-65843-4_13
167
1 Introduction
In China, there is an old saying: “要致富先修路” (loosely translated: If you want tobe rich, you must first build roads) [1]. Especially in Chinese megacities, thiswisdom has been put into effect for quite some time, leading to prosperity in theever-increasing middle class and to urban infrastructures that have reached theirmaximum of capacity in many places. Nevertheless, the urbanization continues(e.g. Shanghai had a population growth of 38% in the years from 2000 to 2011 [2])and studies predict that by 2030, one billion people will be living in urban areas inChina. This will produce a tenfold increase of the traffic volume [3]. The highpopulation density, as well as the population’s desire for motorized transport, isleading to the well-known megacity problems such as harmful emissions, smog,and sustained traffic congestion. Electrification, car-sharing, and an expansion ofpublic transportation provide the first solutions for passenger transportation.However, few alternative solutions have been developed so far for the transporta-tion of cargo, although the demand for an on-time delivery of the goods to the finalcustomers continues to grow in importance [4]. Public access to the Internet and theassociated introduction of e-commerce accelerates the development of rising freightflows. This brings great challenges to logistics companies especially for the lastmile delivery stage [4]. The last mile is the final delivery stage in the logistics chainin which the goods reach (final) customers. Here, the cargo has to be delivered ontime in the densest neighborhoods, via narrow one-way streets, into the historic citycenters or into pedestrian areas to different customers. Thus, the last mile is not onlythe bottleneck of the delivery chain, but also provides the largest potential forinnovative vehicle concepts and mobility solutions.
2 Methodical Approach
When developing vehicles for cargo transportation, one has to start with thetransport task including its customer and market-specific requirements [5]. For thispurpose, a market analysis was carried out for the example of Shanghai to under-stand the logistics chain in Asian megacities (Fig. 1, step 1). The analysis included,among other aspects, expert interviews, traffic flow observations or visits to variouslogistics centers (details of the market analysis compare [6, 7]). From this, explicitproduct requirements could be derived such as the length of the last mile ortransport volumes and masses (Fig. 1, step 2). Along with the legal regulations aswell as the customer’s needs, as determined by surveys among truck drivers, a listof requirements for specific vehicle concepts for the last mile is derived. This list ofrequirements was the basis for subsequent methodical concept development andconcept evaluation using product development methods from [6] such as themorphological method (Fig. 1, step 3). The most suitable concept was then furtherdetailed using CAD methods for design and simulation (Fig. 1, step 4). Finally, a
168 A. Höfer et al.
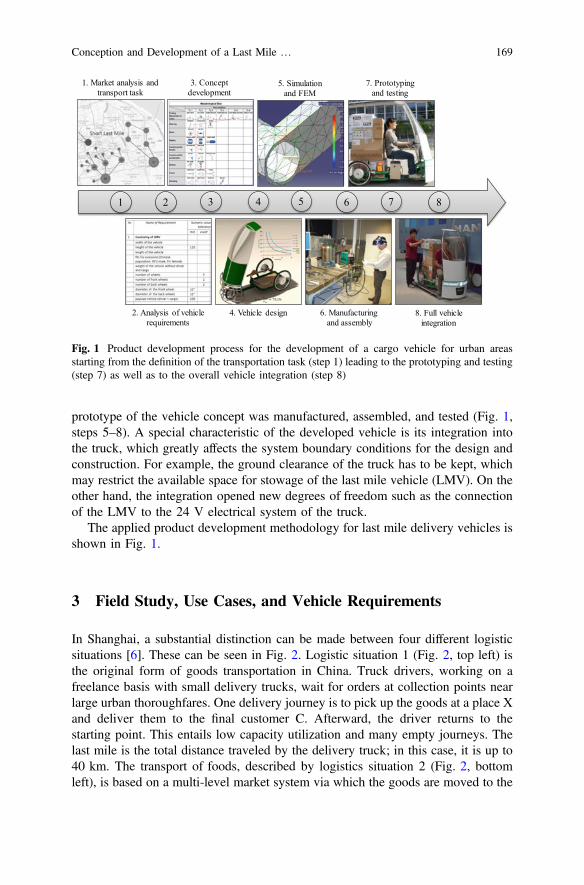
prototype of the vehicle concept was manufactured, assembled, and tested (Fig. 1,steps 5–8). A special characteristic of the developed vehicle is its integration intothe truck, which greatly affects the system boundary conditions for the design andconstruction. For example, the ground clearance of the truck has to be kept, whichmay restrict the available space for stowage of the last mile vehicle (LMV). On theother hand, the integration opened new degrees of freedom such as the connectionof the LMV to the 24 V electrical system of the truck.
The applied product development methodology for last mile delivery vehicles isshown in Fig. 1.
3 Field Study, Use Cases, and Vehicle Requirements
In Shanghai, a substantial distinction can be made between four different logisticsituations [6]. These can be seen in Fig. 2. Logistic situation 1 (Fig. 2, top left) isthe original form of goods transportation in China. Truck drivers, working on afreelance basis with small delivery trucks, wait for orders at collection points nearlarge urban thoroughfares. One delivery journey is to pick up the goods at a place Xand deliver them to the final customer C. Afterward, the driver returns to thestarting point. This entails low capacity utilization and many empty journeys. Thelast mile is the total distance traveled by the delivery truck; in this case, it is up to40 km. The transport of foods, described by logistics situation 2 (Fig. 2, bottomleft), is based on a multi-level market system via which the goods are moved to the
1 2 3
1. Market analysis and transport task
3. Concept development
5. Simulation and FEM
4. Vehicle design 6. Manufacturingand assembly
2. Analysis of vehicle requirements
8. Full vehicle integration
7. Prototyping and testing
4 5 6 7 8
Fig. 1 Product development process for the development of a cargo vehicle for urban areasstarting from the definition of the transportation task (step 1) leading to the prototyping and testing(step 7) as well as to the overall vehicle integration (step 8)
Conception and Development of a Last Mile … 169
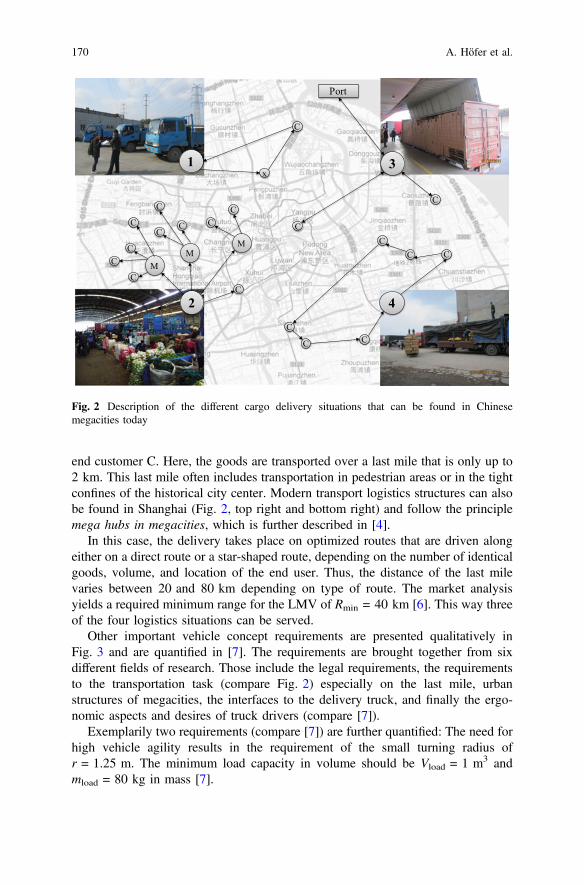
end customer C. Here, the goods are transported over a last mile that is only up to2 km. This last mile often includes transportation in pedestrian areas or in the tightconfines of the historical city center. Modern transport logistics structures can alsobe found in Shanghai (Fig. 2, top right and bottom right) and follow the principlemega hubs in megacities, which is further described in [4].
In this case, the delivery takes place on optimized routes that are driven alongeither on a direct route or a star-shaped route, depending on the number of identicalgoods, volume, and location of the end user. Thus, the distance of the last milevaries between 20 and 80 km depending on type of route. The market analysisyields a required minimum range for the LMV of Rmin = 40 km [6]. This way threeof the four logistics situations can be served.
Other important vehicle concept requirements are presented qualitatively inFig. 3 and are quantified in [7]. The requirements are brought together from sixdifferent fields of research. Those include the legal requirements, the requirementsto the transportation task (compare Fig. 2) especially on the last mile, urbanstructures of megacities, the interfaces to the delivery truck, and finally the ergo-nomic aspects and desires of truck drivers (compare [7]).
Exemplarily two requirements (compare [7]) are further quantified: The need forhigh vehicle agility results in the requirement of the small turning radius ofr = 1.25 m. The minimum load capacity in volume should be Vload = 1 m3 andmload = 80 kg in mass [7].
14
MM
M
CC
C C
C
C
C
C
C
2C
C
C
Port
3
4
CCC
C
C C
C
1x
Fig. 2 Description of the different cargo delivery situations that can be found in Chinesemegacities today
170 A. Höfer et al.
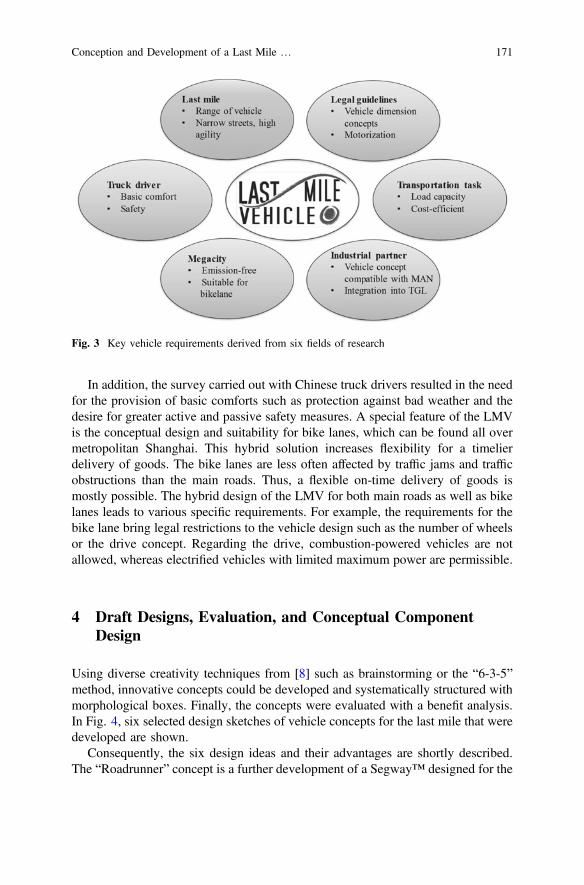
In addition, the survey carried out with Chinese truck drivers resulted in the needfor the provision of basic comforts such as protection against bad weather and thedesire for greater active and passive safety measures. A special feature of the LMVis the conceptual design and suitability for bike lanes, which can be found all overmetropolitan Shanghai. This hybrid solution increases flexibility for a timelierdelivery of goods. The bike lanes are less often affected by traffic jams and trafficobstructions than the main roads. Thus, a flexible on-time delivery of goods ismostly possible. The hybrid design of the LMV for both main roads as well as bikelanes leads to various specific requirements. For example, the requirements for thebike lane bring legal restrictions to the vehicle design such as the number of wheelsor the drive concept. Regarding the drive, combustion-powered vehicles are notallowed, whereas electrified vehicles with limited maximum power are permissible.
4 Draft Designs, Evaluation, and Conceptual ComponentDesign
Using diverse creativity techniques from [8] such as brainstorming or the “6-3-5”method, innovative concepts could be developed and systematically structured withmorphological boxes. Finally, the concepts were evaluated with a benefit analysis.In Fig. 4, six selected design sketches of vehicle concepts for the last mile that weredeveloped are shown.
Consequently, the six design ideas and their advantages are shortly described.The “Roadrunner” concept is a further development of a Segway™ designed for the
Fig. 3 Key vehicle requirements derived from six fields of research
Conception and Development of a Last Mile … 171
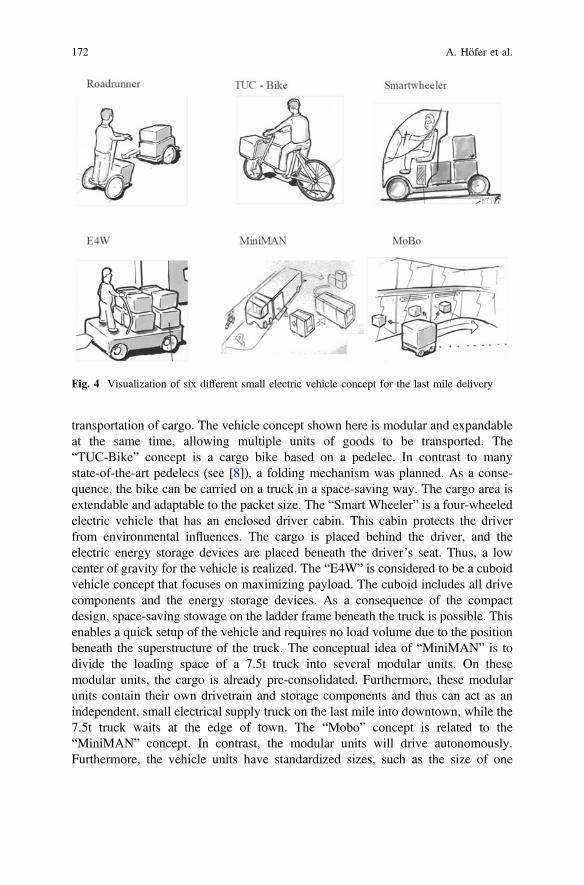
transportation of cargo. The vehicle concept shown here is modular and expandableat the same time, allowing multiple units of goods to be transported. The“TUC-Bike” concept is a cargo bike based on a pedelec. In contrast to manystate-of-the-art pedelecs (see [8]), a folding mechanism was planned. As a conse-quence, the bike can be carried on a truck in a space-saving way. The cargo area isextendable and adaptable to the packet size. The “Smart Wheeler” is a four-wheeledelectric vehicle that has an enclosed driver cabin. This cabin protects the driverfrom environmental influences. The cargo is placed behind the driver, and theelectric energy storage devices are placed beneath the driver’s seat. Thus, a lowcenter of gravity for the vehicle is realized. The “E4W” is considered to be a cuboidvehicle concept that focuses on maximizing payload. The cuboid includes all drivecomponents and the energy storage devices. As a consequence of the compactdesign, space-saving stowage on the ladder frame beneath the truck is possible. Thisenables a quick setup of the vehicle and requires no load volume due to the positionbeneath the superstructure of the truck. The conceptual idea of “MiniMAN” is todivide the loading space of a 7.5t truck into several modular units. On thesemodular units, the cargo is already pre-consolidated. Furthermore, these modularunits contain their own drivetrain and storage components and thus can act as anindependent, small electrical supply truck on the last mile into downtown, while the7.5t truck waits at the edge of town. The “Mobo” concept is related to the“MiniMAN” concept. In contrast, the modular units will drive autonomously.Furthermore, the vehicle units have standardized sizes, such as the size of one
Fig. 4 Visualization of six different small electric vehicle concept for the last mile delivery
172 A. Höfer et al.
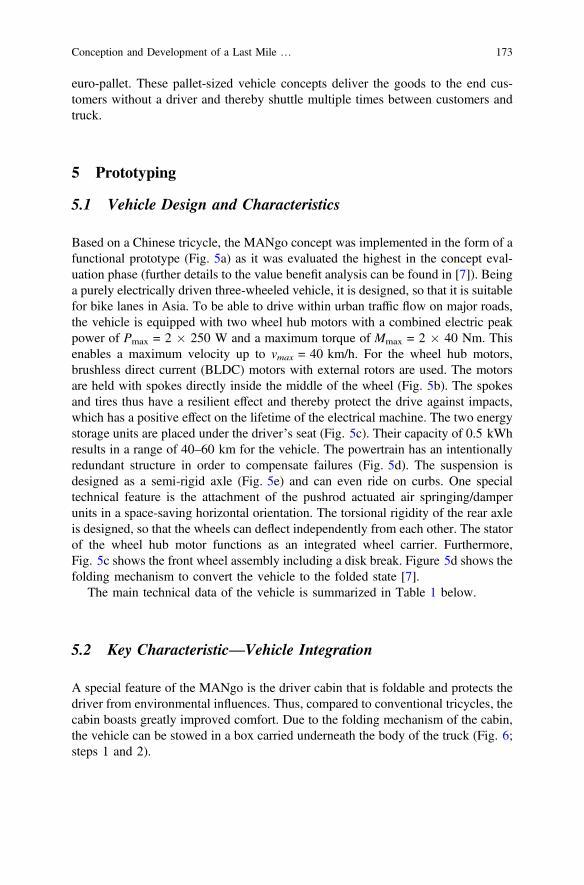
euro-pallet. These pallet-sized vehicle concepts deliver the goods to the end cus-tomers without a driver and thereby shuttle multiple times between customers andtruck.
5 Prototyping
5.1 Vehicle Design and Characteristics
Based on a Chinese tricycle, the MANgo concept was implemented in the form of afunctional prototype (Fig. 5a) as it was evaluated the highest in the concept eval-uation phase (further details to the value benefit analysis can be found in [7]). Beinga purely electrically driven three-wheeled vehicle, it is designed, so that it is suitablefor bike lanes in Asia. To be able to drive within urban traffic flow on major roads,the vehicle is equipped with two wheel hub motors with a combined electric peakpower of Pmax = 2 � 250 W and a maximum torque of Mmax = 2 � 40 Nm. Thisenables a maximum velocity up to vmax = 40 km/h. For the wheel hub motors,brushless direct current (BLDC) motors with external rotors are used. The motorsare held with spokes directly inside the middle of the wheel (Fig. 5b). The spokesand tires thus have a resilient effect and thereby protect the drive against impacts,which has a positive effect on the lifetime of the electrical machine. The two energystorage units are placed under the driver’s seat (Fig. 5c). Their capacity of 0.5 kWhresults in a range of 40–60 km for the vehicle. The powertrain has an intentionallyredundant structure in order to compensate failures (Fig. 5d). The suspension isdesigned as a semi-rigid axle (Fig. 5e) and can even ride on curbs. One specialtechnical feature is the attachment of the pushrod actuated air springing/damperunits in a space-saving horizontal orientation. The torsional rigidity of the rear axleis designed, so that the wheels can deflect independently from each other. The statorof the wheel hub motor functions as an integrated wheel carrier. Furthermore,Fig. 5c shows the front wheel assembly including a disk break. Figure 5d shows thefolding mechanism to convert the vehicle to the folded state [7].
The main technical data of the vehicle is summarized in Table 1 below.
5.2 Key Characteristic—Vehicle Integration
A special feature of the MANgo is the driver cabin that is foldable and protects thedriver from environmental influences. Thus, compared to conventional tricycles, thecabin boasts greatly improved comfort. Due to the folding mechanism of the cabin,the vehicle can be stowed in a box carried underneath the body of the truck (Fig. 6;steps 1 and 2).
Conception and Development of a Last Mile … 173
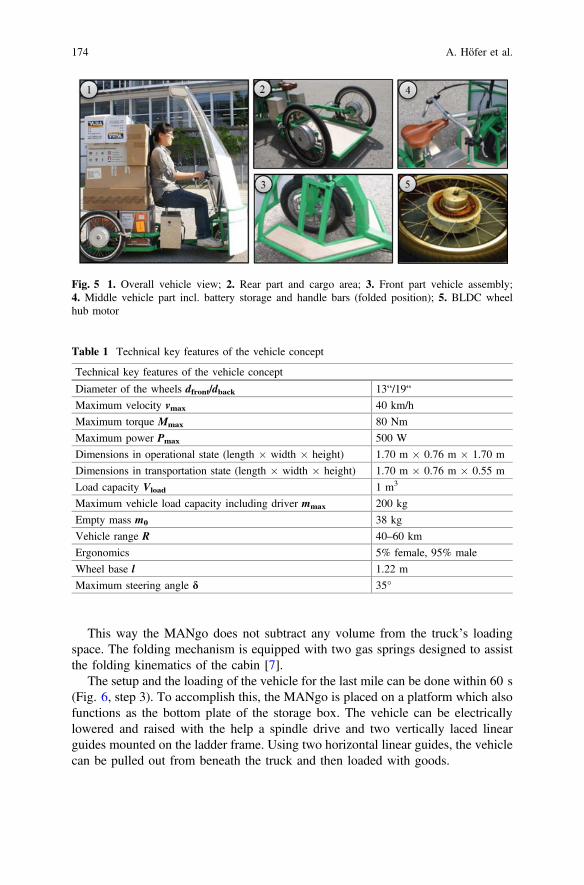
This way the MANgo does not subtract any volume from the truck’s loadingspace. The folding mechanism is equipped with two gas springs designed to assistthe folding kinematics of the cabin [7].
The setup and the loading of the vehicle for the last mile can be done within 60 s(Fig. 6, step 3). To accomplish this, the MANgo is placed on a platform which alsofunctions as the bottom plate of the storage box. The vehicle can be electricallylowered and raised with the help a spindle drive and two vertically laced linearguides mounted on the ladder frame. Using two horizontal linear guides, the vehiclecan be pulled out from beneath the truck and then loaded with goods.
Fig. 5 1. Overall vehicle view; 2. Rear part and cargo area; 3. Front part vehicle assembly;4. Middle vehicle part incl. battery storage and handle bars (folded position); 5. BLDC wheelhub motor
Table 1 Technical key features of the vehicle concept
Technical key features of the vehicle concept
Diameter of the wheels dfront/dback 13“/19“
Maximum velocity vmax 40 km/h
Maximum torque Mmax 80 Nm
Maximum power Pmax 500 W
Dimensions in operational state (length � width � height) 1.70 m � 0.76 m � 1.70 m
Dimensions in transportation state (length � width � height) 1.70 m � 0.76 m � 0.55 m
Load capacity Vload 1 m3
Maximum vehicle load capacity including driver mmax 200 kg
Empty mass m0 38 kg
Vehicle range R 40–60 km
Ergonomics 5% female, 95% male
Wheel base l 1.22 m
Maximum steering angle d 35°
174 A. Höfer et al.
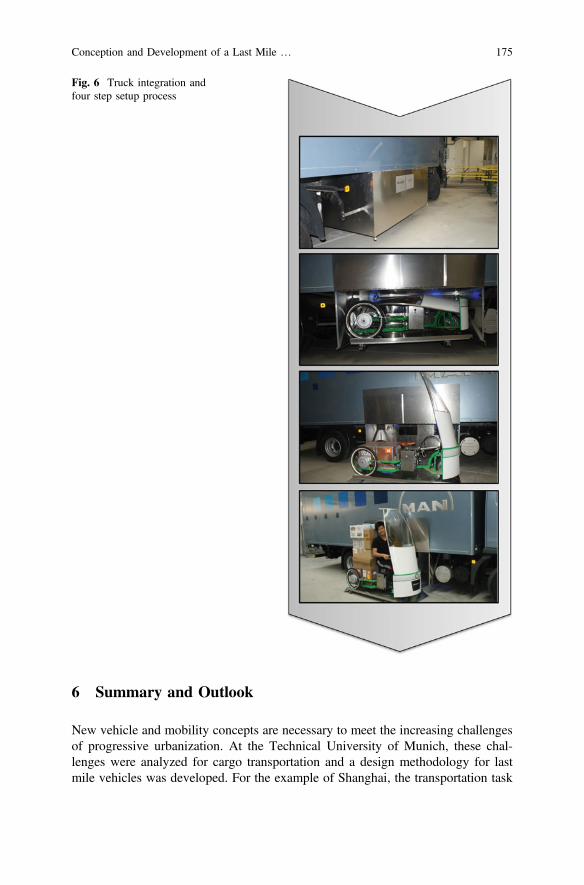
6 Summary and Outlook
New vehicle and mobility concepts are necessary to meet the increasing challengesof progressive urbanization. At the Technical University of Munich, these chal-lenges were analyzed for cargo transportation and a design methodology for lastmile vehicles was developed. For the example of Shanghai, the transportation task
Fig. 6 Truck integration andfour step setup process
Conception and Development of a Last Mile … 175
for goods delivery in megacities was analyzed, and innovative vehicle conceptswere developed and evaluated methodically. The MANgo vehicle concept has beenprototypically built and was able to meet all the functional requirements during thetesting.
The MANgo that was awarded with a national scientific research award [9] is anelectrified tricycle and thus is based on the tradition of Chinese three-wheeled cargoconcepts. The foldable driver cabin and the vehicle’s compact design allow it to becarried onboard commercial vehicles such as the MAN-TGL. The vehicle alsomeets the requirements for the use of bike lanes. The implemented technicalinnovations create a competitive advantage for the vehicle in a variety of differentdelivery scenarios. For example, in the case of a traffic jam, the MANgo can beunloaded and be set up within a minute. Prioritized goods are transshipped, andon-time delivery is assured. Bike lanes can be used, increasing flexibility and smartmobility. With its electric powertrain, the vehicle is also able to navigate inner citiesand deliver into pedestrian areas and is suitable for the narrow streets in old citycenters. A more futuristic delivery scenario involves several agile LMVs that areconnected with each other and networked with a larger logistics vehicle traveling onouter ring roads. After delivery, the LMVs shuttle back multiple times to the heavyduty truck in order to pick up new loads.
Even though the MANgo has not passed from prototype stage to a serial releaseyet (2020) that new, small electric vehicle (SEV) concepts including new designmethodologies are necessary not only for passenger transport but also for cargotransportation.
The future will show whether small zero-emission vehicles specially designedfor the last mile will prevail in logistics in megacities, or if deliveries will continuewith conventional large delivery trucks. However, if those conventional deliverytrucks are stuck in traffic jams, the vehicle concept presented here for the last milewould still have the advantage of unlimited mobility.
Acknowledgements The scientific content of this paper are resulting from the global DriveProgram at Technische Universität München, Lehrstuhl für Fahrzeugtechnik, Fakultät fürMaschinenwesen (https://www.mw.tum.de/ftm/lehre/internationale-studentenprojekte/). Someparts were already published in [10].The results were derived together with Tongji University and MAN Truck & Bus SE. Special
thanks to Dr. Britta Michel, Dr.-Ing. Frank Diermeyer, and Alexander Süßmann.
References
1. Biswas, A., Tortajada, C: Bridging the infrastructure deficit. In: The Business Times (2013)2. Government-China: Infosite Goverment China, 1 July (1999). https://inquiryshanghai.weebly.
com/population-characteristics.html, accessed 16 July 20203. Textor, M.: (w.Y.) Institut für Pädagogik und Zukunftsforschung (IPZF). http://www.
zukunftsentwicklungen.de, accessed 21 January 20154. Deutsche Post AG: Delivering Tomorrow—Logistik 2050: Eine Szenariostudie. Deutsche
Post AG, Bonn, Deutschland, ISBN 978-3-920269-53-5 (2012)
176 A. Höfer et al.
5. Hoepke, E., Breuer. S.: Nutzfahrzeugtechnik, Köln und Weinheim: Vieweg + TeubnerVerlag, Springer Fachmedien Wiesbaden GmbH (2010)
6. Esl, E., Höfer, A., Türk, D., Hüttinger, V.: Abschlusspräsentation: Last Mile Vehicle forChinese Megacities, München: Technische Universität München, Designskizzen: Bram vanKrieken, 24 May (2012)
7. Höfer, A.: Diplomarbeit: Conception and Development of a Last Mile Vehicle: From theConcept to the Prototype. Technische Universität München; Lehrstuhl für Fahrzeugtechnik,München (2012)
8. Lindemann, U.: Methodische Entwicklung technischer Produkte: Methoden flexibel undsituationsgerecht anwenden, Garching: Springer. Heidelberg, London, New York, Dordrecht(2009)
9. IAV: Springer Professional: Hermann-Appel Preis für herausragende wissenschaftlicheLeistungen in der Fahrzeugtechnik (2014). https://www.springerprofessional.de/automobil—motoren/iav-hermann-appel-preis-2014-verliehen/6585218. Accessed 28 April 2020
10. Höfer, A., Esl, E., Türk, D., et al.: Innovative Fahrzeugkonzepte für Shanghais letzte Meile.ATZ Automobiltech Z 117, 76–81 (2015). https://doi.org/10.1007/s35148-015-0049-y
Open Access This chapter is licensed under the terms of the Creative Commons Attribution 4.0International License (http://creativecommons.org/licenses/by/4.0/), which permits use, sharing,adaptation, distribution and reproduction in any medium or format, as long as you give appropriatecredit to the original author(s) and the source, provide a link to the Creative Commons license andindicate if changes were made.The images or other third party material in this chapter are included in the chapter’s Creative
Commons license, unless indicated otherwise in a credit line to the material. If material is notincluded in the chapter’s Creative Commons license and your intended use is not permitted bystatutory regulation or exceeds the permitted use, you will need to obtain permission directly fromthe copyright holder.
Conception and Development of a Last Mile … 177
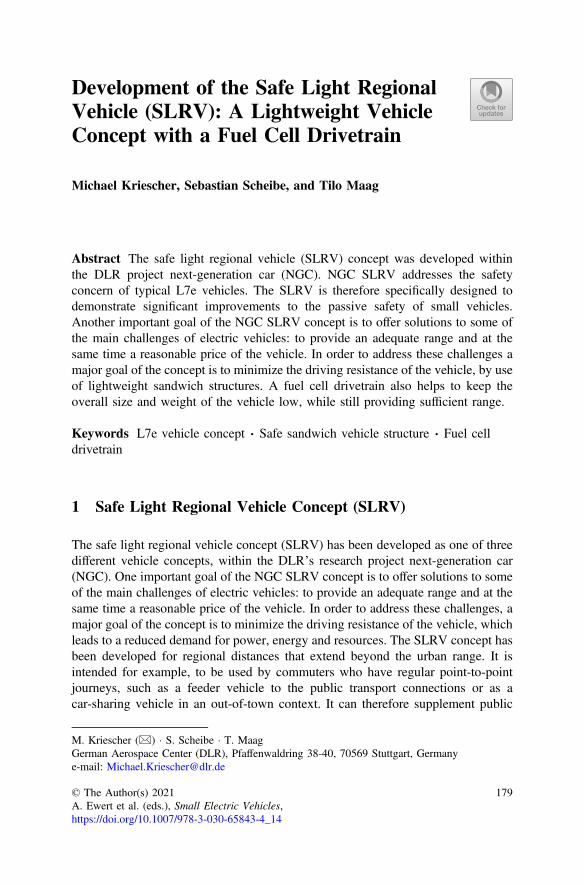
Development of the Safe Light RegionalVehicle (SLRV): A Lightweight VehicleConcept with a Fuel Cell Drivetrain
Michael Kriescher, Sebastian Scheibe, and Tilo Maag
Abstract The safe light regional vehicle (SLRV) concept was developed withinthe DLR project next-generation car (NGC). NGC SLRV addresses the safetyconcern of typical L7e vehicles. The SLRV is therefore specifically designed todemonstrate significant improvements to the passive safety of small vehicles.Another important goal of the NGC SLRV concept is to offer solutions to some ofthe main challenges of electric vehicles: to provide an adequate range and at thesame time a reasonable price of the vehicle. In order to address these challenges amajor goal of the concept is to minimize the driving resistance of the vehicle, by useof lightweight sandwich structures. A fuel cell drivetrain also helps to keep theoverall size and weight of the vehicle low, while still providing sufficient range.
Keywords L7e vehicle concept � Safe sandwich vehicle structure � Fuel celldrivetrain
1 Safe Light Regional Vehicle Concept (SLRV)
The safe light regional vehicle concept (SLRV) has been developed as one of threedifferent vehicle concepts, within the DLR’s research project next-generation car(NGC). One important goal of the NGC SLRV concept is to offer solutions to someof the main challenges of electric vehicles: to provide an adequate range and at thesame time a reasonable price of the vehicle. In order to address these challenges, amajor goal of the concept is to minimize the driving resistance of the vehicle, whichleads to a reduced demand for power, energy and resources. The SLRV concept hasbeen developed for regional distances that extend beyond the urban range. It isintended for example, to be used by commuters who have regular point-to-pointjourneys, such as a feeder vehicle to the public transport connections or as acar-sharing vehicle in an out-of-town context. It can therefore supplement public
M. Kriescher (&) � S. Scheibe � T. MaagGerman Aerospace Center (DLR), Pfaffenwaldring 38-40, 70569 Stuttgart, Germanye-mail: [email protected]
© The Author(s) 2021A. Ewert et al. (eds.), Small Electric Vehicles,https://doi.org/10.1007/978-3-030-65843-4_14
179
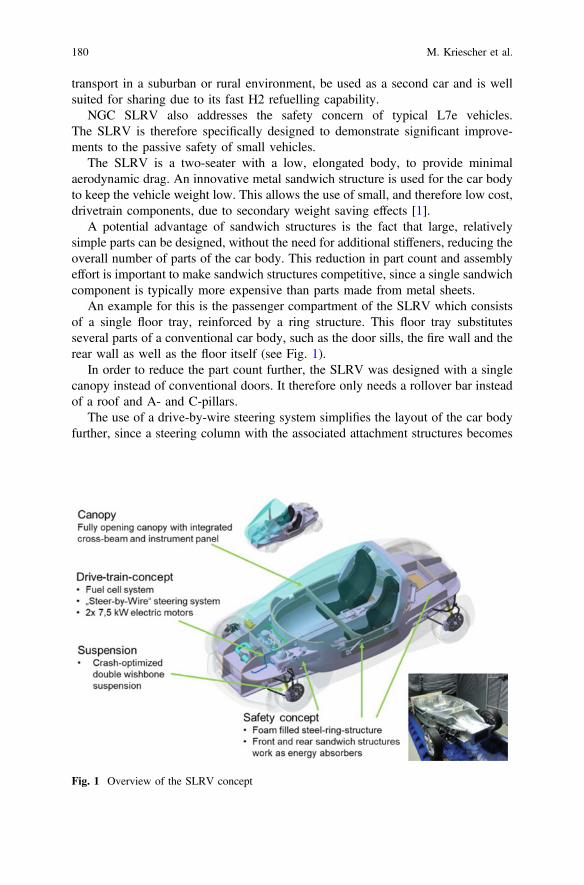
transport in a suburban or rural environment, be used as a second car and is wellsuited for sharing due to its fast H2 refuelling capability.
NGC SLRV also addresses the safety concern of typical L7e vehicles.The SLRV is therefore specifically designed to demonstrate significant improve-ments to the passive safety of small vehicles.
The SLRV is a two-seater with a low, elongated body, to provide minimalaerodynamic drag. An innovative metal sandwich structure is used for the car bodyto keep the vehicle weight low. This allows the use of small, and therefore low cost,drivetrain components, due to secondary weight saving effects [1].
A potential advantage of sandwich structures is the fact that large, relativelysimple parts can be designed, without the need for additional stiffeners, reducing theoverall number of parts of the car body. This reduction in part count and assemblyeffort is important to make sandwich structures competitive, since a single sandwichcomponent is typically more expensive than parts made from metal sheets.
An example for this is the passenger compartment of the SLRV which consistsof a single floor tray, reinforced by a ring structure. This floor tray substitutesseveral parts of a conventional car body, such as the door sills, the fire wall and therear wall as well as the floor itself (see Fig. 1).
In order to reduce the part count further, the SLRV was designed with a singlecanopy instead of conventional doors. It therefore only needs a rollover bar insteadof a roof and A- and C-pillars.
The use of a drive-by-wire steering system simplifies the layout of the car bodyfurther, since a steering column with the associated attachment structures becomes
Fig. 1 Overview of the SLRV concept
180 M. Kriescher et al.

unnecessary. In the SLRV, the steering wheel is located on a cross-beam whichswings open, along with the canopy.
The suspension of the SLRV is optimized with respect to its deformationbehaviour during a frontal crash. Several predetermined breaking points are used toavoid an intrusion of the wheel into the cars body (see also chapter Velomobilesand Urban Mobility: Opportunities and Challenges).
2 Concept of the Car Body
An innovative metal sandwich structure is developed to achieve a very low weightfor the body in white—only 90 kg—and at the same time optimize the crashbehaviour to protect the occupants (see Fig. 2). The use of a metal sandwichstructure reduces the number of separate parts necessary for the assembly of thevehicle body. Conventional materials such as aluminium, steel and plastic foam areused to keep material costs low.
Innovative deformation mechanisms are used on several parts of the vehiclebody structure, in order to achieve a favourable relationship between crash per-formance and lightweight design.
The front and rear sections of the vehicle are made from sandwich panels, whichare bonded to form the front and rear structures. These structures carry theattachment points for the chassis and most of drivetrain components. They alsowork as energy absorbers in the case of a frontal or rear impact. The passengercompartment is made of a floor tray with a surrounding ring structure. Thesecomponents protect the passengers in the case of a side-, or pole impact. They alsobear the loads of a front- or rear impact.
Fig. 2 SLRV vehicle body with metal sandwich construction—weight 90 kg
Development of the Safe Light Regional Vehicle (SLRV) … 181
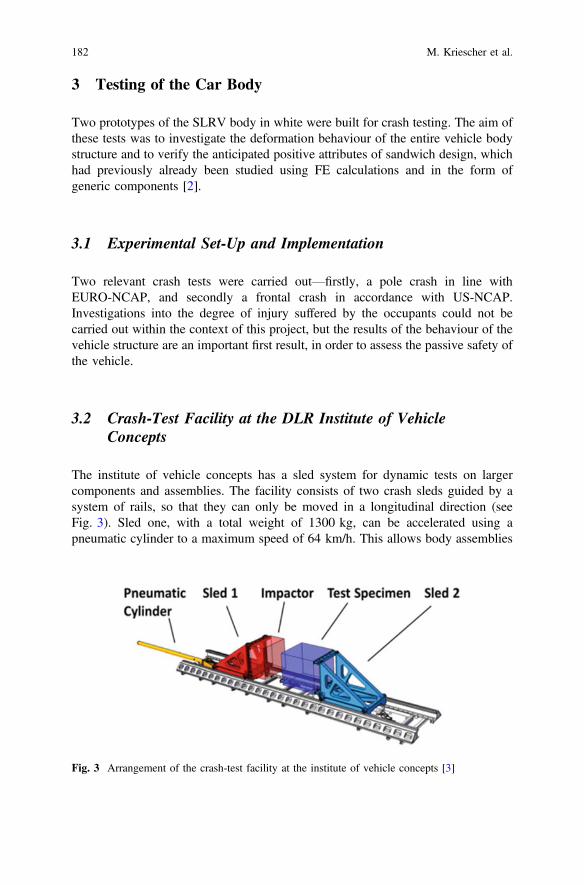
3 Testing of the Car Body
Two prototypes of the SLRV body in white were built for crash testing. The aim ofthese tests was to investigate the deformation behaviour of the entire vehicle bodystructure and to verify the anticipated positive attributes of sandwich design, whichhad previously already been studied using FE calculations and in the form ofgeneric components [2].
3.1 Experimental Set-Up and Implementation
Two relevant crash tests were carried out—firstly, a pole crash in line withEURO-NCAP, and secondly a frontal crash in accordance with US-NCAP.Investigations into the degree of injury suffered by the occupants could not becarried out within the context of this project, but the results of the behaviour of thevehicle structure are an important first result, in order to assess the passive safety ofthe vehicle.
3.2 Crash-Test Facility at the DLR Institute of VehicleConcepts
The institute of vehicle concepts has a sled system for dynamic tests on largercomponents and assemblies. The facility consists of two crash sleds guided by asystem of rails, so that they can only be moved in a longitudinal direction (seeFig. 3). Sled one, with a total weight of 1300 kg, can be accelerated using apneumatic cylinder to a maximum speed of 64 km/h. This allows body assemblies
Fig. 3 Arrangement of the crash-test facility at the institute of vehicle concepts [3]
182 M. Kriescher et al.
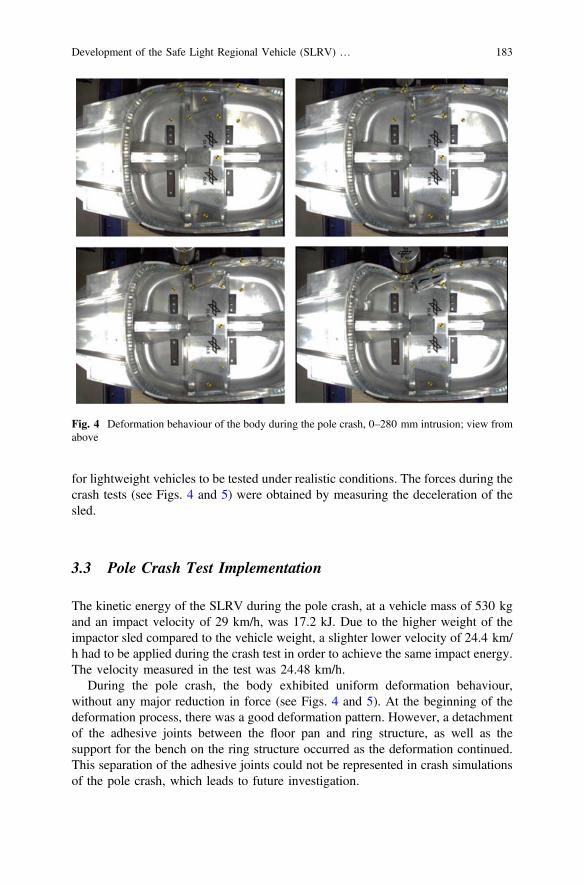
for lightweight vehicles to be tested under realistic conditions. The forces during thecrash tests (see Figs. 4 and 5) were obtained by measuring the deceleration of thesled.
3.3 Pole Crash Test Implementation
The kinetic energy of the SLRV during the pole crash, at a vehicle mass of 530 kgand an impact velocity of 29 km/h, was 17.2 kJ. Due to the higher weight of theimpactor sled compared to the vehicle weight, a slighter lower velocity of 24.4 km/h had to be applied during the crash test in order to achieve the same impact energy.The velocity measured in the test was 24.48 km/h.
During the pole crash, the body exhibited uniform deformation behaviour,without any major reduction in force (see Figs. 4 and 5). At the beginning of thedeformation process, there was a good deformation pattern. However, a detachmentof the adhesive joints between the floor pan and ring structure, as well as thesupport for the bench on the ring structure occurred as the deformation continued.This separation of the adhesive joints could not be represented in crash simulationsof the pole crash, which leads to future investigation.
Fig. 4 Deformation behaviour of the body during the pole crash, 0–280 mm intrusion; view fromabove
Development of the Safe Light Regional Vehicle (SLRV) … 183
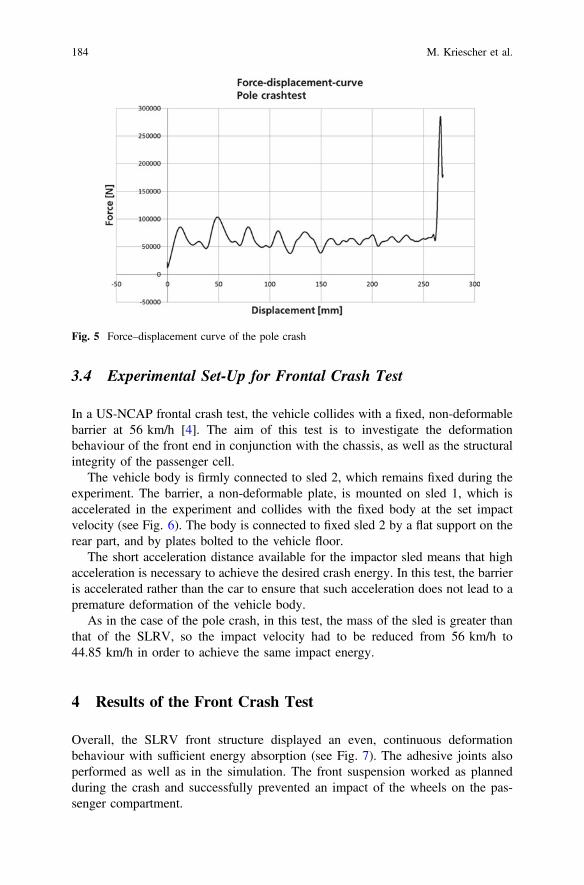
Fig. 5 Force–displacement curve of the pole crash
3.4 Experimental Set-Up for Frontal Crash Test
In a US-NCAP frontal crash test, the vehicle collides with a fixed, non-deformablebarrier at 56 km/h [4]. The aim of this test is to investigate the deformationbehaviour of the front end in conjunction with the chassis, as well as the structuralintegrity of the passenger cell.
The vehicle body is firmly connected to sled 2, which remains fixed during theexperiment. The barrier, a non-deformable plate, is mounted on sled 1, which isaccelerated in the experiment and collides with the fixed body at the set impactvelocity (see Fig. 6). The body is connected to fixed sled 2 by a flat support on therear part, and by plates bolted to the vehicle floor.
The short acceleration distance available for the impactor sled means that highacceleration is necessary to achieve the desired crash energy. In this test, the barrieris accelerated rather than the car to ensure that such acceleration does not lead to apremature deformation of the vehicle body.
As in the case of the pole crash, in this test, the mass of the sled is greater thanthat of the SLRV, so the impact velocity had to be reduced from 56 km/h to44.85 km/h in order to achieve the same impact energy.
4 Results of the Front Crash Test
Overall, the SLRV front structure displayed an even, continuous deformationbehaviour with sufficient energy absorption (see Fig. 7). The adhesive joints alsoperformed as well as in the simulation. The front suspension worked as plannedduring the crash and successfully prevented an impact of the wheels on the pas-senger compartment.
184 M. Kriescher et al.
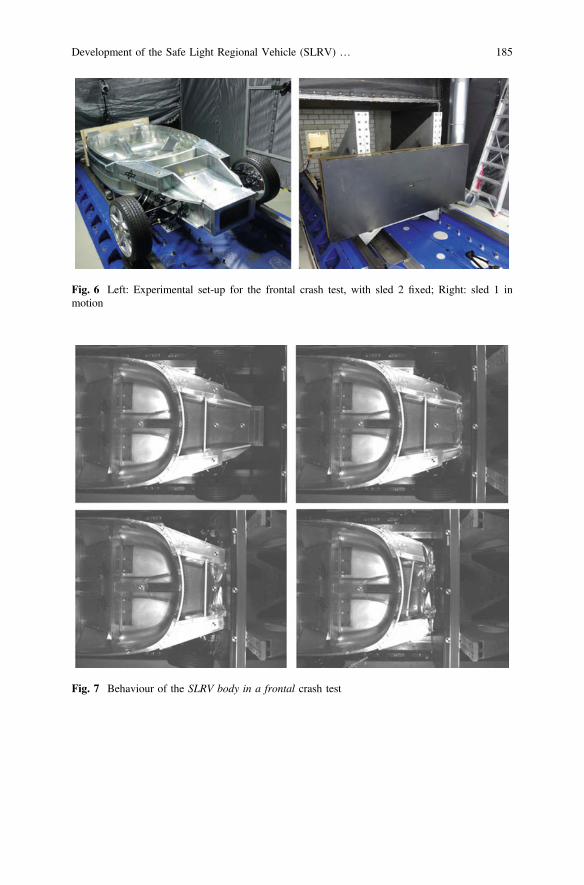
Fig. 6 Left: Experimental set-up for the frontal crash test, with sled 2 fixed; Right: sled 1 inmotion
Fig. 7 Behaviour of the SLRV body in a frontal crash test
Development of the Safe Light Regional Vehicle (SLRV) … 185
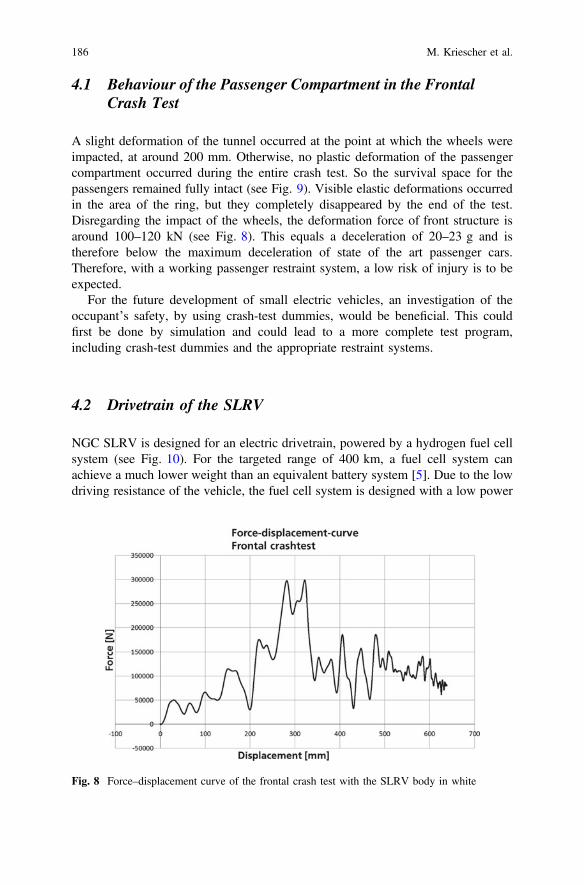
4.1 Behaviour of the Passenger Compartment in the FrontalCrash Test
A slight deformation of the tunnel occurred at the point at which the wheels wereimpacted, at around 200 mm. Otherwise, no plastic deformation of the passengercompartment occurred during the entire crash test. So the survival space for thepassengers remained fully intact (see Fig. 9). Visible elastic deformations occurredin the area of the ring, but they completely disappeared by the end of the test.Disregarding the impact of the wheels, the deformation force of front structure isaround 100–120 kN (see Fig. 8). This equals a deceleration of 20–23 g and istherefore below the maximum deceleration of state of the art passenger cars.Therefore, with a working passenger restraint system, a low risk of injury is to beexpected.
For the future development of small electric vehicles, an investigation of theoccupant’s safety, by using crash-test dummies, would be beneficial. This couldfirst be done by simulation and could lead to a more complete test program,including crash-test dummies and the appropriate restraint systems.
4.2 Drivetrain of the SLRV
NGC SLRV is designed for an electric drivetrain, powered by a hydrogen fuel cellsystem (see Fig. 10). For the targeted range of 400 km, a fuel cell system canachieve a much lower weight than an equivalent battery system [5]. Due to the lowdriving resistance of the vehicle, the fuel cell system is designed with a low power
Fig. 8 Force–displacement curve of the frontal crash test with the SLRV body in white
186 M. Kriescher et al.
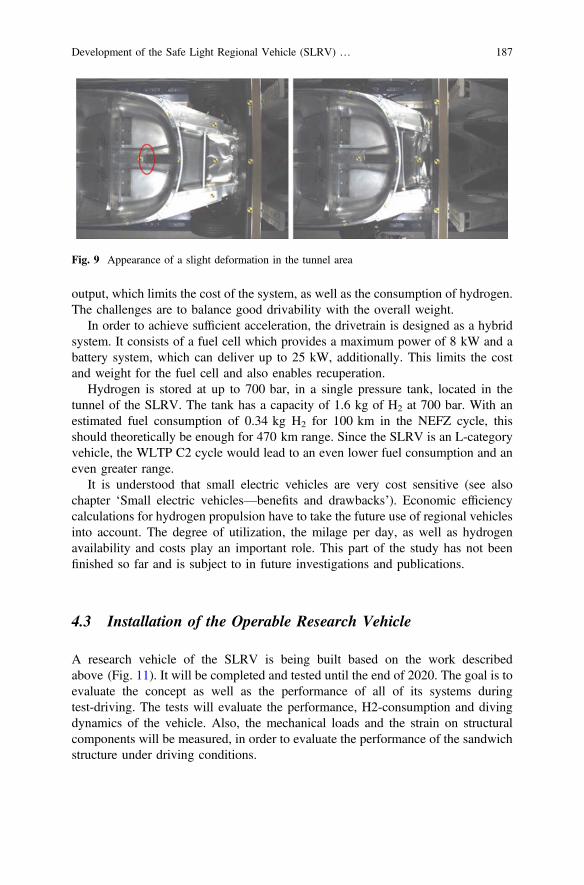
output, which limits the cost of the system, as well as the consumption of hydrogen.The challenges are to balance good drivability with the overall weight.
In order to achieve sufficient acceleration, the drivetrain is designed as a hybridsystem. It consists of a fuel cell which provides a maximum power of 8 kW and abattery system, which can deliver up to 25 kW, additionally. This limits the costand weight for the fuel cell and also enables recuperation.
Hydrogen is stored at up to 700 bar, in a single pressure tank, located in thetunnel of the SLRV. The tank has a capacity of 1.6 kg of H2 at 700 bar. With anestimated fuel consumption of 0.34 kg H2 for 100 km in the NEFZ cycle, thisshould theoretically be enough for 470 km range. Since the SLRV is an L-categoryvehicle, the WLTP C2 cycle would lead to an even lower fuel consumption and aneven greater range.
It is understood that small electric vehicles are very cost sensitive (see alsochapter ‘Small electric vehicles—benefits and drawbacks’). Economic efficiencycalculations for hydrogen propulsion have to take the future use of regional vehiclesinto account. The degree of utilization, the milage per day, as well as hydrogenavailability and costs play an important role. This part of the study has not beenfinished so far and is subject to in future investigations and publications.
4.3 Installation of the Operable Research Vehicle
A research vehicle of the SLRV is being built based on the work describedabove (Fig. 11). It will be completed and tested until the end of 2020. The goal is toevaluate the concept as well as the performance of all of its systems duringtest-driving. The tests will evaluate the performance, H2-consumption and divingdynamics of the vehicle. Also, the mechanical loads and the strain on structuralcomponents will be measured, in order to evaluate the performance of the sandwichstructure under driving conditions.
Fig. 9 Appearance of a slight deformation in the tunnel area
Development of the Safe Light Regional Vehicle (SLRV) … 187

References
1. Eckstein, L., Göbbels, R., Goede, M, et al.: Analyse sekundärer Gewichtseinsparpotenziale inKraftfahrzeugen, ATZ 01/2011 (2011)
2. Kriescher, M., Hampel, M., Grünheid, T., Brückmann, S.: Entwicklung einer leichten,funktionsintegrierten Karosserie in Metall-Sandwich-Bauweise, In: Lightweight Design (2015)
Fig. 10 Drivetrain concept of the SLRV
Fig. 11 SLRV research vehicle, November 2019, the drivetrain is still being developed
188 M. Kriescher et al.
3. Kriescher, M. et al.: Dynamische Komponenten-Prüfanlage, In: handout of the Institute ofVehicle Concepts (2013)
4. Crash Training safety wissen App., 21 March 20185. Friedrich, A.: Batterie oder Brennstoffzelle—was bewegt uns in Zukunft? Talk, DLR Institute
of Technical Thermodynamics (2014)
Open Access This chapter is licensed under the terms of the Creative Commons Attribution 4.0International License (http://creativecommons.org/licenses/by/4.0/), which permits use, sharing,adaptation, distribution and reproduction in any medium or format, as long as you give appropriatecredit to the original author(s) and the source, provide a link to the Creative Commons license andindicate if changes were made.The images or other third party material in this chapter are included in the chapter’s Creative
Commons license, unless indicated otherwise in a credit line to the material. If material is notincluded in the chapter’s Creative Commons license and your intended use is not permitted bystatutory regulation or exceeds the permitted use, you will need to obtain permission directly fromthe copyright holder.
Development of the Safe Light Regional Vehicle (SLRV) … 189