amar et al 2012 biol cons peregrine paper final online version
TRANSCRIPT

This article appeared in a journal published by Elsevier. The attachedcopy is furnished to the author for internal non-commercial researchand education use, including for instruction at the authors institution
and sharing with colleagues.
Other uses, including reproduction and distribution, or selling orlicensing copies, or posting to personal, institutional or third party
websites are prohibited.
In most cases authors are permitted to post their version of thearticle (e.g. in Word or Tex form) to their personal website orinstitutional repository. Authors requiring further information
regarding Elsevier’s archiving and manuscript policies areencouraged to visit:
http://www.elsevier.com/copyright
Author's personal copy
Linking nest histories, remotely sensed land use data and wildlife crime recordsto explore the impact of grouse moor management on peregrine falcon populations
Arjun Amar a,b,⇑, Ian R. Court c, Martin Davison c, Steve Downing c, Trevor Grimshaw c, Terry Pickford c,David Raw c
a RSPB Scotland, Ground Floor, 2 Lochside View, Edinburgh Park, Edinburgh EH12 9DH, United Kingdomb Percy FitzPatrick Institute of African Ornithology, DST/NRF Centre of Excellence, University of Cape Town, Private Bag X3, Rondebosch 7701, South Africac Northern England Raptor Forum, PO Box 536, Keighley BD21 9DL, United Kingdom
a r t i c l e i n f o
Article history:Received 14 July 2011Received in revised form 4 October 2011Accepted 11 October 2011Available online 8 November 2011
Keywords:Source-sink dynamicsPersecutionPredationClimate changeHuntingWildlife crime
a b s t r a c t
Wildlife crime can be difficult to quantify, and its true impact on populations can be underestimated ifrates are under-recorded. The illegal killing of birds of prey is an important form of wildlife crime, whichin the UK, is often associated with land managed for the recreational shooting of red grouse Lagopuslagopus scoticus. In the UK, increases in peregrine falcons Falco peregrinus following recovery from org-ano-chlorine pesticides have not been uniform, with slow growth and localised declines in some areas,including those managed for red grouse shooting. In this study, we combined 1081 peregrine nest histo-ries across northern England between 1980 and 2006 with a remotely sensed map of grouse moor man-agement, to test whether breeding performance was lower in areas with active management for grouseshooting. Productivity of pairs on grouse moors was 50% lower than pairs breeding on non-grouse moorhabitat. However, clutch size and brood size of successful nests did not differ between habitat types, sug-gesting that food constraints were unlikely to explain this difference. Population models suggestedsource-sink dynamics, with populations on grouse moors unable to sustain themselves without immigra-tion. Population data confirmed that growth rates were indeed lower on grouse moors than on non-grouse moor sites. Analysis of wildlife crime data confirmed that persecution of the species was morefrequent on grouse moors than in other habitat types. This population will be more secure, and betterable to function as a barometer of environmental health and climate change, if illegal persecution ofthe species ceases on areas of land managed for grouse shooting.
� 2011 Elsevier Ltd. All rights reserved.
1. Introduction
Populations of top predators, including raptors, are vulnerableto direct anthropogenic control (Newton, 1979; Helldin, 2000;Rodriguez and Delibes, 2004). Despite many raptor species beingprotected across their range by legislation (Mclean et al., 1999),illegal activity often continues, but as with most wildlife crimes,quantifying the true level of these activities can often be difficult(Gavin et al., 2009). Uncertainty over the amount of unreportedor undiscovered crime, described as ‘dark-figures’ by criminolo-gists, is one of the greatest obstacles in tackling wildlife crimeglobally (Akella and Cannon, 2004; Wellsmith, 2011). It is clearhowever, that in some circumstances illegal persecution of raptorsis sufficient to limit their breeding success (Etheridge et al., 1997;Whitfield et al., 2008), survival (Oro et al., 2008; Real and Manosa,
1997; Smart et al., 2010; Whitfield et al., 2004a), territorial occu-pancy (Redpath et al., 2010; Villafuerte et al., 1998; Whitfieldet al., 2004b), and population size (Whitfield et al., 2006; Smartet al., 2010).
Raptors are often persecuted because of their perceived impactson gamebirds (Park et al., 2008; Valkama et al., 2005; Villafuerteet al., 1998). In the British uplands, the management of moorlandareas for recreational sport shooting of red grouse is a widespreadand economically important land use in Scotland and northernEngland (Sotherton et al., 2009). However grouse shooting, andin particular ‘driven’ grouse shooting (grouse flushed toward a sta-tic row of shooters) which requires a high densities of grouse to beeconomically viable, remains associated with the illegal killing anddisturbance of raptors (Redpath et al., 2010; Thompson et al., 2009)and these activities are a major impediment to the conservation ofseveral species (Anderson et al., 2009; Etheridge et al., 1997; Field-ing et al., 2011; Sim et al., 2007; Whitfield et al., 2006).
Populations of peregrine falcon across Europe and NorthAmerica suffered dramatic declines caused by secondary poisoningfrom organo-chlorine pesticides such as DDT in the 1950s and
0006-3207/$ - see front matter � 2011 Elsevier Ltd. All rights reserved.doi:10.1016/j.biocon.2011.10.014
⇑ Corresponding author. Address: Percy FitzPatrick Institute of African Ornithol-ogy, DST/NRF Centre of Excellence, University of Cape Town, Private Bag X3,Rondebosch 7701, South Africa. Tel.: +27 (0)21 6503304; fax: +27 21 6503295.
E-mail address: [email protected] (A. Amar).
Biological Conservation 145 (2012) 86–94
Contents lists available at SciVerse ScienceDirect
Biological Conservation
journal homepage: www.elsevier .com/locate /b iocon
Author's personal copy
1960s (Hickey, 1969). Following the ban on their use, and in somecases management intervention, populations have recovered (Cadeet al., 1988; Ratcliffe, 1993). The UK is now of international impor-tance for the species, holding 12–14% of the European population,with 1530 occupied nesting ranges in 2002 (Banks et al., 2010). Thespecies has few natural predators, but has long been persecuted byhumans (Mearns and Newton, 1988). Although the species is nowfully protected in the UK (Wildlife and Countryside Act 1981, asamended) it remains the target of illegal killing and nest destruc-tion, particularly on grouse moors where peregrines are perceivedas a threat to grouse stocks (Court et al., 2004; Hardey et al., 2003).The species was recently identified by the UK government as a pri-ority for targeting wildlife crime enforcement resources (DEFRA,2011).
Motivated in part by these continuing conservation threats, vol-unteer observers monitor many raptor species across the UK (e.g.Wernham et al., 2008). The accumulated information includes30 years of data on the breeding success of peregrine falcons col-lected by the Northern England Raptor Forum. These data, col-lected across landscapes varying in grouse managementintensity, provide an opportunity to test whether peregrine falconbreeding success is limited by persecution associated with grousemoor management. Banks et al. (2010) recently stressed the needfor such research to accurately establish the current importanceof persecution of peregrine populations in the UK.
In this study, we test whether measures of breeding perfor-mance of peregrine falcons differed between grouse moor andnon-grouse moor habitats. We predict that if persecution associ-ated with grouse moor management was widespread, breedingparameters such as hatching success and overall breeding successwould be lower in areas surrounded by active grouse moor. Forcomparison, we also examine differences in clutch size and broodsize (of fledged broods), parameters which are unlikely to be af-fected by illegal persecution (because persecution usually resultsin complete breeding failure), but may be affected if grouse moormanagement is influencing the food resources available.
Using the breeding parameters found on grouse moors and innon-grouse moor habitats, we then construct stochastic populationmodels, to test whether productivity on grouse moors is sufficientfor the population to be self sustaining or whether these popula-tions are being sustained by immigration from areas of higher pro-ductivity. We also explore whether trends in the number ofoccupied nesting ranges on grouse moors differed from that onnon-grouse moor habitats over time. Finally, we explore directlywhether incidents of peregrine persecution are associated withgrouse moor management in northern England. For this we usethe Royal Society for the Protection of Birds’ (RSPB) Wild BirdCrime Database to examine the incidents of peregrine persecutionin our study area, and to explore whether the frequency of perse-cution incidents was higher in grouse moor areas.
2. Methods
2.1. Study areas and peregrine breeding surveys
Peregrine breeding data were obtained by volunteers from se-ven regions of northern England (Fig. 1, Table 1) between 1980and 2006, although the span of years varied between regions (Ta-ble 1). Data were available for the majority of upland areas in thenorth of England, with the exception of the Lake District; howevera study on the dynamics of this population covering a similar per-iod to our study has been previously published (Horne and Field-ing, 2002). Field methods followed those described formonitoring peregrine populations (Court et al., 2004; Hardeyet al., 2006). Known peregrine nesting ranges were monitored by
fieldworkers throughout the study period and new nesting rangeswere located from visits to potentially suitable nesting areas or byfollowing up reports of possible breeding attempts. Several visits tocheck for occupancy at each site were made from mid-March tolate April, followed by further visits in May to record evidence ofbreeding (presence of a clutch) from direct observations or thepresence of incubating females, and where possible to recordclutch size. Subsequent visits determined hatching success, even-tual outcome of the breeding attempt and fledging brood size. Be-cause volunteers carried out most work, data are not available forall site-year combinations. A foot- and-mouth disease outbreak re-duced access and therefore monitoring effort in 2001.
Nest locations were recorded as six figure UK Ordnance Survey(OS) grid references (i.e. to the nearest 100 m). Some nestingranges have a series of alternative nests sites and we allocated aunique identifier (‘range’) to nests within the same nesting terri-tory, as describe by Steenhof and Newton (2007) and Newtonand Marquiss (1982). Altitude of each nest site was recorded assix 100 m height bands as follows: <100 = 1; 100–199 = 2; 200–299 = 3, 300–399 = 4, 400–499 = 5, >500 = 6. Fieldworkers wereasked to classify the main habitat surrounding each nest site ascoastal, urban/suburban, farmland, forestry, grass moor, heathermoor managed for grouse shooting (grouse moor), and heathermoor not managed for grouse shooting. Very few coastal (n = 6)and urban/suburban (n = 18) sites were monitored so nests inthese habitats were excluded from any further analysis. Wherepossible, pairs occupying a nesting range were aged based on theirplumage colour, and classified as ‘adult’ or ‘immature’ (whereeither one or both were 1st year birds).
2.2. Quantifying surrounding grouse moor management
Heather on moorland managed for red grouse is burned in stripsto perpetuate a mosaic of young nutritious heather as a food sourcefor grouse (Hudson, 1992). This produces a characteristic patternthat is readily apparent from satellite images, enabling the identi-fication of areas with active grouse moor management. This ap-proach has been used in numerous studies to explore variousspatial relationships with grouse moor management (Amar et al.,2011; Anderson et al., 2009; Whitfield et al., 2003). We used recentsatellite images (mainly 2005–2006 http://earth.google.com; seeAnderson et al., 2009) to classify grouse moor management acrossour study regions using a 1 � 1 km OS grid. We selected 1 kmsquares with heather habitat (Target Level 1 categories DwarfShrub Heath) as classified by Land Cover Map 2000 (Fuller et al.,2005). We then classified each square which contained heather,as either burnt or un-burnt depending on whether strip burningwas present from the satellite images. Finally, to derive a measureof grouse moor activity (hereafter Ground Moor Index – GMI) foreach nest site, we calculated the percentage of ground strip-burnedin the land area encompassed by the 1 km square in which the nestsite was located and the surrounding eight 1 km squares.
We compared the GMI with the habitat classification of nestsites provided by fieldworkers (Fig. 2). The average GMI for nestsclassified as grouse moor was close to 50%, whereas for nests inother habitats it was well below 20% (Fig. 2). Thus, for the purposeof our subsequent analysis we categorised nest sites as being ongrouse moors if they were surrounded by over 20% strip burning,and classified sites as non-grouse moor habitat if they were sur-rounded by less than 20% strip burning. Using this approach wefound there was close agreement between the subjective (field-workers) classifications and the objective (GMI) classification;82% of sites that were classified as grouse moors and 91% that wereclassified as non-grouse moor habitats from fieldworker classifica-tion were classified as such using the 20% GMI threshold.
A. Amar et al. / Biological Conservation 145 (2012) 86–94 87

Author's personal copy
Fig. 1. Map showing the location of our study area and the boundary of our study regions, and the prevalence of grouse moors as shown by the 1 km squares which wereclassified as containing strip burning.
Table 1Regional summaries of the data used in the analysis for each of the seven regions, and the average ± S.E. (sample size) of the various breeding parameters analysed. Due to smallsample sizes, these data exclude information from coastal or urban/suburban sites, and from pairs where one bird was immature.
Study region Span ofyears (n)
Nesting ranges (totaloccupied years)
Burnt within1 km (%)
Probability oflaying (%)
Clutch size Hatchingsuccess (%)
Fledged broodsize
Breedingsuccess (%)
Calderdale 1998–2006 8 (32) 2 ± 1 100 ± 0 (32) 3.30 ± 0.12 (30) 71 ± 8 (32) 2.43 ± 0.18 23) 71 ± 8 (32)Northumbria 1980–2006 31 (216) 3 ± 1 90 ± 2 (213) 3.29 ± 0.06 (154) 81 ± 3 (163) 2.39 ± 0.08 (129) 61 ± 3 (213)South Peaks 1984–2006 27 (152) 19 ± 3 91 ± 2 (149) 2.91 ± 0.08 (85) 86 ± 3 (132) 2.42 ± 0.10 (106) 71 ± 4 (148)Yorkshire
Dales1980–2006 33 (263) 19 ± 1 90 ± 2 (212) 3.25 ± 0.17 (35) 81 ± 3 (180) 2.46 ± 0.08 (131) 53 ± 3 (251)
Durham 1992–2006 9 (71) 21 ± 3 79 ± 5 (71) 3.06 ± 0.11 (52) 58 ± 6 (56) 2.25 ± 0.17 (31) 44 ± 6 (71)North York
Moors1992–2006 5 (17) 43 ± 4 44 ± 1 (9) 3 ± 0 (3) 33 ± 33 (3) 2 ± 0 (1) 7 ± 7 (14)
North West 1980–2006 28 (282) 52 ± 1 98 ± 1 (261) 3.18 ± 0.06 (199) 56 ± 3 (241) 2.15 ± 0.09 (98) 37 ± 3
Total 1980–2006 141 (1033) 25 ± 1 91 ± 1 (947) 3.17 ± 0.04 (559) 72 ± 2 (807) 2.36 ± 0.04 (519) 52 ± 2 (990)
88 A. Amar et al. / Biological Conservation 145 (2012) 86–94

Author's personal copy
2.3. Rainfall data
Previous research has found that peregrine breeding success inthe UK is inversely related to rainfall in May, the month when mostclutches hatch and when young chicks are most vulnerable (Horneand Fielding, 2002; Mearns and Newton, 1988). We therefore ex-tracted estimated May rainfall levels for each year from 1980 to2006 from the monthly 5 km gridded UKCIP dataset (Perry andHollis, 2005), and allocated rainfall in each year to nests withineach 5 km cell.
2.4. Persecution data
The RSPB’s Wild Bird Crime Database assigns persecution inci-dents into three categories: confirmed, probable and possible,depending on the amount of available evidence (RSPB, 2010). Weobtained all confirmed and probable incidents of persecution onperegrines between 1990 and 2006 within our study areas, definedby the boundaries in Fig. 1. This time period was slightly shorterthan the full span of years when our monitoring work occurred,but covered the years when monitoring occurred in most of the re-gions. Only those incidents assignable to a 1 km square were used,and to avoid issues of pseudo-replication, the few incidents (n = 4)involving multiple persecution cases at the same locality (e.g.where birds were shot and their nests also destroyed) were classi-fied as single incidents. Repeated cases of persecution betweenyears at the same locality were however treated as separate inci-dents. The proportion of strip burning surrounding each incident
was then calculated in the same manner as for peregrine nests,and sites were again classified as being ‘grouse moors’ if GMIwas >20%.
2.5. Statistical analysis
Breeding performance measures from each site in each yearwere as follows: (i) Clutch Production: whether an occupied siteproduced a clutch; (ii) Hatching Success: whether a pair producinga clutch went on to successfully hatch that clutch; (iii) FledgingSuccess: whether a hatched brood successfully fledged; (iv) Breed-ing Success: whether a site occupied by a pair produced anyfledged young. All these measures were binary (success/failure)and were analysed in our models with a binomial error structureand logit link function. We also analysed (v) Clutch Size; (vi)Fledged Brood Size: the number of young fledged by a successfulnest; and (vii) Overall Productivity: the number of young producedper occupied site. These last three variables were analysed with aPoisson error structure and log link function.
Data on breeding performance were analysed using GeneralisedLinear Mixed Models (GLMMs), incorporating nest site, range,study region and year as random terms to control for non-indepen-dence of data collected at these levels, and to account for theunbalanced nature of our data. On occasions when models failedto converge with all random terms, we removed ‘site’ from themodel, enabling convergence. Denominator degrees of freedomwere calculated using the Kenward Rogers method and the signif-icance value of fixed effects was taken from a Type III analysis. AllGLMMS were carried out in SAS version 9.1 (SAS Institute Inc.,2004).
The key explanatory variable in our analyses was that describ-ing whether a site was classified as grouse moor (GMI P 20%) ornot (GMI < 20%). Models also included the nest site’s altitude band(scored 1–6) as a covariate to control for a positive association be-tween altitude and burning. For hatching, fledging and breedingsuccess we also included May rainfall as a covariate. If persecutionoccurred disproportionately on grouse moors, then effects ofweather conditions on breeding performance may be masked, thuswe also tested for an interaction between habitat type and Mayrainfall. We also examined whether any difference in breeding suc-cess between habitats was consistent across regions, for this anal-ysis we used the same models but fitted region, habitat andregion � habitat type interaction as fixed effects (removing the ran-dom region term). Pairwise comparisons between habitat typeswithin regions were then made using the differences in leastsquared means.
We used a Chi-square test (with Yates’ correction) to explorewhether persecution incidents occurred on grouse moors (sites
Fig. 2. Mean (±95% C.I.) percentage of area with strip burning (Grouse Moor Index:GMI) within a 1 km of nests located in different habitat types as classified by fielddata. Line shows the 20% level, which was our threshold value for classifying sites aseither grouse moor sites or non-grouse moor sites.
Table 2Results of a generalised linear mixed models, testing whether each variable differed on grouse moor and non grouse moor habitats (together with the mean model estimate foreach habitat type) after controlling for Altitude and May rain (where appropriate). Results in bold are those which were significant at P < 0.05.
Variable Altitude May rainfall Habitat type Non-grouse moor habitat (±SE) Grouse moor (±SE)
% Singletonsa F1, 89 = 0.09, P = 0.76 F1, 85 = 0.26, P = 0.60 2.3 ± 1.8% 3.1 ± 2.4%% Immature pairs F1, 102 = 0.33, P = 0.56 F1, 60 = 0.08, P = 0.78 4.2 ± 2.1% 5.0 ± 2.9%Clutch production F1, 91 = 0.04, P = 0.84 F1, 78 = 14.38, P = 0.0003 96 ± 2% 83 ± 8%Hatching success F1, 116 = 2.10, P = 0.15 F1, 803 = 2.31, P = 0.13 F1, 80 = 12.90, P = 0.0006 82 ± 4% 58 ± 8%Fledging success F1, 95 = 0.04, P = 0.83 F1, 42 = 0.14, P = 0.70 F1, 35 = 4.47, P = 0.04 92 ± 2% 82 ± 5%Overall breeding success F1, 111 = 0.04, P = 0.83 F1, 28 = 0.48, P = 0.49 F1, 47 = 26.59, P < 0.0001 67 ± 4% 33 ± 5%Overall productivityb F1, 113 = 5.59, P = 0.02 F1, 57 = 25.39, P < 0.0001 1.51 ± 0.15 0.76 ± 0.09Cltuch size F1, 78 = 0.01, P = 0.93 F1, 40 = 0.67, P = 0.41 3.09 ± 0.09 3.19 ± 0.11Brood sizec F1, 516 = 0.06, P = 0.81 F1, 516 = 0.81, P = 0.36 2.40 ± 0.08 2.26 ± 0.13
a % Of territories with any birds present which only held a single bird.b GLMM would not converge with altitude and habitat type in the model – this result is therefore for altitude fitted separately in the model. GLM modelling (fitting Year,
Region, Altitude, May Rainfall and Habitat type) confirmed that habitat type remained significant with altitude included in the model.c Models would only converge after the exclusion of the random term ‘territory’, and would not converge with May rainfall.
A. Amar et al. / Biological Conservation 145 (2012) 86–94 89
Author's personal copy
with GMI > 20%) more frequently than expected, given the propor-tion of nesting peregrines in that habitat type. To calculate thisproportion, we used data from nests monitored between 1990and 2006, covering the period when the persecution data were re-corded and ensured greatest representation across the regions.
2.6. Population models
We modelled growth rates of peregrine populations usingVORTEX (Lacy et al., 2005) making various assumptions (AppendixA, Table A.1). We used a meta-population model, with habitat spe-cific probability of breeding success and the mean fledged broodsize (Table 2). Our initial population size of 150 individuals in eachpopulation, resulted in around 50 pairs assuming a stable age dis-tribution, similar to the maximum number of pairs monitored peryear in either habitat type (n = 53). Carrying capacity of each pop-ulation was 400 individuals and models were run for 100 iterationsover 50 years. Our first scenario assumed a closed population withno dispersal, allowing population specific growth rates to be esti-mated. We then specified 10% dispersal between the populations,similar to the breeding dispersal levels seen in a nearby southernScottish population (Mearns and Newton 1984), in order to testwhether productivity from one population could sustain the other,and whether this affected the overall meta-population growth.
3. Results
3.1. Prevalence of immature pairs and singletons
Over the 27 years (1980–2006), we had data from 1081 pair-occupied territories. From the 916 (85%) aged pairs, only 48 (5%)were immature pairs. Overall breeding success of immature pairswas very low, with only 3 of 48 pairs (6%) producing young. Dueto this low breeding success, small sample size and uneven distri-bution between regions, we excluded data from immature pairs inall our subsequent analysis. There was, however, no difference inthe proportion of immature pairs found on grouse moor andnon-grouse moor habitats (Table 2), so this exclusion should havelittle influence on our principle analyses. From the territories thatheld any peregrines, there was no significant difference in the pro-portion that were occupied by single birds between grouse moorand non-grouse moor habitats (Table 2).
3.2. Clutch production, hatching and fledging success
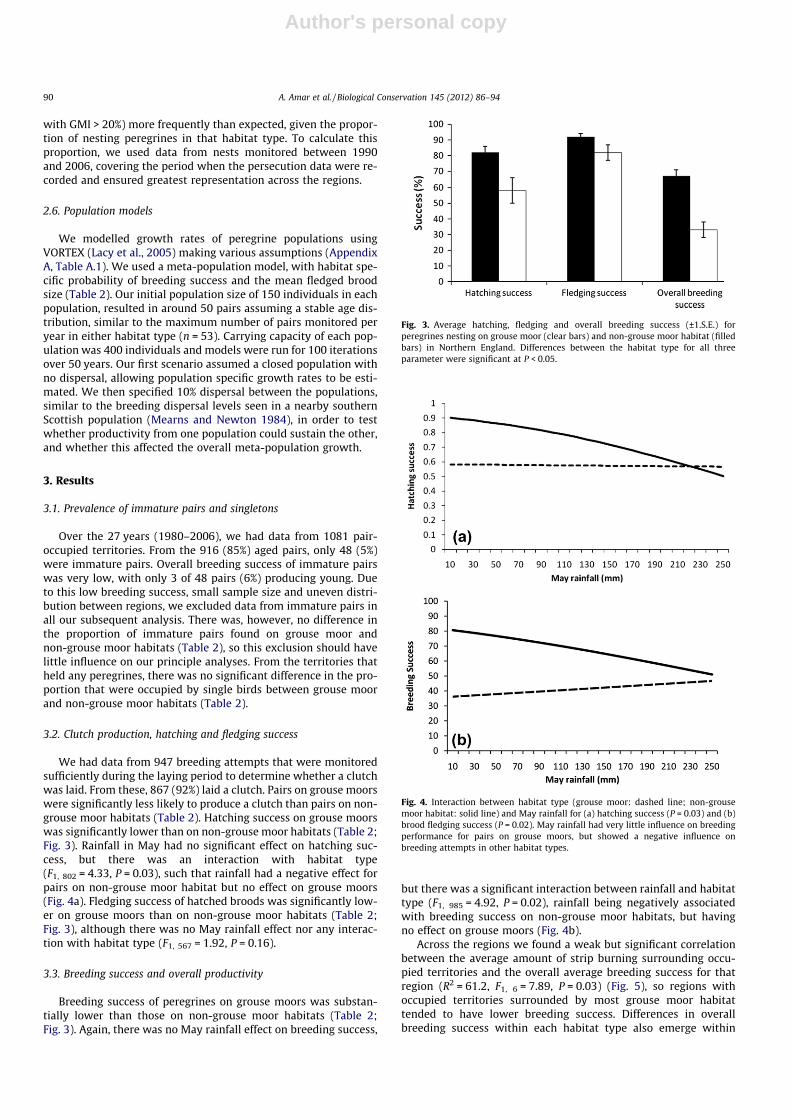
We had data from 947 breeding attempts that were monitoredsufficiently during the laying period to determine whether a clutchwas laid. From these, 867 (92%) laid a clutch. Pairs on grouse moorswere significantly less likely to produce a clutch than pairs on non-grouse moor habitats (Table 2). Hatching success on grouse moorswas significantly lower than on non-grouse moor habitats (Table 2;Fig. 3). Rainfall in May had no significant effect on hatching suc-cess, but there was an interaction with habitat type(F1, 802 = 4.33, P = 0.03), such that rainfall had a negative effect forpairs on non-grouse moor habitat but no effect on grouse moors(Fig. 4a). Fledging success of hatched broods was significantly low-er on grouse moors than on non-grouse moor habitats (Table 2;Fig. 3), although there was no May rainfall effect nor any interac-tion with habitat type (F1, 567 = 1.92, P = 0.16).
3.3. Breeding success and overall productivity
Breeding success of peregrines on grouse moors was substan-tially lower than those on non-grouse moor habitats (Table 2;Fig. 3). Again, there was no May rainfall effect on breeding success,
but there was a significant interaction between rainfall and habitattype (F1, 985 = 4.92, P = 0.02), rainfall being negatively associatedwith breeding success on non-grouse moor habitats, but havingno effect on grouse moors (Fig. 4b).
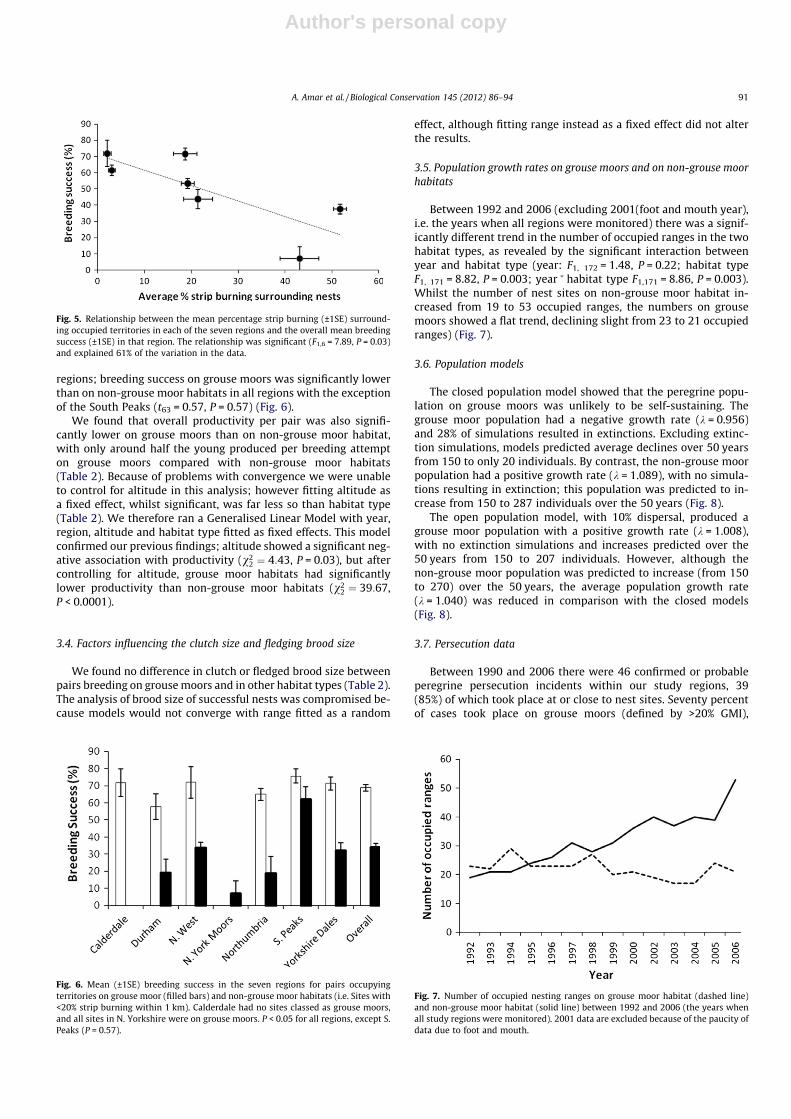
Across the regions we found a weak but significant correlationbetween the average amount of strip burning surrounding occu-pied territories and the overall average breeding success for thatregion (R2 = 61.2, F1, 6 = 7.89, P = 0.03) (Fig. 5), so regions withoccupied territories surrounded by most grouse moor habitattended to have lower breeding success. Differences in overallbreeding success within each habitat type also emerge within
Fig. 3. Average hatching, fledging and overall breeding success (±1.S.E.) forperegrines nesting on grouse moor (clear bars) and non-grouse moor habitat (filledbars) in Northern England. Differences between the habitat type for all threeparameter were significant at P < 0.05.
Fig. 4. Interaction between habitat type (grouse moor: dashed line; non-grousemoor habitat: solid line) and May rainfall for (a) hatching success (P = 0.03) and (b)brood fledging success (P = 0.02). May rainfall had very little influence on breedingperformance for pairs on grouse moors, but showed a negative influence onbreeding attempts in other habitat types.
90 A. Amar et al. / Biological Conservation 145 (2012) 86–94
Author's personal copy
regions; breeding success on grouse moors was significantly lowerthan on non-grouse moor habitats in all regions with the exceptionof the South Peaks (t63 = 0.57, P = 0.57) (Fig. 6).
We found that overall productivity per pair was also signifi-cantly lower on grouse moors than on non-grouse moor habitat,with only around half the young produced per breeding attempton grouse moors compared with non-grouse moor habitats(Table 2). Because of problems with convergence we were unableto control for altitude in this analysis; however fitting altitude asa fixed effect, whilst significant, was far less so than habitat type(Table 2). We therefore ran a Generalised Linear Model with year,region, altitude and habitat type fitted as fixed effects. This modelconfirmed our previous findings; altitude showed a significant neg-ative association with productivity (v2
2 ¼ 4:43, P = 0.03), but aftercontrolling for altitude, grouse moor habitats had significantlylower productivity than non-grouse moor habitats (v2
2 ¼ 39:67,P < 0.0001).
3.4. Factors influencing the clutch size and fledging brood size
We found no difference in clutch or fledged brood size betweenpairs breeding on grouse moors and in other habitat types (Table 2).The analysis of brood size of successful nests was compromised be-cause models would not converge with range fitted as a random
effect, although fitting range instead as a fixed effect did not alterthe results.
3.5. Population growth rates on grouse moors and on non-grouse moorhabitats
Between 1992 and 2006 (excluding 2001(foot and mouth year),i.e. the years when all regions were monitored) there was a signif-icantly different trend in the number of occupied ranges in the twohabitat types, as revealed by the significant interaction betweenyear and habitat type (year: F1, 172 = 1.48, P = 0.22; habitat typeF1, 171 = 8.82, P = 0.003; year � habitat type F1,171 = 8.86, P = 0.003).Whilst the number of nest sites on non-grouse moor habitat in-creased from 19 to 53 occupied ranges, the numbers on grousemoors showed a flat trend, declining slight from 23 to 21 occupiedranges) (Fig. 7).
3.6. Population models
The closed population model showed that the peregrine popu-lation on grouse moors was unlikely to be self-sustaining. Thegrouse moor population had a negative growth rate (k = 0.956)and 28% of simulations resulted in extinctions. Excluding extinc-tion simulations, models predicted average declines over 50 yearsfrom 150 to only 20 individuals. By contrast, the non-grouse moorpopulation had a positive growth rate (k = 1.089), with no simula-tions resulting in extinction; this population was predicted to in-crease from 150 to 287 individuals over the 50 years (Fig. 8).
The open population model, with 10% dispersal, produced agrouse moor population with a positive growth rate (k = 1.008),with no extinction simulations and increases predicted over the50 years from 150 to 207 individuals. However, although thenon-grouse moor population was predicted to increase (from 150to 270) over the 50 years, the average population growth rate(k = 1.040) was reduced in comparison with the closed models(Fig. 8).
3.7. Persecution data
Between 1990 and 2006 there were 46 confirmed or probableperegrine persecution incidents within our study regions, 39(85%) of which took place at or close to nest sites. Seventy percentof cases took place on grouse moors (defined by >20% GMI),
Fig. 5. Relationship between the mean percentage strip burning (±1SE) surround-ing occupied territories in each of the seven regions and the overall mean breedingsuccess (±1SE) in that region. The relationship was significant (F1,6 = 7.89, P = 0.03)and explained 61% of the variation in the data.
Fig. 6. Mean (±1SE) breeding success in the seven regions for pairs occupyingterritories on grouse moor (filled bars) and non-grouse moor habitats (i.e. Sites with<20% strip burning within 1 km). Calderdale had no sites classed as grouse moors,and all sites in N. Yorkshire were on grouse moors. P < 0.05 for all regions, except S.Peaks (P = 0.57).
Fig. 7. Number of occupied nesting ranges on grouse moor habitat (dashed line)and non-grouse moor habitat (solid line) between 1992 and 2006 (the years whenall study regions were monitored). 2001 data are excluded because of the paucity ofdata due to foot and mouth.
A. Amar et al. / Biological Conservation 145 (2012) 86–94 91

Author's personal copy
whereas from our study during 1990–2006 only 42% of peregrinesnests were found on grouse moors. This proportion was signifi-cantly higher than expected if persecution was occurring in pro-portion to the distribution of peregrines nesting in the twohabitat types from our study (v2
1 ¼ 13:8, P < 0.01).
4. Discussion
Breeding performance of peregrine falcons was considerablylower on grouse moors than in other habitats, and these differ-ences were consistent across almost all of the regions within ourstudy area. Clutch production, hatching success and fledging suc-cess were all lower on grouse moors, and consequently overallbreeding success and productivity of pairs was only half the levelfound in other habitat types. Only one third of pairs occupyinggrouse moor territories went onto produce any young, whereason non-grouse moors over two thirds produced young. However,clutch size and brood size of successful nests did not differ be-tween grouse moor and non-grouse moor habitats. Food suppliesare more likely to affect these two measures (Aparicio, 1994;Newton, 1979; Redpath et al., 2002a) and this suggests that foodsupplies differed little between grouse moor and non-grouse moorhabitats, and were unlikely to explain the overall differences inbreeding performance in this study. This is not surprising giventhat we know that many peregrine prey species occur at similaror higher densities on grouse moors than on non-grouse moors(Tharme et al., 2001).
Productivity levels on non-grouse moor habitats in this study(1.51 ± 0.15 per pair) were similar to other comparable studies inthe UK (Hardey et al., 2003; Horne and Fielding, 2002; Ratcliffe,1993) and elsewhere (Gainzarain et al., 2000; Tordoff and Redig,1997; Olsen and Olsen, 1989). Productivity on grouse moors(0.76 ± 0.09) however, was far lower than those recorded in theseother studies, and was closer to those found during the era of org-ano-chlorine pesticides use (Hickey, 1969; Cade et al., 1988;Ratcliffe, 1993). For example, productivity in northern Englandduring the 1960s, a period when organo-chlorine pesticides werereducing productivity, was between 0.45 and 0.99 young per occu-pied territory, very similar to that found for grouse moors in thesame area in this study.
Our analysis of data held in the RSPB’s wild bird crime databaserevealed that peregrine persecution incidents occurred far morefrequently on grouse moors, than would be expected from theoccurrence of peregrine territories in that habitat type. We believethat human persecution, associated with the practice of grousemoor management, was the most likely explanation for the dispar-ities in breeding performance between the different habitats. Asimilar analysis considering only illegal wildlife poisoning alsoconfirmed the close link between illegal poisoning and land man-aged for grouse shooting (Whitfield et al., 2003). High levels of hu-man persecution of peregrines on grouse moors have beensuggested from several other studies. For example, Hardey et al.(2003) suggested that the lower productivity of peregrines neargrouse moors in Scotland was due to persecution associated withgrouse moor management. A quasi-experimental study in southernScotland revealed that when raptors on a grouse moor were fullyprotected from persecution, peregrine numbers doubled (Redpathand Thirgood, 1999; Amar et al., 2008). Court et al. (2004), whilstacknowledging the difficulties of detection, suggested that a mini-mum of 13% of nesting attempts in their study failed due to delib-erate human interference on grouse moors.
Persecution levels on grouse moors were apparently so high inour study that they were sufficient to obscure the natural influencethat weather can have on this species’ breeding performance(Mearns and Newton, 1988; Horne and Fielding, 2002). Thus, onnon-grouse moors the expected negative influence of May rainfallwas apparent, whereas nests located on grouse moors consistentlyhad lower breeding and hatching success irrespective of May rain-fall, such that hatching and breeding success on grouse moors weresimilar to levels seen in other habitats in the wettest May condi-tions. This finding has considerable implications for research usingraptors as the model organism to examine the impacts of climatechange (e.g. Redpath et al., 2002b; Wichmann et al., 2003), sincethe true influence of any changes in climate may be masked by hu-man persecution.
Our closed population model suggested that the grouse moorpopulation was not self-sustaining, whereas productivity on non-grouse moors was sufficiently high to allow rapid populationgrowth. Because of this, our open population model with 10% dis-persal between populations indicated that the meta-populationhad a positive population growth rate and should increase atapproximately 2.7% per annum. Using this modelled growth rateto predict recent population changes we would estimate that theinland population in northern England would have increased from160 in 1991 to 218 in 2002, which is reassuringly close to the 226pairs observed in 2002 (Banks et al., 2010). The population there-fore likely exists as a meta-population with source-sink dynamics(Pulliam, 1988). Grouse moors are operating as sinks, maintainedthrough the continual immigration of birds from other habitattypes which are acting as sources. Trends in the numbers of occu-pied territories in the different habitat types further reinforced thefindings for these models. Numbers more than doubled on the non-grouse moor habitats (19–53), but stagnated and actually declinedslightly on grouse moors (23–21). These results further reinforcethe idea that persecution levels were sufficient to have populationlevel impacts. This lack of growth on grouse moors cannot simplybe explained through insufficient nesting opportunities on grousemoors, because these data on grouse moors come from 56 separatenesting territories.
Whilst our results are consistent with the hypothesis that per-secution on grouse moors was the cause of the poor breeding per-formance in this habitat, could there be other explanations? Itseems unlikely. Our evidence already suggests food supplies areunlikely to be different between grouse moors and non-grousemoor habitats. Moreover, the few predators of peregrines in theUK (e.g. goshawk Accipiter gentilis, golden eagle Aquila chrysaetos,
Fig. 8. Graphical output for the VORTEX population models, simulated populationsize over 50 years, for population on grouse moor (dashed lines) and non-grousemoor habitat (solid lines), according to whether the populations were either closed(thin lines), with no immigration or emigration; or open with 10% dispersalbetween populations (thick lines). Lines show the mean output for 100 simulationsrun for each model over a 50 year period. See supplementary Table 1 for the fullparameter estimates.
92 A. Amar et al. / Biological Conservation 145 (2012) 86–94
Author's personal copy
red fox Vulpes vulpes and corvids) are all likely to be found at lowerdensities on moorland managed for grouse than in other habitattypes (Fletcher et al., 2010; Tharme et al., 2001; Whitfield et al.,2004b). Therefore, the most logical explanation for these differ-ences is that illegal persecution associated with grouse moor man-agement is responsible.
Various solutions have been proposed to resolve the conflict be-tween raptor conservation and management for red grouse shoot-ing (Thirgood et al., 2000; Thirgood and Redpath, 2008; Thompsonet al., 2009), and it is important that a solution is found given thesocio-economic importance of both birds of prey and red grouseshooting (Sotherton et al., 2009). At present however, considerablesums of money are being spent by conservation NGOs and govern-ment statutory agencies, and considerable time invested by dedi-cated volunteers, in trying to shield protected raptors frompersecution (Natural England, 2008; RSPB, 2010), and by the policein trying to enforce existing legislation (e.g. Her Majesty’s Inspec-torate of Constabulary, 2008) with relatively little success. Redpathand Thirgood (1999) found that peregrines show a type II func-tional response to grouse densities, such that they pose the great-est threat to grouse stocks when grouse are at low densities;however, they concluded that peregrines hunting in the absenceof other predators would not limit grouse numbers. However, per-egrine predation in addition to harrier predation is likely to reducethe ability of low density grouse populations to increase (Redpathand Thirgood, 1999), and is behind the motivation for the species’persecution on grouse moors. The use of diversionary feeding to re-duce grouse predation rates by hen harriers has received consider-able attention (Amar et al., 2004; Redpath et al., 2001); whereas,although a similar technique exists for peregrines (Phillips,1990), it has yet to be rigorously tested. Establishing novel tech-niques such as this may be vital in reducing the motivation behindthe illegal persecution of this species.
Understanding and acknowledging the scale of persecution onwild raptor populations is vital to tackling this issue (Wellsmith,2011) and this paper contributes directly to our understanding inthat respect. Persecution levels are often debated by the protago-nists in the conflict between raptor conservation and managementfor red grouse shooting, although from a conservation perspectiveit is the population level impact that is important, rather than thenumber of confirmed persecution cases. This study suggests thatpersecution of peregrines on grouse moors is on a scale sufficientto have an impact at the population level. The approach outlinedin this study whereby demographic data are combined with remo-tely sensed data on management practices may be useful for otherstudies to quantify levels of illegal activities which can be difficultto measure directly (Gavin et al., 2009) and to monitor changes inthese levels following implementation of new policies or enforce-ment initiatives.
Acknowledgements
We are hugely grateful to Sophie Eastwood and Sally Fisher forhelp in organising and checking the data, and to Liz Hoffman, WillGeorge and Dave Fouracre whom carried out the GIS analyses.Thanks are also due to Garry Marchant for compiling the data fromthe North York Moors. We are also grateful to Jeremy Wilson,Murray Grant, Pat Thompson, Alistair Crowle, Jen Smart, StaffanRoos, Steve Redpath, David Hoccom, Phil Whitfield and an anony-mous reviewer who provided useful comments on this paper. Wethank Ian Thomson and Guy Shorrocks who helped with the provi-sion of the persecution data. Thanks are also due to Staffan Roos foruse of his collated survival data. This research would not have beenpossible without the dedication and time of numerous NERF field-workers who have contributed their data to this Project. This re-search was made possible by funding to AA from the RSPB and
by support from the Percy Fitz Patrick Institute of African Ornithol-ogy, DST / NRF Centre of Excellence, University of Cape Town.
Appendix A. Supplementary material
Supplementary data associated with this article can be found, inthe online version, at doi:10.1016/j.biocon.2011.10.014.
References
Akella, A.S., Cannon, J.B., 2004. Strengthening the Weakest Links: Strategies forImproving the Enforcement of Environmental Laws Globally. ConservationInternational, Center for Conservation and Government. Washington, DC.
Amar, A., Arroyo, B.E., Redpath, S., Thirgood, S., 2004. Habitat predicts losses of redgrouse to individual hen harriers. Journal of Applied Ecology 41, 305–314.
Amar, A., Thirgood, S., Redpath, S., Pearce-Higgins, J., 2008. The impact of raptors onthe abundance of upland passerines and waders? Oikos 117, 1143–1152.
Amar, A., Grant, M., Buchanan, G., Sim, I., Wilson, J., Pearce-Higgins, J., Redpath, S.,2011. Exploring the relationships between wader declines and current land usein the British uplands. Bird Study 58, 13–26.
Anderson, B.J., Arroyo, B.E., Collingham, Y.C., Etheridge, B., Fernandez-de-Simon, J.,Gillings, S., Gregory, R.D., Leckie, F.M., Sim, I.M.W., Thomas, C.D., Travis, J.,Redpath, S.M., 2009. Using distribution models to test alternative hypothesesabout a species’ environmental limits and recovery prospects. BiologicalConservation 142, 488–499.
Aparicio, J.M., 1994. The seasonal decline in clutch size: an experiment withsupplementary food in the Kestrel Falco tinnunculus. Oikos 71, 451–458.
Banks, A.N., Crick, H.Q.P., Coombes, R., Benn, S., Ratcliffe, D.A., Humpreys, E.M., 2010.The breeding status of Peregrine Falcons Falco peregrines in the UK and Isle ofMan in 2002. Bird Study 57, 421–436.
Cade, T.J., Enderson, J.H., Thelander, C.G., White, C.M., 1988. Peregrine FalconPopulations: Their Management and Recovery. The Peregrine Fund, Boise,Idaho, USA.
Court, I.R., Irving, P.V., Carter, I., 2004. Status and productivity of peregrine falconsin the Yorkshire dales between 1978 and 2002. British Birds 97, 456–463.
DEFRA, 2011. <http://www.defra.gov.uk/news/2011/04/02/paw-seminar/> (25.05.11).Etheridge, B., Summers, R.W., Green, R.E., 1997. The effects of illegal killing and
destruction of nests by humans on the population dynamics of the hen harrierCircus cyaneus in Scotland. Journal of Applied Ecology 34, 1081–1105.
Fletcher, K., Aebischer, N.J., Baines, D., Foster, R., Hoodless, A.N., 2010. Changes inbreeding success and abundance of ground-nesting moorland birds in relationto the experimental deployment of legal predator control. Journal of AppliedEcology 47, 263–272.
Fielding, A., Howorth, P., Whitfield, P., McLeod, D., Riley, H., 2011. A ConservationFramework for Hen Harriers in the United Kingdom. JNCC Report 441. JointNature Conservation Committee, Peterborough.
Fuller, R.M., Cox, R., Clarke, R.T., Rothery, P., Hill, R.A., Smith, G.M., Thomson, A.G.,Brown, N.J., Howard, D.C., Stott, A.P., 2005. The UK land cover map 2000:planning, construction and calibration of a remotely sensed use-oriented mapof broad habitats. International Journal of Applied. Earth Observation &Geoinformation 7, 202–216.
Gavin, M.C., Solomon, J.N., Blank, S.G., 2009. Measuring and monitoring illegal use ofnatural resources. Conservation Biology 24, 89–100.
Gainzarain, J.A., Arambarri, R., Rodriguez, A.F., 2000. Breeding density, habitatselection and reproductive rates of the Peregrine Falcon Falco peregrinus inAlava (northern Spain). Bird Study 47, 225–231.
Hardey, J., Rollie, C.J., Stirling-Aird, P.K., 2003. Variation in breeding success ininland Peregrine Falcons Falco peregrines in three regions of Scotland. In:Thompson, D.B.A., Redpath, S.M., Fielding, A.H., Marquiss, M., Galbraith, C.A.(Eds.), Birds of Prey in a Changing Environment. The Stationer Office, Edinburgh.
Hardey, J., Crick, H.Q.P., Wernham, C.V., Riley, H.T., Etheridge, B., Thompson, D.B.A.,2006. Raptors: A Field Guide to Survey and Monitoring. The Stationery Office,Edinburgh.
Helldin, J.O., 2000. Population trends and harvest management of pine martenMartes martes in Scandinavia. Wildlife Biology 6, 111–120.
Her Majesty’s Inspectorate of Constabulary, 2008. Natural Justice: A Joint ThematicInspection of the Arrangements in Scotland for Preventing, Investigating andProsecuting Wildlife Crime. Scottish Government, Edinburgh, UK.
Hickey, J.J. (Ed.), 1969. Peregrine Falcon Populations: Their Biology and Decline. TheUniversity of Wisconsin Press, Madison, Milwaukee & London.
Horne, G., Fielding, A.H., 2002. Recovery of the Peregrine Falcon Falco peregrinus inCumbria, UK, 1966–99. Bird Study 49, 229–236.
Hudson, P.J., 1992. Grouse in Space and Time. The Game Conservancy Trust,Fordingbridge, UK.
Lacy, R.C., Borbat, M., Pollack, J.P., 2005. VORTEX: A Stochastic Simulation of theExtinction Process. Chicago Zoological Society, Brookfield, IL.
Mclean, I.F.G., Wright, A.D., Williams, A., 1999. The role of legislation in conservingEurope’s threatened species. Conservation Biology 13, 966–969.
Mearns, R., Newton, I., 1988. Factors affecting breeding success of peregrines insouth Scotland. Journal of Animal Ecology 57, 903–916.
A. Amar et al. / Biological Conservation 145 (2012) 86–94 93
Author's personal copy
Mearns, R., Newton, I., 1984. Turnover and dispersal in a Peregrine Falco peregrinuspopulation. Ibis 126, 347–355.
Natural England, 2008. A Future for the Hen Harrier in England? Report by NaturalEngland, Peterborough, ISBN:978-1-84754-109-7.
Newton, I., 1979. Population Ecology of Raptors. T. & A. D. Poyser, Berkhamsted, UK.Newton, I., Marquiss, M., 1982. Fidelity to breeding area and mate in Sparrowhawks
Accipiter nisus. Journal of Animal Ecology 51, 327–341.Olsen, P.D., Olsen, J., 1989. Breeding of the peregrine falcon Falco peregrinus III.
Weather, nest quality and breeding success. Emu 89, 6–14.Oro, D., Margalida, A., Carrete, M., Heredia, R., Donázar, J.A., 2008. Testing the
goodness of supplementary feeding to enhance population viability in anendangered vulture. PloS ONE 3 (12), e4084. doi:10.1371/journal.pone.0004084.
Park, K.J., Graham, K.E., Calladine, J., Wernham, C.W., 2008. Impacts of birds of preyon gamebirds in the UK: a review. Ibis 150, 9–26.
Perry, M., Hollis, D., 2005. The generation of monthly gridded datasets for a range ofclimatic variables over the United Kingdom. International Journal ofClimatology 25, 1041–1054.
Phillips, J., 1990. ‘Buffer’ feeding of raptors. In: The Heather Trust (Ed.), AnnualReport 1990. The Heather Trust, Kippen, UK.
Pulliam, H.R., 1988. Sources, sinks, and population regulation. American Naturalist132, 652–661.
Ratcliffe, D., 1993. The Peregrine Falcon. second ed. T & A. D. Poyser, London, UK.Redpath, S., Amar, A., Smith, A., Thompson, D., Thirgood, S., 2010. People and nature
in conflict: can we reconcile raptor conservation and game management? In:Baxter, J., Galbraith, C.A. (Eds.), Species Management: Challenges and Solutionfor the 21st Century. The Stationary Office, Edinburgh.
Redpath, S.M., Thirgood, S.J., 1999. Numerical and functional responses in generalistpredators: hen harriers and peregrines on Scottish grouse moors. Journal ofAnimal Ecology 68, 879–892.
Redpath, S.M., Thirgood, S.J., Leckie, F.M., 2001. Does supplementary feeding reducepredation of red grouse by hen harriers. Journal of Applied Ecology 38, 1157–1168.
Redpath, S.M., Thirgood, S.J., Clarke, R., 2002a. Field vole Microtus agrestisabundance and Hen harrier Circus cyaneus diet and breeding in Scotland. Ibis144, 33–38.
Redpath, S.M., Arroyo, B.E., Etheridge, B., Leckie, F., Bouwman, K., Thirgood, S.J.,2002b. Temperature and hen harrier productivity: from local mechanisms togeographical patterns. Ecography 25, 533–540.
Real, J., Manosa, S., 1997. Demography and conservation of Western EuropeanBonelli’s eagle Hieraaetus fasciatus populations. Biological Conservation 79, 59–66.
Rodriguez, A., Delibes, M., 2004. Patterns and causes of nonnatural mortality in theIberian lynx during a 40 year period of range contraction. BiologicalConservation 118, 151–161.
RSPB, 2010. Birdcrime 2009. RSPB Report, Sandy, Bedfordshire, United Kingdom.SAS Institute Inc., 2004. SAS/STAT 9.1 User’s Guide. SAS Institute Inc., Cary, NC.Sim, I.M.W., Dillon, I.A., Eaton, M.A., Etheridge, B., Lindley, P., Riley, H., Saunders, R.,
Sharpe, C., Tickner, M., 2007. Status of the Hen Harrier Circus cyaneus in the UKand the Isle of Man in 2004, and a comparison with the 1988/89 and 1998surveys. Bird study 54, 256–267.
Smart, J., Amar, A., Sim, I.M.W, Etheridge, B., Cameron, D., Christie, G., Wilson, J.D.,2010. Illegal killing slows population recovery of a re-introduced raptor of highconservation concern – the red kite Milvus milvus. Biological Conservation 143,1278–1286.
Sotherton, N., Tapper, S., Smith, A., 2009. Hen harriers and red grouse: economicaspects of red grouse shooting and the implications for moorland conservation.Journal of Applied Ecology 46, 955–960.
Steenhof, K., Newton, I., 2007. Assessing nesting success and productivity. In: Bird,D.M., Bildstein, K.L. (Eds.), Raptor Research and Management Techniques.Hancock House Publishers, Blaine, Washington.
Tordoff, H.B., Redig, P.T., 1997. Midwest peregrine falcon demography, 1982–1995.Journal of Raptor Research 31, 339–346.
Tharme, A.P., Green, R.E., Baines, D., Bainbridge, I.P., O’Brien, M., 2001. The effect ofmanagement for red grouse shooting on the population density of breedingbirds on heather-dominated moorland. Journal of Applied Ecology 38, 439–457.
Thirgood, S., Redpath, S., Newton, I., Hudson, P., 2000. Raptors and red grouse:conservation conflicts and management solutions. Conservation Biology 14, 95–104.
Thirgood, S., Redpath, S., 2008. Hen harriers and red grouse: science, politics andhuman-wildlife conflict. Journal of Applied Ecology 45, 1550–1554.
Thompson, P., Amar, A., Hoccom, D.G., Knott, J., Wilson, J.D., 2009. Resolving theconflict between driven-grouse shooting and conservation of hen harriers.Journal of Applied Ecology 46, 950–954.
Valkama, J., Korpimäki, E., Arroyo, B., Beja, P., Bretagnolle, V., Bro., E., Kenward, R.,Mañosa, S., Redpath, S.M., Thirgood, S., Viñuela, J., 2005. Birds of prey as limitingfactors of gamebird populations in Europe: a review. Biology Reviews 80, 171–203.
Villafuerte, R., Viñuela, J., Blanco, J.C., 1998. Extensive predator persecution causedby crash in a game species: the case of Red Kites and Rabbits in Spain. BiologicalConservation 84, 181–188.
Wernham, C.V., Etheridge, B., Holling, M., Riddle, G., Riley, H.T., Stirling-Aird, P.K.,Stroud, D., Thompson, D.B.A., Wilson, J., 2008. The Scottish Raptor MonitoringScheme: objectives, achievements in the first four years, and plans for futuredevelopment. Ambio 37, 460–465.
Wichmann, M.C., Jeltsch, W., Dean, W.R.J., Moloney, K.A., Wissel, C., 2003.Implications of climate change for the persistence of raptors in arid savanna.Oikos 102, 186–202.
Whitfield, D.P., McLeod, D.R.A., Watson, J., Fielding, A.H., Howarth, P.F., 2003. Theassociation of grouse moor in Scotland with the illegal use of poisons to controlpredators. Biological Conservation 114, 157–163.
Whitfield, D.P., Fielding, A.H., McLeod, D.R.A., Howarth, P.F., 2004a. Modelling theeffects of persecution on the population dynamics of golden eagles in Scotland.Biological Conservation 119, 319–333.
Whitfield, D.P., Fielding, A.H., Mcleod, D.R.A., Haworth, P.F., 2004b. The effects ofpersecution on age of breeding and territory occupation in golden eagles inScotland. Biological Conservation 118, 249–259.
Whitfield, D.P., Fieldign, A.H., McLeod, D.R.A., Howarth, P.F., Watson, J., 2006. Aconservation framework for the golden eagle in Scotland: refining conditiontargets and assessment of constraint influences. Biological Conservation 130,465–480.
Whitfield, D.P., Fielding, A.H., Whitehead, S., 2008. Long-term increase in thefecundity of hen harriers in Wales is explained by reduced human interferenceand warmer weather. Animal Conservation 11, 144–152.
Whitfield, D.P., McLeod, D.R.A., Watson, J., Fielding, A.H., Haworth, P.F., 2003. Theassociation of grouse moor in Scotland with the illegal use of poisons to controlpredators. Biological Conservation 114, 157–163.
Wellsmith, M., 2011. Wildlife crime: the problems of enforcement. EuropeanJournal on Criminal Policy Research 17, 125–148.
94 A. Amar et al. / Biological Conservation 145 (2012) 86–94