alvarez blanco11limnology
TRANSCRIPT
RESEARCH PAPER
Spatiotemporal changes in diatom ecological profiles:implications for biomonitoring
Irene Alvarez-Blanco • Cristina Cejudo-Figueiras •
Eloy Becares • Saul Blanco
Received: 1 July 2010 / Accepted: 5 September 2010 / Published online: 29 September 2010
� The Japanese Society of Limnology 2010
Abstract Diatom indices developed in certain geographic
regions are frequently used elsewhere, despite the strong
evidence that such metrics are less useful when applied in
regions other than that where species–environment rela-
tionships were originally assessed, showing that species
have particular autoecological requirements in different
geographic areas. In this study, we define the ecological
profiles for selected environmental variables in three
common epilithic diatom species in the Duero Basin (NW
Spain), comparing our results with data gathered from
different geographic regions. We assess differences in
autoecological parameters obtained from the northern and
southern subbasins, and from different years, in order to
observe whether significant small-scale, spatiotemporal
changes exist. Our results show that there are variations
in species’ autoecological parameters between different
regions. Furthermore, there are significant changes com-
paring northern and southern Duero subbasins for certain
species and physiochemical variables. Additionally, dif-
ferent autoecologies have been observed for certain di-
atoms and environmental factors comparing two different
years. It can be concluded that freshwater diatom auto-
ecologies can vary between different geographic areas. This
implies that, in order to improve water-quality bioassess-
ments, autoecology-based diatom metrics should be
developed by quantifying species distributions along
environmental gradients, using datasets representative of
the areas or river types where the metrics will be applied.
Keywords Autoecology � Response curves �Bioindicators � Ecological indices
Introduction
Diatoms have been widely used for water quality assess-
ment in rivers and lakes around the world, considering their
sensitivity to water physical and chemical parameters,
especially pH, conductivity, nutrient concentration, organic
matter, and dissolved oxygen (e.g., Eloranta and Soininen
2002; Blanco et al. 2004; Levkov et al. 2007). Diatom
metrics allow numeric values to be assigned as measures of
the response of species to abiotic factors to obtain a
quantitative water quality bioassessment (Pan et al. 1996;
Rott et al. 1997; Potapova et al. 2004). Two major
advantages of turning diatoms into good indicator organ-
isms are their wide geographical distribution and the well-
known autoecology of most species. However, the question
of whether diatom-based metrics developed for a specific
area could be applied to other regions has been poorly
explored. Several studies carried out in the Iberian Penin-
sula have demonstrated that the specific pollution index
(SPI), developed for Central European watercourses, is an
effective tool for water quality assessment in Mediterra-
nean streams (Almeida 2001; Goma et al. 2004; Blanco
et al. 2008).
Nevertheless, different studies emphasize the impor-
tance of the ecological indicator values that each taxon
exhibits in its natural habitat (Rimet et al. 2004; Charles
et al. 2006). Particularly, there is evidence that an index
related to a particular geographic region is less effective
when applied elsewhere (Pipp 2002). This is due not only
to the diverse floristic spectra found in areas where the
index is applied, but also to environmental differences
I. Alvarez-Blanco � C. Cejudo-Figueiras � E. Becares �S. Blanco (&)
Department of Biodiversity and Environmental Management,
University of Leon, 24071 Leon, Spain
e-mail: [email protected]
123
Limnology (2011) 12:157–168
DOI 10.1007/s10201-010-0333-1
between zones that modify species response to water
physical and chemical variables. Therefore, if ecological
profiles depend on environmental characteristics, this puts
at risk any plausible extrapolation of indices. This study
focuses on checking this hypothesis and warning about the
possible problematics of indices extrapolation. We define
the ecological profile of three common epilithic diatom
species in the Duero Basin (NW Spain) for selected envi-
ronmental variables, comparing our results with data
gathered from different geographic regions. Furthermore,
we compare the autoecological values obtained from dif-
ferent regions within this basin, and from different years, to
assess the presence of significant changes at small spatio-
temporal scales.
Materials and methods
Study area
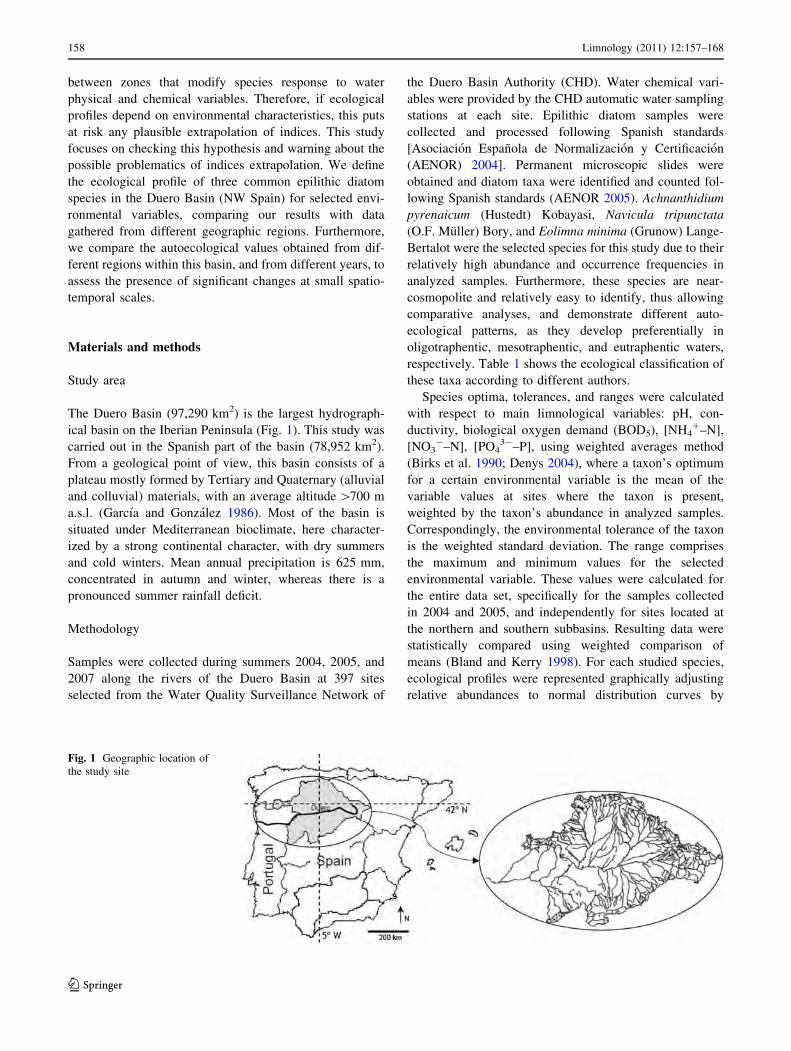
The Duero Basin (97,290 km2) is the largest hydrograph-
ical basin on the Iberian Peninsula (Fig. 1). This study was
carried out in the Spanish part of the basin (78,952 km2).
From a geological point of view, this basin consists of a
plateau mostly formed by Tertiary and Quaternary (alluvial
and colluvial) materials, with an average altitude [700 m
a.s.l. (Garcıa and Gonzalez 1986). Most of the basin is
situated under Mediterranean bioclimate, here character-
ized by a strong continental character, with dry summers
and cold winters. Mean annual precipitation is 625 mm,
concentrated in autumn and winter, whereas there is a
pronounced summer rainfall deficit.
Methodology
Samples were collected during summers 2004, 2005, and
2007 along the rivers of the Duero Basin at 397 sites
selected from the Water Quality Surveillance Network of
the Duero Basin Authority (CHD). Water chemical vari-
ables were provided by the CHD automatic water sampling
stations at each site. Epilithic diatom samples were
collected and processed following Spanish standards
[Asociacion Espanola de Normalizacion y Certificacion
(AENOR) 2004]. Permanent microscopic slides were
obtained and diatom taxa were identified and counted fol-
lowing Spanish standards (AENOR 2005). Achnanthidium
pyrenaicum (Hustedt) Kobayasi, Navicula tripunctata
(O.F. Muller) Bory, and Eolimna minima (Grunow) Lange-
Bertalot were the selected species for this study due to their
relatively high abundance and occurrence frequencies in
analyzed samples. Furthermore, these species are near-
cosmopolite and relatively easy to identify, thus allowing
comparative analyses, and demonstrate different auto-
ecological patterns, as they develop preferentially in
oligotraphentic, mesotraphentic, and eutraphentic waters,
respectively. Table 1 shows the ecological classification of
these taxa according to different authors.
Species optima, tolerances, and ranges were calculated
with respect to main limnological variables: pH, con-
ductivity, biological oxygen demand (BOD5), [NH4?–N],
[NO3-–N], [PO4
3-–P], using weighted averages method
(Birks et al. 1990; Denys 2004), where a taxon’s optimum
for a certain environmental variable is the mean of the
variable values at sites where the taxon is present,
weighted by the taxon’s abundance in analyzed samples.
Correspondingly, the environmental tolerance of the taxon
is the weighted standard deviation. The range comprises
the maximum and minimum values for the selected
environmental variable. These values were calculated for
the entire data set, specifically for the samples collected
in 2004 and 2005, and independently for sites located at
the northern and southern subbasins. Resulting data were
statistically compared using weighted comparison of
means (Bland and Kerry 1998). For each studied species,
ecological profiles were represented graphically adjusting
relative abundances to normal distribution curves by
Fig. 1 Geographic location of
the study site
158 Limnology (2011) 12:157–168
123
means of Levenberg–Marquardt nonlinear regression algo-
rithm (More 1977). Statistical analyses were performed using
Statistica 7.0 (StatSoft 2004).
Results
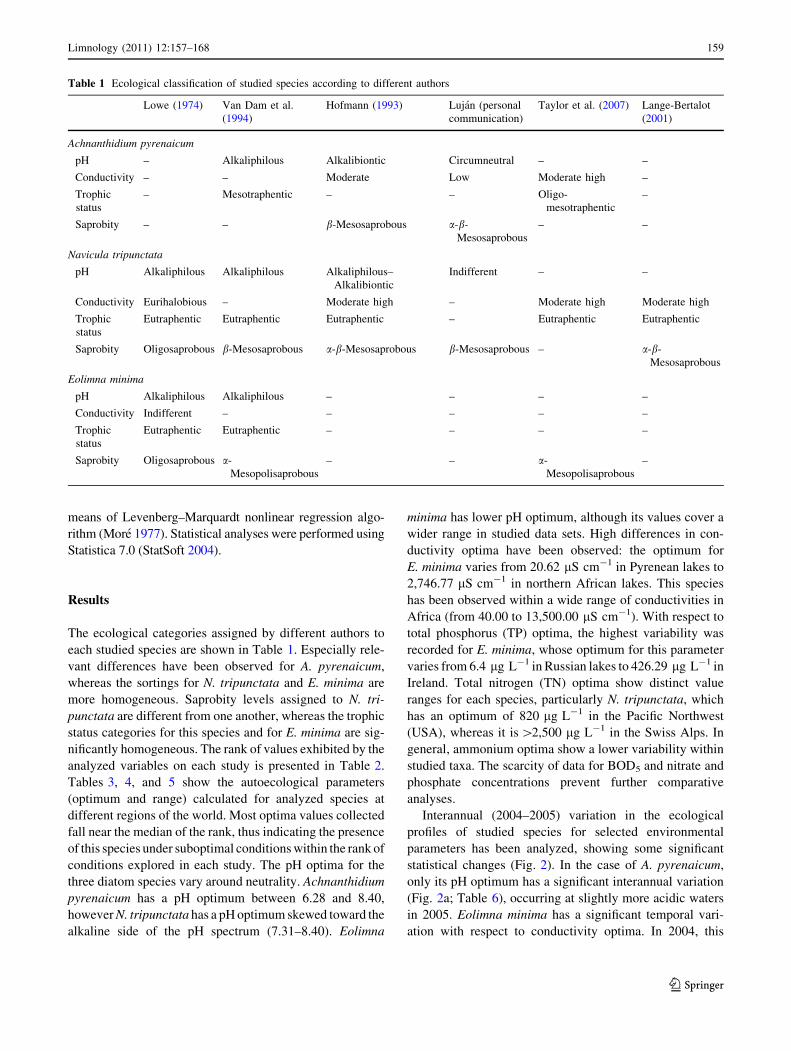
The ecological categories assigned by different authors to
each studied species are shown in Table 1. Especially rele-
vant differences have been observed for A. pyrenaicum,
whereas the sortings for N. tripunctata and E. minima are
more homogeneous. Saprobity levels assigned to N. tri-
punctata are different from one another, whereas the trophic
status categories for this species and for E. minima are sig-
nificantly homogeneous. The rank of values exhibited by the
analyzed variables on each study is presented in Table 2.
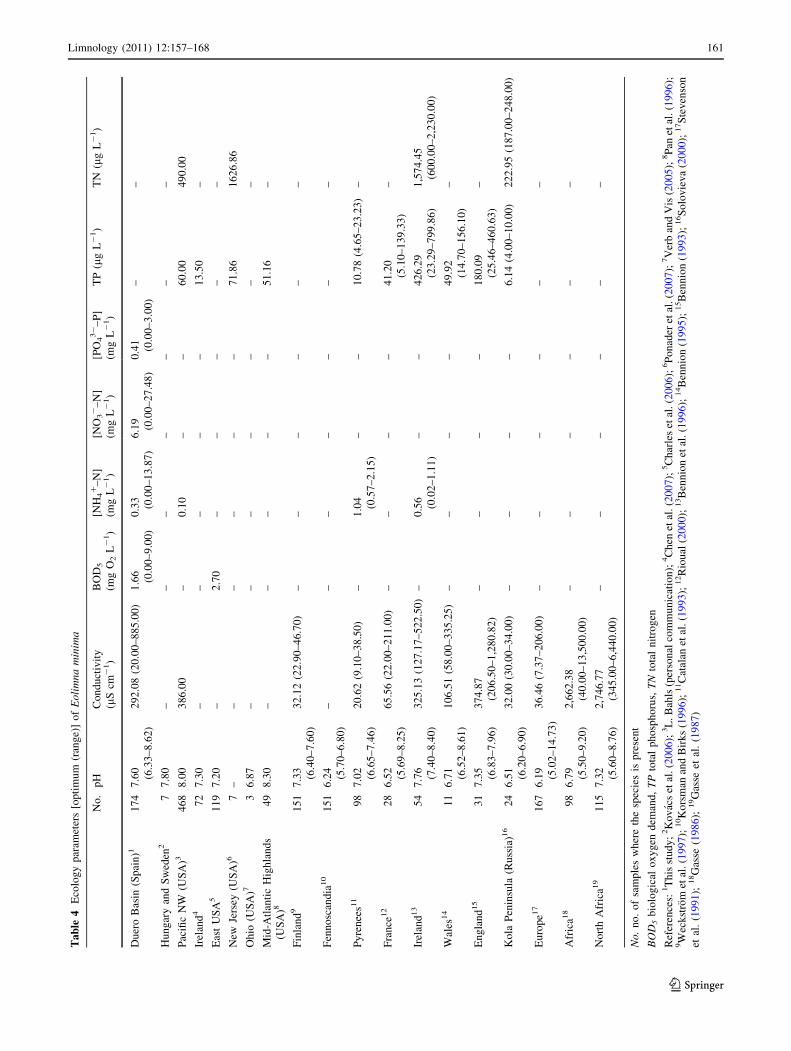
Tables 3, 4, and 5 show the autoecological parameters
(optimum and range) calculated for analyzed species at
different regions of the world. Most optima values collected
fall near the median of the rank, thus indicating the presence
of this species under suboptimal conditions within the rank of
conditions explored in each study. The pH optima for the
three diatom species vary around neutrality. Achnanthidium
pyrenaicum has a pH optimum between 6.28 and 8.40,
however N. tripunctata has a pH optimum skewed toward the
alkaline side of the pH spectrum (7.31–8.40). Eolimna
minima has lower pH optimum, although its values cover a
wider range in studied data sets. High differences in con-
ductivity optima have been observed: the optimum for
E. minima varies from 20.62 lS cm-1 in Pyrenean lakes to
2,746.77 lS cm-1 in northern African lakes. This species
has been observed within a wide range of conductivities in
Africa (from 40.00 to 13,500.00 lS cm-1). With respect to
total phosphorus (TP) optima, the highest variability was
recorded for E. minima, whose optimum for this parameter
varies from 6.4 lg L-1 in Russian lakes to 426.29 lg L-1 in
Ireland. Total nitrogen (TN) optima show distinct value
ranges for each species, particularly N. tripunctata, which
has an optimum of 820 lg L-1 in the Pacific Northwest
(USA), whereas it is [2,500 lg L-1 in the Swiss Alps. In
general, ammonium optima show a lower variability within
studied taxa. The scarcity of data for BOD5 and nitrate and
phosphate concentrations prevent further comparative
analyses.
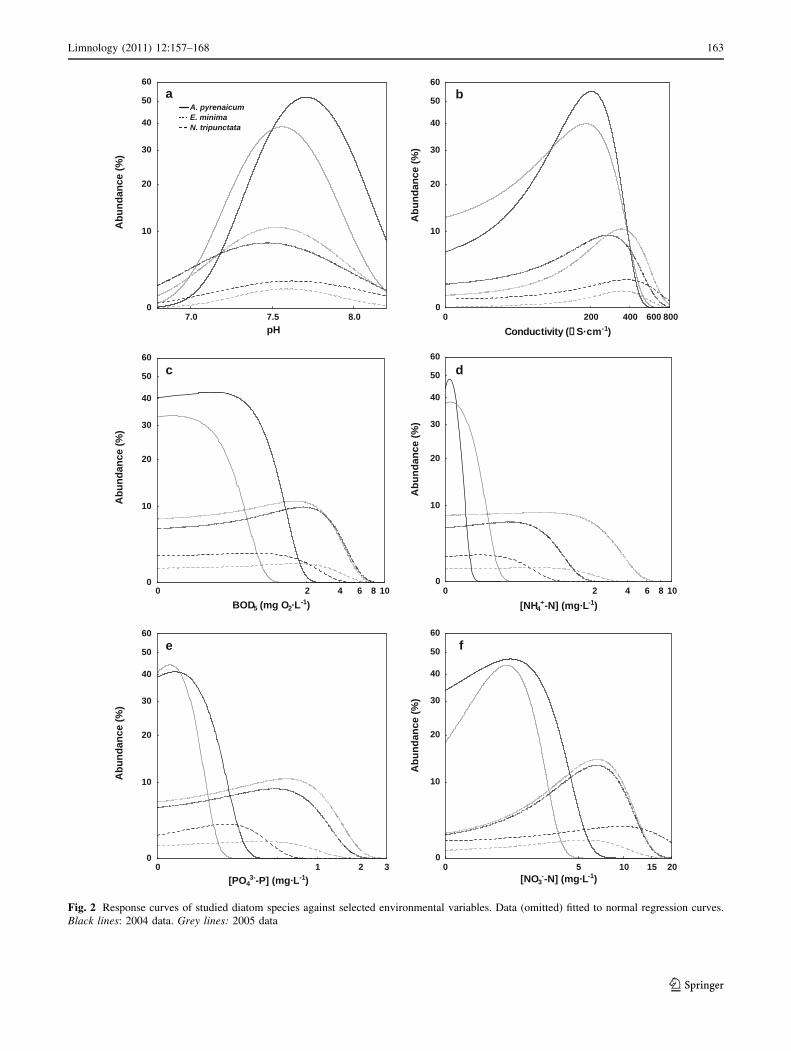
Interannual (2004–2005) variation in the ecological
profiles of studied species for selected environmental
parameters has been analyzed, showing some significant
statistical changes (Fig. 2). In the case of A. pyrenaicum,
only its pH optimum has a significant interannual variation
(Fig. 2a; Table 6), occurring at slightly more acidic waters
in 2005. Eolimna minima has a significant temporal vari-
ation with respect to conductivity optima. In 2004, this
Table 1 Ecological classification of studied species according to different authors
Lowe (1974) Van Dam et al.
(1994)
Hofmann (1993) Lujan (personal
communication)
Taylor et al. (2007) Lange-Bertalot
(2001)
Achnanthidium pyrenaicum
pH – Alkaliphilous Alkalibiontic Circumneutral – –
Conductivity – – Moderate Low Moderate high –
Trophic
status
– Mesotraphentic – – Oligo-
mesotraphentic
–
Saprobity – – b-Mesosaprobous a-b-
Mesosaprobous
– –
Navicula tripunctata
pH Alkaliphilous Alkaliphilous Alkaliphilous–
Alkalibiontic
Indifferent – –
Conductivity Eurihalobious – Moderate high – Moderate high Moderate high
Trophic
status
Eutraphentic Eutraphentic Eutraphentic – Eutraphentic Eutraphentic
Saprobity Oligosaprobous b-Mesosaprobous a-b-Mesosaprobous b-Mesosaprobous – a-b-
Mesosaprobous
Eolimna minima
pH Alkaliphilous Alkaliphilous – – – –
Conductivity Indifferent – – – – –
Trophic
status
Eutraphentic Eutraphentic – – – –
Saprobity Oligosaprobous a-
Mesopolisaprobous
– – a-
Mesopolisaprobous
–
Limnology (2011) 12:157–168 159
123
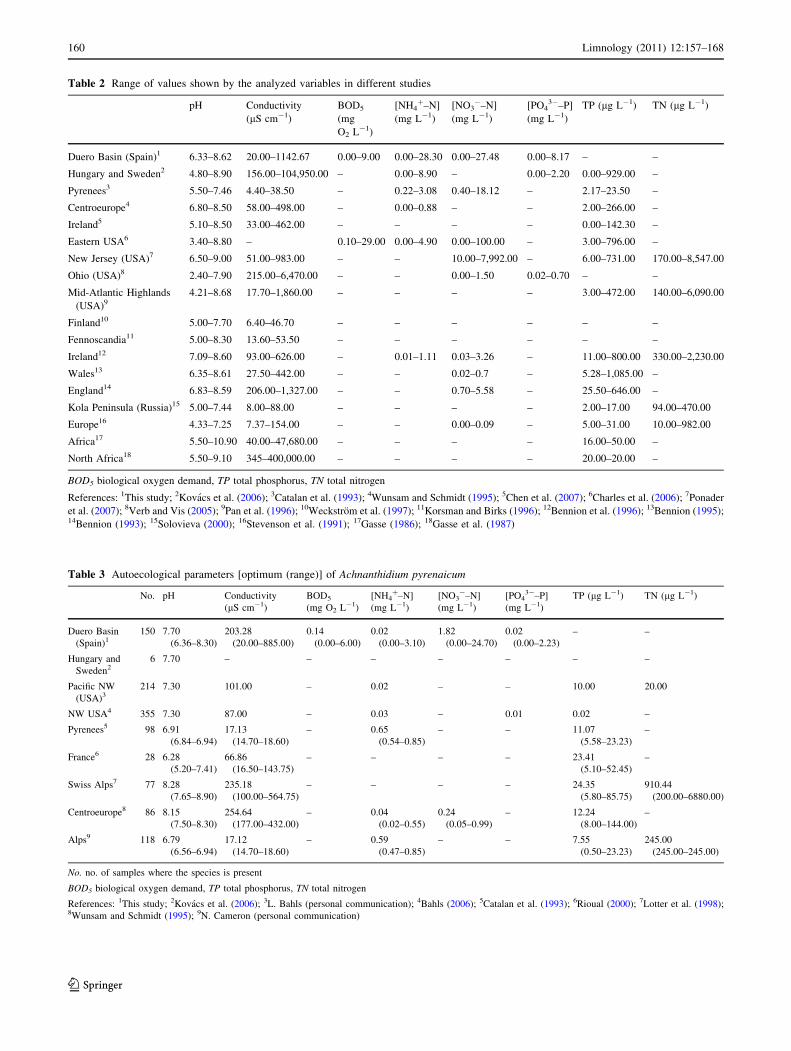
Table 2 Range of values shown by the analyzed variables in different studies
pH Conductivity
(lS cm-1)
BOD5
(mg
O2 L-1)
[NH4?–N]
(mg L-1)
[NO3-–N]
(mg L-1)
[PO43-–P]
(mg L-1)
TP (lg L-1) TN (lg L-1)
Duero Basin (Spain)1 6.33–8.62 20.00–1142.67 0.00–9.00 0.00–28.30 0.00–27.48 0.00–8.17 – –
Hungary and Sweden2 4.80–8.90 156.00–104,950.00 – 0.00–8.90 – 0.00–2.20 0.00–929.00 –
Pyrenees3 5.50–7.46 4.40–38.50 – 0.22–3.08 0.40–18.12 – 2.17–23.50 –
Centroeurope4 6.80–8.50 58.00–498.00 – 0.00–0.88 – – 2.00–266.00 –
Ireland5 5.10–8.50 33.00–462.00 – – – – 0.00–142.30 –
Eastern USA6 3.40–8.80 – 0.10–29.00 0.00–4.90 0.00–100.00 – 3.00–796.00 –
New Jersey (USA)7 6.50–9.00 51.00–983.00 – – 10.00–7,992.00 – 6.00–731.00 170.00–8,547.00
Ohio (USA)8 2.40–7.90 215.00–6,470.00 – – 0.00–1.50 0.02–0.70 – –
Mid-Atlantic Highlands
(USA)9
4.21–8.68 17.70–1,860.00 – – – – 3.00–472.00 140.00–6,090.00
Finland10 5.00–7.70 6.40–46.70 – – – – – –
Fennoscandia11 5.00–8.30 13.60–53.50 – – – – – –
Ireland12 7.09–8.60 93.00–626.00 – 0.01–1.11 0.03–3.26 – 11.00–800.00 330.00–2,230.00
Wales13 6.35–8.61 27.50–442.00 – – 0.02–0.7 – 5.28–1,085.00 –
England14 6.83–8.59 206.00–1,327.00 – – 0.70–5.58 – 25.50–646.00 –
Kola Peninsula (Russia)15 5.00–7.44 8.00–88.00 – – – – 2.00–17.00 94.00–470.00
Europe16 4.33–7.25 7.37–154.00 – – 0.00–0.09 – 5.00–31.00 10.00–982.00
Africa17 5.50–10.90 40.00–47,680.00 – – – – 16.00–50.00 –
North Africa18 5.50–9.10 345–400,000.00 – – – – 20.00–20.00 –
BOD5 biological oxygen demand, TP total phosphorus, TN total nitrogen
References: 1This study; 2Kovacs et al. (2006); 3Catalan et al. (1993); 4Wunsam and Schmidt (1995); 5Chen et al. (2007); 6Charles et al. (2006); 7Ponader
et al. (2007); 8Verb and Vis (2005); 9Pan et al. (1996); 10Weckstrom et al. (1997); 11Korsman and Birks (1996); 12Bennion et al. (1996); 13Bennion (1995);14Bennion (1993); 15Solovieva (2000); 16Stevenson et al. (1991); 17Gasse (1986); 18Gasse et al. (1987)
Table 3 Autoecological parameters [optimum (range)] of Achnanthidium pyrenaicum
No. pH Conductivity
(lS cm-1)
BOD5
(mg O2 L-1)
[NH4?–N]
(mg L-1)
[NO3-–N]
(mg L-1)
[PO43-–P]
(mg L-1)
TP (lg L-1) TN (lg L-1)
Duero Basin
(Spain)1150 7.70
(6.36–8.30)
203.28
(20.00–885.00)
0.14
(0.00–6.00)
0.02
(0.00–3.10)
1.82
(0.00–24.70)
0.02
(0.00–2.23)
– –
Hungary and
Sweden26 7.70 – – – – – – –
Pacific NW
(USA)3214 7.30 101.00 – 0.02 – – 10.00 20.00
NW USA4 355 7.30 87.00 – 0.03 – 0.01 0.02 –
Pyrenees5 98 6.91
(6.84–6.94)
17.13
(14.70–18.60)
– 0.65
(0.54–0.85)
– – 11.07
(5.58–23.23)
–
France6 28 6.28
(5.20–7.41)
66.86
(16.50–143.75)
– – – – 23.41
(5.10–52.45)
–
Swiss Alps7 77 8.28
(7.65–8.90)
235.18
(100.00–564.75)
– – – – 24.35
(5.80–85.75)
910.44
(200.00–6880.00)
Centroeurope8 86 8.15
(7.50–8.30)
254.64
(177.00–432.00)
– 0.04
(0.02–0.55)
0.24
(0.05–0.99)
– 12.24
(8.00–144.00)
–
Alps9 118 6.79
(6.56–6.94)
17.12
(14.70–18.60)
– 0.59
(0.47–0.85)
– – 7.55
(0.50–23.23)
245.00
(245.00–245.00)
No. no. of samples where the species is present
BOD5 biological oxygen demand, TP total phosphorus, TN total nitrogen
References: 1This study; 2Kovacs et al. (2006); 3L. Bahls (personal communication); 4Bahls (2006); 5Catalan et al. (1993); 6Rioual (2000); 7Lotter et al. (1998);8Wunsam and Schmidt (1995); 9N. Cameron (personal communication)
160 Limnology (2011) 12:157–168
123
Ta
ble
4E
colo
gy
par
amet
ers
[op
tim
um
(ran
ge)
]o
fE
oli
mn
am
inim
a
No
.p
HC
on
du
ctiv
ity
(lS
cm-
1)
BO
D5
(mg
O2
L-
1)
[NH
4?
–N
]
(mg
L-
1)
[NO
3-
–N
]
(mg
L-
1)
[PO
43-
–P
]
(mg
L-
1)
TP
(lg
L-
1)
TN
(lg
L-
1)
Du
ero
Bas
in(S
pai
n)1
17
47
.60
(6.3
3–
8.6
2)
29
2.0
8(2
0.0
0–
88
5.0
0)
1.6
6
(0.0
0–
9.0
0)
0.3
3
(0.0
0–
13
.87
)
6.1
9
(0.0
0–
27
.48
)
0.4
1
(0.0
0–
3.0
0)
––
Hu
ng
ary
and
Sw
eden
27
7.8
0–
––
––
––
Pac
ific
NW
(US
A)3
46
88
.00
38
6.0
0–
0.1
0–
–6
0.0
04
90
.00
Irel
and
47
27
.30
––
––
–1
3.5
0–
Eas
tU
SA
51
19
7.2
0–
2.7
0–
––
––
New
Jers
ey(U
SA
)67
––
––
––
71
.86
16
26
.86
Oh
io(U
SA
)73
6.8
7–
––
––
––
Mid
-Atl
anti
cH
igh
lan
ds
(US
A)8
49
8.3
0–
––
––
51
.16
–
Fin
lan
d9
15
17
.33
(6.4
0–
7.6
0)
32
.12
(22
.90
–4
6.7
0)
––
––
––
Fen
no
scan
dia
10
15
16
.24
(5.7
0–
6.8
0)
––
––
––
–
Py
ren
ees1
19
87
.02
(6.6
5–
7.4
6)
20
.62
(9.1
0–
38
.50
)–
1.0
4
(0.5
7–
2.1
5)
––
10
.78
(4.6
5–
23
.23
)–
Fra
nce
12
28
6.5
2
(5.6
9–
8.2
5)
65
.56
(22
.00
–2
11
.00
)–
––
–4
1.2
0
(5.1
0–
13
9.3
3)
–
Irel
and
13
54
7.7
6
(7.4
0–
8.4
0)
32
5.1
3(1
27
.17
–5
22
.50
)–
0.5
6
(0.0
2–
1.1
1)
––
42
6.2
9
(23
.29
–7
99
.86
)
1,5
74
.45
(60
0.0
0–
2,2
30
.00
)
Wal
es14
11
6.7
1
(6.5
2–
8.6
1)
10
6.5
1(5
8.0
0–
33
5.2
5)
––
––
49
.92
(14
.70
–1
56
.10
)
–
En
gla
nd
15
31
7.3
5
(6.8
3–
7.9
6)
37
4.8
7
(20
6.5
0–
1,2
80
.82
)
––
––
18
0.0
9
(25
.46
–4
60
.63
)
–
Ko
laP
enin
sula
(Ru
ssia
)16
24
6.5
1
(6.2
0–
6.9
0)
32
.00
(30
.00
–3
4.0
0)
––
––
6.1
4(4
.00
–1
0.0
0)
22
2.9
5(1
87
.00
–2
48
.00
)
Eu
rop
e17
16
76
.19
(5.0
2–
14
.73
)
36
.46
(7.3
7–
20
6.0
0)
––
––
––
Afr
ica1
89
86
.79
(5.5
0–
9.2
0)
2,6
62
.38
(40
.00
–1
3,5
00
.00
)
––
––
––
No
rth
Afr
ica1
91
15
7.3
2
(5.6
0–
8.7
6)
2,7
46
.77
(34
5.0
0–
6,4
40
.00
)
––
––
––
No
.n
o.
of
sam
ple
sw
her
eth
esp
ecie
sis
pre
sen
t
BO
D5
bio
log
ical
ox
yg
end
eman
d,
TP
tota
lp
ho
sph
oru
s,T
Nto
tal
nit
rog
en
Ref
eren
ces:
1T
his
stu
dy
;2K
ov
acs
etal
.(2
00
6);
3L
.B
ahls
(per
son
alco
mm
un
icat
ion
);4C
hen
etal
.(2
00
7);
5C
har
les
etal
.(2
00
6);
6P
on
ader
etal
.(2
00
7);
7V
erb
and
Vis
(20
05
);8P
anet
al.
(19
96
);9W
eck
stro
met
al.
(19
97
);10K
ors
man
and
Bir
ks
(19
96
);11C
atal
anet
al.
(19
93
);12R
iou
al(2
00
0);
13B
enn
ion
etal
.(1
99
6);
14B
enn
ion
(19
95
);15B
enn
ion
(19
93
);16S
olo
vie
va
(20
00
);17S
tev
enso
n
etal
.(1
99
1);
18G
asse
(19
86
);19G
asse
etal
.(1
98
7)
Limnology (2011) 12:157–168 161
123
species appears more frequently in sites with lower con-
ductivities than in 2005 (Fig. 2b; Table 6). Navicula
tripunctata seems to have larger fluctuations in its auto-
ecological preferences over time. Significant statistical
differences in its abundance from 2004 to 2005 were
observed for BOD5, ammonium, nitrate, and phosphate
concentrations (Fig. 2c–f; Table 6).
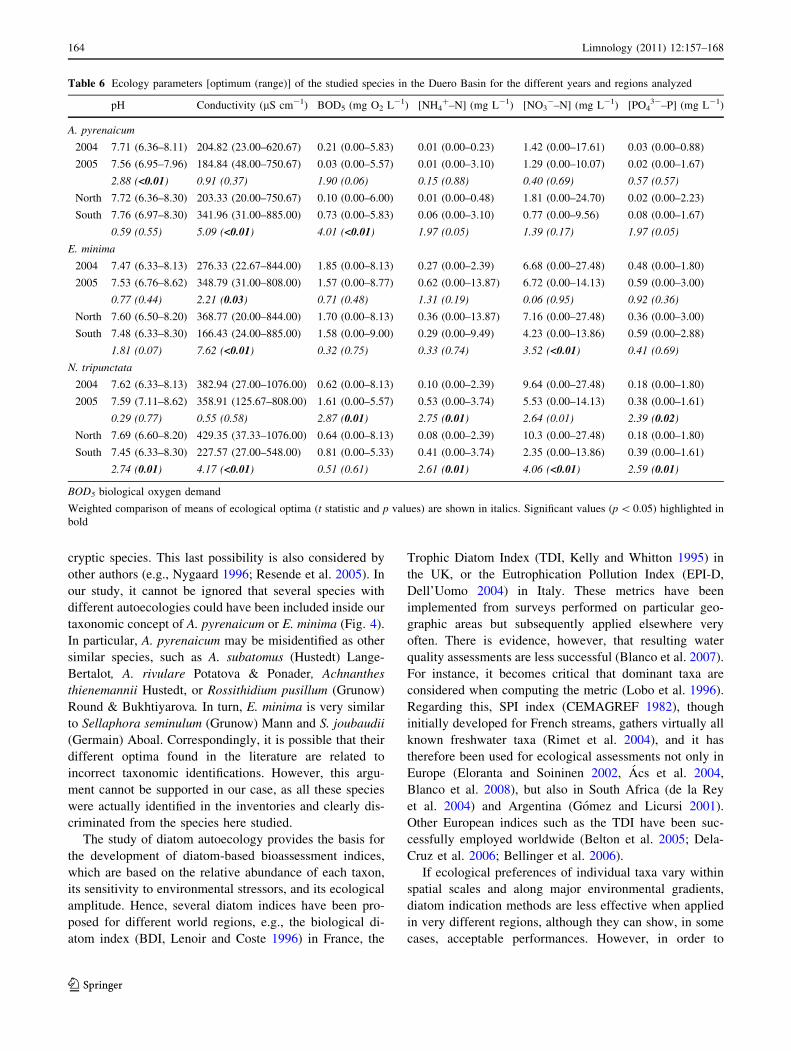
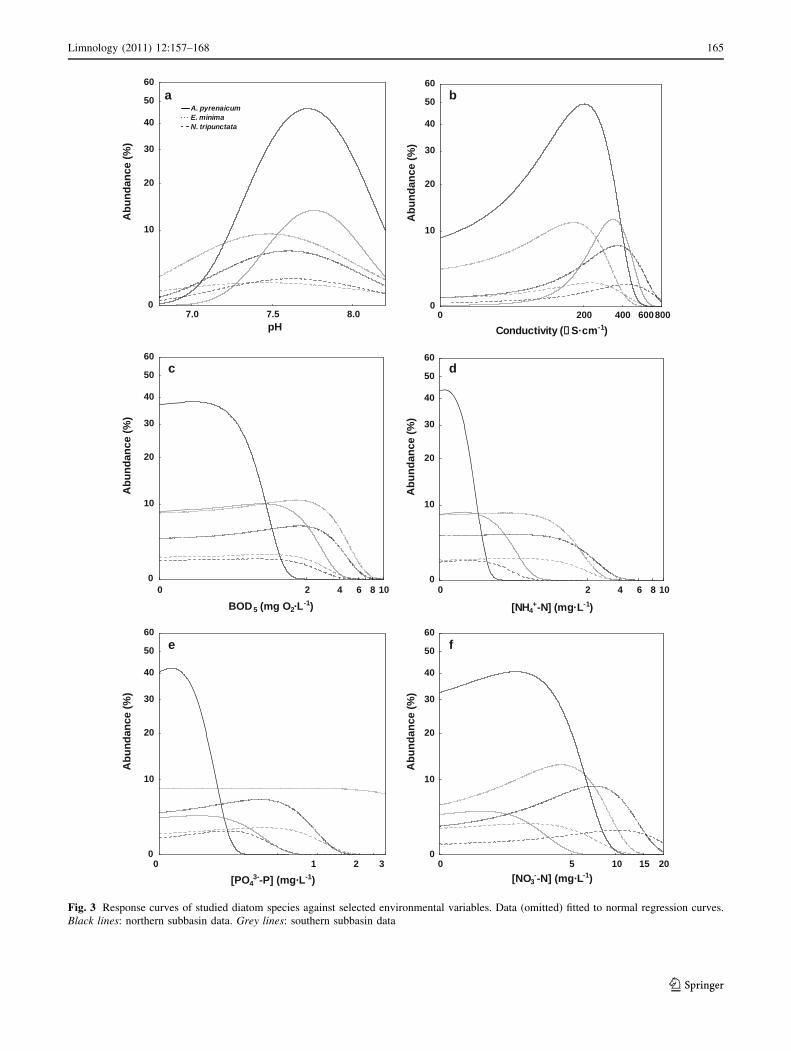
Likewise, intrabasin variations in the ecological profiles
were assessed. Achnanthidium pyrenaicum is more widely
distributed in the northern subbasin and, additionally, there
develops in waters with lower conductivities and BOD5
levels than in the southern subbasin. Only these parameters
demonstrated statistically significant differences between
both regions (Fig. 3b, c; Table 6). Significant spatial fluc-
tuations in the ecological profile of E. minima for nitrate
concentration and conductivity were observed (Fig. 3b, f;
Table 6). This species develops at lower levels of both
variables in the southern region. Finally, ecological pref-
erences at spatial scale of N. tripunctata have a significant
variation for most of the studied environmental parameters,
with the exception of BOD5 (Fig. 3c). This taxon does not
have clear preferences for particular pH levels or ammo-
nium and phosphate concentrations in the southern part of
the basin, though higher abundances of N. tripunctata at
lower levels of conductivity and nitrate concentrations
were observed in this region.
Discussion
Our results demonstrate both spatial and temporal vari-
abilities in the autoecological spectra of common and
widely distributed diatom species. Most of these variations
can be considered ecologically relevant, as they imply
changes in the autoecological classification of the species,
according to the criteria presented by several authors (e.g.,
Lowe 1974; Hofmann 1993; Van Dam et al. 1994). For
instance, the BOD5 optimum for N. tripunctata increased
up to 260% between 2004 and 2005, so that the species
shifted from indicating oligosaprobic to near b-mesosapr-
obic conditions.
Spatial variation has been assessed on a large scale
comparing remote geographic regions, and on a small
scale, evidencing significant differences within a single
hydrographic basin. Analogue results have been found in
other studies; e.g., patterns of diatom distribution against
several environmental variables were analyzed by Winter
and Duthie (2000) in streams from southern Ontario,
Canada. These authors observed how species optima and
tolerances vary geographically and between different hab-
itats. Charles et al. (2006) studied large-scale regional
variations in diatom–water chemistry relationships in rivers
of the eastern United States, addressing considerable geo-
graphic variations in the ecological characteristics of many
taxa.
In general, diatom ecological patterns are complex and
difficult to quantify and interpret, and consequently, pre-
cise ecological data should be calculated for each geo-
graphic region. The factors leading to such interregional
variability in diatom ecological profiles are several.
According to Charles et al. (2006), this could be due to the
presence of environmental variables differently restricting
the distribution of taxa in different regions, or to a certain
genetic variability related to the coexistence of different
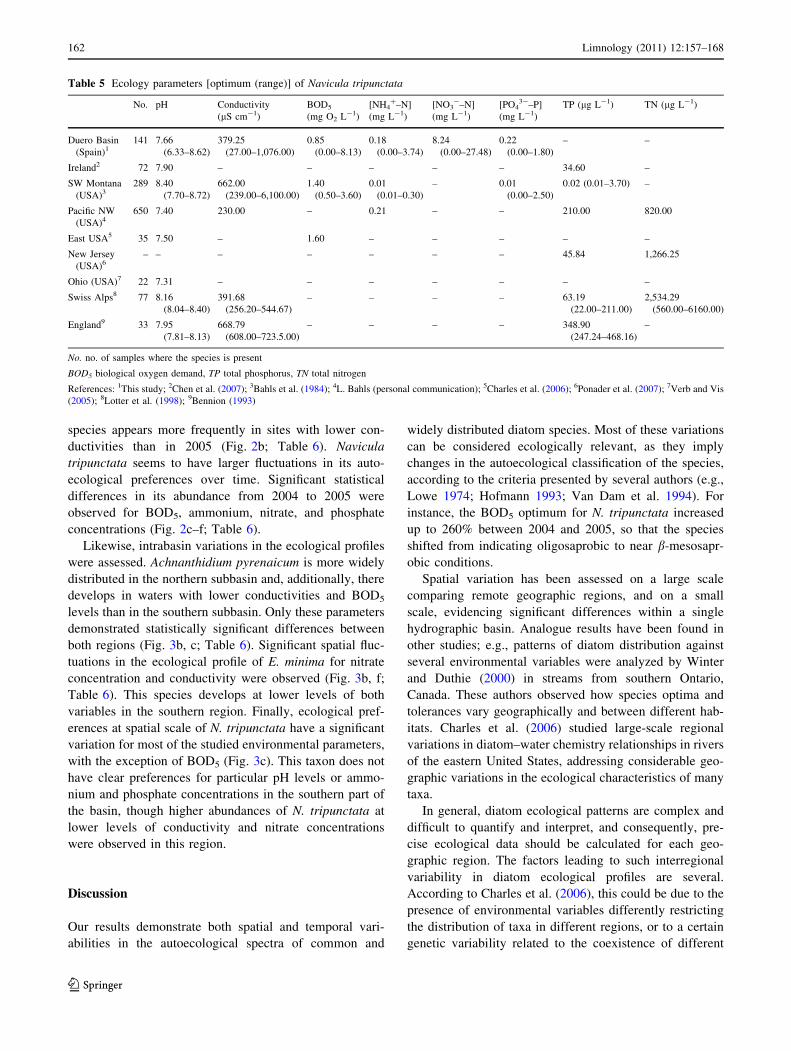
Table 5 Ecology parameters [optimum (range)] of Navicula tripunctata
No. pH Conductivity
(lS cm-1)
BOD5
(mg O2 L-1)
[NH4?–N]
(mg L-1)
[NO3-–N]
(mg L-1)
[PO43-–P]
(mg L-1)
TP (lg L-1) TN (lg L-1)
Duero Basin
(Spain)1141 7.66
(6.33–8.62)
379.25
(27.00–1,076.00)
0.85
(0.00–8.13)
0.18
(0.00–3.74)
8.24
(0.00–27.48)
0.22
(0.00–1.80)
– –
Ireland2 72 7.90 – – – – – 34.60 –
SW Montana
(USA)3289 8.40
(7.70–8.72)
662.00
(239.00–6,100.00)
1.40
(0.50–3.60)
0.01
(0.01–0.30)
– 0.01
(0.00–2.50)
0.02 (0.01–3.70) –
Pacific NW
(USA)4650 7.40 230.00 – 0.21 – – 210.00 820.00
East USA5 35 7.50 – 1.60 – – – – –
New Jersey
(USA)6– – – – – – – 45.84 1,266.25
Ohio (USA)7 22 7.31 – – – – – – –
Swiss Alps8 77 8.16
(8.04–8.40)
391.68
(256.20–544.67)
– – – – 63.19
(22.00–211.00)
2,534.29
(560.00–6160.00)
England9 33 7.95
(7.81–8.13)
668.79
(608.00–723.5.00)
– – – – 348.90
(247.24–468.16)
–
No. no. of samples where the species is present
BOD5 biological oxygen demand, TP total phosphorus, TN total nitrogen
References: 1This study; 2Chen et al. (2007); 3Bahls et al. (1984); 4L. Bahls (personal communication); 5Charles et al. (2006); 6Ponader et al. (2007); 7Verb and Vis
(2005); 8Lotter et al. (1998); 9Bennion (1993)
162 Limnology (2011) 12:157–168
123
3210
[PO43--P] (mg·L-1)
0
10
20
30
40
50
60
Ab
un
dan
ce (
%)
7.0 7.5 8.0
pH
0
10
20
30
40
50
60
Ab
un
dan
ce (
%)
A. pyrenaicum E. minima N. tripunctata
8006004002000
Conductivity (µ S·cm-1)
0
10
20
30
40
50
60
Ab
un
dan
ce (
%)
1086420
[NH4+-N] (mg·L-1)
0
10
20
30
40
50
60
Ab
un
dan
ce (
%)
1086420
BOD5 (mg O2·L-1)
0
10
20
30
40
50
60
Ab
un
dan
ce (
%)
20151050[NO3
--N] (mg·L-1)
0
10
20
30
40
50
60
Ab
un
dan
ce (
%)
ba
dc
fe
Fig. 2 Response curves of studied diatom species against selected environmental variables. Data (omitted) fitted to normal regression curves.
Black lines: 2004 data. Grey lines: 2005 data
Limnology (2011) 12:157–168 163
123
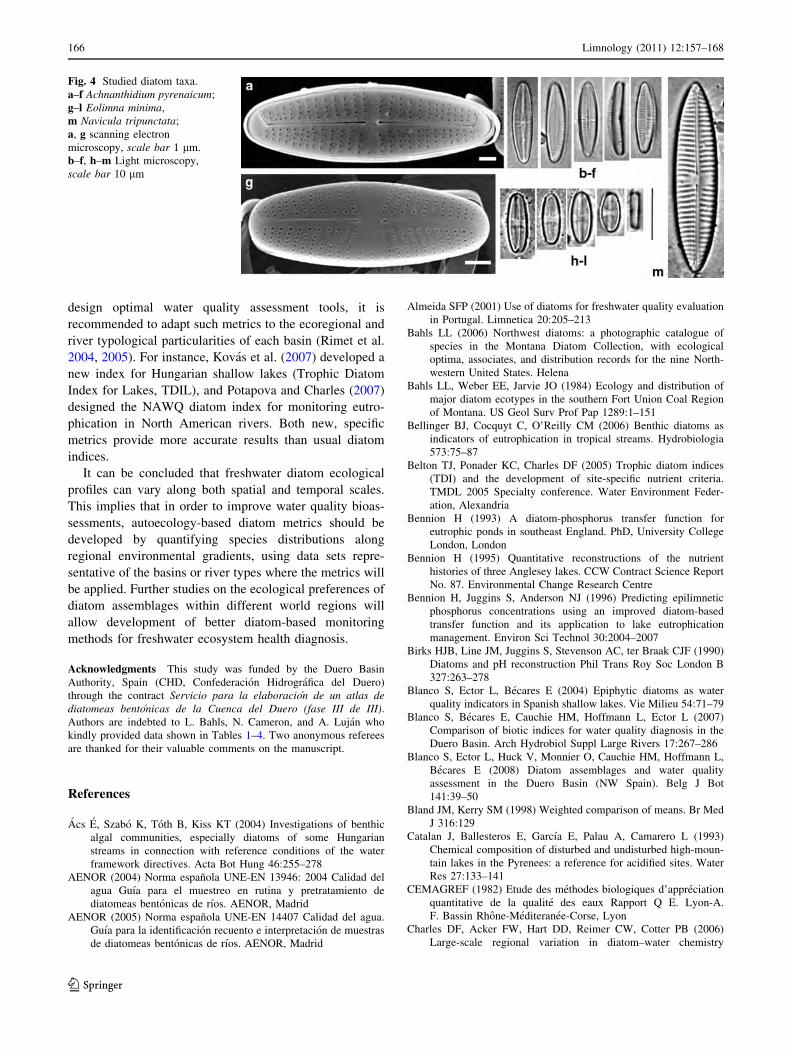
cryptic species. This last possibility is also considered by
other authors (e.g., Nygaard 1996; Resende et al. 2005). In
our study, it cannot be ignored that several species with
different autoecologies could have been included inside our
taxonomic concept of A. pyrenaicum or E. minima (Fig. 4).
In particular, A. pyrenaicum may be misidentified as other
similar species, such as A. subatomus (Hustedt) Lange-
Bertalot, A. rivulare Potatova & Ponader, Achnanthes
thienemannii Hustedt, or Rossithidium pusillum (Grunow)
Round & Bukhtiyarova. In turn, E. minima is very similar
to Sellaphora seminulum (Grunow) Mann and S. joubaudii
(Germain) Aboal. Correspondingly, it is possible that their
different optima found in the literature are related to
incorrect taxonomic identifications. However, this argu-
ment cannot be supported in our case, as all these species
were actually identified in the inventories and clearly dis-
criminated from the species here studied.
The study of diatom autoecology provides the basis for
the development of diatom-based bioassessment indices,
which are based on the relative abundance of each taxon,
its sensitivity to environmental stressors, and its ecological
amplitude. Hence, several diatom indices have been pro-
posed for different world regions, e.g., the biological di-
atom index (BDI, Lenoir and Coste 1996) in France, the
Trophic Diatom Index (TDI, Kelly and Whitton 1995) in
the UK, or the Eutrophication Pollution Index (EPI-D,
Dell’Uomo 2004) in Italy. These metrics have been
implemented from surveys performed on particular geo-
graphic areas but subsequently applied elsewhere very
often. There is evidence, however, that resulting water
quality assessments are less successful (Blanco et al. 2007).
For instance, it becomes critical that dominant taxa are
considered when computing the metric (Lobo et al. 1996).
Regarding this, SPI index (CEMAGREF 1982), though
initially developed for French streams, gathers virtually all
known freshwater taxa (Rimet et al. 2004), and it has
therefore been used for ecological assessments not only in
Europe (Eloranta and Soininen 2002, Acs et al. 2004,
Blanco et al. 2008), but also in South Africa (de la Rey
et al. 2004) and Argentina (Gomez and Licursi 2001).
Other European indices such as the TDI have been suc-
cessfully employed worldwide (Belton et al. 2005; Dela-
Cruz et al. 2006; Bellinger et al. 2006).
If ecological preferences of individual taxa vary within
spatial scales and along major environmental gradients,
diatom indication methods are less effective when applied
in very different regions, although they can show, in some
cases, acceptable performances. However, in order to
Table 6 Ecology parameters [optimum (range)] of the studied species in the Duero Basin for the different years and regions analyzed
pH Conductivity (lS cm-1) BOD5 (mg O2 L-1) [NH4?–N] (mg L-1) [NO3
-–N] (mg L-1) [PO43-–P] (mg L-1)
A. pyrenaicum
2004 7.71 (6.36–8.11) 204.82 (23.00–620.67) 0.21 (0.00–5.83) 0.01 (0.00–0.23) 1.42 (0.00–17.61) 0.03 (0.00–0.88)
2005 7.56 (6.95–7.96) 184.84 (48.00–750.67) 0.03 (0.00–5.57) 0.01 (0.00–3.10) 1.29 (0.00–10.07) 0.02 (0.00–1.67)
2.88 (<0.01) 0.91 (0.37) 1.90 (0.06) 0.15 (0.88) 0.40 (0.69) 0.57 (0.57)
North 7.72 (6.36–8.30) 203.33 (20.00–750.67) 0.10 (0.00–6.00) 0.01 (0.00–0.48) 1.81 (0.00–24.70) 0.02 (0.00–2.23)
South 7.76 (6.97–8.30) 341.96 (31.00–885.00) 0.73 (0.00–5.83) 0.06 (0.00–3.10) 0.77 (0.00–9.56) 0.08 (0.00–1.67)
0.59 (0.55) 5.09 (<0.01) 4.01 (<0.01) 1.97 (0.05) 1.39 (0.17) 1.97 (0.05)
E. minima
2004 7.47 (6.33–8.13) 276.33 (22.67–844.00) 1.85 (0.00–8.13) 0.27 (0.00–2.39) 6.68 (0.00–27.48) 0.48 (0.00–1.80)
2005 7.53 (6.76–8.62) 348.79 (31.00–808.00) 1.57 (0.00–8.77) 0.62 (0.00–13.87) 6.72 (0.00–14.13) 0.59 (0.00–3.00)
0.77 (0.44) 2.21 (0.03) 0.71 (0.48) 1.31 (0.19) 0.06 (0.95) 0.92 (0.36)
North 7.60 (6.50–8.20) 368.77 (20.00–844.00) 1.70 (0.00–8.13) 0.36 (0.00–13.87) 7.16 (0.00–27.48) 0.36 (0.00–3.00)
South 7.48 (6.33–8.30) 166.43 (24.00–885.00) 1.58 (0.00–9.00) 0.29 (0.00–9.49) 4.23 (0.00–13.86) 0.59 (0.00–2.88)
1.81 (0.07) 7.62 (<0.01) 0.32 (0.75) 0.33 (0.74) 3.52 (<0.01) 0.41 (0.69)
N. tripunctata
2004 7.62 (6.33–8.13) 382.94 (27.00–1076.00) 0.62 (0.00–8.13) 0.10 (0.00–2.39) 9.64 (0.00–27.48) 0.18 (0.00–1.80)
2005 7.59 (7.11–8.62) 358.91 (125.67–808.00) 1.61 (0.00–5.57) 0.53 (0.00–3.74) 5.53 (0.00–14.13) 0.38 (0.00–1.61)
0.29 (0.77) 0.55 (0.58) 2.87 (0.01) 2.75 (0.01) 2.64 (0.01) 2.39 (0.02)
North 7.69 (6.60–8.20) 429.35 (37.33–1076.00) 0.64 (0.00–8.13) 0.08 (0.00–2.39) 10.3 (0.00–27.48) 0.18 (0.00–1.80)
South 7.45 (6.33–8.30) 227.57 (27.00–548.00) 0.81 (0.00–5.33) 0.41 (0.00–3.74) 2.35 (0.00–13.86) 0.39 (0.00–1.61)
2.74 (0.01) 4.17 (<0.01) 0.51 (0.61) 2.61 (0.01) 4.06 (<0.01) 2.59 (0.01)
BOD5 biological oxygen demand
Weighted comparison of means of ecological optima (t statistic and p values) are shown in italics. Significant values (p \ 0.05) highlighted in
bold
164 Limnology (2011) 12:157–168
123
8006004002000
Conductivity (µ S·cm-1)
0
10
20
30
40
50
60
Ab
un
dan
ce (
%)
1086420
[NH4+-N] (mg·L-1)
0
10
20
30
40
50
60
Ab
un
dan
ce (
%)
20151050
[NO3--N] (mg·L-1)
0
10
20
30
40
50
60
Ab
un
dan
ce (
%)
3210
[PO43--P] (mg·L-1)
0
10
20
30
40
50
60
Ab
un
dan
ce (
%)
1086420
BOD5 (mg O2·L-1)
0
10
20
30
40
50
60
Ab
un
dan
ce (
%)
7.0 7.5 8.0pH
0
10
20
30
40
50
60
Ab
un
dan
ce (
%)
A. pyrenaicum E. minima N. tripunctata
ba
dc
fe
Fig. 3 Response curves of studied diatom species against selected environmental variables. Data (omitted) fitted to normal regression curves.
Black lines: northern subbasin data. Grey lines: southern subbasin data
Limnology (2011) 12:157–168 165
123
design optimal water quality assessment tools, it is
recommended to adapt such metrics to the ecoregional and
river typological particularities of each basin (Rimet et al.
2004, 2005). For instance, Kovas et al. (2007) developed a
new index for Hungarian shallow lakes (Trophic Diatom
Index for Lakes, TDIL), and Potapova and Charles (2007)
designed the NAWQ diatom index for monitoring eutro-
phication in North American rivers. Both new, specific
metrics provide more accurate results than usual diatom
indices.
It can be concluded that freshwater diatom ecological
profiles can vary along both spatial and temporal scales.
This implies that in order to improve water quality bioas-
sessments, autoecology-based diatom metrics should be
developed by quantifying species distributions along
regional environmental gradients, using data sets repre-
sentative of the basins or river types where the metrics will
be applied. Further studies on the ecological preferences of
diatom assemblages within different world regions will
allow development of better diatom-based monitoring
methods for freshwater ecosystem health diagnosis.
Acknowledgments This study was funded by the Duero Basin
Authority, Spain (CHD, Confederacion Hidrografica del Duero)
through the contract Servicio para la elaboracion de un atlas dediatomeas bentonicas de la Cuenca del Duero (fase III de III).Authors are indebted to L. Bahls, N. Cameron, and A. Lujan who
kindly provided data shown in Tables 1–4. Two anonymous referees
are thanked for their valuable comments on the manuscript.
References
Acs E, Szabo K, Toth B, Kiss KT (2004) Investigations of benthic
algal communities, especially diatoms of some Hungarian
streams in connection with reference conditions of the water
framework directives. Acta Bot Hung 46:255–278
AENOR (2004) Norma espanola UNE-EN 13946: 2004 Calidad del
agua Guıa para el muestreo en rutina y pretratamiento de
diatomeas bentonicas de rıos. AENOR, Madrid
AENOR (2005) Norma espanola UNE-EN 14407 Calidad del agua.
Guıa para la identificacion recuento e interpretacion de muestras
de diatomeas bentonicas de rıos. AENOR, Madrid
Almeida SFP (2001) Use of diatoms for freshwater quality evaluation
in Portugal. Limnetica 20:205–213
Bahls LL (2006) Northwest diatoms: a photographic catalogue of
species in the Montana Diatom Collection, with ecological
optima, associates, and distribution records for the nine North-
western United States. Helena
Bahls LL, Weber EE, Jarvie JO (1984) Ecology and distribution of
major diatom ecotypes in the southern Fort Union Coal Region
of Montana. US Geol Surv Prof Pap 1289:1–151
Bellinger BJ, Cocquyt C, O’Reilly CM (2006) Benthic diatoms as
indicators of eutrophication in tropical streams. Hydrobiologia
573:75–87
Belton TJ, Ponader KC, Charles DF (2005) Trophic diatom indices
(TDI) and the development of site-specific nutrient criteria.
TMDL 2005 Specialty conference. Water Environment Feder-
ation, Alexandria
Bennion H (1993) A diatom-phosphorus transfer function for
eutrophic ponds in southeast England. PhD, University College
London, London
Bennion H (1995) Quantitative reconstructions of the nutrient
histories of three Anglesey lakes. CCW Contract Science Report
No. 87. Environmental Change Research Centre
Bennion H, Juggins S, Anderson NJ (1996) Predicting epilimnetic
phosphorus concentrations using an improved diatom-based
transfer function and its application to lake eutrophication
management. Environ Sci Technol 30:2004–2007
Birks HJB, Line JM, Juggins S, Stevenson AC, ter Braak CJF (1990)
Diatoms and pH reconstruction Phil Trans Roy Soc London B
327:263–278
Blanco S, Ector L, Becares E (2004) Epiphytic diatoms as water
quality indicators in Spanish shallow lakes. Vie Milieu 54:71–79
Blanco S, Becares E, Cauchie HM, Hoffmann L, Ector L (2007)
Comparison of biotic indices for water quality diagnosis in the
Duero Basin. Arch Hydrobiol Suppl Large Rivers 17:267–286
Blanco S, Ector L, Huck V, Monnier O, Cauchie HM, Hoffmann L,
Becares E (2008) Diatom assemblages and water quality
assessment in the Duero Basin (NW Spain). Belg J Bot
141:39–50
Bland JM, Kerry SM (1998) Weighted comparison of means. Br Med
J 316:129
Catalan J, Ballesteros E, Garcıa E, Palau A, Camarero L (1993)
Chemical composition of disturbed and undisturbed high-moun-
tain lakes in the Pyrenees: a reference for acidified sites. Water
Res 27:133–141
CEMAGREF (1982) Etude des methodes biologiques d’appreciation
quantitative de la qualite des eaux Rapport Q E. Lyon-A.
F. Bassin Rhone-Mediteranee-Corse, Lyon
Charles DF, Acker FW, Hart DD, Reimer CW, Cotter PB (2006)
Large-scale regional variation in diatom–water chemistry
Fig. 4 Studied diatom taxa.
a–f Achnanthidium pyrenaicum;
g–l Eolimna minima,
m Navicula tripunctata;
a, g scanning electron
microscopy, scale bar 1 lm.
b–f, h–m Light microscopy,
scale bar 10 lm
166 Limnology (2011) 12:157–168
123
relationships: rivers of the eastern United States. Hydrobiologia
561:27–57
Chen G, Dalton C, Leira M, Taylor D (2007) Diatom-based total
phosphorus (TP) and pH transfer functions for the Irish
Ecoregion. J Paleolimnol 40:143–163
de la Rey PA, Taylor JC, Laas A, van Rensburg L, Vosloo A (2004)
Determining the possible application value of diatoms as
indicators of general water quality: a comparison with SASS 5.
Water SA 30:325–332
Dela-Cruz J, Pritchard T, Gordon G, Ajani P (2006) The use of
periphytic diatoms as a means of assessing impacts of point
source inorganic nutrient pollution in south-eastern Australia.
Freshw Biol 51:951–972
Dell’Uomo A (2004) L’Indice Diatomico de Eutrofizzacione/
Polluzione (EPI-D) nel monitoraggio delle acque correnti Linee
guida. APAT, Roma
Denys L (2004) Relation of abundance-weighted averages of diatom
indicator values to measured environmental conditions in
standing freshwater. Ecol Indic 4:255–275
Eloranta P, Soininen J (2002) Ecological status of some Finnish rivers
evaluated using benthic diatom communities. J Appl Phycol
14:1–7
Garcıa D, Gonzalez M (1986) Metodos biologicos para el estudio de
la calidad de las aguas aplicacion a la Cuenca del Duero.
Ministerio de agricultura pesca y alimentacion. ICONA, Madrid
Gasse F (1986) East African diatoms, taxonomy, ecological distribu-
tion. Biblioth Diatomol 11:1–202
Gasse F, Fontes JC, Plaziat JC, Carbonel P, Kaczmarska I, De Deckker
P, Soulie-Marsche I, Callot Y, Dupeuple PA (1987) Biological
remains, geochemistry and stable isotopes for the reconstruction
of environmental and hydrological changes in the Holocene lakes
from North Sahara. Palaeo Palaeo Palaeo 60:1–46
Goma J, Ortız R, Cambra J, Ector L (2004) Water quality evaluation
in Catalonian Mediterranean rivers using epilithic diatoms as
bioindicators. Vie Milieu 54:81–90
Gomez N, Licursi M (2001) The Pampean Diatom Index (IDP) for
assessment of rivers and streams in Argentina. Aquat Ecol
35:173–181
Hofmann G (1993) Aufwuchs-Diatomeen in Seen und ihre Eignung
als Indikatoren der Trophie. Biblioth Diatomol 30:1–241
Kelly MG, Whitton BA (1995) The Trophic Diatom Index: a new
index for monitoring eutrophication in rivers. J Appl Phycol
7:433–444
Korsman T, Birks HJB (1996) Diatom-based reconstruction from
northern Sweden: a comparison of reconstruction techniques.
J Paleolimnol 15:65–77
Kovacs C, Kahlert M, Padisak J (2006) Benthic diatom communities
along pH and TP gradients in Hungarian and Swedish streams.
J Appl Phycol 18:105–117
Kovas CS, Buczko K, Hajnal E, Padisak J (2007) Epiphytic, littoral
diatoms as bioindicators of shallow lake trophic status: trophic
diatom index for lakes (TDIL) developed in Hungary. Hydro-
biologia 589:141–154
Lange-Bertalot H (2001) Navicula sensu stricto, 10 genera separated
from Navicula sensu lato, Frustulia. Diatoms Eur 2:1–526
Lenoir A, Coste M (1996) Development of a practical diatom index of
overall water quality applicable to the French national water
board network. In: Whitton BA, Rott E (eds) Use of algae for
monitoring rivers II. Institut fur Botanik, Universitat Innsbruck,
Austria, pp 29–43
Levkov Z, Blanco S, Krstic S, Nakov T, Ector L (2007) Ecology of
benthic diatoms from Lake Macro Prespa (Macedonia). Arch
Hydrobiol Suppl Algol Stud 124:71–83
Lobo EA, Callegaro VL, Oliveira MA, Salomoni SE, Schuler S, Asai
K (1996) Pollution tolerant diatoms from lotic systems in the
Jacuı Basin, Rıo Grande do Sul, Brazil. Iherin Ser Bot 47:45–72
Lotter AF, Birks HJB, Hofmann W, Marchetto A (1998) Modern
diatom, cladocera, chironomid, and chrysophyte cyst assem-
blages as quantitative indicators for the reconstruction of past
environmental conditions in the Alps, II, nutrients. J Paleolimno-
limnol 19:443–463
Lowe RL (1974) Environmental requirements and pollution tolerance
of freshwater diatoms. US Environmental Protection Agency,
Cincinnati
More JJ (1977) The Levenberg–Marquardt Algorithm: implementa-
tion and theory. In: Watson GA (ed) Lecture notes in mathe-
matics 630. Springer, Berlin, pp 105–116
Nygaard G (1996) Temporal and spatial development of individual
species of plankton algae from European lakes. Hydrobiologia
332:71–91
Pan Y, Stevenson RJ, Hill BH, Herlihy AT, Collins GB (1996) Using
diatoms as indicators of ecological conditions in lotic systems:
a regional assessment. J N Am Benthol Soc 15:481–495
Pipp E (2002) A regional diatom-based trophic state indication
system for running water sites in Upper Austria an its over
regional applicability. Verh Internat Verein Limnol 27:3376–
3380
Ponader KC, Charles DF, Belton TJ (2007) Diatom-based TP and TN
inference models and indices for monitoring nutrient enrichment
of New Jersey streams. Ecol Indic 7:79–93
Potapova M, Charles DF (2007) Diatom metric for monitoring
eutrophication in rivers of the United States. Ecol Indic 7:48–70
Potapova M, Charles DF, Ponader KC, Winter DM (2004) Quanti-
fying species indicator values for trophic diatom indices:
comparison of approaches. Hydrobiologia 517:21–41
Resende P, Azeiteiro U, Pereira MJ (2005) Diatom ecological
preferences in a shallow temperate estuary (Rıa de Aveiro,
Western Portugal). Hydrobiologia 544:77–88
Rimet F, Ector L, Cauchie HM, Hoffmann L (2004) Regional
distribution of diatom assemblages in the headwater streams of
Luxembourg. Hydrobiologia 520:105–117
Rimet F, Cauchie HM, Hoffmann L, Ector L (2005) Response of
diatom indices to simulated water quality improvements in a
river. J Appl Phycol 17:119–128
Rioual P (2000) Diatom assemblages and water chemistry of lakes in
the French Massif Central: a methodology for reconstruction of
past limnological and climate fluctuations during the Eemian
period. Thesis, University College, London
Rott E, Hofmann G, Pall K, Pfister P, Pipp E (1997) Indikationslisten
fur Aufwuchsalgen in osterreichischen Fliebgewassern. Teil 1:
Saprobielle Indikation. Wasserwirtschaftskataster, Bundesminis-
terium f. Land-u. Forstwirtschaft, Wien
Solovieva N (2000) A palaeoecological study of Holocene environ-
mental change in a small upland lake from the Kola peninsula,
Russia. PhD, University of London, London
StatSoft Inc (2004) STATISTICA (data analysis software system),
version 7
Stevenson AC, Juggins S, Birks HJB, Anderson DS, Anderson NJ,
Battarbee RW, Berge F, Davis RB, Flower RJ, Haworth EY,
Jones VJ, Kingston JC, Kreiser AM, Line JM, Munro M,
Renberg I (1991) The surface waters acidification project
palaeolimnology programme: modern diatom/lake-water chem-
istry data-set. ENSIS Ltd., London
Taylor JC, Harding WR, Archibald GM (2007) An illustrated guide to
some common diatom species from South Africa. WRC Report
TT 282/07, Pretoria
Van Dam H, Mertens A, Sinkeldam J (1994) A coded checklist and
ecological indicator values of freshwater diatoms from the
Netherlands. Neth J Aquat Ecol 28:117–133
Verb RG, Vis ML (2005) Periphyton assemblages as bioindicators of
mine-drainage in Unglaciated Western Allegheny Plateau lotic
system. Wat Air Soil Pollut 161:227–262
Limnology (2011) 12:157–168 167
123

Weckstrom J, Korhola A, Blom T (1997) Diatoms as quantitative
indicators of pH and water temperature in subarctic Fennoscan-
dian lakes. Hydrobiologia 347:171–184
Winter JG, Duthie HC (2000) Epilithic diatoms as indicators of
stream total N and total P concentration. J N Am Benthol Soc
19:32–49
Wunsam S, Schmidt R (1995) A diatom-phosphorus transfer
function for Alpine and pre-alpine lakes. Mem Ist Ital Idrobiol
53:85–99
168 Limnology (2011) 12:157–168
123