algorithmic alchemy, or the work of code in the age of computerized visualization
TRANSCRIPT
T&F Proofs: Not For Distribution
Visualization in the Age of Computerization
Edited by Annamaria Carusi, Aud Sissel Hoel, Timothy Webmoor and Steve Woolgar
NEW YORK LONDON
Webmoor Carusi Hoel & Woolgar 1st pages.indd vWebmoor Carusi Hoel & Woolgar 1st pages.indd v 4/16/2014 3:29:38 PM4/16/2014 3:29:38 PM

T&F Proofs: Not For Distribution
First published 2014by Routledge711 Third Avenue, New York, NY 10017
and by Routledge2 Park Square, Milton Park, Abingdon, Oxon OX14 4RN
Routledge is an imprint of the Taylor & Francis Group, an informa business
© 2014 Taylor & Francis
The right of the editors to be identified as the authors of the editorial material, and of the authors for their individual chapters, has been asserted in accordance with sections 77 and 78 of the Copyright, Designs and Patents Act 1988.
All rights reserved. No part of this book may be reprinted or reproduced or utilised in any form or by any electronic, mechanical, or other means, now known or hereafter invented, including photocopying and recording, or in any information storage or retrieval system, without permission in writing from the publishers.
Trademark Notice: Product or corporate names may be trademarks or registered trademarks, and are used only for identification and explanation without intent to infringe.
Library of Congress Cataloging-in-Publication DataA catalog record has been requested for this book.
ISBN13: 978-0-415-81445-4 (hbk)ISBN13: 978-0-203-06697-3 (ebk)
Typeset in Sabon by IBT Global.
Printed and bound in the United States of America by IBT Global.SFI-01234
SFI label applies to the text stock
Webmoor Carusi Hoel & Woolgar 1st pages.indd viWebmoor Carusi Hoel & Woolgar 1st pages.indd vi 4/16/2014 3:29:38 PM4/16/2014 3:29:38 PM
T&F Proofs: Not For Distribution
Visualization in the Age of Computerization
Digitalization and computerization are now pervasive in science. This has deep consequences for our understanding of scientifi c knowledge and of the scientifi c process, and challenges longstanding assumptions and traditional frameworks of thinking of scientifi c knowledge. Digital media and compu-tational processes challenge our conception of the way in which perception and cognition work in science, of the objectivity of science, and the nature of scientifi c objects. They bring about new relationships between science, art and other visual media, and new ways of practicing science and orga-nizing scientifi c work, especially as new visual media are being adopted by science studies scholars in their own practice. This volume refl ects on how scientists use images in the computerization age, and how digital technolo-gies are aff ecting the study of science.
Annamaria Carusi is Associate Professor in Philosophy of Medical Science and Technology at the University of Copenhagen.
Aud Sissel Hoel is Associate Professor in Visual Communication at the Norwegian University of Science and Technology.
Timothy Webmoor is Assistant Professor adjunct in the Department of Anthropology, University of Colorado, Boulder.
Steve Woolgar is Chair of Marketing and Head of Science and Technology Studies at Said Business School, University of Oxford.
Webmoor Carusi Hoel & Woolgar 1st pages.indd iWebmoor Carusi Hoel & Woolgar 1st pages.indd i 4/16/2014 3:29:34 PM4/16/2014 3:29:34 PM

T&F Proofs: Not For Distribution
Contents
List of Figures
Introduction 1ANNAMARIA CARUSI, AUD SISSEL HOEL,
TIMOTHY WEBMOOR AND STEVE WOOLGAR
PART IVisualization in the Age of Computerization
1 Algorithmic Alchemy, or the Work of Code in the Age of Computerized Visualization 19TIMOTHY WEBMOOR
2 From Spade-Work to Screen-Work: New Forms of Archaeological Discovery in Digital Space 40MATT EDGEWORTH
3 British Columbia Mapped: Geology, Indigeneity and Land in the Age of Digital Cartography 59TOM SCHILLING
4 Redistributing Representational Work: Tracing a Material Multidisciplinary Link 77DAVID RIBES
5 Making the Strange Familiar: Nanotechnology Images and Their Imagined Futures 97MICHAEL LYNCH AND KATHRYN DE RIDDER-VIGNONE
Webmoor Carusi Hoel & Woolgar 1st pages.indd viiWebmoor Carusi Hoel & Woolgar 1st pages.indd vii 4/16/2014 3:29:38 PM4/16/2014 3:29:38 PM

viii Contents
T&F Proofs: Not For Distribution
123456789
10111213141516171819202122232425262728293031323334353637383940414243444546
6 Objectivity and Representative Practices across Artistic and Scientifi c Visualization 118CHIARA AMBROSIO
7 Brains, Windows and Coordinate Systems 145ANNAMARIA CARUSI AND AUD SISSEL HOEL
8 A Four-Dimensional Cinema: Computer Graphics, Higher Dimensions and the Geometrical Imagination 170ALMA STEINGART
PART IIDoing Visual Work in Science Studies
9 Visual STS 197PETER GALISON
10 Expanding the Visual Registers of STS 226TORBEN ELGAARD JENSEN, ANDERS KRISTIAN MUNK,
ANDERS KOED MADSEN AND ANDREAS BIRKBAK
11 Mapping Networks: Learning From the Epistemology of the “Natives” 231ALBENA YANEVA
12 Visual STS Is the Answer, What Is the Question? 237ANNE BEAULIEU
13 Visual Science Studies: Always Already Materialist 243LISA CARTWRIGHT
Contributors 269Index 273
Webmoor Carusi Hoel & Woolgar 1st pages.indd viiiWebmoor Carusi Hoel & Woolgar 1st pages.indd viii 4/16/2014 3:29:38 PM4/16/2014 3:29:38 PM
T&F Proofs: Not For Distribution
Figures
1.1 Lines of code in the programming language C++ (on right) rendering the visualization (on left) of a London transport model. 21
1.2 Cached MySQL database. 282.1 The use of iPads at Pompeii excavations, 2010. 464.1 Two examples of Marie’s work in the application of texture-
mapping to a single surface. Which is more eff ective? 804.2 A texture-map used in one of Marie’s experimental systems. 845.1 “Quantum Corral” (1993). 1035.2 Nanocar models and STM image. 1106.1 Bernard Siegfried Albinus. 1246.2 Bernard Siegfried Albinus. 1256.3 Alfred Stieglitz, The Steerage, 1907. 1326.4 Martin John Callanan, 2009. 1358.1 On the left (1a) is a still from Banchoff and Strauss’s fi rst
fi lm, showing a projection of the fl at torus into three-space, which divides the space into two congruent halves. On the right (1b) is a later rendering of the same projection with color and shading. 175
8.2 On the top (2a & 2b) are two images from The Hypercube Projections and Slicing. Below (2c & 2d) are two images from Complex Functions Graph. 177
8.3 Two versions of the Veronese surface. 1809.1 Still from Primate. 2079.2 Dimitri Mugianis. 2099.3 Still from Leviathan. 2109.4 Still from Secrecy. 216
11.1 The dynamic network mapping of the process of design and construction of the 2012 London Olympics Stadium. 235
Webmoor Carusi Hoel & Woolgar 1st pages.indd ixWebmoor Carusi Hoel & Woolgar 1st pages.indd ix 4/16/2014 3:29:38 PM4/16/2014 3:29:38 PM
T&F Proofs: Not For Distribution
12345678910111213141516171819202122232425262728293031323334
1 Algorithmic Alchemy, or the Work of Code in the Age of Computerized VisualizationTimothy Webmoor
INTRODUCTION
“I’m doing something very dangerous right now” (Informant 1, July 8, 2010).
“Yah, now is not a good time for me!” (Informant 2, July 8, 2010).
Ethnographic silence can speak volumes. Despite prompts from the anthro-pologist, the dialogue dried up. Falling back on observation, the two infor-mants were rapidly, if calmly, moving between their multiple program windows on their multiple computer displays. I had been observing this customary activity of coding visualizations for nearly a month now—a visual multitasking that is so characteristic of the post–Microsoft Windows age (Friedberg 2006). Looking around the open plan offi ce setting, every-one was huddled in front of a workstation. Unlike ethnographic work in “wet labs,” where the setting and activities at hand diff er from the anthro-pologist’s own cubicled site of production, this dry lab (Merz 2006) seemed so mundane and familiar, as a fellow offi ce worker and computer user, that admittedly I had little idea of how to gain any analytic purchase as their resident anthropologist. What was interesting about what these researchers and programmers were doing?
It wasn’t until I had moved on to questioning some of the PhD research-ers in the cramped backroom that the importance of what the two infor-mants were doing was overheard: “Well done! So it’s live?” (Director, July 8, 2010). The two programmers had launched a web-based survey program, where visitors to the site could create structured questionnaires for other visitors to answer. The responses would then be compiled for each visitor and integrated with geo-locational information obtained from browser-based statistics to display results spatially on a map. It was part of what this laboratory was well known for: mashing up and visualizing crowd-sourced and other “open” data. While focused upon the UK, within a few months the platform had received over 25,000 visitors from around the world. The interface looked deceptively simple, even comical given a
Webmoor Carusi Hoel & Woolgar 1st pages.indd 19Webmoor Carusi Hoel & Woolgar 1st pages.indd 19 4/16/2014 3:29:39 PM4/16/2014 3:29:39 PM

20 Timothy Webmoor
T&F Proofs: Not For Distribution
1 2 3 4 5 6 7 8 910111213141516171819202122232425262728293031323334353637383940414243444546
cartoon giraff e graced the splash page as a mascot of sorts. However, the reticence the day of its launch was due to the sheer labor of coding to dis-simulate the complicated operations allowing such an “open” visualization. “If you’re going to allow the world to ask the rest of the world anything, it is actually quite complicated” (Director, June 11, 2010). As one of the programmers later explained his shifting of attention between paper notes, notes left in the code, and the code itself, “I have to keep abreast of what I’ve done because an error . . . (pause) . . . altering the back channel infra-structure goes live on a website” (Informant 1, July 21, 2010).
Being familiar with basic HTML, a type of code or, more precisely, a markup text often used to render websites, I knew the two programmers were writing and debugging code that day. Alphanumeric lines, full of sym-bols and incongruous capitalizations and spacing, were recognizable enough; at the lab this lingua franca was everywhere apparent and their multiple screens were full of lines of code. Indeed, there were “1,000 lines just for the web page view itself [of the web-based survey platform]” (Informant 2, June 6, 2011)—that is, for the window on the screen to correctly size, place and frame the visualized data. Yet when looking at what they were doing there was little to see, per se. There was no large image on their screens to anchor my visual attention—a link between the programming they were engrossed in and what it was displaying, or, more accurately, the dispersed data the code was locating, compiling and rendering in the visual register.
The web-based survey and visualization platform was just one of several visualizing platforms that the laboratory was working on. For other types of completed visualizations rendering large amounts of data—for example, a London transport model based upon publicly available data from the Transport for London (TfL) authority—you might have much more coding: “This is about 6,000 lines of code, for this visualization [of London traf-fi c]” (Informant 3, June 10, 2011) (Figure 1.1).
Over the course of roughly a year during which I regularly visited the visualization laboratory in London, I witnessed the process of launching many such web-based visualizations, some from the initial designing ses-sions around the whiteboards to the critical launches. A core orientation of the research lab was a desire to make the increasingly large amounts of data in digital form accessible to scholars and the interested public. Much infor-mation has become widely available from government authorities (such as the TfL) through mandates to make collected digital data publicly available, for instance, through the 2000 Freedom of Information Act in the UK, or the 1996 Electronic Freedom of Information Act Amendments in the US. Massive quantities are also being generated through our everyday engage-ments with the Internet. Of course, the tracking of our clicks, “likes,” visited pages, search keywords, browsing patterns, and even email con-tent has been exploited by Internet marketing and service companies since the commercialization of the Internet in the late 1990s (see Neuhaus and Webmoor 2012 on research with social media). Yet embedded within an
Webmoor Carusi Hoel & Woolgar 1st pages.indd 20Webmoor Carusi Hoel & Woolgar 1st pages.indd 20 4/16/2014 3:29:39 PM4/16/2014 3:29:39 PM

Algorithmic Alchemy 21
T&F Proofs: Not For Distribution
12345678910111213141516171819202122232425262728293031323334353637383940414243444546
academic institution, this laboratory was at the “bleeding edge” of harvest-ing and visualizing such open databases and other traces left on the Inter-net for scholarly purposes. Operating in a radically new arena for potential research, there is a growing discussion in the social sciences and digital humanities over how to adequately and ethically data mine our “digital heritage” (Webmoor 2008; Bredl, Hünniger and Jensen 2012; Giglietto, Rossi and Bennato 2012). Irrespective of what sources of data were being rendered into the visual register by programmers and researchers at this lab, I constantly found myself asking for a visual counterpart to their inces-sant coding: “Can you show me what the code is doing?” I needed to see what they were up to.
CODEWORK
Code, or specifi cally working with code as a software programmer, has often been portrayed as a complicated and arcane activity. Broadly defi ned, code is “[a]ny system of symbols and rules for expressing information or instructions in a form usable by a computer or other machine for process-ing or transmitting information” (OED 2013). Of course, like language,
Figure 1.1 Lines of code in the programming language C++ (on right) rendering the visualization (on left) of a London transport model (Informant 3, June 10, 2011).
Webmoor Carusi Hoel & Woolgar 1st pages.indd 21Webmoor Carusi Hoel & Woolgar 1st pages.indd 21 4/16/2014 3:29:39 PM4/16/2014 3:29:39 PM
22 Timothy Webmoor
T&F Proofs: Not For Distribution
1 2 3 4 5 6 7 8 910111213141516171819202122232425262728293031323334353637383940414243444546
there are many forms of code: C++, JavaScript, PHP, Python—to name a few more common ones discussed later. The ability to “speak computer” confers on programmers a perceived image of possessing inscrutable and potent abilities to get computers to comply.1 Part nerd, part hero, program-mers and specifi cally hacker culture have been celebrated in cyberpunk literature and cinema for being mysterious and libertarian.2 The gothic sensibility informing such portrayals reinforces a darkened and distanced view of working with code.
The academic study of code, particularly from the science and technol-ogy studies (STS) perspective of exhibiting what innervates the quintessen-tial “black boxes” that are our computing devices, has only recently been pursued ethnographically (e.g., Coleman and Golub 2008; Demazière, Horn and Zune 2007; Kelty 2008). Oftentimes, however, such studies scale out from code, from a consideration of its performative role in generat-ing computerized outputs, to discuss the identity and social practices of code workers. More closely examining working with code has received less attention (though see Brooker, Greiff enhagen and Sharrock 2011; Rooksby, Martin and Rouncefi eld’s 2006 ethnomethodological study). Sterne (2003) addresses the absent presence of code and software more generally in academic work and suggests it is due to the analytic challenge that code presents. The reasons for this relate to my own ethnographic encounter. It is boring. It is also nonindexical of visual outputs (as least to the untrained eye unfamiliar with “reading” code; see Rooksby, Martin and Rouncefi eld 2006). In other words, code, like Thrift’s (2004) “tech-nological unconscious,” tends to recede from immediate attention into infrastructural systems sustaining and enabling topics and practices of concern. Adrian Mackenzie, in his excellent study Cutting Code (2006, 2), describes how software is felt to be intangible and immaterial, and for this reason it is often on the fringe of academic and commercial analyses of digital media. He is surely right to bemoan not taking code seriously, downplayed as it is in favor of supposed higher-order gestalt shifts in cul-ture (“convergence”), political economy (“digital democracy” and “radical sharing”) and globalization (“network society”). No doubt the “technical practices of programming interlace with cultural practices” (ibid., 4), with the shaping and reshaping of sociality, forms of collectivity and ideas of selfhood; what Manovich (2001, 45) termed “trans-coding” (e.g., Ghosh 2005; Himanen, Torvalds and Castells 2002; Lessig 2004; Weber 2004; for academic impacts see Bartscherer and Coover 2011). However, these larger order processes have dominated analyses of the signifi cance involving the ubiquity of computer code.
Boring and analytically slippery, code is also highly ambiguous. The Oxford Dictionary of Computing (1996) off ers no less than 113 techni-cal terms that use the word “code” in the domain of computer science and information technology. So despite acknowledging the question “Why is it hard to pin down what software is?” (2006, 19), Mackenzie, a sociologist
Webmoor Carusi Hoel & Woolgar 1st pages.indd 22Webmoor Carusi Hoel & Woolgar 1st pages.indd 22 4/16/2014 3:29:39 PM4/16/2014 3:29:39 PM

Algorithmic Alchemy 23
T&F Proofs: Not For Distribution
12345678910111213141516171819202122232425262728293031323334353637383940414243444546
of science, admirably takes up the summons in his work. For Mackenzie, code confounds normative concepts in the humanities and social sciences. It simply does not sit still long enough to be easily assigned to conventional explanatory categories, to be labeled as object or practice, representation or signifi ed, agent or eff ect, process or event. He calls this “the shifting status of code” (ibid., 18). Mackenzie’s useful approach is to stitch together code with agency. Based upon Alfred Gell’s (1998) innovative anthropo-logical analysis of art and agency, Mackenzie (2006, 2005) pursues an understanding of software and code in terms of its performative capacity. “Code itself is structured as a distribution of agency” (2006, 19). To string together what he sees as distributed events involving code’s agency, he takes up another anthropologist’s methodological injunction to pursue “multi-sited ethnography” (Marcus 1995). In terms of how code is made to travel, distributed globally across information and communication technologies (ICTs) and networked servers as a mutable mobile (cf. Latour 1986), this approach permits Mackenzie to follow (the action of) code and off er one of the fi rst non-technical considerations of its importance in the blood fl ow of contemporary science, commerce and society.
Given its mobility, mutability, its slippery states, code can usefully be studied through such network approaches. Yet I am sympathetic with recent moves within ethnography to reassess the importance of locality and resist the tendency (post-globalization) to scale out (see Candea 2009; Falzon 2009; in STS see Lynch 1993). While there is of course a vast infrastructural network that supports the work code performs in terms of the “fi nal” visu-alizations, which will be discussed with respect to “middle-ware”, most of the work involving code happens in defi nite local settings—in this case, in a mid-sized visualization and research laboratory in central London.
Describing how code works and what it does for the “hackers” of com-puterized visualizations will help ground the larger order studies of cul-tural impacts of computerization, as well as complement the more detailed research into the eff ects of computerization on scientifi c practices. I am, therefore, going to pass over the much studied eff ects of software in the workplace (e.g., Flowers 1996; Hughes and Cotterell 2002) and focus upon when technology is the work (Grint and Woolgar 1997; Hine 2006). Stay-ing close to code entails unpacking what occurs at the multiple screens on programmers’ computers. Like a summer holiday spent at home, it is mundane and a little boring to “stay local,” but like the launch of the new web-based open survey visualizer that tense day, there are all the same quite complex operations taking place with code.
With the computerization of data and visualizations, the work with code weaves together many formerly distinct roles. This workfl ow wraps together the practices of: sourcing data to be visualized; programming to trans-form and render data visually; visualizing as a supposed fi nal stage. I term these activities “codework.” Merging often sequential stages involved with the generation of visual outputs, I highlight how proliferating web-based
Webmoor Carusi Hoel & Woolgar 1st pages.indd 23Webmoor Carusi Hoel & Woolgar 1st pages.indd 23 4/16/2014 3:29:39 PM4/16/2014 3:29:39 PM
24 Timothy Webmoor
T&F Proofs: Not For Distribution
1 2 3 4 5 6 7 8 910111213141516171819202122232425262728293031323334353637383940414243444546
visualizations challenge analytic models oriented by paper-based media. Computerized visualizations, such as those in this case study, are open-ended. They require constant care in the form of coding in order to be sus-tained on the Internet. Moreover they are open in terms of their continuing infl uence in a feedback cycle that plays into both the sourcing of data and the programming involved to render the data visually.
Codework, as an emergent and distinct form of practice in scientifi c research involving visualization, also blends several sets of binary catego-ries often deployed in visual studies: private/public, visible/invisible, mate-rial/immaterial. While these are of interest, I focus upon the manner in which code confounds the binary of creativity/containment and discuss the implications for the political economy of similar visualization labs and the accountability of codework. For clarity, I partially parse these categories and activities in what follows.
SOURCING/PROGRAMMING/VISUALIZING
The July 6, 2010 edition of The Guardian, a very popular UK newspaper, featured a map of London on the second page compiled from “tweets,” or posts to the microblogging service Twitter. It resembled a topographic map in that it visually depicted the density of tweeting activity around the city by using classic hypsometric shading from landscape representations. Given that there was a mountain over Soho, it was apparent to anyone familiar with the city that the data being visualized were not topographi-cal. The caption read, “London’s Twitterscape: Mapping the City Tweet by Tweet.”3 It was good publicity for the lab. The visualizations were a spin-off or side project of one of the PhD researchers. As he stated, it was an experi-ment “to get at the social physics of large cities through Twitter activity” (Informant 4, July 7, 2010). It was one of my earliest visits to the lab at a time when research deploying emergent social media such as Facebook, Flickr, Foursquare and Twitter, or other online sources such as Wikipedia editing activity, was in its infancy (see Viégas and Wattenberg 2004 as an early example). Indeed, many of these now popular online services did not exist before 2006.
Sourcing the data to visualize from these online platforms is not particu-larly diffi cult. It does, however, take an understanding of how the data are encoded, how they might be “mined” and made portable with appropriate programming, and whether the information will be amenable to visual-izing. These programming skills are driven by a creative acumen; knowing where to look online for information relevant to research and/or commer-cial interests, and whether it might provide interesting and useful, or at least aesthetic, visualizations. Creative sourcing and programming are nec-essary crafts of codework.
Webmoor Carusi Hoel & Woolgar 1st pages.indd 24Webmoor Carusi Hoel & Woolgar 1st pages.indd 24 4/16/2014 3:29:39 PM4/16/2014 3:29:39 PM
Algorithmic Alchemy 25
T&F Proofs: Not For Distribution
12345678910111213141516171819202122232425262728293031323334353637383940414243444546
Many online services, such as Twitter, provide data through an appli-cation programming interface (API). Doing so allows third-party devel-opers to provide “bolt-on” applications, and this extensibility benefi ts the service provider through increased usage. “There’s an app for that!”: It is much like developing “apps” for Apple iTunes or Google Android. Importantly, though, sourcing these APIs or “scraping” web pages for data to visualize does require programming, and both the format of the data and the programming language(s) involved heavily determine the “fi nal” visualizations themselves.
In the case of Twitter, the company streams “live” a whole set of infor-mation bundled with every tweet. Most of this information, such as Internet protocol (IP) location, browser or service used to tweet, link to user profi le and sometimes latitude and longitude coordinates (with a 5–15 m accu-racy), is not apparent to users of the service.4 The researchers at the London lab applied to Twitter to download this open data from their development site.5 The format is key for what types of visualization will be possible, or at least how much translation of the data by code will be required. For instance, as discussed later, many open data sources are already encoded in a spatial format like Keyhole Markup Language (KML) for display in industry standard analytic software and mapping platforms (for Google Earth or in ESRI’s geographic information system [GIS] programs such as ArcGIS). Twitter, like most social media companies, government institu-tions and scientifi c organizations, formats its data as comma-separated val-ues (CSV). For simplicity and portability across programming languages, this format for organizing data has become the primary de facto standard for open datasets. Information is arranged in tabular format much like an Excel or Numbers spreadsheet, and values are separated by either a comma or a tab-spacing (tabular-space values [TSV] format is a variety of CSV). The London lab logged a week’s worth of tweets for various metropolises. This amounted to raw data tables containing about 150,000 tweets and over 1.5 million discrete data points for each city. Such massive datasets could be visualized based upon various criteria—for instance, semanti-cally for word frequency or patterning. Importantly, being in CSV format means that the Twitter data are highly mutable by a wide range of pro-gramming languages, and therefore there are a number of possible paths to visualization.
The researcher was interested in tying such Twitter “landscapes” into his larger PhD research involving travel patterns in the city of London. Spatial and temporal aspects were therefore most important, and a program was written to mine the data for spatial coordinates within a certain radius of the urban centers, as well as for time stamps. When and where a Twitter user sent a tweet could then be plotted. Once aggregated, the visualizations indicated patterns of use in terms of diurnal and weekly activity. They also suggested varying usage around the cities of concern.
Webmoor Carusi Hoel & Woolgar 1st pages.indd 25Webmoor Carusi Hoel & Woolgar 1st pages.indd 25 4/16/2014 3:29:39 PM4/16/2014 3:29:39 PM

26 Timothy Webmoor
T&F Proofs: Not For Distribution
1 2 3 4 5 6 7 8 910111213141516171819202122232425262728293031323334353637383940414243444546
Sourcing data packaged as CSV fi les was common for the laboratory. Indeed, in step with the growing online, open data repositories, where much data are user-generated and least user-contributed, the lab was developing a visualizing middle-ware program to display spatial data based upon Open-StreetMap and OpenLayers.6 “A place to share maps and compare data visually,” as their website states, is the goal. Unlike either large commercial companies that typically fund and manage server farms where these large datasets are uploaded, such as Google’s Spreadsheets or Yahoo!’s Pipes, or commercially funded research groups like IBM’s ManyEyes,7 this lab was providing a visualizing tool, or “visualizer,” that would fetch data which was located remotely. Otherwise, despite the recent purchase of three new Dell stacked servers located in a closet in the hallway, there simply was not enough storage space for the modest lab to host the huge datasets. Described as “a service for researchers,” the web-based platform would, for example, “serve up on an ad hoc basis a visualization of the dataset whenever a query was made by a user” (Informant 1, November 10, 2010). As he went on to unpack the operation, when a user selected a set of statistics (e.g., crime statistics) to display over a selected region (e.g., the UK), there were a host of operations that had to transpire rapidly, and all hinged upon the web-based platform and the coding the researcher had written and “debugged” (and rewritten). These operations might be thought of as putting together layers consisting of diff erent information and diff erent formats in order to build a complexly laminar visualization. As the informant described, the programming allows the “fusing of CSV data [like census data] with geo-spatial data [coordinates] on a tile by tile basis [portions of the map viewed on the screen] . . . this involves three servers and six websites” (Informant 1, November 10, 2010). Data, plug-ins and the program code itself were variously dispersed and are pulled together to form the visualization on a user’s screen—hence the “middle” or go-between function of the software package developed by the lab and later released as GMapCreator. For pro-gramming web-based visualizations, code is coordination work.
In addition to the growing online datasets stored primarily as CSV fi les, many government agencies now provide their stored data in accessible digital repositories. The UK’s data.london.gov.uk was another popular archive where the visualization lab and other researchers were obtaining UK census data. This was variously fetched and displayed as a dynamic, interactive map through the lab’s web-based platform. Twenty-seven months after the initial launch of the visualizing platform, 885 datas-ets had been “uploaded” to the map visualizer (or more precisely shared through linking to a remote server where the datasets were physically stored) and there were “about 10,000 users for the program” (Informant 1, November 10, 2010).
Other data was being sourced by the lab through scraping. While the “ready-made” data stream from Twitter’s API or other online data
Webmoor Carusi Hoel & Woolgar 1st pages.indd 26Webmoor Carusi Hoel & Woolgar 1st pages.indd 26 4/16/2014 3:29:39 PM4/16/2014 3:29:39 PM
Algorithmic Alchemy 27
T&F Proofs: Not For Distribution
12345678910111213141516171819202122232425262728293031323334353637383940414243444546
repository requires some initial coding to obtain the data—for instance, writing a program to log data for a specifi ed period of time as in the case of the Twitterscapes—web-scraping typically requires more involved code-work. Frequently, the data scraped must go through a series of steps all defi ned by code in order to be useful; and in many cases converted into a standard data format such as CSV.
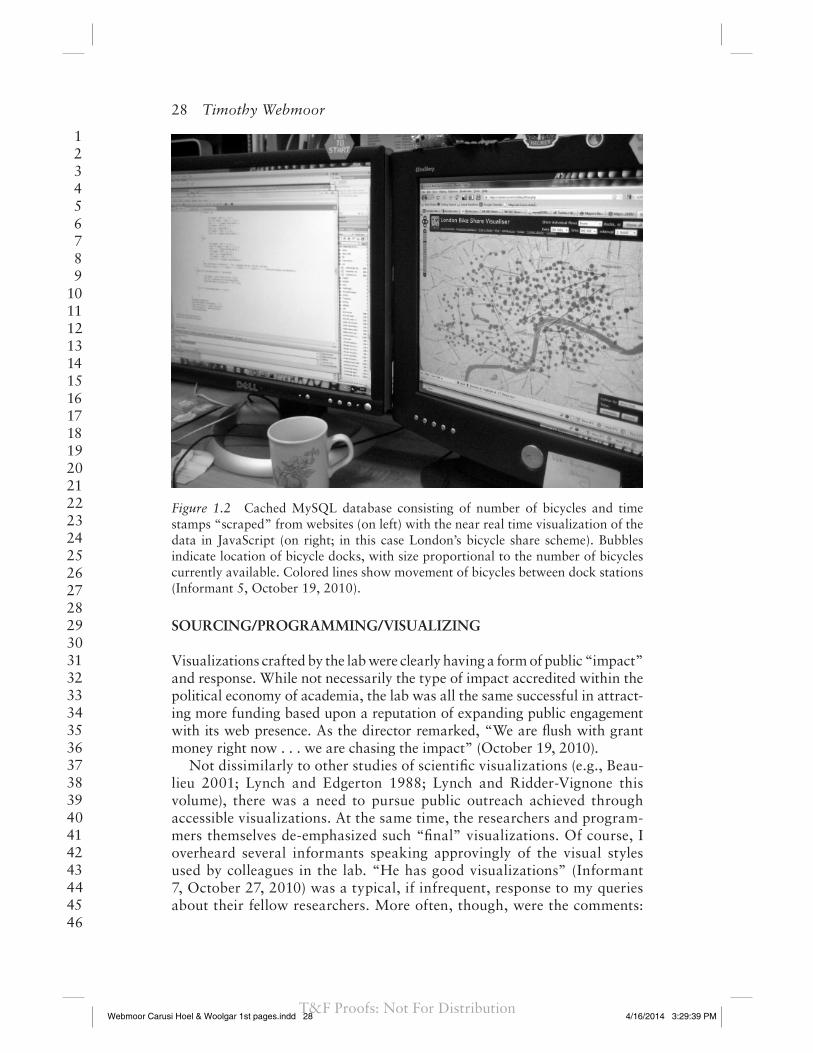
Let’s consider another example from the visualization lab. One of the programmers was interested in getting at “the social demography of, and city dynamics relating to, bike share usage” (Informant 5, Octo-ber 19, 2010). Bike share or bike rentals programs had recently become quite popular in international cities. London’s own bike sharing scheme, known as the Barclay’s Cycle Hire after its principal commercial con-tributor, was launched on June 30, 2010, and represents a quite large and well-utilized example. Visualizing and making publicly accessible the status of the bike share schemes piggybacks off of the data that the corporate managers of the various schemes collect for operational pur-poses. The number of bikes at each docking station (London has over 560 stations) is updated electronically every three minutes. The stages involved begin with the programmer using the “view source” feature in the web browser Firefox to de-visualize the “front end” of the commer-cial websites in order to assess what types of information are encoded. The “back end” or source code of the scheme’s website showed several types of information that could be rendered spatially. Specifi cally, time stamps, dock location and number of bicycles were data he thought could be harvested from these websites. With visualizations in mind, he was confi dent “that they would be something cool to put out there” (Infor-mant 5, September 23, 2010). He wrote a code in Python to parse the information scraped to narrow in on geographic coordinates and num-ber of bicycles. Using a MySQL database to store the information, the Python program pulled the selected data into CSV format by removing extraneous information (such as HTML markup). A cron program was written to schedule how frequently the web scraping takes place. Finally, the programmer aggregated the information scraped for each individual bike station to scale up to the entire system or city. To visualize the data, he used JavaScript to make it compatible with many web-based map dis-plays, such as Google Maps. In this case, he used OpenStreetMap with (near) real time information displayed for ninety-nine cities worldwide (Figure 1.2). Finally, he used Google’s Visualization API8 to generate and embed the charts and graphs. Several months after the world bike shar-ing schemes visualizer went live, the programmer related how he was contacted by the corporate managers of four diff erent international cities asking him “to take down the visualizations . . . likely because it made apparent which schemes were being underutilized and poorly managed” (Informant 7, October 27, 2010).
Webmoor Carusi Hoel & Woolgar 1st pages.indd 27Webmoor Carusi Hoel & Woolgar 1st pages.indd 27 4/16/2014 3:29:39 PM4/16/2014 3:29:39 PM
28 Timothy Webmoor
T&F Proofs: Not For Distribution
1 2 3 4 5 6 7 8 910111213141516171819202122232425262728293031323334353637383940414243444546
SOURCING/PROGRAMMING/VISUALIZING
Visualizations crafted by the lab were clearly having a form of public “impact” and response. While not necessarily the type of impact accredited within the political economy of academia, the lab was all the same successful in attract-ing more funding based upon a reputation of expanding public engagement with its web presence. As the director remarked, “We are fl ush with grant money right now . . . we are chasing the impact” (October 19, 2010).
Not dissimilarly to other studies of scientifi c visualizations (e.g., Beau-lieu 2001; Lynch and Edgerton 1988; Lynch and Ridder-Vignone this volume), there was a need to pursue public outreach achieved through accessible visualizations. At the same time, the researchers and program-mers themselves de-emphasized such “fi nal” visualizations. Of course, I overheard several informants speaking approvingly of the visual styles used by colleagues in the lab. “He has good visualizations” (Informant 7, October 27, 2010) was a typical, if infrequent, response to my queries about their fellow researchers. More often, though, were the comments:
Figure 1.2 Cached MySQL database consisting of number of bicycles and time stamps “scraped” from websites (on left) with the near real time visualization of the data in JavaScript (on right; in this case London’s bicycle share scheme). Bubbles indicate location of bicycle docks, with size proportional to the number of bicycles currently available. Colored lines show movement of bicycles between dock stations (Informant 5, October 19, 2010).
Webmoor Carusi Hoel & Woolgar 1st pages.indd 28Webmoor Carusi Hoel & Woolgar 1st pages.indd 28 4/16/2014 3:29:39 PM4/16/2014 3:29:39 PM
Algorithmic Alchemy 29
T&F Proofs: Not For Distribution
12345678910111213141516171819202122232425262728293031323334353637383940414243444546
“He has clean code” (Informant 5, October 27, 2010); or “the style of programming is very important . . . everything around the actual algo-rithm, even the commenting [leaving lines within the code prefaced by ‘//’ so as not to be readable/executable by the computer] is very important” (Informant 2, June 10, 2011). More than visualizations or data, the pro-gramming skill that made both possible was identifi ed as the guarantor of reliability in web-based visualizations.
“Code is king” assertions contrast with previous studies where research-ers engaging visualizations stated greater confi dence in, or preference for, the supposed raw data visualized. In this laboratory, the programmers and researchers tended to hold a confl icted opinion of data. Ingenuity in fi nd-ing sources of data to visualize was admired, such as with the bike share scheme or the Twitter maps. Equally, the acts of researchers who leveraged open data initiatives to amass new repositories, such as making requests through the Freedom of Information Act to the Transport for London (TfL) to release transportation statistics, were approvingly mentioned (e.g., Infor-mant 5, November 10, 2010). Yet once sourced, the data tended to recede into the background or bedrock as a substrate to be worked upon through programming skill.
Everyone has their preferred way of programming, and preferred style of programming . . . The data is much more clearly defi ned. The struc-ture of the data and how you interface, or interact, with it. Whereas programming is so much more complex. It’s not so easy . . . maybe sounds like it’s isolated. But it’s really hundreds of lines of code. (Infor-mant 3, June 10, 2011)
Like this informant, many felt that the data were fairly “static and closed,” and for this reason were less problematic and, consequently, less interesting to work with. One programmer explained, with reference to the prevalence of digital data in CSV format, that you need to “use a base-set that was ubiquitous . . . because web-based visualizations were changing constantly . . . with new versions being released every week or so” (Informant 1, June 13, 2011). Such a perception of data as a relatively stable “base” was often declared in contrast to the code to “mash up” the data and render it readable by the many changing platforms and plug-ins. As a go-between, code has to be dynamic to ensure the data remains compatible with the perpetually changing platforms for visualizing. Pro-grammers often bemoaned how much time they spent updating their code to keep their visualizations and platforms live on the Internet. Informant 1 (November 10, 2010) explained how he was “developing a point-click interface to make it easier to use the site [the mapping visualizer that the lab hosted], but it requires much more KML [a standard geospatial markup language] to make it compatible with Google Maps and Open-StreetMap [which the site used to display the maps].” When Google or
Webmoor Carusi Hoel & Woolgar 1st pages.indd 29Webmoor Carusi Hoel & Woolgar 1st pages.indd 29 4/16/2014 3:29:39 PM4/16/2014 3:29:39 PM
30 Timothy Webmoor
T&F Proofs: Not For Distribution
1 2 3 4 5 6 7 8 910111213141516171819202122232425262728293031323334353637383940414243444546
another API provider updated their software, the programmers often had to update the code for their visualizations accordingly.
Perhaps unsurprisingly, activities that required skill were more highly regarded. These preferences fed into the treatment of data vis-à-vis code in terms of lab management. There was much informal sharing of datasets that had already been sourced, sharing links to where relevant data might be found, or otherwise discussing interesting and pertinent information for one another’s research projects. To make sharing and collaborating with data easier and more accountable, the lab was beginning to set up a data repository using Trac, an open source project management program, on a central server. When asked about a code repository, the informant identi-fi ed the need, but admitted that a “data repository was much less of a prob-lem” (Informant 5, October 13, 2010). Instead, despite “revision control being essential to programming . . . and taught in the 2nd year of software engineering,” it was largely left to the individual programmer to create a “code repository so that [you] can back up to where [the software] was working . . . like a safety net” (Informant 2, March 16, 2011).
Updating the felicitous phrase describing Victorian sex, code was every-where admired, spoken about and inherent to the survival of the lab, but never shared. This incongruous observation prompted a conversation later in the fi eldwork:
TW: You don’t share code, you share data?Informant: Mostly data, not so much code. The thing with data, once you
load it and you have your algorithms, you can start to transform the data in diff erent ways. You can also (pause) . . . quite often you download data in a certain format, and you load it, and your programming transforms it in diff erent ways. Then it becomes useful . . . With C++ there is no boundary to what you can do.
TW: So you can do whatever with the data. So you do that by writing new code? Do you write a bit of code in C++?
Informant: I do it all the time. It’s how I spend my days. (Informant 3, June 10, 2011)
Programming was held in deference for two principal reasons. First, as a creative skill it was seen as proprietary (see Graham 2004 on the paral-lels between artists and programmers). It was not something that could be straightforwardly taught, but as a craft it was learned on the job; and programmers strove to improve this skill in order to write the cleanest, most minimalist code. This fostered a defi nite peer awareness and review of code. These interpersonal dynamics fed into the larger management and economy of the lab already mentioned. This lab was chasing the impact. To do so they were creating “fast visualizations.” In addition, as discussed with respect to the mapping visualizer, web-based visualizations rely upon middle-ware or go-between programs gathering distributed data and
Webmoor Carusi Hoel & Woolgar 1st pages.indd 30Webmoor Carusi Hoel & Woolgar 1st pages.indd 30 4/16/2014 3:29:39 PM4/16/2014 3:29:39 PM

Algorithmic Alchemy 31
T&F Proofs: Not For Distribution
12345678910111213141516171819202122232425262728293031323334353637383940414243444546
rendering it on an ad hoc basis on the computer screen. Given the larger infrastructural medium, the lab’s visualizations needed constant coding and recoding in order to maintain operability with the rapidly changing software platforms and APIs that they were tied to. Each researcher who began a project had to quickly and on an ad hoc basis develop code that could render source data visually. Intended for rapid results but not neces-sarily long-term sustainability, the only reasonable way to manage such projects was to minimize confusion and the potential for working at cross-purposes by leaving the coding to individuals. At a smaller research lab where programming happens, this was feasible. At larger, corporate labora-tories, the many tasks of codework are often broken up in a Fordist manner among several specialists: software engineers, network engineers, graphic designers. All of whom may be involved in creating web-based visualizing platforms. Bolted together by teams, such coding is more standardized, minimalist and therefore more compatible and fungible.
In contrast, the London lab found itself in a double-bind of sorts. They clearly knew they needed some form of accountability of the code produced by the lab: “Revision control is essential for the lab” (Informant 2, March 2, 2011). At the same time, the success of the lab in garnering fi nancial sup-port, the “soft funding” it was entirely dependent upon, was largely due “to the creative mix of code and tools” and the “hands-off management style” (Director, March 2, 2011). Individual researchers were therefore largely left to practice their own codework.
Secondly, in addition to being a highly creative and skilled craft, writing code, and specifi cally the code itself, was seen as dynamic and potent in relation to data. Mackenzie discusses the agency of code in general terms with respect to its ability to have eff ects at a distance (2005, 2006)—for instance, forging a shared sense of identity among the internationally based software engineers who develop the open source software Unix. For this lab, the software they were writing had agency in the very defi nite sense of transforming data. You want to “build an algorithm so you have good performance” (Informant 6, October 13, 2010). Unlike code more gener-ally, which includes human-readable comments and other instructions, an algorithm is a subset or specifi c type of code that is expressly written for a computer to perform a specifi ed function in a defi ned manner. The defi n-ing function of many algorithms in computer programming is the ability to manipulate data. For instance, as the informant describes ahead, a basic operation of algorithms is precisely the transformation of data from one format (e.g., the markup language KML) to a diff erent format (e.g., C++).
An algorithm performs a well-defi ned task. Like sorting a series of numbers, for example. Like a starting point [for the] input of data and output of data in diff erent format. You can do everything with source code. You can write algorithms, but you can do all other kinds of stuff as well. (Informant 3, June 10, 2011)
Webmoor Carusi Hoel & Woolgar 1st pages.indd 31Webmoor Carusi Hoel & Woolgar 1st pages.indd 31 4/16/2014 3:29:39 PM4/16/2014 3:29:39 PM
32 Timothy Webmoor
T&F Proofs: Not For Distribution
1 2 3 4 5 6 7 8 910111213141516171819202122232425262728293031323334353637383940414243444546
Code as transitive revealed the confl icting view of data as being less than stable. In fact, during many conversations, code’s potency was estimated in fairly direct relation to how malleable it rendered data.
TW: You transform these two sources of data that you have into XML fi les, so that you can look at them in ArcGIS?
Informant: From ArcGIS you understand how the data, how these things are supposed to be connected. So then you can connect the net-work in the way it’s supposed to be connected, in your connec-tion structure that you have defi ned in your code, in C++.
TW: Does it have to be in C++, or is that a standard for running simu-lations? . . . So you have to transform this data in C++, let me get at this, for a couple of reasons: One, you are familiar with it; two, it’s going to be much faster when you make queries [as opposed to ArcGIS]. Anything else?
Informant: Well, I’m familiar with the code. (Informant 6, October 13, 2010)
Code’s purpose was to translate and to work with data. Yet diff erent types of code worked on data diff erently. Part of this was due to personal pref-erence and background. What certain programmers could do with code depended upon their familiarity with it. For this reason, depending upon the programmer, certain code was asserted to be “top end” or “higher order.” This implies that the coding language is more generalized and so could be written to perform many types of tasks. It also means, however, that the code must be programmed much more extensively. Whatever code was preferred, the acknowledgment that it transformed and manipulated data rarely led to discussion of a potential corollary: that data were somehow “constructed” or may become fl awed. Part of this has to do with the data asserting a mea-sure of independence from code. More specifi ally, the format of the data partially determines the type of visualization pursued and so constrains to a certain degree the coding deployed. More emphasis was, however, given to code’s neutral operation upon data. It was held to merely translate the data’s format for “readability” across the networked computers and programs in order to render the visualization. Put another way, code transforms metadata not data. The view that code transformed without corruption became most apparent when researchers discussed the feedback role of visualization in examining and correcting the original datasets.
SOURCING/PROGRAMMING/VISUALIZING
Most visualizations mashed up by the lab were not fi nalized outputs. Just as the format of the sourced data infl uenced the programming required and the choices for visualization, the visualizations themselves recursively
Webmoor Carusi Hoel & Woolgar 1st pages.indd 32Webmoor Carusi Hoel & Woolgar 1st pages.indd 32 4/16/2014 3:29:39 PM4/16/2014 3:29:39 PM

Algorithmic Alchemy 33
T&F Proofs: Not For Distribution
12345678910111213141516171819202122232425262728293031323334353637383940414243444546
looped back into this process of codework. Several informants fl ipped the usual expectation that visualizations were end products in the information chain by discussing their integral role at the beginning of the process.
It’s a necessary fi rst step to try and visualize certain facets of the infor-mation. Because it does give you a really quick way of orienting your research. You can see certain patterns straightaway . . . you literally do need to see the big picture sometimes. It informed my research com-pletely . . . There are some themes in your research. But you still, (pause) the visualization informs your trajectory . . . Is part of the trajectory of your research . . . You draw on that . . . because you see something. (Informant 8, October 27, 2010)
For this informant, deploying “sample” visualizations allowed him to identify patterns or other salient details in an otherwise enormous corpus of data. He was researching with Foursquare, a social media service that personalizes information based upon location. As he stated, he was “min-ing their API to harvest 300,000,000 records” (Informant 8, October 27, 2010). Awash in data, he needed to reduce the complexity in order to iden-tify and anchor research problems. Much like the lab’s resident anthropolo-gist, he needed a visual counterpart to what was otherwise undiff erentiated and unfamiliar clutter on the computer screen.
More than suggesting what to do with mined data, another researcher noted with pride that the working visualizations actually identifi ed fl aws in the data. He was coding with open data from Transport for London and the UK Ordnance Survey. Much of this entails merging traffi c fl ow volume (TfL data) with geospatial coordinates (Ordnance data) to create large visuals consisting of lines (roadways, paths) and nodes (intersections). Responding to a question about accuracy in the original data and worries about creating errors through transforming the CSV fi les into C++, he dis-cussed the “bridge problem.” This was an instance where the visualization he began to run on the small scale actually pinpointed an error in the data. Running simulations of a small set of nodes and lines, he visually noticed traffi c moving across where no node had been labeled. After inspecting a topographic map, he concluded that the Ordnance Survey had not plotted an overpass where it should have been.
TW: When you say you know exactly what is going on with the algo-rithm, does that mean you can visualize each particular node that is involved in this network?
Informant: Yes, once you program you can debug it where you can stop where the algorithm is running, you can stop it at anytime and see what kind of data it is reading and processing . . . you can monitor it, how it behaves, what it is doing. And once you check that and you are happy with that, you go on to a larger scale
Webmoor Carusi Hoel & Woolgar 1st pages.indd 33Webmoor Carusi Hoel & Woolgar 1st pages.indd 33 4/16/2014 3:29:40 PM4/16/2014 3:29:40 PM
34 Timothy Webmoor
T&F Proofs: Not For Distribution
1 2 3 4 5 6 7 8 910111213141516171819202122232425262728293031323334353637383940414243444546
. . . once you see what it is giving you. (Informant 6, October 13, 2010)
Running visualizations allowed the researcher to feel confi dent in the reli-ability of his data as he aggregated (eventually) to the scale of the UK.
Whether visualizations were used by the lab researchers at the beginning of the process of codework to orient their investigations, or throughout the process to periodically corroborate the data, visualizations as fi nal outputs were sometimes expected. Where this was the case, especially with respect to paper-based visualizations, many at the lab were resigned to their neces-sity but skeptical of the quality. Several felt it was an inappropriate medium for what were developed to be web-based and dynamic. Yet they openly acknowledged the need for such publication within the confi nes of aca-demia’s political economy.
Online publishing has to be critical. For me, my research is mainly online. And that’s a real problem as a PhD student. Getting published is important. And the more you publish online independently the less scope you have to publish papers . . . still my motivation is to publish online, particularly when it’s dynamic . . . You might have a very, very interesting dynamic visualization that reveals a lot and its impact in the academic community might be limited . . . the main constraint is that these are printed quite small, that’s why I have to kind of tweak the visuals. So they make sense when they are reproduced so small. Because I look at them at twenty inches, on a huge screen. That’s the main diff erence, really. There’s a lot of fi ne-grained stuff in there. (Informant 8, October 27, 2010)
Set within academic strictures of both promotion and funding, the lab’s researchers found themselves needing to generate fast visualizations, while at the same time “freezing” them, or translating and reducing them, to fi t traditional print.
CONCLUDING DISCUSSION: CODEWORK AND RIGHT WRITING IN SCIENTIFIC PRODUCTION
Given the way codework weaves together the many activities happening at the visualization lab, the demands of academic publication to assign defi -nite credit became an arena for contestation. This is because programming, as a mode of writing and a skill integral to all of these activities, abrades against a tradition of hierarchical assignation of authorship going back to pre-Modern science (Shapin 1989). This tradition would restrict the role of software programming along the lines of Shapin’s “invisible technicians.” Writing code is not the right type of writing.
Webmoor Carusi Hoel & Woolgar 1st pages.indd 34Webmoor Carusi Hoel & Woolgar 1st pages.indd 34 4/16/2014 3:29:40 PM4/16/2014 3:29:40 PM
Algorithmic Alchemy 35
T&F Proofs: Not For Distribution
12345678910111213141516171819202122232425262728293031323334353637383940414243444546
The nonproprietary attitude on the part of the programmers-research-ers at the lab toward the visualized results encouraged “nonauthorship”. Yet, as their resident anthropologist, I myself violated the lab’s mode of production which regarded visualizations as collective achievements. I became entangled in their web of work. While, as previously mentioned, the complexities of code involved in sourcing, programing and visualiz-ing were partially contained by leaving this entire process up to individ-ual researchers, the lack of more defi ned, sequential steps involved with web-based visualizations meant that there were sometimes confl icts over authorship. Sourcing of data, as discussed, involved creativity in locating data and skill in harvesting the information through programming. These skills were bound together as part of the craft of codework. Within a col-laborative environment, where researchers shared ideas for data sources, the question was raised whether a single individual ought to retain sole authorship for a visualization. This was especially so when the idea for the data mining came from another researcher. With a particular article that I co-authored at the lab, there was acrimony that the individual who identifi ed the data source was not granted co-authorship. Additionally, another researcher helped with the programming needed to harvest the information, but was subsequently little involved in the project. Again, because of the continuity of codework, the programmer felt he ought to have been listed as a co-author.
This personal vignette occurred toward the end of my year at the lab and it suggested that I was perhaps getting too close and “going native”. Not simply because I was co-authoring “outputs” of the lab as a participant, but also because of the palpable and expressed sense of altering the working dynamics of the programmers. My involvement contentiously and publicly posed the question of whether the attribution of credit at the lab, and in academia more generally, operated according to anachronous guidelines with regard to such visualizations. Might such dry-labs follow the prec-edent of wet-labs, where large teams federate their eff orts together under the directorship of a senior scientist? This translates, not without conten-tion, into a lead author with many possible secondary authors listed. How-ever, the specifi c activity of codework aligned most of the lab’s researchers with the so-called “hacker ethic” mode of production. That is, according to Himanen, Torvalds and Castells (2002, 63) “the open model in which the hacker gives his or her creation freely for others to use, test, and develop further.” Such an ideal of radical sharing is diffi cult to square with the con-straints of academic credit and promotion. My own awkward intervention in the lab’s political economy demonstrated the tendency to relegate writing software to the invisible spectrum of scientifi c production.
Clearly the medium of live, web-based visualizations questions our still analog-oriented modes of credit in the academy. Ideas of web presence and public outreach through engagement with Internet-based research are not radically new. More strongly, however, as the informant working
Webmoor Carusi Hoel & Woolgar 1st pages.indd 35Webmoor Carusi Hoel & Woolgar 1st pages.indd 35 4/16/2014 3:29:40 PM4/16/2014 3:29:40 PM

36 Timothy Webmoor
T&F Proofs: Not For Distribution
1 2 3 4 5 6 7 8 910111213141516171819202122232425262728293031323334353637383940414243444546
with Foursquare intimated, is that the gold standard of print publication is not an appropriate medium for this type of interactive imagery. Notions of “authorship” may not be straightforwardly applicable. Scientifi c pro-duction in wet-labs, such as the classic examples studied in STS (Knorr-Cetina and Mulkay 1983; Latour 1987; Latour and Woolgar 1986; Lynch 1985), disclosed the messiness of making science work. The work of code in the age of computerization further blurs the roles and stages of scien-tifi c research.
The dynamic and open visualizations depend upon middle-ware, or spe-cifi cally written code, to fetch distributed sources of data and software plug-ins (with APIs). Given that the production and hosting of these datasets and plug-ins involve multiple commercial, governmental and academic sources dispersed across the Internet, the code to federate and sustain web-based visualizations must be constantly cared for (on matters of care, see Puig de la Bellacasa 2011). As a woven set of activities, I would argue that the study of visualizations, particularly the proliferation of web-based visual-izations, must de facto consider the entire workfl ow centered upon coding. Path dependency is involved. However, it is not a linear or sequential work-fl ow as this metaphor suggests, with each stage or activity building step-wise toward a fi nal (or at least fi nalized) output. It is rather like reiterative knot making, with preferred programming languages and skills constrain-ing both what types of data are sourced and the forms of visualization that are possible, and also the format of the data acting to constrain the possible visualizations and what programming languages are deployed. Addition-ally, the visualizations themselves are often used to ground-truth or check the sourced data. The output or visualization itself is held only provision-ally like a knot before it is redone, adjusted, updated or taken down. As an emergent craft in the making of scientifi c visualizations, codework presents challenges to our analytic categories for studying science. Yet it promises to pose interesting questions for future practices in the academy.
NOTES
1. As I complete the draft of this chapter, I wait hoping that the computer sci-ence students are miraculously able to resuscitate my computer’s crashed hard drive.
2. Novels by William Gibson, Neal Stephenson and Bruce Sterling set the genre of cyberpunk. Popular fi lms such as Blade Runner or the Matrix trilogy are the genre’s more well-known cinematic counterparts.
3. See the archived story at: http://www.guardian.co.uk/news/datablog/2010/jul/06/twitter-maps?INTCMP=SRCH.
4. These data points include: TwitterPost (actual message); TwitterID (in addi-tion to the username every user is assigned an internal number); dateT (date and time when the message was sent); name (user or screen name); link (link to online location of this tweet); usage; Twittergeo; lang (language); profi le (link to online user profi le); google_location (location of user derived as a geocoded place via the user profi le location); atom_content (message in atom
Webmoor Carusi Hoel & Woolgar 1st pages.indd 36Webmoor Carusi Hoel & Woolgar 1st pages.indd 36 4/16/2014 3:29:40 PM4/16/2014 3:29:40 PM
Algorithmic Alchemy 37
T&F Proofs: Not For Distribution
12345678910111213141516171819202122232425262728293031323334353637383940414243444546
format); source (platform used to send the tweet); Lat (latitude) and Lon (longitude).
5. Located at: dev.twitter.com. 6. These are open source alternatives to Google Maps; see http://www.openlay-
ers.org/ and http://www.openstreetmap.org/. 7. See http://drive.google.com, http://pipes.yahoo.com/pipes/, and http://www-
958.ibm.com/software/analytics/manyeyes/. 8. A set of visualizing tools off ered freely by Google: https://developers.google.
com/.
REFERENCES
Bartscherer, Thomas, and Roderick Coover, eds. 2011. Switching Codes: Thinking through Digital Technology in the Humanities and the Arts. Chicago: Univer-sity of Chicago Press.
Beaulieu, Anne. 2001. “Voxels in the Brain: Neuroscience, Informatics and Chang-ing Notions of Objectivity.” Social Studies of Science 31 (5): 635 –680.
Bredl, Klaus, Julia Hünniger and Jakob Linaa Jensen. 2012. “Methods for Analyz-ing Social Media: Introduction to the Special Issue.” Journal of Technology in Human Services 30: 141–144.
Brooker, Christian Greiff enhagen, and Wes Sharrock. 2011. “Scientifi c Findings.” Paper presented at the Visualisation in the Age of Computerisation conference, March, Oxford, UK.
Candea, Matei. 2009. “Arbitrary Locations: In Defense of the Bounded Field-Site.” In Multi-Sited Ethnography: Theory, Praxis and Locality in Contemporary Research, edited by Mark-Anthony Falzon, 25–46. Farnham: Ashgate.
Coleman, Gabriella, and Alex Golub. 2008. “Hacker Practice: Moral Genres and the Cultural Articulation of Liberalism.” Anthropological Theory 8 (3): 255–277.
Demazière, Didier, François Horn and Marc Zune. 2007. “The Functioning of a Free Software Community: Entanglement of Three Regulation Modes—Con-trol, Autonomous and Distributed.” Science Studies 20 (2): 34–54.
Falzon, Mark-Anthony, ed. 2009. Multi-sited Ethnography: Theory, Praxis and Locality in Contemporary Research. Farnham: Ashgate.
Flowers, Stephen. 1996. Software Failure: Management Failure—Amazing Stories and Cautionary Tales. New York: John Wiley and Sons.
Friedberg, Anne. 2006. The Virtual Window: From Alberti to Microsoft. Cam-bridge, MA: MIT Press.
Gell, Alfred. 1998. Art and Agency: An Anthropological Theory. Oxford: Clarendon.
Ghosh, Rishab Aiyer, ed. 2005. CODE: Collaborative Ownership and the Digital Economy. Cambridge, MA: MIT Press.
Giglietto, Fabio, Luca Rossi and Davide Bennato. 2012. “The Open Laboratory: Limits and Possibilities of Using Facebook, Twitter, and YouTube as a Research Data Source.” Journal of Technology in Human Services 30: 145–159.
Graham, P. 2004. Hackers and Painters: Big Ideas from the Computer Age. Sebas-topol, CA: O’Reilly Press.
Grint, Keith, and Steve Woolgar. 1997. The Machine at Work. Cambridge: Polity Press.
Himanen, Pekka, Linus Torvalds and Manuel Castells. 2002. The Hacker Ethic: A Radical Approach to the Philosophy of Business. New York: Random House.
Hine, Christine. 2006. “Databases as Scientifi c Instruments and Their Role in the Ordering of Scientifi c Work.” Social Studies of Science 36: 269–298.
Webmoor Carusi Hoel & Woolgar 1st pages.indd 37Webmoor Carusi Hoel & Woolgar 1st pages.indd 37 4/16/2014 3:29:40 PM4/16/2014 3:29:40 PM
38 Timothy Webmoor
T&F Proofs: Not For Distribution
1 2 3 4 5 6 7 8 910111213141516171819202122232425262728293031323334353637383940414243444546
Hughes, Bob, and Mike Cotterell. 2002. Software Project Management. 3rd ed. London: McGraw-Hill.
Kelty, Christopher. 2008. Two Bits: The Cultural Signifi cance of Free Software. Durham, NC: Duke University Press.
Knorr-Cetina, Karin, and Michael Mulkay, eds. 1983. Science Observed: Perspec-tives on the Social Study of Science. London: SAGE.
Latour, Bruno. 1986. “Visualization and Cognition: Thinking with Eyes and Hands.” In Knowledge and Society: Studies in the Sociology of Culture Past and Present, edited by Elizabeth Long and Henrika Kuklick, 1–40. Lon-don: JAI Press.
Latour, Bruno. 1987. Science in Action: How to Follow Scientists and Engineers through Society. Cambridge, MA: Harvard University Press.
Latour, Bruno, and Steve Woolgar. 1986. Laboratory Life: The Construction of Scientifi c Facts. 2nd ed. Princeton: Princeton University Press.
Lessig, Lawrence. 2004. Free Culture: The Nature and Future of Creativity. New York: Penguin Books.
Lynch, Michael. 1985. Art and Artifact in Laboratory Science: A Study of Shop Work and Shop Talk in a Research Laboratory. London: Routledge and Kegan Paul.
Lynch, Michael. 1993. Scientifi c Practice and Ordinary Action: Ethnomethodol-ogy and Social Studies of Science. Cambridge: Cambridge University Press.
Lynch, Michael, and Samuel Edgerton. 1988. “Aesthetics and Digital Image Pro-cessing: Representational Craft in Contemporary Astronomy.” In Picturing Power: Visual Depiction and Social Relations, edited by Gordon Fyfe and John Law, 184–220. London: Routledge.
Mackenzie, Adrian. 2005. “The Performativity of Code: Software and Cultures of Circulation.” Theory, Culture and Society 22 (1): 71–92.
Mackenzie, Adrian. 2006. Cutting Code: Software and Sociality. New York: Peter Lang.
Manovich, Lev. 2001. The Language of New Media. Cambridge, MA: MIT Press.Marcus, George. 1995. “Ethnography in/of the World System: The Emergence of
Multi-sited Ethnography.” Annual Review of Anthropology 24: 95–117.Merz, Martina. 2006. “Locating the Dry Lab on the Lab Map.” In Simulation:
Pragmatic Construction of Reality, edited by Johannes Lenhard, Günter Küp-pers and Terry Shinn, 155–172. Dordrecht: Springer.
Neuhaus, Fabian, and Timothy Webmoor. 2012. “Agile Ethics for Massifi ed Research and Visualisation.” Information, Communication and Society 15 (1): 43–65.
Oxford Dictionary of Computing. 1996. Oxford: Oxford University Press. Oxford Reference Online. Accessed May 20, 2013. http://www.oxfordreference.com/views/ENTRY.html?subview=Main&entry=t11.e4940.
Oxford English Dictionary (OED). 2013. Accessed May 24, 2013. http://oed.com.Puig de la Bellacasa, Maria. 2011. “Matters of Care in Technoscience: Assembling
Neglected Things.” Social Studies of Science 41 (1): 85–106.Rooksby, J., D. Martin and M. Rouncefi eld. 2006. “Reading as a Part of Com-
puter Programming. An Ethnomethodological Inquiry.” Unpublished ePrint. Accessed June 20, 2013. http://eprints.lancs.ac.uk/12829/.
Shapin, Steven. 1989. “The Invisible Technician.” American Scientist 77: 554–63.Sterne, J. 2003. “Bourdieu, Technique and Technology.” Cultural Studies 17 (3–4):
367–389.Thrift, Nigel. 2004. “Remembering the Technological Unconscious by Fore-
grounding Knowledges of Position.” Environment & Planning D: Society & Space 22 (1): 175–191.
Webmoor Carusi Hoel & Woolgar 1st pages.indd 38Webmoor Carusi Hoel & Woolgar 1st pages.indd 38 4/16/2014 3:29:40 PM4/16/2014 3:29:40 PM
Algorithmic Alchemy 39
T&F Proofs: Not For Distribution
12345678910111213141516171819202122232425262728293031323334353637383940414243444546
Viégas, Fernanda, Martin Wattenberg and K. Dave. 2004. “Studying Cooperation and Confl ict between Authors with ‘History Flow’ Visualizations.” Computer-Human Interaction 6 (1): 575–582.
Webmoor, Timothy. 2008. “From Silicon Valley to the Valley of Teotihuacan: The Yahoo!©s of New Media and Digital Heritage.” Visual Anthropology Review 24 (2): 183–200.
Weber, Steve. 2004. The Success of Open Source. Cambridge, MA: Harvard Uni-versity Press.
Webmoor Carusi Hoel & Woolgar 1st pages.indd 39Webmoor Carusi Hoel & Woolgar 1st pages.indd 39 4/16/2014 3:29:40 PM4/16/2014 3:29:40 PM