alcohol licensing system changes and alcohol consumption: introduction of wine into new zealand...
TRANSCRIPT
Addiction (1995) 90, 773-783
RESEARCH REPORT
Alcohol licensing system changes and alcoholconsumption: introduction of wine into NewZealand grocery stores
ALEXANDER C. WAGENAAR' & JOHN D. LANGLEY^
^Minnesota School of Public Health, Minneapolis, USA & ^Injury Prevention Research Unit,Dunedin, New Zealand
AbstractNew Zealand permitted grocery stores to sell table wine products beginning April 1990 with the implemen-tation of a new Sale of Liquor Act. The number of licensed outlets for retail sales of wine for consumptionoff-premises increased substantially. Using an interrupted multiple time-series design with nation-widequarterly alcohol sales data from 1983 to 1993, we assessed the effects of the policy change on sales of wine.Results from Box-Jenkins time-senes models revealed a 17% increase in wine sales associated with theintroduction of wine into grocery stores. Increased sales were limited to the specific category of alcoholicbeverages permitted in grocery stores—table wine. Sales of fortified wine, distilled spirits and beer did notincrease. We conclude that expansion in retail availability of wine is associated with increased sales andconsumption.
IntroductionCountries and jurisdictions within countries varyconsiderahly in terms of the numbers and typesof retail sales outlets allowed to sell heer, wine ordistilled spirits. Furthermore, alcohol controlsystems frequently incorporate limits or regula-tions on many of other dimensions, such ashours and days of sale, prices and taxes, natureof sales premises, promotion and advertising and
Dr A. C Wagetiaar, Associate Professor of Epidemiology,University of Minnesota School of Public Health, 1300 SntithSecond Street, Suite 300, Minneapolis, MN 55454-1015 USA.
DrJ. D. I^ngley is Director of the Injury Preventioti ResearchUnii, University of Otago Medical School, PO Box 913,Dunediti, New Zealand.
0965-2140/95/060773-11
other matters (Wagenaar & Farrell, 1989). Tohest reflect the reality of diverse licensing sys-tems, differences across jurisdictions should heconceptualized as a continuum of the extent ofcontrol on alcohol distribution (Janes & Grue-newald, 1991).
While recognizing the complexity of contem-porary alcohol control systems, studies to assessthe effects of alcohol regulations typically focuson alcohol consumprion responses to discretechanges in alcohol control policies. Changesstudied in recent years include lowering or rais-ing the legal age of alcohol purchase (Wagenaar,1993), changes in "dram shop" server legal li-ahility (Wagenaar & Holder, 1991a), changes in
© 1995, Society for the Study of Addiction to Alcoholand other Drugs
774 Alexander C. Wagenaar & John D. Langley
taxes or pricing policies (reviewed by Toomey,Jones-Webb & Wagenaar, 1993), introduction ofnew alcoholic beverage products (Makela, Oster-berg & Sulkunen, 1981), and introduction ofservice of liquor-by-the-drink (Blose & Holder,1987).
Assessment of the effects of alcohol controlpolicies is facilitated by the implementation ofsudden changes in such policies. Examining suchdiscrete policy changes as natural experimentspermits estimation of the effects of specific al-cohol control regulations on the alcohol market.The current study focuses on the effects of intro-ducing wine into grocery stores in New Zealand,as a result of the Sale of Liquor Act of 1989which took effect in April, 1990 (Public Law 63,1989).
Several studies of the introduction of winesales in grocery stores have appeared. Macdon-ald (1986) found increased wine sales in threeof four US states that privatized retail sale ofwine. Smart (1986) examined the effectof introduction of wine to grocer>' stores inthe Canadian province of Quebec and foundno evidence of increased wine sales. Mulford& Fitzgerald (1988) assessed the effects ofintroduction of wine sales in grocery storesin the US state of Iowa, finding no significantincreases in self-reported consumption levels orwine sales.
Wagenaar & Holder (1991b) evaluated theeffects of a 1985 policy change introducing winesales into grocery stores in Iowa, and a similar1981 policy change in the state of West Virginia.They found a 93% increase in wine sales inIowa over the first 2.5 years after the intro-duction of wine into grocery stores, and inWest Virginia wine sales increased 48%. Mulfordand associates published a second study ofthe Iowa experience using Box-Jenkins analysesof alcohol sales data (Mulford, Ledolter &Fitzgerald, 1992) and analyses of self-reportsurvey data (Fitzgerald & Mulford, 1992). Thesurvey data did not reflect a significant increasein drinking. Their time-series models indicated amodest increase in wine sales, but the authorsargue the increase decayed to pre-interventionlevels over time. Wagenaar & Holder (1993)subsequently noted several methodologicalproblems with the Mutford study, most notablyfailure to control for national trends in alcoholsales over this period.
In summary, a number of studies indicated
that introduction of wine into grocery storesincreased sales and consumption of wine. Thepurpose of the current study is to evaluate theexperience in another country, namely NewZealand, that recently introduced wine into gro-cery stores.
The New Zealand Sale of Liquor Act contains132 pages with detailed specification of processesfor application and operation of each type ofalcohol sales licence, and has been described indetail by Dormer, Sherriff & Crookston (1990).The Act clearly liberalizes conditions for alcoholsales, and eliminates numerous restraints on li-censees that had been in place since the Sale ofLiquor Act of 1962. While the Act requires rela-tively few restrictions on licenses, local licensingauthorities are permitted to place significant addi-tional restrictions on licensees. Local licensingauthorities also can more easily deny the renewalof a licence if the operation of the premises hasbeen inconsistent with stated conditions of licen-sure. Dormer et al. (1990) describe it as an "easyto get, easy to lose" alcohol outlet licensingphilosophy. The nation-wide chairman of theLiquor Licensing Authority similarly notes thatthe Act is described as an "easy come, easy go"licensing process, but notes that "the 'easy go'aspect of the Act has not really proved to be so",given that only two licence suspensions havebeen implemented to date (Alcoholic Liquor Ad-visory Council, 1993). Imposition of additionalrestrictions typically occurs as a result of activeparticipation of community residents, health pro-motion workers and local police in public hear-ings and related dimensions of the licensingprocess (Stewart et al., 1994).
The most noteworthy changes from prior al-cohol control policy in New Zealand include arelaxation of conditions for obtaining on-prem-ises alcohol sales licences, extension in the allow-able hours of sale and licensure of grocery storesfor sales of wine. After the Act, wine was permit-ted to be sold in conventional grocery stores thatmet minimum size requirements. The Act didnot permit wine to be sold in small conveniencestores.
MethodsDesignWe used a time-series quasi-experimental designto assess the effect of the Sale of Liquor Act on
Alcohol licensing changes in New Zealand 775
alcohol sales in New Zealand. The design can beillustrated as follows:
O| O2O, O2
O,,
where each O, represents the quantity of alcoholsaleSj n is the number of quarters before thepolicy change X, and m is the number of quar-ters after the policy change. The second rowrepresents a control or comparison series notexpected to be infiuenced by the policy changeunder study. We used two comparison series—quarterly sales of beer and quarterly sales ofdistilled spirits, which were not affected by theSale of Liquor Act to the degree that wine was.
The time-series quasi-experimental designprovided important advantages above and be-yond conventional pre/post evaluations. Time-series provided additional assurance thatconditions just before the intervention were notatypical, reducing risk of regression-to-the-meaneffects. Similarly, the time-series design permit-ted assessment of whether initial effects of thepolicy change were maintained or decayed overtime. The time-series design provided increasedcontrol over contemporaneous unanticipatedevents occurring during policy implementation,by allowing statistical controls for such eventsthat are not possible with simple pre/post de-signs. In the current study we controlled formacro-economic conditions by including nation-wide employment data in outcome models, fortwo reasons. First, alcohol use is known to beaffected by price, income and general economicconditions (Wagenaar & StrefF, 1989; Toomey eial., 1993), and secondly, economic conditionschanged significantly in New Zealand over thepast decade. Finally, a time-series design withcontemporaneous control groups has the highestlevels of internal validity possible in the absenceof random assignment, maximizing confidence ina causal interpretation of observed relationships(Cook & Campbell, 1979).
DataData on the quarterly volume of alcoholic bever-ages sold in the form of beer, wine and distilledspirits, and the consumer price index for wine,were obtained from the New Zealand Depart-ment of Statistics from the third quarter of 1983to the second quarter of 1993. Ethanol contentof beverages has varied in recent years, with theexpansion of the market for low-alcohol beers,
for example. Therefore, we also obtained data onthe quarterly sales of each type of beverage inunits of pure ethanol, to control for variationsover time in the sales of beverages of differingethanol concentrations.
Data on the type of alcohol outlet from whichwine was purchased were also obtained from theNew Zealand Department of Statistics, based ona continuing series of national household expen-diture surveys. Each annual survey wave repre-sents interviews completed from 1 April of agiven year to 31 March of the following year.
Data on the number of alcohol outlet licencesin force and newly issued were obtained from theNew Zealand Department of Justice. Data on thenumber of employed persons, based on a nation-wide quarterly general population survey, was ob-tained from the New Zealand Department ofStatistics for the 1985 to 1993 period. Such dataare unavailable prior to the last quarter of 1985.
Statistical analysesWe used the Box-Jenkins intervention-analysisstrategy, beginning with identification orspecification of a parsimonious Auto-regressiveIntegrated Moving Average (ARIMA) model foreach dependent time-series variable. TheARIMA model is not based on a theory of thecauses of the series. It is a model to describe thenature of the ongoing regularities in the seriescaused by any number of factors. The ARIMAmodel for each outcome variable, therefore, wasdetermined empirically by an examination of aseries of observations of that particular variablefollowing the standard identification, estimation,evaluation strategy outlined by Box & Jenkins(1976). To reduce heteroscedasticity we trans-formed each series taking the natural logarithms.All series were well-modelled with an ARIMA(0,0,0)(0,l,l)4 model.
Transfer functions representing hypothesizedeffects of the intervention were then added to theARIAIA model, and each full model was esti-mated using the backcasting Gauss-Marquardtmaximum-likelihood estimation routines imple-mented in the software package BMDP2T. Eachintervention model was re-estimated with theaddition of a transfer function controlling for theeffects of economic conditions as measured bythe unemployment rate, to ensure that observedresults were not confounded by the effects ofchanging economic conditions.
All estimated models were evaluated using

776 Alexander C. Wagenaar & John D. Langley
several conventional criteria. First, all estimatedparameters meet conditions of stationarity orinvenibility required for the particular modelunder consideration (Box & Jenkins, 1976). Sec-ondly, estimated parameters of the ARIMA com-ponent were all significantly different from zero.Thirdly, correlations among the parameters werenot excessive, indicating no redundancy in themodel specified. Fourthly, overall flatness of theautocorrelation function of the residuals wasdocumented by a non-significant Q-statistic(Ljung & Box, 1976). Fifthly, residual autocorre-lation functions did not reveal significant correla-tions at the first few lags or the first seasonal lag.Sixthly, parameter estimates were interpretablein terms of theoretical expectations and knowncharacteristics of the dependent variable.
ResultsShortly after the Sale of Liquor Act of 1989 tookeffect in April 1990 there were 6295 pre-existingalcohol outlet licences in the country that wereconverted to the new licensing system. Thenumber of licensed premises was substantiallylower, because many premises had multiple li-cences. For example, one licence is needed toserve alcohol for consumption on the premises,and another to sell for carry-out. In the first 27months under the new Act, 608 newly licensedoff-premises alcohol outlets opened. Assumingthe ratio of licences to premises is 2:1, we esti-mate that the number of off-sale outlets in-creased by approximately a quarter as a result ofthe new law, most being grocery stores nowpermitted to sell table (but not fortified) wine.
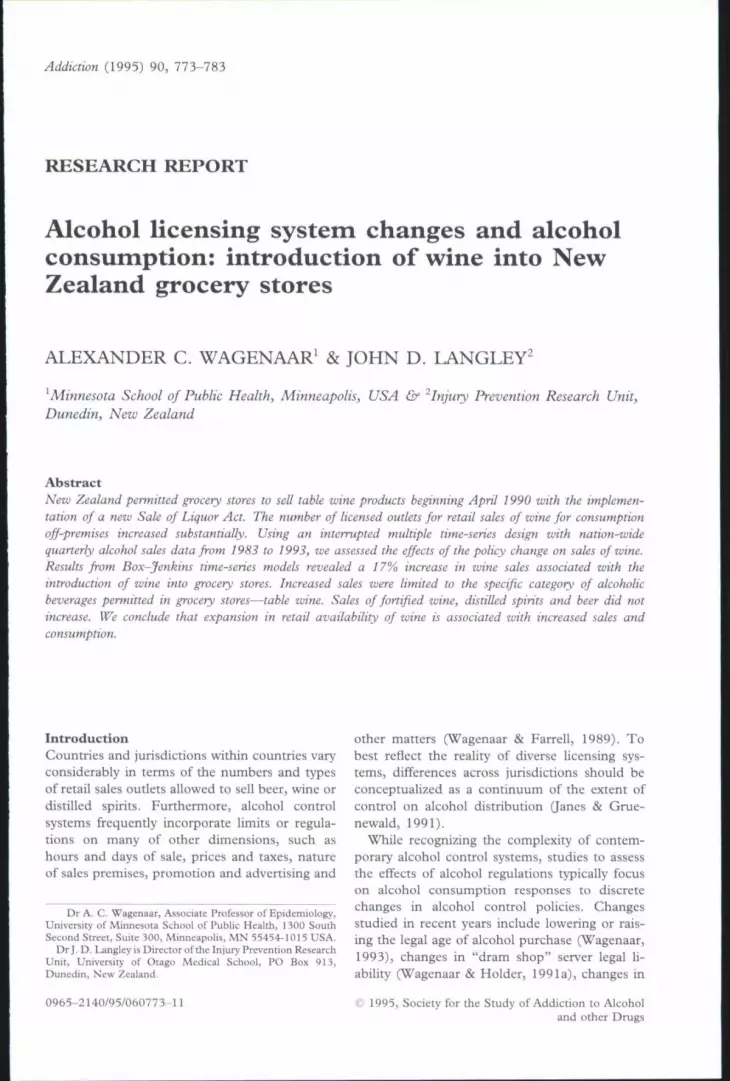
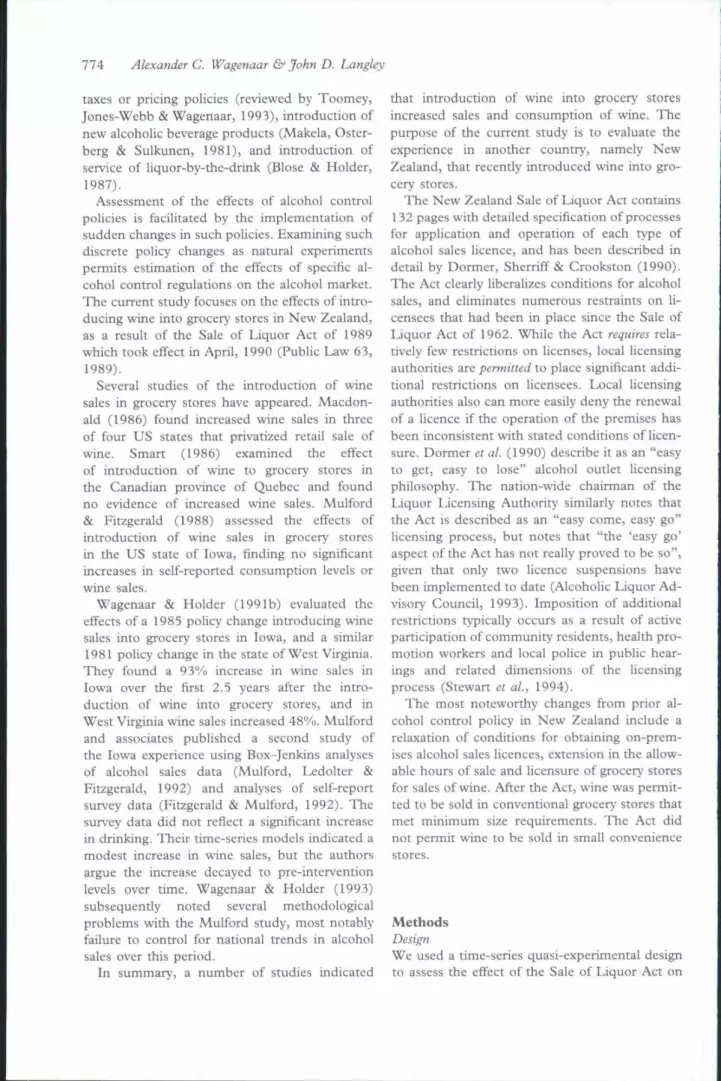
After controlling for normal seasonalfiuctuations with time-series models, the volumeof wine sold in New Zealand increased by anestimated 17% after the Sale of Liquor Act wasimplemented (Table 1). After controlling forchanges in ethano! content of wine sold, theestimated increase was slightly smaller, 11 %(Fig. 1). Total intake of ethanol in the form ofwine increased less than total volume of winebecause fortified (i.e. higher alcohol content)wine sales declined in recent years, while tablewine experienced a substantial increase after theSale of Liquor Act (Fig. 2). This pattern isconsistent with expectations, given that onlytable wine, not fortified wine, was introducedinto grocery stores. It may be that some con-sumers who previously may have purchased
fortified wines at a liquor store may have shiftedtheir consumption to table wine which is nowmuch more accessible. The downward trend infortified wine sales, however, began before theSale of Liquor Act took effect. The Act clearlyhad effects well beyond a shift from fortified totable wine, since overall consumption of pureethanol in the form of wine increased 11%.
Full implementation of the Sale of Liquor Acttook some time, and all the new table wineoutlets were not instantly operational in April1990. We therefore considered whether a grad-ual-impact transfer function model would fitthese data better than an abrupt-impact model(Gottman. 1981). Results showed that a grad-ual-impact model fit the data equally well as theabrupt-impact model (both R̂ = 0.83). More-over, the estimated asymptotic effect from thegradual-impact model was identical to the effectestimated with the abrupt-impact model (i.e.11"/.) increase in wine sales in units of pureethanol). The size of the growth parameter esti-mate was such that 90% of the Act's effects wereevident within six quarters, consistent with ourknowledge of the time when increasing numbersof grocery stores carried wine products. Onepotential reason the gradual-impact and abrupt-impact models produced the same results is thecombination of somewhat gradual growth in li-censed outlets with sudden wholesale wine salesincreases as new outlets are initially stocked.Thus, the temporarily heightened sales due tostocking (a decaying impact curve) combinedwith a gradual increase in outlets (a convexgrowth curve) sums to an abrupt-impact effect.
To isolate whether the increase in wine con-sumption was part of broader trends in alcoholuse in New Zealand, we also examined spiritsand beer consumption (Table 1, Fig. 1). Thepoint estimates suggest an 8% decline in spiritsconsumption during the period that wine salesincreased, but the decline is not statisticallysignificant. Also, the point estimates for spiritsvolume and spirits ethanol were identical,reflecting the lack of change in average ethanolconcentration of spirits sold during this period.The volume of beer sold declined 6%. The de-cline in beer consumption is apparently associ-ated with numerous efforts to reducealcohol-impaired driving in the early 1990s, suchas a national host responsibility campaign (He-witt, 1993) and compulsory random roadsidebreath-testing (Bailey, 1993). Because of these
Alcohol licensing changes in New Zealand 111
Table 1. Estimated effect of introduction of wine in grocery stores in Nevi Zealand: time-series model results withoutemployment covariate
Model
95% Confidence intervalStandard Per cent
Estimate error change Low High
Wine ethanolARIMA (0,0,0)(0,l,l)4Adjusted j ; ^ = 0.83 Q= 5.3 @ lag 8 0.102 0.027 10.7 3.9 18.1
Wine volumeARIMA (0,0,0)(0,1,1)4Adjusted R^ = 0.84 Q = 4.5 (Sj lag 8 0.158 0.027 17.1 9.8 24.9
Spirits volumeARIMA (0,0,0)(0,1,1)4Adjusted ft^-0.64 Q-4.1 @ lag 8 -0.087 0.041 -8.3 - 16.7 0.9
Spirits ethanolARIMA (0,0,0)(0,1,1)4Adjusted i;^ = 0.64 Q = 4.1 (a) lag 8 -0.087 0.041 -8.3 - 16.7 1.0
Beer volumeARIMA (0,0,0)(0,1,1)4Adjusted R^ 0.82 Q = 2.2 @ lag 8 -0.061 0.018 -5.9 9.8 -1.9
Beer ethanolARIMA (0,0,0)(0,l,t)4Adjusted R^ - 0.84 Q = 4.4 (fl! lag 8 -0.063 0.018 6.1 - 10.0 -2.1
Total ethanolARIJUA (0,0,l)(0,1,1)4Adjusted R^ = 0.93 Q = 6.2 @ lag 8 - 0.025 0.020 - 2.4 - 6.9 2.3
Percentage change is based on (e'" - 1)100, since dependent variables were natural logarithms of the raw series.
other efforts, focused particularly on youngmales, who are predominantly beer drinkers, it isdifficult to isolate whether the introduction ofwine into grocery stores and the increased winesales that resulted represents a beverage substi-tution effect. We believe it is more plausible toattribute the modest declines in beer sales toother simultaneous effects rather than to theintroduction of wine into grocery stores, primar-ily because previous studies using control groupsof similar jurisdictions found little evidence ofsubstitution effects. In the New Zealand case,time-series analyses of total ethanol sales re-vealed no significant change at the time of theimplementation of the Sale of Liquor Actin April, 1990 (Table 1). The modest declinein the much larger beer market offset thesignificant increase in the wine market. Extantdata are not adequate to address the beveragesubstitution hypothesis definitively in the NewZealand context.
Not only is there potential substitution acrossbeverage types, but grocery store sales of winemight in part reflect sales obtained at the ex-pense of other types of outlets. Analyses ofnation-wide expenditure survey data revealed
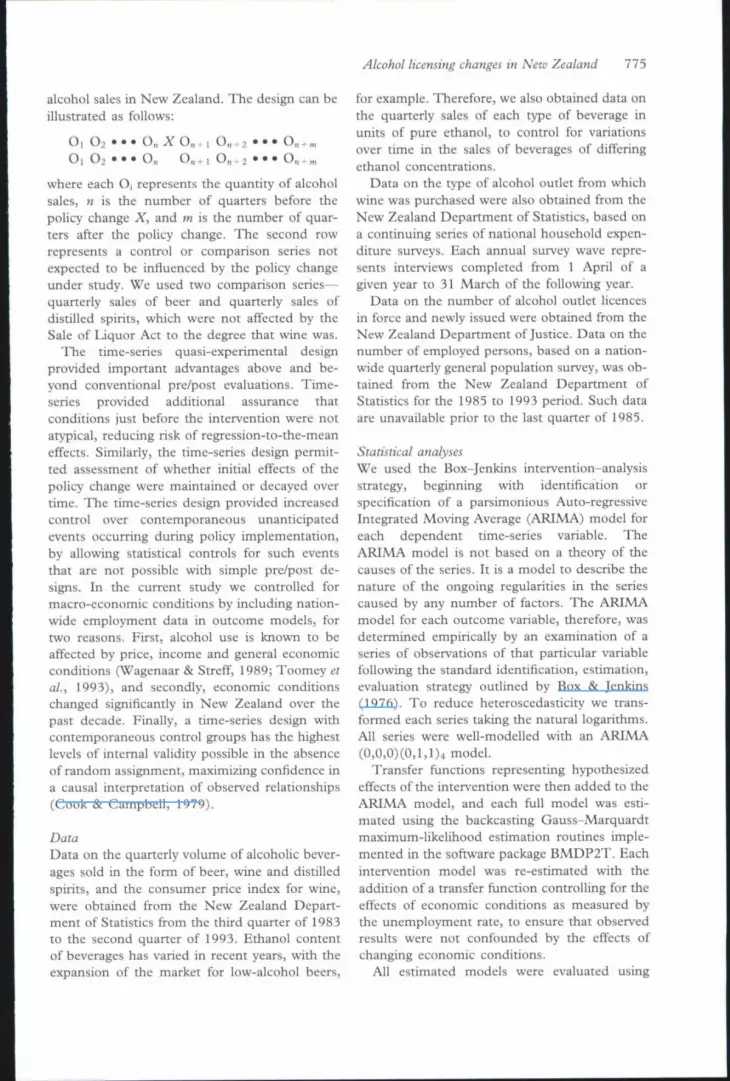
that introduction of wine into grocery stores lednot only to an increase in the quantity of winesoldj but also a shift in sales from liquor stores togrocery stores (Fig. 3). Before wine was allowedin grocery stores 25% of all wine sales were fromliquor stores, but that fraction declined to 11%afterwards. After the new policy was imple-mented, a quarter of all wine sales were viagrocery stores. In short, not all grocery storesales of wine represent "new" sales that wouldnot have occurred without the policy change.Grocery store sales of wine represent the combi-nation of two effects—additional wine sales asso-ciated with the new policy and sales that wouldhave occurred previously via liquor stores thatnow occur via grocery stores.
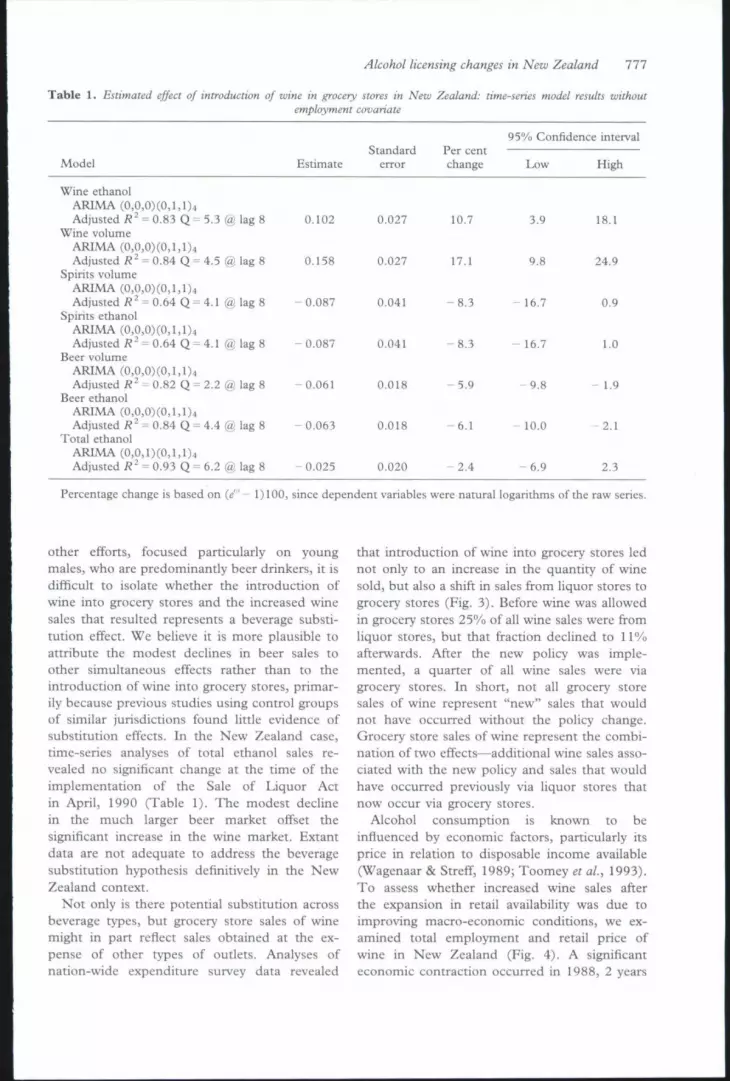
Alcohol consumption is known to beinfiuenced by economic factors, particularly itsprice in relation to disposable income available(Wagenaar & Streff, 1989; Toomey et al., 1993).To assess whether increased wine sales afterthe expansion in retail availability was due toimproving macro-economic conditions, we ex-amined total employment and retail price ofwine in New Zealand (Fig. 4). A significanteconomic contraction occurred in 1988, 2 years

778 Alexander C. Wagenaar & John D. Langley
2300 T Wine
1800
1300
1983 1984 1985 1986 1987 1988 1989 1990 1991 1992 1993
Figure 1. Alcohol sales in New Zealand (liters of pure ethanol).
before the Sale of Liquor Act took effect, withrelatively little change since that time. As a re-sult, increased wine sales after its introductioninto grocery stores in 1990 cannot be attributedplausibly to changes in economic conditions. Were-estimated all time-series models after adding a
covariate to control for the state of the economy.Resulting estimated effects of the Sale of LiquorAct were essentially the same as the initial mod-els (Table 2). Thus, our initial conclusion, thatchanging economic conditions did not explainincreased wine consumption after sales were al-

2750 4
2250 -
1750--
1250-
Alcohol licensing changes in New Zealand 179
Fortified
Table
1983 1984 1985 1986 1987 1988 1989 1990 1991 1992 1993
Figure 2. Wine sales in New Zealand,
lowed in grocery stores was substantiated. Simi-larly, there was a noticeable increase in wineprices from the early 1980s to the late 1980s, butmuch less change in the 2 years before or 2 yearsafter the introduction of wine in grocery stores(Fig. 3). There was a slight temporary decline inwine prices in 1991. Given that wine prices didnot increase in line with the overall CPI, in-creased wine sales after privatization may in partbe due to the lower prices that resulted fromincreased competition among outlets.
DiscussionResults of analyses of introduction of wine intogrocery stores has confirmed what has been
found in North America. Wine sales increasedsignificantly when the number of outlets in-creased as a result of a change in licensing policy.Furthermore, the increase was specific to theparticular class of beverage whose availability isincreased. In the New Zealand case, only tablewine was introduced into grocery stores, andonly table wine exhibited a significant increase insales—not other wine, distilled spirits or beer.
Quasi-experimental time-series studies usingavailable archival records have high levels ofinternal validity, but are frequently limited intheir ability to identify and measure the specificmechanisms for observed effects. In the presentcase information on several expected interveningvariables further strengthens confidence in acausal interpretation of the observed increases in

780 Alexander C. Wagenaar & John D. Langley
100
80
60
40
20
Other
Wine Store
Liquor Store
On-SaieI I I I I I II
32
24
25
13
Other
Wine Store
Liquor Store
I [rrTTTTTTOn-Saie
Grocery Store
27
Other
Wine Store
Liquor Store-
I 1 I I I i I I IOn-Saie
iGrocery Store \
29
22
24
Other
Wine Store
Liquor Store
i Grocery Store ̂
27
19
11
11
27
1989 1990 1991 1992Figure 3. Wine purchases by outlet type (New Zealand Nation-wide Expenditure Survey).
Table 2. Estimated effect of introduction of wine in grocery stores in New Zealand: ttme-senes model results with employmentcovariate
95% Confidence interval
Mode! EstimateStandard Per cent
error change Low High
Wine ethano!ARIMA (0,0,0)(0,l,!)4Adjusted ff^= 0.86 Q - 5 . 3 @ lag 8 0.145 0.033 15.6 6.7 25.2
Wine volumeARIMA CO,0,0)(0,1,1)4Adjusted/;^ = 0.87 Q = 4.5 @ lag 8 O.!6O 0.035 17.4 8.0 27.7
Spirits volumeARIMA (0,0,0)(0,l,l)4Adjusted K^ = 0.78 Q = 4.1 @ lag 8 -0.082 0.058 7.9 -19.8 5.7
Spirits ethanolARIMA (0,0,0) (0,1,1)4Adjusted ff^-0.78 Q = 4.1 («i lag 8 - 0.082 0.058 -7 .9 19.7 5.8
Beer volumeARIMA (0,0,0)C0,1,1)4Adjusted R^ = 0.87 Q = 2.2 @ !ag 8 - 0.045 0.021 - 4.4 9.0 0.4
Beer ethanolARIMA (0,0,0)(0,1,1)4Adjusted R^ = 0.86 Q= 4.4 @ lag 8 -0.041 0.022 -4.1 -8 .9 1.0
Total ethanolARIMA (O,O,l)(O,l,1)4Adjusted R^ - 0.93 Q= 6.6 @ lag 8 -0.016 0.025 1.6 -7 .3 4.6
Percentage change is based on (e" 1)100, since dependent variables were natural logarithms of the raw series.

15900
Alcohol licensing changes in New Zealand 781
Employment
1983 1984 1985 1986 1987 1988 1989 1990 1991 1992 1993
Figure 4. Employment and wine consumer price index in Nev: Zealand.
wine sales. First, we have documented that thenumber of off-sale outlets increased substantiallyshortly after the Sale of Liquor Act took effect.Secondly, the retail price of wine in real (i.e.inflation-adjusted) terms declined after wine wasintroduced into grocery stores—an expected re-sult of the increased competition concomitantwith significant increases in the number of out-lets. We know from an extensive literature thatwine consumption is price elastic, such that thereduction in retail prices would be expected toresult in increased consumption. TTiirdly, a se-ries of in-depth qualitative interviews with NewZealand residents revealed that consumers (es-pecially women) were more comfortable buyingwine from grocery stores than from separate
liquor stores (Wyllie et al.., 1993). Consumersreported the advantage of disguising purchases ofwine in a cart full of groceries, in contrast tofrequenting a liquor store where the purchase ofalcoholic beverages is obvious. Such commentsreflect a social norm restraining wine consump-tion, since some consumers apparently felt self-conscious about being publicly identified aspurchasing wine. Easy availability of wine ingrocery stores may have reduced the restraininginfluence of such norms. Finally, consumers re-poned being less cognizant of personal expendi-tures for wine because its cost is buried in alarger overall grocery bill (Wyllie et al., 1993),This effect may be enhanced by the simulta-neous emergence of widespread use of electronic
782 Alexander C. Wagenaar & John D. Langley
debit cards rather than cash in major grocerystores. In short, available data on numbers ofoutlets and retail price of wine, along with re-ports of New Zealand consumers on theirperceptions and practices regarding wine pur-chases, al! provide a consistent and plausibleview of the mechanisms for the effect of the Saleof Liquor Act on table wine consumption inNew Zealand.
The magnitude of the effect of the introduc-tion of wine into grocery stores in New Zealandis smaller than the efFect found in most NorthAmerican jurisdictions studied in detail to date.There are several possible explanations. First,New Zealand is an island nation with no popu-lation at its borders. Therefore, having wine con-veniently available in grocery stores withconcomitant lower prices could not attract pur-chasers from adjacent jurisdictions where wine isnot as readily available. This is in contrast toNorth America, where sales could potentially beinflated by cross-border purchasers. However,note that Wagenaar & Holder (1991b) found noevidence that increased wine sales in Iowaand West Virginia were due to border-crossingpurchasers. Secondly, the New Zealand Saleof Liquor Act included provisions in additionto the introduction of wine into grocerystores, some of which may have a restrainingefl'ect on alcohol sales. At a minimum ofonce every 3 three years, each licensee is re-viewed by a local licensing authority priorto renewal of the licence. The review processencourages responsible alcohol selling practicesby licensees. Thirdly, there are a number ofother major efforts under way in New Zealandin the early 1990s designed to reduce exces-sive alcohol consumption and associatedproblems. Such efforts include a nation-wideprogramme encouraging "host responsibility"designed to reduce intoxication (Hewitt, 1993),random roadside breath-testing of motoristsand other drink-driving countermeasures(Bailey, 1993).
In conclusion, the increased availability oftable wine in New Zealand was associated withsignificantly increased wine consumption. Giventhat comparison measures not as affectedby the new policy—such as fonified wine, spiritsand beer—did not increase and, given evidenceconcerning plausible mechanisms of effect,the increased consumption of table wineappears to be a result of the change in alcohol
availability policy permitting wine to be sold ingrocery stores.
ReferencesALCOHOLIC LIQUOR ADVISORY COUNCIL (1993) Pro-
moting host responsibility in law: An interview withLiquor Licensing Authority chairman Judge Gatley,Sol Talk, 3, 3.
BAIIJ;Y, J. P . M . (1993) A Preliminary Evaluation ofCompulsory Breath Testing in New Zealand Using Am-bulance Data (Porirua, New Zealand, Institute ofEnvironmental Health and Forensic Sciences).
Box, G, E. P. & JENKINS, G . M . (1976) Time SeriesAnalysis: Forecasting and Control (San Francisco,Holden-Day, Inc.),
BmsE, J. O. & HouJER, H. D. (1987) The publicavailability' of distilled spirits: structural and reportedconsumption changes associated with liquor-hy-the-drink, Joumai of Studies on Alcohol, 48, 371-379.
COOK, T . D . & CAMPBELL, D . T . (1979) Quasi-Exper-imentation. Design and Analysis Issues for Field Settings(Chicago, Rand McNatly College Publishing Com-pany).
DORMER, A., SHERRIFF, A. G. & CROOKSTON, J, C.(1990) Sale of Liquor (Wellington, New Zealand,Brooker & Friend).
FITZGERALD, J. L. & MULFORD, H . A. (1992) Conse-quences of increasing alcoho! availability: The Iowaexperience revisited, British Joumai of Addiction, 87,267-274.
Gii-SBRECHT, N, & MACDONALD, S . (1981) A ban onfortified wine in northwestern Ontario and its impacton the consumption level and drinking pattems,British Joumai of Addiction, 76, 281-288.
GOTT.MAN, J. M. (1981) Time series-analysis, in: AComprehensive Introduction for Social Scientists (NewYork, Cambridge University Press).
HEWITT, J. (1993) Host Responsibility: Where are weup to? Conference on Alcohol and Road Safety: ACommunity Challenge, Auckland, New Zealand.
JANES, K . & GRUHNEWAtj}, P. J. (1991) The role offormal law in alcohol control systems: a comparisonamong states, American Joumai of Drug and AlcoholAbuse, 17, 199-214.
LjUNO, G. & Box, G. B. P. (1976) Studies in the Model-ing of Discrete Time Series 3, Technical Report 477(Madison, WI, University of Wisconsin, Departmentof Statistics).
MACDONAtJj, S. (1986) The impact of increased avail-ability of wine in grocery stores on consumption:Four case histories, British Joumai of Addiction, 81,381-387.
MAKiitj\, K., OSTERBERO, E, & SULKUNI-N, P. (1981)Drink in Finland: Increasing alcohol availability in amonopoly state. Alcohol, Society, and the State 2: TheSocial History of Control Policy in Seven Countries(Toronto, Addiction Research Foundation).
MULFORD, H . A. SE FITZGERAIJ), J. L. (1988) Conse-quences of increasing off-premise wine outlets inIowa, British Joumai of Addiction, 83, 1271-1279.
MULFORD, H . A,, LEDOLIER, J. & FITZGERALD, J. L,
(1992) Alcohol availability and consumption: IowaSales Data Revisited, Joumai of Studies on Alcohol,53, 487-494.
Alcohol licensing changes in New Zealand 783
, R. G. (1986) The impact on consumption ofselling wine in grocery stores. Alcohol & Alcoholism,21, 233-236.
SiHWARl, L., CASSWiiLL, S. & DUIGNAN, P. (1994)Using evaluation resources in a community actionproject: formative evaluation of public health inputinto the implementation of the New Zealand Saleof Liquor Act, Contemporary Drug Problems, 21, 681-704.
TooMEY, T. L , JONES-WEBB, R. & W.\GENAAR, A. C.
(1993) Policy—alcohol Annual Review of AddictionResearch and Treatment, 3, 279-292.
WAGFN.'VAR, A. C . (1993) Minimum drinking age andalcohol availability to youth: issues and researchneeds. Research Monograph 25: Economics and theprevention of Alcohol-Related Problems, Backgroundpapers, pp. 1-14, pp. 175-200 (National Institute onAlcohol Abuse and Alcoholism).
WAGliNAAR, A. C. & FARREII,, S . (1988) Alcohol bever-age control pohcies: their role in preventing alcohol-impaired driving. Surgeon General's Workshop on
Drunk Driving (Washington, DC, US Department ofHealth and Human Services)..̂ GENAAR, A. C. & HoLDKR, H, D. (1991a) Effects ofalcoholic beverage server liability on traffic crashinjuries. Alcoholism: Clinical and Experimental Re-search, 15, 942-947.
AAR, A. W. & HOLDER, H . D . (1991b) A changefrom public to private sale of wine: Results fromnatural experiments in Iowa and West Virginia, Jour-nal of Studies on Alcohol, 52, 162-173.
WAGENAAR, A.C. &HOIX)[-;K, H . D . (1993) A responseto Mulford, Ixdolcer and Fitzgerald (correspon-dence), Joumai of Studies on Alcohol, 54, 251-252,
WAGKNAAR, A. C . & STREFF, F . M . (1989) Macroeco-nomic conditions and alcohol-impaired driving,Joumai of Studies on Alcohol, 50, 217-225,
WYLLIE, A., HOLIBAR, F . , JAKOB-HOFF, M . &
CASSWEIi., S, (1993) A qualitative investigation ofresponses to the introduction of wine in NewZealand grocery outlets. Contemporary Drug Prob-lems, 20, 33-49.
