ajp- 00651-2003accepted version
TRANSCRIPT

The effect of fasting on the 2OV& and fH relationship in king penguins, Aptenodytes
patagonicus
AJP- 00651-2003-Accepted version
Fahlman1, A., Y. Handrich2, A.J. Woakes1, C-A. Bost2, R. Holder3, C. Duchamp4, and
P.J. Butler1
1School of Biosciences The University of Birmingham
Edgbaston, Birmingham B15 2TT, United Kingdom
2 Centre d’Ecologie et Physiologie Energétiques, C.N.R.S. 23 rue Becquerel, 67087 Strasbourg
Cedex 02, France
3School of Mathematics and Statistics The University of Birmingham
Edgbaston, Birmingham B15 2TT, United Kingdom
4 Physiologie des Régulations Energétiques, Cellulaires et Moléculaires C.N.R.S. - Université C. Bernard Lyon F-69622 Villeurbanne Cedex, France
Running Head: Physiological effects of fasting in king penguins
Address for correspondence P.J. Butler: School of Biosciences The University of Birmingham Edgbaston, Birmingham B15 2TT, United Kingdom
Current address for A. Fahlman, CRESE- School of Medicine and Biomedical
Sciences, State University of New York at Buffalo, 124 Sherman Hall, 3435 Main
Street, Buffalo, NY 14214, USA, e-mail: [email protected]
Articles in PresS. Am J Physiol Regul Integr Comp Physiol (June 3, 2004). 10.1152/ajpregu.00651.2003
Copyright © 2004 by the American Physiological Society.

2
Abstract
King penguins (Aptenodytes patagonicus) may fast for up to 30 days during their
breeding period. As such extended fasting may affect the relationship between the rate
of oxygen consumption (2OV& ) and heart rate (fH), five male king penguins were
exercised at various speeds on repeated occasions during a fasting period of 24-31
days. In addition, 2OV& and fH were measured in the same animals during rest in cold
air and water (4° C). Resting 2OV& and fH and
2OV& during exercise decreased with
fasting. There was a significant relationship between 2OV& and fH (r2 = 0.56), which
was improved by including speed, body mass (Mb), number of days fasting (t) and a
cross term between fH and t (r2 = 0.92). It was concluded that there was a significant
change in the2OV& and fH relationship with fasting during exercise. As t is measurable
in the field and was shown to be significant and, therefore, a practical covariate, a
regression equation for use when birds are ashore was obtained by removing speed
and Mb. Using this equation, predicted 2OV& was in good agreement with the observed
data, with an overall error of 3.0%. There was no change in the ƒH/2OV& relationship in
penguins at rest in water.
Key Words: Sea bird, exercise, fH-technique, metabolic rate, body composition

3
Introduction
The use of heart rate (fH) to estimate metabolic rate in the field has recently
received much attention (15, 18, 22, 29) and is based on the relationship between rate
of oxygen consumption (2OV& ) and fH as formulated in the Fick equation for
convection of O2 in the cardiovascular system (5). Unfortunately, it cannot always be
assumed that the relationship between ƒH and 2OV& for a species remains the same
under all conditions. The relationship may be affected by several factors such as
gender (15), type and level of activity (7, 29), physiological state (fasting, breeding,
molting, 15, 18), and seasonal changes (23).
In king penguins (Aptenodytes patagonicus), the relationship was
significantly different between males returning from a foraging trip and males that
had been on the nest with a chick for 14 to 17 days (15). It was postulated that this
difference was the result of the animals’ fasting when ashore and probably resulted
from a change in body composition. Thus, the aim of the present study was to test the
hypothesis that the relationship between fH and 2OV& changes during fasting in king
penguins. This was achieved by determining the 2OV& and fH relationship at various
levels of exercise on a treadmill at repeated intervals in five male king penguins
during an extended fasting period. As the animals alternate periods ashore with
periods at sea during the breeding period, resting 2OV& and fH were also determined in
air and water for the same animals in a separate experiment.

4
Materials and Methods
Animals
Ethical approval for all procedures was granted by the Ethics Committee of
the French Polar Research Institute (IPEV) and of the Ministère de l’Environnement.
We also carefully followed the requirements of the United Kingdom (Scientific
Procedures) Act 1986, especially those set out by the Home Office in the Official
Guidance on the operation of the Act. As our benchmark, we followed guidance to
researchers using similar methods in the UK.
The experiments were carried out on Possession Island (Crozet Archipelago
46o25’ S, 51o45’ E) over the Austral summer 2002-2003. A total of five courting male
king penguins were used in the experiments. Gender was determined by the song (24)
and later confirmed by genetic analysis (Avian Biotech International, Truro,
Cornwall). All birds were caught directly on the beach, outside the breeding site, in
early February at the beginning of courtship. Thus, these animals were late breeders.
At this stage in the courtship, mate choice had not been made, and the female
immediately underwent courtship with other partners. The birds were caught in the
afternoon the day before the first experiment and were then weighed. Only birds with
an initial mass > 13.0 kg were used in the experiments, a body mass known to allow
male king penguins to fast for at least one month while incubating the egg (17). The
lengths of the flipper (Lflipper), bill (Lbill) and foot (Lfoot) were taken according to
standard techniques (31). Repeated measurements of Lflipper, Lbill, and Lfoot were made
to reduce measurement errors, and all measurements were made on the left side of the
animal. A 0.3 ml blood sample from the brachial flipper vein was taken for gender
determination. Each bird was fitted with a temporary plastic flipper band for

5
recognition and placed in a wooden enclosure (size 3 m x 3 m) where it was kept for
the duration of the fasting period.
All experimental birds repeated a treadmill test 5 times (treadmill
experiments) over a period of 24-31 days (including the first day of capture, Tables 1
and 2). Throughout the fasting period the animals had no access to water other than
from rain fall. Each bird had at least 3 and at most 9 days of rest before repeating the
treadmill test and the numbers of days of fasting before each test are summarized in
Table 2. In addition, the2OV& and fH of each bird were measured in air and water
(air/water experiment) during rest at 4° C twice throughout the fasting period (tests A
and B). Body mass (Mb,) was determined for each animal prior to each experiment
(Table 2). The mean (± 1 SD) Mb of the birds during tests A and test B were 12.1 ±
0.6 kg and 10.4 ± 0.5 kg, respectively. The animals had fasted for 5-12 days (mean
10.0 ± 3.9 days) and 11-25 days (mean 22.6 ± 1.3 days) before tests A and B
respectively.
Body mass of each bird was continuously monitored to detect any increase in
the mass specific daily change in body mass (dMb/Mb · dt), a sign that the animal is
entering a metabolic state of high protein breakdown, the so-called phase III of
fasting, which is associated with a signal to re-feed and abandon the egg (19, 27). At
the transition between phases II and III, Mb decreases below a critical body mass
(cMb; 20). In the present study, the mean Mb upon release was 7% above the cMb
(Table 1) as defined by Gauthier-Clerc et al. (17), and no increase of dMb/Mb · dt was
detected in any bird just before their release into the wild after completion of the
experiment. Thus, the birds were either in phase I or phase II of fasting during the
experiments.

6
Experimental protocol
At the start of each test, the animal was fitted with an externally mounted heart
rate data logger (HRDL, (33) placed in a protective plastic casing (size: 30 x 36 x 12
mm, mass: 28 g) as detailed in Froget et al (15). The HRDL calculated and stored the
average fH once per second.
After attaching the logger, the animal was placed in the respirometer, which in
turn was placed behind a curtain to prevent disturbance of the animal due to
movement of the observer. A hole in the curtain allowed continuous observation of
the penguin. The bird was allowed to rest in the respirometer for at least 1 h until
stable2OV& and
2COV& readings were obtained over at least 20 min. Next, the penguin
was walked on the treadmill that was the floor of the respirometer at one of 5 different
speeds (U, 0.3, 0.7, 1.0, 1.5, 1.8 km • h-1). The sequence of walking speeds was
assigned at random between birds, but the sequence of speeds was the same within
birds between tests. There was no attempt to walk the animals at their maximum
sustainable speed. The animal walked at each speed until steady values for 2OV& and
2COV& were obtained for at least 5 min, usually within 15-20 min after starting to walk.
Each walking session at a given speed was separated by a period of rest, with the bird
left undisturbed until 2OV& and
2COV& had again reached resting values.
All tests were performed at the same time of the day and were completed
before noon. This was to avoid possible diurnal effects and to reduce the effect of the
outside temperature on the temperature inside the respirometer.
Respirometry in the treadmill experiments

7
Rates of O2 consumption and CO2 production when the birds were on the
treadmill were measured using a flow-through respirometer system, similar to that
used by Froget et al (15), but with a few modifications.
The internal dimensions of the respirometer, including frame and Plexiglas
box, were 80 cm x 46 cm x 86 cm (≈ 316 l, length x width x height). The excurrent
flow rate was ~ 80 l • min-1 and a sub sample of this gas passed via a canister of
anhydrous CaSO4 (W.A. Hammond Drierite Co., Xenia, Ohio) to a paramagnetic O2
and an infrared CO2 analyzer (Servomex 1440). The gas analyzers were calibrated
before and after each experiment using pure N2, ambient air (20.9% O2) and 1% CO2
in N2 made up by a gas-mixing pump (2M301/a-F, H. Wösthoff, Bochum, Germany).
The temperature and humidity values inside and outside of the box and the ambient
pressure were measured using suitable sensors (Farnell Electronics). The ranges of
these variables were 10.1 – 19.8 ° C, 31.9-100 % and 98.7-101.4 kPa, respectively. A
solenoid valve (RS Component Ltd) switched between sampling excurrent and
ambient gas to allow compensation due to any drift in the gas analyzers. The accuracy
of the system was determined by N2-dilution tests (14), where both N2 and CO2 where
used as the dilution gas. These tests showed that the difference between the observed
and expected values were within 2% and confirmed that the system was properly
sealed. The time constant of the system was approximately 4 min, including the
volume of the respirometer and the PVC tubing to the analyzers. The time required to
reach a 95% fractional transformation to a new steady state was computed to be 3.2
times the time constant, or approximately 13 min.
During an experiment, the output signals of the gas analyzers, flow meters,
and the humidity, temperature and pressure sensors were passed to a purpose-built
signal conditioner. The processed signals were passed to a computer via an A/D

8
converter (DAQ500 card, National Instruments). Data were then sampled, displayed
and analyzed every 2 s using Lab VIEWTM 5.0 software (National Instruments Co.,
Austin, TX). All flows were corrected to standard temperature (273º K) and pressure
(101.3 kPa) dry (STPD) and the data saved to file.
Respirometry in the air/water experiments
Resting values of 2OV& with the birds in air or water were determined as
described by Barré and Roussel (2) and Froget et al (16). Briefly, the animal was
placed in a plastic bucket in a thermostatic chamber and fitted with an opaque
Plexiglas hood over the head. The hood attached to the lid which covered the bucket,
and the lid attached securely to the bucket. During all experiments, the bird rested
while standing in the container either in air or submerged in water. While submersed,
water covered the animal from the feet up to the neck.
A vacuum pump (Miniseco SV/SD 1000, Busch, Switzerland) was attached to
the hood via a long PVC tubing (~ 5 m), which created a flow of air through the hood
of approximately 45-50 l • min-1. The flow was measured using a variable flow meter
(Houdec S7530) and corrected to STPD. A second vacuum pump (Miniport, KNF
Neuberger, Freiburg) removed a sub sample of the excurrent gas, which, once passed
through a canister of drying agent (Drierite, W.A. Hammond Drierite Co., Xenia,
Ohio), was analyzed for the concentrations of O2 (Servomex 1100) and CO2
(Servomex 1410B). The gas analyzers were calibrated before and after each
experiment using ambient air (20.9% O2), pure N2, and 0.6 % CO2 in N2 (Air liquide,
Alphagaz, Paris France). Temperature and humidity of the excurrent gas were
measured by a custom-built thermistor and hygrometer, respectively. A manual valve

9
allowed switching between sampling excurrent and ambient gas in order to
compensate for any drift in the gas analyzers.
During an experiment, data were sampled, displayed and analyzed every 10 s
on a computer using Labtech Notebook software. The birds were initially exposed to
room air for 60 min and then submerged in water. For tests A and B the mean (± 1
standard deviation, SD) air temperatures were 4.6 ± 0.3° C and 3.7 ± 0.2 0.3° C,
respectively. Stable values for 2OV& and
2COV& in air were usually observed after
approximately 20 min. The birds were then submerged in water at a mean temperature
of 4.9 ± 0.6º C and 4.4 ± 0.5º C for tests A and B, respectively. Animals were
submerged until steady values for 2OV& and
2COV& were obtained for at least 20 min, and
stable values were usually observed after 20-40 min. Body temperature (° C) was
measured using a thermistor (accuracy ± 0.2 °C) that was placed approximately 50 cm
into the esophagus, and the connecting lead fixed with Tesa tape at the opening of the
bill. Body temperatures in air and water were 37.7 ± 0.5° C and 36.9 ± 1.3° C,
respectively. The animals were randomly assigned to start testing either in the
morning (03:00 h – 06:00 h) or the afternoon (12:00 h – 14:00 h). All animals were
held captive and were fasting between tests.
Data Assessment and Statistical Analysis
All values are reported as means ± 1 standard deviation (SD), unless otherwise
stated. Student’s t-test was used to compare the difference between the means of two
populations. Analysis of variance (ANOVA) with Bonferroni multiple comparison
adjustments was used when more than two populations were compared. Kolmogorov-
Smirnov and F-tests were used in order to check for normality and equality of

10
variance of the data. Departures from normality were corrected by appropriate
transformations, e.g. log-transformation. In the case of unequal variances, Mann-
Whitney or Kruskall-Wallis statistical tests were used.
Rates of O2 consumption and CO2 production were calculated using standard
equations (15). The recorded values for fH were averaged over the same interval as the
values used to calculate the 2OV& . Temporal changes in the relationship between the
2OV& and fH, were analyzed using the average values for fH and 2OV& , together with
various covariates for each animal and experiment, in a multivariate regression
analysis.
Multivariate least squares regression models were used to determine the effect
of fasting on the relationship between 2OV& and fH, using
2OV& as the dependent variable,
and five experimental variables: fH, respirometer temperature, speed (U), Mb, and
number of days fasting (t), as independent fixed covariates. Initially, a univariate
analysis on each independent variable was performed and only those variables with a
P-value < 0.20 (Wald’s tests) were considered in the multivariate analysis. Following
this, we used stepwise techniques to search for the best model. Nested regressions
were compared with each other by F-tests, with significant difference assigned at the
P < 0.05 level. For the forward step, each variable was analyzed sequentially, starting
from only the y-intercept term and adding each successive variable in order of greatest
statistical significance. This was followed by an F-test to determine whether there had
been a significant improvement. The backward step began with all variables in the
model and any that were not significant were eliminated. This tested the robustness of
the model by confirming that the best fit model from the backward and forward step
included the same variables and had the same parameter estimates for those variables.
Cross terms were considered to determine possible interaction effects in the

11
relationship between the 2OV& and the covariates. The parameters from the most
parsimonious model were considered to draw conclusions about the effect of fasting
in a laboratory setting while modified models were considered as alternatives in the
field. The models were analyzed and corrected for departures from normality, outliers,
and linearity as detailed by Neter et al. (28).
Statistical analyses were performed using NCSS 2000 (NCSS statistical
software, Kaysville, UT, USA), Minitab (Version 13.32, Minitab Inc., State College,
PA, USA), or SAS (Version 8, SAS Institute Inc., Cary, NC, USA). Acceptance of
significance was set to the P < 0.05 level, and 0.05 < P < 0.1 considered a trend (9). A
statement that mean values were different signifies that they were significantly
different.
Results
Animals and morphology
Morphological summary statistics are presented in Table 1, and in Table 2 are
the body masses and total number of days fasting for the animals when used in the
treadmill experiments.
Body mass during fasting
The body mass losses throughout the fasting period for the 5 king penguins in
the current study are summarized in Fig. 1. The body mass decreased linearly beyond
day 5 of the fasting period (Fig. 1A) and there was a significant correlation between
log(Mb) and number of days of fasting (r2 = 0.80, Fig. 1B). Mass-specific daily change
of body mass (n = 70) was biphasic, and decreased rapidly during the first 5 days
(phase I of fasting) from an average of 22.9 ± 9.4 g • kg-1• day-1 (n = 20), and then

12
leveled of to a more or less constant rate of 11.6 ± 2.9 g • kg-1• day-1 (n = 50, Fig. 1C)
throughout the remaining fasting period (phase II of fasting). No bird showed an
increase in their dMb/Mb · dt before their release, thus indicating that they did not enter
phase III of fasting.
Treadmill experiments
Rest
Following a period of exercise, neither resting 2OV& nor fH were correlated
with the preceding speed or sequence of the resting periods (2OV& , P > 0.9, 1-way
ANOVA, fH, P > 0.4). This suggests that the resting period was sufficiently long to
allow 2OV& to return to resting values and that there was no carry over effect. As there
were no systematic changes, the repeated measurements of resting 2OV& , fH, and
respiratory exchange ratio (RER, 2COV& /
2OV& ) were averaged for a given bird and the
mean value of the 5 repeated resting periods were used as the representative resting
value for that test (see Table 3).
During resting periods, the animals were mostly standing or occasionally lying
prone. While standing, the animals were mostly resting in a hunched posture, similar
to that observed in the field, or at times either preening or investigating the
respirometer. For all animals, the minimum values for 2OV& and fH were observed
during these resting periods. Resting 2OV& decreased between 11-17% (Table 3)
between tests while Mb decreased between 7-9% (Table 1), and the overall changes
were 48% and 29%, respectively, from test 1 to test 5. Between test 2 and 5, the
decrease was 39% for the 2OV& (Table 3) and 22% for the Mb (Table 1). For fH, on the

13
other hand, there was no systematic change between tests but during test 5 it was
significantly lower than that during test 1 or 3 by 31%, and that during test 2 by 27%
(Table 3, P < 0.05, in each case).
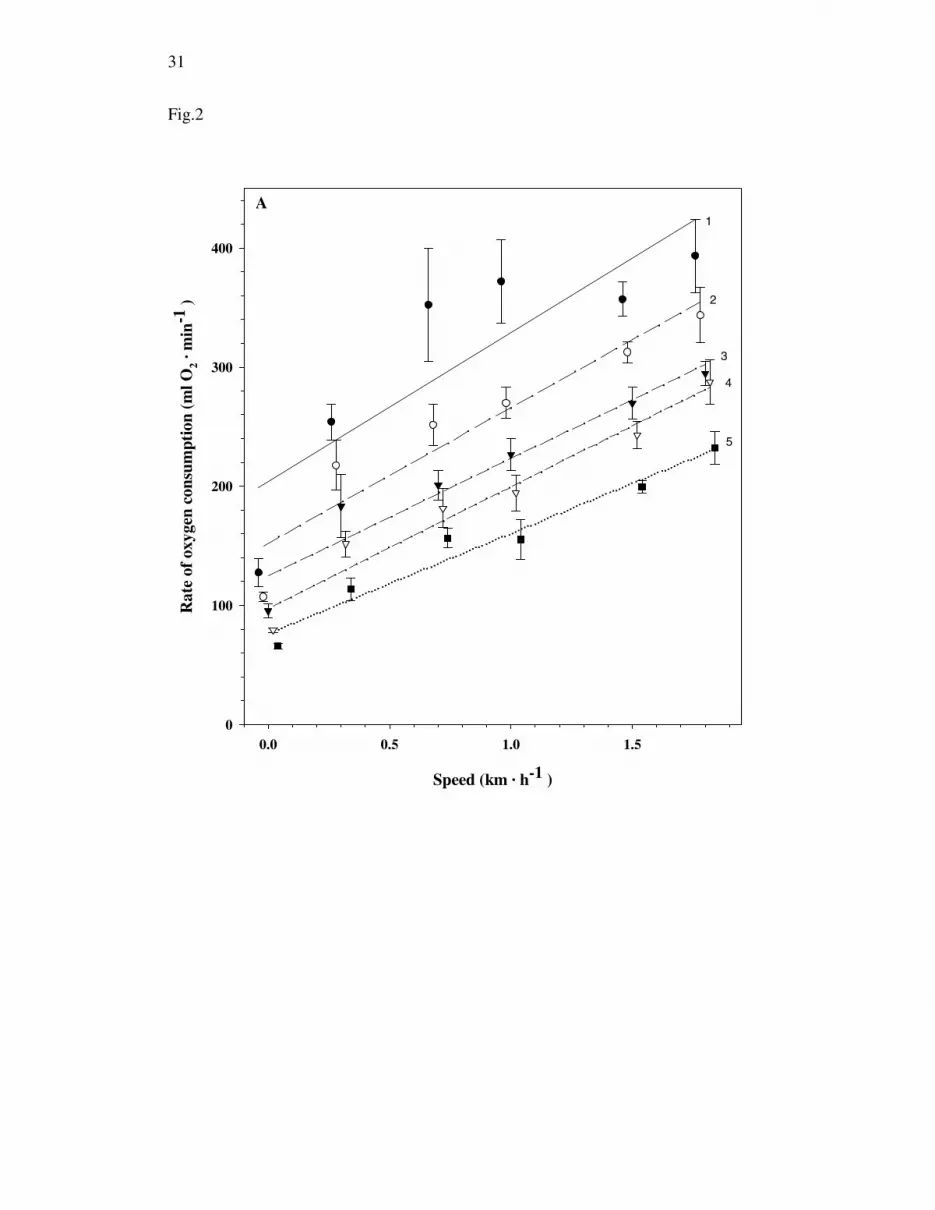
Changes in fH and2OV& with increasing U
Except for test 1, the maximum values in the current study for 2OV& and fH were
attained at the highest or second highest speed (Fig. 2A). When the data for all tests
and animals were pooled (rest included), 2OV& changed linearly with speed (
2OV& =
130.5 + 104.7 • U, r2 = 0.47, Fig. 2A, P < 0.01, n=150). For fH, the linear regression
when the resting values were omitted was: fH = 149.7 + 32.5 • U (r2 = 0.14 P < 0.01,
Fig. 2B) and the slopes changed between tests (P < 0.01, F4,115 = 4.38). However,
when the data for test 1 were omitted, there was no difference between either the
slopes (P > 0.5, F3, 92 = 0.06) or intercepts (P > 0.3, F3, 95 = 1.20).
The coefficient of variation (CV, the standard deviation divided by the mean)
of fH for resting birds and each speed increased with test number ( 21χ = 77.3, P < 0.01,
Kruskall-Wallis 1-way ANOVA on ranks). �
Relationship between 2OV& and fH during rest and exercise
There was no change in the oxygen pulse, (OP, ml O2 • heart beat-1) with
fasting at rest (P > 0.5, F4,20 = 0.77), thus, the relationship between resting 2OV& and fH
did not change with fasting. With the exception of one test for one animal (r2 = 0.56, P
= 0.08), good correlations were observed between fH and 2OV& for each animal and
each test (range r2 = 0.70 - 0.98). Between animals, there was no difference between

14
the slopes within any one test (P > 0.5, ANCOVA) but there was a significant
difference in the intercepts (P < 0.01). For this reason we used a random-effects
model, treating the intercepts as a random sample from a normal distribution. The
appropriate ANCOVA would therefore allow the intercept to be entered as a random
effect and an additional random term was introduced into the model (18). When all
animals and all tests were combined, there was a significant correlation between fH
and 2OV& (P < 0.01, r2 = 0.38, n =150). However, the residuals from this regression
were not normally distributed and both 2OV& and fH were log10-transformed which
improved the fit (r2 = 0.56) and normalized the residuals. There was a significant
difference in the slopes between tests for the combined data (P < 0.01, F4, 144 = 52.9,
Fig. 3), suggesting that the relationship changed between tests. When test 1 was
removed there were no differences in the slopes (P > 0.1, F3, 115 = 1.11, Fig. 3)
between tests.
Univariate analysis showed that number of days of fasting (t, r2 = 0.26, P <
0.01), log(Mb) (r2 = 0.27) and a non-linear transformation of speed, using the
following transformation U’ = 1-e(-U) (r2 = 0.63, P < 0.01), were important covariates.
Temperature in the respirometer was not an important covariate (P > 0.7, r2 = 0.02)
and was not further considered.
Following this, stepwise regression was used to finally include log(fH), t, U,
log(Mb) and an interaction term between log(fH) and t (r2 = 0.90). Including U’ instead
of U lead to a slight improvement of the fit (r2 = 0.92), but neither U nor U' are usable
in the field. Thus, for use in the field, the equation was modified by removing both
Mb, U or U’ including polynomials and interaction terms. Polynomials and interaction
terms were added until there was no additional improvement in the fit as determined
by an F-test (28). The best model was:

15
log(2OV& )= -0.279 + 1.24 • log(fH) + 0.0237 • t – 0.0157 • log(fH) • t (r2 = 0.81) Eq. 1
The % errors of the residuals, the relative difference between the observed and
predicted values ({[observed-predicted]/observed}• 100), from Eq. 1 was 3.0%, with a
range between –95.9% to 42.1%, and an absolute mean error of 19.3%. The partial
residuals were randomly distributed against all covariates and there were no
departures from normality (28).
Resting in air and water experiments
Rate of oxygen consumption and heart rate during rest in air/water
Resting values of 2OV& for the birds when in air in the air/water experiments
(Fig. 4) were similar to those during the treadmill experiments (P > 0.6, 2-tailed t-test)
for tests where the birds had a similar Mb and fasting duration, i.e. test A (98.0 ± 16.4
ml O2 • min-1, 10.0 days, n = 5) compared to tests 2 and 3 (Tables 1 and 2, n = 10) and
test B (72.8 ± 10.9 ml O2 • min-1, 22.6 days) compared to tests 4 and 5 (Tables 1 and
2). The range of mean resting fH values in air for tests A and B were 64.1-110.2 beats
• min-1, and 50.6-93.0 beats • min-1, respectively (Fig. 4A and B). In water, the mean
resting 2OV& and fH for tests A and B were 149.2-191.1 ml O2 • min-1, 97.3-135.3 beats
• min-1, 111.6-243.0 ml O2 • min-1, and 68.3-144.1 beats • min-1, respectively (Fig. 4A
and B).
Comparing differences between resting values in air and in water
To evaluate relative differences in2OV& , fH, and OP for animals resting in air or
water, the resting values for these variables were analyzed using a repeated measures
ANOVA (SAS version 8) using test number, and Mb as fixed effects and animal as a

16
random effect. The 2OV& and fH increased, between air and water ([
2OV& , P < 0.01, F1,13
= 38.31], [fH, P < 0.01, F1,13 = 12.51], Fig. 4A and B), and the relative increases were
109% and 51%, respectively. There was a trend for a change in the relative increase in
the 2OV& between tests A and B (P < 0.1, F1,4 = 3.67), from 74% to 144%. There was a
significant decrease in the 2OV& and fH in air from tests A to test B ([
2OV& , P < 0.05,
F1,13 = 5.16], [fH, P < 0.01, F1,13 = 8.56]). The OP increased (P < 0.01, F1,14 = 80.1)
by ~40% (1.12 ml O2 • heart beat-1 versus 1.47 ml O2 • heart beat-1) in water as
compared to air (Fig. 4C).
Discussion
The main findings from this study are that (a) 2OV& decreased throughout the
fasting period and this decrease was mainly explained by changes in Mb, (b) there was
a change in the2OV& / fH relationship in exercising birds during fasting but not during
rest, (c) the duration of fasting was a satisfactory proxy in a predictive equation for all
of the factors that influence the 2OV& / fH relationship during the fast and (d) the
2OV& ,
fH and OP increased significantly from air to water at 4°C.
Body mass loss
Body mass decreased by 30.7 ± 2.7 % (range 27.1-34.1 %) from test 1 to 5 and
the dMb/Mb · dt data (Fig. 1B) indicate that, except perhaps for test I, all experiments
in this study were performed during phase II of fasting. The fact that the rate of loss of
Mb between tests 1 and 2 in the current study mirrored that of fasting animals in the
colony before egg-laying (17) suggests that the initial rapid body mass loss was not
caused by stress of being confined to an enclosure and due to handling.

17
Resting values during treadmill experiments
Rate of oxygen consumption
The range of mean resting 2OV& values observed if birds and tests were pooled
(164.7-58.5 ml O2 • min-1) were similar to those obtained by others during shorter [14-
17 days, 152.1 –112.5 ml O2 • min-1, (15)] or similar [30 days, 169.8 -74.9ml O2 •
min-1, (26)] fasting durations. There was a much greater proportional decrease in
resting 2OV& than in Mb (Table 1 and 3). As a result of these changes, the mass
exponent for 2OV& for rest only was 1.89. In a previous study, the magnitude of change
in 2OV& between arriving and departing males was 29.7% while the change in Mb was
11.5% (15).
Intraspecific allometric exponents > 1 have been observed in different
situations in birds with large individual variation in Mb, for example, in the kestrel
(Falco tinnunculus) fed a hypo caloric diet (12), in the European barn owl (Tyto alba
alba) during re-feeding after starvation (21), and in fasted emperor penguins (13). In
the first case, it was suggested that the reduction in 2OV& with decreasing Mb lead to a
decrease in body temperature. We hypothesize, therefore, that there is a decrease in
body temperature during fasting in king penguins, but this is yet to be tested.
The fact that the allometric exponent for 2OV& was > 1 for all tests in the
current study, suggests that, during fasting the resting metabolic rate decreases below
the basal metabolic rate of post-absorptive birds, a situation of hypo metabolism
already observed during the incubation fast in the emperor penguin (1). It is clear
from the data of Cherel et al. (8) that, during phase II of fasting, there is a greater
proportional loss of highly metabolically active organs such as the liver (11), however

18
it is also clear that the rate of reduction in lean body mass is proportionately slower
than that of whole body mass. Thus, the proportionately greater loss of the most
metabolically active organs cannot, in itself, explain the high mass exponent for2OV& .
Other possibilities are channel arrest, differential gene expression, and regulatory
changes in the protein synthesis and degradation (32). The proportional change in the
2OV& between test 2 versus 4 in the current study was 26.2% which was similar to that
reported previously for fasting king penguins (29.7%) for a comparable fasting
duration (15.5 days, 15).
Heart rate
The resting fH decreased throughout the fasting period (Fig 2B) and the range
of mean resting fH values for the first 13.4 days of fasting (tests 1-3, Table 3) were
87.6-92.9 beats • min-1, which is similar to the values previously reported for arriving
and departing males (15).
Resting values in air/water experiments
Rate of oxygen consumption in air
The range of mean resting 2OV& values for birds in air during tests A and B
were similar to those from birds with similar fasting periods during the treadmill tests.
This indicates that both protocols gave equivalent values. In addition, the fact that the
2OV& was not different in 4° C air or during rest on the treadmill at temperatures
between 10.1 –19.8 ° C shows that the penguins were in their thermo-neutral zone.
This agrees with an earlier study which showed that the lower critical temperature for
king penguins in air is ~ -5° C (16).

19
Rate of oxygen consumption and heart rate in water
Mean 2OV& for birds in water during both tests A and B was 172.3 ml O2 • min-
1, which is similar to that previously reported for king penguins resting at 9° C (160
ml O2 • min-1 10), or at 5° C (182.9 ml O2 • min-1, 25) at similar Mb’s. The mean
resting 2OV& in water at 4° C for test A (168.8 ml O2 • min-1) and test B (175.9 ml O2 •
min-1) were 74% and 144 % higher, respectively, than for animals in air (test A: 98.0
ml O2 • min-1, test B: 72.8 ml O2 • min-1), which are similar to the differences
measured at 10° C in the little penguin (~ 80-100%, Eudyptula minor, 30), the gentoo
penguin (~88% Pygoscelis papua, 3), and eider ducks (140%, Somateria mollissima,
22). The fH was 51% higher in water as compared to air. This difference is higher than
the increase measured in humboldt penguins (15%, Spheniscus humboldti, 6), or eider
ducks (40%, 22), but lower than the difference in gentoo penguins (~70%, 3).
Exercise values during treadmill experiments
Rate of oxygen consumption during exercise
The highest speed used throughout the present study and achieved by all
animals was 1.8 km • h-1 even though it has been shown that some king penguins are
able to sustain speeds of up to 2.5 km • h-1 (15). To be able to use the fH-technique in
the field, it is important during the calibration studies to cover a range of fH-values
that are similar to those observed in the field. In the field, less than 1 % of fH-values
ashore exceeded 130 beats • min-1 (G. Froget et al., unpublished observation).
Consequently, in the present study an appropriate range of fH-values was achieved

20
although there was no attempt to exercise the birds at intensities approaching
their maxO2V& .
Heart rate during exercise
During tests 1 and 5, fH when the birds were walking at 0.3 km • h-1 increased
by 45% and 132% respectively above the resting values. The fH increased by a further
56% and 32% for test 1 and 5, respectively, as the speed increased from 0.3 km • h-1
to 1.8 km • h-1.
Although the maximum value of fH for test 1 in the present study was
significantly different (Table 3, 212.1 ± 29.4 beats • min-1) from that of arriving males
(P < 0.05, t0.05,12 = 2.56, 148.8 ± 50.1 beats • min-1), maximum ƒH for test 3 (226.2 ±
58.9 beats • min-1) was not significantly different from that of departing males (P >
0.3, t0.05,12 = 0.76, 196.6 ± 73.2, n = 9) in a previous study (see Table 2, in ref 15).
Relationship between the 2OV& and fH
Fasting related changes in the relationship between 2OV& and fH
The best multivariate model including speed, body mass and fasting time as
covariates suggested that the relationship between 2OV& and fH in the present
experiments was affected by the activity level and a complex effect of fasting on Mb
and the body composition that warranted inclusion of t. Thus, the results in this study
support the hypothesis of a change in the relationship between the 2OV& and fH changes
with extended fasting during exercise but not at rest. These findings are in agreement
with those in the study by Froget et al. (15), where it was concluded that the
relationship changed with fasting in males. However, conclusions from the results of

21
Froget et al. (15) need to be made with caution as neither the length of fasting nor Mb
were considered during the analysis of these data. Also, in the previous study, the
fasting durations were different between males and females, which could explain the
difference between the genders (15). Indeed, a new analysis of these previous data,
including Mb and number of days fasting, indicated that there were no differences
between groups or gender.
Possible explanations for the small mass-independent changes in the
relationship between the 2OV& and the fH during fasting were postulated by Froget et al.
(15) and include changes in any of the variables in the term Vs • (CaO2– C v O2
), i.e.
the OP, of the Fick equation, where Vs is the cardiac stroke volume, and CaO2and
C v O2the arterial and mixed venous O2 concentrations, respectively (4). Thus, fasting
may cause a decrease in O2 extraction at the tissue level and/or a decrease Vs
throughout the fast (15), which could be particularly significant during elevated levels
of exercise. A reduction in the capillary density during fasting may be the result of
prolonged inactivity during the fasting period which in turn results in a reduced O2
extraction.
Predicting the rate of oxygen consumption in the field
When studying king penguins during their breeding period, there are two
distinct field situations: a) when fasting on shore while moulting, incubating or
rearing a chick and b) when foraging at sea. In both these cases, an equation including
Mb and speed is not a practical equation to estimate the 2OV& of an animal, but is only
appropriate in a laboratory setting where several of the confounding variables can be
estimated and properly controlled. The variable t, and Eq. 1, may only be useful

22
during terrestrial fasting periods when the 2OV& /ƒH relationship changes. As the animal
shifts from its time ashore and enters the sea, fasting may only persist for another 1-2
days as the bird travels to the foraging site. After this, the animal continuously
consumes prey during most of the foraging trip and the use of the variable t may be
inappropriate. Furthermore, the physiological state of the birds while they are at sea
may be close to that immediately after they return to the colony, i.e. that of being
fully-feed (Test 1). Consequently, using the data for test 1 only, there was no
significant difference in the slopes (F4,20 = 2.04, P > 0.1) between animals but a
significant difference in the intercepts (F4,24 = 3.10, P < 0.05). The model with a
random effect for the intercept resulted in the following equations
log(2OV& ) = -0.488 + 1.35 • log(fH) (r2 = 0.86) Eq. 2a
or
log(2OV& ) = -11.1 + 11.3 • log(fH) – 2.33 • log(fH)2 (r2 = 0.91) Eq. 2b
It is, of course, possible that the reversal in the relationship between fH and 2OV& takes
place over an extended period during re-feeding. Thus, it is necessary to determine
how long it takes the birds to return to the fully-fed state following their return to sea.
While on shore, even though Mb was important in defining the physiological
changes due to fasting, it only explained an additional 2% of the variation of the data
as compared to the model including all important covariates. The high correlation
between Mb and t (Fig. 1B) allowed most of this additional variation to be explained
by t alone. In addition, inclusion of an interaction term allowed the regression model
to predict 2OV& satisfactory after removal of speed (Eq. 1). Consequently, Eq. 1 could
be used to estimate the energetics during the molting, courtship and incubation

23
periods on land. The estimated 2OV& from 10 breeding king penguins (G. Froget et al.,
unpublished observation) was significantly lower when using Eq. 1 (112.2 ml O2 •
min-1, P < 0.05, Z-test) compared to either Eq. 2A (146.9 ml O2 • min-1) or the
equation developed by Froget et al. (15, 2OV& = 3.39 • fH – 136.86, 158.5 ml O2 • min-
1). This emphasizes the importance of including t when estimating field 2OV& in
penguins when they are ashore.
ACKNOWLEDGEMENTS:
The quality and quantity of work on this project are directly attributable to the
dedication and professionalism of Mr. Frédéric Delencre and his staff of TAAF for
their technical help in the field. Sebastian Durand was crucial in helping to locate
male penguins by the song. We are grateful to Mr. Chris Hardman and the staff in the
workshop at the School of Biosciences at the University of Birmingham for helping us
build the respirometry system, and to Guillaume Froget for sharing ideas, knowledge
and expertise on necessary experiments in king penguins to determine the effect of
fasting. Peter Frappell and Jon Green provided constructive assistance with the data
analysis and to Susan Kayar for comments on the manuscript. We are indebted to
IPEV for all the help and support in the field. This study was funded by grant from
NERC of the UK (NERC ref: NER/A/S/200001074).

24
REFERENCES
1. Ancel A, Visser GH, Handrich Y, Masman D, and Le Maho Y. Energy saving in huddling emperor penguins. Nature 385: 304-305, 1997. 2. Barré H and Roussel B. Thermal and metabolic adaptation to first cold-water immersion in juvenile penguins. Am J Physiol 251: R456-R462, 1986. 3. Bevan RM, Woakes AJ, Butler PJ, and Croxall JP. Heart rate and oxygen consumption of exercising gentoo penguins. Physiol Zool 68: 855-877, 1995. 4. Butler PJ. To what extent can heart rate be used as an indicator of metabolic rate in free-living marine mammals. Symp Zool Soc Lond 66: 317-332, 1993. 5. Butler PJ, Green JA, Boyd IL, and Speakman JR. Measuring metabolic rate in the field: the pros and cons of the doubly-labelled water and heart rate methods. Func Ecol 18: 168-183, 2004. 6. Butler PJ and Woakes AJ. Heart rate and aerobic metabolism in Humboldt penguins, Spheniscus humboldti, during voluntary dives. J Exp Biol 108: 419-428, 1984.7. Butler PJ, Woakes AJ, Bevan RM, and Stephenson R. Heart rate and rate of oxygen consumption during flight of the barnacle goose, Branta leucopsis. Comp Biochem Physiol A Mol Integr Physiol 126: 379-385, 2000. 8. Cherel Y, Gilles J, Handrich Y, and Le Maho Y. Nutrient reserves dynamics and energetics during long-term fasting in the king penguin (Aptenodytes patagonicus). J Zool Lond 234: 1-12, 1994. 9. Collett D. Modelling survival data in medical research. London, UK: Chapman & Hall, 1994. 10. Culik B, Putz K, Wilson R, Allers D, Lage J, Bost C-A, and LeMaho Y.Diving energetics in king penguins (Aptenodytes patagonicus). J Exp Biol 199: 973-983, 1996. 11. Daan S, Masman D, and Groenewold A. Avian basal metabolic rate: their association with body composition and energy expenditure. Am J Physiol 259: R333-R340, 1990. 12. Daan S, Masman D, Strikstra A, and Verhulst S. Intraspecific allometry of basal metabolic-rate-relations with body size, temperature, composition, and circadian phase in the kestrel, Falco tinnunculus. J Biol Rythms 4: 267-283, 1989. 13. Dewasmes G, Le Maho Y, Cornet A, and Groscolas R. Resting metabolic rate and cost of locomotion in long-term fasting emperor penguins. J Appl Physiol 49:888-896, 1980. 14. Fedak MA, Rome L, and Seeherman HJ. One-step N2-dilution technique for calibrating open-circuit VO2 measuring systems. J Appl Physiol 51: 772-776, 1981.15. Froget G, Butler PJ, Handrich Y, and Woakes AJ. Heart rate as an indicator of oxygen consumption: influence of body condition in the king penguin. JExp Biol 204: 2133-2144, 2001. 16. Froget G, Handrich Y, Maho YL, Rouanet JL, Woakes AJ, and Butler PJ. The heart rate/oxygen consumption relationship during cold exposure of the king penguin: a comparison with that during exercise. J Exp Biol 205: 2511-2517, 2002. 17. Gauthier-Clerc M, Le Maho M, Gendner J, and Handrich Y. State dependent decision in long term fasting in King penguin (Aptenodytes patagonicus)during courtship and incubation. Anim Behav 62: 661-669, 2001.

25
18. Green JA, Butler PJ, Woakes AJ, Boyd IL, and Holder RL. Heart rate and rate of oxygen consumption of exercising macaroni penguins. J Exp Biol 204: 673-684, 2001. 19. Groscolas R. Metabolic adaptations to fasting in emperor and king penguins. In: Penguin biology, edited by Davis LS and Darby JT. San Diego: Academic Press, 1990, p. 269-296. 20. Groscolas R, Decrock F, Thil M-A, Fayolle C, Boissery C, and Robin J-P.Refeeding signal in fasting-incubating king penguins: changes in behavior and egg temperature. Am J Physiol 279: R2104-2112, 2000. 21. Handrich Y, Nicolas L, and Le Maho Y. Winter starvation in captive common barn-owls-bioenergetics during refeeding. Auk 110: 470-480, 1993. 22. Hawkins PA, Butler PJ, Woakes AJ, and Speakman JR. Estimation of the rate of oxygen consumption of the common eider duck (Somateria mollissima), with some measurements of heart rate during voluntary dives. J Exp Biol 203 Pt 18: 2819-2832, 2000. 23. Holter J, Urban W, Hayes H, and Silver H. Predicting metabolic rate from telemetered heart rate in white-tailed deer. J Wildl Mgmt 40: 626-629, 1976. 24. Jouventin P. Visual and vocal signals in penguins, their evolution and adaptive characters. Berlin: Verlag Paul Parey, 1982. 25. Kooyman GL, Cherel Y, LeMaho Y, Croxall JP, Thorson PH, and Ridoux V. Diving behavior and energetics during foraging cycles in king penguins. Ecol Monographs 62: 143-163, 1992. 26. Le Maho Y and Despin B. Reduction de la depense energetique au cours du jeune chez le manchot royal Aptenodytes patagonicus. CR Acad Sci Paris D 283: 979-982, 1976. 27. Le Maho Y, Robin J-P, and Cherel Y. Starvation as a treatment for obesity: the need to conserve body protein. News Physiol Sci 3: 21-24, 1988. 28. Neter J, Kutner M, Nachtsheim C, and Wasserman W. Applied Linear Regression Models. Chicago: Irwin Book Team., 1996. 29. Nolet BA, Butler PJ, Masman D, and Woakes AJ. Estimation of the daily energy expenditure from heart rate and doubly labelled water in exercising geese. Physiol Zool Lond 65: 1188-1216, 1992. 30. Stahel CD and Nicol SC. Temperature regulation in the little penguin, Eudyptula minor, in air and water. J Comp Physiol [B] 148: 93-100, 1986. 31. Stonehouse B. The king penguin Aptenodytes patagonica of South Georgia. I. Breeding behaviour and development. In: Sci. Rep. Falkland Isl. Depend. Surv., 1960, p. 1-81. 32. Storey K and Storey JM. Metabolic rate depression in animals: transcriptional and translational controls. Biol Rev Camb Philos Soc 79: 207-233, 2004.33. Woakes AJ, Butler PJ, and Bevan RM. Implantable data logging system for heart rate and body temperature: its application to the estimation of field metabolic rates in Antarctic predators. Med Biol Eng Comput 33: 145-151, 1995.

26
Table 1. Summary morphometrics for the 5 male king penguins used in experiments to determine the relationship between fH and
2OV& during an extended period of
fasting. Mb is the body mass, cMb the critical body mass (17), and Lbill, Lflipper, and Lfoot the length of the bill flipper and foot, respectively. Morphometric values are mean values ± 1 SD, the number of measurements are in parenthesis and x is the mean of the mean values for each individual. For the remaining measurements, x is mean value for each variable.
Bird No.
Initial Mb
(kg) Final Mb
(kg) Fast
Duration (days)
Lbill
(mm) Lfoot
(cm) Lflipper
(cm) cMb
(kg)
8 14.5 9.8 31 122.8 ± 0.9 (6) 17.4 ± 0.5 (6) 33.0 ± 0.5 (6) 9.09
9 14.2 9.4 26 125.7 ± 1.1 (5) 17.5 ± 0.5 (6) 33.0 ± 0.2 (5) 9.40
10 14.9 10.3 31 126.4 ± 0.3 (5) 17.1 ± 0.6 (7) 33.4 ± 0.3 (6) 9.46
11 14.1 10.0 26 118.0 ± 0.5 (3) 16.7 ± 0.3 (3) 32.9 ± 0.2 (3) 8.61
12 13.3 9.7 24 125.6 ± 0.6 (4) 17.4 ± 0.2 (4) 33.3 ± 0.3 (4) 9.38
x 14.2 ± 0.6 9.8 ± 0.3 27.6 ± 3.2 123.7 ± 3.5 17.2 ± 0.3 33.1 ± 0.2 9.19 ± 0.35

27
Table 2. Total number of days fasting for each male king penguin used in the experiments to determine the relationships between fH and
2OV& during the fasting
period (tests) and mean body mass (Mb, kg) for each test. x (± 1 SD) is mean value for each test.
Days fasting Bird No. Test 1 Test 2 Test 3 Test 4 Test 5
8 1 6 14 22 31 9 1 5 13 20 26
10 1 8 15 22 31 11 1 7 13 20 26 12 1 4 12 19 24
x 1.0 ± 0.0 6.0 ± 1.6 13.4 ± 1.1 20.6 ± 1.3 27.6 ± 3.2
Mean Mb 13.8 ± 0.6 12.6 ± 0.5 11.5 ± 0.5 10.7 ± 0.5 9.8 ± 0.3

28
Table 3. Mean (± 1 SD) resting oxygen consumption rate (2OV& ), mean resting respiratory exchange ratio (RER,
2COV& •2OV& -1), mean resting heart
rate (fH), mean maximum2OV& , mean maximum fH, and mean percent increase between resting and maximum
2OV& (2OV&∆ , %), fH (∆fH, %) for 5
male king penguins for each of the 5 experiments to determine the relationship between fH and2OV& during the fasting period (tests). See Tables 1
and 2 for further details. P-value represents repeated measures ANOVA, using test number as within group fixed factor. Significantly differentfrom test 1 (†, P < 0.05, Bonferroni multiple comparison), test 2 (‡) or test 3 (*).
TestNo.
Mean Resting2OV&
(ml • min-1)
Mean RER Mean Resting fH(beats • min-1)
Mean Maximum2OV&
(ml • min-1)
Mean Maximum fH(beats • min-1)
∆ fH(%) 2OV&∆
(%)1 127.6 ± 26.6 0.76±0.12 92.9 ± 13.7 418.8 ± 66.1 212.1 ± 29.4 132 ± 48 236 ± 622 107.2 ± 9.2 † 0.76±0.05 87.6 ± 15.6 359.7 ± 27.2 214.0 ± 40.7 149 ± 55 238 ± 443 95.3 ± 12.8 † 0.74±0.04 92.9 ± 24.4 295.1 ± 22.9 † 226.2 ± 58.9 146 ± 41 212 ± 254 79.1 ± 3.7 † ‡ 0.75+0.03 82.5 ± 36.8 289.3 ± 40.3 † 233.7 ± 30.6 211 ± 84 267 ± 585 65.8 ± 5.2 † ‡ * 0.69±0.03 63.8 ± 28.2 †‡ * 232.1 ± 31.1 † ‡ * 215.0 ± 30.2 272 ± 116 † ‡ * 255 ± 57P < 0.01 > 0.9 < 0.05 < 0.01 > 0.6 < 0.01 > 0.4

Figure Legends Figure 1. A) Linear or B) log10-transformed daily body mass C) and mass specific daily change in body mass of 5 male king penguins used in the experiments to determine the relationship between fH and
2OV& during an extended period of fasting.
The , , , and denote the different birds.
Figure 2. A) Mean (± 1 SEM) rate of oxygen consumption, B) and heart rate against treadmill speed for 5 repeated treadmill experiments (tests 1-5) for 5 male king penguins during 24-31 days of fasting. The , , , and denote tests 1-5, respectively. The regressions were calculated from the raw data but the symbols represent the mean (± SEM) for each test. In the figure, the values for speed at each test are slightly offset to ease presentation, but the speeds were 0, 0.3, 0.7, 1.0, 1.5, and 1.8 km • h-1 for all tests. The numbers in figure 2A represent the test number for each regression line.
Figure 3. Rate of oxygen consumption versus heart rate for 5 repeated treadmill experiments (tests 1-5) for 5 male king penguins during 24-31 days of fasting. The data are plotted on a double logarithmic scale rather than using the log10-transformed data to ease interpretation. The , , , and denote tests 1-5, respectively and the numbers in the figure is the test number for each regression line. Regression equations were for test 1 to 5: log(
2OV& ) = -0.49 + 1.35 • log(fH), r2 = 0.86; log(2OV& ) = -0.33 +
1.23 • log(fH), r2 = 0.93; log(2OV& ) = -0.37 + 1.21 • log(fH), r2 = 0.89; log(
2OV& ) =
0.03 + 1.00 • log(fH), r2 = 0.82; log(2OV& ) = 0.27 + 0.87 • log(fH), r2 = 0.80.
Figure 4. Mean (± 1 SD) rate of oxygen consumption A), heart rate B), and oxygen pulse C) for animals resting in air or in water (Air, Water) at 4° C for test A (filled bars) and test B (open bar). † indicates a significant difference between air or water and ‡ indicate difference between tests (P < 0.05, repeated measures ANOVA followed by Bonferroni multiple comparison).

30
Fig. 1
0 5 10 15 20 25 30
Bod
yM
ass
(kg)
9
10
11
12
13
14
15
16
Days Fasting
0 5 10 15 20 25 30
Mas
ssp
ecif
icra
teof
chan
gein
body
mas
s(g
. kg-1
. day
-1)
0
10
20
30
40
50
60
A
C
0 5 10 15 20 25 30
log 10
body
mas
s
0.95
1.00
1.05
1.10
1.15
1.20 B
31
Fig.2
Speed (km . h-1 )
0.0 0.5 1.0 1.5
Rat
eof
oxyg
enco
nsum
ptio
n(m
lO2
. min
-1)
0
100
200
300
400
A1
2
3
4
5

32
Fig.2
Speed (km . h-1 )
0.0 0.5 1.0 1.5
f H(b
eats
. min
-1)
50
100
150
200
250B

33
Fig. 3
Heart rate (beats . min-1)
40 60 80 100 200 300 400
Rat
eof
oxyg
enco
nsum
ptio
n(m
lO2. m
in-1
)
50
100
200
300
400
500
600 1
2
3
4
5

34
Fig. 4
Air Water
Rat
eof
oxyg
enco
nsum
ptio
n(m
lO2. m
in-1
)
0
50
100
150
200
250
300A
Air Water
Hea
rtra
te(b
eats. m
in-1
)
0
20
40
60
80
100
120
140
160
180
B
Air Water
Oxy
gen
puls
e(m
lO2. h
eart
beat
-1)
0.6
0.8
1.0
1.2
1.4
1.6
1.8
2.0
C
†
‡
†
†
‡