agricultural \u0026 applied economics staff paper series
TRANSCRIPT
University of Wisconsin-Madison
January 1997 No.408
POVERTY, LIVELIHOOD AND CLASSIN RURAL SOUTH AFRICA
By
Michael R. Carter and Julian May
__________________________________
AGRICULTURAL &
APPLIED ECONOMICS____________________________
STAFF PAPER SERIES
Copyright © 1997 by Michael R. Carter and Julian May. All rights reserved. Readers may makeverbatim copies of this document for non-commercial purposes by any means, provided that thiscopyright notice appears on all such copies.

January 1997 No. 408
POVERTY, LIVELIHOOD AND CLASSIN RURAL SOUTH AFRICA
By
Michael R. Carter and Julian May
Please Address Correspondence to:Michael Carter
Agricultural and Applied EconomicsUniversity of Wisconsin
Madison, WI 53706
fax: (608) 262-4376email: [email protected]
Copyright © 1996 by Michael Carter and Julian May. All rights reserved. Readers may make verbatimcopies of this document for non-commercial purposes by any means, provided that this copyright noticeappears on all such copies. The authors respectively are Professor, Department of Agricultural andApplied Economics, University of Wisconsin; Madison, WI, USA; and, Director, Data Research Africa,Durban, RSA. The work reported here has been generously supported by the World Bank, the FordFoundation and the Land and Agricultural Policy Centre. The authors thank seminar participants at Landand Agricultural Policy Centre, University of Natal, Loyola University, Stanford University and theUniversity of Wisconsin for their many and useful comments.

Abstract
Using data from a national living standards survey undertaken in late 1993, this paper disaggregates andexplores the economics of livelihood generation and class in rural South Africa in an effort to contributeto the ongoing and vociferous debate in South Africa about poverty and its alleviation. Pursuant to thesuggestion of participants in a recent participatory poverty assessment, this paper analyzes what might betermed the class structure of poverty. After exploring the range of claiming systems and livelihoodtactics available in rural South Africa, the paper offers a first look at who the poor are by disaggregatingthe rural population into discrete livelihood strategy classes. Non-parametric regression methods areused to then estimate and graphically explore the nature of the livelihood mapping between endowmentsand real incomes. In addition to identifying those endowment combinations which map to consumptionlevels below the poverty line (the asset basis of poverty), the topography of the estimated livelihoodmapping helps identify the constraints which limit household’s ability to effectively utilize their assetsand endowments. These results suggest that poverty is a matter of not only having few assets, but also ofconstraints which limit the effectiveness with which those assets are used, and poverty and livelihoodpolicy needs to be designed accordingly.

1
POVERTY LIVELIHOOD AND CLASS IN RURAL SOUTH AFRICA
1. INTRODUCTION
Despite the fact that South Africa ranks as an upper-middle income country with a per-capita
GDP of some $3000, the majority of South Africans live in poverty. The legacy of apartheid has of
course much to do with the poverty and the sharp dualism which characterizes contemporary South
Africa. One aspect of apartheid was a process of active dispossession whereby assets, such as land and
livestock, were stripped from the black majority. Apartheid simultaneously denied people the
opportunity to develop new assets by restricting access to markets, infrastructure and education.
Apartheid thus both produced poverty, and compressed social and economic class, especially in the rural
locations where the majority of black South African continue to reside. Nonetheless, this process of class
compression does not imply that the black majority constitutes an economically homogenous population;
nor does it imply that a single undifferentiated anti-poverty strategy will suffice to break the poverty
dynamic introduced by apartheid.
As in many countries, the poor in South Africa are disproportionately found in rural areas. As
Mckinley and Alarcon (1995) suggest in their study of Mexico, anti-poverty policy must find a way to
boost the level and stability of income for the rural poor. Using data from a national living standards
survey undertaken in late 1993, this paper disaggregates and explores the economics of livelihood
generation and class in rural South Africa in an effort to contribute to the ongoing and vociferous debate
in South Africa about poverty and its alleviation (e.g., see Lipton et al. 1996). Section 2 below begins
the paper with conventional quantitative poverty measures, noting that poverty is most extreme amongst
rural black households. Yet, in contrast to these quantitative measures, which focus on realized income
or nutritional outcomes, the informants for a recent participatory poverty assessment (summarized by
May 1996) describe poverty and vulnerability in terms of the specific bundles of livelihood tactics which
the poor are able to exercise and assemble. As developed in section 3, this livelihoods-based description
creates a connection to Amartya Sen’s “entitlements” approach which analytically characterizes poverty
and deprivation in terms of the livelihood or claiming systems which map social and economic

2
endowments into real consumption possibilities. After exploring the range of claiming systems and
livelihood tactics available in rural South Africa, section 3 offers a first look at who the poor are from an
entitlements perspective by disaggregating the rural population into discrete livelihood strategy classes.
In order to extend the analysis of poverty, livelihood and class, section 4 then briefly reviews
microeconomic forces which distort and otherwise shape the nature of the livelihood mapping which
links endowments to consumption possibilities. Section 5 goes on to employ non-parametric regression
methods to estimate and graphically explore the nature of the livelihood mapping in rural South Africa.
In addition to identifying those endowment combinations which map to consumption levels below the
poverty line, the topography of the estimated livelihood maps helps identify the constraints which limit
household’s ability to effectively utilize their assets and endowments. These results suggest that poverty
is a matter of not only having few assets, but also of facing constraints which limit the effectiveness with
which those assets are used. Section 6 closes the paper with implications for the design of poverty and
livelihood policy.
2. QUANTITATIVE POVERTY MEASURES
The best method of measuring poverty remains the subject of debate amongst researchers (see
Ravallion 1996). A measure based on longitudinal data would perhaps be the most desirable as it could
distinguish between households transitorily in poverty, and those whose current circumstance both render
them poor and offer no potential for escaping to a better living standard in the future. Unfortunately, the
available cross-sectional survey of South African households does not permit the construction of
complex, multi-period measures which capture both current well-being and future potential and long term
capabilities. Undertaken during the last quarter of 1993 by the Project for Statistics on Living Standards
and Development (PLSLD) at the University of Cape Town, the available data do provide South Africa’s
first-ever nationally and racially representative household data. With its focus on rural poverty, the
analysis in this paper relies only on the data from the 4212 black households surveyed in non-urban
areas.1 Ardington (1994) describes some of the weaknesses of this data set.
1 “Black” is here defined to include people previously classified as African, but excludes the
“colored” and Asian populations. “Households” are defined using the admittedly problematic PLSLDsurvey definition. According to that definition, resident household members are defined as those

3
Table 1: Alternative Measures of Absolute Poverty in Rural South Africa
Poverty Measures % Rural AfricanHouseholds which are
PoorIncome Poverty Line (237 Rand per Adult Equivalent) 52.1
Basic Needs Indicator (Lowest Rank on CompositeScale of Housing, Sanitation, Water andEnergy)
21.9
Nutritional Poverty Line (1815 Daily Calories per AdultEquivalent)
44.6
Nutritional Poverty Line (2100 Daily Calories per AdultEquivalent)
56.7
Table 1 provides several alternatives measures of the incidence of poverty amongst South
Africa’s black rural African population. While each of the measures presented in Table 1 has its
strengths and weaknesses, together they give a remarkably consistent portrayal of the risk and incidence
of poverty. The income-based measure is calculated using a poverty line of 237 Rand (67 US dollars)
per-adult equivalent per-month. This poverty line is based on scaling IPR’s (1993) estimate that a rural
family of two adults and four children requires 723 Rand per-month to achieve a subsistence living
standard. 2 Just over half (52.1 percent) of all African households in rural areas are poor in that their
scaled per-capita expenditure3 falls below this poverty line. Because these poorer households tend on
individuals who had (a) lived in the surveyed dwelling for at least 15 out of the preceding 30 days, (b)shared food from a common source; and, (c) contributed to or shared from a common resource pool.Individuals not meeting condition (a) were classified as non-resident members if they had lived in thehousehold at least 15 days out of the preceding year and filled conditions (b) and (c) during their periodof residence. Complete employment and earning data were collected on all resident household members.Earnings by non-resident members were recorded only to the extent that they were reported asremittances on the survey. All calculations of household size utilize only resident members.
2 Here and throughout this study, all monetary measures of well-being are standardized or scaledin order to account for the fact that large households need more income than do small households toreach a similar level of well-being, that adults need more food and other commodities then do children,and that there are some economies of scale in household production. A simple scaling was defined suchthat the number of adult equivalents (ADEQs) in each household is defined as:
ADEQ = (A + 0.5*C)0.9.
where A is the number of resident adult (older then 16 years of age) household members, C the numberof children, and 0.9 is the scaling parameter which captures modest increasing returns in the creation of aliving standard. Dividing household income or expenditure by ADEQ yields scaled per-capita measures.The 237 Rand poverty line results from applying this scaling to the IPR’s (1993) reference household of 4adults and 2 children. May et al. (1995) detail the weaknesses of the IPR-based poverty line.
3 Throughout this paper, total monthly expenditures rather than measured income are used as thepreferred measure of household material well-being. Assuming that households are more or less

4
average to be larger than wealthier households, this figure implies that almost 70 percent of all rural
African individuals live in households with incomes below the poverty line.
The adequacy of the above income-based poverty measures can be critiqued from a number of
perspectives, including one which notes that household income or expenditure only adequately reflect
individual material well-being if the household has access to a market at which it can purchase all goods
at given prices (see the discussion in Ravallion 1996). However, goods like safe and available water and
sanitation services have a large indivisibility and public good components which makes it impossible for
a single household to marginally purchase more of such goods. More generally, some analysts would
argue that access to safe water, adequate shelter, etc. are better indicator of poverty and human possibility
then are income or expenditure-based measures.
Reflecting these various concerns, May et al. (1995) construct a basic needs indicator variable
built around the type of shelter, water, sanitation and energy to which each household has access. As
shown in Table 1, they find that 22 percent of the rural black population falls into the lowest rank of a
four scale indicator. The bulk of the households in this group live in homesteads with rustic or temporary
roofing, such as plastic sheeting or cardboard, and which have high occupation densities. These
households use unprotected sources of water, do not have a toilet facility of any kind, and collect and use
wood as their main energy source. Another 51 percent of black rural households fall into the next highest
basic needs category, meaning that they typically had access to a protected water source and an
unimproved pit latrine, but had housing and energy sources similar to those of households in the lowest
group. By way of contrast, only 3.1 percent of all households resident in major metropolitan areas
respectively fall into either of these two lowest basic needs categories.
Another weakness of the household income-based poverty measures in Table 1 is that they are
impervious to differences in intra-household inequality. While food can of course be distributed
unequally within a household, average dietary adequacy in a household arguably comes closer to a
successfully able to smooth their consumption over time, expenditures is theoretically a better measureof permanent income (and well-being) then is current income. In addition, because certain real incomeflows are difficult to measure, as are changes in stocks of savings, expenditures may be empirically morereliable than measured income.

5
measure of individual well-being then does scaled per-capita household income.4 While the PSLD data
do not contain information on individual specific food intake, it is possible to calculate the calorie value
of all food used by the household (over a 7 to 30 day recall period) relative to the caloric needs of the
individuals who comprise the household. 5 Table 1 shows that approximately 57 percent of African rural
households in the sample fall below a 2100 calories per-day (per-adult male equivalent) nutritional
poverty line. The nutritional poverty head count under a lower standard of nutritional adequacy (1815
calories per day per-adult male equivalent) is 45 percent. Interestingly, these two nutritional poverty
figures bracket the income-based poverty measures.
Finally, relative deprivation as measured by income inequality provides another window into
rural poverty and well-being. The poorest decile of the population, of whom 77 percent are Africans
living in rural areas, controls just over 1 percent of household and adult equivalent expenditure. This can
be contrasted to the wealthiest 10 percent of South African households which controls some 40 percent of
expenditure. Only 4 percent of this group are Africans living in rural areas. These figures reflect an
income distribution which the World Bank estimates to be the most unequal in the world.
3. POVERTY, LIVELIHOOD AND CLASS
The headcount and other quantitative poverty measures presented in the prior section permit the
identification of an amorphous poverty risk or incidence for distinct demographic groupings. However,
they tell us relatively little about how and why those identified as poor are poor. Interestingly, the
voices and perceptions of the poor themselves, recorded in a recent participatory poverty assessment,
point to a useful direction for a richer and more informative mode of analysis.
4 For example, a finding of caloric inadequacy in households with incomes above the poverty
line would signal a sort of intra-household inequality which would lead us to question the adequacy ofhousehold income-based measures. as indicators of individual well-being.
5 Nutritional needs were calculated for each individual using standard WHO requirements foreach individual based on their age, sex and pregnancy and lactation status. Clearly, however, suchcalculations are imperfect as food energy requirements vary across individuals and over-time. Likewise,the way in which food is prepared and combined also affects the energy which can be realized from it.Despite these reservations, nutrition has formed one of the ways in which economists have attempted toanalyze poverty. Kakwani (1989) provides a useful discussion of measuring under-nutrition and poverty.

6
(a) Voices of the Poor
In a recent participatory poverty assessment undertaken in South Africa, members of the
community of Nhlangwini in the province of KwaZulu-Natal carried out a wealth ranking exercise,
indicating on a social map the relative proportions of households belonging to different economic strata,
in as well as some criteria for placing households in the different groups. 6 As reported in Murphy
(1995), the community members found that:
• Of the 76 houses drawn on the map 50% (38) were classified in the poor category. Criteria included:no-one working for cash, doing cheap labor, the household head living alone (especially women withno husbands), ill health, mental illness, pensioner, no parents and farmworkers.
• 30% (21) were place in the average category. Included in this category were households wheremembers were wage workers (e.g. teacher, policeman, nurse, work in Durban) or got an income fromfarming, owning a spaza (beer) shop or a taxi. In many cases, more than one member of thehousehold had a regular job.
• 20% (17) were classified as rich. Some of these households ran more than one business (e.g. shops,taxis, tractors, traditional healer) while others had a number of members in salaried work.
The similarity between the subjective responses of the poor, and quantitative approaches based
on expenditures and caloric intake is striking, as all three indicate that about half of rural South African
households are poor. However, what is most striking about the perceptions of rural residents themselves
is that they identify the poor in terms of shared characteristics, principally in terms of how the poor go
about generating their income and the stability with which they are able to do it. This focus on what
might be termed livelihood strategies identifies a way to move beyond poverty headcounts and profiles
through a livelihood-based disaggregation and analysis of the rural population in a way which permits
understanding of the structure of constraints which impinge upon the poor.
Similar to the approach put forward by Amartya Sen (1981), this livelihood focus suggests that
the poor (and the vulnerable) can be identified as those who share common income-claiming strategies or
“entitlements.” Like the respondents to the participatory poverty assessment, Sen’s work usefully directs
our attention not just to the incomes people have (or have not) realized, but also to the bundles of assets
or endowments held by the poor; the nature of the claims attached to those assets; and, the nature and the
vulnerability of particular claiming systems. This approach describes the relationship of people to the
6 . Methodologies which facilitate quantitative information using participatory techniques such
as Participatory Rural Appraisal enable such measurement. For a fuller discussion of the background andpractice of PRA see Chambers (1994a, 1994b, 1994c).

7
resources that they have and the commodities which they require to meet their basic sustenance
requirements. In the terminology of Sen’s entitlement approach, ownership endowments (including
tangible assets like land and labor, as well as intangible assets like welfare rights and social and familial
reciprocity) form the basis for gaining access to commodity bundles (food, services, facilities) through
various claiming systems (including the labor and other markets, social and bureaucratic processes, etc.).
The mapping which links endowments with attainable commodity bundles is what Sen calls the
entitlement mapping, and will be referred to here as the livelihood mapping.7
The livelihood mapping thus defines the set of commodity bundles which can be claimed on the
basis of a given set of tangible and intangible endowments, either through direct use of the endowments,
or by using them to access other goods through market and other claiming systems (e.g., moral or legal).
In the pure exchange economy of economic theory, when markets are perfect (price-rationed), the
livelihood mapping is no more than the budget set defined by the endowments and the given set of
relative prices at which exchanges are made. In his own work, Sen is interested in a more complex world
in which sales- or quantity-constraints (e.g., unemployment), missing markets, and production and price
shocks conspire to add complexity to the notion of a livelihood mapping. In particular, in a world
without prefect insurance, a claiming system may fail to provide access to the expected bundle of
commodities, creating what Sen calls an entitlements failure. Ex ante, the linkage or mapping between a
set of endowments and the accessible bundles of consumable commodities thus becomes probabilistic. 8
7 The term “livelihood” is used in preference to “entitlement” because the latter term carries
negative connotations from debates in the US and South Africa over a “culture of entitlement” whichdiscourages work effort.
8 While Sen castes his entitlement approach in the general terms of multi-dimensionalcommodity bundles which an endowment can command , much of the dynamism and insight of hisapproach can be retained by thinking more simply about the one dimensional real income which anendowment bundle can command and the distinctive patterns of vulnerability which characterize the realincome claiming mechanisms utilized by different classes of agents. For example, a semi-subsistencepeasant farmer (endowed with unskilled labor and land) and a semi-skilled artesian (endowed with labor,human capital and tools) may on average be able to command the same commodity bundles (i.e., theymay have the same real income and budget sets on average). However, they are subject to verydistinctive forms of vulnerability and poverty risk. The peasant farmer is exposed to production shocks(direct entitlement failures), while the artesian is subject to the risk of sales constraints and changes in theprice of the commodity he sells relative to the price of subsistence goods (what Sen calls tradeentitlement failure). Sen’s (1981) analysis of Bengal famine shows that precisely these two groups,peasants and artisans, had distinctive histories, with the latter suffering trade entitlement failures andbearing the brunt of the famine-related deaths. Note however, that changes in the prices of consumptionnecessities relative to each other is not critical to this story, which can be told in terms of the different

8
In addition, imperfect markets (e.g., credit markets in which access to capital is wealth-biased)
also imply that some assets (e.g., land) can only be effectively utilized to generate claims when they are
matched by holdings of ancillary ownership endowments (e.g., own-capital). Section 4 below will utilize
the economic theory of the household in the face of imperfect markets to elaborate these considerations
and their implications for the shape of the livelihood mapping. This theory also provides a choice-
theoretic basis upon which to rest the analysis of livelihood mappings and class. However, before turning
to that discussion, the remainder of this section empirically explores the multiple claiming systems
operative in rural South Africa and the ways in which they are assembled into livelihood strategies.
(b) The Components and Complexity of Rural Livelihood
In rural South Africa, as in many places, poor household exercise a multiplicity of claims
passing through many distinctive claiming systems (Lipton 1993, and Maxwell and Smith 1992). The
PSLSD survey data makes it possible to identify a number of activities from which rural households in
South Africa are able to generate income. These include:
• Agriculture, including agricultural production which is undertaken for own consumption, as well asthat for sale
• Small and Micro Enterprise activities based on the extension of distribution networks such ashawking, petty commodity production such as the making of clothes and handicrafts, and nichemarkets in the service sector such as child minding, money lending and contract agriculturalservices.
• Wage Labor, including working as migrant laborers, farm workers and an increasingly large groupof commuter laborers. Following Buraway (1975), the labor market in South Africa can beconceptualized as being a segmented market with two main sectors - a primary market and asecondary market. The primary labor market is defined as that in which jobs are well paid andsecure, and workers have prospects of career advancements. The secondary market is defined aseverything which the primary labor market is not. Jobs in the secondary market are low paid andoffer little security and opportunities for upward mobility.
• Claiming against the State South Africa is somewhat unique amongst developing countries in that ithas a well functioning social pensions system which has a high coverage amongst the elderly in ruralareas. Claiming these rights from the state in the form of pensions and disability grants has beenshown to be of critical importance to household incomes (e.g., see Ardington and Lund 1996).
• Claiming against Household and Community Members Migration for employment remains animportant aspect of many rural people’s lives, as does the reliance of the rural household upon ashare of the migrant’s income in the form of a remittance. As such, effective claiming of thisremittance from migrants is an important livelihood tactic. Assistance is also rendered throughkinship ties as well as through other forms of community reciprocity, including “work parties” and
vulnerability of the agents’ real income claims. The empirical analysis later in this paper will in factconcentrate on the mapping between assets and real income.
9
outright charity. In addition, households assist one another by absorbing family members. May et al.(1995), for example, use the PSLSD data to show that resident household members suddenlyincreases when the declared head of household reaches pensionable age, reversing the demographicdecline which sets in when the household head reaches middle age. Note that many of these familyand social claims, like those which can be entered against the state, are contingent claims which canbe pressed only when disaster strikes.
In addition to these activities which were measured by the PSLSD with varying success, at least
three critical types of entitlement-generating activities are not adequately dealt with and can only be
noted:
• Unpaid domestic labor, performed largely by women, which although not paid, contributessignificantly to the household livelihood strategy.
• Illegitimate activities Clearly, many households survive by undertaking activities which areregarded as being illegitimate, either in the narrow, legal sense, or in terms of the moral norms of acommunity. These include activities such as drug-trafficking, prostitution, and petty crime.
• Non-Monetized Activities Finally, there is a disparate bundle of activities in which householdsengage in order to either stretch their income, or to gain access to additional entitlements.
The relative importance of the different entitlements or income-generating activities for African
rural households is reported in Table 2. The table shows that the three most frequently employed
livelihood tactics are making claims against the incomes of non-resident (migrant) household members
(39 percent of all households),9 employment in the secondary labor market (37 percent) and agricultural
production (36 percent). Claims made against the state for pensions are the only other tactic employed
by a large group (32 percent) 10, although it is noteworthy that 22 percent of households were able to
enter into employment in the primary labor market. Involvement in small and micro enterprise activities
is confined to some 10 percent of the sample, half of which are in the distribution and hawking sub-
sector, confirming the paucity of rural manufacturing and endowments and opportunities to undertake it.
9 Interestingly, although 35 percent of households reported an absent adult family member, 39
percent of households were able to claim an income from a migrant. This finding supports the notion thatthe ‘household is not a readily bounded concept, and that households receive, and presumably give,support to people other than those defined as household members according to the time spent in thehousehold.
10 This figure of 32 percent exceeds the proportion of households with a person of pensionableage. As there other possible forms of state assistance beyond pensions, this is entirely possible, andsuggests that pension coverage in the rural areas of South Africa is virtually complete. Data problemscannot however be ruled out as May et al. (1995) discuss.

10
Table 2: Income Generation and Claiming Systems
% Households Engaging inActivity
Rand Earned per month(for those householdsengaged in activity)
Activity Mean Median
Agricultural Production (Sold and Consumed) 36.4 91 31Small and Micro-Enterprises 10.4 392 200Wage Labor in the Primary Labor Market 22.1 1445 1132Wage Labor in the Secondary Labor Market 37.4 582 500Illegitimate Activities n/a n/a n/aUnpaid domestic labor 100% (?) n/a n/aClaims against household members 39.0 267 200Claims against the state 32.4 396 320Non-monetized activity n/a n/a n/a
Table 2 also presents indicators of the relative weight of the various activities within household
budgets. Clearly, involvement in the primary labor market brings the highest return to rural households
at an average of almost R1500.00 per month. Income earned from participation in the primary labor
market contrasts sharply with that available from secondary labor market work (at approximately R450
per month). Participation in niche service markets for both small and medium enterprises offers the
second highest return of approximately R900 per month. Perhaps surprising is the finding that agriculture
contributes on average little income, even among those households which engage in it. This result
supports the findings from other studies where it has been noted that although households maximize what
they can from the available land, agriculture is not the mainstay of rural households’ existence (May,
1993; May 1996). Interestingly, the medians in Table 2 indicate that there is substantial variation and
differentiation across households in the amounts earned the self-employment sectors, suggesting that
there may be quite distinctive types or classes of households participating in these activities.
(c) Livelihood Strategy Classes
Following the lead of the participatory poverty assessment, it should be possible to identify
strata of households which assemble similar bundles of the income earning tactics reviewed above, and
in so doing share a common survival strategies and (in a well defined sense described in section 4 below)
comprise distinct livelihood classes. While other researchers have made similar classifications of rural

Table 1: Characteristics of the Different Livelihood Strategy Classes
Livelihood Strategy Class PercentHouseholds
DominantTactic
Mean AdultEquivalent
Income(Median)
Poverty Risk% H’holds
% in Worst-off BNIGroup
Mean Valueof Capital(Median)
% Access toLand
% Access toEducated
Labor
Marginalized 4.3% Agriculture81%
191 (131)
79 42 8840 (3001) 36 27
Welfare Dependent 11.5% Transfers95%
195(159)
74 30 5523 (2002) 35 31
Remittance Dependent 25.1% Remittances64%
256(xx)
57 27 7779 (3282) 36 40
Secondary Wage Dependent 19.8% Wages96%
415(274)
42 17 2386 (4361) 10.1 15.5
Primary Wage Dependent 13.6% Wages98%
507(333)
29 9.1 8555 (2207) 10.2 53
Mixed Income with Secondary Wages 15.8% Even spread20% - 30%
238(177)
62 27.9 8489 (2662) 31 35
Mixed Income with Primary Wages 8.1% Wages72%
376(266)
38 8.3 21,237 (8262) 30 74
Entrepreneurial 1.0% Self-employ.70%
631(387)
24 9.4 38,946(21,002)
28 60
12
South African society, the analysis here tries to build on and improve these earlier efforts to create a
typology of rural households (e.g., Nicholson and Bembridge 1991 and Murray 1978). Unlike these
earlier efforts which primarily identify classes based on income levels, the livelihood classification
scheme put forward here utilizes information on extra-household claims derived from wage-earning
activity in different labor markets, and on intra-household claims derived from the remitted incomes of
people who live away from home. Table 3 presents detailed information on the following livelihood
strategy classes for African rural households:
1. Marginalized Households have no access to wages or remittances from formal sector opportunities,and have no access to welfare transfers (largely pensions). Income from petty commodity productionis R92.00 per month or less11;
2. Welfare Dependent Households have access to welfare transfers (pensions) , and receiving no wageor remittance payments. Income from petty commodity production is R92.00 per month or less;
3. Remittance Dependent Households have access to a remitted income, although no wage is received.Transfers payments may be present. Income from petty commodity production is R92.00 per monthor less;
4. Secondary Wage Dependent Households have wage income earned by people living at homeemployed in the ‘secondary’ labor market. Income from petty commodity production is R92.00 permonth or less;
5. Primary Wage Dependent Households have access to wages earned by people living at homeemployed in the ‘primary’ labor market. Income from petty commodity production is R92.00 permonth or less;
6. Mixed Income Households with Secondary Wages combine wages earned in the ‘secondary’ labormarket with modest small business and other self-employment income.
7. Mixed Income Households with Primary Wages combine wages earned in the ‘primary’ labor marketwith small business and other self-employment income.
8. Entrepreneurial Households earn incomes in excess of R1000 per month from agricultural activities,and/or business activities.12
As can be seen in Table 3, the single largest category of households (20 percent of all rural
households) are in class 4, those dependent on wages earned in the secondary labor market. Indeed, it is
noteworthy that almost 33 percent of the rural sample are wholly reliant upon wage income earned in
11 . Petty commodity production is taken to include subsistence and small scale agricultural
activities, as well as non-farm micro-enterprises. Eighty percent of the sample received R92.00 permonth or less.
12 . In the National Living Standards Study, income from self-employment was gathered for alltypes of enterprises making it difficult to distinguish petty commodity production from formal capitalistproduction. As a result, a class of business people and commercial farmers were included who derivedsubstantial incomes from these activities. As it was quite feasible that this group could have beenclassified as being marginalised, that is having no access to a formal source of income, it was decidedtreat them differently. Consequently, households with a business income exceeding R1000.00 per monthwere treated separately from households which are engaged in micro-enterprises.
13
either the primary or secondary labor markets. Taken with those households which are dependent upon
remittances, the extent of the general decline of agricultural production amongst the African rural
population is evident. Another 11 percent of household are dependent on welfare payments such as
social pensions and disability grants, and a marginalized 5 percent have no access to a formal cash
income from any source.
Within each strategy class, the proportion of income derived from the household’s primary
income source varies as the “Dominant Tactic” column of Table 3 shows. Wage dependent groups, for
example, receive 96 to 97 percent of their income from wages. Further analysis of these livelihood
classes reveals a number of other significant features about the structure of household incomes in rural
South Africa:
• Some households which are remittance dependent also combine this income with incomes derivedfrom pensions and other welfare payments. These would appear to be older households who are ableto exert intermittent claims on their children. These pensions form a vital component of their incomeand serve to boost the average income earned by this group.
• Agriculture makes up 81 percent of the income of the poorest group, the marginalized, as well as 32percent of the income of the wealthiest group, those deriving an income from entrepreneurialactivities. This dual role of agriculture, as a safety net and as a way of deriving an entrepreneurialincome is critical in understanding the role that is played, and can potentially be played, byagriculture in South Africa.
• Finally, households which combine income in which the wage is earned in the secondary marketspread their income earning activities across a wide range of survival strategies. Income is derivedfrom claims pressed against household members, the state, as well as from entrepreneurial activities
•
• in small business and agriculture. In the absence of this range of activities, this group would receivea monthly income of less than R200.00 per month.
Table 3 also shows indicators of the relative well-being of households in the different livelihood
classes. Not surprisingly, the marginalized group are the least successful in generating a secure
livelihood, earning just over R190.00 per adult equivalent per month on average with almost 80 percent
of households in this group falling below the 237 Rand poverty line. The majority of households in the
marginalized group also fall into the most poorly serviced groups as measured by the human needs
indicator introduced in section 2 above, with fully 41 percent of marginalized households in the most
severely under-serviced group. Households dependent upon remittances which they receive from an
unreliable source also generate an insecure livelihood, and earn R240 per adult equivalent per month.
This group should be viewed as being extremely vulnerable, and with the loss of an income source, could

14
easily be pushed into the marginalized group. At the other extreme, households who are able to
specialize in primary labor market employment, as well as those who are in receipt of an income from
entrepreneurial activities, are by far the most successful at generating an adequate and secure livelihood.
The earnings of these groups are R630.00 per adult equivalent per month and R506.00 per adult
equivalent per month respectively.
(d) Access to Endowments
Consistent with the vision expressed by informants in the participatory poverty assessment cited
above, analysis of the distinct livelihood strata found in rural South Africa shows that it those groups with
the most precarious claims which experience the greatest incidence of poverty. Sen’s entitlements
approach suggests that the ability to make claims and assemble a secure livelihood strategy has its basis
in the household’s social and economic endowments and the claiming systems to which the endowments
give access. While few studies have attempted to estimate the distribution of assets amongst African
rural households, it is generally recognized that wealth is more unevenly distributed than income (May
1988). The PSLSD did gather information on a number of aspects of wealth including estimates of the
value of fixed and movable property and the ownership of livestock.
Analysis of this data reveals that just over a quarter of African rural households (26.1 percent)
currently have access to a plot of land for the cultivation of crops. Average land size for these
households is 2.2 hectares. A similar pattern is repeated with respect to the ownership of livestock, with
some 24 percent of African households in rural South Africa owning livestock with an average holding
for these households of 5.4 Mature Livestock Units13 valued at approximately R4300.
Ownership of agricultural and other productive equipment is limited to 18 and 8 percent of rural
African households respectively. As this refers to important agricultural tools such as plows and
harvesters as well as tools which could be used in small and micro enterprise manufacturing activities,
such as welding and sewing, this is likely to place severe constraints on the development of rural non-
farm income generation. Turning to fungible assets, meaning assets which household could convert to
13 A mature livestock unit is a simple cattle-equivalent scale in which 5 sheep or goats are
equivalent to one head of cattle.

15
cash in some way, it is alarming to note that 20 percent of rural African household have no assets of any
kind, which could be converted to cash (meaning no cash savings, consumer durables, salable housing or
land, nor livestock or other productive assets). These households thus have no safety net of their own,
and are extremely vulnerable to any loss of income or entitlement failure, are unable to liquidate an asset
to cover unexpected expenses or invest in new opportunities, and finally, lack any possible resource
which could be used security against credit.
Access to human capital in the form of educated labor emerges as the most common endowment
of rural households with 37 percent of households having an adult household member with ten years of
education (Standard 8) or more, while another 39 percent have an adult household member who could be
considered functionally literate. Finally, 30 percent of household had a person of pensionable age, and
35 percent had a member of the household who was a migrant in another area.
Table 3 gives a first look at the endowments held by households within the different livelihood
strata. In terms of capital (defined as housing as well as productive assets) , households which are
dependent upon wages in the secondary labor market emerge as the least well off, with the mean value of
assets worth less than R2386.00, little access to land, and the lowest access to educated labor.
Households which are dependent upon pensions also have very little capital, although they have some
access to land and to educated labor. To some extent, it can be suggested that these households are in a
late stage of their life cycle, and are liquidating their assets.
At the other extreme, Entrepreneurial Households are the wealthiest in terms of ownership of
capital, with the mean value of assets worth just under R39000. Interestingly, this group is followed by
those who combining incomes with wages received from the primary labor market. In terms of access to
land, those households who are dependent upon wage labor tend not to have land, whereas land holdings
are most common amongst households who fall into the more vulnerable livelihood tactic groups, that is,
those reliant upon remittances and pensions. Finally, in terms of access to a person with more than a ten
years of education (Standard 8), it is not surprising that this is most frequent amongst those households
who are engaging in primary labor employment, in particular, those households which are engaging in
activities in addition to wage labor.

16
4. MICROFOUNDATIONS OF LIVELIHOOD MAPPINGS AND CLASS
The shared endowment characteristics of the livelihood strata revealed by Table 3 suggest that
these strata can be meaningful described as classes in the sense that households within them are
characterized by broadly similar relationships to property and means of production. From the rational
choice perspective of class analysts like Jon Elster (1985) (who compactly defines a class as a group of
individuals who share a common “endowment-necessitated behavior”), the assembly of endowment and
claiming systems into livelihood strategies described in the preceding section, can be seen as an active or
endogenous choice process in which people do the best they can given the often meager assets and
opportunities available to them.
This process of livelihood assembly or endogenous class formation creates the livelihood or
entitlement mapping defined in section 3 above. As detailed in note 8 above, we focus here on the
mapping from assets into a one dimensional real income space, rather then the higher dimensional
commodity space discussed by Sen in his original formulation. Conceptualizing this mapping as the
outcome of active household choice is useful because it brings into focus the constraints which limit a
household’s ability to generate secure livelihood. The reality of risk and imperfect insurance markets
creates the prospects for entitlement failure imply that each asset position maps into a distribution of
possible livelihood outcomes. The remainder of the analysis here will refer to the first moment or mean
of that distribution—the ex ante expected livelihood outcome—as the livelihood map.
The microeconomic theory of the household—understood as a unit which jointly organizes
production and consumption activities—offers a series of insights useful for elaborating the
choicetheoretic basis of the livelihood mapping and for understanding the logic and constraints of low
income rural households. From its roots in the 1924 work of A.V. Chayanov (1966), this theory has
stressed how a household’s resource allocation (e.g., the intensity with which it uses its fixed assets)
systematically varies with the household’s endowments of land and labor. As this section explores,
refocusing the theory upon the real income which the household generates through its allocative choices
provides a choice theoretic foundations for the entitlement map which links endowments to income.

17
Prodcutive Asset
Sca
led
Per
-Cap
ita In
com
e
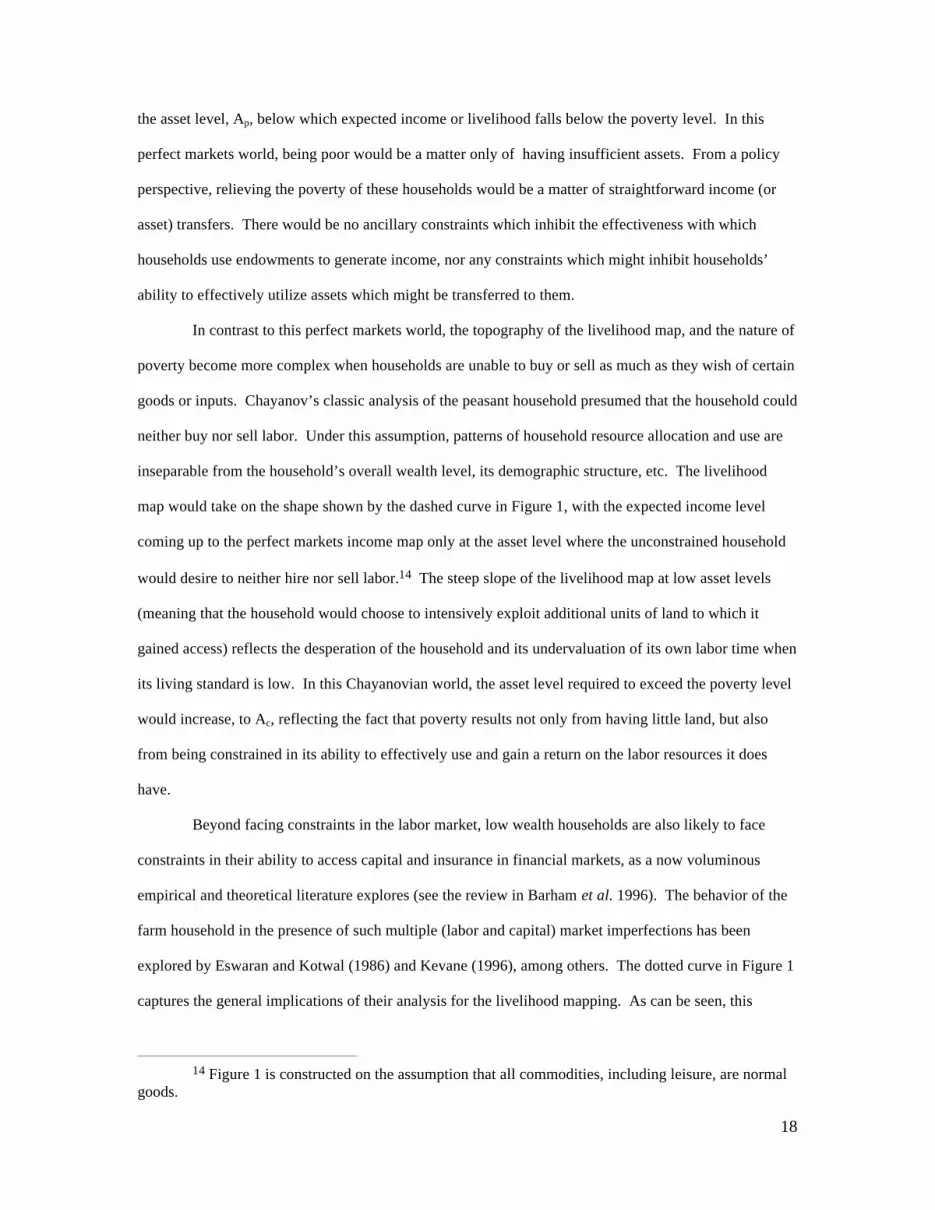
Figure 1 Microfoundations of Livelihhood Mapping and Asset Poverty
Livelihood Mapping under
Perfect Mkts
Income Poverty Line
ApApAc Am
Imperfect Labor Mkt
Multiple Market Imperfections
As Singh, Squire and Strauss (1985) have most thoroughly explored, when the household has
access to full and complete markets (meaning it can purchase or sell any quantity it desires of both
consumer goods and productive inputs like labor or capital), its production and (full) income generation
decisions become independent of, or separable from its consumption decisions and its overall level of
wealth and endowments. Under these assumptions, the topography of this livelihood map would be a
boring, upward sloping plane, featuring constant slopes throughout the endowment space (indicating that
marginal returns to endowments are constant everywhere, for rich and poor). The particular asset bundle
owned by the household would not influence its marginal returns to any individual asset or endowment.
The entitlement surface would simply be linear or additive in each asset or endowment.
The solid line in Figure 1 illustrates a two-dimensional livelihood map for this perfect markets
case. To keep matters simple, Figure 1 assumes that all households have the same demographic structure
and hence livelihood requirements so that vertical axis can be equivalently expressed in total income and
income per-adult equivalent units. The intersection of the poverty line with the livelihood map identifies
18
the asset level, Ap, below which expected income or livelihood falls below the poverty level. In this
perfect markets world, being poor would be a matter only of having insufficient assets. From a policy
perspective, relieving the poverty of these households would be a matter of straightforward income (or
asset) transfers. There would be no ancillary constraints which inhibit the effectiveness with which
households use endowments to generate income, nor any constraints which might inhibit households’
ability to effectively utilize assets which might be transferred to them.
In contrast to this perfect markets world, the topography of the livelihood map, and the nature of
poverty become more complex when households are unable to buy or sell as much as they wish of certain
goods or inputs. Chayanov’s classic analysis of the peasant household presumed that the household could
neither buy nor sell labor. Under this assumption, patterns of household resource allocation and use are
inseparable from the household’s overall wealth level, its demographic structure, etc. The livelihood
map would take on the shape shown by the dashed curve in Figure 1, with the expected income level
coming up to the perfect markets income map only at the asset level where the unconstrained household
would desire to neither hire nor sell labor.14 The steep slope of the livelihood map at low asset levels
(meaning that the household would choose to intensively exploit additional units of land to which it
gained access) reflects the desperation of the household and its undervaluation of its own labor time when
its living standard is low. In this Chayanovian world, the asset level required to exceed the poverty level
would increase, to Ac, reflecting the fact that poverty results not only from having little land, but also
from being constrained in its ability to effectively use and gain a return on the labor resources it does
have.
Beyond facing constraints in the labor market, low wealth households are also likely to face
constraints in their ability to access capital and insurance in financial markets, as a now voluminous
empirical and theoretical literature explores (see the review in Barham et al. 1996). The behavior of the
farm household in the presence of such multiple (labor and capital) market imperfections has been
explored by Eswaran and Kotwal (1986) and Kevane (1996), among others. The dotted curve in Figure 1
captures the general implications of their analysis for the livelihood mapping. As can be seen, this
14 Figure 1 is constructed on the assumption that all commodities, including leisure, are normal
goods.

19
additional market imperfection flattens the entitlement surface of low wealth borrowers who are unable
to access working capital needed to finance cash costs of production (including perhaps their own
immediate consumption needs). Despite their advantageous access to relatively cheap efficiency labor,
these households are unable to effectively utilize more than a minimal land endowment because of their
inability to capitalize production. Note that income (and marginal returns to productive assets) could
rise steeply beyond a wealth level where the household is able to gain access to formal financial markets
(see Kevane 1996 for a complete discussion of the impact of various financial and labor market
constraints on asset use and productivity).
In this multiple market imperfection world, the projection of the poverty line into asset space
now shifts out to a point like Am. Households can be poor both because they are close to the origin (i.e.,
they have a meager asset bundle) and, or because they are trapped in a flat portion of the endowment
space indicating constraints limiting the ability to generate income from that bundle.15 From a policy
perspective, such a world would be one in which the usual range of income and asset transfers can be
supplemented with ancillary financial market policies which correct constraints which limit poor
households ability to utilize those assets they do have. Equally important, in this world, simple asset
transfers (or market-assisted asset transfer schemes) may not work in the absence of what Carter and
Barham (1996) call a “proper microeconomic sequencing” of reform policies.
5. NON-PARAMETRIC ESTIMATES OF LIVELIHOOD ORENTITLEMENT MAPPINGS FOR RURAL SOUTH AFRICA
Rural South Africa is of course more complex than the multiple market failure model described
in the preceding section. Nonetheless that simple model suggests an interpretation of flat spots or other
twists in the topography of the empirical livelihood map to be estimated in this section. In addition to
15. The dynamic question is of course why households would get trapped in such unbalanced
portions of the asset space. Poverty is reproduced if the household remains stuck in that unremunerativeportion of the asset space over time. While issues of poverty reproduction are beyond the scope of thiswork and its cross-sectional data base, dynamic analysis of accumulation suggests two fundamentalreasons why a household may reproduce a weak endowment position over time. First, its income couldbe so low, and its current needs and discount rate so high, that little savings are generated. Second,missing insurance and contingency markets may lead the rational household into autarchic self-insurancestrategies which lead to reliance on safe savings instruments which generate low rates of return (e.g.,large grain stores generating a -7% rate of return in the prototypical peasant economy). Zimmerman andCarter (1996) discuss these issues of “distorted” accumulation in greater detail.

20
missing and imperfect markets analyzed in section 4, the logic of the survival strategies outlined section
3 reflects the reality of decades of apartheid and its restrictions on opportunity and mobility for the rural
African population. Moreover, unlike the abstract discussion in the prior section, households both save
and exercise social claims, implying that observable livelihood generation in any period depends on more
then contemporaneously generated income. Note that the real income transfers of a well functioning
system of reciprocity or of social safety nets will flatten out the livelihood map compared to the
individualistic theoretical representation in Figure 1 above.16 A similar effect obtains when individuals
transfer household members to better-off households (e.g., children may be sent to live with pensioner
grandparents--see May et. al 1995). Against the backdrop of these theoretical and other considerations,
this section goes on to employ a flexible econometric approach to the estimation and exploration of the
topography of the mapping between assets and livelihood or entitlements for rural South Africa.
Table 4 presents basic information on the variables to be used for the estimation of the
livelihood map. For the estimation and analysis of the entitlement mappings in rural South Africa, the
PSLSD data covering rural black households were split into three geographically defined groups, the arid
former homelands, the subsistence former homelands, and white farming regions. The three regions can
be distinguished from one another in terms of the environmental and economic structures of income
earning opportunities. The analysis presented here is for the subsistence former homeland region,
comprised primarily by KwaZulu/Natal, Mpumulanga and Eastern Cape. Results for the arid former
homeland areas are similar to those presented here. The entitlement mapping for rural black households
in white farming regions is rather distinctive, but is not reported here in the interest of saving space and
because of the relatively small number of African rural households in that region.
As Table 4 shows, livelihood or income per-scaled-adult equivalent averages only R230 in the
subsistence region, with a median value of R183.17 The endowments available to households to produce
income are divided into uneducated labor, educated labor; land; other productive assets (farming tools as
16 Sen (1981) colourfully denotes an economy which lacks the social reciprocity of traditional,
embedded economies and the social safety nets of the welfare state as a PEST for pure exchange systemin transition. Sen of course was writing at a time when the welfare state enjoyed greater politicallegitimacy then it does now, though this comment only heightens the importance of his observation aboutthe importance of safety nets in market economies.
17 As in the earlier sections, income is measured by total household expenditures.

21
well as equipment and installations used to generate non-farm self-employment income); livestock; and
monthly transfer income (defined as the sum of pension payments and remittances received by resident
household members). Both the labor and human capital endowments are measure as weighted sums of
the individuals resident in each household, with young children given a weight of zeros, older children
and the elderly a weight of 0.5, and all others given a weight of 1.0. Uneducated individuals are with less
than 5 years of schooling. Educated individuals are those with more then that amount. Also reported
with the labor variables is a measure of household reproduction time, defined as the full-time labor
equivalents devoted to the fetching of fuelwood and water. As can be seen, this variable averages nearly
60 percent of a full time worker in the sample, though the median is lower. As documented in May et al.
(1995), these tasks are primarily undertaken by women and girls. This household reproduction burden
suggests that the net endowment of labor time is significantly less than the gross figures for uneducated
labor availability suggest. How this and other constraints impinge on the ability of rural African
households to generate a livelihood is explored in the remainder of this section.
(a) Non-Parametric Estimation Procedure for Livelihood Maps
In order to explore the topography of the mapping between assets and livelihood, this section
utilizes the non-parametric smoothing technique of locally weighted regression (or LOESS, see
Cleveland et al. 1989, and Hastie and Tibshirani 1990).18 For each data point, LOESS calculates a set of
local regression weights (as detailed below) for all other observations in the sample. These observation-
specific regression weights are then used to approximate a unique local regression fit for each
observation, as described by Cleveland et al. (1989). While no single set of numerical parameters can
describe the LOESS fit, the results can be displayed and interpreted graphically using higher order
conditioning plots, as will be explained momentarily.
The advantages of the non-parametric LOESS procedure over conventional parametric
regression analysis are several fold in the current context. First, LOESS flexibly allows the shape of
18. An advantage of non-parametric techniques is that they allow flexible exploration of a
regression surface. Unfortunately, many non-parametric techniques break-down over eitherdimensionality (i.e., if they are more than a single explanatory variable) or over interactions amongexplanatory variables. LOESS techniques offer a nice compromise of flexibility with less sacrifice in thenature of the interactions being modeled.

22
Table 4: Income and Endowment Variables for Non-Parametric Regression Analysis*
Full Sample(4208 observations)
Subsistence Former Homelands(1549 observations)
% withAsset
Mean Median % withAsset
Mean Median
LIVELIHOOD - 292 199 230 185Household Size
(Scaled AdultEquivalents)
-- 4.0 3.9 -- 4.7 4.3
Earned Income -- 561 230 -- 522 161
UNEDUCATEDLABOR(fte’s)
98 3.0 2.8 98 3.5 3.3
EDUCATEDLABOR(fte’s)
28 0.42 0 30 0.45 0
HH REPRO.TIME (fte’s)
-- 0.49 0.03 -- 0.58 0.1
LAND (hectares) 26 0.41 0 41 0.6 0
LIVESTOCK 24 1038 0 36 1776 0TRANSFER
INCOME59 246 140 67 272 187
MigrantRemittances
39 105 0 57 144 33
Pensions andTransfers
32 141 0 30 128 0
PRODUCTIVECAPITAL
24 217 0 38 383 0
SME Equip. 139 0 215 0Agricultural
Equipment18 78 0 30 168 0
* Bold-faced variables are those actually used in regression analysis. Unless otherwise indicated, all variablesmeasured in Rand/month for flows and total Rand for stocks.
the regression function to change over the data space. Such flexibility is particularly appropriate for the
exploration of livelihood or entitlement maps given that theory predicts that these mapping can take on
complex and variable shapes over the endowment space, depending on the interacting, and theoretically
indeterminate effects, of multiple market imperfections. In addition, the “localness” of the regression fit
should help partially mitigate that the fact that particularly livelihood strategies are the endogenous result
of a not yet well understood household decisionmaking process. Thus, households which choose to
cultivate the land to which they have access may in fact be those who have experienced an entitlement
failure along other dimensions (e.g., the household may have lost or failed to find formal sector wage

23
employment for its labor power). A conventional, single-equation parametric analysis might show that
land has a low or even negative impact on livelihood if land rights are only exercised by households
which have experienced relatively unfavorable circumstances in the labor market. In contrast, a local
regression fit will estimate the impact of land on livelihood using information on structurally similar,
statistically proximate, observations.19 LOESS results are thus less likely to be biased by the
endogeneity of the decisions to pursue a particular livelihood strategy.
Computationally, LOESS estimates are calculated as follows. For a given observation x, let
∆i(x) be the Euclidean distance from x to the explanatory variables of the “i
th” observation. Let ∆
(i) (x) be
the value of those distances ordered from smallest to largest. For the α observations closest to x, the
local regression weight for observation “i” is defined by the following tricube weight function:
wi(x) = (1 - ( ∆i (x) / ∆(α) (x))3)3
where ∆(α)
(x) is the distance of the α most close observation to x. The other N-α observations (i.e., those
further away from point x than the cutoff observation α) are given a zero weight. Note that the parameter
α thus determines the bandwidth, or span, of the LOESS non-parametric estimation (see Hastie and
Tibshirani 1990). The results reported below use a default span parameter of 75 percent. All
computations were carried out using the SPLUS software.20
(b) Endowment Necessitated Choice and Poverty
To explore the nature of rural livelihood mapping, LOESS techniques were used to explore the
relationship between livelihood (measured as income per-scaled adult equivalent) and the following
assets shown in Table 4: Land access (measured in hectares); Livestock; Productive capital (measured as
the Rand value of agricultural implements and equipment used in small and medium enterprises);
19 The standard ordinary least squares parametric regression results reported in May et al. (1995)
in fact estimate that land has a negative impact on livelihood generation. It should, however, be notedthat the non-parametric local regression approach utilized here will still tend to confound the impact oflatent characteristics which uniquely enhance the household’s return to certain activities (e.g., farmingskill) with the expected average return to, say, land use.
20 Because of programming restrictions, all LOESS fits were specified to locally linear in theexplanatory variables as SPLUS will not support locally quadratic fits when more than four explanatoryvariables are utilized. Inspection of a truncated model, with only four variables, suggests that thisrestriction was not especially important.

24
Uneducated labor (measured in full time adult equivalents); Educated labor (in full time equivalents);
financial capital or liquidity (measured as transfer income form either migrant remittances or government
social welfare transfers); and, the “negative asset” of required household reproduction time (measured as
the full time labor equivalents spent in the collection of water and fuel). This latter variable is included
on the ground that while household reproduction time is probably partially endogenous to realized
income levels (e.g., a wealthier household can substitute a paraffin stove for firewood), the huge amounts
of time spent by many rural households on these tasks primarily reflects poor social infrastructure.
237
300
500800
0
1
2
3
4
5
6
0 2 4 6 8
Uneducated Labor
Edu
cate
d La
bor
Figure 2: Livelihood Contour Map
Conditional on Median Values for Other Variables
Figure 2 gives a first look at the nature of the estimated livelihood mapping. Drawn holding
land, transfer income and household reproduction time at their sample medians, the contours in Figure 2
show those combinations of uneducated and uneducated labor which map into the indicated levels of
livelihood. Note that the contour marking an income of 237 Rand (per-scaled adult equivalent per-month)
is the projection of the conventional income-based poverty line into asset space. In simpler terms,

25
Figure 2 maps out those asset combinations which are expected to yield a livelihood at or below a
subsistence living standard.
Apparent in Figure 2 are the extremely low returns to uneducated labor as increments of
uneducated labor actually reduce scaled per-capita income, indicating that expected incremental returns
to uneducated labor are below a poverty subsistence level. It should be stressed that Figure 2 is drawn
conditional on holding other endowment variables at their median levels (including social claims). It is
thus apparent from Figure 2 that only those households with either education or other assets above
median levels are likely to be found above a poverty standard of living. In simplest terms, Figure 2
shows that poverty in rural South Africa is in part simply a measure of having few assets to which the
extant economy pays significant returns.
2
4
6
2
4
6
0
100
200
300
UneducatedLaborHH Rep'n Time
ncome
Figure 3: Time Poverty and Livelihoods
Conditional on Median Values for Other Variables
As discussed in section 4, in the actually existing world of imperfect markets, poverty is also
potentially the result of interacting constraints which prevent households from effectively deploying and
earning returns to the meager assets they do possess. Figures 3 and 4 use the LOESS estimates to

26
explores aspects of these interacting constraints. Figure 3 explores the impact of household reproduction
time on income generation capacity. Subject to the endogeneity caveat described above, these estimates
suggest that for a given work capacity, household reproduction time sharply diminishes income
generation capacity. Indeed, the time demands of securing drinking water and fuelwood diminish the
median household’s available uneducated labor power by some 20 percent. While returns to this labor
are low, it is clear that poverty in part reflects the state of rural infrastructure which creates what might
be termed Time Poverty.
1
2
3
4
200
400
600
800
1000
150
200
250
300
350
LandTransfer Inc.
Income
Figure 4: Capital Constraints and Land Productivity
Conditional on Median Values for Other Variables
Finally, Figure 4 explores the interactions between transfer income (as a potential source of
capitalizing liquidity) and land. The surface is drawn for median levels of labor, education and
household reproduction time. The ability of transfer income to apparently relax a binding capital
constraint is visible in the steepening slope of the entitlement surface (with respect to land) as transfer
income increases. When transfer income is low, marginal returns to land are actually estimated to be
slightly negative (holding labor fixed). By contrast, returns to land rise to about R50/hectare/per-month

27
when transfer income is high. These twists in the topography of the livelihood surface are similar to what
the simple multiple market failure model above shows to be the impact of binding capital or liquidity
constraints on the returns to land. While there are undoubtedly other important constraints which limit
rural households’ ability to effectively use land resources, the flat part of the entitlement surface when
independent is low, matches the theoretical expectation discussed in section 4 above.
To summarize, understood as the result of optimizing, endowment necessitated choice, the
topography of the entitlement mapping which links endowments and real incomes helps identify the
nature of the constraints which shape livelihood choices by the rural poor. The empirical estimates
presented here identify significant departures from the smooth asset additivity which would characterize
the mapping in a world of full and complete markets. The poor are poor not only because they have few
assets, but also because they appear constrained in their ability to effectively utilize the assets they do
have. Under the existing structure of opportunity, which surely remains an artifact of the legal
restrictions of apartheid, an land endowment appears necessary to garner a return to uneducated labor,
and an endowment of capital (measured as an inflow of transfer income) appears necessary to effectively
utilize land. The picture which emerges is one in which wage opportunities are weak and ancillary factor
markets do not working very well.
6. CONCLUSION
This paper has explored the economics of livelihood generation and class in rural South Africa
in an effort to understand not just who is poor, and along what dimensions, but why they are poor. In
general, the picture that emerges is one of poor households with alarmingly limited access to
endowments, highly constrained options for the use of these endowments, and in most cases, poor returns
being generated for those activities which they are able to engage. Stratification of the rural population
into livelihood classes based on shared livelihood strategies reveals that economic well-being differs
systematically across livelihood class. This suggests that the poor and the non-poor gain their livelihoods
from rather distinctive portfolios of activities and enjoy rather different sets of economic endowments
and social claims. Merging Sen’s entitlement approach with the economic theory of the household in
imperfect market environments, non-parametric estimates of the mapping between household

28
endowments and poverty is presented. Analysis of the estimated mapping permits identification of those
endowment bundles (or portions of the endowment space) which map into livelihoods above the poverty
line and reveals three two dimensions of the rural poverty problem:
1. Most simply and matching the conventional concept of poverty, returns to uneducated labor are solow that claims on other economic or social assets are necessary to lift a family above the povertyline;
2. The topography of the livelihood map identifies financial constraints which limit the poor’s ability toeffectively utilize productive assets and endowments (e.g., land) which they do have. Poverty is thusnot only a matter of few assets, but also of constraints to effective use of those assets.
3. The burden of water and fuelwood fetching in rural South Africa creates a “time poverty” whichfurther constrains households ability to effectively employ those resources to which they do haveaccess in the generation of livelihood.
These findings about the nature of rural poverty have implications for policy designed to
promote rural livelihoods and relieve poverty. In a world in which markets were perfect, a policy which
transferred assets such as land to the poor would indeed improve their position as they would simply be
able to use factor markets to access any complementary resources which they might need. In a country in
which policies have systematically distorted almost every economic market and social institution, it is not
possible to be sanguine about the functioning of factor markets. In addition, a wealth of international
experience suggest that factor markets--especially financial markets--tend not to work well for the poor,
irrespective of policy distortions (e.g., see Barham et al. 1996).
These results thus suggest that policy prioritize actions which lift the constraints which limit the
effectiveness with which the rural poor are able to use the limited assets and endowments they possess
should be especially beneficial. As an example of such policy would be the promotion of local financial
institutions which would help release the financial constraints discussed above. These micro-lending
institutions would need to have the capacity to extend credit, take deposits and foster investment while
dealing with the costs of numerous small transactions. The delivery of essential services, especially
water and energy would be a complementary measure to release time constraints for rural households,
thereby allowing them to engage in productive activities. While not all constraints need be lifted prior to,
or simultaneous with, asset transfer schemes, it is important to note that when productive assets are
transferred at market prices (as they are under the market-assisted land reform policies being utilized in
South Africa), the failure to lift constraints to asset use effectively causes a decapitalization of the poor.

29
Successfully implementing these policies will require flexibility at a local level so as to permit
appropriate sequencing. Support would be required to strengthen or establish institutions which can
facilitate implementation of this nature . A final concern to be taken into account is the strong evidence
that rural communities are fundamentally heterogeneous in nature. If overlooked, this characteristic can
undermine development initiatives in rural areas through the influence of patronage and factionalism. It
also suggests that there is the potential for conflict between integrative development strategies and the
differentiated nature of the intended beneficiaries. Despite this, shared economic or social need may
offer a more powerful basis for collective action than that of an organisation based on locality, such as
the village development committee, and if recognised, be contribute towards the alleviation of poverty.

30
REFERENCES
Ardington, E.M., (1994): Quantitative Analysis of Socio-Economic Data from Five ThousandHouseholds in KwaZulu, CSDS Research Report No. 4, University of Natal, Durban.
Ardington, E.M. and F. Lund (1996). “Questioning Rural Livelihoods,” in in Michael Lipton etal. (eds). Land, Labour and Livelihoods in Rural South Africa, Volume 2 (University ofNatal Indicator Press: Durban).
Barham, Bradford, Steven Boucher and Michael Carter (1996). “Credit Constraints, CreditUnions and Small Scale Producers in Guatemala,” World Development 24(5):793-806.
Burawoy, M., (1975): The functions and reproduction of migrant labour: comparative materialfrom Southern Africa and the United States, American Journal of Sociology, 81(5).
Carter, Michael and B. Barham (1996): “Level Playing Fields and Laissez Faire: Post-Liberalization Development Policy in Inegalitarian Agrarian Economies,” WorldDevelopment 24(7):1133-1149.
Chayanov, A.V., (1966): On the Theory of Peasant Economy (Homewood, ILL: Richard D.Irwin Press).
Cleveland, W., S. Devlin and E. Grosse (1988). “Regression by Local Fitting: Methods,Properties and Computation Algorithms,” Journal of Econometrics, 37, 87-114.
Cliffe, L., (1977): “Rural Class Formation in East Africa,” Journal of Peasant Studies, Vol. 4,No. 2.
Eswaran, M. and A. Kotwal (1986). “Access to Capital and Agrarian Production Organization,”Economic Journal.
Gore, C (1993): “Entitlement relations and "unruly" social practices: A comment on the work ofAmartya Sen,” Journal of Development Studies, 29(3)
Hastie, T.J. and R.J. Tibshirani (1990): Generalized Additive Models, Chapman and Hall,London.
Institute for Planning Research (IPR) (1993). The Household Subsistence Level in the MajorUrban Centres of the Republic of South Africa (Port Elizabeth, RSA: IPR, Universityof Port Elizabeth).
Kakwani, N. (1989). “On Measuring Undernutrition,” Oxford Economic Papers 41: 528-552.
Kevane, Michael (1996). “Agrarian Structure and Agricultural Practice in Western Sudan,”American Journal of Agricultural Economics.
Levin, R. and M. Neocosmas, (1987): The Agrarian Question and Class Contradiction in SouthAfrica: Some Theoretical Issues for Consideration, paper presented at the workshop on

31
“The South African Agrarian Question: Past, Present & Future, University of theWitwatersrand, May 22-24, 1987.
Lipton, Michael, de Klerk Mike and Merle Lipton (1996). Land, Labour and Livelihoods inRural South Africa, Volumes 1 and 2 (University of Natal Indicator Press: Durban).
Lipton, Michael, de Klerk Mike and Merle Lipton, (1996). “Introduction,” in Michael Lipton etal. (eds). Land, Labour and Livelihoods in Rural South Africa, Volume 1 (University ofNatal Indicator Press: Durban).
Maxwell, S. and M. Smith, (1992): Household Food Security: A Conceptual Review, IDSReport, Institute for Development Studies, University of Sussex.
May, Julian, Michael Carter and Dori Posel (1995). “The Composition and Persistence of RuralPoverty in South Africa: An Entitlements Approach,” LAPC Policy Paper No. 15.
May, J. (1996). “Assets, Income and Livelihoods in Rural KwaZulu-Natal,” in Michael Lipton etal. (eds). Land, Labour and Livelihoods in Rural South Africa, Volume 2 (University ofNatal Indicator Press: Durban).
May, J. and S. Rankin, (1991): The differentiation of the urbanisation process under apartheid,World Development, Vol. 19, No. 10.
May, J., (1987): Migrant Labour in Transkei: Cause and Consequence at the Village Level,Journal of Contemporary African Studies, Vol. 6, No 1/2.
May J., (1987). Differentiation and Inequality in the Bantustans: Evidence from KwaZulu. SocialDynamics. Vol. 13, No. 2, University of Cape Town.
McKinley, T. and D. Alarcon (1995). “The Prevalence of Rural Poverty in Mexcio,” WorldDevelopment 23(9): 1575-1585.
Murphy, C., (1991): Gender constraints to increased agricultural production - a case study ofwomen in rural KwaZulu, paper presented to the Conference on Women and Gender inSouthern Africa, 30/01/91 to 02/02/91, University of Natal, Durban.
Murray, C., (1978): Migration, Differentiation and the Developmental Cycle in Lesotho, in, vonBinbergin, W.M. and H.A. Meilink, Africa Perspectives: Migration and theTransformation of Modern African Society, Studiecentrum, Leiden.
Nicholson, C.A. and T.J. Bembridge (1991): Characteristics of Black Commercial Farmers inGazankulu, South African Journal of Agricultural Extension, Vol 7., No. 17.
Posel, D., (1994): Household and Women in South Africa, A Poverty Profile, Rural PovertyStudy Working Paper, Data Research Africa, Durban.
Ravallion, Martin (1996). “Issues in Measuring and Modeling Poverty,” Economic Journal 106(September).

32
Sen, A., (1981). Poverty and Famines: An Essay on Entitlement and Deprivation, ClarendonPress, Oxford.
Singh, I., L. Squire and J. Strauss (1984). Agricultural Household Models, Baltimore, JohnsHopkins.
Wilson, F. and M. Ramphele, (1989): Uprooting Poverty: The South African Challenge, DavidPhilips, Cape Town.
World Bank, (1994): World Development Report, 1994, World Bank, Washington, D.C.
Zimmerman, F. and M. Carter (1996): “Portfolio Management under Risk and SubsistenceConstraints in Developing Countries,” Agricultural and Applied Economics Staff Paper402 (Madison:, University of Wisconsin).