agricultural economics research centre november, 2015
TRANSCRIPT
Research Study No. 2015/02
RELATIONSHIP BETWEEN WHOLESALE PRICES, RETAIL PRICES AND EXPORT PRICES OF BASMATI RICE IN HARYANA
Usha Tuteja
Agricultural Economics Research Centre
University of Delhi
Delhi -110 007
November, 2015
I
PREFACE
The present study sponsored by the Ministry of Agriculture, Government of India aimed at
analyzing issues related to basmati rice in Haryana. The primary as well as secondary sources of data
were used to fulfill the specific objectives of the study. Primary data were collected through a field
survey of 150 farmers growing basmati paddy in the selected three districts of Haryana.
The results of this study reveal (i) India produces about 7-8 million tonnes of basmati rice
primarily in three major states – Haryana, Punjab and Uttar Pradesh (ii) the steady increase in
production of basmati rice and demand in the world market has made India a leading exporter in the
world (iii) the results of intra year variability show that 30 per cent of basmati rice is exported in
January, February and March (iv) per farm production of basmati paddy on sampled farms was around
113 qtls during 2013-14. A small part of the produce was retained for domestic consumption and other
purposes. The marketed surplus of Basmati 1121 and 1509 was 16529 qtls and 1532 qtls. Farmers
realized a price of Rs. 3607 and Rs. 3364 per qtl respectively for these varieties (v) the per hectare net
returns from cultivation of Basmati 1121 and 1509 were Rs. 108903 and Rs. 113569 respectively
during 2013-14 (vi) farmers sold basmati paddy through village market and commission agents (vii)
producers of Basmati 1121 and 1509 received 66.41 and 63.62 per cent of consumer’s rupee (viii)
other intermediaries such as wholesalers, retailers and exporters earned margin between 4.34 and
11.43 per cent (ix) stakeholders – wholesalers, retailers and exporters perceived variety of problems
during the process from production to exports.
Basmati rice is a great strength of India since its quality in terms of grain length and aroma
can hardly match any other variety of rice in the world. There has been commendable increase in the
production of basmati in the country due to area expansion and yield enhancement. The steady
increase in production and growing demand in the world market has made India a leading exporter in
the world. India has potential to further increase production of basmati rice primarily through yield
enhancement. This is essential for maintaining the position as a leading exporter in the world market.
Therefore, ensuring profitability of basmati rice on sustainable basis through suitable policy reforms
appears to be a pre-requisite for successful strategy. These reforms include favourable price regime,
technology for raising the existing level of productivity, financial support, rural infrastructure and above
all, multi-pronged government support in particular, simplifying the procedures for exports.
We are grateful to Prof. Pami Dua, Chairperson, GB, for her constant encouragement to
complete this study. We express our thanks to the Ministry of Agriculture, Government of India for
providing support during the course of this study. Thanks are due to the coordinator of the study,
Dr. C.S.C. Sekher, Associate Professor, Institute of Economic Growth, Delhi for providing the study
design, tabulation scheme and useful comments on the draft report. We are thankful to Deputy
Directors, Agriculture of Selected districts for the useful discussion on various aspects of the project.
Thanks are due to study team for contribution during the course of this study. Author gratefully
acknowledges the support of all the staff members of the AER Centre, Delhi University.
November, 2015 Usha Tuteja
II
Project Team
Project Leader Dr. Usha Tuteja
Field Survey and Inputting of Primary Data Dr. Subhash Chandra
Dr. Vishnu Shanker Meena Ms. Nandini Pandey Mr. Vishal Dagar
Primary and Secondary Data Analysis Mr. Narinder Singh
Bibliographical Assistance Ms. Nandi Negi
Word Processing Mr. Sri Chand
III
Contents
Chapter No.
Title Page No.
Chapter-1
Introduction 1.1 Basmati Production in India 1.2 Exports of Basmati Rice 1.3 Literature Survey 1.4 Objectives 1.5 Study Design and Methodology 1.6 Analytical Framework 1.7 Organization of the Study
1-28 1 3 9
25 26 27 28
Chapter-2
Basic Indicators of Selected Districts and Status of Basmati Paddy in Haryana Section-1: Select Districts Section-2: Area, Production and Yield of Basmati Paddy in Haryana
29-36 29 34
Chapter-3
Demographic Profile and Cropping Pattern of the Sampled Farms 3.1 Demographic Characteristics 3.2 Land Details 3.3 Status of Irrigation of Land Holdings 3.4 Cropping Pattern 3.5 Area under Different Varieties of Basmati Paddy
31-45 37 39 40 41 43
Chapter-4
Economics of Cultivation of Basmati Paddy in Haryana 4.1 Area, Production, Consumption and Marketed Surplus 4.2 Cost of Cultivation 4.3 Economics of Basmati Paddy Cultivation:
46-57 46 49 55
Chapter-5
Marketing of Basmati Produce 5.1 Status of Regulated Markets in Haryana 5.2 Disposal of Basmati Paddy 5.3 Marketwise Disposal of Basmati Paddy 5.4 Month-wise Disposal of Basmati Paddy 5.5 Sources of Supply of Basmati Rice for Intermediaries
58-71 58 60 64 66 69
Chapter-6
Price Pattern over Time and Space 6.1 Producer’s Price and Price Spread 6.2 Wholesaler’s Price 6.3 Retailer’s Price 6.4 Exporter’s Price
72-83 72 73 77 80
Chapter-7
Perceptions of Stakeholders on Production and Trade of Basmati Paddy/Rice 7.1 Reasons for Cultivation of Basmati Paddy 7.2 Problems of Farmers 7.3 Problems faced by Wholesalers 7.4 Problems faced by Retailers 7.5 Problems Faced by Exporters:
84-92 84 86 89 89 90
Chapter-8
Summary and Conclusion 8.1 Objectives of the Study 8.2 Research Methodology 8.3 Main Findings 8.4 Policy Implications
93-104 93 94 95
103
Bibliography 104-05
IV
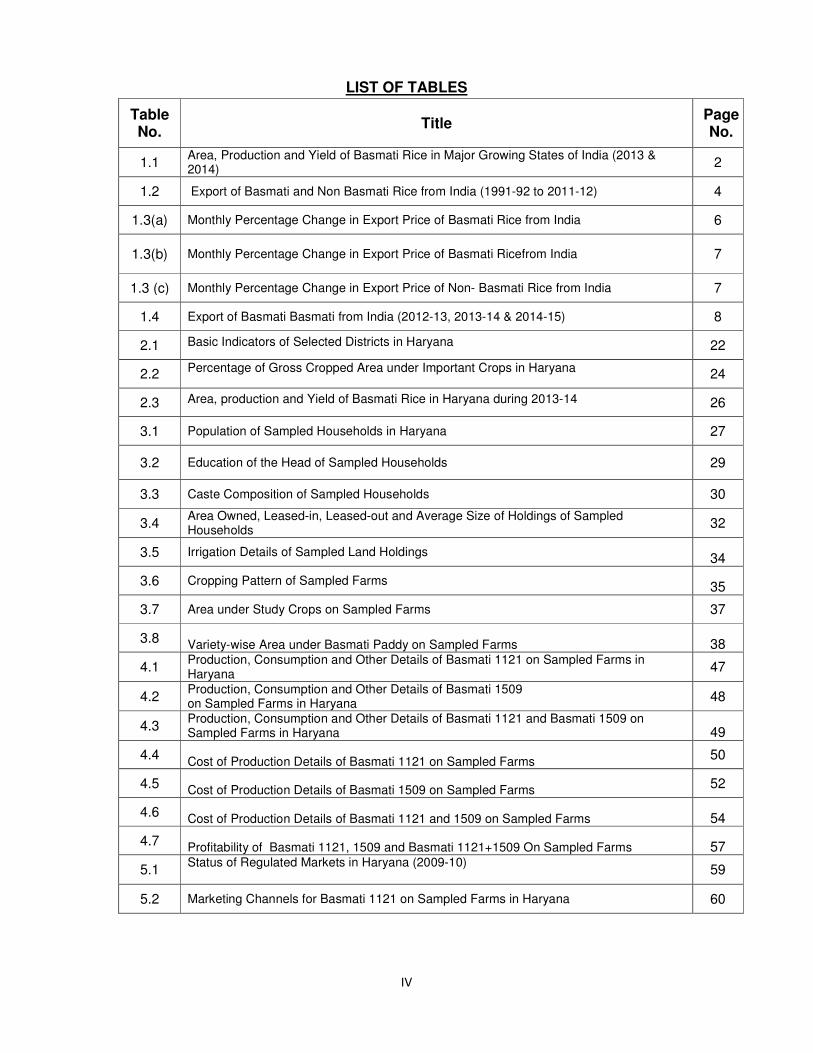
LIST OF TABLES
Table No.
Title Page No.
1.1 Area, Production and Yield of Basmati Rice in Major Growing States of India (2013 & 2014)
2
1.2 Export of Basmati and Non Basmati Rice from India (1991-92 to 2011-12) 4
1.3(a) Monthly Percentage Change in Export Price of Basmati Rice from India 6
1.3(b) Monthly Percentage Change in Export Price of Basmati Ricefrom India 7
1.3 (c) Monthly Percentage Change in Export Price of Non- Basmati Rice from India 7
1.4 Export of Basmati Basmati from India (2012-13, 2013-14 & 2014-15) 8
2.1 Basic Indicators of Selected Districts in Haryana 22
2.2 Percentage of Gross Cropped Area under Important Crops in Haryana
24
2.3 Area, production and Yield of Basmati Rice in Haryana during 2013-14 26
3.1 Population of Sampled Households in Haryana 27
3.2 Education of the Head of Sampled Households 29
3.3 Caste Composition of Sampled Households 30
3.4 Area Owned, Leased-in, Leased-out and Average Size of Holdings of Sampled Households
32
3.5 Irrigation Details of Sampled Land Holdings 34
3.6 Cropping Pattern of Sampled Farms 35
3.7 Area under Study Crops on Sampled Farms 37
3.8 Variety-wise Area under Basmati Paddy on Sampled Farms 38
4.1 Production, Consumption and Other Details of Basmati 1121 on Sampled Farms in Haryana
47
4.2 Production, Consumption and Other Details of Basmati 1509 on Sampled Farms in Haryana
48
4.3 Production, Consumption and Other Details of Basmati 1121 and Basmati 1509 on Sampled Farms in Haryana 49
4.4 Cost of Production Details of Basmati 1121 on Sampled Farms
50
4.5 Cost of Production Details of Basmati 1509 on Sampled Farms
52
4.6 Cost of Production Details of Basmati 1121 and 1509 on Sampled Farms 54
4.7 Profitability of Basmati 1121, 1509 and Basmati 1121+1509 On Sampled Farms 57
5.1 Status of Regulated Markets in Haryana (2009-10)
59
5.2 Marketing Channels for Basmati 1121 on Sampled Farms in Haryana 60
V
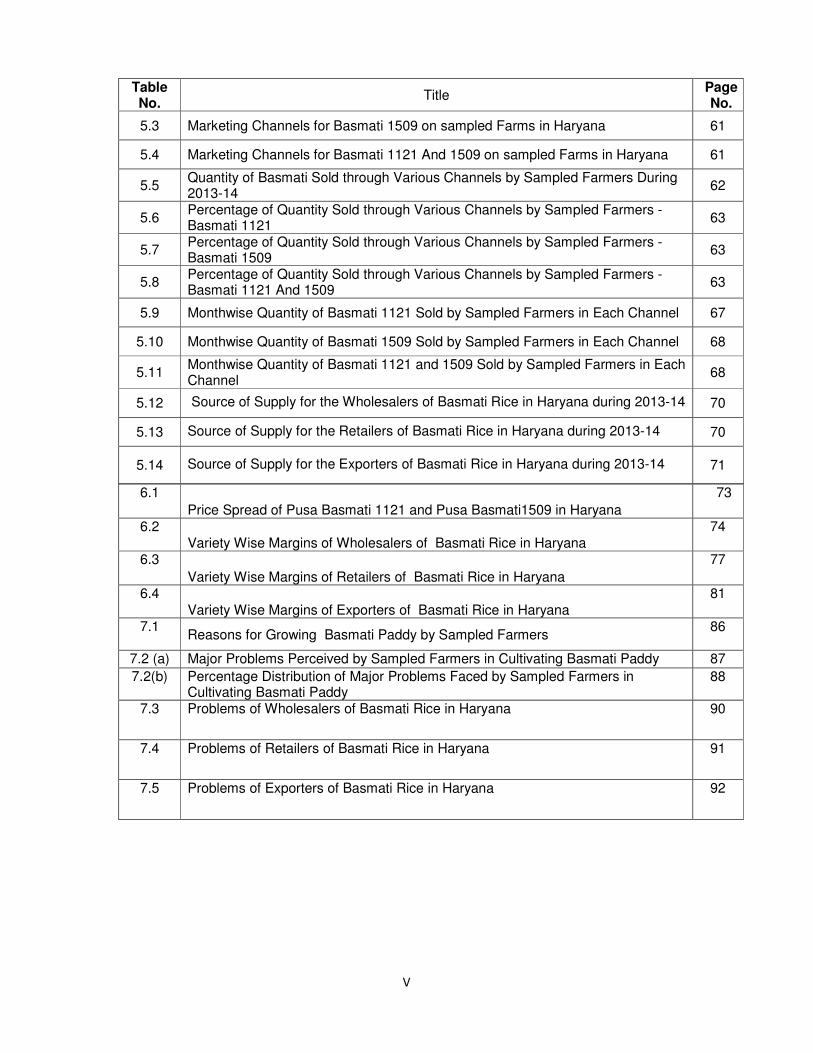
Table No.
Title Page No.
5.3 Marketing Channels for Basmati 1509 on sampled Farms in Haryana 61
5.4 Marketing Channels for Basmati 1121 And 1509 on sampled Farms in Haryana 61
5.5 Quantity of Basmati Sold through Various Channels by Sampled Farmers During 2013-14
62
5.6 Percentage of Quantity Sold through Various Channels by Sampled Farmers - Basmati 1121
63
5.7 Percentage of Quantity Sold through Various Channels by Sampled Farmers - Basmati 1509
63
5.8 Percentage of Quantity Sold through Various Channels by Sampled Farmers - Basmati 1121 And 1509
63
5.9 Monthwise Quantity of Basmati 1121 Sold by Sampled Farmers in Each Channel 67
5.10 Monthwise Quantity of Basmati 1509 Sold by Sampled Farmers in Each Channel 68
5.11 Monthwise Quantity of Basmati 1121 and 1509 Sold by Sampled Farmers in Each Channel
68
5.12 Source of Supply for the Wholesalers of Basmati Rice in Haryana during 2013-14 70
5.13 Source of Supply for the Retailers of Basmati Rice in Haryana during 2013-14 70
5.14 Source of Supply for the Exporters of Basmati Rice in Haryana during 2013-14 71
6.1
Price Spread of Pusa Basmati 1121 and Pusa Basmati1509 in Haryana
73
6.2 Variety Wise Margins of Wholesalers of Basmati Rice in Haryana
74
6.3
Variety Wise Margins of Retailers of Basmati Rice in Haryana
77
6.4
Variety Wise Margins of Exporters of Basmati Rice in Haryana
81
7.1 Reasons for Growing Basmati Paddy by Sampled Farmers
86
7.2 (a) Major Problems Perceived by Sampled Farmers in Cultivating Basmati Paddy 87
7.2(b) Percentage Distribution of Major Problems Faced by Sampled Farmers in Cultivating Basmati Paddy
88
7.3 Problems of Wholesalers of Basmati Rice in Haryana
90
7.4 Problems of Retailers of Basmati Rice in Haryana
91
7.5 Problems of Exporters of Basmati Rice in Haryana
92
Introduction
1
Chapter-1
Introduction
Rice is an important staple food grain for more than 60 per cent of the world
population. Therefore, it has shaped culture, diet and economics of thousand of
million households across the globe. Considering the importance of rice in human
food, the United Nations designated 2004 as the International Year of Rice. The
common uses of rice include ready to eat products (popped & puffed rice, rice flakes,
canned rice and fermented products). In addition, rice straw is used as cattle feed,
for thatching roof and in cottage industry for making ropes, hats, mats, etc. Rice husk
and bran are also used as animal feed, fuel, making paper and medium of cooking.
India is the second largest producer of rice after China in the world. It grows
large number of varieties across the regions. Basmati is very special and regarded
as the gold standard of rice. It is one of the India’s great national treasures, at par
with saffron from Kashmir, pepper from Kerala and tea from Darjeeling. What makes
basmati so special? After all, there are thousands of rice varieties in India. Why is
basmati deserving special attention?. First of all, basmati is the Indian rice that we
have grown in the foothills of the Himalayas for many centuries. Secondly, the best
kinds of basmati have long grains that stay separate and distinct, even when they
are cooked. The third reason is fragrance. So basmati is one of the world’s most
special rice varieties. It is not just the flavor and the shape of the grain, it is also that
distinctive aroma that few other rice breeds can hope to match.
India produces about 7-8 million tonnes of basmati rice (12 million tonnes of
paddy at 66 per cent conversion ratio) primarily in three states namely, Haryana,
Punjab and Uttar Pradesh. It is one of the major export items from India. The
exports of basmati rice touched about 3 million tonnes, equivalent to Rs. 15336 crore
during 2011-12. Pusa Basmati 1121 &1509 which are hybrid varieties and yield
higher than traditional basmati have become popular in Iran and other export
markets of West Asia.
1.1 Basmati Production in India:
During the past two decades, area, production, productivity, availability and
exports of basmati rice from India increased manifolds which provided ample
opportunities to producers and exporters in major basmati growing states such as
Haryana and Punjab.
Introduction
2
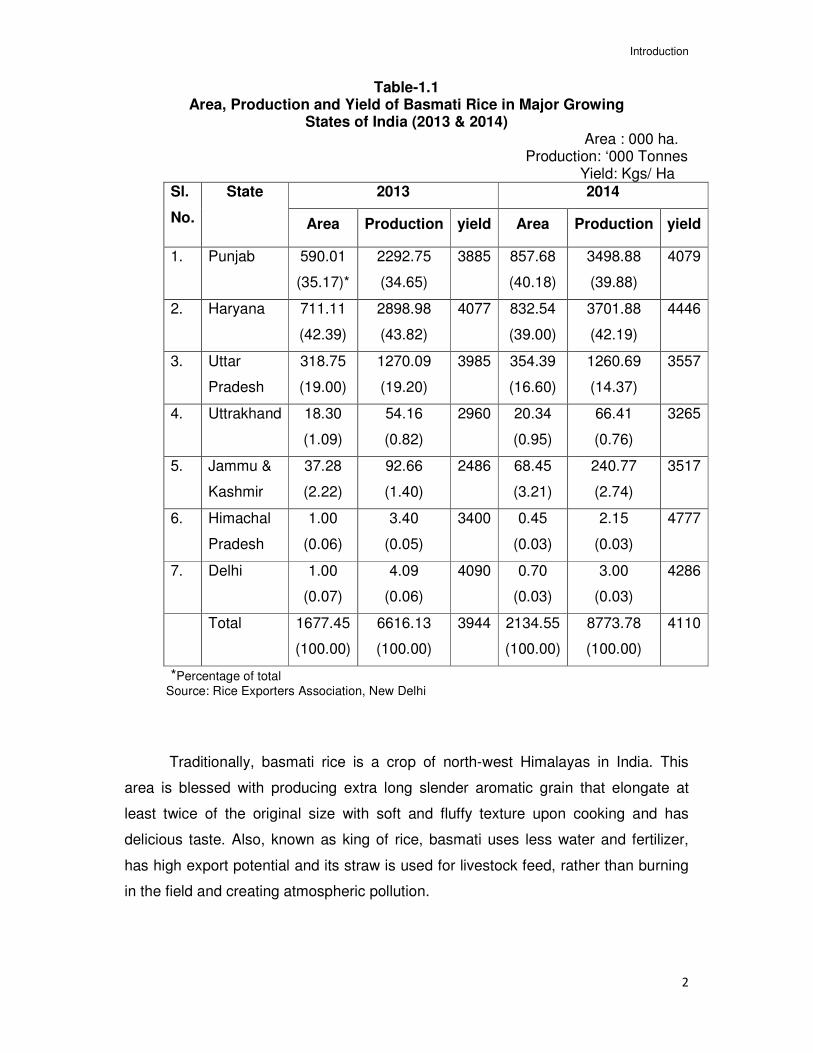
Table-1.1 Area, Production and Yield of Basmati Rice in Major Growing
States of India (2013 & 2014) Area : 000 ha.
Production: ‘000 Tonnes Yield: Kgs/ Ha
Sl.
No.
State 2013 2014
Area Production yield Area Production yield
1. Punjab 590.01
(35.17)*
2292.75
(34.65)
3885
857.68
(40.18)
3498.88
(39.88)
4079
2. Haryana 711.11
(42.39)
2898.98
(43.82)
4077 832.54
(39.00)
3701.88
(42.19)
4446
3. Uttar
Pradesh
318.75
(19.00)
1270.09
(19.20)
3985 354.39
(16.60)
1260.69
(14.37)
3557
4. Uttrakhand 18.30
(1.09)
54.16
(0.82)
2960 20.34
(0.95)
66.41
(0.76)
3265
5. Jammu &
Kashmir
37.28
(2.22)
92.66
(1.40)
2486 68.45
(3.21)
240.77
(2.74)
3517
6. Himachal
Pradesh
1.00
(0.06)
3.40
(0.05)
3400 0.45
(0.03)
2.15
(0.03)
4777
7. Delhi 1.00
(0.07)
4.09
(0.06)
4090 0.70
(0.03)
3.00
(0.03)
4286
Total 1677.45
(100.00)
6616.13
(100.00)
3944 2134.55
(100.00)
8773.78
(100.00)
4110
*Percentage of total Source: Rice Exporters Association, New Delhi
Traditionally, basmati rice is a crop of north-west Himalayas in India. This
area is blessed with producing extra long slender aromatic grain that elongate at
least twice of the original size with soft and fluffy texture upon cooking and has
delicious taste. Also, known as king of rice, basmati uses less water and fertilizer,
has high export potential and its straw is used for livestock feed, rather than burning
in the field and creating atmospheric pollution.
Introduction
3
Production of basmati rice is concentrated in north-west Indian states –
Haryana, Punjab, Western Uttar Pradesh and to a limited extent in Uttrakhand,
Himachal Pradesh, Jammu & Kashmir. Currently, Haryana is the leading producer of
basmati in India. The production of basmati in India was 6616 thousand tonnes in
2013. The share of Haryana in total basmati production was about 43.8 per cent
followed by Punjab with 34.7 per cent and Uttar Pradesh with 19.2 per cent. Haryana
and Punjab together constituted more than 75 per cent of basmati rice produced in
India. It may be noted that production of basmati rice has increased by 32.61 per
cent in 2014 over 2013. The highest increase may be observed in Haryana and
Punjab. The yield rate of basmati rice was 3944 kgs/ha which rose to 4110 kgs/ha in
2014. It is worth recording that Haryana was leading in productivity.
1.2 Exports of Basmati Rice:
In India, export expansion is widely regarded as a means to attain a higher
rate of economic growth. Since 1991, a number of measures have been undertaken
to correct the “anti export bias” of previous policy regimes. Export performance of
India improved during the post 1991 period. The Foreign Trade Policy for 2004-05
(FTP, 2004) announced in 2004 aimed at doubling India’s share in global trade
within a fix time frame and using trade policy as an effective instrument of economic
growth and employment generation.
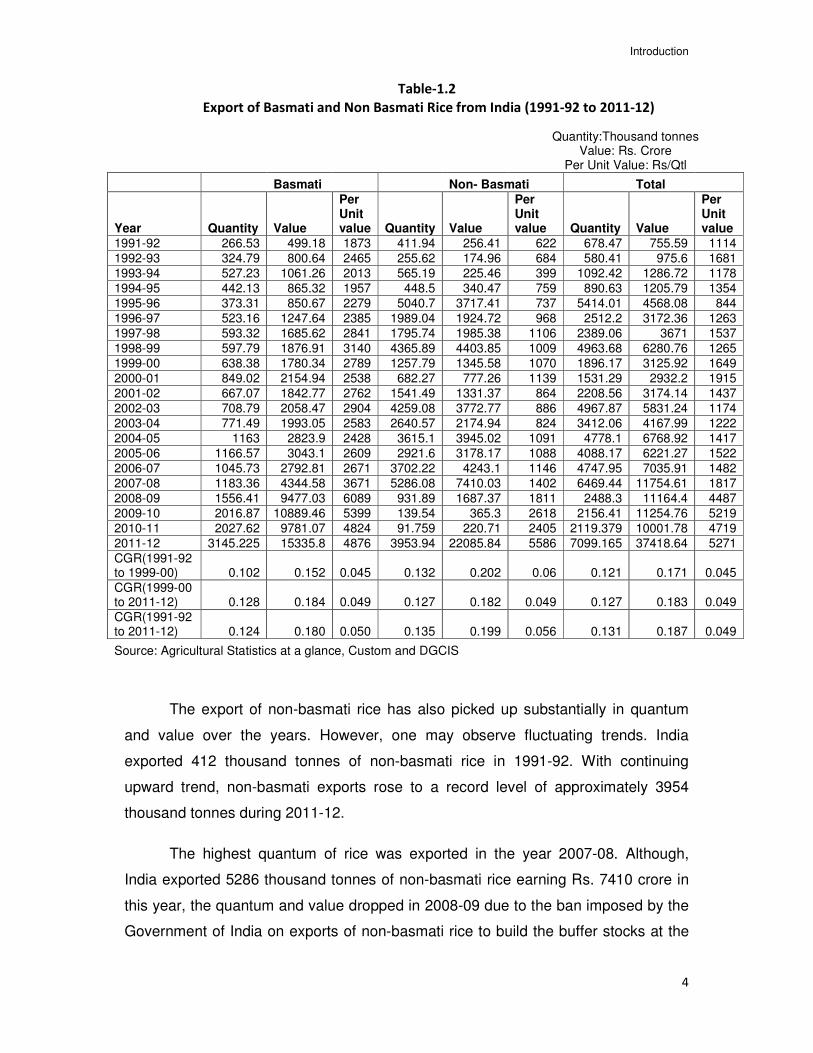
Rice is a major export commodity from India. The steady increase in
production and growing demand for basmati in the world market has made India an
important exporting country in the world. The quantum of basmati exports from India
was around 267 thousand tonnes in 1991-92 which rose to 849 thousand tonnes in
2000-01 and increased phenomenally to a record scale of 3145 thousand tonnes in
2011-12. Similarly, the value too rose from around Rs. 499 crore in 1991-92 to Rs.
2155 crore in 2001-02 and further to Rs. 15335 crore in 2011-12 which turns out
around 1080 percentage points increase in quantum and 2972 percentage points
increase in value. The per unit price also followed the upward trend and rose from
Rs. 1873 per qtl in 1991-92 to Rs. 2538 per qtl in 2000-01 and further escalated to
Rs. 4876 per qtl in 2011-12.
Introduction
4
Table-1.2
Export of Basmati and Non Basmati Rice from India (1991-92 to 2011-12)
Quantity:Thousand tonnes Value: Rs. Crore
Per Unit Value: Rs/Qtl Basmati Non- Basmati Total
Year Quantity Value
Per Unit value Quantity Value
Per Unit value Quantity Value
Per Unit value
1991-92 266.53 499.18 1873 411.94 256.41 622 678.47 755.59 1114
1992-93 324.79 800.64 2465 255.62 174.96 684 580.41 975.6 1681
1993-94 527.23 1061.26 2013 565.19 225.46 399 1092.42 1286.72 1178
1994-95 442.13 865.32 1957 448.5 340.47 759 890.63 1205.79 1354
1995-96 373.31 850.67 2279 5040.7 3717.41 737 5414.01 4568.08 844
1996-97 523.16 1247.64 2385 1989.04 1924.72 968 2512.2 3172.36 1263
1997-98 593.32 1685.62 2841 1795.74 1985.38 1106 2389.06 3671 1537
1998-99 597.79 1876.91 3140 4365.89 4403.85 1009 4963.68 6280.76 1265
1999-00 638.38 1780.34 2789 1257.79 1345.58 1070 1896.17 3125.92 1649
2000-01 849.02 2154.94 2538 682.27 777.26 1139 1531.29 2932.2 1915
2001-02 667.07 1842.77 2762 1541.49 1331.37 864 2208.56 3174.14 1437
2002-03 708.79 2058.47 2904 4259.08 3772.77 886 4967.87 5831.24 1174
2003-04 771.49 1993.05 2583 2640.57 2174.94 824 3412.06 4167.99 1222
2004-05 1163 2823.9 2428 3615.1 3945.02 1091 4778.1 6768.92 1417
2005-06 1166.57 3043.1 2609 2921.6 3178.17 1088 4088.17 6221.27 1522
2006-07 1045.73 2792.81 2671 3702.22 4243.1 1146 4747.95 7035.91 1482
2007-08 1183.36 4344.58 3671 5286.08 7410.03 1402 6469.44 11754.61 1817
2008-09 1556.41 9477.03 6089 931.89 1687.37 1811 2488.3 11164.4 4487
2009-10 2016.87 10889.46 5399 139.54 365.3 2618 2156.41 11254.76 5219
2010-11 2027.62 9781.07 4824 91.759 220.71 2405 2119.379 10001.78 4719
2011-12 3145.225 15335.8 4876 3953.94 22085.84 5586 7099.165 37418.64 5271
CGR(1991-92 to 1999-00) 0.102 0.152 0.045 0.132 0.202 0.06 0.121 0.171 0.045
CGR(1999-00 to 2011-12) 0.128 0.184 0.049 0.127 0.182 0.049 0.127 0.183 0.049
CGR(1991-92 to 2011-12) 0.124 0.180 0.050 0.135 0.199 0.056 0.131 0.187 0.049
Source: Agricultural Statistics at a glance, Custom and DGCIS
The export of non-basmati rice has also picked up substantially in quantum
and value over the years. However, one may observe fluctuating trends. India
exported 412 thousand tonnes of non-basmati rice in 1991-92. With continuing
upward trend, non-basmati exports rose to a record level of approximately 3954
thousand tonnes during 2011-12.
The highest quantum of rice was exported in the year 2007-08. Although,
India exported 5286 thousand tonnes of non-basmati rice earning Rs. 7410 crore in
this year, the quantum and value dropped in 2008-09 due to the ban imposed by the
Government of India on exports of non-basmati rice to build the buffer stocks at the
Introduction
5
domestic level. We have calculated compound growth rates of quantity, value and
per unit price of basmati rice exported from India. The rate of growth was above 10
per cent per annum for quantity and value in each time period. On the other hand, it
was around 5 per cent per year for per unit price irrespective of time period.
Currently, India is one of the leading exporters of basmati rice in the world.
Several factors have been responsible for this achievement. Some of these include
research efforts in developing suitable varieties, adoption of suitable farm
management practices and liberalization of trade policy by the government and the
zeal of exporters to establish themselves as reliable and dependable suppliers of
basmati and non-basmati rice in the global market. In a nutshell, basmati rice is
higher priced in international market than non-basmati rice.
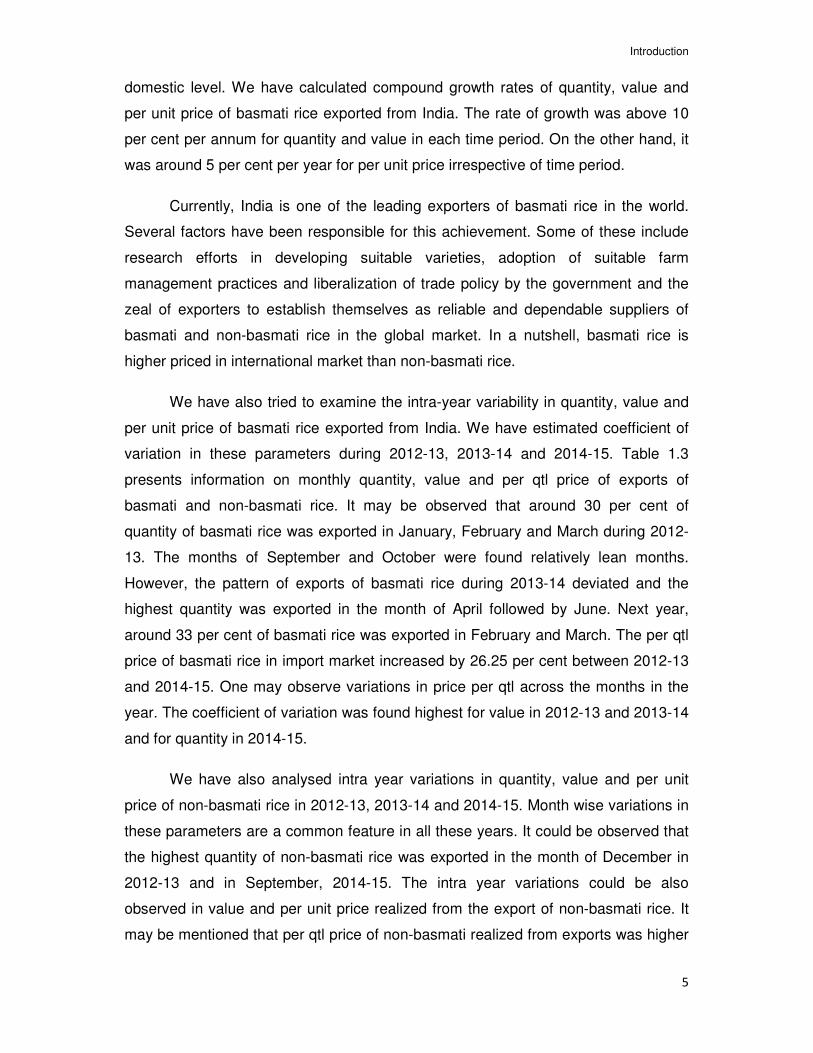
We have also tried to examine the intra-year variability in quantity, value and
per unit price of basmati rice exported from India. We have estimated coefficient of
variation in these parameters during 2012-13, 2013-14 and 2014-15. Table 1.3
presents information on monthly quantity, value and per qtl price of exports of
basmati and non-basmati rice. It may be observed that around 30 per cent of
quantity of basmati rice was exported in January, February and March during 2012-
13. The months of September and October were found relatively lean months.
However, the pattern of exports of basmati rice during 2013-14 deviated and the
highest quantity was exported in the month of April followed by June. Next year,
around 33 per cent of basmati rice was exported in February and March. The per qtl
price of basmati rice in import market increased by 26.25 per cent between 2012-13
and 2014-15. One may observe variations in price per qtl across the months in the
year. The coefficient of variation was found highest for value in 2012-13 and 2013-14
and for quantity in 2014-15.
We have also analysed intra year variations in quantity, value and per unit
price of non-basmati rice in 2012-13, 2013-14 and 2014-15. Month wise variations in
these parameters are a common feature in all these years. It could be observed that
the highest quantity of non-basmati rice was exported in the month of December in
2012-13 and in September, 2014-15. The intra year variations could be also
observed in value and per unit price realized from the export of non-basmati rice. It
may be mentioned that per qtl price of non-basmati realized from exports was higher
Introduction
6
in March than other months during 2012-13, July in 2013-14 and September in 2014-
15. The estimated coefficient of variation in per qtl price could be observed lower
than basmati rice in each analysed year, while it was more than 0.20 in quantity and
value. It implies that quantity and value experienced higher variability in comparison
to price.
Table-1.3 (a)
Quantity, Value and Per Unit Price of Basmati and Non Basmati Rice Exported from India (2012-13 to 2014-15)
Qty in Thousand Tonne Value in Rs. Crore
Basmati Rice
2012-13 2013-14 2014-15
Month Qty Value
Per unit price
(Rs/ Qtl) Qty Value
Per unit price( Rs/ Qtl) Qty Value
Per unit price (Rs/ Qtl)
April 278.80 1241 4451 392.80 2590 6594 285.11 2428 8517
May 322.91 1566 4851 345.19 2417 7003 337.15 2905 8616
June 346.91 1818 5241 378.79 2825 7459 364.64 3082 8452
July 299.99 1641 5471 333.99 2540 7606 233.77 1963 8398
August 248.88 1391 5588 275.84 2130 7722 217.36 1829 8414
Sept 230.43 1327 5757 206.88 1687 8157 203.73 1660 8147
Oct 193.70 1056 5451 180.19 1426 7912 295.15 1946 6592
Nov 207.96 1164 5599 252.29 1903 7541 298.27 2102 7049
Dec 286.55 1718 5996 376.61 3126 8299 382.72 2580 6741
Jan 318.08 1870 5880 345.69 2871 8304 350.32 2276 6497
Feb 335.40 2076 6189 350.09 3005 8582 468.91 2255 4810
March 387.47 2531 6531 319.01 2781 8716 434.99 2404 5526
Total 3457.08 19399 5611 3757.36 29300 7798 3872.11 27429 7084
C.V* 0.20 0.26 0.10 0.22 0.22 0.08 0.26 0.19 0.18
Non Basmati
April 275.27 565 2053 392.94 907 2308 390.78 1015 2598
May 715.88 1514 2115 473.33 1090 2303 425.08 1066 2508
June 593.23 1284 2164 559.85 1372 2451 493.05 1253 2542
July 486.14 988 2033 652.76 1701 2606 535.36 1321 2468
August 467.97 965 2062 708.77 1786 2520 699.34 1731 2475
Sept 451.29 981 2174 790.71 2033 2571 886.44 2410 2718
Oct 644.19 1393 2162 622.47 1585 2546 822.94 2108 2562
Nov 627.78 1379 2197 422.48 1056 2499 726.34 1825 2512
Dec 808.43 1780 2202 663.59 1579 2380 594.62 1477 2485
Jan 551.94 1189 2154 600.33 1517 2527 780.79 1978 2533
Feb 469.22 1040 2216 618.62 1552 2509 647.86 1323 2042
March 557.65 1320 2367 512.69 1314 2563 648.92 1414 2179
Total 6648.98 14399 2166 7018.53 17493 2492 6354.75 16184 2547
C.V* 0.25 0.26 0.04 0.20 0.22 0.04 0.24 0.28 0.07
Source: All India Rice Exporters Association, New Delhi originally from DGCIS,Calcutta * CV- coefficient of variation
Introduction
7
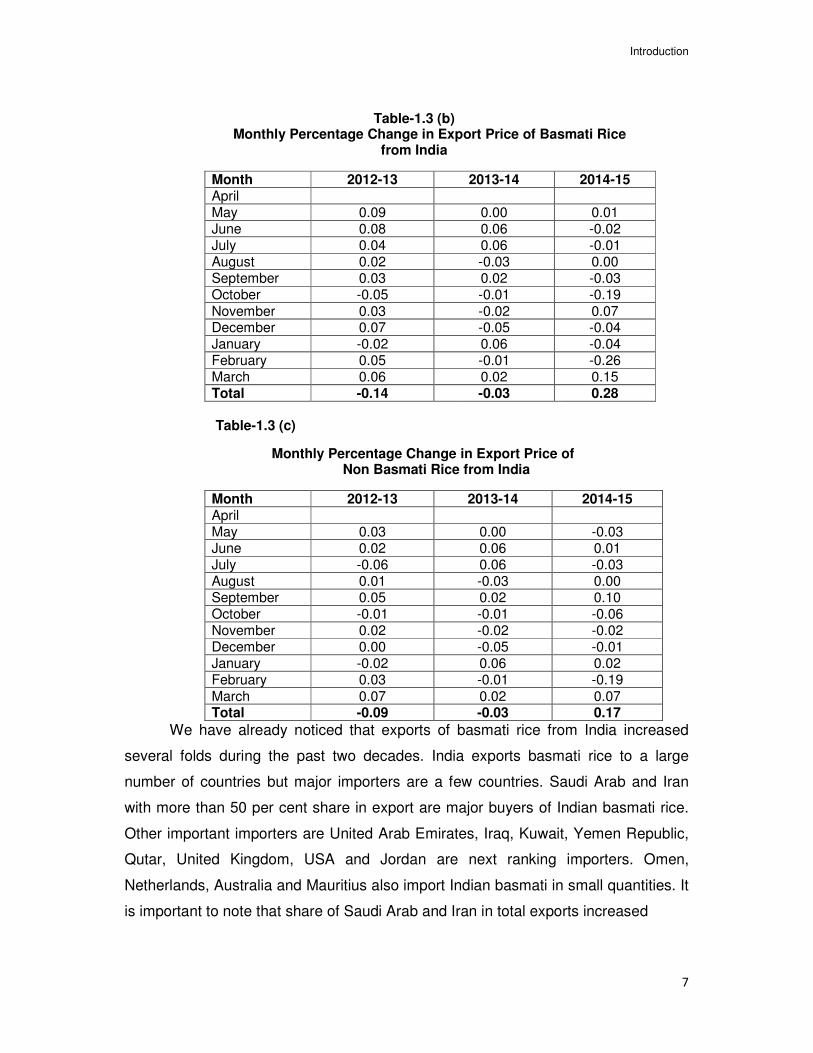
Table-1.3 (b) Monthly Percentage Change in Export Price of Basmati Rice
from India
Month 2012-13 2013-14 2014-15 April May 0.09 0.00 0.01 June 0.08 0.06 -0.02 July 0.04 0.06 -0.01 August 0.02 -0.03 0.00 September 0.03 0.02 -0.03 October -0.05 -0.01 -0.19
November 0.03 -0.02 0.07 December 0.07 -0.05 -0.04 January -0.02 0.06 -0.04 February 0.05 -0.01 -0.26 March 0.06 0.02 0.15 Total -0.14 -0.03 0.28
Table-1.3 (c)
Monthly Percentage Change in Export Price of Non Basmati Rice from India
Month 2012-13 2013-14 2014-15 April May 0.03 0.00 -0.03 June 0.02 0.06 0.01 July -0.06 0.06 -0.03 August 0.01 -0.03 0.00 September 0.05 0.02 0.10 October -0.01 -0.01 -0.06 November 0.02 -0.02 -0.02 December 0.00 -0.05 -0.01 January -0.02 0.06 0.02 February 0.03 -0.01 -0.19
March 0.07 0.02 0.07 Total -0.09 -0.03 0.17
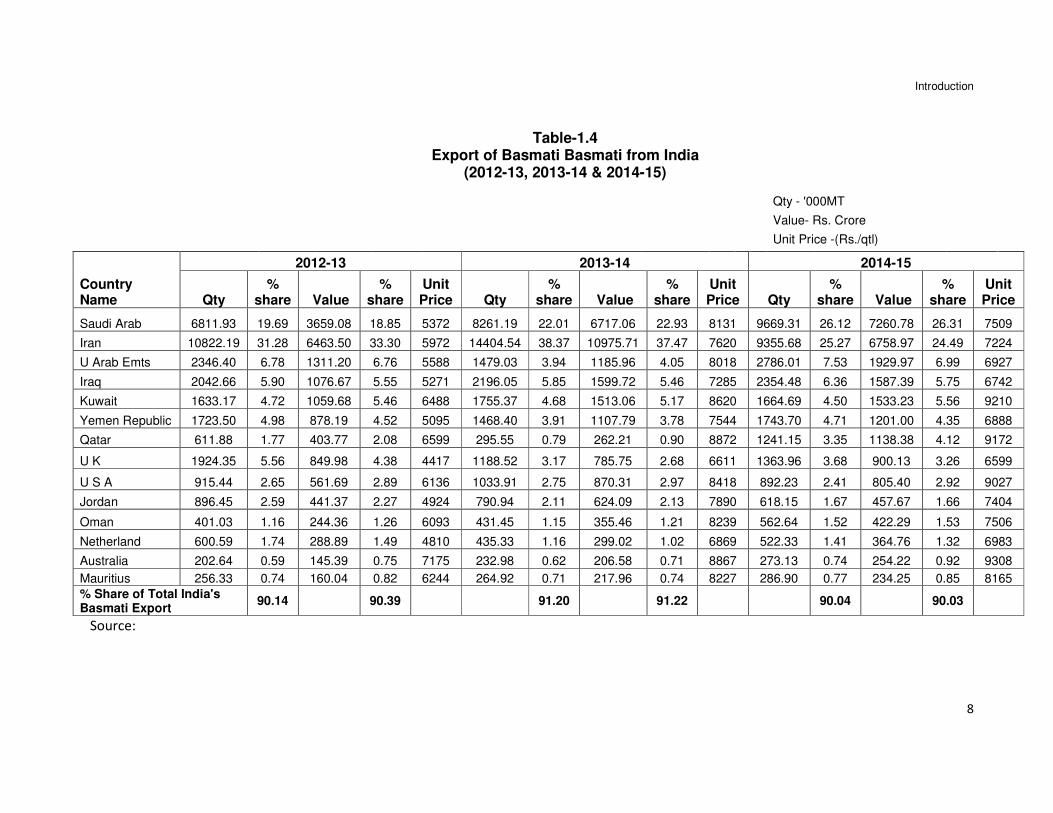
We have already noticed that exports of basmati rice from India increased
several folds during the past two decades. India exports basmati rice to a large
number of countries but major importers are a few countries. Saudi Arab and Iran
with more than 50 per cent share in export are major buyers of Indian basmati rice.
Other important importers are United Arab Emirates, Iraq, Kuwait, Yemen Republic,
Qutar, United Kingdom, USA and Jordan are next ranking importers. Omen,
Netherlands, Australia and Mauritius also import Indian basmati in small quantities. It
is important to note that share of Saudi Arab and Iran in total exports increased
Introduction
8
Table-1.4 Export of Basmati Basmati from India
(2012-13, 2013-14 & 2014-15)
Qty - '000MT
Value- Rs. Crore
Unit Price -(Rs./qtl)
2012-13 2013-14 2014-15
Country Name Qty
% share Value
% share
Unit Price Qty
% share Value
% share
Unit Price Qty
% share Value
% share
Unit Price
Saudi Arab 6811.93 19.69 3659.08 18.85 5372 8261.19 22.01 6717.06 22.93 8131 9669.31 26.12 7260.78 26.31 7509
Iran 10822.19 31.28 6463.50 33.30 5972 14404.54 38.37 10975.71 37.47 7620 9355.68 25.27 6758.97 24.49 7224
U Arab Emts 2346.40 6.78 1311.20 6.76 5588 1479.03 3.94 1185.96 4.05 8018 2786.01 7.53 1929.97 6.99 6927
Iraq 2042.66 5.90 1076.67 5.55 5271 2196.05 5.85 1599.72 5.46 7285 2354.48 6.36 1587.39 5.75 6742
Kuwait 1633.17 4.72 1059.68 5.46 6488 1755.37 4.68 1513.06 5.17 8620 1664.69 4.50 1533.23 5.56 9210
Yemen Republic 1723.50 4.98 878.19 4.52 5095 1468.40 3.91 1107.79 3.78 7544 1743.70 4.71 1201.00 4.35 6888
Qatar 611.88 1.77 403.77 2.08 6599 295.55 0.79 262.21 0.90 8872 1241.15 3.35 1138.38 4.12 9172
U K 1924.35 5.56 849.98 4.38 4417 1188.52 3.17 785.75 2.68 6611 1363.96 3.68 900.13 3.26 6599
U S A 915.44 2.65 561.69 2.89 6136 1033.91 2.75 870.31 2.97 8418 892.23 2.41 805.40 2.92 9027
Jordan 896.45 2.59 441.37 2.27 4924 790.94 2.11 624.09 2.13 7890 618.15 1.67 457.67 1.66 7404
Oman 401.03 1.16 244.36 1.26 6093 431.45 1.15 355.46 1.21 8239 562.64 1.52 422.29 1.53 7506
Netherland 600.59 1.74 288.89 1.49 4810 435.33 1.16 299.02 1.02 6869 522.33 1.41 364.76 1.32 6983
Australia 202.64 0.59 145.39 0.75 7175 232.98 0.62 206.58 0.71 8867 273.13 0.74 254.22 0.92 9308
Mauritius 256.33 0.74 160.04 0.82 6244 264.92 0.71 217.96 0.74 8227 286.90 0.77 234.25 0.85 8165
% Share of Total India's Basmati Export
90.14
90.39
91.20
91.22
90.04
90.03
Source:
Introduction
9
continuously. It was largely due to popularity of PUSA Basmati 1121 in these
countries. All these countries together imported around 90 per cent quantity of Indian
basmati rice in 2012-13, 2013-14 and 2014-15 (Table-1.4).
An examination of per qtl price realised from exports of basmati rice in
different countries (Table-1.4) indicates that it ranged between Rs. 4924 and Rs.
7175 in 2012-13. The price escalated next year during 2013-14 and basmati exports
fetched a price of Rs. 8867 per qtl in Australia. Even the lowest price obtained was
Rs. 6869 per qtl from Netherland. Next year, 2014-15, presents a mixed pattern in
price realization across the importing countries. In five countries, realization from
basmati exports increased while in remaining nine countries price declined during
2014-15.
1.3 Literature Survey:
Before setting the objectives for the study, it would be useful to survey
literature for understanding the issues in production and marketing of basmati rice.
We have divided literature survey into three parts. At first, we present papers
exclusively carried out for basmati rice, while, in second and third parts, we
concentrate on issues related to rice including exports of rice.
Part-1
Ali and Flinn (1989)1 in their paper estimated farm-specific profit inefficiency
among Basmati rice producers in Pakistan from a variable-coefficient profit frontier.
Authors conclude that better use of existing technology provides substantial
opportunity to improve the profitability of Basmati rice in Gujranwala district. The
mean level of inefficiency in farm resources and price levels was 28 per cent, with a
wide range (5-87 per cent). Average loss of profit was Rs 1,222 per hectare. Socio-
economic factors related to loss in profit were education, non agricultural
employment and credit constraint of selected farm households and institutional
determinants of profit loss were water constraint and late application of fertilizer. The
Punjab-wide benefits of increasing farmer's profit efficiency are large. A 25 per cent
reduction in loss in profit among Basmati rice producers may generate over Rs 240
1Mubarik, Ali and John C. Flinn. (1989). Profit Efficiency among Basmati Rice Producers in Pakistan Punjab. American
Journal of Agricultural Economics, 71 (2): 303-310p.
Introduction
10
million extra profits in each rice season. The authors explain the benefits of
promoting increased efficiency in Basmati rice production.
Farooq (2001)2 in his paper looks into supply response of basmati rice in
Pakistan. Pakistan’s stated policy is to increase basmati rice production through
price support measures and liberalization of input markets. This study assesses the
scope of price support policy to achieve growth targets. Whether, additional
assistance is needed in the form of non-price policy measures. The econometric
analysis is based on a profit function using farm household survey data from Punjab,
Pakistan for 1995-1996. The results reveal that higher support prices are required to
achieve production. Since these price levels may not be feasible, a more appropriate
option may involve some inducements to expand paddy area and the area allocated
to modern variety.
Brar et al. (2011)3 based their paper on a field experiment to estimate the
economics of basmati rice. The data used for economic analysis of basmati rice-
wheat sequence under different methods of crop establishment relate to the years
2005-06 and 2006-07. Results show that the productivity of basmati rice-wheat
sequence was significantly higher with TPBR (Transplanted Basmati Rice) than
direct seeded basmati rice (DSBR) irrespective of seeding technique of succeeding
wheat. Thus, transplanting basmati rice followed by zero tillage or conventional
sowing of succeeding wheat was more profitable than direct seeding of basmati rice
in basmati rice- wheat sequence.
Sidhu and Kumar (2014)4 carried out study for the state of Punjab. The main
objective of Agricultural Market Intelligence Centres (AMIC) in India is to maintain a
balance between demand and supply of any agricultural commodity at a
remunerative level for the farmers. The production of higher basmati than demand in
2 Umar, Farooq; Trevor Young; Noel Russell and Iqbal, Muhammad. (2001). The Supply Response of Basmati Rice
Growers in Punjab, Pakistan: price and non-price determinants. Journal of International Development, 13(2):227-237p. 3 Brar, A.S; S.S. Mahal; G.S. Buttar and J.S. Deol. (2011). Water Productivity, Economics and Energetic of Basmati Rice
(Oryza Sativa) Wheat (Triticum Aestivum) Under Different Methods of Crop Establishment. Indian Journal of Agronomy,
56 (4): 317-320p.
4 Sidhu, J.S; Jasdev Singh and Raj Kumar. (2014). Role of market intelligence in Agriculture: A success story of basmati
cultivation in Punjab. Indian Journal of Economic Development, 10 (1a): 26-31p.
Introduction
11
India during 2011-12 resulted in crash of prices which made basmati cultivation
unviable as compared to non basmati rice. Reacting to this basmati crisis, AMIC,
PAU, Ludhiana advised the farmers through both print and electronic media to
reduce area under basmati rice in order to match its demand and supply to earn
better returns. The basmati growers responded to the AMIC’s advice and reduced
the area during 2012-13 and earned additional income of 381 crore. The average
additional returns were estimated at Rs. 25400 per/ha. along with additional amount
of three lakh tonnes of non-basmati rice. Thus, agricultural market intelligence
played an important role in increasing the income of basmati growers and helped
them in achieving the national objective of providing additional food grains to the
society.
Ghani et al. (1993)5 analyzed growth of rice and agricultural production over
the last two decades. It has been due to increased production of food grains. The
data used are regional distribution of specialty rice production and processing, crop
duration and yield of some aromatic transplanted AMAN varieties for the year 1993.
In addition, rice trade of selected rice exporting countries is examined. The authors
suggest two options: First is pursuit of a coarse rice export strategy and the second
is to diversify production out of coarse rice into diversified array of commodities. The
results show that policy restrictions and cumbersome administrative impediments to
rice exports should be eliminated in order to encourage exporters and to avoid losing
export opportunities to competitors.
Nagaraju et al. (2002)6 in their study examined an efficient system to establish
relation among traditional and evolved basmati and semi dwarf non basmati (NB)
rice varieties. The researchers selected three groups of rice; traditional basmati (TB),
evolved basmati (EB) and non basmati (NB). The data used were classified in two
classes of markers: fluorescence based inter simple sequence repeat (ISSR-PCR)
and simple sequence repeat (SSR’s). The findings show that fluorescence based
ISSR-PCR markers could be clearly resolved on an ABI automated sequencing gel.
The TB and EB varieties included in the study represent a major component of the 5 Ghani, Abdul; Jeffrey C. Metzel and B. Lynn Salinger. (1993). Diversification within Rice: Production Opportunities and
Export Prospects of Specialty Rice in Bangladesh. The Bangladesh Development Studies, 21(3):111-123p.
6Nagaraju, J.; M. Kathirvel; R. Ramesh Kumar; E.A. Siddiq and Seyed E. Hasnain. (2002). Genetic Analysis of Traditional
and Evolved Basmati and Non-Basmati Rice Varieties by Using Fluorescence-Based ISSR-PCR and SSR Markers. The
National Academy of Sciences of the United States of America, 99 (9):5836-5841p.
Introduction
12
basmati gene pool of the Indian sub-continent. The markers specific to the TB
varieties used in the present study should be further pursued to look for allelic
association, thus helping breeders to shorten breeding cycles by rapid incorporation
of basmati rice into breeding lines.
Part-2
Zulfiqar et al. (2009)7 in their paper tried to identify various protection policies and
interventions made for Basmati rice economy in Pakistan. It also estimated welfare
effects associated with existing protection policies, interventions and implications of
WTO's trade liberalisation in domestic economy and abroad. The study concluded
that government policy interventions in price regime had lowered during post- WTO
period as compared to pre- WTO period. This was evident from relatively narrowing
gap between Pakistan's domestic price and export price of former period than that of
pre- WTO period. The estimated welfare effects in terms of producers and
consumers' surpluses revealed larger producers' gains relative to losses to
consumers if trade was liberalised. Trade liberalisation simulations for world market
also reflected higher gains to the domestic economy of Pakistan. Therefore, efforts
should be geared up for trade liberalisation on global basis. The paper suggests that
instead of coddling in State Trading Enterprises (STEs), the government should act
as a facilitator of trade as envisaged in the 'Green Box' of Agreement on Agriculture
and other WTO agreements. It should concentrate on research, development and
out-reach related investments for improvement in productivity and quality of Basmati
rice.
Mulik and Crespi (2011)8 examined the controversy over granting of patent
rights to three new strains of Basmati rice by the U.S. Results suggest that the
introduction of a competing product that may infringe on India’s geographical
indicator has lowered the product differentiation of Indian Basmati rice in key export
markets. The study indicated that, residual demand elasticity for Basmati rice in the
UK and Kuwait fell after the entry of a competitor in the four markets. RiceTec, who 7 Zulfiqar, Muhammad; Dilawar Khan; Anwar F Chishti; Munir Khan; Wasiullah; Ajmal Waheed; Muhammad Zakir and
Robina Karim. (2009). Trade Liberalisation Could Improve Producers Profitability in Agriculture: A Case of Basmati,
Rice. The Pakistan Development Review, 48(4):771-782p.
8 Mulik, Kranti and John M Crespi. (2011). Geographical Indications and the Trade Related Intellectual Property Rights
Agreement (TRIPS): A Case Study of Basmati Rice Exports. Journal of Agricultural & Food Industrial Organization,
9(4):1-24p.
Introduction
13
might have not been able to compete with India has been proactive in trade marking
its Basmati variety or had TRIPS been more encompassing of traditional
commodities like some countries. The study also states that the TRIPS agreement
pertaining to geographical indications (GI) does not offer equal protection to other
commodities as it does to wines and spirits. Since, increasing number of countries
are involved in similar controversies surrounding protecting their traditional
commodities (e.g., Jasmine rice in Thailand or Parmesan cheese in Italy), it is
essential to revisit the TRIPS agreement and extend section 23 of the geographical
indications to offer additional protection to agricultural commodities.
Ali (1995) 9 in his article investigates constraints in the second-generation
Green Revolution by quantifying the causes of resource-use inefficiency and
variation in input use in agriculture. A case study was carried out to understand
socioeconomic conditions, institutional setting and physical environment in two
representative rice-growing villages in Pakistan, Punjab and their role in formulating
the farmers' production-related characteristics and farm management practices in the
sequence. This study found a significant variation in input level and resource-use
efficiency in Basmati rice production. On an average, Basmati rice production could
be improved by 30 per cent at the existing level of input use. The differences in
access to public infrastructure, socioeconomic conditions, resource-based and
biophysical factors affected production by influencing farm management practices
and farmers' production-related characteristics. The resource-use inefficiency in
Basmati rice production was significantly explained by the institutional and
socioeconomic factors that determined farmers' production-related characteristics
and farm management practices. However, input use could be enhanced by
improving marketing efficiency by removing unnecessary government interventions
in input and output markets, providing the necessary physical infrastructure and
technical and market information and streamlining the credit procedure. The study
points out that researchers and policy makers should work together to improve
socioeconomic conditions and institutional functions and develop site-specific
technologies in order to improve farm management practices and enhance
productivity.
9 Ali, Mubarik (1995). Institutional and Socioeconomic Constraints on the Second-Generation Green Revolution: A Case
Study of Basmati Rice Production in Pakistan's Punjab. Economic Development and Cultural Change, 43(4):835-861p
Introduction
14
Grover (2012) 10 in his paper studied resource use pattern and economic
viability and various biotic and abiotic constraints of basmati rice and non-basmati
rice cultivation in Punjab. The study is based on the sample of 200 basmati rice
growers spread over five districts of the state during 2008-09.Basmati cultivation
saved around 18, 81, 70 and 39 per cent irrigation water, urea, DAP and zinc
fertilizers respectively as compared to non-basmati rice crop. Basmati rice promised
more returns over variable costs to the tune of Rs. 4562 per hectare over the non-
basmati rice. It implies that basmati rice cultivation was both resource conserving as
well as remunerative. The regression analysis has brought out that there existed
scope to further increase use of human labour, plant population and
insecticides/pesticides for improving the yield of basmati rice in the state. The price
variability and difficulty to access price related information were the most important
marketing problems for basmati rice. Sample farmers wanted the scientists to evolve
new dwarf varieties to minimize the water logging losses. Basmati rice yield needs to
be enhanced through genetically improved varieties. To encourage the farmers to
increase area under basmati rice, the government needs to formulate a policy to
ensure adequate support price for basmati rice on the pattern of non-basmati rice.
Aslam (1979) 11 restricts his paper to the European Community which
comprises of nine countries and has been one of the most important market for high
quality Basmati Rice. The objective of this paper is to examine the possibilities
against the backdrop of the Rice Policy formulated by the Commission of the
European Community. The rice exports to the E.C from Pakistan started in early
sixties and increased from 3000 metric tons in 1961 to 6896 metric tons in 1963 and
were mainly to the Benelux countries. The Benelux countries used to apply a zero
import duty on their rice imports as compared to 15-27 per cent tariff imposed by
other members of the community. The Benelux countries were also free from
government control and interventions. However, it can be noticed that Pakistan’s rice
exports dropped to almost zero and there are 3 factors that explain Pakistan’s poor
performance between 1964 and 1969. When it comes to future prospects, Pakistan
10
Grover, D.K. (2012). Basmati Rice Cultivation for Resource Conservation and use Efficiency in Context of Sustainable
Agriculture in Punjab, Indian Journal of Economic Development, 8 (2):11-26p.
11
Aslam. (1979). Rice Policy of the European Community and Prospects of Rice Export from Pakistan. Pakistan Economic
and Social Review, 17(1/2):50-65p.
Introduction
15
will have to strive hard to improve her performance in the E.C market. She faced a
tough competition from exporters like Burma, U.S.A and Thailand. Pakistan can
compete with these exporters by improving the quality and increasing the production
of basmati rice which can be done by application of fertilizer, use of HYV seeds and
adoption of better farming techniques.
David and Huang (1996)12 in their paper attempted to explain variations in the
level of rice price protection in nine selected Asian countries-Philippines, Indonesia,
Thailand, Bangladesh, Pakistan, India, Japan, South Korea and Taiwan from 1960 to
1988 using econometric analysis of the determinants of rice price. The analysis
confirmed earlier findings about the importance of economic development and
resource endowments in explaining the pattern of agricultural protection. It also
revealed the importance of price stabilization as a policy objective and relationship
between cost reducing policies (technology generation and input price subsidy) and
the rice price policy. An important finding of this study was that policies that reduce
the unit cost of production, such as adoption of modern variety and favorable
fertilizer pricing policies had lowered rice prices and major beneficiaries of those
policies were consumers. The study emphasized that in order to escape from the
trap of extreme high-cost protection, newly industrializing countries in South and
Southeast Asia need to have foresight and determination in adopting industrial
adjustment policies that will accelerate through education and training, shift of
resources from rice to high-income-elastic farm products within agriculture and in the
non- farm sector.
Sharma and Kumar (2001)13 examined behavior of the procurement prices of
wheat, rice and groundnut. The study focused on relationship between procurement
prices and cost of production, farm harvest prices and wholesale prices. The
variability in the prices of these selected commodities and the structure of markets
were also examined in this study. The data for the study was collected mainly from
published sources. Unpublished data on relevant variables were collected from the
Ministry of Consumer Affairs, Ministry of Agriculture and Commission for Agricultural
12
David; C. Cristina and Jikun Huang. (1996). Political Economy of Rice Price Protection in Asia. Economic Development
and Cultural Change, 44(3):463-483p.
13
Sharma; Anil and Parmod Kumar. (2001). An analysis of the Price Behavior Of Selected Commodities.
Planningcommission.Gov.In, GoI
Introduction
16
Costs and Prices (CACP). An important finding of the study was that procurement
prices of cereals have been consistently fixed at a higher level than recommended
by the CACP. The margin between the actual procurement prices and those that are
recommended by the CACP was observed to be higher during the 1990s in
comparison to the 1980s. The mean excess of the procurement prices actually
announced by the government over the cost of cultivation (Cost A2 + family labour)
also exhibits substantially higher incentives provided to the producers of cereals
during the 1990s in comparison to the 1980s. The examination of price variations
showed that there had been acceleration in the rate of growth of the nominal as well
as real prices of cereals. This was in sharp contrast to the trends observed during
the 1980s, when the real prices of these crops exhibited a significant decline. A
comparison in variations of prices of selected commodities showed that price
fluctuations were generally higher in the case of coarse cereals, groundnut and
groundnut oil as compared to rice and wheat. Among the selected commodities,
price variability had been least in the case of rice. The results also indicated that
despite significant reduction in inter-year variability of wheat prices during the 1990s,
variability within a year had shot up during this period. The study emphasized to
focus on all important factors which determine procurement prices. There is hardly
any need for raising procurement prices to higher levels.
Sekhar (2008)14 in his paper attempted to analyze the current global crisis in
the availability and prices of rice by drawing upon the long-term developments in the
rice market. The world rice market has traditionally been thin, with average traded
volume of about 5 per cent of the world rice production between1960-2000. The
instability and thinness in the world rice markets were shown to be mainly due to the
predominantly precautionary export policies of major exporting countries, which in
turn are a result of domestic food security considerations. The instability in the world
rice market can be largely attributed to the predominantly precautionary motives of
stock- holding by the major exporting countries, which in turn, is linked to the high
geographical coincidence of production, consumption and higher levels of poverty in
Asia. The study sums up that the world rice market needs a seller of last resort and
the possibilities of evolving a global food reserve system or other similar options
need to be urgently explored.
14
Sekhar, C. S. C. (2008). World Rice Crisis: Issues and Options. Economic and Political Weekly, 43 (26/27):13-17p.
Introduction
17
Dorosh (2008)15 argues that liberalized international trade provides the best
mechanism for stabilizing prices and food supplies in most years, but appropriate
contingency policies are needed for years in which international prices are
extraordinarily high. More explicit commitments to cereal trade liberalization within
South Asia would also promote region-wide food security and help avoid a repetition
of supply disruptions that raised food prices sharply in Afghanistan and Bangladesh.
The study states that private sector international trade is generally more efficient
than either public stocks or public trade in stabilizing prices because competitive
private markets can react more quickly to changing market conditions than public
institutions. Moreover, private trade often involves lower overall costs (increased
economic efficiency) and minimal fiscal costs to the government. In order to verify
that private markets for imported grain are working well, margins between import
parity (inclusive of taxes) and domestic wholesale prices can be monitored. The
study concluded that there is always a possible scenario of complete disruption to
trade coinciding with major production shortfalls, but in most years, large stocks are
unnecessary and come at a high opportunity cost. South Asia enjoyed success in
enhancing food security by promoting agricultural growth (a supply side policy) while
promoting equitable growth and, in some countries, using transfer programs to
directly increase access to food by poor households (demand side policies).
Continuing the past successful policies, including promotion of private sector trade,
with flexible adjustments to cope with new risks and contingencies, it is likely to be
the best path to enhance food security and reduction in poverty.
Acharya et al.(2012)16 in their study examined the transmission of prices of
rice and wheat from the world markets to the domestic markets, especially to the
farm gate during the world food crisis of 2007-08 by using both econometric tools
and policy analysis approaches. The study observed that there is integration among
geographically dispersed rice wholesale markets. The rice retail markets exhibit the
same pattern of integration like wholesale markets. The primary markets of rice
showed remarkable degree of integration, though these were geographically
15
Dorosh, Paul A. (2008). Regional Trade and Food Price Stabilization in South Asia: Policy Responses to The 2007-08
World Price Shocks. The Pakistan Development Review, 47(4):803-813p.
16
Acharya, S.S.; Ramesh Chand; P.S. Birthal; Shiv Kumar and D.S. Negi. (2012). Market Integration and Price
Transmission in India: A Case of Rice and Wheat with Special Reference to the World Food Crisis of 2007/08,
www.fao.org, Rome, Italy.
Introduction
18
dispersed. The vertical transmission of rice prices from wholesale to farm gate
(primary markets) was quite smooth. There was a long-run equilibrium between
wholesale and farm gate prices and farm gate prices move in tandem with wholesale
prices. However, speed of adjustment and dynamics of price transmission varied
between markets of north and south. No co-integration was observed between
domestic and international rice prices. The results of regression of Minimum Support
Prices (MSPs) of rice and wheat with international prices also corroborate to earlier
observations that high global prices have impacted farm gate prices in India, not
directly but through their influence on the decision of the government related to the
levels of fixation of guaranteed support prices.
Kurosaki (1996)17 in his paper empirically examined spatial and inter temporal
price relations of grains in Pakistan's Punjab. Investigation on spatial price relations
after harvest found that farm-gate prices of wheat were mostly explained by the
support price whereas those of Basmati paddy had more unexplained variation. This
author suggested that gap was due to a difference in the price support mechanism.
In the second empirical investigation, inter temporal price relations and effects of
public wheat release on them were examined using wholesale market prices. It was
found that wheat prices regularly increased at the rate of storage costs in the first
half of a good year, but the price rise was repressed by the government release in
the second half in a normal year. Prices were found to be integrated spatially and
inter-temporally so that their excess volatility was prevented. Prices in the private
channels reflect the ongoing market conditions including government interventions.
The relations of these prices need to be analysed comprehensively.
Kumar and Sharma (2003) 18 attempted to check efficiency of regulated
markets in Haryana at the macro and micro levels for the paddy crop. Market
integration has been used as an indicator of market efficiency. This paper states that
regulated markets have helped in reducing many illegal exactions earlier charged by
the traders and so have mitigated the handicap experienced by the producers-sellers
in their market transactions. These markets have undoubtedly ensured a better
17
Kurosaki, Takashi. (1996). Government Interventions, Market Integration, and Price Risk in Pakistan's Punjab. The
Pakistan Development Review, 35(2):129-144p.
18
Kumar, Parmod; R.K. Sharma. (2003). Spatial Price Integration And Pricing Efficiency At The Farm Level: A Study of
Paddy in Haryana. Indian Journal of Agricultural Economics, 58(2):201-217p
Introduction
19
marketing environment both for the sellers and buyers. As most part of the
agricultural produce comes in the ambit of wholesale markets, the major question in
the present debate is how efficiently these regulated wholesale markets run their
business. The study sets the objectives to document whether: i) liberalization
process has improved the efficiency of regulated markets and ii) to see the structural
and pricing efficiency across different farm size groups at the farm gate level.
Authors analyze market integration among wholesale paddy markets with the help of
co-integration and error- correction mechanism (ECM). This is followed by an
analysis of market structure and prices at the farm gate level with the help of primary
data generated by the household survey of 400 farmers in two districts (Karnal and
Kaithal) in Haryana. At the micro level, agricultural markets of both the districts i.e.,
Karnal and Kaithal appeared to be efficient. As a result, all the farmers sold their
produce in the regulated markets. Lack of scientific storage, market intelligence and
insufficient institutional credit were the cause of concern as these affected farmers
adversely.
Reddy and Sen (2004)19 conducted their study in the Sone canal command
area in the state of Bihar. A sample of 270 farms comprising 207 marginal (< 1
hectare), 31 small (1-2 hectares), 22 semi-medium (2-4 hectares) and 10 medium (4-
10 hectares) farms was selected from different locations of the canal command
through stratified random sampling method. Data pertaining to the agricultural year
2001- 2002 were collected through personal interview method. The study reveals the
existence of technical inefficiency in the production of rice in the study area. Yield of
rice can be considerably improved without increasing the level of inputs in the study
area if the inefficiency is reduced. Technical inefficiency in the production of rice is
negatively related with farm size, education of the farmer, experience, extension
contacts, quality land and positively related with age and fragmentation of the land.
Caste of the farmer and location of the farm in the canal command do not have any
influence on inefficiency. Similarly, number of farm workers in the family does not
show any relation with inefficiency. In order to reduce inefficiency in the production of
rice and wheat, measures like encouraging co-operative type of farming, land
19 Reddy, A R and C. Sen. (2004). Technical Inefficiency in Rice Production and Its Relationship with farm-specific socio-
economic characteristics. Indian Journal of Agricultural Economics, 59(2):259-267p.
Introduction
20
consolidation, improving literacy rate, strengthening extension services and providing
alternate employment opportunities should be taken up in this area.
Part-3
Dwivedi et al. (2011) 20 carried out an economic analysis of Basmati rice
production in three villages namely Chakroi, Gharana and Gharani of C.D. Block of
R.S.Pura, district Jammu. Almost all the farmers in these villages grow Basmati Rice
on their farms. The study reveals that it is possible to increase production of Basmati
Rice in the state and generate more potential for export of the scented crop. Around
0.85 lakh hectare of area is allotted to rice cultivation including both coarse as well
as fine rice varieties in these three districts of the state. The area under basmati can
be increased further by about 25 per cent by replacement of coarse varieties, which
is estimated around 50 thousand hectares. Local basmati and basmati 370 are the
most popular varieties grown in the said area. The study examined cost structure
and returns of basmati rice on different farm size groups. The per hectare cost of
cultivation worked out to Rs. 20914.02 on small farms, Rs. 20960 on medium farms,
Rs. 18825 on large farms and Rs. 20233 at the overall level. The net income from
basmati rice per hectare was Rs.32451 on small farms, Rs. 29888 on medium farms,
Rs. 29505.78 on large farms and Rs. 30608.06 at overall level.
The recent study by Mukesh et al. (2013)21 focused on the effects of different
transplanting dates on yield and quality of basmati rice. Basmati rice is one of the
most important agricultural produce when it comes to international trade. India is one
of the major exporters of basmati rice accounting for 50-70 per cent of total basmati
rice production. A field study was conducted at Rice Research Station, Kaul (Kaithal)
of CCS Haryana Agricultural University during the kharif season in 2008 to study
effect of transplanting dates on the yield and quality of basmati rice. It could be
noticed that interaction effect of dates of transplanting and varieties was found
significant in terms of yield. The findings show that tall varieties did not show decline
in the yield because of transplanting dates, whereas, dwarf rice varieties showed a
20 Dwivedi, Sudhakar; M.C. Dwivedi; and Tarunvir Singh. (2011). An Economic Analysis of Basmati Rice Production in
Jammu district of Jammu and Kashmir. Journal of Research, SKUAST-J, 10 (1):93-99p.
21
Mukesh; Ishwar Singh; R.K. Pannu; Dasharath Prasad and Asha Ram. (2013). Effects of Different Transplanting Dates on
Yield and Quality of Basmati Rice (Oryza Sativa) Varieties. Indian Journal of Agronomy, 58 (2): 256- 258p.
Introduction
21
decline with a delay in transplantation. It can be seen that delay in planting recorded
a higher hulling and milling percentage, better rice recovery when it is compared to
25th July and 10th June planting. The varieties did not differ in hulling and milling
percentage, but the recovery was higher in tall varieties than dwarf varieties.
Another paper by Khatkar et al. (2014) 22 tested extent of market co-
integration of prices of Paddy among major markets in Haryana, Amritsar and
markets of Punjab by using Johansen Granger Causality Test. It also captures speed
of adjustment to deviations in long run equilibrium in Paddy markets by using Vector
Error Correction Model. India’s basmati (aromatic) rice exports crossed a record of
two million tonnes (mt) in the last financial year, in the process helping the country to
recoup some of the losses suffered because of more than two-year-long ban on non-
basmati rice exports. In Haryana, about 40 percent of the total area under rice is
allocated to basmati paddy. During 2008-09, area under basmati rice has crossed
more than 60 percent of the total area under rice primarily due to popularity of PUSA
1121 under the category of basmati. In value terms, the export of basmati rice has
crossed 19,400 crore in the last fiscal against Rs. 9,476 crore achieved during 2008-
09. This has gone a long way in wiping off an annual loss of around Rs. 7,000 crore
that India suffered because of ban on non-basmati rice exports imposed couple of
years ago to check rising local prices.
Chaudhry and Kayani (1991) 23 quantified and discussed implications of
implicit taxes in Pakistan's agriculture. The methodology of the paper was confined
to calculations of import and export parity prices of major agricultural commodities
grown in Pakistan, by comparing them with domestic procurement prices. In the case
of IRRI, domestic prices of rice and sugarcane were above the world level in some
years of the study period. In the light of relative taxable capacities of agriculture and
Pakistan's economy implicit taxes were much higher in agriculture than in other
sectors of the economy. The abysmally low agricultural commodity prices and
variations across commodities have tended to impair resource-use efficiency in
agriculture, reduced growth and employment and accentuated the existing income
22
Khatkar, R.K.; J.C. Karwasra; V.K. Singh and Jitender Kumar Bhatia. (2014). Market co-integration, price discovery and
causation of basmati paddy in Haryana. Indian Journal Economic Development, 10 (1a): 38-44p.
23
Chaudhry, M. Ghaffar; Kayani and Nighat Naheed. (1991). Implicit Taxation of Pakistan's Agriculture: An Analysis of the
Commodity and Input Prices. The Pakistan Development Review, 30(3):225-242p.
Introduction
22
inequalities. These trends are inconsistent with desired goals of economic
development, policy of under-pricing of agricultural commodities needs to be
abandoned. The paper emphasizes discontinuation of under-pricing of agricultural
commodities is likely to release the huge resources for investment currently tied to
institutional credit for agriculture.
Iqbal (1993)24 in his paper states that rice trade was in the private sector prior
to the 1970s, but the fall of Dacca in 1971, resulted in the diversion of the rice
previously supplied to East Pakistan to the international markets. During this period,
worldwide commodity boom led export price of rice to rise more than double in 1973-
74 compared to 1972-73. In order to maximize revenue, the government created a
huge gap between the international price and the domestic price by restricting
exports. As a result ,rice exports declined in 1972-73 and price could not rise up to
1975-76 despite increasing trends in output. The government allowed dealers to sell
a quota of Basmati Rice (l/5th of total delivered to the procurement Centres) in local
market creating scarcity in the market which dropped procurement price while
consumer prices went up. The analysis of effects of Rice Price distortions indicated
that main factors resulting in negative transfers to producers had been price support
and state trading followed by implicit taxation through overvalued exchange rate. On
the other hand, the consumers had been consistent beneficiaries of government
intervention.
Samal and Mishra (2003) 25 analyzed benefits accrued to India from rice
exports in the post GATT (General Agreement on Tariffs and Trade) period and
suggest future strategies to increase the exports of rice. The study is based on data
collected from various published sources for the period 1990-91 to 2002-03. Findings
reveal that India has increased the exports post World Trade Organization (WTO) of
both basmati and non basmati rice in volume and value terms in spite of wide
fluctuations in the exports of non basmati rice over the years. The increase in
basmati exports was 75 per cent, while that of non basmati rice was 462 per cent in
24
Iqbal, Nuzhat. (1993). Economic Analysis of the Effects of Rice Price Distortions in Pakistan: 1975-90. The Pakistan
Development Review 32(4):859-872p.
25
Samal, P; A.K. Mishra. (2003). GATT Commitments and Rice Exports: Issues for the Indian Rice Sector. Indian Journal
of Agricultural Economics, 58(3):400-401p.
Introduction
23
the quinquennium ending 2002-03 over 1994-95 in value terms. In basmati exports,
there is an increasing trend and the exports reached to 8.52 lakh tonnes during
2000-01. The non-basmati export has reached to a record level of 45.41 lakh tonnes
during 1995-96. Before the existence of WTO, India used to export maximum
quantities of non-parboiled rice in non-basmati categories. Out of the three
components of the Agreement on Agriculture, i.e. Market Access, Export Subsidies
and Domestic Support, India has benefitted from market access agreement and has
expanded its rice exports to 50 countries. The study suggests the following short-
term and long-term measures to boost rice exports: (i) fixing the support price of rice
by looking into the prevailing international prices, buffer stock position and domestic
production scenario; (ii) promoting infrastructure development for storage and
handling at ports and godowns; (iii) looking for new rice markets around the globe;
and (iv) more public and private funds should be diverted for rice research to break
the yield barriers in irrigated ecosystems, development of technologies for japonica
rice, organic rice and increase in the yield of unfavorable ecosystems.
Sekhar (2003) 26 attempted to understand implications of agricultural trade
liberalization in determining the role of major producers/exporters in world rice
markets. The likely implications for India are traced through linkage between
domestic and world markets. The paper is based on secondary data. The sample
period chosen for the study is 1962-1995 for international sector and 1970-1995 for
domestic sector after the green revolution in India. The results indicate that the world
markets for rice are mainly influenced by production in the major exporting and
importing countries and income levels in the major importing countries. The supply is
highly inelastic. The world price of rice appears to move in tandem with that of
wheat.
The findings about the Indian sector are a mixture of the expected and the
unexpected. The supply response is quite low as established by various empirical
studies. Supply and demand functions show expected results. Export supply shows
positive response to relative price, although with an insufficient coefficient. Export
demand function shows high elasticity with respect to Indian export price relative to
that of Thailand and Pakistan. This implies that Indian export price needs to be
26
. Sekhar, C.S.C. (2003). Agricultural Trade Liberalisation Likely Implications for Rice Sector In India. Indian
Journal of Agricultural Economics,58(1); 42-63P
Introduction
24
competitive vis-s-vis Pakistan and Thailand to grab the export markets for rice, which
are likely to be sizeable in the near future.
The suggested policy implications are as under:
1. India must continue to follow the current buffer stock policy to protect its poor
consumers from the price shocks resulting from volatility in international grain
markets. Efforts should be made to improve the purchasing power of the poor
rather than hastily unloading the stocks in the already depressed world markets.
The future increases in demand for cereals have to be met only through yield
improvements since the scope for area increase is almost negligible. Therefore,
strategies should be devised to improve technology for the dry regions of the
country.
2. Public investment in agriculture, particularly in irrigation sector, needs to be
stepped up.
India must invest in domestic infrastructure, effective and efficient input and output
markets, a more equitable distribution of land and other productive resources. The
distribution of benefits will be determined by the distribution of productive assets.
A study by Mallik (2005)27 shows that India being one of the major exporters
of rice in the world tends to confront several policy issues related to exports. In India,
increase in export has been considered as a means to attain economic growth. The
appreciation of rupee vis-à-vis US dollar raises concerns regarding its adverse
consequences on exports. The paper has been divided into four sections; section-1
covers the growth performance of India’s exports since 1950-51 while section-2
focuses on exchange rate and observes a positive association between exchange
rate and exports. Section-3 of the paper discusses trade policy and its role in the
growth. The last section presents the findings of the study and its implications for
India’s export strategy. The trade policy measures taken in post-1991 period, include
removal of quantitative and other restrictions on both exports and imports, reduction
of tariffs and simplification of administrative procedures.
27
Mallik, Jayanta Kumar. (2005). India's Exports: Policy Defeating Exchange Rate Arithmetic. Economic and Political
Weekly, 40(52):5486-5496p.
Introduction
25
Basmati rice has been cultivated in the Indian subcontinent for thousands of
years and originates from North India and present day Pakistan. It is one of the
important export commodities from India. Basmati rice production in India is spread
over the states of Punjab, Haryana, Rajasthan, Jammu & Kashmir, Himachal
Pradesh, Delhi, Uttarakhand, Uttar Pradesh and Bihar. The above review of literature
reveals that most of the studies focused on analyzing the profit efficiency,
institutional and socio economic constraints in rice price protection, role of markets,
government interventions, price behavior of basmati rice.
Although, some scholars have worked on market co-integration, price
discovery and related issues for the states of Punjab and Haryana, analysis of
relationship between different prices like wholesale price, retail price, farm gate price
and export price is limited. Despite price being an important component in
determining efficiency of agricultural commodities, none of the studies focused on
India and covered this relationship in the context of Basmati rice and that too in the
major basmati rice growing state of India i.e. Haryana. In this background, it would
be useful to carry out a detailed study of relationship between wholesale price, retail
price, farm gate price and export price of Basmati rice in the state of Haryana.
1.4 Objectives:
Food security, nutritional security, sustainability and profitability are the main
focus of present and future agricultural development. The crop rotation of rice-wheat
largely adopted in irrigated areas of Haryana has posed serious challenges in future
for sustainability of agriculture in the state. Adoption of basmati in cropping systems
could improve productivity and also the agro-eco-systems of the region. Further,
irrigation requirements of the area could be reduced through adoption of basmati,
thereby reducing pressure on depleting water table. In addition, basmati being a high
value crop will help in reducing production risk in mono-cropping and will raise
income of the farmers. This study aims to analyze issues related to basmati
production, marketing and perceptions of stake holders such as producers,
wholesalers, retailers and exporters of basmati rice in Haryana.
The specific objectives of the study are as under:
i) To analyse economics of major basmati varieties grown by the farmers in Haryana.
Introduction
26
ii) To study the marketing pattern of basmati producers. iii) To study divergence among producer price, wholesaler price, retailer price
and exporter price of basmati rice. iv) To analyse perceptions and problems of above stakeholders.
1.5 Study Design and Methodology:
This study is conducted in the state of Haryana. It is based on published and
un-published sources of secondary and primary data. The relevant information about
the state and districts was obtained from various issues of the Statistical Abstract of
Haryana, Government of Haryana, Panchkula. Further, district-wise data on area,
production and yield of basmati were obtained from Statistics Department of
Haryana. The data on exports of basmati rice were culled from the APEDA website.
The Agri-net and FAO websites were also used to collect relevant information. The
required preliminary information regarding the selection of blocks and villages was
obtained from the district officials. The meetings with the Deputy Director of
Agriculture of selected districts were useful and informative. The sampling design for
primary survey for study was decided as per the study design provided by the
coordinator.
The scope of the study is confined to basmati rice in Haryana. Three districts
namely, Kaithal, Jind and Sonipat with highest share of area under basmati rice in
Haryana were selected for in-depth study. The selection of respondents is based on
multistage sampling design. At the first and second stages, basmati rice producing
districts and blocks in these districts were selected. At the third stage, villages were
selected on the same criterion. A questionnaire was canvassed to the farmers
growing basmati rice. All farm size categories i.e. marginal, small, medium and large
were covered in the sample. The number of farm households in each category was
decided according to their proportion at the district level. The primary data pertaining
to the year 2013-14 were collected from 150 farmers.
The popular basmati varieties grown in Haryana are Pusa Basmati-1121,
Pusa Basmati-1509, Pusa Basmati-1, CSR-30, Pusa Basmati-1401, Super, etc. The
total basmati area in Haryana was 741 thousand hectares in 2013-14. Out of which,
more than 50 per cent of area was devoted to Pusa basmati-1121. The next was
Pusa Basmati-1509 covering more than 15 per cent of area. The remaining varieties
Introduction
27
covered rest of the area. Considering the importance of Pusa basmati-1121 and
Pusa basmati-1509, we have carried out in-depth analysis for these varieties. The
reason for higher proportion of area under Pusa-1121 is better crop output and
popularity in the export market. It has superior grain length and excellent elongation
upon cooking and therefore, it has caught the fancy of the Iranian and other
International markets.
In addition, ten wholesalers, ten retailers and seven exporters of basmati rice
from the selected districts were surveyed to analyse prices and problems of
stakeholders dealing with basmati rice.
1.6 Analytical Framework:
The study has used simple statistical techniques for the analyses of primary
and secondary data. For examining variations, coefficient of variation was used to
interpret instability in quantity, value and per unit price of basmati rice.
The socio-economic characteristics of sampled farmers were analyzed
through tables created by calculation of percentages, averages, etc. The similar
simple methods were used for examining cost, returns and profitability of basmati
rice on sampled farms. The multiple responses were used to analyze problems of
wholesalers, retailers and exporters. The time series secondary data were obtained
for quantity, value and per unit price of exports of basmati from India to other
countries for the time period 1991-92 to 2011-12. The exports of basmati to major
countries were also analysed for 2012-13, 2013-14 and 2014-15.
The study has several limitations. First and foremost, availability of secondary
data about basmati rice is inadequate. Even, time series information on area,
production and yield of basmati in the major growing states and at the all India level
is not available. Further, it is very difficult to obtain required information from
exporters since they do not wish to share quantity and price of basmati exported by
them to various countries.
Introduction
28
1.7 Organization of the Study:
The study is divided into eight chapters. Chapter-1 is introductory and
presents an overview of basmati rice in India, objectives of the study, literature
survey, research methodology and organization of the study. Chapter-2 deals with
main features of selected districts and status of basmati rice in Haryana. Chapter-3
summarizes demographic characteristics and crop pattern of sampled farmers.
Chapter-4 is devoted to the empirical findings on economics of basmati cultivation.
Chapter-5 presents marketing scenario of basmati rice in Haryana. Chapter-6 is
devoted to the price patterns of basmati rice for wholesalers, retailers and exporters.
The next chapter examines the perceptions of stakeholders. Final chapter presents
summary and conclusions of the study.
Basic Indicators of Selected Districts and Status of Basmati Paddy
29
Chapter - 2
Basic Indicators of Selected Districts and Status of Basmati Paddy in Haryana
After presenting research methodology adopted for the selection of study
area, sampling design, data collection and analytical framework used in the light of
specific objectives of the study in Chapter-1, we provide a brief background of the
selected districts and status of basmati paddy in terms of area, production and yield
in Haryana in this chapter which is divided into two sections. One section is devoted
to each aspect
Section-1
Selected Districts
Now, we present main indicators of selected districts for the study. In
particular, we have included those indicators which affect development of agriculture.
Sonipat
Sonipat, is an ancient town in the state of Haryana. The district Sonipat
comprises of three sub-divisions, namely, Gannaur, Sonipat and Gohana and seven
blocks (Gannaur, Sonipat, Rai, Kharkhoda, Gohana, Kathura and Mundlana). The
district was carved out of Rohtak and was made a ful fledged district on 22
December 1972. Sonipat with an area of 2,13,080 ha. lies in the south-east of the
state of Haryana , north of the Union Territory of Delhi and is bounded by the districts
of Rohtak, Jind and Panipat. It shares an inter-state boundary with district Meerut,
Uttar Pradesh. The river Yamuna runs along the eastern boundary of the district and
separates it from Uttar Pradesh.
The climate of the district Sonipat is dry with an extremely hot summer and a
cold winter. The weather becomes comparatively mild during the monsoon period
(July to September). The post-monsoon months i.e. October and November
constitute a transition period, prior to the onset of winter. The district experiences
high humidity during the monsoon period. The period of minimum humidity (less than
20%) is between April and May every year.
According to the Population Census of India, 2011, total population of the
district was 14.5 lakh persons. Of this, urban population formed small part and was
Basic Indicators of Selected Districts and Status of Basmati Paddy
30
4.53 lakh persons. The district is primarily rural in nature and the major economic
activity of the workers is agriculture. The rural population of the district was 9.97 lakh
persons. The working population of district Sonipat comprised of 27.11% cultivators,
19.45% agricultural labourers and the rest were non-agricultural workers.
Around 53.48% of geographical area is cultivated in Sonipat. The average
size of holding is 1.35 ha. Agriculture is well developed in the district due to
availability of irrigation facilities which is carried out by tube-wells and canals. Sweet
water is available in plenty throughout the district. The percentage of gross area
irrigated to total cropped area is 100.00. The same is true for net irrigated area as
well. The crop intensity was around 187. The crop pattern in Sonipat was found
skewed towards rice and wheat. The yield rate of rice was found above the state
level while vice-versa was noticed for wheat. The soil of the district is a good alluvial
loam with sufficient moisture and is mostly rausli in texture (Table 2.1).
The infrastructure in the Sonipat district comprises banks, primary agricultural
co-operative credit societies and regulated markets. The road length per lakh
population was around 98 kms.
Jind
Jind district was an integral part of Kurukshetra in the traditional geographical
account. The district lies in the North of Haryana between 29.03’ and 29.51’ north
latitude & 75.53’ and 76.47’ east longitude. The districts of Panipat, Karnal and
Kaithal respectively lie on its east and north-east. Its boundary line on the north
forms the inter-state Haryana- Punjab border with Patiala and Sangurar districts of
Punjab. In the west and south-west, it has a common boundary with district Hissar
and Fatehabad and in its south and south-east lie the districts of Rohtak and Sonipat
respectively. The district comprises three sub-divisions: Jind, Narwana and Safidon.
According to the Population Census of India, 2011, Jind had a population of
136,089 persons. The rural population constituted 54 per cent while 46 per cent of
population resides in urban areas. The population density was 494 persons per sq.
km. The percentage of literate population to total population in Jind was 72.7 per
cent which is slightly higher than the state of Haryana. The sex ratio in the district
was 870 females per 1000 males.
Basic Indicators of Selected Districts and Status of Basmati Paddy
31
Out of total geographical area in Jind, net sown area was 49.79 per cent and
tube-wells are the main source of irrigation. The net irrigated area constituted 99.2
per cent of the net sown area. The cropping intensity in the district was around 201
per cent and the average size of operational holding was 2.6 ha against 2.25 ha. in
Haryana.
The share of gross cropped area under important crops reveals that cereals
covered around 75 per cent of GCA. Oil seeds were grown on 0.92 percent of GCA.
Cotton occupied sizeable share (13.18 per cent of GCA). The yield rates of cereals
were almost the same as the state.
The climate of Jind district is dry, hot in summer and cold in winter. The year
is divided into four seasons. The cold season from November to March is followed by
hot season which lasts till the onset of the south-west monsoon.
The area of Jind district is irrigated by two canal systems, viz. the Western
Yamuna (Jumna) Canal and the Bhakra Canal. These two systems are interlinked by
the Narwana and Barwala link canals of the Bhakra Canal system. Infrastructure in
Jind district comprises banks, primary agricultural co-operative credit societies and
regulated markets. The road length per lakh population was around 67 kms (Table
2.1).
Kaithal
Kaithal is the north eastern district of Haryana state and is located between
29°31’:30°12’ north latitudes and 76°10:76°42’ east longitudes. It is surrounded by
Jind, Kurukshetra and Ambala districts of Haryana and Patiala district of Punjab in
the north.
The district of Kaithal is under control of Ambala division and administratively,
divided into seven development blocks, namely, Kaithal, Pundri, Rajaund and Guhla.
There are 277 villages and 253 Panchayats in Kaithal district. It consists of two
tehsils, namely Kaithal and Guhla and five sub-tehsils, namely, Pundari, Rajaund,
Dhand, Kalayat and Siwan. The name of Kaithal, Pundri, Pharal, Siwan and Kalayat
show that the soil of Kaithal has cultural rich heritage.
As per Population Census of India, 2011, total population of the district was
10.74 lakh. The share of rural and urban population was 8.38 lakh (78.03 per cent)
Basic Indicators of Selected Districts and Status of Basmati Paddy
32
and 2.36 lakh (21.97 per cent), respectively with an average density of 464 persons
per sq km. The male and female ratio in the population of the district was 1000:881.
Literacy was recorded as 76.64 per cent during 2011.
The Ghaggar and Markanda rivers are important seasonal rivers in the district
and flow through the northern part of the district (covering Guhla block) in the west
and enters Patiala district of Punjab. The share of net sown area in the total
geographical area is 52.89 per cent. Agriculture is well developed in the district since
entire net area sown and gross cropped area is irrigated. Canal is the main source of
irrigation. The cropping intensity was around 189 and the average size of operational
holding was 2.75 ha. in the Kaithal district.
The soil of Kaithal is sandy to sandy loam in texture. The main crops grown in
the district are paddy in Kharif and wheat in rabi season followed by some area
under American cotton. The farmers also grow moong to meet out their domestic
requirement. The yield rates of paddy and wheat were 2901 kg/ha and 5451 kg/ha.
during 2011-12. The productivity of paddy was observed below the state level while
vice versa is true for wheat.
The climate of Kaithal district can be classified as tropical steppe, semi arid
and hot which is primarily dry with hot summer and cold winter except monsoon
season when moist air of oceanic origin penetrates into the district. There are four
seasons in a year. The hot weather starts from mid March to last week of June
followed by monsoon which lasts up to September. The transition period from
September to October forms the post-monsoon season. The winter season starts in
November and goes up to first week of March.
Agriculture is modernized in Kaithal district as fertilizer consumption was 251
kg/ha. which is higher than the state (220 kg/ha.). The infrastructure comprises of
primary agriculture cooperative societies and regulated markets. The district is well
connected by road as road length per lakh of population is 170 kms (Table 2.1).
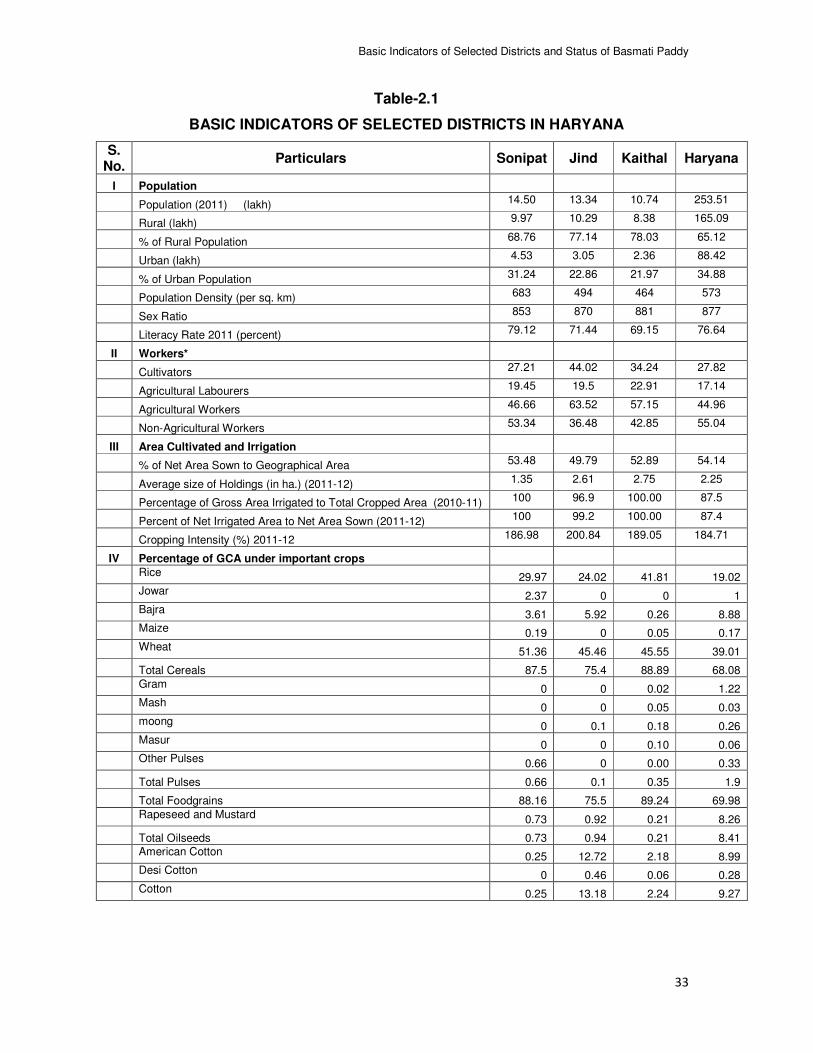
Basic Indicators of Selected Districts and Status of Basmati Paddy
33
Table-2.1
BASIC INDICATORS OF SELECTED DISTRICTS IN HARYANA
S. No.
Particulars Sonipat Jind Kaithal Haryana
I Population
Population (2011) (lakh) 14.50 13.34 10.74 253.51
Rural (lakh) 9.97 10.29 8.38 165.09
% of Rural Population 68.76 77.14 78.03 65.12
Urban (lakh) 4.53 3.05 2.36 88.42
% of Urban Population 31.24 22.86 21.97 34.88
Population Density (per sq. km) 683 494 464 573
Sex Ratio 853 870 881 877
Literacy Rate 2011 (percent) 79.12 71.44 69.15 76.64
II Workers*
Cultivators 27.21 44.02 34.24 27.82
Agricultural Labourers 19.45 19.5 22.91 17.14
Agricultural Workers 46.66 63.52 57.15 44.96
Non-Agricultural Workers 53.34 36.48 42.85 55.04
III Area Cultivated and Irrigation
% of Net Area Sown to Geographical Area 53.48 49.79 52.89 54.14
Average size of Holdings (in ha.) (2011-12) 1.35 2.61 2.75 2.25
Percentage of Gross Area Irrigated to Total Cropped Area (2010-11) 100 96.9 100.00 87.5
Percent of Net Irrigated Area to Net Area Sown (2011-12) 100 99.2 100.00 87.4
Cropping Intensity (%) 2011-12 186.98 200.84 189.05 184.71
IV Percentage of GCA under important crops
Rice 29.97 24.02 41.81 19.02
Jowar 2.37 0 0 1
Bajra 3.61 5.92 0.26 8.88
Maize 0.19 0 0.05 0.17
Wheat 51.36 45.46 45.55 39.01
Total Cereals 87.5 75.4 88.89 68.08
Gram 0 0 0.02 1.22
Mash 0 0 0.05 0.03
moong 0 0.1 0.18 0.26
Masur 0 0 0.10 0.06
Other Pulses 0.66 0 0.00 0.33
Total Pulses 0.66 0.1 0.35 1.9
Total Foodgrains 88.16 75.5 89.24 69.98
Rapeseed and Mustard 0.73 0.92 0.21 8.26
Total Oilseeds 0.73 0.94 0.21 8.41
American Cotton 0.25 12.72 2.18 8.99
Desi Cotton 0 0.46 0.06 0.28
Cotton 0.25 13.18 2.24 9.27
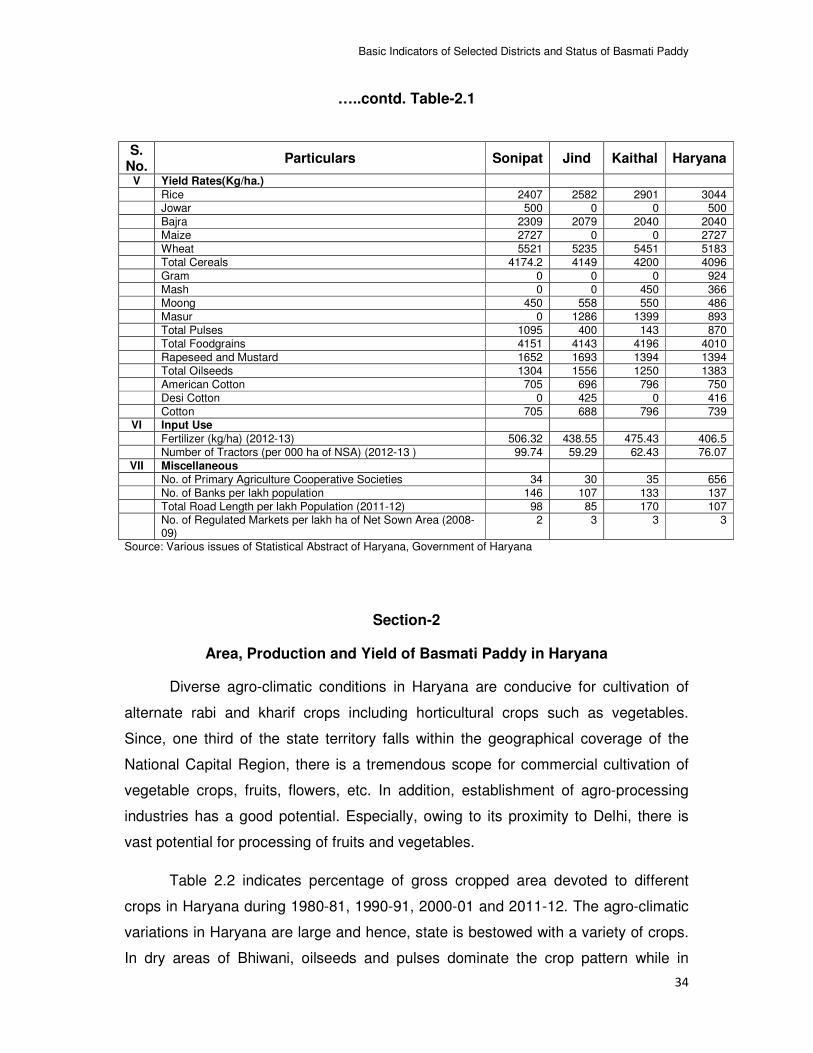
Basic Indicators of Selected Districts and Status of Basmati Paddy
34
…..contd. Table-2.1
S. No.
Particulars Sonipat Jind Kaithal Haryana
V Yield Rates(Kg/ha.)
Rice 2407 2582 2901 3044 Jowar 500 0 0 500
Bajra 2309 2079 2040 2040
Maize 2727 0 0 2727
Wheat 5521 5235 5451 5183
Total Cereals 4174.2 4149 4200 4096
Gram 0 0 0 924
Mash 0 0 450 366
Moong 450 558 550 486
Masur 0 1286 1399 893
Total Pulses 1095 400 143 870
Total Foodgrains 4151 4143 4196 4010
Rapeseed and Mustard 1652 1693 1394 1394
Total Oilseeds 1304 1556 1250 1383
American Cotton 705 696 796 750
Desi Cotton 0 425 0 416
Cotton 705 688 796 739 VI Input Use
Fertilizer (kg/ha) (2012-13) 506.32 438.55 475.43 406.5
Number of Tractors (per 000 ha of NSA) (2012-13 ) 99.74 59.29 62.43 76.07
VII Miscellaneous
No. of Primary Agriculture Cooperative Societies 34 30 35 656
No. of Banks per lakh population 146 107 133 137
Total Road Length per lakh Population (2011-12) 98 85 170 107
No. of Regulated Markets per lakh ha of Net Sown Area (2008-09)
2 3 3 3
Source: Various issues of Statistical Abstract of Haryana, Government of Haryana
Section-2
Area, Production and Yield of Basmati Paddy in Haryana
Diverse agro-climatic conditions in Haryana are conducive for cultivation of
alternate rabi and kharif crops including horticultural crops such as vegetables.
Since, one third of the state territory falls within the geographical coverage of the
National Capital Region, there is a tremendous scope for commercial cultivation of
vegetable crops, fruits, flowers, etc. In addition, establishment of agro-processing
industries has a good potential. Especially, owing to its proximity to Delhi, there is
vast potential for processing of fruits and vegetables.
Table 2.2 indicates percentage of gross cropped area devoted to different
crops in Haryana during 1980-81, 1990-91, 2000-01 and 2011-12. The agro-climatic
variations in Haryana are large and hence, state is bestowed with a variety of crops.
In dry areas of Bhiwani, oilseeds and pulses dominate the crop pattern while in
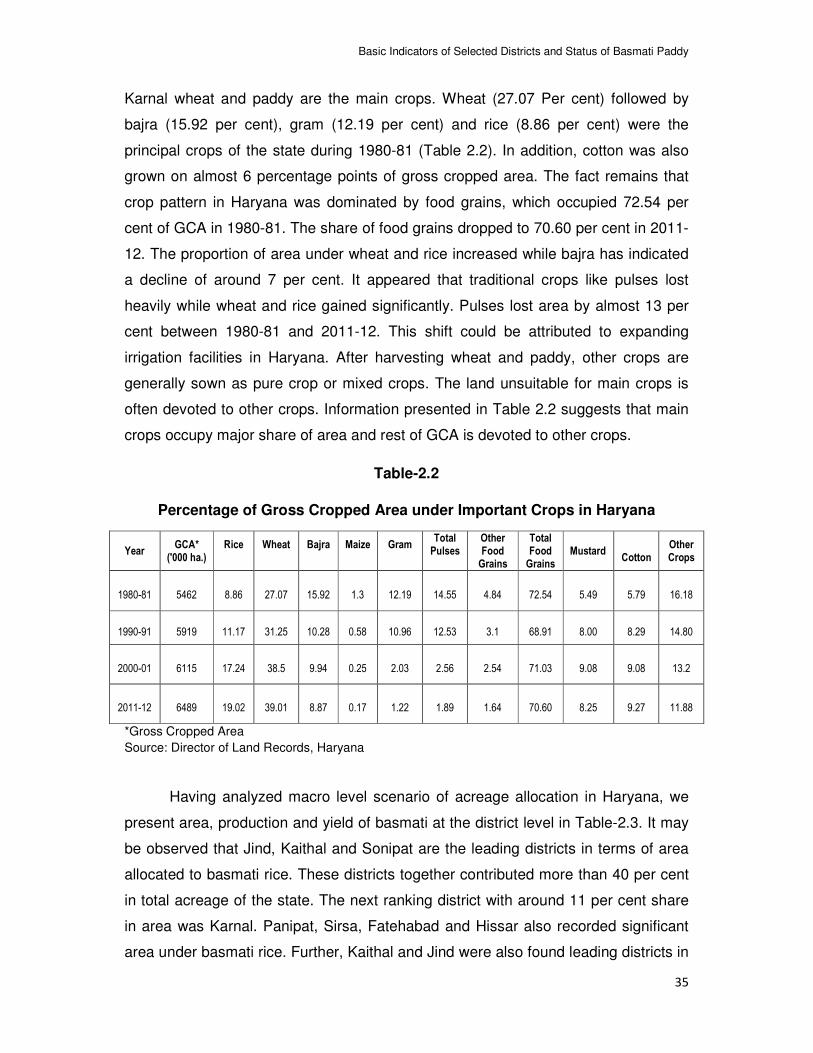
Basic Indicators of Selected Districts and Status of Basmati Paddy
35
Karnal wheat and paddy are the main crops. Wheat (27.07 Per cent) followed by
bajra (15.92 per cent), gram (12.19 per cent) and rice (8.86 per cent) were the
principal crops of the state during 1980-81 (Table 2.2). In addition, cotton was also
grown on almost 6 percentage points of gross cropped area. The fact remains that
crop pattern in Haryana was dominated by food grains, which occupied 72.54 per
cent of GCA in 1980-81. The share of food grains dropped to 70.60 per cent in 2011-
12. The proportion of area under wheat and rice increased while bajra has indicated
a decline of around 7 per cent. It appeared that traditional crops like pulses lost
heavily while wheat and rice gained significantly. Pulses lost area by almost 13 per
cent between 1980-81 and 2011-12. This shift could be attributed to expanding
irrigation facilities in Haryana. After harvesting wheat and paddy, other crops are
generally sown as pure crop or mixed crops. The land unsuitable for main crops is
often devoted to other crops. Information presented in Table 2.2 suggests that main
crops occupy major share of area and rest of GCA is devoted to other crops.
Table-2.2
Percentage of Gross Cropped Area under Important Crops in Haryana
Year GCA*
('000 ha.) Rice
Wheat
Bajra
Maize
Gram
Total Pulses
Other Food Grains
Total Food Grains
Mustard
Cotton Other Crops
1980-81 5462 8.86 27.07 15.92 1.3 12.19 14.55 4.84 72.54 5.49 5.79 16.18
1990-91 5919 11.17 31.25 10.28 0.58 10.96 12.53 3.1 68.91 8.00 8.29 14.80
2000-01 6115 17.24 38.5 9.94 0.25 2.03 2.56 2.54 71.03 9.08 9.08 13.2
2011-12 6489 19.02 39.01 8.87 0.17 1.22 1.89 1.64 70.60 8.25 9.27 11.88
*Gross Cropped Area
Source: Director of Land Records, Haryana
Having analyzed macro level scenario of acreage allocation in Haryana, we
present area, production and yield of basmati at the district level in Table-2.3. It may
be observed that Jind, Kaithal and Sonipat are the leading districts in terms of area
allocated to basmati rice. These districts together contributed more than 40 per cent
in total acreage of the state. The next ranking district with around 11 per cent share
in area was Karnal. Panipat, Sirsa, Fatehabad and Hissar also recorded significant
area under basmati rice. Further, Kaithal and Jind were also found leading districts in
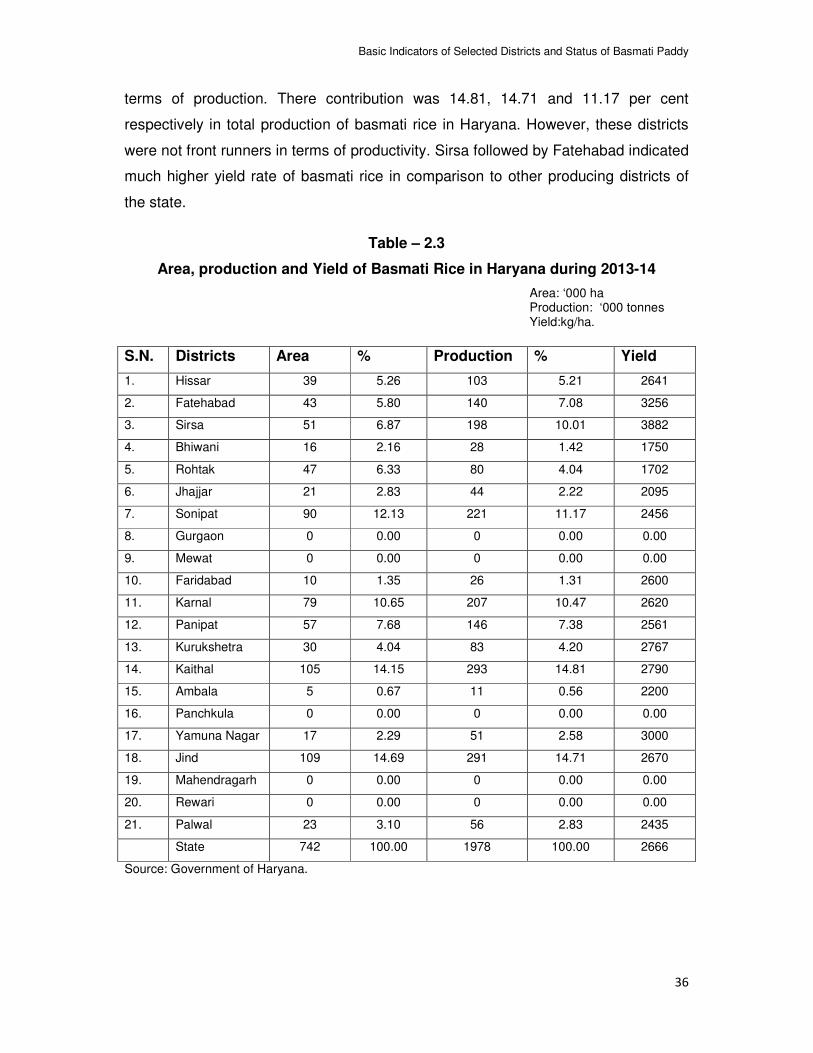
Basic Indicators of Selected Districts and Status of Basmati Paddy
36
terms of production. There contribution was 14.81, 14.71 and 11.17 per cent
respectively in total production of basmati rice in Haryana. However, these districts
were not front runners in terms of productivity. Sirsa followed by Fatehabad indicated
much higher yield rate of basmati rice in comparison to other producing districts of
the state.
Table – 2.3
Area, production and Yield of Basmati Rice in Haryana during 2013-14
Area: ‘000 ha Production: ‘000 tonnes Yield:kg/ha.
S.N. Districts Area % Production % Yield
1. Hissar 39 5.26 103 5.21 2641
2. Fatehabad 43 5.80 140 7.08 3256
3. Sirsa 51 6.87 198 10.01 3882
4. Bhiwani 16 2.16 28 1.42 1750
5. Rohtak 47 6.33 80 4.04 1702
6. Jhajjar 21 2.83 44 2.22 2095
7. Sonipat 90 12.13 221 11.17 2456
8. Gurgaon 0 0.00 0 0.00 0.00
9. Mewat 0 0.00 0 0.00 0.00
10. Faridabad 10 1.35 26 1.31 2600
11. Karnal 79 10.65 207 10.47 2620
12. Panipat 57 7.68 146 7.38 2561
13. Kurukshetra 30 4.04 83 4.20 2767
14. Kaithal 105 14.15 293 14.81 2790
15. Ambala 5 0.67 11 0.56 2200
16. Panchkula 0 0.00 0 0.00 0.00
17. Yamuna Nagar 17 2.29 51 2.58 3000
18. Jind 109 14.69 291 14.71 2670
19. Mahendragarh 0 0.00 0 0.00 0.00
20. Rewari 0 0.00 0 0.00 0.00
21. Palwal 23 3.10 56 2.83 2435
State 742 100.00 1978 100.00 2666
Source: Government of Haryana.
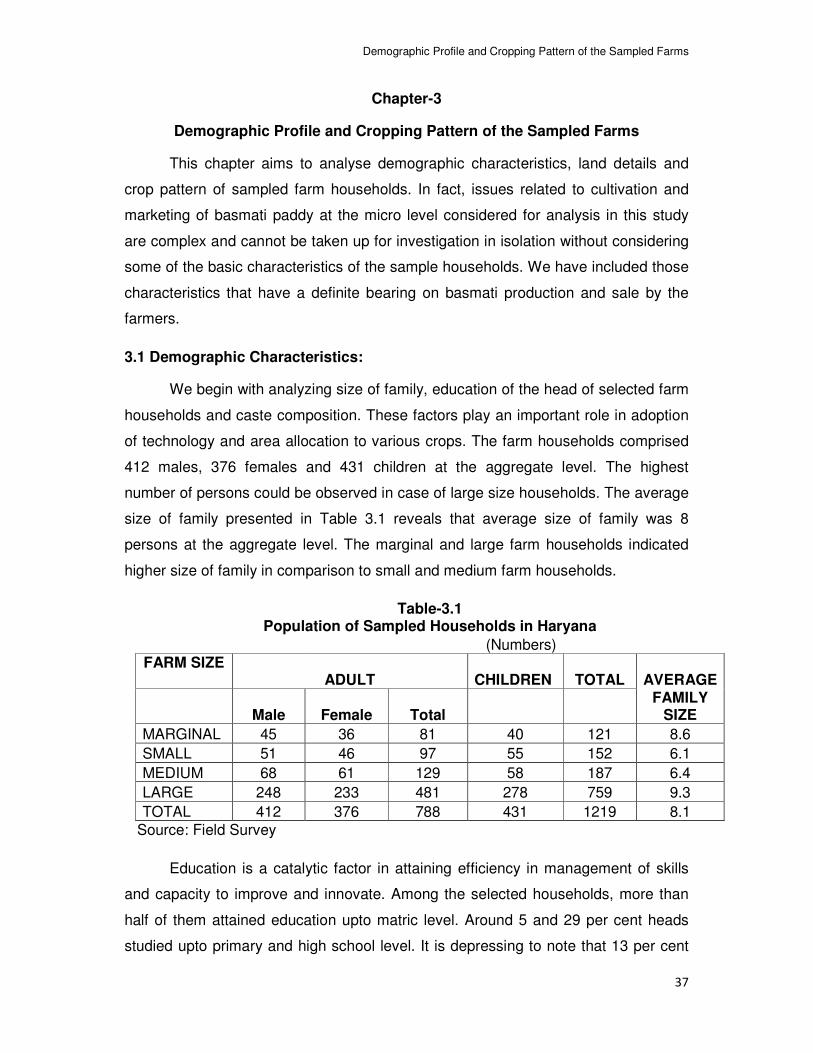
Demographic Profile and Cropping Pattern of the Sampled Farms
37
Chapter-3
Demographic Profile and Cropping Pattern of the Sampled Farms
This chapter aims to analyse demographic characteristics, land details and
crop pattern of sampled farm households. In fact, issues related to cultivation and
marketing of basmati paddy at the micro level considered for analysis in this study
are complex and cannot be taken up for investigation in isolation without considering
some of the basic characteristics of the sample households. We have included those
characteristics that have a definite bearing on basmati production and sale by the
farmers.
3.1 Demographic Characteristics:
We begin with analyzing size of family, education of the head of selected farm
households and caste composition. These factors play an important role in adoption
of technology and area allocation to various crops. The farm households comprised
412 males, 376 females and 431 children at the aggregate level. The highest
number of persons could be observed in case of large size households. The average
size of family presented in Table 3.1 reveals that average size of family was 8
persons at the aggregate level. The marginal and large farm households indicated
higher size of family in comparison to small and medium farm households.
Table-3.1 Population of Sampled Households in Haryana
(Numbers) FARM SIZE ADULT CHILDREN TOTAL AVERAGE
Male Female Total FAMILY
SIZE
MARGINAL 45 36 81 40 121 8.6
SMALL 51 46 97 55 152 6.1
MEDIUM 68 61 129 58 187 6.4
LARGE 248 233 481 278 759 9.3
TOTAL 412 376 788 431 1219 8.1
Source: Field Survey
Education is a catalytic factor in attaining efficiency in management of skills
and capacity to improve and innovate. Among the selected households, more than
half of them attained education upto matric level. Around 5 and 29 per cent heads
studied upto primary and high school level. It is depressing to note that 13 per cent
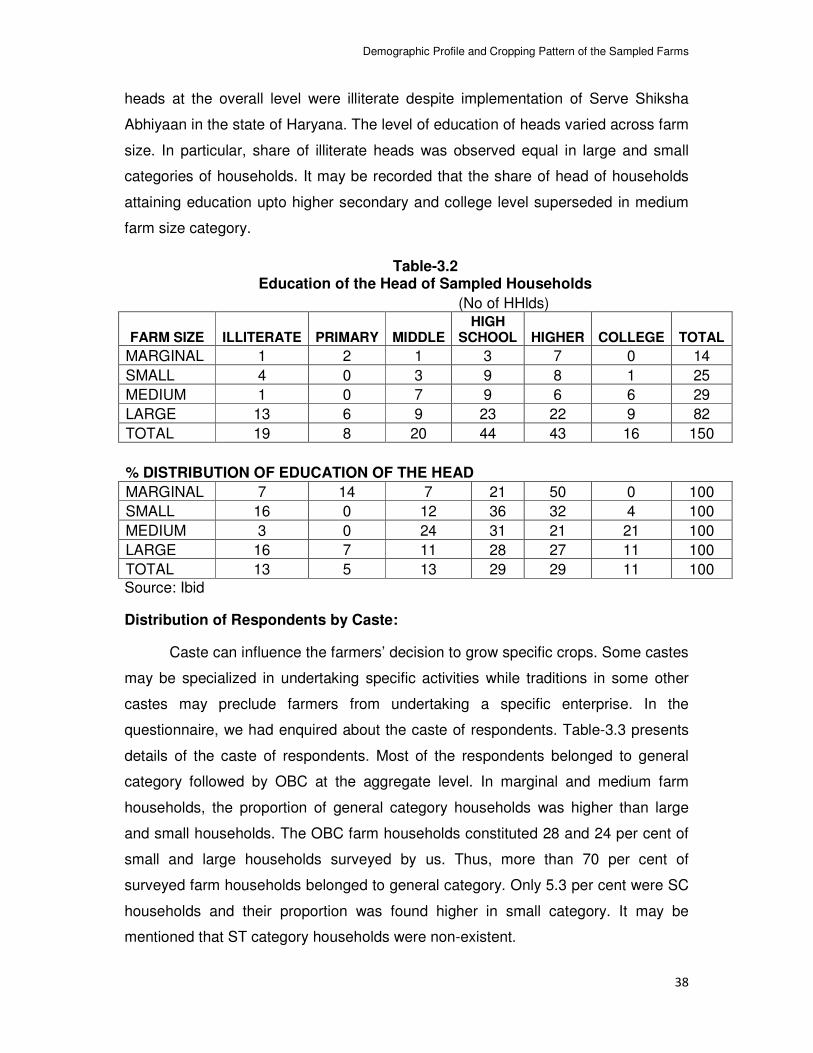
Demographic Profile and Cropping Pattern of the Sampled Farms
38
heads at the overall level were illiterate despite implementation of Serve Shiksha
Abhiyaan in the state of Haryana. The level of education of heads varied across farm
size. In particular, share of illiterate heads was observed equal in large and small
categories of households. It may be recorded that the share of head of households
attaining education upto higher secondary and college level superseded in medium
farm size category.
Table-3.2 Education of the Head of Sampled Households
(No of HHlds)
FARM SIZE ILLITERATE PRIMARY MIDDLE HIGH
SCHOOL HIGHER COLLEGE TOTAL
MARGINAL 1 2 1 3 7 0 14
SMALL 4 0 3 9 8 1 25
MEDIUM 1 0 7 9 6 6 29
LARGE 13 6 9 23 22 9 82
TOTAL 19 8 20 44 43 16 150
% DISTRIBUTION OF EDUCATION OF THE HEAD
MARGINAL 7 14 7 21 50 0 100
SMALL 16 0 12 36 32 4 100
MEDIUM 3 0 24 31 21 21 100
LARGE 16 7 11 28 27 11 100
TOTAL 13 5 13 29 29 11 100
Source: Ibid
Distribution of Respondents by Caste:
Caste can influence the farmers’ decision to grow specific crops. Some castes
may be specialized in undertaking specific activities while traditions in some other
castes may preclude farmers from undertaking a specific enterprise. In the
questionnaire, we had enquired about the caste of respondents. Table-3.3 presents
details of the caste of respondents. Most of the respondents belonged to general
category followed by OBC at the aggregate level. In marginal and medium farm
households, the proportion of general category households was higher than large
and small households. The OBC farm households constituted 28 and 24 per cent of
small and large households surveyed by us. Thus, more than 70 per cent of
surveyed farm households belonged to general category. Only 5.3 per cent were SC
households and their proportion was found higher in small category. It may be
mentioned that ST category households were non-existent.
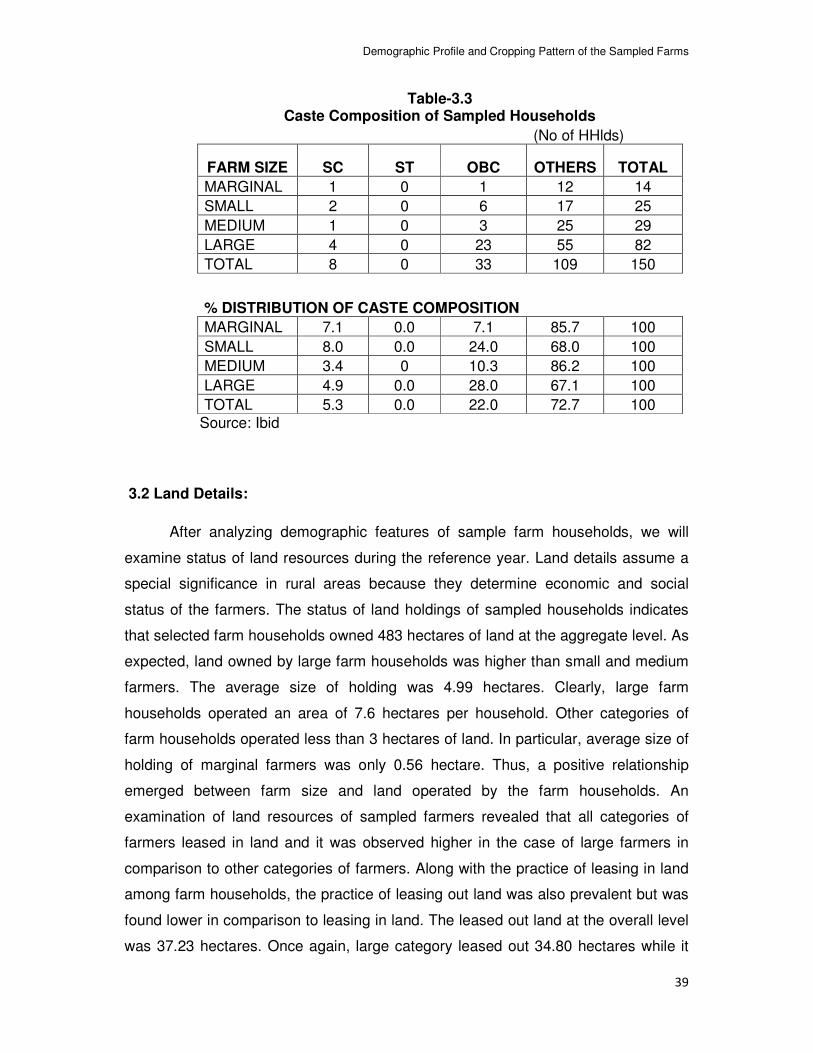
Demographic Profile and Cropping Pattern of the Sampled Farms
39
Table-3.3 Caste Composition of Sampled Households
(No of HHlds)
FARM SIZE SC ST OBC OTHERS TOTAL
MARGINAL 1 0 1 12 14
SMALL 2 0 6 17 25
MEDIUM 1 0 3 25 29
LARGE 4 0 23 55 82
TOTAL 8 0 33 109 150
% DISTRIBUTION OF CASTE COMPOSITION
MARGINAL 7.1 0.0 7.1 85.7 100
SMALL 8.0 0.0 24.0 68.0 100
MEDIUM 3.4 0 10.3 86.2 100
LARGE 4.9 0.0 28.0 67.1 100
TOTAL 5.3 0.0 22.0 72.7 100
Source: Ibid
3.2 Land Details:
After analyzing demographic features of sample farm households, we will
examine status of land resources during the reference year. Land details assume a
special significance in rural areas because they determine economic and social
status of the farmers. The status of land holdings of sampled households indicates
that selected farm households owned 483 hectares of land at the aggregate level. As
expected, land owned by large farm households was higher than small and medium
farmers. The average size of holding was 4.99 hectares. Clearly, large farm
households operated an area of 7.6 hectares per household. Other categories of
farm households operated less than 3 hectares of land. In particular, average size of
holding of marginal farmers was only 0.56 hectare. Thus, a positive relationship
emerged between farm size and land operated by the farm households. An
examination of land resources of sampled farmers revealed that all categories of
farmers leased in land and it was observed higher in the case of large farmers in
comparison to other categories of farmers. Along with the practice of leasing in land
among farm households, the practice of leasing out land was also prevalent but was
found lower in comparison to leasing in land. The leased out land at the overall level
was 37.23 hectares. Once again, large category leased out 34.80 hectares while it
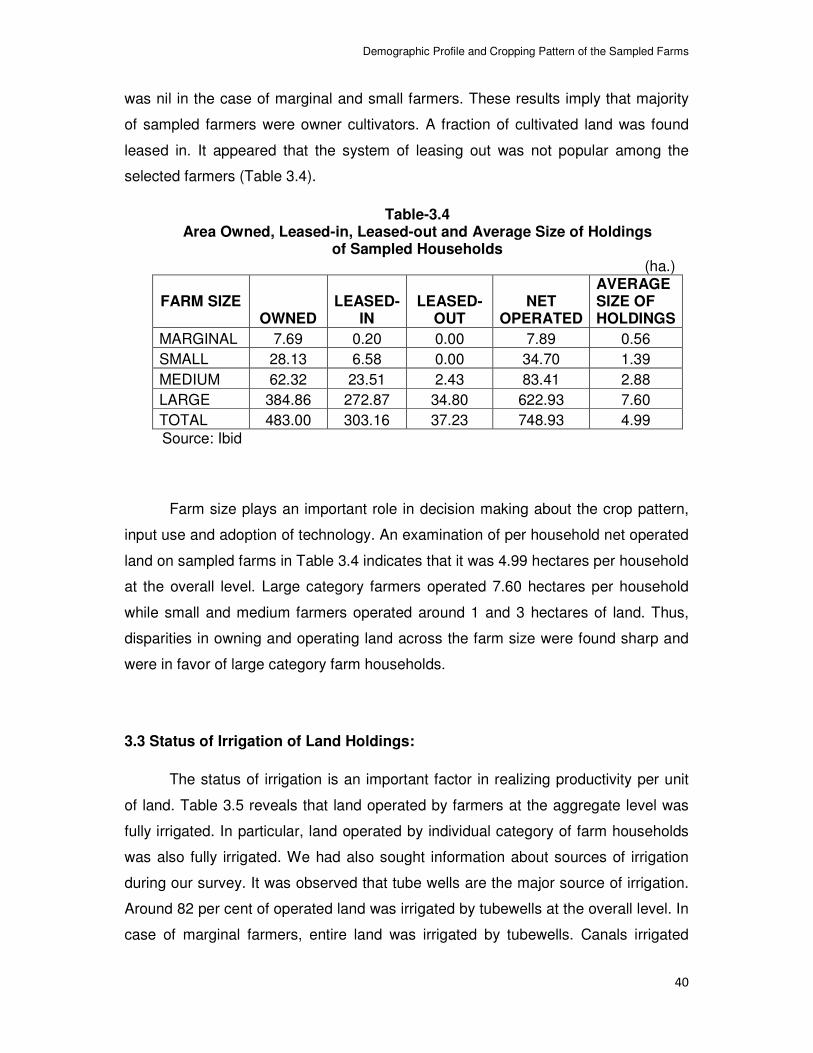
Demographic Profile and Cropping Pattern of the Sampled Farms
40
was nil in the case of marginal and small farmers. These results imply that majority
of sampled farmers were owner cultivators. A fraction of cultivated land was found
leased in. It appeared that the system of leasing out was not popular among the
selected farmers (Table 3.4).
Table-3.4 Area Owned, Leased-in, Leased-out and Average Size of Holdings
of Sampled Households (ha.)
FARM SIZE OWNED
LEASED-IN
LEASED-OUT
NET OPERATED
AVERAGE SIZE OF HOLDINGS
MARGINAL 7.69 0.20 0.00 7.89 0.56
SMALL 28.13 6.58 0.00 34.70 1.39
MEDIUM 62.32 23.51 2.43 83.41 2.88
LARGE 384.86 272.87 34.80 622.93 7.60
TOTAL 483.00 303.16 37.23 748.93 4.99
Source: Ibid
Farm size plays an important role in decision making about the crop pattern,
input use and adoption of technology. An examination of per household net operated
land on sampled farms in Table 3.4 indicates that it was 4.99 hectares per household
at the overall level. Large category farmers operated 7.60 hectares per household
while small and medium farmers operated around 1 and 3 hectares of land. Thus,
disparities in owning and operating land across the farm size were found sharp and
were in favor of large category farm households.
3.3 Status of Irrigation of Land Holdings:
The status of irrigation is an important factor in realizing productivity per unit
of land. Table 3.5 reveals that land operated by farmers at the aggregate level was
fully irrigated. In particular, land operated by individual category of farm households
was also fully irrigated. We had also sought information about sources of irrigation
during our survey. It was observed that tube wells are the major source of irrigation.
Around 82 per cent of operated land was irrigated by tubewells at the overall level. In
case of marginal farmers, entire land was irrigated by tubewells. Canals irrigated
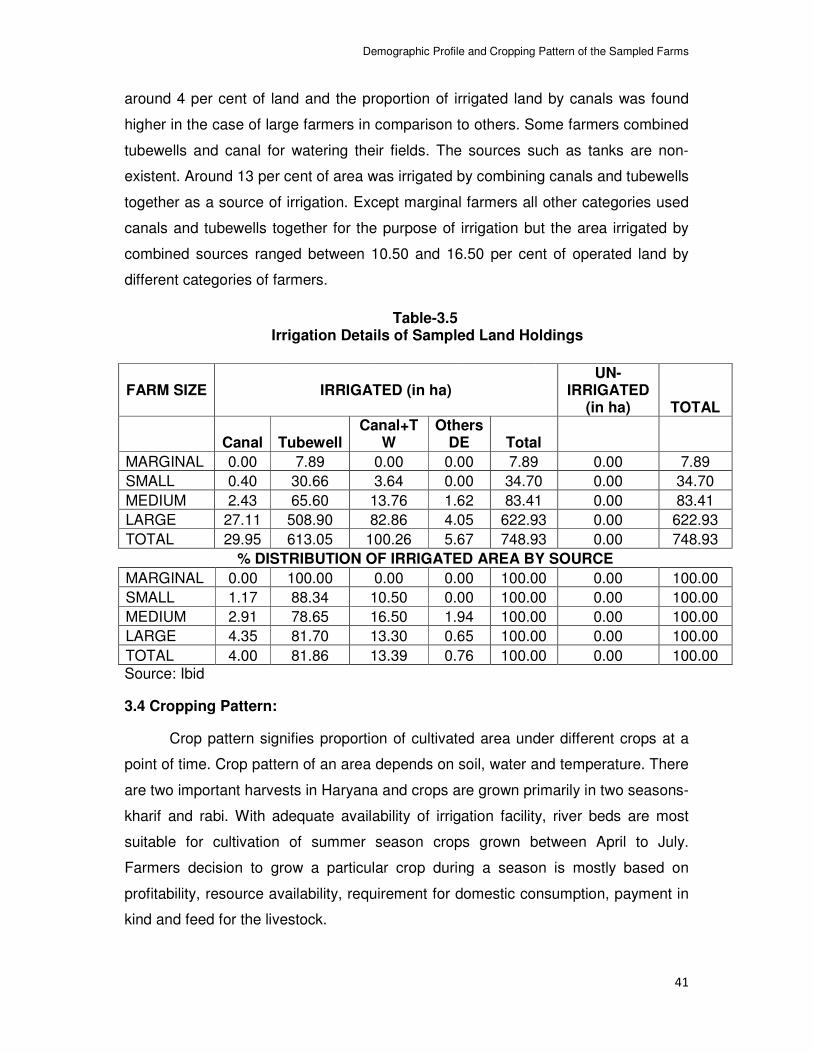
Demographic Profile and Cropping Pattern of the Sampled Farms
41
around 4 per cent of land and the proportion of irrigated land by canals was found
higher in the case of large farmers in comparison to others. Some farmers combined
tubewells and canal for watering their fields. The sources such as tanks are non-
existent. Around 13 per cent of area was irrigated by combining canals and tubewells
together as a source of irrigation. Except marginal farmers all other categories used
canals and tubewells together for the purpose of irrigation but the area irrigated by
combined sources ranged between 10.50 and 16.50 per cent of operated land by
different categories of farmers.
Table-3.5 Irrigation Details of Sampled Land Holdings
FARM SIZE
IRRIGATED (in ha)
UN-IRRIGATED
(in ha) TOTAL
Canal Tubewell Canal+T
W Others
DE Total
MARGINAL 0.00 7.89 0.00 0.00 7.89 0.00 7.89
SMALL 0.40 30.66 3.64 0.00 34.70 0.00 34.70
MEDIUM 2.43 65.60 13.76 1.62 83.41 0.00 83.41
LARGE 27.11 508.90 82.86 4.05 622.93 0.00 622.93
TOTAL 29.95 613.05 100.26 5.67 748.93 0.00 748.93
% DISTRIBUTION OF IRRIGATED AREA BY SOURCE
MARGINAL 0.00 100.00 0.00 0.00 100.00 0.00 100.00
SMALL 1.17 88.34 10.50 0.00 100.00 0.00 100.00
MEDIUM 2.91 78.65 16.50 1.94 100.00 0.00 100.00
LARGE 4.35 81.70 13.30 0.65 100.00 0.00 100.00
TOTAL 4.00 81.86 13.39 0.76 100.00 0.00 100.00 Source: Ibid
3.4 Cropping Pattern:
Crop pattern signifies proportion of cultivated area under different crops at a
point of time. Crop pattern of an area depends on soil, water and temperature. There
are two important harvests in Haryana and crops are grown primarily in two seasons-
kharif and rabi. With adequate availability of irrigation facility, river beds are most
suitable for cultivation of summer season crops grown between April to July.
Farmers decision to grow a particular crop during a season is mostly based on
profitability, resource availability, requirement for domestic consumption, payment in
kind and feed for the livestock.
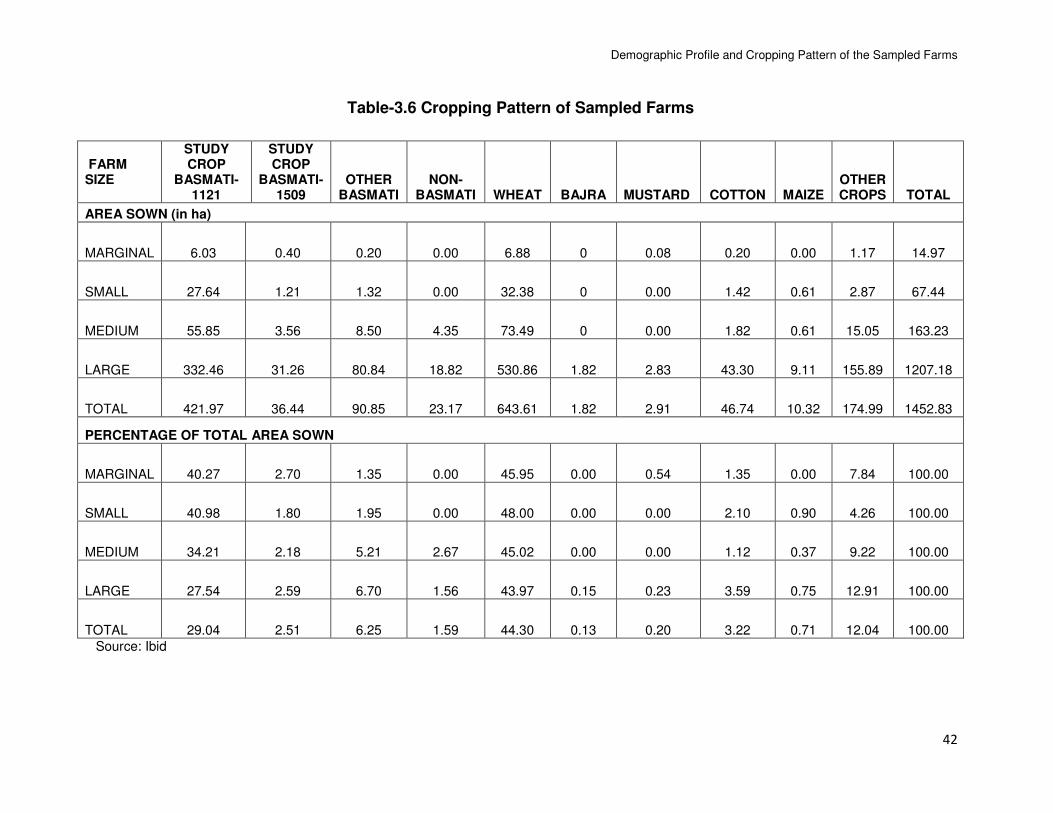
Demographic Profile and Cropping Pattern of the Sampled Farms
42
Table-3.6 Cropping Pattern of Sampled Farms
FARM SIZE
STUDY CROP
BASMATI-1121
STUDY CROP
BASMATI-1509
OTHER BASMATI
NON-BASMATI WHEAT BAJRA MUSTARD COTTON MAIZE
OTHER CROPS TOTAL
AREA SOWN (in ha)
MARGINAL 6.03 0.40 0.20 0.00 6.88 0 0.08 0.20 0.00 1.17 14.97
SMALL 27.64 1.21 1.32 0.00 32.38 0 0.00 1.42 0.61 2.87 67.44
MEDIUM 55.85 3.56 8.50 4.35 73.49 0 0.00 1.82 0.61 15.05 163.23
LARGE 332.46 31.26 80.84 18.82 530.86 1.82 2.83 43.30 9.11 155.89 1207.18
TOTAL 421.97 36.44 90.85 23.17 643.61 1.82 2.91 46.74 10.32 174.99 1452.83
PERCENTAGE OF TOTAL AREA SOWN
MARGINAL 40.27 2.70 1.35 0.00 45.95 0.00 0.54 1.35 0.00 7.84 100.00
SMALL 40.98 1.80 1.95 0.00 48.00 0.00 0.00 2.10 0.90 4.26 100.00
MEDIUM 34.21 2.18 5.21 2.67 45.02 0.00 0.00 1.12 0.37 9.22 100.00
LARGE 27.54 2.59 6.70 1.56 43.97 0.15 0.23 3.59 0.75 12.91 100.00
TOTAL 29.04 2.51 6.25 1.59 44.30 0.13 0.20 3.22 0.71 12.04 100.00
Source: Ibid
Demographic Profile and Cropping Pattern of the Sampled Farms
43
Since, one of our main objectives is to assess the cost of cultivation and the
returns generated from basmati paddy grown by the sampled farmers in kharif
reason, it is pertinent to examine crop pattern adopted by the sampled farm
households. The information about crop pattern of selected farmers was collected
during the survey. These results are presented in Table 3.6 According to the survey,
paddy and wheat dominated crop pattern of the sampled farm households at the
aggregate level. This result was found uniform for all categories although share of
GCA devoted to these crops varied in each farm size. Paddy including basmati and
non-basmati shared 39.39 per cent of GCA at the aggregate level. We have already
mentioned that we will focus on in-depth study of Pusa Basmati-1121 and Pusa
Basmati 1509. It may be observed that percentage of GCA devoted to Basmati 1121
was 29.04 per cent while a lower share of GCA was allotted to Basmati 1509 and
other basmati varieties. It may be further noted that 1.59 per cent of GCA was
allotted to non-basmati rice. Farm-size variations were large in the allocation of area
to basmati varieties. Particularly, small and marginal farmers devoted 41 and 40 per
cent of GCA to Basmati 1121. On the other hand, large farmers allocated around 28
per cent of GCA to basmati 1121. In ranking, wheat was recorded as priority crop
which received around 44 per cent of GCA at the aggregate level. It is worth noting
that none of the surveyed farm household category devoted less than 44 per cent
GCA to wheat. Cotton followed by maize and mustard were also grown by the
sampled farmers. In particular, 3.22 per cent of GCA was devoted to cotton by
farmers at the overall level. Others also allotted at least 1 per cent of GCA to cotton.
A summary of results on area allocated to different varieties of basmati by the
sampled farmers reveals that share of area devoted to Basmati 1121 + Basmati
1509 of total basmati area was 83.45 per cent of total basmati area at the overall
level. In case of marginal farmers it was the maximum i.e, around 97 per cent of total
basmati area. Other categories also devoted more than 80 per cent of total basmati
area of basmati 1121+1509 during the reference year.
3.5 Area under Different Varieties of Basmati Paddy:
A distribution of area devoted to various basmati varieties by the farmers is
depicted in Table-3.8. Results show that around 77 per cent of total basmati area
was devoted to Basmati 1121. Specially, marginal and small farmers allotted 91 and
92 per cent of basmati area to this variety. It implies that Basmati 1121 is very
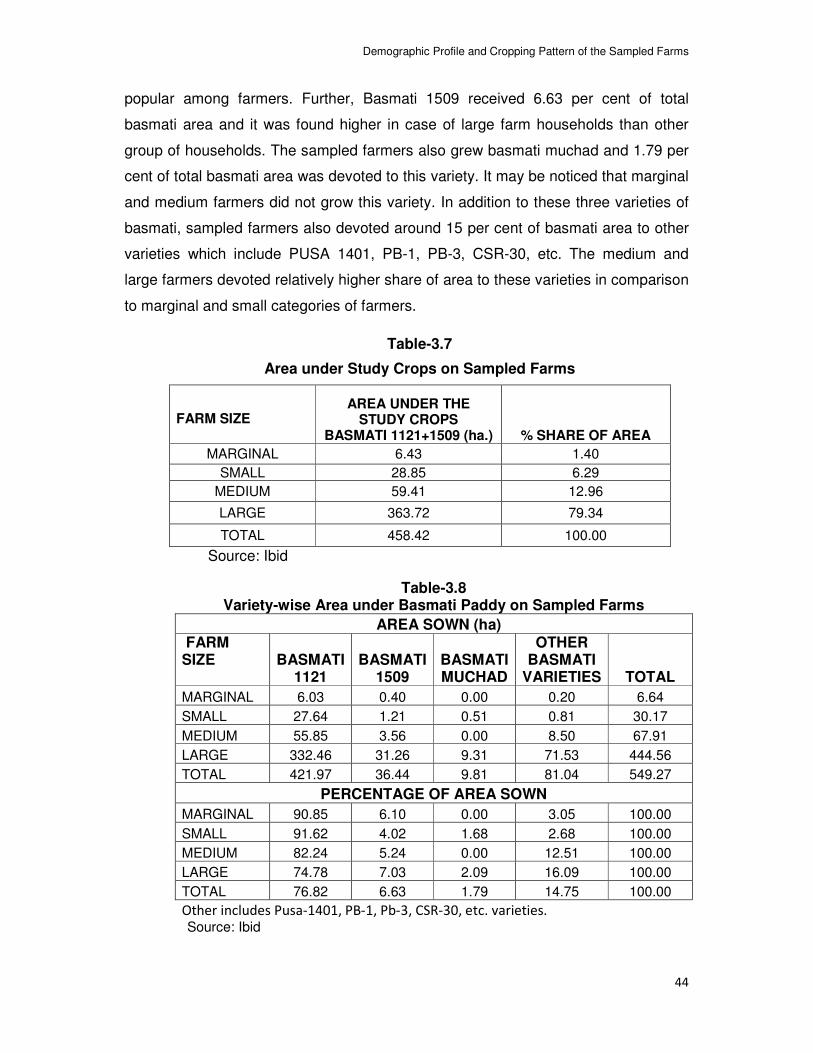
Demographic Profile and Cropping Pattern of the Sampled Farms
44
popular among farmers. Further, Basmati 1509 received 6.63 per cent of total
basmati area and it was found higher in case of large farm households than other
group of households. The sampled farmers also grew basmati muchad and 1.79 per
cent of total basmati area was devoted to this variety. It may be noticed that marginal
and medium farmers did not grow this variety. In addition to these three varieties of
basmati, sampled farmers also devoted around 15 per cent of basmati area to other
varieties which include PUSA 1401, PB-1, PB-3, CSR-30, etc. The medium and
large farmers devoted relatively higher share of area to these varieties in comparison
to marginal and small categories of farmers.
Table-3.7
Area under Study Crops on Sampled Farms
FARM SIZE
AREA UNDER THE STUDY CROPS
BASMATI 1121+1509 (ha.) % SHARE OF AREA
MARGINAL 6.43 1.40
SMALL 28.85 6.29
MEDIUM 59.41 12.96
LARGE 363.72 79.34
TOTAL 458.42 100.00
Source: Ibid
Table-3.8 Variety-wise Area under Basmati Paddy on Sampled Farms
AREA SOWN (ha) FARM SIZE
BASMATI 1121
BASMATI 1509
BASMATI MUCHAD
OTHER BASMATI
VARIETIES TOTAL
MARGINAL 6.03 0.40 0.00 0.20 6.64
SMALL 27.64 1.21 0.51 0.81 30.17
MEDIUM 55.85 3.56 0.00 8.50 67.91
LARGE 332.46 31.26 9.31 71.53 444.56
TOTAL 421.97 36.44 9.81 81.04 549.27
PERCENTAGE OF AREA SOWN
MARGINAL 90.85 6.10 0.00 3.05 100.00
SMALL 91.62 4.02 1.68 2.68 100.00
MEDIUM 82.24 5.24 0.00 12.51 100.00
LARGE 74.78 7.03 2.09 16.09 100.00
TOTAL 76.82 6.63 1.79 14.75 100.00
Other includes Pusa-1401, PB-1, Pb-3, CSR-30, etc. varieties. Source: Ibid
Economics of Cultivation of Basmati Paddy
45
Chapter-4
Economics of Cultivation of Basmati Paddy in Haryana
Economics or profitability of various crops is the most important determinant of
production of agricultural commodities governing the behaviour of producers. In reality,
perceptions of profitability derive crop options. Farmers grow crops, which offer the
highest returns per unit of their precious resources such as land and expensive inputs.
Profitability being a catalytic factor in increasing production of agricultural
commodities, it is proposed to analyze related issues such as marketed surplus, cost
of cultivation and profitability of Pusa Basmati 1121 and Pusa Basmati 1509 grown in
kharif season on the sampled farms in Haryana during 2013-14.
In this chapter, analysis of gross and net returns from cultivation of selected
crops is based on data collected during the field survey in selected three districts of
Haryana. The discussion is confined to above mentioned two varieties of basmati
paddy in kharif season. Further, net returns from these selected varieties of Basmati
paddy are computed. The variable costs constituted human labour (hired and family),
machine labour, seed, fertilizer, plant protection, manure and irrigation. We have also
included cost on storage, transportation and marketing. The net returns for each crop
were worked out by subtracting costs from gross returns. Gross returns for these crops
were calculated on the basis of the value of the main product and by product. It may
be mentioned that net returns and profitability are used interchangeably in the
analysis.
Now, we present results of primary data on various aspects related to basmati
paddy grown on sampled farms during the year 2013-14. Specifically, empirical
findings on marketed surplus, cost of cultivation and economics of production are
discussed in the following sections.
4.1 Area, Production, Consumption and Marketed Surplus:
In the preceding chapter, we have discussed crop pattern and area under to
different varieties of basmati paddy on the sampled farms during 2013-14. The
proportion of produce available as marketed surplus for disposal in the market
depends on the level of production and retention. Normally, farmers retain a part of
output for consumption of family, seed requirement, animal feed and other purposes.
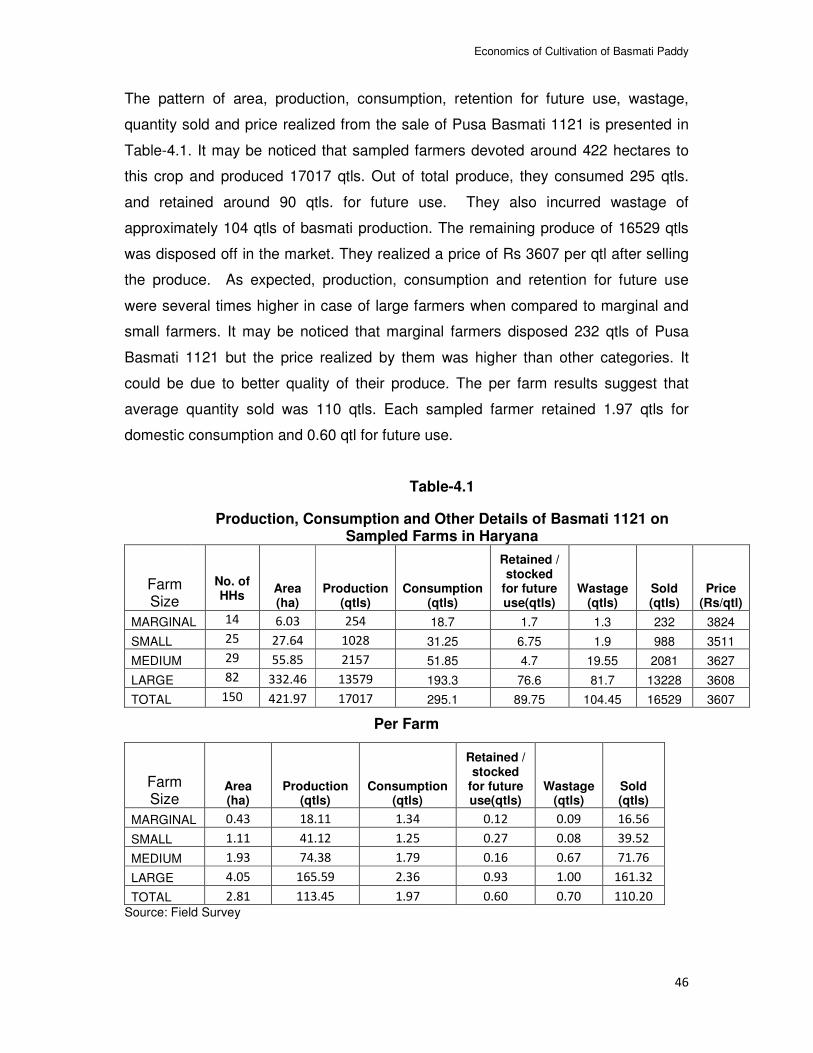
Economics of Cultivation of Basmati Paddy
46
The pattern of area, production, consumption, retention for future use, wastage,
quantity sold and price realized from the sale of Pusa Basmati 1121 is presented in
Table-4.1. It may be noticed that sampled farmers devoted around 422 hectares to
this crop and produced 17017 qtls. Out of total produce, they consumed 295 qtls.
and retained around 90 qtls. for future use. They also incurred wastage of
approximately 104 qtls of basmati production. The remaining produce of 16529 qtls
was disposed off in the market. They realized a price of Rs 3607 per qtl after selling
the produce. As expected, production, consumption and retention for future use
were several times higher in case of large farmers when compared to marginal and
small farmers. It may be noticed that marginal farmers disposed 232 qtls of Pusa
Basmati 1121 but the price realized by them was higher than other categories. It
could be due to better quality of their produce. The per farm results suggest that
average quantity sold was 110 qtls. Each sampled farmer retained 1.97 qtls for
domestic consumption and 0.60 qtl for future use.
Table-4.1
Production, Consumption and Other Details of Basmati 1121 on Sampled Farms in Haryana
Farm Size
No. of HHs
Area (ha)
Production (qtls)
Consumption (qtls)
Retained / stocked
for future use(qtls)
Wastage (qtls)
Sold (qtls)
Price (Rs/qtl)
MARGINAL 14 6.03 254 18.7 1.7 1.3 232 3824
SMALL 25 27.64 1028 31.25 6.75 1.9 988 3511
MEDIUM 29 55.85 2157 51.85 4.7 19.55 2081 3627
LARGE 82 332.46 13579 193.3 76.6 81.7 13228 3608
TOTAL 150 421.97 17017 295.1 89.75 104.45 16529 3607
Per Farm
Farm Size
Area (ha)
Production (qtls)
Consumption (qtls)
Retained / stocked
for future use(qtls)
Wastage (qtls)
Sold (qtls)
MARGINAL 0.43 18.11 1.34 0.12 0.09 16.56
SMALL 1.11 41.12 1.25 0.27 0.08 39.52
MEDIUM 1.93 74.38 1.79 0.16 0.67 71.76
LARGE 4.05 165.59 2.36 0.93 1.00 161.32
TOTAL 2.81 113.45 1.97 0.60 0.70 110.20
Source: Field Survey
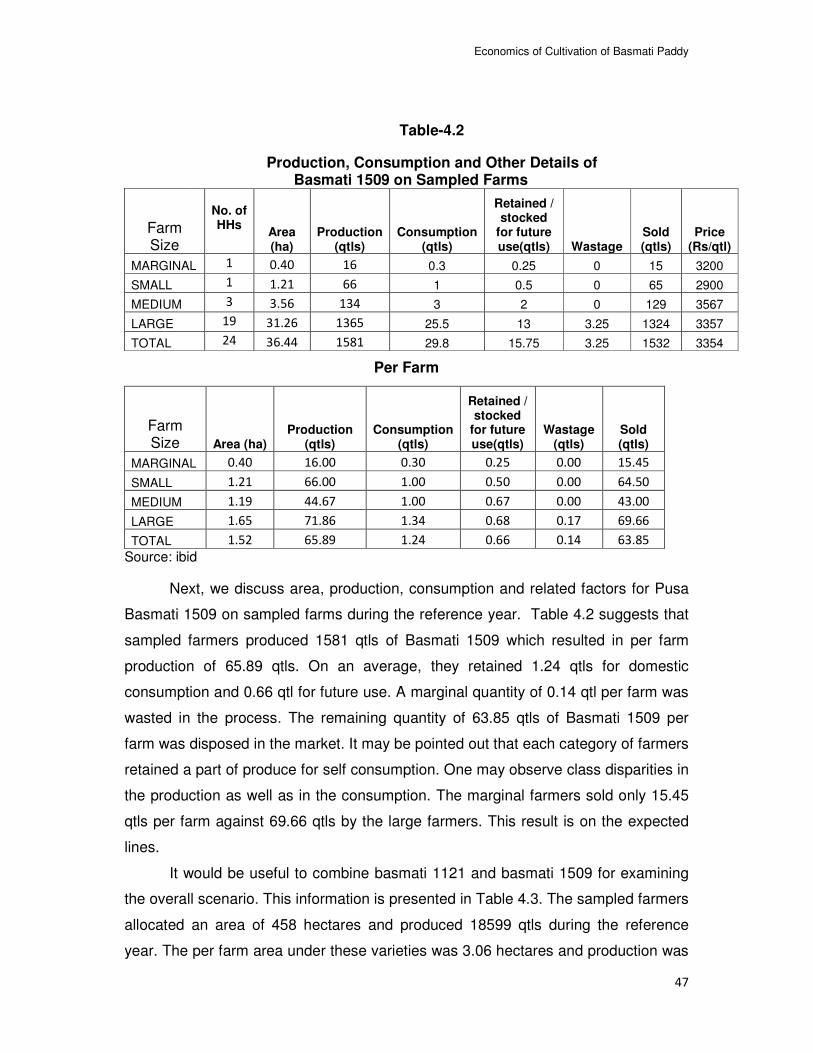
Economics of Cultivation of Basmati Paddy
47
Table-4.2
Production, Consumption and Other Details of Basmati 1509 on Sampled Farms
Farm Size
No. of HHs
Area (ha)
Production (qtls)
Consumption (qtls)
Retained / stocked
for future use(qtls) Wastage
Sold (qtls)
Price (Rs/qtl)
MARGINAL 1 0.40 16 0.3 0.25 0 15 3200
SMALL 1 1.21 66 1 0.5 0 65 2900
MEDIUM 3 3.56 134 3 2 0 129 3567
LARGE 19 31.26 1365 25.5 13 3.25 1324 3357
TOTAL 24 36.44 1581 29.8 15.75 3.25 1532 3354
Per Farm
Farm Size Area (ha)
Production (qtls)
Consumption (qtls)
Retained / stocked
for future use(qtls)
Wastage (qtls)
Sold (qtls)
MARGINAL 0.40 16.00 0.30 0.25 0.00 15.45
SMALL 1.21 66.00 1.00 0.50 0.00 64.50
MEDIUM 1.19 44.67 1.00 0.67 0.00 43.00
LARGE 1.65 71.86 1.34 0.68 0.17 69.66
TOTAL 1.52 65.89 1.24 0.66 0.14 63.85
Source: ibid
Next, we discuss area, production, consumption and related factors for Pusa
Basmati 1509 on sampled farms during the reference year. Table 4.2 suggests that
sampled farmers produced 1581 qtls of Basmati 1509 which resulted in per farm
production of 65.89 qtls. On an average, they retained 1.24 qtls for domestic
consumption and 0.66 qtl for future use. A marginal quantity of 0.14 qtl per farm was
wasted in the process. The remaining quantity of 63.85 qtls of Basmati 1509 per
farm was disposed in the market. It may be pointed out that each category of farmers
retained a part of produce for self consumption. One may observe class disparities in
the production as well as in the consumption. The marginal farmers sold only 15.45
qtls per farm against 69.66 qtls by the large farmers. This result is on the expected
lines.
It would be useful to combine basmati 1121 and basmati 1509 for examining
the overall scenario. This information is presented in Table 4.3. The sampled farmers
allocated an area of 458 hectares and produced 18599 qtls during the reference
year. The per farm area under these varieties was 3.06 hectares and production was
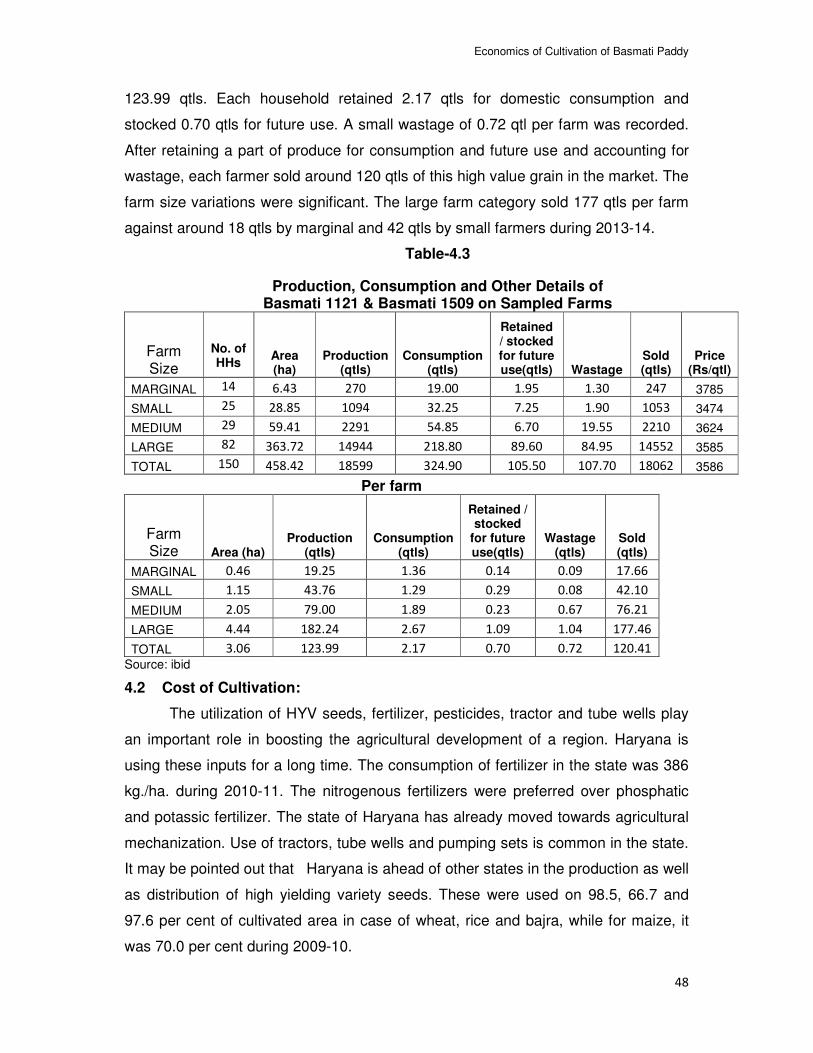
Economics of Cultivation of Basmati Paddy
48
123.99 qtls. Each household retained 2.17 qtls for domestic consumption and
stocked 0.70 qtls for future use. A small wastage of 0.72 qtl per farm was recorded.
After retaining a part of produce for consumption and future use and accounting for
wastage, each farmer sold around 120 qtls of this high value grain in the market. The
farm size variations were significant. The large farm category sold 177 qtls per farm
against around 18 qtls by marginal and 42 qtls by small farmers during 2013-14.
Table-4.3
Production, Consumption and Other Details of Basmati 1121 & Basmati 1509 on Sampled Farms
Farm Size
No. of HHs
Area (ha)
Production (qtls)
Consumption (qtls)
Retained / stocked for future use(qtls) Wastage
Sold (qtls)
Price (Rs/qtl)
MARGINAL 14 6.43 270 19.00 1.95 1.30 247 3785
SMALL 25 28.85 1094 32.25 7.25 1.90 1053 3474
MEDIUM 29 59.41 2291 54.85 6.70 19.55 2210 3624
LARGE 82 363.72 14944 218.80 89.60 84.95 14552 3585
TOTAL 150 458.42 18599 324.90 105.50 107.70 18062 3586
Per farm
Farm Size Area (ha)
Production (qtls)
Consumption (qtls)
Retained / stocked
for future use(qtls)
Wastage (qtls)
Sold (qtls)
MARGINAL 0.46 19.25 1.36 0.14 0.09 17.66
SMALL 1.15 43.76 1.29 0.29 0.08 42.10
MEDIUM 2.05 79.00 1.89 0.23 0.67 76.21
LARGE 4.44 182.24 2.67 1.09 1.04 177.46
TOTAL 3.06 123.99 2.17 0.70 0.72 120.41
Source: ibid
4.2 Cost of Cultivation:
The utilization of HYV seeds, fertilizer, pesticides, tractor and tube wells play
an important role in boosting the agricultural development of a region. Haryana is
using these inputs for a long time. The consumption of fertilizer in the state was 386
kg./ha. during 2010-11. The nitrogenous fertilizers were preferred over phosphatic
and potassic fertilizer. The state of Haryana has already moved towards agricultural
mechanization. Use of tractors, tube wells and pumping sets is common in the state.
It may be pointed out that Haryana is ahead of other states in the production as well
as distribution of high yielding variety seeds. These were used on 98.5, 66.7 and
97.6 per cent of cultivated area in case of wheat, rice and bajra, while for maize, it
was 70.0 per cent during 2009-10.
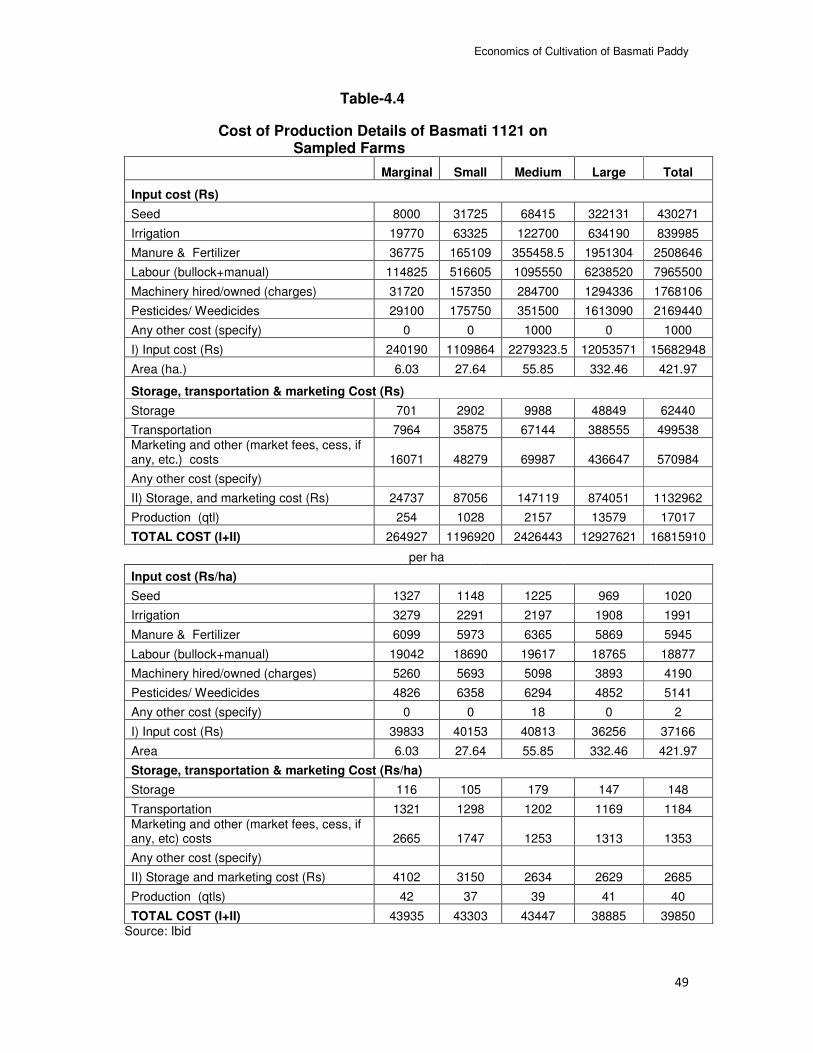
Economics of Cultivation of Basmati Paddy
49
Table-4.4
Cost of Production Details of Basmati 1121 on Sampled Farms
Marginal Small Medium Large Total
Input cost (Rs)
Seed 8000 31725 68415 322131 430271
Irrigation 19770 63325 122700 634190 839985
Manure & Fertilizer 36775 165109 355458.5 1951304 2508646
Labour (bullock+manual) 114825 516605 1095550 6238520 7965500
Machinery hired/owned (charges) 31720 157350 284700 1294336 1768106
Pesticides/ Weedicides 29100 175750 351500 1613090 2169440
Any other cost (specify) 0 0 1000 0 1000
I) Input cost (Rs) 240190 1109864 2279323.5 12053571 15682948
Area (ha.) 6.03 27.64 55.85 332.46 421.97
Storage, transportation & marketing Cost (Rs)
Storage 701 2902 9988 48849 62440
Transportation 7964 35875 67144 388555 499538
Marketing and other (market fees, cess, if any, etc.) costs 16071 48279 69987 436647 570984
Any other cost (specify)
II) Storage, and marketing cost (Rs) 24737 87056 147119 874051 1132962
Production (qtl) 254 1028 2157 13579 17017
TOTAL COST (I+II) 264927 1196920 2426443 12927621 16815910
per ha
Input cost (Rs/ha)
Seed 1327 1148 1225 969 1020
Irrigation 3279 2291 2197 1908 1991
Manure & Fertilizer 6099 5973 6365 5869 5945
Labour (bullock+manual) 19042 18690 19617 18765 18877
Machinery hired/owned (charges) 5260 5693 5098 3893 4190
Pesticides/ Weedicides 4826 6358 6294 4852 5141
Any other cost (specify) 0 0 18 0 2
I) Input cost (Rs) 39833 40153 40813 36256 37166
Area 6.03 27.64 55.85 332.46 421.97
Storage, transportation & marketing Cost (Rs/ha)
Storage 116 105 179 147 148
Transportation 1321 1298 1202 1169 1184
Marketing and other (market fees, cess, if any, etc) costs 2665 1747 1253 1313 1353
Any other cost (specify)
II) Storage and marketing cost (Rs) 4102 3150 2634 2629 2685
Production (qtls) 42 37 39 41 40
TOTAL COST (I+II) 43935 43303 43447 38885 39850
Source: Ibid
Economics of Cultivation of Basmati Paddy
50
We begin with paddy which is the most important among kharif crops in
Haryana. It is also one of the key crops grown world over and central to the lives of
billions of people in the world. Around 9 per cent of arable land of the world is
devoted to this single crop. Asia accounts for over 90 per cent of the world’s
production with India, China and Indonesia as the major producers. However, a
small proportion of production is traded in the world market. India is one of the major
exporters of rice in the world. It can be grown under diverse conditions but requires a
lot of irrigation. The varieties of rice are short, medium or long grain, aromatic, waxy
(sticky) or non-waxy.
With this brief introduction, we analyze cost of cultivation of basmati paddy
1121 and basmati 1509 during the reference year. As a part of cost, we have also
included storage, transportation and marketing cess, etc.
We have provided details of cost of cultivation of basmati-1121 in Table- 4.4
.The per hectare cost of the basmati 1121 cultivation was Rs 39850 at the aggregate
level. Evidently, maximum proportion of cost was incurred on human labour followed
by fertilizer including manure and pesticides. These items constituted 47.37, 14.91
and 12.90 per cent of total cost of cultivation of basmati-1121. The share of these
items in total cost was more than 75 per cent. In the array, expenditure on irrigation
was the next item of the cost and constituted approximately 5 per cent of total cost.
The sampled farmers also incurred Rs 148 and Rs 1184 per hectare as a cost
of storage and transportation. Food grains including paddy are bulky in nature and
require higher space both in storage and transportation. This causes relatively higher
cost of storage and transportation per unit of produce. Often, higher cost of
transportation restricts the movement from surplus to deficit areas. This also results
in lower price of the produce in growing states and higher price in the deficit states.
Owing to these reasons, marginal and small farmers sell their produce immediately
after the harvest and realize low price due to higher supply in the harvesting months.
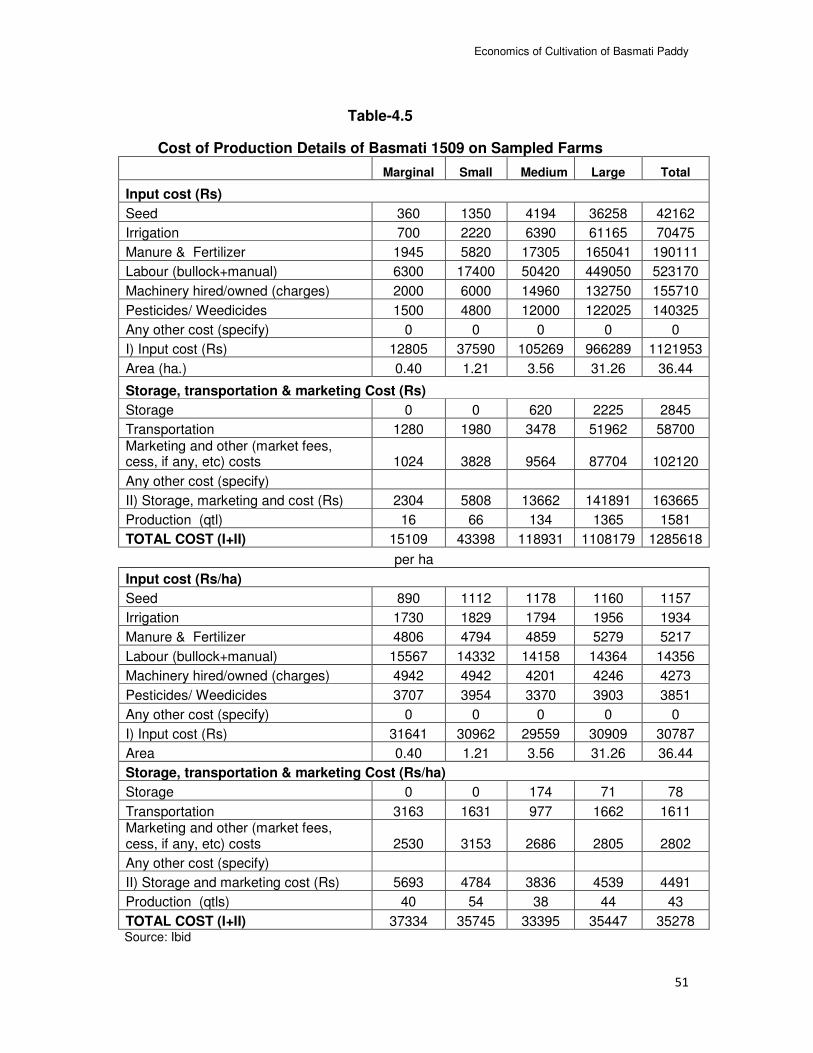
Economics of Cultivation of Basmati Paddy
51
Table-4.5
Cost of Production Details of Basmati 1509 on Sampled Farms
Marginal Small Medium Large Total
Input cost (Rs)
Seed 360 1350 4194 36258 42162
Irrigation 700 2220 6390 61165 70475
Manure & Fertilizer 1945 5820 17305 165041 190111
Labour (bullock+manual) 6300 17400 50420 449050 523170
Machinery hired/owned (charges) 2000 6000 14960 132750 155710
Pesticides/ Weedicides 1500 4800 12000 122025 140325
Any other cost (specify) 0 0 0 0 0
I) Input cost (Rs) 12805 37590 105269 966289 1121953
Area (ha.) 0.40 1.21 3.56 31.26 36.44
Storage, transportation & marketing Cost (Rs)
Storage 0 0 620 2225 2845
Transportation 1280 1980 3478 51962 58700
Marketing and other (market fees, cess, if any, etc) costs 1024 3828 9564 87704 102120
Any other cost (specify)
II) Storage, marketing and cost (Rs) 2304 5808 13662 141891 163665
Production (qtl) 16 66 134 1365 1581
TOTAL COST (I+II) 15109 43398 118931 1108179 1285618
per ha
Input cost (Rs/ha)
Seed 890 1112 1178 1160 1157
Irrigation 1730 1829 1794 1956 1934
Manure & Fertilizer 4806 4794 4859 5279 5217
Labour (bullock+manual) 15567 14332 14158 14364 14356
Machinery hired/owned (charges) 4942 4942 4201 4246 4273
Pesticides/ Weedicides 3707 3954 3370 3903 3851
Any other cost (specify) 0 0 0 0 0
I) Input cost (Rs) 31641 30962 29559 30909 30787
Area 0.40 1.21 3.56 31.26 36.44
Storage, transportation & marketing Cost (Rs/ha)
Storage 0 0 174 71 78
Transportation 3163 1631 977 1662 1611 Marketing and other (market fees, cess, if any, etc) costs 2530 3153 2686 2805 2802
Any other cost (specify)
II) Storage and marketing cost (Rs) 5693 4784 3836 4539 4491
Production (qtls) 40 54 38 44 43
TOTAL COST (I+II) 37334 35745 33395 35447 35278 Source: Ibid
Economics of Cultivation of Basmati Paddy
52
The surveyed farmers spent Rs 2685 per hectare on storage, transportation
and marketing cost. It may be noticed that cost of cultivation of Basmati 1121 varied
across the farm sizes. In case of human labour, small farmers incurred lower cost in
comparison to other categories. Surprisingly, cost of human labour per hectare on
marginal farms was higher than the large farms. Also, cost of cultivation of basmati
paddy 1121 could be observed maximum on marginal farms. It was largely due to
higher expenditure on irrigation and some other items.
The information related to expenditure incurred by the growers of Pusa
Basmati 1509 on various inputs used by them and associated cost in terms of
storage, transportation and marketing cost is presented in Table 4.5. Clearly, cost of
cultivation of this variety on sampled farms at the aggregate level was Rs. 35278per
hectare during the reference year. It may be observed that cost of cultivation of
Basmati 1509 was lower in comparison to Basmati 1121. Like Basmati 1121,
marginal farmers incurred higher cost per hectare in comparison to other categories.
The expenditure on human labour was the highest irrespective of farm category. In
case of marginal farmers, around 42 percent of the cost was spent on this item
alone. Other categories of farmers also incurred around 40 per cent of total cost on
human labour. The high cost of human labour was due to shortage which resulted in
higher wages in turn increasing the cost on this item. Further, cost of fertilizer and
machinery were other major items which constituted sizeable proportion of the total
cost. None of the farm categories spent less than Rs. 4000 per hectare on these
items. We could not find a clear cut advantage of family labour on marginal and
small farms. The expenditure on pesticides and weedicides ranged between Rs
3370 and Rs 3954 per hectare. All these input items constituted around 87 per cent
of total cost of cultivation at the overall level. The remaining 13 per cent of cost was
incurred on storage, transport and marketing.
The combined results of basmati 1121 and 1509 on cost of cultivation are
presented in Table 4.6. The per hectare cost of cultivation was Rs 39485 at the
aggregate level during the reference year. Like separate results of basmati 1121 and
basmati 1509, marginal farmers incurred higher cost in comparison to other
categories of farmers. Among the included items, human labour, fertilizer
and pesticides constituted 46.90, 14.91 and 12.76 per cent of the total cost.
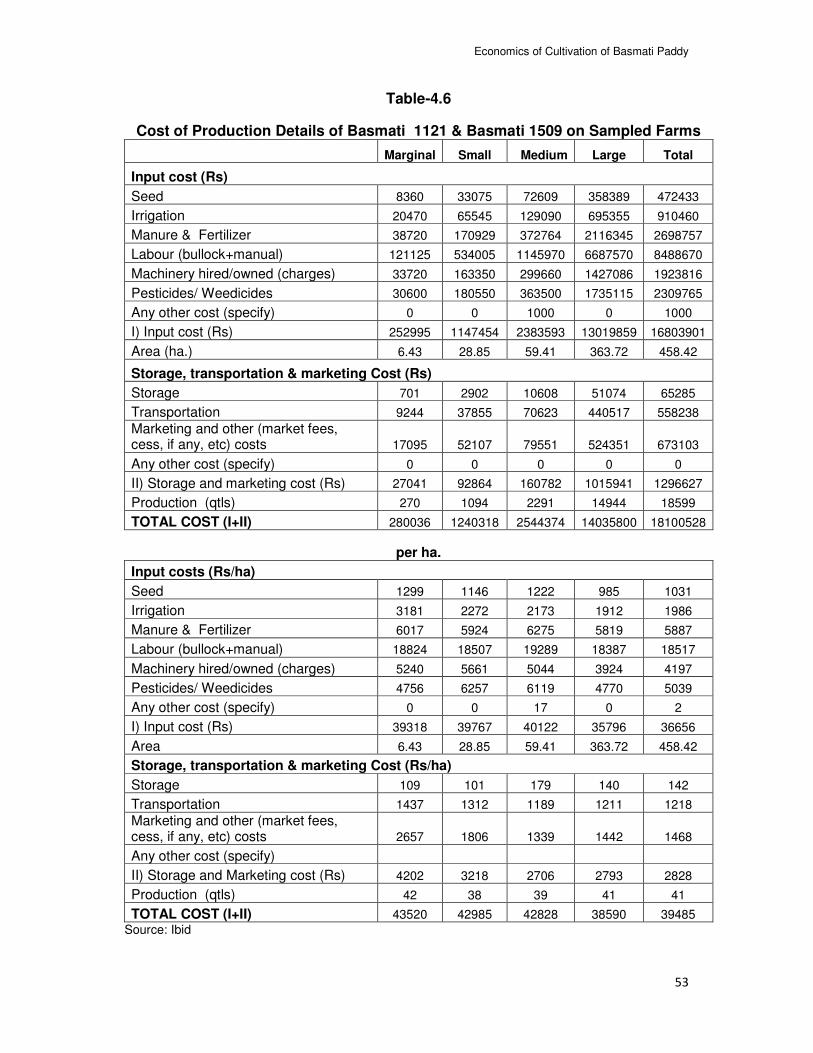
Economics of Cultivation of Basmati Paddy
53
Table-4.6
Cost of Production Details of Basmati 1121 & Basmati 1509 on Sampled Farms
Marginal Small Medium Large Total
Input cost (Rs)
Seed 8360 33075 72609 358389 472433
Irrigation 20470 65545 129090 695355 910460
Manure & Fertilizer 38720 170929 372764 2116345 2698757
Labour (bullock+manual) 121125 534005 1145970 6687570 8488670
Machinery hired/owned (charges) 33720 163350 299660 1427086 1923816
Pesticides/ Weedicides 30600 180550 363500 1735115 2309765
Any other cost (specify) 0 0 1000 0 1000
I) Input cost (Rs) 252995 1147454 2383593 13019859 16803901
Area (ha.) 6.43 28.85 59.41 363.72 458.42
Storage, transportation & marketing Cost (Rs)
Storage 701 2902 10608 51074 65285
Transportation 9244 37855 70623 440517 558238
Marketing and other (market fees, cess, if any, etc) costs 17095 52107 79551 524351 673103
Any other cost (specify) 0 0 0 0 0
II) Storage and marketing cost (Rs) 27041 92864 160782 1015941 1296627
Production (qtls) 270 1094 2291 14944 18599
TOTAL COST (I+II) 280036 1240318 2544374 14035800 18100528
per ha.
Input costs (Rs/ha)
Seed 1299 1146 1222 985 1031
Irrigation 3181 2272 2173 1912 1986
Manure & Fertilizer 6017 5924 6275 5819 5887
Labour (bullock+manual) 18824 18507 19289 18387 18517
Machinery hired/owned (charges) 5240 5661 5044 3924 4197
Pesticides/ Weedicides 4756 6257 6119 4770 5039
Any other cost (specify) 0 0 17 0 2
I) Input cost (Rs) 39318 39767 40122 35796 36656
Area 6.43 28.85 59.41 363.72 458.42
Storage, transportation & marketing Cost (Rs/ha)
Storage 109 101 179 140 142
Transportation 1437 1312 1189 1211 1218
Marketing and other (market fees, cess, if any, etc) costs 2657 1806 1339 1442 1468
Any other cost (specify)
II) Storage and Marketing cost (Rs) 4202 3218 2706 2793 2828
Production (qtls) 42 38 39 41 41
TOTAL COST (I+II) 43520 42985 42828 38590 39485
Source: Ibid
Economics of Cultivation of Basmati Paddy
54
Thus, these three items alone formed around 75 per cent of cost. The next item was
machinery with an expenditure of Rs 4197 (10.63%). The expenditure on these four
items across farm size ranged between Rs 4197 and Rs 19289. The cost of human
labour was high due to shortage and escalating wages. In addition to cost of inputs,
sampled farmers spent on storage, transportation and marketing. All these
associated costs together formed around 7 per cent of the total cost. Farm size
variations are a common phenomenon in the expenditure incurred by the sampled
farmers on various items in cultivation of basmati paddy. Surprisingly, cost of several
items on marginal and small farms was higher than the overall level.
4.3 Economics of Basmati Paddy Cultivation:
Having analysed cost of Basmati 1121 and Basmati 1509 cultivation, we now
discuss economics of cultivation on the sampled farms during the reference year.
Table 4.7 presents area, production, prices realized by the producers, gross returns,
total cost, net returns per hectare and per qtl and per farm value of marketed surplus
of Basmati 1121. One may notice from Table 4.7 that per hectare yield of basmati
1121 on sampled farms was 40 qtls. Clearly, marginal farmers grew higher quantity
per unit of land in comparison to other categories. The sampled farmers realized a
price of Rs 3607 per qtl during 2013-14. Evidently, marginal farmers received higher
price in comparison to other categories of the farmers. The gross and net returns per
hectare from cultivation of basmati 1121 were Rs 148754 and Rs.108903
respectively. Like per unit price, marginal farmers reaped higher gross and net
returns per hectare. Further, wide variations may be noticed in the gross returns and
net returns per qtl from cultivation of basmati 1121 during 2013-14. Obviously,
marginal farmers emerged greater beneficiaries than other categories of surveyed
farmers. The value of marketed surplus disposed off by the farmers was Rs 397672
per farm during the reference year. Since, production of large farmers was higher
than other categories; their marketed surplus was also recorded maximum. As
expected, large group followed by medium farmers indicated higher marketed
surplus in comparison to small and marginal farmers who allocated low area to
basmati 1121 due to tiny pieces of their land holdings. This implies that marketed
surplus of basmati 1121 is primarily concentrated in the hands of large land owning
class who constitute low proportion in number.
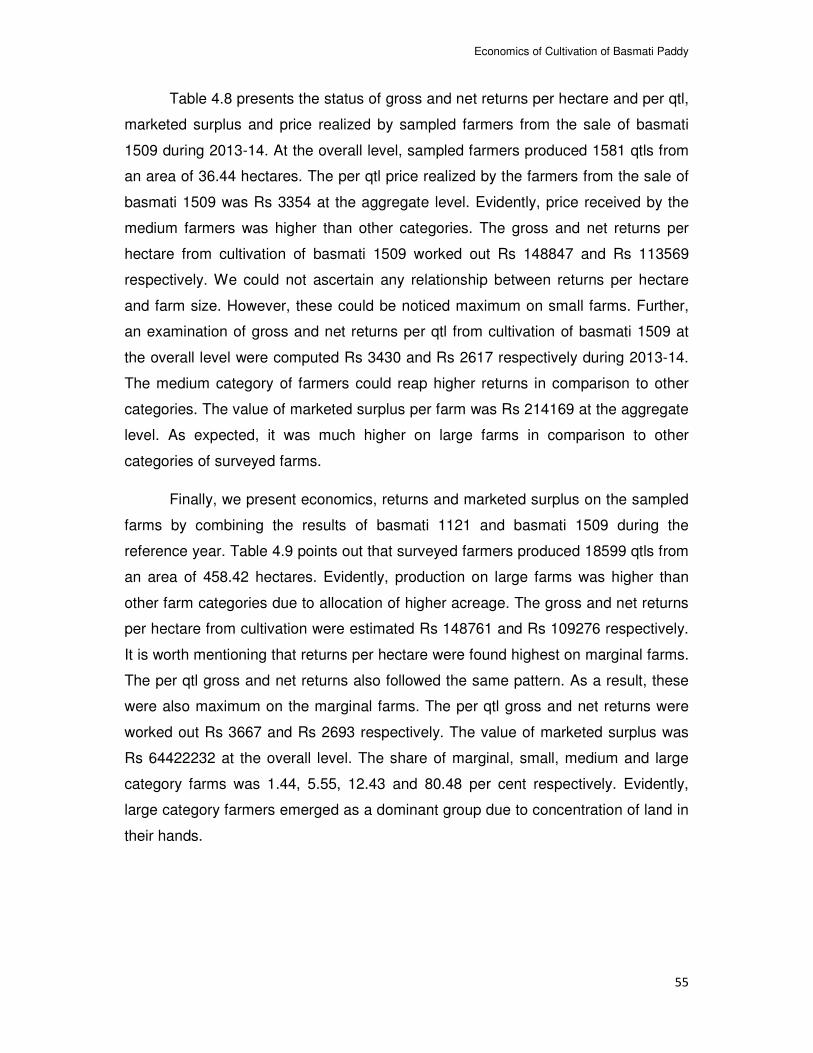
Economics of Cultivation of Basmati Paddy
55
Table 4.8 presents the status of gross and net returns per hectare and per qtl,
marketed surplus and price realized by sampled farmers from the sale of basmati
1509 during 2013-14. At the overall level, sampled farmers produced 1581 qtls from
an area of 36.44 hectares. The per qtl price realized by the farmers from the sale of
basmati 1509 was Rs 3354 at the aggregate level. Evidently, price received by the
medium farmers was higher than other categories. The gross and net returns per
hectare from cultivation of basmati 1509 worked out Rs 148847 and Rs 113569
respectively. We could not ascertain any relationship between returns per hectare
and farm size. However, these could be noticed maximum on small farms. Further,
an examination of gross and net returns per qtl from cultivation of basmati 1509 at
the overall level were computed Rs 3430 and Rs 2617 respectively during 2013-14.
The medium category of farmers could reap higher returns in comparison to other
categories. The value of marketed surplus per farm was Rs 214169 at the aggregate
level. As expected, it was much higher on large farms in comparison to other
categories of surveyed farms.
Finally, we present economics, returns and marketed surplus on the sampled
farms by combining the results of basmati 1121 and basmati 1509 during the
reference year. Table 4.9 points out that surveyed farmers produced 18599 qtls from
an area of 458.42 hectares. Evidently, production on large farms was higher than
other farm categories due to allocation of higher acreage. The gross and net returns
per hectare from cultivation were estimated Rs 148761 and Rs 109276 respectively.
It is worth mentioning that returns per hectare were found highest on marginal farms.
The per qtl gross and net returns also followed the same pattern. As a result, these
were also maximum on the marginal farms. The per qtl gross and net returns were
worked out Rs 3667 and Rs 2693 respectively. The value of marketed surplus was
Rs 64422232 at the overall level. The share of marginal, small, medium and large
category farms was 1.44, 5.55, 12.43 and 80.48 per cent respectively. Evidently,
large category farmers emerged as a dominant group due to concentration of land in
their hands.
Economics of Cultivation of Basmati Paddy
56
Table-4.7
PROFITABILITY OF Basmati 1121, 1509 and Basmati 1121+1509 On Sampled Farms
Farm Size
Area (ha)
Production (qtl)
Price received on sale
(Rs)
GROSS RETURN
S (Rs)
TOTAL COSTS
(Rs)
NET RETURNS
(Rs)
GROSS RETURNS PER HA
(Rs)
NET RETURNS PER HA
(Rs)
GROSS RETURNS PER QTL
(Rs)
NET RETURNS PER QTL
(Rs)
VALUE OF MARKETED SURPLUS
(Rs)
VALUE OF MARKETED SURPLUS Rs./Farm
Basmati 1121
MARGINAL 6.03 254 3824 989919 264927 724992 164167 120232 3905 2860 886347 63310
SMALL 27.64 1028 3511 3714250 1196920 2517330 134376 91074 3613 2449 3468905 138756
MEDIUM 55.85 2157 3627 8007002 2426443 5580559 143372 99924 3712 2587 7540879 260030
LARGE 332.46 13579 3608 50059191 12927621 37131569 150574 111689 3687 2735 47754688 582374
TOTAL 421.97 17017 3607 62770361 16815910 45954451 148754 108903 3689 2700 59650818 397672
Basmati 1509
MARGINAL 0.40 16 3200 52480 15109 37371 129678 92344 3280 2336 49440 49440
SMALL 1.21 66 2900 196680 43398 153282 161999 126253 2980 2322 187050 187050
MEDIUM 3.56 134 3567 486920 118931 367989 136725 103330 3634 2746 458400 152800
LARGE 31.26 1365 3357 4688295 1108179 3580116 149965 114517 3434 2622 4445170 233956
TOTAL 36.44 1581 3354 5424375 1285618 4138757 148847 113569 3430 2617 5140060 214169
Basmati 1121 + 1509
MARGINAL 6.43 270 3749 1042399 280036 762363 161998 118478 3868 2829 926937
SMALL 28.85 1094 3402 3910930 1240318 2670612 135539 92554 3575 2441 3580980
MEDIUM 59.41 2291 3625 8493922 2544374 5949548 142973 100145 3708 2597 8011238
LARGE 363.72 14944 3563 54747486 14035800 40711685 150521 111932 3664 2724 51851075
TOTAL 458.42 18599 3567 68194736 18100528 50094208 148761 109276 3667 2693 64422232
Source: ibid
Marketing of Basmati Produce
57
Chapter-5
Marketing of Basmati Produce
Introduction:
During the 1960s and 1970’s, India’s agricultural policy was framed with the
objective of attaining food security and price stability. These policies were based on
controls on marketing, pricing, storage, transport, and quantitative restrictions on
trade. As a result of public investment in the agricultural sector, spurred by “The
Green Revolution” of the 1960s, agriculture grew by over 4 percent per annum in the
1970s and 1980s. This rate, however, was not sustainable. A slowdown in public
investment, low yield growth and environmental problems including declining water
table led to lower agricultural performance in the 1990s. During this period, domestic
economic reforms and the WTO Agreement on agriculture constituted two important
policy changes. The impact of the economic reforms was indirect by raising per
capita income which led to change in food consumption pattern. The WTO
Agreement brought some tariff reforms through liberalizing agricultural trade through
removal of quantitative restrictions on imports. India’s focus on liberalizing
agricultural trade is partially set out in the Tenth Five Year Plan (2002-07). The
strategy to raise agricultural output included increasing crop intensity, adoption of
modern technology to increase productivity and diversification of cropping pattern.
India has an Agricultural Produce Market Regulation Act (APMRA) in which
every regulated market has a market committee where farmers, traders, commission
agents, local bodies and the state government are represented. Prices are fixed
through an open auction in a transparent manner in front of an official of the auction
committee. The main criticism of regulated markets is that they do not reduce the
long chain of intermediaries between the farmer and the consumer, which adds to
the cost of agricultural commodities for consumers on the one hand and decreases
returns for farmers on the other.
5.1 Status of Regulated Markets in Haryana:
The Royal Commission on Agriculture (1928) pointed out that there was no
common yardstick to measure the quality of produce, the weights and measures
were un-standardized and the private market operators exploited the farmers. It
recommended enactment of market legislation to curb rampant malpractices and
realize better returns. In that context, Haryana state being a part of undivided Punjab
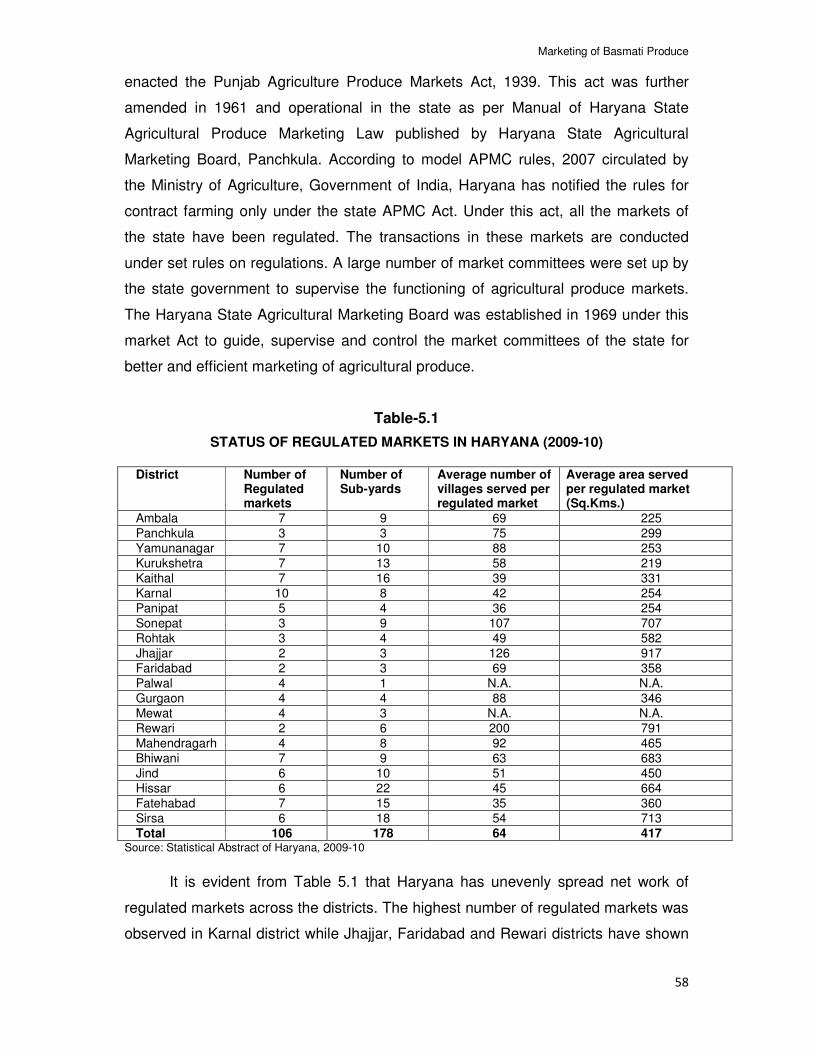
Marketing of Basmati Produce
58
enacted the Punjab Agriculture Produce Markets Act, 1939. This act was further
amended in 1961 and operational in the state as per Manual of Haryana State
Agricultural Produce Marketing Law published by Haryana State Agricultural
Marketing Board, Panchkula. According to model APMC rules, 2007 circulated by
the Ministry of Agriculture, Government of India, Haryana has notified the rules for
contract farming only under the state APMC Act. Under this act, all the markets of
the state have been regulated. The transactions in these markets are conducted
under set rules on regulations. A large number of market committees were set up by
the state government to supervise the functioning of agricultural produce markets.
The Haryana State Agricultural Marketing Board was established in 1969 under this
market Act to guide, supervise and control the market committees of the state for
better and efficient marketing of agricultural produce.
Table-5.1
STATUS OF REGULATED MARKETS IN HARYANA (2009-10)
District Number of Regulated markets
Number of Sub-yards
Average number of villages served per regulated market
Average area served per regulated market (Sq.Kms.)
Ambala 7 9 69 225
Panchkula 3 3 75 299
Yamunanagar 7 10 88 253
Kurukshetra 7 13 58 219
Kaithal 7 16 39 331
Karnal 10 8 42 254
Panipat 5 4 36 254
Sonepat 3 9 107 707
Rohtak 3 4 49 582
Jhajjar 2 3 126 917
Faridabad 2 3 69 358
Palwal 4 1 N.A. N.A.
Gurgaon 4 4 88 346
Mewat 4 3 N.A. N.A.
Rewari 2 6 200 791
Mahendragarh 4 8 92 465
Bhiwani 7 9 63 683
Jind 6 10 51 450
Hissar 6 22 45 664
Fatehabad 7 15 35 360
Sirsa 6 18 54 713
Total 106 178 64 417 Source: Statistical Abstract of Haryana, 2009-10
It is evident from Table 5.1 that Haryana has unevenly spread net work of
regulated markets across the districts. The highest number of regulated markets was
observed in Karnal district while Jhajjar, Faridabad and Rewari districts have shown
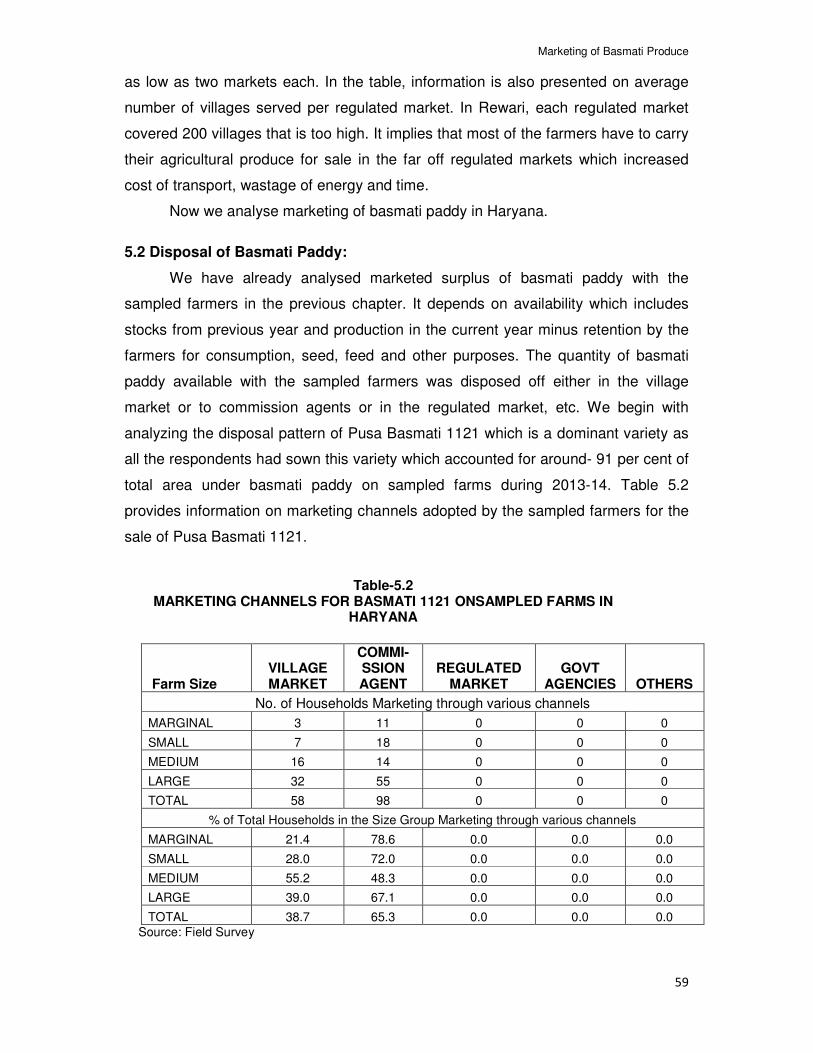
Marketing of Basmati Produce
59
as low as two markets each. In the table, information is also presented on average
number of villages served per regulated market. In Rewari, each regulated market
covered 200 villages that is too high. It implies that most of the farmers have to carry
their agricultural produce for sale in the far off regulated markets which increased
cost of transport, wastage of energy and time.
Now we analyse marketing of basmati paddy in Haryana.
5.2 Disposal of Basmati Paddy:
We have already analysed marketed surplus of basmati paddy with the
sampled farmers in the previous chapter. It depends on availability which includes
stocks from previous year and production in the current year minus retention by the
farmers for consumption, seed, feed and other purposes. The quantity of basmati
paddy available with the sampled farmers was disposed off either in the village
market or to commission agents or in the regulated market, etc. We begin with
analyzing the disposal pattern of Pusa Basmati 1121 which is a dominant variety as
all the respondents had sown this variety which accounted for around- 91 per cent of
total area under basmati paddy on sampled farms during 2013-14. Table 5.2
provides information on marketing channels adopted by the sampled farmers for the
sale of Pusa Basmati 1121.
Table-5.2 MARKETING CHANNELS FOR BASMATI 1121 ONSAMPLED FARMS IN
HARYANA
Farm Size VILLAGE MARKET
COMMI-SSION AGENT
REGULATED MARKET
GOVT AGENCIES OTHERS
No. of Households Marketing through various channels
MARGINAL 3 11 0 0 0
SMALL 7 18 0 0 0
MEDIUM 16 14 0 0 0
LARGE 32 55 0 0 0
TOTAL 58 98 0 0 0
% of Total Households in the Size Group Marketing through various channels
MARGINAL 21.4 78.6 0.0 0.0 0.0
SMALL 28.0 72.0 0.0 0.0 0.0
MEDIUM 55.2 48.3 0.0 0.0 0.0
LARGE 39.0 67.1 0.0 0.0 0.0
TOTAL 38.7 65.3 0.0 0.0 0.0
Source: Field Survey
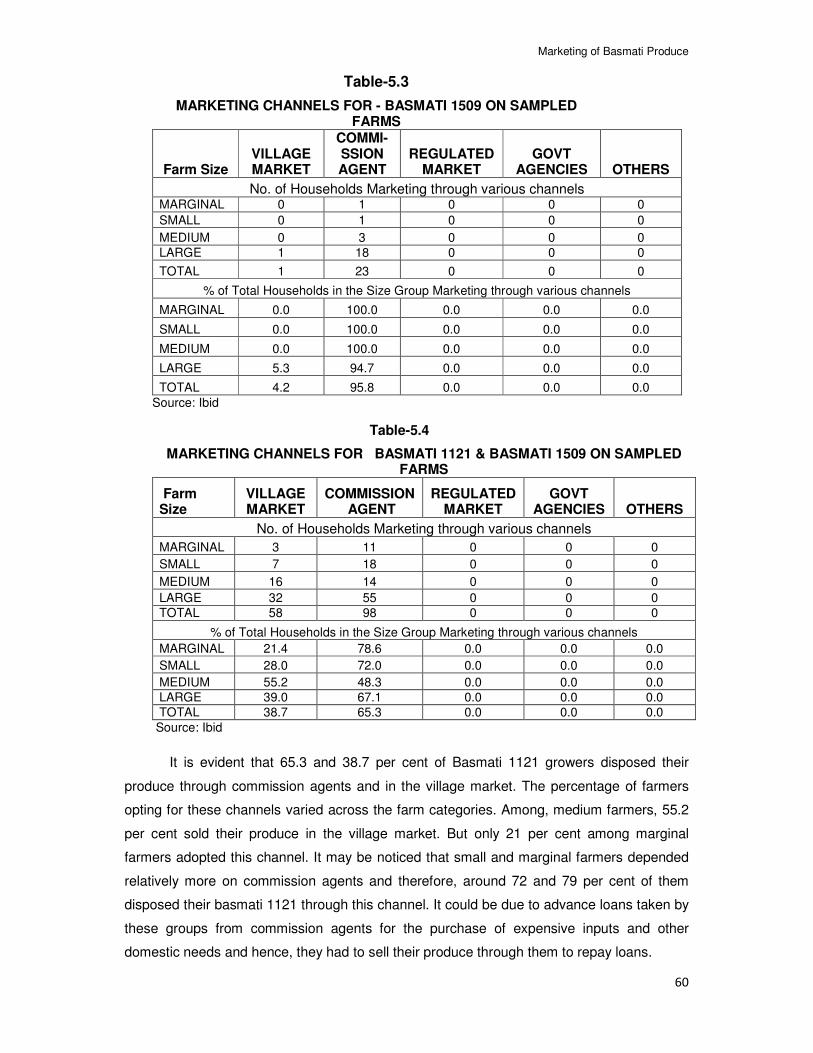
Marketing of Basmati Produce
60
Table-5.3
MARKETING CHANNELS FOR - BASMATI 1509 ON SAMPLED FARMS
Farm Size VILLAGE MARKET
COMMI- SSION AGENT
REGULATED MARKET
GOVT AGENCIES OTHERS
No. of Households Marketing through various channels MARGINAL 0 1 0 0 0
SMALL 0 1 0 0 0
MEDIUM 0 3 0 0 0
LARGE 1 18 0 0 0
TOTAL 1 23 0 0 0
% of Total Households in the Size Group Marketing through various channels
MARGINAL 0.0 100.0 0.0 0.0 0.0
SMALL 0.0 100.0 0.0 0.0 0.0
MEDIUM 0.0 100.0 0.0 0.0 0.0
LARGE 5.3 94.7 0.0 0.0 0.0
TOTAL 4.2 95.8 0.0 0.0 0.0
Source: Ibid
Table-5.4
MARKETING CHANNELS FOR BASMATI 1121 & BASMATI 1509 ON SAMPLED FARMS
Farm Size
VILLAGE MARKET
COMMISSION AGENT
REGULATED MARKET
GOVT AGENCIES OTHERS
No. of Households Marketing through various channels
MARGINAL 3 11 0 0 0
SMALL 7 18 0 0 0
MEDIUM 16 14 0 0 0
LARGE 32 55 0 0 0
TOTAL 58 98 0 0 0
% of Total Households in the Size Group Marketing through various channels
MARGINAL 21.4 78.6 0.0 0.0 0.0
SMALL 28.0 72.0 0.0 0.0 0.0
MEDIUM 55.2 48.3 0.0 0.0 0.0
LARGE 39.0 67.1 0.0 0.0 0.0
TOTAL 38.7 65.3 0.0 0.0 0.0
Source: Ibid
It is evident that 65.3 and 38.7 per cent of Basmati 1121 growers disposed their
produce through commission agents and in the village market. The percentage of farmers
opting for these channels varied across the farm categories. Among, medium farmers, 55.2
per cent sold their produce in the village market. But only 21 per cent among marginal
farmers adopted this channel. It may be noticed that small and marginal farmers depended
relatively more on commission agents and therefore, around 72 and 79 per cent of them
disposed their basmati 1121 through this channel. It could be due to advance loans taken by
these groups from commission agents for the purchase of expensive inputs and other
domestic needs and hence, they had to sell their produce through them to repay loans.
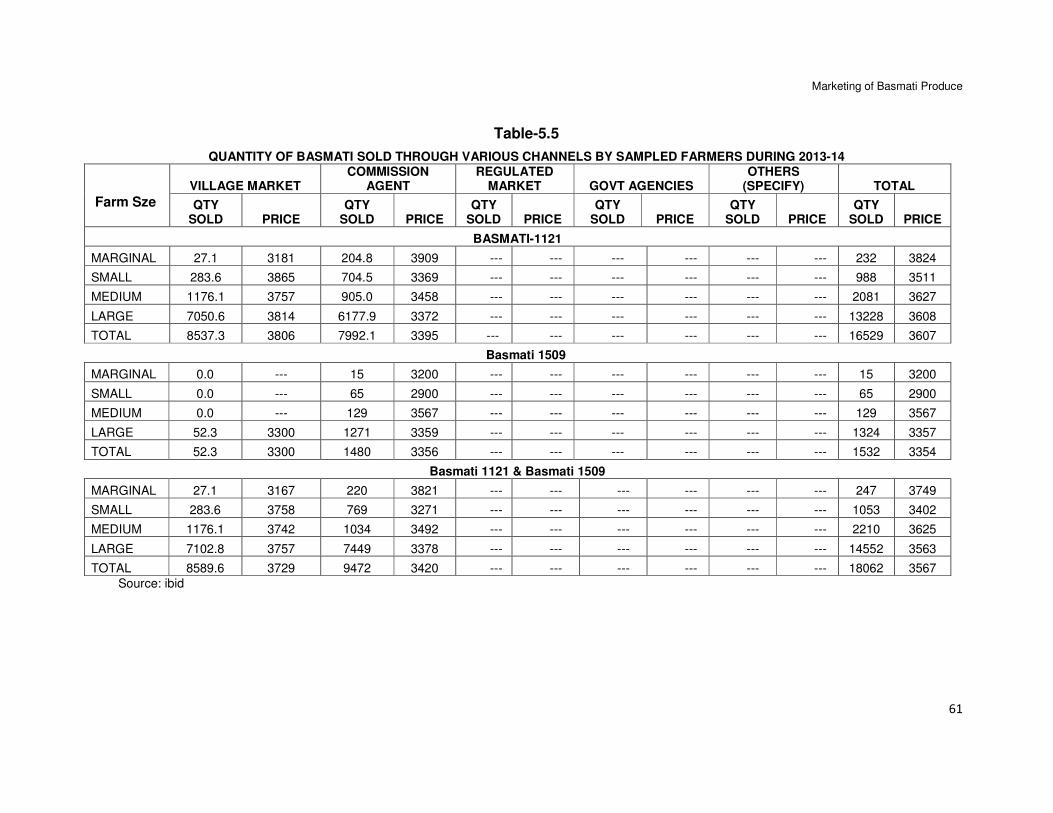
Marketing of Basmati Produce
61
Table-5.5
QUANTITY OF BASMATI SOLD THROUGH VARIOUS CHANNELS BY SAMPLED FARMERS DURING 2013-14
Farm Sze
VILLAGE MARKET COMMISSION
AGENT REGULATED
MARKET GOVT AGENCIES OTHERS
(SPECIFY) TOTAL
QTY SOLD PRICE
QTY SOLD PRICE
QTY SOLD PRICE
QTY SOLD PRICE
QTY SOLD PRICE
QTY SOLD PRICE
BASMATI-1121
MARGINAL 27.1 3181 204.8 3909 --- --- --- --- --- --- 232 3824
SMALL 283.6 3865 704.5 3369 --- --- --- --- --- --- 988 3511
MEDIUM 1176.1 3757 905.0 3458 --- --- --- --- --- --- 2081 3627
LARGE 7050.6 3814 6177.9 3372 --- --- --- --- --- --- 13228 3608
TOTAL 8537.3 3806 7992.1 3395 --- --- --- --- --- --- 16529 3607
Basmati 1509
MARGINAL 0.0 --- 15 3200 --- --- --- --- --- --- 15 3200
SMALL 0.0 --- 65 2900 --- --- --- --- --- --- 65 2900
MEDIUM 0.0 --- 129 3567 --- --- --- --- --- --- 129 3567
LARGE 52.3 3300 1271 3359 --- --- --- --- --- --- 1324 3357
TOTAL 52.3 3300 1480 3356 --- --- --- --- --- --- 1532 3354
Basmati 1121 & Basmati 1509
MARGINAL 27.1 3167 220 3821 --- --- --- --- --- --- 247 3749
SMALL 283.6 3758 769 3271 --- --- --- --- --- --- 1053 3402
MEDIUM 1176.1 3742 1034 3492 --- --- --- --- --- --- 2210 3625
LARGE 7102.8 3757 7449 3378 --- --- --- --- --- --- 14552 3563
TOTAL 8589.6 3729 9472 3420 --- --- --- --- --- --- 18062 3567
Source: ibid
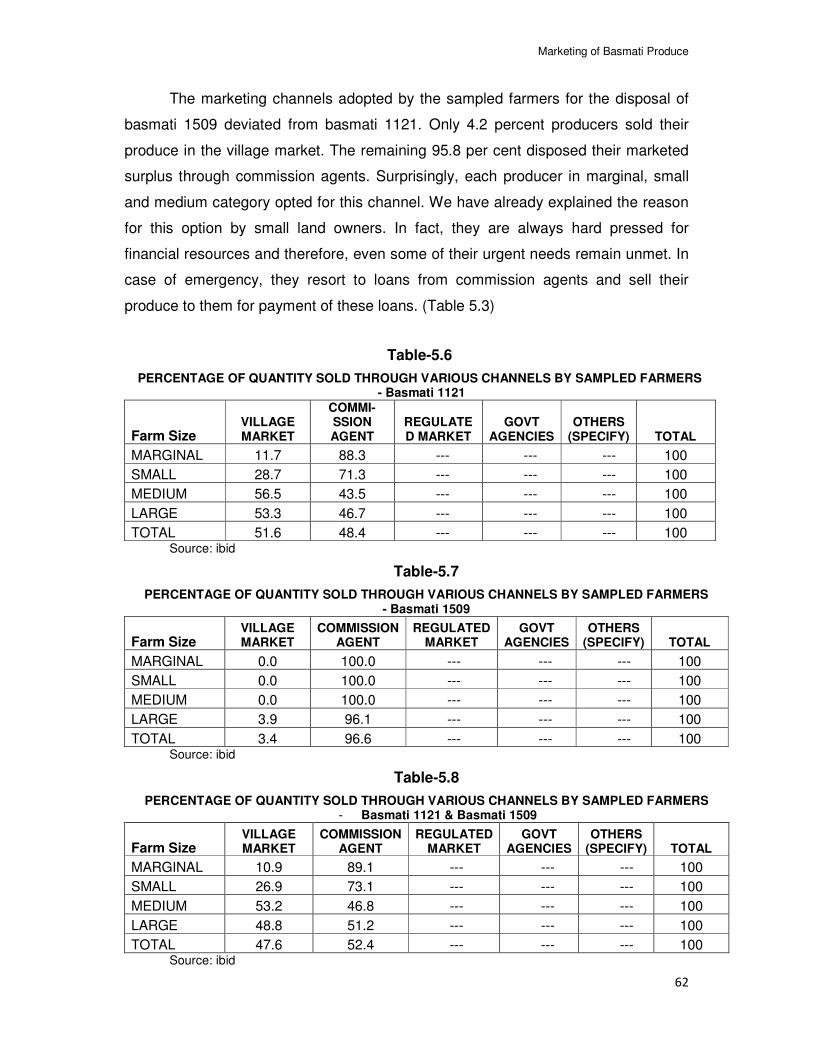
Marketing of Basmati Produce
62
The marketing channels adopted by the sampled farmers for the disposal of
basmati 1509 deviated from basmati 1121. Only 4.2 percent producers sold their
produce in the village market. The remaining 95.8 per cent disposed their marketed
surplus through commission agents. Surprisingly, each producer in marginal, small
and medium category opted for this channel. We have already explained the reason
for this option by small land owners. In fact, they are always hard pressed for
financial resources and therefore, even some of their urgent needs remain unmet. In
case of emergency, they resort to loans from commission agents and sell their
produce to them for payment of these loans. (Table 5.3)
Table-5.6
PERCENTAGE OF QUANTITY SOLD THROUGH VARIOUS CHANNELS BY SAMPLED FARMERS - Basmati 1121
Farm Size VILLAGE MARKET
COMMI-SSION AGENT
REGULATED MARKET
GOVT AGENCIES
OTHERS (SPECIFY) TOTAL
MARGINAL 11.7 88.3 --- --- --- 100
SMALL 28.7 71.3 --- --- --- 100
MEDIUM 56.5 43.5 --- --- --- 100
LARGE 53.3 46.7 --- --- --- 100
TOTAL 51.6 48.4 --- --- --- 100 Source: ibid
Table-5.7
PERCENTAGE OF QUANTITY SOLD THROUGH VARIOUS CHANNELS BY SAMPLED FARMERS - Basmati 1509
Farm Size VILLAGE MARKET
COMMISSION AGENT
REGULATED MARKET
GOVT AGENCIES
OTHERS (SPECIFY) TOTAL
MARGINAL 0.0 100.0 --- --- --- 100
SMALL 0.0 100.0 --- --- --- 100
MEDIUM 0.0 100.0 --- --- --- 100
LARGE 3.9 96.1 --- --- --- 100
TOTAL 3.4 96.6 --- --- --- 100 Source: ibid
Table-5.8
PERCENTAGE OF QUANTITY SOLD THROUGH VARIOUS CHANNELS BY SAMPLED FARMERS - Basmati 1121 & Basmati 1509
Farm Size VILLAGE MARKET
COMMISSION AGENT
REGULATED MARKET
GOVT AGENCIES
OTHERS (SPECIFY) TOTAL
MARGINAL 10.9 89.1 --- --- --- 100
SMALL 26.9 73.1 --- --- --- 100
MEDIUM 53.2 46.8 --- --- --- 100
LARGE 48.8 51.2 --- --- --- 100
TOTAL 47.6 52.4 --- --- --- 100 Source: ibid
Marketing of Basmati Produce
63
We have also tried to draw the overall scenario of marketing channels
adopted by the sampled farmers for the sale of basmati paddy by combining basmati
1121 and basmati 1509. Table 5.4 depicts information on marketing channels
adopted by the sampled farmers for the disposal of their paddy produce during the
reference year. It is evident that 38.7 per cent farmers opted village market while a
large proportion of farmers i.e. 65.3 per cent adopted disposal of produce through
commission agents. The differences exercised by the farmers among options across
farm size were found significant. It may be pointed out that less than 30 per cent of
marginal and small farmers sold their basmati produce in the village market. At the
same time, proportion of medium farmers adopting this channel for sale of basmati
was around 55 per cent. Some of the sampled farmers combined both the channels
for disposal of basmati produce during 2013-14. The number of respondents in each
farm size is fixed and therefore, same farmers sold Basmati 1121 and 1509produce
through the above channels and hence, there is no difference in percentage at the
overall level. These are similar to 1121 because all respondents grew this variety.
5.3 Marketwise Disposal of Basmati Paddy:
After analyzing marketing channels adopted by the sampled farmers for the
sale of Basmati paddy produced by them, it would be useful to examine the quantity
sold through these channels and price realized by them. Table 5.5 provides this
information for basmati-1121. Results show that 16529 qtls of Basmati 1121 were
disposed off by the sampled farmers at the aggregate level. Wide variations could be
observed across different categories of farmers. In particular, marginal farmers sold
only 232 qtls against 13228 qtls by the large land owning big farmers. The similar
type of disparities could be noticed in quantity sold through village market and
commission agents. When we look at the price realized by different categories of
farmers at the aggregate level, clearly, marginal farmers reaped higher price in
comparison to other categories. It could be due to better quality of their produce. The
same is true when produce was sold through commission agents. However, scenario
in the village market deviated from the aggregate level. The small farmers realized a
higher price per qtl of Basmati 1121 in comparison to other categories. In a nutshell,
neither quantity disposed nor price realized from the sale of Basmati 1121 through
different channels were found uniform across the farm categories.
Marketing of Basmati Produce
64
The findings about the share of marketed surplus of basmati 1121 disposed
through various marketing channels reveal that sampled farmers sold 51.6 per cent
of their produce in the village market and rest of approximately 48 per cent was
disposed through commission agents. The pattern of disposal of different categories
of farmers was not uniform. The marginal and small farmers preferred sale through
commission agents while medium and large farmers depended more on the village
market. As a result, they disposed relatively higher percentage of the marketed
surplus of basmati 1121 in the village market. It may be mentioned that the sampled
farmers didn’t opt for other marketing channels such as government agency to
dispose marketed surplus of this variety during the reference year. (Table-5.6)
.
Having discussed the quantity and price realized from sale of basmati
1121through different channels by the sampled farmers during 2013-14, we have
examined the scenario for basmati 1509. The information presented in Table 5.5
indicates that quantity of basmati 1509 sold through different channels by farmers
was much lower in comparison to basmati 1121. It was 1532 qtls at the aggregate
level and farmers reaped a price of Rs 3354 per qtl. Obviously, quantity sold by large
farmers was several times higher in comparison to marginal, small and even medium
farmers. In this case, producers largely adopted sale of basmati 1509 through
commission agents and therefore, only 52.3 qtls were sold in the village market
against 1480 qtls disposed through the commission agents. The disposal of basmati
1509 in the village market was nil by marginal, small and medium farmers. An
average price of Rs. 3356 per qtl was realized by the farmers from sale through
commission agents and it was observed higher for medium farmers in comparison to
other categories.
The information related to percentage of marketed surplus of basmati 1509
disposed by the farmers through various marketing channels reveals (Table 5.6) that
sampled farmers had great preference for commission agents in disposing this
variety of basmati and therefore, 96.6 per cent of the marketed surplus was disposed
through this channel. A small proportion of the marketed surplus of basmati 1509
was sold in the village market. It may be recorded that marginal, small and medium
farmers disposed entire marketed surplus of basmati 1509 through commission
agents during 2013-14.
Marketing of Basmati Produce
65
An overall scenario of sale of basmati produce through different channels by
the sampled farmers is depicted in Table 5.5. The sampled farmers disposed 18062
qtls of both varieties during 2013-14 and realized a price of Rs. 3567 per qtl. The
quantity sold was highest by large farmers while the price realized was the maximum
by marginal farmers. Further, around 8590 qtls and 9472 qtls were sold in the village
market and through commission agents. It may be pointed out that the price realized
in the village market was higher than sale through commission agents. The small
farmers in the village market and marginal farmers through commission agents
realized higher price for their basmati produce in comparison to other categories of
farmers.
Table 5.6 also provides percentage quantity of marketed surplus of basmati
disposed through various marketing channels. It is evident that sampled farmers sold
marketed surplus in the village market and through commission agents. However,
they indicated higher preference for the latter. As a result, around 52.4 per cent of
the marketed surplus of basmati was disposed through this channel. The remaining
52.4 per cent of the produce was sold in the village market. Particularly, marginal
farmers sold 89 per cent of marketed surplus through commission agents.
5.4 Month-wise Disposal of Basmati Paddy:
Agricultural commodities are characterized by a definite season of production.
Some crops are grown in rabi season while other crops are produced in kharif
season and zaid season. Even within a season, there are early and late varieties of
the crops. Some varieties take short duration in maturity while others take relatively
longer time in the process of production. Therefore, availability of agricultural
commodities is not uniform throughout the year. This results in month to month
variations or intra year variations in price of agricultural commodities. Normally,
prices are low after the harvest due to huge arrivals in the mandies in turn creating
excess supply over the demand. On the other hand, prices rise in lean months due
to contraction/reduced supply of agricultural commodities.
During the course of field survey, we had collected information on month wise
disposal and price realized by the producers of Basmati 1121 and 1509 during 2013-
14. The results for Basmati 1121 are presented in Table-5.9.
It is evident that farmers sold 6485 qtls of Basmati 1121 in November, 2013
immediately after the harvest in the village market and realized a price of Rs. 3711
Marketing of Basmati Produce
66
per qtl. They also disposed off 6676 qtls of produce through commission agents in
the same month but realized a lower price of Rs. 3421. The difference in price could
be due to direct sale of produce to the traders in the village market. In this medium of
sale, farmers save cost of transportation and marketing. In December, 2013 sampled
farmers sold 1377 qtls and 437 qtls in the village market and through commission
agents. The price realized in the village market during this month was almost the
same but in the case of commission agents, it was higher by Rs. 207 per qtl. over
the previous month. The balance of produce stored for future sale was disposed in
January, 2014. The quantum of sale in village market and through commission
agents was 459 qtls and 879 qtls respectively. The price realized in the village
market was higher by Rs. 358 per qtl while it was marginally lower by the sale
through commission agents. The last lot of Basmati 1121 was sold by the farmers in
February, 2014 in the village market but the price realized was not attractive for the
farmers since it was slightly higher than harvesting months. Thus, sampled farmers
reaped limited profit from stocking produce of Basmati 1121 for future sale in
February, 2014.
The month wise disposal of Basmati 1509 by the producers deviated from
Basmati 1121 during the reference year. The sampled farmers primarily sold their
produce through commission agents. Only insignificant quantity of 52.3 qtls in
January 2014 was sold in the village market by realizing a price of Rs. 3300 per qtl.
A significant quantity of marketed surplus i.e 1374 qtls was sold through commission
agents at a price of Rs. 3212 in November 2013. The highest price was realized by
the medium farmers. In December 2013, merely 32 qtls were sold to the commission
agents but the price realized was higher by more than Rs. 500 per qtl. Next month in
January 2014, 74 qtls of Basmati 1509 was disposed by producers through
commission agents and received a price of Rs. 3600 per qtl. In a nutshell,
commission agents were the major source of disposal of produce for Basmati 1509
during the reference year (Table- 5.10).
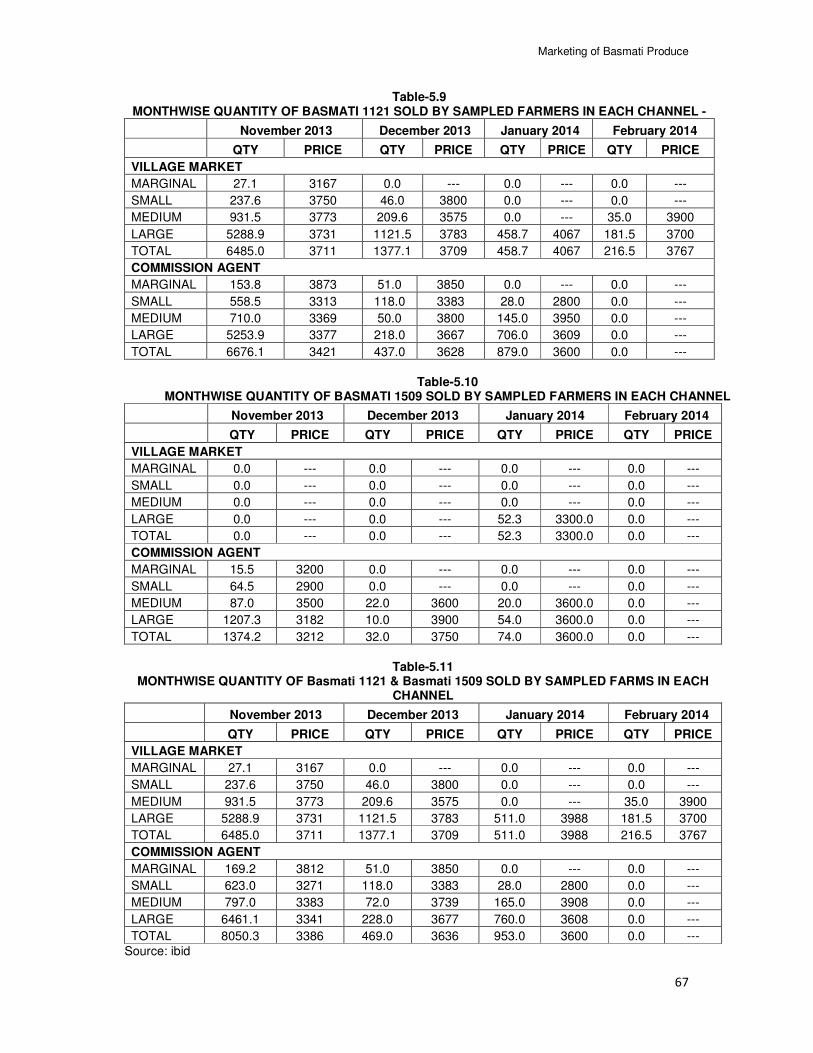
Marketing of Basmati Produce
67
Table-5.9 MONTHWISE QUANTITY OF BASMATI 1121 SOLD BY SAMPLED FARMERS IN EACH CHANNEL -
November 2013 December 2013 January 2014 February 2014
QTY PRICE QTY PRICE QTY PRICE QTY PRICE
VILLAGE MARKET
MARGINAL 27.1 3167 0.0 --- 0.0 --- 0.0 ---
SMALL 237.6 3750 46.0 3800 0.0 --- 0.0 ---
MEDIUM 931.5 3773 209.6 3575 0.0 --- 35.0 3900
LARGE 5288.9 3731 1121.5 3783 458.7 4067 181.5 3700
TOTAL 6485.0 3711 1377.1 3709 458.7 4067 216.5 3767
COMMISSION AGENT
MARGINAL 153.8 3873 51.0 3850 0.0 --- 0.0 ---
SMALL 558.5 3313 118.0 3383 28.0 2800 0.0 ---
MEDIUM 710.0 3369 50.0 3800 145.0 3950 0.0 ---
LARGE 5253.9 3377 218.0 3667 706.0 3609 0.0 ---
TOTAL 6676.1 3421 437.0 3628 879.0 3600 0.0 ---
Table-5.10 MONTHWISE QUANTITY OF BASMATI 1509 SOLD BY SAMPLED FARMERS IN EACH CHANNEL
November 2013 December 2013 January 2014 February 2014
QTY PRICE QTY PRICE QTY PRICE QTY PRICE
VILLAGE MARKET
MARGINAL 0.0 --- 0.0 --- 0.0 --- 0.0 ---
SMALL 0.0 --- 0.0 --- 0.0 --- 0.0 ---
MEDIUM 0.0 --- 0.0 --- 0.0 --- 0.0 ---
LARGE 0.0 --- 0.0 --- 52.3 3300.0 0.0 ---
TOTAL 0.0 --- 0.0 --- 52.3 3300.0 0.0 ---
COMMISSION AGENT
MARGINAL 15.5 3200 0.0 --- 0.0 --- 0.0 ---
SMALL 64.5 2900 0.0 --- 0.0 --- 0.0 ---
MEDIUM 87.0 3500 22.0 3600 20.0 3600.0 0.0 ---
LARGE 1207.3 3182 10.0 3900 54.0 3600.0 0.0 ---
TOTAL 1374.2 3212 32.0 3750 74.0 3600.0 0.0 ---
Table-5.11 MONTHWISE QUANTITY OF Basmati 1121 & Basmati 1509 SOLD BY SAMPLED FARMS IN EACH
CHANNEL
November 2013 December 2013 January 2014 February 2014
QTY PRICE QTY PRICE QTY PRICE QTY PRICE
VILLAGE MARKET
MARGINAL 27.1 3167 0.0 --- 0.0 --- 0.0 ---
SMALL 237.6 3750 46.0 3800 0.0 --- 0.0 ---
MEDIUM 931.5 3773 209.6 3575 0.0 --- 35.0 3900
LARGE 5288.9 3731 1121.5 3783 511.0 3988 181.5 3700
TOTAL 6485.0 3711 1377.1 3709 511.0 3988 216.5 3767
COMMISSION AGENT
MARGINAL 169.2 3812 51.0 3850 0.0 --- 0.0 ---
SMALL 623.0 3271 118.0 3383 28.0 2800 0.0 ---
MEDIUM 797.0 3383 72.0 3739 165.0 3908 0.0 ---
LARGE 6461.1 3341 228.0 3677 760.0 3608 0.0 ---
TOTAL 8050.3 3386 469.0 3636 953.0 3600 0.0 ---
Source: ibid
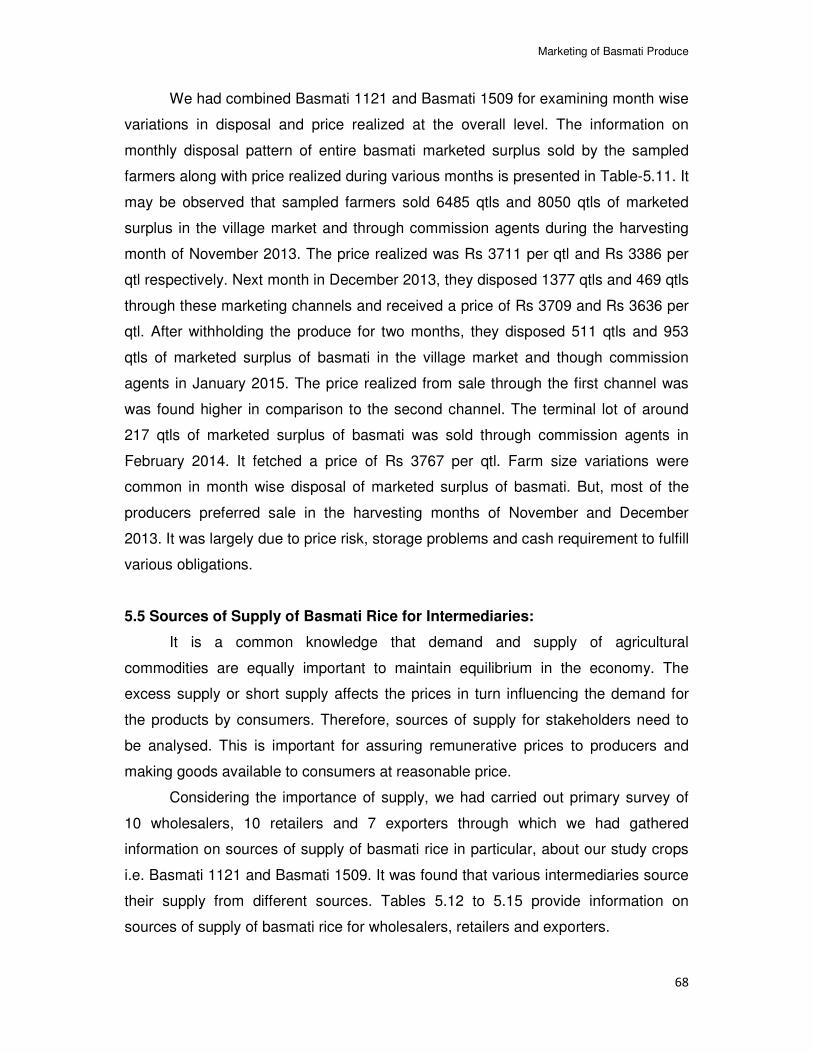
Marketing of Basmati Produce
68
We had combined Basmati 1121 and Basmati 1509 for examining month wise
variations in disposal and price realized at the overall level. The information on
monthly disposal pattern of entire basmati marketed surplus sold by the sampled
farmers along with price realized during various months is presented in Table-5.11. It
may be observed that sampled farmers sold 6485 qtls and 8050 qtls of marketed
surplus in the village market and through commission agents during the harvesting
month of November 2013. The price realized was Rs 3711 per qtl and Rs 3386 per
qtl respectively. Next month in December 2013, they disposed 1377 qtls and 469 qtls
through these marketing channels and received a price of Rs 3709 and Rs 3636 per
qtl. After withholding the produce for two months, they disposed 511 qtls and 953
qtls of marketed surplus of basmati in the village market and though commission
agents in January 2015. The price realized from sale through the first channel was
was found higher in comparison to the second channel. The terminal lot of around
217 qtls of marketed surplus of basmati was sold through commission agents in
February 2014. It fetched a price of Rs 3767 per qtl. Farm size variations were
common in month wise disposal of marketed surplus of basmati. But, most of the
producers preferred sale in the harvesting months of November and December
2013. It was largely due to price risk, storage problems and cash requirement to fulfill
various obligations.
5.5 Sources of Supply of Basmati Rice for Intermediaries:
It is a common knowledge that demand and supply of agricultural
commodities are equally important to maintain equilibrium in the economy. The
excess supply or short supply affects the prices in turn influencing the demand for
the products by consumers. Therefore, sources of supply for stakeholders need to
be analysed. This is important for assuring remunerative prices to producers and
making goods available to consumers at reasonable price.
Considering the importance of supply, we had carried out primary survey of
10 wholesalers, 10 retailers and 7 exporters through which we had gathered
information on sources of supply of basmati rice in particular, about our study crops
i.e. Basmati 1121 and Basmati 1509. It was found that various intermediaries source
their supply from different sources. Tables 5.12 to 5.15 provide information on
sources of supply of basmati rice for wholesalers, retailers and exporters.
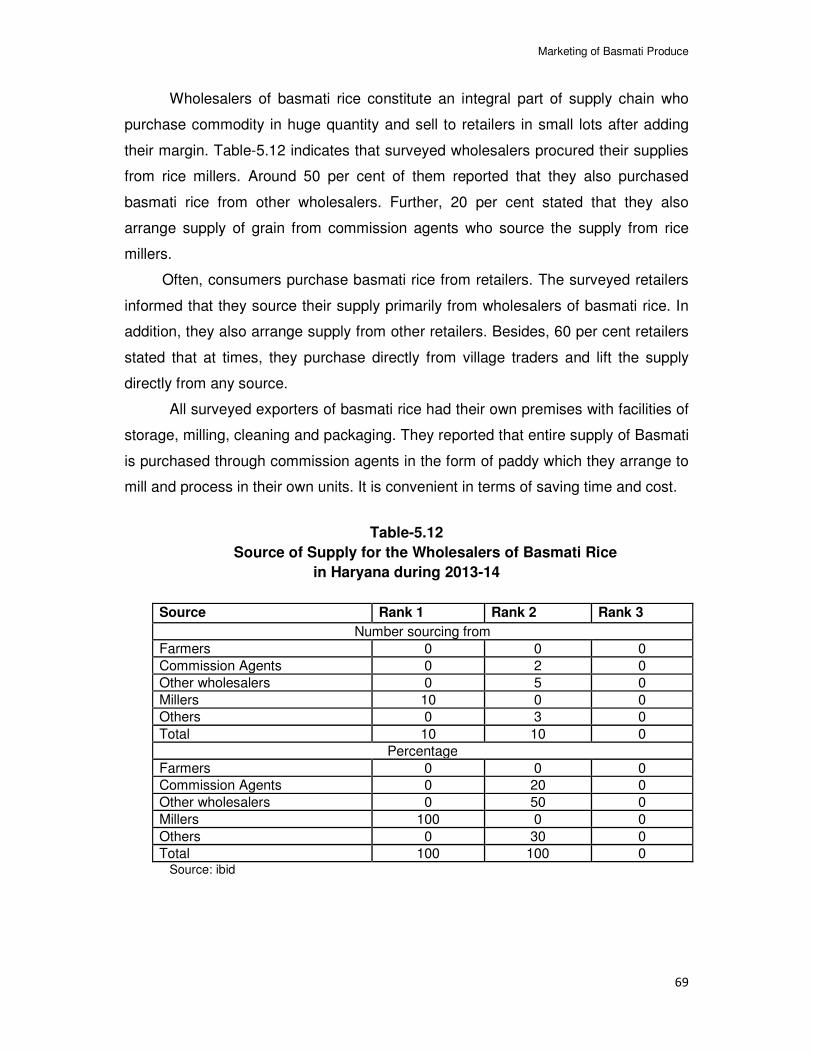
Marketing of Basmati Produce
69
Wholesalers of basmati rice constitute an integral part of supply chain who
purchase commodity in huge quantity and sell to retailers in small lots after adding
their margin. Table-5.12 indicates that surveyed wholesalers procured their supplies
from rice millers. Around 50 per cent of them reported that they also purchased
basmati rice from other wholesalers. Further, 20 per cent stated that they also
arrange supply of grain from commission agents who source the supply from rice
millers.
Often, consumers purchase basmati rice from retailers. The surveyed retailers
informed that they source their supply primarily from wholesalers of basmati rice. In
addition, they also arrange supply from other retailers. Besides, 60 per cent retailers
stated that at times, they purchase directly from village traders and lift the supply
directly from any source.
All surveyed exporters of basmati rice had their own premises with facilities of
storage, milling, cleaning and packaging. They reported that entire supply of Basmati
is purchased through commission agents in the form of paddy which they arrange to
mill and process in their own units. It is convenient in terms of saving time and cost.
Table-5.12
Source of Supply for the Wholesalers of Basmati Rice
in Haryana during 2013-14
Source Rank 1 Rank 2 Rank 3
Number sourcing from
Farmers 0 0 0
Commission Agents 0 2 0
Other wholesalers 0 5 0
Millers 10 0 0
Others 0 3 0
Total 10 10 0
Percentage
Farmers 0 0 0
Commission Agents 0 20 0
Other wholesalers 0 50 0
Millers 100 0 0
Others 0 30 0
Total 100 100 0 Source: ibid
Marketing of Basmati Produce
70
Table-5.13
Source of Supply for the Retailers of Basmati Rice in Haryana during 2013-14
Source Rank 1 Rank 2 Rank 3 Number sourcing from
Farmers 0 0 0 Commission Agents 0 0 0
Wholesalers 10 0 0 Other retailers 0 2 0 Millers 0 2 0
Others 0 6 0 Total 10 10 0
Percentage Farmers 0.00 0.00 0.00 Commission Agents 0.00 0.00 0.00
Wholesalers 100.00 0.00 0.00 Other retailers 0.00 20.00 0.00
Millers 0.00 20.00 0.00 Others 0.00 60.00 0.00
Total 100.00 100.00 0.00
Source: ibid
Table-5.14
Source of Supply for the Exporters/Millers of Basmati Rice in Haryana during
2013-14
Source Rank 1 Rank 2 Rank 3
Number sourcing from Farmers 0 0 0
Commission Agents 7 7 0 Wholesalers 0 0 0 Other retailers 0 0 0 Other exporters 0 0 0 Other millers 0 0 0
Others 0 0 0 Total 7 7 0
Percentage Farmers 0.00 0.00 0.00 Commission Agents 100.00 100.00 0.00 Wholesalers 0.00 0.00 0.00 Other retailers 0.00 0.00 0.00
Other exporters 0.00 0.00 0.00 Other millers 0.00 0.00 0.00 Others 0.00 0.00 0.00 Total 100.00 100.00 0.00
Source: ibid
Price Pattern over Time and Space
71
Chapter-6
Price Pattern over Time and Space
Price of agricultural commodities has multiple implications for all stakeholders.
In a comparative economy, prices provide signals to producers in decision making
what and how much to be produced with the available land and other resources to
maximize returns from farming. They also guide consumers in budgeting their
income to maintain optimum standard of living. In brief, prices help in balancing
demand and supply, allocation of scarce resources, budgeting income of households
and regulating the movement of agricultural items across the regions.
Agricultural prices play an important role in the resource allocation,
distribution of income and in inducing capital formation in India. Realizing their
importance, Raj Krishna (1963) viewed them as an integral part of growth policy. The
prices of foodgrains are the most basic among the price structure of agricultural
commodities. Exceptional rise in their prices touches economic life at many points by
affecting the consumption and real income of the people. The agricultural
commodities move from farm to the ultimate consumer through different stages. The
stake holders in the process are farmers, wholesalers, retailers and exporters.
Considering the importance of prices, this chapter is devoted to the analysis
of price pattern of basmati rice at the producer’s, wholesaler’s, retailer’s and
exporter’s level in the selected districts of Haryana.
6.1 Producer’s Price and Price Spread:
Producer’s price is the price received by the farmer after selling his produce.
A farmer has to incur some cost in selling his produce. Such cost may cover
expenditure on bags, loading, transportation, unloading and octroi charges. The
actual price accruing to the farmer is net of all these costs. In exceptional cases,
where the produce is lifted by the buyer from the farmer’s premises, the price
received by the latter is the same as the producer’s price because the marketing cost
is zero. The producer’s price can be derived after netting out marketing cost per unit
incurred by the farmer from sale price of the producers.
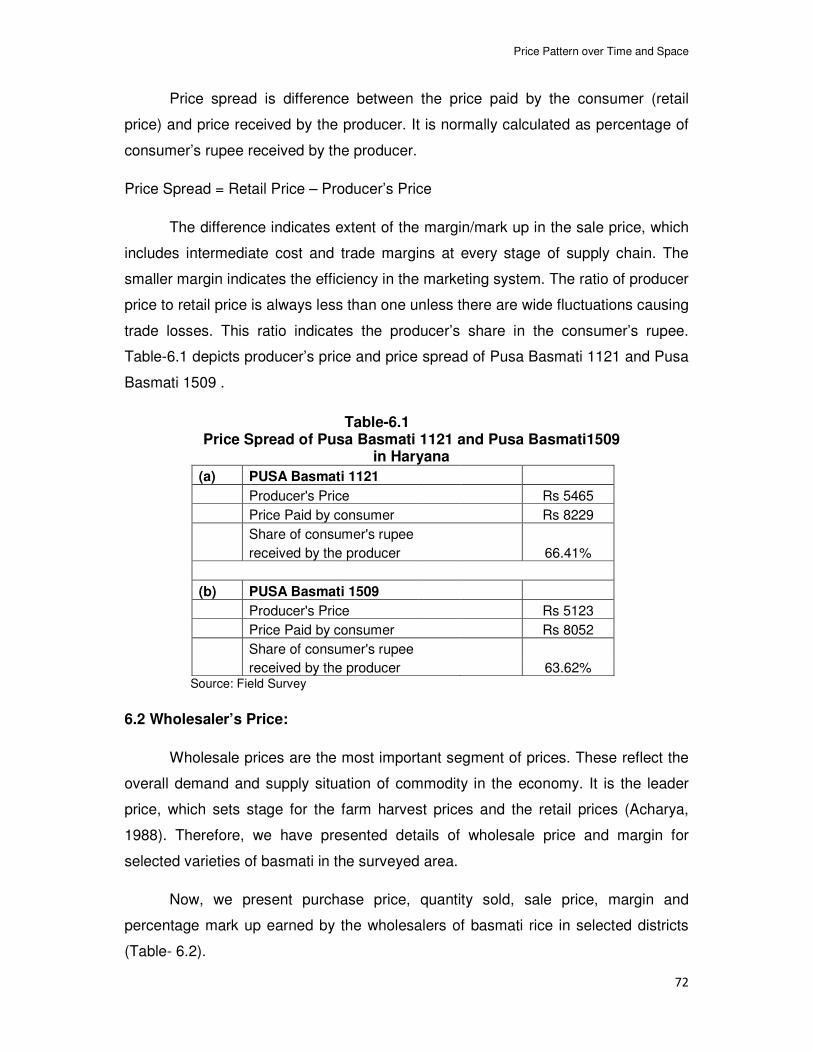
Price Pattern over Time and Space
72
Price spread is difference between the price paid by the consumer (retail
price) and price received by the producer. It is normally calculated as percentage of
consumer’s rupee received by the producer.
Price Spread = Retail Price – Producer’s Price
The difference indicates extent of the margin/mark up in the sale price, which
includes intermediate cost and trade margins at every stage of supply chain. The
smaller margin indicates the efficiency in the marketing system. The ratio of producer
price to retail price is always less than one unless there are wide fluctuations causing
trade losses. This ratio indicates the producer’s share in the consumer’s rupee.
Table-6.1 depicts producer’s price and price spread of Pusa Basmati 1121 and Pusa
Basmati 1509 .
Table-6.1 Price Spread of Pusa Basmati 1121 and Pusa Basmati1509
in Haryana
(a) PUSA Basmati 1121 Producer's Price Rs 5465 Price Paid by consumer Rs 8229 Share of consumer's rupee received by the producer 66.41% (b) PUSA Basmati 1509 Producer's Price Rs 5123 Price Paid by consumer Rs 8052 Share of consumer's rupee received by the producer 63.62% Source: Field Survey
6.2 Wholesaler’s Price:
Wholesale prices are the most important segment of prices. These reflect the
overall demand and supply situation of commodity in the economy. It is the leader
price, which sets stage for the farm harvest prices and the retail prices (Acharya,
1988). Therefore, we have presented details of wholesale price and margin for
selected varieties of basmati in the surveyed area.
Now, we present purchase price, quantity sold, sale price, margin and
percentage mark up earned by the wholesalers of basmati rice in selected districts
(Table- 6.2).
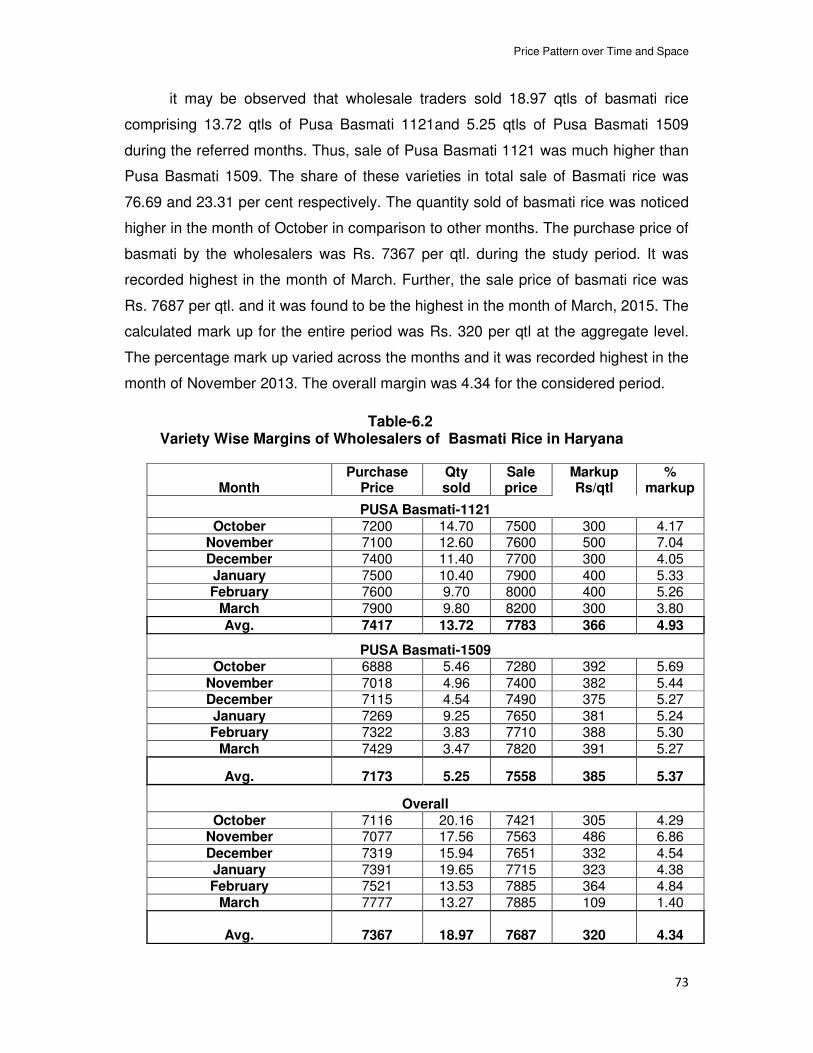
Price Pattern over Time and Space
73
it may be observed that wholesale traders sold 18.97 qtls of basmati rice
comprising 13.72 qtls of Pusa Basmati 1121and 5.25 qtls of Pusa Basmati 1509
during the referred months. Thus, sale of Pusa Basmati 1121 was much higher than
Pusa Basmati 1509. The share of these varieties in total sale of Basmati rice was
76.69 and 23.31 per cent respectively. The quantity sold of basmati rice was noticed
higher in the month of October in comparison to other months. The purchase price of
basmati by the wholesalers was Rs. 7367 per qtl. during the study period. It was
recorded highest in the month of March. Further, the sale price of basmati rice was
Rs. 7687 per qtl. and it was found to be the highest in the month of March, 2015. The
calculated mark up for the entire period was Rs. 320 per qtl at the aggregate level.
The percentage mark up varied across the months and it was recorded highest in the
month of November 2013. The overall margin was 4.34 for the considered period.
Table-6.2 Variety Wise Margins of Wholesalers of Basmati Rice in Haryana
Month Purchase
Price Qty sold
Sale price
Markup Rs/qtl
% markup
PUSA Basmati-1121
October 7200 14.70 7500 300 4.17 November 7100 12.60 7600 500 7.04 December 7400 11.40 7700 300 4.05
January 7500 10.40 7900 400 5.33 February 7600 9.70 8000 400 5.26
March 7900 9.80 8200 300 3.80
Avg. 7417 13.72 7783 366 4.93
PUSA Basmati-1509 October 6888 5.46 7280 392 5.69
November 7018 4.96 7400 382 5.44 December 7115 4.54 7490 375 5.27
January 7269 9.25 7650 381 5.24 February 7322 3.83 7710 388 5.30
March 7429 3.47 7820 391 5.27
Avg. 7173 5.25 7558 385 5.37
Overall October 7116 20.16 7421 305 4.29
November 7077 17.56 7563 486 6.86
December 7319 15.94 7651 332 4.54 January 7391 19.65 7715 323 4.38 February 7521 13.53 7885 364 4.84
March 7777 13.27 7885 109 1.40
Avg. 7367 18.97 7687 320 4.34
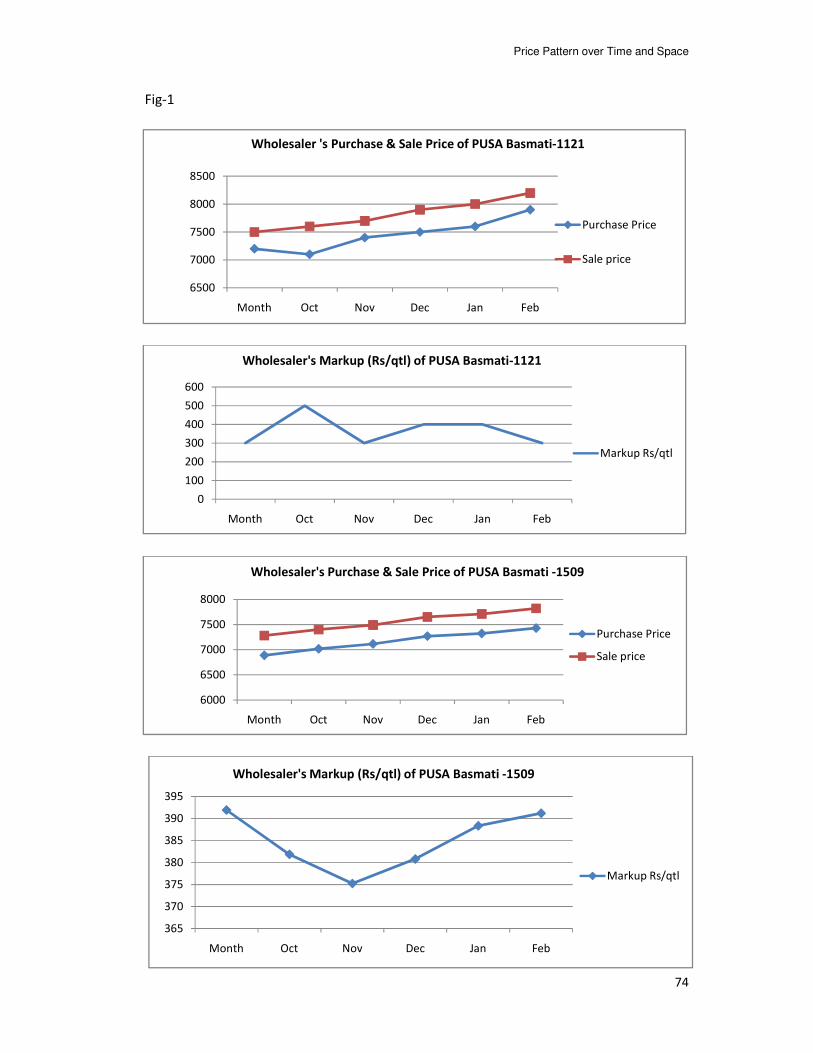
Price Pattern over Time and Space
74
Fig-1
6500
7000
7500
8000
8500
Month Oct Nov Dec Jan Feb
Purchase Price
Sale price
Wholesaler 's Purchase & Sale Price of PUSA Basmati-1121
0
100
200
300
400
500
600
Month Oct Nov Dec Jan Feb
Wholesaler's Markup (Rs/qtl) of PUSA Basmati-1121
Markup Rs/qtl
6000
6500
7000
7500
8000
Month Oct Nov Dec Jan Feb
Purchase Price
Sale price
Wholesaler's Purchase & Sale Price of PUSA Basmati -1509
365
370
375
380
385
390
395
Month Oct Nov Dec Jan Feb
Wholesaler's Markup (Rs/qtl) of PUSA Basmati -1509
Markup Rs/qtl
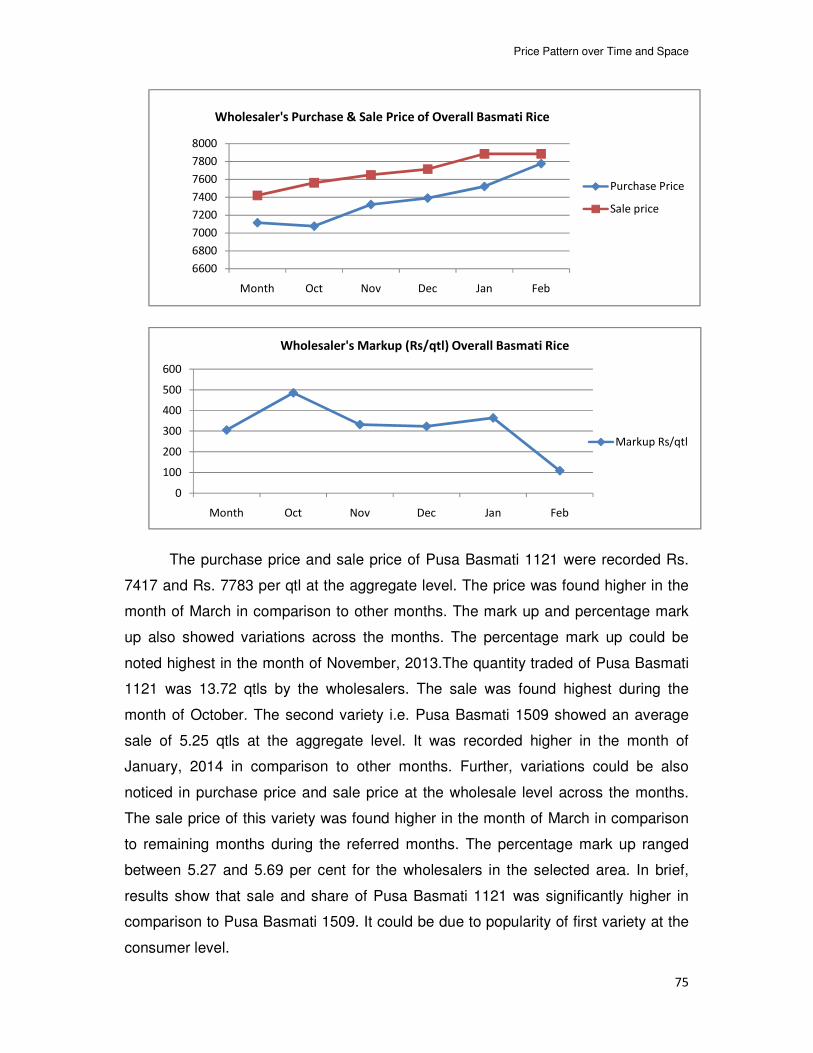
Price Pattern over Time and Space
75
The purchase price and sale price of Pusa Basmati 1121 were recorded Rs.
7417 and Rs. 7783 per qtl at the aggregate level. The price was found higher in the
month of March in comparison to other months. The mark up and percentage mark
up also showed variations across the months. The percentage mark up could be
noted highest in the month of November, 2013.The quantity traded of Pusa Basmati
1121 was 13.72 qtls by the wholesalers. The sale was found highest during the
month of October. The second variety i.e. Pusa Basmati 1509 showed an average
sale of 5.25 qtls at the aggregate level. It was recorded higher in the month of
January, 2014 in comparison to other months. Further, variations could be also
noticed in purchase price and sale price at the wholesale level across the months.
The sale price of this variety was found higher in the month of March in comparison
to remaining months during the referred months. The percentage mark up ranged
between 5.27 and 5.69 per cent for the wholesalers in the selected area. In brief,
results show that sale and share of Pusa Basmati 1121 was significantly higher in
comparison to Pusa Basmati 1509. It could be due to popularity of first variety at the
consumer level.
6600
6800
7000
7200
7400
7600
7800
8000
Month Oct Nov Dec Jan Feb
Purchase Price
Sale price
Wholesaler's Purchase & Sale Price of Overall Basmati Rice
0
100
200
300
400
500
600
Month Oct Nov Dec Jan Feb
Wholesaler's Markup (Rs/qtl) Overall Basmati Rice
Markup Rs/qtl
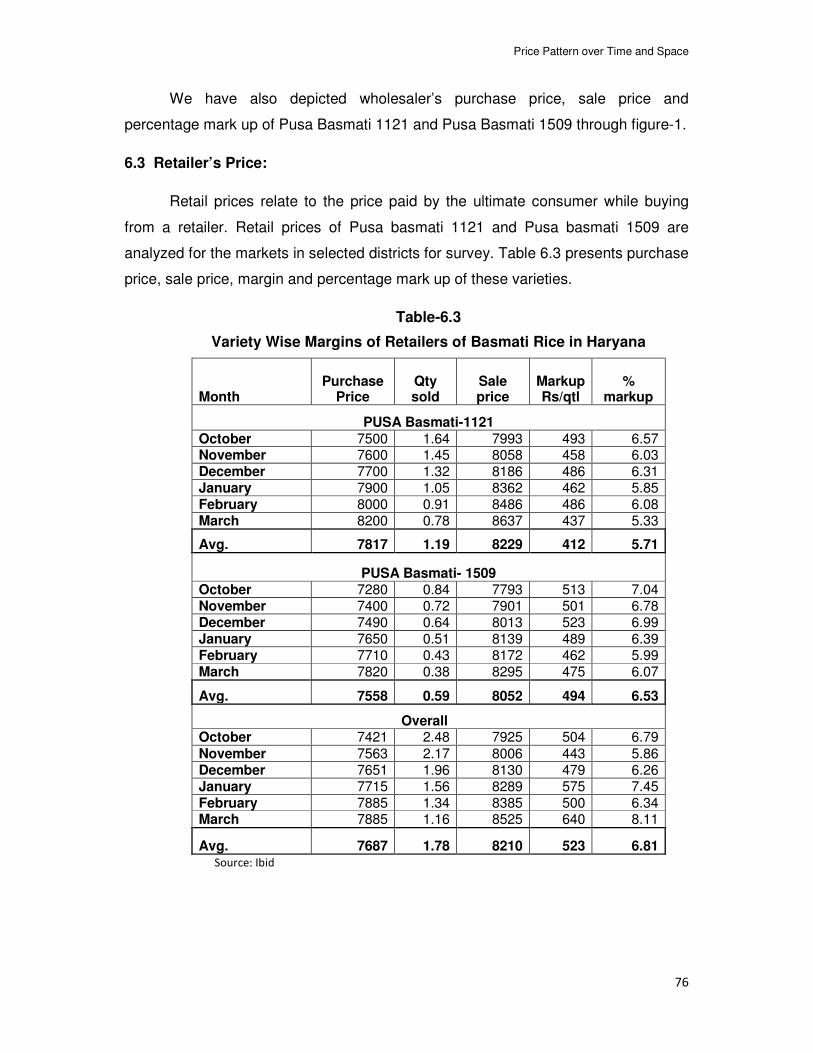
Price Pattern over Time and Space
76
We have also depicted wholesaler’s purchase price, sale price and
percentage mark up of Pusa Basmati 1121 and Pusa Basmati 1509 through figure-1.
6.3 Retailer’s Price:
Retail prices relate to the price paid by the ultimate consumer while buying
from a retailer. Retail prices of Pusa basmati 1121 and Pusa basmati 1509 are
analyzed for the markets in selected districts for survey. Table 6.3 presents purchase
price, sale price, margin and percentage mark up of these varieties.
Table-6.3
Variety Wise Margins of Retailers of Basmati Rice in Haryana
Month Purchase
Price Qty sold
Sale price
Markup Rs/qtl
% markup
PUSA Basmati-1121
October 7500 1.64 7993 493 6.57 November 7600 1.45 8058 458 6.03 December 7700 1.32 8186 486 6.31 January 7900 1.05 8362 462 5.85 February 8000 0.91 8486 486 6.08 March 8200 0.78 8637 437 5.33
Avg. 7817 1.19 8229 412 5.71
PUSA Basmati- 1509 October 7280 0.84 7793 513 7.04 November 7400 0.72 7901 501 6.78 December 7490 0.64 8013 523 6.99 January 7650 0.51 8139 489 6.39 February 7710 0.43 8172 462 5.99 March 7820 0.38 8295 475 6.07
Avg. 7558 0.59 8052 494 6.53
Overall October 7421 2.48 7925 504 6.79
November 7563 2.17 8006 443 5.86 December 7651 1.96 8130 479 6.26 January 7715 1.56 8289 575 7.45 February 7885 1.34 8385 500 6.34 March 7885 1.16 8525 640 8.11
Avg. 7687 1.78 8210 523 6.81 Source: Ibid
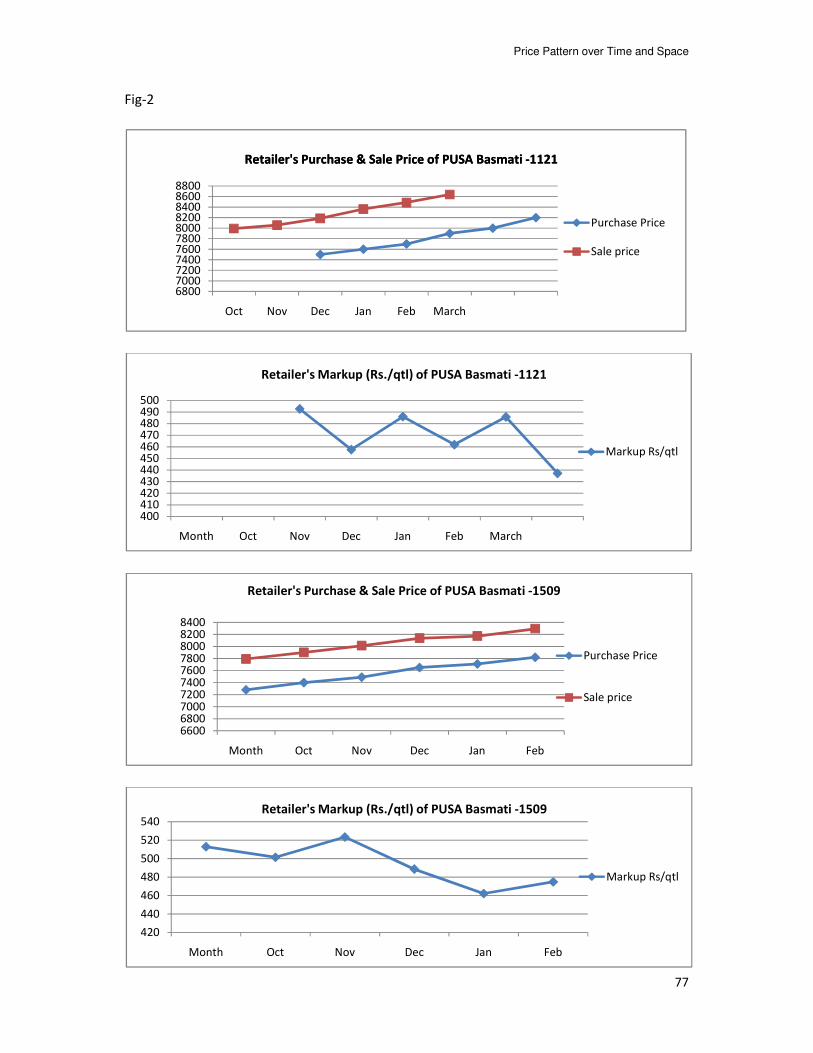
Price Pattern over Time and Space
77
Fig-2
68007000720074007600780080008200840086008800
Oct Nov Dec Jan Feb March
Purchase Price
Sale price
Retailer's Purchase & Sale Price of PUSA Basmati -1121Retailer's Purchase & Sale Price of PUSA Basmati -1121
400410420430440450460470480490500
Month Oct Nov Dec Jan Feb March
Markup Rs/qtl
Retailer's Markup (Rs./qtl) of PUSA Basmati -1121
6600680070007200740076007800800082008400
Month Oct Nov Dec Jan Feb
Purchase Price
Sale price
Retailer's Purchase & Sale Price of PUSA Basmati -1509
420
440
460
480
500
520
540
Month Oct Nov Dec Jan Feb
Markup Rs/qtl
Retailer's Markup (Rs./qtl) of PUSA Basmati -1509
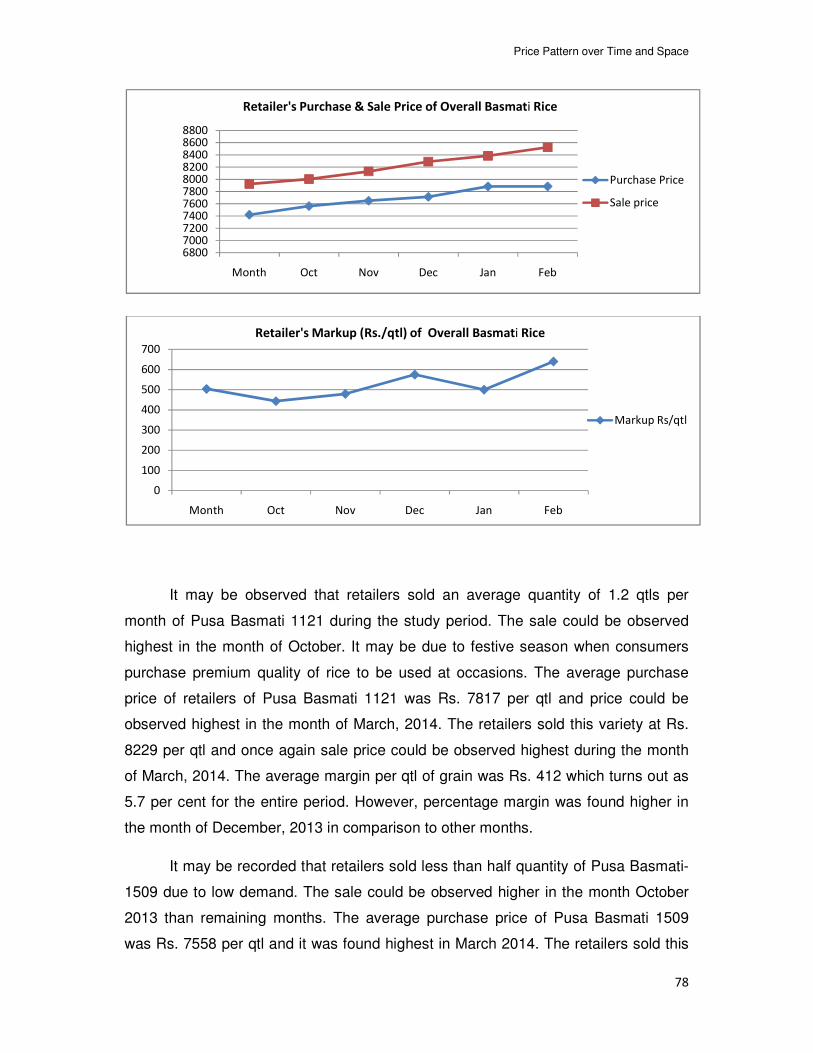
Price Pattern over Time and Space
78
It may be observed that retailers sold an average quantity of 1.2 qtls per
month of Pusa Basmati 1121 during the study period. The sale could be observed
highest in the month of October. It may be due to festive season when consumers
purchase premium quality of rice to be used at occasions. The average purchase
price of retailers of Pusa Basmati 1121 was Rs. 7817 per qtl and price could be
observed highest in the month of March, 2014. The retailers sold this variety at Rs.
8229 per qtl and once again sale price could be observed highest during the month
of March, 2014. The average margin per qtl of grain was Rs. 412 which turns out as
5.7 per cent for the entire period. However, percentage margin was found higher in
the month of December, 2013 in comparison to other months.
It may be recorded that retailers sold less than half quantity of Pusa Basmati-
1509 due to low demand. The sale could be observed higher in the month October
2013 than remaining months. The average purchase price of Pusa Basmati 1509
was Rs. 7558 per qtl and it was found highest in March 2014. The retailers sold this
68007000720074007600780080008200840086008800
Month Oct Nov Dec Jan Feb
Purchase Price
Sale price
Retailer's Purchase & Sale Price of Overall Basmati Rice
0
100
200
300
400
500
600
700
Month Oct Nov Dec Jan Feb
Markup Rs/qtl
Retailer's Markup (Rs./qtl) of Overall Basmati Rice
Price Pattern over Time and Space
79
variety to consumers at Rs. 8052 and earned a margin of Rs. 6.53 percentage
points. The percentage mark up was observed highest during October, 2013. The
total quantity of basmati sold by the retailers was 1.78 qtls per month during the
study period. The sale was higher in the month of October followed by November,
2013. The purchase price of basmati by retailers was recorded Rs. 7687 per qtl
being maximum in the months of February and March 2014. The retailers sold
basmati at Rs. 8210 per qtl by earning a margin of Rs. 523 per qtl which turns out
into 6.81 percentage points. The mark up could be observed higher in the month of
March in comparison to other months.
We have also depicted retailer’s purchase price, sale price and percentage
mark up of Pusa Basmati 1121 and Pusa Basmati 1509 through figure-2.
6.4 Exporter’s Price:
We have mentioned in chapter-1 that India exports rice into two main
categories such as basmati (fragrant) and non-basmati (non-fragrant). In case of
basmati rice, India dominates the world trade followed by Pakistan. Basmati rice is
the leading aromatic fine quality rice traded in the world and it fetches higher export
price in the International market. India is the largest producer and exporter of
basmati rice in the world. The annual production of basmati rice in the country is
between 8-10 million tonnes a year of which around two third is exported. Basmati
exports from India peak during November-December to March-April. Gulf region is
the major market for Indian basmati. Saudi Arab accounts for the major share of
basmati exports from India. European Union is the next important market for Indian
basmati.
The primary survey of exporters revealed (Table-6.4) that they exported an
average quantity of 6990 qtls of Basmati 1121 and 1551 qtls of Basmati 1509 during
the reference period of October 2013 to March 2014. Evidently, quantum of exports
of Basmati 1121 was around four times as compared to Basmati 1509. It was largely
due to international demand for this variety in countries like Iran. In December 2013,
quantum of exports of above mentioned varieties was higher in comparison to other
months under consideration. The per qtl price realized from exports of Basmati 1121
was Rs. 8127 while it was Rs. 7424 for Basmati 1509. The percentage mark up of
exporters was 11.43 per cent and 10.50 per cent respectively for these varieties of
basmati rice. The overall results show that exporters exported 8542 qtls per month
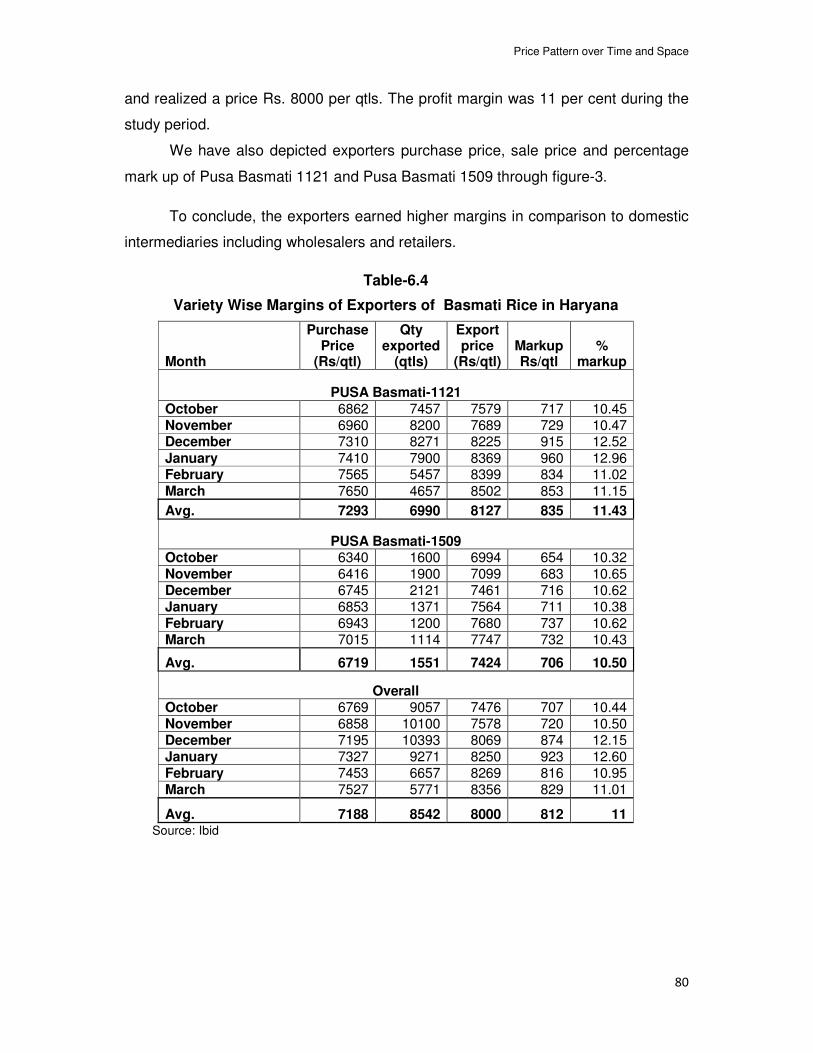
Price Pattern over Time and Space
80
and realized a price Rs. 8000 per qtls. The profit margin was 11 per cent during the
study period.
We have also depicted exporters purchase price, sale price and percentage
mark up of Pusa Basmati 1121 and Pusa Basmati 1509 through figure-3.
To conclude, the exporters earned higher margins in comparison to domestic
intermediaries including wholesalers and retailers.
Table-6.4
Variety Wise Margins of Exporters of Basmati Rice in Haryana
Month
Purchase Price
(Rs/qtl)
Qty exported
(qtls)
Export price
(Rs/qtl) Markup Rs/qtl
% markup
PUSA Basmati-1121
October 6862 7457 7579 717 10.45 November 6960 8200 7689 729 10.47 December 7310 8271 8225 915 12.52
January 7410 7900 8369 960 12.96 February 7565 5457 8399 834 11.02
March 7650 4657 8502 853 11.15
Avg. 7293 6990 8127 835 11.43
PUSA Basmati-1509 October 6340 1600 6994 654 10.32 November 6416 1900 7099 683 10.65 December 6745 2121 7461 716 10.62 January 6853 1371 7564 711 10.38 February 6943 1200 7680 737 10.62 March 7015 1114 7747 732 10.43
Avg. 6719 1551 7424 706 10.50
Overall October 6769 9057 7476 707 10.44 November 6858 10100 7578 720 10.50 December 7195 10393 8069 874 12.15 January 7327 9271 8250 923 12.60 February 7453 6657 8269 816 10.95 March 7527 5771 8356 829 11.01
Avg. 7188 8542 8000 812 11 Source: Ibid
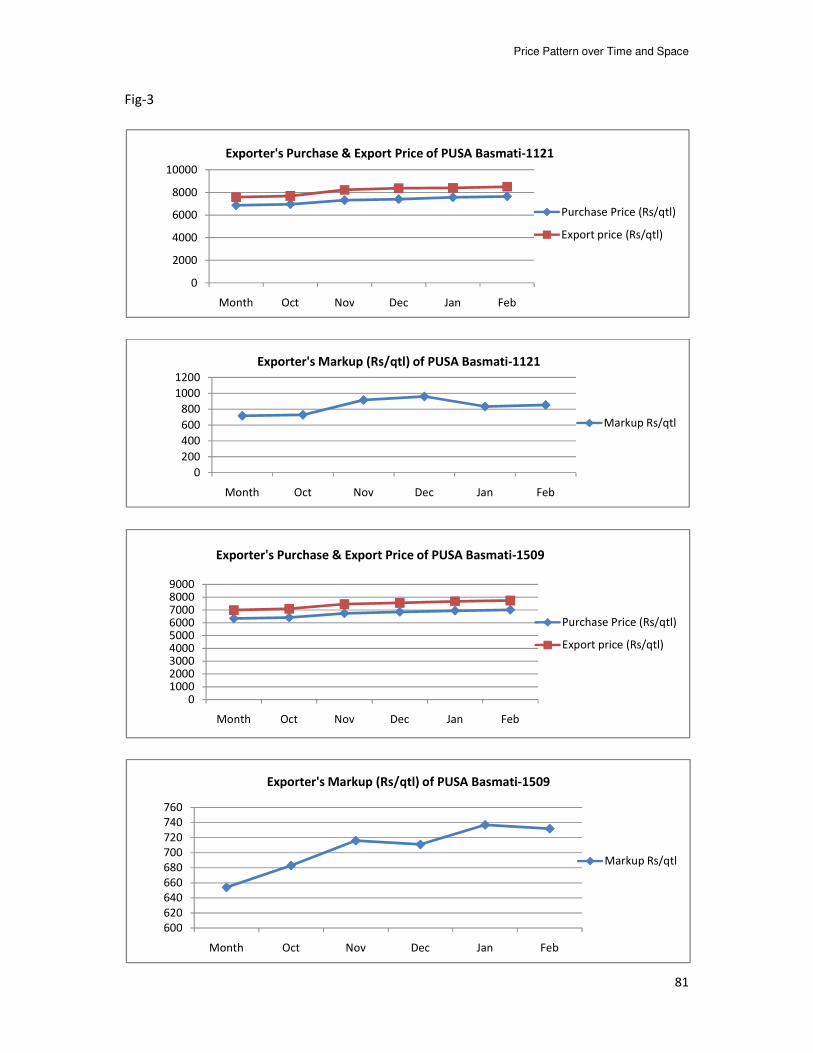
Price Pattern over Time and Space
81
Fig-3
0
2000
4000
6000
8000
10000
Month Oct Nov Dec Jan Feb
Purchase Price (Rs/qtl)
Export price (Rs/qtl)
Exporter's Purchase & Export Price of PUSA Basmati-1121
0
200
400
600
800
1000
1200
Month Oct Nov Dec Jan Feb
Markup Rs/qtl
Exporter's Markup (Rs/qtl) of PUSA Basmati-1121
0100020003000400050006000700080009000
Month Oct Nov Dec Jan Feb
Purchase Price (Rs/qtl)
Export price (Rs/qtl)
Exporter's Purchase & Export Price of PUSA Basmati-1509
600
620
640
660
680
700
720
740
760
Month Oct Nov Dec Jan Feb
Markup Rs/qtl
Exporter's Markup (Rs/qtl) of PUSA Basmati-1509
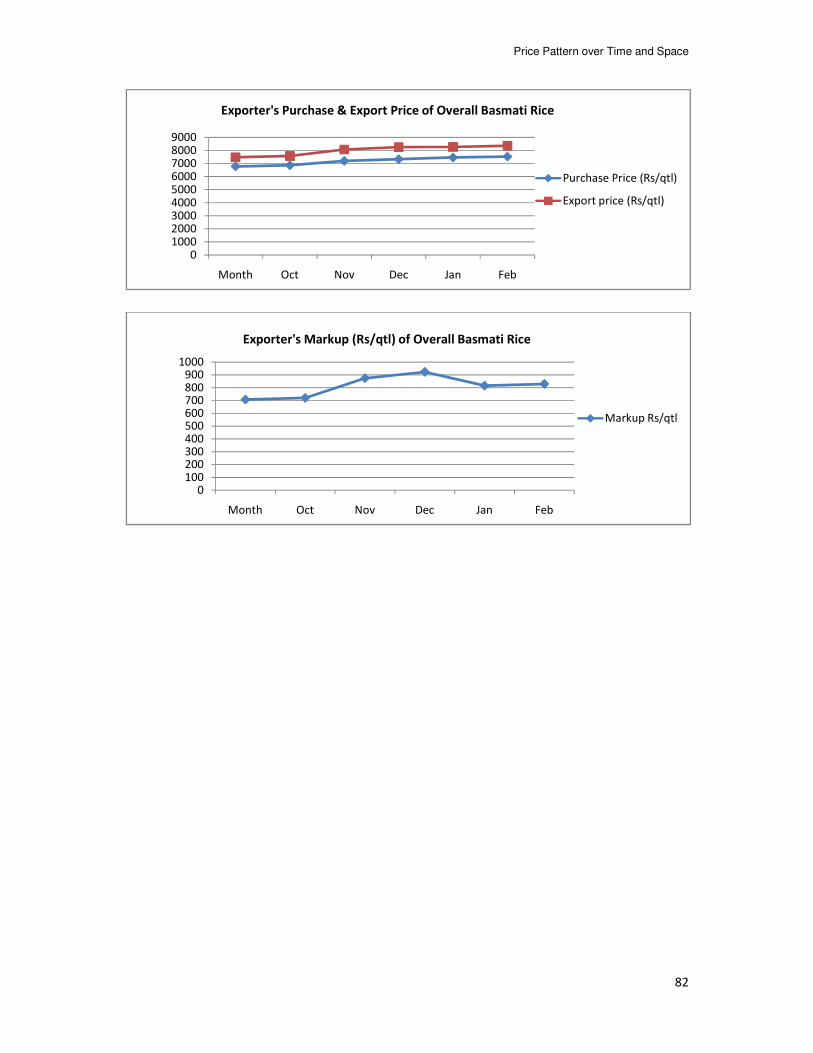
Price Pattern over Time and Space
82
0100020003000400050006000700080009000
Month Oct Nov Dec Jan Feb
Purchase Price (Rs/qtl)
Export price (Rs/qtl)
Exporter's Purchase & Export Price of Overall Basmati Rice
0100200300400500600700800900
1000
Month Oct Nov Dec Jan Feb
Markup Rs/qtl
Exporter's Markup (Rs/qtl) of Overall Basmati Rice
Perceptions of Stakeholders on Production and Trade of Basmati Rice
83
Chapter-7
Perceptions of Stakeholders on Production and Trade of Basmati Rice
An understanding of the perceptions of stakeholders involved in the process
of production to exports of basmati rice helps in initiating policy measures to improve
production, profitability and exports. Therefore, this chapter is devoted to the
analysis of perceptions of farmers, wholesalers, retailers and exporters of basmati
rice in Haryana. The findings are based on the information collected during the field
survey. We had enquired about the degree of problems faced by these groups
during the process. The empirical results in the form of responses are reported in the
forthcoming analyses.
7.1 Reasons for Cultivation of Basmati Rice:
Haryana was a non-paddy producing state prior to the advent of the Green
Revolution. The crop was grown in some parts and therefore, area under paddy was
only 246 thousand hectares during TE 1970-71 which increased several folds and
became 1227 thousand hectares in TE 2011-12. This is due to a gradual increase in
profitability of paddy in comparison to alternative kharif crops. The farmers therefore,
are not ready to switch over to alternative kharif crops despite the advocacy by policy
makers and agricultural scientists. Paddy consumes around 3,000 liters of water per
kilo of rice produced. As a result, ground water level has reached to a critical stage in
major growing areas. This is a great challenge for sustainability of agriculture and
paddy in particular in future.
Basmati rice is a good alternative for paddy in Haryana. It has potential in
terms of saving precious resources like water in addition to demand in the export
market at the international level.
The degree of production risk in alternative crops is higher due to biotic and
abiotic constraints. Climate change is further aggravating the risk. It is essential to
improve productivity and reduce yield and price risk for alternative crops to
encourage farmers to reduce area under paddy. In this back drop, it is important to
understand the perceptions of sampled farmers about biotic and aboitic constraints
of various kharif crops. We propose to discuss opinions of the farmers on these
issues in this chapter.
Crops are affected negatively by aboitic and biotic stresses. Aboitic stress
occurs in many forms such as drought, salinity, high temperature, high rainfall, high
Perceptions of Stakeholders on Production and Trade of Basmati Rice
84
wind and flood, etc. Aboitic stresses are harmful for the growth and productivity of
crops. For instance, rice is highly susceptible to temperature stress during the
reproductive and ripening stages. On the other hand, biotic stress is a stress that
occurs as a result of harm done to crops by living organisms such as insect/pests,
diseases and weeds. The relationship between biotic stress and yield of crops
affects decisions of the growers, quality of the produce and profitability.
In the present study, we have used qualitative responses of the stakeholders
to analyze perceptions regarding stresses in the form of constraints. Agricultural
crops are affected from different abiotic and biotic stress conditions. Now, we
present details of information gathered during the course of survey.
Agriculture is a risky business because it deals with uncertain factors such as
weather and market conditions. These factors make income from agriculture
uncertain. Therefore, selection of suitable crops through allocation of land is one of
the most important decisions for the farmers. One of the suggested approaches is to
reduce risk through crop diversification. Under this strategy, a farmer is likely to grow
a number of crops that differ in constraints arising out of biotic and aboitic stresses.
During the course of our survey, we had asked farmers about the reasons for
growing basmati paddy during kharif season in Haryana. The responses of farmers
are presented in Table 7.1. It is evident that 99 per cent of sampled farmers rated
profitability as the primary motive for cultivation of basmati rice. It is essential to
mention that all categories of farmers provided high weightage to this reason. As a
result, per cent of farmers citing profitability as a reason was above 90 per cent in
each category. Further, farmers opined that suitability of land for basmati rice is also
one of the reasons for land allocation to this crop. The marginal and medium farmers
felt it more in comparison to other categories. We had also tried to seek responses of
the farmers about attractive prices and stimulation received from the policies of the
government. The response of farmers was found discouraging. Only 1 per cent
farmers stated that these factors are important in decision making about area
allocation to basmati rice. Thus, sampled farmers grew basmati rice primarily due to
profitability followed by suitability of land.
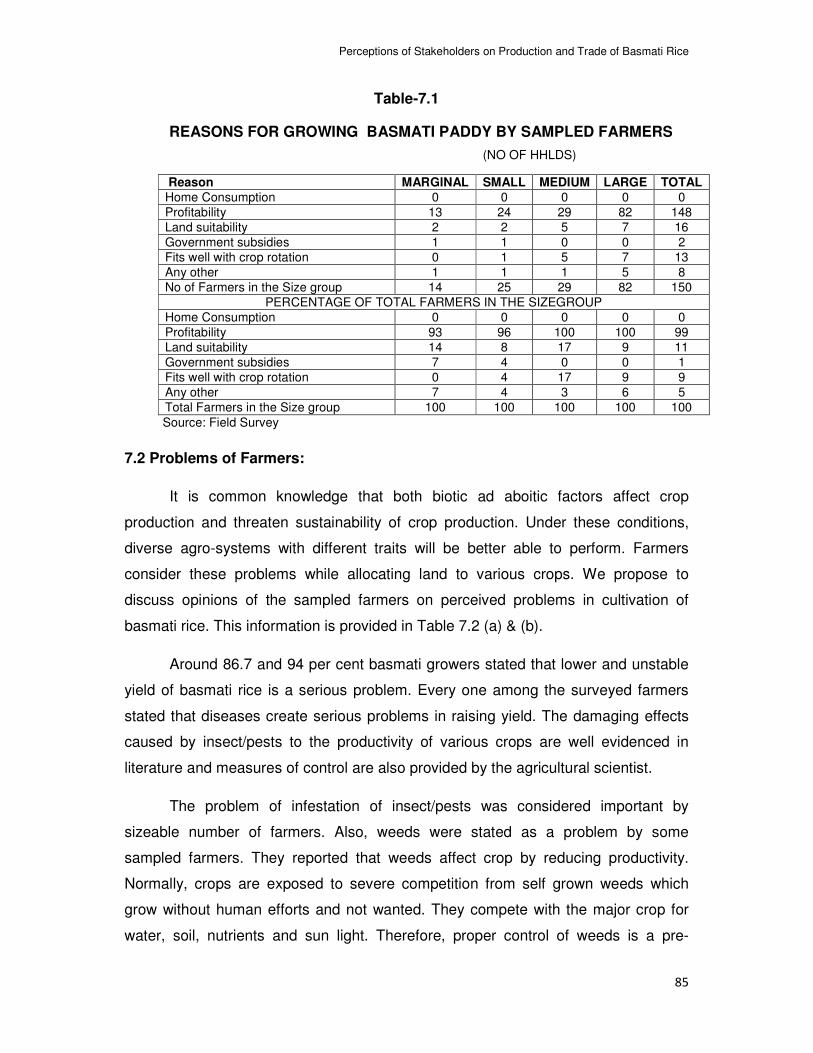
Perceptions of Stakeholders on Production and Trade of Basmati Rice
85
Table-7.1
REASONS FOR GROWING BASMATI PADDY BY SAMPLED FARMERS
(NO OF HHLDS)
Reason MARGINAL SMALL MEDIUM LARGE TOTAL
Home Consumption 0 0 0 0 0
Profitability 13 24 29 82 148
Land suitability 2 2 5 7 16
Government subsidies 1 1 0 0 2
Fits well with crop rotation 0 1 5 7 13
Any other 1 1 1 5 8
No of Farmers in the Size group 14 25 29 82 150
PERCENTAGE OF TOTAL FARMERS IN THE SIZEGROUP
Home Consumption 0 0 0 0 0
Profitability 93 96 100 100 99
Land suitability 14 8 17 9 11
Government subsidies 7 4 0 0 1
Fits well with crop rotation 0 4 17 9 9
Any other 7 4 3 6 5
Total Farmers in the Size group 100 100 100 100 100
Source: Field Survey
7.2 Problems of Farmers:
It is common knowledge that both biotic ad aboitic factors affect crop
production and threaten sustainability of crop production. Under these conditions,
diverse agro-systems with different traits will be better able to perform. Farmers
consider these problems while allocating land to various crops. We propose to
discuss opinions of the sampled farmers on perceived problems in cultivation of
basmati rice. This information is provided in Table 7.2 (a) & (b).
Around 86.7 and 94 per cent basmati growers stated that lower and unstable
yield of basmati rice is a serious problem. Every one among the surveyed farmers
stated that diseases create serious problems in raising yield. The damaging effects
caused by insect/pests to the productivity of various crops are well evidenced in
literature and measures of control are also provided by the agricultural scientist.
The problem of infestation of insect/pests was considered important by
sizeable number of farmers. Also, weeds were stated as a problem by some
sampled farmers. They reported that weeds affect crop by reducing productivity.
Normally, crops are exposed to severe competition from self grown weeds which
grow without human efforts and not wanted. They compete with the major crop for
water, soil, nutrients and sun light. Therefore, proper control of weeds is a pre-
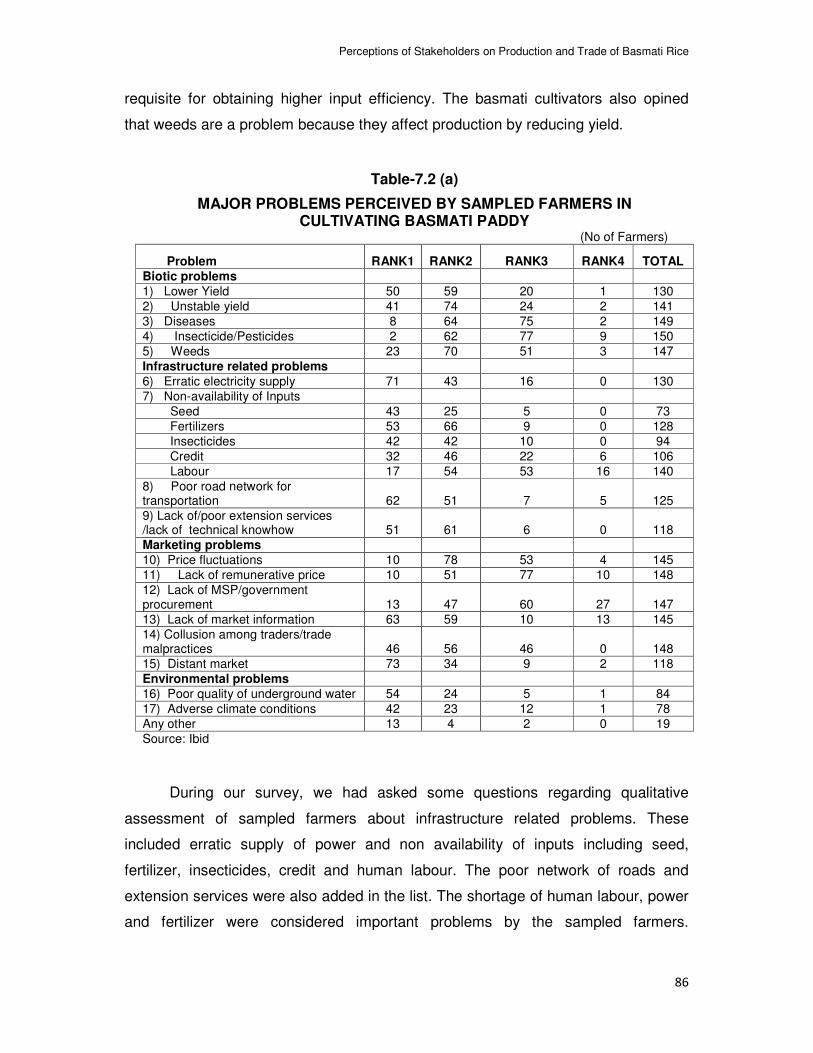
Perceptions of Stakeholders on Production and Trade of Basmati Rice
86
requisite for obtaining higher input efficiency. The basmati cultivators also opined
that weeds are a problem because they affect production by reducing yield.
During our survey, we had asked some questions regarding qualitative
assessment of sampled farmers about infrastructure related problems. These
included erratic supply of power and non availability of inputs including seed,
fertilizer, insecticides, credit and human labour. The poor network of roads and
extension services were also added in the list. The shortage of human labour, power
and fertilizer were considered important problems by the sampled farmers.
Table-7.2 (a)
MAJOR PROBLEMS PERCEIVED BY SAMPLED FARMERS IN CULTIVATING BASMATI PADDY
(No of Farmers)
Problem RANK1 RANK2 RANK3 RANK4 TOTAL
Biotic problems
1) Lower Yield 50 59 20 1 130
2) Unstable yield 41 74 24 2 141
3) Diseases 8 64 75 2 149
4) Insecticide/Pesticides 2 62 77 9 150
5) Weeds 23 70 51 3 147
Infrastructure related problems
6) Erratic electricity supply 71 43 16 0 130
7) Non-availability of Inputs
Seed 43 25 5 0 73
Fertilizers 53 66 9 0 128
Insecticides 42 42 10 0 94
Credit 32 46 22 6 106
Labour 17 54 53 16 140
8) Poor road network for transportation 62 51 7 5 125
9) Lack of/poor extension services /lack of technical knowhow 51 61 6 0 118
Marketing problems
10) Price fluctuations 10 78 53 4 145
11) Lack of remunerative price 10 51 77 10 148
12) Lack of MSP/government procurement 13 47 60 27 147
13) Lack of market information 63 59 10 13 145
14) Collusion among traders/trade malpractices 46 56 46 0 148
15) Distant market 73 34 9 2 118
Environmental problems
16) Poor quality of underground water 54 24 5 1 84
17) Adverse climate conditions 42 23 12 1 78
Any other 13 4 2 0 19
Source: Ibid
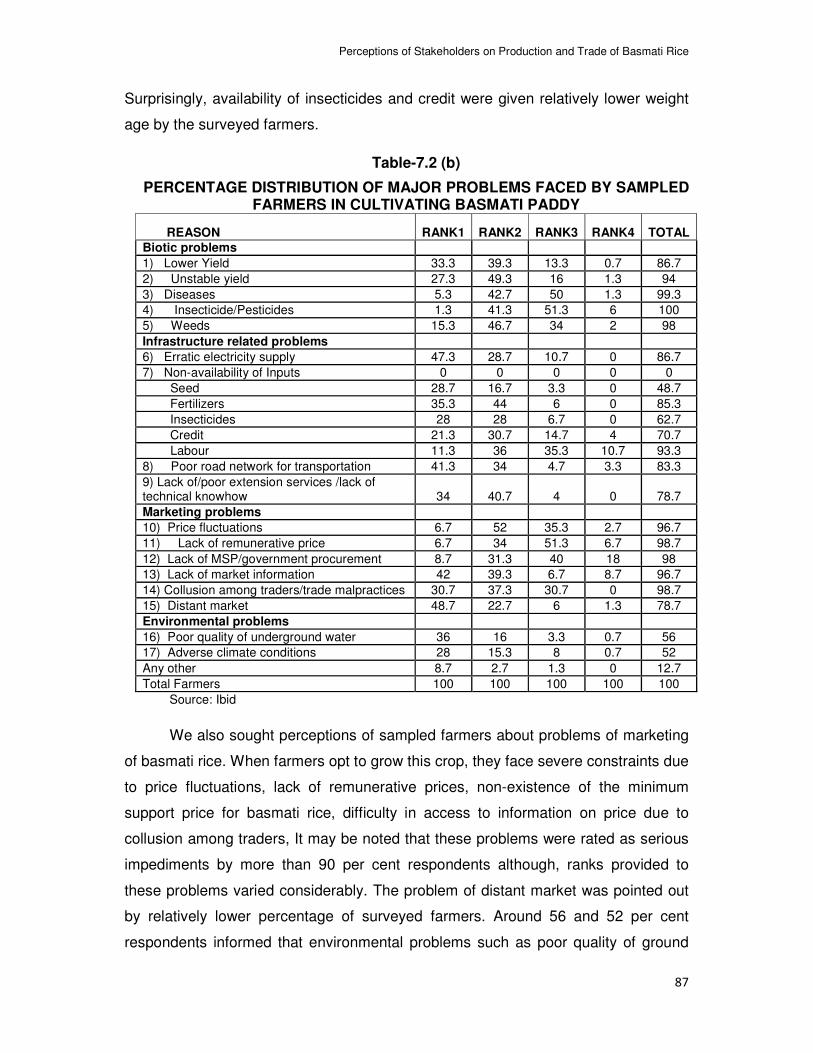
Perceptions of Stakeholders on Production and Trade of Basmati Rice
87
Surprisingly, availability of insecticides and credit were given relatively lower weight
age by the surveyed farmers.
Table-7.2 (b)
PERCENTAGE DISTRIBUTION OF MAJOR PROBLEMS FACED BY SAMPLED FARMERS IN CULTIVATING BASMATI PADDY
REASON RANK1 RANK2 RANK3 RANK4 TOTAL
Biotic problems
1) Lower Yield 33.3 39.3 13.3 0.7 86.7
2) Unstable yield 27.3 49.3 16 1.3 94
3) Diseases 5.3 42.7 50 1.3 99.3
4) Insecticide/Pesticides 1.3 41.3 51.3 6 100
5) Weeds 15.3 46.7 34 2 98
Infrastructure related problems
6) Erratic electricity supply 47.3 28.7 10.7 0 86.7
7) Non-availability of Inputs 0 0 0 0 0
Seed 28.7 16.7 3.3 0 48.7
Fertilizers 35.3 44 6 0 85.3
Insecticides 28 28 6.7 0 62.7
Credit 21.3 30.7 14.7 4 70.7
Labour 11.3 36 35.3 10.7 93.3
8) Poor road network for transportation 41.3 34 4.7 3.3 83.3
9) Lack of/poor extension services /lack of technical knowhow 34 40.7 4 0 78.7
Marketing problems
10) Price fluctuations 6.7 52 35.3 2.7 96.7
11) Lack of remunerative price 6.7 34 51.3 6.7 98.7
12) Lack of MSP/government procurement 8.7 31.3 40 18 98
13) Lack of market information 42 39.3 6.7 8.7 96.7
14) Collusion among traders/trade malpractices 30.7 37.3 30.7 0 98.7
15) Distant market 48.7 22.7 6 1.3 78.7
Environmental problems
16) Poor quality of underground water 36 16 3.3 0.7 56
17) Adverse climate conditions 28 15.3 8 0.7 52
Any other 8.7 2.7 1.3 0 12.7
Total Farmers 100 100 100 100 100
Source: Ibid
We also sought perceptions of sampled farmers about problems of marketing
of basmati rice. When farmers opt to grow this crop, they face severe constraints due
to price fluctuations, lack of remunerative prices, non-existence of the minimum
support price for basmati rice, difficulty in access to information on price due to
collusion among traders, It may be noted that these problems were rated as serious
impediments by more than 90 per cent respondents although, ranks provided to
these problems varied considerably. The problem of distant market was pointed out
by relatively lower percentage of surveyed farmers. Around 56 and 52 per cent
respondents informed that environmental problems such as poor quality of ground
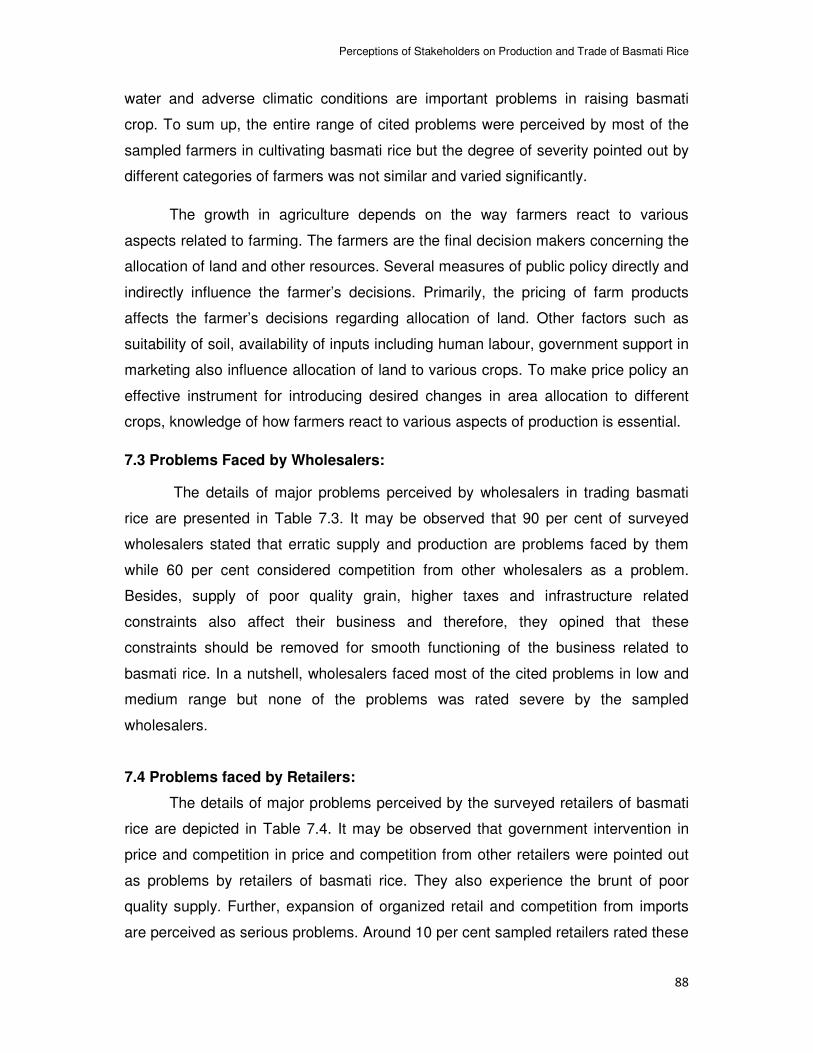
Perceptions of Stakeholders on Production and Trade of Basmati Rice
88
water and adverse climatic conditions are important problems in raising basmati
crop. To sum up, the entire range of cited problems were perceived by most of the
sampled farmers in cultivating basmati rice but the degree of severity pointed out by
different categories of farmers was not similar and varied significantly.
The growth in agriculture depends on the way farmers react to various
aspects related to farming. The farmers are the final decision makers concerning the
allocation of land and other resources. Several measures of public policy directly and
indirectly influence the farmer’s decisions. Primarily, the pricing of farm products
affects the farmer’s decisions regarding allocation of land. Other factors such as
suitability of soil, availability of inputs including human labour, government support in
marketing also influence allocation of land to various crops. To make price policy an
effective instrument for introducing desired changes in area allocation to different
crops, knowledge of how farmers react to various aspects of production is essential.
7.3 Problems Faced by Wholesalers:
The details of major problems perceived by wholesalers in trading basmati
rice are presented in Table 7.3. It may be observed that 90 per cent of surveyed
wholesalers stated that erratic supply and production are problems faced by them
while 60 per cent considered competition from other wholesalers as a problem.
Besides, supply of poor quality grain, higher taxes and infrastructure related
constraints also affect their business and therefore, they opined that these
constraints should be removed for smooth functioning of the business related to
basmati rice. In a nutshell, wholesalers faced most of the cited problems in low and
medium range but none of the problems was rated severe by the sampled
wholesalers.
7.4 Problems faced by Retailers:
The details of major problems perceived by the surveyed retailers of basmati
rice are depicted in Table 7.4. It may be observed that government intervention in
price and competition in price and competition from other retailers were pointed out
as problems by retailers of basmati rice. They also experience the brunt of poor
quality supply. Further, expansion of organized retail and competition from imports
are perceived as serious problems. Around 10 per cent sampled retailers rated these
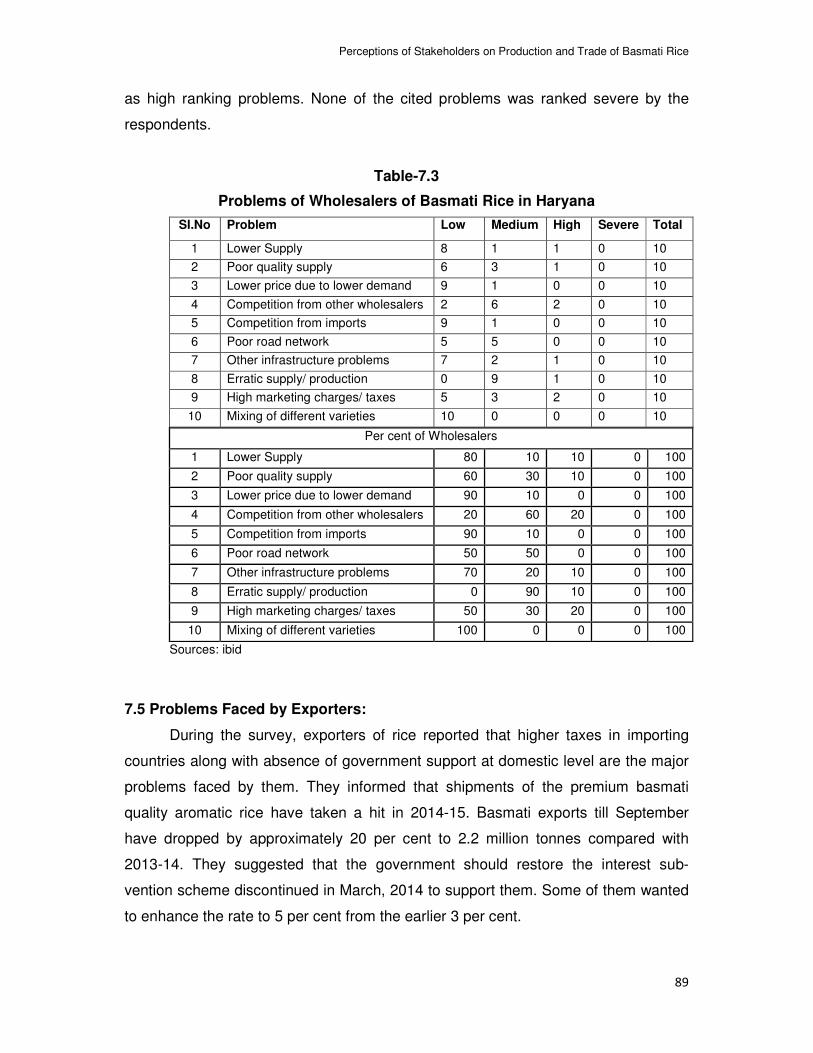
Perceptions of Stakeholders on Production and Trade of Basmati Rice
89
as high ranking problems. None of the cited problems was ranked severe by the
respondents.
Table-7.3
Problems of Wholesalers of Basmati Rice in Haryana
SI.No Problem Low Medium High Severe Total
1 Lower Supply 8 1 1 0 10
2 Poor quality supply 6 3 1 0 10
3 Lower price due to lower demand 9 1 0 0 10
4 Competition from other wholesalers 2 6 2 0 10
5 Competition from imports 9 1 0 0 10
6 Poor road network 5 5 0 0 10
7 Other infrastructure problems 7 2 1 0 10
8 Erratic supply/ production 0 9 1 0 10
9 High marketing charges/ taxes 5 3 2 0 10
10 Mixing of different varieties 10 0 0 0 10
Per cent of Wholesalers
1 Lower Supply 80 10 10 0 100
2 Poor quality supply 60 30 10 0 100
3 Lower price due to lower demand 90 10 0 0 100
4 Competition from other wholesalers 20 60 20 0 100
5 Competition from imports 90 10 0 0 100
6 Poor road network 50 50 0 0 100
7 Other infrastructure problems 70 20 10 0 100
8 Erratic supply/ production 0 90 10 0 100
9 High marketing charges/ taxes 50 30 20 0 100
10 Mixing of different varieties 100 0 0 0 100
Sources: ibid
7.5 Problems Faced by Exporters:
During the survey, exporters of rice reported that higher taxes in importing
countries along with absence of government support at domestic level are the major
problems faced by them. They informed that shipments of the premium basmati
quality aromatic rice have taken a hit in 2014-15. Basmati exports till September
have dropped by approximately 20 per cent to 2.2 million tonnes compared with
2013-14. They suggested that the government should restore the interest sub-
vention scheme discontinued in March, 2014 to support them. Some of them wanted
to enhance the rate to 5 per cent from the earlier 3 per cent.
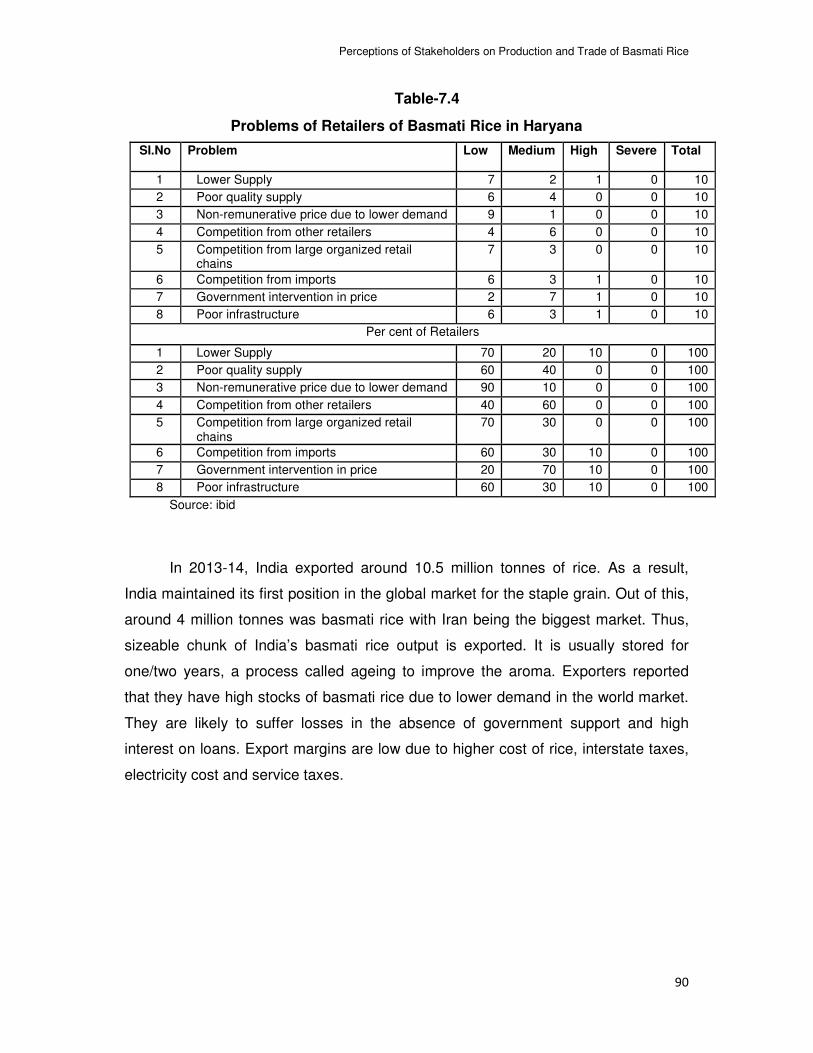
Perceptions of Stakeholders on Production and Trade of Basmati Rice
90
Table-7.4
Problems of Retailers of Basmati Rice in Haryana
SI.No Problem Low Medium High Severe Total
1 Lower Supply 7 2 1 0 10
2 Poor quality supply 6 4 0 0 10
3 Non-remunerative price due to lower demand 9 1 0 0 10
4 Competition from other retailers 4 6 0 0 10
5 Competition from large organized retail chains
7 3 0 0 10
6 Competition from imports 6 3 1 0 10
7 Government intervention in price 2 7 1 0 10
8 Poor infrastructure 6 3 1 0 10
Per cent of Retailers
1 Lower Supply 70 20 10 0 100
2 Poor quality supply 60 40 0 0 100
3 Non-remunerative price due to lower demand 90 10 0 0 100
4 Competition from other retailers 40 60 0 0 100
5 Competition from large organized retail chains
70 30 0 0 100
6 Competition from imports 60 30 10 0 100
7 Government intervention in price 20 70 10 0 100
8 Poor infrastructure 60 30 10 0 100
Source: ibid
In 2013-14, India exported around 10.5 million tonnes of rice. As a result,
India maintained its first position in the global market for the staple grain. Out of this,
around 4 million tonnes was basmati rice with Iran being the biggest market. Thus,
sizeable chunk of India’s basmati rice output is exported. It is usually stored for
one/two years, a process called ageing to improve the aroma. Exporters reported
that they have high stocks of basmati rice due to lower demand in the world market.
They are likely to suffer losses in the absence of government support and high
interest on loans. Export margins are low due to higher cost of rice, interstate taxes,
electricity cost and service taxes.
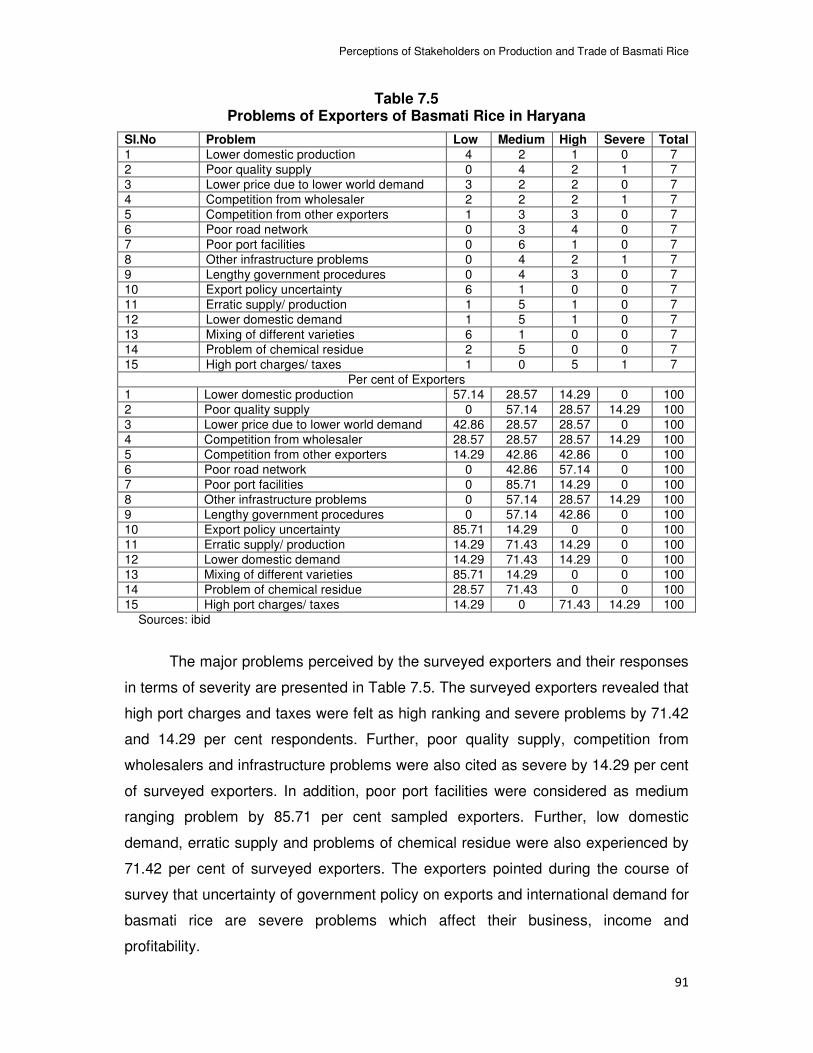
Perceptions of Stakeholders on Production and Trade of Basmati Rice
91
Table 7.5 Problems of Exporters of Basmati Rice in Haryana
SI.No Problem Low Medium High Severe Total
1 Lower domestic production 4 2 1 0 7
2 Poor quality supply 0 4 2 1 7
3 Lower price due to lower world demand 3 2 2 0 7
4 Competition from wholesaler 2 2 2 1 7
5 Competition from other exporters 1 3 3 0 7
6 Poor road network 0 3 4 0 7
7 Poor port facilities 0 6 1 0 7
8 Other infrastructure problems 0 4 2 1 7
9 Lengthy government procedures 0 4 3 0 7
10 Export policy uncertainty 6 1 0 0 7
11 Erratic supply/ production 1 5 1 0 7
12 Lower domestic demand 1 5 1 0 7
13 Mixing of different varieties 6 1 0 0 7
14 Problem of chemical residue 2 5 0 0 7
15 High port charges/ taxes 1 0 5 1 7
Per cent of Exporters
1 Lower domestic production 57.14 28.57 14.29 0 100
2 Poor quality supply 0 57.14 28.57 14.29 100
3 Lower price due to lower world demand 42.86 28.57 28.57 0 100
4 Competition from wholesaler 28.57 28.57 28.57 14.29 100
5 Competition from other exporters 14.29 42.86 42.86 0 100
6 Poor road network 0 42.86 57.14 0 100
7 Poor port facilities 0 85.71 14.29 0 100
8 Other infrastructure problems 0 57.14 28.57 14.29 100
9 Lengthy government procedures 0 57.14 42.86 0 100
10 Export policy uncertainty 85.71 14.29 0 0 100
11 Erratic supply/ production 14.29 71.43 14.29 0 100
12 Lower domestic demand 14.29 71.43 14.29 0 100
13 Mixing of different varieties 85.71 14.29 0 0 100
14 Problem of chemical residue 28.57 71.43 0 0 100
15 High port charges/ taxes 14.29 0 71.43 14.29 100
Sources: ibid
The major problems perceived by the surveyed exporters and their responses
in terms of severity are presented in Table 7.5. The surveyed exporters revealed that
high port charges and taxes were felt as high ranking and severe problems by 71.42
and 14.29 per cent respondents. Further, poor quality supply, competition from
wholesalers and infrastructure problems were also cited as severe by 14.29 per cent
of surveyed exporters. In addition, poor port facilities were considered as medium
ranging problem by 85.71 per cent sampled exporters. Further, low domestic
demand, erratic supply and problems of chemical residue were also experienced by
71.42 per cent of surveyed exporters. The exporters pointed during the course of
survey that uncertainty of government policy on exports and international demand for
basmati rice are severe problems which affect their business, income and
profitability.
Summary and Conclusions
92
Chapter-8
Summary and Conclusions
This chapter aims to present main findings of the study and to draw policy
implications in order to encourage farmers to adopt cultivation of basmati paddy in
Haryana. Most of the earlier studies on basmati paddy/rice in India are limited, based
on secondary data and do not provide farm size information. Literature based on in-
depth village studies at the micro level is limited to some studies and therefore, there
is an urgent need to conduct in-depth micro level studies. Such studies provide an
important insight that cannot be derived from secondary data based studies due to
availability of limited information. The present study is a departure from earlier
literature in terms of its focus on issues related to basmati production and sale at the
micro level and therefore, will be useful in framing future policy initiatives to promote
production and export of this valuable commodity. Although, Haryana is the leading
producer of basmati paddy in India, we have not come across any study which deals
with production and marketing aspects of basmati paddy in the state. This study was
planned to bridge this research gap. It is expected to benefit all stakeholders
involved in the process of production and marketing of basmati paddy/rice from
Haryana.
8.1 Objectives of the Study:
Food security, nutritional security, sustainability and profitability are the main
focus of present and future agricultural development. The crop rotation of rice-wheat
largely adopted in irrigated areas of Haryana has posed serious challenges in future
for sustainability of agriculture in the state. Adoption of basmati in cropping systems
could improve productivity and also the agro-eco-systems of the region. Further,
irrigation requirements of the area could be reduced through adoption of basmati,
thereby reducing pressure on depleting water table. In addition, basmati being a high
value crop will help in reducing production risk in mono-cropping and will raise
income of the farmers. This study aims to analyze issues related to basmati
production, marketing and perceptions of stake holders such as producers,
wholesalers, retailers and exporters of basmati rice in Haryana.
The specific objectives of the study are as under:
i) To analyse economics of major basmati varieties grown by the farmers in Haryana.
Summary and Conclusions
93
ii) To study the marketing pattern of basmati producers. iii) To study divergence among producer price, wholesaler price, retailer price and exporter price of basmati rice. iv) To analyse perceptions and problems of above stakeholders.
8.2 Research Methodology:
This study is conducted in the state of Haryana. It is based on published and
un-published sources of secondary and primary data. The relevant information about
the state and districts was obtained from various issues of the Statistical Abstract of
Haryana, Government of Haryana, Panchkula. Further, district-wise data on area,
production and yield of basmati were obtained from Statistics Department of
Haryana. The data on exports of basmati rice were culled from the APEDA website.
The Agri-net and FAO websites were also used to collect relevant information. The
required preliminary information regarding the selection of blocks and villages was
obtained from the district officials. The meetings with the Deputy Director of
Agriculture of selected districts were useful and informative. The sampling design for
primary survey for study was decided as per the study design provided by the
coordinator.
The scope of the study is confined to basmati rice in Haryana. Three districts
namely, Kaithal, Jind and Sonipat with highest share of area under basmati rice in
Haryana were selected for in-depth study. The selection of respondents is based on
multistage sampling design. At the first and second stages, basmati rice producing
districts and blocks in these districts were selected. At the third stage, villages were
selected on the same criterion. A questionnaire was canvassed to the farmers
growing basmati rice. All farm size categories i.e. marginal, small, medium and large
were covered in the sample. The number of farm households in each category was
decided according to their proportion at the district level. The primary data pertaining
to the year 2013-14 were collected from 150 farmers.
The popular basmati varieties grown in Haryana are Pusa Basmati-1121,
Pusa Basmati-1509, Pusa Basmati-1, CSR-30, Pusa Basmati-1401, Super, etc. The
total basmati area in Haryana was 741 thousand hectares in 2013-14. Out of which,
more than 50 per cent of area was devoted to Pusa Basmati-1121. The next was
Pusa Basmati-1509 covering more than 15 per cent of area. The remaining varieties
covered rest of the area. Considering the importance of Pusa Basmati-1121 and
Summary and Conclusions
94
Pusa Basmati-1509, we have carried out in-depth analysis for these varieties. The
reason for higher proportion of area under Pusa-1121 is better crop output and
popularity in the export market. It has superior grain length and excellent elongation
upon cooking and therefore, it has caught the fancy of the Iranian and other
International markets.
In addition, ten wholesalers, ten retailers and seven exporters of basmati rice
from the selected districts were surveyed to analyse prices and problems of
stakeholders dealing with basmati rice.
8.3 Main Findings:
Now, we present main findings of the study
a) Macro level Findings:
Area, Production and Yield of Basmati Paddy in India:
India produces about 7-8 million tonnes of basmati rice or 12 million tonnes
of paddy (at 66 per cent conversion ratio) primarily in three states namely, Haryana,
Punjab and Uttar Pradesh. It is one of the major export items from India. Exports of
basmati rice touched about 3 million tonnes, equivalent to Rs. 15336 crore during
2011-12. Pusa Basmati 1121/1509 which are hybrid varieties and yield higher than
traditional basmati have become popular in Iran and other export markets of West
Asia.
Traditionally, basmati rice is a crop of north-west Himalayas in India. This
area is blessed with producing extra long slender aromatic grain that elongate at
least twice of the original size with soft and fluffy texture upon cooking and has
delicious taste. Also, known as king of rice, basmati uses less water and fertilizer,
has high export potential and its straw is used for livestock feed, rather than burning
in the field and creating atmospheric pollution.
Exports of Basmati Rice from India:
Rice is a major export commodity from India. The steady increase in
production and growing demand for basmati in the world market has made India a
leading exporter in the world. The quantum of basmati exports from India was
around 267 thousand tonnes in 1991-92 which rose to 849 thousand tonnes in
2000-01 and increased phenomenally to a record scale of 3145 thousand tonnes in
Summary and Conclusions
95
2011-12. Similarly, the value too rose from around Rs. 499 crore in 1991-92 to Rs.
2155 crore in 2001-02 and further to Rs. 15335 crore in 2011-12 which turns out
around 1080 percentage points increase in quantum and 2972 percentage points
increase in value. The per unit price also followed the upward trend and rose from
Rs. 1873 per qtl in 1991-92 to Rs. 2538 per qtl in 2000-01 and further escalated to
Rs. 4876 per qtl in 2011-12.
We have also tried to examine the intra-year variability in quantity, value and
per unit price of basmati rice exported from India. We have estimated coefficient of
variation in these parameters during 2012-13, 2013-14 and 2014-15. The analysis of
monthly quantity, value and per qtl price of exports of basmati and non-basmati rice
suggests that around 30 per cent of quantity of basmati rice was exported in
January, February and March during 2012-13. The months of September and
October were found relatively lean months. However, pattern of exports of basmati
rice during 2013-14 deviated and the highest quantity was exported in the month of
April followed by June. Next year, around 33 per cent of basmati rice was exported in
February and March. The per qtl price of basmati rice in import market has increased
by 26.25 per cent between 2012-13 and 2014-15. We have observed variations in
price per qtl across the months in the year. The coefficient of variation was found
highest for value in 2012-13 and 2013-14 and for quantity in 2014-15.
The exports of basmati rice from India increased several folds during the past
two decades. India exports basmati rice to a large number of countries but major
importers are a few countries. Saudi Arab and Iran with more than 50 per cent share
in export are major buyers of Indian basmati rice. Other important importers are
United Arab Emirates, Iraq, Kuwait, Yemen Republic, Qutar, United Kingdom, USA
and Jordan. Omen, Netherlands, Australia and Mauritius also import Indian basmati
in small quantities. It may be noted that share of Saudi Arab and Iran in total exports
increased continuously. It was largely due to popularity of Pusa Basmati 1121 in
these countries. All these countries together imported around 90 per cent quantity of
Indian basmati rice in 2012-13, 2013-14 and 2014-15.
We have found intra year variability in quantity, value and per qtl price of
basmati rice across the months in 2012-13, 2013-14 and 2014-15. The coefficient of
Summary and Conclusions
96
variation was estimated higher for quantity and value in comparison to price during
all these years.
b) Socio-Economic Characteristics of Sampled Districts and Households
Sampled Districts:
At the outset, we provide basic information about the important
indicators of the selected districts for the survey from the state of Haryana.
i) The total population of Sonipat, Jind and Kaithal districts was14.50, 9.42
and 10.74 lakh respectively during 2011. Surprisingly, around 78 per cent
of population in Jind and Kaithal is rural based. Education, although a
catalytic factor in development has exhibited poor performance in Jind and
Kaithal districts. The share of agricultural workers in total workers in
selected districts was between 47 and 64 per cent. The share of non-
agricultural workers in Sonipat was around 53 per cent. It appeared that
growing work opportunities in these districts could not benefit rural
population. The composition of workers in farm and non-farm sectors was
markedly different across the selected districts for field survey. Sonipat
has shown around 53 per cent workers engaged in the non-farm sector.
On the contrary, Jind has exhibited.36 per cent of the work force involved
in this sector. Thus, Sonipat is much ahead of other selected districts in
rural non-farm employment.
(ii) A comparison of important indicators of agricultural development reveals wide
disparities across the selected districts. The agricultural economy of all these
districts is food grains based with an area allocation of 88-89 per cent of GCA
under these crops except for Jind where around 76 per cent of GCA was
devoted to these crops. Cotton is grown on more than 10 per cent of GCA in
Jind district. The irrigation status, yield rates of important crops, input uses
were analyzed to gauge the disparities in agricultural development. Out of the
selected districts, Kaithal appeared to be ahead in productivity of paddy and
cotton in comparison to other selected districts.
(iii) The infrastructural development of selected districts was distinctively
different. Sonipat is one of the important industrial and commercial centre near
Summary and Conclusions
97
the capital city of Delhi, therefore, it is found rich in infrastructure such as
roads.
Sampled Households:
For an understanding of basmati production and marketing, we have looked
into main indicators related to population, land resources and crop pattern of the
sampled households.
Demographic Characteristics:
The average size of the family of selected farm households was 8 persons at
the aggregate level. Farm size and average size of family were not related. The large
farmers indicated an average size of family around 9 persons against 6 persons by
small households. It could be due to prevalence of joint family system. The literacy
rate of the head of households was not found to be impressive however, head of
small farm households indicated higher level of literacy.
Land Resources:
The nature of land ownership influences crop pattern, adoption of technology
and innovation. At the aggregate level, land owned by selected farmers was 483
hectares. The practice of leasing-in land was prevalent but a small share of land was
leased out. The net operated area per household was 4.99 hectares. A positive
relationship emerged between land operated and farm size. Thus, large farmers
operated 7.6 hectares against 1.39 by small farmers. Tubewells are the major source
of irrigation. Some farmers combined tubewells and canal for watering their fields.
The sources such as tanks are non-existent.
Crop Pattern:
The crop pattern on the sampled farms indicated that wheat and paddy are
the dominant crops which occupied around 80 per cent of GCA. Paddy is the main
crop grown by the farmers in kharif season occupying 40 per cent of GCA. The
commercial crop of cotton was allotted 3 per cent of GCA. The most important
coarse cereal crop of bajra received only 0.13 per cent of GCA and maize was
grown on 0.71 per cent of GCA. The farm size variations were common in allocation
of area to different crops grown by the farmers.
Summary and Conclusions
98
Basmati paddy was grown on around 549 hectares by the sampled farmers.
The largest proportion of basmati paddy was devoted to Pusa Basmati 1121. Each
surveyed farmer had sown this variety due to better yield and demand in the export
market. A much lower share of total basmati paddy (6.63 per cent) was allotted to
Pusa Basmati 1509. A summary of results on proportion of total basmati area
allocated to Basmati 1121 + 1509 reveals that it was the maximum in case of
marginal farmers. Other categories also devoted more than 80 per cent of basmati
area to these varieties.
c) Production and Disposal:
An analysis of production, retention and disposal of Pusa Basmati 1121 and
Pusa Basmati 1509 grown by the farm households during the reference year
revealed that production of Basmati 1121 was around 113 qtls per farm during 2013-
14. Farm size variations were found wide. The sampled households retained a part
of production i.e. 1.97 qtls for domestic consumption. In retention, self consumption
dominated whereas other requirements were found marginal. The quantity of
Basmati 1121 sold was around 16529 qtls whereas, a smaller quantity of 1532 qtls of
Basmati 1509 was disposed during the reference year. Since large farm category
produced higher quantity than other categories, they also dominated in sales. The
price of Basmati 1121 realized by the farmers was Rs. 3607 per qtl while Rs.3364
per qtl were received for Basmati 1509. The produce of basmati was sold primarily to
commission agents followed by village traders.
d) Economics of Basmati Paddy Cultivation:
We have analyzed cost of cultivation and economics of production of Basmati
1121 and Basmati 1509 grown by the sampled farmers during kharif season of 2013-
14 in Haryana. In addition, we have examined value of marketed surplus of these
varieties.
Cost of Cultivation:
The sampled farmers incurred cost on human labour, seed, irrigation, fertilizer
and manure and pesticides used by them in cultivation of basmati paddy in kharif
season. They also incurred expenditure on storage, transportation and marketing.
The per hectare cost of cultivating Basmati 1121 was Rs. 39850 on sampled farms
Summary and Conclusions
99
and the maximum proportion of cost was incurred on human labour followed by
chemical fertilizer and pesticides. Findings show that per hectare cost of cultivating
Basmati 1509 on sampled farms was Rs. 35447 during 2013-14. The human labour
and fertilizer were found the major components of cost. Thus, human labour,
machine labour, fertilizer and plant protection were the major items in cost
composition in cultivation of study crops.
To sum up, cost of cultivation varies from one crop to another. Farm size
variations are common. Among the included crops, cost of cultivation was found
higher in production of Basmati 1121 due to relatively higher expenditure on human
labour, fertilizer and machine labour.
e) Returns from Cultivation of Basmati 1121 and Basmati 1509:
The per hectare yield of Basmati 1121 on sampled farms was 40.32qtls. Farm
size and productivity were found related. Thus, productivity on marginal farms was
higher than large farms. After deducting the cost from gross returns, producers
earned a profitability of Rs. 1,09,903 per hectare during 2013-14. As expected,
marketed surplus in terms of value was much higher in case of large farmers in
comparison to other categories. The net returns per qtl from Basmati 1121 were Rs.
2700 and these were found highest on marginal farms.
The results of economics of Basmati 1509 revealed that per hectare input cost
of cultivation was Rs. 30787 on sampled farms during the reference year. The major
cost items were human labour followed by fertilizer and machinery. Other costs such
as storage, transportation, marketing cess, etc were estimated Rs. 4491 per hectare.
Thus, total cost of basmati 1509 cultivation was Rs. 35278 per hectare on sampled
farms. In particular, marginal farmers incurred higher cost in comparison to other
categories. The net returns per hectare after deducting the cost from gross returns
were computed Rs. 113569 during 2013-14. The net returns per qtl were estimated
Rs. 2617. Like basmati 1121, marketed surplus was recorded higher on large farms
in comparison to other categories.
After combining the results for cost of cultivation and net returns from Basmati
1121 and 1509, it was found that sampled producers earned a profit of Rs. 109276
per hectare and Rs. 2693 per qtl during 2013-14. The share of marginal, small,
medium and large categories of farmers in marketed surplus of basmati paddy was
positively related to farm size.
Summary and Conclusions
100
f) Marketing of Basmati Rice:
Most of the sampled basmati paddy growers disposed their produce in the
village market and through commission agents. Some of them combined both the
channels. The proportion of farmers selling produce of Basmati 1121 through these
channels was 39 and 65 per cent respectively. The sampled farmers sold 110 qtls of
Basmati 1121 and 63.85 qtls of Basmati 1509 per farm during 2013-14. They
received a price of Rs. 3607 and Rs. 3554 per qtl at the overall level. We could not
ascertain any relationship between the price realized and farm size. Basmati 1121
sold through village market and commission agents was 8537 qtls and 7992 qtls,
which turns out as 51 and 49 per cent respectively. Among different categories,
marginal farmers sold 27 qtls in the village market and 205 qtls through commission
agents. They realized a price of Rs. 3181 and Rs. 3909 per qtl respectively. The
large proportion of Basmati 1121 produce was sold immediately after the harvest in
November, 2013. The produce stocked for future sale was disposed in December
2013, January 2014 and February 2014. The producers realized highest price of
Basmati 1121 in January 2014 in the village market and through commission agents
in December 2013
In case of Basmati 1509, farmers preferred commission agents but also sold
some quantity in the village market. It is unexpected that they received higher price
in sale through commission agents. Like Basmati 1121, most of the marketed
surplus was sold in the harvesting month of November 2013. A small quantity of
produce was retained by some farmers for future sale and it was sold in the month of
December 2013 and January 2014. The price realized was the maximum through
disposal in the month of December 2013.
The intermediaries play an important role in functioning of supply chain of
food commodities. We had examined sources of their supply for basmati rice. The
wholesalers sourced their supply from millers while retailers purchased their stock
from wholesalers. The exporters purchased paddy through commission agents in the
regulated market. They have milling facility in their premises and therefore, they
process paddy in their own units.
Summary and Conclusions
101
g) Price Pattern of Basmati Rice:
Price of agricultural commodities has multiple implications for all
stakeholders. Prices help in balancing demand and supply, allocation of scarce
resources and in regulating the movement of agricultural items across the regions.
We had worked out price spread i.e. share of consumer’s rupee received by the
producers for study crops. In addition, purchase and sale prices of Basmati 1121 and
Basmati 1509 and margins of stakeholders such as wholesalers, retailers and
exporters are analysed for a period from October 2013 to March 2014.
Findings show that producers of Basmati 1121 and Basmati 1509 received
66.41 and 63.62 per cent of the consumer’s rupee. The balance was reaped by
intermediaries in the supply chain.
The wholesalers sold an average quantity of 13.72 and 5.25 qtls of Basmati
1121 and Basmati 1509 during the reference period. The total quantity disposed was
18.97 qtls per month. They earned a margin of 4.34 per cent. The retailers sold 1.19
qtls and 0.59 qtl of Basmati 1121 and 1509. They sold an average quantity of 1.78
quintals per month. The maximum sale occurred in the festival months of October
and November, 2013. The percentage mark up of retailers was 6.81 per cent after
combining Basmati 1121 and Basmati 1509 during the reference period.
The primary survey of exporters revealed that they exported an average
quantity of 6990 qtls of Basmati 1121 and 1551 qtls of Basmati 1509 during the
reference period of Oct 2013 to March 2014. Evidently, quantum of exports of
Basmati 1121 was around four times as compared to Basmati 1509. It was largely
due to international demand for this variety in countries like Iran. In December 2013,
quantum of exports of above mentioned varieties was higher in comparison to other
months under consideration. The per qtl price realized from exports of Basmati 1121
was Rs. 8127 while it was Rs. 7424 for Basmati 1509. The percentage mark up of
exporters was 11.43 per cent and 10.50 per cent respectively for these varieties of
basmati rice. At the overall level, this margin was 11 per cent during the study
period. To conclude, the exporters earned higher margins in comparison to domestic
intermediaries including wholesalers and retailers.
Summary and Conclusions
102
h) Perceptions of Stakeholders:
We had gauged the perceptions of stakeholders involved in the process of
production to exports of basmati rice through perceived problems by them. The
stakeholders included producers, wholesalers, retailers and exporters.
Agriculture is a risky business because it deals with uncertain factors such as
weather and market conditions. During the course of survey, we had asked farmers
about reasons for growing basmati paddy. They rated profitability followed by
suitability of land as primary factors governing their decisions for allocation of land to
basmati paddy. They reported that they face umpteen problems during cultivation of
basmati paddy such as lower and unstable yield, shortage of human labour and
other inputs. They also stated that instability in price, lack of remunerative price and
non-existence of minimum support price are serious constraints in their efforts. The
problems are further aggravated by environmental problems such as poor quality of
ground water and adverse climatic conditions. The wholesalers of basmati 1121 and
basmati 1509 perceived the problems such as lower price due to lower domestic
demand, competition from imports, supply of poor quality grain, mixing of varieties
and infrastructural problems.
The retailers of basmati rice reported problems such as non-remunerative
price, competition from large organized retail chains, lower supply of the grain in the
market when demand in the international market is higher than the available supply.
8.4 Policy Implications:
Basmati rice is a great strength of India since its quality in terms of grain
length and aroma can hardly match any other variety of rice in the world. There has
been commendable increase in the production of basmati in the country due to area
expansion and yield enhancement. The steady increase in production and growing
demand in world market has made India a leading exporter of basmati rice in the
world. This has benefited all stakeholders including farmers. However, a huge
potential still remains to be realized. Haryana is the leading producer of basmati rice
in India. The production can be further improved through pragmatic policy initiatives.
The following policy measures are recommended for achieving this objective.
Summary and Conclusions
103
1. Yield enhancement of basmati paddy through research on improved
varieties and their transfer at the farm level.
2. In addition to technology generation for improved yield of basmati paddy,
timely delivery of required inputs at reasonable price to the farmers should
be prioritized.
3. Pesticide residues in the produce of basmati rice create serious problem in
matching international standards of food safety. Therefore, extension
department should organize regularly awareness camps for the producers
in order to promote balance use of fertilizer and pesticides.
4. Provision of necessary physical (storage, credit, etc) and marketing
infrastructure.
5. Streamlining the administrative procedures for export of basmati rice.
Bibliography
104
Bibliography:
1. Acharya, S.S.; Ramesh Chand; P.S. Birthal; Shiv Kumar and D.S. Negi.
(2012). Market Integration and Price Transmission in India: A Case of Rice and Wheat with Special Reference to the World Food Crisis of 2007/08, www.fao.org, Rome, Italy.
2. Ali, Mubarik (1995). Institutional and Socioeconomic Constraints on the Second-Generation Green Revolution: A Case Study of Basmati Rice Production in Pakistan's Punjab. Economic Development and Cultural Change, 43(4):835-861p.
3. Ali, Mubarik and John C. Flinn. (1989). Profit Efficiency among Basmati Rice Producers in Pakistan Punjab. American Journal of Agricultural Economics, 71(2):303-310p.
4. Aslam. (1979). Rice Policy of the European Community and Prospects of Rice Export from Pakistan. Pakistan Economic and Social Review, 17(1/2):50-65p.
5. Brar, A.S; S.S. Mahal; G.S. Buttar and J.S. Deol. (2011). Water Productivity, Economics and Energetic of Basmati Rice (Oryza Sativa) Wheat (Triticum Aestivum) Under Different Methods of Crop Establishment. Indian Journal of Agronomy, 56(4):317-320p.
6. Chaudhry, M. Ghaffar; and Nighat Naheed Kayani. (1991). Implicit Taxation of Pakistan's Agriculture: An Analysis of the Commodity and Input Prices. The Pakistan Development Review, 30(3):225-242p.
7. David, C. Cristina and Jikun Huang. (1996). Political Economy of Rice Price Protection in Asia. Economic Development and Cultural Change, 44(3):463-483p.
8. Dorosh, Paul A. (2008). Regional Trade and Food Price Stabilization in South Asia: Policy Responses to the 2007-08 World Price Shocks. The Pakistan Development Review, 47(4):803-813p.
9. Dwivedi, Sudhakar; M.C. Dwivedi; and Tarunvir Singh. (2011). An Economic Analysis of Basmati Rice Production in Jammu district of Jammu and Kashmir. Journal of Research, SKUAST-J, 10(1):93-99p.
10. Farooq, Umar; Trevor Young; Noel Russell and Muhammad Iqbal. (2001). The Supply Response of Basmati Rice Growers in Punjab, Pakistan: Price and Non-Price Determinants. Journal of International Development, 13(2):227-237p.
11. Ghani, Abdul; Jeffrey C. Metzel and B. Lynn Salinger. (1993). Diversification within Rice: Production Opportunities and Export Prospects of Specialty Rice in Bangladesh. The Bangladesh Development Studies, 21(3):111-123p.
12. Grover, D.K. (2012). Basmati Rice Cultivation for Resource Conservation and use Efficiency in Context of Sustainable Agriculture in Punjab, Indian Journal of Economic Development, 8(2):11-26p.
13. Iqbal, Nuzhat. (1993). Economic Analysis of the Effects of Rice Price Distortions in Pakistan: 1975-90. The Pakistan Development Review 32(4):859-872p.
14. Khatkar, R.K.; J.C. Karwasra; V.K. Singh and Jitender Kumar Bhatiya. (2014). Market Co-Integration, Price Discovery and Causation of Basmati Paddy in Haryana. Indian Journal Economic Development, 10(1a):38-44p.
Bibliography
105
15. Kurosaki, Takashi. (1996). Government Interventions, Market Integration, and Price Risk in Pakistan's Punjab. The Pakistan Development Review, 35(2):129-144p.
16. Kumar, Parmod; R.K. Sharma. (2003). Spatial Price Integration And Pricing Efficiency At The Farm Level: A Study of Paddy in Haryana. Indian Journal of Agricultural Economics, 58(2):201-217p
17. Mallik, Jayanta Kumar. (2005). India's Exports: Policy Defeating Exchange Rate Arithmetic. Economic and Political Weekly, 40(52):5486-5496p.
18. Mukesh; Ishwar Singh; R.K. Pannu; Dasharath Prasad and Asha Ram. (2013). Effects of Different Transplanting Dates on Yield and Quality of Basmati Rice (Oryza Sativa) Varieties. Indian Journal of Agronomy, 58(2): 256-258p.
19. Mulik, Kranti and John M Crespi. (2011). Geographical Indications and the Trade Related Intellectual Property Rights Agreement (TRIPS): A Case Study of Basmati Rice Exports. Journal of Agricultural & Food Industrial Organization, 9(4):1-26p.
20. Nagaraju, J.; M. Kathirvel; R. Ramesh Kumar; E.A. Siddiq and Seyed E. Hasnain. (2002). Genetic Analysis of Traditional and Evolved Basmati and Non-Basmati Rice Varieties by Using Fluorescence-Based ISSR-PCR and SSR Markers. The National Academy of Sciences of the United States of America, 99(9):5836-5841p.
21. Reddy, A. R and C. Sen. (2004). Technical Inefficiency in Rice Production and its Relationship with Farm-Specific Socio-Economic Characteristics. Indian Journal of Agricultural Economics, 59(2):259-267p.
22. Samal, P; A.K. Mishra. (2003). GATT Commitments and Rice Exports: Issues for the Indian Rice Sector. Indian Journal of Agricultural Economics, 58(3):400-401p.
23. Sekhar, C. S. C. (2008). World Rice Crisis: Issues and Options. Economic and Political Weekly, 43(26/27):13-17p.
24. Sekhar, C S C. (2003). Agricultural Trade Liberalisation-Likely Implications for Rice Sector in India. Indian Journal of Agricultural Economics, 58(1):42-63p.
25. Sharma; Anil and Parmod Kumar. (2001). An Analysis of the Price Behavior of Selected Commodities. planningcommission.gov.in, GoI.
26. Sidhu, J.S.; Jasdev Singh and Raj Kumar. (2014). Role of Market Intelligence in Agriculture: A Success Story of Basmati Cultivation in Punjab. Indian Journal of Economic Development, 10(1a): 26-31p.
27. Zulfiqar, Muhammad; Dilawar Khan; Anwar F Chishti; Munir Khan; Wasiullah; Ajmal Waheed; Muhammad Zakir and Robina Karim. (2009). Trade Liberalisation Could Improve Producers Profitability in Agriculture: A Case of Basmati, Rice. The Pakistan Development Review, 48(4):771-782p.
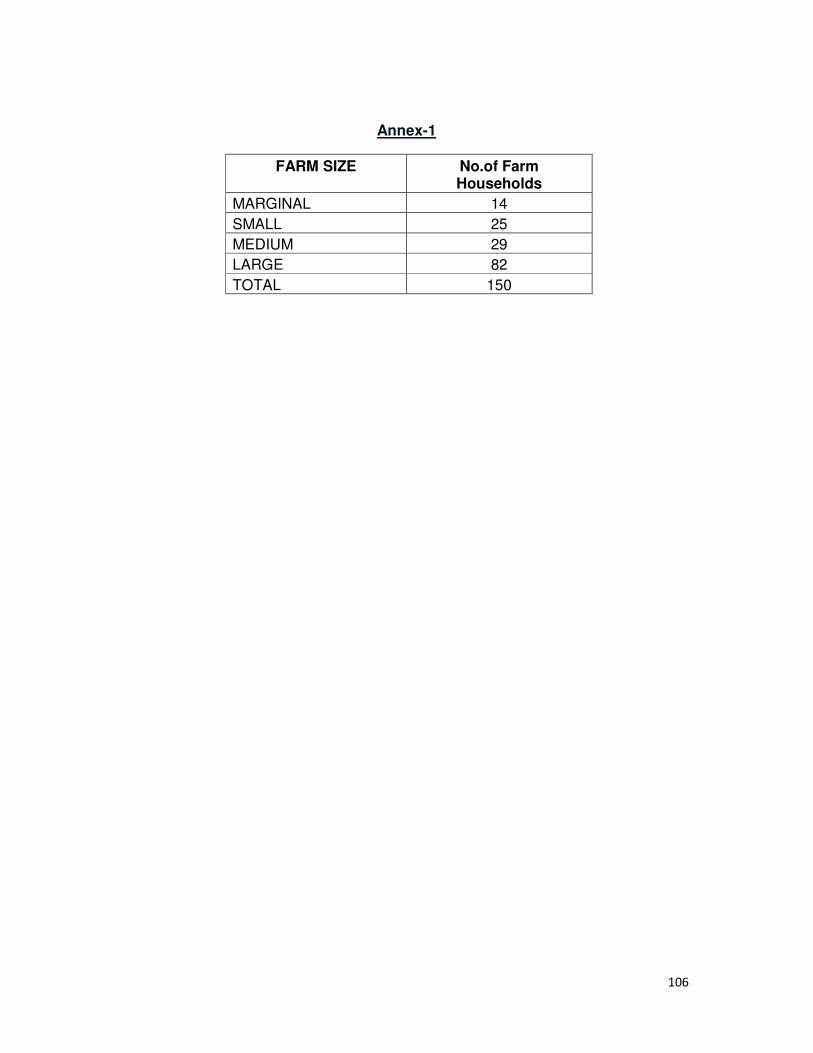
106
Annex-1
FARM SIZE
No.of Farm Households
MARGINAL 14
SMALL 25
MEDIUM 29
LARGE 82
TOTAL 150
107
Action taken on Comments
Comments on Report “Relationship between Wholesale Prices, Retail Prices and Export Prices of
Basmati rice in Haryana”
We are thankful to Dr. C.S.C. Sekher, Associate Professor, IEG for useful comments on the above
submitted draft report.
General comment:
This is a well-written report with a good overview chapter and literature review. Tabulation is mostly
as per the format suggested by the coordinating centre. The action taken on comments is as under:
Chapter 3
i) Please provide a table on the number of households in each size-category
--------------------------table incorporated as Annex-1
ii) Matching of total area irrigated and un-irrigated to total area under all crops in
case of sampled farmers.
---------------These would not match since first is NAS and second is GCA.
iii) Table 3.9 is a repetition of Table 3.8 and may be removed.
---------------Table 3.9 is deleted.
Chapter 4
i) Number of households in tables 4.1, 4.2 and 4.3.
--------------Provided.
ii) “Machinery hired / owned charges” include imputed value of owned machinery
----------------Checked and found correct.
Chapter 5
i) Sum of households marketing through village market and commission
----------yes, several farmers are marketing their Basmati produce through both
the Channels
Chapter 6
i) Price patterns over time using secondary data,
---------Secondary date for the state of Haryana are not available.
Chapter 7
i)and ii) Matching of distribution to 100.
-----------These are multiple responses and therefore, would not be 100.