agreeing to disagree: uncertainty management in assessing climate change, impacts and responses by...
TRANSCRIPT
Agreeing to disagree: Uncertainty management in assessing climate change, impacts and responses by the IPCC
by Rob Swart1, Lenny Bernstein2, Minh Ha-Duong3 and Arthur Petersen4
(Revised and submitted to Climatic Change: 17/12/2007)
Abstract5
Dealing consistently with risk and uncertainty across the IPCC reports is a difficult challenge. Huge practical difficulties arise from the Panel's scale and interdisciplinary context, the complexity of the climate change issue and its political context. The key question of this paper is if the observed differences in the handling of uncertainties by the three IPCC Working Groups can be clarified. To address this question, the paper reviews a few key issues on the foundations of uncertainty analysis, and summarizes the history of the treatment of uncertainty by the IPCC. One of the key findings is that there is reason to agree to disagree: the fundamental differences between the issues covered by the IPCC’s three interdisciplinary Working Groups, between the type of information available, and between the dominant paradigms of the practitioners, legitimately lead to different approaches. We argue that properly using the IPCC’s Guidance Notes for Lead Authors for addressing uncertainty, adding a pedigree analysis for key findings, and particularly communicating the diverse nature of uncertainty to the users of the assessment would increase the quality of the assessment. This approach would provide information about the nature of the uncertainties in addition to their magnitude and the confidence assessors have in their findings.
1 Corresponding author; Netherlands Environmental Assessment Agency (MNP), P.O. Box 303, 3720 AH Bilthoven, Netherlands; email: [email protected]
2 L.S. Bernstein & Associates, L.L.C., 488 Kimberly Avenue, Asheville, NC 28804, USA, email: [email protected]
3 Centre International de Recherche sur l'Environnement et le Développement (CIRED), Campus du Jardin Tropical 45bis Ave. de la Belle Gabrielle F94736 Nogent-sur-Marne CEDEX FRANCE; email: [email protected]
4 Netherlands Environmental Assessment Agency (MNP), P.O. Box 303, 3720 AH Bilthoven, Netherlands; email: [email protected]@mnp.nl
5 We acknowledge useful comments on earlier drafts of this paper from Suraje Dessai of the Tyndall Centre, Peter Janssen of the Netherlands Environmental Assessment Agency, Matthieu Craye of the European Commission’s Joint Research Center, James Risbey of the Australian Commonwealth Scientific and Industrial Research Organisation, and one anonymous reviewer.
1. Introduction
Since its inception, the Intergovernmental Panel on Climate Change (IPCC) has given increasing attention to the management and reporting of uncertainties. Since the start of the IPCC, the author teams of the different Working Groups (WGs) have differed in terms of the level of attention paid to, and methods applied for, assessing uncertainty. Most visibly attention has been given to the communication of uncertainties by the natural scientists in the areas of climate science and impacts, and to a lesser extent, or at least very differently, by social scientists in the assessment of vulnerability, sources of greenhouse gas emissions, and adaptation and mitigation options. For the Third and Fourth Assessment Reports (TAR and AR4), an effort was made to enhance consistency in the treatment of uncertainties by the various WGs by developing guidance papers prepared for all WGs at the beginning of the writing process. This led to fairly consistent treatment of uncertainties within but not across WGs, neither in the TAR, nor in the AR4. WG I focused on uncertainties in climatic processes and probabilities and WG II on risks and confidence levels. During the TAR process, these guidelines were hardly used by the authors of WG III (primarily economists and other social scientists), who continued to address uncertainties less systematically and in a different fashion. During the AR4, they adopted a common qualitative approach. The issues covered by the social scientists have a different nature from those covered by the natural scientists, adding uncertainties related to human choice to the lack of scientific understanding of the systems which determine climatic changes and associated impacts. What are the reasons for these different approaches? Are they legitimate? What are the implications for future assessments? These are the key questions addressed in this paper.
Processes within the scientific community and interactions with the external world of policy makers and other stakeholders are critical for the robustness of findings (e.g., Craye et al., 2005). Hence, frameworks other than the IPCC may lead to different results. However, in this paper, we take the position and procedures of the IPCC as an intermediary between science and policy as a given, and do not discuss alternative ways of communicating scientific climate change research and associated uncertainties, ways that may or may not be more effective. Still, within the limits of the IPCC, even if its procedures are fixed in negotiated documents, there may be opportunities for adapting procedures to improve uncertainty communication.
This paper is based in two qualitative methods: the authors’ observations as IPCC participants (taken together, their experiences cover all four assessments), and IPCC document analysis. It discusses typologies of uncertainties relevant to climate change in general and mitigation in particular (Section 2), the history of the treatment of uncertainties by the IPCC (Section 3), the challenges of addressing uncertainties from diverse perspectives, taking costs and potentials of mitigation options as a case study (Section 4), and finally it proposes how improvements can be made in future IPCC reports, focusing on WG III, the WG to which the first three authors of this paper contributed during the AR4 (Section 5).
2. Typologies of uncertainties relevant to climate change
Dealing consistently with risk and uncertainty across the IPCC reports is a difficult challenge. Huge practical difficulties arise from the Panel's scale alone: any coordination in a very heterogeneous community is difficult, especially when there is no single authoritative management point of view, but thousands of scientists contributing on a voluntary basis from all parts of the world. Moreover, climate change assessments are written in a very interdisciplinary context by climatologists, engineers, ecologists, economists, political scientists and other experts. These difficulties of scale and interdisciplinarity are
2
compounded by the complexity of the climate issue and the link of the IPCC process to the political negotiations. These technical and philosophical problems are not completely new. Indeed researchers of all kinds have thought about the nature of knowledge and ignorance for centuries. Reviewing a few key issues on the foundations of uncertainty analysis sets the context for this paper by identifying more precisely the difficulties facing the IPCC.
Towards a common goal: to improve the assessment and communication of uncertainties
What should be the IPCC goal in elaborating common guidelines on uncertainties for its future reports, and how much convergence should be aimed for? In our view, the primary goal of guidance to authors is to encourage them to acknowledge the importance of uncertainties and describe their full range and the multiplicity of views in a transparent fashion. In order to reach this goal, guidance should (a) establish a vocabulary to describe levels of confidence or of probability consistent across all WGs and from one report to the next; (b) educate the writing teams with the basic elements of the science (or art) of uncertainty communication; (c) establish the view that different approaches to scientific knowledge and uncertainty are legitimate, and (d) enable the authors to help the readers of the assessment understand not only how large uncertainties are and how confident the assessors are about their findings, but also the nature and origin of the uncertainties.
Additionally, recommendations to the writing teams should be based on the state of the art in the scientific understanding of risk and uncertainty communication. They should fit well with the models of risk, uncertainty, rationality and decision making used by the researchers. At the same time, they should be convenient to follow by IPCC authors. They should lead to effective communication of the risk and uncertainty aspects of the assessment to the intended audience. Such a set of guidelines can be valuable well beyond the IPCC community, to other international academic bodies concerned with risks and uncertainties. For example, the authors of the Millennium Ecosystem Assessment (e.g., MA, 2005) used – with mixed success – the earlier experience from the IPCC Third Assessment, adapting the “likelihood” scale of WG I and the qualitative scale from the IPCC Third Assessment Report (TAR) Guidance (see below). A similar IPCC-derived approach was used by the Arctic Climate Impact Assessment (ACIA, 2004).
Recognizing philosophical controversies, and agreeing to disagree
Uncertainties can have different “locations” (that is, where in the assessment the uncertainties arise, e.g., in the context, input data, model/methodology, or selection of output variables), different “levels” (statistical uncertainty, scenario uncertainty and recognized ignorance), a different nature (epistemic, variability), a different qualification of the knowledge base (from weak to strong), and they involve value-ladenness of choices (Table 1, see also Walker et al., 2003; Janssen et al., 2005; Petersen, 2006). First, they depend on the context of the assessment and the ecological, technological, economic, social and political questions that the assessment addresses: how do we define the problem, and which choices do we make in this definition? Second, uncertainties arise at the level of observations (measurements for natural phenomena and some socio-economic statistics, possibly survey data for other socio-economic, political and cultural issues) and how the data from observations are turned into indicators used in the assessment (e.g. by combinations of variables, statistical methods). Third, various types of uncertainties arise when models are used, such as choices of parameters and model relationships, soft- and hardware implementation of those relationships, and the selection of input data. Fourth, uncertainties are introduced when outputs are processed, e.g. through the formulation of statements and key findings, and by constructing indicators to communicate these findings.
Expert judgment is generally used in all steps of an assessment. For example, Kloprogge et al. (2005) conducted a workshop-supported analysis of two indicators from the 5th Dutch
3
Environmental Outlook, the projected change in the length of the growing season as a result of climate change, and deaths and hospital admittances due to ozone exposure. For the first indicator, 7 discrete steps in the assessment process were identified, involving 19 explicit or implicit assumptions. For the second indicator, 5 steps and 18 assumptions were identified. These assumptions were mapped and prioritized, their value-ladenness was analyzed, and communication of the prioritized assumptions and their value-ladenness was discussed. This was a major effort for only two indicators at the national level. Doing the same thing for the much larger number of indicators reported in IPCC assessments by author teams would be next to impossible. In some cases, authors can rely on uncertainty analyses reported in the peer reviewed literature that forms the basis for the assessment, but in many cases, they have to judge the uncertainties without that information.
Experts can relatively easily agree on the different locations of uncertainty in assessments. But they are divided on how to further characterize this uncertainty. More than a century of philosophical discussion on uncertainty has shown that there are divisions which cannot be resolved. For the sake of simplicity, we address three of the most fundamental differences between uncertainty approaches, namely those between the objective and the subjective views of uncertainty, and those between precise, probabilistic risk and imprecise uncertainty, and those between uncertainties in natural systems and human choice. We reduce the uncertainty problem to these dimensions only to explore the key questions of this paper about the rationale and legitimacy of the differences between the different IPCC Working Groups, and do not exclude that other dimensions could also be considered.
The division between the objective and the subjective views of probabilities is the oldest. Objective views of probabilities include the classical approach (probability is the proportion of favorable cases over total cases), the frequentist approach (probability is the limit of frequency in the long run (von Mises, 1957)), and the propensity approach (probability is a physical tendency (Popper, 1959)). These views are objective in that probability is seen to be an intrinsic property of the system being studied. This is opposed to the Bayesian point of view, in which probabilities refer to degrees of belief (de Finetti, 1937; Savage, 1954), and which mostly reflects a subjective perspective.
Then there is the difference between situations where information can legitimately be represented using precise probabilities, and situations where the information is too imprecise to use a probability distribution. Knight (1921) called this the difference between situations of risk and situations of uncertainty, but the vocabulary is not standardized in the literature. There is a standard definition of risk as the combination of the probability of an event and its consequences (ISO, 2002), which is consistent with, but more general than, the simple “product of probability times loss.” As for uncertainty, it may be simpler to define it negatively, that is all other forms of ignorance about a system for which we don’t have well founded precise probabilitiesi. This does not mean that all kinds uncertainty are out of reach of rigorous formal analysis, see for example the imprecise probabilities approaches in Walley (1991) or Ellsberg (1967).
The third dimension is the difference between uncertainty in causal systems and uncertainty in intentional systems. In the former, the past determines the future. In the later, the arrow of time can be reversed: long term goals can influence the present. Causality is recognized as a fundamental principle of all natural sciences, and accordingly most models of natural systems are resolved with recursive simulation, computing the state at t+1 from the state at date t. This is generally not the case with models of systems involving human choices, which are intentional. Even though causal descriptions are often used in analyzing social systems (see, e.g., demographic models), the social scientist is often confronted with the intentionality of his/her objects of study – which adds a fundamentally different layer of deep uncertainty to studies of the long-term future of societal systems. The presence of intentionality also makes that in large parts of social science, Laplace’s principle of
4
indifference (all outcomes are equally probable) is replaced by a principle of optimization: assume that agents in the system will choose what they think is best rather than acting randomly.
Both objective and subjective sources of information can be precise or imprecise. Imprecision occurs in the frequentist setting when the sample size is small, and in the subjective setting when experts are deeply uncertain and cannot give precise probabilities, and hence cannot quantify risk. In climate change assessment, information about the unknown future is important, notably because of the role of human choice captured by the causal/intentionality dimension above. From a policy point of view it can be important to distinguish between the uncertainties related to lack of knowledge about the way biogeochemical and socio-economic systems function and those related to the understanding of the role of human choiceii.
Critically for an interdisciplinary panel, traditional experimental sciences methods have predominantly relied on the objective and precise approach to information, while social sciences methods have tended to use more subjective (e.g. most Bayesian methods) and imprecise approaches. Experimental sciences seek to determine precise objective frequencies based on a large body of observations, and experiments are (at least assumed) reproducible. Social sciences rarely have replicated controlled experiments or even complete observations, and often the most adequate description of knowledge available is narrative. This leads to imprecise theories, which are also subjective in that they are based on actions of humans observed by other humans.
Saying that experimental sciences tend to take a ‘hard’ (precise, objective and causal) approach of knowledge, while social sciences tend to be on the ‘soft’ (imprecise, subjective, intentional) side is of course only a general tendency. When there are missing data or a small number of observations, experimental results also can be very imprecise. In the natural science of climate, which is largely an observational science, imprecisions reign, since some critical data are scarce and experimentation with the climate system is impossible (see, e.g., Petersen 2000). Many “observation” data are in fact the result of data reanalysis. On the other hand, there are social objects such as financial markets, which lend themselves well to an objective (frequentist) approach. There is an emerging array of disciplines blurring the distinction between hard and soft sciences, such as behavioral- or experimental- or neuro-economics. Nevertheless, some debates on uncertainty within IPCC circles (for example on the question of future emission levels as a function of socio-economic scenario and resulting climate change) can be seen as discussions between the imprecise-subjective and the precise-objective positions.
What are the challenges in dealing with the varying dominance of the objective-subjective, the precise-imprecise, and the causal-intentional dimensions in an interdisciplinary panel? Demanding unanimity and constraining diverse authors to one perspective would be detrimental to the guidance’s primary goal, which is to encourage them to describe the variety of uncertainties appropriately. A normative vocabulary meaningful only for one philosophical position is likely not to be used by everybodyiii.The challenge is to disentangle the various dimensions. This brings us to the question: taking the different dimensions into account, how has the IPCC developed its treatment of uncertainties over time?
3. History of treating uncertainties by the IPCC
IPCC typologies
Tables 2 and 3 present the simple typologies distinguished in the TAR (Moss and Schneider, 2000) and 4th Assessment Report (AR4, see IPCC, 2005) guidance notes. The first table lists
5
basic 'sources' of uncertainty, in the way one would list the possible causes of failure of a complicated machine. The machine here is called a model (scientific theories can be viewed as models). Thus, the table supposes implicitly that there is a Truth to be discovered, and uncertainty is the product of defective or limited means of knowledge. While the first two sets of uncertainty sources in Table 2 can often be quantified, the third “other” sources of uncertainty generally cannot. Table 3 demonstrates the evolution of a broader view on the issue of uncertainty, as it relates to objective as well as subjective types of uncertainty, indicative examples of sources, and typical approaches and considerations. The human dimensions of uncertainty get a bigger role as a cause for unpredictability. Below, we discuss the development of the treatment of uncertainties in the history of the IPCC in more detail.
Evolution of uncertainty treatment in the IPCC assessments
In the IPCC First and Second Assessment Reports, uncertainty management and treatment was not systematically addressed across WGs. At the stage of the First Assessment Report (1990), the question whether climate change was a real problem dominated the assessment, with a primary role for the climatologists of WG I. This WG set the standard for the rigorous procedures that were later formalized for all WGs. The political importance of the questions whether climate change was occurring, and if so, whether human actions contributed to it, put pressure on the authors to focus on the scientific uncertainties to provide a balanced answer. The review procedures employed and the scope of participation in the production of the WG I report ensured that sufficient attention was being paid to uncertainties.
In the IPCC First Assessment Report (1990), the WG I executive summary started with what the authors were certain of and what they were confident about, thus taking a subjective perspective. They used strong words like “predict”, a term too strong for looking decades or more ahead. Uncertainty management was not yet centrally guided, but was left at the discretion of the authors. For WG II (Impacts) and WG III (Response Strategies)iv, the review procedures were not yet very rigorous, lacking systematic expert review procedures, while uncertainties were not a major topic of debate. The Summary for Policymakers of WG II contains a few sentences stressing several uncertainties, e.g. those related to the difficulty of making regional estimates of climate-change impacts. In WG III, the formulation of key findings did take uncertainties into account, albeit not in any consistent manner. Two pages were used to describe the scenarios – as a description of uncertainty about the future – used in the WG III report.
In the Second Assessment Report (1996), WG I dropped the usage of uncertainty terms in its main policy messages, but added a special section on uncertainties. While much attention was paid to reaching consensus about the appropriate formulation of statements taking into account the uncertainties (“The balance of evidence suggests..v”), no common language was used. “Predicting” was replaced by “projecting” climatic changes on the basis of a set of scenariosvi. In its concluding chapter on advancing the understanding, WG I mentions the need for a more formal and consistent approach to uncertainties in the future. WG II, which during the Second Assessment covered scientific-technical analyses of impacts, adaptations and mitigation of climate change, assigned low, medium or high levels of confidence to the major findings of the chapters in the executive summaries, like WG I in the First Assessment Report taking a subjective approach. WG III covered the economic and social dimensions of climate change. Managing and reporting uncertainties was not a key focus in the WG III assessment, in which uncertainties were captured through reporting of ranges from the literature and scenario-based what-if analyses of costs of response action.
6
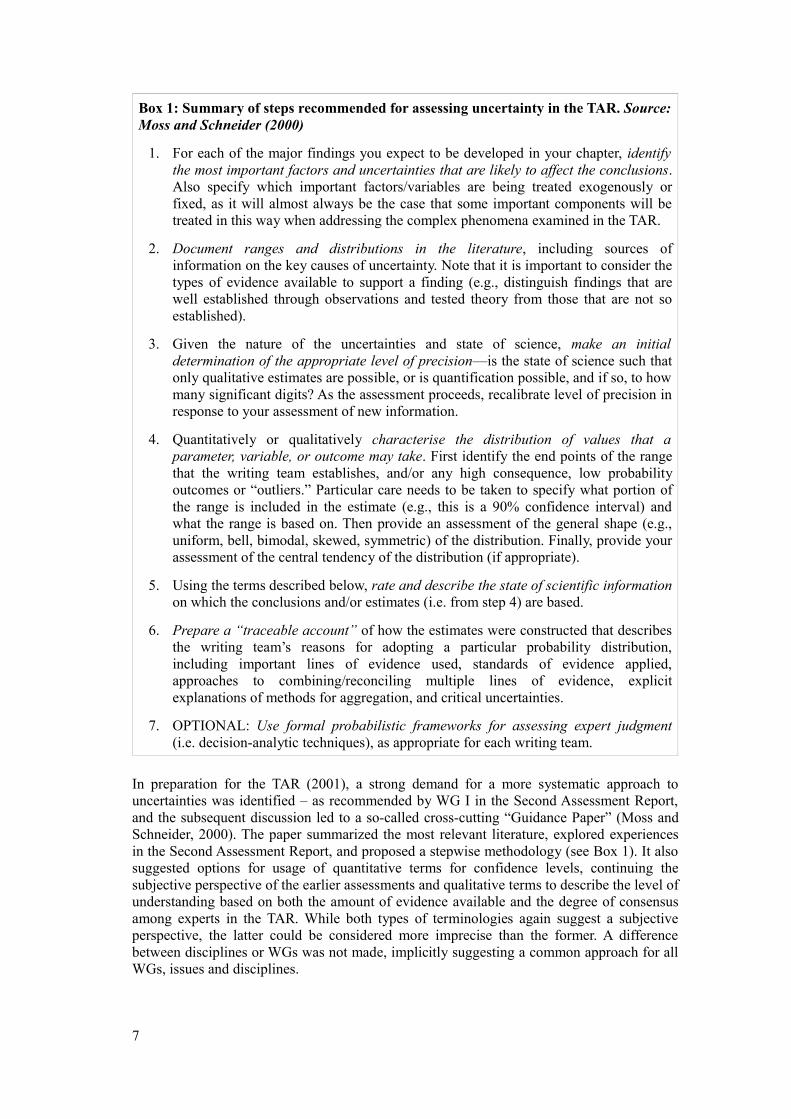
In preparation for the TAR (2001), a strong demand for a more systematic approach to uncertainties was identified – as recommended by WG I in the Second Assessment Report, and the subsequent discussion led to a so-called cross-cutting “Guidance Paper” (Moss and Schneider, 2000). The paper summarized the most relevant literature, explored experiences in the Second Assessment Report, and proposed a stepwise methodology (see Box 1). It also suggested options for usage of quantitative terms for confidence levels, continuing the subjective perspective of the earlier assessments and qualitative terms to describe the level of understanding based on both the amount of evidence available and the degree of consensus among experts in the TAR. While both types of terminologies again suggest a subjective perspective, the latter could be considered more imprecise than the former. A difference between disciplines or WGs was not made, implicitly suggesting a common approach for all WGs, issues and disciplines.
7
Box 1: Summary of steps recommended for assessing uncertainty in the TAR. Source: Moss and Schneider (2000)
1. For each of the major findings you expect to be developed in your chapter, identify the most important factors and uncertainties that are likely to affect the conclusions. Also specify which important factors/variables are being treated exogenously or fixed, as it will almost always be the case that some important components will be treated in this way when addressing the complex phenomena examined in the TAR.
2. Document ranges and distributions in the literature, including sources of information on the key causes of uncertainty. Note that it is important to consider the types of evidence available to support a finding (e.g., distinguish findings that are well established through observations and tested theory from those that are not so established).
3. Given the nature of the uncertainties and state of science, make an initial determination of the appropriate level of precision—is the state of science such that only qualitative estimates are possible, or is quantification possible, and if so, to how many significant digits? As the assessment proceeds, recalibrate level of precision in response to your assessment of new information.
4. Quantitatively or qualitatively characterise the distribution of values that a parameter, variable, or outcome may take. First identify the end points of the range that the writing team establishes, and/or any high consequence, low probability outcomes or “outliers.” Particular care needs to be taken to specify what portion of the range is included in the estimate (e.g., this is a 90% confidence interval) and what the range is based on. Then provide an assessment of the general shape (e.g., uniform, bell, bimodal, skewed, symmetric) of the distribution. Finally, provide your assessment of the central tendency of the distribution (if appropriate).
5. Using the terms described below, rate and describe the state of scientific information on which the conclusions and/or estimates (i.e. from step 4) are based.
6. Prepare a “traceable account” of how the estimates were constructed that describes the writing team’s reasons for adopting a particular probability distribution, including important lines of evidence used, standards of evidence applied, approaches to combining/reconciling multiple lines of evidence, explicit explanations of methods for aggregation, and critical uncertainties.
7. OPTIONAL: Use formal probabilistic frameworks for assessing expert judgment (i.e. decision-analytic techniques), as appropriate for each writing team.
The discussion in the author teams focused mainly on the choice of the most appropriate terminology for the summaries rather than on a consistent application of all 7 steps of Box 1 throughout the assessment. WG II largely adopted the proposed levels of confidence. WG I authors amended the guidance by adding a “virtually certain” category and developing a different terminology for describing quantified levels of likelihood. Their definition of likelihoods refers to “judgmental estimates of confidence”, which seems to refer to Bayesian probabilities, even though many of the lead authors used the scale as a hybrid of objective and subjective probability. For example, after having determined an ‘objective’ (that is, solely observation- and model-based estimate of the likelihood of a significant anthropogenic climate signal) likelihood of “more than 90% chance” (“very likely”), a ‘subjective’ evaluation of the quality of the estimate (and thus of the underlying climate models) led the lead authors to lower their likelihood estimate to “more than 66% chance” (“likely”). These considerations by the lead authors have not been made explicit however, and have only come to light after careful study of the TAR WG I production process (Petersen, 2006). WG III authors were encouraged to use the guidance, but – with a few exceptions – ignored it, feeling that the proposed approach did not address their perspectives on uncertainty. Also in WG III, the attention of the Lead Authors focused most on the terms (step 5), but eventually the proposed options were judged to be less appropriate for the social scientists of WG III. However, even without explicitly referring to the Guidance Note, other elements of the suggested approach were applied, albeit not systematically, across all WG III chapters (notably steps 1-4).
While this paper was written during the review phase, it is published after the finalization of the AR4. Therefore in this paper we focus on the first three IPCC major assessment reports rather than the 4th. However, it is useful to note that eventually the AR4 dealt with uncertainties very much like the TAR did, with the exception of WGIII, where for the first time a common, qualitative methodology was adopted.
One may wonder why the authors, who were generally sympathetic to the guidance, still focused mainly on the terminology. One important reason is practical: the lack of time and the pressing existence of other competing priorities – IPCC authors are “volunteers” who have a full set of non-IPCC professional obligations – and the simplicity of using just a scale in a table rather than diving deeper into the much richer guidelines. Another reason may be that scratching only the surface of the complex uncertainty domain by focusing on a relatively easily managed part of it, allows the assessors to continue with only a minimal change in their usual working methods. Also, intentionally or unintentionally, more political considerations may have played a role. A more thorough reflection on the scientific methods and framing of problems could be seen as a threat to the status of these methods and framings and to the existing culture in the associated disciplines (Craye, 2006).
The fact that the authors focused on the terms has to be seen in the light of the finding that readers of the report interpret the words very differently. The fact that the TAR defined the meaning of words used to describe probabilities did not appear to influence how people then interpreted those words (Patt and Schrag, 2003; Patt and Dessai, 2005). More precisely, these authors found that among a sample of COP 9 participants, the numerical interpretation of “unlikely, perhaps very unlikely” climate change did not depend on whether they had read the IPCC TAR. This suggests that the IPCC WG I likelihood scale is more a means to ensure consistency among authors than a means to alleviate the known cognitive bias with probabilistic information among readers.
Differences between Working Groups in the TAR
We return to our basic questions: are the differences between the three WGs real, and if so what might be the reasons that a fully consistent treatment of uncertainties across the three groups – and hence across disciplines – may be infeasible or undesirable? In order to
8
evaluate the way uncertainties were reported in the TAR, we have focused on five key issues for each WG.
For WG I, we looked at observed temperature changes, observed concentrations and radiative forcing, attribution to anthropogenic causes, future average climate changes, and future changes in climate extremes. Most of these issues are dominated by uncertainties in the physical sciences related to observations in the natural world. These are often determined by uncertainties related to natural variability of observed variables and lack of understanding about physical and chemical processes. Much information is available, e.g. from world-wide observations of atmospheric, terrestrial and marine variables over long periods. With respect to past and present information, the IPCC deals with what could be regarded as relatively precise and objective information which could be conducive to a frequentist attitude. As Manning (2003) notes, notably the physical scientists prefer to consider uncertainty in objective terms, in relationship to measurements, repeatability of results, and with bounds for systematic errors. However, lack of consistency between different available data sets, high data variability within data sets and the fact that many data from observations are in fact based on data re-analysis using models may explain why WG I eventually adopted a subjective perspective, although the subjective character of the terminology – a (precise) likelihood scale capturing degrees of certainty – is only revealed in the definitions (“judgmental estimates of confidence”) hidden in a footnote. In the WG I TAR ranges for outcomes were usually given and explained. However, the more explicitly subjective “confidence levels” which are used by WG II, could lead readers to erroneously interpret the difference between WGs I and II as one between objective and subjective findings, rather than one between precise and imprecise information (see further below).
In general, WG I opted for the quantitative likelihood terminology (cf. Table 4 for the revised AR4 version) for all the five issues considered. One may question this one-size-fits-all approach, since some issues are characterized by much more imprecise and subjective information than others. This is the case when the reliability of models or future developments are discussed. In attributing climate-change to anthropogenic causes, for instance, both observations and models were used, which led to inclusion of subjective judgments about the (imprecise) quality of the models to give a (precise) frequency distribution of the outcomes, as was discussed above. For future scenarios, the likelihood scales suggest a level of knowledge about the future that does not exist. Furthermore, in speaking about the future, the conditionality of future developments (e.g. climatic changes) on future human choices needs to be acknowledged.
For WG II, we looked at observed climate change impacts, projected impacts of extremes, projected economic impacts, projected impacts on sectors and projected impacts in regions. In WG II the biological sciences are more important than in WG I and social sciences come in when vulnerability, impacts and adaptation are assessed. The interactions in biological systems and between these systems and physical-chemical and social systems, are more complex, are dependent on human choices and actions, and are more subject to the different perspectives of the assessors. Unlike most WG I data, most WG II data have relatively short time series of observations, lack global coverage, and lack a set of globally agreed definitions and measurements techniques. Changes in various systems (e.g. ecosystems) may be observed, but a large number of assumptions are required to relate these observations to climate change. The imprecise nature of the available information explains why it is more difficult to agree on likelihoods of findings in a group of diverse authors in a WG II chapter team. Being more explicit about the reliance on imprecise information and subjective confidence levels (Table 5) therefore seems an appropriate way for WG II to address the higher complexity and subjectivity of its findings, avoiding the impression of objective and precise knowledge.
9
There are just a few occasions in the TAR where WG II appears to be inconsistent. One example is the confusing usage of likelihood levels with respect to the projected changes during the 21st century in extreme climate phenomena. This is derived from the usage of these terms by WG I that is questioned above, and is unavoidable since one IPCC WG cannot change the uncertainty assessment of another WG. In only a few instances qualitative levels of understanding are used (cf. Table 6 for the revised AR4 version).
The terminologies in both WG I and II are based on a subjective perspective. The difference can be explained by the availability of more precise information in WG I as compared to the more imprecise information available to WG II. The objective, frequentist history in the dominant WG I disciplines (Manning, 2003) may also be an explanatory factor for the only implicit subjectivity in the definitions by WG I, as compared to the explicitly subjective confidence levels of WG II. This may be legitimate, but from an uncertainty communication point of view there is a risk – maybe not to scientific analysts, but certainly to a policy audience – that “likelihoods” could unintentionally be interpreted as more objective than “confidence levels” and hence be awarded a higher level of “truth”, while it is only the consensus judgment of the authors for the section in which the conclusion appears (a subset of the full lead author teams and an even smaller subset of the 2500 scientists contributing to the assessments as lead or contributing authors or as reviewers).vii That such a risk is real, may be illustrated by Patt (2005), who finds that readers may respond differently to information about confidence levels if these are framed according to (dis-)agreement between the IPCC experts or according to the outcomes of computer models.
For WG III, we looked at GHG emissions, GHG mitigation potential, short-term costs and benefits, long-term costs and benefits (stabilization of GHG concentrations), and spill-over effects. In WG III the scale further tips to include social, institutional, cultural and political issues characterized by different perspectives and human choices and thus into subjective, imprecise, and volition territory. The information basis is weaker than in the other WGs, since these variables are usually not covered by long-term statistical time series. WG III did not use the various options for the terminology in the TAR (with one exception– see discussion further below,) (Table 6). The authors opted for addressing uncertainty differently, mainly through presentation of ranges of outcomes and explanation of the underlying assumptions. In the Special Report on Emissions Scenarios (SRES), the authors explicitly have not attached any probabilities to emissions scenariosviii.
When addressing costs and benefits of particular levels of mitigation policies (e.g. implementing the Kyoto Protocol or reaching particular levels of GHG stabilization), the authors have reported a range of outcomes from the literature and clarified the differences (steps 1-4 in Box 1) rather than attempting to arrive at a best (or most likely) guess or assign confidence levels. An interesting exception is that in their assessment of potentials of technological options in various economic sectors, the authors of the chapter on the technological and economic potential of greenhouse gas emission reduction options did attempt to make a best guess and estimated probabilities of these potentials being achieved. However, this “best guess” suffered from the weakness that for different options and for different sectors the potential for mitigation was not assessed against the same baseline development, leading to unquantified inconsistencies. The term “potential” was related to a poorly defined new term “socio-economic potential”. The probability levels for potentials here suggest an implicit systematic and comprehensive assessment of the probability of the achievement of the potential of options and thus of factors such as the development and implementation of policies as well as on “autonomous” societal developments. Such an assessment was not done in the TAR.
A word count of the three WG TAR reports confirmed the differences between the three groups (for details see http://www.centre-cired.fr/forum/article428.html). For example, “uncertain” was found about twice as often in WG I as in WG II and about three times as
10
often as in WG III. “Proba” was found in WG II almost three times as often as in WG I and four times as often as in WG III, and similarly “risk” was used more than four times as often by WG II than by WG III, while it was hardly used by WG I. In contrast, “choice” was found almost three times as often in WG III as in WG II, and “decision”, a word hardly found in WG I, was found twice as often in WG III as in WG II. According to this simple word count, uncertainty dominates WG I; risk, WG II; and choice, WG III.
In summary, it may be more difficult for the readers to understand and interpret the different approaches to uncertainty communication by different WGs, but there are legitimate reasons why these differences exist. Similarly, Risbey and Kandlikar (2007) argue that different quantities dealt with in IPCC assessments are known with different degrees of precision, and that hence a one size-fits all approach is not appropriate. The different types of information (observations, model calculations, scenarios, and volition) and the different levels of evidence and agreement make the application of different approaches not only legitimate, but desirable.
Comprehensiveness of assessing uncertainties by the IPCC
Comprehensively addressing uncertainties across all dimensions is unrealistically time-consuming (see also section 2). A systematic analysis taking into account the various elements of Table 1 has not been taken, not even for a selected number of key messages. It is not surprising that the uncertainty handling of the IPCC reports is concentrated in the formulation of key messages in the Summaries for Policy Makers (SPMs). The other elements have not been ignored and are often discussed during the assessment of the available literature. For the authors of WGs I and II, who generally use consistent terms within their group, this implies that the readers of the assessment may end up being well informed about the levels of confidence or likelihood of key statements in the summaries, but generally are not informed about the basis for the uncertainty quantification. This approach has the advantage of using consistent terminology, but disadvantages in that the terminology is not transparent, that - notwithstanding the definition provided - the words means different things to different people, and that readers are less informed about the basis of the reported (high or low) likelihood or confidence level (uncertainties in the basic data, in model simulations, in the influence of human choices?).
In the WG III TAR the emphasis has been on explaining the determinants of outcomes, rather than quantifying likelihoods or confidence levels. For example, how are technological potentials and their costs defined and calculated, and how do different definitions and methods affect the outcomes? This has the disadvantage of the absence of a common terminology, but the advantage of helping the readers to understand the background of the results of the assessment. This analysis however has not been done in the systematic and comprehensive way of the Kloprogge et al. (2005) example.
SPMs are the parts of IPCC reports that are most carefully scrutinized by governments and most widely read. The political sensitivity of the statements in SPMs requires that their uncertainty be carefully described. Especially in WG III, with social scientists from all regions and very different schools of thought, agreement about controversial issues such as costs of response measures is a tough job. For this reason, much attention has been focused on the way IPCC authors describe uncertainty in the SPMs. However, this is only one of many things that needs to be done to develop a high-quality assessment that is approved by the over 100 countries that typically attend an IPCC Plenary.
The 4th IPCC Assessment: update of Uncertainty Guidance
In preparation for the AR4, an Uncertainty Guidance Note was prepared (IPCC, 2005), to a large extent based on discussions during an IPCC workshop (Manning et al., 2004) and
11
discussions between Lead Authors of all WGs during and after their first meetings in the second half of 2004. Agreement was reached on this Guidance Note, and its application was tested in preparing preliminary drafts of the AR4 report. One innovative aspect of this Guidance Note is the introduction of a hierarchy in the application of preferred approaches, dependent on the amount and character of the available information and the level of agreement between the assessors (see Box 2). The notion of a hierarchy was also argued for by Kandlikar et al. (2005) the development of which paper cross-fertilized the development of the AR4 Guidance Note.
The quantitative likelihood scales, confidence levels, and qualitative levels of understanding of the TAR were updated for the AR4 (Tables 4, 5 and 6). As discussed above, the different types of terminologies could be considered to fall in different domains and hence the terminology of Tables 4, 5 and 6 could at least theoretically be considered complementary, e.g. one can have high confidence (Table 5) in a low likelihood (Table 4) and simultaneously provide more information about the arguments for the assignment of the confidence and/or likelihood levels (Table 6). One could consider the confidence terminology as a second order probability when it is combined with the likelihood terminology. However, likelihood levels implicitly include confidence levels, for example a high likelihood is hard to combine with low confidence. Therefore, combinations of likelihoods and confidence levels are difficult to interpret (Risbey and Kandlikar, 2007). Because of this problem, and not to confuse the reader, IPCC (2005) therefore recommends to avoiding the use of more than one terminology for one issue, a recommendation not followed consistently by WGII in the AR4. We would argue that the use of the qualitative scale proposed by IPCC and much more attention to explaining the basis of key findings provide complementary information in a form that is less likely to confuse readers.
Table 6 provides additional insights as compared to Tables 4 and 5. Since only few socio-economic issues are suitable for the usage of quantitative uncertainty terminology, Table 6 is particularly relevant for WG III, and can be expanded by authors to arrive at more differentiation than the TAR 2*2 matrix with qualitative terminology that was proposed by Moss and Schneider (2000)ix. Experience during the TAR demonstrated that different interpretation of the qualitative terms (speculative, established but incomplete, well established, competing explanations) can lead to confusion or incorrect communication. Therefore the terms have been replaced by terminologies capturing both dimensions of the matrix. The fact that the new Guidance allows for a more diverse approach addresses some of the problems that we have identified in the previous section. We note, however, that the Guidance does not specifically distinguish between the different dimensions, notably the distinction between natural system uncertainty and human choices.
12
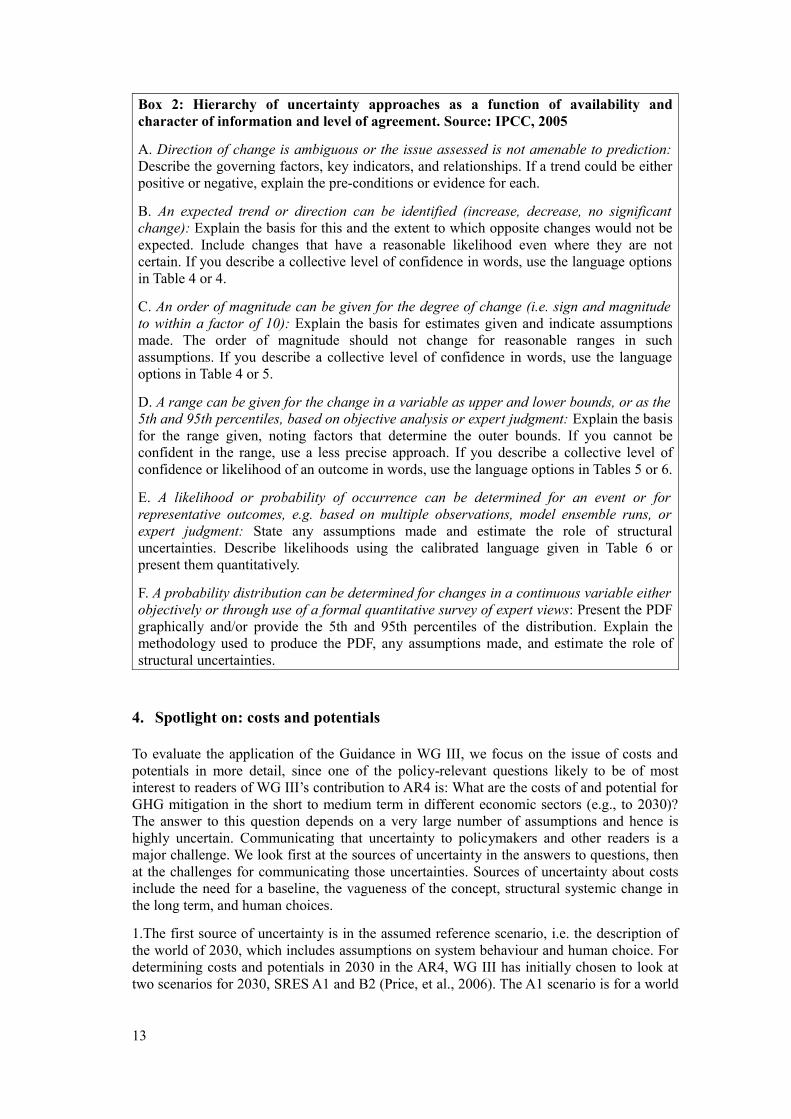
Box 2: Hierarchy of uncertainty approaches as a function of availability and character of information and level of agreement. Source: IPCC, 2005
A. Direction of change is ambiguous or the issue assessed is not amenable to prediction: Describe the governing factors, key indicators, and relationships. If a trend could be either positive or negative, explain the pre-conditions or evidence for each.
B. An expected trend or direction can be identified (increase, decrease, no significant change): Explain the basis for this and the extent to which opposite changes would not be expected. Include changes that have a reasonable likelihood even where they are not certain. If you describe a collective level of confidence in words, use the language options in Table 4 or 4.
C. An order of magnitude can be given for the degree of change (i.e. sign and magnitude to within a factor of 10): Explain the basis for estimates given and indicate assumptions made. The order of magnitude should not change for reasonable ranges in such assumptions. If you describe a collective level of confidence in words, use the language options in Table 4 or 5.
D. A range can be given for the change in a variable as upper and lower bounds, or as the 5th and 95th percentiles, based on objective analysis or expert judgment: Explain the basis for the range given, noting factors that determine the outer bounds. If you cannot be confident in the range, use a less precise approach. If you describe a collective level of confidence or likelihood of an outcome in words, use the language options in Tables 5 or 6.
E. A likelihood or probability of occurrence can be determined for an event or for representative outcomes, e.g. based on multiple observations, model ensemble runs, or expert judgment: State any assumptions made and estimate the role of structural uncertainties. Describe likelihoods using the calibrated language given in Table 6 or present them quantitatively.
F. A probability distribution can be determined for changes in a continuous variable either objectively or through use of a formal quantitative survey of expert views: Present the PDF graphically and/or provide the 5th and 95th percentiles of the distribution. Explain the methodology used to produce the PDF, any assumptions made, and estimate the role of structural uncertainties.
4. Spotlight on: costs and potentials
To evaluate the application of the Guidance in WG III, we focus on the issue of costs and potentials in more detail, since one of the policy-relevant questions likely to be of most interest to readers of WG III’s contribution to AR4 is: What are the costs of and potential for GHG mitigation in the short to medium term in different economic sectors (e.g., to 2030)? The answer to this question depends on a very large number of assumptions and hence is highly uncertain. Communicating that uncertainty to policymakers and other readers is a major challenge. We look first at the sources of uncertainty in the answers to questions, then at the challenges for communicating those uncertainties. Sources of uncertainty about costs include the need for a baseline, the vagueness of the concept, structural systemic change in the long term, and human choices.
1.The first source of uncertainty is in the assumed reference scenario, i.e. the description of the world of 2030, which includes assumptions on system behaviour and human choice. For determining costs and potentials in 2030 in the AR4, WG III has initially chosen to look at two scenarios for 2030, SRES A1 and B2 (Price, et al., 2006). The A1 scenario is for a world
13
of “… very rapid economic growth, low population growth, and the rapid introduction of new and more efficient technologies.” The B2 world is one “in which the emphasis is on local solutions to economic, social and environmental sustainability. It is a world with moderate population growth, intermediate levels of economic development, and less rapid and more diverse technological change than in … A1…” (Nakicenovic, et al, 2000).
A1 and B2 are both baseline scenarios, i.e., they contain no overt efforts to control GHG emissions. As such, they are counter-factual descriptions of the world. However, the scenarios are still useful because they provide baselines against which the potential for new technology can be tested, independent of whether it is adopted voluntarily or to meet a legally binding target. Probabilities are not assigned (see Box 3).
2. The definition of the terms “potential” and “costs” introduces a second source of uncertainty. Several different measures of potential exist. At the high end, technical potential estimates the performance of the technology, independent of cost considerations. At the low end, market potential estimates the extent to which the technology is likely to be used, given its cost, competitive technology, government regulation, consumer preferences and all of the other factors that affect the market. These two measures of potential will give very different estimates. For estimating mitigation potential and cost, WG III used an intermediate measure: economic potential, which is defined as the cost of GHG mitigation when non-market social costs and benefits are added to market costs and benefits, and when social discount rates (about 5% in the short to medium term) are used instead of private discount rates (typically 15% or higher). If sufficient information is available, this approach can provide a mitigation supply curve, i.e., the amount of GHG mitigation that could be achieved in 2030 as a function of the cost expressed in $/tCO2. Also, the definition of “costs” introduces uncertainties, e.g. with respect to the boundaries of what is included in the cost calculation, e.g. the inclusion or exclusion of transaction costs or distributional effects.
A top-down approach will generate reasonable estimates, provided that the problems in estimating long-term elasticities are addressed, and that there are no “paradigm-changing” technological changes. For example, if there were a breakthrough in hydrogen fuel cell technology that made this approach attractive for both vehicle and stationary source use, large amounts of hydrogen would be required, and large amounts of CO2 suitable for carbon capture and storage (CCS) would be generated. CCS technology could be implemented much more rapidly than generally assumed, and global CO2 emissions reduced more cheaply than currently anticipated. Surprises can also happen in the other direction. A breakdown of political will to control GHGs could lead to fewer incentives to apply existing technology on a large scale or to develop new technology. Either would raise the costs of controlling greenhouse gas emissions.
3. Projections of cost create a third set of uncertainties. While all of the technology that WG III will be considering has been invented, some of it (e.g. the hydrogen fuel cell) is in the early phases of the development cycle, and could see large changes from projected costs over the next 25 years. Technologies that prove cheaper than currently estimated will take larger shares of the market; technologies that prove more expensive are unlikely to be implemented.
14
4. The fourth set of uncertainties involves the way in which technological improvement will be implemented, again involving assumptions about human choices. Improved energy efficiency, which is a major component of GHG mitigation technology, can be used to reduce fossil-fuel consumption, and thus CO2 emissions, or it can be used to improve output in some fashion. Vehicle efficiency in the U.S. is a classic example of this choice. The actual efficiency of automotive engines in the U.S. has improved steadily (AuYeung, Haywood and Schafer, 2001). However, this improvement has not translated into reduced fuel usage, but into greater vehicle size, power, or luxury.
Given all of these uncertainties, in the AR4 WG III has not assigned either probabilities or confidence levels to its estimates of mitigation cost or potential. However, the 2-dimensional qualitative terminology, combining information on the amount of evidence in the literature and the agreement between the authors, has indeed been used for most of the key findings in the area of costs and potentials, after continuous encouragement of the authors by the IPCC leadership. However, this alone is insufficient to adequately communicate the uncertainties. The challenge for WG III was to explain to policymakers and other readers the process used to develop its estimates, and the uncertainties involved, in sufficient detail to allow them to judge the validity of the numbers. In the AR4 discussion in WG III on costs and potentials,
15
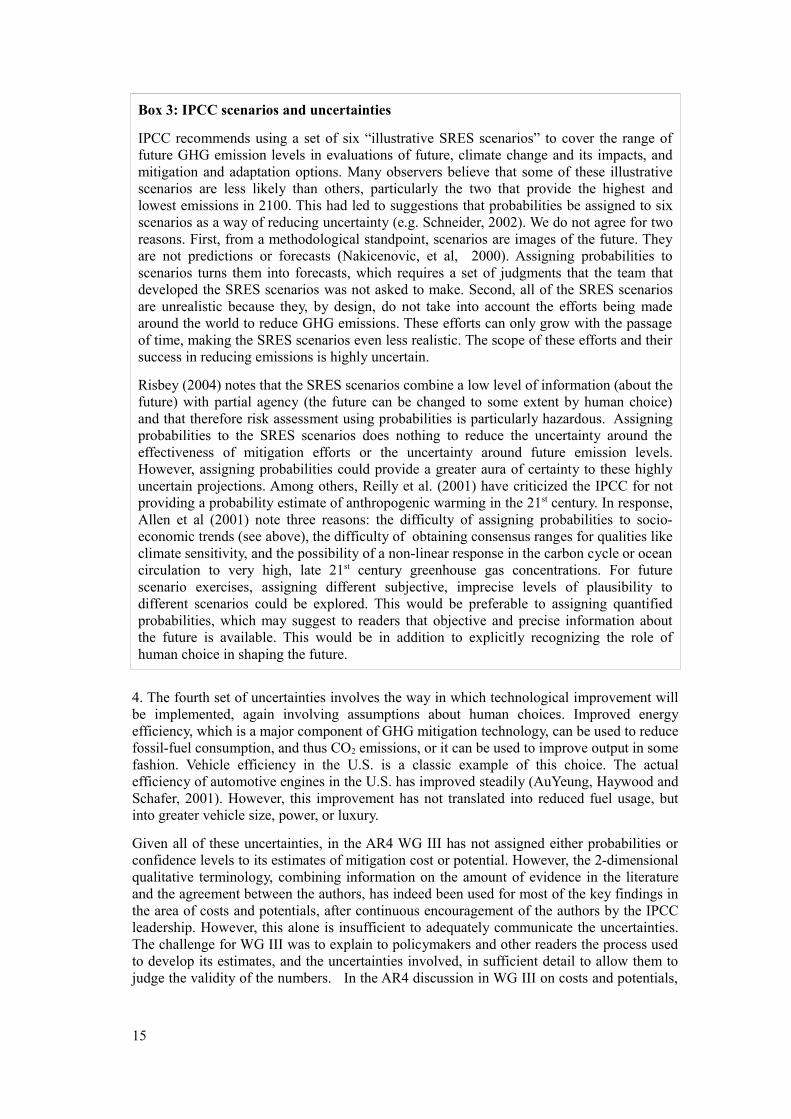
Box 3: IPCC scenarios and uncertainties
IPCC recommends using a set of six “illustrative SRES scenarios” to cover the range of future GHG emission levels in evaluations of future, climate change and its impacts, and mitigation and adaptation options. Many observers believe that some of these illustrative scenarios are less likely than others, particularly the two that provide the highest and lowest emissions in 2100. This had led to suggestions that probabilities be assigned to six scenarios as a way of reducing uncertainty (e.g. Schneider, 2002). We do not agree for two reasons. First, from a methodological standpoint, scenarios are images of the future. They are not predictions or forecasts (Nakicenovic, et al, 2000). Assigning probabilities to scenarios turns them into forecasts, which requires a set of judgments that the team that developed the SRES scenarios was not asked to make. Second, all of the SRES scenarios are unrealistic because they, by design, do not take into account the efforts being made around the world to reduce GHG emissions. These efforts can only grow with the passage of time, making the SRES scenarios even less realistic. The scope of these efforts and their success in reducing emissions is highly uncertain.
Risbey (2004) notes that the SRES scenarios combine a low level of information (about the future) with partial agency (the future can be changed to some extent by human choice) and that therefore risk assessment using probabilities is particularly hazardous. Assigning probabilities to the SRES scenarios does nothing to reduce the uncertainty around the effectiveness of mitigation efforts or the uncertainty around future emission levels. However, assigning probabilities could provide a greater aura of certainty to these highly uncertain projections. Among others, Reilly et al. (2001) have criticized the IPCC for not providing a probability estimate of anthropogenic warming in the 21st century. In response, Allen et al (2001) note three reasons: the difficulty of assigning probabilities to socio-economic trends (see above), the difficulty of obtaining consensus ranges for qualities like climate sensitivity, and the possibility of a non-linear response in the carbon cycle or ocean circulation to very high, late 21st century greenhouse gas concentrations. For future scenario exercises, assigning different subjective, imprecise levels of plausibility to different scenarios could be explored. This would be preferable to assigning quantified probabilities, which may suggest to readers that objective and precise information about the future is available. This would be in addition to explicitly recognizing the role of human choice in shaping the future.
guidelines were formulated for reporting. These include the reporting of discount rates; the year and region for which the costs are estimated; the type, definition and level of the costs; the reference case; the preferred units; and the type of potential. This description was meant to allow readers to judge the meaning of the results being presented and to determine when it is possible to sum sectoral or regional information into global totals. This was one of the most challenging tasks inWGIII’s assessment, and a completely satisfactory result was not achieved, e.g. because full consistency between baseline scenarios could not be achieved. However, global and regional totals were derived for all sectors except transportation, where the inclusion of international aviation made regional totals impossible. A description of the assumptions underlying the results was provided for each sector.
5. Discussion and recommendations: handling uncertainties in future IPCC assessments
A broader approach rather than a scale
It is tempting to organize guidelines on uncertainty around a general scale going from totally certain (or totally true) to totally unknowable. Unfortunately a strict hierarchical classification is hard to find in the domain of risks and uncertainty. The most important insight arising from an interdisciplinary assessment on uncertainty is its conceptual diversity.
There have been attempts at systematic taxonomies of uncertainty (see, e.g. Smithson, 1989, Walker et al., 2003; Janssen et al., 2005; Petersen, 2006, see also Section 2). However, although a uniform taxonomic approach is a very systematic way to explore concepts, it may not be the most appropriate approach within the context of guidelines for hundreds of authors. As discussed above, using a multi-dimensional typology of uncertainty is quite complex, and may result in a vocabulary that is precise in a technical context but ineffective at communication. Also, while the above discussion of the objective/subjective, the precise/imprecise, the causal/intentionality dimensions of uncertainty is key for demonstrating the importance of diversity in uncertainty treatment, it is not necessarily the best way to structure the uncertainty communication framework. It is beyond the scope of this paper to discuss all elements of uncertainty communication in the context of climate changex
Funtowicz and Ravetz (1990) have proposed a rich framework to address different aspects of uncertainty. In this framework, called NUSAP, a quantitative analysis of the available data (the Numerical, Unit, and Spread steps) is followed by a more qualitative analysis (the Assessment and Pedigree steps). This approach can in theory be considered to be quite useful for the IPCC.
This approach would eventually aim to qualify the reports' findings, which are mostly statements about the future of complex dynamic systems involving the human will, in a multidimensional fashion with a few relevant descriptors to help the reader assess which degree of confidence he or she wants to place in the findings. The approach has been successfully explored in recent years (van der Sluijs et al., 2005; see also http://www.nusap.net/). However, since it requires a large amount of effort to implement and report the approach properly, the reality of the IPCC process, with many competing claims for time and resources, makes its full application there unrealistic.
However, it is worth exploring whether some elements of the approach could be adopted to broaden the current IPCC practice. One option would be to enhance reporting of pedigree. In this context, “pedigree” refers to the ancestry of information in a broad manner: it is taken to
16
mean an evaluative description of the mode of production of the information. It rates aspects of the information such as the way indicators have been defined, how data were collected, analyzed and reviewed, and the institutional culture involved (Funtowicz and Ravetz, 1990). Table 6 (which shows qualitatively calibrated levels of confidence along two pedigree dimensions – “amount of evidence (theory, observations, models)” and “level of agreement or consensus”) constitutes a simple example of the pedigree approach. In the pedigree approach, more dimensions can be taken into account, however, for example by disaggregating the “amount of evidence” dimension again into “theory”, “observations” and “models” (Moss and Schneider, 2000; Petersen, 2006). Even more extensively, describing the building blocks of the uncertainties, like in the example of the mitigation potentials again provides more information. Another example that has not been covered by the IPCC explicitly yet would be the description of the history of the estimates of the climate sensitivity: how did the IPCC translate (or not translate) developments in the climate literature into changes of the reported ranges of values?
Organizing diversity in IPCC statements
Another way to broaden the approach to uncertainly handling and communication is to accept and clarify diversity. In principle various ways of describing uncertainties can be complementary. According to Manning et al. (2004), identifying and explaining the determinants of uncertainty including issues as definitions of variables, assumptions regarding system boundaries affecting the method used, and existence of competing conceptual frameworks, is often more relevant than trying to quantify those uncertainties. In all WGs, the uncertainty approach should be dependent on the issue at stake: e.g., different questions may lead to different choices for the kind of approach to be used.
Parker (2005) evaluated the IPCC experience with uncertainty management focusing on how the evidential basis of findings could be evaluated, how the qualitative scale could be adjusted, and how the treatment of uncertainties could be further coordinated and tailored. Coming to this issue from another angle, she also concludes that diversity in uncertainty communications is required, and suggests that a tailor-made, chapter-specific approach could be developed for future assessments, involving experts beyond the climate science community, e.g. philosophy of science and risk assessment experts.
It is tempting to summarize the discussion above for organizing actual statements about the various issues in the various WGs according to the dominant philosophy regarding uncertainties and their level of precision (objective/frequentist versus subjective and precise versus imprecise), the distinction between natural system uncertainty and human choice, and the preferred approach regarding communication of the uncertainties. We recognize that the uncertainty philosophy is in the eyes of the beholder, but on the other hand we think that the discourse about particular issues is generally dominated by one of the philosophies. And as we concluded in section 2, the objective/subjective distinction is fundamental.
In Figure 1 we make an attempt to illustrate this by grouping types of statements for the various issues and placing them in different, but overlapping areas for the three dimensions discussed in this paper. In the Figure, dimensions change from uncertainties in natural systems, a frequentist perspective and precise information dominating in the left top corner to intentionality in human systems, a subjective perspective, and imprecise information dominating in the right bottom corner of the Figure. None of the statements of any of the Working Groups is completely objective/subjective or precise/imprecise or even causal/intentional, but the different emphasis is reflected in the Figure. Please note that this Figure is not prescribing which approach should be selected or in which part of the panel a particular subject should be placed, because one issue can be approached from different perspectives and hence different approaches can be preferred by different people. Rather, it
17
illustrates the dominant paradigms that we have noted for the different issues and from that explains the different approaches selected by different groups in IPCC.
A specific challenge is to locate costs and potentials of mitigation options in this Figure and to determine an appropriate approach for these issues. If costs and potentials could be precisely defined and statistically tracked, they could be regarded as frequentist and put in the left top corner of the Figure. But as discussed in the previous section, in practice they are not, so we prefer to consider information about these issues as subjective and imprecise and put them in the right bottom corner. Although one can quarrel about details and exceptions, roughly one can superimpose the hierarchical approach of the IPCC Guidance Note on the matrix (grey shaded arrow), and thus conclude that generally, the hierarchy captures in a stylized way the multi-dimensional nature of the uncertainty information, clearly an improvement over earlier attempts. One could consider in the future if even more explicit acknowledgements of the different dimensions would be desirable and feasible.
Conclusions and recommendations
In this paper we have made an attempt to explain why IPCC Working Groups have taken different approaches to uncertainty handling. What lessons can we draw from the evaluation of the treatment of uncertainties in the TAR and the new insights discussed above? We summarize the most important ones in Box 4. Although some scientists in WG I may have a predominantly objective, frequentist perspective, in the TAR both WG I and II eventually chose a subjective definition of uncertainty terms following IPCC guidance documents. That they selected different terminologies we relate to the availability of precise or imprecise information. WG III authors did not use any consistent methodology until the AR4. We partly explain this by the dominance in this WG of the human choice dimension, which is not explicitly covered by the IPCC guidance. While these differences across WGs may be confusing to readers, we argue that it is, in fact, both legitimate and appropriate. A one-size-fits-all approach would obscure important differences in the type of uncertainties for the users. The questions which are addressed by the three WGs differ, and hence also the approach towards uncertainty should differ. The IPCC Uncertainty Guidance Note for the AR4 proposes a simple, pragmatic and one-dimensional hierarchy in addressing such differences: from explaining the determinants of uncertainty, to using qualitative terms of understanding, to using quantitative confidence levels, to quantitative likelihood scales, while at the same time carefully and comprehensively explaining the underlying assumptions. We think the AR4 guidance provides important additional direction compared to the TAR guidance. The guidance could be developed further for future assessments, inter alia, by further elaborating the diversity into more tailor-made approaches for different issues or Working Groups.
How can the uncertainty communication in future assessments be improved more specifically? For simplicity we assume that IPCC would retain the same Working Group structure, something that may or not be desirable (e.g., see Raes and Swart, 2007). We suggest that for WG I that in the next assessment it should be clear which part of the findings are based on observations, which on models, and which on future scenarios that involve human choice. It should be noted that data are usually “models of data” (Edwards, 1999), thus blurring the categories of observations and models. This recommendation also applies to the other WGs. The distinction between observations, theory and models was also proposed in the original TAR guidance, which suggested a plot with four axes, corresponding to the confidence in (1) the theory, (2) the observations, (3 the models and (4) the consensus within a field (Giles, 2002). Since theories are usually based on observations and both feed into models, they are not independent of the other categories. We do not suggest theories as a separate category. Instead, we distinguish the human choice category because of its relevance from a policy perspective.
18
Based on the above considerations we would favor a qualitative approach over the quantitative likelihood scale for issues that involve complex modeling and/or human choice. As Allen et al (2001) note, while it may be more convenient for some purposes if more of the uncertainties were summarized numerically by the IPCC, this approach would no longer provide an accurate representation of current, scientific knowledge. Even for topics for which relatively objective and precise information is available, controversy is possible in the communication of uncertainty information. Recently the so-called “hockey stick” graph was heavily criticized (McIntyre and McKitrick, 2003, 2005). This led to an in-depth discussion and renewed consideration of the basic data, which however did not lead to conclusions fundamentally different from those of the IPCC, e,g, NRC (2006). What can be learned from this experience is that even more attention should be given to the selection of graphs (or tables) and explaining why they have been selected, preferably always including different sources of information in the same graph (or table).
In previous assessments we observe a tendency to focus on the middle of distributions of variables for formulating key conclusions (while providing an uncertainty range) rather than explaining the conditions that underlie the extreme values of the distribution. Particularly because of the policy relevance of such extreme values (e.g. high impacts or high costs), for future assessments we recommend that outliers are given more attention, even if the likelihood of occurrence is assessed to be small.
For WG II, we find the usage of a confidence scale appropriate for many issues, but recommend the complementary usage of the two-dimensional qualitative scale, with proper explanation of underlying assumptions, especially for issues which involve model calculations and assumptions about human actions, and following a pedigree approach for key findings. We suggest avoiding the use of the likelihood scale by WG II, with the exception of quotations from WG I, noting the reason for the usage of these terms. Statements that depend on human choices, e.g. in adaptation, have to be clearly acknowledged.
Key questions in WG III deal with quantitative estimates of current and future greenhouse emissions and their reduction potential, and costs of response options. The approach and terminology used when addressing these issues depend on the kind of question to be answered. If the question would be “what are the most likely costs of implementing the Kyoto Protocol?” the answer would necessarily be conditional - depending on a large number of assumptions regarding the design of policies and measures, and demographic, economic and technological developments – but it could theoretically be answered in a subjective fashion, e.g. by expert elicitation. A more interesting question however may be “how do the costs of implementing the Kyoto Protocol depend on the design of policies”? Or, “what are robust options to reach the Kyoto Protocol targets with minimal costs?” These questions require a different, qualitative approach to uncertainties and an explicit recognition of the role of human choice.
In WG III, the difference of views on costs of mitigation between “top-down” economic modelers and “bottom-up” technological experts is a well-known example, where different paradigms initially led to widely different results. As a result of an intensive exchange of views and associated adaptation of methods, this initial gap had been narrowed very substantially at the time of IPCC’s latest assessment report (IPCC, 2007c). Nevertheless, not only in the TAR but also in the AR4, explaining these differences was one of the key elements of the SPM. The same applies to the SRES scenarios, where different scenario families describe different views on how the future may unfold, rather than attempt to describe a most likely future. New ways of addressing scenario uncertainty are currently being explored, like imprecise probabilities (Tonn, 2005), possibility theory (Ha-Duong, 2005) and utilizing belief functions (Kriegler and Held, 2005). The new approaches
19
mentioned above have not yet been included in the AR4, but it is likely that results can be included in scenario development work that may feed into a future assessment report.
Also in WGIII, describing and explaining outliers should get more attention. For example, with usually wide ranges of estimates for costs of options proponents of mitigation measure tend to use the lowest estimates and adversaries the highest. Bringing out more clearly the conditions for these more extreme estimates puts the results more in perspective. We have elaborated on the uncertainties related to potentials and associated costs of options. Most important is to provide appropriate explanations of the various sources of uncertainties, such as the baseline scenario used, the definition and coverage of potential” and “costs”, and technological improvements assumed.
We recommend that for future assessment reports, the current Guidance be further developed to structure communication methods according to the various uncertainty dimensions, explicitly including methods to deal with uncertainty related to human choice. We suggest that all WGs adopt more thorough procedures for analyzing the “pedigree” of uncertainties affecting their most relevant key findings and outcomes, carefully explaining the basis of differences in outcomes.
This would be similar to the “traceability account” that was already recommended by Moss and Schneider (2000) for the TAR, but not implemented in either TAR or AR4. Use of a limited pedigree approach would lead to a more diversified and informative treatments of uncertainty in assessment reports. It would be quite informative to do a pedigree analysis on selected AR4 findings after its publication. If such an effort were successful, it would enhance the possibility of a formal application of a more comprehensive uncertainty treatment for future IPCC and other assessments, in line with recommendations already formulated for the TAR. In addition, it would be useful to develop a practical guide for how to implement a pedigree approach, for future IPCC or other assessments. Such a guide should be added to the general Guidance.
20
Box 4: Recommendations for future assessment reports
● Make clear what parts of findings are based on observations, on models and on future scenarios including human choice
● Carefully explain definitions of indicators and assumptions underlying outcomes, including outliers
● For selected key indicators and findings, adopt a more extensive pedigree approach.
● Avoid usage of probabilities for future scenarios without stressing subjectivity
● Use qualitative terminology for describing uncertainty related to costs and potentials of response options
● Further develop uncertainty guidance to structure communication methods according to diversity of uncertainty perspectives
● Develop a systematic way of communicating uncertainties related to human choice and intentionality
● Develop a more rigorous and comprehensive process of analysing uncertainties focussing on the key findings, e.g. applying (elements of) the NUSAP approach
6. References
Allen, M.R., B.B.B. Booth, D.J. Frame, J.M. Gregory, J.A. Kettleborough, L.A. Smith, D.A. Stainforth and P.A. Scoot (2004) Observational constraints on future climate: Distinguishing robust from model-dependent statement of uncertainty in climate forecasting. In: Manning, M., M. Petit, D. Easterling, J. Murphy, A. Patwardhan, H. Rogner, R. Swart and G. Yohe (2004) IPCC Workshop Report: Describing Scientific Uncertainties in Climate Change to Support Analysis of Risk and of Options. IPCC, Geneva
AuYeung, F., J.B. Haywood and A. Schafer (2001) Future Light-Duty Vehicles: Predicting their Fuel Consumption and Carbon-Reduction Potential. SAE Paper 2001-01-1081, presented at the SAE 2001 World Congress, Detroit, MI, March 5-8, 2001
Briscoe, M. (2004) Communicating uncertainties in the science of climate change.: An overview of efforts to reduce miscommunication.between the research community, policy makers and the public. International Centre for Technology Assessment
Craye, M. (2006) Personal communication
Craye, M. , S. Funtowicz and J.P. van der Sluijs (2005)
De Finetti, B. (1937) La Prévision: Ses Lois Logiques, ses Sources Subjectives, Annales de l'
Giles, J. (2002) Scientific uncertainty: When doubt is a sure thing. Nature 418, 476-478.
Gruebler, A and N. Nakicenovic (2001) Identifying dangers in an uncertain climate: We need to research all the potential outcomes, not try to guess which is likeliest to occur. Nature, 412: 15
Ha-Duong, M. (2005) Scenarios, probability and possible futures. Pre- and Post-Print documents halshs-00003925_v1, HAL, CCSd/CNRS
IPCC (2005) Guidance Notes for Lead Authors of the IPCC Fourth Assessment Report on Addressing Uncertainties. http://www.ipcc.ch/activity/uncertaintyguidancenote.pdf
IPCC (2007a) Climate Change 2007 - The Physical Science Basis; Contribution of Working Group I to the Fourth Assessment Report of the IPCC. Cambridge University Press
IPCC (2007b) Climate Change 2007 - Impacts, Adaptation and Vulnerability; Contribution of Working Group II to the Fourth Assessment Report of the IPCC. Cambridge University Press
IPCC (2007c) Climate Change 2007 - Mitigation of Climate Change; Contribution of Working Group III to the Fourth Assessment Report of the IPCC. Cambridge University Press
ISO/IEC (2002) Guide 73:2002 Risk management — Vocabulary — Guidelines for use in standards, International Organization for Standardization, Geneva
Janssen, P. H. M., A. C. Petersen, J. P. van der Sluijs, J. S. Risbey, and J. R. Ravetz (2003) RIVM/MNP Guidance for Uncertainty Assessment and Communication: Quickscan Hints & Actions List. Netherlands Environmental Assessment Agency (MNP), National Institute for Public Health and the Environment (RIVM), Bilthoven, available at: http://www.rivm.nl/bibliotheek/digitaaldepot/Guidance_QS-HA.pdf
Janssen, P.H.M., Petersen, A.C., van der Sluijs, J.P., Risbey, J.S. and Ravetz, J.R. (2005), A guidance for assessing and communicating uncertainties, Water Science & Technology 52: 125–131.
Kandlikar, M, Risbey and S. Dessai (2005) Representing and communicating deep uncertainty in climate change assessment, Comptes Rendus Geoscience, vol. 337, no. 4, pp 443-455
Kloprogge, P, J.P. van der Sluijs, and A.C. Petersen, A.C. (2005) A Method for the Analysis of Assumptions in Assessments: Exploring the Value-Ladenness of Two Indicators in the Fifth Dutch Environmental Outlook, MNP Report 550002010, Bilthoven: Netherlands Environmental Assessment Agency (MNP)
Knight, F. H. (1921) Risk, Uncertainty, and Profit, Boston, MA: Hart, Schaffner & Marx.
Kriegler, E. and H. Held. (2005) Utilizing belief functions for the estimation of future climate change International Journal of Approximate Reasoning 39: 185-209
Manning, M. (2003) The difficulty of communicating uncertainty. Climatic Change, 61: 9-16
Manning, M. and M. Petit (2004) A Concept Paper for the AR4 Cross Cutting Theme: Uncertainties and Risk, IPCC, Geneva
Manning, M., M. Petit, D. Easterling, J. Murphy, A. Patwardhan, H. Rogner, R. Swart and G. Yohe (2004) IPCC Workshop Report: Describing Scientific Uncertainties in Climate Change to Support Analysis of Risk and of Options. IPCC, Geneva
Millennium Ecosystem Assessment (MA) (2005. Ecosystems and Human Well-being: General Synthesis. Island Press, Washington, DC
McIntyre, S and R. McKitrick (2003) Corrections to the Mann, et al. (1998) proxy data base and Northern Hemisphere average temperature series. Energy and Environment, 14: 751-771
McIntyre, S. and R. McKitrick (2005) The M&M critique of MBH98 Northern Hemisphere Climate Index: Update and implications. Energy and Environment, 16: 69-100
21
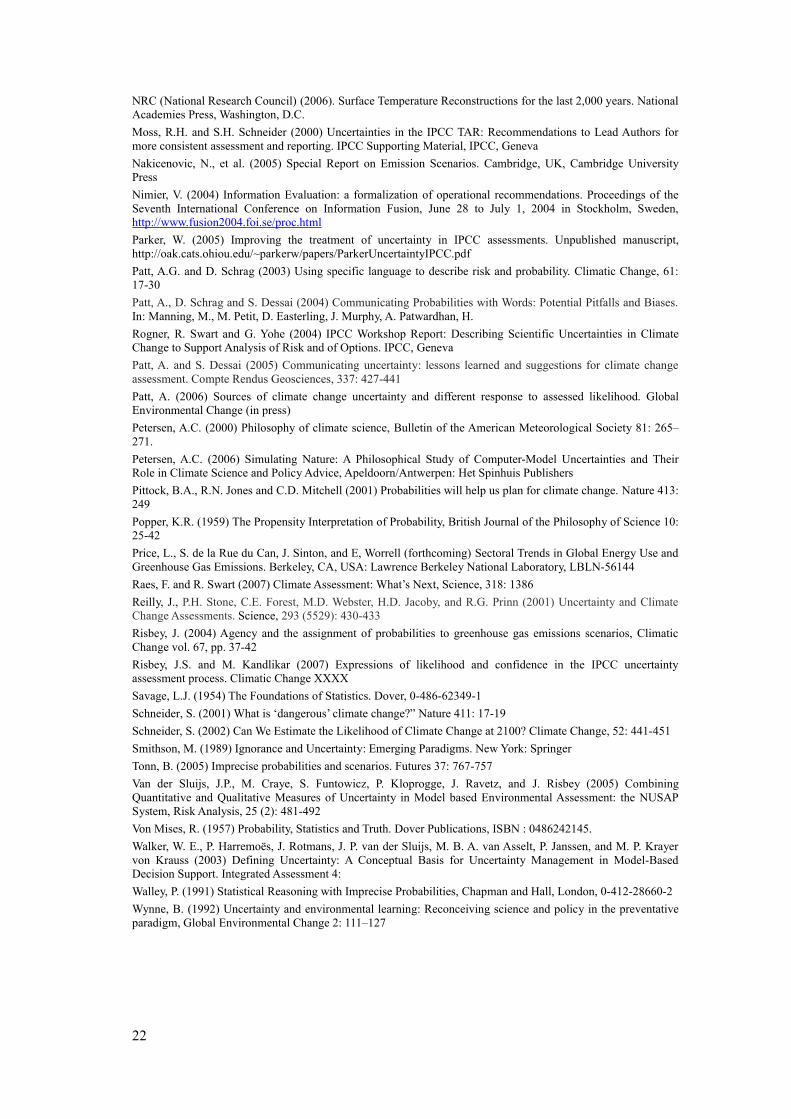
NRC (National Research Council) (2006). Surface Temperature Reconstructions for the last 2,000 years. National Academies Press, Washington, D.C.
Moss, R.H. and S.H. Schneider (2000) Uncertainties in the IPCC TAR: Recommendations to Lead Authors for more consistent assessment and reporting. IPCC Supporting Material, IPCC, Geneva
Nakicenovic, N., et al. (2005) Special Report on Emission Scenarios. Cambridge, UK, Cambridge University Press
Nimier, V. (2004) Information Evaluation: a formalization of operational recommendations. Proceedings of the Seventh International Conference on Information Fusion, June 28 to July 1, 2004 in Stockholm, Sweden, http://www.fusion2004.foi.se/proc.html
Parker, W. (2005) Improving the treatment of uncertainty in IPCC assessments. Unpublished manuscript, http://oak.cats.ohiou.edu/~parkerw/papers/ParkerUncertaintyIPCC.pdf
Patt, A.G. and D. Schrag (2003) Using specific language to describe risk and probability. Climatic Change, 61: 17-30
Patt, A., D. Schrag and S. Dessai (2004) Communicating Probabilities with Words: Potential Pitfalls and Biases. In: Manning, M., M. Petit, D. Easterling, J. Murphy, A. Patwardhan, H.
Rogner, R. Swart and G. Yohe (2004) IPCC Workshop Report: Describing Scientific Uncertainties in Climate Change to Support Analysis of Risk and of Options. IPCC, Geneva
Patt, A. and S. Dessai (2005) Communicating uncertainty: lessons learned and suggestions for climate change assessment. Compte Rendus Geosciences, 337: 427-441
Patt, A. (2006) Sources of climate change uncertainty and different response to assessed likelihood. Global Environmental Change (in press)
Petersen, A.C. (2000) Philosophy of climate science, Bulletin of the American Meteorological Society 81: 265–271.
Petersen, A.C. (2006) Simulating Nature: A Philosophical Study of Computer-Model Uncertainties and Their Role in Climate Science and Policy Advice, Apeldoorn/Antwerpen: Het Spinhuis Publishers
Pittock, B.A., R.N. Jones and C.D. Mitchell (2001) Probabilities will help us plan for climate change. Nature 413: 249
Popper, K.R. (1959) The Propensity Interpretation of Probability, British Journal of the Philosophy of Science 10: 25-42
Price, L., S. de la Rue du Can, J. Sinton, and E, Worrell (forthcoming) Sectoral Trends in Global Energy Use and Greenhouse Gas Emissions. Berkeley, CA, USA: Lawrence Berkeley National Laboratory, LBLN-56144
Raes, F. and R. Swart (2007) Climate Assessment: What’s Next, Science, 318: 1386
Reilly, J., P.H. Stone, C.E. Forest, M.D. Webster, H.D. Jacoby, and R.G. Prinn (2001) Uncertainty and Climate Change Assessments. Science, 293 (5529): 430-433
Risbey, J. (2004) Agency and the assignment of probabilities to greenhouse gas emissions scenarios, Climatic Change vol. 67, pp. 37-42
Risbey, J.S. and M. Kandlikar (2007) Expressions of likelihood and confidence in the IPCC uncertainty assessment process. Climatic Change XXXX
Savage, L.J. (1954) The Foundations of Statistics. Dover, 0-486-62349-1
Schneider, S. (2001) What is ‘dangerous’ climate change?” Nature 411: 17-19
Schneider, S. (2002) Can We Estimate the Likelihood of Climate Change at 2100? Climate Change, 52: 441-451
Smithson, M. (1989) Ignorance and Uncertainty: Emerging Paradigms. New York: Springer
Tonn, B. (2005) Imprecise probabilities and scenarios. Futures 37: 767-757
Van der Sluijs, J.P., M. Craye, S. Funtowicz, P. Kloprogge, J. Ravetz, and J. Risbey (2005) Combining Quantitative and Qualitative Measures of Uncertainty in Model based Environmental Assessment: the NUSAP System, Risk Analysis, 25 (2): 481-492
Von Mises, R. (1957) Probability, Statistics and Truth. Dover Publications, ISBN : 0486242145.
Walker, W. E., P. Harremoës, J. Rotmans, J. P. van der Sluijs, M. B. A. van Asselt, P. Janssen, and M. P. Krayer von Krauss (2003) Defining Uncertainty: A Conceptual Basis for Uncertainty Management in Model-Based Decision Support. Integrated Assessment 4:
Walley, P. (1991) Statistical Reasoning with Imprecise Probabilities, Chapman and Hall, London, 0-412-28660-2
Wynne, B. (1992) Uncertainty and environmental learning: Reconceiving science and policy in the preventative paradigm, Global Environmental Change 2: 111–127
22
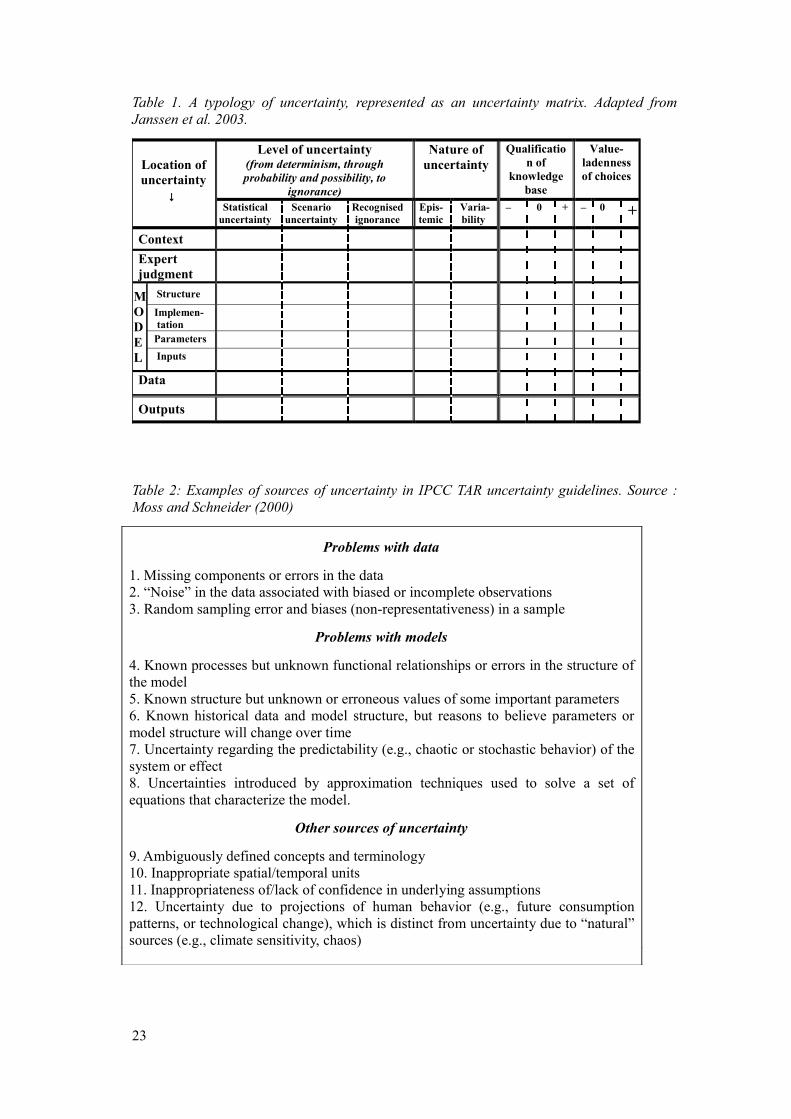
Table 1. A typology of uncertainty, represented as an uncertainty matrix. Adapted from Janssen et al. 2003.
Location of uncertainty ↓
Level of uncertainty (from determinism, through probability and possibility, to
ignorance)
Nature of uncertainty
Qualification of
knowledge base
Value-ladenness of choices
Statistical uncertainty
Scenario uncertainty
Recognised ignorance
Epis-temic
Varia-bility
– 0 + – 0 +
Context
Expert judgment
M O D E L
Structure
Implemen- tation
Parameters Inputs
Data
Outputs
Table 2: Examples of sources of uncertainty in IPCC TAR uncertainty guidelines. Source : Moss and Schneider (2000)
Problems with data
1. Missing components or errors in the data2. “Noise” in the data associated with biased or incomplete observations3. Random sampling error and biases (non-representativeness) in a sample
Problems with models
4. Known processes but unknown functional relationships or errors in the structure of the model5. Known structure but unknown or erroneous values of some important parameters6. Known historical data and model structure, but reasons to believe parameters or model structure will change over time7. Uncertainty regarding the predictability (e.g., chaotic or stochastic behavior) of the system or effect8. Uncertainties introduced by approximation techniques used to solve a set of equations that characterize the model.
Other sources of uncertainty
9. Ambiguously defined concepts and terminology10. Inappropriate spatial/temporal units11. Inappropriateness of/lack of confidence in underlying assumptions12. Uncertainty due to projections of human behavior (e.g., future consumption patterns, or technological change), which is distinct from uncertainty due to “natural” sources (e.g., climate sensitivity, chaos)
23
Table 3: The simple typology of uncertainties in IPCC AR4 guidelines. Source: IPCC Guidance Note (IPCC, 2005)
Type Indicative examples of sources Typical approaches and considerations
Unpredictability Projections of human behavior not easily amenable to prediction (e.g. evolution of political systems). Chaotic components of complex systems.
Use of scenarios spanning a plausible range, clearly stating assumptions, limits considered, and subjective judgments. Ranges from ensembles of model runs.
Structural uncertainty
Inadequate models, incomplete or competing conceptual frameworks, lack of agreement on model structure, ambiguous system boundaries or definitions, significant processes or relationships wrongly specified or not considered.
Specify assumptions and system definitions clearly, compare models with observations for a range of conditions, assess maturity of the underlying science and degree to which understanding is based on fundamental concepts tested in other areas.
Value uncertainty
Missing, inaccurate or non-representative data, inappropriate spatial or temporal resolution, poorly known or changing model parameters.
Analysis of statistical properties of sets of values (observations, model ensemble results, etc); bootstrap and hierarchical statistical tests; comparison of models with observations.
Table 4: Likelihood scale. Source: IPCC (2007a)
Likelihood Terminology Likelihood of the occurrence/ outcome
Virtually certain > 99% probability
Extremely likely > 95% probability
Very likely > 90% probability
Likely > 66% probability
More likely than not > 50% probability
About as likely as not 33 to 66% probability
Unlikely < 33% probability
Very unlikely < 10% probability
Extremely unlikely < 5% probability
Exceptionally unlikely < 1% probability
24
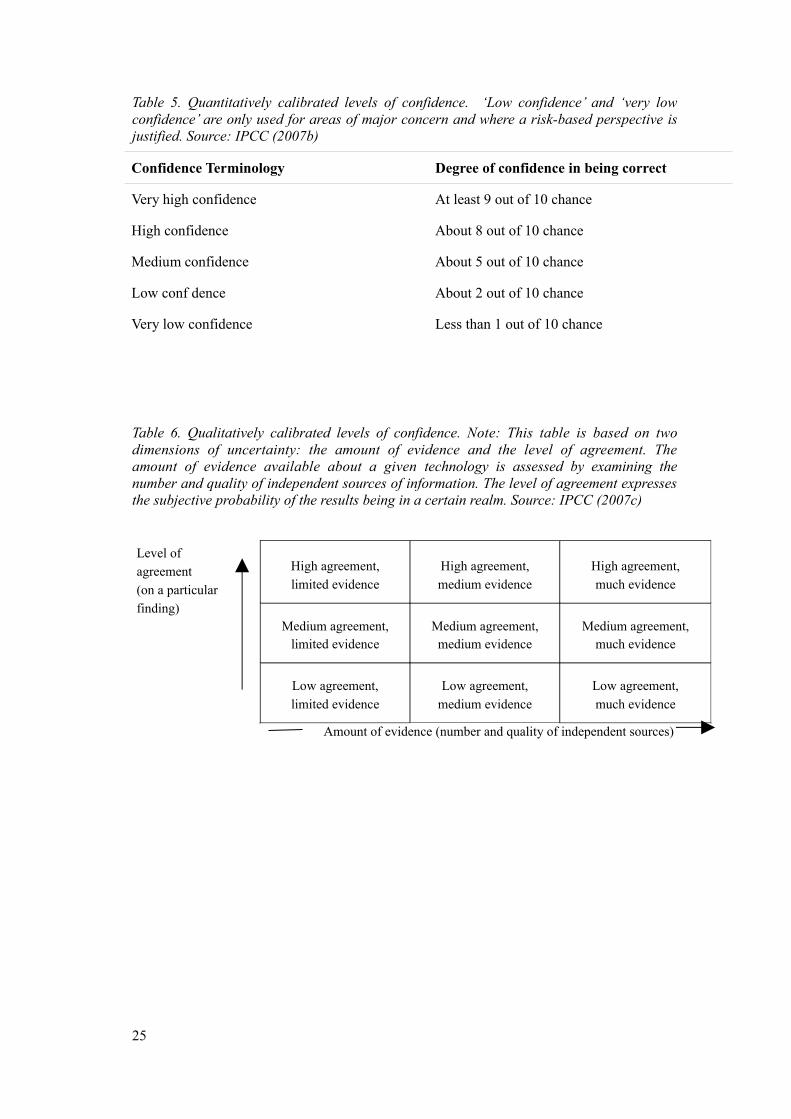
Table 5. Quantitatively calibrated levels of confidence. ‘Low confidence’ and ‘very low confidence’ are only used for areas of major concern and where a risk-based perspective is justified. Source: IPCC (2007b)
Confidence Terminology Degree of confidence in being correct
Very high confidence At least 9 out of 10 chance
High confidence About 8 out of 10 chance
Medium confidence About 5 out of 10 chance
Low conf dence About 2 out of 10 chance
Very low confidence Less than 1 out of 10 chance
Table 6. Qualitatively calibrated levels of confidence. Note: This table is based on two dimensions of uncertainty: the amount of evidence and the level of agreement. The amount of evidence available about a given technology is assessed by examining the number and quality of independent sources of information. The level of agreement expresses the subjective probability of the results being in a certain realm. Source: IPCC (2007c)
Amount of evidence (number and quality of independent sources)
25
Level of agreement
(on a particular finding)
High agreement,limited evidence
High agreement,medium evidence
High agreement,much evidence
Medium agreement,limited evidence
Medium agreement,medium evidence
Medium agreement,much evidence
Low agreement,
limited evidence
Low agreement,
medium evidence
Low agreement,
much evidence
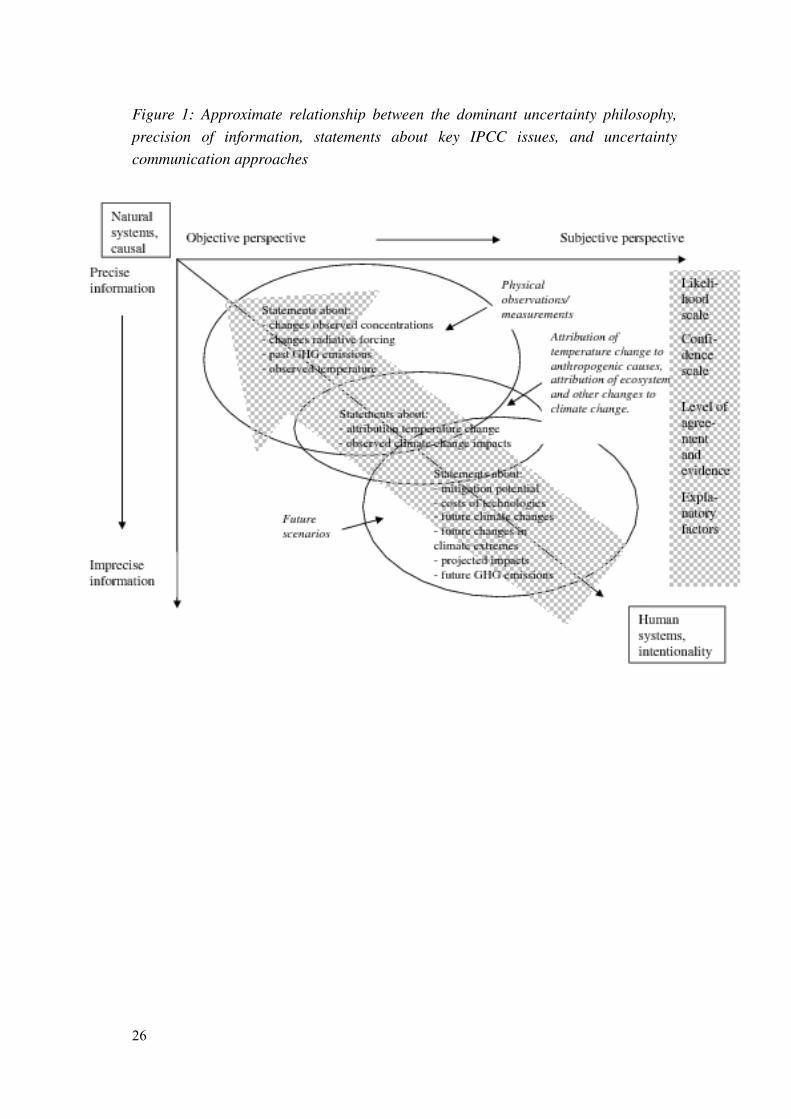
Figure 1: Approximate relationship between the dominant uncertainty philosophy, precision of information, statements about key IPCC issues, and uncertainty communication approaches
26
i Risk and uncertainty in some definitions do not capture the full range of what we do not know. Wynne (1992) distinguishes in addition to risk (known odds) and uncertainty (unknown odds but parameters largely known) also ignorance (where we ‘don’t know what we don’t know’) and – spanning uncertainty and ignorance – indeterminacy (where causal chains or networks are open. The later two aspects are either implicitly or explicitly (e.g. when describing surprises) included in IPCC assessments and captured in the broad definition of uncertainty that we adopt in this paper.
ii In a similar vein, Allen et al. (2004) recommend that WG I distinguish between scenario uncertainty (different emissions paths), natural variability, and response uncertainty (incomplete knowledge of timescales and feedback processes). Briscoe (2004), in an overview of inputs into a US hearing on communicating scientific uncertainties, noted that the science of climate change is affected by two main types of uncertainty: unknown aspects of how the climate system works and of how human actions will impact climate change.
iii We argue that contrary to the objective/subjective difference, from a purely theoretical point of view, the distinction between theories of risk (precise) and uncertainty (imprecise) is not philosophically irreducible. Truth and belief are fundamentally different concepts, but precise probabilities can be seen as the limit case of imprecise probabilities, when the imprecision is zero. Probabilistic reasoning is by far the best understood method consistent with the dominant precise approach in science. But in reality, situations where precise probabilities are not well defined cannot be avoided, e.g., in assessments of future developments the imprecision can never be reduced to zero. Mathematical procedures to deal with imprecision are much less developed, in spite of a growing body of empirical and theoretical literature on imprecise probabilities or fuzzy logic (Walley, 1993).
iv The responsibilities of WG II and WG III have changed since the First Assessment Report. WG II now addresses impacts, adaptation and vulnerability, while WG III addresses mitigation.
v In fact, this formulation was designed during the Plenary meeting jointly by IPCC delegates and lead authors.
vi A prediction or forecast is the result of an attempt to produce a most likely description or estimate of the actual evolution of a variable in the future, e.g. at seasonal, interannual or long-term time scales. Projections are based on simulations by models with various input assumptions, concerning, e.g., future socio-economic and technological developments. They generally do not have likelihoods attached to them.
viiThe author’s judgment is subjected to review and may therefore become considered representative for a larger group of experts. However, it is crucial to ensure a spectrum of views within the lead-authors team charged with crafting uncertainty statements.
viii Pittock et al. (2001) and Schneider (2001, 2002) have suggested to attach probabilities to scenarios of climate change to serve policy makers, but Gruebler and Nakicenovic (2001) have provided counter arguments. The debate continues. It reflects, to some extent, the tension of the causal-intentional dimension; the SRES authors prefer to keep the human choice dimension explicit, while other prefer to take a subjective risk approach. See also Box 3.
ix Interestingly, it has been suggested that the matrix not only can be used as qualifiers for key statements, but also can be filled with response options organized according to the level of consensus and evidence.
x E.g. we did not discuss important issues such as communicating relative importance of uncertainties, the possibilities of addressing robustness rather than the uncertainty of findings, and the importance of graphical representation of uncertainties for communication with users.