after the wave: the advantages of demographic change - epc
TRANSCRIPT
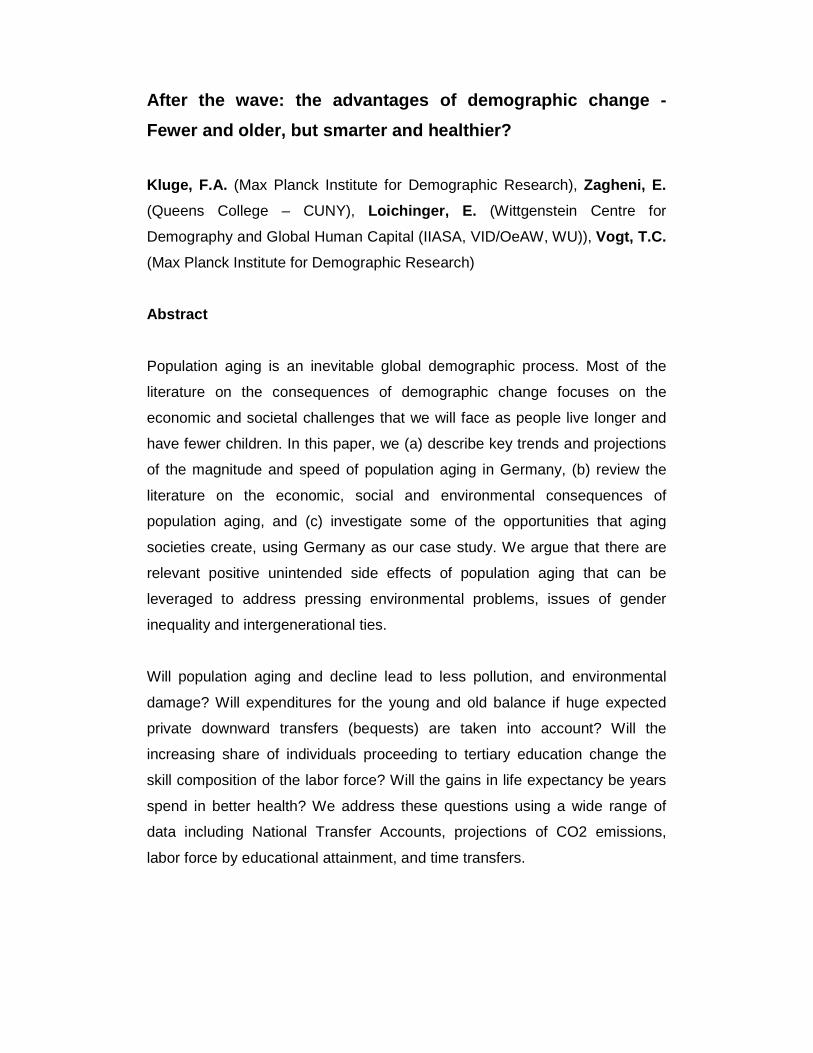
After the wave: the advantages of demographic chang e -
Fewer and older, but smarter and healthier?
Kluge, F.A. (Max Planck Institute for Demographic Research), Zagheni, E.
(Queens College – CUNY), Loichinger, E. (Wittgenstein Centre for
Demography and Global Human Capital (IIASA, VID/OeAW, WU)), Vogt, T.C.
(Max Planck Institute for Demographic Research)
Abstract
Population aging is an inevitable global demographic process. Most of the
literature on the consequences of demographic change focuses on the
economic and societal challenges that we will face as people live longer and
have fewer children. In this paper, we (a) describe key trends and projections
of the magnitude and speed of population aging in Germany, (b) review the
literature on the economic, social and environmental consequences of
population aging, and (c) investigate some of the opportunities that aging
societies create, using Germany as our case study. We argue that there are
relevant positive unintended side effects of population aging that can be
leveraged to address pressing environmental problems, issues of gender
inequality and intergenerational ties.
Will population aging and decline lead to less pollution, and environmental
damage? Will expenditures for the young and old balance if huge expected
private downward transfers (bequests) are taken into account? Will the
increasing share of individuals proceeding to tertiary education change the
skill composition of the labor force? Will the gains in life expectancy be years
spend in better health? We address these questions using a wide range of
data including National Transfer Accounts, projections of CO2 emissions,
labor force by educational attainment, and time transfers.
I. Introduction
Around the globe countries face population aging. Life expectancy has risen
at a steady pace of about 3 months per year and is not yet expected to come
to an end (Oeppen and Vaupel 2002). At the same time, fertility fell
considerably in almost all countries around the world. In Europe, three-
quarters of the population live in countries with fertility even below
replacement level (Frejka and Sobotka 2008). Increasing longevity and low
birth rates result in major changes in the observed age structure having
severe consequences for societal arrangements. The projected changes
impact on numerous areas of life such as family formation, labor market
arrangements, sustainability of public finances or environmental
considerations.
Economic research stresses primarily the negative effects of increasing life
expectancy and declining fertility, such as the burden of increasing
dependency ratios (Cutler, Poterba et al. 1990), the dramatic effects on the
labour market (Börsch-Supan 2003; Börsch-Supan 2004), and the effects of
global aging on the economy (Bloom and Canning 2008; Börsch-Supan
2008). Furthermore, a big branch of literature studies the impact of population
aging on the pillars of social security. According to numerous studies, health
expenditures are going to increase (Getzen 1992; Anderson and Hussey
2000; McGrail, Green et al. 2000), as well as expenditures for long-term care
(Schulz, Leidl et al. 2004; Comas-Herrera, Wittenberg et al. 2006). Also the
increasing burden of public pensions on government budgets is of great
concern (Bongaarts 2004; Fenge and Werding 2004; Jimeno, Rojas et al.
2008). The observed and expected changes in the demographic composition
cause varying problems in different countries, depending mainly on the
degree of reliance of the citizens on the public sector in old age and the
generosity of public programs.
Still, for most European countries, this mainly applies within the next three
decades in which a decreasing number of producers has to care for an
increasing number of consumers. After this transition period, one can on
average expect older and smaller populations and reduced costs induced by
smaller cohorts entering retirement age. So while it is certainly true that
current and expected age structure changes will have a negative impact on
for example public finances, we expect a levelling off in the long run. We can
even find domains where population aging could be advantageous. These
could for example be: lower pollution levels, balanced intergenerational
transfers as the upward public transfers for public pensions are compensated
through higher inter-vivo transfers and bequests due to lower number of
siblings, or increasing gender equality via higher female labor force
participation and changes in time use. This paper addresses some areas
where we expect beneficial effects as population aging occurs. We mainly
focus on Germany, as it is a forerunner not only as an aging society but also
with very high level of public transfers and a huge industrial sector and
therefore highly suitable for the envisaged analysis.
We investigate five illustrative areas regarding potentially unintended
consequences of population aging in the long-run. We focus on the
educational composition of the labour force, CO2-emissions in aging
societies, intergenerational transfers in form of bequests, developments in
healthy life expectancy, and the share of lifetime spent working. These five
examples demonstrate potential positive long-run effects that are either a
direct cause of population aging, such as for example lower CO2-emissions
due to changing consumption patterns over the life cycle, or an indirect one,
such as likely changes in female labour force participation rates due to the
expected changes in the age structure.
All illustrated results crucially depend on behavioural adaptation of individuals.
Thus, the findings are subject to change whenever individuals make decisions
in the future that deviate from the currently observed ones. In that way, our
study shows the possible positive effects if the current conditions prevail.
Speculations on different coping strategies can be made but are out of scope
of this article. The article structures as follows: We first provide an overview
on the population aging process in Germany. Afterwards we present five
illustrative examples of areas where aging might have advantageous side-

effects. In the remaining of the paper we show why this can be important for
policy makers before we conclude.
II. Aging in Germany
We begin our analysis with some descriptive figures on population aging in
Germany. We would like to show that major demographic changes happened
in the past and are expected to shape the future mainly until 2040. Main
reason for this development is the baby boomer cohorts’ entry to retirement
age. When this influential transition phase associated with pressure to social
security programs and more general sustainability issues is past, a more
advantageous population age distribution can be expected again. Figure 1
compares the population age distribution for Germany in 2010 and 2060.
While today individuals of working age are in the majority these cohorts will
grow old over the next decades. Afterwards we see an older but more evenly
distributed age structure.
Figure 1: Population age distribution, Germany 2010 (left) and 2060 (right)
Source: Statistisches Bundesamt (2012)
Figure 2 depicts old-age dependency ratios for all EU-27 countries according
to their aging trajectories. Overall, we see a doubling in the old-age
dependency ratio within the following five decades for the mean of all EU-27
countries. Some countries such as Germany, Italy or Greece are already
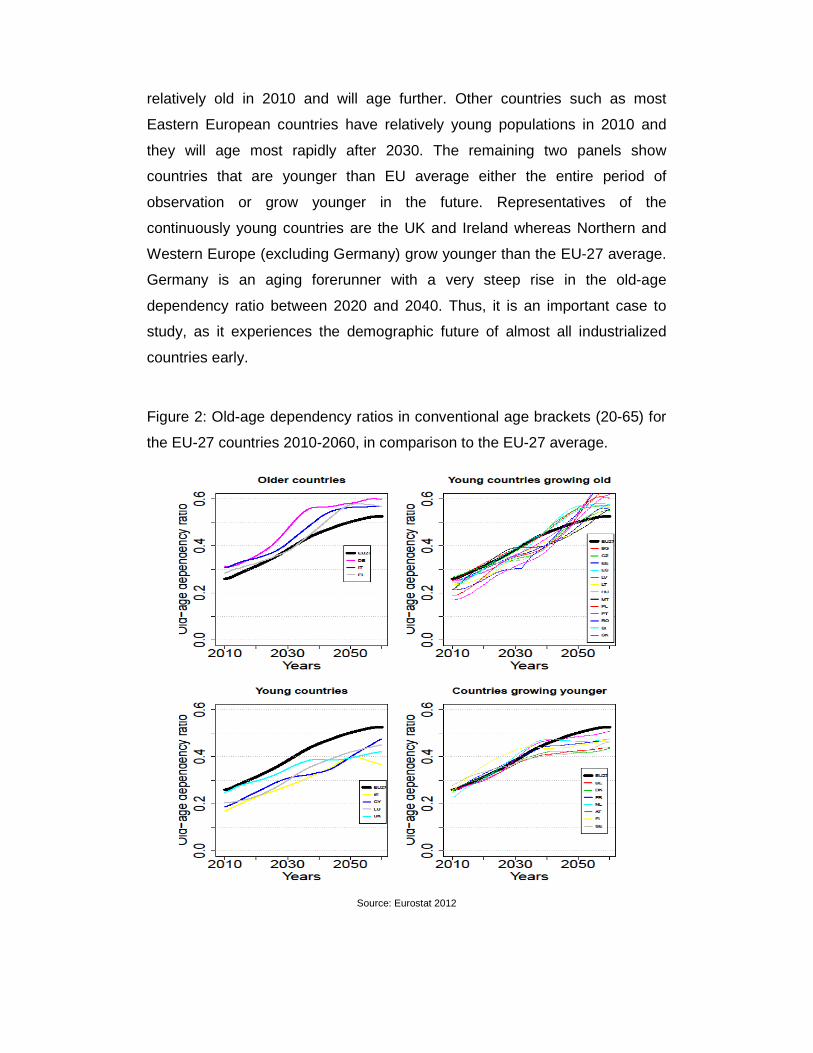
relatively old in 2010 and will age further. Other countries such as most
Eastern European countries have relatively young populations in 2010 and
they will age most rapidly after 2030. The remaining two panels show
countries that are younger than EU average either the entire period of
observation or grow younger in the future. Representatives of the
continuously young countries are the UK and Ireland whereas Northern and
Western Europe (excluding Germany) grow younger than the EU-27 average.
Germany is an aging forerunner with a very steep rise in the old-age
dependency ratio between 2020 and 2040. Thus, it is an important case to
study, as it experiences the demographic future of almost all industrialized
countries early.
Figure 2: Old-age dependency ratios in conventional age brackets (20-65) for
the EU-27 countries 2010-2060, in comparison to the EU-27 average.
Source: Eurostat 2012
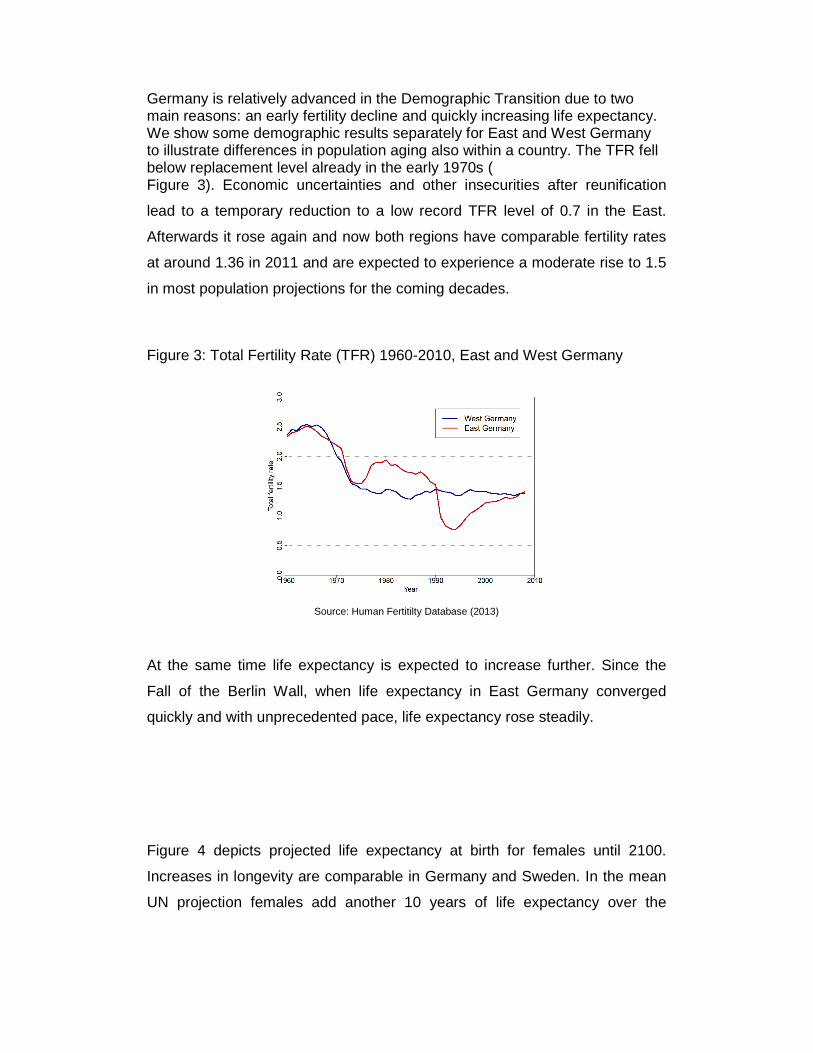
Germany is relatively advanced in the Demographic Transition due to two main reasons: an early fertility decline and quickly increasing life expectancy. We show some demographic results separately for East and West Germany to illustrate differences in population aging also within a country. The TFR fell below replacement level already in the early 1970s ( Figure 3). Economic uncertainties and other insecurities after reunification
lead to a temporary reduction to a low record TFR level of 0.7 in the East.
Afterwards it rose again and now both regions have comparable fertility rates
at around 1.36 in 2011 and are expected to experience a moderate rise to 1.5
in most population projections for the coming decades.
Figure 3: Total Fertility Rate (TFR) 1960-2010, East and West Germany
Source: Human Fertitilty Database (2013)
At the same time life expectancy is expected to increase further. Since the
Fall of the Berlin Wall, when life expectancy in East Germany converged
quickly and with unprecedented pace, life expectancy rose steadily.
Figure 4 depicts projected life expectancy at birth for females until 2100.
Increases in longevity are comparable in Germany and Sweden. In the mean
UN projection females add another 10 years of life expectancy over the
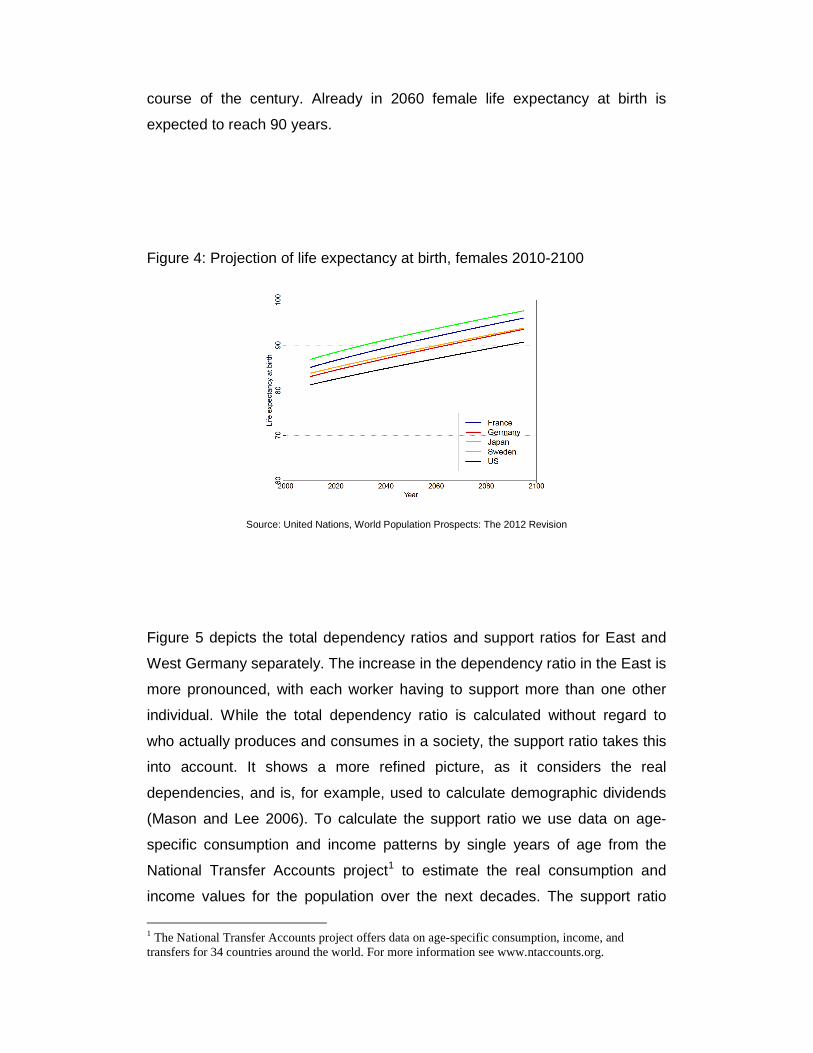
course of the century. Already in 2060 female life expectancy at birth is
expected to reach 90 years.
Figure 4: Projection of life expectancy at birth, females 2010-2100
Source: United Nations, World Population Prospects: The 2012 Revision
Figure 5 depicts the total dependency ratios and support ratios for East and
West Germany separately. The increase in the dependency ratio in the East is
more pronounced, with each worker having to support more than one other
individual. While the total dependency ratio is calculated without regard to
who actually produces and consumes in a society, the support ratio takes this
into account. It shows a more refined picture, as it considers the real
dependencies, and is, for example, used to calculate demographic dividends
(Mason and Lee 2006). To calculate the support ratio we use data on age-
specific consumption and income patterns by single years of age from the
National Transfer Accounts project1 to estimate the real consumption and
income values for the population over the next decades. The support ratio
1 The National Transfer Accounts project offers data on age-specific consumption, income, and transfers for 34 countries around the world. For more information see www.ntaccounts.org.
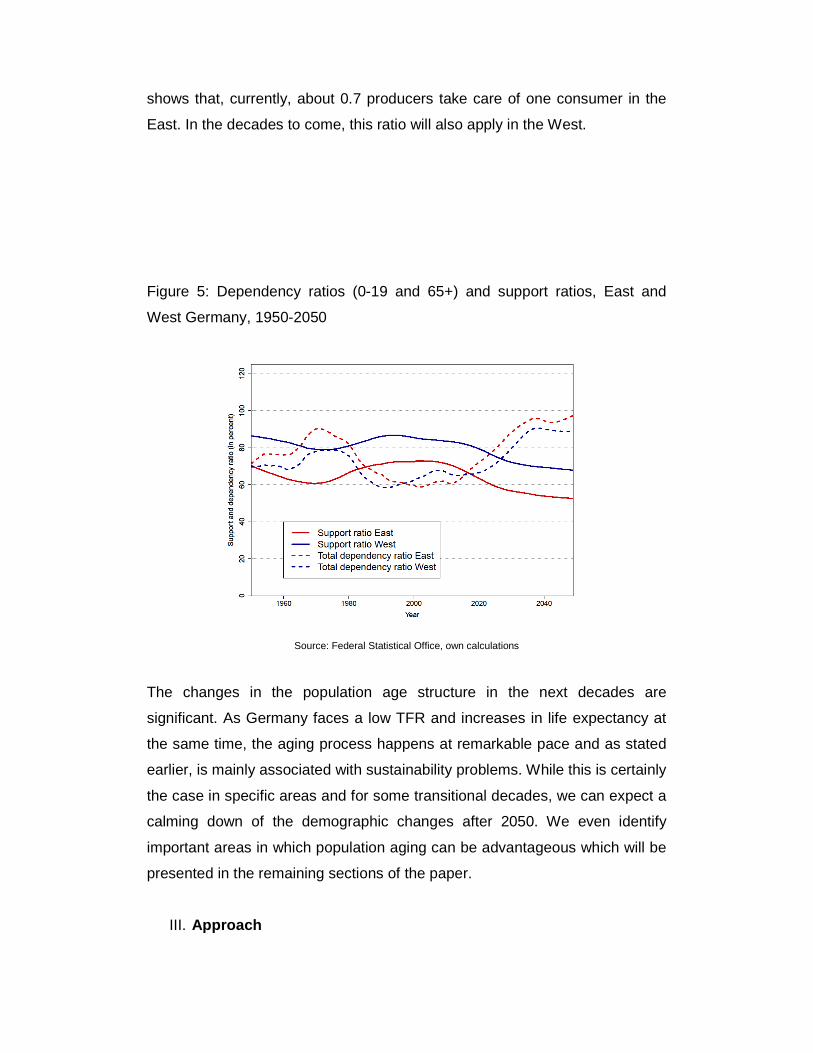
shows that, currently, about 0.7 producers take care of one consumer in the
East. In the decades to come, this ratio will also apply in the West.
Figure 5: Dependency ratios (0-19 and 65+) and support ratios, East and
West Germany, 1950-2050
Source: Federal Statistical Office, own calculations
The changes in the population age structure in the next decades are
significant. As Germany faces a low TFR and increases in life expectancy at
the same time, the aging process happens at remarkable pace and as stated
earlier, is mainly associated with sustainability problems. While this is certainly
the case in specific areas and for some transitional decades, we can expect a
calming down of the demographic changes after 2050. We even identify
important areas in which population aging can be advantageous which will be
presented in the remaining sections of the paper.
III. Approach
We will not go into detail here and present all the different methods used to
show the likely advantageous effects of population aging in selected areas.
Rather we describe the data and methods used shortly at the beginning of
each respective section. Yet, the overall approach for all sections is
comparable: We will show the underlying age patterns for each variable of
interest, such as for example the CO2-emissions or education-specific labour
force participation. This is meant to provide information on how age sensitive
our variables are. Then, we will project the information into the future. We
focus on the very long run, when the demographic turmoil is over and we on
average expect a smaller population with a more favorable age structure. Our
analysis mainly investigates what happens if the current conditions prevail.
We use age profiles of monetary, environmental, labor market and health
related as well as and time use variables as observed today together with
medium population forecasts to show what would happen to the results on the
macro level if we assume a different age structure. This basic forecast can
give important insights on how demography will alter the variables on the
population level and if we will encounter a release in for example pollution
levels after 2050 just by the fact that an on average older population means
less CO2 emissions.
We will extend our findings with a discussion of likely changes in our observed
age profiles. Is the time allocation of males and females subject to change
through increasing female labor force participation rates? Can we expect
lower pollution levels due to advanced technology and what would be the
additional “aging” effect? Will per capita bequests increase as smaller cohorts
will have to share the wealth inherited or is the capital stock eaten up by the
longer lives of the parent’s generation? What will the educational attainment
structure of the labor force look like in the future? Will the care need of oldest-
old individuals really be concentrated on the last two years of life?
Our scenarios are not meant to provide exact forecasts. Instead, we intend to
offer some basis for discussion about the possible advantages of population
aging and how key age utilization patterns could be subject to change
entailing important societal adjustments.
IV. Results – What the future could bring?
To assess the impact of population aging in the long run, we focus on some
specific areas where we argue that aging can be potentially advantageous.
We will investigate some of the opportunities that aging societies create, using
Germany as our main case study. We will examine labor force composition,
pollution levels, intergenerational transfers, the share of life spend in good
health, as well as the fraction of lifetime devoted to work and leisure.
A. Smarter? – Demographic change and education
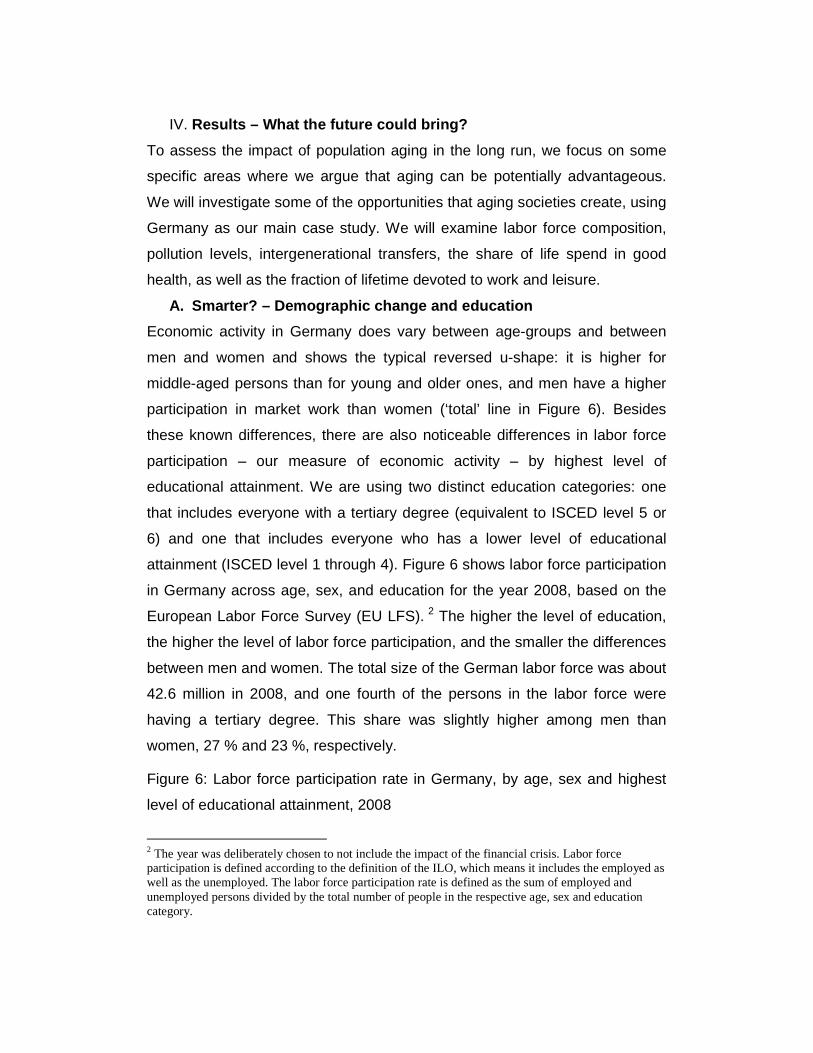
Economic activity in Germany does vary between age-groups and between
men and women and shows the typical reversed u-shape: it is higher for
middle-aged persons than for young and older ones, and men have a higher
participation in market work than women (‘total’ line in Figure 6). Besides
these known differences, there are also noticeable differences in labor force
participation – our measure of economic activity – by highest level of
educational attainment. We are using two distinct education categories: one
that includes everyone with a tertiary degree (equivalent to ISCED level 5 or
6) and one that includes everyone who has a lower level of educational
attainment (ISCED level 1 through 4). Figure 6 shows labor force participation
in Germany across age, sex, and education for the year 2008, based on the
European Labor Force Survey (EU LFS). 2 The higher the level of education,
the higher the level of labor force participation, and the smaller the differences
between men and women. The total size of the German labor force was about
42.6 million in 2008, and one fourth of the persons in the labor force were
having a tertiary degree. This share was slightly higher among men than
women, 27 % and 23 %, respectively.
Figure 6: Labor force participation rate in Germany, by age, sex and highest
level of educational attainment, 2008
2 The year was deliberately chosen to not include the impact of the financial crisis. Labor force participation is defined according to the definition of the ILO, which means it includes the employed as well as the unemployed. The labor force participation rate is defined as the sum of employed and unemployed persons divided by the total number of people in the respective age, sex and education category.
Source: EU LFS, own calculations
The fact that economic activity does not only show distinct patterns by age
and sex but also by education plays a crucial role when it comes to assessing
the potential impact of changes in the size and structure of the labor force on
economic growth. The consequences of population aging are only to a certain
degree determined by a population’s age-structure itself. Labor productivity is
not uniform but varies along several dimensions, one of them being the level
of educational attainment of workers (Bloom and Canning 2008). It might very
well be that a smaller and older but – in terms of human capital - better
equipped labor force can compensate for some of the expected declines in
economic growth (Lee and Mason 2010; Ludwig, Schelkle et al. 2012).
However, it is not the goal of this exercise to quantify these growth effects but
to show potential changes in the composition of the German labor force that
go beyond the usual outlooks by age and sex.
In order to be able to project the labor force along age, sex and education, it is
necessary to not only have the participation profiles along these three
dimensions but to have corresponding population projections as well. Using
the multi-state cohort-component method, the German population was
projected from 2008 to 2053. The starting population distribution in 2008 was
calculated from the EU LFS. The specifications for future fertility, mortality,
migration and education transitions are the same as laid out in K.C., Barakat
et al. (2010), the only difference being that the assumptions about the future
development of fertility, mortality and migration have been updated with the
2011 Version of the World Population Prospects (United Nations 2011). The
education transitions are those of the GET (Global Education Trend) scenario
whose transitions are based on the development of historical global patterns
of educational expansion. Based on these assumptions, not only are larger
shares of persons in young cohorts expected to attain tertiary education (33 %
of 25-29-year olds in 2053, compared to 19 % in 2008), the share of persons
with higher education is also projected to increase for those aged 50 years
and older, since better educated cohorts will replace cohorts with lower levels
of educational attainment (“educational upgrading”). This means that the
share of Germans aged 50 years and older with a tertiary degree was 21 % in
2008 and is estimated to be 34 % in 2053.
Keeping the labor force participation profiles fixed at the levels observed in
2008 and combining them with the education-specific population projections
leads to an absolute labor force size of 29.1 millions in 2053, which is a
reduction of almost a third compared to 2008. This projected decline in the
number of economically active persons in Germany, based purely on changes
in the demographic structure, has been shown in previous research (Börsch-
Supan and Wilke 2009). However, by including the educational dimension, it
is possible to now also present some estimates on the educational
composition of the future labor force: was the share of the labor force with
tertiary education 25 % in 2008, so is it projected to be 33 % in 2033 and to
increase further to 42 % in 2053 (compare Figure 7).
Figure 7: Projected development of the German labor force size, 2008 to
2053, by level of educational attainment. Scenario with constant labor force
participation rates.

Source: own calculations, based on 2008 data from EU LFS and WIC educational attainment population projections.
Since participation is held constant, this change is solely due to the above
described changes in the composition of the German population.
Table 1 shows that this change does happen for all age-groups, although at
varying degrees.
Table 1: Composition of the German labor force by educational attainment,
2008 and 2053 (constant scenario)
Age-group 2008 2053
25-29 21 % 36 %
30-49 29 % 50 %
50+ 30 % 45 %
overall 25 % 42 %
Source: own calculations
Based on the observation of past trends in Germany and other aging
countries, increases in the participation of women as well as of persons above
age 50 are likely. Besides the constant scenario, we did calculate a
benchmark scenario where we assumed that participation would, by 2053,
reach the levels that were observed in Sweden in 2008. Sweden is an often
cited role model country when it comes to equality in economic activity of men
and women and to participation of workers above age 50. For example, labor
force participation of 60-64 year-olds in Sweden was 61 % in 2008, compared
to only 36 % in Germany.
In case of the benchmark assumptions, the total size of the labor force does
still decline, but only to 37.7 million, which is only a 20 % reduction instead of
the over 30 % that result in the constant case. In terms of the educational
composition of the future labor force, the two scenarios show only very minor
differences.
B. Cleaner? – Demographic change and the environment
It has been shown that the profile of per-capita CO2 emissions by age has an
inverted-U shape (Zagheni 2011). As individuals enter adulthood, they tend to
consume and travel more, which, in turn, leads to a larger amount of
emissions. The trend continues well into adulthood as older people have
larger incomes and larger houses and cars. Emissions then decline when
individuals retire and travel less. At an aggregate level, the inverted-U profile
of emissions over the life cycle means that changing age structure may
generate considerable reductions of CO2 emissions, all else being constant.
The figure below shows the trend in emissions for Germany, obtained by
multiplying the age-specific per-capita profile in Zagheni (2011) and UN
population projections (the 2012 Revision of the World Population Prospects).
The profile of emissions over the life course is kept constant: changes in
emissions are driven by changes in population size and age structure. We
observe that population aging initially tends to increase emissions as more
and more people live through the age when emissions peak. We expect that
the effect of changing population size and age structure may be responsible
for an increase in emissions of more than 30% over several decades, from
1950 to 2020. However, in the long run, as the proportion of people older than
80 years old continues to increase and population size shrinks; emissions will
decrease and reach pre-1950 levels.

Figure 8: CO2 Emissions, Germany 1950-2100
Source: Zagheni (2011), UN population projections, own calculations
C. Richer? – Demographic change and intergeneration al transfers
The impact of population aging on intergenerational transfers has been
studied extensively (e.g., Lee and Mason (2011)). However, the effect of
demographic change on the size and timing of bequests over the life course
has been overlooked. Increasing life expectancy means that people tend to
receive bequests later in life. Lower fertility means that bequests are shared
among a smaller group of people and thus the per-capita amount that people
receive would be larger.
The relationship between demography and bequests is mediated by a number
of economic variables like saving rates and wealth accumulation. It is thus
hard to model the dynamics of bequests and to isolate the effect of
demographic change. In order to address the problem, we use
microsimulation. In particular, we use the microsimulator SOCSIM. In the
simulation, each individual is an observation in a rectangular data file, with
records of demographic characteristics for the individual, and identification
numbers for key kinship members. The simulator takes as input population
files and demographic rates. It returns updated population files as output. The
individual is the unit of analysis of the simulator. Each person is subject to a
set of rates, expressed as monthly probabilities of events, given certain
demographic characteristics such as age, sex, marital status, etc. Every
month, each individual faces the risk of a number of events including
childbirth, death and marriage. The selection of the event and the waiting time
until the event occurs are determined stochastically, using a competing risk
model. Some other constraints are included in the simulation program in order
to draw events only for individuals that are eligible for the events (e.g., to
allow for a minimum interval of time between births from the same mother, to
avoid social taboos such as incest, etc.). Each event for which the individual is
at risk is modeled as a piecewise exponential distribution. The waiting time
until each event occurs is randomly generated according to the associated
demographic rates. The individual’s next event is the one with the shortest
waiting time.
At the end of the simulation, population files that contain a list of everyone
who ever lived in the population are created. From these data, it is possible to
estimate the main demographic characteristics of the population and the
entire kin network of any individual at any time. For more details about
SOCSIM, its history, computer routines and applications, see the online
documentation available at lab.demog.berkeley.edu/socsim.
We simulated a hypothetical country with demographic rates that resemble
the ones observed for Sweden, the country for which we have the longest
time series of vital statistics. We assumed that per-capita profiles of wealth
continue to increase over the life course even after retirement. In other words,
we assumed that saving rates remain positive after retirement. Our goal here
is not match in detail the historical experience of a country. Instead, we would
like to explore the consequences of general demographic trends that are
shared by a number of developed countries, coupled with realistic
assumptions about saving behavior.
The figure below shows trends in female life expectancy and in the mean age
at mother’s death for Sweden. Estimates and projections are obtained from
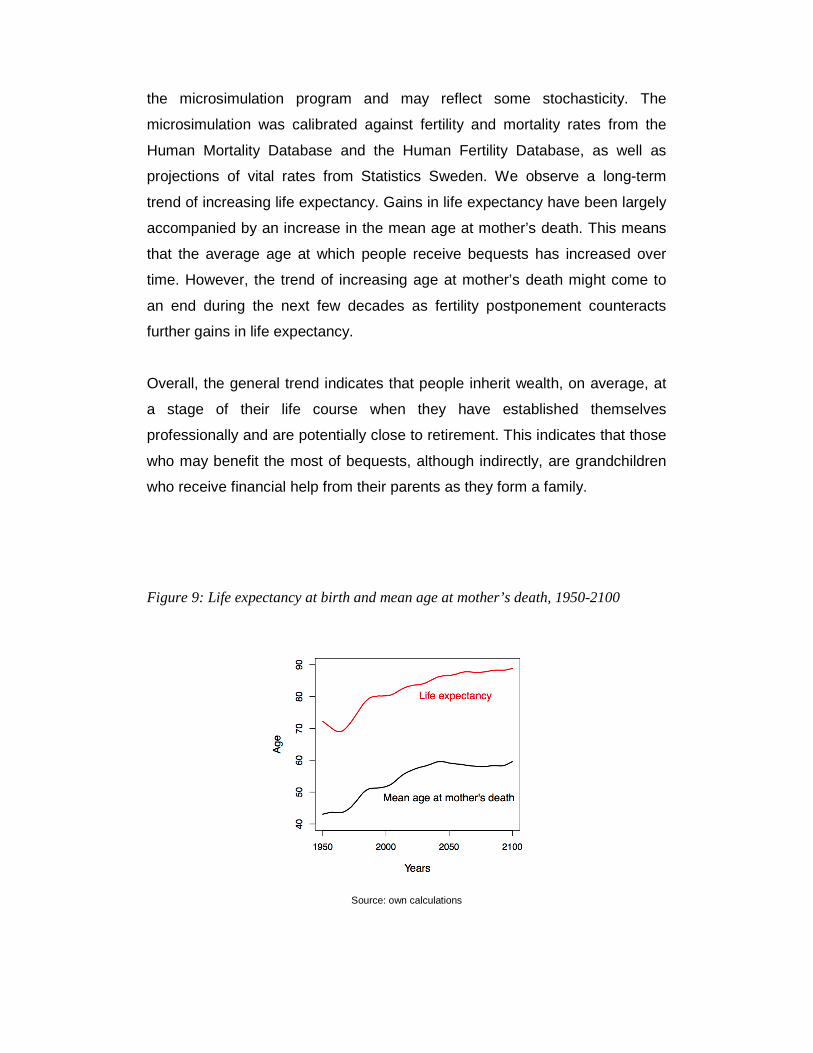
the microsimulation program and may reflect some stochasticity. The
microsimulation was calibrated against fertility and mortality rates from the
Human Mortality Database and the Human Fertility Database, as well as
projections of vital rates from Statistics Sweden. We observe a long-term
trend of increasing life expectancy. Gains in life expectancy have been largely
accompanied by an increase in the mean age at mother’s death. This means
that the average age at which people receive bequests has increased over
time. However, the trend of increasing age at mother’s death might come to
an end during the next few decades as fertility postponement counteracts
further gains in life expectancy.
Overall, the general trend indicates that people inherit wealth, on average, at
a stage of their life course when they have established themselves
professionally and are potentially close to retirement. This indicates that those
who may benefit the most of bequests, although indirectly, are grandchildren
who receive financial help from their parents as they form a family.
Figure 9: Life expectancy at birth and mean age at mother’s death, 1950-2100
Source: own calculations
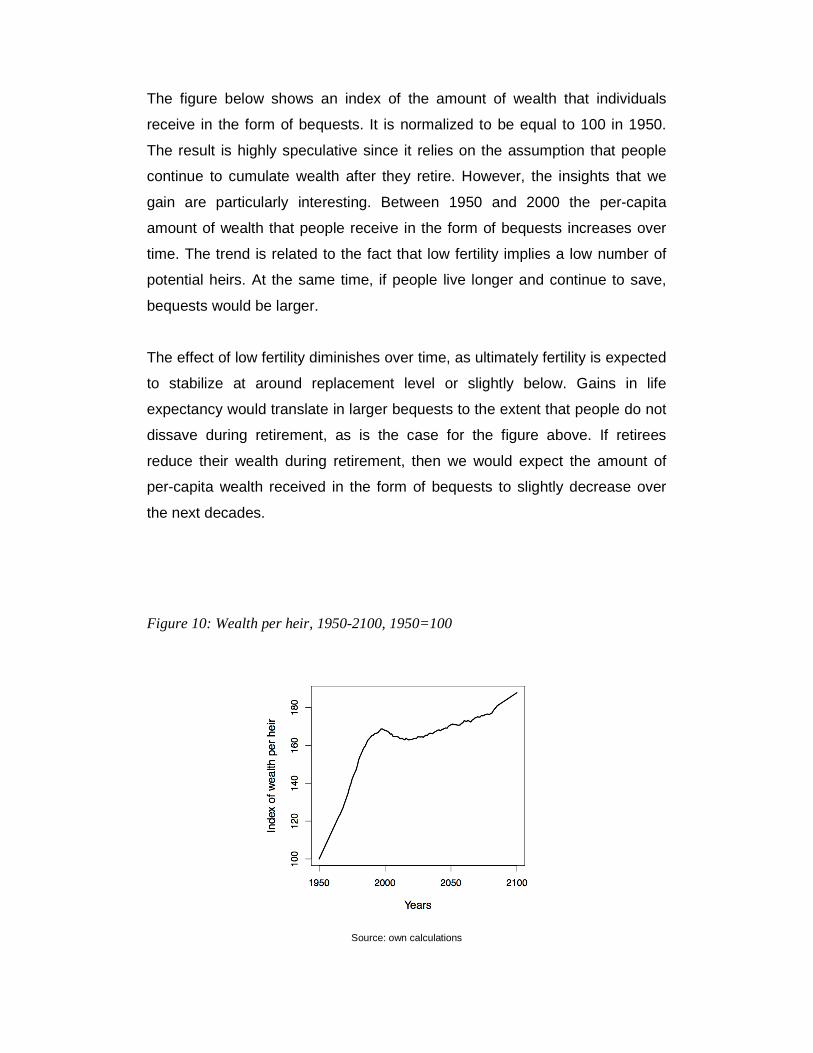
The figure below shows an index of the amount of wealth that individuals
receive in the form of bequests. It is normalized to be equal to 100 in 1950.
The result is highly speculative since it relies on the assumption that people
continue to cumulate wealth after they retire. However, the insights that we
gain are particularly interesting. Between 1950 and 2000 the per-capita
amount of wealth that people receive in the form of bequests increases over
time. The trend is related to the fact that low fertility implies a low number of
potential heirs. At the same time, if people live longer and continue to save,
bequests would be larger.
The effect of low fertility diminishes over time, as ultimately fertility is expected
to stabilize at around replacement level or slightly below. Gains in life
expectancy would translate in larger bequests to the extent that people do not
dissave during retirement, as is the case for the figure above. If retirees
reduce their wealth during retirement, then we would expect the amount of
per-capita wealth received in the form of bequests to slightly decrease over
the next decades.
Figure 10: Wealth per heir, 1950-2100, 1950=100
Source: own calculations
D. Healthier? – Demographic change and healthy life expectancy
The projected increases in longevity in the next decades are substantial. In
Germany life expectancy at birth for females will rise from 83 years to
somewhat around 90 years until 2050. In the past the gains corresponded to
roughly 2.5 years that could be added every 10 years. These projected
changes in longevity entail the question whether the lifetime added will be
spend in good health. There are several studies on current and past trends in
health expectancies including disability free and active life expectancy
(Christensen, Doblhammer et al. 2009). They show improvements in health
expectancies for Germany and other developed countries measured by
different indicator on limitations in the activities of daily living or subjective
health perception (Doblhammer and Kytir 2001; Unger 2006; Manton 2008;
Ziegler and Doblhammer 2008). Thus, other studies add that these gains in
disability free life expectancy are accompanied by an increase in the
prevalence of chronic diseases (Crimmins 2004; Parker and Thorslund 2007).
Surprisingly, analyses on future German health expectancy trends are less
frequent. This aspect in mainly considered in studies on the future
expenditures on health and long-term care in aging welfare states (Getzen
1992; Anderson and Hussey 2000; Schulz, Leidl et al. 2004; Comas-Herrera,
Wittenberg et al. 2006). Increasingly, studies find indications that long-term
care expenditures are rather concentrated at the end of life, about two years
before dying (Zweifel, Felder et al. 1999; Breyer and Felder 2004).
This suggests that the increases in life expectancy are not necessarily related
to soaring health care costs. Yet, the question remains if Germans can not
only enjoy longer lives but also longer healthy lives. To answer this question
we forecast age and sex specific trends in self-perceived health and care
need of household members.
The analysis is based on micro level data collected in the German Socio-
Economic Panel Study (SOEP). The SOEP is a representative household
panel study that reaches back to 1984 and interviews all adult household
members over age 17 on an annual basis. In the first wave, 12,000
respondents were interviewed, later subsets for foreigners, East Germans (in
1990) and immigrants were added and in 1998, 2006, and 2009
``Refreshment'' samples were included. The participating households are
followed over time. The SOEP contains information about the individual, the
working history, income parameters and household structure. A detailed
description of the panel design and description of the data is given elsewhere
(Haisken-DeNew and Frick 2005; Wagner, Frick et al. 2007).
SOEP data is organized in different data sets. For our analysis, we have
matched the data elicited in individual-level questionnaires with biographic
data, and health and disability information. We chose the question “How
would you describe your health at present?” as indicator for self-perceived
health status and the question “Is there anyone in your household who is
receiving care because of old age or health reasons?” as an indicator for care
need among elderly in the household. The first question was asked between
1992 and 2011 and had five possibilities to answer: “very good”, “good”,
“satisfactory”, “poor” and “very poor”. We dichotomized this variable with the
first three opportunities meaning the respondent was healthy. The second
question was asked between 1984 and 2011 and had already only two
answering options: yes and no. We used this information to calculate the sex
specific mean age at which good health/bad health and no need for care/
need for care was reported. In a second step, we forecast these trends using
a random walk with drift.
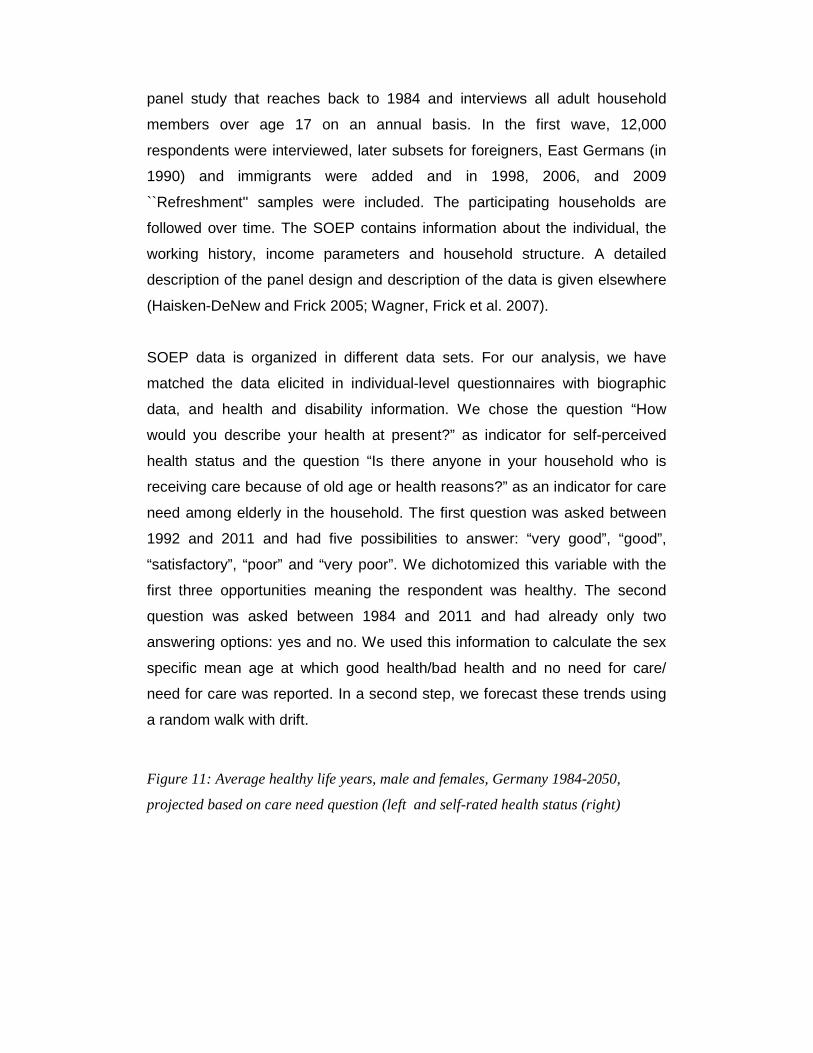
Figure 11: Average healthy life years, male and females, Germany 1984-2050,
projected based on care need question (left and self-rated health status (right)
Source: GSOEP 1984-2011, own calculations
Our results confirm the findings from the literature. Between 1984 and 2011
average healthy life expectancy for females rose by 13 years from 36 to 49
years. Assuming that the pace of improvement is similar in the future, females
could add another 19 years of healthy life expectancy reaching 68 years.
Using self-rated health status as indicator to project healthy life expectancy,
the numbers do not differ considerably. Also here, we see immense
improvements in healthy life expectancy in the past. Over the entire
observation period almost 30 years of life without any health difficulties are
added (for the results compare Figure 11). For males, improvements are a little
bit lower than for females but still high.
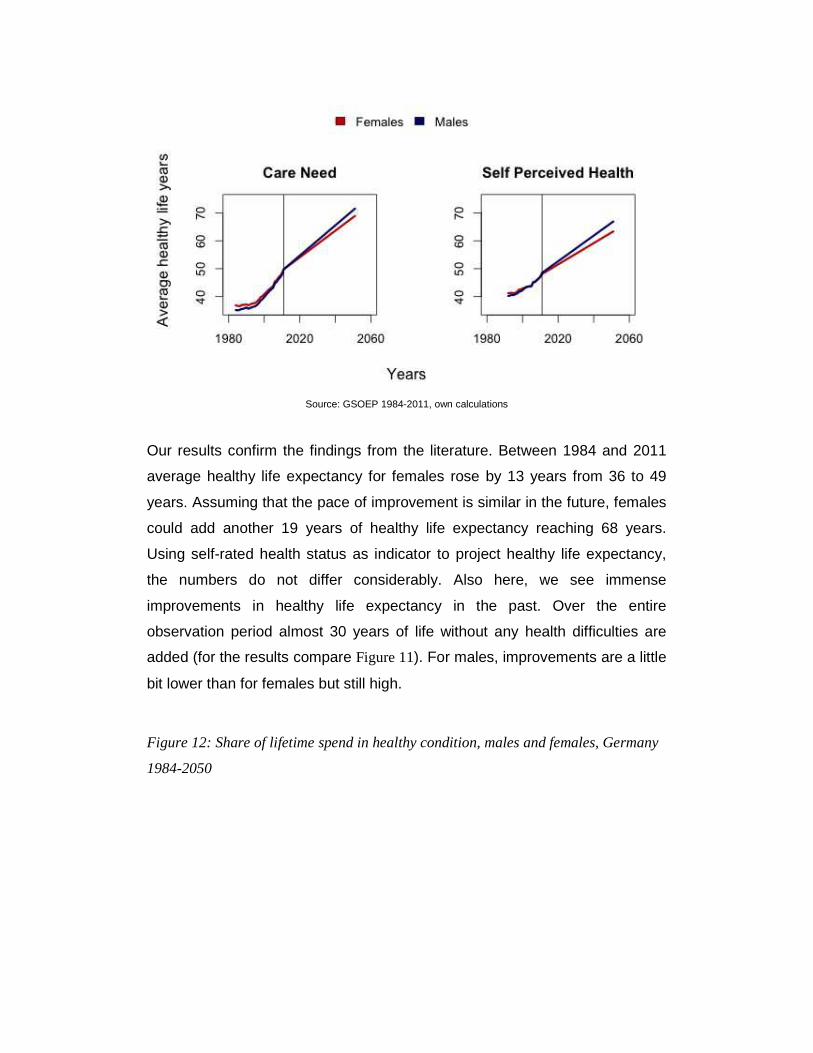
Figure 12: Share of lifetime spend in healthy condition, males and females, Germany
1984-2050
Source: GSOEP 1984-2011, UN population projection
Figure 12 shows the results in relation to life expectancy. Both indicators, care
need and self-rated health status, show a significant increase in the share of
life spend in good health condition. For men, we estimate an increase from
around 50 percent of lifetime spend in healthy condition to 84 percent in 2050.
Here, the gap between males and females is slightly bigger, given the higher
life expectancy of females. In 2050, females have a 7 percentage points lower
lifetime share in good health. Still, over 77 percent of their lifetime women can
expect to live in healthy condition as compared to less than 50 percent in the
past and about 60 percent today.
E. Happier? – Demographic change and time use
The ratio of market work, housework and leisure over the lifecycle and in
cross-section is also of increasing importance both between sexes and across
the life cycle at the individual level. Against the background of population
aging and desired increases in female labor force participation this area is
subject to change having a major impact on the generational and gender
contract as observed today. We use monetary estimates on income,
consumption, and intergenerational transfers obtained by following the
standard methodology of the National Transfer Accounts providing age
specific economic variables, also decomposed by gender. The theoretical
framework builds upon Samuelson (1958), Diamond (1965), and Lee (1994).
Information about consumption, income, and the age utilization of public
expenditures and revenues is provided in the database for Germany (Kluge
2009). To estimate production, consumption, and transfers in the household,
the Time Use Survey 2001/02 is employed. As for all variables of interest we
first show how time use varies over the life cycle today. The observed
differences in time use by gender provide information about labor division of
domestic work within households and the overall workload of an individual.
While working hours in market employment are twice as high for men as for
women, the reverse holds true for domestic labor. Here women provide two
thirds of services including general housekeeping tasks, child or elderly care,
and shopping.
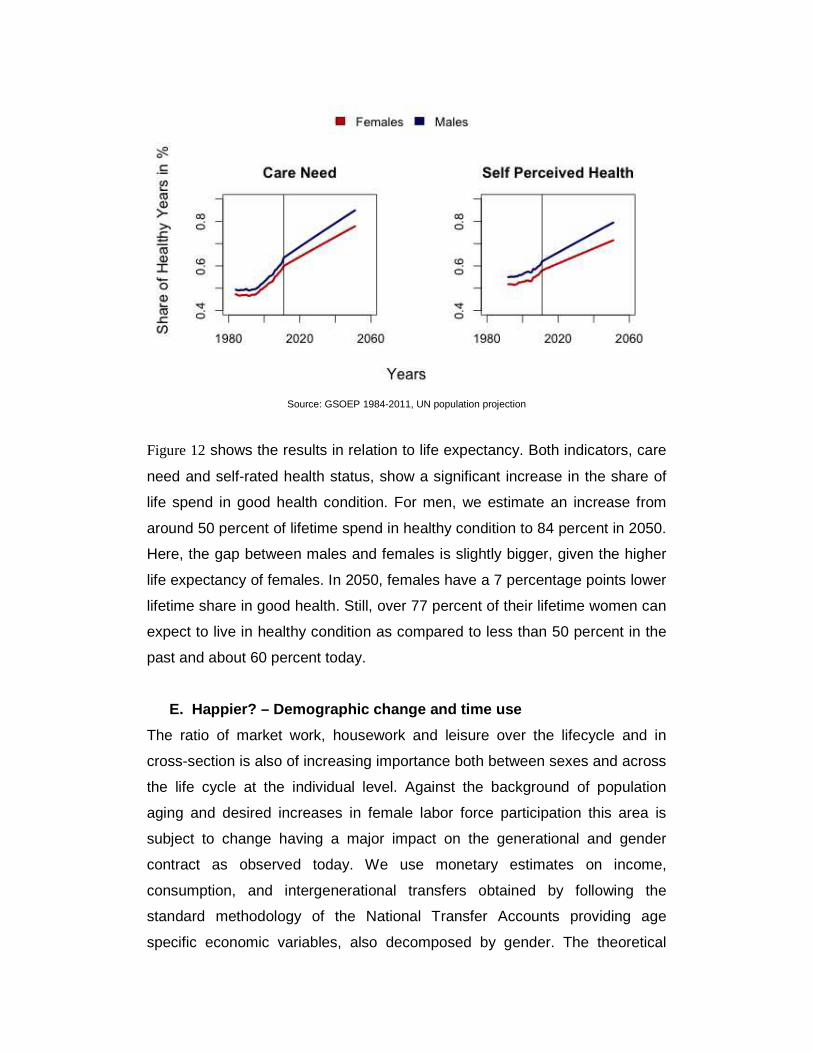
Market consumption and labour income as well as the corresponding
difference between the two, the lifecycle deficit, at each age is shown in
Figure 13. Not surprisingly we find that men produce twice as much as women
beginning in the 30ies. Consumption is relatively comparable, thus, women
hardly reach a surplus over their life course. This picture changes dramatically
if we include unpaid home production.
Figure 13: Income, consumption, and the difference between them (lifecycle
deficit) by age and gender, Germany 2003
Source: NTA database, own calculations
Figure 14 shows the differences in home production by age and gender
expressed in minutes per day. For almost all items such as cooking, cleaning
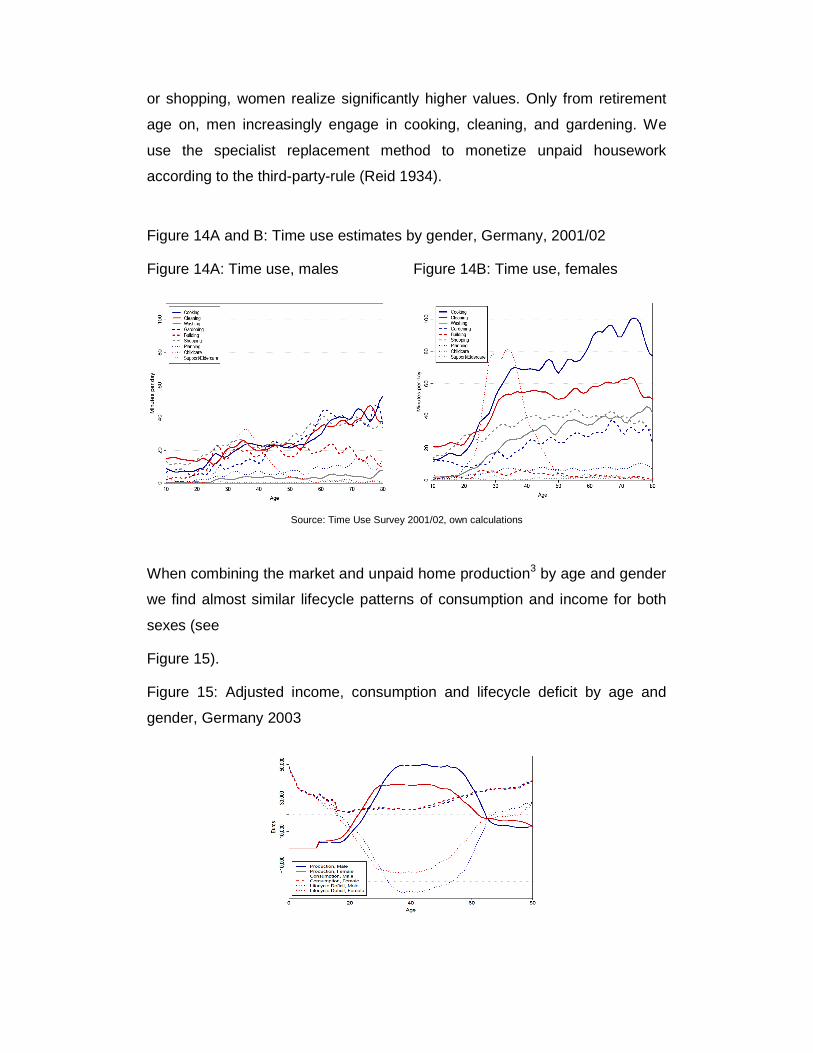
or shopping, women realize significantly higher values. Only from retirement
age on, men increasingly engage in cooking, cleaning, and gardening. We
use the specialist replacement method to monetize unpaid housework
according to the third-party-rule (Reid 1934).
Figure 14A and B: Time use estimates by gender, Germany, 2001/02
Figure 14A: Time use, males
Figure 14B: Time use, females
Source: Time Use Survey 2001/02, own calculations
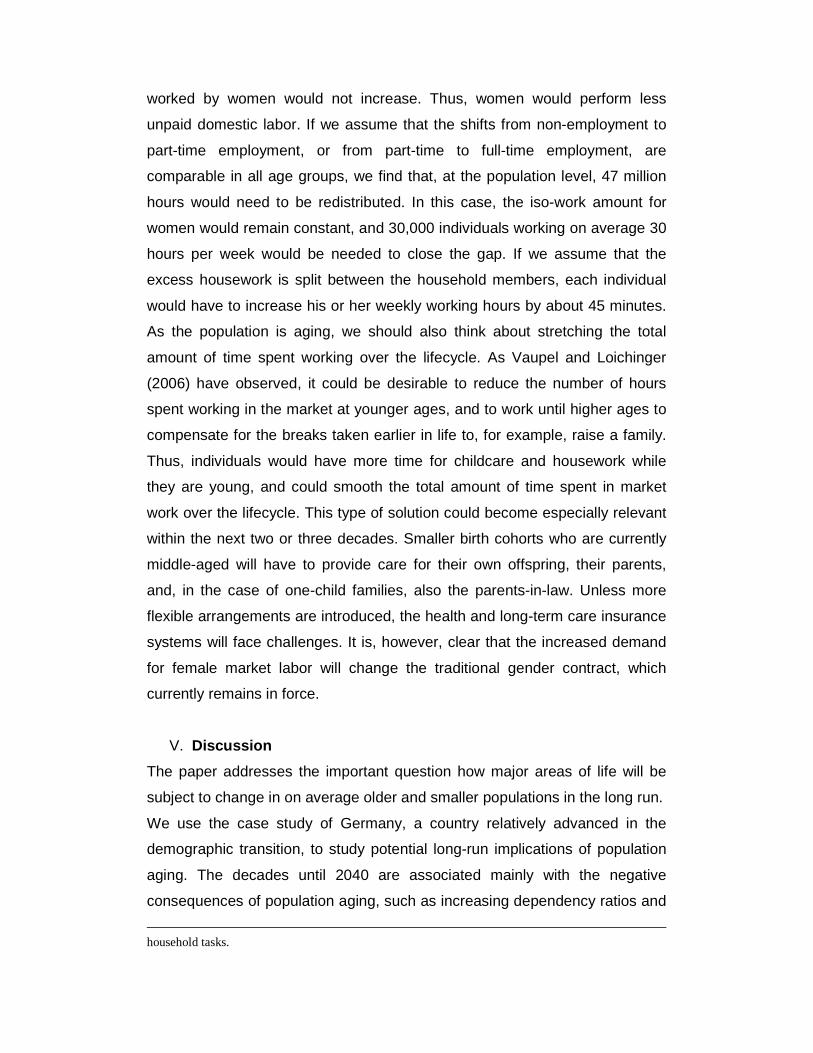
When combining the market and unpaid home production3 by age and gender
we find almost similar lifecycle patterns of consumption and income for both
sexes (see
Figure 15).
Figure 15: Adjusted income, consumption and lifecycle deficit by age and
gender, Germany 2003

Source: own calculations
The relationship between leisure, market work and housework changes in the
future assuming the currently observed profiles prevail in the future is shown
in Figure 16. At the population level we find the time devoted to home
production exceeding the time spent performing market work. The percentage
share for market work as fraction of total time available only adds up to 9.3
percent and would decrease to 7.6 percent. Time that we call leisure, anything
that is not market, home production or sleeping even increases in the older
population by two percentage points. For the individual (in this synthetic
cohort approach) we even find time spend working adds up to 7.4 percent
while leisure nears half a lifetime. Thus population aging will increase leisure
time if no further adjustments are made.
Figure 16: Percentage share of activities at the population level, Germany
2010 and 2060
Source: Time Use Survey 2001/02, own calculations
Over the coming decades, the current gender contract is likely to change
significantly against the background of increasing female labor force
participation rates entailed by population aging. In analyzing the possible
implications of an increase of 10 percentage points in female labor force
participation, we can imagine different scenarios. First, we could keep the iso-
work amount constant. This would mean that the total number of hours
3 Unpaid home production is monetized by using the hourly wage of an unskilled worker for all easy
14.5 11.9
worked by women would not increase. Thus, women would perform less
unpaid domestic labor. If we assume that the shifts from non-employment to
part-time employment, or from part-time to full-time employment, are
comparable in all age groups, we find that, at the population level, 47 million
hours would need to be redistributed. In this case, the iso-work amount for
women would remain constant, and 30,000 individuals working on average 30
hours per week would be needed to close the gap. If we assume that the
excess housework is split between the household members, each individual
would have to increase his or her weekly working hours by about 45 minutes.
As the population is aging, we should also think about stretching the total
amount of time spent working over the lifecycle. As Vaupel and Loichinger
(2006) have observed, it could be desirable to reduce the number of hours
spent working in the market at younger ages, and to work until higher ages to
compensate for the breaks taken earlier in life to, for example, raise a family.
Thus, individuals would have more time for childcare and housework while
they are young, and could smooth the total amount of time spent in market
work over the lifecycle. This type of solution could become especially relevant
within the next two or three decades. Smaller birth cohorts who are currently
middle-aged will have to provide care for their own offspring, their parents,
and, in the case of one-child families, also the parents-in-law. Unless more
flexible arrangements are introduced, the health and long-term care insurance
systems will face challenges. It is, however, clear that the increased demand
for female market labor will change the traditional gender contract, which
currently remains in force.
V. Discussion
The paper addresses the important question how major areas of life will be
subject to change in on average older and smaller populations in the long run.
We use the case study of Germany, a country relatively advanced in the
demographic transition, to study potential long-run implications of population
aging. The decades until 2040 are associated mainly with the negative
consequences of population aging, such as increasing dependency ratios and
household tasks.
increasing expenditures for pensions and health care, as the baby boomers
reach retirement age. Still, we find evidence that after the decades of
transition, population aging could have partially positive effects.
In detail, we show important aspects of an older and smaller population
entailing possibly lower pollution levels due to the fact that consumption
patterns vary considerably by age. A higher fraction of individuals proceeding
to tertiary education might be beneficial for economic growth in the long-run,
compensating at least partly for an absolutely and relatively smaller number of
producers. Inherited wealth will have to be split among a lower number of
siblings and thus could compensate to a higher extend for upward public
transfers such as contributions to the PAYGO-pension system. Furthermore,
individuals are expected to live longer in a healthy state and have more
leisure over their lifetime.
The results only take into account pure demographic changes, since we focus
on age structural changes and their impact on different societal areas. Given
this limitation, we are unable to predict any behavioral changes that will occur
as individuals adapt to an older population structure. We are aware that
changing expectations will alter today’s observed profiles.
The higher educational attainment at the population level can be
advantageous for economic growth. If this development, through presumed
increases in productivity, can compensate for the negative long-run effects of
the shrinking workforce will have to be seen. The expected lower pollution
levels due to population decline could decrease even further if more advanced
technologies are invented. On the other hand the pollution levels could also
stagnate as shrinking populations might not be able to realize significant CO2-
reductions due to for example more individuals living in single households.
The bequests received by future generations could also decrease compared
to our estimates if parents plan for longer lives and adapt to increasing
longevity by using/depleting their capital stock. Also, the projected increase in
healthy life expectancy is difficult to estimate. The question remains if the time
spent in intensive care is really postponed to the last two years of life as
proposed by some studies (Zweifel, Felder et al. 1999; Breyer and Felder

2006). Trends in dementia for example are not entirely clear (Rocca, Petersen
et al. 2011; Schrijvers, Verhaaren et al. 2012). Lifetime spent working will
rather stay constant than decline against the background of retirement age
increase in most developed countries. We could adapt to the longer lives by
redistributing work differently over the lifecycle (Vaupel and Loichinger 2006;
Vaupel and Hofäcker 2009).
Nevertheless, the results show important areas where population aging and
decline could be advantageous and shows a potential bandwidth. Projecting
behavioral changes in each of the areas are out of scope of this article but are
obvious next areas of research.
Although the results presented refer to Germany they could be of interest for
other regions around the world including developed and developing countries.
Life expectancy is increasing almost universally, together with improvements
in the health status of the older population. The importance of investments in
education are well known and education levels are increasing in the large
majority of countries. Depending on a country’s stage in the demographic
transition process, the results from the analyses of bequests and CO2
emissions are also generalizable.
References
Anderson, G. F. and P. S. Hussey (2000). "Population aging: a comparison among industrialized countries." Health Affairs 19(3): 191-203.
Bloom, D. and D. Canning (2008). Global Economic Change: Dimensions and Economic Significance. Population Aging, Human Capital Accumulation, and Productivity Growth. A. Prskawetz, D. Bloom and W. Lutz, Wiley-Blackwell: 17-51.
Bongaarts, J. (2004). "Population aging and the rising cost of public pensions." Population and Development Review 30(1): 1--23.
Börsch-Supan, A. (2003). "Labor market effects of population aging." Labour 17(s1): 5-44.
Börsch-Supan, A. (2004). "Global Aging: Issues, Answers, More Questions." MEA Discussion Paper 55-2004.
Börsch-Supan, A. (2008). The impact of Global Aging on Labor, Product, and Capital Market. Population Aging, Human Capital Accumulation, and Productivity Growth. A. Prskawetz, D. Bloom and W. Lutz, Wiley-Blackwell: 52-77.
Börsch-Supan, A. and C. B. Wilke (2009). "Zur mittel-und langfristigen Entwicklung der Erwerbstätigkeit in Deutschland." Zeitschrift für ArbeitsmarktForschung 42(1): 29-48.
Breyer, F. and S. Felder (2004). "Life Expectancy and Health Care Expenditures in the 21st Century: A New Calculation for Germany Using the Costs of Dying." DIW Discussion Paper.
Breyer, F. and S. Felder (2006). "Life expectancy and health care expenditures: A new calculation for Germany using the costs of dying." Health Policy 75(2): 178--186.
Christensen, K., G. Doblhammer, et al. (2009). "Ageing populations: the challenges ahead." The Lancet 374(9696): 1196-1208.
Comas-Herrera, A., R. Wittenberg, et al. (2006). "Future long-term care expenditure in Germany, Spain, Italy and the United Kingdom." Ageing and Society 26(02): 285--302.
Crimmins, E. M. (2004). "Trends in the health of the elderly." Annu. Rev. Public Health 25: 79-98.
Cutler, D. M., J. M. Poterba, et al. (1990). "An Aging Society: Opportunity or Challenge?" Brookings Papers on Economic Activity 1(990): 1--73.
Diamond, P. A. (1965). "National Debt in a Neoclassical Growth Model." The American Economic Review 55(5): 1126--1150.
Doblhammer, G. and J. Kytir (2001). "Compression or expansion of morbidity? Trends in healthy-life expectancy in the elderly Austrian population between 1978 and 1998." Social science & medicine 52(3): 385-391.
Fenge, R. and M. Werding (2004). "Ageing and the tax implied in public pension schemes: simulations for selected OECD countries." Fiscal Studies 25(2): 159--200.
Frejka, T. and T. Sobotka (2008). "Overview Chapter 1: Fertility in Europe: Diverse, delayed and below replacement." Demographic Research 19(3): 15-46.
Getzen, T. E. (1992). "Population aging and the growth of health expenditures." Journal of gerontology 47(3): 98-104.
Haisken-DeNew, J. and J. Frick (2005). DTC desktop companion to the German Socio-Economic Panel (SOEP).
Human Fertility Database (2013). Human Fertility Database. Joint project of the Max Planck Institute for Demographic Research and the Vienna Institute of Demography and b. a. t. MPIDR. www.humanfertility.org.
Jimeno, J. F., J. A. Rojas, et al. (2008). "Modelling the impact of aging on social security expenditures." Economic Modelling 25(2): 201--224.
K.C., S., B. Barakat, et al. (2010). "Projection of populations by level of educational attainment, age, and sex for 120 countries for 2005-2050." Demographic Research 22(15): 383-472.
Kluge, F. A. (2009). "Transfers, consumption and income over the lifecycle in Germany." MPIDR Working Paper WP-2009-014.
Lee, R. and A. Mason (2010). "Some Macroeconomic Aspects of Global Population Aging." Demography 47-Supplement: 151-172.
Lee, R. and A. Mason (2011). Population Aging and the Generational Economy. Cheltenham, UK., Elgar, Edward.
Lee, R. D. (1994). The Formal Demography of Population Aging, Transfers, and the Economic Life Cycle. Demography of Aging. L. G. Martin and S. H. Preston, National Academy Press Washington, DC 1994: 8-49.
Ludwig, A., T. Schelkle, et al. (2012). "Demographic change, human capital and welfare." Review of Economic Dynamics 15(1): 94-107.
Manton, K. G. (2008). "Recent declines in chronic disability in the elderly US population: risk factors and future dynamics." Annu. Rev. Public Health 29: 91-113.
Mason, A. and R. Lee (2006). "Reform and support systems for the elderly in developing countries: capturing the second demographic dividend." Genus: 11-35.
McGrail, K., B. Green, et al. (2000). "Age, costs of acute and long-term care and proximity to death: evidence for 1987-88 and 1994-95 in British Columbia." Age and Ageing 29(3): 249-253.
Oeppen, J. and J. W. Vaupel (2002). "Demography: enhanced: broken limits to life expectancy." Science 296(5570): 1029-1031.
Parker, M. G. and M. Thorslund (2007). "Health trends in the elderly population: getting better and getting worse." The Gerontologist 47(2): 150-158.
Reid, M. G. (1934). Economics of household production, J. Wiley & Sons, Inc. Rocca, W. A., R. C. Petersen, et al. (2011). "Trends in the incidence and prevalence of
Alzheimer’s disease, dementia, and cognitive impairment in the United States." Alzheimer's & Dementia 7(1): 80-93.
Samuelson, P. A. (1958). "An Exact Consumption-Loan Model of Interest with or without the Social Contrivance of Money." The Journal of Political Economy 66(6): 467--482.
Schrijvers, E. M., B. F. Verhaaren, et al. (2012). "Is dementia incidence declining? Trends in dementia incidence since 1990 in the Rotterdam Study." Neurology 78(19): 1456-1463.
Schulz, E., R. Leidl, et al. (2004). "The impact of ageing on hospital care and long-term care--the example of Germany." Health Policy 67(1): 57--74.
Unger, R. (2006). "Trends in active life expectancy in Germany between 1984 and 2003—a cohort analysis with different health indicators." Journal of Public Health 14(3): 155-163.
United Nations (2011). World Population Prospects: The 2010 Revision. Vaupel, J. W. and D. Hofäcker (2009). "Das lange Leben lernen." Zeitschrift für
Erziehungswissenschaft 12(3): 383--407.
Vaupel, J. W. and E. Loichinger (2006). "Redistributing work in aging Europe." Science 312(5782): 1911-1913.
Wagner, G., J. Frick, et al. (2007). "The German Socio-Economic Panel study (SOEP) - evolution, scope and enhancements." Schmollers Jahrbuch 127: 139-169.
Zagheni, E. (2011). "The leverage of demographic dynamics on carbon dioxide emissions: does age structure matter?" Demography 48(1): 371-399.
Ziegler, U. and G. Doblhammer (2008). "Cohort changes in the incidence of care need in West Germany between 1986 and 2005." European Journal of Population/Revue européenne de Démographie 24(4): 347-362.
Zweifel, P., S. Felder, et al. (1999). "Ageing of population and health care expenditure: a red herring?" Health Economics 8(6): 485--496.