advantages of improved time resolution for tof pet at very low statistics
TRANSCRIPT
126 IEEE TRANSACTIONS ON NUCLEAR SCIENCE, VOL. 61, NO. 1, FEBRUARY 2014
Advantages of Improved Time Resolution for TOFPET at Very Low StatisticsVictor Westerwoudt, Maurizio Conti, and Lars Eriksson
Abstract—In this paper, Monte Carlo generated data are usedto simulate a time-of- ight (TOF) positron emission tomography(PET) scannerwith improving time resolution, down to 200-ps timeresolution. TOF and non-TOF ordered subsets expectation maxi-mization (OSEM) reconstructions were compared in terms of con-trast recovery and signal-to-noise ratio, with the purpose of char-acterizing the differences of TOF and non-TOF at very low counts.This study shows that there is a lower limit to the number of countsin a PET scan, in order to obtain a quantitative PET image. Belowthis limit, the reliability of the measurement is very poor. The useof TOF information has the bene cial effect of lowering this statis-tical limit, allowing for shorter reliable PET scans. Another inter-esting nding derives from the comparison with TOF ltered backprojection (FBP) images: if time resolution can be improved, TOFFBP images become competitive with TOF MLEM and OSEM al-gorithms, not only in terms of contrast recovery but also in termsof reduced noise level.
Index Terms—Low statistics, signal-to-noise ratio, time resolu-tion, TOF PET.
I. INTRODUCTION
T HE advantages of time-of- ight (TOF) positron emissiontomography (PET) have been explained by early research
[1]–[4], discussed [5]–[7] and con rmed by experimental mea-surement in recent years [8]–[11]. The present generation ofcommercial TOF scanners has a time resolution in the rangeof 500-600 ps at full width half maximum (FWHM) [12]–[14].More advanced TOF PET research scanners exhibit less than400 ps time resolution [15].The main improvement of TOF reconstruction is the lower
image noise or higher signal-to-noise ratio (SNR). This is equiv-alent to a virtual gain in sensitivity or count ampli cation. TOFreconstruction is associated with a SNR gain that is inverselyproportional to the square root of the time resolution:
(1)
Manuscript received April 11, 2013; revised July 25, 2013; accepted October18, 2013. Date of publication January 09, 2014; date of current version February06, 2014.V. Westerwoudt was with Siemens Healthcare, Molecular Imaging,
Knoxville, TN 37932 USA. He is now with Delft University of Technology,2600 Delft, The Netherlands.M. Conti is with Siemens Healthcare, Molecular Imaging, Knoxville, TN
37932 USA (e-mail: [email protected]).L. Eriksson is with Siemens Healthcare, Molecular Imaging, Knoxville, TN
37932 USA, and also with the Karolinska Institute, Department of Physics ofthe University of Stockholm, 10691 Stockholm, Sweden, and with Scintilla-tion Materials Research Center, University of Tennessee, Knoxville, TN 37996USA.Digital Object Identi er 10.1109/TNS.2013.2287175
where is the speed of light, is the diameter of the patientor phantom to be imaged, and is the time resolution. Theseequations are obtained for SNR at the center of a uniform cylin-drical source, using a model based on a linear reconstruction,such as ltered back projection (FBP).The TOF gain in SNR allows for obtaining images with sim-
ilar contrast and noise characteristics while using a reducednumber of counts. This advantage can be exploited either byreducing the scan time or reducing the dose to the patient [11].In a previous work, we demonstrated that, if using FBP recon-
struction, the TOF gain is inversely proportional to the time res-olution of the scanner in the 200-600 ps range of time resolution[16]. We observed that the proportionality constant for the SNRgain is about 0.8, which is consistent with a previous theory [1]and intuitive demonstration [16]. Finally, in FBP the proportion-ality holds very well in a wide range of statistics, down to a verylow total true coincidences in the 3D PET scan. Thestudy was based on a Monte Carlo simulation of a Siemens Bi-ograph 4-ring mCT scanner. The data were also reconstructedwith an iterative method, ordinary Poisson ordered subsets ex-pectation maximization (OP-OSEM) [17]. The SNR gain wasalso con rmed for iterative reconstruction, but the proportion-ality with the inverse of time resolution seemed to be valid ina much shorter count range, down to about total truecoincidences, corresponding to a few counts per sinogram bin.Also, the same study showed that TOF and non-TOF imagesseem not to converge to the same activity values below suchthreshold.Signi cant bias in OSEM [18] and a difference between TOF
and non-TOF convergence values [19] have been observed inPET data at very low statistics, reconstructed with OSEM. Inthe reconstruction of very noisy data, the positivity constraint,inherent in maximum likelihood expectation maximization(MLEM) and OSEM, can be responsible for a positive bias inthe image, and such bias can be different in TOF and non-TOFreconstruction. In a simulation study, it has been observed thatsuch bias starts appearing when the number of counts goesdown to 100 counts per sinogram bin, and grows more dramati-cally in the range of 1-10 counts per bin [20]. In this region, thepositivity of the Poisson distribution makes it incompatible withthe noisy data. A modi ed Poisson distribution was proposedto allow for negative values, which are not uncommon in verynoisy, low statistics data sets after random subtraction [20].In terms of noise, the fact that the TOF gain does not strictly
follow the proportionality with the inverse of the time resolutionis not surprising, since in MLEM and OSEM the noise doesnot propagate linearly from the projection space to the imagespace, as happens in FBP. The variance in the image space is not
0018-9499 © 2014 IEEE. Personal use is permitted, but republication/redistribution requires IEEE permission.See http://www.ieee.org/publications_standards/publications/rights/index.html for more information.
WESTERWOUDT et al.: ADVANTAGES OF IMPROVED TIME RESOLUTION FOR TOF PET AT VERY LOW STATISTICS 127
proportional to the variance in the projection space, and the TOFvariance reduction in the projection space cannot be directlytranslated into reduced noise in the image.The behavior of MLEM (and OSEM) variance at low sta-
tistics has been found to be anomalous by others [21]: below athreshold, again in the range of 1-100 counts per bin (dependingon the object and sampling), the empirical variance of OSEMstarts higher than the theoretical lower bound and then growsdramatically.In conclusion, several independent studies seem to indicate
that there is a lower limit, in terms of counts, for reliability ofMLEM and OSEM: below this threshold, bias and variance in-crease, and this increase is not well understood or controlled.This implies that even the TOF gain, which is related to thesignal, the background values and the variance, might not followthe expected behavior.In this paper, using Monte Carlo simulated data, TOF and
non-TOF OSEM reconstructions are compared, with the pur-pose of characterizing the differences of TOF and non-TOF re-construction at variable statistics, and of assessing the advan-tages of TOF at very low counts.
II. METHODS
A. Geant4 Simulation, Data Sets and Reconstruction
AGeant4 simulation was performed assuming a PET scannerarchitecture identical to the Siemens 4-ring mCT PET/CT [13].These same data were used in a previous work to assess imagequality improvement for FBP reconstruction with increasingtime resolution [16]. Data were simulated in list mode, and thenrebinned into TOF sinograms comprising 400 radial bins, 168angular bins and 621 planes, of which 109 were direct planes.An energy resolution of 12% at 511 keV and an energy thresholdof 435 keV were used. A total of detected true coinci-dences were recorded. From the large list mode le, sinogramswith variable statistics were made, in 10 independent realiza-tions for each count statistics, starting from a typical number oftrue counts for an oncology study ( ), down to an ex-tremely low number of counts ( ).The phantom was a 30-cm diameter uniform cylinder that
contained spheres as in the image quality NEMA phantom[22]. A 4:1 contrast over the background was simulated in the4 smallest spheres (10, 13, 17, 22 mm diameter), and the largerspheres (28, 37 mm diameter) were lled with water and noactivity.True coincidences only were selected and reconstructed,
using a 3D Ordinary Poisson Ordered Subsets ExpectationMaximization (OP-OSEM3D) algorithm, both in the TOF andnon-TOF modes. Three subsets were used and 20 iterationswere computed. No randoms were considered, and scattercoincidences were not included. Reconstruction was done in109 transaxial slices of pixels, with a 4 mm pixelsize and 2 mm axial slice thickness. No post-reconstructionsmoothing lter was used. Time resolutions of 200 ps, 300 ps,400 ps, 500 ps, and 600 ps were simulated. Because of com-puter memory size, the TOF bin size was changed with theimproving time resolution. Details on the TOF bin size andeld of view coverage are available in the previous publication
[16]. As a reference, FBP reconstruction was also performed,using Fourier rebinning (FORE) [23] and 2D-FBP, in both TOFand non-TOF versions.
B. De nitions of Noise, SNR and Contrast
For this work, we used the average “image roughness” (IR) inthe background region in the center of the phantom as a measureof the global noise in the image [24]. This can be obtained asthe average of the local standard deviations measured inregions in the background, divided by the region’s mean :
(2)
A 6-cm diameter circular region of interest (ROI) was placedat the center of the cylinder, and the IR was averaged over the21 axially central planes ( ).When the signal-to-noise ratio (SNR) was analyzed in the
four hot spheres, the noise was evaluated locally: six 2-cm diam-eter background ROIs were selected at a radial distance similarto the radial position of the features, and on the same plane. Thesignal-to-noise ratio for each sphere was de ned accounting forthe difference between the measured activity in the spheres andthe background, and compared to the local noise level:
(3)
where is the mean value within a 2D ROI of the same sizeas the nominal diameter of each sphere; is the mean valuewithin the 2-cm diameter 2D ROI placed in the background inposition ; and is the standard deviation within the samebackground ROI .The contrast recovery coef cient (CRC) for each hot sphere
was de ned as the ratio between the mean value in the sphereand the mean value in the background, normalized to the inputcontrast ratio (4:1):
(4)
Since the signal ROI has the same size as the sphere, a partialvolume effect is expected to decrease the contrast recovery, par-ticularly for the smallest spheres, where the size of the spheresis comparable to the image pixel size.A similar de nition was used for the cold spheres:
(5)
C. Evaluation of Performance Parameters
The image quality performance parameters such as contrastrecovery, de ned in eq. (4) and (5), and signal-to-noise ratio,de ned in eq. (3), were studied as a function of the iterationnumber or of the image roughness noise level, de ned in eq.
128 IEEE TRANSACTIONS ON NUCLEAR SCIENCE, VOL. 61, NO. 1, FEBRUARY 2014
(2). CRC and SNR were studied for each sphere and each timeresolution for TOF reconstruction.CRC was studied as a function of the iteration, or the noise
associated with each iteration. The convergence value, de nedas the CRC at the 20th iteration, was studied as a function ofthe square root of the counts in the scan, which is another mea-sure of the data noise level, assuming a Poisson statistics. Tenrealizations of the same count level were used; mean values andstandard deviations were computed for each measured quantity.SNR was studied as a function of the iteration. From the SNR
curves for iterative and FBP reconstruction, a plot was obtainedshowing at which MLEM-equivalent iteration (iterations x sub-sets) the OSEM SNR becomes lower than the FBP SNR.
III. RESULTS
A. Contrast Recovery
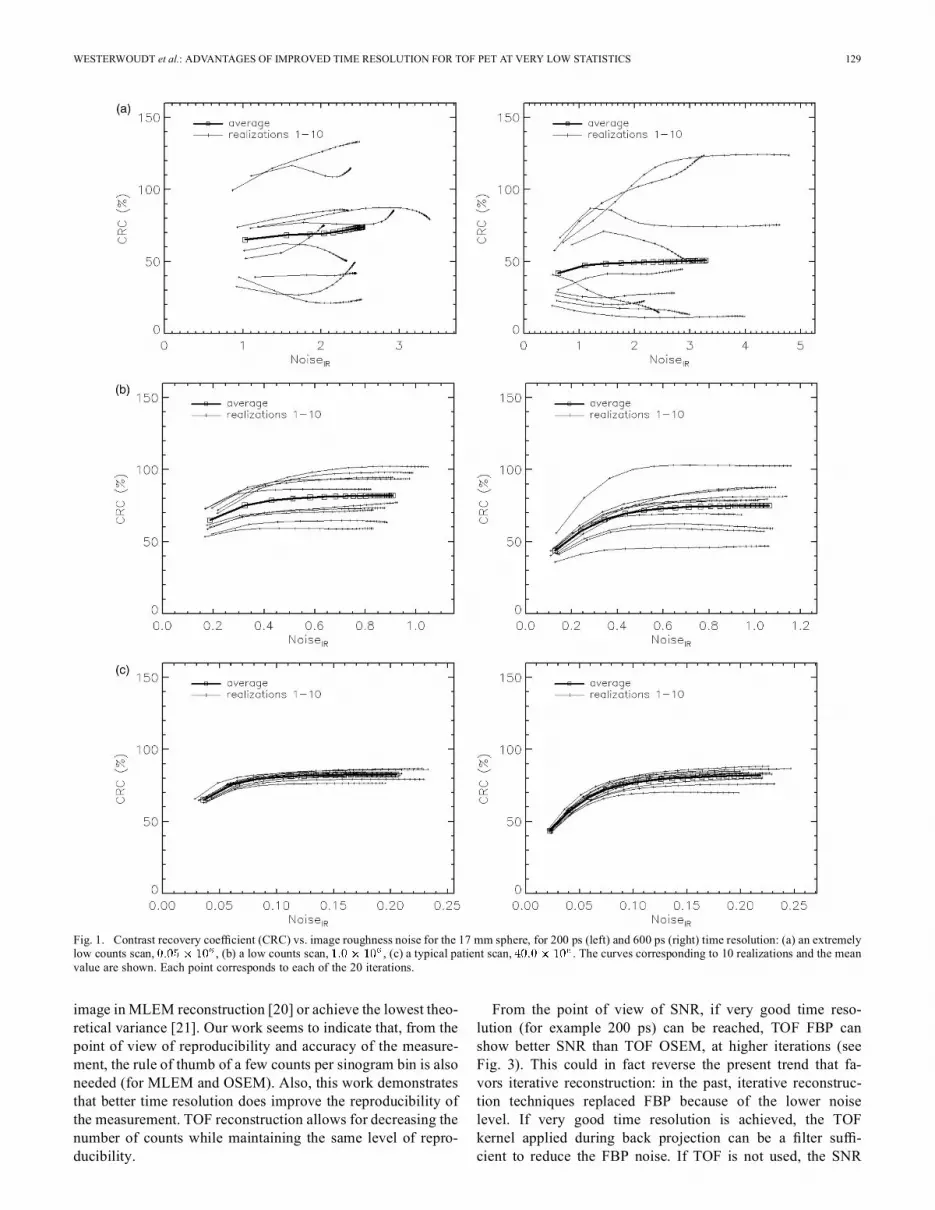
Statistical uctuation affects the contrast recovery, and moreso at very low counts. In Fig. 1, an example of CRC vs. noise foreach of the 10 realizations is shown: an extremely low countsscan ( ), a very low counts scan ( ), and a scanwith typical oncology statistics ( ) are presented, for200 ps and 600 ps time resolution. The curves corresponding to10 realizations and the mean value are shown. Each point cor-responds to each of the 20 iterations. One can observe that if thecount statistics are extremely low, the variations between real-izations are very large and they decrease, as expected, with datasets with more counts. Moreover, the effect of improved timeresolution is also to narrow the spread of the ten realizations, ascan be seen comparing the 200 ps curves (left) and the 600 pscurves (right).A study covering the full range, from to
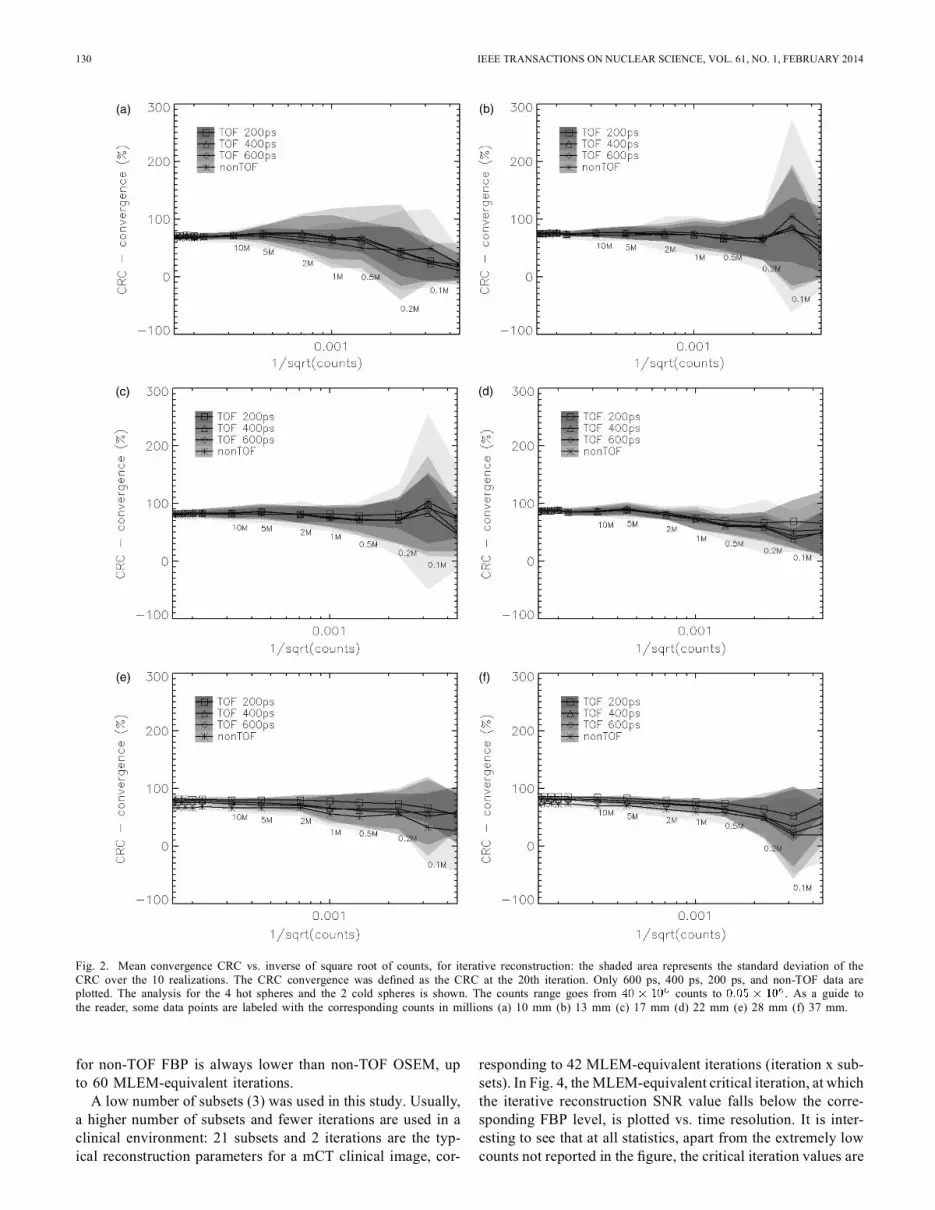
counts, was performed, for all spheres and all time resolutionsconsidered. Results are summarized in Fig. 2. In this gure, themean convergence CRC (CRC at the 20th iteration) is plottedvs. the inverse of the square root of counts. The shaded arearepresents the range included within one standard deviation ofthe CRC over the 10 realizations. Only non-TOF, 600 ps, 400 ps,and 200 ps data are plotted. The analysis for the four hot spheresand the two cold spheres is shown.We do not expect the CRC to always reach 100%, because
of the partial volume effect, due to the choice of ROI size andpixel size. But for larger spheres we can observe that the con-trast recovery, at high statistics, is closer to 100%. The contrastrecovery, particularly for the smallest spheres, decreases at ex-tremely low counts. At that level of low counts, the MLEM pos-itive bias in the background might play a role in the loss of con-trast.Also, as expected, the standard deviation gets smaller for in-
creasing counts, but grows dramatically below countsin the scan. The large standard deviation may affect the relia-bility of contrast or SUV measurements at very low counts, ifonly one measurement is available. It is worth noticing, though,that improving time resolution reduces the standard deviation:improved TOF resolution, therefore, can provide better relia-bility and reproducibility at low statistics.
The positive effect of TOF reconstruction is particularly evi-dent in the cold sphere recovery (Fig. 2e and Fig. 2f). In this case,TOF and non-TOF reconstructions, even at higher count statis-tics, do not converge to the same value even at the 20th iteration.Cold areas are known tobeproblematic forMLEMandOSEMre-construction, but TOF convergesmuch faster towards a very lowresidual in coldregionsandreducesoreliminates thebias.
B. Signal-to-Noise Ratio
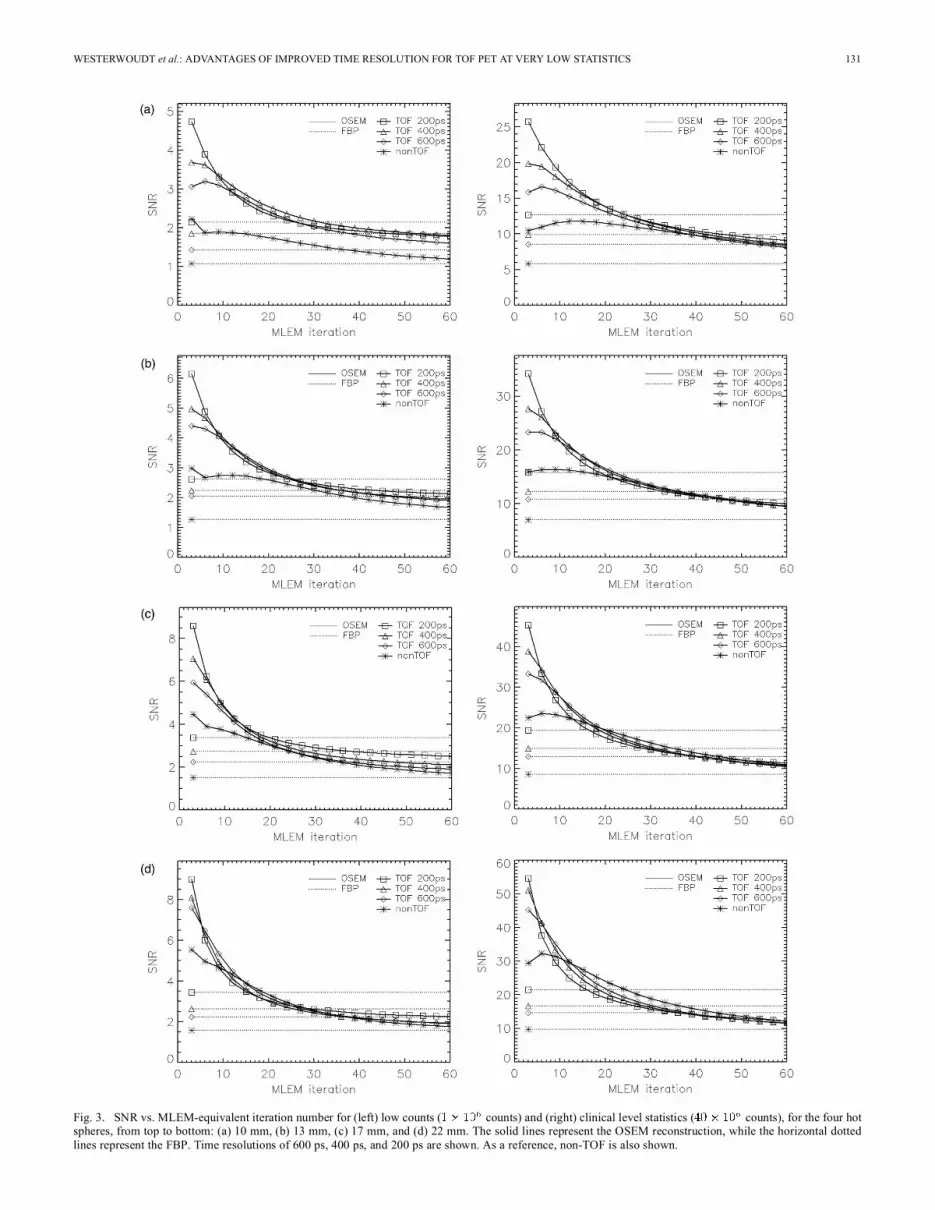
Using eq. (3), we studied SNR for each sphere vs. iterationnumber, for time resolution from 200 ps to 600 ps and statisticsranging from to counts. In Fig. 3, exam-ples of low statistics ( counts) and clinical level statistics( counts) are shown; as a reference, the same time res-olution FBP results are plotted with dotted lines. MLEM-equiv-alent iterations were used in the gure as a more general repre-sentation of the iteration.In general, the time resolution affects the SNR mainly at therst iterations. At low iterations, since the signal value ( ) atthe nominator of eq. (3) is dominated by the convergence rate,the TOF curves clearly separate. At high iterations, the signalvalue is closer to convergence and all curves tend to overlap,and they could be differentiated only based on the different noiselevel at a given iteration. A better time resolution would show alower noise level. In general, a better time resolution is associ-ated with a higher SNR curve. Larger spheres at high statisticsat higher iterations (Fig. 3d, right) show a different behavior:since large features converge faster than small features, and TOFspeeds up the convergence, too many TOF iterations result onlyinto larger noise, lowering the SNR ratio.The fact that the SNR maximum is generally reached at therst iteration should not bring to the conclusion that the rstiteration always produces the “best” image: in fact, more thanone iteration might be necessary to guarantee that an acceptableconvergence level is reached for all lesions of different size andintensity.SNR curves are higher for low noise high statistics data sets,
and within each image, in general, larger spheres exhibit largerSNR. One can observe that, in extremely low statistics data sets,the SNR is very low, reaching values close to 1: this means thatthe smallest hot spheres are practically not detectable.
IV. DISCUSSION
The great variability of the multiple measurements for the ex-tremely low statistics, shown in Fig. 1, demonstrates that thereis a statistical lower limit to the scan time. Below such a limit,the reproducibility of a quantitative measurement is arguable,and so is its reliability. While a similar phenomenon was ob-served in FBP images [16], due to the high variance inherentin low statistics data, the effect seems to be worse in OSEM.This limit appears to be, for OSEM reconstruction, in the rangeof - , as can be seen in Fig. 2. Such a limit probablydepends on sinogram bin size, image pixel size, and phantomsize. For this phantom, it corresponds to a few true counts persinogram bin, after randoms and scatter correction. Other au-thors observed a similar threshold in order to obtain an unbiased
WESTERWOUDT et al.: ADVANTAGES OF IMPROVED TIME RESOLUTION FOR TOF PET AT VERY LOW STATISTICS 129
Fig. 1. Contrast recovery coef cient (CRC) vs. image roughness noise for the 17 mm sphere, for 200 ps (left) and 600 ps (right) time resolution: (a) an extremelylow counts scan, , (b) a low counts scan, , (c) a typical patient scan, . The curves corresponding to 10 realizations and the meanvalue are shown. Each point corresponds to each of the 20 iterations.
image in MLEM reconstruction [20] or achieve the lowest theo-retical variance [21]. Our work seems to indicate that, from thepoint of view of reproducibility and accuracy of the measure-ment, the rule of thumb of a few counts per sinogram bin is alsoneeded (for MLEM and OSEM). Also, this work demonstratesthat better time resolution does improve the reproducibility ofthe measurement. TOF reconstruction allows for decreasing thenumber of counts while maintaining the same level of repro-ducibility.
From the point of view of SNR, if very good time reso-lution (for example 200 ps) can be reached, TOF FBP canshow better SNR than TOF OSEM, at higher iterations (seeFig. 3). This could in fact reverse the present trend that fa-vors iterative reconstruction: in the past, iterative reconstruc-tion techniques replaced FBP because of the lower noiselevel. If very good time resolution is achieved, the TOFkernel applied during back projection can be a lter suf -cient to reduce the FBP noise. If TOF is not used, the SNR
130 IEEE TRANSACTIONS ON NUCLEAR SCIENCE, VOL. 61, NO. 1, FEBRUARY 2014
Fig. 2. Mean convergence CRC vs. inverse of square root of counts, for iterative reconstruction: the shaded area represents the standard deviation of theCRC over the 10 realizations. The CRC convergence was de ned as the CRC at the 20th iteration. Only 600 ps, 400 ps, 200 ps, and non-TOF data areplotted. The analysis for the 4 hot spheres and the 2 cold spheres is shown. The counts range goes from counts to . As a guide tothe reader, some data points are labeled with the corresponding counts in millions (a) 10 mm (b) 13 mm (c) 17 mm (d) 22 mm (e) 28 mm (f) 37 mm.
for non-TOF FBP is always lower than non-TOF OSEM, upto 60 MLEM-equivalent iterations.A low number of subsets (3) was used in this study. Usually,
a higher number of subsets and fewer iterations are used in aclinical environment: 21 subsets and 2 iterations are the typ-ical reconstruction parameters for a mCT clinical image, cor-
responding to 42 MLEM-equivalent iterations (iteration x sub-sets). In Fig. 4, the MLEM-equivalent critical iteration, at whichthe iterative reconstruction SNR value falls below the corre-sponding FBP level, is plotted vs. time resolution. It is inter-esting to see that at all statistics, apart from the extremely lowcounts not reported in the gure, the critical iteration values are
WESTERWOUDT et al.: ADVANTAGES OF IMPROVED TIME RESOLUTION FOR TOF PET AT VERY LOW STATISTICS 131
Fig. 3. SNR vs. MLEM-equivalent iteration number for (left) low counts ( counts) and (right) clinical level statistics ( counts), for the four hotspheres, from top to bottom: (a) 10 mm, (b) 13 mm, (c) 17 mm, and (d) 22 mm. The solid lines represent the OSEM reconstruction, while the horizontal dottedlines represent the FBP. Time resolutions of 600 ps, 400 ps, and 200 ps are shown. As a reference, non-TOF is also shown.
132 IEEE TRANSACTIONS ON NUCLEAR SCIENCE, VOL. 61, NO. 1, FEBRUARY 2014
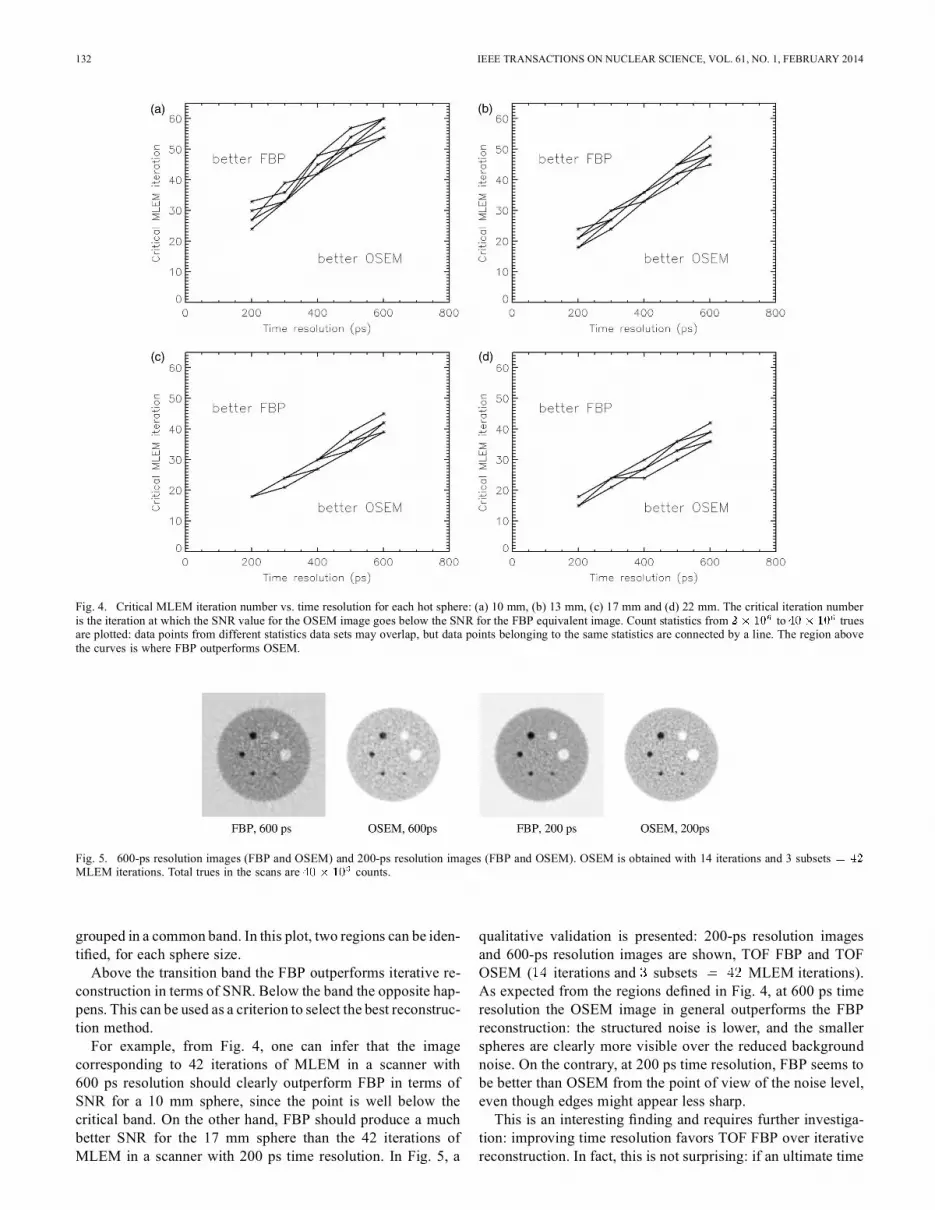
Fig. 4. Critical MLEM iteration number vs. time resolution for each hot sphere: (a) 10 mm, (b) 13 mm, (c) 17 mm and (d) 22 mm. The critical iteration numberis the iteration at which the SNR value for the OSEM image goes below the SNR for the FBP equivalent image. Count statistics from to truesare plotted: data points from different statistics data sets may overlap, but data points belonging to the same statistics are connected by a line. The region abovethe curves is where FBP outperforms OSEM.
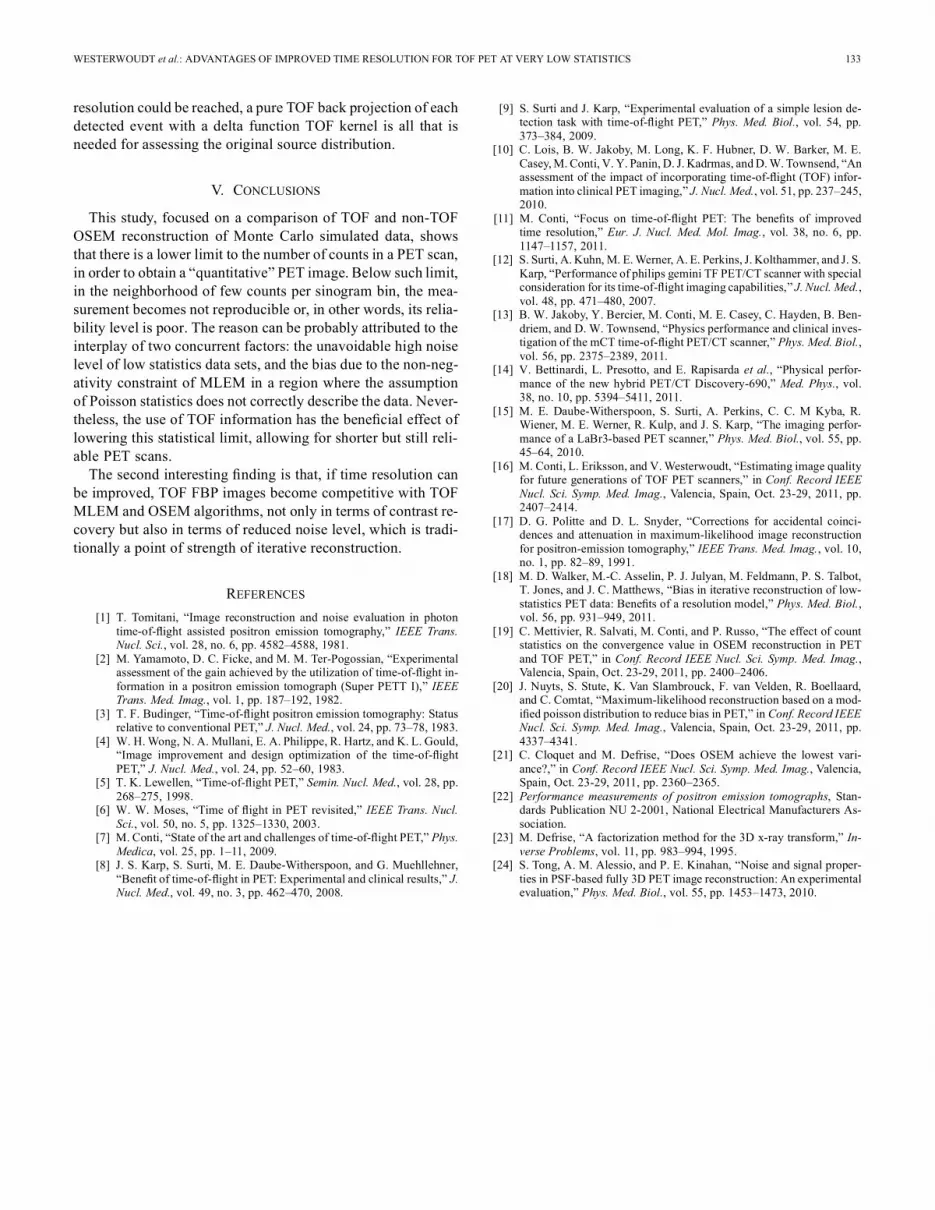
Fig. 5. 600-ps resolution images (FBP and OSEM) and 200-ps resolution images (FBP and OSEM). OSEM is obtained with 14 iterations and 3 subsetsMLEM iterations. Total trues in the scans are counts.
grouped in a common band. In this plot, two regions can be iden-ti ed, for each sphere size.Above the transition band the FBP outperforms iterative re-
construction in terms of SNR. Below the band the opposite hap-pens. This can be used as a criterion to select the best reconstruc-tion method.For example, from Fig. 4, one can infer that the image
corresponding to 42 iterations of MLEM in a scanner with600 ps resolution should clearly outperform FBP in terms ofSNR for a 10 mm sphere, since the point is well below thecritical band. On the other hand, FBP should produce a muchbetter SNR for the 17 mm sphere than the 42 iterations ofMLEM in a scanner with 200 ps time resolution. In Fig. 5, a
qualitative validation is presented: 200-ps resolution imagesand 600-ps resolution images are shown, TOF FBP and TOFOSEM ( iterations and subsets MLEM iterations).As expected from the regions de ned in Fig. 4, at 600 ps timeresolution the OSEM image in general outperforms the FBPreconstruction: the structured noise is lower, and the smallerspheres are clearly more visible over the reduced backgroundnoise. On the contrary, at 200 ps time resolution, FBP seems tobe better than OSEM from the point of view of the noise level,even though edges might appear less sharp.This is an interesting nding and requires further investiga-
tion: improving time resolution favors TOF FBP over iterativereconstruction. In fact, this is not surprising: if an ultimate time
WESTERWOUDT et al.: ADVANTAGES OF IMPROVED TIME RESOLUTION FOR TOF PET AT VERY LOW STATISTICS 133
resolution could be reached, a pure TOF back projection of eachdetected event with a delta function TOF kernel is all that isneeded for assessing the original source distribution.
V. CONCLUSIONS
This study, focused on a comparison of TOF and non-TOFOSEM reconstruction of Monte Carlo simulated data, showsthat there is a lower limit to the number of counts in a PET scan,in order to obtain a “quantitative” PET image. Below such limit,in the neighborhood of few counts per sinogram bin, the mea-surement becomes not reproducible or, in other words, its relia-bility level is poor. The reason can be probably attributed to theinterplay of two concurrent factors: the unavoidable high noiselevel of low statistics data sets, and the bias due to the non-neg-ativity constraint of MLEM in a region where the assumptionof Poisson statistics does not correctly describe the data. Never-theless, the use of TOF information has the bene cial effect oflowering this statistical limit, allowing for shorter but still reli-able PET scans.The second interesting nding is that, if time resolution can
be improved, TOF FBP images become competitive with TOFMLEM and OSEM algorithms, not only in terms of contrast re-covery but also in terms of reduced noise level, which is tradi-tionally a point of strength of iterative reconstruction.
REFERENCES[1] T. Tomitani, “Image reconstruction and noise evaluation in photon
time-of- ight assisted positron emission tomography,” IEEE Trans.Nucl. Sci., vol. 28, no. 6, pp. 4582–4588, 1981.
[2] M. Yamamoto, D. C. Ficke, and M. M. Ter-Pogossian, “Experimentalassessment of the gain achieved by the utilization of time-of- ight in-formation in a positron emission tomograph (Super PETT I),” IEEETrans. Med. Imag., vol. 1, pp. 187–192, 1982.
[3] T. F. Budinger, “Time-of- ight positron emission tomography: Statusrelative to conventional PET,” J. Nucl. Med., vol. 24, pp. 73–78, 1983.
[4] W. H.Wong, N. A. Mullani, E. A. Philippe, R. Hartz, and K. L. Gould,“Image improvement and design optimization of the time-of- ightPET,” J. Nucl. Med., vol. 24, pp. 52–60, 1983.
[5] T. K. Lewellen, “Time-of- ight PET,” Semin. Nucl. Med., vol. 28, pp.268–275, 1998.
[6] W. W. Moses, “Time of ight in PET revisited,” IEEE Trans. Nucl.Sci., vol. 50, no. 5, pp. 1325–1330, 2003.
[7] M. Conti, “State of the art and challenges of time-of- ight PET,” Phys.Medica, vol. 25, pp. 1–11, 2009.
[8] J. S. Karp, S. Surti, M. E. Daube-Witherspoon, and G. Muehllehner,“Bene t of time-of- ight in PET: Experimental and clinical results,” J.Nucl. Med., vol. 49, no. 3, pp. 462–470, 2008.
[9] S. Surti and J. Karp, “Experimental evaluation of a simple lesion de-tection task with time-of- ight PET,” Phys. Med. Biol., vol. 54, pp.373–384, 2009.
[10] C. Lois, B. W. Jakoby, M. Long, K. F. Hubner, D. W. Barker, M. E.Casey,M. Conti, V. Y. Panin, D. J. Kadrmas, andD.W. Townsend, “Anassessment of the impact of incorporating time-of- ight (TOF) infor-mation into clinical PET imaging,” J. Nucl. Med., vol. 51, pp. 237–245,2010.
[11] M. Conti, “Focus on time-of- ight PET: The bene ts of improvedtime resolution,” Eur. J. Nucl. Med. Mol. Imag., vol. 38, no. 6, pp.1147–1157, 2011.
[12] S. Surti, A. Kuhn, M. E.Werner, A. E. Perkins, J. Kolthammer, and J. S.Karp, “Performance of philips gemini TF PET/CT scanner with specialconsideration for its time-of- ight imaging capabilities,” J. Nucl. Med.,vol. 48, pp. 471–480, 2007.
[13] B. W. Jakoby, Y. Bercier, M. Conti, M. E. Casey, C. Hayden, B. Ben-driem, and D. W. Townsend, “Physics performance and clinical inves-tigation of the mCT time-of- ight PET/CT scanner,” Phys. Med. Biol.,vol. 56, pp. 2375–2389, 2011.
[14] V. Bettinardi, L. Presotto, and E. Rapisarda et al., “Physical perfor-mance of the new hybrid PET/CT Discovery-690,” Med. Phys., vol.38, no. 10, pp. 5394–5411, 2011.
[15] M. E. Daube-Witherspoon, S. Surti, A. Perkins, C. C. M Kyba, R.Wiener, M. E. Werner, R. Kulp, and J. S. Karp, “The imaging perfor-mance of a LaBr3-based PET scanner,” Phys. Med. Biol., vol. 55, pp.45–64, 2010.
[16] M. Conti, L. Eriksson, and V.Westerwoudt, “Estimating image qualityfor future generations of TOF PET scanners,” in Conf. Record IEEENucl. Sci. Symp. Med. Imag., Valencia, Spain, Oct. 23-29, 2011, pp.2407–2414.
[17] D. G. Politte and D. L. Snyder, “Corrections for accidental coinci-dences and attenuation in maximum-likelihood image reconstructionfor positron-emission tomography,” IEEE Trans. Med. Imag., vol. 10,no. 1, pp. 82–89, 1991.
[18] M. D. Walker, M.-C. Asselin, P. J. Julyan, M. Feldmann, P. S. Talbot,T. Jones, and J. C. Matthews, “Bias in iterative reconstruction of low-statistics PET data: Bene ts of a resolution model,” Phys. Med. Biol.,vol. 56, pp. 931–949, 2011.
[19] C. Mettivier, R. Salvati, M. Conti, and P. Russo, “The effect of countstatistics on the convergence value in OSEM reconstruction in PETand TOF PET,” in Conf. Record IEEE Nucl. Sci. Symp. Med. Imag.,Valencia, Spain, Oct. 23-29, 2011, pp. 2400–2406.
[20] J. Nuyts, S. Stute, K. Van Slambrouck, F. van Velden, R. Boellaard,and C. Comtat, “Maximum-likelihood reconstruction based on a mod-i ed poisson distribution to reduce bias in PET,” in Conf. Record IEEENucl. Sci. Symp. Med. Imag., Valencia, Spain, Oct. 23-29, 2011, pp.4337–4341.
[21] C. Cloquet and M. Defrise, “Does OSEM achieve the lowest vari-ance?,” in Conf. Record IEEE Nucl. Sci. Symp. Med. Imag., Valencia,Spain, Oct. 23-29, 2011, pp. 2360–2365.
[22] Performance measurements of positron emission tomographs, Stan-dards Publication NU 2-2001, National Electrical Manufacturers As-sociation.
[23] M. Defrise, “A factorization method for the 3D x-ray transform,” In-verse Problems, vol. 11, pp. 983–994, 1995.
[24] S. Tong, A. M. Alessio, and P. E. Kinahan, “Noise and signal proper-ties in PSF-based fully 3D PET image reconstruction: An experimentalevaluation,” Phys. Med. Biol., vol. 55, pp. 1453–1473, 2010.