assessing the advantages and disadvantages of entrusting
TRANSCRIPT
Written by Charu Wilkinson, Juliette Mathis
(ICF), Peter Meijer, Geoff Smailes (Keypoint Financial)
December 2019
Assessing the advantages and disadvantages of
entrusting the financial management of the assets of
the Common Provisioning Fund to the Commission, the EIB, or a combination of the
two Final Report

EUROPEAN COMMISSION
Directorate-General for Economic and Financial Affairs
Directorate L — Treasury and financial operations
Unit L.2 — Treasury and Asset Management
Contact: Ludmila Nola
E-mail: [email protected]
European Commission
EUROPEAN COMMISSION
Directorate-General for Economic and Financial Affairs
December, 2019
Assessing the advantages
and disadvantages of entrusting the financial
management of the assets of
the Common Provisioning Fund to the Commission, the EIB, or a combination of the
two Final report

Assessing the advantages and disadvantages of entrusting the financial management
of the assets of the Common Provisioning Fund to the Commission, the EIB, or a
combination of the two
Europe Direct is a service to help you find answers to your questions about the European Union.
Freephone number (*):
00 800 6 7 8 9 10 11
(*) The information given is free, as are most calls (though some operators, phone boxes or hotels may charge you).
LEGAL NOTICE
This document has been prepared for the European Commission however it reflects the views only of the authors, and the Commission cannot be held responsible for any use which may be made of the information contained therein.
More information on the European Union is available on the Internet (http://www.europa.eu).
Luxembourg: Publications Office of the European Union, 2020
PDF ISBN 978-92-76-17579-7 doi: 10.2765/21274 KC-02-20-212-EN-N
© European Union, 2020
Reproduction is authorised provided the source is acknowledged.
Assessing the advantages and disadvantages of entrusting the financial management
of the assets of the Common Provisioning Fund to the Commission, the EIB, or a
combination of the two
December, 2019
Table of Contents
Abbreviations .................................................................................................... 1 1 Introduction ................................................................................................ 3
1.1 Study context and objectives .................................................................. 3 1.2 Structure of this report ........................................................................... 3
2 Background to the study ............................................................................... 4
2.1 Treasury/ asset management within the Commission ................................. 4 2.2 Treasury/ asset management within the EIB ............................................. 4 2.3 Division of asset management between the Commission and the EIB: a
historical perspective ....................................................................................... 5 2.4 Future direction: creation of a Common Provisioning Fund .......................... 7
3 Approach and methodology ..........................................................................14
3.1 Overall study approach ..........................................................................14 3.2 Caveats and limitations .........................................................................16
4 Assessment against the criteria ....................................................................18
4.1 Institutional set-up and governance ........................................................18 4.2 Accountability and transparency .............................................................35 4.3 Risk Management .................................................................................42 4.4 Reporting and information management ..................................................46 4.5 Technical infrastructure .........................................................................48 4.6 Expertise .............................................................................................52 4.7 Scalability ............................................................................................54 4.8 Performance ........................................................................................57 4.9 Costs ..................................................................................................62 4.10 Synergies ........................................................................................67
5 Description and analysis of options and scenarios ...........................................70
5.1 Description of the options and scenarios ..................................................70 5.2 Analysis of the options and scenarios ......................................................72
Annex 1 Interviews and meetings undertaken ...................................................78 Annex 2 Mapping of the portfolios managed by the EC and portfolios outsourced to
the EIB 78 Annex 3 List of assembled documentation ........................................................78 Annex 4 Reporting .........................................................................................79 Annex 5 Expertise .........................................................................................83 Annex 6 Performance .....................................................................................84
A6.1 Performance Investment guidelines .....................................................84 A6.2 Portfolio composition .........................................................................89 A6.3 Portfolio grouping .............................................................................90 A6.4 Analysis of results for Group 3 ............................................................92 A6.5 Analysis of each separate fund’s performance data................................93
Assessing the advantages and disadvantages of entrusting the financial management
of the assets of the Common Provisioning Fund to the Commission, the EIB, or a
combination of the two
December, 2019 1
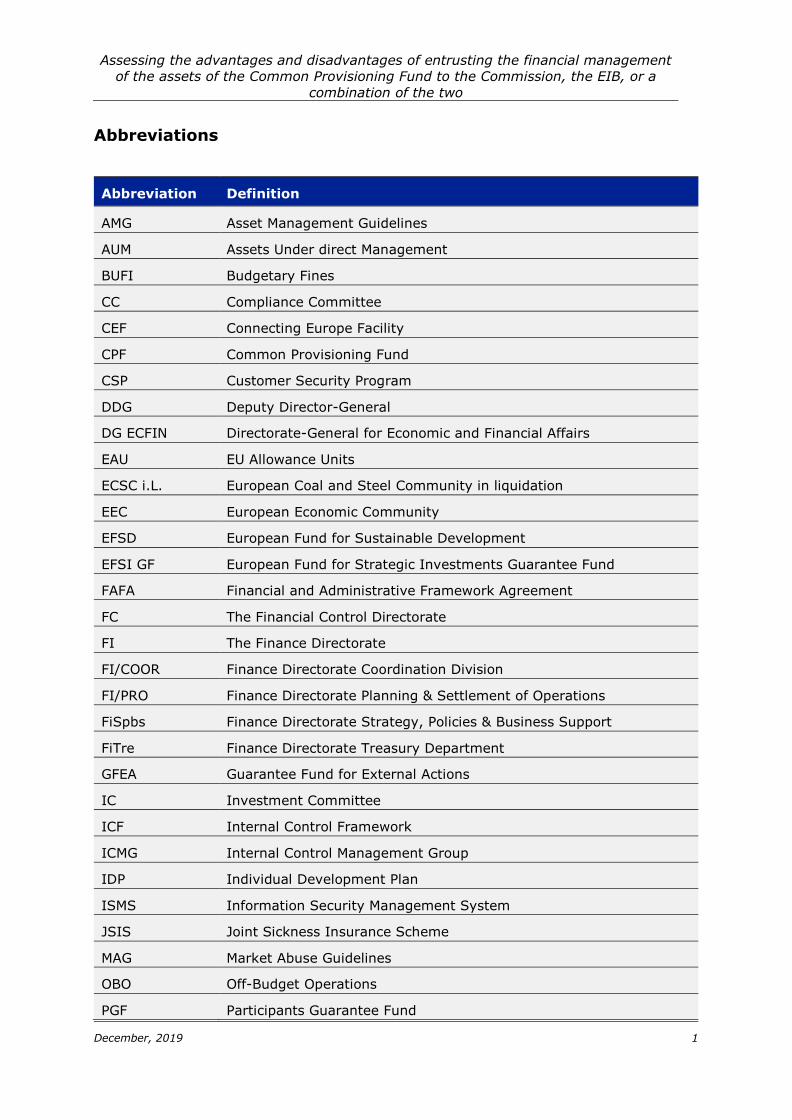
Abbreviations
Abbreviation Definition
AMG Asset Management Guidelines
AUM Assets Under direct Management
BUFI Budgetary Fines
CC Compliance Committee
CEF Connecting Europe Facility
CPF Common Provisioning Fund
CSP Customer Security Program
DDG Deputy Director-General
DG ECFIN Directorate-General for Economic and Financial Affairs
EAU EU Allowance Units
ECSC i.L. European Coal and Steel Community in liquidation
EEC European Economic Community
EFSD European Fund for Sustainable Development
EFSI GF European Fund for Strategic Investments Guarantee Fund
FAFA Financial and Administrative Framework Agreement
FC The Financial Control Directorate
FI The Finance Directorate
FI/COOR Finance Directorate Coordination Division
FI/PRO Finance Directorate Planning & Settlement of Operations
FiSpbs Finance Directorate Strategy, Policies & Business Support
FiTre Finance Directorate Treasury Department
GFEA Guarantee Fund for External Actions
IC Investment Committee
ICF Internal Control Framework
ICMG Internal Control Management Group
IDP Individual Development Plan
ISMS Information Security Management System
JSIS Joint Sickness Insurance Scheme
MAG Market Abuse Guidelines
OBO Off-Budget Operations
PGF Participants Guarantee Fund
Assessing the advantages and disadvantages of entrusting the financial management
of the assets of the Common Provisioning Fund to the Commission, the EIB, or a
combination of the two
December, 2019 2
RC Risk Management Committee
RCM Risk Control Matrix
RSFF Risk Sharing Finance Facility
RSI Risk Sharing Instrument
RTO Recovery Time Objective
TMB Treasury Management Board
TPAMC Third-Party Asset Management Committee
Assessing the advantages and disadvantages of entrusting the financial management
of the assets of the Common Provisioning Fund to the Commission, the EIB, or a
combination of the two
December, 2019 3
1 Introduction
This report documents the findings and results of an independent comparative
assessment of the advantages and disadvantages of entrusting the financial management
of the assets of the Common Provisioning Fund (CPF) to the Commission, the EIB, or a
combination of the two. The assessment was carried out by ICF in association with
Keypoint Financial who were appointed as by the Directorate-General for Economic and
Financial Affairs (DG ECFIN), under Framework Service Contract ECFIN-001-2017.
1.1 Study context and objectives
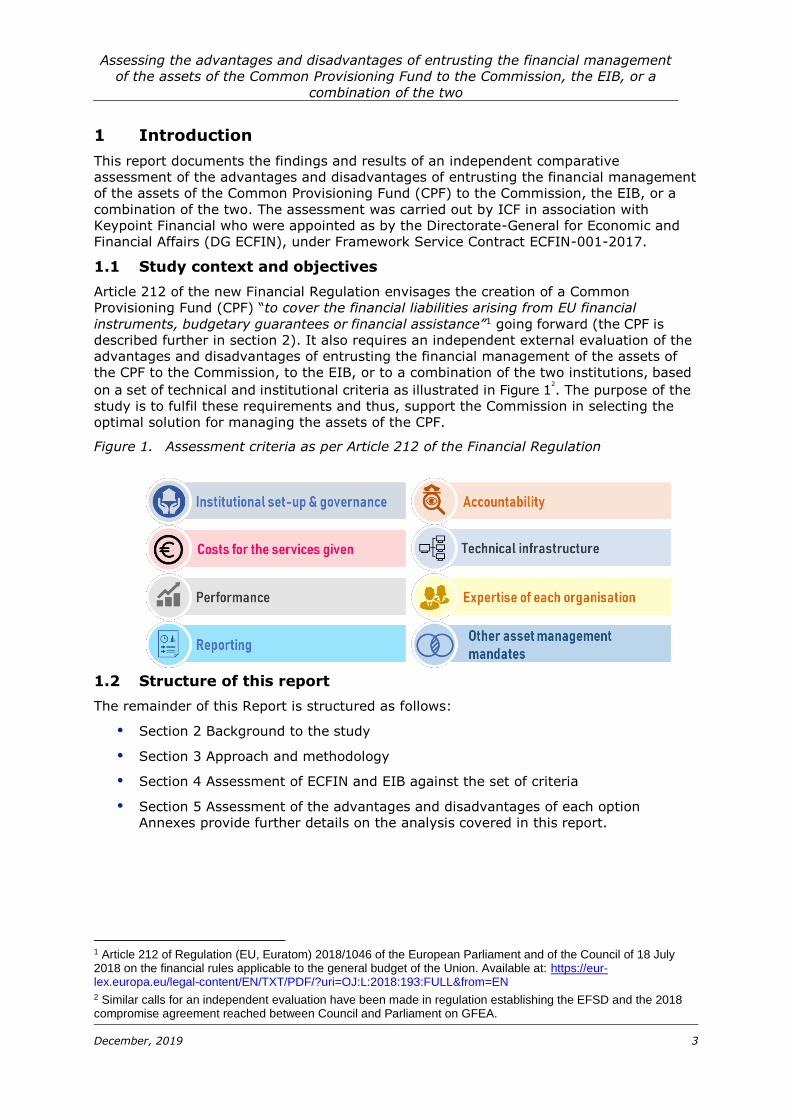
Article 212 of the new Financial Regulation envisages the creation of a Common
Provisioning Fund (CPF) “to cover the financial liabilities arising from EU financial
instruments, budgetary guarantees or financial assistance”1 going forward (the CPF is
described further in section 2). It also requires an independent external evaluation of the
advantages and disadvantages of entrusting the financial management of the assets of
the CPF to the Commission, to the EIB, or to a combination of the two institutions, based
on a set of technical and institutional criteria as illustrated in Figure 12
. The purpose of the
study is to fulfil these requirements and thus, support the Commission in selecting the
optimal solution for managing the assets of the CPF.
Figure 1. Assessment criteria as per Article 212 of the Financial Regulation
1.2 Structure of this report
The remainder of this Report is structured as follows:
Section 2 Background to the study
Section 3 Approach and methodology
Section 4 Assessment of ECFIN and EIB against the set of criteria
Section 5 Assessment of the advantages and disadvantages of each option
Annexes provide further details on the analysis covered in this report.
1 Article 212 of Regulation (EU, Euratom) 2018/1046 of the European Parliament and of the Council of 18 July 2018 on the financial rules applicable to the general budget of the Union. Available at: https://eur- lex.europa.eu/legal-content/EN/TXT/PDF/?uri=OJ:L:2018:193:FULL&from=EN 2 Similar calls for an independent evaluation have been made in regulation establishing the EFSD and the 2018 compromise agreement reached between Council and Parliament on GFEA.
Assessing the advantages and disadvantages of entrusting the financial management
of the assets of the Common Provisioning Fund to the Commission, the EIB, or a
combination of the two
December, 2019 4
2 Background to the study
This section provides an overview of the asset management activities of the Commission
(particularly DG ECFIN) and those of the EIB, by way of background and wider context for
the information and analysis presented in subsequent sections of the report. It also
details the options and scenarios relating to the size and scope of the CPF based on
information currently available.
2.1 Treasury/ asset management within the Commission
DG BUDG is responsible for the execution as well as treasury management of the entire
budget managed by the Commission and the European Development Fund. In this
context, the Commission has been entrusted with an annual budget (payments
appropriations) of more than EUR 140 billion and a balance sheet of a similar order (EUR
166 billion). DG BUDG’s responsibilities involve management of short-term liquidities (<
12 months). What DG BUDG does is however, closer to treasury management than asset
management3.
The classical asset management activity is performed by DG ECFIN within the
Commission. This typically involves management of funds available for longer horizons
which are invested across the maturity spectrum and thus, have longer average
maturities. The assets managed by DG ECFIN comprise certain off-budget activities4 of
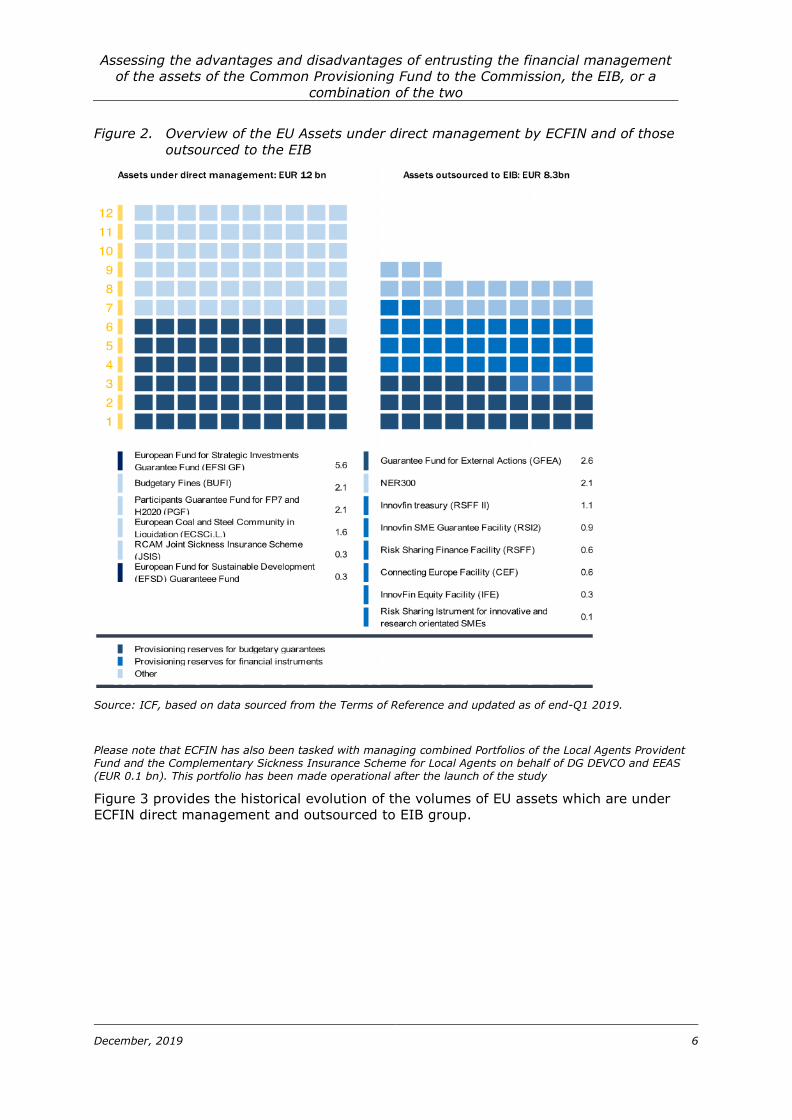
the Commission. In this respect, DG ECFIN manages six different portfolios amounting to
EUR 12 billion (Figure 2). In addition to the portfolios that are managed directly by
ECFIN, it also has the role of overseeing the portfolios ‘outsourced’ to the EIB, as the
Commission retains the ultimate responsibility for the execution of the EU budget5. More
specifically, in its current role as the Asset Management Designated Service (AMDS) for
other Commission DGs, ECFIN carries out the following functions:
Designing the Asset Management Guidelines (AMGs) for each portfolio;
Leading the negotiation of FAFA;
Acting as an interface between parent DGs and the EIB;
Providing advisory services to parent DGs on asset management;
Approving investment strategies for the outsourced portfolios;
Monitoring the portfolios;
Risk control;
Preparing consolidated accounts.
2.2 Treasury/ asset management within the EIB
EIB, on its side, undertakes treasury/ asset management activities mainly for its own
account, to support the Bank’s core financing activity6. EIB treasury activities are thus
3 The difference between Treasury management and Asset Management is mainly the nature of it: Treasury management focuses on short-term management of liquidity and day-to-day financial activities, asset management focuses on obtaining longer term performance on a portfolio of assets, subject to certain pre-stated criteria. 4 Off-budget activities are not explicitly covered by the Financial Regulation and do not fall under the responsibility of the Commission Accounting Officer, save for the need to include them in the Commission financial statements 5 The Commission may entrust implementation tasks of the budget of the Union to entrusted entities and specifically the EIB pursuant to Article 58(1)(c)(iii) of the Financial Regulation. However, in accordance with Article 317 of the Treaty, it remains responsible for the implementation of the budget of the Union. 6 A. 21 (ex A. 23) of EIB statutes
Assessing the advantages and disadvantages of entrusting the financial management
of the assets of the Common Provisioning Fund to the Commission, the EIB, or a
combination of the two
December, 2019 5
conducted with the primary objective of ensuring that the Bank can meet its payment
obligations on time and in full, and protecting the capital invested. Altogether, the total
volume of assets that EIB managed for its own account as of year-end 2018 was EUR
80.6 bn7. 91% of that amount are held in the Treasury Monetary Portfolio, designed for
daily liquidity management. EUR 7.2 bn (or 9%) have relatively longer horizons (>12m)
and are comparable with those managed by DG ECFIN.
EIB is also managing assets on behalf of third parties, essentially the European
Commission. Presently, the EIB is managing eight different portfolios with a total value of
EUR 8.3 billion on behalf of the Commission (Figure 2), out of a total value of EUR 8.9
billion for external mandates. The remaining EUR 0.6 billion is made of mandates
managed on behalf of EU Member States (IF-Cotonou) and their regional or municipal
authorities (SME-Spain).
2.3 Division of asset management between the Commission and the EIB: a historical perspective
Asset management responsibilities of the Commission date back to the 1950s. At the
time, there were already some asset management activities associated with the receipts
from the borrowing and lending activities of the Community, and the taxes paid by the
steel & coal industry. The asset management activity of ECFIN was however, limited in
the beginning but grew in the 1980s and 1990s primarily due to ECSC assets.
The EIB and the EC started working together on asset management in the 1990s. In
1994, the Guarantee Fund for External Actions (GFEA) was set up and the related AM
activities were outsourced to the EIB following guidance received from the Council.
In recent years, various asset management mandates (mainly for financial instruments
managed by the EIB Group such as InnovFin) have been given to the EIB as part of the
whole package.
In 2009/10, DG ECFIN was assigned a new mandate by the Commission (competition
fines). Three options for asset management were studied (in-house, outsourced to EIB or
outsourced to another public or private asset manager) before allocating the task directly
to ECFIN.
From then onwards, ECFIN’s asset management capabilities have increased significantly.
In 2014, the asset management of the Participants Guarantee Fund (PGF) was moved
from the EIB to ECFIN as the EIB was not involved in the implementation of the actions
covered by the Fund. In 2015, ECFIN was assigned asset management responsibilities for
EFSI Guarantee Fund, the largest single mandate.
The figure below provides an overview of the current allocation of EU assets between
ECFIN and the EIB.
7 EIB Financial Report 2018, available at: https://www.eib.org/attachments/general/reports/eib_financial_report_2018_en.pdf
Assessing the advantages and disadvantages of entrusting the financial management
of the assets of the Common Provisioning Fund to the Commission, the EIB, or a
combination of the two
December, 2019 6
Figure 2. Overview of the EU Assets under direct management by ECFIN and of those
outsourced to the EIB
Source: ICF, based on data sourced from the Terms of Reference and updated as of end-Q1 2019.
Please note that ECFIN has also been tasked with managing combined Portfolios of the Local Agents Provident Fund and the Complementary Sickness Insurance Scheme for Local Agents on behalf of DG DEVCO and EEAS (EUR 0.1 bn). This portfolio has been made operational after the launch of the study
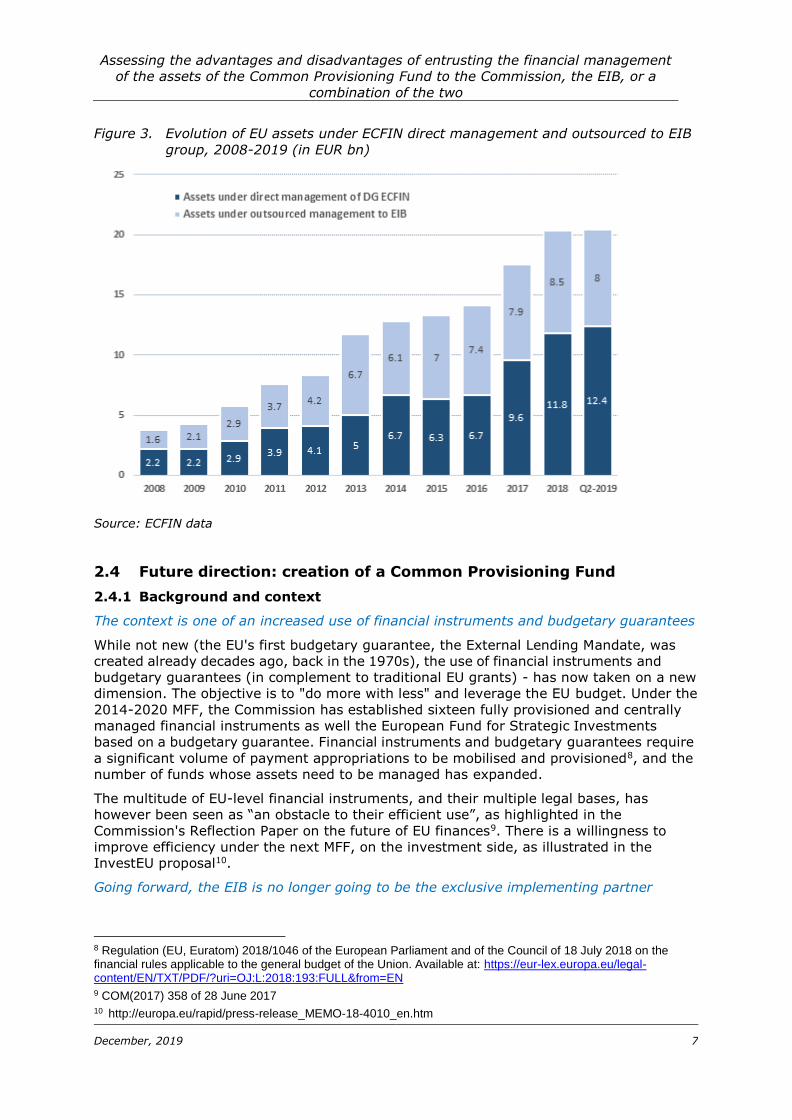
Figure 3 provides the historical evolution of the volumes of EU assets which are under
ECFIN direct management and outsourced to EIB group.
Assessing the advantages and disadvantages of entrusting the financial management
of the assets of the Common Provisioning Fund to the Commission, the EIB, or a
combination of the two
December, 2019 7
Figure 3. Evolution of EU assets under ECFIN direct management and outsourced to EIB
group, 2008-2019 (in EUR bn)
Source: ECFIN data
2.4 Future direction: creation of a Common Provisioning Fund
2.4.1 Background and context
The context is one of an increased use of financial instruments and budgetary guarantees
While not new (the EU's first budgetary guarantee, the External Lending Mandate, was
created already decades ago, back in the 1970s), the use of financial instruments and
budgetary guarantees (in complement to traditional EU grants) - has now taken on a new
dimension. The objective is to "do more with less" and leverage the EU budget. Under the
2014-2020 MFF, the Commission has established sixteen fully provisioned and centrally
managed financial instruments as well the European Fund for Strategic Investments
based on a budgetary guarantee. Financial instruments and budgetary guarantees require
a significant volume of payment appropriations to be mobilised and provisioned8, and the
number of funds whose assets need to be managed has expanded.
The multitude of EU-level financial instruments, and their multiple legal bases, has
however been seen as “an obstacle to their efficient use”, as highlighted in the
Commission's Reflection Paper on the future of EU finances9. There is a willingness to
improve efficiency under the next MFF, on the investment side, as illustrated in the
InvestEU proposal10.
Going forward, the EIB is no longer going to be the exclusive implementing partner
8 Regulation (EU, Euratom) 2018/1046 of the European Parliament and of the Council of 18 July 2018 on the financial rules applicable to the general budget of the Union. Available at: https://eur-lex.europa.eu/legal- content/EN/TXT/PDF/?uri=OJ:L:2018:193:FULL&from=EN 9 COM(2017) 358 of 28 June 2017 10 http://europa.eu/rapid/press-release_MEMO-18-4010_en.htm
Assessing the advantages and disadvantages of entrusting the financial management
of the assets of the Common Provisioning Fund to the Commission, the EIB, or a
combination of the two
December, 2019 8
Up until now, as far as internal policy was concerned, the Commission has always
implemented its financial instruments via indirect management and always entrusted the
EIB group, either the EIB or the EIF, despite the fact that it could possibly have entrusted
other entities11.
Going forward, the EIB will remain the main partner but in addition, other implementing
partners will have direct access to the EU guarantee, following the external policy
model12. Other implementing partners would include:
National Promotional Banks and Institutions;
Other IFIs (EBRD, COE Bank, World Bank Group)
Other entities fulfilling the criteria laid down in the Financial Regulation (Art. 62.1).
EIB’s share will vary between 50% in the field of external policy13 and 75% in the field of
internal policy14.
There is a willingness to improve efficiency under the next MFF also on the asset
management side
The new Financial regulation therefore envisages a Common Provisioning Fund, specifying
that the provisions made to cover the financial liabilities arising from financial
instruments, budgetary guarantees or financial assistance shall be held in a common
provisioning fund.15 The basic idea behind the CPF is to increase efficiency: by pooling
provisions into a common fund, and for a given level of protection / provisioning, it
reduces the amount of resources used and increases flexibility (as compared to a
situation where the resources would be held separately).
The future CPF focuses on pooling the resources set aside for the financial tools which
aim to support investment and to achieve EU policy objectives (e.g. EFSI GF, EFSD,
GFEA), but the detail around the new CPF is yet to be fully fleshed out as further
explained under section 2.4.2.
11 See points (ii), (iii), (v) and (vi) of Article 58(1)(c) of the Financial Regulation 12 in the field of external policy, implementation tasks have already been entrusted by the Commission to International Finance Institutions (IFIs) and development banks within the framework of blending facilities. 13 European Commission, Proposal for a regulation of the European Parliament and of the Council establishing the
Neighbourhood, Development and International Cooperation Instrument, COM/2018/460 final 14 European Commission, Proposal for a regulation of the European Parliament and of the Council establishing the InvestEU Programme, COM(208) 439 final. Please note a partial provisional agreement on the proposal was reached between the co-legislators in early 2019. See also: http://www.europarl.europa.eu/legislative- train/theme-new-boost-for-jobs-growth-and-investment/file-mff-investeu 15 Article 212 of Regulation (EU, Euratom) 2018/1046 of the European Parliament and of the Council of 18 July 2018 on the financial rules applicable to the general budget of the Union. Available at: https://eur- lex.europa.eu/legal-content/EN/TXT/PDF/?uri=OJ:L:2018:193:FULL&from=EN
Assessing the advantages and disadvantages of entrusting the financial management
of the assets of the Common Provisioning Fund to the Commission, the EIB, or a
combination of the two
December, 2019 9
Box: The Financial Regulation
2.4.2 Size and scope of the CPF
The final design of the CPF has not yet been decided upon. The following parameters are
however, currently under discussion:
The future CPF focuses on pooling the resources set aside for the budgetary
guarantees which aim to support investment and to achieve EU policy objectives.
Thus, the CPF is expected to include (a) the assets of the EFSI guarantee fund; (b)
the provisioning for the new InvestEU Guarantee fund and (c) the provisioning for
the different third country lending mandates (post 2020 these will be grouped
under the NDICI heading).
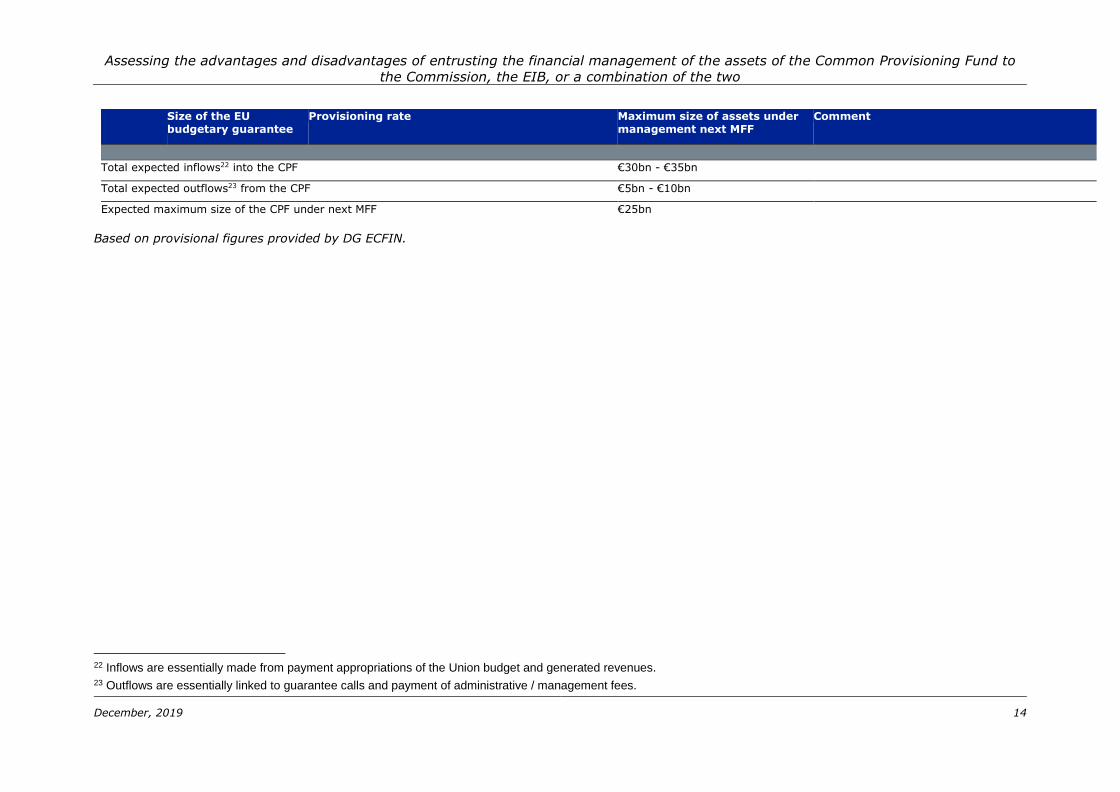
The maximum size of the CPF is estimated to be around €25 bn, given expected
calls. This estimate is based on the numbers currently included in the legislative
proposals of the respective instruments, as further specified in the table below.
No formal decisions have been taken yet as regards the type of assets in which the
CPF will invest. The study team has however, been advised that it would be
reasonable to expect that the focus will be on fixed income and that the PGF or
EFSI AMGs could be regarded as a proxy at this stage.
The Financial Regulation lays down the rules for the establishment and the
implementation of the general budget of the European Union and of the European
Atomic Energy Community and the presentation and auditing of their accounts. A
revised version was published in 2018, with the aim of simplifying and increasing
the flexibility of the EU financial rules to adapt to changing circumstances and to
respond to unexpected developments. The new Financial regulation should therefore
increase access to EU funding and improve cooperation between administrations,
increase focus on achieving better results with less bureaucracy and improved
controls at a lower cost, increase leverage and flexibility of the EU Budget as well as
better protect the EU Budget.
Assessing the advantages and disadvantages of entrusting the financial management of the assets of the Common Provisioning Fund to
the Commission, the EIB, or a combination of the two
December, 2019 10
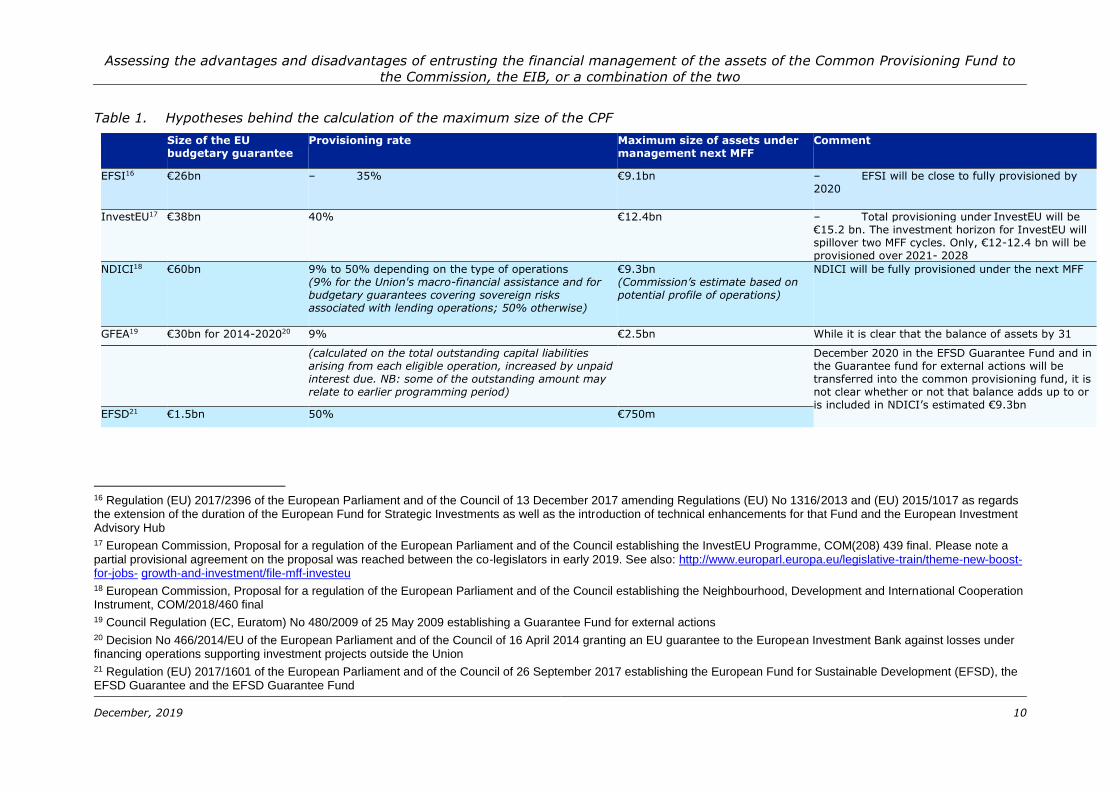
Table 1. Hypotheses behind the calculation of the maximum size of the CPF
Size of the EU budgetary guarantee
Provisioning rate Maximum size of assets under management next MFF
Comment
EFSI16 €26bn – 35% €9.1bn – EFSI will be close to fully provisioned by 2020
InvestEU17 €38bn 40% €12.4bn – Total provisioning under InvestEU will be €15.2 bn. The investment horizon for InvestEU will spillover two MFF cycles. Only, €12-12.4 bn will be provisioned over 2021- 2028
NDICI18 €60bn 9% to 50% depending on the type of operations (9% for the Union's macro-financial assistance and for budgetary guarantees covering sovereign risks associated with lending operations; 50% otherwise)
€9.3bn (Commission’s estimate based on potential profile of operations)
NDICI will be fully provisioned under the next MFF
GFEA19 €30bn for 2014-202020 9% €2.5bn While it is clear that the balance of assets by 31
(calculated on the total outstanding capital liabilities arising from each eligible operation, increased by unpaid interest due. NB: some of the outstanding amount may relate to earlier programming period)
December 2020 in the EFSD Guarantee Fund and in the Guarantee fund for external actions will be transferred into the common provisioning fund, it is not clear whether or not that balance adds up to or is included in NDICI’s estimated €9.3bn
EFSD21 €1.5bn 50% €750m
16 Regulation (EU) 2017/2396 of the European Parliament and of the Council of 13 December 2017 amending Regulations (EU) No 1316/2013 and (EU) 2015/1017 as regards the extension of the duration of the European Fund for Strategic Investments as well as the introduction of technical enhancements for that Fund and the European Investment Advisory Hub 17 European Commission, Proposal for a regulation of the European Parliament and of the Council establishing the InvestEU Programme, COM(208) 439 final. Please note a partial provisional agreement on the proposal was reached between the co-legislators in early 2019. See also: http://www.europarl.europa.eu/legislative-train/theme-new-boost-for-jobs- growth-and-investment/file-mff-investeu 18 European Commission, Proposal for a regulation of the European Parliament and of the Council establishing the Neighbourhood, Development and International Cooperation Instrument, COM/2018/460 final 19 Council Regulation (EC, Euratom) No 480/2009 of 25 May 2009 establishing a Guarantee Fund for external actions 20 Decision No 466/2014/EU of the European Parliament and of the Council of 16 April 2014 granting an EU guarantee to the European Investment Bank against losses under financing operations supporting investment projects outside the Union 21 Regulation (EU) 2017/1601 of the European Parliament and of the Council of 26 September 2017 establishing the European Fund for Sustainable Development (EFSD), the EFSD Guarantee and the EFSD Guarantee Fund
Assessing the advantages and disadvantages of entrusting the financial management of the assets of the Common Provisioning Fund to
the Commission, the EIB, or a combination of the two
December, 2019 14
Size of the EU budgetary guarantee
Provisioning rate Maximum size of assets under management next MFF
Comment
Total expected inflows22 into the CPF €30bn - €35bn
Total expected outflows23 from the CPF €5bn - €10bn
Expected maximum size of the CPF under next MFF €25bn
Based on provisional figures provided by DG ECFIN.
22 Inflows are essentially made from payment appropriations of the Union budget and generated revenues. 23 Outflows are essentially linked to guarantee calls and payment of administrative / management fees.
Assessing the advantages and disadvantages of entrusting the financial management of
the assets of the Common Provisioning Fund to the Commission, the EIB, or a
combination of the two
December, 2019 13
The main remaining uncertainties are as follows:
Whether the existing AM mandates linked to financial instruments (e.g. InnovFin
etc.) will be folded in within the CPF or grandfathered (i.e. continue to exist
outside the CPF until they run out). These are, however, relatively small in
comparison to the CPF (< €3bn).
The maximum size of the CPF may reduce if within the context of the final
agreement on the MFF, the final size of InvestEU and NDICI is lower than the
Commission’s proposal. For simplicity, this study is based on the numbers
currently being proposed in the Commission’s Legislative Financial Statements.
Member States compartments may increase the size of the CPF. However, given
the uncertainties around the take-up of Member States’ compartments, it has been
agreed with the Steering Group that the Study can disregard this element for the
moment.
Assessing the advantages and disadvantages of entrusting the financial management of
the assets of the Common Provisioning Fund to the Commission, the EIB, or a
combination of the two
December, 2019 14
3 Approach and methodology
This section describes our overall approach to the study, including the criteria and the
methods used to conduct the comparative assessment. However, as with any research
there were some limitations to the work undertaken. These are discussed at the end of
the section.
3.1 Overall study approach
3.1.1 Assessment criteria
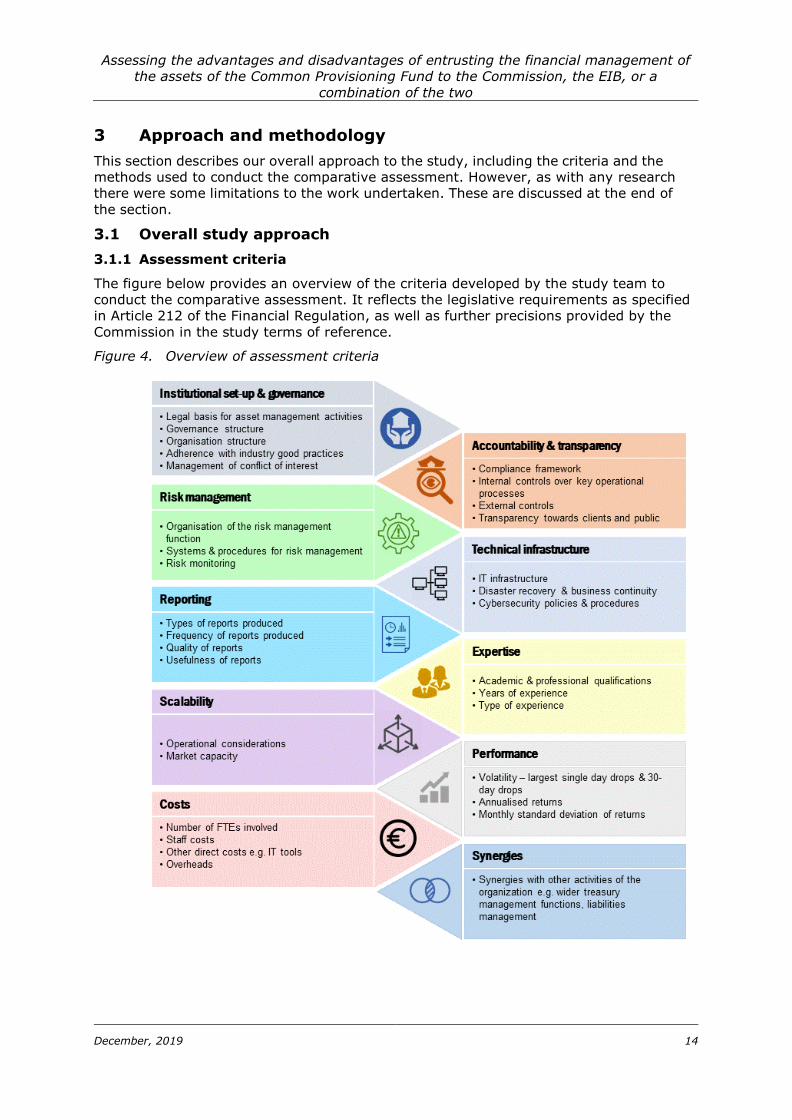
The figure below provides an overview of the criteria developed by the study team to
conduct the comparative assessment. It reflects the legislative requirements as specified
in Article 212 of the Financial Regulation, as well as further precisions provided by the
Commission in the study terms of reference.
Figure 4. Overview of assessment criteria
Assessing the advantages and disadvantages of entrusting the financial management of
the assets of the Common Provisioning Fund to the Commission, the EIB, or a
combination of the two
December, 2019 15
3.1.2 Methodology
The assessment was essentially based on documentary review and interviews / meetings
with both institutions. The two methods were used in a complementary manner to enrich
and cross-check the information collected from a single source. For example,
documentary evidence was sought to validate the statements and claims made by the
interviewees while interviews were undertaken to establish the extent to which
documented procedures and processes were followed.
Beyond that, other elements which fed into the report include:
Steering Group24 meetings;
Discussions among members of the study team;
Follow-up exchanges with both DG ECFIN and EIB to address outstanding
clarification needs;
Workshop with Commission services held on 23 July 2019.
Workshop with Commission and EIB services held on 25 September 2019, with an
aim to expose the findings and results of the assessment to critical review and
challenge by the Commission services as well as EIB representatives, thereby
identifying and correcting any factual inaccuracies, misinterpretation of information
or gaps.
Documentary review
Documentary review included:
Assembling the necessary documentation and data and populating a repository
database (see Annex 3), to which we constantly added over the course of the
study;
An in-depth review of all the documentation provided, including inter alia:
The Asset Management governance related documentation, including organisation
charts, mapping of decision-making processes information on roles /
responsibilities, sample of minutes of main Governance structures;
Key policies e.g. risk management policy, conflict of interest policy, Business
Continuity Plan etc;
Documents describing systems, processes and procedures e.g. front office manual,
IT systems, operational procedures;
Asset management guidelines;
Annual investment plans for each portfolio (Tactical Asset Allocations and annual
strategies);
Performance and risk reports.
A detailed mapping of the portfolios (see Annex 1),
An analysis of the performance data provided by DG ECFIN and the EIB (see
section 4.8 and Annex 6).
24 The Inter-Service Steering Group (ISG) was composed of members from DG BUDG and DG ECFIN.
Assessing the advantages and disadvantages of entrusting the financial management of
the assets of the Common Provisioning Fund to the Commission, the EIB, or a
combination of the two
December, 2019 16
Site visits and interviews
A series of in-depth, face-to-face, semi structured group interviews were organised with
staff involved in asset management and related functions at DG ECFIN and the EIB e.g.
portfolio management, risk management, etc. in order to collect the necessary
information and offer to both institutions the opportunity to provide feedback and
clarifications. A list of interviews undertaken is provided in Annex 1. These interviews
systematically explored each of the elements of the assessment criteria. The site visits
also involved walkthroughs of key processes and controls e.g. trading process.
On ECFIN side, this included:
A series of scoping interviews with key DG ECFIN staff with asset management
responsibilities;
A meeting with ECFIN officials to discuss current capacities and infrastructure,
outsourcing of asset management mandates to the EIB, and the validation of
options and scenarios;
One follow-up clarification meeting. On EIB side, this involved:
An introductory meeting to the EIB services and a group scoping interview;
A meeting with the EIB teams (portfolio management, risk management and
middle office) on 4 June 2019 to discuss current capacities and infrastructure and
held a first discussion on the options and scenarios;
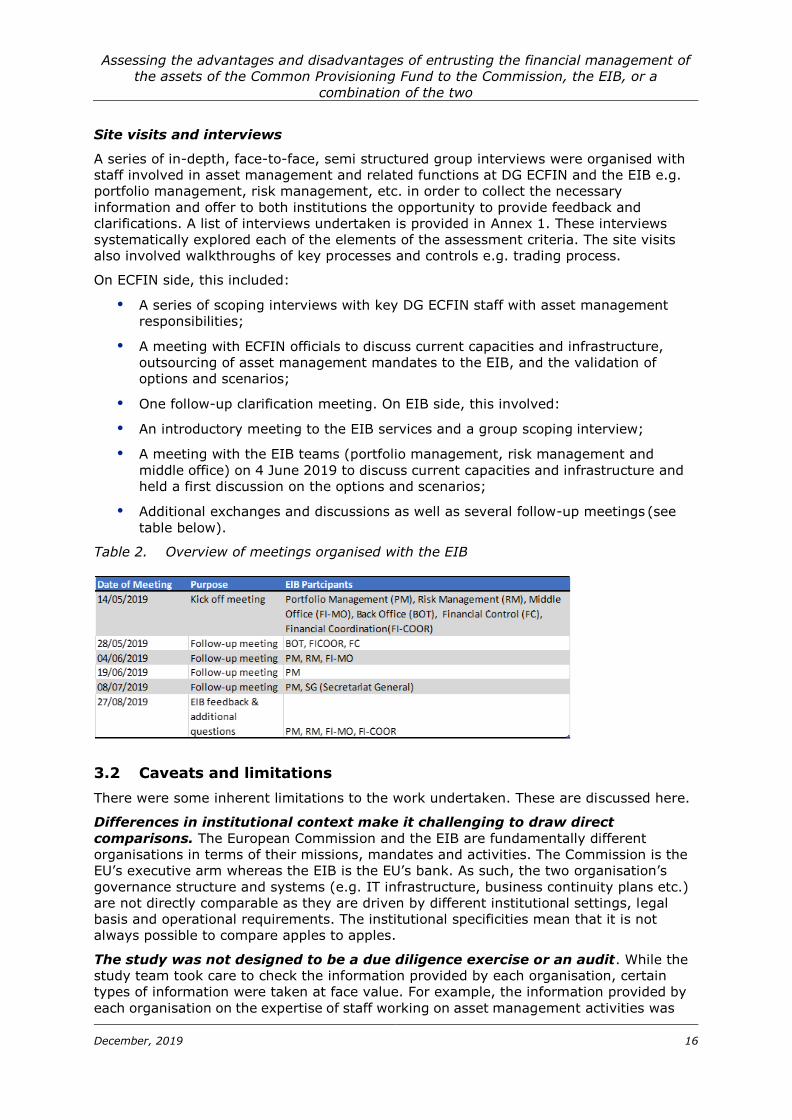
Additional exchanges and discussions as well as several follow-up meetings (see
table below).
Table 2. Overview of meetings organised with the EIB
3.2 Caveats and limitations
There were some inherent limitations to the work undertaken. These are discussed here.
Differences in institutional context make it challenging to draw direct
comparisons. The European Commission and the EIB are fundamentally different
organisations in terms of their missions, mandates and activities. The Commission is the
EU’s executive arm whereas the EIB is the EU’s bank. As such, the two organisation’s
governance structure and systems (e.g. IT infrastructure, business continuity plans etc.)
are not directly comparable as they are driven by different institutional settings, legal
basis and operational requirements. The institutional specificities mean that it is not
always possible to compare apples to apples.
The study was not designed to be a due diligence exercise or an audit. While the
study team took care to check the information provided by each organisation, certain
types of information were taken at face value. For example, the information provided by
each organisation on the expertise of staff working on asset management activities was

Assessing the advantages and disadvantages of entrusting the financial management of
the assets of the Common Provisioning Fund to the Commission, the EIB, or a
combination of the two
December, 2019 17
not cross-checked through interviews or other sources. Moreover, the study scope did not
include an independent verification of third-party service providers’ identity or a review of
the services being performed.
Assessing the advantages and disadvantages of entrusting the financial management of
the assets of the Common Provisioning Fund to the Commission, the EIB, or a
combination of the two
December, 2019 18
4 Assessment against the criteria
4.1 Institutional set-up and governance
The following aspects were examined under this criterion:
Institutional set-up: the legal framework and institutional set-up for asset
management within each organisation, to ensure that there is an explicit legal
foundation for the asset management activities of each organisation.
Governance aspects: the governance structure put in place to ensure that the
organisation meets its fiduciary and legal duties to all stakeholders. This typically
means delineating the investment decision making process from the dealing
process. Moreover, a good governance structure should consist of the following
three layers:
A higher-level body such as a Board which defines the Strategic Asset Allocation
(investment horizon and risk tolerance for the investment of the assets) and is
responsible for oversight of the long-term execution of the strategy.
An Investment Committee, responsible for formulating the Investment Strategy and
monitoring its implementation. The Investment Committee should meet on a
regular basis to review the portfolios under management, Investment Strategy
and approach.
Operational units which manage the assets on a daily basis according to the
Investment Strategy and in line with applicable rules and procedures.
Organisation structure: how the various asset management functions (portfolio
management, risk management, reporting, transaction processing and settlement,
control, compliance, etc.) are organised within each institution. There should be
adequate segregation of duties within the operational units i.e. the front, middle
and back-office functions. In practice this means that these functions should be
carried out by different staff with separate reporting lines.
Adherence with good practice: the extent to which each institution adheres with
industry standards and good practices.
Conflict of interest: processes and procedures put in place to manage potential
conflicts of interest, which are especially relevant in the case of third-party
management.
4.1.1 European Commission
4.1.1.1 Institutional set-up
The European Commission has the ultimate responsibility for managing the EU budget in
accordance with the principles of sound financial management (Article 317 of TFEU).
As enshrined in Article 77 of the Financial Regulation25, treasury management is part of the
Accounting Officer’s duties. The Accounting Officer needs to ensure that financial
resources are readily available to make the payments which are inherent to the process
of budget implementation and is required to set up cash management systems enabling
the drawing-up of cash-flow forecasts. DG BUDG is, inter alia, responsible for the
execution of the budget / treasury management of the entire budget managed by the
25 Regulation (EU, Euratom) 2018/1046 of the European Parliament and of the Council of 18 July 2018 on the financial rules applicable to the general budget of the Union, amending Regulations (EU) No 1296/2013, (EU) No 1301/2013, (EU) No 1303/2013, (EU) No 1304/2013, (EU) No 1309/2013, (EU) No 1316/2013, (EU) No 223/2014, (EU) No 283/2014, and Decision No 541/2014/EU and repealing Regulation (EU, Euratom) No 966/2012( 1) OJ-L 193/30.07.2018, p.1
Assessing the advantages and disadvantages of entrusting the financial management of
the assets of the Common Provisioning Fund to the Commission, the EIB, or a
combination of the two
December, 2019 19
Commission and the European Development Fund. This typically involves the
management of short-term liquidities. In this context, the Commission has been
entrusted with an annual budget (payments appropriations) of more than EUR 140 billion
and a balance sheet of similar order26.
The Commission has delegated to DG ECFIN, on the proposal of or with the agreement of
the Accounting Officer, the management of certain off-budget assets. This typically
involves management of funds available for longer horizons which are invested across the
maturity spectrum and have thus longer average maturities. In particular, ECFIN has
been delegated with the responsibility for asset management of off- budget assets and
investment of EU funds on behalf of ‘parent’ DGs such as BUDG, RTD, DEVCO etc27.
In addition to the portfolios that are managed directly by the DG, ECFIN also has the role
of overseeing the portfolios ‘outsourced’ to the EIB as the Commission retains the
ultimate responsibility for the execution of the EU budget according to the TFEU,
including in case of outsourcing28. ECFIN is thus responsible for:
Negotiating the asset management guidelines for the outsourced portfolios;
Approving the investment strategies;
Acting as an interface between parent DGs and the EIB, including advising the
parent DGs on asset management-related issues;
Monitoring the risk and performance of the portfolios outsourced to the EIB;
Consolidated accounting.
4.1.1.2 Governance
Following a peer review workshop with representatives of DG BUDG, the World Bank and
the European Stability Mechanism, a new governance structure was put in place for the
asset management activities of DG ECFIN as of 1 February 2018. As illustrated in Figure
5, the governance structure for asset management within ECFIN is integrated within the
organisation structure of the Commission.
26 Assets of consolidated EU balance sheets are in the order of EUR 166 billion.
27 The division of tasks and responsibilities between ECFIN and parent DGs is defined in Service Level Agreements
28 The Commission may entrust implementation tasks of the budget of the Union to entrusted entities and specifically the EIB pursuant to Article 58(1)(c)(iii) of the Financial Regulation. However, in accordance with Article 317 of the Treaty, it remains responsible for the implementation of the budget of the Union
Assessing the advantages and disadvantages of entrusting the financial management of
the assets of the Common Provisioning Fund to the Commission, the EIB, or a
combination of the two
December, 2019 20
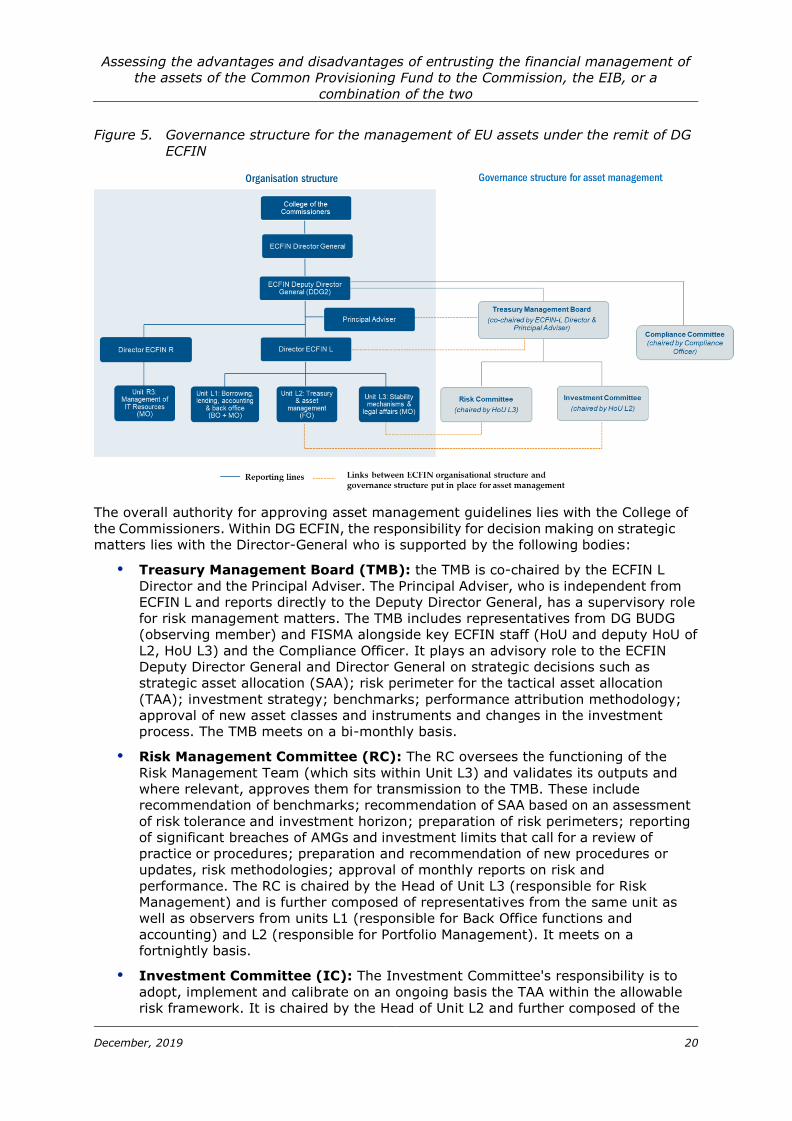
Figure 5. Governance structure for the management of EU assets under the remit of DG
ECFIN
The overall authority for approving asset management guidelines lies with the College of
the Commissioners. Within DG ECFIN, the responsibility for decision making on strategic
matters lies with the Director-General who is supported by the following bodies:
Treasury Management Board (TMB): the TMB is co-chaired by the ECFIN L
Director and the Principal Adviser. The Principal Adviser, who is independent from
ECFIN L and reports directly to the Deputy Director General, has a supervisory role
for risk management matters. The TMB includes representatives from DG BUDG
(observing member) and FISMA alongside key ECFIN staff (HoU and deputy HoU of
L2, HoU L3) and the Compliance Officer. It plays an advisory role to the ECFIN
Deputy Director General and Director General on strategic decisions such as
strategic asset allocation (SAA); risk perimeter for the tactical asset allocation
(TAA); investment strategy; benchmarks; performance attribution methodology;
approval of new asset classes and instruments and changes in the investment
process. The TMB meets on a bi-monthly basis.
Risk Management Committee (RC): The RC oversees the functioning of the
Risk Management Team (which sits within Unit L3) and validates its outputs and
where relevant, approves them for transmission to the TMB. These include
recommendation of benchmarks; recommendation of SAA based on an assessment
of risk tolerance and investment horizon; preparation of risk perimeters; reporting
of significant breaches of AMGs and investment limits that call for a review of
practice or procedures; preparation and recommendation of new procedures or
updates, risk methodologies; approval of monthly reports on risk and
performance. The RC is chaired by the Head of Unit L3 (responsible for Risk
Management) and is further composed of representatives from the same unit as
well as observers from units L1 (responsible for Back Office functions and
accounting) and L2 (responsible for Portfolio Management). It meets on a
fortnightly basis.
Investment Committee (IC): The Investment Committee's responsibility is to
adopt, implement and calibrate on an ongoing basis the TAA within the allowable
risk framework. It is chaired by the Head of Unit L2 and further composed of the
Assessing the advantages and disadvantages of entrusting the financial management of
the assets of the Common Provisioning Fund to the Commission, the EIB, or a
combination of the two
December, 2019 21
Deputy Head of Unit (DHoU), portfolio managers and analysts and observers
designated by Unit L3. The IC meets on a weekly basis to discuss future outlook
and implications for key exposures and trading ideas; asset allocation; new asset
classes or instruments; and investment process enhancements.
The Compliance Committee (CC): The CC is chaired by the Compliance Officer
and is further composed of representatives of ECFIN as well as the Legal Service. It
defines internal rules relating to market sensitive information in line with the
Market Abuse Regulation ("Chinese walls") and personal conflicts of interest;
ensures coherence of ECFIN Treasury compliance rules with the general
Commission framework (on ethics, gifts and hospitality; on whistleblowing); and
regularly assesses regulatory changes applicable to the asset management and
borrowing activities undertaken. The CC meets once every two months.
The composition, mission, decision making modalities, frequency of meetings and tasks of
each committee are clearly defined and documented29. The study team reviewed a sample
of minutes of meetings (there is a detailed record of each committee meeting) and
concludes that the minutes are:
Clear – topics are clearly laid-out and differing opinions are noted;
Thorough – current investment themes are explained within their macro-economic
context as well as through the economic impact on current and potential future
positions.
Although ECFIN’s governance structure was already assessed by peers (notably, the
World Bank) as compliant with industry standards, the above changes to the governance
structure applied since early 2018 bring further improvements, in light of the anticipated
increase in assets under management (under the current programming period, linked to
EFSI and EFSD’s ramp up). These improvements include:
Clearer and better separation of strategic issues from operational issues (e.g.
assigning responsibility for benchmarks to RC, leaving the formulation of the TAA
proposals to the IC);
Increased independence of risk management (e.g. by the creation of a new
committee and adapting the reporting lines - the Principal Adviser, who has a
supervisory role for risk management matters is independent from ECFIN L and
reports directly to the Deputy Director General). Nevertheless, according to
industry best practice (as coded in the three lines of defense model) and EBA
guidelines30 the risk management function should ideally have direct access to the
management body.
A more formalised compliance function (e.g. creation of the CC and an
independent compliance officer – see section 4.2.1.2 on accountability);
Clear delegation of the decision-making process.
4.1.1.3 Organisation structure
Within ECFIN, Directorate L is responsible for operational management of the assets. Its
resources are exclusively dedicated to the management of EU assets as the Commission
is not managing assets on behalf of third parties.
29 Ref. Ares(2018)828484 - 13/02/2018 30 EBA (2017) Guidelines on internal governance under Directive 2013/36/EU
Assessing the advantages and disadvantages of entrusting the financial management of
the assets of the Common Provisioning Fund to the Commission, the EIB, or a
combination of the two
December, 2019 22
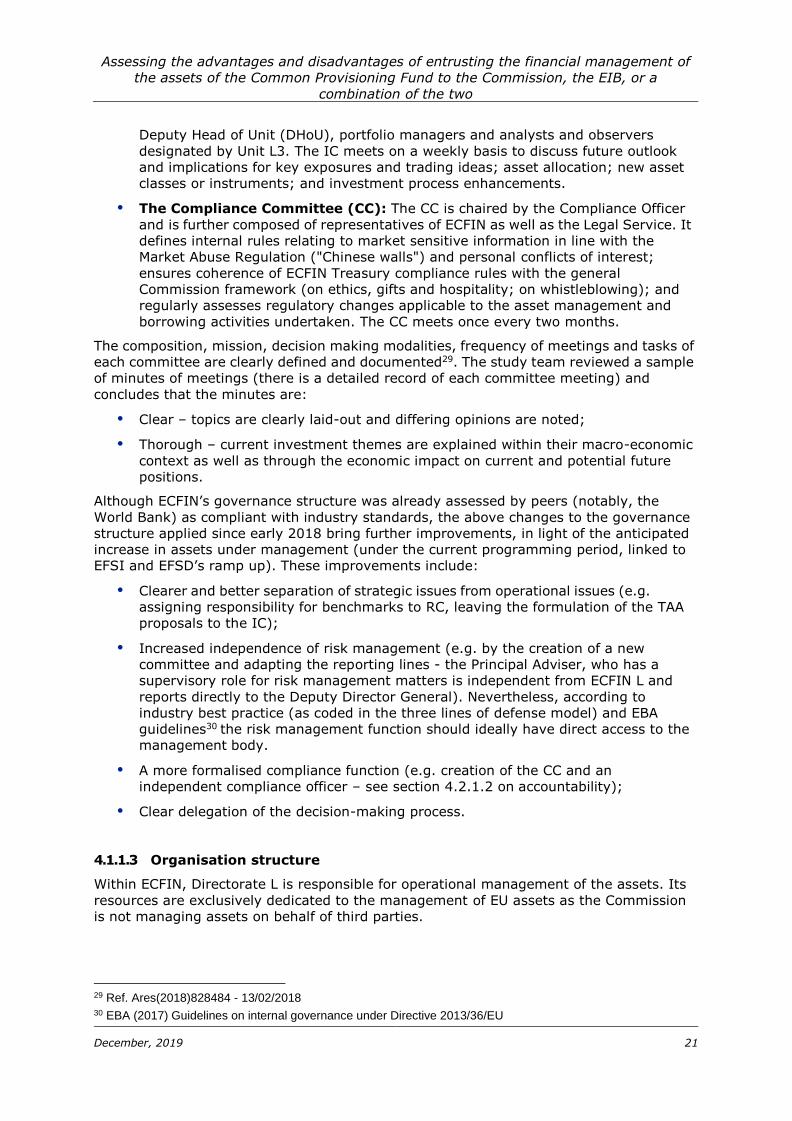
Figure 6. Organisation structure for asset management within DG ECFIN
Adapted from the European Commission
As illustrated above, the tasks necessary to carry out the asset management activities
are spread across four units of ECFIN as follows:
Unit L2 (Treasury and Asset Management) performs the typical front office
functions such as tactical asset allocation, portfolio implementation, market
intelligence, or market analyses and valuation, development of investment
methodologies for new asset classes and instruments, supervision of outsourced
portfolios, etc. This unit consists of eight portfolio managers and three market
analysts.
Unit L1 (Borrowing, lending, accounting & back office) is, inter alia,
responsible for Back-Office functions and Accounting with four staff supporting
payments/settlements and two staff dedicated to reconciliation of the treasury
activity. Unit L1 is also responsible for accounting for off-budget activities within
the framework established by the Financial Regulation and under the overall
supervision of the Accounting Officer31.
Middle office activities (accounting, reporting) are carried out by Units L1
and L3 with the support of R3 (IT which belongs to a different directorate).
Unit L3 (Stability mechanism and legal affairs) is responsible for the Risk
Management function. Within this Unit, a team of six risk managers is in charge
of the SAA and benchmarking process, measuring risk and performance and
limiting compliance/operational risk through the proposal and monitoring of a limit
framework.
The functions and roles of each unit are clearly defined and well documented in manuals,
notably the Treasury and Asset Management Manual, the Back Office and Reconciliation
Manuals, the Front Office Manual and the Risk Management Manual. ECFIN- L also has a
detailed process mapping which offers a comprehensive view of the decision-making chain
and procedures for the asset management activities.
31 These activities also cover the borrowing and lending operations and reporting
Assessing the advantages and disadvantages of entrusting the financial management of
the assets of the Common Provisioning Fund to the Commission, the EIB, or a
combination of the two
December, 2019 23
There is adequate segregation of duties between the various operational units and at the
decision-making level. A distinction is drawn between the transversal functions (Legal,
Operations and IT) and the operational units directly in charge of the management of the
assets.
ECFIN provided examples of constructive discussions that take place between the front-
office and risk management functions. In addition, internal and external audit provide the
independent assurance that the interaction between Front Office and Risk Management is
working well.
4.1.1.4 Adherence with good practice
ECFIN regularly subjects its asset management activities to independent peer reviews
(2014, 2018) to ensure alignment with industry best practice. ECFIN provided evidence
to demonstrate that the recommendations arising from the peer reviews have been
implemented.
ECFIN’s Financial Risk Management Policy makes reference to the market standards and
the relevant recommendations of the asset management industry representative bodies
and of financial services regulators, which should be applied by ECFIN where appropriate
– in a non-mechanistic manner given the nature of the organisation and the nature of the
treasury activities (own funds managed rather than funds of third-party investors). In
particular, the Good Asset Management Principles which need to be respected as per
ECFIN’s Financial Risk Management Policy include:
Investment activities to be performed in full compliance with Investment
Guidelines or investment policies formulated by the mandating services of any
given portfolio (or by equivalent bodies);
Asset management activities to be executed with full respect of fair-trading rules,
ensuring that the various portfolios are entitled to equal treatment in prices and
other conditions when trading simultaneously in the same sense (purchase/sale) in
the same instrument;
Risk Management to be fully independent from all units performing front-office
activities, in accordance with the principle of segregation of duties. In this context,
it should be noted that while the risk management functions lie in a unit (L3), that
is separated from the front office (Unit L2), the two units report to the same
Director. Strategic issues, also those related to risk management and SAA, are
however decided at a higher level, by the Director General, not the Director of
ECFIN L. In addition, the Principal Advisor, who has a supervisory role for risk
management matters is independent from ECFIN L and reports directly to the
Deputy Director General. It has however no direct report staff and has to rely on
risk reporting and expertise coming from ECFIN L3 that is neither hierarchically,
nor functionally, independent from DG ECFIN L.
Performance measurement to be executed by Risk Management;
The rules to be followed in case of limit breaches to be clearly defined in Financial
Risk Management Manual.
4.1.1.5 Conflict of interest
Articles 11 and 16 of the EU staff regulation32 set out the general rules on conflicts of
interest applicable to all Commission staff. Aside from complying with these rules,
Commission staff involved in asset management (across front office, risk management and
32 REGULATION No 31 (EEC), 11 (EAEC)
Assessing the advantages and disadvantages of entrusting the financial management of
the assets of the Common Provisioning Fund to the Commission, the EIB, or a
combination of the two
December, 2019 24
managers of the back office) have to sign declarations to confirm no conflict of interest
and to acknowledge personal trading limitations.
Additionally, the inside information control manual (dated May 2018) sets out internal
rules and procedures aimed at preventing and detecting possible misuse or
misappropriation of non-public market sensitive information within the framework of
ECFIN’s asset management activities.
More broadly, the Commission does not manage third party mandates and thus it is not
subject to potential conflicts of interest that may arise from a principal -agent
relationship.
4.1.2 EIB
4.1.2.1 Institutional set-up
The EIB was created by Articles 129 and 130 of the Treaty establishing the European
Economic Community (EEC), signed by the six founding members of the EU (Belgium,
France, Germany, Italy, Luxembourg and the Netherlands) on 27 March 1957 in Rome. In
accordance with Article 308 of the TFEU, the EIB is owned by the Member States of the
EU. The mission of the EIB is set out in Article 309 of the TFEU: to promote sound projects,
especially for the development of the less-developed regions, this being financed by
borrowing on the international capital markets and from its own resources.
Asset management within the EIB is mainly carried out to support the Bank’s core
activity,
i.e. providing financing to sound and sustainable investment projects that contribute to
EU policy objectives33. The EIB, however, also provides treasury services to third parties,
mainly to the European Commission.
Since 2014, the cooperation between the two institutions has been organised under the
umbrella of the Financial and Administrative Framework Agreement (FAFA) which primarily
concerns the domain of financial instruments, but it also contains some sections on the
management of related assets, setting out the required information flows (e.g. the need
to provide information on cash flows and to submit investment strategies for the approval
of the Commission) and asset management guidelines (including risk limits, etc.).
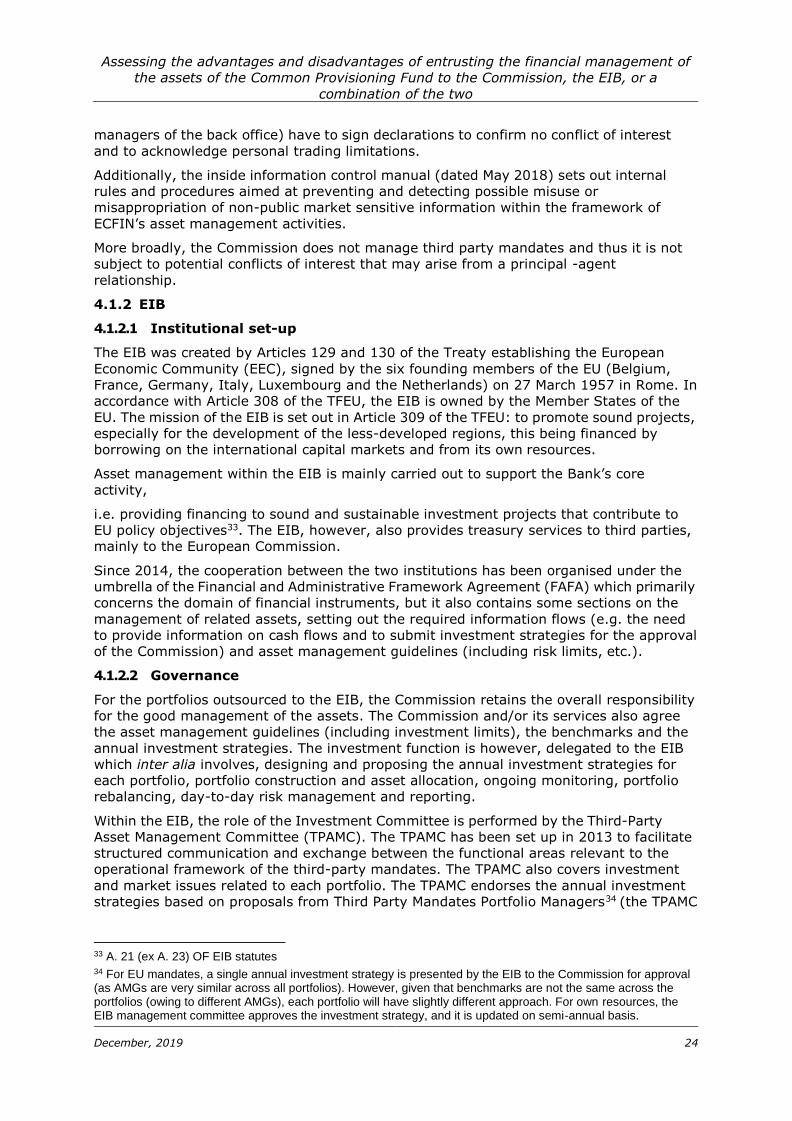
4.1.2.2 Governance
For the portfolios outsourced to the EIB, the Commission retains the overall responsibility
for the good management of the assets. The Commission and/or its services also agree
the asset management guidelines (including investment limits), the benchmarks and the
annual investment strategies. The investment function is however, delegated to the EIB
which inter alia involves, designing and proposing the annual investment strategies for
each portfolio, portfolio construction and asset allocation, ongoing monitoring, portfolio
rebalancing, day-to-day risk management and reporting.
Within the EIB, the role of the Investment Committee is performed by the Third-Party
Asset Management Committee (TPAMC). The TPAMC has been set up in 2013 to facilitate
structured communication and exchange between the functional areas relevant to the
operational framework of the third-party mandates. The TPAMC also covers investment
and market issues related to each portfolio. The TPAMC endorses the annual investment
strategies based on proposals from Third Party Mandates Portfolio Managers34 (the TPAMC
33 A. 21 (ex A. 23) OF EIB statutes 34 For EU mandates, a single annual investment strategy is presented by the EIB to the Commission for approval (as AMGs are very similar across all portfolios). However, given that benchmarks are not the same across the portfolios (owing to different AMGs), each portfolio will have slightly different approach. For own resources, the EIB management committee approves the investment strategy, and it is updated on semi-annual basis.
Assessing the advantages and disadvantages of entrusting the financial management of
the assets of the Common Provisioning Fund to the Commission, the EIB, or a
combination of the two
December, 2019 25
does not approve investment strategies for EU mandates as these are approved by the
Commission) and supervises their implementation. The TPAMC constantly reviews TAA
and makes decisions on basis of whether these correspond with relevant investment
strategies. It reviews the investment opportunities and the asset allocation of each
mandate and can issue recommendations regarding the different mandates.
It is composed of the Director- Treasury (chair)35, the Head of Portfolio Management, the
third-party mandates Portfolio Managers, one representative from Middle office’s
Operational Support and Monitoring team, one representative from Liquidity Management
and one representative from the team of the Risk Management’s Treasury Risk Unit
dedicated to external mandates. The chair of the TPAMC reports to the Director General
of the Finance Directorate.
The TPAMC typically meets on a monthly basis and discussions are minuted. The study
team reviewed a sample of the minutes of TPMAC meetings (held between October 2018
and April 2019). These are not as detailed or as thorough as the minutes of the ECFIN
Investment Committee, but capture the main points discussed and agreed actions. The
minutes of the TPAMC serve as a review of the focus of PM in terms of executing the
strategy along with a review of other policy issues concerning the mandate portfolios.
TPAMC decisions are in the form of action points and are related to issuer eligibility,
exposure concentration and special market topics such as Brexit. Issues discussed are
thus typically similar to those addressed during EIB – Commission monthly calls.
35 The Director- Treasury also heads the Investment Committee for EIB own resources, thus ensuring a link between third party mandates activity and the EIB own resources activity
Assessing the advantages and disadvantages of entrusting the financial management of
the assets of the Common Provisioning Fund to the Commission, the EIB, or a
combination of the two
December, 2019 26
Figure 7. Governance structure for the management of EU assets outsourced to the EIB
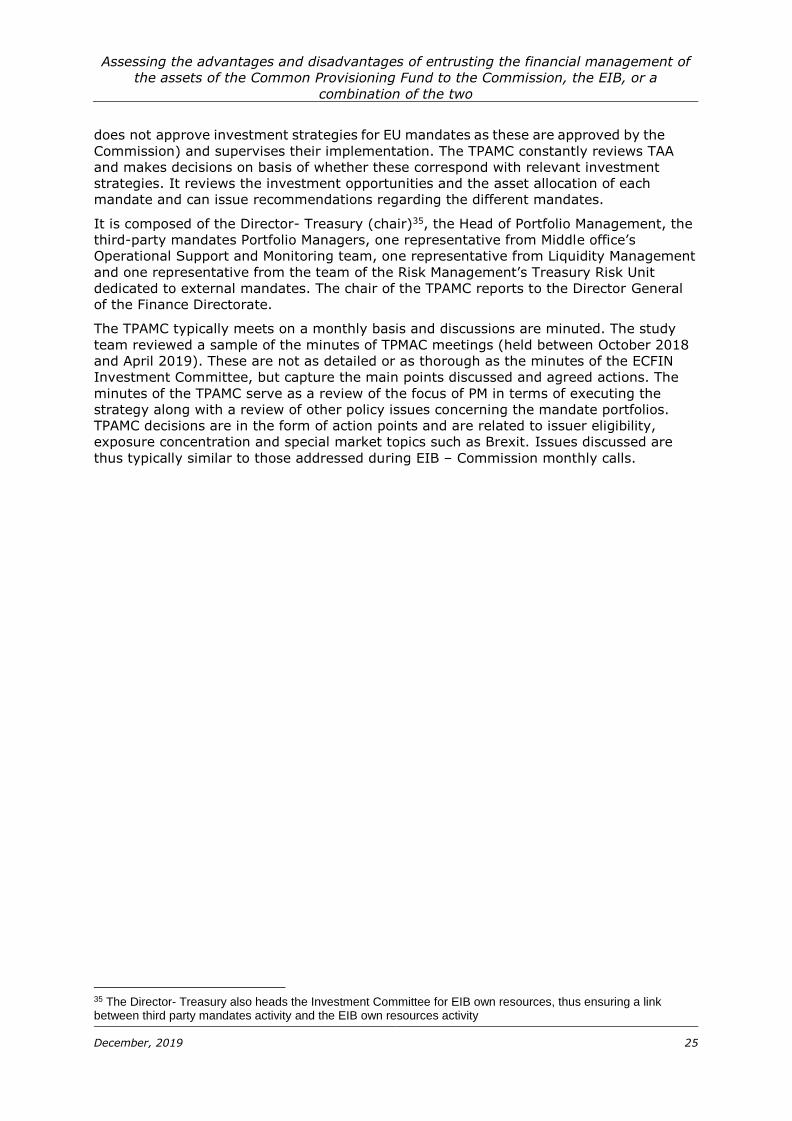
4.1.2.3 Organisation structure
Several directorates and units are involved within the EIB in the asset management
function as illustrated in Figure 8 and further explained below.
Assessing the advantages and disadvantages of entrusting the financial management of the assets of the Common Provisioning Fund to
the Commission, the EIB, or a combination of the two
December, 2019 27
Figure 8. Organisation structure for asset management activities within the EIB
Assessing the advantages and disadvantages of entrusting the financial management
of the assets of the Common Provisioning Fund to the Commission, the EIB, or a
combination of the two
December, 2019 28
Finance
The Finance Directorate (FI) performs front/middle/back-office functions relating to
the EIB’s asset management activities.
Within the Finance Directorate, the FI/COOR (coordination) Division and
specifically the Partnerships Processes & Control Unit, has three key roles:
Partnerships team is responsible for the coordination of mandate activity36,
including the negotiation and set-up of new mandates. Within the FI Directorate,
this team acts as the central contact point for mandate activity, i.e. it liaises with
all FI teams involved in mandate activity and acts as an interface with other EIB
Directorates involved in mandate activity and in particular the Mandate
Management officers37.
Processes team is responsible for (i) the documentation and the maintenance of
processes & procedures and for (ii) the establishment and maintenance of the
Internal Control Framework for all FI Directorate.
Compliance team is responsible for preparing internal (at FI Directorate level)
policies and procedures, including the Front Office Manual, and monitoring their
implementation by exercising the relevant control functions within the first line
of defence. Its full responsibilities are described in section 4.2.2 on
Accountability and Transparency.
FiTre (Treasury) Department is responsible for the front office operations. FiTre also
develops the annual investment strategy for the Commission mandates (which is
internally discussed at the TPAMC and is subject to final approval by the Commission).
Within FiTre, the EIB Portfolio Management division has two sub teams, one
responsible for managing EIB own portfolios and the other responsible for third-party
mandates. There is a separate Liquidity Management Division in the Treasury
functioning as a money market desk, responsible for managing the short-term liquidity
of the Bank and the third party mandates, the commercial paper program and the
Unitary Fund (an internal money market fund).
FiSpbs (Strategy, Policies & Business Support) is responsible for the middle office
functions. FI-SPBS was set up recently, following a recent FI reorganisation based on
the ‘Middle Office & Operational Support for FI Front Offices’ project initiated at the
end of 2014 to implement an Internal Audit recommendation requiring a robust and
independent market conformity check of all front office transactions, and based also
on the Oliver Wyman high-level review of EIB’s Control Framework focused on the
three lines of defence paradigm. The new department was approved by the
Management Committee in November 2016 and has been in place since September
2017. The middle office does not have a dedicated team for third party mandates. The
middle office inter alia carries out market conformity checks and full trade surveillance.
It performs a control function within the first line of defence. As such, it also checks
the reports produced by the Treasury Risk Unit within the Risk Management
Directorate.
FI/PRO (Planning & Settlement of Operations) provides back office services
covering the Bank’s funding, treasury and lending activities. The back office treasury
operates on a pool of competency principle. This means that, with a view to allow each
staff to perform all functions and improve internal back up and resilience, staff rotate
on a weekly or bi-weekly basis. As such, there is no dedicated team for third party
36 Asset management is only one of the aspects coordinated by FI/COOR 37 Mandate Management officers coordinate the mandate implementation at EIB level, when the mandate foresees EIB operations from own resources (e.g. lending, guarantee).
Assessing the advantages and disadvantages of entrusting the financial management
of the assets of the Common Provisioning Fund to the Commission, the EIB, or a
combination of the two
December, 2019 29
mandates. They are responsible, among other tasks, of the trade processing and
settlement, collateral management activities, intraday cash and liquidity management
for the front office, payments and reconciliation. The treasury back office has around
30 staff members (of which more than 20, involved in two separate pools of
competency, are relevant for mandates).
There is clear segregation of duties between the different functions (front office,
middle office, back office). Within the front office, there is a dedicated team for third
party mandates. Although the third party mandates team and the EIB’s own portfolios
team report to the same manager (Head of Portfolio Management) and as such are not
entirely segregated, the EIB has put in place several measures to mitigate any
potential conflict of interest risks (see section 4.1.3.4).
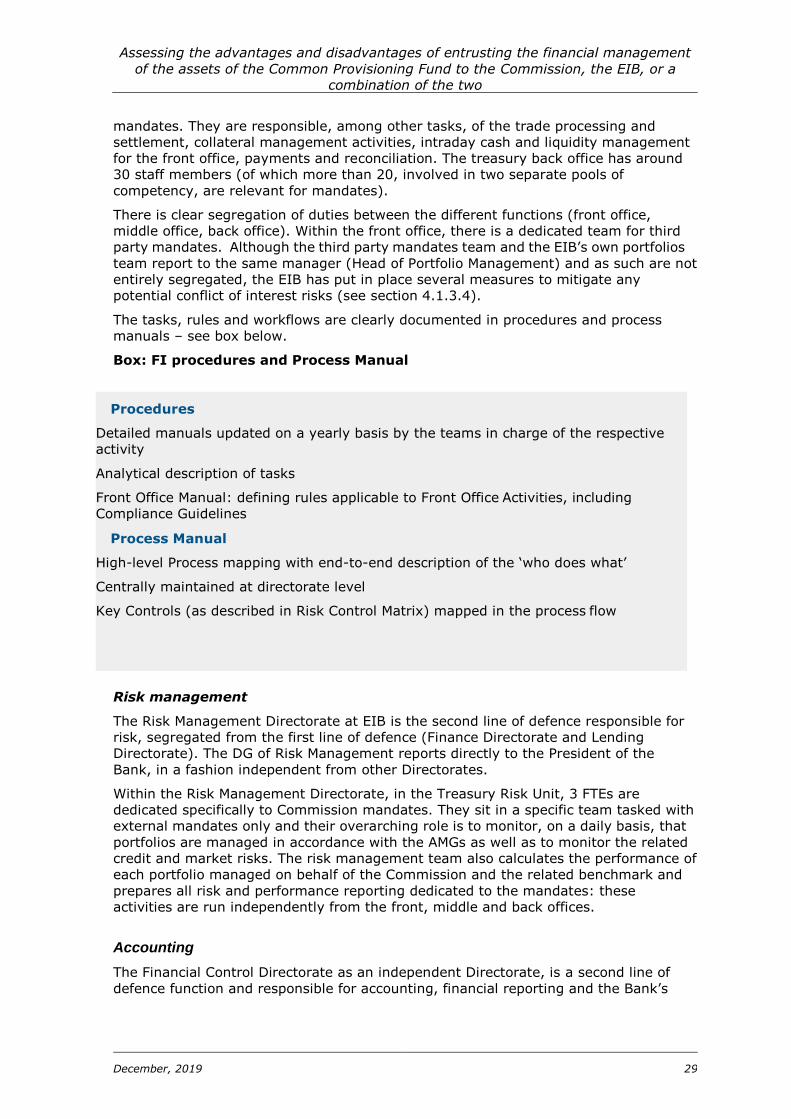
The tasks, rules and workflows are clearly documented in procedures and process
manuals – see box below.
Box: FI procedures and Process Manual
Risk management
The Risk Management Directorate at EIB is the second line of defence responsible for
risk, segregated from the first line of defence (Finance Directorate and Lending
Directorate). The DG of Risk Management reports directly to the President of the
Bank, in a fashion independent from other Directorates.
Within the Risk Management Directorate, in the Treasury Risk Unit, 3 FTEs are
dedicated specifically to Commission mandates. They sit in a specific team tasked with
external mandates only and their overarching role is to monitor, on a daily basis, that
portfolios are managed in accordance with the AMGs as well as to monitor the related
credit and market risks. The risk management team also calculates the performance of
each portfolio managed on behalf of the Commission and the related benchmark and
prepares all risk and performance reporting dedicated to the mandates: these
activities are run independently from the front, middle and back offices.
Accounting
The Financial Control Directorate as an independent Directorate, is a second line of
defence function and responsible for accounting, financial reporting and the Bank’s
Procedures
Detailed manuals updated on a yearly basis by the teams in charge of the respective
activity
Analytical description of tasks
Front Office Manual: defining rules applicable to Front Office Activities, including
Compliance Guidelines
Process Manual
High-level Process mapping with end-to-end description of the ‘who does what’
Centrally maintained at directorate level
Key Controls (as described in Risk Control Matrix) mapped in the process flow
Assessing the advantages and disadvantages of entrusting the financial management
of the assets of the Common Provisioning Fund to the Commission, the EIB, or a
combination of the two
December, 2019 30
internal control framework. Dedicated team, the TPM unit, is responsible for the
financial reporting of the third-party funds, including the financial instruments of the
EC and third-party funds under treasury asset management. The team is responsible
for the day-to-day accounting, preparation of monthly “marked-to-marked” assets
under management reports, preparation of annual financial statements, coordination
of the external audits and cooperation with the DG BUDG to ensure the smooth
reporting of the EC concerning the funds managed by EIB.
4.1.2.4 Conflict of interest
The EIB Group conflict of interest policy document lays out the general principles and
mitigating measures for managing potential conflicts. It covers institutional as well as
personal conflicts of interest. The former is further addressed through implementing
measures and the latter via the Staff Code of Conduct38.
Additionally, EIB has put in place an Integrity Policy and Compliance Charter which
underlines the commitment of the EIB on integrity which is a fundamental principle for
the prevention of possible conflicts of interest39.
There are two particularly relevant conflicts of interest associated with outsourcing of
asset management to the EIB (which do not apply in case the assets are managed in
house by the Commission). These are further discussed below.
Potential conflict of interest between the Bank’s lending and treasury
activities
There are Chinese Walls between Portfolio Management activities and the lending
teams/operations. The EIB Group Market Abuse Guidelines and the market abuse
provisions of the Front Office Manual further reinforce these Chinese Walls.
Conflict of interest arising out of principal-agent relationship
Conflicts of interest can often arise in a principal-agent relationship. In a principal-
agent relationship, the principal is the party that legally appoints the agent to make
decisions and take actions on its behalf. The separation of the “ownership” (principal)
and the “control” (agent) in principal-agent relationships creates the grounds for the
conflict of interest between the two parties. For example, the agent may not prioritise
the best interests of the principal, but may instead pursue its own goals.
The measures taken by the EIB to manage the risk of potential conflicts of interest
arising, inter alia, from a principal-agent relationship are summarised in the box below.
38 https://www.eib.org/en/publications/staff-code-of-conduct 39 EIB Integrity Policy and Compliance Charter. Available at: https://www.eib.org/attachments/general/occo_charter_en.pdf
Assessing the advantages and disadvantages of entrusting the financial management
of the assets of the Common Provisioning Fund to the Commission, the EIB, or a
combination of the two
December, 2019 31
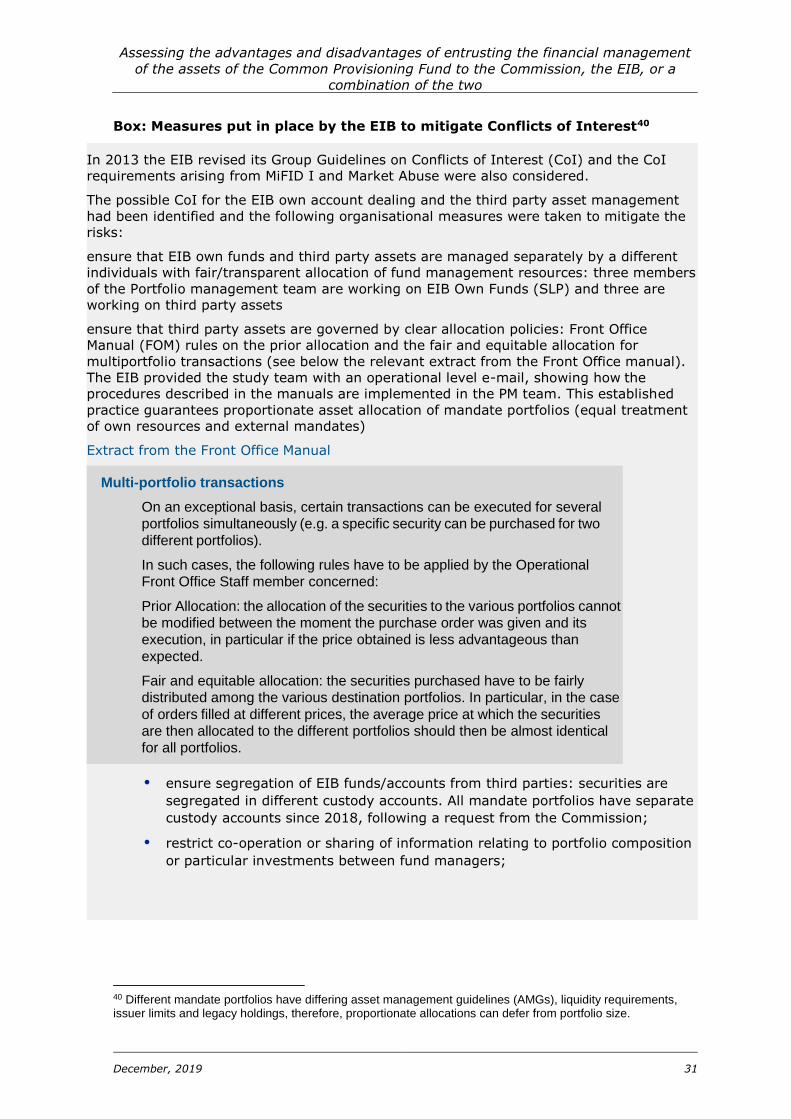
Box: Measures put in place by the EIB to mitigate Conflicts of Interest40
40 Different mandate portfolios have differing asset management guidelines (AMGs), liquidity requirements, issuer limits and legacy holdings, therefore, proportionate allocations can defer from portfolio size.
In 2013 the EIB revised its Group Guidelines on Conflicts of Interest (CoI) and the CoI
requirements arising from MiFID I and Market Abuse were also considered.
The possible CoI for the EIB own account dealing and the third party asset management
had been identified and the following organisational measures were taken to mitigate the
risks:
ensure that EIB own funds and third party assets are managed separately by a different
individuals with fair/transparent allocation of fund management resources: three members
of the Portfolio management team are working on EIB Own Funds (SLP) and three are
working on third party assets
ensure that third party assets are governed by clear allocation policies: Front Office
Manual (FOM) rules on the prior allocation and the fair and equitable allocation for
multiportfolio transactions (see below the relevant extract from the Front Office manual).
The EIB provided the study team with an operational level e-mail, showing how the
procedures described in the manuals are implemented in the PM team. This established
practice guarantees proportionate asset allocation of mandate portfolios (equal treatment
of own resources and external mandates)
Extract from the Front Office Manual
ensure segregation of EIB funds/accounts from third parties: securities are
segregated in different custody accounts. All mandate portfolios have separate
custody accounts since 2018, following a request from the Commission;
restrict co-operation or sharing of information relating to portfolio composition
or particular investments between fund managers;
Multi-portfolio transactions
On an exceptional basis, certain transactions can be executed for several
portfolios simultaneously (e.g. a specific security can be purchased for two
different portfolios).
In such cases, the following rules have to be applied by the Operational
Front Office Staff member concerned:
Prior Allocation: the allocation of the securities to the various portfolios cannot
be modified between the moment the purchase order was given and its
execution, in particular if the price obtained is less advantageous than
expected.
Fair and equitable allocation: the securities purchased have to be fairly
distributed among the various destination portfolios. In particular, in the case
of orders filled at different prices, the average price at which the securities
are then allocated to the different portfolios should then be almost identical
for all portfolios.
Assessing the advantages and disadvantages of entrusting the financial management
of the assets of the Common Provisioning Fund to the Commission, the EIB, or a
combination of the two
December, 2019 32
Furthermore:
The EIB requires the Front Office staff to sign annually a declaration to
acknowledge the personal investment prohibitions and all the rules (including
the rules for the management of the conflicts of interest) contained in the Front
Office Manual. the Front Office Manual Rules are in addition to the EIB Group
Conflicts of Interest policy.
The EIB Group Market Abuse Guidelines for the prevention of Insider Dealing
and Market Manipulation (the “MAG”) provide for personal prohibitions of
trading when in possession of inside information. In the same context front
running is of course prohibited.
Transfer of assets between portfolios has to be approved by the relevant
Commission DG;
Portfolio managers cannot sell positions to other desks within EIB (see box
below) and brokers are not allowed to resell positions bought from EIB to EIB
for five days.
separate portfolio management from trading and lending activity and
guidelines to protect managers' investment decisions from inappropriate
influence: EIB Market Abuse Guidelines, rules in the FOM, information barriers
between lending and portfolio management teams to avoid misuse of
confidential/inside information
provide fixed and transparent charges with clear disclosure of expenses (if
any);
ensure that fund management staff remuneration is not structured in a way
that might compromise clients' interests or EIB's objectives. There are no
economic incentives for any portfolio manager to benefit any particular
portfolio – bonuses are relatively small (1-1.5 months’ salary) and primarily
depend on the Bank’s performance. For the part of the bonus which depends
on individual contribution and performance, there is no 1:1 relationship
between the portfolio performance and the financial incentives, portfolio
performance being one element amongst others which are taken into account
when assessing individual performance in broader terms.
establish the TPAMC to ensure a forum for the representation of third party
mandator’s interests;
use independent third parties, or an independent division within the
organisation for valuation (FI/SPBS/SDM Division which is also using external
consultants);
justify and document Asset Management Guidelines
Keep records of specific conflicts of interest
Assessing the advantages and disadvantages of entrusting the financial management
of the assets of the Common Provisioning Fund to the Commission, the EIB, or a
combination of the two
December, 2019 33
Box: Extract from the Front Office Manual
4.1.2.5 Adherence with good practice
The EIB is not subject to the supervision as the typical MFI41 but voluntarily complies
with best banking practice, which is mostly based on EU regulation, but also aligned
with relevant global best practice.
The Bank has policies and processes, including strict customer due diligence and anti-
money laundering rules to promote high ethical and professional standards in the
financial sector and prevent the Bank from being used, intentionally or unintentionally,
for criminal activities.
Regulatory changes, applicable also to the treasury – asset management activities,
are monitored by the EIB BBP Watch Team established by the EIB. FI is an active
member of the Watch Team, represented by the dedicated FI/SPBS/FPM Division
established in FI for the monitoring of financial policies and best banking practices and
by FI/COOR especially for the market conduct best banking practices, The
composition, mission, decision making modalities, frequency of meetings (convening
in principle on a monthly basis) and tasks of the Watch team are clearly defined and
documented.
The Audit Committee of the EIB, as part of its statutory duties, is required to verify,
and report to the EIB’s Board of Governors, that the activities of the EIB conform to
best banking practice applicable to it.
Additionally, the EIB complies with the following good practice principles:
Investment activities to be performed in full compliance with Investment
Guidelines or investment policies formulated by the mandating services of any
given portfolio (or by equivalent bodies);
Asset management activities to be executed with full respect of fair-trading
rules, ensuring that the various portfolios are entitled to equal treatment in
prices and other conditions when trading simultaneously in the same sense
(purchase/sale) in the same instrument;
Risk Management to be fully independent from all units performing front-office
activities;
Performance measurement to be executed by Risk Management;
The segregation of duties between the first, second a third line of defence is
compliant to best banking practices;
In order to ensure compliance with best market practice, prior to engaging in
the revision of the benchmark methodology, EIB’s Risk Management initiated a
market survey among peers to determine the best market practice in setting up
appropriate benchmarks.
41 The European Investment Bank has reportedly agreed to discussions which could lead to it falling under the supervisory eye of the European Central Bank.
Intra-portfolio transactions
Subject to exceptions duly signed-off by the Director General of FI, no transaction
between two portfolios managed by FI/TRE (whether EIB portfolios of portfolios
managed on behalf of third parties) will be authorised.
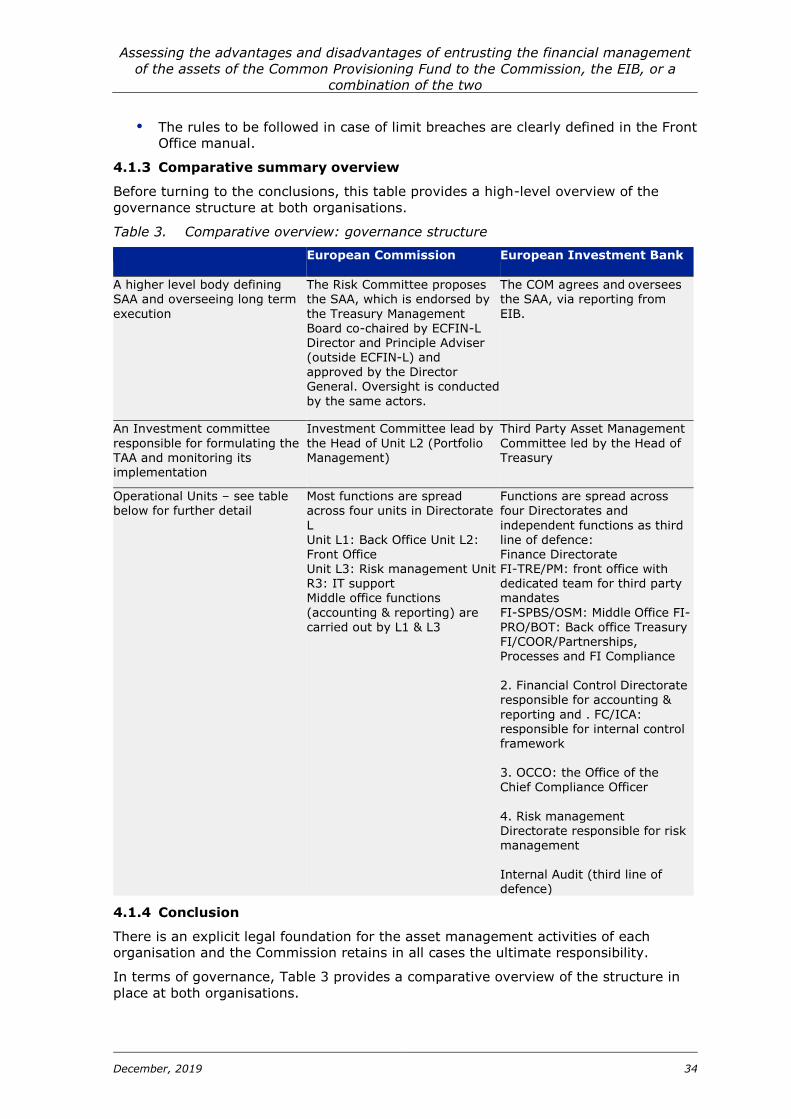
Assessing the advantages and disadvantages of entrusting the financial management
of the assets of the Common Provisioning Fund to the Commission, the EIB, or a
combination of the two
December, 2019 34
The rules to be followed in case of limit breaches are clearly defined in the Front
Office manual.
4.1.3 Comparative summary overview
Before turning to the conclusions, this table provides a high-level overview of the
governance structure at both organisations.
Table 3. Comparative overview: governance structure
European Commission European Investment Bank
A higher level body defining SAA and overseeing long term
execution
The Risk Committee proposes the SAA, which is endorsed by
the Treasury Management Board co-chaired by ECFIN-L Director and Principle Adviser (outside ECFIN-L) and
approved by the Director General. Oversight is conducted
by the same actors.
The COM agrees and oversees the SAA, via reporting from
EIB.
An Investment committee
responsible for formulating the TAA and monitoring its implementation
Investment Committee lead by
the Head of Unit L2 (Portfolio Management)
Third Party Asset Management
Committee led by the Head of Treasury
Operational Units – see table below for further detail
Most functions are spread across four units in Directorate
L Unit L1: Back Office Unit L2: Front Office Unit L3: Risk management Unit R3: IT support Middle office functions
(accounting & reporting) are
carried out by L1 & L3
Functions are spread across four Directorates and
independent functions as third line of defence: Finance Directorate FI-TRE/PM: front office with dedicated team for third party mandates
FI-SPBS/OSM: Middle Office FI-
PRO/BOT: Back office Treasury FI/COOR/Partnerships, Processes and FI Compliance 2. Financial Control Directorate responsible for accounting &
reporting and . FC/ICA: responsible for internal control framework 3. OCCO: the Office of the Chief Compliance Officer
4. Risk management Directorate responsible for risk management
Internal Audit (third line of defence)
4.1.4 Conclusion
There is an explicit legal foundation for the asset management activities of each
organisation and the Commission retains in all cases the ultimate responsibility.
In terms of governance, Table 3 provides a comparative overview of the structure in
place at both organisations.
Assessing the advantages and disadvantages of entrusting the financial management
of the assets of the Common Provisioning Fund to the Commission, the EIB, or a
combination of the two
December, 2019 35
Key features at the Commission include that it has a Risk Committee, reporting to the
TMB. The TMB is co-chaired by the Director of ECFIN-L and the independent Principal
Advisor who is responsible for the strategic asset allocation and risk related
management matters. All risk measurement, monitoring and management activities,
as well as performance measurement, are performed within ECFIN L3, separately from
the front office. The Principal Advisor reports directly to the Deputy Director-General
(DDG. All strategic issues, also those related to risk management and SAA are decided
by the Director General, not the Director of ECFIN L. In the commission the accounting
activities of ECFIN L are taking place within the framework established by the Financial
Regulation and under the overall supervision of the Accounting Officer (who is the
DDG of DG BUDG).
Within the EIB, there are dedicated, but not segregated teams42 for third party
mandates where relevant (accounting, front office, risk management). In the EIB, risk
management is performed by a separate Directorate, which is segregated and
independent from other Directorates and whose Director General reports directly to
the President of EIB. All risk measurement, monitoring and management activities, as
well as performance measurement against benchmark, are performed within the Risk
Management Directorate of EIB, independent from the front office (located instead in
the Finance Directorate). Moreover, accounting lies in an entirely separate Directorate
(Financial Control) and is separated from payments and settlements to reduce
operational risk.
Both organisations have appropriate governance and organisational structures for
their asset management activities, respecting good corporate governance principles
with clear delegation of decision making, adequate segregation of duties, clearly
defined roles and well defined and documented procedures and processes.
Both organisations have sound procedures and codes in place to manage conflicts of
interest.
The EIB additionally has to manage conflict of interest risks arising from its role as a
bank and as an agent acting on behalf of the Commission (principal). The study team is
satisfied with the organisational structures, procedures and rules put in place by the EIB
to manage these risks. In addition, ECFIN uses independent/external reviews to
strengthen the procedures and compliance to the best industry practice standards on a
regular basis. EIB tasks its Audit Committee to check compliance with best practices.
4.2 Accountability and transparency
Under this criterion, the study team examined whether there are clear lines of
accountability, mechanisms for independent internal and external control as well as
public transparency of each organisation’s asset management activities. Generally
speaking, a fund manager should have an effective compliance function to ensure that
it complies with its own internal policies and procedures as well as all applicable legal
and regulatory requirements. The compliance function should be independent of other
functions and report directly to the fund manager’s senior management. Furthermore,
a fund manager should maintain an independent (internal) audit function to check the
adequacy and effectiveness of the fund manager’s management, operations and
internal controls. The audit function should have a direct line of communication to
senior management or the audit committee. The internal audit function may be
supplemented by external audits. The three lines of defense model is typically
42 This means that there are separate staff for the third party mandates, but they report to the same line manager as the staff responsible for activities related to the management of the EIB’s own assets
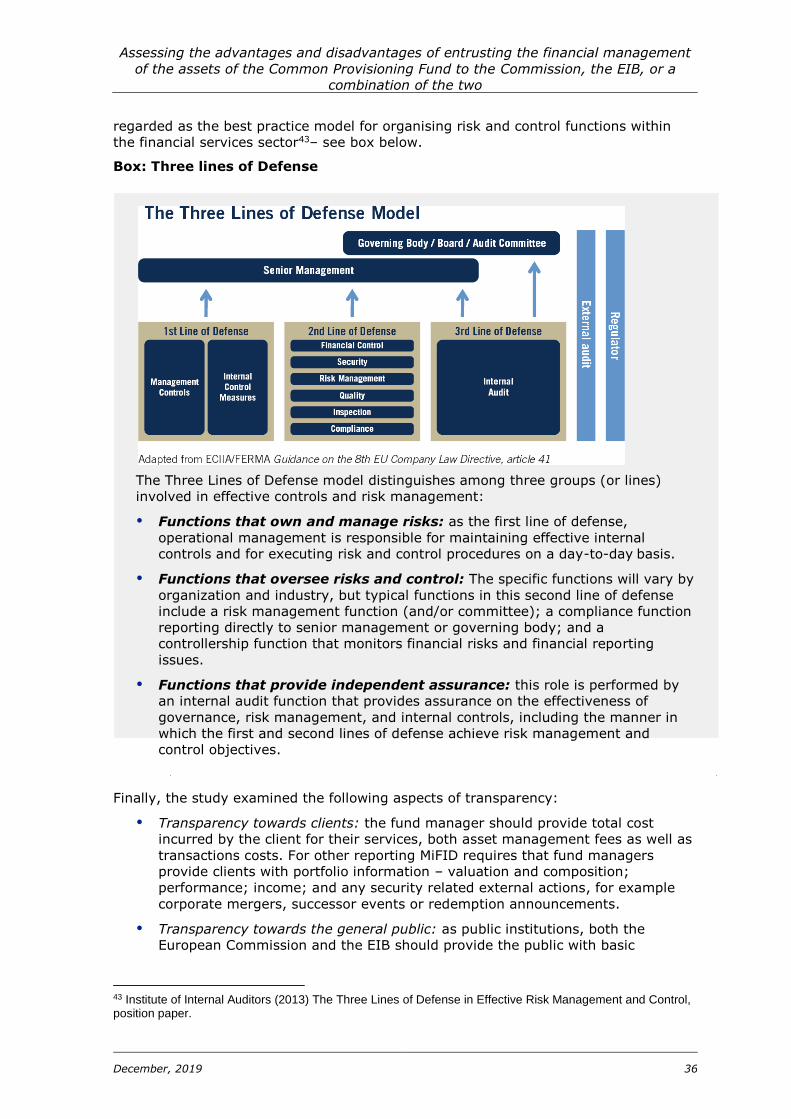
Assessing the advantages and disadvantages of entrusting the financial management
of the assets of the Common Provisioning Fund to the Commission, the EIB, or a
combination of the two
December, 2019 36
regarded as the best practice model for organising risk and control functions within
the financial services sector43– see box below.
Box: Three lines of Defense
The Three Lines of Defense model distinguishes among three groups (or lines)
involved in effective controls and risk management:
Functions that own and manage risks: as the first line of defense,
operational management is responsible for maintaining effective internal
controls and for executing risk and control procedures on a day-to-day basis.
Functions that oversee risks and control: The specific functions will vary by
organization and industry, but typical functions in this second line of defense
include a risk management function (and/or committee); a compliance function
reporting directly to senior management or governing body; and a
controllership function that monitors financial risks and financial reporting
issues.
Functions that provide independent assurance: this role is performed by
an internal audit function that provides assurance on the effectiveness of
governance, risk management, and internal controls, including the manner in
which the first and second lines of defense achieve risk management and
control objectives.
Finally, the study examined the following aspects of transparency:
Transparency towards clients: the fund manager should provide total cost
incurred by the client for their services, both asset management fees as well as
transactions costs. For other reporting MiFID requires that fund managers
provide clients with portfolio information – valuation and composition;
performance; income; and any security related external actions, for example
corporate mergers, successor events or redemption announcements.
Transparency towards the general public: as public institutions, both the
European Commission and the EIB should provide the public with basic
43 Institute of Internal Auditors (2013) The Three Lines of Defense in Effective Risk Management and Control, position paper.
Assessing the advantages and disadvantages of entrusting the financial management
of the assets of the Common Provisioning Fund to the Commission, the EIB, or a
combination of the two
December, 2019 37
information on the costs/ fees of the service as well as risk and performance
data related to the management of EU assets.
4.2.1 European Commission
4.2.1.1 Lines of accountability
The Director of ECFIN-L is the Authorising officer by sub-delegation44 for ECFIN’s asset
management activities. He is accountable to the ECFIN DDG/DG who in turn is
accountable to the College of Commissioners, which in turn is accountable to the
European Parliament and the Council (see Figure 5).
4.2.1.2 Compliance and control
The control function in ECFIN is placed independently from ECFIN L in Directorate R,
sector R.1.002, to ensure segregation of duties and is based on the three-lines-of-
defence model:
The first line of defence: operational management;
The second line of defence: the various risk control and compliance oversight
functions established by management (the Financial Risk Management sector,
the Compliance Officer, the Internal Control sector R.1.002 and the Internal
Control Management Group (ICMG) chaired by the Risk Management and
Internal Control Coordinator (RMIC) who is Director R);
The third line of defence: independent (re-)assurance by auditors notably the
Internal Audit Service and the European Court of Auditors, as well as external
audit firms45. The EU follows the Single Audit Model, which ensures that there is
efficient co-ordination among the activities of various external and internal
auditors
For the second line of defence, the ICMG mandate is to oversee the proper functioning
of the internal control system in ECFIN (including financial management and the
financial circuits). The compliance officer is part of the ICMG (see box below).
Additionally, ECFIN applies a number of control activities to make sure all its internal
control objectives are met:
Independent ex-post checks are carried out by the ex post controller in R.1.002
to give assurance about DG ECFIN's operations,
The functioning of internal control is reviewed annually by the ICMG.
The list of all functions where there is a risk that jobholders may deliberately
use their decision-making power or influence to gain some personal advantage
are reviewed annually by the ICMG to ascertain whether a rotation would be
warranted. The review encompasses a census of the associated mitigating
measures and an assessment of their effects.
One main accountability document is the annual, publicly available activity
report of the DG which contains a declaration of assurance signed by the
Director- General, covering, inter alia, the sound management of all financial
transactions.
44 The Authorising Officer of the Commission is the College of Commissioners. The College delegates financial management tasks to the Directors-General or Heads of Service who thereby become Authorising Officers by Delegation. These tasks can further be delegated by the Authorising Officer by Delegation to Directors, Heads of Unit and others, who thereby become Authorising Officers by Sub-Delegation. 45 The EU follows the Single Audit Model, with an aim to ensure that there is efficient co-ordination among the activities of various external and internal auditors
Assessing the advantages and disadvantages of entrusting the financial management
of the assets of the Common Provisioning Fund to the Commission, the EIB, or a
combination of the two
December, 2019 38
Box: Role of the Compliance Officer
Transparency of asset management activities
Transparency towards clients
ECFIN provides regular reporting (monthly, quarterly and annual) to mandators
(parent DGs) as per the requirements set out in the various service level agreements.
Public transparency
The annexes to DG ECFIN’s annual activity reports (which are publicly available)
contain a section on the treasury and asset management activities of the DG. It
provides an overview of the market value of each of the portfolios managed by the
DG.
Beyond this, for budgetary guarantees, the Commission produces public reports to EP
and the Council (e.g. in the case of EFSI GF46 or in the case of the GF for external
action47. These reports provide inter alia information on risk and performance,
composition of portfolios and financial statements including information on fees and
charges, etc, and are available for both in-house and outsourced portfolios48.For other
types of portfolios, ECFIN already provides detailed information to the public in the
annexes to its annual activity reports49 and in the consolidated annual accounts of the
European Union50. The transparency could be even further increased, using for
example as a basis the annual EFSI report to the European Parliament and the
Council.
4.2.2 EIB
4.2.2.1 Lines of accountability
The Director of FiTre (Treasury) Department has the ultimate responsibility for the
management of portfolios outsourced by the Commission. He is accountable both to
the European Commission (DG ECFIN) as well as his internal hierarchy at the Bank
46 See COM(2019) 244 final 47 See SWD/2019/314 final 48 In case of outsourced portfolios, the management report on the Fund is based on information submitted by the EIB. 49 See: https://ec.europa.eu/info/publications/annual-activity-report-2018-economic-and-financial-affairs_en 50 See COM(2019) 316 final
In addition to the Compliance Committee, ECFIN has one compliance officer, who works
exclusively on treasury issues. The compliance officer is independent from Directorate L
and reports directly to the Deputy Director General.
The mission of the compliance officer is to monitor compliance with applicable legal and
regulatory requirements and internal policies, and to report senior management on
compliance risks. Regarding the portfolios outsourced to the EIB Group, the Compliance
Officer liaises with EIB compliance.
The compliance officer is supported by and liaises with HR, the Legal Service and
Internal Control where appropriate.
Assessing the advantages and disadvantages of entrusting the financial management
of the assets of the Common Provisioning Fund to the Commission, the EIB, or a
combination of the two
December, 2019 39
(i.e. the Bank’s Management Committee which operates under the authority of the
Bank’s President who is accountable to the Board of Governors51).
4.2.2.2 Compliance and control
The EIB is also organised around the three lines of defence model.
The first line of defense: Finance Directorate;
The second line of defense: Financial Control Directorate, Internal Control and
assertions Division, the Risk Management Directorate and the Office of the Chief
Compliance Officer- OCCO (the Directorate General for Compliance);
The third line of defence: Internal Audit Directorate and external audits.
Additionally, the EIB Compliance and Controls Committee (CCC) is responsible for
strengthening and monitoring the compliance and control framework.
The first line of defense
Within the Finance Directorate, the FI-Compliance team (under the Partnership
Processes & Control Unit) within FI/-/COOR (coordination) Division, is responsible for:
Preparing internal (i.e. at Finance Directorate level) policies and procedures for
the implementation of EIB Compliance related policies (such as AML/CFT,
Sanctions, Non-Compliance Jurisdictions) and Market Conduct Best Banking
Practices (such as Market Abuse);
Monitoring their implementation and exercising relevant control functions within
the first line of defense;
Liaising with DG Compliance (OCCO) when cases are escalated to the second
line of defense;
Liaising with the dedicated team established in the EIB, for the “Know Your
Customer Due Diligence” of the EIB counterparties (including counterparties
established/used for mandate activities).
Moreover, the middle office also performs a control function within the first line of
defence. It inter alia carries out market conformity checks, full trade surveillance and
it also checks the reports produced by the Treasury Risk Unit within the Risk
Management Directorate
The second line of defense
The TPM Unit of the Financial Control Directorate is responsible for the financial
reporting of mandate activities. Each audited financial statement prepared by the Bank
where the relevant mandate agreement is not explicit about the process of approving
the financial statements, is approved by the Management Committee (MC approval by
delegation to the Secretary General and Financial Controller).
Besides on an annual basis, FC prepares a Note to the Management Committee about
the financial situation of the EIB partnerships (including the mandates in scope). The
Note is subsequently also presented to the Board of Directors and the Audit
Committee.
Internal Controls & Assertion Division (FC/-/ICA)’s specific role is to strengthen
the second line of defence in monitoring the appropriate implementation and
51 The Board of Governors comprises Ministers designated by each of the 28 Member States, usually Finance Ministers
Assessing the advantages and disadvantages of entrusting the financial management
of the assets of the Common Provisioning Fund to the Commission, the EIB, or a
combination of the two
December, 2019 40
maintenance of the Internal Control Framework (ICF) across EIB Directorates. As
such, the ICF and its associated maintenance tasks are the primary evidence to
substantiate and legitimise the EIB Senior Management’s annual assertions to its
Management Committee, President and Audit Committee. These assertions, in the
form of representation letters signed-off at Directorate General level supported by ICF
reports, provide reasonable assurance over EIB’s control environment. Assertions on
internal controls are not only an internal EIB requirement, but are also addressed to
the Bank’s mandators (i.e. the EC Delegation Agreements via the annual FAFA
Management Declaration of Assurance reporting obligation) and to External Auditors.
Risk Management
For the assets managed on behalf of Commission, Risk Management officers:
Perform daily compliance checks against the limits set out in the specific AMGs,
per each mandate and report to ECFIN any breach in a timely manner (5
business days)
Analyse the eligibility of the limit requests sent by FI/TRE and decide to open
limits;
Prepare for ECFIN a risk and performance report on a quarterly basis, for each
specific mandates and aggregated, for all the assets managed on behalf of ECFIN.
Annexes detailing the counterpart limits open and positions per ISIN at the end
of each month of the quarter accompany the report.
Analyse the current benchmark methodology and propose revisions to ECFIN
Participate in drafting or revisions of the AMGs;
Analyse market movements and regulatory changes with a potential impact on
the assets managed on behalf of ECFIN and informs ECFIN about such
occasions during the Risk Managers Conference Call
DG Compliance (OCCO)
OCCO represents the Bank’s independent compliance function. It is responsible for
setting compliance policies in relation to AML/CFT, Non Compliant Jurisdictions, EU, UN
and International Sanctions, Market abuse, Reputational risks, ethics, professional
conduct and is also responsible for the identification, assessment, monitoring and
reporting of compliance risks and for the testing of the relevant compliance controls.
In this context OCCO is responsible for the controlling of the implementation of market
abuse, liaising with the Legal Services of the EIB as necessary. It defines internal rules
relating to market sensitive information in line with the Market Abuse Regulation
("Chinese walls") and personal conflicts of interest; OCCO ensures compliance with the
general EIB compliance framework (on ethics, gifts and hospitality; on
whistleblowing);
Third Line of defence Internal Audit
Internal Audit is an independent function which provides a systematic, disciplined
approach to evaluate and improve the effectiveness of the Bank’s governance, risk
management and internal control. It furnishes all levels of the Bank’s management
with analyses, agreed action plans or recommendations, counsel and information
concerning the activities reviewed.
Internal Audit helps the EIB accomplish its objectives by providing management with
the assurance that the Bank is operating properly and efficiently.
Assessing the advantages and disadvantages of entrusting the financial management
of the assets of the Common Provisioning Fund to the Commission, the EIB, or a
combination of the two
December, 2019 41
Audit Committee
The Audit Committee of the EIB, as part of its statutory duties, is required to verify,
and report to the EIB’s Board of Governors, that the activities of the EIB conform to
best banking practice applicable to it.
External audit and controls
Various external checks are conducted to ensure that controls are effective:
The FAFA management declaration of assurance provided annually, subject to
an independent external audit.
Annual external audits conducted by a commercial provider.
Annual review of the external auditors’ working papers performed by the Court
of Auditors.
As regards scrutiny by the ECA, in accordance with Article 287(3) of the TFEU, it can
audit operations under the mandate conferred by the EU on the Bank as well as the
operations managed by the Bank that are guaranteed by the general EU budget. To
this end, a tripartite agreement has been adopted by the Commission, the ECA and
the EIB35. The EIB’s non-EU budget related operations, however, fall outside the scope
of the ECA.
4.2.2.3 Transparency of asset management activities
Transparency towards clients
EIB provides the Commission with ex-ante and ex-post information on the fees charged
by the EIB for its asset management services.
The Commission would want to see a detailed breakdown of the EIB’s internal costs in
order to assess if the Bank fulfils its commitment to be cost neutral on the asset
management services that it provides to the Commission, also considering that, as a
service provider, the EIB does not enter into competition with other asset managers.
So far, the EIB has not provided this information to the Commission or the study team.
The EIB has shared with the study team a general qualitative description of the cost
allocation methodology, but without the concrete and specific calculations
underpinning its application in the case of the EU mandates. In addition, EIB provided
a list of services included within its fees – see section 4.9 on costs.
As far as reporting of risk, performance and other variables is concerned, the EIB fully
complies with the reporting requirements of the Commission – see section 4.4 on
reporting.
Public transparency
The EIB’s annual financial reports (which are publicly available) contain a section on
its own treasury activities. When required, e.g. for the GFEA, EIB also shares the
necessary information feeding into the public management reports published by the
Commission52 on its outsourced portfolios.
52 This role of producing public reports sits with the Commission who has the ultimate responsibility for the management of the assets
Assessing the advantages and disadvantages of entrusting the financial management
of the assets of the Common Provisioning Fund to the Commission, the EIB, or a
combination of the two
December, 2019 42
4.2.3 Conclusion
Both organisations have clear lines of accountability for asset management functions
and apply the three lines of defence model. . -.
Compared to the EIB, the Commission has a Compliance Officer and a Compliance
Committee exclusively dedicated to the asset management activities. This role is
fulfilled by FI-Compliance team at the EIB (the compliance controlling function within
the first line of defence), while the Office of the Chief Compliance Officer (OCCO)
represents the compliance control function as second line of defence and the
Compliance and Control Committee (CCC), strengthens and monitors the compliance
and control framework. The overall risk management and control structures at the
Bank adequately cover its third party mandate activity. Moreover, the FAFA
management declaration of assurance provided annually by the EIB to the Commission
is subject to an independent external audit. Similar declaration of assurance is
provided annually by each Director General, also of ECFIN (such declaration covers all
activities of the DG, including asset management).
Both organisations are subject to external scrutiny by the ECA as far as asset
management of EU resources is concerned, and by private auditors.
In the case of portfolios linked to budgetary guarantees, as required by the relevant
regulations, the Commission provides reports to the EU Parliament and the Council.
For other types of portfolios, ECFIN provides reports in line with the requirements
defined by the mandators. Additionally, publicly available information includes the
annexes to its annual activity reports53 and the consolidated annual accounts of the
European Union54.
Regarding access to cost data for the purpose of this study, the study team could
access more information on the side of the Commission. The EIB on the other hand,
has not provided the Commission or the study team with a detailed breakdown of the
costs incurred by it in managing EU assets.
4.3 Risk Management
Asset Management requires robust risk management to ensure current and future
compliance with the agreed asset management guidelines/ investment strategies. A
dedicated risk management team, independent from the portfolio management team
should develop, set and monitor the risk management strategy and risk management
parameters. The systems used to do so should be robust and based on information
obtained from sources independent from the portfolio management team. In other
words, the risk management team is responsible for the monitoring and management
of both financial and operational risk.
4.3.1 European Commission
ECFIN’s financial risk management is documented in its Financial Risk Management
Policy (14 November 2016), which also applies to outsourced asset management, and
is further specified in the Financial Risk Management Manual. The risk management
activities for outsourced asset management is of limited nature and involve advisory,
monitoring and reporting functions. ECFIN’s risk management functions are carried out
by unit L3 within Directorate ECFIN L, which is separate and operates independently
from ECFIN’s asset management teams (see sections 4.1 and 4.2). ECFIN L3
performs the strategic asset allocation, all risk assessment, risk management, risk
reporting and performance measurement activities, which includes performance
53 See: https://ec.europa.eu/info/publications/annual-activity-report-2018-economic-and-financial-affairs_en 54 See COM(2019) 316 final
Assessing the advantages and disadvantages of entrusting the financial management
of the assets of the Common Provisioning Fund to the Commission, the EIB, or a
combination of the two
December, 2019 43
attribution, analysis of expansion into new asset classes, instruments and currencies
and is responsible for the production of the Financial Risk Management manual.
The Risk Management Strategy is based on the Asset Management Guidelines of each
individual instrument, programme or mandate. It is periodically updated mainly based
on market evolutions. It sets out further details with respect to limits and guidelines
for the portfolios. The Risk Management team prepares the Strategic Asset Allocation
for each portfolio, amongst others based on this Strategy and the limits and guidelines
of each portfolio. As part of this process it produces benchmarks for each portfolio
managed by ECFIN and updates thereof. ECFIN has an active approach to the
production of benchmarks, based on modern portfolio theory:
It obtains implied returns from market prices
It optimises portfolios using a Markowitz based modern portfolio theory
approach
ECFIN’s Financial Risk Management Policy specifies the principles to be applied for the
risk management of:
Market Risk
Interest Rate Risk
FX Risk
Credit spread market risk
Equity risk
Derivative risk
Credit risk
Counterparty risk
Issuer risk
Settlement risk
Liquidity risk
Operational risk
Risk management is responsible for the administration of the Bloomberg AIM and the
Bloomberg Port+ module, as well as for obtaining data and quality control thereof.
Risk management is responsible for assessing these financial risks, controlling the risk
limit process and monitoring them. Front office can resolve breaches in co- operation
with risk management. A review of breaches over 2018 showed no major breaches –
most breaches resulted from passive exposure breaches due to relative valuation
changes.
ECFIN Risk Management reviews observations stemming from risk and performance
reports or limit breach notifications received from EIB related to the AMDS function in
order to identify remedies and minimise risk of recurrences, and, in a few cases, to
make proposals for limit waivers.
The Financial Risk Management Policy describes the roles and responsibilities
regarding financial risk management and details an appropriate allocation of functions
and responsibilities respecting an appropriate segregation of duties.
Assessing the advantages and disadvantages of entrusting the financial management
of the assets of the Common Provisioning Fund to the Commission, the EIB, or a
combination of the two
December, 2019 44
The Risk Management group provides reports to senior management. Annex 4
provides an overview of Risk Management Reports available. In short, the Risk
Management team provides or contributes to the following reports:
Annual report on Management of Off-Budget Operations.
Quarterly Risk Report related to Treasury Activities
Monthly Risk and Performance Reports
Ad-hoc reports, for example to describe market developments and their impact
on the EC portfolio.
The reports are produced in line with the guidelines specified in the Financial Risk
Management Manual and are consistent and clear.
4.3.2 EIB
The EIB performs its risk management activities within the framework of best banking
practices recommended by the Basel Committee on Banking Supervision:
Risk identification: New products are subject to adequate assessment
procedures
Risk assessment: measurement
Risk monitoring: Appropriate systems to monitor risks
Risk control and mitigation: Policies, processes and procedures
The EIB Financial Risk Guidelines, inter alia, specify the principles to be applied for the
risk management of:
Market Risk
Interest Rate Risk
FX Risk
Spread risk
Credit risk on treasury and derivatives
Liquidity risk
Funding liquidity risk
Asset liquidity risk
Asset and collateral reuse
Legal risk
Substitution risk
Margining risk
Settlement risk
Furthermore, specific guidelines are dedicated to the principles to be applied for non-
financial risk, such as:
Credit Risk on lending transactions
Assessing the advantages and disadvantages of entrusting the financial management
of the assets of the Common Provisioning Fund to the Commission, the EIB, or a
combination of the two
December, 2019 45
Operational risk
Model risk (model validation policy)
EIB’s Financial Risk Management procedures for the EC portfolios are described in the
Financial Risk Procedures Manual, Volume2, Extract for Mandates published in January
2018. It is supplemented by the EIB Operational Risk Policy 2014, which focuses on
operational risk.
According to the EIB Front Office Manual (update 2018), Risk Management performs
the role of the second line of defence (with first line of defence being controls
performed by FI services: front office, middle-office and back-office and compliance
function within FI).
The external mandates for EIB are managed distinctly from the other assets managed
by the bank.
Assets are kept separately
All proceeds are for the benefit of the particular fund
There is separate reporting by the units RM//FIN/T&L/TRU, on the following
aspects
Market Risk
Credit Risk
Monitoring and reporting of compliance of other limits as per the asset
management agreements
The procedures describe the relevant risk management processes and allocate
responsibility and accountability. This segregation of responsibility also applies to the
input and maintenance of Wall Street WSS TRM, EIB booking system.
EIB Risk Management provides reports to ECFIN AMDS. Table 14 in annex 4
Reporting, provides an overview of Risk Management Reports available. In short, the
following reports are provided:
Annual Guarantee Fund Risk & Performance report
Quarterly report per portfolio (as well as an aggregated version), which includes
the following elements:
Portfolio overview
Credit Risk overview
Market Risk overview
Performance
Portfolio activity, assets bought/sold and redeemed
Limits and other information
Limit breaches
Late settlement transactions
The performance attribution is different from ECFIN’s internal approach, which is more
quantitative and includes interest rate performance attribution.
Monthly valuations
Risk management produces an internal weekly risk management monitoring
report. Any breaches of limits are provided to AMDS shortly following
Assessing the advantages and disadvantages of entrusting the financial management
of the assets of the Common Provisioning Fund to the Commission, the EIB, or a
combination of the two
December, 2019 46
confirmation. Any breaches during the quarter are provided in the quarterly
reports. Breaches are resolved in co-operation with ECFIN. A review of breaches
over 2018 showed no extraordinary results – most breaches resulted from
rating downgrades, passive exposure breaches due to relative valuation
changes. Furthermore, proactive action was taken on future limit changes due
to policy decisions from the mandator, in cooperation with ECFIN.
Ad-hoc reports as requested by the commission
Separately, the EIB produces several risk management reports for its own internal
processes, such as internal and external audit reports, daily reports, including
performance reconciliation, monthly reports per business line with losses, risk
incidents and management views, as well as monthly operational risk scorecards for
key departments.
The EIB holds minuted monthly Third-Party Assets Management Committee meetings in
which it discusses the tactical approach to the management of Third-Party Assets. A
document containing key statistics on portfolio details (performance, risk analytics,
transactions) and market views (main market drivers) is prepared for each Third-Party
Asset Management Committee. These reports are used for EIB’s internal process,
although a synopsis of the risk management overview is sometimes shared for the
benefit of the monthly update between EIB and ECFIN.
The performance of portfolios managed by EIB is measured against pre-set
benchmarks which are proposed by the EIB and approved by the EC. As identified in
this document, up until earlier this year, the benchmark process used by EIB was not
in line with the process used by ECFIN which made the benchmark information less
valuable for ECFIN. EIB used benchmarks adjusted on the composition and tenor of
the actual portfolio. This has been resolved at the request and in consultation with
ECFIN, with the EIB now using fixed benchmarks since January 2019. There are still
some methodological differences between ECFIN L’s approach (producing benchmarks
based on Modern Portfolio Theory, with return optimized for a given level of market
risk) and EIB’s benchmark approach. However, with the better benchmark alignment,
the quarterly reports provided to ECFIN are concise, consistent with the FAFA and
clear.
4.3.3 Conclusion
Both ECFIN and EIB have properly documented risk management procedures that
meet standards that can be expected for asset managers of their stature. There is a
clear segregation of duties at both institutions and due processes are in place to pre-
empt, identify, control, monitor and report both financial and operational risks.
The Commission has the ability to adequately manage financial risk management
regardless of the in-house / outsource decision. The Commission has more direct
control over the portfolios it manages directly. In case of an outsource decision, the
information provided by EIB does enable the Commission to regularly monitor the
financial risk management of the portfolios and also to have a grasp of any breaches
of portfolio limits.
4.4 Reporting and information management
Good reporting and information management provides relevant information in a clear,
consistent and timely manner to enable decision making and to assess performance.
This section reviews the quality and usefulness of reporting produced and/or used by
the two organisations. A detailed mapping of the reports and indicators available is
included in Annex 4.
Assessing the advantages and disadvantages of entrusting the financial management
of the assets of the Common Provisioning Fund to the Commission, the EIB, or a
combination of the two
December, 2019 47
4.4.1 European Commission
Reporting is performed at regular intervals, on a weekly, monthly, quarterly and
annual basis and, if needed, on an ad-hoc basis. Since the introduction of the weekly
Investment Committee’s meetings and its dashboard, frequency of reporting on risk
and performance has increased. The reporting requirements towards both the
hierarchy and decision-making bodies are seen by the study team as adequate.
Further details on the various reports and their frequency are available in Table 13.
The range of performance and risk indicators in the monthly reports, presented in
Table 15, is seen as adequate. Those cover all necessary aspects in relation to: (i)
Portfolio composition; (ii) Market and Credit Risk Analysis; (iii) Performance; (iv)
Performance Analysis; and (v) Limit breaches. The approach taken by ECFIN with
regards to credit risk analysis and performance analysis is quantitative (based on
stress tests and analysis of return factors).
In addition to the main formal reporting exercise which takes place on a monthly basis,
the various teams / committees produce information to support decision making
processes (e.g. weekly Investment Committee’s meeting dashboard and minutes,
which record discussions on market developments, performance and positioning or the
monthly comprehensive Risk and performance report distributed widely, in ECFIN,
FISMA, BUDG and responsible cabinet).
In parallel with the information produced in-house, day-to-day decision-making by
ECFIN teams is supported by standard market databases and connectors and
(Bloomberg, Reuters), frequent contacts with counterparties and access to the
information produced by external credit agencies. Positions are real-time available on
Bloomberg AIM.
4.4.2 EIB
Table 14 describes the reports that EIB submits to ECFIN in its role as AMDS and to
designated services. ECFIN as AMDS receives55 the main risk and performance report
for portfolios outsourced to the EIB on a quarterly basis56, as per FAFA requirements.
It also receives a report on Portfolio Holdings each month, containing the list of assets
in each respective portfolio and their “marked-to-market” valuations and
corresponding credit ratings, where applicable. Increasing the frequency of the main
quarterly report has already been a topic under discussion but no change has so far
been formally requested (understanding that there would have resource and cost
implications).
In terms of content, there is a range of performance and risk indicators in the
quarterly reports. Those cover the same aspects as the ECFIN reports, namely: (i)
Portfolio composition; (ii) Market and Credit Risk Analysis; (iii) Performance; (iv)
Performance Analysis; and (v) Limit breaches. In addition, EIB reports contain sections
which are useful to add in a context of outsourced assets, namely an historical view of
performance and an overview of the portfolio activity, which enhances reporting on
the outsourced portfolio. To inform its performance analysis, EIB reports performance
for portfolio and benchmark also by asset class, rating and maturity bucket and
complements this by qualitative comments of the asset managers on factors impacting
performance.
55 ECFIN receives its reporting through Client connect, EIB’s secured web reporting tool where the following documents can be retrieved: (i) Assets Management Guidelines, (ii) Investment strategies, (iii) Risk reports, (iv) Audited Financial package. 56 This includes some data being reported for each month of the quarter, including Credit limits and concentration limits per issuer, Concentration limits per issue, Por tfolio by credit rating
Assessing the advantages and disadvantages of entrusting the financial management
of the assets of the Common Provisioning Fund to the Commission, the EIB, or a
combination of the two
December, 2019 48
Now that the new benchmark methodology based on fixed weights is in place, the
relevance of performance indicators in relative terms has increased as compared to the
past. In that context, further new indicators are being considered for addition (e.g.
Interest risk measurement figures in relative terms vis-à-vis the benchmark).
In addition to the formal reporting, there are monthly calls with ECFIN as AMDS
(focused on information exchange). Furthermore, in case of breaches, a notification
would be sent to the European Commission, within 5 business days.
Other than for the AMDS, other reports are produced, or information extracted, for EIB’s
own use. For instance, a document containing key statistics on portfolio details
(performance, risk analytics, transactions) and market views (main market drivers) is
prepared ahead of each Third-Party Asset Management Committee, which takes place
on a monthly basis. On a weekly basis, a summary of breaches, overview of limits and
performance figures for the third-party mandates are included in the weekly report,
which is sent to several recipients within the Bank, including the Head of FI Directorate
and the Head of RM Directorate. To support day-to-day decision-making processes,
further data and data sources are available. EIB teams are, inter alia, using standard
market connectors (Bloomberg, Reuters) and are provided with access to the
information produced by external credit agencies. Additionally, the Middle Office
produces a daily report on all mandate portfolios to PM. A market update, based on
Bloomberg information but containing qualitative information beyond statistics, is also
extracted twice a day to be circulated internally by email to RM, PM and a wider
audience.
4.4.3 Conclusion
From the perspective of the Commission, it has, by definition, information on the
portfolio it manages internally more frequently, quasi instantly, as opposed to the
portfolios it has outsourced. Information on outsourced portfolios is provided mainly
on a quarterly basis, for risk and performance information, and complemented by
report on Portfolio Holdings on a monthly basis. This is in line with the reporting
requirements which have been set out in FAFA but higher frequency reporting (on a
monthly basis) is typical among peers.
Portfolios need to be followed closely. That role of close monitoring on a daily or
instantaneous basis is however by definition outsourced as well to external asset
manager in case of an outsourced portfolio. Given the type of portfolios and the
additional obligations and practices which have been put in place, the existing
arrangements between ECFIN and EIB suffice. That said,
Both parties provide clear and well-structured reports. EIB reports contain information
which is useful in the context of outsourced portfolios Reports on both sides are
equally insightful, even if the information provided and approaches taken inside those
reports is somewhat different (e.g. ECFIN gives a quantitative analysis of return factors
for its performance analysis, including attribution analysis, while the EIB relies on an
analysis of breakdowns of performance data by asset class, rating and bucket
complemented by qualitative comments). Generally, in terms of content / quality of
reporting, no gap has been identified. Indicators which are covered on one side but not
on the other could easily be replicated using existing information (e.g. historical
performance, additional performance indicators and stress tests).
For their own purposes, both asset managers produce - and have access to - current
information at any point in time.
4.5 Technical infrastructure
The study examined the following parameters:
Assessing the advantages and disadvantages of entrusting the financial management
of the assets of the Common Provisioning Fund to the Commission, the EIB, or a
combination of the two
December, 2019 49
IT systems: Technology is a key component of asset management, integral to
many functions including trading, risk management, compliance and client
service. At a very basic level, asset managers require IT systems to facilitate
data management, information processing and the flow of information between
multiple functions internally as well as with external parties. More sophisticated
IT systems include risk analytics and decision support tools. An integrated IT
system can help eliminate redundant data input across multiple systems,
enhance data integrity through shared and transparent information, and
increase operating efficiencies and controls (e.g. through process automation of
time-consuming tasks and by improving the quality of risk management).
Moreover, asset managers rely on high-quality and timely information to, inter
alia, make and execute investment decisions, manage risks and performance.
Front to back integrated IT systems allow asset managers to have: (i) real time
or near real time visibility of operational, performance and risk data; and (ii) a
holistic view across all portfolios and asset classes.
Business continuity plans: Business continuity and disaster recovery plans
should be in place to ensure that asset managers can continue to operate when
external events impact availability of systems, facilities and staff. At a
minimum, plans should ensure the ability to recover staff, technology systems
and business operations in a timeframe that meets business requirements.
Moreover, organisations should test their plans on a regular basis.
Cyber security: Financial services firms are experiencing a growing number of
cybersecurity breaches. Asset managers, therefore, need to invest in
developing and implementing robust cybersecurity policies and measures,
including alignment with industry frameworks (e.g. ISO 27001 and Cyber
Essentials Plus).
This section is based on both institutions’ systems infrastructure landscapes, as
presented to the study team in stand-alone documents and commented on during
interviews. ECFIN’s and EIB’s respective business continuity plans / disaster recovery
plans have also been reviewed.
4.5.1 European Commission
4.5.1.1 IT systems
Until recently, ECFIN was using a system based on SAP’s Treasury Management
module (SAP FSCM-TM). To enhance functionalities57, ECFIN complemented its IT
landscape with Bloomberg AIM in 2018. Bloomberg AIM is an off-the-shelf system
used by many other large asset managers and global multilateral banks and official
institutions58. Bloomberg AIM frequently and automatically gets upgraded.
As part of the above change, the Front Office, Back Office and Risk Management
functions were migrated from SAP to Bloomberg AIM. All transaction-related data are
automatically flowing through the various functions and automatically replicated in
SAP, but only for accounting and for business continuity purposes.
Bloomberg AIM allows for many functionalities, including specific trade entry
restrictions based upon each mandate’s settings. It offers pre-trade limit checks,
meaning that a breaching transaction cannot be submitted as a request to the trading
and execution system.
57 For example, real time update of positions under AIM instead of end of day under the SAP Asset Management module. 58 AIM is used by many professionals including global multilateral banks and official institutions
Assessing the advantages and disadvantages of entrusting the financial management
of the assets of the Common Provisioning Fund to the Commission, the EIB, or a
combination of the two
December, 2019 50
Global performance figures are reported by ECFIN L3 based on SAP. ECFIN uses
Bloomberg Portfolio & Risk Analytics module, PORT+, e.g. for the performance
calculation, benchmark maintenance, performance attribution, and some risk
measures, e.g. Value at Risk. Other risk measures, e.g. CVaR or stress-testing, are
devised internally based on Matlab software.
To ensure the secure transfer of financial instructions (payment instructions,
confirmation, etc.), ECFIN uses the SWIFT network.
4.5.1.2 Back-up facilities
ECFIN recovery time objectives and preventive measures are in line with the Business
Impact Assessment and the Risk Assessment for ECFIN asset management and
borrowing and lending activities.
In practical terms, ECFIN has different business contingency sites. A hot-site is
available in Luxembourg as per EC’s business continuity plan / disaster recovery plan,
which is reviewed at least annually or after significant organisational changes. The site
is fully operationally equipped with hardware and system software to operate SWIFT,
Bloomberg and SAP. Furthermore, effectively ECFIN also has a second hot-site in
Brussels (since the DG is mainly located in Brussels), with full connectivity to
Bloomberg and SAP59.
Concerning IT infrastructure, several Service Level Agreements are in place to ensure
response times of 2-4 hours. Concerning application availability, ECFIN depends on
external service providers like SWIFT and Bloomberg like any other market
participant. For the internal SAP application, the Recovery Time Objective (RTO) is set
to 48 hours, however it only applies if the real-time failover system of SAP (which has
a 2 hours activation window) is not working.
4.5.1.3 Connection with market infrastructure
The EC has a network of counterparties and access to market infrastructure using
central and commercial banks.
4.5.1.4 Cybersecurity policies and procedures
Since ECFIN is part of the centrally-managed IT infrastructure, several different IT
security policies are set. The baseline of all these policies is laid down in Commission
Decision 46/2017 and its implementing rules60, and is based on international
standards and IT security good practices including ISO/IEC 27001, 27002, 27005,
27035.
Furthermore, ECFIN complies with the SWIFT CSP (Customer Security Program).
4.5.2 EIB
4.5.2.1 IT systems
EIB operates on Wallstreet Suite/Finance Kit, used as backbone for trade booking and
payment processing. Several software solutions (package or in-house developed) are
complementing this core package, e.g. Collateral Management Solution from FIS
(former Sungard), Liquidity and Cash Management, Cash and Securities account
reconciliation. Integration is mainly done through a data hub called ION Bus, which
allows real-time event messaging and seamless integration with other systems,
59 Since Bloomberg also acts a SWIFT service provider for ECFIN, SWIFT could be used for such cases (from Brussels), through Bloomberg. 60 The exact references are Implementing Rules for Commission Decision 46/2017 and Implementing Rules for article 6 of Commission Decision 46/2017
Assessing the advantages and disadvantages of entrusting the financial management
of the assets of the Common Provisioning Fund to the Commission, the EIB, or a
combination of the two
December, 2019 51
through API. As of 2016, Finance Kit is used by many central banks across the
world61.
There are regular technical upgrades to the system, which EIB selectively decides to
buy depending on whether it would serve a purpose in the EIB context.
Finance Kit allows for many functionalities, including specific trade entry restrictions
based upon each mandate’s settings. More specifically Finance Kit gives the possibility
to simulate trades, including their impact on credit limits availability but a breaching
transaction can still be submitted as a request to the booking system (and be
accepted given the way the system is currently configured). This is a disadvantage
although not a major weakness given that the front office has the ability to pro-
actively check available limits, directly in Finance Kit, and has the possibility to consult
Risk Management in specific cases pre-trade. Positions are refreshed on a daily basis
and EIB/RM verifies on a daily basis the compliance of the mandate portfolios with
their respective AMGs.
Finance Kit requires new securities to be set-up separately which adds an operational
step to the trade flow. The impact of this is, however, quite limited given the limited
frequency of these events and the semi-automated process required to be followed.
EIB also uses Bloomberg Portfolio & Risk Analytics solution, PORT, for EC portfolios, to
enhance analytical capabilities, in combination with other solutions, e.g. Algorithmics.
EIB uses Oracle PeopleSoft Financials as an accounting system. The accounting IT
environment operates under a straight through processing model including Finance Kit
and therefore it requires very limited manual interventions.
The trade messaging system is SWIFT.
4.5.2.2 Connection with market infrastructure
EIB is fully connected with market infrastructure. EIB for instance has direct access to
TARGET2, a payment system owned and operated by Eurosystem. It also has access
to the Continuous Linked Settlement System (CLS) for FX transactions, to a network
of cash correspondents, custodians and central clearing counterparties. This
connectivity to market infrastructure constitutes an advantage when managing
liquidity and settlement risk. It is however of limited importance in the context of the
CPF, given the envisaged contractual payment times and the different tools which will
be available to honour calls (e.g. the share of cash and cash-like holdings).
4.5.2.3 Back-up facilities
EIB’s Business Continuity Policy, approved by its Management Committee, is based on
the Business Continuity Institute’s Good Practice Guidelines considered to be an
independent body of knowledge for good business continuity practice worldwide.
In practical terms, there is a resilience centre outside Luxembourg City (but within the
borders of Luxembourg), which contains a fully-equipped dealing room and where 10
tests a year are conducted. Concerning application availability, EIB depends on global
players (e.g. SWIFT, Bloomberg or ION), like any other market participant.
The Business Continuity Plan for Finance - Treasury Department clearly identifies
portfolio and third parties’ mandates management as a core activity which has to be
recovered into two hours. It clearly maps all the business continuity requirements
needed for the recovery to happen successfully and on time.
61 Wallstreet Suite has been rolled out across 35 central banks since 1994 according to the press. See: https://www.centralbanking.com/awards/2440200/risk-management-services-provider-of-the-year-wall-street- systems
Assessing the advantages and disadvantages of entrusting the financial management
of the assets of the Common Provisioning Fund to the Commission, the EIB, or a
combination of the two
December, 2019 52
4.5.2.4 Cybersecurity policies and procedures
EIB’s Information Security Policy framework is built upon a set of policies and
supporting documents including an overarching Information Security Policy, and
additional operational supporting Policies, Standards, Guidelines and Procedures. The
overarching Information Security Policy specifically refers to compliance with ISO/IEC
27001: 2013, the best-known standard in the 27000 family providing requirements for
an information security management system (ISMS). Furthermore, EIB’s Internal
Control and Assertions division (FC/-/ICA) together with IT has completed the IT
Internal Control Framework, based on EBA Guidelines on ICT Risk Assessment under
SREP and ISO 27001. The ICT Risk Assessment has been enhanced with FC/ICA’s risk
assessment, including the evaluation of ICT control design adequacy.
The responsibility of verifying that the adequate security controls foreseen in the
relevant frameworks and policies are actually implemented lies within the risk
management function of the EIB (thereby guaranteeing the independence of the
oversight function from the IT department).
Furthermore, EIB complies with the SWIFT CSP (Customer Security Program) and
also, given it participates in TARGET2, the TARGET2-specific security requirements.
4.5.3 Conclusion
Both organisations use major commercial systems, “battle tested’ by others in the
industry, Bloomberg AIM in the case of ECFIN and Finance Kit at the EIB. Both
systems are centralised, front-to-back vendor systems guaranteeing all parts of the
institutions are looking at the same information. They ensure good data flows, close
monitoring and analytical tools for Risk Management, Front Office and Back Office.
They provide the managers with essential and sufficient tools for the execution and
risk management of their portfolios.
The independence of Finance Kit does mean that there is some limited operational
duplication in booking new transactions (i.e. new instruments have to be set up in
Finance Kit, while in Bloomberg they are set up on behalf of the issuer, thus effectively
reducing the risk of manual errors).
By using Bloomberg AIM, the Commission also has the advantage to prevent breaching
transactions from being submitted, as a request to the trading and execution system.
This is an important comparative advantage, but not critical given adequate safeguards
are in place at the EIB (Finance Kit allows simulating trades’ impact on credit limits
availability and EIB/RM verifies on a daily basis the compliance of the mandate
portfolios with their respective AMGs).
Both institutions have access to market infrastructure. EIB’s connectivity to market
infrastructure as a bank could in principle bring value to manage liquidity risk. In the
context of the CPF however, it would in fact be of limited use e.g. given the envisaged
contractual payment times and the different tools which will be available to honour
calls. The Commission, on the other hand, has an industry-typical access to market
infrastructure though the broad network of counterparties, including central and
commercial banks, custodians and other market infrastructure providers.
Both institutions have adequate back-up facilities and cybersecurity policies and
procedures in place, in line with industry best practices.
4.6 Expertise
It is important that an asset management team is adequately staffed. It should also
possess the right set of skills and experience. Opportunities for upgrading skills and
participating in trainings are also essential given the evolving environment in which
teams works. In this section, we analyse whether both institutions are well equipped
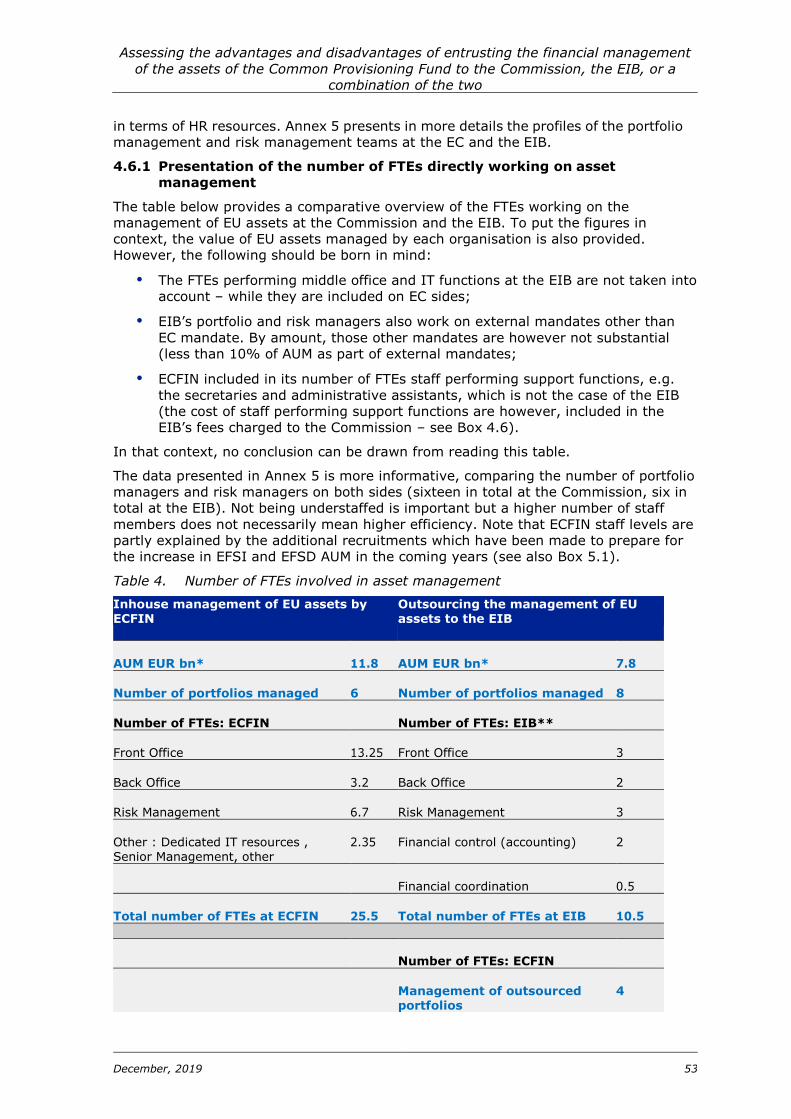
Assessing the advantages and disadvantages of entrusting the financial management
of the assets of the Common Provisioning Fund to the Commission, the EIB, or a
combination of the two
December, 2019 53
in terms of HR resources. Annex 5 presents in more details the profiles of the portfolio
management and risk management teams at the EC and the EIB.
4.6.1 Presentation of the number of FTEs directly working on asset
management
The table below provides a comparative overview of the FTEs working on the
management of EU assets at the Commission and the EIB. To put the figures in
context, the value of EU assets managed by each organisation is also provided.
However, the following should be born in mind:
The FTEs performing middle office and IT functions at the EIB are not taken into
account – while they are included on EC sides;
EIB’s portfolio and risk managers also work on external mandates other than
EC mandate. By amount, those other mandates are however not substantial
(less than 10% of AUM as part of external mandates;
ECFIN included in its number of FTEs staff performing support functions, e.g.
the secretaries and administrative assistants, which is not the case of the EIB
(the cost of staff performing support functions are however, included in the
EIB’s fees charged to the Commission – see Box 4.6).
In that context, no conclusion can be drawn from reading this table.
The data presented in Annex 5 is more informative, comparing the number of portfolio
managers and risk managers on both sides (sixteen in total at the Commission, six in
total at the EIB). Not being understaffed is important but a higher number of staff
members does not necessarily mean higher efficiency. Note that ECFIN staff levels are
partly explained by the additional recruitments which have been made to prepare for
the increase in EFSI and EFSD AUM in the coming years (see also Box 5.1).
Table 4. Number of FTEs involved in asset management
Inhouse management of EU assets by ECFIN
Outsourcing the management of EU assets to the EIB
AUM EUR bn*
11.8
AUM EUR bn*
7.8
Number of portfolios managed
6
Number of portfolios managed
8
Number of FTEs: ECFIN
Number of FTEs: EIB**
Front Office
13.25
Front Office
3
Back Office
3.2
Back Office
2
Risk Management
6.7
Risk Management
3
Other : Dedicated IT resources , Senior Management, other
2.35
Financial control (accounting)
2
Financial coordination
0.5
Total number of FTEs at ECFIN
25.5
Total number of FTEs at EIB
10.5
Number of FTEs: ECFIN
Management of outsourced portfolios
4
Assessing the advantages and disadvantages of entrusting the financial management
of the assets of the Common Provisioning Fund to the Commission, the EIB, or a
combination of the two
December, 2019 54
Source: based on data provided by ECFIN and EIB. *Figures as of 31 December 2018. **Does not include middle office / IT functions
4.6.2 Skills and training opportunities
4.6.2.1 European Commission
The study team reviewed the profile of ECFIN’s asset management teams, who are
highly qualified and experienced. All of the sixteen portfolio and risk managers have
acquired a master or PhD in a relevant domain. Among them, six hold a professional
qualification (e.g. Chartered Financial Analyst (CFA) and/or Financial Risk Manager
(FRM)). They have on average thirteen years of relevant experience, including six
years in the same function. Typical previous workplaces before the European
Commission include commercial banks, investment banks, equity funds, asset
management companies, central banks, corporate treasuries and universities.
ECFIN L staff has access to economics and finance related courses from the internal
training catalogue and the so-called summer school organised each June/July by
ECFIN. For more specialised trainings, staff also has access to conferences and
seminars organised by central banks, investment banks, private asset managers. In
addition, there are specialised group trainings by external trainers. In 2018 for
instance, 9 days of specialised trainings were offered by external qualified trainers,
attended by 20 colleagues each. These covered Credit Risk Modelling (2 days), Risk
Budgeting (2 days), Covered Bonds (1 day), Interest Rate Risk management/Bond
futures (2 days), Financial programming with Python (2 days). For specific needs,
individual external trainings are provided.
4.6.2.2 EIB
The team examined the profile of the FTEs dedicated to external mandates in the
portfolio management team and the risk management team. The teams are made up
in total of six highly qualified experienced staff. They all have relevant academic
degrees (Master or PhD) and four of them have a professional certification (e.g.
Chartered Financial Analyst (CFA) and/or Financial Risk Manager (FRM)). On average,
they have thirteen years of relevant experience, including eight years in the same
function. Prior to joining the EIB, staff has acquired experience with commercial banks,
investment banks, asset management companies, central banks, corporate treasuries
and universities.
EIB’s asset managers have the possibility to benefit from external and internal
trainings and conferences. In 2018 for example, external trainings were organised by
central banks, investment banks, private asset managers and external credit rating
agencies on the following topics management of FX Risk using Derivatives (2 days),
Advanced Corporate Credit Analysis (3 days), Interest Risk Strategies (2 days), Credit
Derivatives (2 days) and Asset Allocation (5 days). In addition, all team members have
the option to highlight any specific individual training needs through their Individual
Development Plan.
4.6.3 Conclusion
The Commission has a higher number of portfolios and risk managers (sixteen versus
six). This is partly driven by the anticipated increase in AUM on ECFIN side (in relation
to EFSI and EFSD). Both institutions have the right mix of skills and experience and
adequate training programmes in place.
4.7 Scalability
In the run up to the launch of the CPF, having scalable systems in place is important
to minimise additional costs for the EU budget. There is also a need to ensure that HR
constraints could easily be filled by additional recruitments and/or skills upgrades. We
cover this assessment in the following section. How well both institutions are equipped
Assessing the advantages and disadvantages of entrusting the financial management
of the assets of the Common Provisioning Fund to the Commission, the EIB, or a
combination of the two
December, 2019 55
to absorb the CPF depends on the characteristics of the CPF itself – whether the CPF
means doing more of the same or means doing radically different activities. Given that
the future design of the CPF is still unknown and for example no formal decisions have
been taken yet as regards the type of assets in which the CPF will invest, the team’s
assessment is based on what is reasonable to expect, as advised by the Steering
Group and spelled out in section 2.4.2. One important and reasonable hypothesis in
that context is for instance that the focus will be on fixed income and that the PGF or
EFSI AMGs constitute a proxy of the CPF AMGs.
Additionally, we also assessed whether from the market perspective there is scope to
accommodate the envisaged increase in EU assets under management. We performed
this analysis only at an aggregate level.
4.7.1 Operational scalability
4.7.1.1 European Commission
At ECFIN, key milestones have been achieved recently in terms of upgrading IT and
governance systems. These changes were made in light of the increase in AUM which
took a new dimension with EFSI. The new portfolio management system, Bloomberg
AIM, is scalable: there is no limit to the size of assets it can manage and no changes
in the system would be required to accommodate an increase in the assets under
management. The governance structure has also been streamlined and the processes
are in place now to handle higher volumes of assets.
In terms of HR resources, ECFIN highlighted that incremental HR needs are not
necessarily directly proportionate to the increase in the assets under management. In
addition, some efficiency gains could be made from the reduction in the number of
portfolios that will take place in parallel to the increase in size of assets under
management. Some of the functions would however have to be reinforced but this
could be made through a reallocation of the staff currently fulfilling AMDS functions.
Note here that even if recruitments were needed, there would be no need to wait for
the organisation of a new recruitment competition for officials, even if no adequate
profile can be found from the list of names of successful candidates from previous
competitions (‘laureates’). Quicker selection procedures, for temporary and contract
staff62, could be used, should the needs be urgent. There is thus no EC-specific issue
related to the speed at which new talents could be recruited – beyond the standard
time needed to recruit and on-board financial specialists.
Besides, given that it is not expected there will be a need to accommodate new asset
classes and instruments (no planned move towards non-rated corporates, Private
Placements or equity), there would be no impediments in terms of skills set.
The EC has the capability to invest in derivatives (currency derivatives) to hedge
currency risk.
The EC has recently been given the responsibility of managing a pooled fund63 and has
developed the relevant infrastructure and expertise to manage internally the valuation
and accounting of shares of the participating mandates, which are the main
particularities specific to a pooled fund.
4.7.1.2 EIB
EIB systems and teams can handle significant increase in assets under management, as
illustrated by the fact that the portfolio of EIB’s own assets (a large portion of which
62 See C(2013) 9049 final and C(2017) 6760 final, respectively, for the exact procedures to be followed. 63 ECFIN has been tasked with managing one pooled fund, combining two small mandates (amounting to 100 million EUR in total) namely the Portfolios of the Local Agents Provident Fund and the Complementary Sickness Insurance Scheme for Local Agents. This fund has been made operational over the course of 2019.
Assessing the advantages and disadvantages of entrusting the financial management
of the assets of the Common Provisioning Fund to the Commission, the EIB, or a
combination of the two
December, 2019 56
consists of instruments with investment horizons below one year64), fluctuates
frequently, from €65bn to 85bn.
More than the size of the portfolios, the limiting factor is the number of portfolios (e.g.
the higher the number of portfolios, the higher the number of limits which need to be
managed in the IT systems, the more reports which need to be produced etc.).
An increase in the size of AUM will still create some additional HR needs as soon as it
involves a higher number of trades (as opposed to larger trade sizes). All functions
can potentially be impacted: front office (carrying out more transactions), middle office
(checking more transactions) and back office (confirming more transactions). No
estimate has been produced especially for the purpose of this study but a general rule
of thumb applied in the current context at the EIB is that every additional EUR 3bn
assets under management equals 1 FTE, across functions.
Furthermore, given that the focus will remain on investment grade fixed income
assets, there would be neither impediments in terms of skills set, nor legal/political
considerations65.
EIB has the capability to invest in derivatives (currency derivatives, interest rates
derivatives), these tools providing some flexibility to hedge currency risk and adjust
the portfolio (i.e. make duration longer or shorter).
The EIB has also experience of managing funds with multi-investors, namely the
Unitary Fund and one pooled fund on behalf of the EC, the CEF Fund. Currently, the
main aspects which are specific to the management of pooled funds (e.g. valuation
and accounting of shares of participating mandates) are not undertaken in-house by
the EIB for cost reasons and/or to have an independent calculation of NAV and
shares66.
4.7.1.3 Conclusion
From the infrastructure point of view, both institutions can handle a large increase in
AUM. While the EIB has a track record of frequently adjusting to fluctuating assets,
ECFIN has, over the recent years, also proven its ability to cope with increased assets
under management and upgraded its systems.
Both institutions see the number of portfolios as the restraining factor, and therefore
rather expect efficiency gains to come with the CPF. CPF’s sheer size would not be a
disruptive factor for the respective teams / functions, especially in a context where the
focus will continue to be on investment grade fixed income assets.
Additional HR needs are expected to be limited67 and manageable by both institutions
given the anticipated shape of the CPF.
EIB is more experienced with currency and interest rates derivatives, which could be
helpful going forward as additional tools to hedge currency risk and adjust the
portfolio, provided that the CPF can use derivatives.
EIB has been managing pooled funds for a longer period of time while the EC is
managing pooled funds since the beginning of 2019. Both organisations have acquired
relevant expertise with pooled funds while relying on different management models:
EIB is outsourcing the tasks, specific to the management of the pooled funds
64 See also section 2.2 65 Legal/political considerations could have arisen should equity investment have been contemplated. 66 Independent calculation of NAV and shares is required in specific cases. 67 Views on rule of thumb applied at the EIB (that every additional EUR 3bn assets under management equals 1 FTE) will be sought at the workshop.
Assessing the advantages and disadvantages of entrusting the financial management
of the assets of the Common Provisioning Fund to the Commission, the EIB, or a
combination of the two
December, 2019 57
(valuation and accounting of shares) while the Commission has developed an in-house
expertise.
4.7.2 Market
Post 2020, the size of EU assets is expected to grow from the current €20bn to €34bn.
Given the size of the market for EU fixed income68 which stands at €15,000bn in May
201969, it is expected the market can absorb the increase in EU assets without a
pressing need to accommodate new asset classes and instruments. Also looking at the
individual asset types, there is scope for ECFIN and/or EIB to buy higher volumes on
the primary market. For instance, European Government bond and bills gross issuance
amounted to close to €600bn in the second quarter of 201870, to be put into
perspective with the overall 10bn of EU assets which are currently invested in
sovereigns, supranational and agencies across ECFIN and EIB.
4.8 Performance
4.8.1 Approach
This section provides an assessment of performance. The study team obtained annual,
monthly and daily71 performance data on the funds managed by the Commission and
the EIB. In the analysis the study team:
Performed basic analysis on the portfolios to see whether there is any
significant short-term performance that cannot be explained by general market
movements and that are not in line with objectives of the portfolio.
Grouped portfolios with similar investment criteria and performed a comparable
analysis of portfolios with similar features for which data is available over a
longer period. The performance of a fixed income portfolio is determined by
many decisions of the portfolio manager, within the limits and guidelines of the
portfolio management agreement and can be studied in a detailed performance
attribution analysis. Following the scope of our analysis we compare similar
portfolios with similar duration profiles.
Compared the general risk measures as provided in the risk reports.
Each fund is guided by asset management guidelines (AMGs). – See Annex 2 for an
overview of legal construct and asset management guidelines.
As per their respective investment guidelines, both managers only invest in Fixed
Income assets, predominantly investment grade sovereigns, supranational, agencies
(together SSA), financials and other corporates. An overview of asset allocation at the
end of Q1 2019 is provided in Table 20.
Both EIB and the EC produce daily performance data and have provided daily, monthly
and annual performance data in as far as available for the benefit of this analysis –
see Table 22 for an overview of the relevant period per portfolio.
68 Concerns debt securities issued by euro area residents in Euros 69 Source: ECB data, available at: https://www.ecb.europa.eu/stats/financial_markets_and_interest_rates/securities_issues/debt_securities/html/inde x.en.html 70 Source: AFME 71 The official data have a monthly periodicity. The study team received monthly official data as of April 2009. The daily data are provided on best efforts basis and are used only for some limited analytical purposes
Assessing the advantages and disadvantages of entrusting the financial management
of the assets of the Common Provisioning Fund to the Commission, the EIB, or a
combination of the two
December, 2019 58
The official data72 for the EC and for the EIB is produced monthly. This corresponds to
the periodicity of official reporting in the EC. The data is reported quarterly from the
EIB to the EC.
Daily data are neither audited nor validated. They are used as a reference for
management purposes and internal checks only and cannot be used as the basis for
official comparison of results. For the purpose of this analysis, we analysed the
difference between monthly performance data based on monthly official numbers as of
April 2009 and calculated using unofficial daily data and did not find differences that are
significant for the purpose of those parts of our analysis where we use daily data.
For the benefit of our analysis we have used the official data up to and including 30
June 2019. An analysis of each separate fund’s performance data together with
comments on each specific fund is provided in the appendix (section A6.5).
4.8.2 Results
4.8.2.1 Analysis of portfolio behaviour
In general, the following observations can be made:
the general objective for the portfolios is that a high degree of security and
stability is maintained over a long period of time. Thus, the funds have a long-
term performance objective. However, most funds could be drawn upon with a
relatively short notice period. We therefore assessed for all portfolios whether
there are any significant short-term movements that cannot be explained. In
our analysis we determined the largest single day and monthly performance
swings over the full period for which data is available.
The largest single day drops over all portfolios are in the order of -0.50%,
which is in line with the objectives.
The largest 30-day drops occurred in the portfolios ECSC and GF managed by
the EC and EIB respectively. For both portfolios these drops occurred during the
November 2011 bond sell-off when Italian yields surpassed 7% and the
associated benchmark went down with a similar order of magnitude.
Large increases can be explained by:
- The Greek bond restructuring in 2012, affecting portfolios managed by both
the EC and EIB. As the relevant benchmarks did not include sub- investment
grade assets, these increases explained a significant outperformance over
the benchmarks.
- Bond market correction in December 2011 following the sell-off in November
2011.
- In conclusion we find that both managers have performance data without
significant unexplainable daily or monthly performance swings.
72 The methodology employed to produce official data produced on both sides is meant to be consistent. The study team was however advised over the course of the study that official data initially provided by the EIB is, for certain mandates, net of certain fees (while data provided by the EC is always gross of fees and costs), thereby creating minor inconsistency concerns. It was not possible within the timeframe of this Study to obtain new data from the EIB in which the way fees are presented would have been fully harmonised with the Commission approach. Indeed, the EIB has provided new gross-of-fees return calculations (on an annual basis) reflecting following fees: treasury management fee, custody fee, income from securities lending, cash account fees. The approach taken however appeared to be not consistent with that of the EC which does not reflect e.g. custody fees. Therefore, that new data was not used for the purpose of this study. The order of magnitude of the inconsistencies across official data have been assessed as being minor by all parties and, as such, monthly official data is presented in this report. The EIB should nevertheless work on resolving these methodological minor issues going forward, in consultation with the Commission.
Assessing the advantages and disadvantages of entrusting the financial management
of the assets of the Common Provisioning Fund to the Commission, the EIB, or a
combination of the two
December, 2019 59
4.8.2.2 Analysis by portfolio grouping
We analysed the performance parameters, grouping portfolios that share certain
criteria based on:
Investment universe
Portfolio guidelines
Period that the portfolios have been in existence
The criteria used for the grouping and the results of the analysis are presented in the
Annex A6.3.
Group I gathered the longest standing portfolios both under direct management of the
EC and of the EIB, sharing comparable investment universe and restrictions.
Group II gathered shorter standing portfolios both under direct management of the EC
and of the EIB, with similar characteristics.
Group III contain portfolios that are not comparable to each other. For completeness
the performance measures are shown, but they should not be compared to other
portfolios.
The following subsections present the results of the performance comparison for the
portfolios with similar features and reference period. It shows the annual return per
portfolio over different time periods up until 30 June 201973 - the monthly standard
deviation of these returns is provided between brackets as a measure of volatility.
Group 1
Table 5. Group 1
Return & (Standard
Deviation)
ECSC-EC RCAM-EC GF-EIB RSFF-EIB
July 2009-2010 5.52% (0.66%) 5.92%
(0.50%)
3.97% (0.57%)
1.89% (0.32%)
July 2010-2011 1.11% (0.43%)
0.68% (0.48%) -0.18% (0.54%) 0.37% (0.22%)
July 2011-2012 4.05% (0.91%) 4.57% (0.69%) 5.68%
(0.92%) 3.59% (0.39%)
July 2012-2013 2.21% (0.51%) 1.82% (0.47%) 2.69% (0.35%) 1.42% (0.30%)
July 2013-2014 2.83%
(0.25%)
2.64% (0.23%) 2.20% (0.17%)
1.00% (0.09%)
July 2014-2015 0.61% (0.41%) 0.25% (0.52%) 0.94% (0.19%) 0.20% (0.06%)
July 2015-2016 3.03% (0.34%) 3.75% (0.34%)
2.32% (0.30%) 2.13% (0.28%)
73 The study team has been provided monthly official data as of April 2009. In general, strategies are finalised in May of each year.
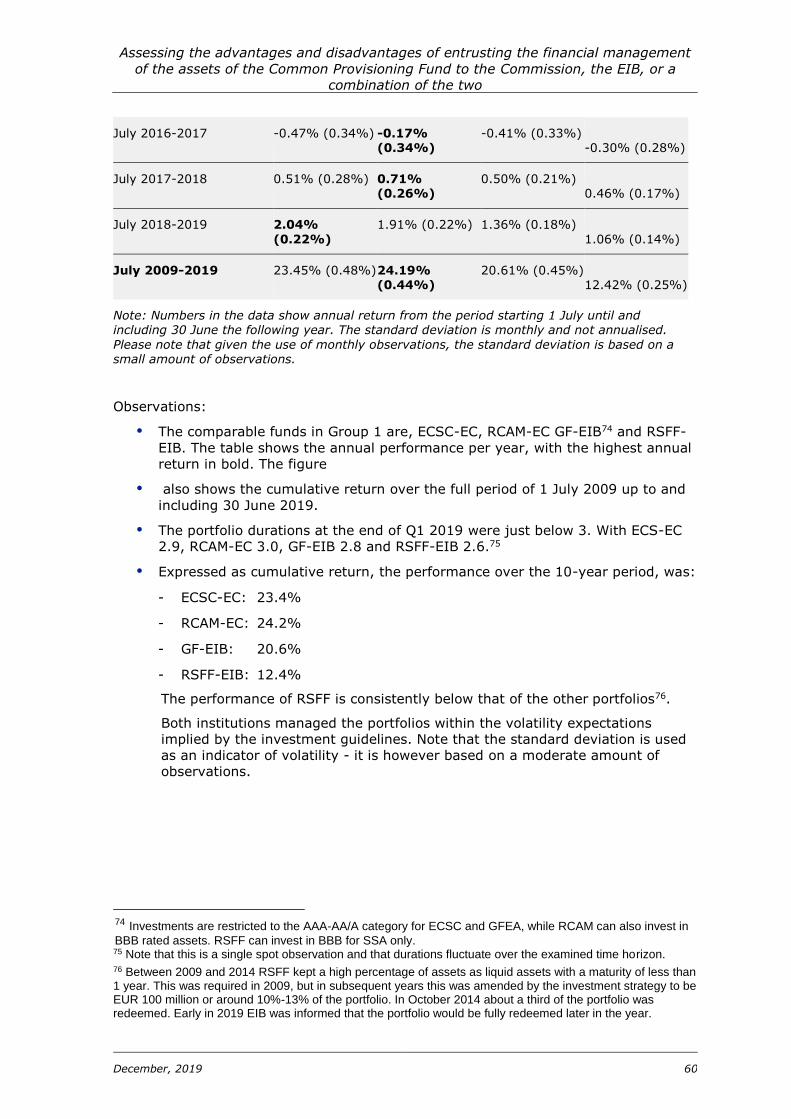
Assessing the advantages and disadvantages of entrusting the financial management
of the assets of the Common Provisioning Fund to the Commission, the EIB, or a
combination of the two
December, 2019 60
July 2016-2017 -0.47% (0.34%) -0.17% (0.34%)
-0.41% (0.33%) -0.30% (0.28%)
July 2017-2018 0.51% (0.28%) 0.71% (0.26%)
0.50% (0.21%) 0.46% (0.17%)
July 2018-2019 2.04%
(0.22%)
1.91% (0.22%) 1.36% (0.18%)
1.06% (0.14%)
July 2009-2019 23.45% (0.48%) 24.19% (0.44%)
20.61% (0.45%) 12.42% (0.25%)
Note: Numbers in the data show annual return from the period starting 1 July until and including 30 June the following year. The standard deviation is monthly and not annualised.
Please note that given the use of monthly observations, the standard deviation is based on a small amount of observations.
Observations:
The comparable funds in Group 1 are, ECSC-EC, RCAM-EC GF-EIB74 and RSFF-
EIB. The table shows the annual performance per year, with the highest annual
return in bold. The figure
also shows the cumulative return over the full period of 1 July 2009 up to and
including 30 June 2019.
The portfolio durations at the end of Q1 2019 were just below 3. With ECS-EC
2.9, RCAM-EC 3.0, GF-EIB 2.8 and RSFF-EIB 2.6.75
Expressed as cumulative return, the performance over the 10-year period, was:
- ECSC-EC: 23.4%
- RCAM-EC: 24.2%
- GF-EIB: 20.6%
- RSFF-EIB: 12.4%
The performance of RSFF is consistently below that of the other portfolios76.
Both institutions managed the portfolios within the volatility expectations
implied by the investment guidelines. Note that the standard deviation is used
as an indicator of volatility - it is however based on a moderate amount of
observations.
74 Investments are restricted to the AAA-AA/A category for ECSC and GFEA, while RCAM can also invest in
BBB rated assets. RSFF can invest in BBB for SSA only. 75 Note that this is a single spot observation and that durations fluctuate over the examined time horizon. 76 Between 2009 and 2014 RSFF kept a high percentage of assets as liquid assets with a maturity of less than 1 year. This was required in 2009, but in subsequent years this was amended by the investment strategy to be EUR 100 million or around 10%-13% of the portfolio. In October 2014 about a third of the portfolio was redeemed. Early in 2019 EIB was informed that the portfolio would be fully redeemed later in the year.
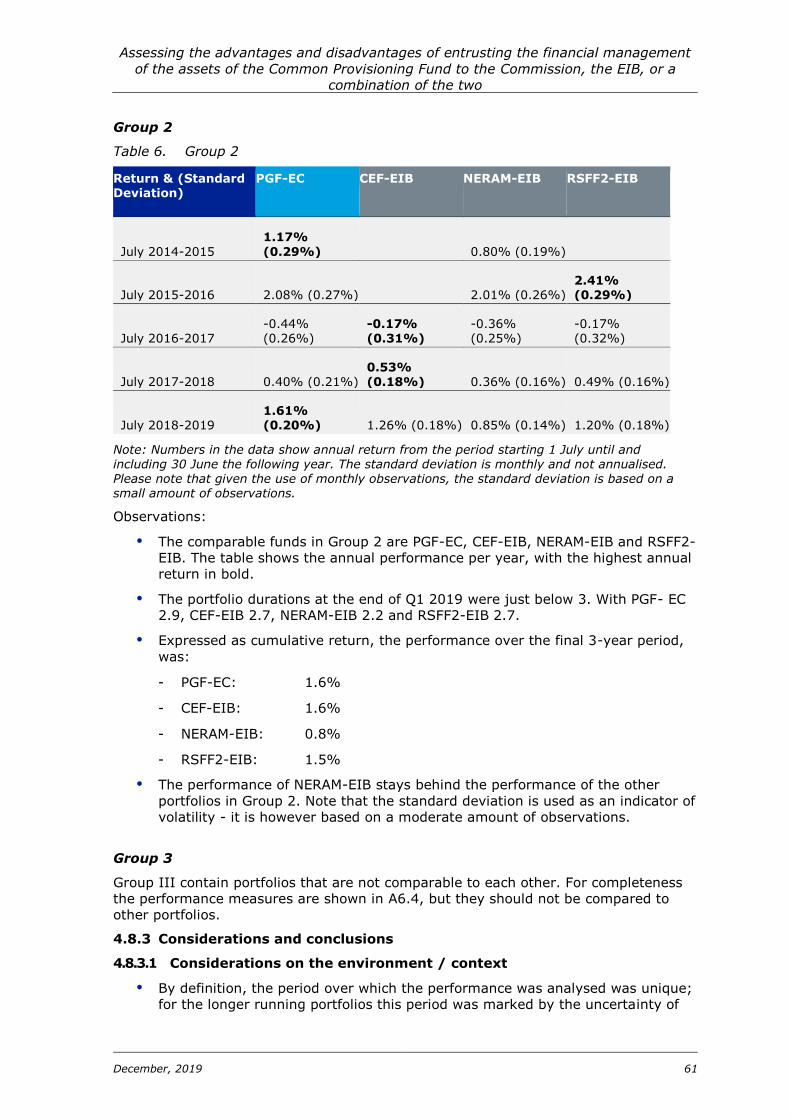
Assessing the advantages and disadvantages of entrusting the financial management
of the assets of the Common Provisioning Fund to the Commission, the EIB, or a
combination of the two
December, 2019 61
Group 2
Table 6. Group 2
Return & (Standard Deviation)
PGF-EC CEF-EIB NERAM-EIB RSFF2-EIB
July 2014-2015
1.17%
(0.29%) 0.80% (0.19%)
July 2015-2016 2.08% (0.27%)
2.01% (0.26%) 2.41% (0.29%)
July 2016-2017 -0.44% (0.26%)
-0.17% (0.31%)
-0.36% (0.25%)
-0.17% (0.32%)
July 2017-2018 0.40% (0.21%)
0.53%
(0.18%) 0.36% (0.16%) 0.49% (0.16%)
July 2018-2019 1.61% (0.20%) 1.26% (0.18%) 0.85% (0.14%) 1.20% (0.18%)
Note: Numbers in the data show annual return from the period starting 1 July until and including 30 June the following year. The standard deviation is monthly and not annualised. Please note that given the use of monthly observations, the standard deviation is based on a small amount of observations.
Observations:
The comparable funds in Group 2 are PGF-EC, CEF-EIB, NERAM-EIB and RSFF2-
EIB. The table shows the annual performance per year, with the highest annual
return in bold.
The portfolio durations at the end of Q1 2019 were just below 3. With PGF- EC
2.9, CEF-EIB 2.7, NERAM-EIB 2.2 and RSFF2-EIB 2.7.
Expressed as cumulative return, the performance over the final 3-year period,
was:
- PGF-EC: 1.6%
- CEF-EIB: 1.6%
- NERAM-EIB: 0.8%
- RSFF2-EIB: 1.5%
The performance of NERAM-EIB stays behind the performance of the other
portfolios in Group 2. Note that the standard deviation is used as an indicator of
volatility - it is however based on a moderate amount of observations.
Group 3
Group III contain portfolios that are not comparable to each other. For completeness
the performance measures are shown in A6.4, but they should not be compared to
other portfolios.
4.8.3 Considerations and conclusions
4.8.3.1 Considerations on the environment / context
By definition, the period over which the performance was analysed was unique;
for the longer running portfolios this period was marked by the uncertainty of
Assessing the advantages and disadvantages of entrusting the financial management
of the assets of the Common Provisioning Fund to the Commission, the EIB, or a
combination of the two
December, 2019 62
the financial crisis, the start of quantitative easing, sovereign crises and
associated rate swings and a currently unprecedented low interest rate
environment. Performance in the past is no guarantee for the future.
The risk tolerance for the portfolios is low – the driving objective for the
portfolios is that a high degree of security and stability is maintained over a
long period of time.
Although both the EC and EIB have used benchmarks for most of their
portfolios for most of the time, the benchmark methodology has not been
comparable until the EIB changed its methodology in January this year in
agreement with ECFIN77. Over or under performance versus the benchmark is
therefore not comparable between the two managers and we have not included
this in our analysis.
4.8.3.2 Conclusion
The performance and the volatilities are in line with the objectives and the risk
tolerance defined in the asset management guidelines and monitored in the risk
reports (see overview in Annex 4). Both institutions adopt a prudent approach
in their asset management activities.
For those comparable portfolios with a longer history, the two Commission-
managed portfolios (ECSC-EC and RCAM-EC produced the highest return
(23.4% and 24.2%, respectively, while GF-EIB and RSFF-EIB produced 20.6%
and 12.4% respectively) over the 10 period up until the end of H1 2019.
The management of all funds, over the periods analysed, would allow to make
funds available when needed.
4.9 Costs
Article 212 of the Financial Regulation requires this study to compare the cost of
inhouse management of EU assets by the Commission against the cost of outsourcing
asset management to the EIB. This section firstly, provides an overview of the cost
information provided by each organisation as background and context for the
subsequent comparisons.
4.9.1 Overview of the information provided by the two institutions
4.9.1.1 European Commission
The Commission disclosed to the study team its own estimates of
its current costs; and
the future costs in January 2021, just at the time of the introduction of the CPF,
as well as the estimation of the costs from 2021 onwards, after the
implementation of the CPF; (iii) the current number of FTEs allocated to each
function (iv) an estimate of how the staffing needs going forward under the
different options (vi) an overview of the overall approach to costings including
costs per FTE.
77 Before the change in benchmark methodology, EIB’s benchmark was based on the composition and tenor of the actual portfolio, this meant that the benchmark was not independent of the portfolio selection and therefore somewhat circular.
Assessing the advantages and disadvantages of entrusting the financial management
of the assets of the Common Provisioning Fund to the Commission, the EIB, or a
combination of the two
December, 2019 63
The Commission produced its estimation based on the rules established by DG BUDG78
and the requirements of the Financial Regulation, as a function of the number of full
time equivalent (FTE)79 working on asset management at ECFIN plus additional costs
which are specifically related to asset management.
The Commission’s estimates are derived as follows:
Cost of asset management = Number of FTEs involved in asset management and
support functions X total cost per FTE+ other costs specifically linked to asset
management
where:
total cost per FTE80 = Average personnel costs per FTE + Average building and
administrative costs per FTE + Average ICT costs per FTE.
Number of FTEs = list of all staff involved in AM / support functions in relation
to AM * ratio representing the share of their time spent on AM / support
functions in relation to AM.
78 Guidance on the charge-back process within the Commission Ares(2014)1634104 - 20/05/2014, Note published by DG BUDG Ref. Ares(2018)6177896 on the average costs to be utilized by the Commission 79 To assist the Commission DGs and services in costing of their services, DG Budget regularly publishes the standard cost of an FTE including and excluding “habillage”( “habillage” covers certain overheads such as buildings, IT equipment, electricity per FTE, etc). The starting point for calculating staff costs is the number of Full Time Equivalents (FTE) allocated to the delivery of the service. The total cost will be obtained in multiplying the FTE total by an annual average cost per FTE. 80 Based on an official internal note emanating from DG BUDG providing average cost per FTE for different categories and broken down into personnel costs, building and administrative costs, and ICT costs. The figure which is provided in the Ares note is frequently updated and is the one to be used consistently for all legislative proposals if and as needed. According to internal rules, the FTE price has to be utilized by the Commission DGs and services in costing of their services.
Assessing the advantages and disadvantages of entrusting the financial management
of the assets of the Common Provisioning Fund to the Commission, the EIB, or a
combination of the two
December, 2019 64
Specific costs linked to asset management (the cost of access to Bloomberg and AIM
port) are separately added on the basis of the actual costs incurred by ECFIN.
EIB
The EIB disclosed to the study team (i) a summary overview of the fees charged over
the period 2008- 2018, (ii) the current fee schedule which will remain applicable until
the FAFA expires (around the introduction of the CPF), (iii) an indicative range for the
fees going forward, (iv) a detailed list of the elements which are included / not included
in the fee schedule, (v) the number of FTEs which are dedicated to the management
of EC portfolios in specific teams, (vi) an overview of its cost allocation methodology.
It is important to note the following:
The EIB makes the assertation that it is cost-based, i.e. that it is operating on a
not-for-profit basis as far as the management of EU portfolios and works on a
full cost recovery approach to pricing its services to the Commission. The level
of fees are thus said to represent the costs actually incurred.
The Commission’s average personnel direct costs per FTE include
Salaries and allowances;
Pension contribution of employees
Expenditure relating to staff recruitment;
Socio-medical infrastructure; and
Training costs.
Average personnel costs are estimated separately by DG BUDG for each of the
following categories of staff: AD, AST, Contract Agent and Seconded National Expert.
The Commission indirect costs per FTE include the average building and administrative
costs :
Rental of buildings and associated costs;
Movable property and associated costs;
Current administrative expenditure; and
Postage and telecommunications
Average ICT costs per FTE comprise the costs of general ICT equipment (e.g.
computers and laptops, printers etc.), external IT consultants IT services and
software. The IT resources directly dedicated to asset management are added to the
total cost.
Overheads
There are costs that cannot be attributed to a specific service such as, management,
internal audit, HR etc. According to internal rules, such costs are to be allocated in
accordance with a reasonable key e.g. proportional to the relative number of FTE staff
directly involved in a delivery of a service. The overheads included in the calculation
provided by the Commission are taking into account all support functions
comprehensively, namely the HR, Legal, Senior Management, Internal Audit,
participation of DG FISMA and DG BUDG in the TMB every 2 months.
Note that some direct HR, IT and administrative costs taken into account as direct costs (e.g. time of the HoU and DHoU linked to recruitment, dedicated IT FTEs in R).
Assessing the advantages and disadvantages of entrusting the financial management
of the assets of the Common Provisioning Fund to the Commission, the EIB, or a
combination of the two
December, 2019 65
However, the study team was not separately provided with an estimate of the
costs incurred by the EIB broken-down by item. The EIB only shared a high-
level overview of its activity-based costing methodology – see Box below. The
EIB’s claim that it is cost-based cannot be independently verified by the study
team in absence of a detailed breakdown of costs.
The Commission own costs cannot be compared to EIB’s internal costs in
absence of this detailed cost information given that the EIB follows an activity
based costing model whereas the Commission’s approach is different (see Box
above).
Box: EIB’s approach to cost allocation
The process is conceptually and technically divided in two phases: Phase 1 pertains to
allocation of Bank-wide operating costs to front-line cost centres (corresponding in
principle to most of Operations, Projects, Legal, Finance, Risk Management,
Transactions Management and Restructuring, SG-External Representation Division
(EER) and SG-Advisory Services front-line divisions) and in Phase 2 costs charged to
front-line cost centres are further allocated to final EIB products and services.
Phase 1 – Allocation to front-line cost centres
At the end of phase 1, the following components of a front-line cost centre’s cost can
be identified:
- Direct costs: front-line cost centre’s own costs which include salaries (EIB
agents, GRADs and Local Agents); staff cost equivalents (Secondees and
Temporary staff); and other direct costs - consultancy, missions,
decentralised training, etc.;
- Allocated direct costs: which include other staff costs (a share of allowances,
performance awards, social expenses etc.) and indirect costs. The latter is
made up of (a) a share of IT costs; (b) a share of facilities management
costs;
(c) a share of costs of non-front-line (and thus typically non-time-recording)
organisational entities within own directorate, e.g. DG’s office, Head of Department
cost centres, co-ordination divisions and other divisions as defined e.g. FI/PRO/BOT;
(d) a share of costs reported by cost centres belonging to the Corporate Support
category (which include full costs of Corporate Services (excl. IT and FM), SG (excl.
EER & Advisory Services), Financial Control, Inspectorate General, OCCO and part of
Legal- Corporate.
Phase 2 – Allocation of costs to final EIB products and services
Time records77drive the allocation of each and every front-line cost centre’s costs to
final EIB products and services81 . Project direct costs are costs allocated directly to
final EIB products and services in relation to which they had been originally incurred
on the basis of product IDs indicated directly in General Ledger.
4.9.1.2 Conclusion on the comparability and usefulness of the information
provided
In absence of detailed breakdown of costs from the EIB, the assessment against the
cost criterion has therefore been conducted as follows:
81 EIB clarified that it keeps timesheets per se only in relation to the Cotonou mandate which is outside the scope of this exercise. Lighter time records are used for other mandates, which permit to separate time spent at trainings for instance and are used as a basis for the production of its fee schedule.
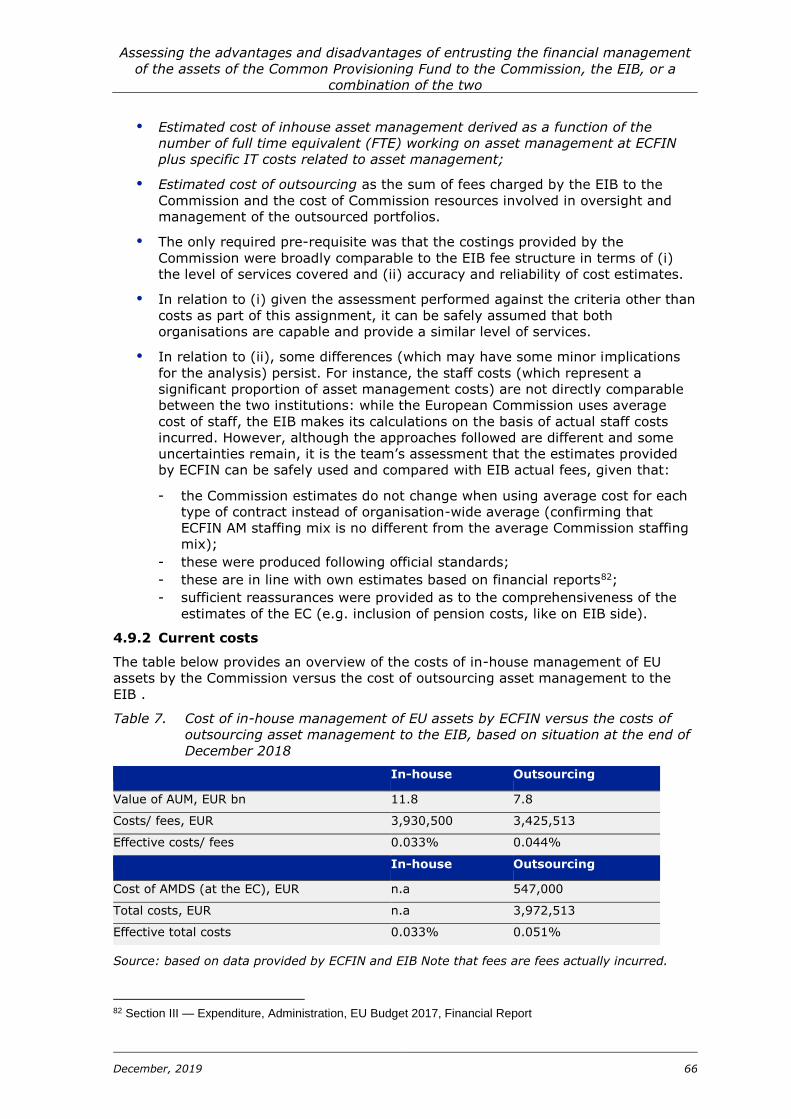
Assessing the advantages and disadvantages of entrusting the financial management
of the assets of the Common Provisioning Fund to the Commission, the EIB, or a
combination of the two
December, 2019 66
Estimated cost of inhouse asset management derived as a function of the
number of full time equivalent (FTE) working on asset management at ECFIN
plus specific IT costs related to asset management;
Estimated cost of outsourcing as the sum of fees charged by the EIB to the
Commission and the cost of Commission resources involved in oversight and
management of the outsourced portfolios.
The only required pre-requisite was that the costings provided by the
Commission were broadly comparable to the EIB fee structure in terms of (i)
the level of services covered and (ii) accuracy and reliability of cost estimates.
In relation to (i) given the assessment performed against the criteria other than
costs as part of this assignment, it can be safely assumed that both
organisations are capable and provide a similar level of services.
In relation to (ii), some differences (which may have some minor implications
for the analysis) persist. For instance, the staff costs (which represent a
significant proportion of asset management costs) are not directly comparable
between the two institutions: while the European Commission uses average
cost of staff, the EIB makes its calculations on the basis of actual staff costs
incurred. However, although the approaches followed are different and some
uncertainties remain, it is the team’s assessment that the estimates provided
by ECFIN can be safely used and compared with EIB actual fees, given that:
- the Commission estimates do not change when using average cost for each
type of contract instead of organisation-wide average (confirming that
ECFIN AM staffing mix is no different from the average Commission staffing
mix);
- these were produced following official standards;
- these are in line with own estimates based on financial reports82;
- sufficient reassurances were provided as to the comprehensiveness of the
estimates of the EC (e.g. inclusion of pension costs, like on EIB side).
4.9.2 Current costs
The table below provides an overview of the costs of in-house management of EU
assets by the Commission versus the cost of outsourcing asset management to the
EIB .
Table 7. Cost of in-house management of EU assets by ECFIN versus the costs of
outsourcing asset management to the EIB, based on situation at the end of
December 2018
In-house Outsourcing
Value of AUM, EUR bn 11.8 7.8
Costs/ fees, EUR 3,930,500 3,425,513
Effective costs/ fees 0.033% 0.044%
In-house Outsourcing
Cost of AMDS (at the EC), EUR n.a 547,000
Total costs, EUR n.a 3,972,513
Effective total costs 0.033% 0.051%
Source: based on data provided by ECFIN and EIB Note that fees are fees actually incurred.
82 Section III — Expenditure, Administration, EU Budget 2017, Financial Report
Assessing the advantages and disadvantages of entrusting the financial management
of the assets of the Common Provisioning Fund to the Commission, the EIB, or a
combination of the two
December, 2019 67
Costs are rounded estimates provided by the Commission on best efforts basis. These are of indicative nature, due to the uncertainties linked to the CPF design and implementation. The sensitivity of the estimate to the exact number of FTEs is low: if one FTE is added the current cost of the Commission would change from 3,3 bps to 3,4 bps.
4.10 Synergies
Against a backdrop where the EU budget will be exposed to larger contingent liabilities
(arising from operations under InvestEU/NDICI), there will be an increased focus on
liability management in the future. The way in which the CPF assets (i.e. the capital
provisions for these guarantees) will be managed will increasingly be driven by the
need to ensure a stable and predictable capital base for supporting the guaranteed
investment. One of the relevant questions in this context is whether it would be more
optimal for the same organisation to manage both the liabilities (i.e. the lending
operations) and the assets or, whether a split of the two functions would yield more
advantages. In this section we explore the potential synergies between asset
management and related activities of each institution: (i) for the Commission looking
at synergies with the management of the EU guarantee; and (ii) for the EIB, looking
at advantages that could arise from having the same institution in charge of the
lending and the asset management activities.
We also explore the potential synergies of asset management activities with the wider
resources, activities and capabilities of each organisation.
4.10.1 Synergies between AM activities and other responsibilities
4.10.1.1 European Commission (and synergies with the management of the EU
guarantee)
For portfolios linked to budgetary guarantees, in any case, regardless of whether asset
management is done in-house or outsourced, the European Commission retains the
responsibility for the provisioning of the EU guarantee and the setting the provisioning
rate i.e. the percentage of the EU Guarantee that is required to be held as a buffer in
the Guarantee Fund. Through this work, the Commission has an intricate
understanding of the risk profile of the operations and the cash flow estimates. This
does however not constitute a comparative informational advantage for the portfolio
asset management function given that this knowledge is based on inputs provided by
the implementing partners83.
For the CPF, which involves a multitude of partners, the Commission will however
become an aggregating hub and benefit more from informational advantage in the
sense that due to confidentiality issues, it becomes the natural receiver / aggregator
of the information coming from the various implementing partners (who could not be
expected to share similar kind of information with the EIB).This informational
advantage has an important role when considering the significant resources of the CPF
and the need to swiftly adapt the assets to the liabilities, the Commission being both
aggregator and manager of contingent liabilities.
4.10.1.2 EIB (and synergies with the operational lending activities)
As explained in the introductory section, the use of financial instruments and
budgetary guarantees has taken on a new dimension under the 2014-2020 MFF84.
Thus far, on the implementation side, the EIB has been the sole entrusted entity of
83 The provisioning rate calculated for EFSI is based on in-house credit portfolio model created by DG ECFIN, but the model inputs and the vast majority of parameters are provided by the EIB and the other implementing partners. See ICF (2018) Independent Evaluation of the EFSI Regulation. (page 104-105) 84 Sixteen fully provisioned and centrally managed financial instruments as well the European Fund for Strategic Investments based on a budgetary guarantee have been set up.
Assessing the advantages and disadvantages of entrusting the financial management
of the assets of the Common Provisioning Fund to the Commission, the EIB, or a
combination of the two
December, 2019 68
the EC. For the first time as part of EFSI Regulation, the co-legislators decided to
assign the asset management of the EFSI Guarantee Fund to the Commission, while
the implementation of the budgetary guarantee was mandated to the EIB. The study
team examined if this created any issues with respect to management of assets and,
specifically, the objective of meeting calls in a timely manner. There is for now a limited
track record85 of answering to guarantee calls under EFSI, which limits our ability to
judge whether the arrangements are appropriate from that point of view.
It is however our assessment that splitting AM and operational lending activities does
not create inefficiencies for the following reasons:
As per the FAFA agreement, EIB has the obligation to provide the EC with cash
flow projections in relation to the EU contribution if and as required 86;
In case AM and operational lending activities are not split but rather all sit
within the EIB. EIB portfolio Managers, benefiting from integrated systems, can
get cash management information on a daily basis as well as intraday to take
position and manage liquidity or settlement risk, which is an advantage (e.g.
anticipating investments and avoiding leaving cash in accounts in current
negative conditions or avoiding re-investing cash maturing in T+3, T+5 only to
liquidate the position immediately taking a mark-to-market risk). However,
contractual payment times are such87 that the benefit of EIB’s informational
advantage (linked to access to instantaneous information) brings limited added
value. Besides, even if the EIB manages both the assets and operations, the
Commission needs to be involved in case of guarantee calls since it manages
the EU Guarantee (e.g. it needs to receive news on calls)
In addition, there is one feasibility argument. Going forward, the EIB will no longer be
the sole implementing partner on the operation sides, excluding the possibility to
delegate to the EIB as part of the same package 100% of the lending and 100% of the
corresponding asset management. In that new context, there will be a need to create
a level playing field across implementing partners and due to confidentiality issues,
other implementing partners cannot be expected to share cash-flow information with
the EIB. The cash-flow information, at least the one coming from the other
implementing partners, will have to be centralised at the Commission level.
4.10.2 Synergies with the wider resources and capabilities of each institution
4.10.2.1 European Commission
Potential synergies lie with the production of macroeconomic, financial information by
other teams (e.g. other directorates from ECFIN produce macro-economic research
and forecasts on macroeconomic issues, some of EC staff also provide advice to the
Member States and/or involved in bank restructuring taskforce in cooperation with the
single resolution board). The use of such information for asset management purposes is
however, largely restricted if non-public, to avoid any risk of insider trading. The
analytical frameworks and models do provide a solid basis for the research work and
85 Just one call has been made as of mid-2019. It has been honoured ahead of the contractual payment time (set at 20 business days) 86 Article 7.2 reads that “the Bank shall provide to the Commission forecasts for the financial year for disbursements or other utilisation of the EU Contribution on an annual or semi-annual basis or more frequently as set out in the Delegation Agreement. These duly substantiated disbursement forecasts shall include applicable management fees.” 87 An overview of contractual payment time is available in the Annex 1. Overall, there is quite some time available to answer the calls. In many cases, a specific number of days is not specified but expectations are that it is quickly met. “Quickly met” is a subjective term but it could mean that efforts need to be made to pay within a reasonable timeframe, i.e. a timeframe which can be justified by a willing and active party.
Assessing the advantages and disadvantages of entrusting the financial management
of the assets of the Common Provisioning Fund to the Commission, the EIB, or a
combination of the two
December, 2019 69
there are potential synergies e.g. when DG FISMA colleagues participate in the TMB
meetings to provide high-level insights into financial market developments.
4.10.2.2 EIB
The EIB’s asset management activities are inserted within the Bank’s wider activities.
The advantages which come with being a bank are however rather small and not
decisive for asset management activities. There are many independent asset
managers in Europe who do not depend on banking groups, especially in certain
markets (e.g. in the UK or France where 65-67% of asset managers are
independent88).
For example, the fact that the EIB has a strong expertise in repos and reverse repos
could be important in a crisis situation to avoid distress/ fire sale of assets, but it is
not a differentiating factor as the Commission also has access to repo lines, via the
EIB but also via private sector banks. That said, it is understood that there is a risk
that EIB repo lines are no longer available to the Commission for asset management
purposes in future in case the EIB stops managing EU assets.
According to the EIB, the CPF could also benefit from its existing counterparty
relationships and legal documentation (the EIB currently has more than 50 active
GMRAs). Current AMGs of the Commission portfolios do not allow reinvestment of cash
received in repo transactions, but if that were to be permitted by the AMGs of the CPF,
it could have a marginal impact on performance of the order of 0.5bp of revenue on a
portfolio on an annual basis, depending on the nature of securities (asset class, rating,
etc.) used as collateral.
The EIB also has teams which carry out the necessary economic or financial
background studies and produce internal ratings. Since the EIB implements an
advanced internal ratings based model for CRR, it produces internal ratings for each
counterpart including treasury counterparts. This however, by definition does not bring
advantages in the case of sovereigns, supranational, agencies (together SSA)
investments 89 and can only play a role at the margin on some occasions to help
mitigate downside risks (in instances where EIB portfolio managers are more prudent
thanks to the existence of internal ratings).
4.10.3 Conclusions
There is no configuration that allows all activity to be carried out in-house: the
Commission has, in any case, to rely on implementing partners on the operational side
(for implementing the financial instruments and budgetary guarantees), while retaining
liability management responsibility (for budgetary guarantees). This means that, in
any case, information will need to be shared with third parties.
The fact that the EU is the ultimate guarantor of the operations does not make it
materially better placed to manage the assets. Similarly, the need to avoid splitting
asset management and operations is not materially relevant given the contractual
payment times, the nature of the investments made and the obligation to share cash
flow projections across organisations. In addition, going forward, given the increase in
the number of implementing partners on the lending side, it will not be possible to
task the EIB with 100% of the asset management. The EIB would not be well placed
to collect cash- flow information from other implementing partners.
The aspects where there are synergies at the EIB (in relation to repos, internal ratings)
are not decisive for the management of the assets of the CPF. No material synergies
88 EFAMA, 2017. Asset Management in Europe, 9th Edition Facts and figures 89 EIB does not produce internal ratings for Member States (given EIB’s shareholding structure).
Assessing the advantages and disadvantages of entrusting the financial management
of the assets of the Common Provisioning Fund to the Commission, the EIB, or a
combination of the two
December, 2019 70
with the Commission’s production of macroeconomic, financial information are to be
highlighted.
5 Description and analysis of options and scenarios
5.1 Description of the options and scenarios
This section provides an outline and analysis of the three potential options for
management of the assets of the Common Provisioning Fund (CPF) 2021 onwards.
These are as follows:
Option 1: The assets of the CPF are managed by the European Commission;
Option 2: The management of the assets of the CPF is outsourced to the EIB,
but the Commission retains overall responsibility and oversight;
Option 3: The asset management of the CPF is split between the Commission
and the EIB. The two organisations will however, manage the assets of the CPF
under a single set of Asset Management Guidelines and using the same
benchmark.
For each option, two scenarios have been developed:
Scenario A: legacy portfolios continue to exist alongside the CPF until they are
wound down;
Scenario B: legacy portfolios are folded in within the CPF.
For ease of reference, the box below provides an overview of the legacy portfolios as
of January 2021.
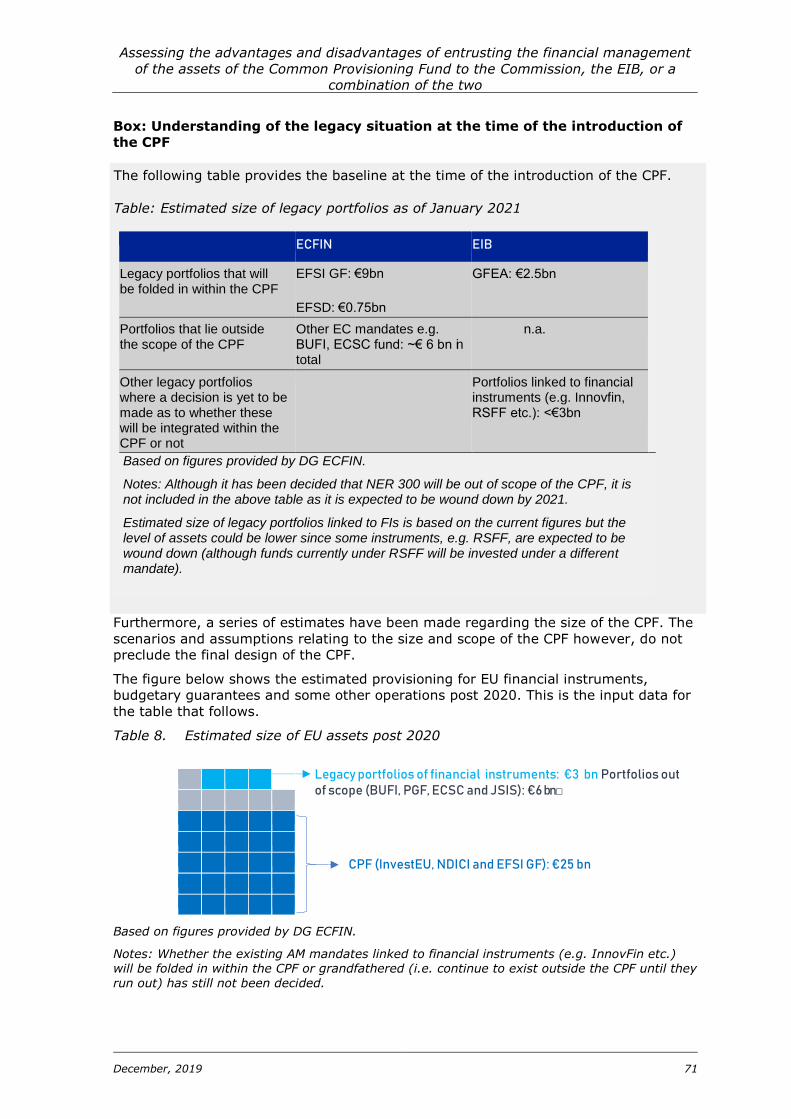
Assessing the advantages and disadvantages of entrusting the financial management
of the assets of the Common Provisioning Fund to the Commission, the EIB, or a
combination of the two
December, 2019 71
Box: Understanding of the legacy situation at the time of the introduction of
the CPF
Furthermore, a series of estimates have been made regarding the size of the CPF. The
scenarios and assumptions relating to the size and scope of the CPF however, do not
preclude the final design of the CPF.
The figure below shows the estimated provisioning for EU financial instruments,
budgetary guarantees and some other operations post 2020. This is the input data for
the table that follows.
Table 8. Estimated size of EU assets post 2020
Legacy portfolios of financial instruments: €3 bn Portfolios out of scope (BUFI, PGF, ECSC and JSIS): €6 bn□
CPF (InvestEU, NDICI and EFSI GF): €25 bn
Based on figures provided by DG ECFIN.
Notes: Whether the existing AM mandates linked to financial instruments (e.g. InnovFin etc.) will be folded in within the CPF or grandfathered (i.e. continue to exist outside the CPF until they
run out) has still not been decided.
The following table provides the baseline at the time of the introduction of the CPF.
Table: Estimated size of legacy portfolios as of January 2021
ECFIN EIB
Legacy portfolios that will be folded in within the CPF
EFSI GF: €9bn
EFSD: €0.75bn
GFEA: €2.5bn
Portfolios that lie outside the scope of the CPF
Other EC mandates e.g. BUFI, ECSC fund: ~€ 6 bn in total
n.a.
Other legacy portfolios where a decision is yet to be made as to whether these will be integrated within the CPF or not
Portfolios linked to financial instruments (e.g. Innovfin, RSFF etc.): <€3bn
Based on figures provided by DG ECFIN.
Notes: Although it has been decided that NER 300 will be out of scope of the CPF, it is not included in the above table as it is expected to be wound down by 2021.
Estimated size of legacy portfolios linked to FIs is based on the current figures but the level of assets could be lower since some instruments, e.g. RSFF, are expected to be wound down (although funds currently under RSFF will be invested under a different mandate).
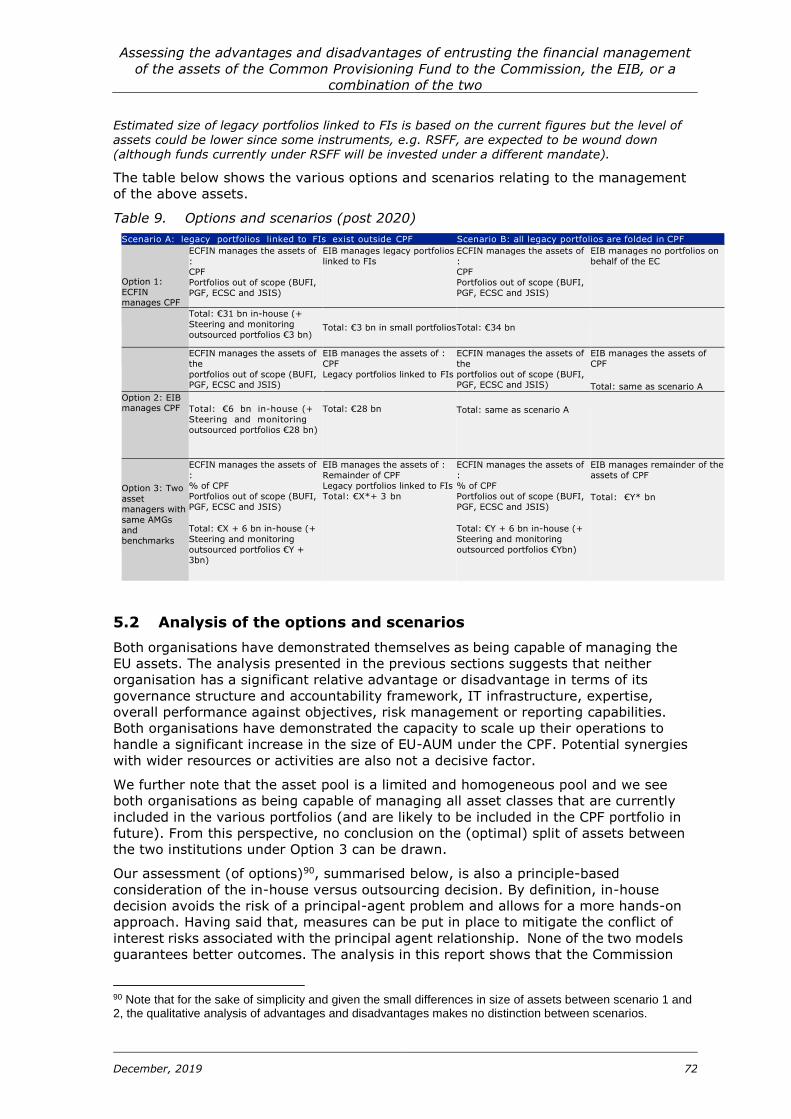
Assessing the advantages and disadvantages of entrusting the financial management
of the assets of the Common Provisioning Fund to the Commission, the EIB, or a
combination of the two
December, 2019 72
Estimated size of legacy portfolios linked to FIs is based on the current figures but the level of assets could be lower since some instruments, e.g. RSFF, are expected to be wound down (although funds currently under RSFF will be invested under a different mandate).
The table below shows the various options and scenarios relating to the management
of the above assets.
Table 9. Options and scenarios (post 2020)
Scenario A: legacy portfolios linked to FIs exist outside CPF Scenario B: all legacy portfolios are folded in CPF
Option 1:
ECFIN manages CPF
ECFIN manages the assets of
:
CPF
Portfolios out of scope (BUFI,
PGF, ECSC and JSIS)
EIB manages legacy portfolios
linked to FIs
ECFIN manages the assets of
:
CPF
Portfolios out of scope (BUFI,
PGF, ECSC and JSIS)
EIB manages no portfolios on
behalf of the EC
Total: €31 bn in-house (+
Steering and monitoring
outsourced portfolios €3 bn)
Total: €3 bn in small portfolios
Total: €34 bn
ECFIN manages the assets of
the
portfolios out of scope (BUFI, PGF, ECSC and JSIS)
EIB manages the assets of :
CPF
Legacy portfolios linked to FIs
ECFIN manages the assets of
the
portfolios out of scope (BUFI, PGF, ECSC and JSIS)
EIB manages the assets of
CPF
Total: same as scenario A
Option 2: EIB manages CPF
Total: €6 bn in-house (+
Steering and monitoring
outsourced portfolios €28 bn)
Total: €28 bn
Total: same as scenario A
Option 3: Two
asset
managers with
same AMGs
and benchmarks
ECFIN manages the assets of
:
% of CPF
Portfolios out of scope (BUFI,
PGF, ECSC and JSIS)
Total: €X + 6 bn in-house (+
Steering and monitoring
outsourced portfolios €Y +
3bn)
EIB manages the assets of :
Remainder of CPF
Legacy portfolios linked to FIs
Total: €X*+ 3 bn
ECFIN manages the assets of
:
% of CPF
Portfolios out of scope (BUFI,
PGF, ECSC and JSIS)
Total: €Y + 6 bn in-house (+
Steering and monitoring
outsourced portfolios €Ybn)
EIB manages remainder of the
assets of CPF
Total: €Y* bn
5.2 Analysis of the options and scenarios
Both organisations have demonstrated themselves as being capable of managing the
EU assets. The analysis presented in the previous sections suggests that neither
organisation has a significant relative advantage or disadvantage in terms of its
governance structure and accountability framework, IT infrastructure, expertise,
overall performance against objectives, risk management or reporting capabilities.
Both organisations have demonstrated the capacity to scale up their operations to
handle a significant increase in the size of EU-AUM under the CPF. Potential synergies
with wider resources or activities are also not a decisive factor.
We further note that the asset pool is a limited and homogeneous pool and we see
both organisations as being capable of managing all asset classes that are currently
included in the various portfolios (and are likely to be included in the CPF portfolio in
future). From this perspective, no conclusion on the (optimal) split of assets between
the two institutions under Option 3 can be drawn.
Our assessment (of options)90, summarised below, is also a principle-based
consideration of the in-house versus outsourcing decision. By definition, in-house
decision avoids the risk of a principal-agent problem and allows for a more hands-on
approach. Having said that, measures can be put in place to mitigate the conflict of
interest risks associated with the principal agent relationship. None of the two models
guarantees better outcomes. The analysis in this report shows that the Commission
90 Note that for the sake of simplicity and given the small differences in size of assets between scenario 1 and 2, the qualitative analysis of advantages and disadvantages makes no distinction between scenarios.
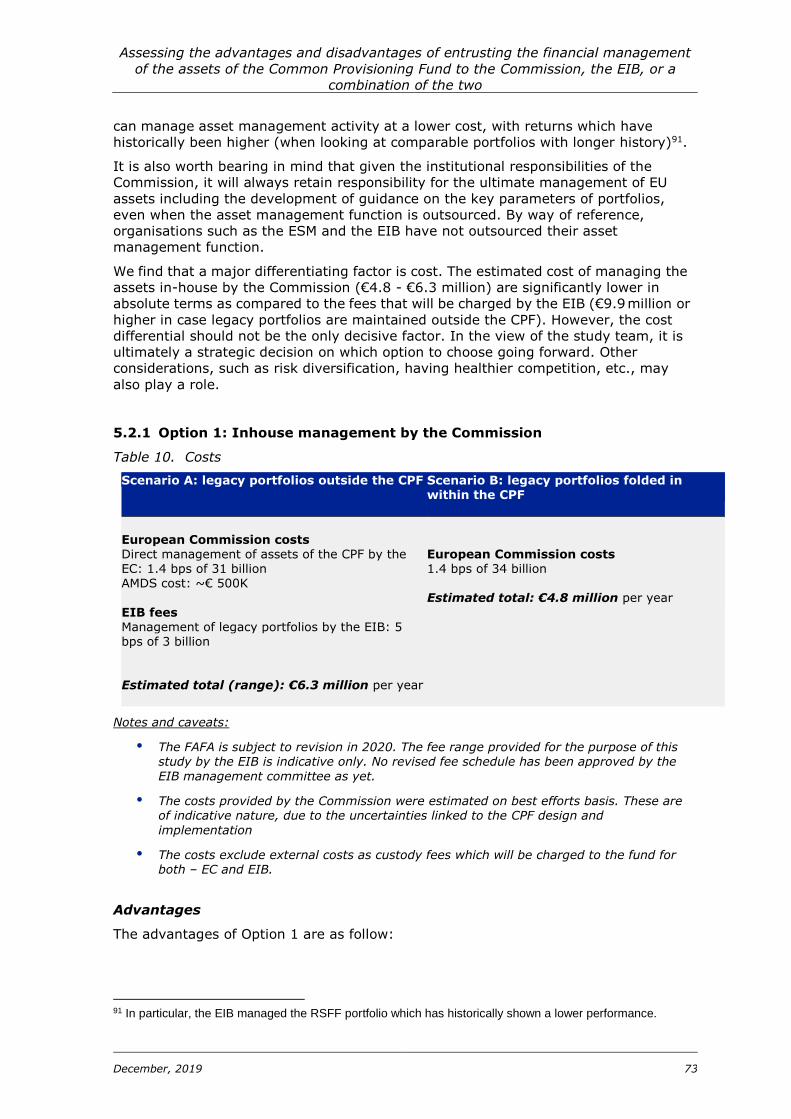
Assessing the advantages and disadvantages of entrusting the financial management
of the assets of the Common Provisioning Fund to the Commission, the EIB, or a
combination of the two
December, 2019 73
can manage asset management activity at a lower cost, with returns which have
historically been higher (when looking at comparable portfolios with longer history)91.
It is also worth bearing in mind that given the institutional responsibilities of the
Commission, it will always retain responsibility for the ultimate management of EU
assets including the development of guidance on the key parameters of portfolios,
even when the asset management function is outsourced. By way of reference,
organisations such as the ESM and the EIB have not outsourced their asset
management function.
We find that a major differentiating factor is cost. The estimated cost of managing the
assets in-house by the Commission (€4.8 - €6.3 million) are significantly lower in
absolute terms as compared to the fees that will be charged by the EIB (€9.9 million or
higher in case legacy portfolios are maintained outside the CPF). However, the cost
differential should not be the only decisive factor. In the view of the study team, it is
ultimately a strategic decision on which option to choose going forward. Other
considerations, such as risk diversification, having healthier competition, etc., may
also play a role.
5.2.1 Option 1: Inhouse management by the Commission
Table 10. Costs
Scenario A: legacy portfolios outside the CPF Scenario B: legacy portfolios folded in within the CPF
European Commission costs Direct management of assets of the CPF by the EC: 1.4 bps of 31 billion AMDS cost: ~€ 500K
EIB fees
Management of legacy portfolios by the EIB: 5 bps of 3 billion Estimated total (range): €6.3 million per year
European Commission costs 1.4 bps of 34 billion Estimated total: €4.8 million per year
Notes and caveats:
The FAFA is subject to revision in 2020. The fee range provided for the purpose of this study by the EIB is indicative only. No revised fee schedule has been approved by the
EIB management committee as yet.
The costs provided by the Commission were estimated on best efforts basis. These are of indicative nature, due to the uncertainties linked to the CPF design and
implementation
The costs exclude external costs as custody fees which will be charged to the fund for both – EC and EIB.
Advantages
The advantages of Option 1 are as follow:
91 In particular, the EIB managed the RSFF portfolio which has historically shown a lower performance.
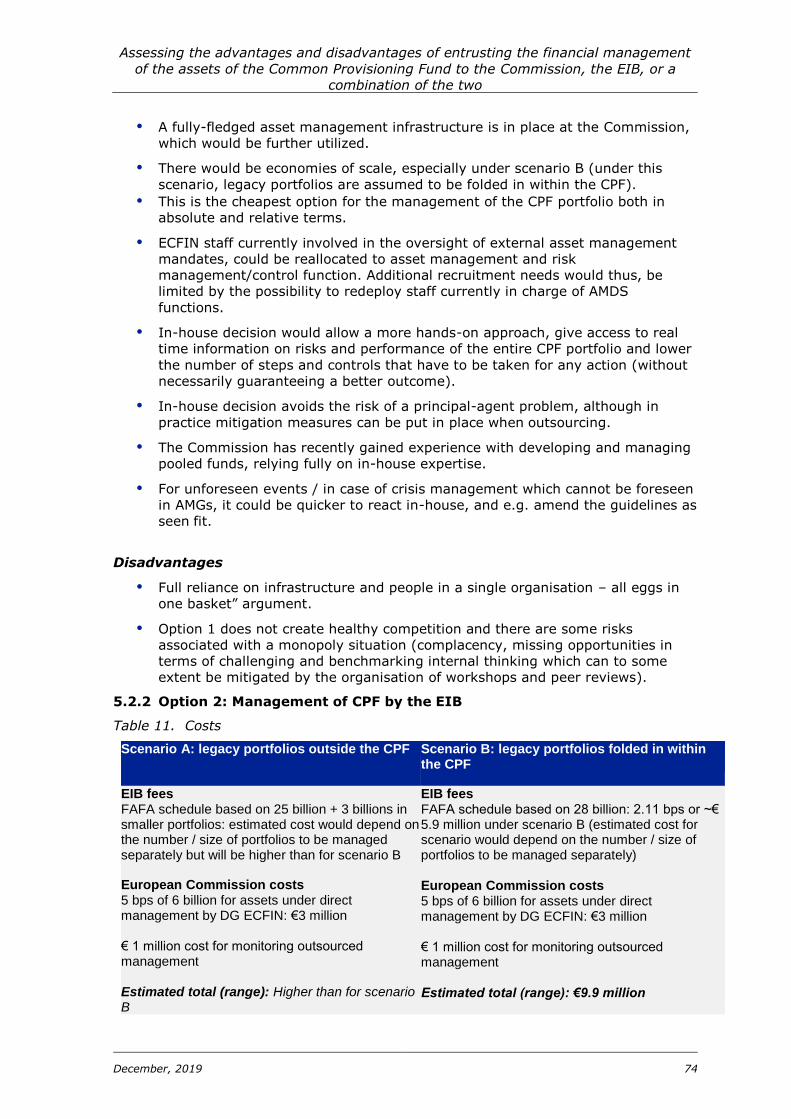
Assessing the advantages and disadvantages of entrusting the financial management
of the assets of the Common Provisioning Fund to the Commission, the EIB, or a
combination of the two
December, 2019 74
A fully-fledged asset management infrastructure is in place at the Commission,
which would be further utilized.
There would be economies of scale, especially under scenario B (under this
scenario, legacy portfolios are assumed to be folded in within the CPF).
This is the cheapest option for the management of the CPF portfolio both in
absolute and relative terms.
ECFIN staff currently involved in the oversight of external asset management
mandates, could be reallocated to asset management and risk
management/control function. Additional recruitment needs would thus, be
limited by the possibility to redeploy staff currently in charge of AMDS
functions.
In-house decision would allow a more hands-on approach, give access to real
time information on risks and performance of the entire CPF portfolio and lower
the number of steps and controls that have to be taken for any action (without
necessarily guaranteeing a better outcome).
In-house decision avoids the risk of a principal-agent problem, although in
practice mitigation measures can be put in place when outsourcing.
The Commission has recently gained experience with developing and managing
pooled funds, relying fully on in-house expertise.
For unforeseen events / in case of crisis management which cannot be foreseen
in AMGs, it could be quicker to react in-house, and e.g. amend the guidelines as
seen fit.
Disadvantages
Full reliance on infrastructure and people in a single organisation – all eggs in
one basket” argument.
Option 1 does not create healthy competition and there are some risks
associated with a monopoly situation (complacency, missing opportunities in
terms of challenging and benchmarking internal thinking which can to some
extent be mitigated by the organisation of workshops and peer reviews).
5.2.2 Option 2: Management of CPF by the EIB
Table 11. Costs
Scenario A: legacy portfolios outside the CPF Scenario B: legacy portfolios folded in within the CPF
EIB fees FAFA schedule based on 25 billion + 3 billions in smaller portfolios: estimated cost would depend on the number / size of portfolios to be managed separately but will be higher than for scenario B
European Commission costs 5 bps of 6 billion for assets under direct management by DG ECFIN: €3 million € 1 million cost for monitoring outsourced management Estimated total (range): Higher than for scenario B
EIB fees FAFA schedule based on 28 billion: 2.11 bps or ~€ 5.9 million under scenario B (estimated cost for scenario would depend on the number / size of portfolios to be managed separately) European Commission costs 5 bps of 6 billion for assets under direct management by DG ECFIN: €3 million € 1 million cost for monitoring outsourced management Estimated total (range): €9.9 million
Assessing the advantages and disadvantages of entrusting the financial management
of the assets of the Common Provisioning Fund to the Commission, the EIB, or a
combination of the two
December, 2019 75
Notes and caveats:
The FAFA is subject to revision in 2020. The fee range provided for the purpose of this study by the EIB is indicative only. No revised fee schedule has been approved by the EIB management committee as yet.
The costs provided by the Commission were estimated on best efforts basis. These are of indicative nature, due to the uncertainties linked to the CPF design and implementation .
The costs exclude external costs as custody fees which will be charged to the fund
Advantages
The advantages of Option 2 are as follow:
A fully-fledged asset management infrastructure is already in place at the EIB.
Economies of scale are expected to be reflected in the fee schedule, especially
under scenario B (under this scenario, legacy portfolios are assumed to be
folded in within the CPF.
The CPF could benefit from EIB core banking activities (in relation to repos).
This is however, not a decisive advantage.
EIB has more experience investing in derivatives (currency derivatives, interest
rate derivatives) which could be useful to increase flexibility when adjusting the
risk of the portfolio.
EIB has longer experience of managing pooled funds (using a model where the
main aspects which are specific to the management of pooled funds, e.g.
valuation and accounting of shares of participating mandates, are outsourced
by the EIB to an external contractor).
5.2.2.1 Disadvantages
The option is more expensive both in absolute and in relative terms.
There are management and other costs inherently associated with outsourcing,
in particular:
- There is a need to preserve an appropriate level of expertise at the
Commission to be able to oversee and monitor effectively the management
of the CPF, thereby limiting the savings which can be made on its side;
- There would be management and outsourcing costs relating to initial
negotiations on conditions for delegated management to EIB (in addition to
the ongoing coordination costs which are captured under the cost criteria,
amounting to EUR 1 million);
- In addition, ECFIN will need to keep asset management capabilities for the
portfolios which are not absorbed into the CPF. This asset management
infrastructure would eventually become under-utilised under Option 2.
-
Full reliance on infrastructure and people in a single organisation – all eggs in
one basket” argument.
Option 2 does not create a healthy competition and there are some risks
associated to a monopoly situation (complacency). In particular, there is a risk
that dependency on an external fee-charging asset manager could make the
Commission vulnerable to progressive fee increases.
Since the EIB will no longer be the sole implementing partner for guarantee
programmes under InvestEU and NDICI, Option 2 would necessitate providing
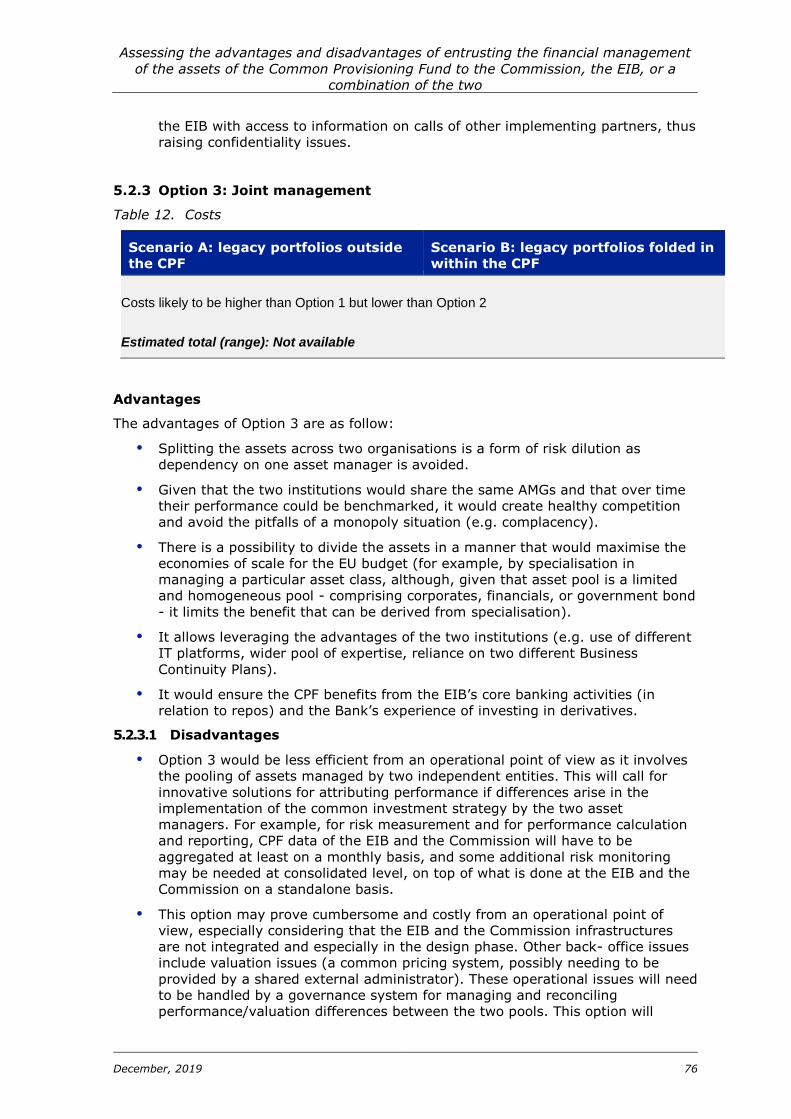
Assessing the advantages and disadvantages of entrusting the financial management
of the assets of the Common Provisioning Fund to the Commission, the EIB, or a
combination of the two
December, 2019 76
the EIB with access to information on calls of other implementing partners, thus
raising confidentiality issues.
5.2.3 Option 3: Joint management
Table 12. Costs
Scenario A: legacy portfolios outside
the CPF
Scenario B: legacy portfolios folded in
within the CPF
Costs likely to be higher than Option 1 but lower than Option 2
Estimated total (range): Not available
Advantages
The advantages of Option 3 are as follow:
Splitting the assets across two organisations is a form of risk dilution as
dependency on one asset manager is avoided.
Given that the two institutions would share the same AMGs and that over time
their performance could be benchmarked, it would create healthy competition
and avoid the pitfalls of a monopoly situation (e.g. complacency).
There is a possibility to divide the assets in a manner that would maximise the
economies of scale for the EU budget (for example, by specialisation in
managing a particular asset class, although, given that asset pool is a limited
and homogeneous pool - comprising corporates, financials, or government bond
- it limits the benefit that can be derived from specialisation).
It allows leveraging the advantages of the two institutions (e.g. use of different
IT platforms, wider pool of expertise, reliance on two different Business
Continuity Plans).
It would ensure the CPF benefits from the EIB’s core banking activities (in
relation to repos) and the Bank’s experience of investing in derivatives.
5.2.3.1 Disadvantages
Option 3 would be less efficient from an operational point of view as it involves
the pooling of assets managed by two independent entities. This will call for
innovative solutions for attributing performance if differences arise in the
implementation of the common investment strategy by the two asset
managers. For example, for risk measurement and for performance calculation
and reporting, CPF data of the EIB and the Commission will have to be
aggregated at least on a monthly basis, and some additional risk monitoring
may be needed at consolidated level, on top of what is done at the EIB and the
Commission on a standalone basis.
This option may prove cumbersome and costly from an operational point of
view, especially considering that the EIB and the Commission infrastructures
are not integrated and especially in the design phase. Other back- office issues
include valuation issues (a common pricing system, possibly needing to be
provided by a shared external administrator). These operational issues will need
to be handled by a governance system for managing and reconciling
performance/valuation differences between the two pools. This option will
Assessing the advantages and disadvantages of entrusting the financial management
of the assets of the Common Provisioning Fund to the Commission, the EIB, or a
combination of the two
December, 2019 77
therefore, require careful elaboration from an operational and governance
perspective.
In the absence of an objective basis for dividing responsibilities between the
two asset managers, the division of assets could prove arbitrary and
contentious particularly if not aligned with ex-post performance.
Costs would be higher than Option 1. The need to maintain a monitoring and oversight
function would limit the scope for economies of scale on the Commission side.
Assessing the advantages and disadvantages of entrusting the financial management
of the assets of the Common Provisioning Fund to the Commission, the EIB, or a
combination of the two
December, 2019 78
Annex 1 Interviews and meetings undertaken
Kick off meeting with the Steering Group - 30 April 2019
Scoping interviews with ECFIN L1, L2, L3, R3 and Compliance Officer - 8 May and
14 May 2019
Introductory meeting at the European Investment Bank, together with the
European Commission - 6 May 2019
Group scoping meeting at the European Investment Bank (with PM, RM, FI-MO,
BOT, FC and FI-COOR), 14 May 2019
Inception meeting with the Steering Group – 24 May 2019
In-depth interview with EIB (BOT, FI-COOR and FC) - 28 May 2019
In-depth interview with EIB (PM, RM FI-MO) - 4 June 2019
ECFIN group meeting (with ECFIN L1, L2, L3, R3 and Compliance Officer) – 5 June
2019
Additional clarification meeting with ECFIN – 14 June 2019
Additional clarification meetings with the EIB – 19 June 2019, 8 July 2019 and 27
August 2019
Interim meeting with the Steering Group – 28 June 2019
Workshop with the Commission to discuss the Draft Final Report – 23 July 2019
Workshop with the Commission and EIB services – 25 September 2019
Meeting with the steering group – 25 October 2019
Annex 2 Mapping of the portfolios managed by the EC and
portfolios outsourced to the EIB
mapping portfolio
FINAL.xlsx
Annex 3 List of assembled documentation
Updated list of
assembled documentation.xlsx
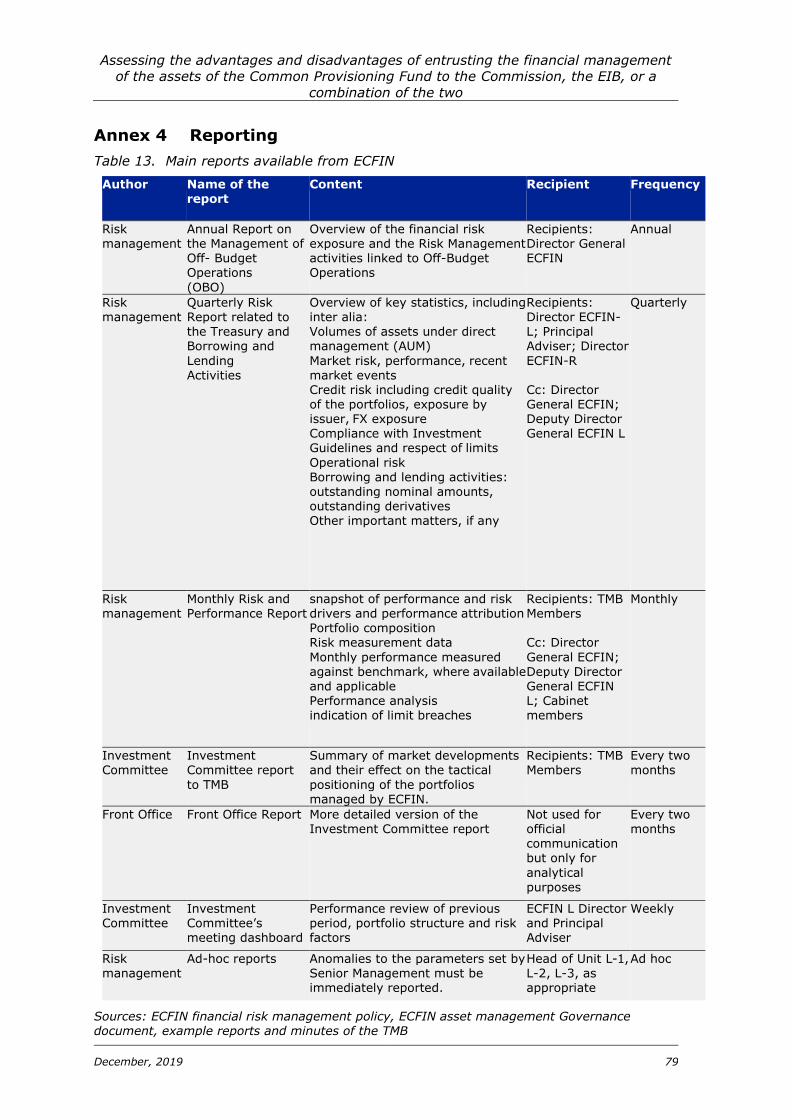
Assessing the advantages and disadvantages of entrusting the financial management
of the assets of the Common Provisioning Fund to the Commission, the EIB, or a
combination of the two
December, 2019 79
Annex 4 Reporting
Table 13. Main reports available from ECFIN
Author Name of the report
Content Recipient Frequency
Risk management
Annual Report on the Management of Off- Budget Operations
(OBO)
Overview of the financial risk exposure and the Risk Management activities linked to Off-Budget Operations
Recipients: Director General ECFIN
Annual
Risk management
Quarterly Risk Report related to the Treasury and Borrowing and
Lending Activities
Overview of key statistics, including inter alia: Volumes of assets under direct management (AUM)
Market risk, performance, recent market events Credit risk including credit quality of the portfolios, exposure by issuer, FX exposure Compliance with Investment Guidelines and respect of limits
Operational risk Borrowing and lending activities: outstanding nominal amounts, outstanding derivatives Other important matters, if any
Recipients: Director ECFIN-L; Principal Adviser; Director
ECFIN-R Cc: Director General ECFIN; Deputy Director General ECFIN L
Quarterly
Risk
management
Monthly Risk and
Performance Report
snapshot of performance and risk
drivers and performance attribution Portfolio composition Risk measurement data
Monthly performance measured against benchmark, where available and applicable Performance analysis indication of limit breaches
Recipients: TMB
Members Cc: Director
General ECFIN; Deputy Director General ECFIN L; Cabinet members
Monthly
Investment Committee
Investment Committee report
to TMB
Summary of market developments and their effect on the tactical
positioning of the portfolios managed by ECFIN.
Recipients: TMB Members
Every two months
Front Office Front Office Report More detailed version of the Investment Committee report
Not used for official
communication but only for
analytical purposes
Every two months
Investment Committee
Investment Committee’s meeting dashboard
Performance review of previous period, portfolio structure and risk factors
ECFIN L Director and Principal Adviser
Weekly
Risk management
Ad-hoc reports Anomalies to the parameters set by Senior Management must be immediately reported.
Head of Unit L-1, L-2, L-3, as appropriate
Ad hoc
Sources: ECFIN financial risk management policy, ECFIN asset management Governance document, example reports and minutes of the TMB
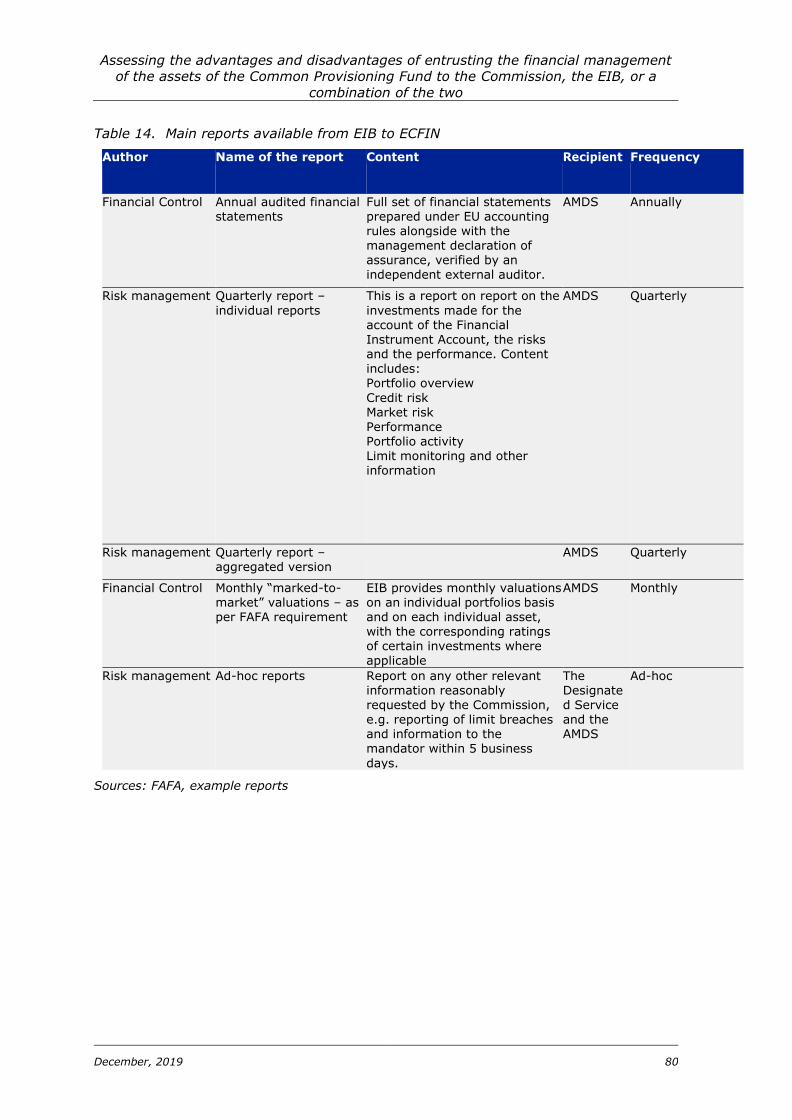
Assessing the advantages and disadvantages of entrusting the financial management
of the assets of the Common Provisioning Fund to the Commission, the EIB, or a
combination of the two
December, 2019 80
Table 14. Main reports available from EIB to ECFIN
Author Name of the report Content Recipient Frequency
Financial Control Annual audited financial statements
Full set of financial statements prepared under EU accounting rules alongside with the management declaration of assurance, verified by an independent external auditor.
AMDS Annually
Risk management Quarterly report –
individual reports
This is a report on report on the
investments made for the account of the Financial Instrument Account, the risks and the performance. Content
includes: Portfolio overview
Credit risk Market risk Performance Portfolio activity Limit monitoring and other information
AMDS Quarterly
Risk management Quarterly report – aggregated version
AMDS Quarterly
Financial Control Monthly “marked-to-
market” valuations – as per FAFA requirement
EIB provides monthly valuations
on an individual portfolios basis and on each individual asset, with the corresponding ratings of certain investments where applicable
AMDS Monthly
Risk management Ad-hoc reports Report on any other relevant information reasonably requested by the Commission, e.g. reporting of limit breaches and information to the mandator within 5 business
days.
The Designate d Service and the AMDS
Ad-hoc
Sources: FAFA, example reports
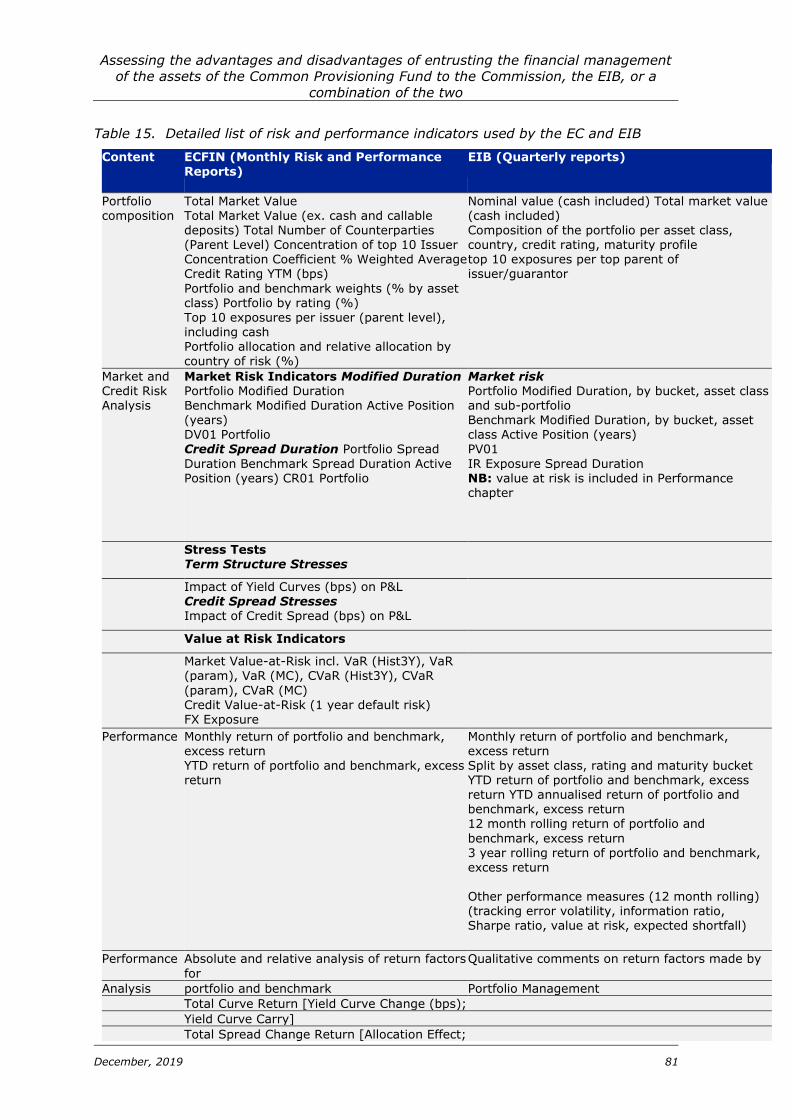
Assessing the advantages and disadvantages of entrusting the financial management
of the assets of the Common Provisioning Fund to the Commission, the EIB, or a
combination of the two
December, 2019 81
Table 15. Detailed list of risk and performance indicators used by the EC and EIB
Content ECFIN (Monthly Risk and Performance Reports)
EIB (Quarterly reports)
Portfolio composition
Total Market Value Total Market Value (ex. cash and callable deposits) Total Number of Counterparties (Parent Level) Concentration of top 10 Issuer Concentration Coefficient % Weighted Average Credit Rating YTM (bps)
Portfolio and benchmark weights (% by asset class) Portfolio by rating (%) Top 10 exposures per issuer (parent level), including cash Portfolio allocation and relative allocation by
country of risk (%)
Nominal value (cash included) Total market value (cash included) Composition of the portfolio per asset class, country, credit rating, maturity profile top 10 exposures per top parent of issuer/guarantor
Market and Credit Risk Analysis
Market Risk Indicators Modified Duration Portfolio Modified Duration Benchmark Modified Duration Active Position (years) DV01 Portfolio Credit Spread Duration Portfolio Spread
Duration Benchmark Spread Duration Active Position (years) CR01 Portfolio
Market risk Portfolio Modified Duration, by bucket, asset class and sub-portfolio Benchmark Modified Duration, by bucket, asset class Active Position (years) PV01
IR Exposure Spread Duration NB: value at risk is included in Performance chapter
Stress Tests Term Structure Stresses
Impact of Yield Curves (bps) on P&L
Credit Spread Stresses Impact of Credit Spread (bps) on P&L
Value at Risk Indicators
Market Value-at-Risk incl. VaR (Hist3Y), VaR (param), VaR (MC), CVaR (Hist3Y), CVaR
(param), CVaR (MC) Credit Value-at-Risk (1 year default risk) FX Exposure
Performance Monthly return of portfolio and benchmark, excess return YTD return of portfolio and benchmark, excess return
Monthly return of portfolio and benchmark, excess return Split by asset class, rating and maturity bucket YTD return of portfolio and benchmark, excess return YTD annualised return of portfolio and benchmark, excess return 12 month rolling return of portfolio and
benchmark, excess return
3 year rolling return of portfolio and benchmark, excess return Other performance measures (12 month rolling) (tracking error volatility, information ratio, Sharpe ratio, value at risk, expected shortfall)
Performance Absolute and relative analysis of return factors
for
Qualitative comments on return factors made by
Analysis portfolio and benchmark Portfolio Management
Total Curve Return [Yield Curve Change (bps);
Yield Curve Carry]
Total Spread Change Return [Allocation Effect;
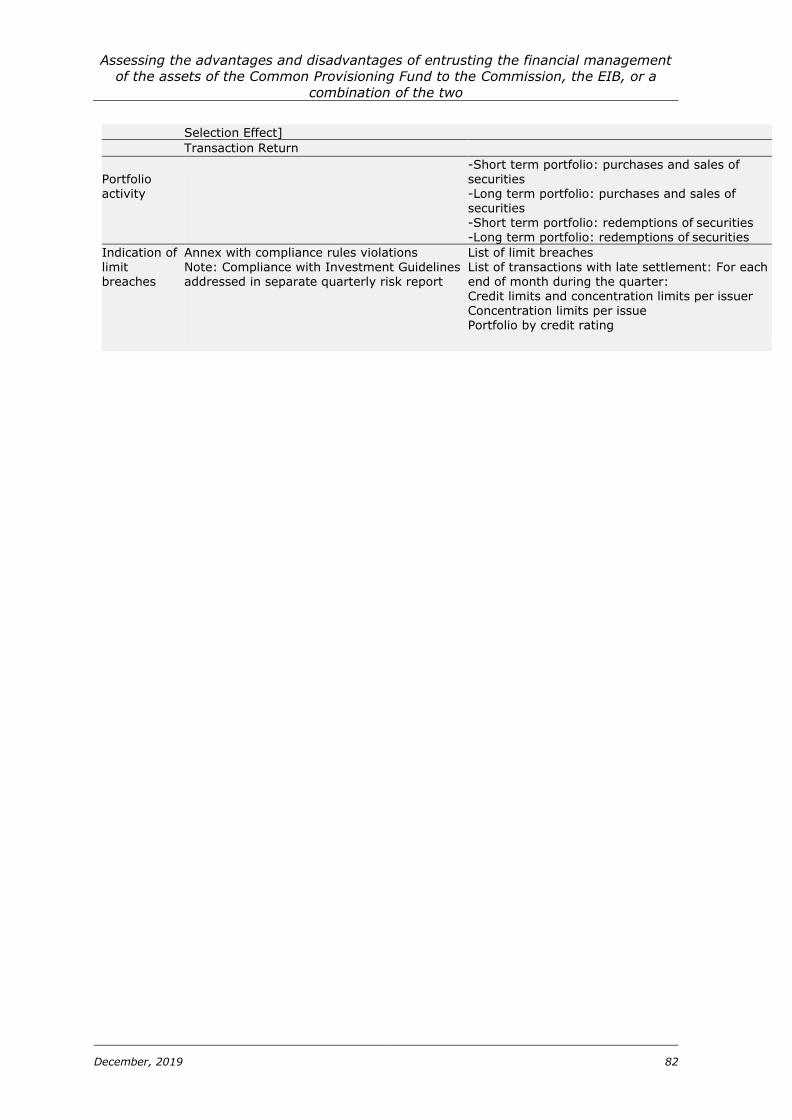
Assessing the advantages and disadvantages of entrusting the financial management
of the assets of the Common Provisioning Fund to the Commission, the EIB, or a
combination of the two
December, 2019 82
Selection Effect]
Transaction Return
Portfolio activity
-Short term portfolio: purchases and sales of securities -Long term portfolio: purchases and sales of securities -Short term portfolio: redemptions of securities -Long term portfolio: redemptions of securities
Indication of limit breaches
Annex with compliance rules violations Note: Compliance with Investment Guidelines addressed in separate quarterly risk report
List of limit breaches List of transactions with late settlement: For each end of month during the quarter: Credit limits and concentration limits per issuer Concentration limits per issue Portfolio by credit rating
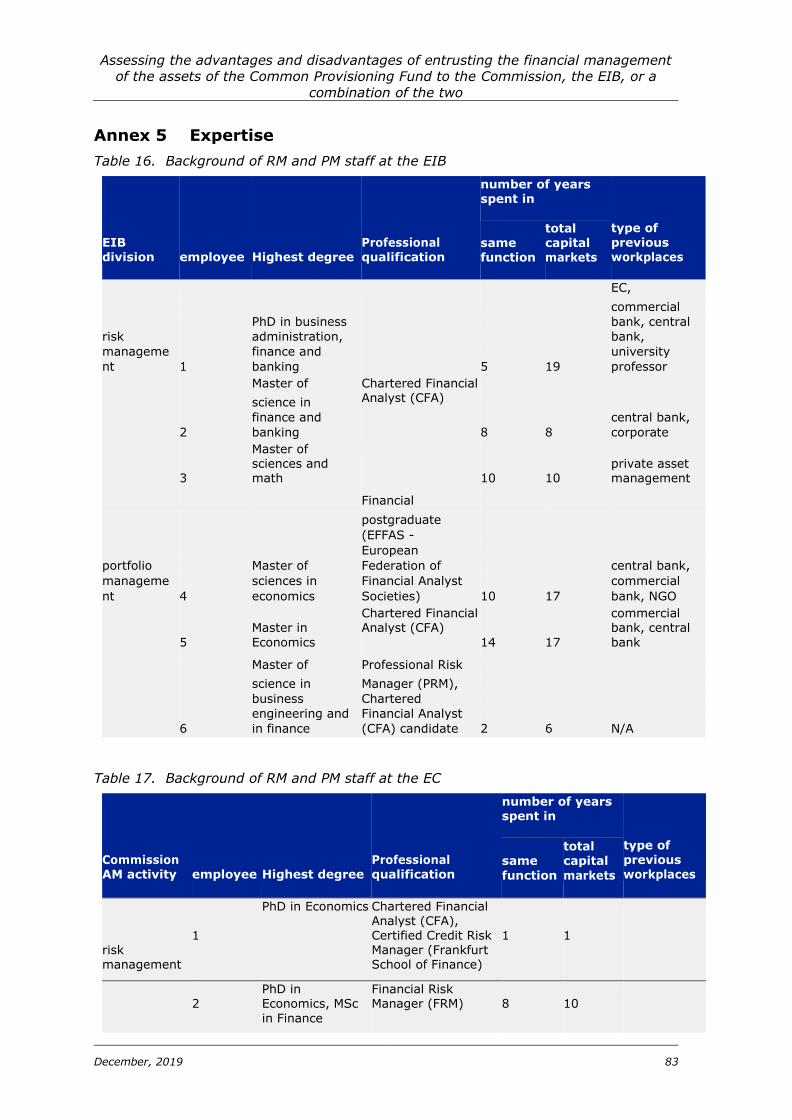
Assessing the advantages and disadvantages of entrusting the financial management
of the assets of the Common Provisioning Fund to the Commission, the EIB, or a
combination of the two
December, 2019 83
Annex 5 Expertise
Table 16. Background of RM and PM staff at the EIB
EIB division
employee
Highest degree
Professional qualification
number of years spent in
type of previous workplaces
same function
total capital markets
EC,
commercial
PhD in business bank, central
risk administration, bank,
manageme finance and university
nt 1 banking 5 19 professor
Master of Chartered Financial Analyst (CFA)
science in
finance and central bank,
2 banking 8 8 corporate
3
Master of sciences and math
10
10
private asset management
Financial
postgraduate
(EFFAS -
European
portfolio Master of Federation of central bank,
manageme sciences in Financial Analyst commercial
nt 4 economics Societies) 10 17 bank, NGO
5
Master in
Economics
Chartered Financial Analyst (CFA)
14
17
commercial bank, central
bank
Master of Professional Risk
science in Manager (PRM),
business Chartered
engineering and Financial Analyst
6 in finance (CFA) candidate 2 6 N/A
Table 17. Background of RM and PM staff at the EC
Commission AM activity
employee
Highest degree
Professional qualification
number of years spent in
type of previous workplaces
same
function
total capital
markets
risk management
1
PhD in Economics Chartered Financial Analyst (CFA), Certified Credit Risk Manager (Frankfurt School of Finance)
1
1
2
PhD in Economics, MSc
in Finance
Financial Risk Manager (FRM)
8
10
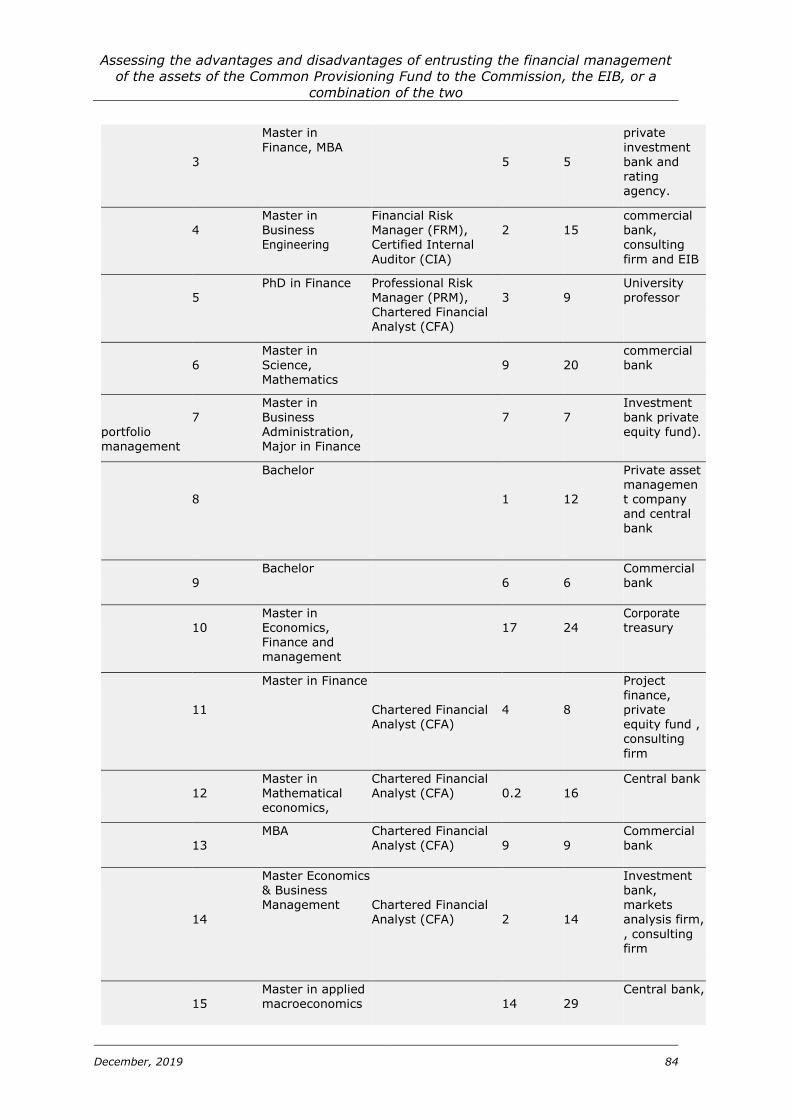
Assessing the advantages and disadvantages of entrusting the financial management
of the assets of the Common Provisioning Fund to the Commission, the EIB, or a
combination of the two
December, 2019 84
3
Master in
Finance, MBA
5
5
private
investment bank and rating agency.
4
Master in Business Engineering
Financial Risk Manager (FRM), Certified Internal
Auditor (CIA)
2
15
commercial bank, consulting
firm and EIB
5
PhD in Finance Professional Risk Manager (PRM), Chartered Financial Analyst (CFA)
3
9
University professor
6
Master in
Science, Mathematics
9
20
commercial
bank
portfolio management
7
Master in Business Administration, Major in Finance
7
7
Investment bank private equity fund).
8
Bachelor 1
12
Private asset managemen t company and central bank
9
Bachelor 6
6
Commercial bank
10
Master in Economics, Finance and management
17
24
Corporate treasury
11
Master in Finance Chartered Financial Analyst (CFA)
4
8
Project finance, private equity fund , consulting
firm
12
Master in Mathematical economics,
Chartered Financial Analyst (CFA)
0.2
16
Central bank
13
MBA Chartered Financial
Analyst (CFA)
9
9
Commercial
bank
14
Master Economics & Business Management
Chartered Financial Analyst (CFA)
2
14
Investment bank, markets analysis firm,
, consulting firm
15
Master in applied macroeconomics
14
29
Central bank,
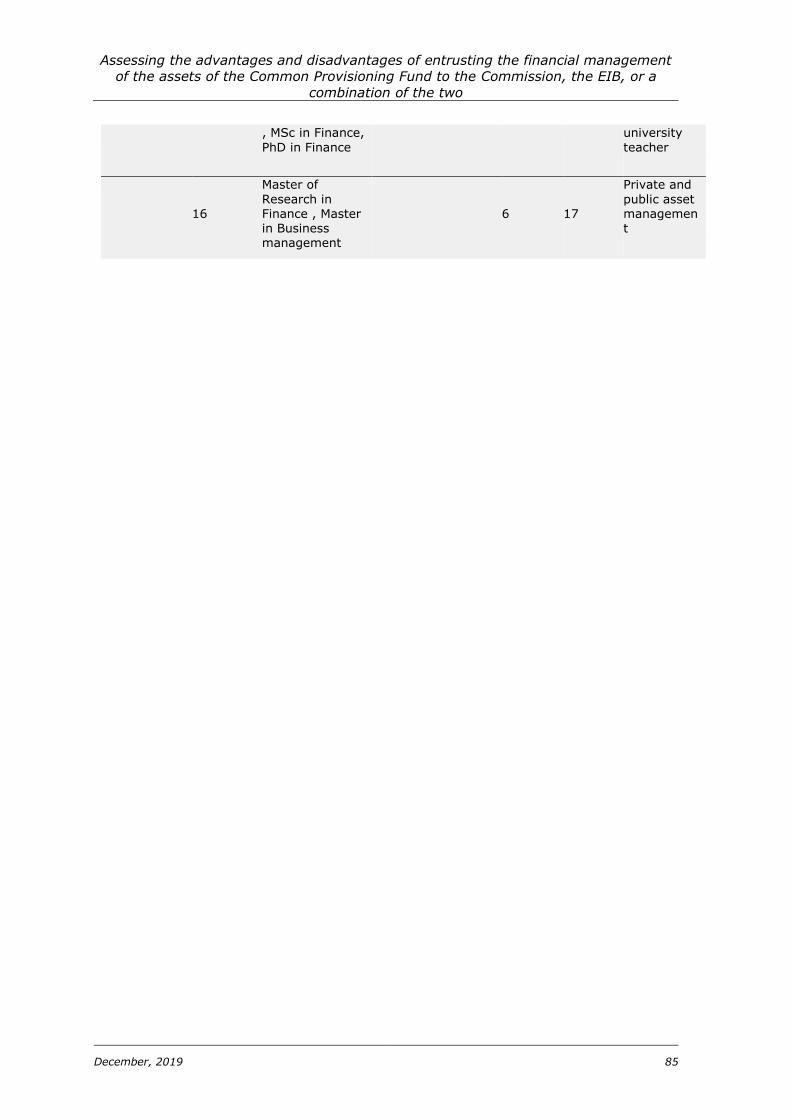
Assessing the advantages and disadvantages of entrusting the financial management
of the assets of the Common Provisioning Fund to the Commission, the EIB, or a
combination of the two
December, 2019 85
, MSc in Finance,
PhD in Finance
university
teacher
16
Master of
Research in Finance , Master in Business management
6
17
Private and
public asset managemen t
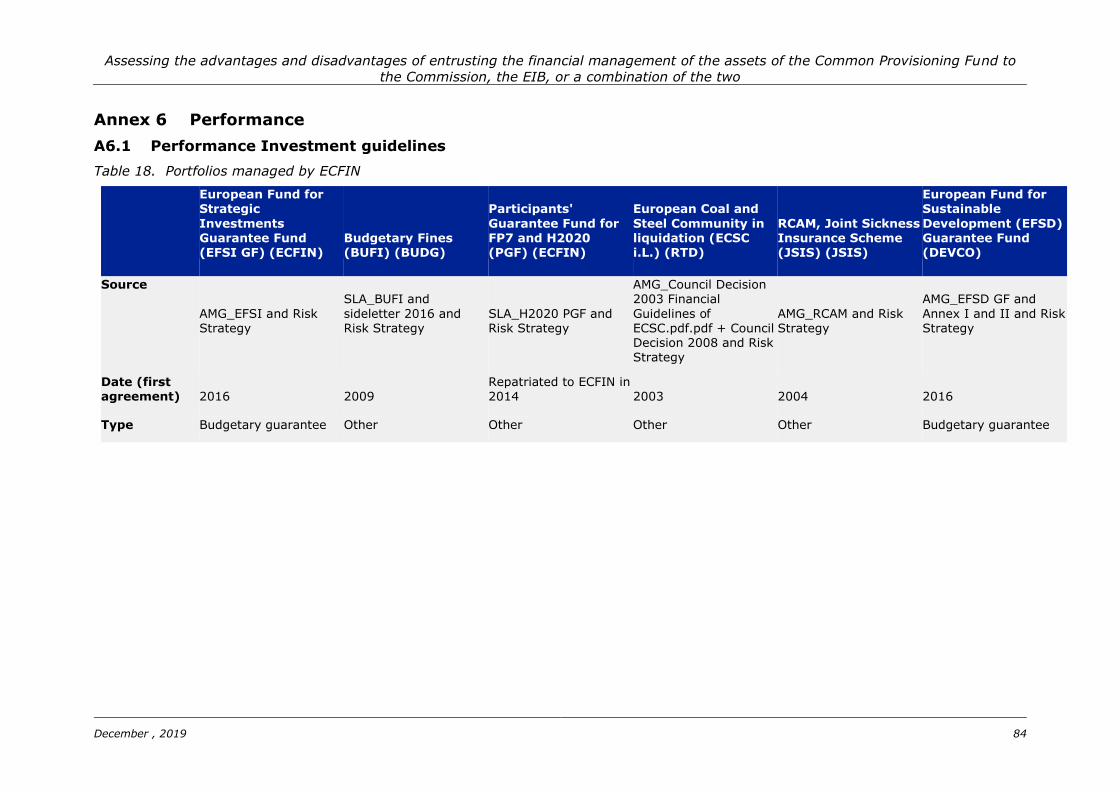
Assessing the advantages and disadvantages of entrusting the financial management of the assets of the Common Provisioning Fund to
the Commission, the EIB, or a combination of the two
December , 2019 84
Annex 6 Performance
A6.1 Performance Investment guidelines
Table 18. Portfolios managed by ECFIN
European Fund for Strategic
Investments Guarantee Fund (EFSI GF) (ECFIN)
Budgetary Fines (BUFI) (BUDG)
Participants'
Guarantee Fund for FP7 and H2020 (PGF) (ECFIN)
European Coal and
Steel Community in liquidation (ECSC i.L.) (RTD)
RCAM, Joint Sickness Insurance Scheme (JSIS) (JSIS)
European Fund for Sustainable
Development (EFSD) Guarantee Fund (DEVCO)
Source
AMG_EFSI and Risk Strategy
SLA_BUFI and
sideletter 2016 and Risk Strategy
SLA_H2020 PGF and Risk Strategy
AMG_Council Decision 2003 Financial
Guidelines of ECSC.pdf.pdf + Council Decision 2008 and Risk Strategy
AMG_RCAM and Risk Strategy
AMG_EFSD GF and
Annex I and II and Risk Strategy
Date (first agreement)
2016
2009
Repatriated to ECFIN in 2014
2003
2004
2016
Type Budgetary guarantee Other Other Other Other Budgetary guarantee
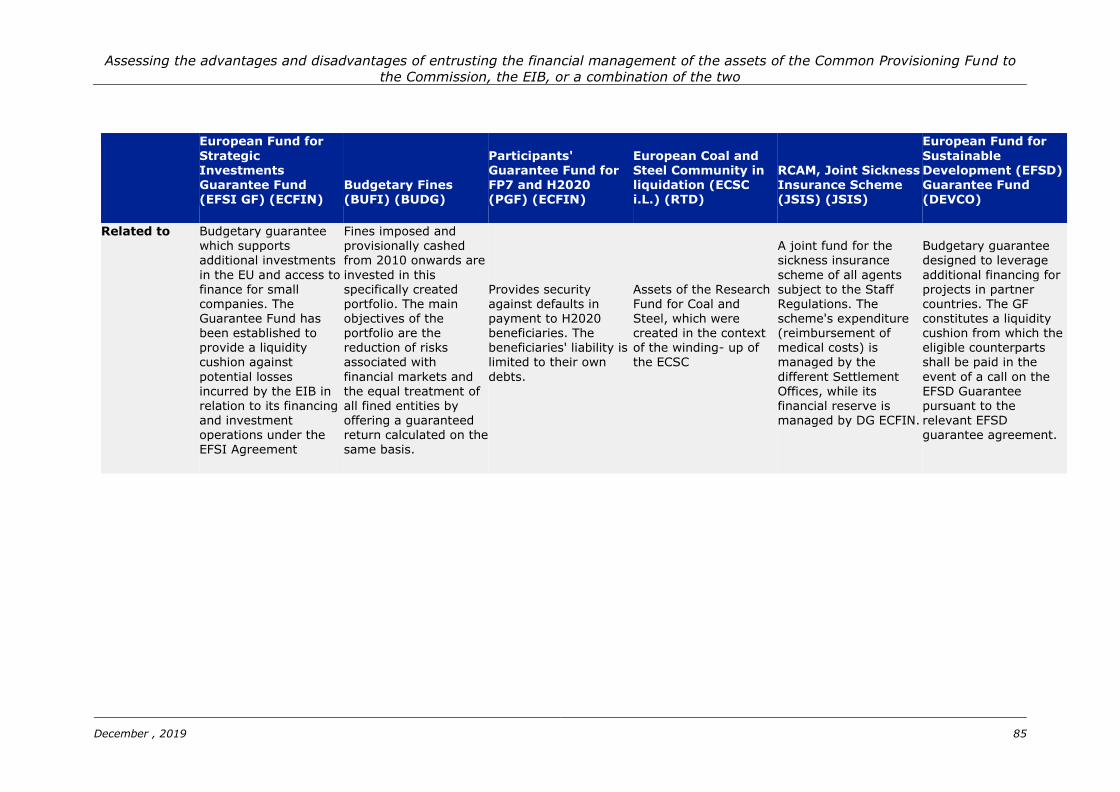
Assessing the advantages and disadvantages of entrusting the financial management of the assets of the Common Provisioning Fund to
the Commission, the EIB, or a combination of the two
December , 2019 85
European Fund for
Strategic Investments Guarantee Fund (EFSI GF) (ECFIN)
Budgetary Fines (BUFI) (BUDG)
Participants' Guarantee Fund for FP7 and H2020 (PGF) (ECFIN)
European Coal and Steel Community in liquidation (ECSC i.L.) (RTD)
RCAM, Joint Sickness Insurance Scheme (JSIS) (JSIS)
European Fund for
Sustainable Development (EFSD) Guarantee Fund (DEVCO)
Related to Budgetary guarantee which supports additional investments
in the EU and access to finance for small companies. The Guarantee Fund has been established to provide a liquidity cushion against
potential losses incurred by the EIB in relation to its financing and investment operations under the EFSI Agreement
Fines imposed and provisionally cashed from 2010 onwards are
invested in this specifically created portfolio. The main objectives of the portfolio are the reduction of risks associated with
financial markets and the equal treatment of all fined entities by offering a guaranteed return calculated on the same basis.
Provides security against defaults in payment to H2020 beneficiaries. The beneficiaries' liability is limited to their own
debts.
Assets of the Research Fund for Coal and Steel, which were created in the context of the winding- up of the ECSC
A joint fund for the sickness insurance
scheme of all agents subject to the Staff Regulations. The scheme's expenditure (reimbursement of medical costs) is managed by the
different Settlement Offices, while its financial reserve is managed by DG ECFIN.
Budgetary guarantee designed to leverage
additional financing for projects in partner countries. The GF constitutes a liquidity cushion from which the eligible counterparts shall be paid in the
event of a call on the EFSD Guarantee pursuant to the relevant EFSD guarantee agreement.
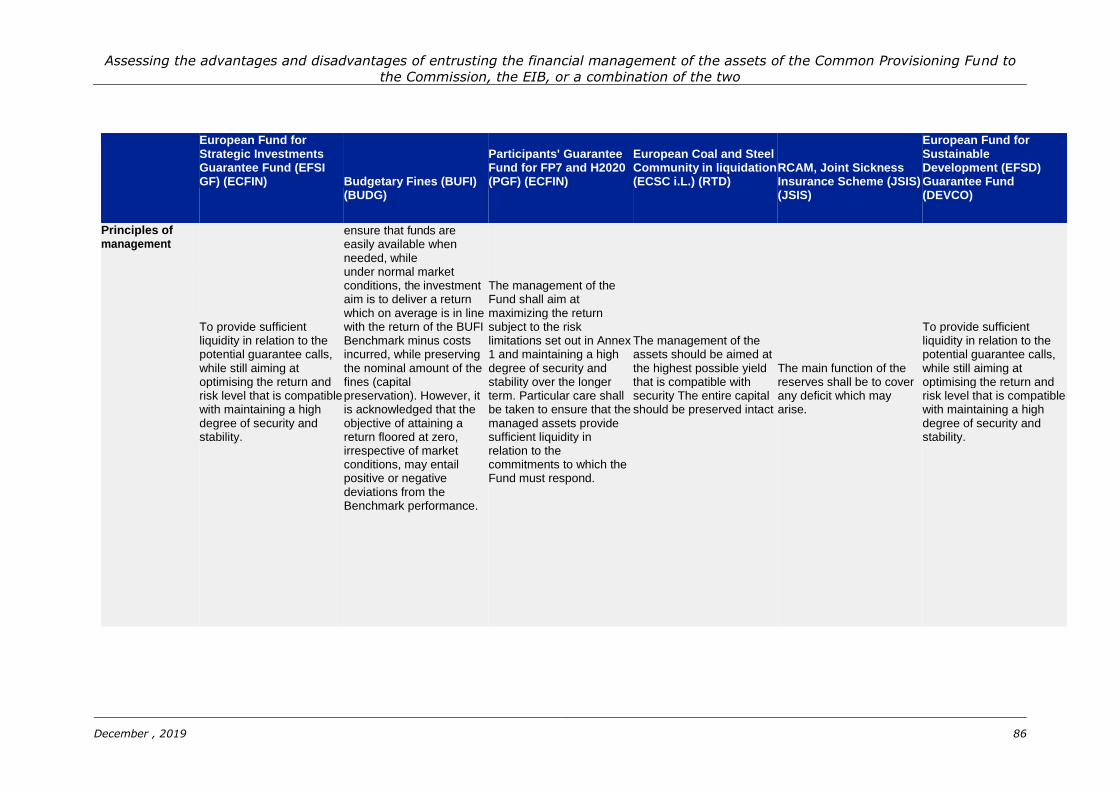
Assessing the advantages and disadvantages of entrusting the financial management of the assets of the Common Provisioning Fund to
the Commission, the EIB, or a combination of the two
December , 2019 86
European Fund for Strategic Investments Guarantee Fund (EFSI GF) (ECFIN)
Budgetary Fines (BUFI) (BUDG)
Participants' Guarantee Fund for FP7 and H2020 (PGF) (ECFIN)
European Coal and Steel Community in liquidation (ECSC i.L.) (RTD)
RCAM, Joint Sickness Insurance Scheme (JSIS) (JSIS)
European Fund for Sustainable Development (EFSD) Guarantee Fund (DEVCO)
Principles of management
To provide sufficient liquidity in relation to the potential guarantee calls, while still aiming at optimising the return and risk level that is compatible with maintaining a high degree of security and stability.
ensure that funds are easily available when needed, while under normal market conditions, the investment aim is to deliver a return which on average is in line with the return of the BUFI Benchmark minus costs incurred, while preserving the nominal amount of the fines (capital preservation). However, it is acknowledged that the objective of attaining a return floored at zero, irrespective of market conditions, may entail positive or negative deviations from the Benchmark performance.
The management of the Fund shall aim at maximizing the return subject to the risk limitations set out in Annex 1 and maintaining a high degree of security and stability over the longer term. Particular care shall be taken to ensure that the managed assets provide sufficient liquidity in relation to the commitments to which the Fund must respond.
The management of the assets should be aimed at the highest possible yield that is compatible with security The entire capital should be preserved intact
The main function of the reserves shall be to cover any deficit which may arise.
To provide sufficient liquidity in relation to the potential guarantee calls, while still aiming at optimising the return and risk level that is compatible with maintaining a high degree of security and stability.
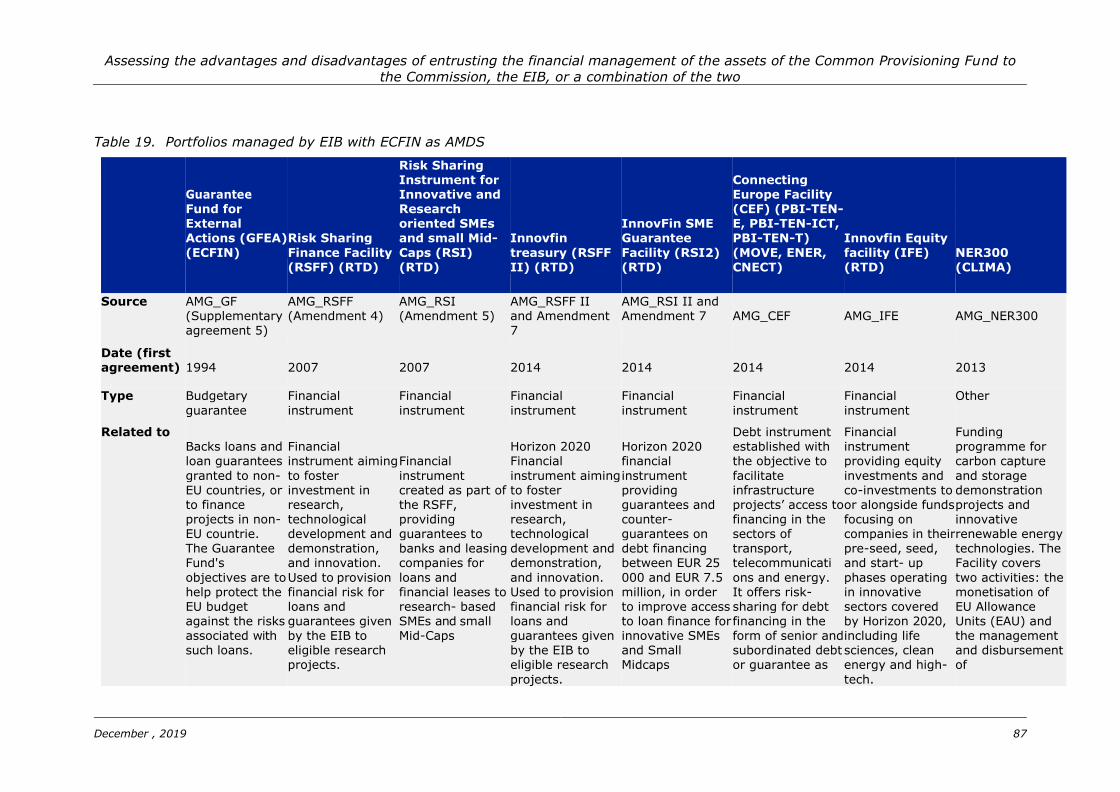
Assessing the advantages and disadvantages of entrusting the financial management of the assets of the Common Provisioning Fund to
the Commission, the EIB, or a combination of the two
December , 2019 87
Table 19. Portfolios managed by EIB with ECFIN as AMDS
Guarantee Fund for
External Actions (GFEA)
(ECFIN)
Risk Sharing
Finance Facility (RSFF) (RTD)
Risk Sharing Instrument for Innovative and Research
oriented SMEs and small Mid-
Caps (RSI) (RTD)
Innovfin
treasury (RSFF II) (RTD)
InnovFin SME Guarantee
Facility (RSI2) (RTD)
Connecting Europe Facility (CEF) (PBI-TEN-
E, PBI-TEN-ICT, PBI-TEN-T)
(MOVE, ENER, CNECT)
Innovfin Equity
facility (IFE) (RTD)
NER300 (CLIMA)
Source AMG_GF (Supplementary agreement 5)
AMG_RSFF (Amendment 4)
AMG_RSI (Amendment 5)
AMG_RSFF II and Amendment 7
AMG_RSI II and Amendment 7
AMG_CEF
AMG_IFE
AMG_NER300
Date (first agreement)
1994
2007
2007
2014
2014
2014
2014
2013
Type Budgetary
guarantee
Financial
instrument
Financial
instrument
Financial
instrument
Financial
instrument
Financial
instrument
Financial
instrument
Other
Related to Backs loans and loan guarantees
granted to non- EU countries, or to finance projects in non-
EU countrie. The Guarantee Fund's
objectives are to help protect the EU budget against the risks associated with such loans.
Financial instrument aiming
to foster investment in research, technological
development and demonstration, and innovation.
Used to provision financial risk for loans and guarantees given by the EIB to eligible research projects.
Financial
instrument created as part of the RSFF, providing
guarantees to banks and leasing companies for
loans and financial leases to research- based SMEs and small Mid-Caps
Horizon 2020 Financial
instrument aiming to foster investment in research,
technological development and demonstration,
and innovation. Used to provision financial risk for loans and guarantees given by the EIB to eligible research
projects.
Horizon 2020 financial
instrument providing guarantees and counter-
guarantees on debt financing between EUR 25
000 and EUR 7.5 million, in order to improve access to loan finance for innovative SMEs and Small Midcaps
Debt instrument established with the objective to
facilitate infrastructure projects’ access to financing in the
sectors of transport, telecommunicati
ons and energy. It offers risk- sharing for debt financing in the form of senior and subordinated debt or guarantee as
Financial instrument providing equity
investments and co-investments to or alongside funds focusing on
companies in their pre-seed, seed, and start- up
phases operating in innovative sectors covered by Horizon 2020, including life sciences, clean energy and high-
tech.
Funding programme for carbon capture
and storage demonstration projects and innovative
renewable energy technologies. The Facility covers
two activities: the monetisation of EU Allowance Units (EAU) and the management and disbursement of
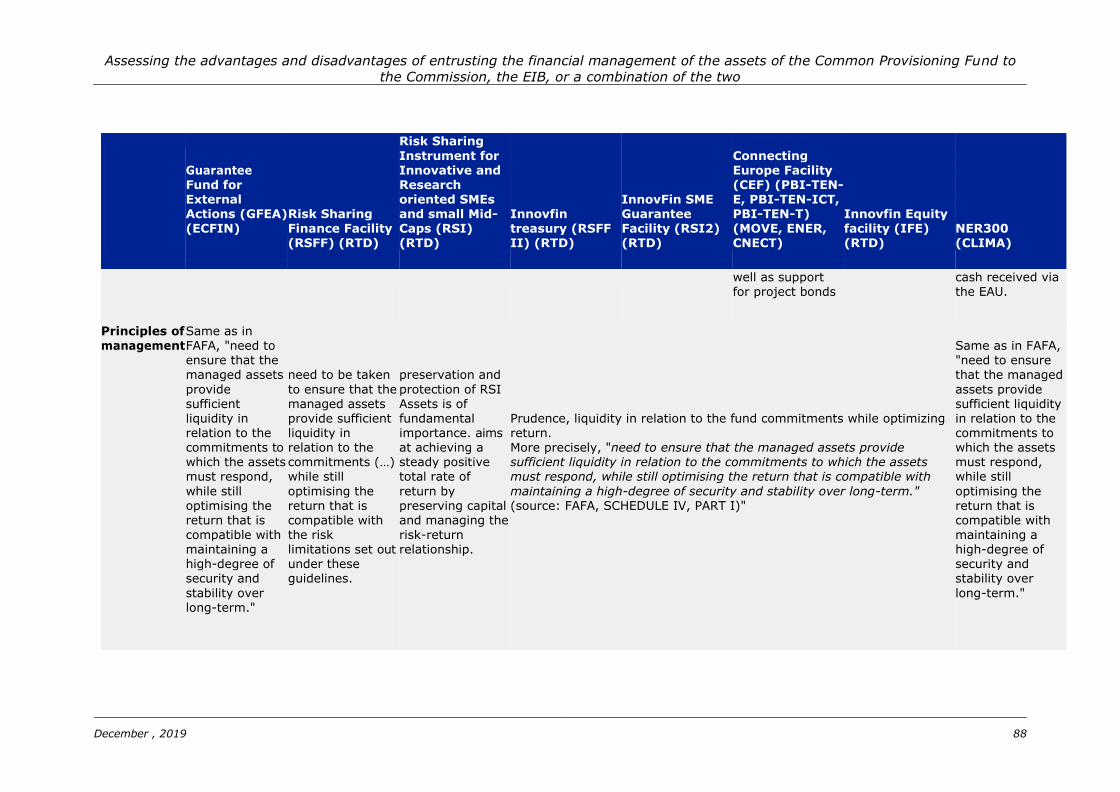
Assessing the advantages and disadvantages of entrusting the financial management of the assets of the Common Provisioning Fund to
the Commission, the EIB, or a combination of the two
December , 2019 88
Guarantee Fund for External Actions (GFEA)
(ECFIN)
Risk Sharing
Finance Facility (RSFF) (RTD)
Risk Sharing
Instrument for Innovative and Research oriented SMEs and small Mid-
Caps (RSI) (RTD)
Innovfin
treasury (RSFF II) (RTD)
InnovFin SME Guarantee
Facility (RSI2) (RTD)
Connecting Europe Facility (CEF) (PBI-TEN- E, PBI-TEN-ICT, PBI-TEN-T)
(MOVE, ENER, CNECT)
Innovfin Equity
facility (IFE) (RTD)
NER300 (CLIMA)
well as support for project bonds
cash received via the EAU.
Principles of management
Same as in FAFA, "need to ensure that the
managed assets
provide sufficient liquidity in relation to the commitments to which the assets must respond,
while still optimising the return that is
compatible with maintaining a high-degree of security and
stability over long-term."
need to be taken
to ensure that the managed assets provide sufficient liquidity in relation to the commitments (…) while still
optimising the return that is compatible with
the risk limitations set out under these guidelines.
preservation and
protection of RSI Assets is of fundamental importance. aims at achieving a steady positive total rate of
return by preserving capital and managing the
risk-return relationship.
Prudence, liquidity in relation to the fund commitments while optimizing return. More precisely, "need to ensure that the managed assets provide sufficient liquidity in relation to the commitments to which the assets must respond, while still optimising the return that is compatible with
maintaining a high-degree of security and stability over long-term." (source: FAFA, SCHEDULE IV, PART I)"
Same as in FAFA, "need to ensure
that the managed
assets provide sufficient liquidity in relation to the commitments to which the assets must respond, while still
optimising the return that is compatible with
maintaining a high-degree of security and stability over
long-term."
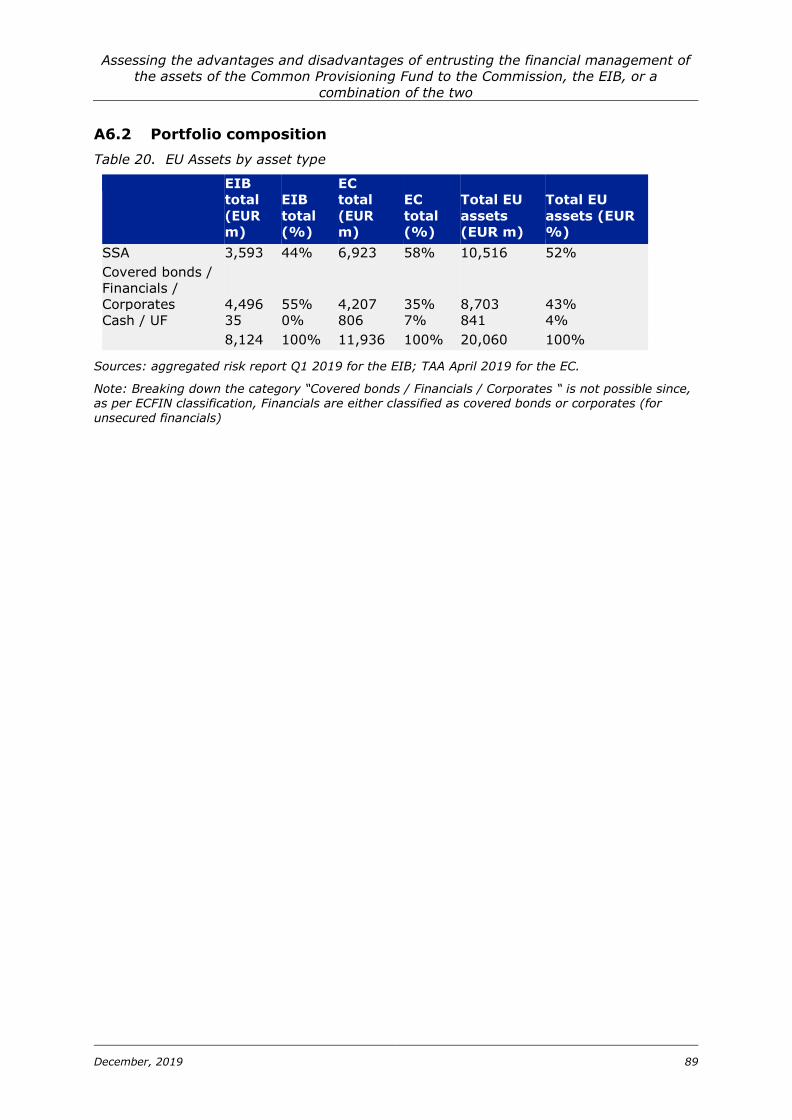
Assessing the advantages and disadvantages of entrusting the financial management of
the assets of the Common Provisioning Fund to the Commission, the EIB, or a
combination of the two
December, 2019 89
A6.2 Portfolio composition
Table 20. EU Assets by asset type
EIB
total
(EUR
m)
EIB
total
(%)
EC
total
(EUR
m)
EC
total
(%)
Total EU
assets
(EUR m)
Total EU
assets (EUR
%)
SSA 3,593 44% 6,923 58% 10,516 52%
Covered bonds /
Financials /
Corporates
4,496
55%
4,207
35%
8,703
43%
Cash / UF 35 0% 806 7% 841 4%
8,124 100% 11,936 100% 20,060 100%
Sources: aggregated risk report Q1 2019 for the EIB; TAA April 2019 for the EC.
Note: Breaking down the category “Covered bonds / Financials / Corporates “ is not possible since, as per ECFIN classification, Financials are either classified as covered bonds or corporates (for
unsecured financials)
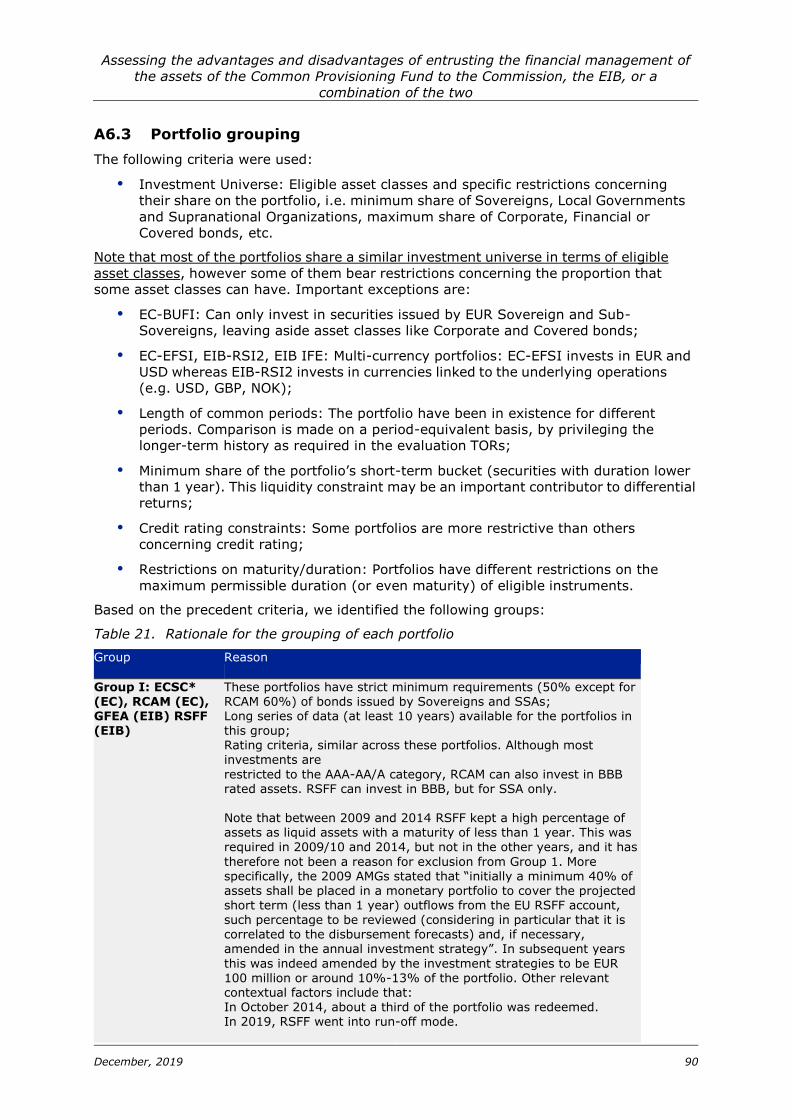
Assessing the advantages and disadvantages of entrusting the financial management of
the assets of the Common Provisioning Fund to the Commission, the EIB, or a
combination of the two
December, 2019 90
A6.3 Portfolio grouping
The following criteria were used:
Investment Universe: Eligible asset classes and specific restrictions concerning
their share on the portfolio, i.e. minimum share of Sovereigns, Local Governments
and Supranational Organizations, maximum share of Corporate, Financial or
Covered bonds, etc.
Note that most of the portfolios share a similar investment universe in terms of eligible
asset classes, however some of them bear restrictions concerning the proportion that
some asset classes can have. Important exceptions are:
EC-BUFI: Can only invest in securities issued by EUR Sovereign and Sub-
Sovereigns, leaving aside asset classes like Corporate and Covered bonds;
EC-EFSI, EIB-RSI2, EIB IFE: Multi-currency portfolios: EC-EFSI invests in EUR and
USD whereas EIB-RSI2 invests in currencies linked to the underlying operations
(e.g. USD, GBP, NOK);
Length of common periods: The portfolio have been in existence for different
periods. Comparison is made on a period-equivalent basis, by privileging the
longer-term history as required in the evaluation TORs;
Minimum share of the portfolio’s short-term bucket (securities with duration lower
than 1 year). This liquidity constraint may be an important contributor to differential
returns;
Credit rating constraints: Some portfolios are more restrictive than others
concerning credit rating;
Restrictions on maturity/duration: Portfolios have different restrictions on the
maximum permissible duration (or even maturity) of eligible instruments.
Based on the precedent criteria, we identified the following groups:
Table 21. Rationale for the grouping of each portfolio
Group Reason
Group I: ECSC* (EC), RCAM (EC), GFEA (EIB) RSFF (EIB)
These portfolios have strict minimum requirements (50% except for RCAM 60%) of bonds issued by Sovereigns and SSAs; Long series of data (at least 10 years) available for the portfolios in this group; Rating criteria, similar across these portfolios. Although most investments are
restricted to the AAA-AA/A category, RCAM can also invest in BBB rated assets. RSFF can invest in BBB, but for SSA only. Note that between 2009 and 2014 RSFF kept a high percentage of assets as liquid assets with a maturity of less than 1 year. This was
required in 2009/10 and 2014, but not in the other years, and it has
therefore not been a reason for exclusion from Group 1. More specifically, the 2009 AMGs stated that “initially a minimum 40% of assets shall be placed in a monetary portfolio to cover the projected short term (less than 1 year) outflows from the EU RSFF account, such percentage to be reviewed (considering in particular that it is correlated to the disbursement forecasts) and, if necessary, amended in the annual investment strategy”. In subsequent years
this was indeed amended by the investment strategies to be EUR 100 million or around 10%-13% of the portfolio. Other relevant contextual factors include that: In October 2014, about a third of the portfolio was redeemed. In 2019, RSFF went into run-off mode.
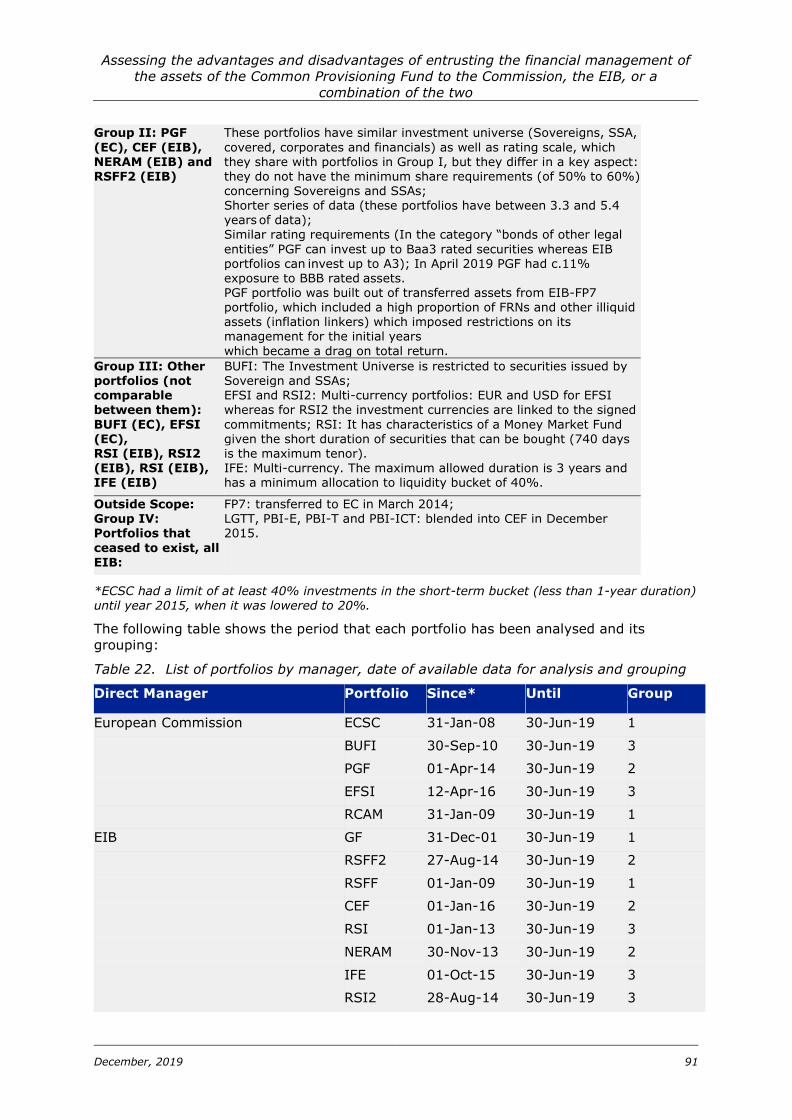
Assessing the advantages and disadvantages of entrusting the financial management of
the assets of the Common Provisioning Fund to the Commission, the EIB, or a
combination of the two
December, 2019 91
Group II: PGF
(EC), CEF (EIB), NERAM (EIB) and RSFF2 (EIB)
These portfolios have similar investment universe (Sovereigns, SSA,
covered, corporates and financials) as well as rating scale, which they share with portfolios in Group I, but they differ in a key aspect: they do not have the minimum share requirements (of 50% to 60%) concerning Sovereigns and SSAs; Shorter series of data (these portfolios have between 3.3 and 5.4 years of data); Similar rating requirements (In the category “bonds of other legal
entities” PGF can invest up to Baa3 rated securities whereas EIB portfolios can invest up to A3); In April 2019 PGF had c.11% exposure to BBB rated assets. PGF portfolio was built out of transferred assets from EIB-FP7 portfolio, which included a high proportion of FRNs and other illiquid assets (inflation linkers) which imposed restrictions on its management for the initial years
which became a drag on total return.
Group III: Other portfolios (not comparable between them):
BUFI (EC), EFSI (EC), RSI (EIB), RSI2 (EIB), RSI (EIB), IFE (EIB)
BUFI: The Investment Universe is restricted to securities issued by Sovereign and SSAs; EFSI and RSI2: Multi-currency portfolios: EUR and USD for EFSI whereas for RSI2 the investment currencies are linked to the signed
commitments; RSI: It has characteristics of a Money Market Fund given the short duration of securities that can be bought (740 days is the maximum tenor). IFE: Multi-currency. The maximum allowed duration is 3 years and has a minimum allocation to liquidity bucket of 40%.
Outside Scope: Group IV: Portfolios that
ceased to exist, all EIB:
FP7: transferred to EC in March 2014; LGTT, PBI-E, PBI-T and PBI-ICT: blended into CEF in December 2015.
*ECSC had a limit of at least 40% investments in the short-term bucket (less than 1-year duration)
until year 2015, when it was lowered to 20%.
The following table shows the period that each portfolio has been analysed and its
grouping:
Table 22. List of portfolios by manager, date of available data for analysis and grouping
Direct Manager Portfolio Since* Until Group
European Commission ECSC 31-Jan-08 30-Jun-19 1
BUFI 30-Sep-10 30-Jun-19 3
PGF 01-Apr-14 30-Jun-19 2
EFSI 12-Apr-16 30-Jun-19 3
RCAM 31-Jan-09 30-Jun-19 1
EIB GF 31-Dec-01 30-Jun-19 1
RSFF2 27-Aug-14 30-Jun-19 2
RSFF 01-Jan-09 30-Jun-19 1
CEF 01-Jan-16 30-Jun-19 2
RSI 01-Jan-13 30-Jun-19 3
NERAM 30-Nov-13 30-Jun-19 2
IFE 01-Oct-15 30-Jun-19 3
RSI2 28-Aug-14 30-Jun-19 3
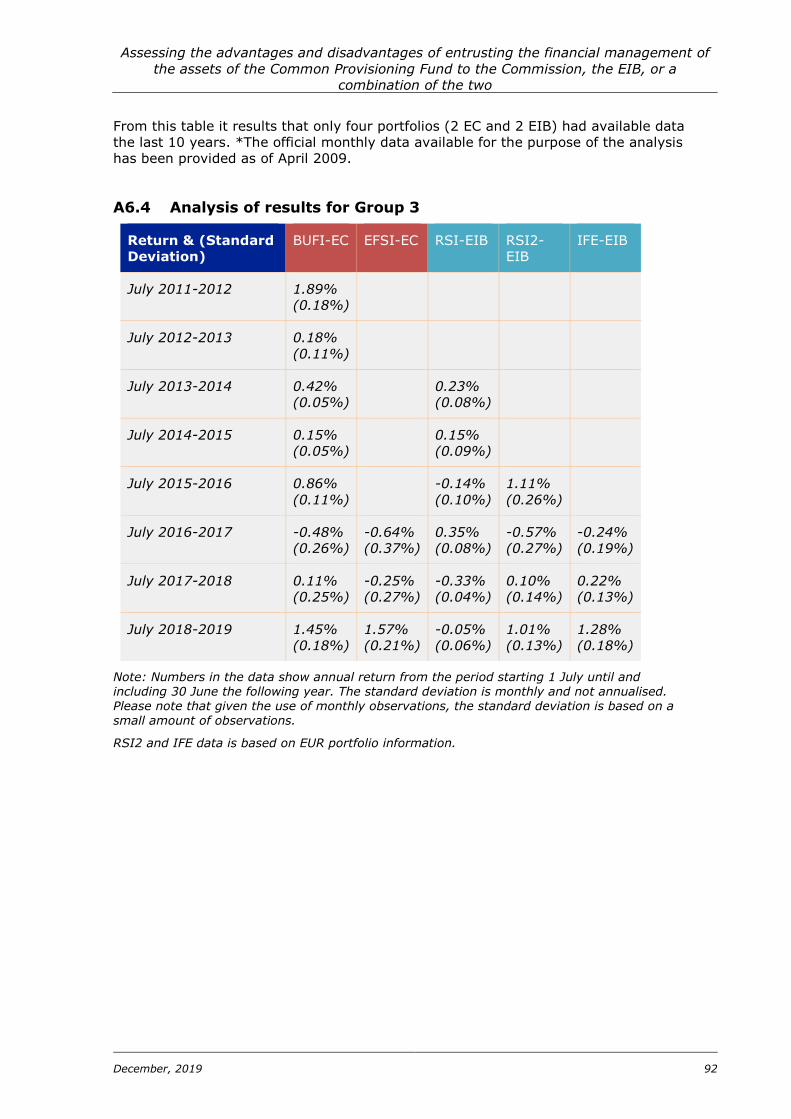
Assessing the advantages and disadvantages of entrusting the financial management of
the assets of the Common Provisioning Fund to the Commission, the EIB, or a
combination of the two
December, 2019 92
From this table it results that only four portfolios (2 EC and 2 EIB) had available data
the last 10 years. *The official monthly data available for the purpose of the analysis
has been provided as of April 2009.
A6.4 Analysis of results for Group 3
Return & (Standard
Deviation)
BUFI-EC EFSI-EC RSI-EIB RSI2-
EIB
IFE-EIB
July 2011-2012 1.89%
(0.18%)
July 2012-2013 0.18%
(0.11%)
July 2013-2014 0.42%
(0.05%)
0.23%
(0.08%)
July 2014-2015 0.15%
(0.05%)
0.15%
(0.09%)
July 2015-2016 0.86%
(0.11%)
-0.14%
(0.10%)
1.11%
(0.26%)
July 2016-2017 -0.48%
(0.26%)
-0.64%
(0.37%)
0.35%
(0.08%)
-0.57%
(0.27%)
-0.24%
(0.19%)
July 2017-2018 0.11%
(0.25%)
-0.25%
(0.27%)
-0.33%
(0.04%)
0.10%
(0.14%)
0.22%
(0.13%)
July 2018-2019 1.45%
(0.18%)
1.57%
(0.21%)
-0.05%
(0.06%)
1.01%
(0.13%)
1.28%
(0.18%)
Note: Numbers in the data show annual return from the period starting 1 July until and including 30 June the following year. The standard deviation is monthly and not annualised. Please note that given the use of monthly observations, the standard deviation is based on a small amount of observations.
RSI2 and IFE data is based on EUR portfolio information.
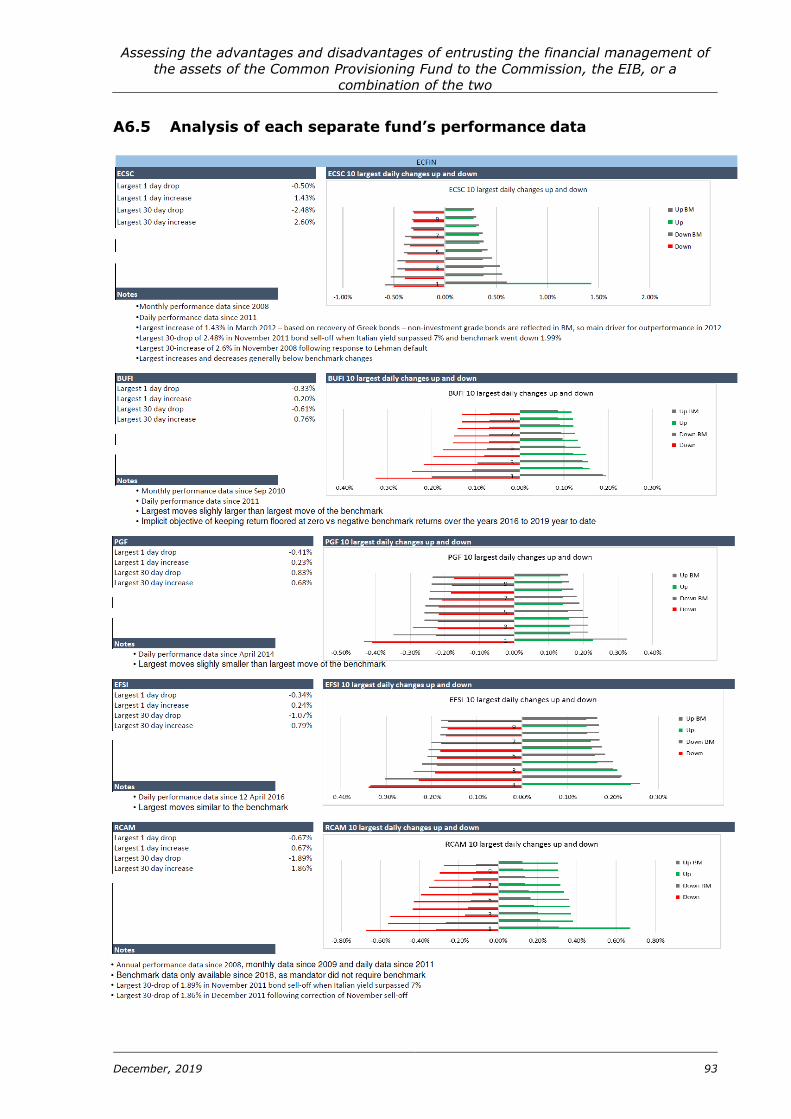
Assessing the advantages and disadvantages of entrusting the financial management of
the assets of the Common Provisioning Fund to the Commission, the EIB, or a
combination of the two
December, 2019 93
A6.5 Analysis of each separate fund’s performance data
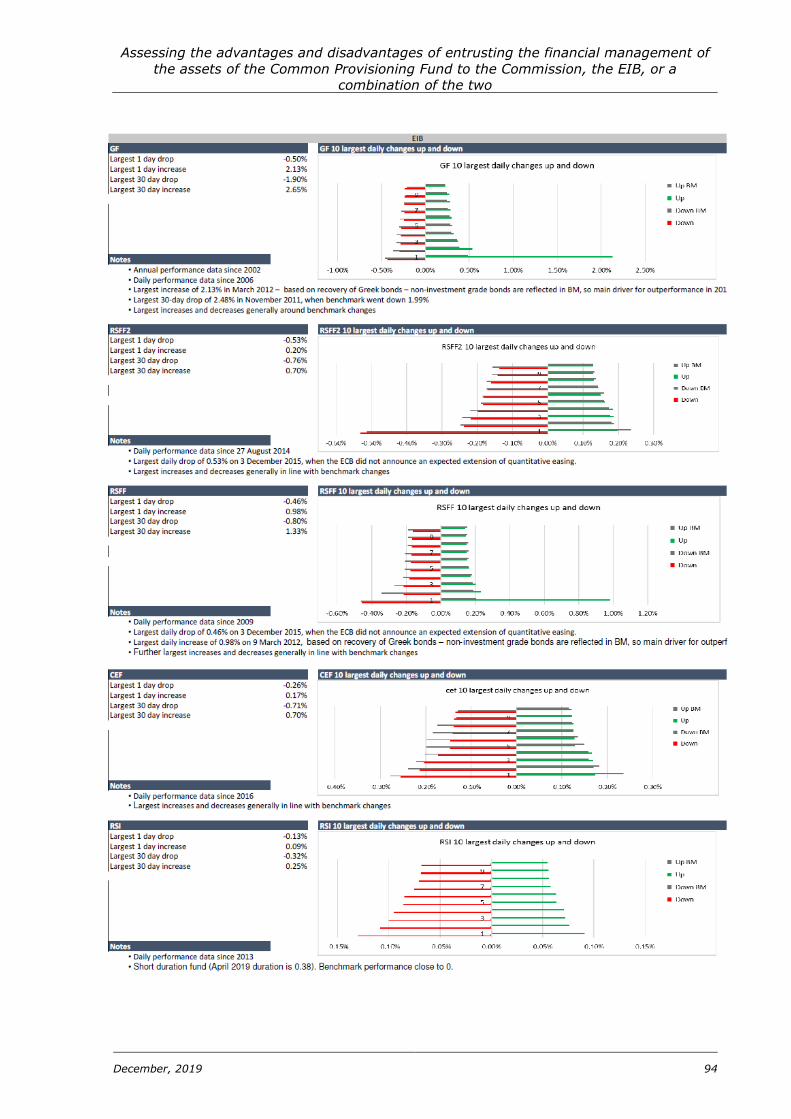
Assessing the advantages and disadvantages of entrusting the financial management of
the assets of the Common Provisioning Fund to the Commission, the EIB, or a
combination of the two
December, 2019 94
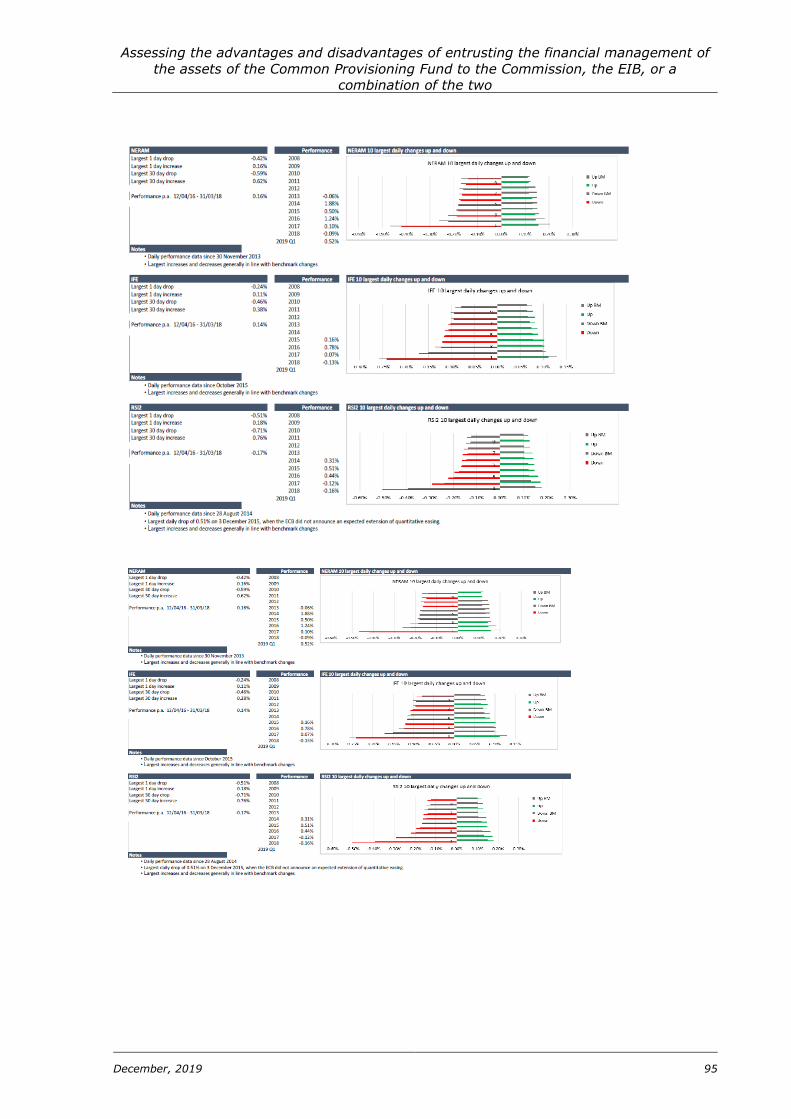
Assessing the advantages and disadvantages of entrusting the financial management of
the assets of the Common Provisioning Fund to the Commission, the EIB, or a
combination of the two
December, 2019 95
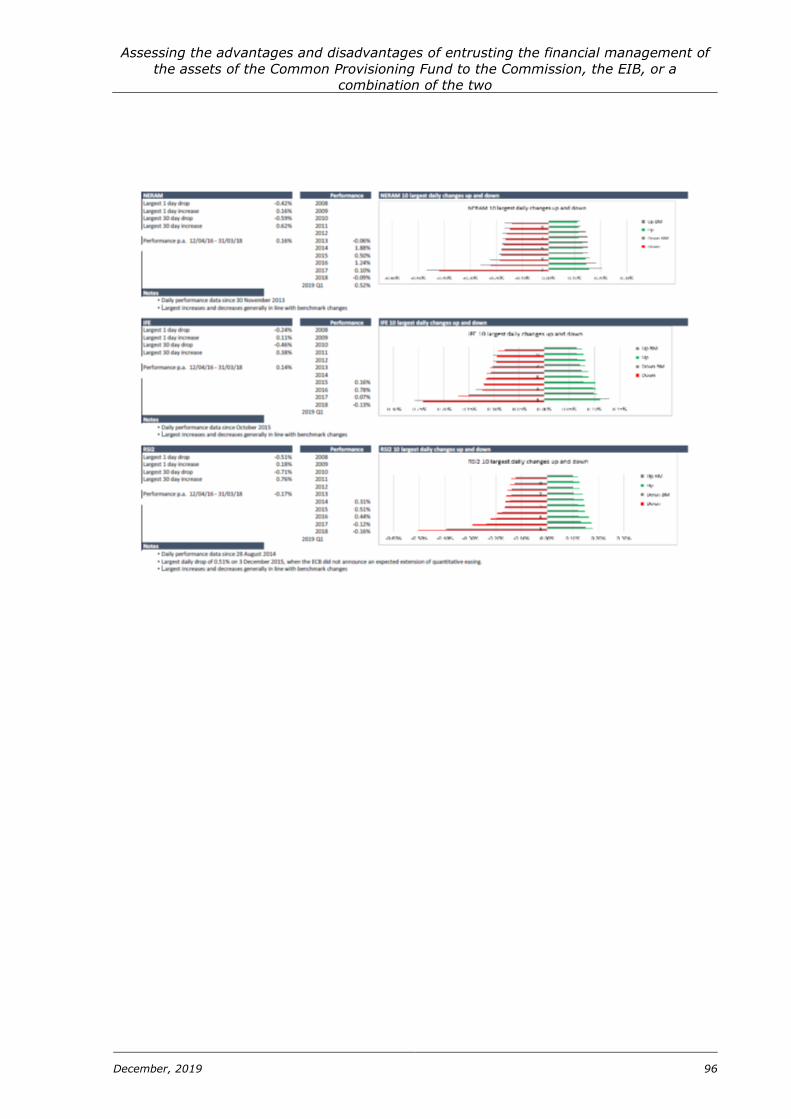
Assessing the advantages and disadvantages of entrusting the financial management of
the assets of the Common Provisioning Fund to the Commission, the EIB, or a
combination of the two
December, 2019 96
HOW TO OBTAIN EU PUBLICATIONS
Free publications:
one copy:
via EU Bookshop (http://bookshop.europa.eu);
more than one copy or posters/maps:
from the European Union’s representations
(http://ec.europa.eu/represent_en.htm);
from the delegations in non-EU countries
(http://eeas.europa.eu/delegations/index_en.htm);
by contacting the Europe Direct service
(http://europa.eu/europedirect/index_en.htm) or calling 00 800 6 7 8 9 10 11
(freephone number from anywhere in the EU) (*).
(*) The information given is free, as are most calls (though some operators, phone boxes or hotels may charge you).
Priced publications:
via EU Bookshop (http://bookshop.europa.eu).
Priced subscriptions:
via one of the sales agents of the Publications Office of the European Union
(http://publications.europa.eu/others/agents/index_en.htm).