advancing sustainable materials management: 2014 fact sheet
TRANSCRIPT
Advancing Sustainable Materials Management:
2014 Fact SheetAssessing Trends in Material Generation, Recycling,
Composting, Combustion with Energy Recovery and Landfilling in the United States
November 2016
2
IntroductionU.S. Environmental Protection Agency (EPA) has collected and reported data on the generation and disposition of waste in the United States for more than 30 years. We use this information to measure the success of waste reduction and recycling programs across the country and characterize our national waste stream. These facts and figures are current through calendar year 2014.
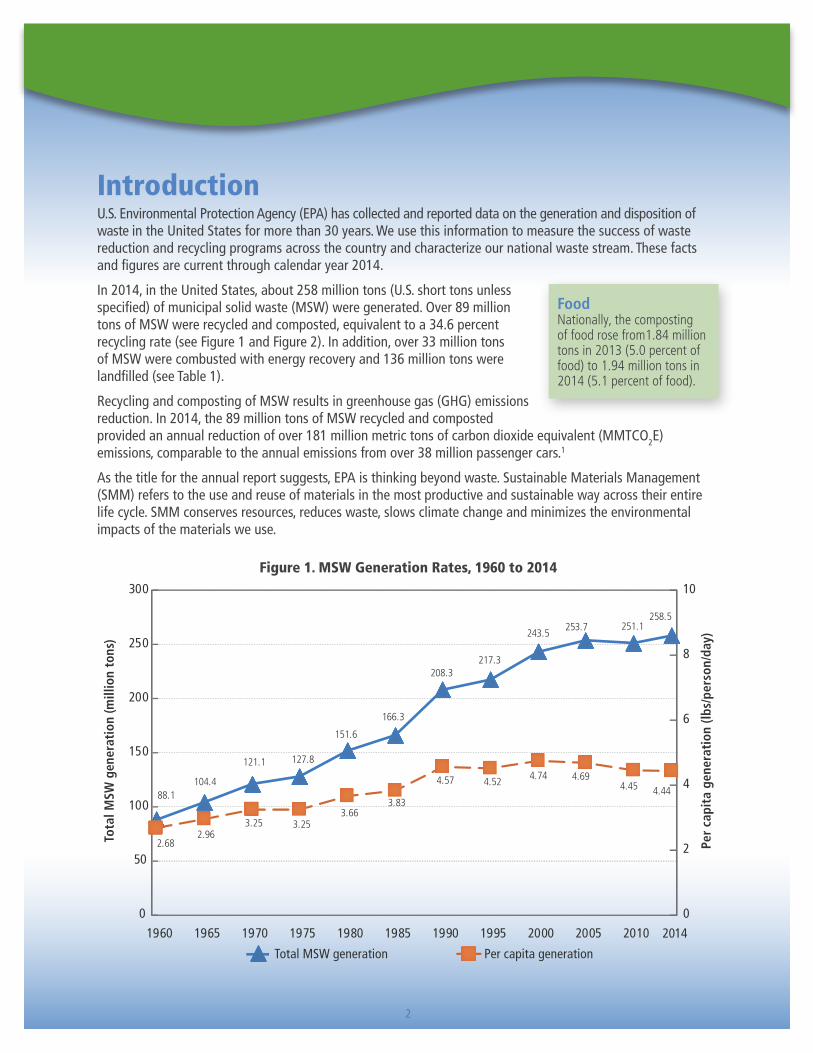
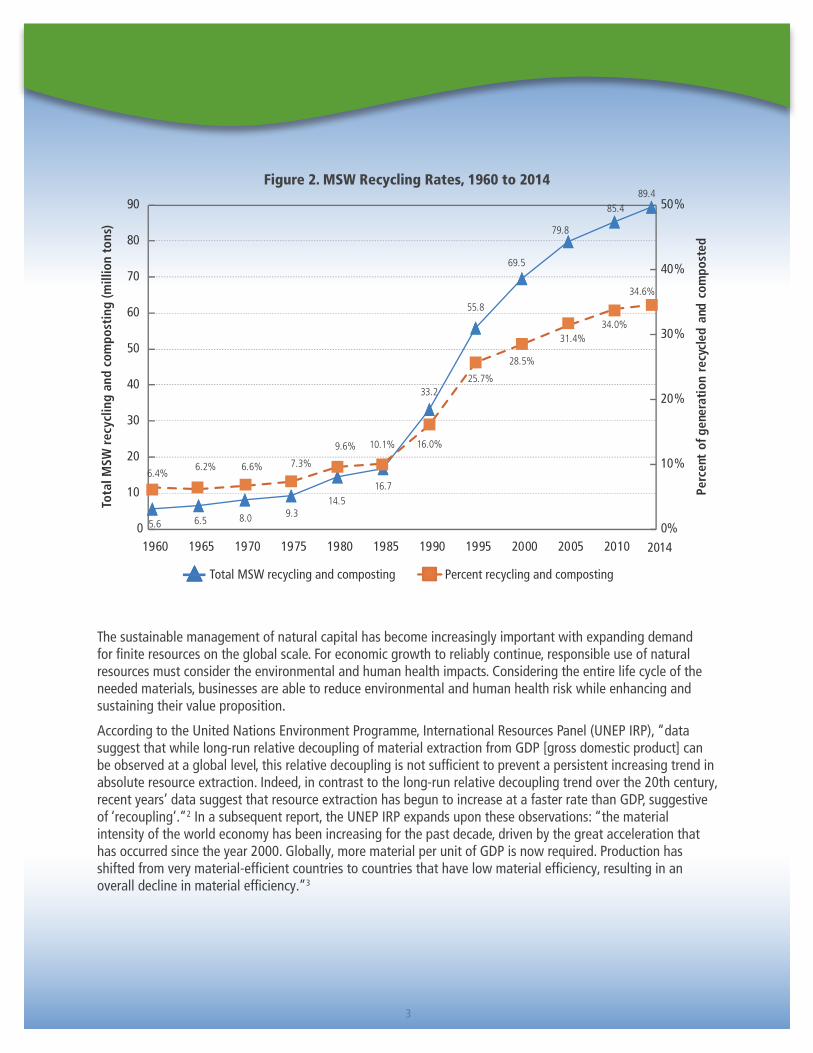
In 2014, in the United States, about 258 million tons (U.S. short tons unless specified) of municipal solid waste (MSW) were generated. Over 89 million tons of MSW were recycled and composted, equivalent to a 34.6 percent recycling rate (see Figure 1 and Figure 2). In addition, over 33 million tons of MSW were combusted with energy recovery and 136 million tons were landfilled (see Table 1).
Recycling and composting of MSW results in greenhouse gas (GHG) emissions reduction. In 2014, the 89 million tons of MSW recycled and composted provided an annual reduction of over 181 million metric tons of carbon dioxide equivalent (MMTCO2E) emissions, comparable to the annual emissions from over 38 million passenger cars.1
As the title for the annual report suggests, EPA is thinking beyond waste. Sustainable Materials Management (SMM) refers to the use and reuse of materials in the most productive and sustainable way across their entire life cycle. SMM conserves resources, reduces waste, slows climate change and minimizes the environmental impacts of the materials we use.
Total MSW generation Per capita generation
88.1104.4
121.1 127.8
151.6
166.3
208.3217.3
243.5253.7 251.1
258.5
2.682.96
3.25 3.253.66
3.83
4.57 4.52 4.74 4.694.45 4.44
0
2
4
6
8
10
0
50
100
150
200
250
300
1960 1965 1970 1975 1980 1985 1990 1995 2000 2005 2010 2014
Per
capi
ta g
ener
atio
n (lb
s/pe
rson
/day
)
Tota
l MSW
gen
erat
ion
(mill
ion
tons
)
Figure 1. MSW Generation Rates, 1960 to 2014
Food Nationally, the composting of food rose from1.84 million tons in 2013 (5.0 percent of food) to 1.94 million tons in 2014 (5.1 percent of food).
3
The sustainable management of natural capital has become increasingly important with expanding demand for finite resources on the global scale. For economic growth to reliably continue, responsible use of natural resources must consider the environmental and human health impacts. Considering the entire life cycle of the needed materials, businesses are able to reduce environmental and human health risk while enhancing and sustaining their value proposition.
According to the United Nations Environment Programme, International Resources Panel (UNEP IRP), “data suggest that while long-run relative decoupling of material extraction from GDP [gross domestic product] can be observed at a global level, this relative decoupling is not sufficient to prevent a persistent increasing trend in absolute resource extraction. Indeed, in contrast to the long-run relative decoupling trend over the 20th century, recent years’ data suggest that resource extraction has begun to increase at a faster rate than GDP, suggestive of ‘recoupling’.”2 In a subsequent report, the UNEP IRP expands upon these observations: “the material intensity of the world economy has been increasing for the past decade, driven by the great acceleration that has occurred since the year 2000. Globally, more material per unit of GDP is now required. Production has shifted from very material-efficient countries to countries that have low material efficiency, resulting in an overall decline in material efficiency.”3
Figure 2. MSW Recycling Rates, 1960 to 2014
5.6 6.5 8.0 9.314.5
16.7
33.2
55.8
69.5
79.8
85.489.4
6.4%6.2% 6.6% 7.3%
9.6% 10.1% 16.0%
25.7%
28.5%
31.4%34.0%
34.6%
0%
10%
20%
30%
40%
50%
0
10
20
30
40
50
60
70
80
90
1960 1965 1970 1975 1980 1985 1990 1995 2000 2005 2010 2014
Perc
ent
of g
ener
atio
n re
cycl
ed a
nd c
ompo
sted
Tota
l MSW
rec
yclin
g an
d co
mpo
stin
g (m
illio
n to
ns)
Total MSW recycling and composting Percent recycling and composting
4
Trends in Municipal Solid Waste in 2014 Our trash, or MSW, is comprised of various items Americans commonly throw away after being used. These items include packaging, food, yard trimmings, furniture, electronics, tires and appliances. MSW does not include industrial, hazardous or construction waste.
In 2014, about 66.4 million tons of MSW were recyled, 23 million tons were composted, 33.1 million tons were combusted with energy recovery and 136 million tons were landfilled.
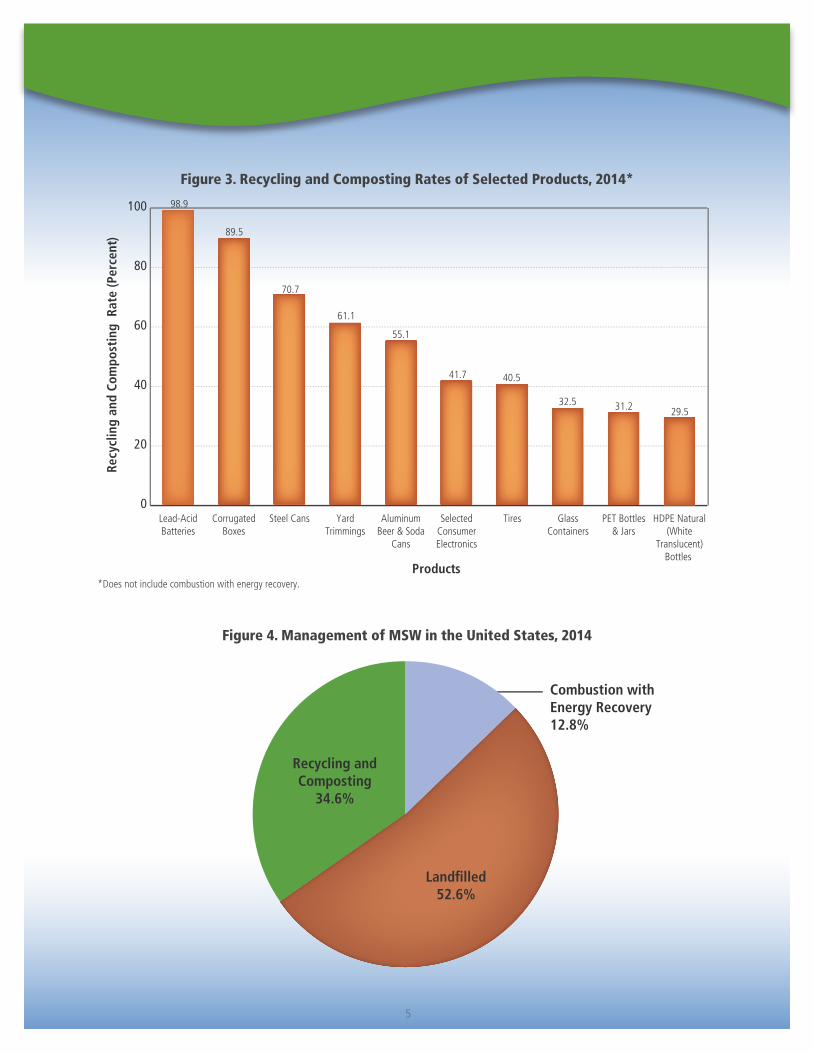
In 2014, the rate of lead-acid battery recycling was about 99 percent (2.81 million tons). The rate of corrugated box recycling was over 89 percent (27.3 million tons), and over 61 percent (21.1 million tons) of yard trimmings were composted (see Figure 3). About 135.9 million tons of MSW (52.6 percent) were landfilled in 2014 (see Figure 4).
Three materials had composting or recycling rates that rose from 2013 to 2014 — yard trimmings, selected consumer electronics and food. In 2014, the rate of yard trimmings composting was 61.1 percent (21.1 million tons), up from 60.2 percent (20.6 million tons). The rate of yard trimmings composting was 51.7 percent in the year 2000. In 2014, the rate of selected consumer electronics recycling was 41.7 percent (1.4 million tons) up from 37.8 percent in 2013 (1.3 million tons).4 This was a further increase from the year 2000, when selected consumer electronics were recycled at 10.0 percent. In 2014, the rate of food composting was 5.1 percent (1.94 million tons), up from 5.0 percent in 2013 (1.84 million tons).5 The rate of food composting was 2.2 percent in the year 2000.
Sources of MSWSources of MSW include residential waste (including waste from multi-family housing) and waste from commercial and institutional locations, such as businesses, schools and hospitals.
Over the last few decades, the generation, recycling, composting, combustion with energy recovery and landfilling of MSW changed substantially. Solid waste generation per person per day peaked in 2000. The 4.4 pounds per person per day in 2014 is about the same as in 2013, and is one of the lowest rates since before 1990. The recycling and composting rate has increased from less than 10 percent of generated MSW in1980 to over 34 percent in 2014. Combustion with energy recovery increased from less than two percent of generation in 1980 to 12.8 percent in 2014. Landfilling of waste decreased from 89 percent in 1980 to under 53 percent in 2014.
Recycling and composting did not exceed 15 percent of total MSW generation until 1990. Growth in the recycling rate was significant over the next 15 years. Over the last five years, the recycling growth rate has leveled off.
5
Figure 4. Management of MSW in the United States, 2014
Recycling andComposting
34.6%
Landfilled52.6%
Combustion withEnergy Recovery12.8%
Figure 3. Recycling and Composting Rates of Selected Products, 2014*
0
20
40
60
80
100
HDPE Natural(White
Translucent)Bottles
PET Bottles& Jars
GlassContainers
TiresSelectedConsumerElectronics
AluminumBeer & Soda
Cans
YardTrimmings
Steel CansCorrugatedBoxes
Lead-AcidBatteries
98.9
70.7
89.5
61.1
55.1
40.5
29.532.5
Recy
clin
g an
d Co
mpo
stin
g R
ate
(Per
cent
)
Products
31.2
41.7
*Does not include combustion with energy recovery.
6
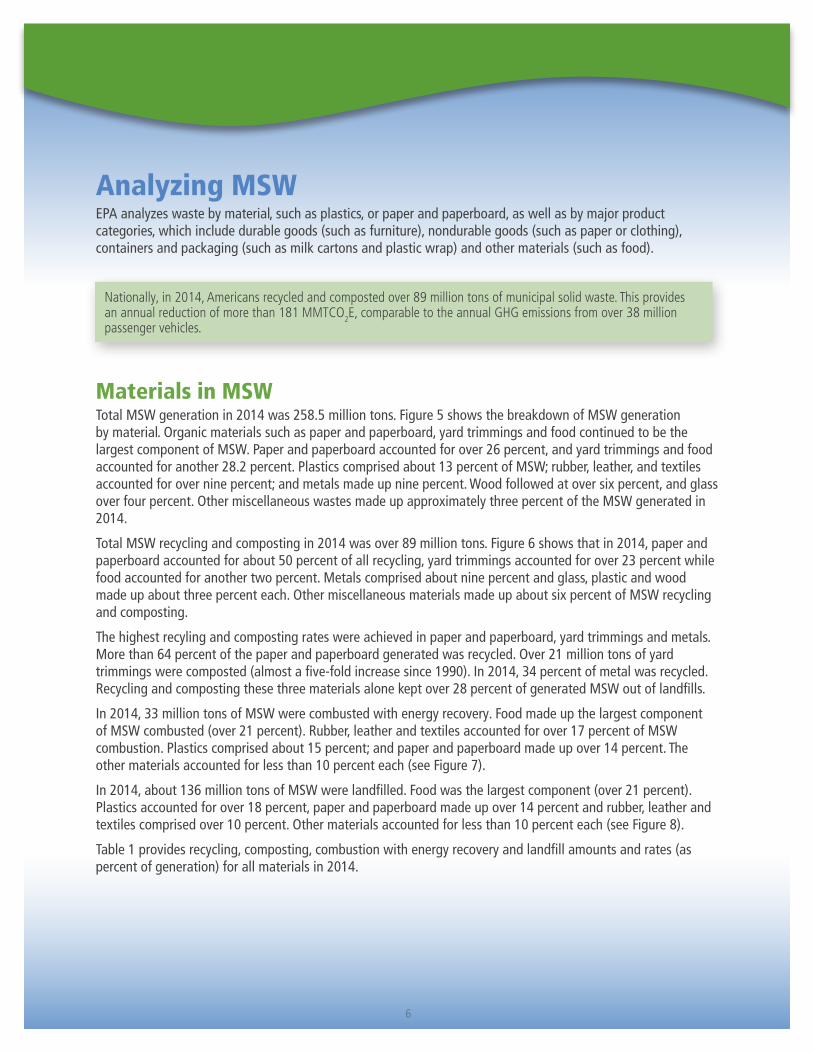
Analyzing MSWEPA analyzes waste by material, such as plastics, or paper and paperboard, as well as by major product categories, which include durable goods (such as furniture), nondurable goods (such as paper or clothing), containers and packaging (such as milk cartons and plastic wrap) and other materials (such as food).
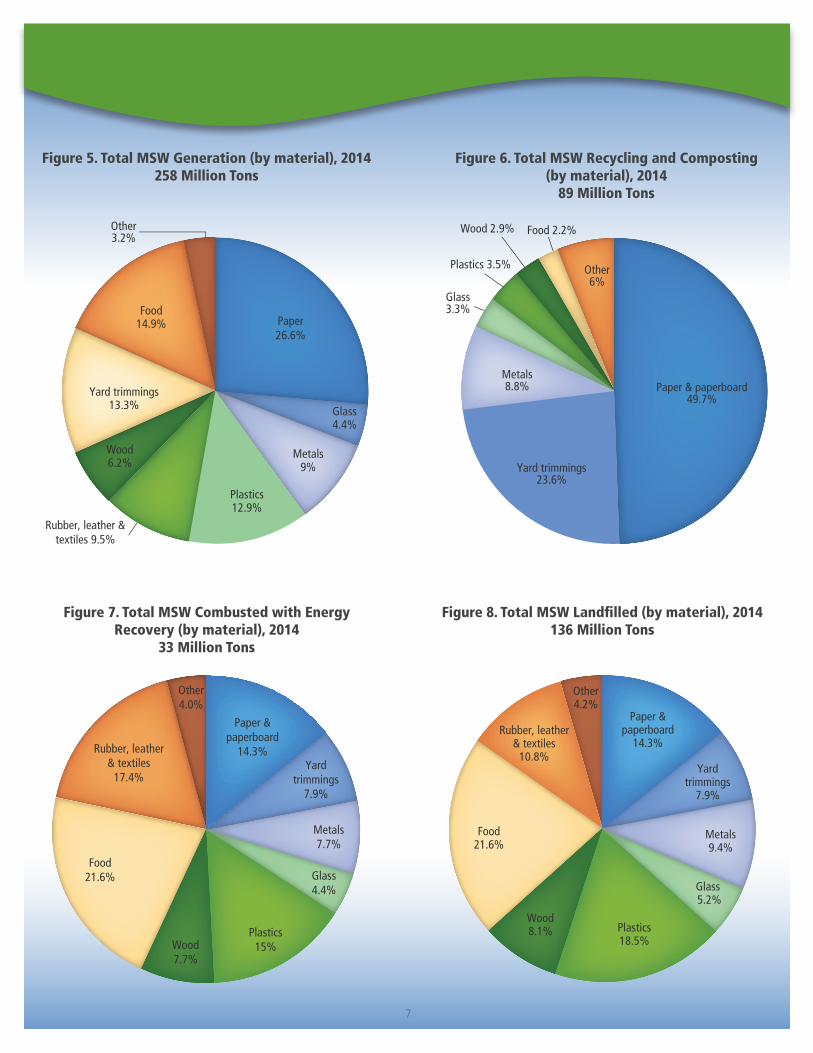
Materials in MSWTotal MSW generation in 2014 was 258.5 million tons. Figure 5 shows the breakdown of MSW generation by material. Organic materials such as paper and paperboard, yard trimmings and food continued to be the largest component of MSW. Paper and paperboard accounted for over 26 percent, and yard trimmings and food accounted for another 28.2 percent. Plastics comprised about 13 percent of MSW; rubber, leather, and textiles accounted for over nine percent; and metals made up nine percent. Wood followed at over six percent, and glass over four percent. Other miscellaneous wastes made up approximately three percent of the MSW generated in 2014.
Total MSW recycling and composting in 2014 was over 89 million tons. Figure 6 shows that in 2014, paper and paperboard accounted for about 50 percent of all recycling, yard trimmings accounted for over 23 percent while food accounted for another two percent. Metals comprised about nine percent and glass, plastic and wood made up about three percent each. Other miscellaneous materials made up about six percent of MSW recycling and composting.
The highest recyling and composting rates were achieved in paper and paperboard, yard trimmings and metals. More than 64 percent of the paper and paperboard generated was recycled. Over 21 million tons of yard trimmings were composted (almost a five-fold increase since 1990). In 2014, 34 percent of metal was recycled. Recycling and composting these three materials alone kept over 28 percent of generated MSW out of landfills.
In 2014, 33 million tons of MSW were combusted with energy recovery. Food made up the largest component of MSW combusted (over 21 percent). Rubber, leather and textiles accounted for over 17 percent of MSW combustion. Plastics comprised about 15 percent; and paper and paperboard made up over 14 percent. The other materials accounted for less than 10 percent each (see Figure 7).
In 2014, about 136 million tons of MSW were landfilled. Food was the largest component (over 21 percent). Plastics accounted for over 18 percent, paper and paperboard made up over 14 percent and rubber, leather and textiles comprised over 10 percent. Other materials accounted for less than 10 percent each (see Figure 8).
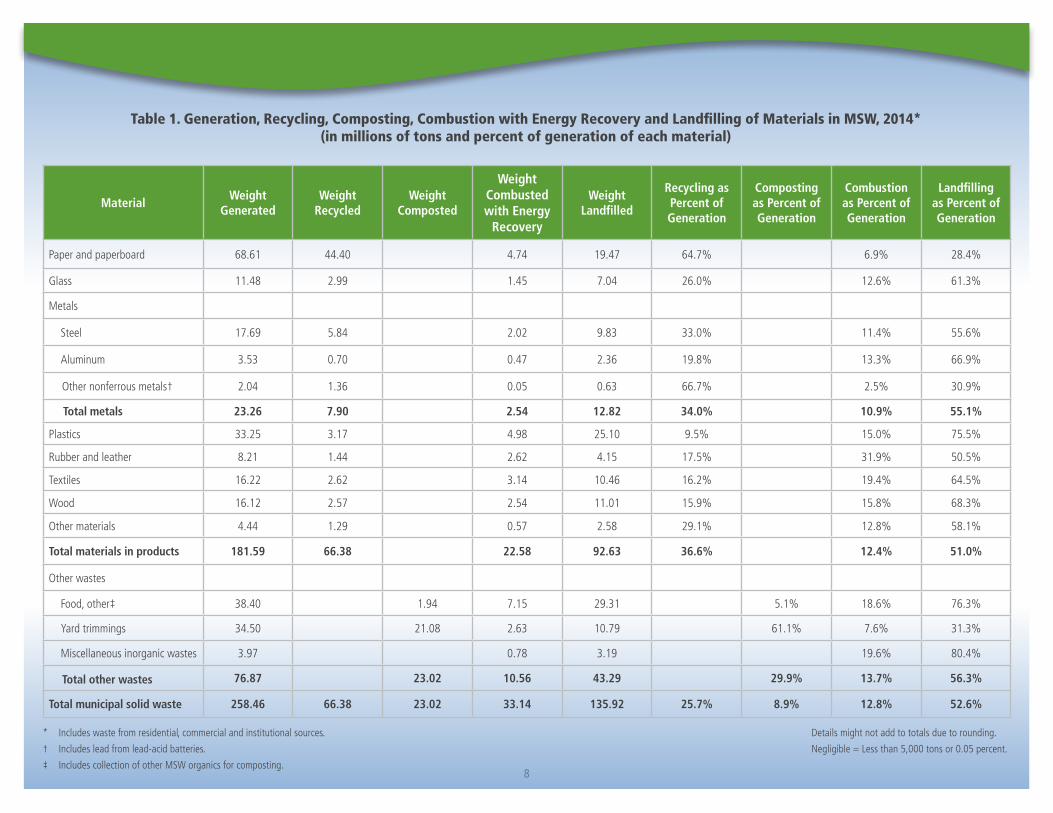
Table 1 provides recycling, composting, combustion with energy recovery and landfill amounts and rates (as percent of generation) for all materials in 2014.
Nationally, in 2014, Americans recycled and composted over 89 million tons of municipal solid waste. This provides an annual reduction of more than 181 MMTCO2E, comparable to the annual GHG emissions from over 38 million passenger vehicles.
7
Figure 5. Total MSW Generation (by material), 2014 258 Million Tons
Figure 6. Total MSW Recycling and Composting (by material), 2014
89 Million Tons
Figure 7. Total MSW Combusted with Energy Recovery (by material), 2014
33 Million Tons
Other3.2%
Food14.9%
Yard trimmings13.3%
Wood6.2%
Rubber, leather &textiles 9.5%
Plastics12.9%
Metals9%
Glass4.4%
Paper26.6%
Other6%
Food 2.2%Wood 2.9%
Plastics 3.5%
Glass3.3%
Metals8.8%
Yard trimmings23.6%
Paper & paperboard49.7%
Other4.0%
Rubber, leather& textiles
17.4%
Food21.6%
Wood7.7%
Plastics15%
Glass4.4%
Metals7.7%
Yardtrimmings
7.9%
Paper &paperboard
14.3%
Figure 8. Total MSW Landfilled (by material), 2014 136 Million Tons
Other4.2%
Rubber, leather& textiles
10.8%
Food21.6%
Wood8.1% Plastics
18.5%
Glass 5.2%
Metals9.4%
Yardtrimmings
7.9%
Paper &paperboard
14.3%
8
MaterialWeight
GeneratedWeight
RecycledWeight
Composted
Weight Combusted with Energy
Recovery
Weight Landfilled
Recycling as Percent of Generation
Composting as Percent of Generation
Combustion as Percent of Generation
Landfilling as Percent of Generation
Paper and paperboard 68.61 44.40 4.74 19.47 64.7% 6.9% 28.4%
Glass 11.48 2.99 1.45 7.04 26.0% 12.6% 61.3%
Metals
Steel 17.69 5.84 2.02 9.83 33.0% 11.4% 55.6%
Aluminum 3.53 0.70 0.47 2.36 19.8% 13.3% 66.9%
Other nonferrous metals† 2.04 1.36 0.05 0.63 66.7% 2.5% 30.9%
Total metals 23.26 7.90 2.54 12.82 34.0% 10.9% 55.1%
Plastics 33.25 3.17 4.98 25.10 9.5% 15.0% 75.5%
Rubber and leather 8.21 1.44 2.62 4.15 17.5% 31.9% 50.5%
Textiles 16.22 2.62 3.14 10.46 16.2% 19.4% 64.5%
Wood 16.12 2.57 2.54 11.01 15.9% 15.8% 68.3%
Other materials 4.44 1.29 0.57 2.58 29.1% 12.8% 58.1%
Total materials in products 181.59 66.38 22.58 92.63 36.6% 12.4% 51.0%
Other wastes
Food, other‡ 38.40 1.94 7.15 29.31 5.1% 18.6% 76.3%
Yard trimmings 34.50 21.08 2.63 10.79 61.1% 7.6% 31.3%
Miscellaneous inorganic wastes 3.97 0.78 3.19 19.6% 80.4%
Total other wastes 76.87 23.02 10.56 43.29 29.9% 13.7% 56.3%
Total municipal solid waste 258.46 66.38 23.02 33.14 135.92 25.7% 8.9% 12.8% 52.6%
Table 1. Generation, Recycling, Composting, Combustion with Energy Recovery and Landfilling of Materials in MSW, 2014* (in millions of tons and percent of generation of each material)
* Includes waste from residential, commercial and institutional sources.
† Includes lead from lead-acid batteries.
‡ Includes collection of other MSW organics for composting.
Details might not add to totals due to rounding.
Negligible = Less than 5,000 tons or 0.05 percent.
9
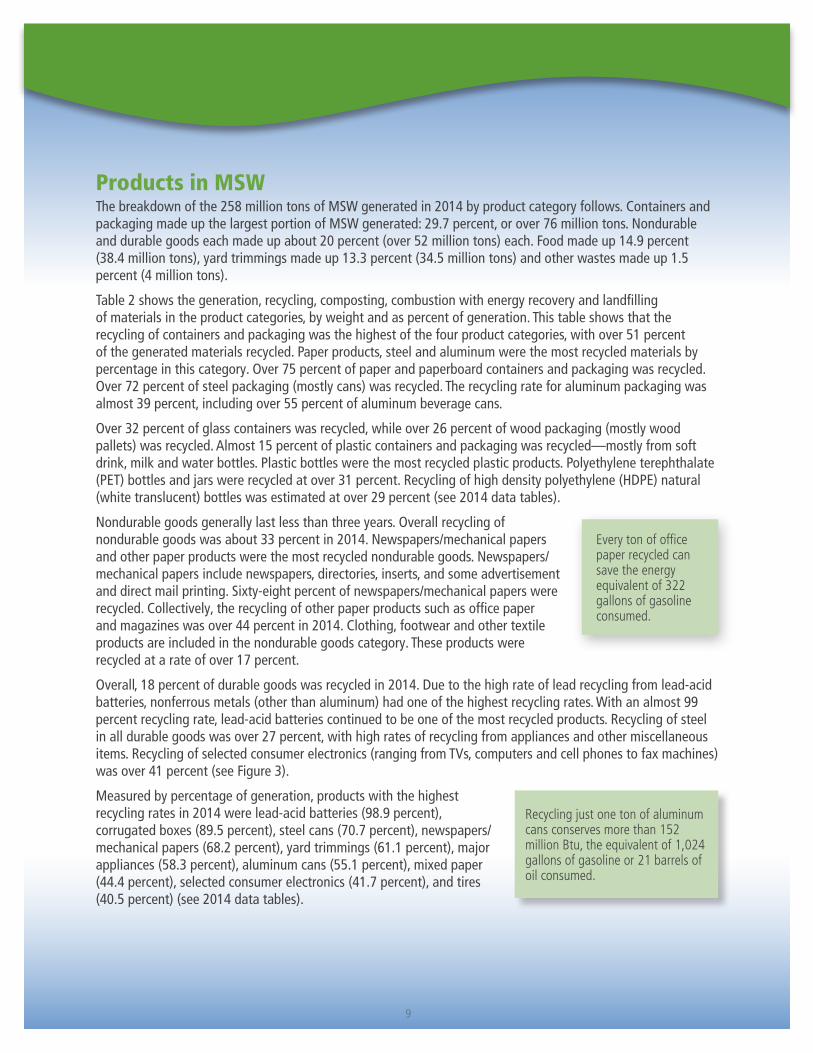
Products in MSWThe breakdown of the 258 million tons of MSW generated in 2014 by product category follows. Containers and packaging made up the largest portion of MSW generated: 29.7 percent, or over 76 million tons. Nondurable and durable goods each made up about 20 percent (over 52 million tons) each. Food made up 14.9 percent (38.4 million tons), yard trimmings made up 13.3 percent (34.5 million tons) and other wastes made up 1.5 percent (4 million tons).
Table 2 shows the generation, recycling, composting, combustion with energy recovery and landfilling of materials in the product categories, by weight and as percent of generation. This table shows that the recycling of containers and packaging was the highest of the four product categories, with over 51 percent of the generated materials recycled. Paper products, steel and aluminum were the most recycled materials by percentage in this category. Over 75 percent of paper and paperboard containers and packaging was recycled. Over 72 percent of steel packaging (mostly cans) was recycled. The recycling rate for aluminum packaging was almost 39 percent, including over 55 percent of aluminum beverage cans.
Over 32 percent of glass containers was recycled, while over 26 percent of wood packaging (mostly wood pallets) was recycled. Almost 15 percent of plastic containers and packaging was recycled—mostly from soft drink, milk and water bottles. Plastic bottles were the most recycled plastic products. Polyethylene terephthalate (PET) bottles and jars were recycled at over 31 percent. Recycling of high density polyethylene (HDPE) natural (white translucent) bottles was estimated at over 29 percent (see 2014 data tables).
Nondurable goods generally last less than three years. Overall recycling of nondurable goods was about 33 percent in 2014. Newspapers/mechanical papers and other paper products were the most recycled nondurable goods. Newspapers/mechanical papers include newspapers, directories, inserts, and some advertisement and direct mail printing. Sixty-eight percent of newspapers/mechanical papers were recycled. Collectively, the recycling of other paper products such as office paper and magazines was over 44 percent in 2014. Clothing, footwear and other textile products are included in the nondurable goods category. These products were recycled at a rate of over 17 percent.
Overall, 18 percent of durable goods was recycled in 2014. Due to the high rate of lead recycling from lead-acid batteries, nonferrous metals (other than aluminum) had one of the highest recycling rates. With an almost 99 percent recycling rate, lead-acid batteries continued to be one of the most recycled products. Recycling of steel in all durable goods was over 27 percent, with high rates of recycling from appliances and other miscellaneous items. Recycling of selected consumer electronics (ranging from TVs, computers and cell phones to fax machines)was over 41 percent (see Figure 3).
Measured by percentage of generation, products with the highest recycling rates in 2014 were lead-acid batteries (98.9 percent), corrugated boxes (89.5 percent), steel cans (70.7 percent), newspapers/mechanical papers (68.2 percent), yard trimmings (61.1 percent), major appliances (58.3 percent), aluminum cans (55.1 percent), mixed paper (44.4 percent), selected consumer electronics (41.7 percent), and tires (40.5 percent) (see 2014 data tables).
Every ton of office paper recycled can save the energy equivalent of 322 gallons of gasoline consumed.
Recycling just one ton of aluminum cans conserves more than 152 million Btu, the equivalent of 1,024 gallons of gasoline or 21 barrels of oil consumed.
10
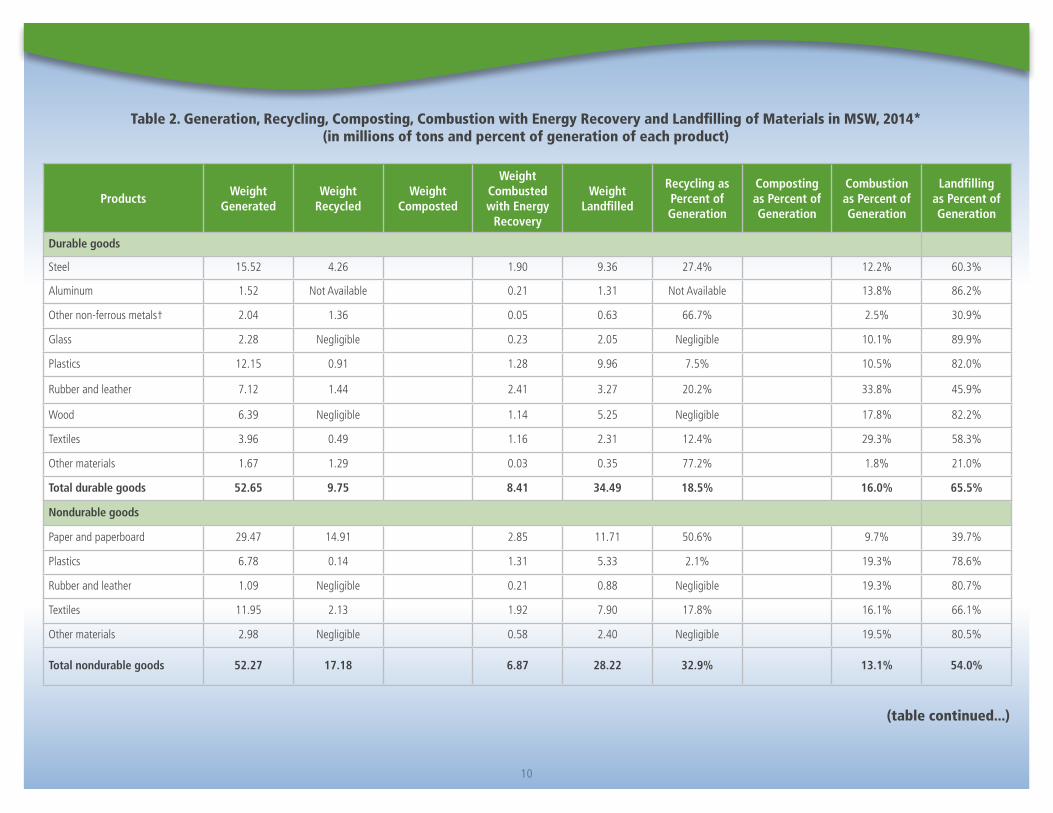
Table 2. Generation, Recycling, Composting, Combustion with Energy Recovery and Landfilling of Materials in MSW, 2014* (in millions of tons and percent of generation of each product)
ProductsWeight
GeneratedWeight
RecycledWeight
Composted
Weight Combusted with Energy
Recovery
Weight Landfilled
Recycling as Percent of Generation
Composting as Percent of Generation
Combustion as Percent of Generation
Landfilling as Percent of Generation
Durable goods
Steel 15.52 4.26 1.90 9.36 27.4% 12.2% 60.3%
Aluminum 1.52 Not Available 0.21 1.31 Not Available 13.8% 86.2%
Other non-ferrous metals† 2.04 1.36 0.05 0.63 66.7% 2.5% 30.9%
Glass 2.28 Negligible 0.23 2.05 Negligible 10.1% 89.9%
Plastics 12.15 0.91 1.28 9.96 7.5% 10.5% 82.0%
Rubber and leather 7.12 1.44 2.41 3.27 20.2% 33.8% 45.9%
Wood 6.39 Negligible 1.14 5.25 Negligible 17.8% 82.2%
Textiles 3.96 0.49 1.16 2.31 12.4% 29.3% 58.3%
Other materials 1.67 1.29 0.03 0.35 77.2% 1.8% 21.0%
Total durable goods 52.65 9.75 8.41 34.49 18.5% 16.0% 65.5%
Nondurable goods
Paper and paperboard 29.47 14.91 2.85 11.71 50.6% 9.7% 39.7%
Plastics 6.78 0.14 1.31 5.33 2.1% 19.3% 78.6%
Rubber and leather 1.09 Negligible 0.21 0.88 Negligible 19.3% 80.7%
Textiles 11.95 2.13 1.92 7.90 17.8% 16.1% 66.1%
Other materials 2.98 Negligible 0.58 2.40 Negligible 19.5% 80.5%
Total nondurable goods 52.27 17.18 6.87 28.22 32.9% 13.1% 54.0%
(table continued...)
11
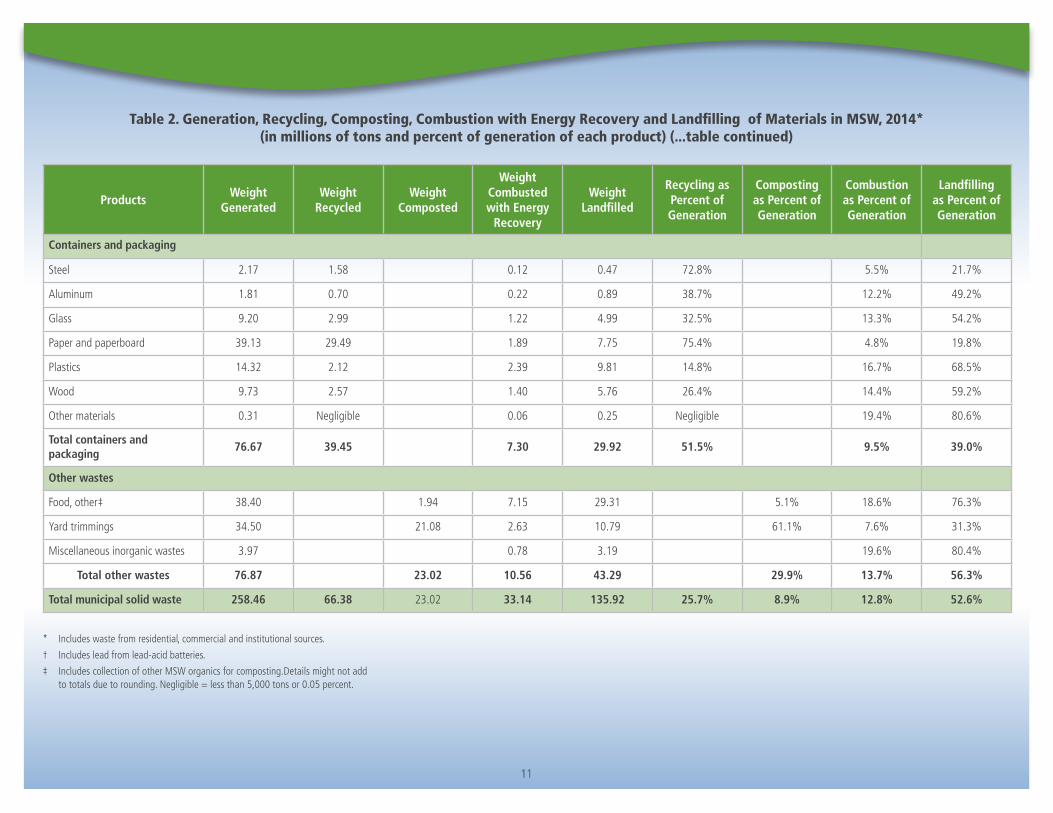
Table 2. Generation, Recycling, Composting, Combustion with Energy Recovery and Landfilling of Materials in MSW, 2014* (in millions of tons and percent of generation of each product) (...table continued)
11
ProductsWeight
GeneratedWeight
RecycledWeight
Composted
Weight Combusted with Energy
Recovery
Weight Landfilled
Recycling as Percent of Generation
Composting as Percent of Generation
Combustion as Percent of Generation
Landfilling as Percent of Generation
Containers and packaging
Steel 2.17 1.58 0.12 0.47 72.8% 5.5% 21.7%
Aluminum 1.81 0.70 0.22 0.89 38.7% 12.2% 49.2%
Glass 9.20 2.99 1.22 4.99 32.5% 13.3% 54.2%
Paper and paperboard 39.13 29.49 1.89 7.75 75.4% 4.8% 19.8%
Plastics 14.32 2.12 2.39 9.81 14.8% 16.7% 68.5%
Wood 9.73 2.57 1.40 5.76 26.4% 14.4% 59.2%
Other materials 0.31 Negligible 0.06 0.25 Negligible 19.4% 80.6%
Total containers and packaging
76.67 39.45 7.30 29.92 51.5% 9.5% 39.0%
Other wastes
Food, other‡ 38.40 1.94 7.15 29.31 5.1% 18.6% 76.3%
Yard trimmings 34.50 21.08 2.63 10.79 61.1% 7.6% 31.3%
Miscellaneous inorganic wastes 3.97 0.78 3.19 19.6% 80.4%
Total other wastes 76.87 23.02 10.56 43.29 29.9% 13.7% 56.3%
Total municipal solid waste 258.46 66.38 23.02 33.14 135.92 25.7% 8.9% 12.8% 52.6%
* Includes waste from residential, commercial and institutional sources.
† Includes lead from lead-acid batteries.
‡ Includes collection of other MSW organics for composting.Details might not add to totals due to rounding. Negligible = less than 5,000 tons or 0.05 percent.
12
Combustion with Energy RecoveryMost of the MSW combustion in the U.S. incorporates recovery of an energy product (generally steam or electricity).
� In 2014, about 33.1 million tons (12.8 percent) of materials were combusted for energy recovery (see Table 3).
� From 1990 to 2000, the quantity of MSW combusted with energy recovery increased over 13 percent to about 34 million tons.
� MSW combustion for energy recovery has decreased from about 34 million tons in 2000 to 33.1 million tons in 2014.
Landfilling of MSWWhile the number of U.S. landfills has steadily declined over the years, the average landfill size has increased. At the national level, landfill capacity appears to be sufficient for our current practices—although it is limited in some areas.
� Since 1990, the total amount of MSW going to landfills dropped by 9.3 million tons, from 145.3 million to 136 million tons in 2014 (see Table 3).
� The net per capita 2014 landfilling rate (after recycling, composting and combustion with energy recovery) was 2.3 pounds per day, lower than the 3.2 per capita rate in 1990 (see Table 4).
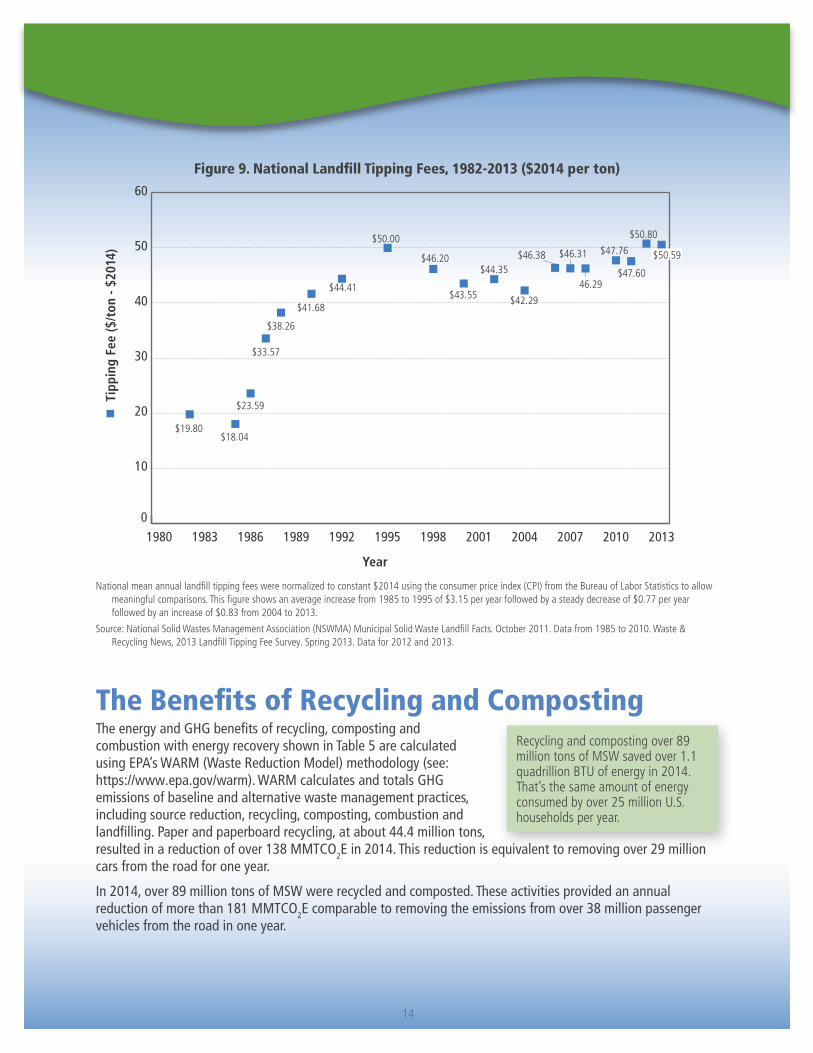
� From 1985 to 1995 there was a rapid rise in the cost to manage MSW going to landfills, followed by a steady decrease from 1995 to 2004. Since 2004, there has been a steady increase in landfill tipping fees (see Figure 9). The tipping fees are expressed in constant 2014 dollars.
13
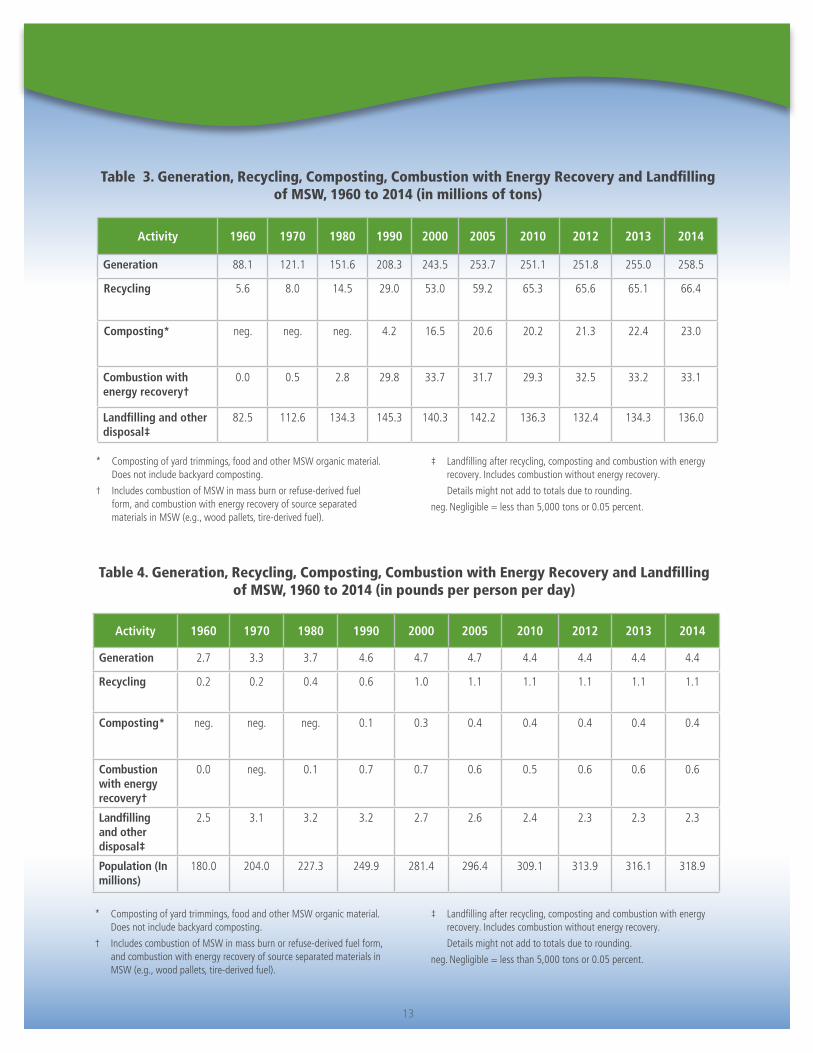
Activity 1960 1970 1980 1990 2000 2005 2010 2012 2013 2014
Generation 2.7 3.3 3.7 4.6 4.7 4.7 4.4 4.4 4.4 4.4
Recycling 0.2 0.2 0.4 0.6 1.0 1.1 1.1 1.1 1.1 1.1
Composting* neg. neg. neg. 0.1 0.3 0.4 0.4 0.4 0.4 0.4
Combustion with energy recovery†
0.0 neg. 0.1 0.7 0.7 0.6 0.5 0.6 0.6 0.6
Landfilling and other disposal‡
2.5 3.1 3.2 3.2 2.7 2.6 2.4 2.3 2.3 2.3
Population (In millions)
180.0 204.0 227.3 249.9 281.4 296.4 309.1 313.9 316.1 318.9
Table 4. Generation, Recycling, Composting, Combustion with Energy Recovery and Landfilling of MSW, 1960 to 2014 (in pounds per person per day)
* Composting of yard trimmings, food and other MSW organic material. Does not include backyard composting.
† Includes combustion of MSW in mass burn or refuse-derived fuel form, and combustion with energy recovery of source separated materials in MSW (e.g., wood pallets, tire-derived fuel).
‡ Landfilling after recycling, composting and combustion with energy recovery. Includes combustion without energy recovery.
Details might not add to totals due to rounding.
neg. Negligible = less than 5,000 tons or 0.05 percent.
Activity 1960 1970 1980 1990 2000 2005 2010 2012 2013 2014
Generation 88.1 121.1 151.6 208.3 243.5 253.7 251.1 251.8 255.0 258.5
Recycling 5.6 8.0 14.5 29.0 53.0 59.2 65.3 65.6 65.1 66.4
Composting* neg. neg. neg. 4.2 16.5 20.6 20.2 21.3 22.4 23.0
Combustion with energy recovery†
0.0 0.5 2.8 29.8 33.7 31.7 29.3 32.5 33.2 33.1
Landfilling and other disposal‡
82.5 112.6 134.3 145.3 140.3 142.2 136.3 132.4 134.3 136.0
Table 3. Generation, Recycling, Composting, Combustion with Energy Recovery and Landfilling of MSW, 1960 to 2014 (in millions of tons)
* Composting of yard trimmings, food and other MSW organic material. Does not include backyard composting.
† Includes combustion of MSW in mass burn or refuse-derived fuel form, and combustion with energy recovery of source separated materials in MSW (e.g., wood pallets, tire-derived fuel).
‡ Landfilling after recycling, composting and combustion with energy recovery. Includes combustion without energy recovery.
Details might not add to totals due to rounding.
neg. Negligible = less than 5,000 tons or 0.05 percent.
14
Tipp
ing
Fee
($/t
on -
$201
4)
0
10
20
30
40
50
60
201320102007200420011998199519921989198619831980
Year
$19.80$18.04
$23.59
$33.57
$38.26
$41.68
$44.41
$50.00
$46.20
$43.55
$44.35
$42.29
$46.38
46.29$47.60
$47.76
$50.80
$46.31 $50.59
Figure 9. National Landfill Tipping Fees, 1982-2013 ($2014 per ton)
National mean annual landfill tipping fees were normalized to constant $2014 using the consumer price index (CPI) from the Bureau of Labor Statistics to allow meaningful comparisons. This figure shows an average increase from 1985 to 1995 of $3.15 per year followed by a steady decrease of $0.77 per year followed by an increase of $0.83 from 2004 to 2013.
Source: National Solid Wastes Management Association (NSWMA) Municipal Solid Waste Landfill Facts. October 2011. Data from 1985 to 2010. Waste & Recycling News, 2013 Landfill Tipping Fee Survey. Spring 2013. Data for 2012 and 2013.
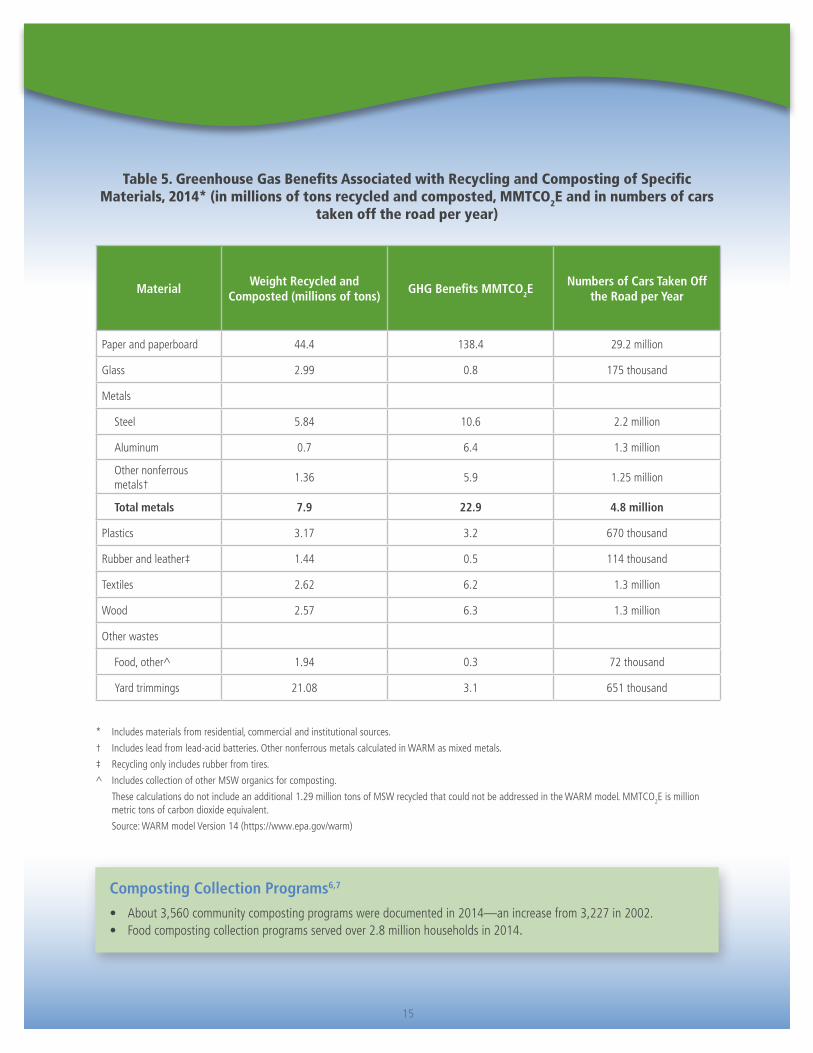
The Benefits of Recycling and CompostingThe energy and GHG benefits of recycling, composting and combustion with energy recovery shown in Table 5 are calculated using EPA’s WARM (Waste Reduction Model) methodology (see: https://www.epa.gov/warm). WARM calculates and totals GHG emissions of baseline and alternative waste management practices, including source reduction, recycling, composting, combustion and landfilling. Paper and paperboard recycling, at about 44.4 million tons, resulted in a reduction of over 138 MMTCO2E in 2014. This reduction is equivalent to removing over 29 million cars from the road for one year.
In 2014, over 89 million tons of MSW were recycled and composted. These activities provided an annual reduction of more than 181 MMTCO2E comparable to removing the emissions from over 38 million passenger vehicles from the road in one year.
Recycling and composting over 89 million tons of MSW saved over 1.1 quadrillion BTU of energy in 2014. That’s the same amount of energy consumed by over 25 million U.S. households per year.
15
MaterialWeight Recycled and
Composted (millions of tons)GHG Benefits MMTCO2E
Numbers of Cars Taken Off the Road per Year
Paper and paperboard 44.4 138.4 29.2 million
Glass 2.99 0.8 175 thousand
Metals
Steel 5.84 10.6 2.2 million
Aluminum 0.7 6.4 1.3 million
Other nonferrous metals†
1.36 5.9 1.25 million
Total metals 7.9 22.9 4.8 million
Plastics 3.17 3.2 670 thousand
Rubber and leather‡ 1.44 0.5 114 thousand
Textiles 2.62 6.2 1.3 million
Wood 2.57 6.3 1.3 million
Other wastes
Food, other^ 1.94 0.3 72 thousand
Yard trimmings 21.08 3.1 651 thousand
Table 5. Greenhouse Gas Benefits Associated with Recycling and Composting of Specific Materials, 2014* (in millions of tons recycled and composted, MMTCO2E and in numbers of cars
taken off the road per year)
* Includes materials from residential, commercial and institutional sources.
† Includes lead from lead-acid batteries. Other nonferrous metals calculated in WARM as mixed metals.
‡ Recycling only includes rubber from tires.
^ Includes collection of other MSW organics for composting.
These calculations do not include an additional 1.29 million tons of MSW recycled that could not be addressed in the WARM model. MMTCO2E is million metric tons of carbon dioxide equivalent.
Source: WARM model Version 14 (https://www.epa.gov/warm)
Composting Collection Programs6,7
• About 3,560 community composting programs were documented in 2014—an increase from 3,227 in 2002.• Food composting collection programs served over 2.8 million households in 2014.
16
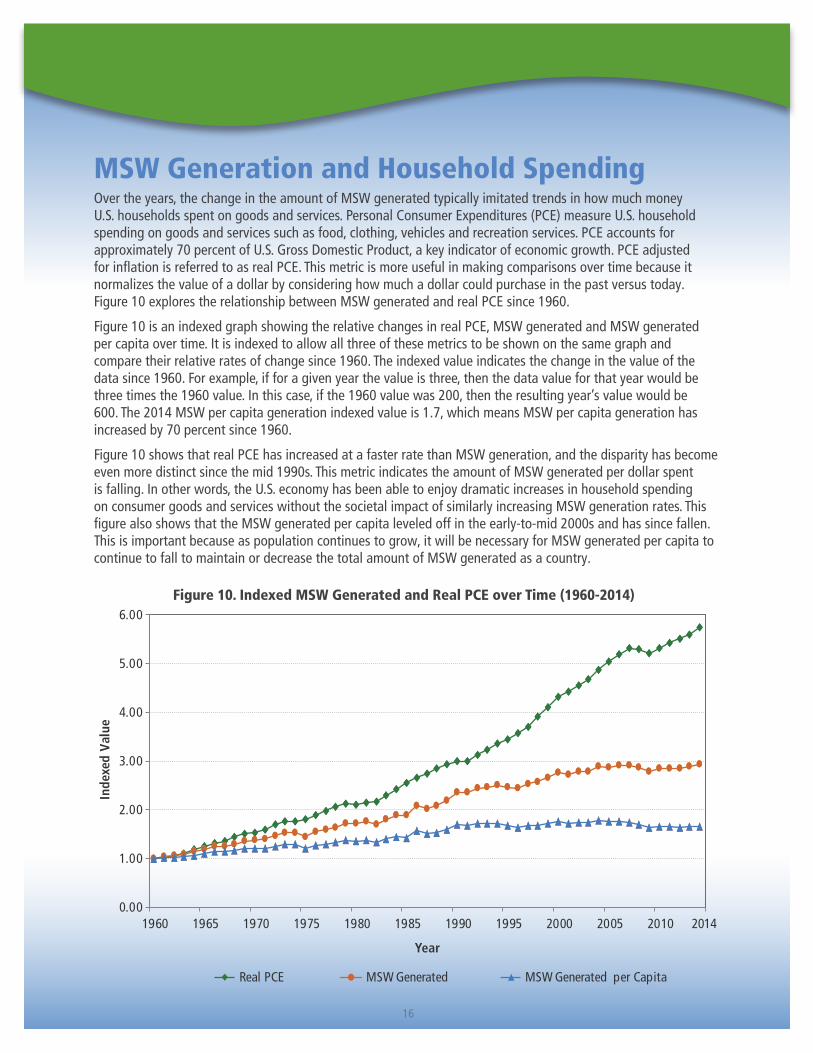
MSW Generation and Household SpendingOver the years, the change in the amount of MSW generated typically imitated trends in how much money U.S. households spent on goods and services. Personal Consumer Expenditures (PCE) measure U.S. household spending on goods and services such as food, clothing, vehicles and recreation services. PCE accounts for approximately 70 percent of U.S. Gross Domestic Product, a key indicator of economic growth. PCE adjusted for inflation is referred to as real PCE. This metric is more useful in making comparisons over time because it normalizes the value of a dollar by considering how much a dollar could purchase in the past versus today. Figure 10 explores the relationship between MSW generated and real PCE since 1960.
Figure 10 is an indexed graph showing the relative changes in real PCE, MSW generated and MSW generated per capita over time. It is indexed to allow all three of these metrics to be shown on the same graph and compare their relative rates of change since 1960. The indexed value indicates the change in the value of the data since 1960. For example, if for a given year the value is three, then the data value for that year would be three times the 1960 value. In this case, if the 1960 value was 200, then the resulting year’s value would be 600. The 2014 MSW per capita generation indexed value is 1.7, which means MSW per capita generation has increased by 70 percent since 1960.
Figure 10 shows that real PCE has increased at a faster rate than MSW generation, and the disparity has become even more distinct since the mid 1990s. This metric indicates the amount of MSW generated per dollar spent is falling. In other words, the U.S. economy has been able to enjoy dramatic increases in household spending on consumer goods and services without the societal impact of similarly increasing MSW generation rates. This figure also shows that the MSW generated per capita leveled off in the early-to-mid 2000s and has since fallen. This is important because as population continues to grow, it will be necessary for MSW generated per capita to continue to fall to maintain or decrease the total amount of MSW generated as a country.
Figure 10. Indexed MSW Generated and Real PCE over Time (1960-2014)
0.00
1.00
2.00
3.00
4.00
5.00
6.00
1960 1965 1970 1975 1980 1985 1990 1995 2000 2005 2010 2014
Real PCE MSW Generated MSW Generated per Capita
Year
Inde
xed
Val
ue
17
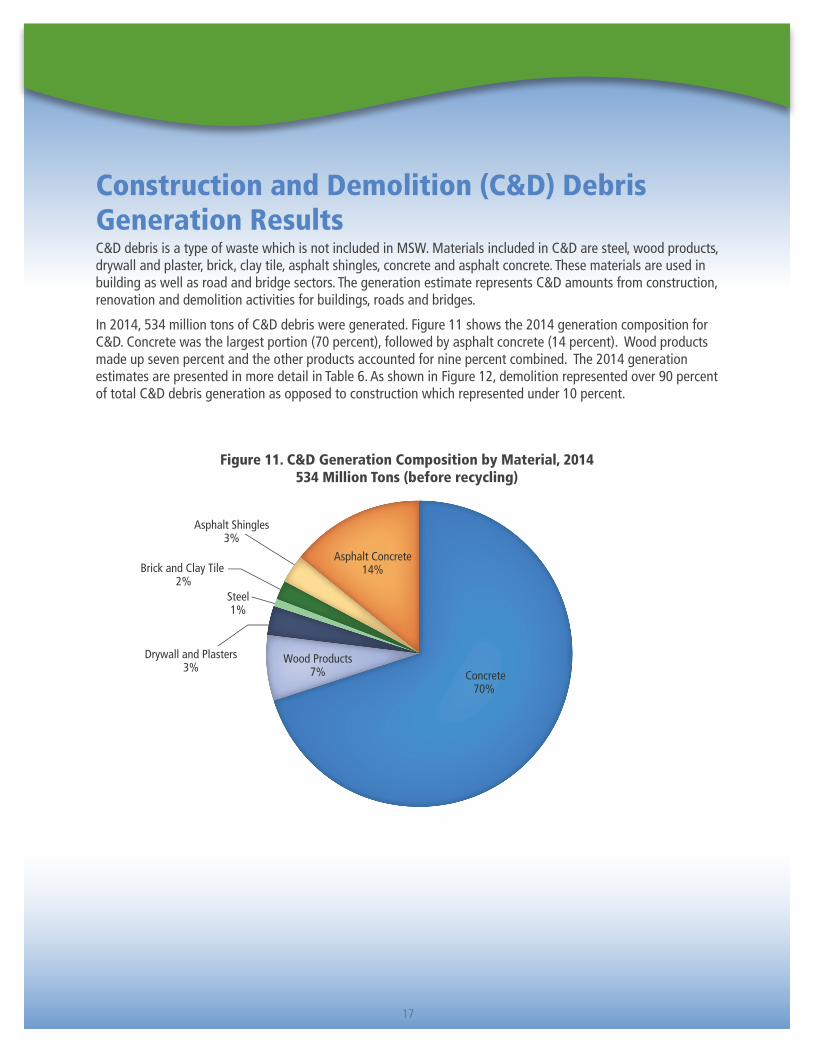
Construction and Demolition (C&D) Debris Generation ResultsC&D debris is a type of waste which is not included in MSW. Materials included in C&D are steel, wood products, drywall and plaster, brick, clay tile, asphalt shingles, concrete and asphalt concrete. These materials are used in building as well as road and bridge sectors. The generation estimate represents C&D amounts from construction, renovation and demolition activities for buildings, roads and bridges.
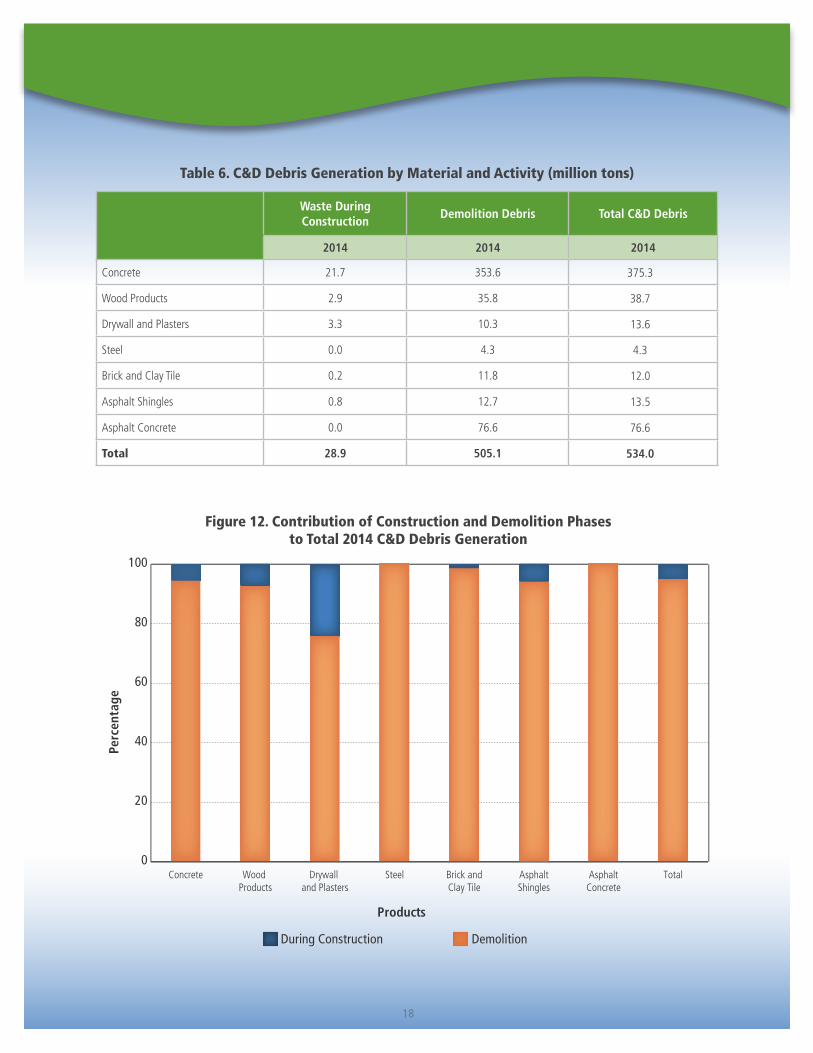
In 2014, 534 million tons of C&D debris were generated. Figure 11 shows the 2014 generation composition for C&D. Concrete was the largest portion (70 percent), followed by asphalt concrete (14 percent). Wood products made up seven percent and the other products accounted for nine percent combined. The 2014 generation estimates are presented in more detail in Table 6. As shown in Figure 12, demolition represented over 90 percent of total C&D debris generation as opposed to construction which represented under 10 percent.
Figure 11. C&D Generation Composition by Material, 2014534 Million Tons (before recycling)
Asphalt Concrete14%
Asphalt Shingles3%
Brick and Clay Tile 2%
Steel1%
Drywall and Plasters3%
Wood Products7% Concrete
70%
18
Waste During Construction
Demolition Debris Total C&D Debris
2014 2014 2014
Concrete 21.7 353.6 375.3
Wood Products 2.9 35.8 38.7
Drywall and Plasters 3.3 10.3 13.6
Steel 0.0 4.3 4.3
Brick and Clay Tile 0.2 11.8 12.0
Asphalt Shingles 0.8 12.7 13.5
Asphalt Concrete 0.0 76.6 76.6
Total 28.9 505.1 534.0
Table 6. C&D Debris Generation by Material and Activity (million tons)
Figure 12. Contribution of Construction and Demolition Phasesto Total 2014 C&D Debris Generation
0
20
40
60
80
100
TotalAsphaltConcrete
AsphaltShingles
Brick andClay Tile
SteelDrywall and Plasters
Wood Products
Concrete
Perc
enta
ge
Products
DemolitionDuring Construction
19
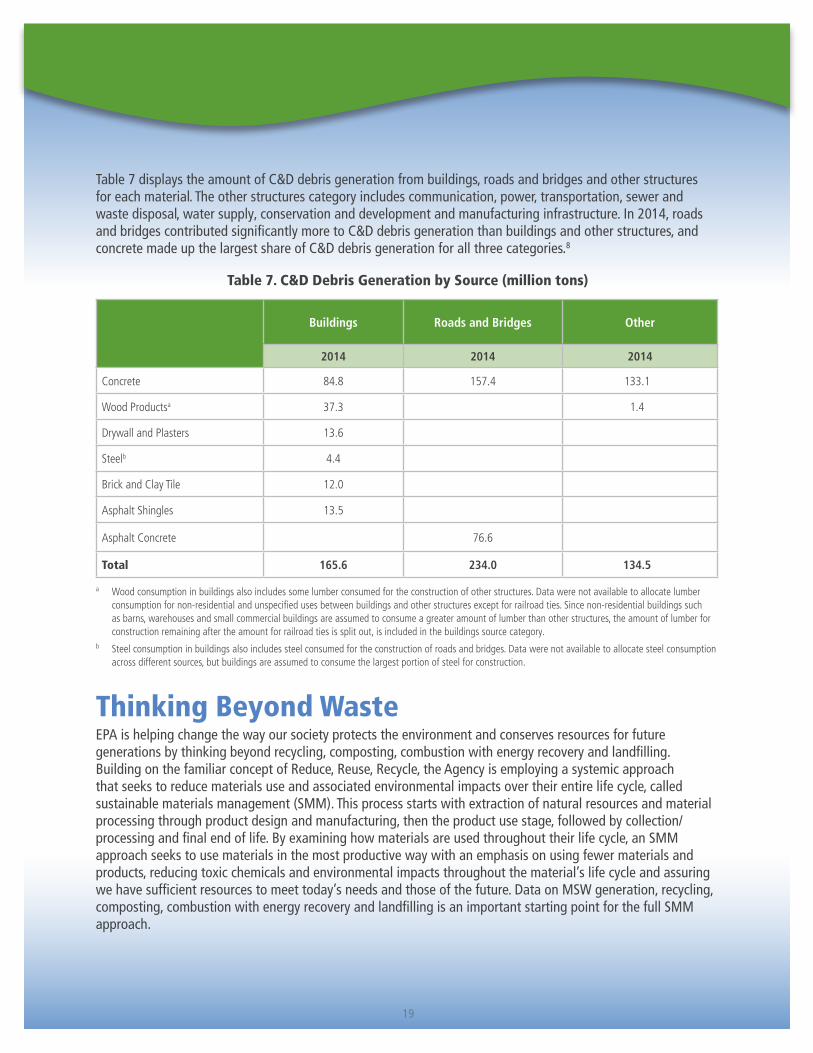
Table 7 displays the amount of C&D debris generation from buildings, roads and bridges and other structures for each material. The other structures category includes communication, power, transportation, sewer and waste disposal, water supply, conservation and development and manufacturing infrastructure. In 2014, roads and bridges contributed significantly more to C&D debris generation than buildings and other structures, and concrete made up the largest share of C&D debris generation for all three categories.8
Thinking Beyond WasteEPA is helping change the way our society protects the environment and conserves resources for future generations by thinking beyond recycling, composting, combustion with energy recovery and landfilling. Building on the familiar concept of Reduce, Reuse, Recycle, the Agency is employing a systemic approach that seeks to reduce materials use and associated environmental impacts over their entire life cycle, called sustainable materials management (SMM). This process starts with extraction of natural resources and material processing through product design and manufacturing, then the product use stage, followed by collection/processing and final end of life. By examining how materials are used throughout their life cycle, an SMM approach seeks to use materials in the most productive way with an emphasis on using fewer materials and products, reducing toxic chemicals and environmental impacts throughout the material’s life cycle and assuring we have sufficient resources to meet today’s needs and those of the future. Data on MSW generation, recycling, composting, combustion with energy recovery and landfilling is an important starting point for the full SMM approach.
Buildings Roads and Bridges Other
2014 2014 2014
Concrete 84.8 157.4 133.1
Wood Productsa 37.3 1.4
Drywall and Plasters 13.6
Steelb 4.4
Brick and Clay Tile 12.0
Asphalt Shingles 13.5
Asphalt Concrete 76.6
Total 165.6 234.0 134.5
Table 7. C&D Debris Generation by Source (million tons)
a Wood consumption in buildings also includes some lumber consumed for the construction of other structures. Data were not available to allocate lumber consumption for non-residential and unspecified uses between buildings and other structures except for railroad ties. Since non-residential buildings such as barns, warehouses and small commercial buildings are assumed to consume a greater amount of lumber than other structures, the amount of lumber for construction remaining after the amount for railroad ties is split out, is included in the buildings source category.
b Steel consumption in buildings also includes steel consumed for the construction of roads and bridges. Data were not available to allocate steel consumption across different sources, but buildings are assumed to consume the largest portion of steel for construction.
20
ResourcesThe data summarized in this fact sheet characterizes the MSW stream as a whole by using a materials flow methodology that relies on a mass balance approach. EPA recognizes that there are several approaches to measuring material flows (e.g. volume). To be consistent, EPA reports the materials quantities in tons in the current fact sheet but will continue to explore options for alternative measurement quantifications to describe materials management in the U.S.
EPA has consistently used materials flow analysis (MFA) to allow for comparison of data over the last three decades. EPA recognizes this methodology differs from other methodologies that also estimate generation of MSW and other waste data. EPA will continue to work with stakeholders to identify methodologies and additional publically available data to improve our national understanding of materials flow in the U.S.
The following provides an example of how the materials flow methodology is used in the fact sheet. To determine the amounts of paper recycled, information is gathered on the amounts processed by paper mills and made into new paper on a national basis plus recycled paper exported, instead of counting paper collected for recycling on a state-by-state basis. Using data gathered from industry associations, businesses and government sources, such as the U.S. Department of Commerce and the U.S. Census Bureau we estimate tons of materials and products gener ated, recycled, composted, combusted with energy recovery and landfilled. Other sources of data, such as waste characterizations and research reports performed by governments, industry or the press, supplement these data. The data on C&D debris generated summarized in this report is also developed using a materials flow methodology.
The benefits of MSW recycling and composting, such as elimination of GHG emissions, are calculated using EPA’s WARM methodology. WARM calculates and totals GHG emissions of baseline and alternative waste management practices including source reduction, recycling, composting, combustion and landfilling. The model calculates emissions in metric tons of carbon equivalent (MTCE), metric tons of carbon dioxide equivalent (MTCO2E) and energy units (million Btu) across a wide range of material types commonly found in MSW. EPA developed GHG emissions reduction factors through a life-cycle assessment methodology. Please see: https://www.epa.gov/warm.
The 2014 data tables and Summaries of the MSW characterization methodology and WARM are available on the EPA website along with information about waste reduction, recycling and sustainable materials management.
Please see:
https://www.epa.gov/smm/advancing-sustainable-materials-management-facts-and-figures-report
https://www.epa.gov/recycle
https://www.epa.gov/smm
21
Endnotes1. All benefit calculations in the fact sheet are derived from WARM version 14. Source: Waste Reduction Model (WARM). U.S. Environmental Protection
Agency. https://www.epa.gov/warm.
2. UNEP (2016) Resource Efficiency: Potential and Economic Implications. A report of the International Resource Panel. Ekins, P., Hughes, N., et al., p. 15. https://www.env.go.jp/press/files/jp/102839.pdf
3. UNEP (2016). Global Material Flows and Resource Productivity. An Assessment Study of the UNEP International Resource Panel. H. Schandl, M. Fischer-Kowalski, J. West, S. Giljum, M. Dittrich, N. Eisenmenger, A. Geschke, M. Lieber, H. P. Wieland, A. Schaffartzik, F. Krausmann, S. Gierlinger, K. Hosking, M. Lenzen, H. Tanikawa, A. Miatto, and T. Fishman. Paris, United Nations Environment Programme, p. 16.
4. “Electronic Products Generation and Recycling in the United States, 2013 and 2014” U.S. Environmental Protection Agency (2016). https://www.epa.gov/smm/studies-summary-tables-and-data-related-advancing-sustainable-materials-management-report
5. “Food Waste Management in the United States, 2014” U.S. Environmental Protection Agency (2016). https://www.epa.gov/smm/studies-summary-tables-and-data-related-advancing-sustainable-materials-management-report
6. Source for 2002 community composting program data: “The State of Garbage In America.” Simmons, Phil, Scott M. Kaufman, and Nickolas J. Themelis. BioCycle 47, no. 4, p. 26 (2006). Sources for 2014 data: “State of Composting in the U.S.: What, Why, Where & How.” Institute for Local Self-Reliance (2014); Advancing Sustainable Materials Management: Facts and Figures 2013. U.S. Environmental Protection Agency (2015). https://www.epa.gov/smm/advancing-sustainable-materials-management-facts-and-figures-report
7. Sources for food composting collection programs: “Residential Food Waste Collection in the U.S. — BioCycle Nationwide Survey.” Supplemental tables. BioCycle 54, no. 3, p. 23 (2013); Advancing Sustainable Materials Management: Facts and Figures 2013. U.S. Environmental Protection Agency (2015). https://www.epa.gov/smm/advancing-sustainable-materials-management-facts-and-figures-report
8. “Construction and Demolition Debris Generation in the United States, 2014” U.S. Environmental Protection Agency (2016). https://www.epa.gov/smm/studies-summary-tables-and-data-related-advancing-sustainable-materials-management-report
United States Environmental Protection Agency Office of Land and Emergency Management (5306P) Washington, DC 20460
Official Business Penalty for Private Use $300
EPA530-R-17-01
November 2016