fund fact sheet - indiafirst life insurance
TRANSCRIPT

Disclaimer: Past performance may or may not be sustained in future and is not a guarantee of future performance. Some of the contents of this document may contain statements / estimates / expectations / predictions, which may be 'forward looking'. The actual outcomes could differ materially from those expressed /implied in this document. These statements, do not intend to provide personal recommendation to any specific individual or any investment needs of an individual. The recommendations / statements / estimates / expectations / predictions are of general in nature and may not take into account the specific investment needs or risk appetite or financial situations of individual clients. Therefore, before acting on any advice or recommendations contained in this document, readers, in their own interest, should consider seeking advice from any authorized and professional investment advisors or financial consultants.’
Fund Fact SheetUnit Linked Insurance Plans – Individual policyholders June 2021
3M 6M 1 Year
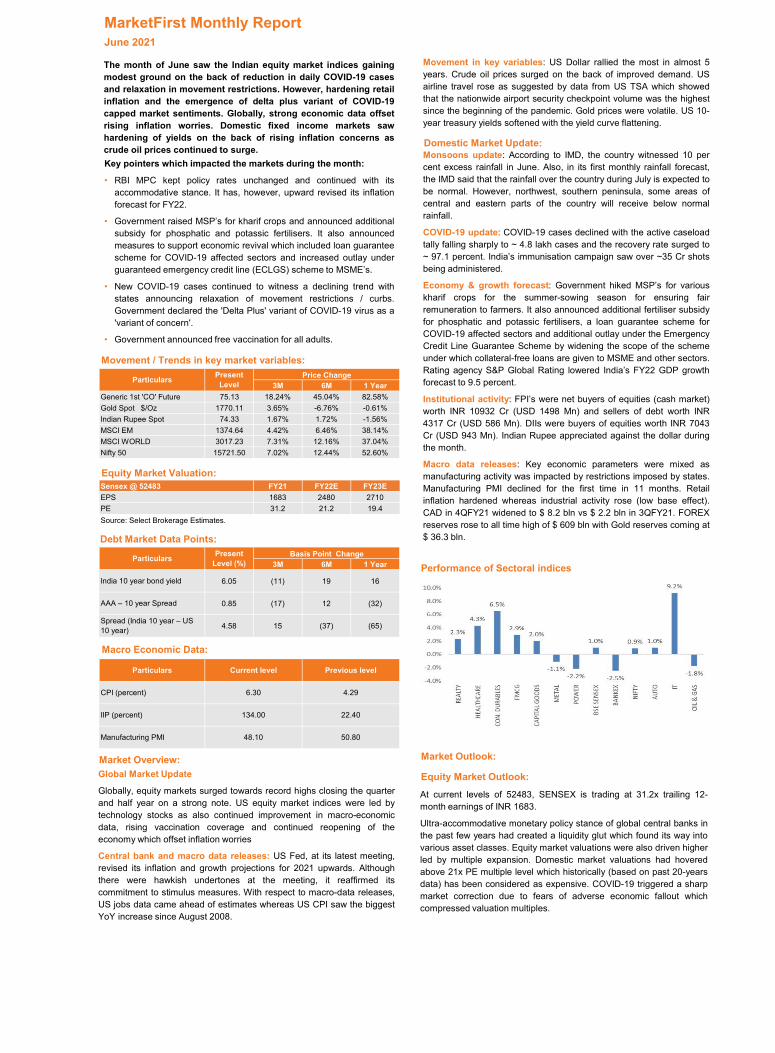
Generic 1st 'CO' Future 75.13 18.24% 45.04% 82.58%Gold Spot $/Oz 1770.11 3.65% -6.76% -0.61%Indian Rupee Spot 74.33 1.67% 1.72% -1.56%MSCI EM 1374.64 4.42% 6.46% 38.14%MSCI WORLD 3017.23 7.31% 12.16% 37.04%Nifty 50 15721.50 7.02% 12.44% 52.60%
Sensex @ 52483 FY21 FY22E FY23E
EPS 1683 2480 2710PE 31.2 21.2 19.4Source: Select Brokerage Estimates.
3M 6M 1 Year
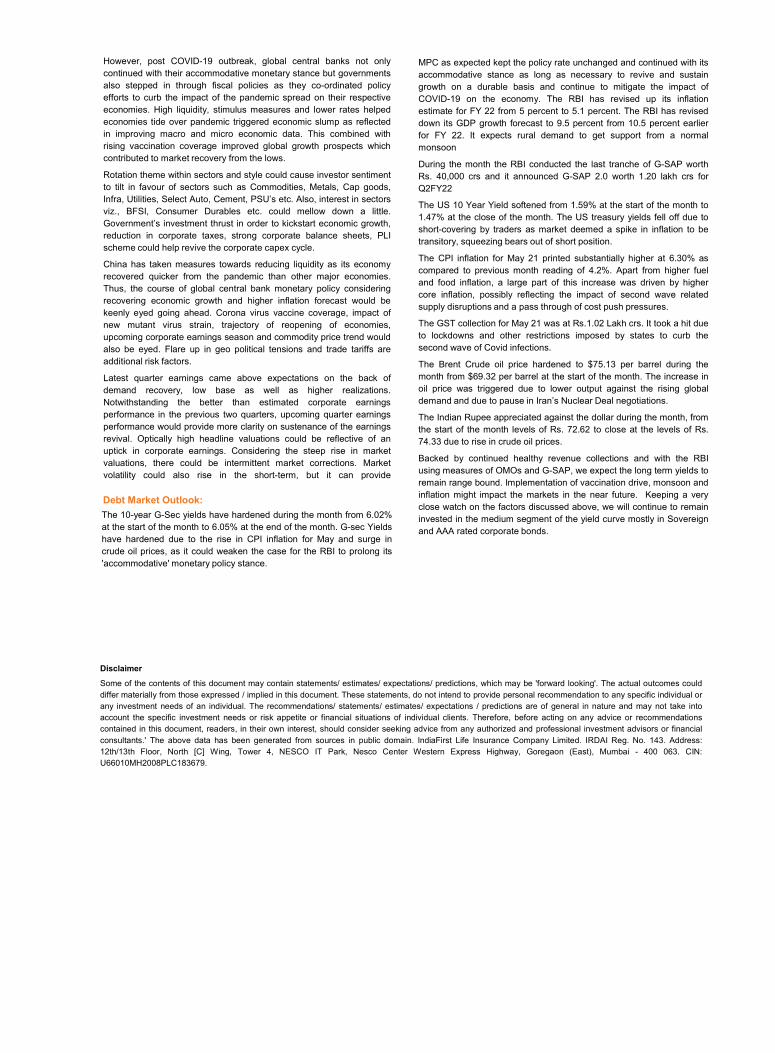
6.05 (11) 19 16
0.85 (17) 12 (32)
4.58 15 (37) (65)
Present Level
Price ChangeParticulars
Basis Point Change
AAA – 10 year Spread
Spread (India 10 year – US 10 year)
ParticularsPresent
Level (%)
India 10 year bond yield
Particulars
CPI (percent)
50.80
22.40
4.29
Previous level
IIP (percent)
Manufacturing PMI
Current level
6.30
134.00
48.10
MarketFirst Monthly ReportJune 2021
Key pointers which impacted the markets during the month:
• RBI MPC kept policy rates unchanged and continued with itsaccommodative stance. It has, however, upward revised its inflationforecast for FY22.
• Government raised MSP’s for kharif crops and announced additionalsubsidy for phosphatic and potassic fertilisers. It also announcedmeasures to support economic revival which included loan guaranteescheme for COVID-19 affected sectors and increased outlay underguaranteed emergency credit line (ECLGS) scheme to MSME’s.
• New COVID-19 cases continued to witness a declining trend withstates announcing relaxation of movement restrictions / curbs.Government declared the 'Delta Plus' variant of COVID-19 virus as a'variant of concern'.
• Government announced free vaccination for all adults.
Movement in key variables: US Dollar rallied the most in almost 5years. Crude oil prices surged on the back of improved demand. USairline travel rose as suggested by data from US TSA which showedthat the nationwide airport security checkpoint volume was the highestsince the beginning of the pandemic. Gold prices were volatile. US 10-year treasury yields softened with the yield curve flattening.
Movement / Trends in key market variables:
Market Overview:
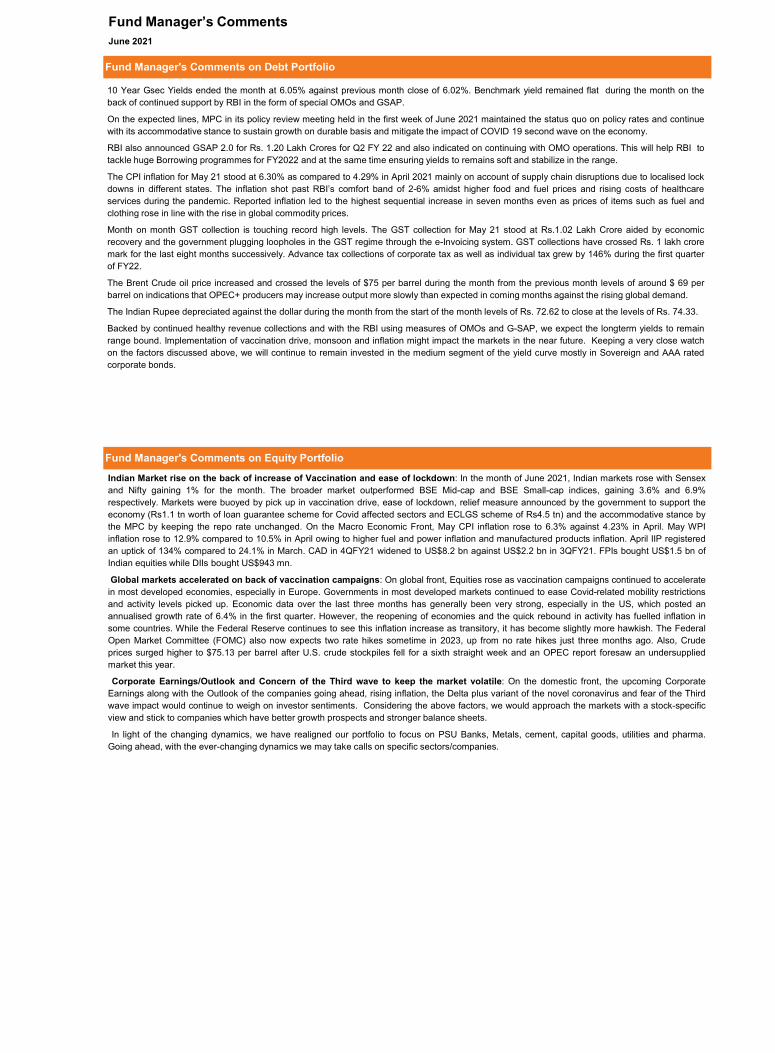
Performance of Sectoral indices
Global Market Update
Globally, equity markets surged towards record highs closing the quarterand half year on a strong note. US equity market indices were led bytechnology stocks as also continued improvement in macro-economicdata, rising vaccination coverage and continued reopening of theeconomy which offset inflation worries
Central bank and macro data releases: US Fed, at its latest meeting,revised its inflation and growth projections for 2021 upwards. Althoughthere were hawkish undertones at the meeting, it reaffirmed itscommitment to stimulus measures. With respect to macro-data releases,US jobs data came ahead of estimates whereas US CPI saw the biggestYoY increase since August 2008.
The month of June saw the Indian equity market indices gainingmodest ground on the back of reduction in daily COVID-19 casesand relaxation in movement restrictions. However, hardening retailinflation and the emergence of delta plus variant of COVID-19capped market sentiments. Globally, strong economic data offsetrising inflation worries. Domestic fixed income markets sawhardening of yields on the back of rising inflation concerns ascrude oil prices continued to surge.
Equity Market Valuation:
Market Outlook:
Equity Market Outlook:
At current levels of 52483, SENSEX is trading at 31.2x trailing 12-month earnings of INR 1683.
Ultra-accommodative monetary policy stance of global central banks inthe past few years had created a liquidity glut which found its way intovarious asset classes. Equity market valuations were also driven higherled by multiple expansion. Domestic market valuations had hoveredabove 21x PE multiple level which historically (based on past 20-yearsdata) has been considered as expensive. COVID-19 triggered a sharpmarket correction due to fears of adverse economic fallout whichcompressed valuation multiples.
Debt Market Data Points:
Macro Economic Data:
Domestic Market Update:Monsoons update: According to IMD, the country witnessed 10 percent excess rainfall in June. Also, in its first monthly rainfall forecast,the IMD said that the rainfall over the country during July is expected tobe normal. However, northwest, southern peninsula, some areas ofcentral and eastern parts of the country will receive below normalrainfall.
COVID-19 update: COVID-19 cases declined with the active caseloadtally falling sharply to ~ 4.8 lakh cases and the recovery rate surged to~ 97.1 percent. India’s immunisation campaign saw over ~35 Cr shotsbeing administered.
Economy & growth forecast: Government hiked MSP’s for variouskharif crops for the summer-sowing season for ensuring fairremuneration to farmers. It also announced additional fertiliser subsidyfor phosphatic and potassic fertilisers, a loan guarantee scheme forCOVID-19 affected sectors and additional outlay under the EmergencyCredit Line Guarantee Scheme by widening the scope of the schemeunder which collateral-free loans are given to MSME and other sectors.Rating agency S&P Global Rating lowered India’s FY22 GDP growthforecast to 9.5 percent.
Institutional activity: FPI’s were net buyers of equities (cash market)worth INR 10932 Cr (USD 1498 Mn) and sellers of debt worth INR4317 Cr (USD 586 Mn). DIIs were buyers of equities worth INR 7043Cr (USD 943 Mn). Indian Rupee appreciated against the dollar duringthe month.
Macro data releases: Key economic parameters were mixed asmanufacturing activity was impacted by restrictions imposed by states.Manufacturing PMI declined for the first time in 11 months. Retailinflation hardened whereas industrial activity rose (low base effect).CAD in 4QFY21 widened to $ 8.2 bln vs $ 2.2 bln in 3QFY21. FOREXreserves rose to all time high of $ 609 bln with Gold reserves coming at$ 36.3 bln.
Disclaimer
Some of the contents of this document may contain statements/ estimates/ expectations/ predictions, which may be 'forward looking'. The actual outcomes coulddiffer materially from those expressed / implied in this document. These statements, do not intend to provide personal recommendation to any specific individual orany investment needs of an individual. The recommendations/ statements/ estimates/ expectations / predictions are of general in nature and may not take intoaccount the specific investment needs or risk appetite or financial situations of individual clients. Therefore, before acting on any advice or recommendationscontained in this document, readers, in their own interest, should consider seeking advice from any authorized and professional investment advisors or financialconsultants.' The above data has been generated from sources in public domain. IndiaFirst Life Insurance Company Limited. IRDAI Reg. No. 143. Address:12th/13th Floor, North [C] Wing, Tower 4, NESCO IT Park, Nesco Center Western Express Highway, Goregaon (East), Mumbai - 400 063. CIN:U66010MH2008PLC183679.
However, post COVID-19 outbreak, global central banks not onlycontinued with their accommodative monetary stance but governmentsalso stepped in through fiscal policies as they co-ordinated policyefforts to curb the impact of the pandemic spread on their respectiveeconomies. High liquidity, stimulus measures and lower rates helpedeconomies tide over pandemic triggered economic slump as reflectedin improving macro and micro economic data. This combined withrising vaccination coverage improved global growth prospects whichcontributed to market recovery from the lows.
Rotation theme within sectors and style could cause investor sentimentto tilt in favour of sectors such as Commodities, Metals, Cap goods,Infra, Utilities, Select Auto, Cement, PSU’s etc. Also, interest in sectorsviz., BFSI, Consumer Durables etc. could mellow down a little.Government’s investment thrust in order to kickstart economic growth,reduction in corporate taxes, strong corporate balance sheets, PLIscheme could help revive the corporate capex cycle.
China has taken measures towards reducing liquidity as its economyrecovered quicker from the pandemic than other major economies.Thus, the course of global central bank monetary policy consideringrecovering economic growth and higher inflation forecast would bekeenly eyed going ahead. Corona virus vaccine coverage, impact ofnew mutant virus strain, trajectory of reopening of economies,upcoming corporate earnings season and commodity price trend wouldalso be eyed. Flare up in geo political tensions and trade tariffs areadditional risk factors.
Latest quarter earnings came above expectations on the back ofdemand recovery, low base as well as higher realizations.Notwithstanding the better than estimated corporate earningsperformance in the previous two quarters, upcoming quarter earningsperformance would provide more clarity on sustenance of the earningsrevival. Optically high headline valuations could be reflective of anuptick in corporate earnings. Considering the steep rise in marketvaluations, there could be intermittent market corrections. Marketvolatility could also rise in the short-term, but it can provide
MPC as expected kept the policy rate unchanged and continued with itsaccommodative stance as long as necessary to revive and sustaingrowth on a durable basis and continue to mitigate the impact ofCOVID-19 on the economy. The RBI has revised up its inflationestimate for FY 22 from 5 percent to 5.1 percent. The RBI has reviseddown its GDP growth forecast to 9.5 percent from 10.5 percent earlierfor FY 22. It expects rural demand to get support from a normalmonsoon
During the month the RBI conducted the last tranche of G-SAP worthRs. 40,000 crs and it announced G-SAP 2.0 worth 1.20 lakh crs forQ2FY22
The US 10 Year Yield softened from 1.59% at the start of the month to1.47% at the close of the month. The US treasury yields fell off due toshort-covering by traders as market deemed a spike in inflation to betransitory, squeezing bears out of short position.
The CPI inflation for May 21 printed substantially higher at 6.30% ascompared to previous month reading of 4.2%. Apart from higher fueland food inflation, a large part of this increase was driven by highercore inflation, possibly reflecting the impact of second wave relatedsupply disruptions and a pass through of cost push pressures.
The GST collection for May 21 was at Rs.1.02 Lakh crs. It took a hit dueto lockdowns and other restrictions imposed by states to curb thesecond wave of Covid infections.
The Brent Crude oil price hardened to $75.13 per barrel during themonth from $69.32 per barrel at the start of the month. The increase inoil price was triggered due to lower output against the rising globaldemand and due to pause in Iran’s Nuclear Deal negotiations.
The Indian Rupee appreciated against the dollar during the month, fromthe start of the month levels of Rs. 72.62 to close at the levels of Rs.74.33 due to rise in crude oil prices.
Backed by continued healthy revenue collections and with the RBIusing measures of OMOs and G-SAP, we expect the long term yields toremain range bound. Implementation of vaccination drive, monsoon andinflation might impact the markets in the near future. Keeping a veryclose watch on the factors discussed above, we will continue to remaininvested in the medium segment of the yield curve mostly in Sovereignand AAA rated corporate bonds.
Debt Market Outlook:
The 10-year G-Sec yields have hardened during the month from 6.02%at the start of the month to 6.05% at the end of the month. G-sec Yieldshave hardened due to the rise in CPI inflation for May and surge incrude oil prices, as it could weaken the case for the RBI to prolong its'accommodative' monetary policy stance.
Fund Manager's Comments on Debt Portfolio
Fund Manager's Comments on Equity Portfolio
Fund Manager’s CommentsJune 2021
10 Year Gsec Yields ended the month at 6.05% against previous month close of 6.02%. Benchmark yield remained flat during the month on theback of continued support by RBI in the form of special OMOs and GSAP.
On the expected lines, MPC in its policy review meeting held in the first week of June 2021 maintained the status quo on policy rates and continuewith its accommodative stance to sustain growth on durable basis and mitigate the impact of COVID 19 second wave on the economy.
RBI also announced GSAP 2.0 for Rs. 1.20 Lakh Crores for Q2 FY 22 and also indicated on continuing with OMO operations. This will help RBI totackle huge Borrowing programmes for FY2022 and at the same time ensuring yields to remains soft and stabilize in the range.
The CPI inflation for May 21 stood at 6.30% as compared to 4.29% in April 2021 mainly on account of supply chain disruptions due to localised lockdowns in different states. The inflation shot past RBI’s comfort band of 2-6% amidst higher food and fuel prices and rising costs of healthcareservices during the pandemic. Reported inflation led to the highest sequential increase in seven months even as prices of items such as fuel andclothing rose in line with the rise in global commodity prices.
Month on month GST collection is touching record high levels. The GST collection for May 21 stood at Rs.1.02 Lakh Crore aided by economicrecovery and the government plugging loopholes in the GST regime through the e-Invoicing system. GST collections have crossed Rs. 1 lakh croremark for the last eight months successively. Advance tax collections of corporate tax as well as individual tax grew by 146% during the first quarterof FY22.
The Brent Crude oil price increased and crossed the levels of $75 per barrel during the month from the previous month levels of around $ 69 perbarrel on indications that OPEC+ producers may increase output more slowly than expected in coming months against the rising global demand.
The Indian Rupee depreciated against the dollar during the month from the start of the month levels of Rs. 72.62 to close at the levels of Rs. 74.33.
Backed by continued healthy revenue collections and with the RBI using measures of OMOs and G-SAP, we expect the longterm yields to remainrange bound. Implementation of vaccination drive, monsoon and inflation might impact the markets in the near future. Keeping a very close watchon the factors discussed above, we will continue to remain invested in the medium segment of the yield curve mostly in Sovereign and AAA ratedcorporate bonds.
Indian Market rise on the back of increase of Vaccination and ease of lockdown: In the month of June 2021, Indian markets rose with Sensexand Nifty gaining 1% for the month. The broader market outperformed BSE Mid-cap and BSE Small-cap indices, gaining 3.6% and 6.9%respectively. Markets were buoyed by pick up in vaccination drive, ease of lockdown, relief measure announced by the government to support theeconomy (Rs1.1 tn worth of loan guarantee scheme for Covid affected sectors and ECLGS scheme of Rs4.5 tn) and the accommodative stance bythe MPC by keeping the repo rate unchanged. On the Macro Economic Front, May CPI inflation rose to 6.3% against 4.23% in April. May WPIinflation rose to 12.9% compared to 10.5% in April owing to higher fuel and power inflation and manufactured products inflation. April IIP registeredan uptick of 134% compared to 24.1% in March. CAD in 4QFY21 widened to US$8.2 bn against US$2.2 bn in 3QFY21. FPIs bought US$1.5 bn ofIndian equities while DIIs bought US$943 mn.
Global markets accelerated on back of vaccination campaigns: On global front, Equities rose as vaccination campaigns continued to acceleratein most developed economies, especially in Europe. Governments in most developed markets continued to ease Covid-related mobility restrictionsand activity levels picked up. Economic data over the last three months has generally been very strong, especially in the US, which posted anannualised growth rate of 6.4% in the first quarter. However, the reopening of economies and the quick rebound in activity has fuelled inflation insome countries. While the Federal Reserve continues to see this inflation increase as transitory, it has become slightly more hawkish. The FederalOpen Market Committee (FOMC) also now expects two rate hikes sometime in 2023, up from no rate hikes just three months ago. Also, Crudeprices surged higher to $75.13 per barrel after U.S. crude stockpiles fell for a sixth straight week and an OPEC report foresaw an undersuppliedmarket this year.
Corporate Earnings/Outlook and Concern of the Third wave to keep the market volatile: On the domestic front, the upcoming CorporateEarnings along with the Outlook of the companies going ahead, rising inflation, the Delta plus variant of the novel coronavirus and fear of the Thirdwave impact would continue to weigh on investor sentiments. Considering the above factors, we would approach the markets with a stock-specificview and stick to companies which have better growth prospects and stronger balance sheets.
In light of the changing dynamics, we have realigned our portfolio to focus on PSU Banks, Metals, cement, capital goods, utilities and pharma.Going ahead, with the ever-changing dynamics we may take calls on specific sectors/companies.
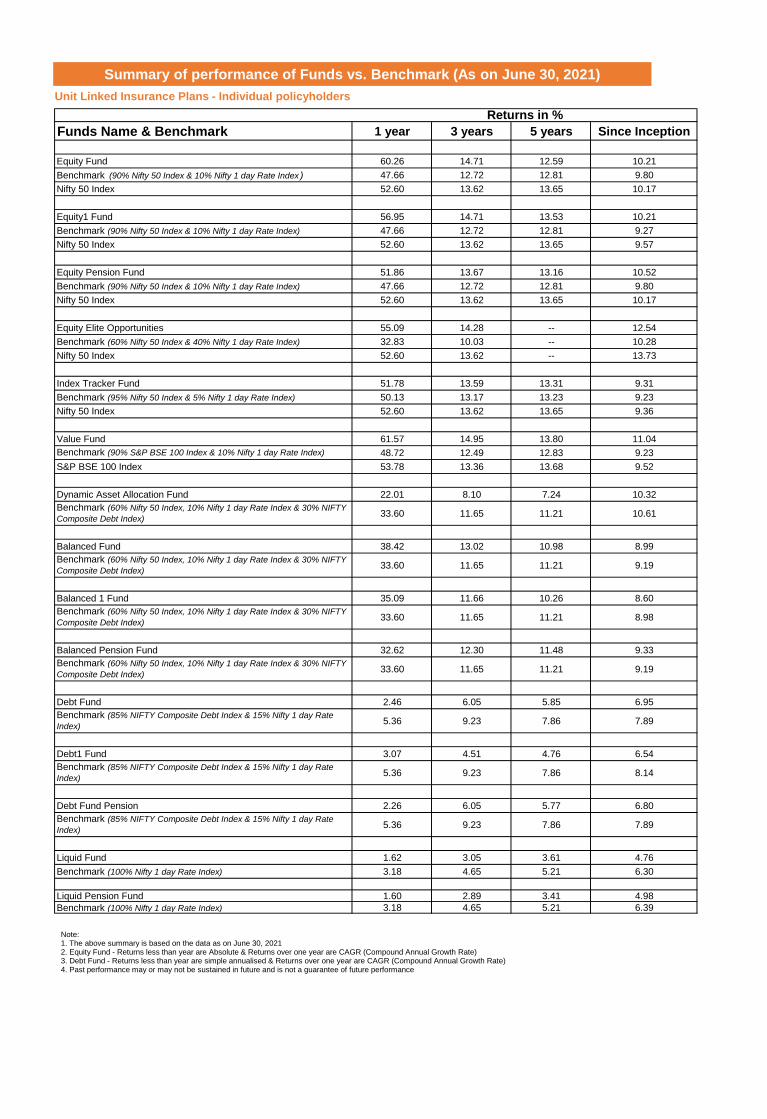
Funds Name & Benchmark 1 year 3 years 5 years Since Inception
Equity Fund 60.26 14.71 12.59 10.21
Benchmark (90% Nifty 50 Index & 10% Nifty 1 day Rate Index ) 47.66 12.72 12.81 9.80
Nifty 50 Index 52.60 13.62 13.65 10.17
Equity1 Fund 56.95 14.71 13.53 10.21
Benchmark (90% Nifty 50 Index & 10% Nifty 1 day Rate Index) 47.66 12.72 12.81 9.27
Nifty 50 Index 52.60 13.62 13.65 9.57
Equity Pension Fund 51.86 13.67 13.16 10.52
Benchmark (90% Nifty 50 Index & 10% Nifty 1 day Rate Index) 47.66 12.72 12.81 9.80
Nifty 50 Index 52.60 13.62 13.65 10.17
Equity Elite Opportunities 55.09 14.28 -- 12.54
Benchmark (60% Nifty 50 Index & 40% Nifty 1 day Rate Index) 32.83 10.03 -- 10.28
Nifty 50 Index 52.60 13.62 -- 13.73
Index Tracker Fund 51.78 13.59 13.31 9.31
Benchmark (95% Nifty 50 Index & 5% Nifty 1 day Rate Index) 50.13 13.17 13.23 9.23
Nifty 50 Index 52.60 13.62 13.65 9.36
Value Fund 61.57 14.95 13.80 11.04
48.72 12.49 12.83 9.23
S&P BSE 100 Index 53.78 13.36 13.68 9.52
Dynamic Asset Allocation Fund 22.01 8.10 7.24 10.32
33.60 11.65 11.21 10.61
Balanced Fund 38.42 13.02 10.98 8.99
33.60 11.65 11.21 9.19
Balanced 1 Fund 35.09 11.66 10.26 8.60
33.60 11.65 11.21 8.98
Balanced Pension Fund 32.62 12.30 11.48 9.33
33.60 11.65 11.21 9.19
Debt Fund 2.46 6.05 5.85 6.95
5.36 9.23 7.86 7.89
Debt1 Fund 3.07 4.51 4.76 6.54
5.36 9.23 7.86 8.14
Debt Fund Pension 2.26 6.05 5.77 6.80
5.36 9.23 7.86 7.89
Liquid Fund 1.62 3.05 3.61 4.76
Benchmark (100% Nifty 1 day Rate Index) 3.18 4.65 5.21 6.30
Liquid Pension Fund 1.60 2.89 3.41 4.98
Benchmark (100% Nifty 1 day Rate Index) 3.18 4.65 5.21 6.39
Benchmark (85% NIFTY Composite Debt Index & 15% Nifty 1 day Rate
Index)
Benchmark (85% NIFTY Composite Debt Index & 15% Nifty 1 day Rate
Index)
Benchmark (85% NIFTY Composite Debt Index & 15% Nifty 1 day Rate
Index)
Benchmark (60% Nifty 50 Index, 10% Nifty 1 day Rate Index & 30% NIFTY
Composite Debt Index)
Returns in %
Benchmark (90% S&P BSE 100 Index & 10% Nifty 1 day Rate Index)
Benchmark (60% Nifty 50 Index, 10% Nifty 1 day Rate Index & 30% NIFTY
Composite Debt Index)
Benchmark (60% Nifty 50 Index, 10% Nifty 1 day Rate Index & 30% NIFTY
Composite Debt Index)
Benchmark (60% Nifty 50 Index, 10% Nifty 1 day Rate Index & 30% NIFTY
Composite Debt Index)
Summary of performance of Funds vs. Benchmark (As on June 30, 2021)
Unit Linked Insurance Plans - Individual policyholders
Note:1. The above summary is based on the data as on June 30, 20212. Equity Fund - Returns less than year are Absolute & Returns over one year are CAGR (Compound Annual Growth Rate)3. Debt Fund - Returns less than year are simple annualised & Returns over one year are CAGR (Compound Annual Growth Rate)4. Past performance may or may not be sustained in future and is not a guarantee of future performance
Name of the Fund Name of the Fund
Asset Allocation Equity Debt Money market Asset Allocation Equity Debt Money market
Minimum 80 0 0 Minimum 50 30 0
Maximum 100 0 20 Maximum 70 50 20
Fund Manager Viraj Nadkarni- Fund Manager Debt - Sandeep Shirsat - B.Com, ICWA
M.Com, C.S. ( Company Secretary), MBA ( Finance) Equity - Viraj Nadkarni
Date of Launch November 25, 2009 M.Com, C.S. ( Company Secretary), MBA ( Finance)
Net Asset Value Declared every business day
Fund's Fact Sheet Published monthly Date of Launch November 9, 2011
Net Asset Value Declared every business day
Fund's Fact Sheet Published monthly
Name of the Fund
Nature of the Fund
Name of the Fund
Asset Allocation Equity Debt Money market
Minimum 0 70 0 Asset Allocation Equity Debt Money market
Maximum 0 100 30 Minimum 0 0 80
Maximum 0 20 100
Fund Manager Sandeep Shirsat- B.Com, ICWA
Date of Launch November 25, 2009 Fund Manager Sandeep Shirsat- B.Com, ICWA
Net Asset Value Declared every business day Date of Launch November 25, 2009
Fund's Fact Sheet Published monthly Net Asset Value Declared every business day
Fund's Fact Sheet Published monthly
Benchmark 100% Nifty 1 day Rate Index
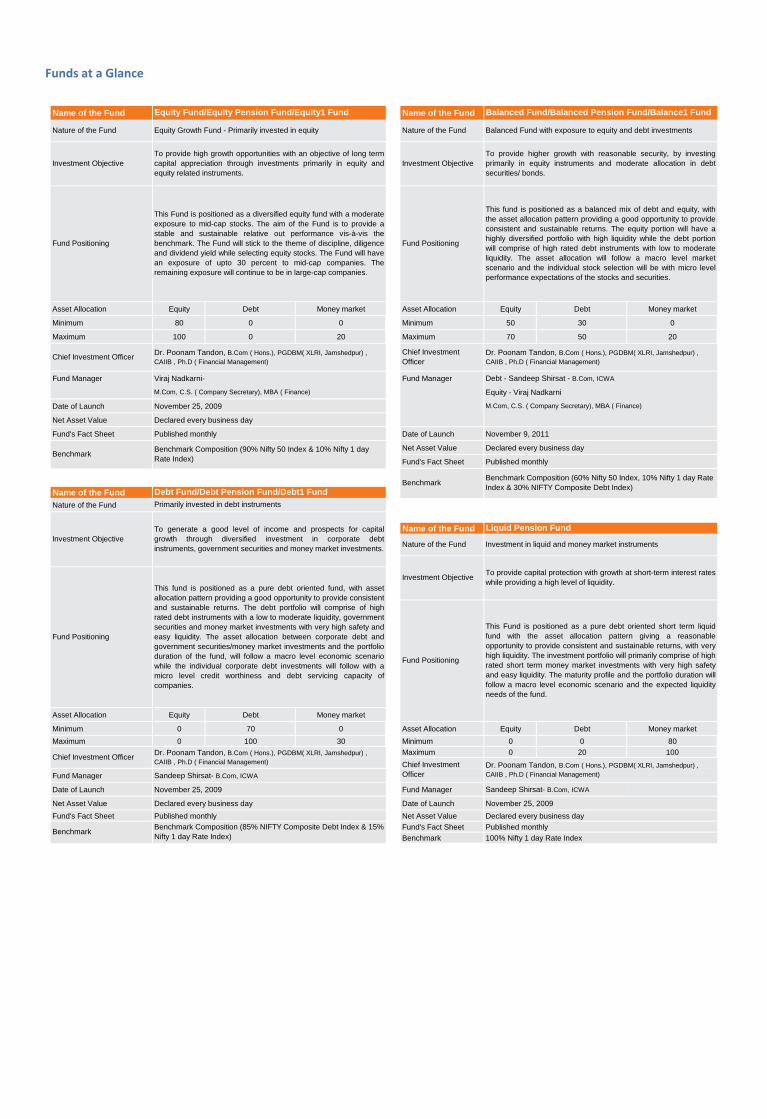
Equity Fund/Equity Pension Fund/Equity1 Fund Balanced Fund/Balanced Pension Fund/Balance1 Fund
Nature of the Fund Equity Growth Fund - Primarily invested in equity Nature of the Fund Balanced Fund with exposure to equity and debt investments
Investment Objective
To provide high growth opportunities with an objective of long term
capital appreciation through investments primarily in equity and
equity related instruments.
Investment Objective
To provide higher growth with reasonable security, by investing
primarily in equity instruments and moderate allocation in debt
securities/ bonds.
Fund Positioning
This Fund is positioned as a diversified equity fund with a moderate
exposure to mid-cap stocks. The aim of the Fund is to provide a
stable and sustainable relative out performance vis-à-vis the
benchmark. The Fund will stick to the theme of discipline, diligence
and dividend yield while selecting equity stocks. The Fund will have
an exposure of upto 30 percent to mid-cap companies. The
remaining exposure will continue to be in large-cap companies.
Fund Positioning
This fund is positioned as a balanced mix of debt and equity, with
the asset allocation pattern providing a good opportunity to provide
consistent and sustainable returns. The equity portion will have a
highly diversified portfolio with high liquidity while the debt portion
will comprise of high rated debt instruments with low to moderate
liquidity. The asset allocation will follow a macro level market
scenario and the individual stock selection will be with micro level
performance expectations of the stocks and securities.
Chief Investment OfficerDr. Poonam Tandon, B.Com ( Hons.), PGDBM( XLRI, Jamshedpur) ,
CAIIB , Ph.D ( Financial Management)
Chief Investment
Officer
Dr. Poonam Tandon, B.Com ( Hons.), PGDBM( XLRI, Jamshedpur) ,
CAIIB , Ph.D ( Financial Management)
BenchmarkBenchmark Composition (90% Nifty 50 Index & 10% Nifty 1 day
Rate Index)
BenchmarkBenchmark Composition (60% Nifty 50 Index, 10% Nifty 1 day Rate
Index & 30% NIFTY Composite Debt Index)Debt Fund/Debt Pension Fund/Debt1 Fund
Primarily invested in debt instruments
Investment Objective
To generate a good level of income and prospects for capital
growth through diversified investment in corporate debt
instruments, government securities and money market investments.
Liquid Pension Fund
Nature of the Fund Investment in liquid and money market instruments
Investment Objective
BenchmarkBenchmark Composition (85% NIFTY Composite Debt Index & 15%
Nifty 1 day Rate Index)
To provide capital protection with growth at short-term interest rates
while providing a high level of liquidity.
Fund Positioning
This fund is positioned as a pure debt oriented fund, with asset
allocation pattern providing a good opportunity to provide consistent
and sustainable returns. The debt portfolio will comprise of high
rated debt instruments with a low to moderate liquidity, government
securities and money market investments with very high safety and
easy liquidity. The asset allocation between corporate debt and
government securities/money market investments and the portfolio
duration of the fund, will follow a macro level economic scenario
while the individual corporate debt investments will follow with a
micro level credit worthiness and debt servicing capacity of
companies.
Fund Positioning
This Fund is positioned as a pure debt oriented short term liquid
fund with the asset allocation pattern giving a reasonable
opportunity to provide consistent and sustainable returns, with very
high liquidity. The investment portfolio will primarily comprise of high
rated short term money market investments with very high safety
and easy liquidity. The maturity profile and the portfolio duration will
follow a macro level economic scenario and the expected liquidity
needs of the fund.
Chief Investment OfficerDr. Poonam Tandon, B.Com ( Hons.), PGDBM( XLRI, Jamshedpur) ,
CAIIB , Ph.D ( Financial Management) Chief Investment
Officer
Dr. Poonam Tandon, B.Com ( Hons.), PGDBM( XLRI, Jamshedpur) ,
CAIIB , Ph.D ( Financial Management)
Funds at a Glance
Name of the Fund Name of the Fund
Asset Allocation Equity Debt Money market Asset Allocation Equity Debt Money market
Minimum 70 0 0 Minimum 0 0 0
Maximum 100 0 30 Maximum 80 80 40
Fund Manager Viraj Nadkarni Fund Manager Viraj Nadkarni
M.Com, C.S. (Company Secretary), MBA (Finance) M.Com, C.S. (Company Secretary), MBA (Finance)
Date of Launch September 16, 2010 Date of Launch September 09, 2011
Net Asset Value Declared every business day Net Asset Value Declared every business day
Fund's Fact Sheet Published monthly Fund's Fact Sheet Published monthly
Name of the Fund Name of the Fund
Asset Allocation Equity Debt Money market
Minimum 90 0 0
Maximum 100 0 10 Asset Allocation Equity Debt Money market
Minimum 60 0 0
Maximum 100 0 40
Fund Manager
Date of Launch Fund Manager Viraj Nadkarni-
Net Asset Value M.Com, C.S. ( Company Secretary), MBA ( Finance)
Fund's Fact Sheet Date of Launch October 27, 2016
Net Asset Value Declared every business day
Fund's Fact Sheet Published monthly
Benchmark Compostion (60% Nifty 50 Index & 40% Nifty 1 Day
Index)Benchmark
September 22, 2010
Declared every business day
Published monthly
BenchmarkBenchmark Composition (95% Nifty 50 Index & 5% Nifty 1 day Rate
Index)
Chief Investment OfficerDr. Poonam Tandon, B.Com ( Hons.), PGDBM( XLRI, Jamshedpur) ,
CAIIB , Ph.D ( Financial Management)
Viraj Nadkarni- Chief Investment
Officer
Dr. Poonam Tandon, B.Com ( Hons.), PGDBM( XLRI, Jamshedpur) ,
CAIIB , Ph.D ( Financial Management)M.Com, C.S. ( Company Secretary), MBA ( Finance)
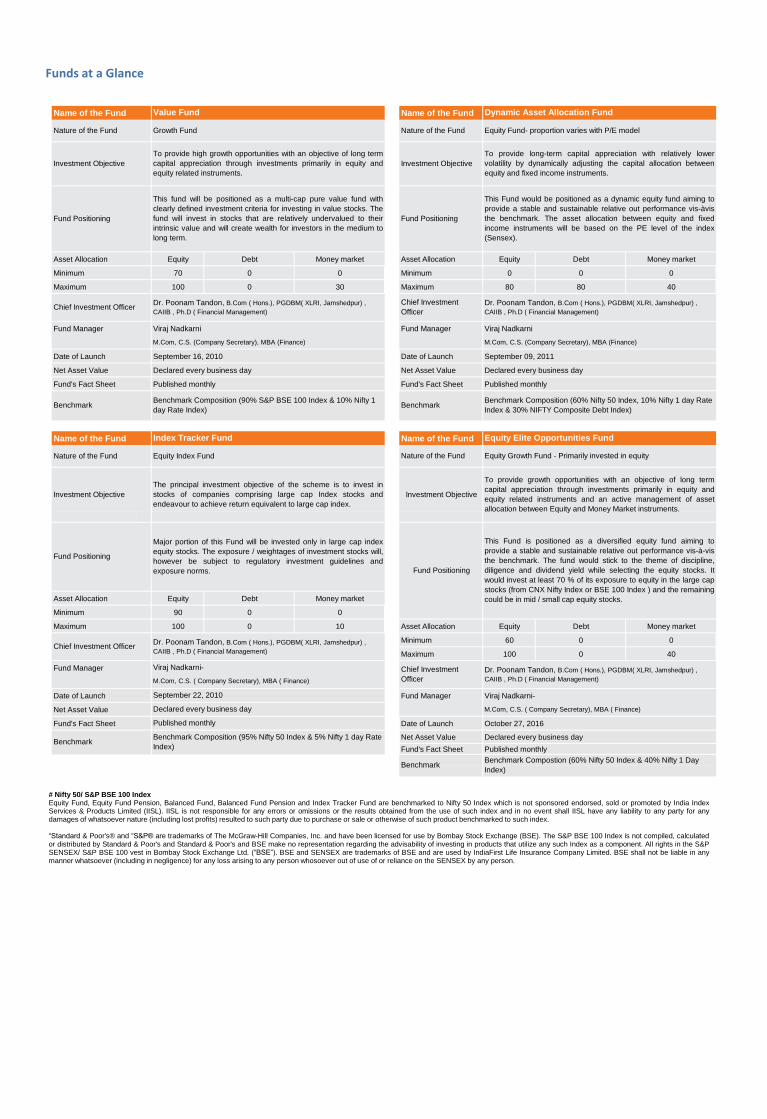
Investment Objective
The principal investment objective of the scheme is to invest in
stocks of companies comprising large cap Index stocks and
endeavour to achieve return equivalent to large cap index.
Investment Objective
To provide growth opportunities with an objective of long term
capital appreciation through investments primarily in equity and
equity related instruments and an active management of asset
allocation between Equity and Money Market instruments.
Fund Positioning
Major portion of this Fund will be invested only in large cap index
equity stocks. The exposure / weightages of investment stocks will,
however be subject to regulatory investment guidelines and
exposure norms. Fund Positioning
This Fund is positioned as a diversified equity fund aiming to
provide a stable and sustainable relative out performance vis-à-vis
the benchmark. The fund would stick to the theme of discipline,
diligence and dividend yield while selecting the equity stocks. It
would invest at least 70 % of its exposure to equity in the large cap
stocks (from CNX Nifty Index or BSE 100 Index ) and the remaining
could be in mid / small cap equity stocks.
Index Tracker Fund Equity Elite Opportunities Fund
Nature of the Fund Equity Index Fund Nature of the Fund Equity Growth Fund - Primarily invested in equity
Chief Investment OfficerDr. Poonam Tandon, B.Com ( Hons.), PGDBM( XLRI, Jamshedpur) ,
CAIIB , Ph.D ( Financial Management)
Chief Investment
Officer
Dr. Poonam Tandon, B.Com ( Hons.), PGDBM( XLRI, Jamshedpur) ,
CAIIB , Ph.D ( Financial Management)
BenchmarkBenchmark Composition (90% S&P BSE 100 Index & 10% Nifty 1
day Rate Index)Benchmark
Benchmark Composition (60% Nifty 50 Index, 10% Nifty 1 day Rate
Index & 30% NIFTY Composite Debt Index)
Investment Objective
To provide high growth opportunities with an objective of long term
capital appreciation through investments primarily in equity and
equity related instruments.
Investment Objective
To provide long-term capital appreciation with relatively lower
volatility by dynamically adjusting the capital allocation between
equity and fixed income instruments.
Fund Positioning
This fund will be positioned as a multi-cap pure value fund with
clearly defined investment criteria for investing in value stocks. The
fund will invest in stocks that are relatively undervalued to their
intrinsic value and will create wealth for investors in the medium to
long term.
Fund Positioning
This Fund would be positioned as a dynamic equity fund aiming to
provide a stable and sustainable relative out performance vis-àvis
the benchmark. The asset allocation between equity and fixed
income instruments will be based on the PE level of the index
(Sensex).
Value Fund Dynamic Asset Allocation Fund
Nature of the Fund Growth Fund Nature of the Fund Equity Fund- proportion varies with P/E model
Funds at a Glance
# Nifty 50/ S&P BSE 100 IndexEquity Fund, Equity Fund Pension, Balanced Fund, Balanced Fund Pension and Index Tracker Fund are benchmarked to Nifty 50 Index which is not sponsored endorsed, sold or promoted by India IndexServices & Products Limited (IISL). IISL is not responsible for any errors or omissions or the results obtained from the use of such index and in no event shall IISL have any liability to any party for anydamages of whatsoever nature (including lost profits) resulted to such party due to purchase or sale or otherwise of such product benchmarked to such index.
“Standard & Poor's® and “S&P® are trademarks of The McGraw-Hill Companies, Inc. and have been licensed for use by Bombay Stock Exchange (BSE). The S&P BSE 100 Index is not compiled, calculatedor distributed by Standard & Poor's and Standard & Poor's and BSE make no representation regarding the advisability of investing in products that utilize any such Index as a component. All rights in the S&PSENSEX/ S&P BSE 100 vest in Bombay Stock Exchange Ltd. (“BSE”). BSE and SENSEX are trademarks of BSE and are used by IndiaFirst Life Insurance Company Limited. BSE shall not be liable in anymanner whatsoever (including in negligence) for any loss arising to any person whosoever out of use of or reliance on the SENSEX by any person.
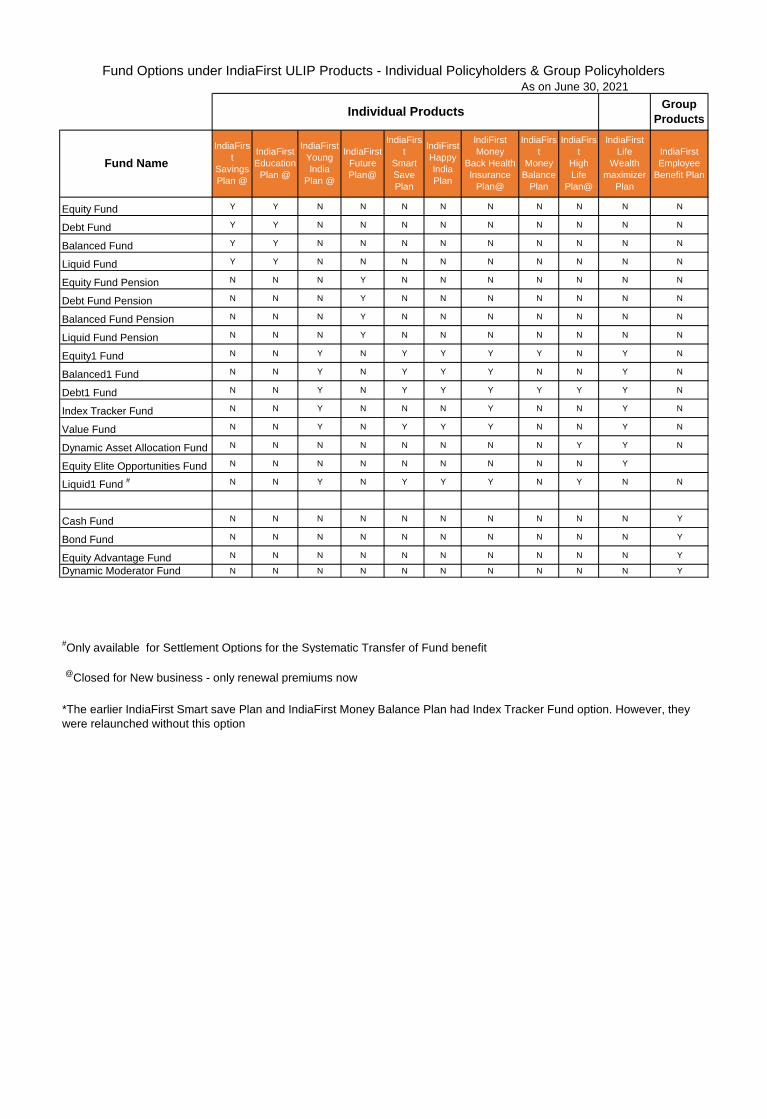
As on June 30, 2021
Equity Fund Y Y N N N N N N N N N
Debt Fund Y Y N N N N N N N N N
Balanced Fund Y Y N N N N N N N N N
Liquid Fund Y Y N N N N N N N N N
Equity Fund Pension N N N Y N N N N N N N
Debt Fund Pension N N N Y N N N N N N N
Balanced Fund Pension N N N Y N N N N N N N
Liquid Fund Pension N N N Y N N N N N N N
Equity1 Fund N N Y N Y Y Y Y N Y N
Balanced1 Fund N N Y N Y Y Y N N Y N
Debt1 Fund N N Y N Y Y Y Y Y Y N
Index Tracker Fund N N Y N N N Y N N Y N
Value Fund N N Y N Y Y Y N N Y N
Dynamic Asset Allocation Fund N N N N N N N N Y Y N
Equity Elite Opportunities Fund N N N N N N N N N Y
Liquid1 Fund # N N Y N Y Y Y N Y N N
Cash Fund N N N N N N N N N N Y
Bond Fund N N N N N N N N N N Y
Equity Advantage Fund N N N N N N N N N N Y
Dynamic Moderator Fund N N N N N N N N N N Y
#Only available for Settlement Options for the Systematic Transfer of Fund benefit
@
Closed for New business - only renewal premiums now
Fund Options under IndiaFirst ULIP Products - Individual Policyholders & Group Policyholders
Individual ProductsGroup
Products
Fund Name
IndiaFirs
t
Savings
Plan @
IndiaFirst
Education
Plan @
IndiaFirst
Young
India
Plan @
IndiaFirst
Future
Plan@
IndiaFirs
t
Smart
Save
Plan
*The earlier IndiaFirst Smart save Plan and IndiaFirst Money Balance Plan had Index Tracker Fund option. However, they
were relaunched without this option
IndiFirst
Happy
India
Plan
IndiFirst
Money
Back Health
Insurance
Plan@
IndiaFirs
t
Money
Balance
Plan
IndiaFirs
t
High
Life
Plan@
IndiaFirst
Life
Wealth
maximizer
Plan
IndiaFirst
Employee
Benefit Plan
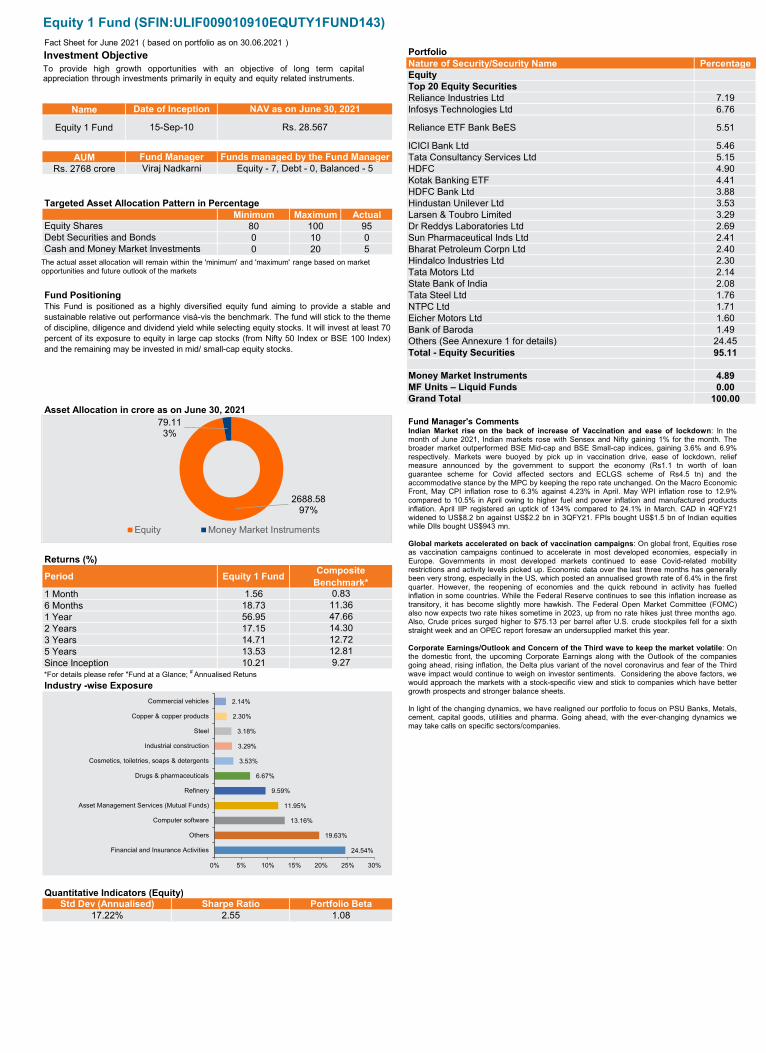
PortfolioNature of Security/Security Name PercentageEquityTop 20 Equity SecuritiesReliance Industries Ltd 7.19
Name Infosys Technologies Ltd 6.76
Equity 1 Fund Reliance ETF Bank BeES 5.51
ICICI Bank Ltd 5.46AUM Tata Consultancy Services Ltd 5.15
Rs. 2768 crore HDFC 4.90Kotak Banking ETF 4.41HDFC Bank Ltd 3.88
Targeted Asset Allocation Pattern in Percentage Hindustan Unilever Ltd 3.53Minimum Maximum Actual Larsen & Toubro Limited 3.29
80 100 95 Dr Reddys Laboratories Ltd 2.690 10 0 Sun Pharmaceutical Inds Ltd 2.410 20 5 Bharat Petroleum Corpn Ltd 2.40
Hindalco Industries Ltd 2.30Tata Motors Ltd 2.14State Bank of India 2.08
Fund Positioning Tata Steel Ltd 1.76NTPC Ltd 1.71Eicher Motors Ltd 1.60Bank of Baroda 1.49Others (See Annexure 1 for details) 24.45Total - Equity Securities 95.11
Money Market Instruments 4.89MF Units – Liquid Funds 0.00Grand Total 100.00
Returns (%)
1 Month 1.566 Months 18.731 Year 56.952 Years 17.153 Years 14.715 Years 13.53Since Inception 10.21*For details please refer "Fund at a Glance; # Annualised Retuns
Quantitative Indicators (Equity)
Equity Shares
Date of Inception NAV as on June 30, 2021
15-Sep-10 Rs. 28.567
Fund Manager Funds managed by the Fund ManagerViraj Nadkarni Equity - 7, Debt - 0, Balanced - 5
Debt Securities and BondsCash and Money Market Investments
This Fund is positioned as a highly diversified equity fund aiming to provide a stable andsustainable relative out performance visà-vis the benchmark. The fund will stick to the themeof discipline, diligence and dividend yield while selecting equity stocks. It will invest at least 70percent of its exposure to equity in large cap stocks (from Nifty 50 Index or BSE 100 Index)and the remaining may be invested in mid/ small-cap equity stocks.
Asset Allocation in crore as on June 30, 2021
Period Equity 1 FundComposite
Benchmark*
Industry -wise Exposure
Std Dev (Annualised) Sharpe Ratio Portfolio Beta17.22% 2.55 1.08
9.27
0.8311.3647.6614.3012.7212.81
Investment Objective
Fund Manager's CommentsIndian Market rise on the back of increase of Vaccination and ease of lockdown: In themonth of June 2021, Indian markets rose with Sensex and Nifty gaining 1% for the month. Thebroader market outperformed BSE Mid-cap and BSE Small-cap indices, gaining 3.6% and 6.9%respectively. Markets were buoyed by pick up in vaccination drive, ease of lockdown, reliefmeasure announced by the government to support the economy (Rs1.1 tn worth of loanguarantee scheme for Covid affected sectors and ECLGS scheme of Rs4.5 tn) and theaccommodative stance by the MPC by keeping the repo rate unchanged. On the Macro EconomicFront, May CPI inflation rose to 6.3% against 4.23% in April. May WPI inflation rose to 12.9%compared to 10.5% in April owing to higher fuel and power inflation and manufactured productsinflation. April IIP registered an uptick of 134% compared to 24.1% in March. CAD in 4QFY21widened to US$8.2 bn against US$2.2 bn in 3QFY21. FPIs bought US$1.5 bn of Indian equitieswhile DIIs bought US$943 mn.
Global markets accelerated on back of vaccination campaigns: On global front, Equities roseas vaccination campaigns continued to accelerate in most developed economies, especially inEurope. Governments in most developed markets continued to ease Covid-related mobilityrestrictions and activity levels picked up. Economic data over the last three months has generallybeen very strong, especially in the US, which posted an annualised growth rate of 6.4% in the firstquarter. However, the reopening of economies and the quick rebound in activity has fuelledinflation in some countries. While the Federal Reserve continues to see this inflation increase astransitory, it has become slightly more hawkish. The Federal Open Market Committee (FOMC)also now expects two rate hikes sometime in 2023, up from no rate hikes just three months ago.Also, Crude prices surged higher to $75.13 per barrel after U.S. crude stockpiles fell for a sixthstraight week and an OPEC report foresaw an undersupplied market this year.
Corporate Earnings/Outlook and Concern of the Third wave to keep the market volatile: Onthe domestic front, the upcoming Corporate Earnings along with the Outlook of the companiesgoing ahead, rising inflation, the Delta plus variant of the novel coronavirus and fear of the Thirdwave impact would continue to weigh on investor sentiments. Considering the above factors, wewould approach the markets with a stock-specific view and stick to companies which have bettergrowth prospects and stronger balance sheets.
In light of the changing dynamics, we have realigned our portfolio to focus on PSU Banks, Metals,cement, capital goods, utilities and pharma. Going ahead, with the ever-changing dynamics wemay take calls on specific sectors/companies.
2688.5897%
79.113%
Equity Money Market Instruments
Fact Sheet for June 2021 ( based on portfolio as on 30.06.2021 )
To provide high growth opportunities with an objective of long term capitalappreciation through investments primarily in equity and equity related instruments.
Equity 1 Fund (SFIN:ULIF009010910EQUTY1FUND143)
24.54%
19.63%
13.16%
11.95%
9.59%
6.67%
3.53%
3.29%
3.18%
2.30%
2.14%
Financial and Insurance Activities
Others
Computer software
Asset Management Services (Mutual Funds)
Refinery
Drugs & pharmaceuticals
Cosmetics, toiletries, soaps & detergents
Industrial construction
Steel
Copper & copper products
Commercial vehicles
0% 5% 10% 15% 20% 25% 30%
The actual asset allocation will remain within the 'minimum' and 'maximum' range based on market opportunities and future outlook of the markets
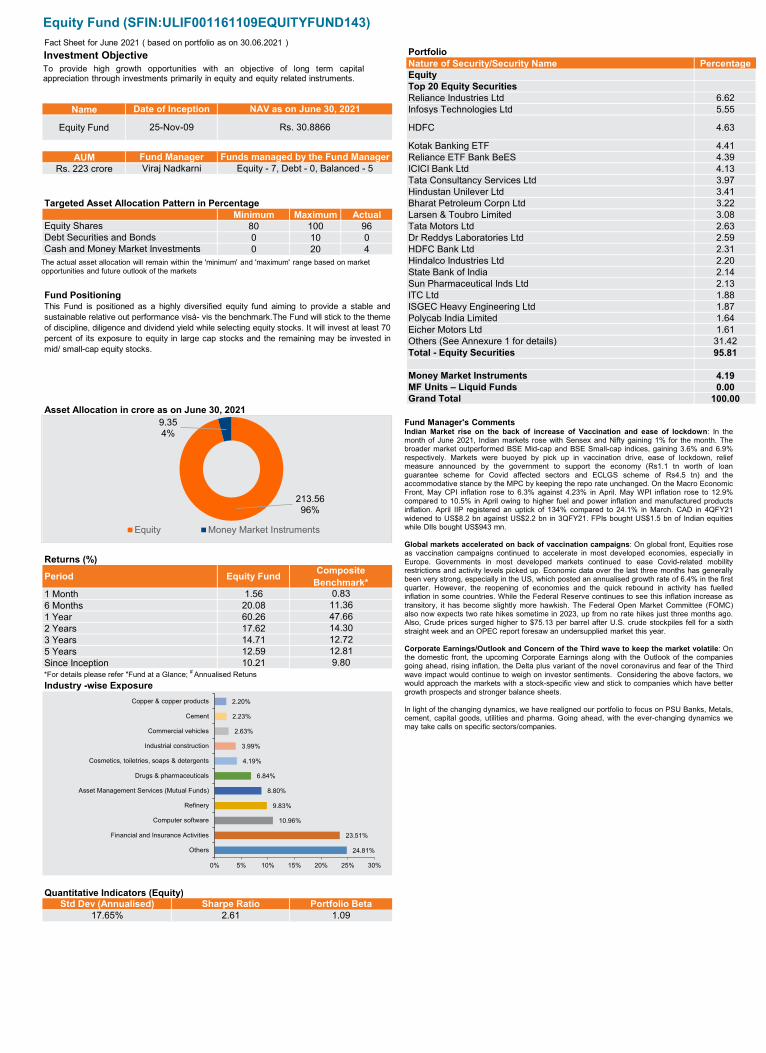
PortfolioNature of Security/Security Name PercentageEquityTop 20 Equity SecuritiesReliance Industries Ltd 6.62
Name Infosys Technologies Ltd 5.55
Equity Fund HDFC 4.63
Kotak Banking ETF 4.41AUM Reliance ETF Bank BeES 4.39
Rs. 223 crore ICICI Bank Ltd 4.13Tata Consultancy Services Ltd 3.97Hindustan Unilever Ltd 3.41
Targeted Asset Allocation Pattern in Percentage Bharat Petroleum Corpn Ltd 3.22Minimum Maximum Actual Larsen & Toubro Limited 3.08
80 100 96 Tata Motors Ltd 2.630 10 0 Dr Reddys Laboratories Ltd 2.590 20 4 HDFC Bank Ltd 2.31
Hindalco Industries Ltd 2.20State Bank of India 2.14Sun Pharmaceutical Inds Ltd 2.13
Fund Positioning ITC Ltd 1.88ISGEC Heavy Engineering Ltd 1.87Polycab India Limited 1.64Eicher Motors Ltd 1.61Others (See Annexure 1 for details) 31.42Total - Equity Securities 95.81
Money Market Instruments 4.19MF Units – Liquid Funds 0.00Grand Total 100.00
Returns (%)
1 Month 1.566 Months 20.081 Year 60.262 Years 17.623 Years 14.715 Years 12.59Since Inception 10.21*For details please refer "Fund at a Glance; # Annualised Retuns
Quantitative Indicators (Equity)
Equity Shares
Date of Inception NAV as on June 30, 2021
25-Nov-09 Rs. 30.8866
Fund Manager Funds managed by the Fund ManagerViraj Nadkarni Equity - 7, Debt - 0, Balanced - 5
Debt Securities and BondsCash and Money Market Investments
This Fund is positioned as a highly diversified equity fund aiming to provide a stable andsustainable relative out performance visà- vis the benchmark.The Fund will stick to the themeof discipline, diligence and dividend yield while selecting equity stocks. It will invest at least 70percent of its exposure to equity in large cap stocks and the remaining may be invested inmid/ small-cap equity stocks.
Asset Allocation in crore as on June 30, 2021
Period Equity FundComposite
Benchmark*
Industry -wise Exposure
Std Dev (Annualised) Sharpe Ratio Portfolio Beta17.65% 2.61 1.09
9.80
0.8311.3647.6614.3012.7212.81
Investment Objective
213.5696%
9.354%
Equity Money Market Instruments
Fact Sheet for June 2021 ( based on portfolio as on 30.06.2021 )
To provide high growth opportunities with an objective of long term capitalappreciation through investments primarily in equity and equity related instruments.
Equity Fund (SFIN:ULIF001161109EQUITYFUND143)
24.81%
23.51%
10.96%
9.83%
8.80%
6.84%
4.19%
3.99%
2.63%
2.23%
2.20%
Others
Financial and Insurance Activities
Computer software
Refinery
Asset Management Services (Mutual Funds)
Drugs & pharmaceuticals
Cosmetics, toiletries, soaps & detergents
Industrial construction
Commercial vehicles
Cement
Copper & copper products
0% 5% 10% 15% 20% 25% 30%
The actual asset allocation will remain within the 'minimum' and 'maximum' range based on market opportunities and future outlook of the markets
Fund Manager's CommentsIndian Market rise on the back of increase of Vaccination and ease of lockdown: In themonth of June 2021, Indian markets rose with Sensex and Nifty gaining 1% for the month. Thebroader market outperformed BSE Mid-cap and BSE Small-cap indices, gaining 3.6% and 6.9%respectively. Markets were buoyed by pick up in vaccination drive, ease of lockdown, reliefmeasure announced by the government to support the economy (Rs1.1 tn worth of loanguarantee scheme for Covid affected sectors and ECLGS scheme of Rs4.5 tn) and theaccommodative stance by the MPC by keeping the repo rate unchanged. On the Macro EconomicFront, May CPI inflation rose to 6.3% against 4.23% in April. May WPI inflation rose to 12.9%compared to 10.5% in April owing to higher fuel and power inflation and manufactured productsinflation. April IIP registered an uptick of 134% compared to 24.1% in March. CAD in 4QFY21widened to US$8.2 bn against US$2.2 bn in 3QFY21. FPIs bought US$1.5 bn of Indian equitieswhile DIIs bought US$943 mn.
Global markets accelerated on back of vaccination campaigns: On global front, Equities roseas vaccination campaigns continued to accelerate in most developed economies, especially inEurope. Governments in most developed markets continued to ease Covid-related mobilityrestrictions and activity levels picked up. Economic data over the last three months has generallybeen very strong, especially in the US, which posted an annualised growth rate of 6.4% in the firstquarter. However, the reopening of economies and the quick rebound in activity has fuelledinflation in some countries. While the Federal Reserve continues to see this inflation increase astransitory, it has become slightly more hawkish. The Federal Open Market Committee (FOMC)also now expects two rate hikes sometime in 2023, up from no rate hikes just three months ago.Also, Crude prices surged higher to $75.13 per barrel after U.S. crude stockpiles fell for a sixthstraight week and an OPEC report foresaw an undersupplied market this year.
Corporate Earnings/Outlook and Concern of the Third wave to keep the market volatile: Onthe domestic front, the upcoming Corporate Earnings along with the Outlook of the companiesgoing ahead, rising inflation, the Delta plus variant of the novel coronavirus and fear of the Thirdwave impact would continue to weigh on investor sentiments. Considering the above factors, wewould approach the markets with a stock-specific view and stick to companies which have bettergrowth prospects and stronger balance sheets.
In light of the changing dynamics, we have realigned our portfolio to focus on PSU Banks, Metals,cement, capital goods, utilities and pharma. Going ahead, with the ever-changing dynamics wemay take calls on specific sectors/companies.
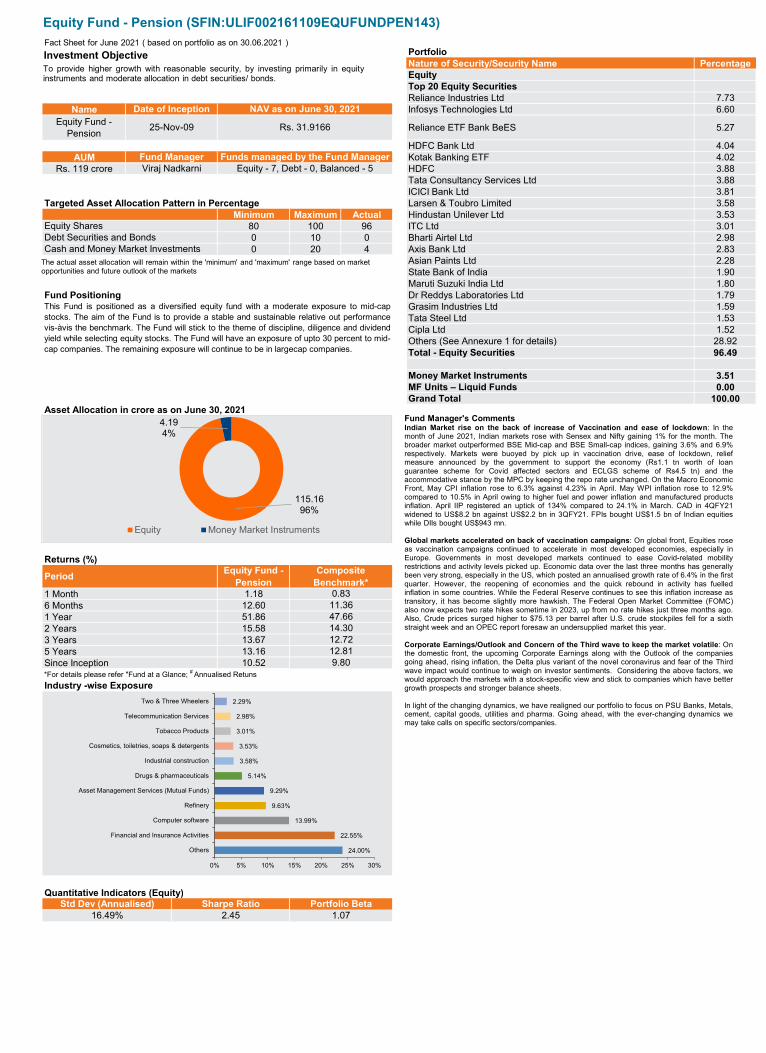
PortfolioNature of Security/Security Name PercentageEquityTop 20 Equity SecuritiesReliance Industries Ltd 7.73
Name Infosys Technologies Ltd 6.60Equity Fund -
Pension Reliance ETF Bank BeES 5.27
HDFC Bank Ltd 4.04AUM Kotak Banking ETF 4.02
Rs. 119 crore HDFC 3.88Tata Consultancy Services Ltd 3.88ICICI Bank Ltd 3.81
Targeted Asset Allocation Pattern in Percentage Larsen & Toubro Limited 3.58Minimum Maximum Actual Hindustan Unilever Ltd 3.53
80 100 96 ITC Ltd 3.010 10 0 Bharti Airtel Ltd 2.980 20 4 Axis Bank Ltd 2.83
Asian Paints Ltd 2.28State Bank of India 1.90Maruti Suzuki India Ltd 1.80
Fund Positioning Dr Reddys Laboratories Ltd 1.79Grasim Industries Ltd 1.59Tata Steel Ltd 1.53Cipla Ltd 1.52Others (See Annexure 1 for details) 28.92Total - Equity Securities 96.49
Money Market Instruments 3.51MF Units – Liquid Funds 0.00Grand Total 100.00
Returns (%)
1 Month 1.186 Months 12.601 Year 51.862 Years 15.583 Years 13.675 Years 13.16Since Inception 10.52*For details please refer "Fund at a Glance; # Annualised Retuns
Quantitative Indicators (Equity)
Equity Shares
Date of Inception NAV as on June 30, 2021
25-Nov-09 Rs. 31.9166
Fund Manager Funds managed by the Fund ManagerViraj Nadkarni Equity - 7, Debt - 0, Balanced - 5
Debt Securities and BondsCash and Money Market Investments
This Fund is positioned as a diversified equity fund with a moderate exposure to mid-capstocks. The aim of the Fund is to provide a stable and sustainable relative out performancevis-àvis the benchmark. The Fund will stick to the theme of discipline, diligence and dividendyield while selecting equity stocks. The Fund will have an exposure of upto 30 percent to mid-cap companies. The remaining exposure will continue to be in largecap companies.
Asset Allocation in crore as on June 30, 2021
PeriodEquity Fund -
PensionComposite
Benchmark*
Industry -wise Exposure
Std Dev (Annualised) Sharpe Ratio Portfolio Beta16.49% 2.45 1.07
9.80
0.8311.3647.6614.3012.7212.81
Investment Objective
115.1696%
4.194%
Equity Money Market Instruments
Fact Sheet for June 2021 ( based on portfolio as on 30.06.2021 )
To provide higher growth with reasonable security, by investing primarily in equityinstruments and moderate allocation in debt securities/ bonds.
Equity Fund - Pension (SFIN:ULIF002161109EQUFUNDPEN143)
24.00%
22.55%
13.99%
9.63%
9.29%
5.14%
3.58%
3.53%
3.01%
2.98%
2.29%
Others
Financial and Insurance Activities
Computer software
Refinery
Asset Management Services (Mutual Funds)
Drugs & pharmaceuticals
Industrial construction
Cosmetics, toiletries, soaps & detergents
Tobacco Products
Telecommunication Services
Two & Three Wheelers
0% 5% 10% 15% 20% 25% 30%
The actual asset allocation will remain within the 'minimum' and 'maximum' range based on market opportunities and future outlook of the markets
Fund Manager's CommentsIndian Market rise on the back of increase of Vaccination and ease of lockdown: In themonth of June 2021, Indian markets rose with Sensex and Nifty gaining 1% for the month. Thebroader market outperformed BSE Mid-cap and BSE Small-cap indices, gaining 3.6% and 6.9%respectively. Markets were buoyed by pick up in vaccination drive, ease of lockdown, reliefmeasure announced by the government to support the economy (Rs1.1 tn worth of loanguarantee scheme for Covid affected sectors and ECLGS scheme of Rs4.5 tn) and theaccommodative stance by the MPC by keeping the repo rate unchanged. On the Macro EconomicFront, May CPI inflation rose to 6.3% against 4.23% in April. May WPI inflation rose to 12.9%compared to 10.5% in April owing to higher fuel and power inflation and manufactured productsinflation. April IIP registered an uptick of 134% compared to 24.1% in March. CAD in 4QFY21widened to US$8.2 bn against US$2.2 bn in 3QFY21. FPIs bought US$1.5 bn of Indian equitieswhile DIIs bought US$943 mn.
Global markets accelerated on back of vaccination campaigns: On global front, Equities roseas vaccination campaigns continued to accelerate in most developed economies, especially inEurope. Governments in most developed markets continued to ease Covid-related mobilityrestrictions and activity levels picked up. Economic data over the last three months has generallybeen very strong, especially in the US, which posted an annualised growth rate of 6.4% in the firstquarter. However, the reopening of economies and the quick rebound in activity has fuelledinflation in some countries. While the Federal Reserve continues to see this inflation increase astransitory, it has become slightly more hawkish. The Federal Open Market Committee (FOMC)also now expects two rate hikes sometime in 2023, up from no rate hikes just three months ago.Also, Crude prices surged higher to $75.13 per barrel after U.S. crude stockpiles fell for a sixthstraight week and an OPEC report foresaw an undersupplied market this year.
Corporate Earnings/Outlook and Concern of the Third wave to keep the market volatile: Onthe domestic front, the upcoming Corporate Earnings along with the Outlook of the companiesgoing ahead, rising inflation, the Delta plus variant of the novel coronavirus and fear of the Thirdwave impact would continue to weigh on investor sentiments. Considering the above factors, wewould approach the markets with a stock-specific view and stick to companies which have bettergrowth prospects and stronger balance sheets.
In light of the changing dynamics, we have realigned our portfolio to focus on PSU Banks, Metals,cement, capital goods, utilities and pharma. Going ahead, with the ever-changing dynamics wemay take calls on specific sectors/companies.

PortfolioNature of Security/Security Name PercentageEquityTop 20 Equity SecuritiesInfosys Technologies Ltd 5.76
Name ICICI Bank Ltd 4.38Equity Elite
Opportunities Tata Consultancy Services Ltd 3.97
Reliance ETF Bank BeES 3.96AUM Kotak Banking ETF 3.95
Rs. 35 crore Reliance Industries Ltd 3.74HDFC 3.42Larsen & Toubro Limited 3.04
Targeted Asset Allocation Pattern in Percentage State Bank of India 3.03Minimum Maximum Actual Hindustan Unilever Ltd 2.52
60 100 87 Bharat Petroleum Corpn Ltd 2.510 0 0 Tata Motors Ltd 2.350 40 13 HDFC Bank Ltd 2.28
Dr Reddys Laboratories Ltd 2.18Axis Bank Ltd 2.16Sun Pharmaceutical Inds Ltd 2.04
Fund Positioning Lupin Ltd 1.56Balrampur Chini Mills Ltd 1.55ITC Ltd 1.55Tata Steel Ltd 1.51Others (See Annexure 1 for details) 29.85Total - Equity Securities 87.31
Money Market Instruments 12.69MF Units – Liquid Funds 0.00Grand Total 100.00
Returns (%)
1 Month 2.026 Months 18.831 Year 55.092 Years 16.933 Years 14.285 Years Since Inception 12.54*For details please refer "Fund at a Glance; # Annualised Retuns
Quantitative Indicators (Equity)
Equity Shares
Date of Inception NAV as on June 30, 2021
27-Oct-16 Rs. 17.3774
Fund Manager Funds managed by the Fund ManagerViraj Nadkarni Equity - 7, Debt - 0, Balanced - 5
Debt Securities and BondsCash and Money Market Investments
This Fund is positioned as a diversified equity fund aiming to provide a stable and sustainablerelative out performance vis-à-vis the benchmark. The fund would stick to the theme ofdiscipline, diligence and dividend yield while selecting the equity stocks. It would invest atleast 70 % of its exposure to equity in the large cap stocks and the remaining could be in mid/ small cap equity stocks.
Asset Allocation in crore as on June 30, 2021
PeriodEquity Elite
OpportunitiesComposite
Benchmark*
Industry -wise Exposure
Std Dev (Annualised) Sharpe Ratio Portfolio Beta15.32% 2.77 1.42
10.28
0.648.1032.8310.8110.03
Investment Objective
30.3787%
4.4213%
Equity Money Market Instruments
Fact Sheet for June 2021 ( based on portfolio as on 30.06.2021 )
To provide growth opportunities with an objective of long term capital appreciationthrough investments primarily in equity and equity related instruments and an activemanagement of asset allocation between Equity and Money Market instruments.
Equity Elite Opportunities (SFIN:ULIF020280716EQUELITEOP143)
33.61%
22.60%
10.94%
7.91%
6.44%
6.26%
3.04%
2.68%
2.52%
2.35%
1.64%
Others
Financial and Insurance Activities
Computer software
Asset Management Services (Mutual Funds)
Drugs & pharmaceuticals
Refinery
Industrial construction
Steel
Cosmetics, toiletries, soaps & detergents
Commercial vehicles
Cement
0% 5% 10% 15% 20% 25% 30% 35% 40%
The actual asset allocation will remain within the 'minimum' and 'maximum' range based on market opportunities and future outlook of the markets
Fund Manager's CommentsIndian Market rise on the back of increase of Vaccination and ease of lockdown: In themonth of June 2021, Indian markets rose with Sensex and Nifty gaining 1% for the month. Thebroader market outperformed BSE Mid-cap and BSE Small-cap indices, gaining 3.6% and 6.9%respectively. Markets were buoyed by pick up in vaccination drive, ease of lockdown, reliefmeasure announced by the government to support the economy (Rs1.1 tn worth of loanguarantee scheme for Covid affected sectors and ECLGS scheme of Rs4.5 tn) and theaccommodative stance by the MPC by keeping the repo rate unchanged. On the Macro EconomicFront, May CPI inflation rose to 6.3% against 4.23% in April. May WPI inflation rose to 12.9%compared to 10.5% in April owing to higher fuel and power inflation and manufactured productsinflation. April IIP registered an uptick of 134% compared to 24.1% in March. CAD in 4QFY21widened to US$8.2 bn against US$2.2 bn in 3QFY21. FPIs bought US$1.5 bn of Indian equitieswhile DIIs bought US$943 mn.
Global markets accelerated on back of vaccination campaigns: On global front, Equities roseas vaccination campaigns continued to accelerate in most developed economies, especially inEurope. Governments in most developed markets continued to ease Covid-related mobilityrestrictions and activity levels picked up. Economic data over the last three months has generallybeen very strong, especially in the US, which posted an annualised growth rate of 6.4% in the firstquarter. However, the reopening of economies and the quick rebound in activity has fuelledinflation in some countries. While the Federal Reserve continues to see this inflation increase astransitory, it has become slightly more hawkish. The Federal Open Market Committee (FOMC)also now expects two rate hikes sometime in 2023, up from no rate hikes just three months ago.Also, Crude prices surged higher to $75.13 per barrel after U.S. crude stockpiles fell for a sixthstraight week and an OPEC report foresaw an undersupplied market this year.
Corporate Earnings/Outlook and Concern of the Third wave to keep the market volatile: Onthe domestic front, the upcoming Corporate Earnings along with the Outlook of the companiesgoing ahead, rising inflation, the Delta plus variant of the novel coronavirus and fear of the Thirdwave impact would continue to weigh on investor sentiments. Considering the above factors, wewould approach the markets with a stock-specific view and stick to companies which have bettergrowth prospects and stronger balance sheets.
In light of the changing dynamics, we have realigned our portfolio to focus on PSU Banks, Metals,cement, capital goods, utilities and pharma. Going ahead, with the ever-changing dynamics wemay take calls on specific sectors/companies.

PortfolioRating Percentage
4.47Name 3.47
Balanced Fund 3.42
3.06AUM 2.75
2.432.252.13
Targeted Asset Allocation Pattern in Percentage 2.10Minimum Maximum Actual 1.86
50 70 65 37.3530 50 30 65.290 20 5
5.33Fund Positioning 2.49
2.051.630.830.800.590.59
14.30
AAA 2.49AAA 2.46AAA 2.27AAA 2.20AAA 1.70AAA 1.64AA+ 1.05AA+ 0.83AAA 0.58AAA 0.21
0.0015.44
Returns (%) 4.960.00
100.001.0613.3438.4214.07 Credit Profile of Debt and Money Market Investments13.0210.988.99
*For details please refer "Fund at a Glance
Maturity Profile of Debt Portfolio
Quantitative Indicators (Equity)
Quantitative Indicators (Debt)
Please refer to the page “Fund Manager's Comments”
Nature of Security/Security NameEquityTop 10 Equity SecuritiesReliance Industries Ltd
Date of Inception NAV as on June 30, 2021 Infosys Technologies Ltd
Sandeep Shirsat Equity - 0, Debt - 7, Balanced - 5 HDFC Bank LtdViraj Nadkarni Equity - 7, Debt - 0, Balanced - 5 Hindustan Unilever Ltd
25-Nov-09 Rs. 27.142 ICICI Bank Ltd
HDFCFund Manager Funds managed by the Fund Manager Tata Consultancy Services Ltd
Debt Securities and Bonds Total - Equity SecuritiesCash and Money Market Investments
DebtTop Sovereign Securities
Bharat Petroleum Corpn LtdLarsen & Toubro LimitedKotak Banking ETF
Equity Shares Others (See Annexure 1 for details)
8.35% Government of India 20225.77% Government of India 2030
This Fund is positioned as a balanced mix of debt and equity, with the asset allocationpattern providing a good opportunity to provide consistent and sustainable returns. Theequity portion will have a highly diversified portfolio with high liquidity while the debt portionwill comprise of high rated debt instruments with a low to moderate liquidity. The assetallocation will follow a macro level market scenario and the individual stock selection will bewith micro level performance expectations of the stocks and securities.
6.84% Government of India 20226.79% Government of India 20277.17% Government of India 20286.45% Government of India 20296.64% Government of India 20355.85% Government of India 2030Total - Sovereign Securities
9.22% LIC Housing Finance Ltd 20247.95% India Infradebt Limited 20247.71% L&T Finance 202210.02% Mahindra & Mahindra Fin. Serv. 202210.15% Mahindra & Mahindra Fin. Serv. 20226.65% Food Corporation of India 2030
Top 10 Corporate bondsAsset Allocation in crore as on June 30, 2021 9.35% Rural Electrification Corp 2022
9.95% Food Corporation of India 20226.85% Indian Railways Finance Corporation 2040
1 Year
9.15% Axis Bank Ltd 2022Others (See Annexure 1 for details)Total - Corporate bonds
Money Market Instruments
PeriodBalanced
FundMF Units – Liquid Funds
39.85AA+ & AA 5.54
Industry -wise Exposure (%) AA- 0.00
9.19
2 Years3 Years Nature Percentage5 Years GSEC & T Bills 42.04
12.4411.6511.21
100.00
Period Exposure in Percentage0 - 3 Months 12.58
A & Below 0.00Fixed Deposits with Banks 0.00CBLO/TREPS/ Other Money Market Investments 12.58
20.32> 10 Years 8.41Total 100.00
3 - 12 Months 32.671 - 3 Years 14.563 - 5 Years 11.46
Average Maturity (Years) Modified Duration (Years) Fund Manager's Comments4.09 2.79
Rs. 126 crore
Composite Benchmark*
0.598.0233.60
Std Dev (Annualised) Sharpe Ratio Portfolio Beta11.56% 2.62 1.07
5 - 10 Years
Total
Since Inception AAA & P1+ & PR1+ & A1+
Grand Total1 Month6 Months
Investment Objective
83.3766%
37.5930%
5.414%
Equity Debt Money Market Instruments
25.02%
23.02%
14.30%
7.11%
6.60%
6.46%
4.57%
4.40%
3.05%
2.75%
2.70%
Others
Financial and Insurance Activities
Sovereign
Computer software
Refinery
Infrastructure Finance Services
Drugs & pharmaceuticals
Asset Management Services (Mutual Funds)
Trading
Cosmetics, toiletries, soaps & detergents
Industrial construction
0% 5% 10% 15% 20% 25% 30%
Fact Sheet for June 2021 ( based on portfolio as on 30.06.2021 )
To provide higher growth with reasonable security, by investing primarily in equityinstruments and moderate allocation in debt securities/ bonds.
Balanced Fund (SFIN:ULIF005161109BALANCEDFN143)
The actual asset allocation will remain within the 'minimum' and 'maximum' range based on market opportunities and future outlook of the markets
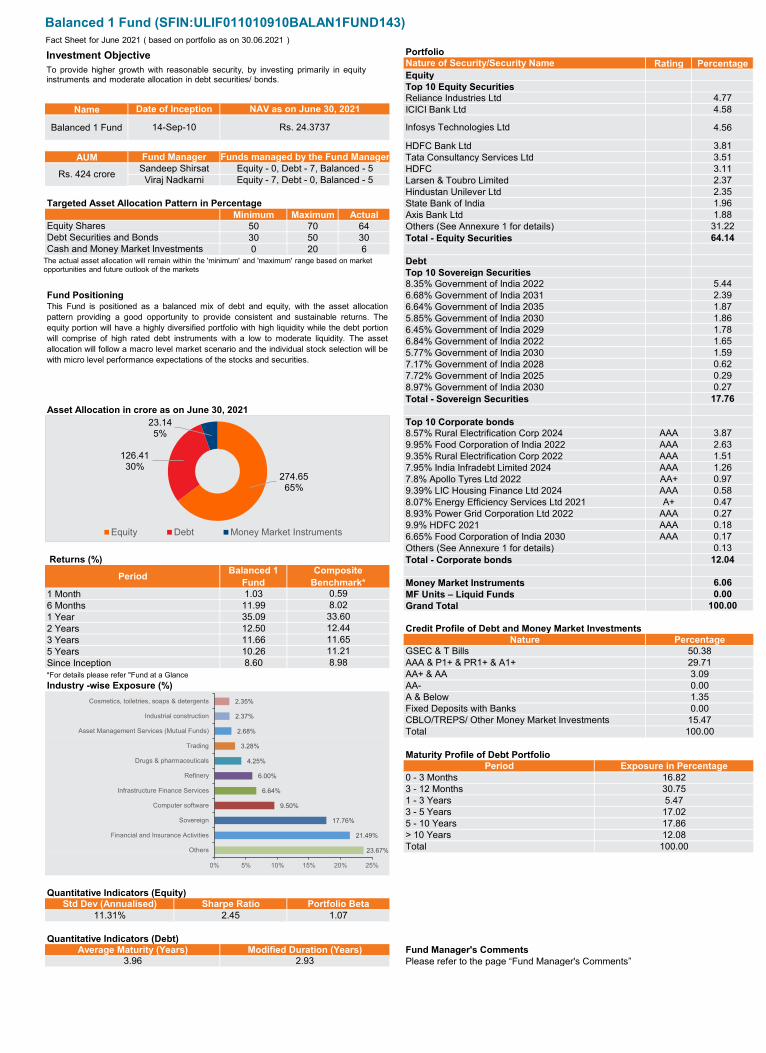
PortfolioRating Percentage
4.77Name 4.58
Balanced 1 Fund 4.56
3.81AUM 3.51
3.112.372.35
Targeted Asset Allocation Pattern in Percentage 1.96Minimum Maximum Actual 1.88
50 70 64 31.2230 50 30 64.140 20 6
5.44Fund Positioning 2.39
1.871.861.781.651.590.620.290.27
17.76
AAA 3.87AAA 2.63AAA 1.51AAA 1.26AA+ 0.97AAA 0.58A+ 0.47
AAA 0.27AAA 0.18AAA 0.17
0.13 Returns (%) 12.04
6.061.03 0.0011.99 100.0035.0912.50 Credit Profile of Debt and Money Market Investments11.6610.268.60
*For details please refer "Fund at a Glance
Maturity Profile of Debt Portfolio
Quantitative Indicators (Equity)
Quantitative Indicators (Debt)
Please refer to the page “Fund Manager's Comments”
Nature of Security/Security NameEquityTop 10 Equity SecuritiesReliance Industries Ltd
Date of Inception NAV as on June 30, 2021 ICICI Bank Ltd
Sandeep Shirsat Equity - 0, Debt - 7, Balanced - 5 HDFCViraj Nadkarni Equity - 7, Debt - 0, Balanced - 5 Larsen & Toubro Limited
14-Sep-10 Rs. 24.3737 Infosys Technologies Ltd
HDFC Bank LtdFund Manager Funds managed by the Fund Manager Tata Consultancy Services Ltd
Debt Securities and Bonds Total - Equity SecuritiesCash and Money Market Investments
DebtTop 10 Sovereign Securities
Hindustan Unilever LtdState Bank of IndiaAxis Bank Ltd
Equity Shares Others (See Annexure 1 for details)
8.35% Government of India 20226.68% Government of India 2031
This Fund is positioned as a balanced mix of debt and equity, with the asset allocationpattern providing a good opportunity to provide consistent and sustainable returns. Theequity portion will have a highly diversified portfolio with high liquidity while the debt portionwill comprise of high rated debt instruments with a low to moderate liquidity. The assetallocation will follow a macro level market scenario and the individual stock selection will bewith micro level performance expectations of the stocks and securities.
6.64% Government of India 20355.85% Government of India 20306.45% Government of India 20296.84% Government of India 20225.77% Government of India 20307.17% Government of India 20287.72% Government of India 2025
9.95% Food Corporation of India 20229.35% Rural Electrification Corp 20227.95% India Infradebt Limited 20247.8% Apollo Tyres Ltd 20229.39% LIC Housing Finance Ltd 20248.07% Energy Efficiency Services Ltd 2021
8.97% Government of India 2030Total - Sovereign Securities
Asset Allocation in crore as on June 30, 2021Top 10 Corporate bonds8.57% Rural Electrification Corp 2024
Grand Total1 Year
8.93% Power Grid Corporation Ltd 20229.9% HDFC 20216.65% Food Corporation of India 2030Others (See Annexure 1 for details)Total - Corporate bonds
PeriodBalanced 1
Fund
29.71AA+ & AA 3.09
Industry -wise Exposure (%) AA- 0.00
8.98
2 Years3 Years Nature Percentage5 Years GSEC & T Bills 50.38
12.4411.6511.21
100.00
Period Exposure in Percentage0 - 3 Months 16.82
A & Below 1.35Fixed Deposits with Banks 0.00CBLO/TREPS/ Other Money Market Investments 15.47
17.86> 10 Years 12.08Total 100.00
3 - 12 Months 30.751 - 3 Years 5.473 - 5 Years 17.02
Average Maturity (Years) Modified Duration (Years) Fund Manager's Comments3.96 2.93
Rs. 424 crore
Composite Benchmark*
0.598.0233.60
Std Dev (Annualised) Sharpe Ratio Portfolio Beta11.31% 2.45 1.07
5 - 10 Years
Total
Since Inception AAA & P1+ & PR1+ & A1+
Money Market Instruments1 Month MF Units – Liquid Funds6 Months
Investment Objective
274.6565%
126.4130%
23.145%
Equity Debt Money Market Instruments
23.67%
21.49%
17.76%
9.50%
6.64%
6.00%
4.25%
3.28%
2.68%
2.37%
2.35%
Others
Financial and Insurance Activities
Sovereign
Computer software
Infrastructure Finance Services
Refinery
Drugs & pharmaceuticals
Trading
Asset Management Services (Mutual Funds)
Industrial construction
Cosmetics, toiletries, soaps & detergents
0% 5% 10% 15% 20% 25%
Fact Sheet for June 2021 ( based on portfolio as on 30.06.2021 )
To provide higher growth with reasonable security, by investing primarily in equityinstruments and moderate allocation in debt securities/ bonds.
Balanced 1 Fund (SFIN:ULIF011010910BALAN1FUND143)
The actual asset allocation will remain within the 'minimum' and 'maximum' range based on market opportunities and future outlook of the markets
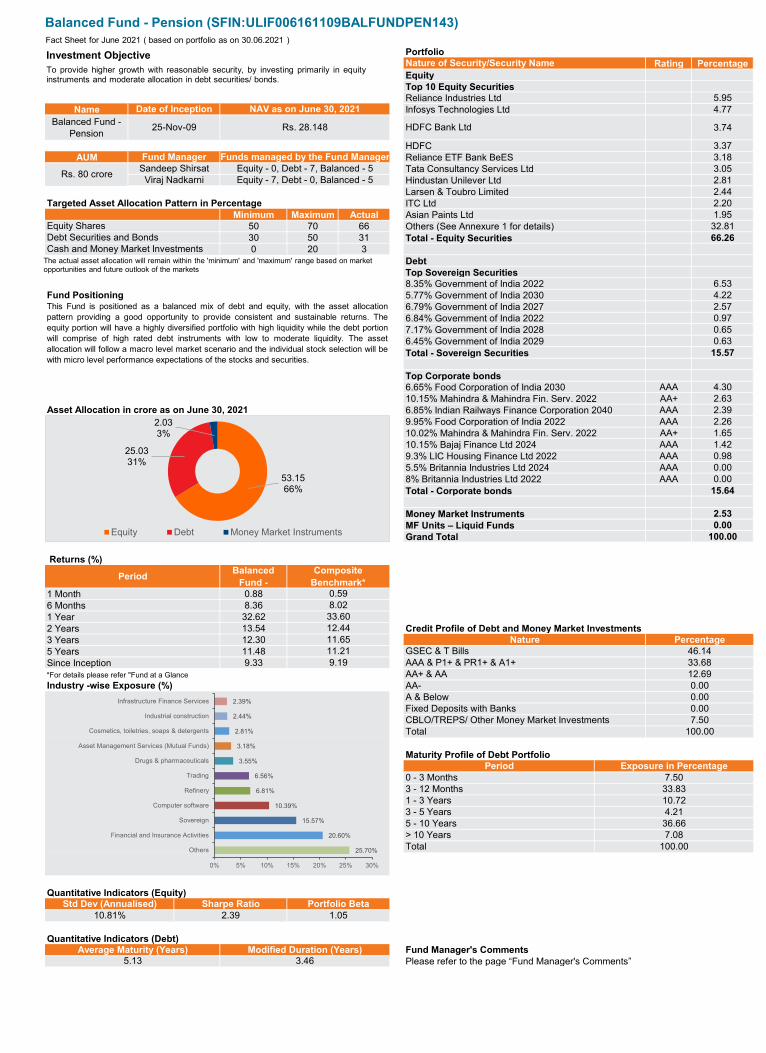
PortfolioRating Percentage
5.95Name 4.77
Balanced Fund - Pension 3.74
3.37AUM 3.18
3.052.812.44
Targeted Asset Allocation Pattern in Percentage 2.20Minimum Maximum Actual 1.95
50 70 66 32.8130 50 31 66.260 20 3
6.53Fund Positioning 4.22
2.570.970.650.63
15.57
AAA 4.30AA+ 2.63AAA 2.39AAA 2.26AA+ 1.65AAA 1.42AAA 0.98AAA 0.00AAA 0.00
15.64
2.530.00
100.00
Returns (%)
0.888.3632.6213.54 Credit Profile of Debt and Money Market Investments12.3011.489.33
*For details please refer "Fund at a Glance
Maturity Profile of Debt Portfolio
Quantitative Indicators (Equity)
Quantitative Indicators (Debt)
Please refer to the page “Fund Manager's Comments”
Nature of Security/Security NameEquityTop 10 Equity SecuritiesReliance Industries Ltd
Date of Inception NAV as on June 30, 2021 Infosys Technologies Ltd
Sandeep Shirsat Equity - 0, Debt - 7, Balanced - 5 Tata Consultancy Services LtdViraj Nadkarni Equity - 7, Debt - 0, Balanced - 5 Hindustan Unilever Ltd
25-Nov-09 Rs. 28.148 HDFC Bank Ltd
HDFCFund Manager Funds managed by the Fund Manager Reliance ETF Bank BeES
Debt Securities and Bonds Total - Equity SecuritiesCash and Money Market Investments
DebtTop Sovereign Securities
Larsen & Toubro LimitedITC LtdAsian Paints Ltd
Equity Shares Others (See Annexure 1 for details)
8.35% Government of India 20225.77% Government of India 2030
This Fund is positioned as a balanced mix of debt and equity, with the asset allocationpattern providing a good opportunity to provide consistent and sustainable returns. Theequity portion will have a highly diversified portfolio with high liquidity while the debt portionwill comprise of high rated debt instruments with low to moderate liquidity. The assetallocation will follow a macro level market scenario and the individual stock selection will bewith micro level performance expectations of the stocks and securities.
6.79% Government of India 20276.84% Government of India 20227.17% Government of India 20286.45% Government of India 2029Total - Sovereign Securities
Top Corporate bonds
10.15% Bajaj Finance Ltd 20249.3% LIC Housing Finance Ltd 20225.5% Britannia Industries Ltd 20248% Britannia Industries Ltd 2022Total - Corporate bonds
6.65% Food Corporation of India 203010.15% Mahindra & Mahindra Fin. Serv. 2022
Asset Allocation in crore as on June 30, 2021 6.85% Indian Railways Finance Corporation 20409.95% Food Corporation of India 202210.02% Mahindra & Mahindra Fin. Serv. 2022
1 Year
Money Market InstrumentsMF Units – Liquid FundsGrand Total
PeriodBalanced
Fund -
33.68AA+ & AA 12.69
Industry -wise Exposure (%) AA- 0.00
9.19
2 Years3 Years Nature Percentage5 Years GSEC & T Bills 46.14
12.4411.6511.21
100.00
Period Exposure in Percentage0 - 3 Months 7.50
A & Below 0.00Fixed Deposits with Banks 0.00CBLO/TREPS/ Other Money Market Investments 7.50
36.66> 10 Years 7.08Total 100.00
3 - 12 Months 33.831 - 3 Years 10.723 - 5 Years 4.21
Average Maturity (Years) Modified Duration (Years) Fund Manager's Comments5.13 3.46
Rs. 80 crore
Composite Benchmark*
0.598.0233.60
Std Dev (Annualised) Sharpe Ratio Portfolio Beta10.81% 2.39 1.05
5 - 10 Years
Total
Since Inception AAA & P1+ & PR1+ & A1+
1 Month6 Months
Investment Objective
53.1566%
25.0331%
2.033%
Equity Debt Money Market Instruments
25.70%
20.60%
15.57%
10.39%
6.81%
6.56%
3.55%
3.18%
2.81%
2.44%
2.39%
Others
Financial and Insurance Activities
Sovereign
Computer software
Refinery
Trading
Drugs & pharmaceuticals
Asset Management Services (Mutual Funds)
Cosmetics, toiletries, soaps & detergents
Industrial construction
Infrastructure Finance Services
0% 5% 10% 15% 20% 25% 30%
Fact Sheet for June 2021 ( based on portfolio as on 30.06.2021 )
To provide higher growth with reasonable security, by investing primarily in equityinstruments and moderate allocation in debt securities/ bonds.
Balanced Fund - Pension (SFIN:ULIF006161109BALFUNDPEN143)
The actual asset allocation will remain within the 'minimum' and 'maximum' range based on market opportunities and future outlook of the markets
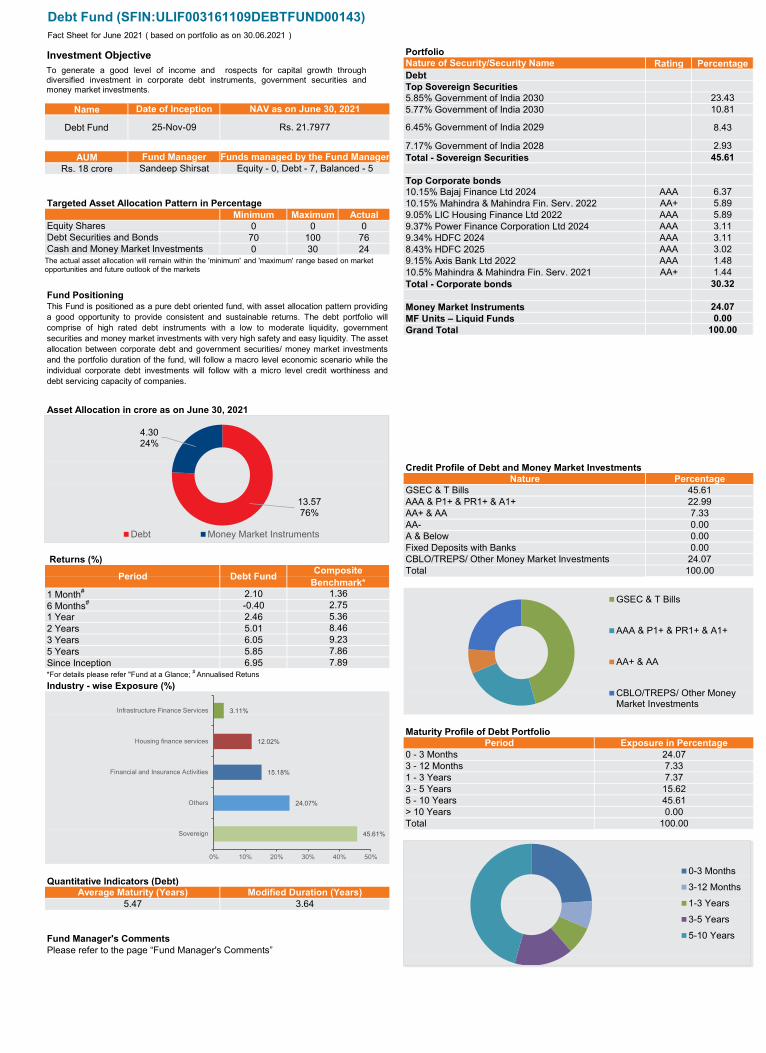
PortfolioRating Percentage
23.43Name 10.81
Debt Fund 8.43
2.93AUM 45.61
Rs. 18 crore
AAA 6.37Targeted Asset Allocation Pattern in Percentage AA+ 5.89
Minimum Maximum Actual AAA 5.890 0 0 AAA 3.1170 100 76 AAA 3.110 30 24 AAA 3.02
AAA 1.48AA+ 1.44
30.32Fund Positioning
24.070.00
100.00
Credit Profile of Debt and Money Market Investments
Returns (%)
2.10-0.402.465.016.055.856.95
*For details please refer "Fund at a Glance; # Annualised RetunsIndustry - wise Exposure (%)
Maturity Profile of Debt Portfolio
Quantitative Indicators (Debt)
Fund Manager's CommentsPlease refer to the page “Fund Manager's Comments”
Nature of Security/Security NameDebtTop Sovereign Securities5.85% Government of India 2030
Date of Inception NAV as on June 30, 2021 5.77% Government of India 2030
Sandeep Shirsat Equity - 0, Debt - 7, Balanced - 5Top Corporate bonds
25-Nov-09 Rs. 21.7977 6.45% Government of India 2029
7.17% Government of India 2028Fund Manager Funds managed by the Fund Manager Total - Sovereign Securities
Debt Securities and Bonds 9.34% HDFC 2024Cash and Money Market Investments 8.43% HDFC 2025
9.15% Axis Bank Ltd 202210.5% Mahindra & Mahindra Fin. Serv. 2021
10.15% Bajaj Finance Ltd 202410.15% Mahindra & Mahindra Fin. Serv. 20229.05% LIC Housing Finance Ltd 2022
Equity Shares 9.37% Power Finance Corporation Ltd 2024
Asset Allocation in crore as on June 30, 2021
Total - Corporate bonds
Money Market InstrumentsMF Units – Liquid FundsGrand Total
This Fund is positioned as a pure debt oriented fund, with asset allocation pattern providinga good opportunity to provide consistent and sustainable returns. The debt portfolio willcomprise of high rated debt instruments with a low to moderate liquidity, governmentsecurities and money market investments with very high safety and easy liquidity. The assetallocation between corporate debt and government securities/ money market investmentsand the portfolio duration of the fund, will follow a macro level economic scenario while theindividual corporate debt investments will follow with a micro level credit worthiness anddebt servicing capacity of companies.
Nature PercentageGSEC & T Bills 45.61AAA & P1+ & PR1+ & A1+ 22.99
Fixed Deposits with Banks 0.00CBLO/TREPS/ Other Money Market Investments 24.07
Period Debt FundTotal 100.00
AA+ & AA 7.33AA- 0.00A & Below 0.00
8.463 Years 9.235 Years 7.86
1 Month# 1.366 Months# 2.751 Year 5.36
Average Maturity (Years) Modified Duration (Years)5.47 3.64
Composite Benchmark*
5 - 10 Years 45.61> 10 Years 0.00Total 100.00
3 - 12 Months 7.331 - 3 Years 7.373 - 5 Years 15.62
Since Inception 7.89
Period Exposure in Percentage0 - 3 Months 24.07
2 Years
Investment Objective
The actual asset allocation will remain within the 'minimum' and 'maximum' range based on market opportunities and future outlook of the markets
13.5776%
4.3024%
Debt Money Market Instruments
0-3 Months
3-12 Months
1-3 Years
3-5 Years
5-10 Years
45.61%
24.07%
15.18%
12.02%
3.11%
Sovereign
Others
Financial and Insurance Activities
Housing finance services
Infrastructure Finance Services
0% 10% 20% 30% 40% 50%
Fact Sheet for June 2021 ( based on portfolio as on 30.06.2021 )
To generate a good level of income and rospects for capital growth throughdiversified investment in corporate debt instruments, government securities andmoney market investments.
Debt Fund (SFIN:ULIF003161109DEBTFUND00143)
GSEC & T Bills
AAA & P1+ & PR1+ & A1+
AA+ & AA
CBLO/TREPS/ Other MoneyMarket Investments
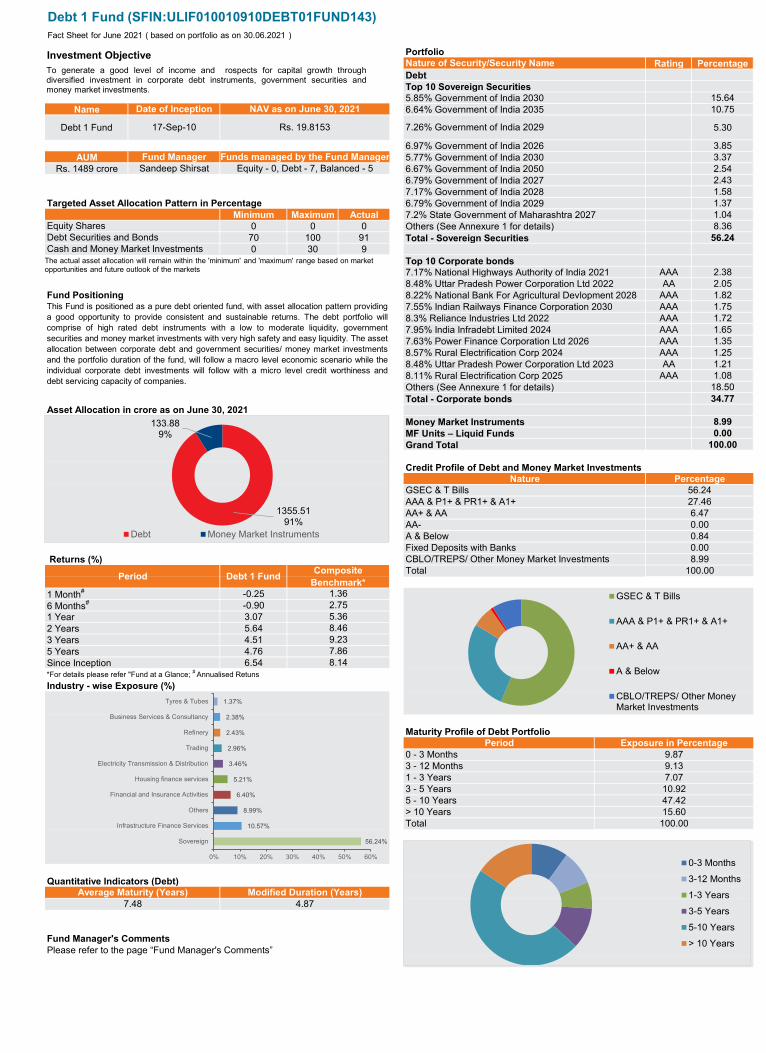
PortfolioRating Percentage
15.64Name 10.75
Debt 1 Fund 5.30
3.85AUM 3.37
Rs. 1489 crore 2.542.431.58
Targeted Asset Allocation Pattern in Percentage 1.37Minimum Maximum Actual 1.04
0 0 0 8.3670 100 91 56.240 30 9
AAA 2.38AA 2.05
Fund Positioning AAA 1.82AAA 1.75AAA 1.72AAA 1.65AAA 1.35AAA 1.25AA 1.21
AAA 1.0818.5034.77
8.990.00
100.00
Credit Profile of Debt and Money Market Investments
Returns (%)
-0.25-0.903.075.644.514.766.54
*For details please refer "Fund at a Glance; # Annualised RetunsIndustry - wise Exposure (%)
Maturity Profile of Debt Portfolio
Quantitative Indicators (Debt)
Fund Manager's CommentsPlease refer to the page “Fund Manager's Comments”
Nature of Security/Security NameDebtTop 10 Sovereign Securities5.85% Government of India 2030
Date of Inception NAV as on June 30, 2021 6.64% Government of India 2035
Sandeep Shirsat Equity - 0, Debt - 7, Balanced - 5 6.67% Government of India 20506.79% Government of India 2027
17-Sep-10 Rs. 19.8153 7.26% Government of India 2029
6.97% Government of India 2026Fund Manager Funds managed by the Fund Manager 5.77% Government of India 2030
Debt Securities and Bonds Total - Sovereign SecuritiesCash and Money Market Investments
Top 10 Corporate bonds7.17% National Highways Authority of India 2021
7.17% Government of India 20286.79% Government of India 20297.2% State Government of Maharashtra 2027
Equity Shares Others (See Annexure 1 for details)
Asset Allocation in crore as on June 30, 2021Money Market InstrumentsMF Units – Liquid Funds
8.48% Uttar Pradesh Power Corporation Ltd 20228.22% National Bank For Agricultural Devlopment 20287.55% Indian Railways Finance Corporation 20308.3% Reliance Industries Ltd 20227.95% India Infradebt Limited 20247.63% Power Finance Corporation Ltd 20268.57% Rural Electrification Corp 20248.48% Uttar Pradesh Power Corporation Ltd 20238.11% Rural Electrification Corp 2025
This Fund is positioned as a pure debt oriented fund, with asset allocation pattern providinga good opportunity to provide consistent and sustainable returns. The debt portfolio willcomprise of high rated debt instruments with a low to moderate liquidity, governmentsecurities and money market investments with very high safety and easy liquidity. The assetallocation between corporate debt and government securities/ money market investmentsand the portfolio duration of the fund, will follow a macro level economic scenario while theindividual corporate debt investments will follow with a micro level credit worthiness anddebt servicing capacity of companies.
Grand Total
Nature PercentageGSEC & T Bills 56.24AAA & P1+ & PR1+ & A1+ 27.46
Others (See Annexure 1 for details)Total - Corporate bonds
Fixed Deposits with Banks 0.00CBLO/TREPS/ Other Money Market Investments 8.99
Period Debt 1 FundTotal 100.00
AA+ & AA 6.47AA- 0.00A & Below 0.84
8.463 Years 9.235 Years 7.86
1 Month# 1.366 Months# 2.751 Year 5.36
Average Maturity (Years) Modified Duration (Years)7.48 4.87
Composite Benchmark*
5 - 10 Years 47.42> 10 Years 15.60Total 100.00
3 - 12 Months 9.131 - 3 Years 7.073 - 5 Years 10.92
Since Inception 8.14
Period Exposure in Percentage0 - 3 Months 9.87
2 Years
Investment Objective
The actual asset allocation will remain within the 'minimum' and 'maximum' range based on market opportunities and future outlook of the markets
1355.5191%
133.889%
Debt Money Market Instruments
0-3 Months
3-12 Months
1-3 Years
3-5 Years
5-10 Years
> 10 Years
56.24%
10.57%
8.99%
6.40%
5.21%
3.46%
2.96%
2.43%
2.38%
1.37%
Sovereign
Infrastructure Finance Services
Others
Financial and Insurance Activities
Housing finance services
Electricity Transmission & Distribution
Trading
Refinery
Business Services & Consultancy
Tyres & Tubes
0% 10% 20% 30% 40% 50% 60%
Fact Sheet for June 2021 ( based on portfolio as on 30.06.2021 )
To generate a good level of income and rospects for capital growth throughdiversified investment in corporate debt instruments, government securities andmoney market investments.
Debt 1 Fund (SFIN:ULIF010010910DEBT01FUND143)
GSEC & T Bills
AAA & P1+ & PR1+ & A1+
AA+ & AA
A & Below
CBLO/TREPS/ Other MoneyMarket Investments
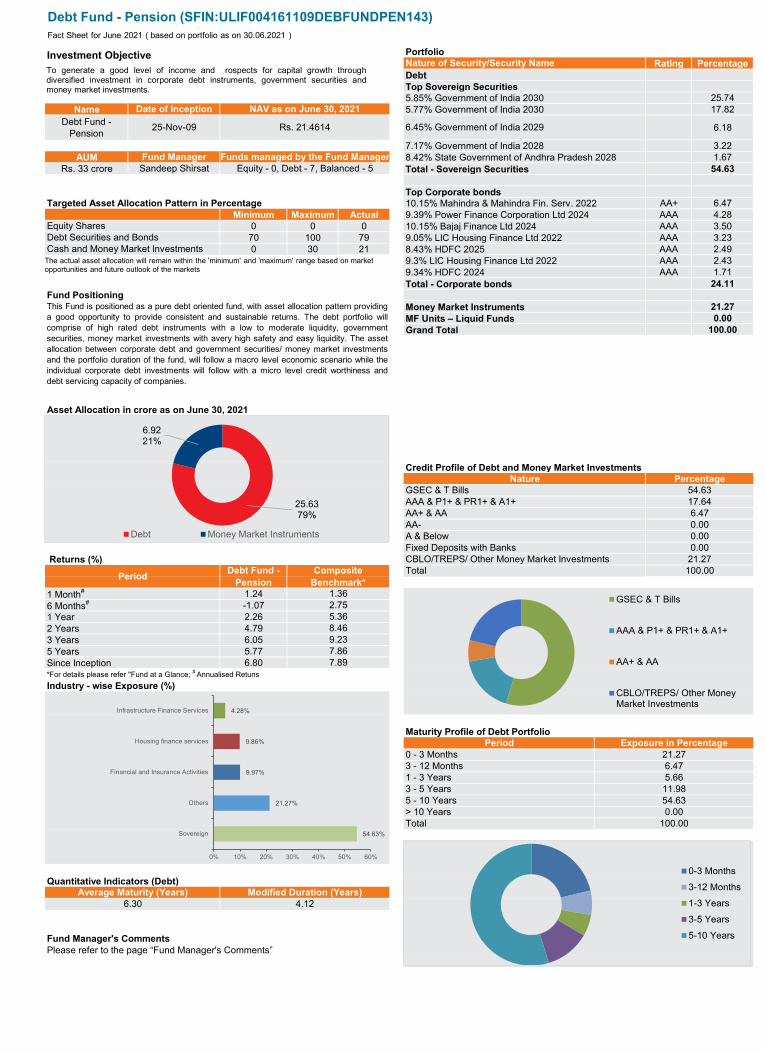
PortfolioRating Percentage
25.74Name 17.82
Debt Fund - Pension 6.18
3.22AUM 1.67
Rs. 33 crore 54.63
Targeted Asset Allocation Pattern in Percentage AA+ 6.47Minimum Maximum Actual AAA 4.28
0 0 0 AAA 3.5070 100 79 AAA 3.230 30 21 AAA 2.49
AAA 2.43AAA 1.71
24.11Fund Positioning
21.270.00
100.00
Credit Profile of Debt and Money Market Investments
Returns (%)
1.24-1.072.264.796.055.776.80
*For details please refer "Fund at a Glance; # Annualised RetunsIndustry - wise Exposure (%)
Maturity Profile of Debt Portfolio
Quantitative Indicators (Debt)
Fund Manager's CommentsPlease refer to the page “Fund Manager's Comments”
Nature of Security/Security NameDebtTop Sovereign Securities5.85% Government of India 2030
Date of Inception NAV as on June 30, 2021 5.77% Government of India 2030
Sandeep Shirsat Equity - 0, Debt - 7, Balanced - 5 Total - Sovereign Securities
25-Nov-09 Rs. 21.4614 6.45% Government of India 2029
7.17% Government of India 2028Fund Manager Funds managed by the Fund Manager 8.42% State Government of Andhra Pradesh 2028
Debt Securities and Bonds 9.05% LIC Housing Finance Ltd 2022Cash and Money Market Investments 8.43% HDFC 2025
9.3% LIC Housing Finance Ltd 20229.34% HDFC 2024
Top Corporate bonds10.15% Mahindra & Mahindra Fin. Serv. 20229.39% Power Finance Corporation Ltd 2024
Equity Shares 10.15% Bajaj Finance Ltd 2024
Asset Allocation in crore as on June 30, 2021
Total - Corporate bonds
Money Market InstrumentsMF Units – Liquid FundsGrand Total
This Fund is positioned as a pure debt oriented fund, with asset allocation pattern providinga good opportunity to provide consistent and sustainable returns. The debt portfolio willcomprise of high rated debt instruments with a low to moderate liquidity, governmentsecurities, money market investments with avery high safety and easy liquidity. The assetallocation between corporate debt and government securities/ money market investmentsand the portfolio duration of the fund, will follow a macro level economic scenario while theindividual corporate debt investments will follow with a micro level credit worthiness anddebt servicing capacity of companies.
Nature PercentageGSEC & T Bills 54.63AAA & P1+ & PR1+ & A1+ 17.64
Fixed Deposits with Banks 0.00CBLO/TREPS/ Other Money Market Investments 21.27
PeriodDebt Fund -
PensionTotal 100.00
AA+ & AA 6.47AA- 0.00A & Below 0.00
8.463 Years 9.235 Years 7.86
1 Month# 1.366 Months# 2.751 Year 5.36
Average Maturity (Years) Modified Duration (Years)6.30 4.12
Composite Benchmark*
5 - 10 Years 54.63> 10 Years 0.00Total 100.00
3 - 12 Months 6.471 - 3 Years 5.663 - 5 Years 11.98
Since Inception 7.89
Period Exposure in Percentage0 - 3 Months 21.27
2 Years
Investment Objective
The actual asset allocation will remain within the 'minimum' and 'maximum' range based on market opportunities and future outlook of the markets
25.6379%
6.9221%
Debt Money Market Instruments
0-3 Months
3-12 Months
1-3 Years
3-5 Years
5-10 Years
54.63%
21.27%
9.97%
9.86%
4.28%
Sovereign
Others
Financial and Insurance Activities
Housing finance services
Infrastructure Finance Services
0% 10% 20% 30% 40% 50% 60%
Fact Sheet for June 2021 ( based on portfolio as on 30.06.2021 )
To generate a good level of income and rospects for capital growth throughdiversified investment in corporate debt instruments, government securities andmoney market investments.
Debt Fund - Pension (SFIN:ULIF004161109DEBFUNDPEN143)
GSEC & T Bills
AAA & P1+ & PR1+ & A1+
AA+ & AA
CBLO/TREPS/ Other MoneyMarket Investments
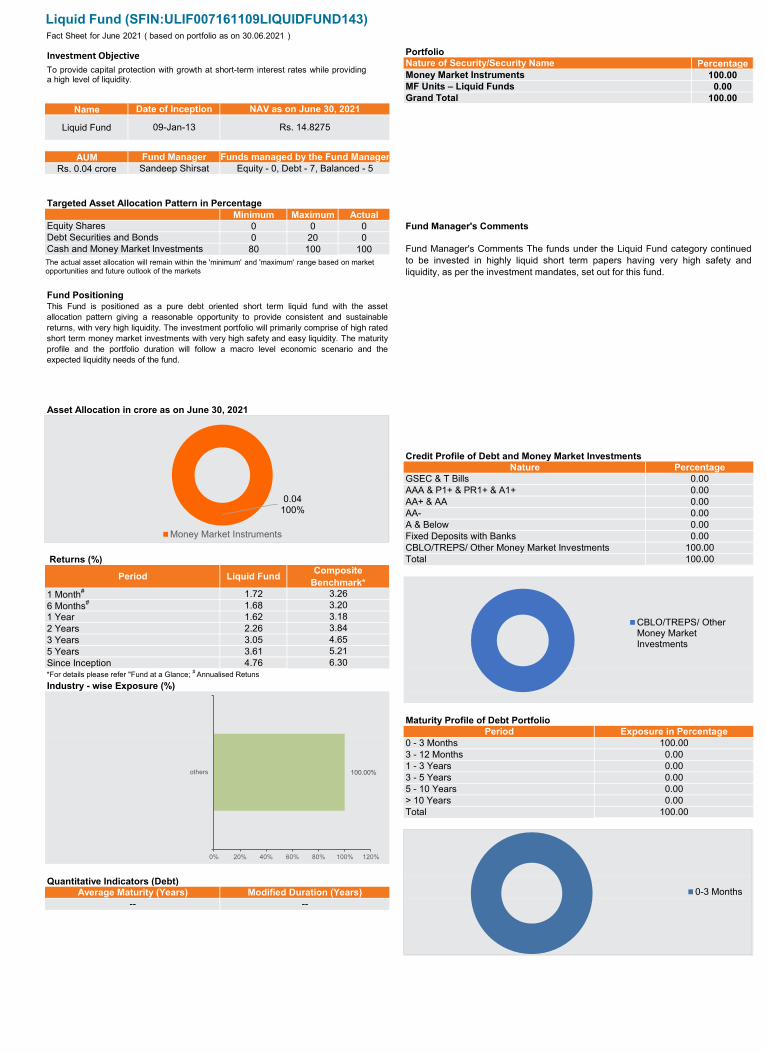
PortfolioPercentage
Money Market Instruments 100.00MF Units – Liquid Funds 0.00Grand Total 100.00
Name
Liquid Fund
AUMRs. 0.04 crore
Targeted Asset Allocation Pattern in PercentageMinimum Maximum Actual
0 0 0 Fund Manager's Comments0 20 080 100 100
Fund Positioning
Credit Profile of Debt and Money Market Investments
Returns (%)
1.721.681.622.263.053.614.76
*For details please refer "Fund at a Glance; # Annualised RetunsIndustry - wise Exposure (%)
Maturity Profile of Debt Portfolio
Quantitative Indicators (Debt)
Nature of Security/Security Name
Date of Inception NAV as on June 30, 2021
09-Jan-13 Rs. 14.8275
Fund Manager Funds managed by the Fund ManagerSandeep Shirsat Equity - 0, Debt - 7, Balanced - 5
AAA & P1+ & PR1+ & A1+ 0.00
Equity SharesDebt Securities and Bonds
Fund Manager's Comments The funds under the Liquid Fund category continuedto be invested in highly liquid short term papers having very high safety andliquidity, as per the investment mandates, set out for this fund.
Cash and Money Market Investments
This Fund is positioned as a pure debt oriented short term liquid fund with the assetallocation pattern giving a reasonable opportunity to provide consistent and sustainablereturns, with very high liquidity. The investment portfolio will primarily comprise of high ratedshort term money market investments with very high safety and easy liquidity. The maturityprofile and the portfolio duration will follow a macro level economic scenario and theexpected liquidity needs of the fund.
Asset Allocation in crore as on June 30, 2021
Nature PercentageGSEC & T Bills 0.00
AA+ & AA 0.00AA- 0.00A & Below 0.00Fixed Deposits with Banks 0.00CBLO/TREPS/ Other Money Market Investments 100.00Total 100.00
3.183.844.655.21
Period Liquid Fund
1 Month#
6 Months#
Composite Benchmark*
3.263.20
1 Year2 Years3 Years5 YearsSince Inception
-- --
3 - 5 Years 0.005 - 10 Years 0.00> 10 Years 0.00
6.30
Total 100.00
Average Maturity (Years) Modified Duration (Years)
Exposure in Percentage0 - 3 Months
Period100.00
3 - 12 Months 0.001 - 3 Years 0.00
Investment Objective
0.04100%
Money Market Instruments
0-3 Months
100.00%others
0% 20% 40% 60% 80% 100% 120%
To provide capital protection with growth at short-term interest rates while providinga high level of liquidity.
Fact Sheet for June 2021 ( based on portfolio as on 30.06.2021 )
Liquid Fund (SFIN:ULIF007161109LIQUIDFUND143)
The actual asset allocation will remain within the 'minimum' and 'maximum' range based on market opportunities and future outlook of the markets
CBLO/TREPS/ OtherMoney MarketInvestments

PortfolioPercentage
Money Market Instruments 100.00MF Units – Liquid Funds 0.00Grand Total 100.00
NameLiquid Fund -
Pension
AUMRs. 0.19 crore
Targeted Asset Allocation Pattern in PercentageMinimum Maximum Actual
0 0 0 Fund Manager's Comments0 20 080 100 100
Fund Positioning
Credit Profile of Debt and Money Market Investments
Returns (%)
1.701.661.602.172.893.414.98
*For details please refer "Fund at a Glance; # Annualised RetunsIndustry - wise Exposure (%)
Maturity Profile of Debt Portfolio
Quantitative Indicators (Debt)
Nature of Security/Security Name
Date of Inception NAV as on June 30, 2021
25-Nov-09 Rs. 17.5717
Fund Manager Funds managed by the Fund ManagerSandeep Shirsat Equity - 0, Debt - 7, Balanced - 5
AAA & P1+ & PR1+ & A1+ 0.00
Equity SharesDebt Securities and Bonds
Fund Manager's Comments The funds under the Liquid Fund category continuedto be invested in highly liquid short term papers having very high safety andliquidity, as per the investment mandates, set out for this fund.
Cash and Money Market Investments
This Fund is positioned as a pure debt oriented short term liquid fund with the assetallocation pattern giving a reasonable opportunity to provide consistent and sustainablereturns, with very high liquidity. The investment portfolio will primarily comprise of high ratedshort term money market investments with very high safety and easy liquidity. The maturityprofile and the portfolio duration will follow a macro level economic scenario and theexpected liquidity needs of the fund.
Asset Allocation in crore as on June 30, 2021
Nature PercentageGSEC & T Bills 0.00
AA+ & AA 0.00AA- 0.00A & Below 0.00Fixed Deposits with Banks 0.00CBLO/TREPS/ Other Money Market Investments 100.00Total 100.00
3.183.844.655.21
PeriodLiquid Fund -
Pension1 Month#
6 Months#
Composite Benchmark*
3.263.20
1 Year2 Years3 Years5 YearsSince Inception
-- --
3 - 5 Years 0.005 - 10 Years 0.00> 10 Years 0.00
6.39
Total 100.00
Average Maturity (Years) Modified Duration (Years)
Exposure in Percentage0 - 3 Months
Period100.00
3 - 12 Months 0.001 - 3 Years 0.00
Investment Objective
0.19100%
Money Market Instruments
0-3 Months
100.00%others
0% 20% 40% 60% 80% 100% 120%
To provide capital protection with growth at short-term interest rates while providinga high level of liquidity.
Fact Sheet for June 2021 ( based on portfolio as on 30.06.2021 )
Liquid Fund - Pension (SFIN:ULIF008161109LIQFUNDPEN143)
The actual asset allocation will remain within the 'minimum' and 'maximum' range based on market opportunities and future outlook of the markets
CBLO/TREPS/ OtherMoney MarketInvestments
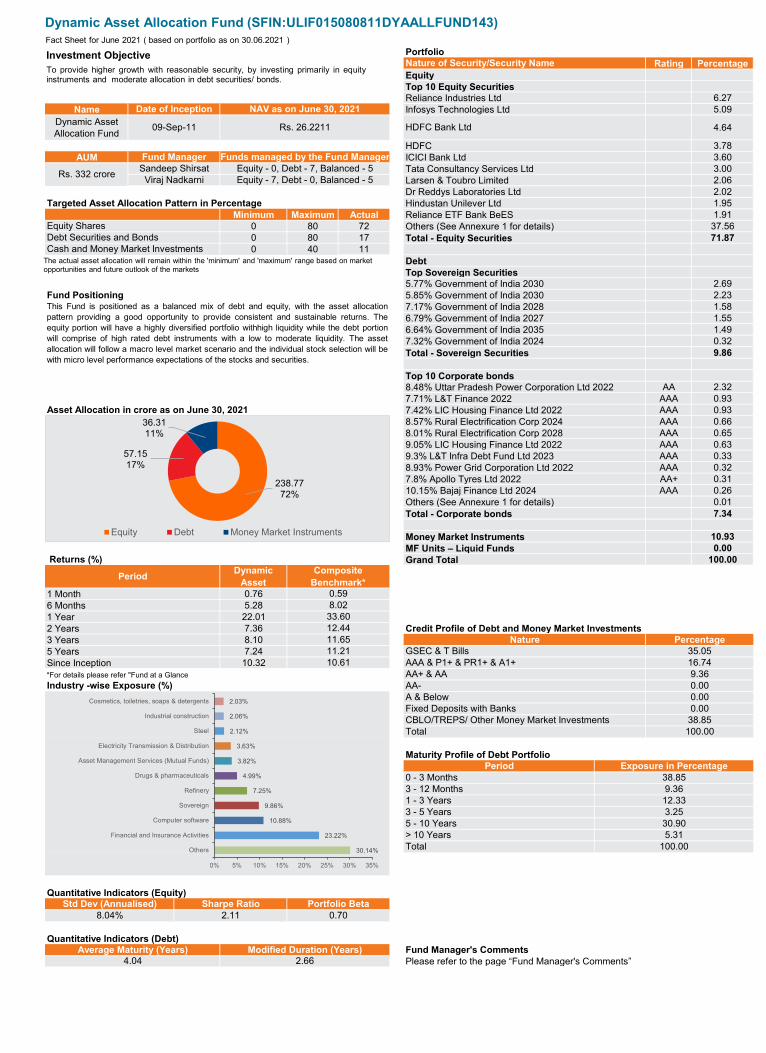
PortfolioRating Percentage
6.27Name 5.09
Dynamic Asset Allocation Fund 4.64
3.78AUM 3.60
3.002.062.02
Targeted Asset Allocation Pattern in Percentage 1.95Minimum Maximum Actual 1.91
0 80 72 37.560 80 17 71.870 40 11
2.69Fund Positioning 2.23
1.581.551.490.329.86
AA 2.32AAA 0.93AAA 0.93AAA 0.66AAA 0.65AAA 0.63AAA 0.33AAA 0.32AA+ 0.31AAA 0.26
0.017.34
10.930.00
Returns (%) 100.00
0.765.2822.017.36 Credit Profile of Debt and Money Market Investments8.107.2410.32
*For details please refer "Fund at a Glance
Maturity Profile of Debt Portfolio
Quantitative Indicators (Equity)
Quantitative Indicators (Debt)
Please refer to the page “Fund Manager's Comments”
Nature of Security/Security NameEquityTop 10 Equity SecuritiesReliance Industries Ltd
Date of Inception NAV as on June 30, 2021 Infosys Technologies Ltd
Sandeep Shirsat Equity - 0, Debt - 7, Balanced - 5 Tata Consultancy Services LtdViraj Nadkarni Equity - 7, Debt - 0, Balanced - 5 Larsen & Toubro Limited
09-Sep-11 Rs. 26.2211 HDFC Bank Ltd
HDFCFund Manager Funds managed by the Fund Manager ICICI Bank Ltd
Debt Securities and Bonds Total - Equity SecuritiesCash and Money Market Investments
DebtTop Sovereign Securities
Dr Reddys Laboratories LtdHindustan Unilever LtdReliance ETF Bank BeES
Equity Shares Others (See Annexure 1 for details)
5.77% Government of India 20305.85% Government of India 2030
This Fund is positioned as a balanced mix of debt and equity, with the asset allocationpattern providing a good opportunity to provide consistent and sustainable returns. Theequity portion will have a highly diversified portfolio withhigh liquidity while the debt portionwill comprise of high rated debt instruments with a low to moderate liquidity. The assetallocation will follow a macro level market scenario and the individual stock selection will bewith micro level performance expectations of the stocks and securities.
7.17% Government of India 20286.79% Government of India 20276.64% Government of India 20357.32% Government of India 2024Total - Sovereign Securities
Top 10 Corporate bonds
9.05% LIC Housing Finance Ltd 20229.3% L&T Infra Debt Fund Ltd 20238.93% Power Grid Corporation Ltd 20227.8% Apollo Tyres Ltd 202210.15% Bajaj Finance Ltd 2024Others (See Annexure 1 for details)
8.48% Uttar Pradesh Power Corporation Ltd 20227.71% L&T Finance 2022
Asset Allocation in crore as on June 30, 2021 7.42% LIC Housing Finance Ltd 20228.57% Rural Electrification Corp 20248.01% Rural Electrification Corp 2028
1 Year
Total - Corporate bonds
Money Market InstrumentsMF Units – Liquid FundsGrand Total
PeriodDynamic
Asset
16.74AA+ & AA 9.36
Industry -wise Exposure (%) AA- 0.00
10.61
2 Years3 Years Nature Percentage5 Years GSEC & T Bills 35.05
12.4411.6511.21
100.00
Period Exposure in Percentage0 - 3 Months 38.85
A & Below 0.00Fixed Deposits with Banks 0.00CBLO/TREPS/ Other Money Market Investments 38.85
30.90> 10 Years 5.31Total 100.00
3 - 12 Months 9.361 - 3 Years 12.333 - 5 Years 3.25
Average Maturity (Years) Modified Duration (Years) Fund Manager's Comments4.04 2.66
Rs. 332 crore
Composite Benchmark*
0.598.0233.60
Std Dev (Annualised) Sharpe Ratio Portfolio Beta8.04% 2.11 0.70
5 - 10 Years
Total
Since Inception AAA & P1+ & PR1+ & A1+
1 Month6 Months
Investment Objective
238.7772%
57.1517%
36.3111%
Equity Debt Money Market Instruments
30.14%
23.22%
10.88%
9.86%
7.25%
4.99%
3.82%
3.63%
2.12%
2.06%
2.03%
Others
Financial and Insurance Activities
Computer software
Sovereign
Refinery
Drugs & pharmaceuticals
Asset Management Services (Mutual Funds)
Electricity Transmission & Distribution
Steel
Industrial construction
Cosmetics, toiletries, soaps & detergents
0% 5% 10% 15% 20% 25% 30% 35%
Fact Sheet for June 2021 ( based on portfolio as on 30.06.2021 )
To provide higher growth with reasonable security, by investing primarily in equityinstruments and moderate allocation in debt securities/ bonds.
Dynamic Asset Allocation Fund (SFIN:ULIF015080811DYAALLFUND143)
The actual asset allocation will remain within the 'minimum' and 'maximum' range based on market opportunities and future outlook of the markets
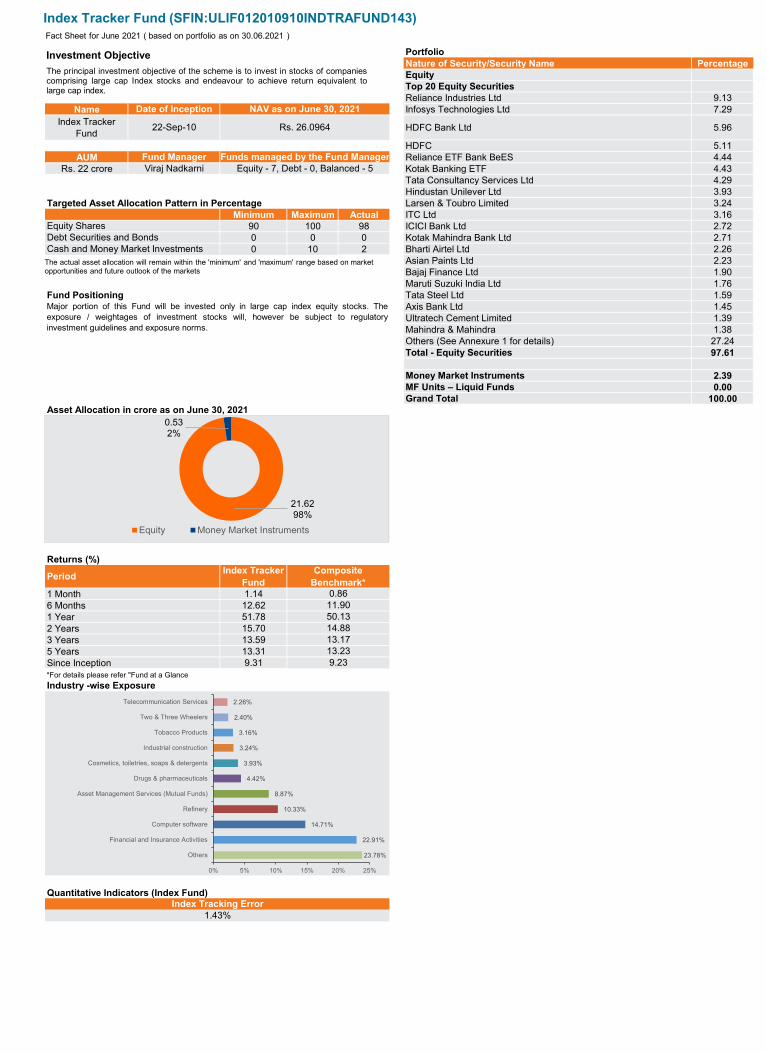
PortfolioNature of Security/Security Name PercentageEquityTop 20 Equity SecuritiesReliance Industries Ltd 9.13
Name Infosys Technologies Ltd 7.29Index Tracker
Fund HDFC Bank Ltd 5.96
HDFC 5.11AUM Reliance ETF Bank BeES 4.44
Rs. 22 crore Kotak Banking ETF 4.43Tata Consultancy Services Ltd 4.29Hindustan Unilever Ltd 3.93
Targeted Asset Allocation Pattern in Percentage Larsen & Toubro Limited 3.24Minimum Maximum Actual ITC Ltd 3.16
90 100 98 ICICI Bank Ltd 2.720 0 0 Kotak Mahindra Bank Ltd 2.710 10 2 Bharti Airtel Ltd 2.26
Asian Paints Ltd 2.23Bajaj Finance Ltd 1.90Maruti Suzuki India Ltd 1.76
Fund Positioning Tata Steel Ltd 1.59Axis Bank Ltd 1.45Ultratech Cement Limited 1.39Mahindra & Mahindra 1.38Others (See Annexure 1 for details) 27.24Total - Equity Securities 97.61
Money Market Instruments 2.39MF Units – Liquid Funds 0.00Grand Total 100.00
Returns (%)
1 Month 1.146 Months 12.621 Year 51.782 Years 15.703 Years 13.595 Years 13.31Since Inception 9.31*For details please refer "Fund at a Glance
Quantitative Indicators (Index Fund)
Equity Shares
Date of Inception NAV as on June 30, 2021
22-Sep-10 Rs. 26.0964
Fund Manager Funds managed by the Fund ManagerViraj Nadkarni Equity - 7, Debt - 0, Balanced - 5
Debt Securities and BondsCash and Money Market Investments
Major portion of this Fund will be invested only in large cap index equity stocks. Theexposure / weightages of investment stocks will, however be subject to regulatoryinvestment guidelines and exposure norms.
Asset Allocation in crore as on June 30, 2021
9.23
Industry -wise Exposure
Index Tracking Error1.43%
Composite Benchmark*
0.8611.9050.1314.8813.1713.23
PeriodIndex Tracker
Fund
Investment Objective
Index Tracker Fund (SFIN:ULIF012010910INDTRAFUND143)
21.6298%
0.532%
Equity Money Market Instruments
23.78%
22.91%
14.71%
10.33%
8.87%
4.42%
3.93%
3.24%
3.16%
2.40%
2.26%
Others
Financial and Insurance Activities
Computer software
Refinery
Asset Management Services (Mutual Funds)
Drugs & pharmaceuticals
Cosmetics, toiletries, soaps & detergents
Industrial construction
Tobacco Products
Two & Three Wheelers
Telecommunication Services
0% 5% 10% 15% 20% 25%
The principal investment objective of the scheme is to invest in stocks of companiescomprising large cap Index stocks and endeavour to achieve return equivalent tolarge cap index.
Fact Sheet for June 2021 ( based on portfolio as on 30.06.2021 )
The actual asset allocation will remain within the 'minimum' and 'maximum' range based on market opportunities and future outlook of the markets
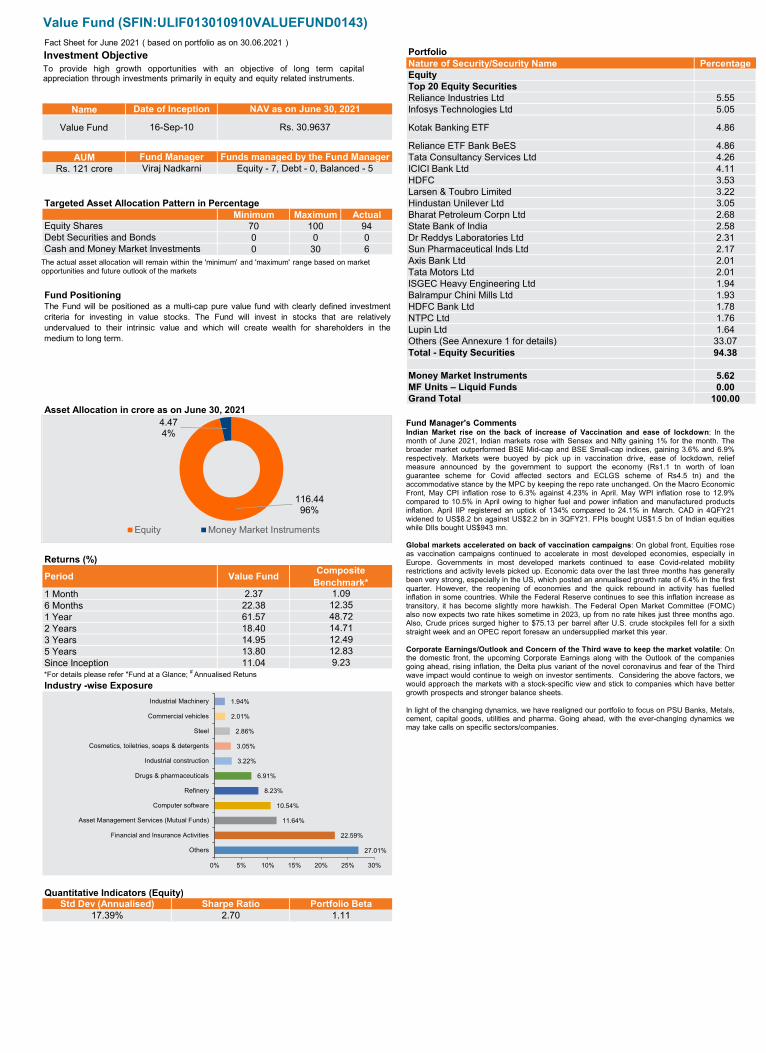
PortfolioNature of Security/Security Name PercentageEquityTop 20 Equity SecuritiesReliance Industries Ltd 5.55
Name Infosys Technologies Ltd 5.05
Value Fund Kotak Banking ETF 4.86
Reliance ETF Bank BeES 4.86AUM Tata Consultancy Services Ltd 4.26
Rs. 121 crore ICICI Bank Ltd 4.11HDFC 3.53Larsen & Toubro Limited 3.22
Targeted Asset Allocation Pattern in Percentage Hindustan Unilever Ltd 3.05Minimum Maximum Actual Bharat Petroleum Corpn Ltd 2.68
70 100 94 State Bank of India 2.580 0 0 Dr Reddys Laboratories Ltd 2.310 30 6 Sun Pharmaceutical Inds Ltd 2.17
Axis Bank Ltd 2.01Tata Motors Ltd 2.01ISGEC Heavy Engineering Ltd 1.94
Fund Positioning Balrampur Chini Mills Ltd 1.93HDFC Bank Ltd 1.78NTPC Ltd 1.76Lupin Ltd 1.64Others (See Annexure 1 for details) 33.07Total - Equity Securities 94.38
Money Market Instruments 5.62MF Units – Liquid Funds 0.00Grand Total 100.00
Returns (%)
1 Month 2.376 Months 22.381 Year 61.572 Years 18.403 Years 14.955 Years 13.80Since Inception 11.04*For details please refer "Fund at a Glance; # Annualised Retuns
Quantitative Indicators (Equity)
Equity Shares
Date of Inception NAV as on June 30, 2021
16-Sep-10 Rs. 30.9637
Fund Manager Funds managed by the Fund ManagerViraj Nadkarni Equity - 7, Debt - 0, Balanced - 5
Debt Securities and BondsCash and Money Market Investments
The Fund will be positioned as a multi-cap pure value fund with clearly defined investmentcriteria for investing in value stocks. The Fund will invest in stocks that are relativelyundervalued to their intrinsic value and which will create wealth for shareholders in themedium to long term.
Asset Allocation in crore as on June 30, 2021
Period Value FundComposite
Benchmark*
Industry -wise Exposure
Std Dev (Annualised) Sharpe Ratio Portfolio Beta17.39% 2.70 1.11
9.23
1.0912.3548.7214.7112.4912.83
Investment Objective
116.4496%
4.474%
Equity Money Market Instruments
Fact Sheet for June 2021 ( based on portfolio as on 30.06.2021 )
To provide high growth opportunities with an objective of long term capitalappreciation through investments primarily in equity and equity related instruments.
Value Fund (SFIN:ULIF013010910VALUEFUND0143)
27.01%
22.59%
11.64%
10.54%
8.23%
6.91%
3.22%
3.05%
2.86%
2.01%
1.94%
Others
Financial and Insurance Activities
Asset Management Services (Mutual Funds)
Computer software
Refinery
Drugs & pharmaceuticals
Industrial construction
Cosmetics, toiletries, soaps & detergents
Steel
Commercial vehicles
Industrial Machinery
0% 5% 10% 15% 20% 25% 30%
The actual asset allocation will remain within the 'minimum' and 'maximum' range based on market opportunities and future outlook of the markets
Fund Manager's CommentsIndian Market rise on the back of increase of Vaccination and ease of lockdown: In themonth of June 2021, Indian markets rose with Sensex and Nifty gaining 1% for the month. Thebroader market outperformed BSE Mid-cap and BSE Small-cap indices, gaining 3.6% and 6.9%respectively. Markets were buoyed by pick up in vaccination drive, ease of lockdown, reliefmeasure announced by the government to support the economy (Rs1.1 tn worth of loanguarantee scheme for Covid affected sectors and ECLGS scheme of Rs4.5 tn) and theaccommodative stance by the MPC by keeping the repo rate unchanged. On the Macro EconomicFront, May CPI inflation rose to 6.3% against 4.23% in April. May WPI inflation rose to 12.9%compared to 10.5% in April owing to higher fuel and power inflation and manufactured productsinflation. April IIP registered an uptick of 134% compared to 24.1% in March. CAD in 4QFY21widened to US$8.2 bn against US$2.2 bn in 3QFY21. FPIs bought US$1.5 bn of Indian equitieswhile DIIs bought US$943 mn.
Global markets accelerated on back of vaccination campaigns: On global front, Equities roseas vaccination campaigns continued to accelerate in most developed economies, especially inEurope. Governments in most developed markets continued to ease Covid-related mobilityrestrictions and activity levels picked up. Economic data over the last three months has generallybeen very strong, especially in the US, which posted an annualised growth rate of 6.4% in the firstquarter. However, the reopening of economies and the quick rebound in activity has fuelledinflation in some countries. While the Federal Reserve continues to see this inflation increase astransitory, it has become slightly more hawkish. The Federal Open Market Committee (FOMC)also now expects two rate hikes sometime in 2023, up from no rate hikes just three months ago.Also, Crude prices surged higher to $75.13 per barrel after U.S. crude stockpiles fell for a sixthstraight week and an OPEC report foresaw an undersupplied market this year.
Corporate Earnings/Outlook and Concern of the Third wave to keep the market volatile: Onthe domestic front, the upcoming Corporate Earnings along with the Outlook of the companiesgoing ahead, rising inflation, the Delta plus variant of the novel coronavirus and fear of the Thirdwave impact would continue to weigh on investor sentiments. Considering the above factors, wewould approach the markets with a stock-specific view and stick to companies which have bettergrowth prospects and stronger balance sheets.
In light of the changing dynamics, we have realigned our portfolio to focus on PSU Banks, Metals,cement, capital goods, utilities and pharma. Going ahead, with the ever-changing dynamics wemay take calls on specific sectors/companies.
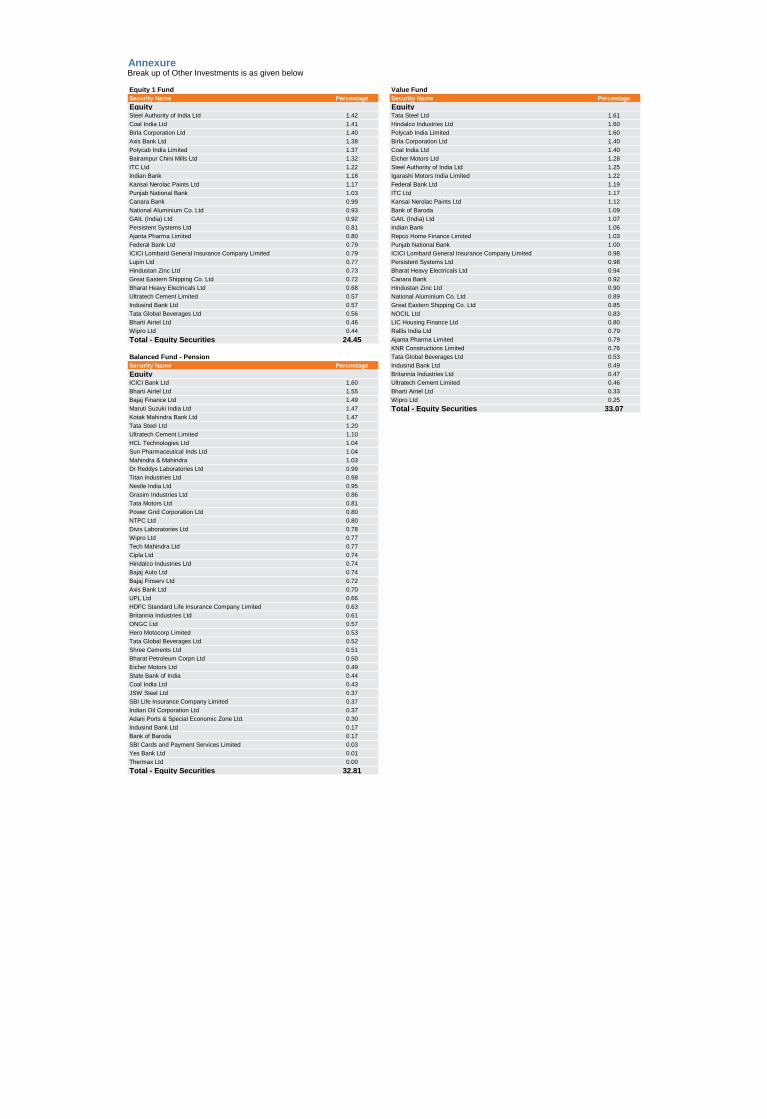
Equity 1 Fund Value Fund
Security Name Percentage Security Name Percentage
Equity EquitySteel Authority of India Ltd 1.42 Tata Steel Ltd 1.61
Coal India Ltd 1.41 Hindalco Industries Ltd 1.60
Birla Corporation Ltd 1.40 Polycab India Limited 1.60
Axis Bank Ltd 1.38 Birla Corporation Ltd 1.40
Polycab India Limited 1.37 Coal India Ltd 1.40
Balrampur Chini Mills Ltd 1.32 Eicher Motors Ltd 1.28
ITC Ltd 1.22 Steel Authority of India Ltd 1.25
Indian Bank 1.18 Igarashi Motors India Limited 1.22
Kansai Nerolac Paints Ltd 1.17 Federal Bank Ltd 1.19
Punjab National Bank 1.03 ITC Ltd 1.17
Canara Bank 0.99 Kansai Nerolac Paints Ltd 1.12
National Aluminium Co. Ltd 0.93 Bank of Baroda 1.09
GAIL (India) Ltd 0.92 GAIL (India) Ltd 1.07
Persistent Systems Ltd 0.81 Indian Bank 1.06
Ajanta Pharma Limited 0.80 Repco Home Finance Limited 1.03
Federal Bank Ltd 0.79 Punjab National Bank 1.00
ICICI Lombard General Insurance Company Limited 0.79 ICICI Lombard General Insurance Company Limited 0.98
Lupin Ltd 0.77 Persistent Systems Ltd 0.98
Hindustan Zinc Ltd 0.73 Bharat Heavy Electricals Ltd 0.94
Great Eastern Shipping Co. Ltd 0.72 Canara Bank 0.92
Bharat Heavy Electricals Ltd 0.68 Hindustan Zinc Ltd 0.90
Ultratech Cement Limited 0.57 National Aluminium Co. Ltd 0.89
Indusind Bank Ltd 0.57 Great Eastern Shipping Co. Ltd 0.85
Tata Global Beverages Ltd 0.56 NOCIL Ltd 0.83
Bharti Airtel Ltd 0.46 LIC Housing Finance Ltd 0.80
Wipro Ltd 0.44 Rallis India Ltd 0.79
Total - Equity Securities 24.45 Ajanta Pharma Limited 0.79
KNR Constructions Limited 0.76
Balanced Fund - Pension Tata Global Beverages Ltd 0.53
Security Name Percentage Indusind Bank Ltd 0.49
Equity Britannia Industries Ltd 0.47
ICICI Bank Ltd 1.60 Ultratech Cement Limited 0.46
Bharti Airtel Ltd 1.55 Bharti Airtel Ltd 0.33
Bajaj Finance Ltd 1.49 Wipro Ltd 0.25
Maruti Suzuki India Ltd 1.47 Total - Equity Securities 33.07Kotak Mahindra Bank Ltd 1.47
Tata Steel Ltd 1.20
Ultratech Cement Limited 1.10
HCL Technologies Ltd 1.04
Sun Pharmaceutical Inds Ltd 1.04
Mahindra & Mahindra 1.03
Dr Reddys Laboratories Ltd 0.99
Titan Industries Ltd 0.98
Nestle India Ltd 0.95
Grasim Industries Ltd 0.86
Tata Motors Ltd 0.81
Power Grid Corporation Ltd 0.80
NTPC Ltd 0.80
Divis Laboratories Ltd 0.78
Wipro Ltd 0.77
Tech Mahindra Ltd 0.77
Cipla Ltd 0.74
Hindalco Industries Ltd 0.74
Bajaj Auto Ltd 0.74
Bajaj Finserv Ltd 0.72
Axis Bank Ltd 0.70
UPL Ltd 0.66
HDFC Standard Life Insurance Company Limited 0.63
Britannia Industries Ltd 0.61
ONGC Ltd 0.57
Hero Motocorp Limited 0.53
Tata Global Beverages Ltd 0.52
Shree Cements Ltd 0.51
Bharat Petroleum Corpn Ltd 0.50
Eicher Motors Ltd 0.49
State Bank of India 0.44
Coal India Ltd 0.43
JSW Steel Ltd 0.37
SBI Life Insurance Company Limited 0.37
Indian Oil Corporation Ltd 0.37
Adani Ports & Special Economic Zone Ltd. 0.30
Indusind Bank Ltd 0.17
Bank of Baroda 0.17
SBI Cards and Payment Services Limited 0.03
Yes Bank Ltd 0.01
Thermax Ltd 0.00
Total - Equity Securities 32.81
AnnexureBreak up of Other Investments is as given below
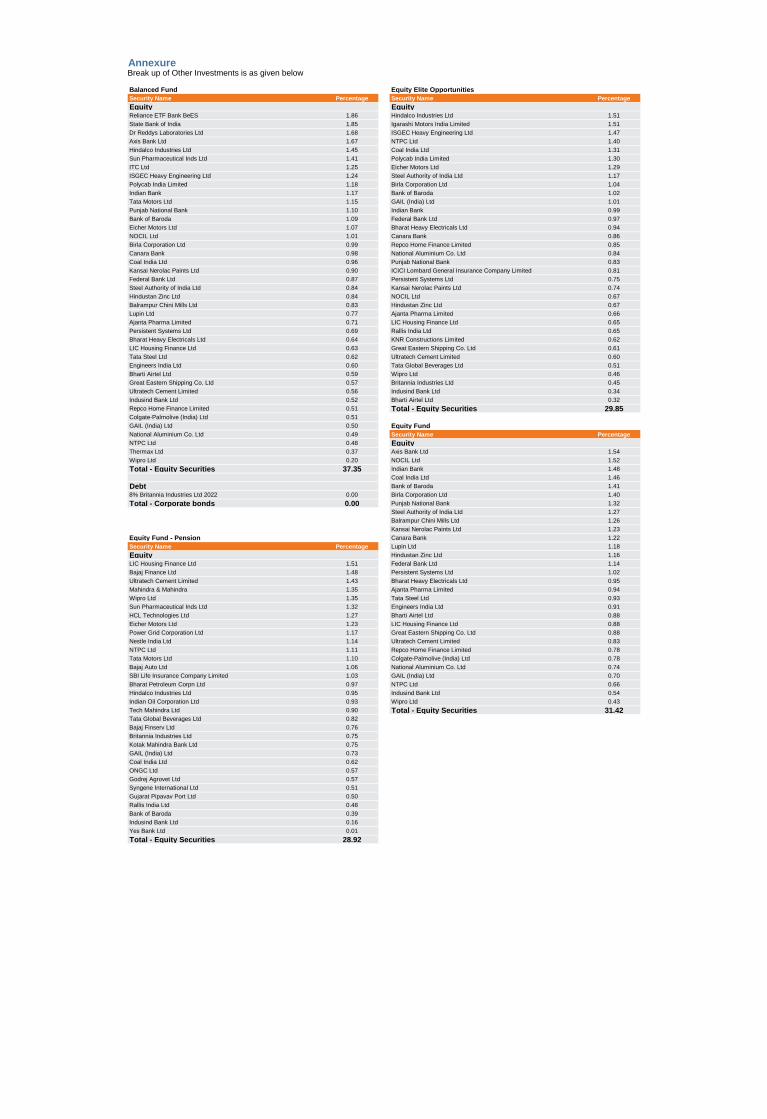
Balanced Fund Equity Elite Opportunities
Security Name Percentage Security Name Percentage
Equity EquityReliance ETF Bank BeES 1.86 Hindalco Industries Ltd 1.51
State Bank of India 1.85 Igarashi Motors India Limited 1.51
Dr Reddys Laboratories Ltd 1.68 ISGEC Heavy Engineering Ltd 1.47
Axis Bank Ltd 1.67 NTPC Ltd 1.40
Hindalco Industries Ltd 1.45 Coal India Ltd 1.31
Sun Pharmaceutical Inds Ltd 1.41 Polycab India Limited 1.30
ITC Ltd 1.25 Eicher Motors Ltd 1.29
ISGEC Heavy Engineering Ltd 1.24 Steel Authority of India Ltd 1.17
Polycab India Limited 1.18 Birla Corporation Ltd 1.04
Indian Bank 1.17 Bank of Baroda 1.02
Tata Motors Ltd 1.15 GAIL (India) Ltd 1.01
Punjab National Bank 1.10 Indian Bank 0.99
Bank of Baroda 1.09 Federal Bank Ltd 0.97
Eicher Motors Ltd 1.07 Bharat Heavy Electricals Ltd 0.94
NOCIL Ltd 1.01 Canara Bank 0.86
Birla Corporation Ltd 0.99 Repco Home Finance Limited 0.85
Canara Bank 0.98 National Aluminium Co. Ltd 0.84
Coal India Ltd 0.96 Punjab National Bank 0.83
Kansai Nerolac Paints Ltd 0.90 ICICI Lombard General Insurance Company Limited 0.81
Federal Bank Ltd 0.87 Persistent Systems Ltd 0.75
Steel Authority of India Ltd 0.84 Kansai Nerolac Paints Ltd 0.74
Hindustan Zinc Ltd 0.84 NOCIL Ltd 0.67
Balrampur Chini Mills Ltd 0.83 Hindustan Zinc Ltd 0.67
Lupin Ltd 0.77 Ajanta Pharma Limited 0.66
Ajanta Pharma Limited 0.71 LIC Housing Finance Ltd 0.65
Persistent Systems Ltd 0.69 Rallis India Ltd 0.65
Bharat Heavy Electricals Ltd 0.64 KNR Constructions Limited 0.62
LIC Housing Finance Ltd 0.63 Great Eastern Shipping Co. Ltd 0.61
Tata Steel Ltd 0.62 Ultratech Cement Limited 0.60
Engineers India Ltd 0.60 Tata Global Beverages Ltd 0.51
Bharti Airtel Ltd 0.59 Wipro Ltd 0.46
Great Eastern Shipping Co. Ltd 0.57 Britannia Industries Ltd 0.45
Ultratech Cement Limited 0.56 Indusind Bank Ltd 0.34
Indusind Bank Ltd 0.52 Bharti Airtel Ltd 0.32
Repco Home Finance Limited 0.51 Total - Equity Securities 29.85Colgate-Palmolive (India) Ltd 0.51
GAIL (India) Ltd 0.50 Equity Fund
National Aluminium Co. Ltd 0.49 Security Name Percentage
NTPC Ltd 0.48 EquityThermax Ltd 0.37 Axis Bank Ltd 1.54
Wipro Ltd 0.20 NOCIL Ltd 1.52
Total - Equity Securities 37.35 Indian Bank 1.48
Coal India Ltd 1.46
Debt Bank of Baroda 1.41
8% Britannia Industries Ltd 2022 0.00 Birla Corporation Ltd 1.40
Total - Corporate bonds 0.00 Punjab National Bank 1.32
Steel Authority of India Ltd 1.27
Balrampur Chini Mills Ltd 1.26
Kansai Nerolac Paints Ltd 1.23
Equity Fund - Pension Canara Bank 1.22
Security Name Percentage Lupin Ltd 1.18
Equity Hindustan Zinc Ltd 1.16
LIC Housing Finance Ltd 1.51 Federal Bank Ltd 1.14
Bajaj Finance Ltd 1.48 Persistent Systems Ltd 1.02
Ultratech Cement Limited 1.43 Bharat Heavy Electricals Ltd 0.95
Mahindra & Mahindra 1.35 Ajanta Pharma Limited 0.94
Wipro Ltd 1.35 Tata Steel Ltd 0.93
Sun Pharmaceutical Inds Ltd 1.32 Engineers India Ltd 0.91
HCL Technologies Ltd 1.27 Bharti Airtel Ltd 0.88
Eicher Motors Ltd 1.23 LIC Housing Finance Ltd 0.88
Power Grid Corporation Ltd 1.17 Great Eastern Shipping Co. Ltd 0.88
Nestle India Ltd 1.14 Ultratech Cement Limited 0.83
NTPC Ltd 1.11 Repco Home Finance Limited 0.78
Tata Motors Ltd 1.10 Colgate-Palmolive (India) Ltd 0.78
Bajaj Auto Ltd 1.06 National Aluminium Co. Ltd 0.74
SBI Life Insurance Company Limited 1.03 GAIL (India) Ltd 0.70
Bharat Petroleum Corpn Ltd 0.97 NTPC Ltd 0.66
Hindalco Industries Ltd 0.95 Indusind Bank Ltd 0.54
Indian Oil Corporation Ltd 0.93 Wipro Ltd 0.43
Tech Mahindra Ltd 0.90 Total - Equity Securities 31.42Tata Global Beverages Ltd 0.82
Bajaj Finserv Ltd 0.76
Britannia Industries Ltd 0.75
Kotak Mahindra Bank Ltd 0.75
GAIL (India) Ltd 0.73
Coal India Ltd 0.62
ONGC Ltd 0.57
Godrej Agrovet Ltd 0.57
Syngene International Ltd 0.51
Gujarat Pipavav Port Ltd 0.50
Rallis India Ltd 0.48
Bank of Baroda 0.39
Indusind Bank Ltd 0.16
Yes Bank Ltd 0.01
Total - Equity Securities 28.92
AnnexureBreak up of Other Investments is as given below
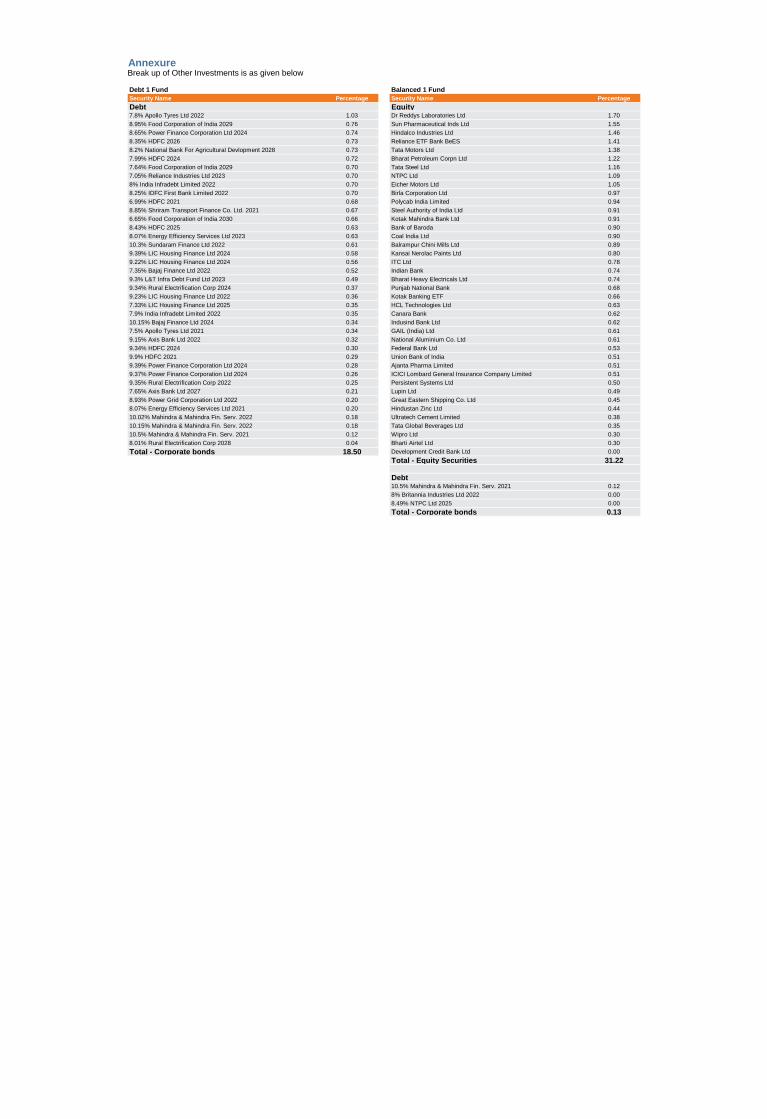
Debt 1 Fund Balanced 1 Fund
Security Name Percentage Security Name Percentage
Debt Equity7.8% Apollo Tyres Ltd 2022 1.03 Dr Reddys Laboratories Ltd 1.70
8.95% Food Corporation of India 2029 0.76 Sun Pharmaceutical Inds Ltd 1.55
8.65% Power Finance Corporation Ltd 2024 0.74 Hindalco Industries Ltd 1.46
8.35% HDFC 2026 0.73 Reliance ETF Bank BeES 1.41
8.2% National Bank For Agricultural Devlopment 2028 0.73 Tata Motors Ltd 1.38
7.99% HDFC 2024 0.72 Bharat Petroleum Corpn Ltd 1.22
7.64% Food Corporation of India 2029 0.70 Tata Steel Ltd 1.16
7.05% Reliance Industries Ltd 2023 0.70 NTPC Ltd 1.09
8% India Infradebt Limited 2022 0.70 Eicher Motors Ltd 1.05
8.25% IDFC First Bank Limited 2022 0.70 Birla Corporation Ltd 0.97
6.99% HDFC 2021 0.68 Polycab India Limited 0.94
8.85% Shriram Transport Finance Co. Ltd. 2021 0.67 Steel Authority of India Ltd 0.91
6.65% Food Corporation of India 2030 0.66 Kotak Mahindra Bank Ltd 0.91
8.43% HDFC 2025 0.63 Bank of Baroda 0.90
8.07% Energy Efficiency Services Ltd 2023 0.63 Coal India Ltd 0.90
10.3% Sundaram Finance Ltd 2022 0.61 Balrampur Chini Mills Ltd 0.89
9.39% LIC Housing Finance Ltd 2024 0.58 Kansai Nerolac Paints Ltd 0.80
9.22% LIC Housing Finance Ltd 2024 0.56 ITC Ltd 0.78
7.35% Bajaj Finance Ltd 2022 0.52 Indian Bank 0.74
9.3% L&T Infra Debt Fund Ltd 2023 0.49 Bharat Heavy Electricals Ltd 0.74
9.34% Rural Electrification Corp 2024 0.37 Punjab National Bank 0.68
9.23% LIC Housing Finance Ltd 2022 0.36 Kotak Banking ETF 0.66
7.33% LIC Housing Finance Ltd 2025 0.35 HCL Technologies Ltd 0.63
7.9% India Infradebt Limited 2022 0.35 Canara Bank 0.62
10.15% Bajaj Finance Ltd 2024 0.34 Indusind Bank Ltd 0.62
7.5% Apollo Tyres Ltd 2021 0.34 GAIL (India) Ltd 0.61
9.15% Axis Bank Ltd 2022 0.32 National Aluminium Co. Ltd 0.61
9.34% HDFC 2024 0.30 Federal Bank Ltd 0.53
9.9% HDFC 2021 0.29 Union Bank of India 0.51
9.39% Power Finance Corporation Ltd 2024 0.28 Ajanta Pharma Limited 0.51
9.37% Power Finance Corporation Ltd 2024 0.26 ICICI Lombard General Insurance Company Limited 0.51
9.35% Rural Electrification Corp 2022 0.25 Persistent Systems Ltd 0.50
7.65% Axis Bank Ltd 2027 0.21 Lupin Ltd 0.49
8.93% Power Grid Corporation Ltd 2022 0.20 Great Eastern Shipping Co. Ltd 0.45
8.07% Energy Efficiency Services Ltd 2021 0.20 Hindustan Zinc Ltd 0.44
10.02% Mahindra & Mahindra Fin. Serv. 2022 0.18 Ultratech Cement Limited 0.38
10.15% Mahindra & Mahindra Fin. Serv. 2022 0.18 Tata Global Beverages Ltd 0.35
10.5% Mahindra & Mahindra Fin. Serv. 2021 0.12 Wipro Ltd 0.30
8.01% Rural Electrification Corp 2028 0.04 Bharti Airtel Ltd 0.30
Total - Corporate bonds 18.50 Development Credit Bank Ltd 0.00
Total - Equity Securities 31.22
Debt10.5% Mahindra & Mahindra Fin. Serv. 2021 0.12
8% Britannia Industries Ltd 2022 0.00
8.49% NTPC Ltd 2025 0.00
Total - Corporate bonds 0.13
Annexure Break up of Other Investments is as given below
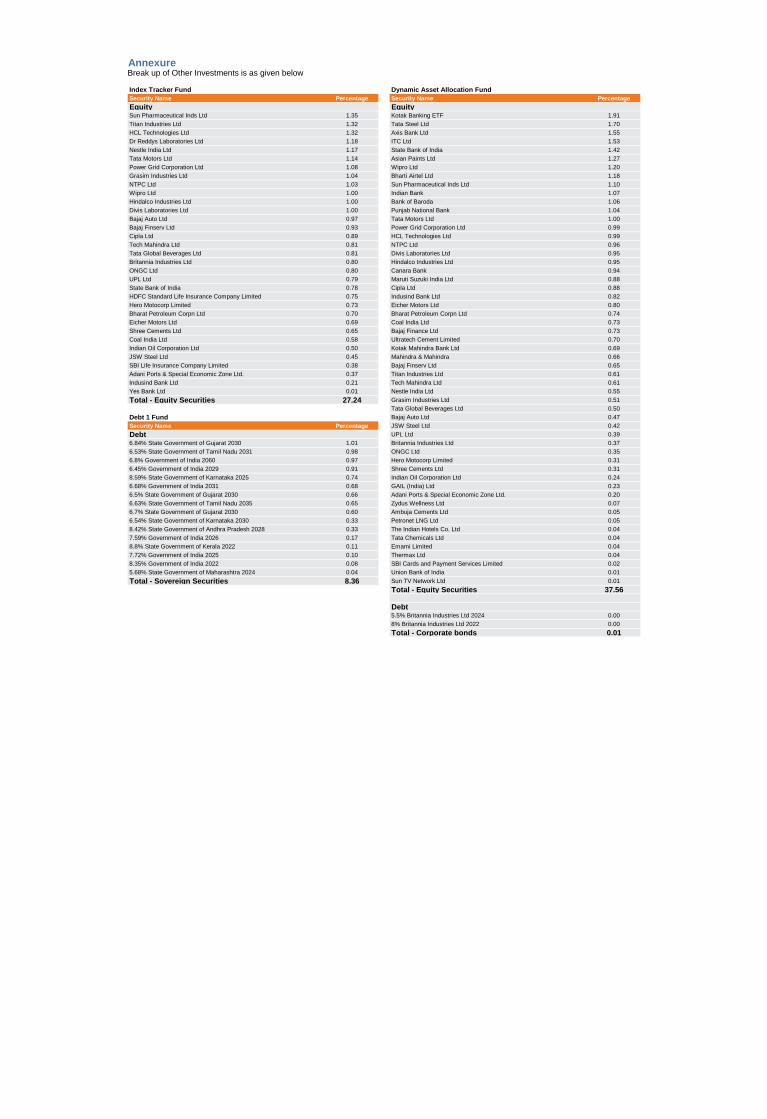
Index Tracker Fund Dynamic Asset Allocation Fund
Security Name Percentage Security Name Percentage
Equity EquitySun Pharmaceutical Inds Ltd 1.35 Kotak Banking ETF 1.91
Titan Industries Ltd 1.32 Tata Steel Ltd 1.70
HCL Technologies Ltd 1.32 Axis Bank Ltd 1.55
Dr Reddys Laboratories Ltd 1.18 ITC Ltd 1.53
Nestle India Ltd 1.17 State Bank of India 1.42
Tata Motors Ltd 1.14 Asian Paints Ltd 1.27
Power Grid Corporation Ltd 1.08 Wipro Ltd 1.20
Grasim Industries Ltd 1.04 Bharti Airtel Ltd 1.18
NTPC Ltd 1.03 Sun Pharmaceutical Inds Ltd 1.10
Wipro Ltd 1.00 Indian Bank 1.07
Hindalco Industries Ltd 1.00 Bank of Baroda 1.06
Divis Laboratories Ltd 1.00 Punjab National Bank 1.04
Bajaj Auto Ltd 0.97 Tata Motors Ltd 1.00
Bajaj Finserv Ltd 0.93 Power Grid Corporation Ltd 0.99
Cipla Ltd 0.89 HCL Technologies Ltd 0.99
Tech Mahindra Ltd 0.81 NTPC Ltd 0.96
Tata Global Beverages Ltd 0.81 Divis Laboratories Ltd 0.95
Britannia Industries Ltd 0.80 Hindalco Industries Ltd 0.95
ONGC Ltd 0.80 Canara Bank 0.94
UPL Ltd 0.79 Maruti Suzuki India Ltd 0.88
State Bank of India 0.78 Cipla Ltd 0.88
HDFC Standard Life Insurance Company Limited 0.75 Indusind Bank Ltd 0.82
Hero Motocorp Limited 0.73 Eicher Motors Ltd 0.80
Bharat Petroleum Corpn Ltd 0.70 Bharat Petroleum Corpn Ltd 0.74
Eicher Motors Ltd 0.69 Coal India Ltd 0.73
Shree Cements Ltd 0.65 Bajaj Finance Ltd 0.73
Coal India Ltd 0.58 Ultratech Cement Limited 0.70
Indian Oil Corporation Ltd 0.50 Kotak Mahindra Bank Ltd 0.69
JSW Steel Ltd 0.45 Mahindra & Mahindra 0.66
SBI Life Insurance Company Limited 0.38 Bajaj Finserv Ltd 0.65
Adani Ports & Special Economic Zone Ltd. 0.37 Titan Industries Ltd 0.61
Indusind Bank Ltd 0.21 Tech Mahindra Ltd 0.61
Yes Bank Ltd 0.01 Nestle India Ltd 0.55
Total - Equity Securities 27.24 Grasim Industries Ltd 0.51
Tata Global Beverages Ltd 0.50
Debt 1 Fund Bajaj Auto Ltd 0.47
Security Name Percentage JSW Steel Ltd 0.42
Debt UPL Ltd 0.39
6.84% State Government of Gujarat 2030 1.01 Britannia Industries Ltd 0.37
6.53% State Government of Tamil Nadu 2031 0.98 ONGC Ltd 0.35
6.8% Government of India 2060 0.97 Hero Motocorp Limited 0.31
6.45% Government of India 2029 0.91 Shree Cements Ltd 0.31
8.59% State Government of Karnataka 2025 0.74 Indian Oil Corporation Ltd 0.24
6.68% Government of India 2031 0.68 GAIL (India) Ltd 0.23
6.5% State Government of Gujarat 2030 0.66 Adani Ports & Special Economic Zone Ltd. 0.20
6.63% State Government of Tamil Nadu 2035 0.65 Zydus Wellness Ltd 0.07
6.7% State Government of Gujarat 2030 0.60 Ambuja Cements Ltd 0.05
6.54% State Government of Karnataka 2030 0.33 Petronet LNG Ltd 0.05
8.42% State Government of Andhra Pradesh 2028 0.33 The Indian Hotels Co. Ltd 0.04
7.59% Government of India 2026 0.17 Tata Chemicals Ltd 0.04
8.8% State Government of Kerala 2022 0.11 Emami Limited 0.04
7.72% Government of India 2025 0.10 Thermax Ltd 0.04
8.35% Government of India 2022 0.08 SBI Cards and Payment Services Limited 0.02
5.68% State Government of Maharashtra 2024 0.04 Union Bank of India 0.01
Total - Sovereign Securities 8.36 Sun TV Network Ltd 0.01
Total - Equity Securities 37.56
Debt5.5% Britannia Industries Ltd 2024 0.00
8% Britannia Industries Ltd 2022 0.00
Total - Corporate bonds 0.01
AnnexureBreak up of Other Investments is as given below

Toll Free No. 1800 209 8700SMS <FIRST> to 5667735, SMS charges apply.Website: www.indiafirstlife.com
Disclaimer: Past performance may or may not be sustained in future and is not a guarantee of future performance. Some of the contents of this document may contain statements / estimates / expectations / predictions, which may be 'forward looking'. The actual outcomes could differ materially from those expressed /implied in this document. These statements, do not intend to provide personal recommendation to any specific individual or any investment needs of an individual. The recommendations / statements / estimates / expectations / predictions are of general in nature and may not take into account the specific investment needs or risk appetite or financial situations of individual clients. Therefore, before acting on any advice or recommendations contained in this document, readers, in their own interest, should consider seeking advice from any authorized and professional investment advisors or financial consultants.’