advances in the tau performance system
TRANSCRIPT

ADVANCES IN THE TAU PERFORMANCE SYSTEM
Allen D. Malony, Sameer Shende, Robert Bell, Kai Li, Li Li, Nick TrebonUniversity of Oregon
{malony,sameer,bertie,likai,lili,ntrebon}@cs.uoregon.edu
Abstract To address the increasing complexity in parallel and distributed systems andsoftware, advances in performance technology towards more robust tools andbroader, more portable implementations are needed. In doing so, new challengesfor performance instrumentation, measurement, analysis, and visualization ariseto address evolving requirements for how performance phenomena is observedand how performance data is used. This paper presents recent advances in the TAUperformance system in four areas where improvements in performance technol-ogy are important: instrumentation control, performance mapping, performanceinteraction and steering, and performance databases. In the area of instrumen-tation control, we are concerned with the removal of instrumentation in casesof high measurement overhead. Our approach applies rule-based analysis ofperformance data in an iterative instrumentation process. Work on performancemapping focuses on measuring performance with respect to dynamic calling pathswhen the static callgraph cannot be determined prior to execution. We describe anonline performance data access, analysis, and visualization system that will formthe basis of a large-scale performance interaction and steering system. Finally,we describe our approach to the management of performance data in a databaseframework that supports multi-experiment analysis.
Keywords: Performance, tools, parallel, distributed.

2
1. Introduction
There has long been a tension in the field of performance tools research be-tween the need to invent new techniques to deal with performance complexity ofnext-generation parallel and distributive systems, and the need to develop toolsthat are robust, both in their function and in their scope of application. Perhapsthis is just the nature of the field. Yet there are important issues concerningthe advancement of performance tools “research” and the successful demon-stration and use of performance “technology.” A cynical perspective mightargue against trying something new without first getting the existing technol-ogy to just work, and work reliably in real applications and environments. Theall too commonly heard mantras “performance tools don’t work” and “perfor-mance tools are too hard to use” might lead one to believe in this perspective,but research history does not necessarily justify such a strong cynical stance.There has been significant innovation in performance observation and analysistechniques in the last twenty year to address the new performance challengesparallel computing environments present [10]. Current attention is certainly be-ing paid to easing the burden of tool use through automated analysis [1]. Therehave also been important technology developments that add considerable valueto the performance tool repertoire, such as APIs for dynamic instrumentation[4] and hardware performance counters [3]. Why, then, is there an apparentdisconnect between research results and the “reality” of tool usage in parallelapplication environments?
From our perspective as performance tool researchers, we take, perhaps,a controversial stance among our peers and argue that tool engineering is animportant factor in this regard. The controversial part primarily concerns thenotion of “research” and the rewards (or lack thereof) in a research career fortool development. Our counter position is that innovation in performance toolsresearch is best advanced by “standing on the shoulders” of solid technologyfoundations. When that foundation does not exist, it must be developed. Whena technology does exist, it should be integrated, if possible, and not reinvented.Indeed, many tools do not work reliably and, as a consequence, are hard touse. Many tools are not portable across parallel systems or reusable with differ-ent programming paradigms, and, as a consequence, have limited application.These results cannot be considered as positive results for the performance toolresearch community, that is, if reliability, portability, and robustness, in gen-eral, is considered worthy of research. We believe that they are, particularly inparallel computing. Furthermore, we contend that the future advances in per-formance tools research with the most direct potential effect in real applicationwill be those that can best leverage and amplify existing robust performancetechnology.

Advances in the TAU Performance System 3
In this paper, we consider four research problems being investigated in theTAU parallel performance system [9, 17] and describe the performance toolsbeing developed to address them. These tools build on and leverage the capa-bilities in TAU (as well as the other technologies integrated in TAU) to providerobust, value-added solutions. While none of these solutions are necessarily“new,” in the sense of a new research finding, the technology being developedis novel and will directly provide new capabilities to TAU users. After a briefdescription of the TAU performance system, we look at the problem of instru-mentation control to reduce measurement overhead. Our work here builds onTAU’s rich instrumentation framework. The second problem of callpath pro-filing requires a solution that maps performance measurements to dynamicallyoccurring callpaths. Here, TAU’s performance mapping API is utilized. Pro-viding online performance analysis and visualization for large-scale parallelapplications is the third problem we consider. Finally, we describe our earlywork to develop a performance database framework that can support multi-experiment performance analysis.
2. TAU Performance System
For the past twelve years, the TAU project has conducted research on per-formance tools for parallel and distributed systems. The goal of this work hasmainly been the development of robust technology to meet evolving perfor-mance evaluation challenges of state-of-the-art parallel systems and applica-tions. In particular, we have focused on problems of performance tool porta-bility, extendability, and interoperation.
The TAU performance system [9, 17] is our integrated toolkit for performanceinstrumentation, measurement, analysis, and visualization of large-scale paral-lel applications. It targets a general computation model consisting of shared-memory computing nodes where contexts reside, each providing a virtual ad-dress space shared by multiple threads of execution. The model is generalenough to apply to many high-performance scalable parallel systems and pro-gramming paradigms. Because TAU enables performance information to becaptured at the node/context/thread levels, this information can be mapped tothe particular parallel software and system execution platform under consider-ation.
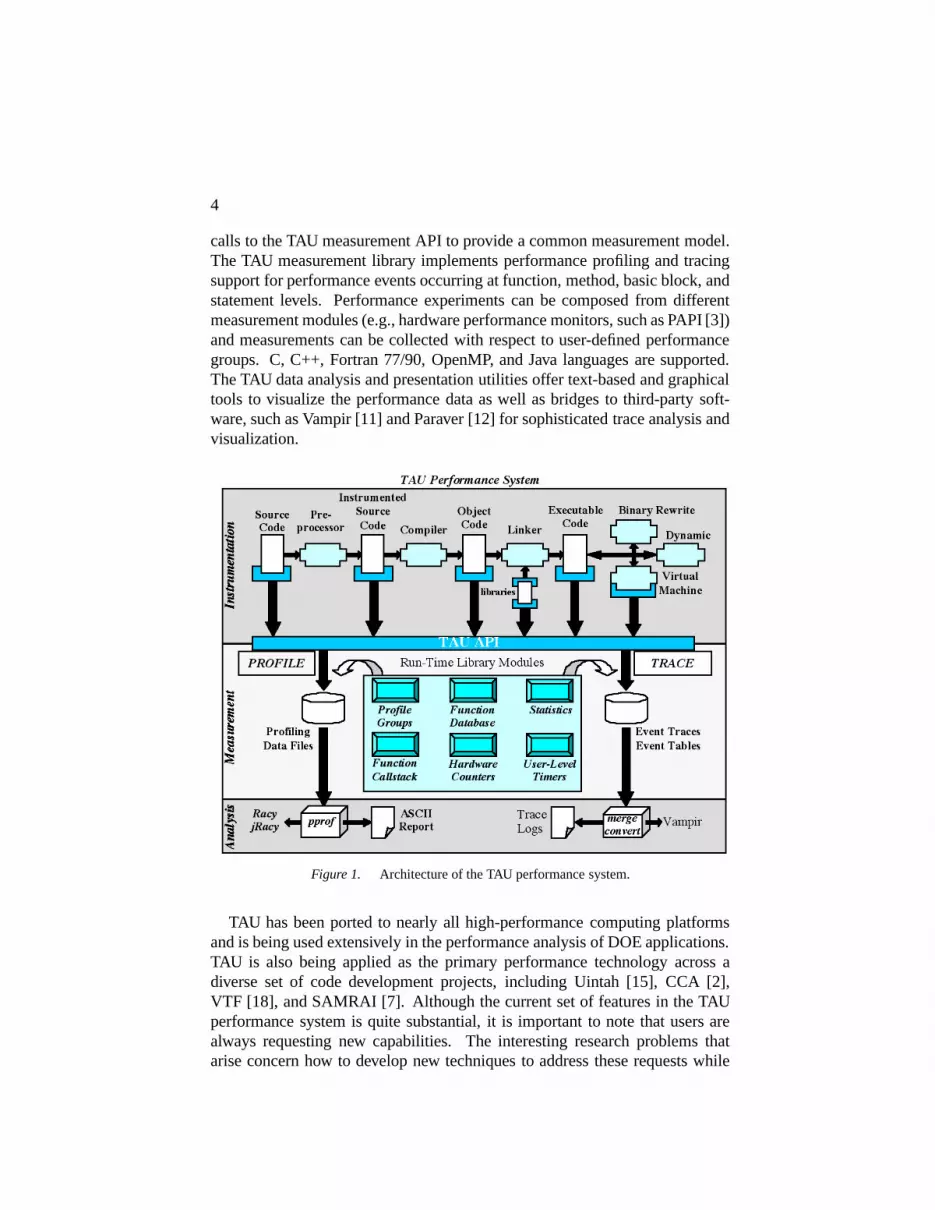
As shown in Figure 1, the TAU system supports a flexible instrumentationmodel that applies at different stages of program compilation and execution.The instrumentation targets multiple code points, provides for mapping of low-level execution events to higher-level performance abstractions, and works withmulti-threaded, message passing, and mixed-mode parallel computation mod-els. Different instrumentation techniques are supported, including dynamicinstrumentation using the DyninstAPI [4]. All instrumentation code makes
4
calls to the TAU measurement API to provide a common measurement model.The TAU measurement library implements performance profiling and tracingsupport for performance events occurring at function, method, basic block, andstatement levels. Performance experiments can be composed from differentmeasurement modules (e.g., hardware performance monitors, such as PAPI [3])and measurements can be collected with respect to user-defined performancegroups. C, C++, Fortran 77/90, OpenMP, and Java languages are supported.The TAU data analysis and presentation utilities offer text-based and graphicaltools to visualize the performance data as well as bridges to third-party soft-ware, such as Vampir [11] and Paraver [12] for sophisticated trace analysis andvisualization.
Figure 1. Architecture of the TAU performance system.
TAU has been ported to nearly all high-performance computing platformsand is being used extensively in the performance analysis of DOE applications.TAU is also being applied as the primary performance technology across adiverse set of code development projects, including Uintah [15], CCA [2],VTF [18], and SAMRAI [7]. Although the current set of features in the TAUperformance system is quite substantial, it is important to note that users arealways requesting new capabilities. The interesting research problems thatarise concern how to develop new techniques to address these requests while

Advances in the TAU Performance System 5
maintaining tight integration with the rest of the TAU system. The four problemsbelow are all representative of such endeavors.
3. Measurement Overhead and Instrumentation Control
The selection of what “events” to observe when measuring the performanceof a parallel application is an important consideration, as it is the basis for howperformance data will be interpreted. The performance events of interest de-pend mainly on what aspect of the execution the user wants to see, so as toconstruct a meaningful performance view from the measurements made. Typi-cal events include control flow events that identify points in the program that areexecuted, or operational events that occur when some operation or action hasbeen performed. Events may be atomic or paired to mark begin and end points,for example, to mark the entry and exit of a routine. Choice of performanceevents also depends on the scope and resolution of the performance measure-ment desired. However, the greater the degree of performance instrumentationin a program, the higher the likelihood that the performance measurements willalter the way the program behaves, an outcome termed performance perturba-tion.
Most performance tools, including TAU, address the problem of performanceperturbation indirectly using techniques to reduce the performance intrusion(i.e., overhead) associated with performance measurement. This overhead is aresult of two factors: 1) the execution time to make the measurement relativeto the “size” of the event, and 2) the frequency of event occurrence. The firstfactor concerns the influence of the measurement overhead on the observedperformance of a particular event. If the overhead is large relative to thesize of the event, the performance measurement is less likely to be accurateunless its overhead is compensated in some way. The overhead is typicallymeasured in execution time, but can also include the impact on other metrics,such as hardware counts. The second factor relates to overheads as seen fromthe perspective of the entire program. That is, the higher the frequency ofevents, the larger percentage of the execution will be taken up by performancemeasurement.
Techniques to control performance intrusion are directed towards makingperformance measurement more efficient or controlling the performance in-strumentation. The former is a product of engineering of the measurementsystem. That is, the lighter-weight the measurment system, the lower the over-head. Here, we are concerned with controlling performance instrumentation toremove or disable performance measurement for “small” events or events thatoccur with high frequency. Clearly this will eliminate the overhead otherwisegenerated, but how are these events determined before a measurment is made?It may be possible for sophisticated source code analysis to identify small code

6
segments, but this is not a complete solution since the execution time coulddepend on runtime parameters. Plus, we would like a solution to work acrosslanguages and few static analysis tools are available.
Instead, a direct measurement approach will likely be needed. The idea isthat a series of instrumentation experiments would be conducted to observethe measurement overhead, weeding out those events resulting in unacceptablelevels of intrusion. Whereas this performance data analysis and instrumentationcontrol can be done manually, it is tedious and error-prone, especially when thenumber of performance events is large. Thus, the problem we addressed washow to develop a tool to help automate the process in TAU.
The TAU performance system instruments an application code using an op-tional instrumentation control file that identifies events for inclusion and exclu-sion. The TAU instrumentor’s default behavior is to instrument every routineand method. Obviously, this instrumentation may result in high measurementoverhead, and the user can manually modify the file to eliminate small events, orthose that are not interesting to observe. As noted above, this is a cumbersomeprocess. Instead, the TAUreduce tool allows the user to write instrumentationrules that will be applied to the parallel measurement data to identify whichevents to exclude. The output of the tool is a new instrumentation control filewith those events de-selected for instrumentation, thereby reducing measure-ment overhead in the next program run.
Table 1 shows examples of the TAUreduce rule language. A simple rule isan arithmetic condition written as:
[EventName: | GroupName:] Field Operator Number
where Field is a TAU profile metric (e.g., numcalls, percent, usec, usec/call),Operator is one of <, >, or =, and Number is any number. A rule applies toall events unless specified explicitly, either by the EventName (e.g., routineA)or by the event GroupName (e.g., TAU USER). In the latter case, all eventsthat belong to the group are selected by the rule. A compound rule is a logicalconjunction of simple rules. Multiple rules, appearing on separate lines, areapplied disjunctively.
As a simple example of applying the instrumentation reduction analysis,consider two algorithms to find the kth largest element in a list of N unsortedelements. The first algorithm (kth largest qs) uses quicksort first to sort thelist and then selects the kth element. The second algorithm (select kth largest)scans the list keeping a sorted set of the k largest elements seen thus far. Atthe end of the scan, it selects the least of the set. We ran the program on alist of 1,000,000 elements with k=2324, first with minimal instrumentation todetermine the execution time of the two algorithms: kth largest qs (.188511

Advances in the TAU Performance System 7
Description RuleExclude all events that are members of the TAU USERgroup and use less than 100 microseconds
TAU USER : usec < 100
Exclude all events that have less than 100 microsecondsand are called only once
usec < 100 & numcalls = 1
Exclude all events that have less than 100 microseconds usecs/call < 100
per call or have a total inclusive percentage less than 5 percent < 5
Table 1. Examples of TAUreduce rule language.
secs), select kth largest (.149594 secs). Total execution time was .36 secs on a1.2 Ghz Pentium III machine.
Then the code was instrumented fully and run again. The profile resultsare shown in the top half of Figure 2. Clearly, there is significant performanceoverhead and the execution times are not accurate, even though TAU’s per eventmeasurement overhead is very low. We defined the rule
usec > 1000 & numcalls > 400000 & usecs/call < 30 & percent > 25
and applied TAUreduce, eliminating the events marked with “(*)”. Runningthe code again produced the results in the lower half of Figure 2. As seen, theexecution times are closer to what we expect.
NODE 0;CONTEXT 0;THREAD 0:---------------------------------------------------------------------------------------%Time Exclusive Inclusive #Call #Subrs Inclusive Name
msec msec usec/call---------------------------------------------------------------------------------------100.0 13 4,982 1 4 4982030 int main93.5 3,223 4,659 4.20241E+06 1.40268E+07 1 void quicksort (*)62.9 0.00481 3,134 5 5 626839 int kth_largest_qs36.4 137 1,813 28 450057 64769 int select_kth_largest33.6 150 1,675 449978 449978 4 void sort_5elements (*)28.8 1,435 1,435 1.02744E+07 0 0 void interchange (*)0.4 20 20 1 0 20668 void setup0.0 0.0118 0.0118 49 0 0 int ceil
NODE 0;CONTEXT 0;THREAD 0:---------------------------------------------------------------------------------------%Time Exclusive Inclusive #Call #Subrs Inclusive Name
msec total msec usec/call---------------------------------------------------------------------------------------100.0 14 383 1 4 383333 int main50.9 195 195 5 0 39017 int kth_largest_qs40.0 153 153 28 79 5478 int select_kth_largest5.4 20 20 1 0 20611 void setup0.0 0.02 0.02 49 0 0 int ceil
Figure 2. Example application of TAUreduce tool.

8
While the above example is rather simple, the TAUreduce tool can be appliedto large parallel applications. It is currently being used in Caltech’s ASAPASCI project to control instrumentation in the Virtual (Shock) Test Facility(VTF) [18]. TAUreduce is part of the TAU performance system distributionand, thus, is supported on all platforms where TAU is available. It is currentlybeing upgraded to include analysis support for multiple performance counters.
One important comment about this work is that it deals with a fundamentallypractical problem in parallel performance observation, that is, the tradeoff ofmeasurement detail and accuracy. By eliminating events from instrumentation,we lose the ability to see those events at all. If the execution of small routinesaccounts for a large portion of the execution time, that may be hard to discernwithout measurement. On the other hand, accurate measurement is confoundedby high relative overheads. We could attempt to track these overheads at run-time and subtract accummulated overhead when execution time measurementsare made. This is something we are pursuing in TAU to increase timing accu-racy, but it requires determining a minimum overhead value from measurementexperiments on each target platform. Another avenue is to change performanceinstrumentation on-the-fly as the result of identifying high overhead events. Weare also considering this approach in TAU.
4. Performance Mapping and Dynamic Callpath Profiling
To observe meaningful performance events requires placement of instrumen-tation in the program code. However, not all information needed to interpret anevent of interest is available prior to execution. A good example of this occursin callgraph profiling. Here the objective is to determine the distribution ofexecution time along the dynamic routine calling paths of an application. Acallpath of length k is a sequence of the last k − 1 routines called. To measureexecution time spent on a callpath requires identifying the begin and end pointsduring which a callpath is “active.” These points are just the entry and exit ofa called routine. If k = 1, callpath profiling is the measurement of amount oftime spent in a routine for each of its calling parents. The basic problem withcallpath profiling is that the identities of all k-length calling paths ending at aroutine may not, and generally are not, known until the application finishes itsexecution. How, then, do we identify the dynamic callpath events in order tomake profile measurements?
One approach is not to try to not identify the callpaths at runtime, and insteadinstrument just basic routine entry and exit events and record the events in atrace. Trace analysis can then easily calculate callpath profiles. The problem,of course, with this approach is that the trace generated may be excessivelylarge, particularly for large numbers of processors. Unfortunately, the instru-

Advances in the TAU Performance System 9
mentation and measurement problem is significantly harder if callpath profilesare calculated online.
If the whole source is available, it is possible to determine the entire staticcallgraph and enumerate all possible callpaths, encoding this information inthe program instrumentation. These callpaths are static, in the sense that theycould occur; dynamic callpaths are the subset of static callpaths that actually dooccur during execution. Once a callpath is encoded and stored in the program,the dynamic callpath can then be determined directly by indexing a table ofpossible next paths using the current routine id. Once the callpath is known, theperformance information can be easily recorded in pre-reserved static memory.This technique was used in the CATCH tool [5].
Unfortunately, this is not a robust solution for several reasons. First, source-based callpath analysis is non-trivial and may be only available for particularsource languages, if at all. Second, the application source code must be availableif a source-based technique is used. Third, static callpath analysis is possibleat the binary code level, but the routine calls must be explicit and not indirect.This complicates C++ callpath profiling, for instance.
To deliver a robust, general solution, we decided to pursue an approach wherethe callpath is calculated and queried at runtime. The TAU measurement systemalready maintains a callstack that is updated with each entry/exit performanceevent (e.g., routine entry and exit). Thus, to determine the k-length callpathwhen a routine is entered, all that is necessary is to traverse up the callstackto determine the last k − 1 events that define the callpath. If this is a newlyencountered callpath, a new measurement profile must be created at that timebecause it was not pre-allocated. The main problem is how to do all of thisefficiently.
Mapping callpath identity to its profile measurement is an example of whatwe call performance mapping. TAU implements a performance mapping APIbased on the Semantic Event Association and Attribute (SEAA) model [14].Here an association is built between the identity of a performance event (e.g., acallpath) and a performance measurement object (e.g., a profile) for that event.Thus, when the event is encountered, the measurement object linked to thatevent can be found, via a lookup in a mapping table, and the measurementmade.
In the case of callpath performance mapping, new callpaths occur dynami-cally, requiring new profile objects to be created at runtime. This can be doneefficiently using the TAU mapping API. The callpath name is then hashed toserve as the index for future reference. Because routine identifiers can be longstrings, TAU optimizes this process by computing the hash based on addressesof the profile objects of its k − 1 parents. While the extra overhead to performthis operation is fixed, the accumulated overhead will depend on the number

10
of unique k-length callpaths encountered in the computation, as each of thesewill need a separate profile object created.
We have implemented 2-level callpath profiling in TAU as part of the currentTAU performance system distribution. The important result is that this capabil-ity is available in all cases where TAU profiling is available. It is not restrictedby programming language, nor source code access required, as dynamic in-strumentation (via DyninstAPI [4]) can be used when source is not available.Also, all types of performance measurements are allowed, including measur-ing hardware counts for each callpath. Finally, in the future, we can benefitfrom the overhead reduction mechanisms to eliminate particular callpaths frommeasurement consideration.
Unfortunately, unlike a static approach, the measurement overhead of thisdynamic approach increases as k increases because we must walk the callstackto determine the callpath. We have discussed several methods to do this moreefficiently, but none lead to a fixed overhead for any k, and adopting a generalk solution for the 2-level case would result in greater cost. Most user requestswere for 2-level callpaths to determine routine performance distribution acrosscalling parents, and this is what has been implemented in TAU. It should benoted that there are no inherent limitations to implementing solutions withk > 2. Also, if it is possible to determine callpaths statically, TAU couldcertainly use that information to implement a fixed-cost solution.
5. Large-Scale Performance Monitoring and Steering
Parallel performance tools offer the program developer insights into the ex-ecution behavior of an application. However, most tools do not work well withlarge-scale parallel applications where the performance data generated comesfrom thousands of processes. Not only can the data be difficult to manage and theanalysis complex, but existing performance display tools are mostly restrictedto two dimensions and lack the customization and interaction to support full datainvestigation. In addition, it is increasingly important that performance toolsbe able to function online, making it possible to control and adapt long-runningapplications based on performance feedback. Again, large-scale parallelismcomplicates the online access and management of performance data. It may bedesirable to use existing computational steering systems for this purpose, butthis will require performance analysis and visualization to be integrated withthese tools.
As a result of our work with the University of Utah [16], we found ourselvesin a position to design and prototype a system architecture for coupling ad-vanced three-dimensional visualization with online performance data access,analysis, and visualization in a large-scale parallel environment. The archi-tecture, shown in Figure 3, consists of four components. The “performance

Advances in the TAU Performance System 11
data integrator” component is responsible for interfacing with a performancemonitoring system to merge parallel performance samples into a synchronousdata stream for analysis. The “performance data reader” component reads theexternal performance data into internal data structures of the analysis and visu-alization system. The “performance analyzer” component provides the analysisdeveloper a programmable framework for constructing analysis modules thatcan be linked together for different functionality. The “performance visualizer”component can also be programmed to create different displays modules.
Figure 3. Online performance analysis and visualization architecture.
Our prototype is based on the TAU performance system, the Uintah compu-tational framework [15], and the SCIRun [13] computational steering and vi-sualization system. Parallel profile data from a Uintah simulation are sampledand written to profile files during execution. The performance data integratorreads the performance profile files, generated for each profile sample for eachthread, and merges the files into a single, synchronized profile sample dataset.Each profile sample file is assigned a sequence number and the whole dataset issequenced and timestamped. A socket- based protocol is maintained with theperformance data reader to inform it of the availability of new profile samplesand to coordinate dataset transfer.
The performance profile reader, implemented as a SCIRun module, inputsthe merged profile sample dataset sent by the data integrator and stores thedataset in an internal C++ object structure. A profile sample dataset is orga-

12
nized in a tree-like manner according to TAU profile hierarchy:
node→ context → thread→ profile data
Each object in the profile tree has a set of attribute access methods and a set ofoffspring access methods.
Using the access methods on the profile tree object, all performance profiledata, including cross-sample data, is available for analysis. Utah’s SCIRun[13] provides a programmable system for building and linking the analysisand visualization components. A library of performance analysis modules canbe developed, some simple and others more sophisticated. We have imple-mented two generic profile analysis modules: Gen2DField and Gen3DField.The modules provide user control that allows them to be customized with re-spect to events, data values, number of samples, and filter options. Ultimately,the output of the analysis modules must be in a form that can be visualized.The Gen2DField and Gen3DField modules are so named because they produce2D and 3D Field data, respectively. SCIRun has different geometric meshesavailable for Fields. We use an ImageMesh for 2D fields and a PointCloudMeshfor 3D fields.
The role of the performance visualizer component is to read the Field objectsgenerated from performance analysis and show graphical representations ofperformance results. We have built three visualization modules to demonstratethe display of 2D and 3D data fields. The Terrain visualizer shows ImageMeshdata as a surface. The user can select the resolution of the X and Y dimensionsin the Terrain control panel. A TerrainDenotator module was developed tomark interesting points in the visualization. A different display of 2D fielddata is produced by the KiviatTube visualizer. Here a “tube” surface is createdwhere the distance of points from the tube center axis is determined by metricvalues and the tube length correlates with the sample. The visualization ofPointCloudMesh data is accomplished by the PointCloud visualizer module.
The SCIRun program graph in Figure 4 shows how the data reader, analyzer,and visualizer modules are connected to process parallel profile samples froma Uintah application. The visualization is for a 500 processor run and showsthe entire parallel profile measurement. The performance events are along theleft-right axis, the processors along the in-out axis, and the performance metric(in this case, the exclusive execution time) along the up-down axis. Denotatorsare used to identify the performance events in the legend with the largest metricvalues. This full performance view enables the user to quickly identify majorperformance contributors.
Although this work is in the early stages, it demonstrates the significant tooladvances possible through technology integration. As the Utah C-SAFE ASCIproject moves towards Uintah computations with adaptive-mesh refinement

Advances in the TAU Performance System 13
Figure 4. Performance profile visualization of 500 Uintah processes.
capabilities, we expect the relevance of online performance analysis to increasein importance. We are developing new performance visualization modulesand extending the performance profile data to accommodate hardware counterstatistics. Since SCIRun is being positioned as a computational steering systemfor Uintah, the implementation of the online performance tool in SCIRun wellpositions it for use as a customizable performance steering tool.
6. Peformance Database Framework
Empirical performance evaluation of parallel and distributed systems oftengenerates significant amounts of performance data and analysis results frommultiple experiments as performance is being investigated and problems diag-nosed. Yet, despite the broad utility of cross-experiment performance analysis,most current performance tools support performance analysis for only a singleapplication execution. We believe this is due primarily to a lack of tools forperformance data management. Hence, there is a strong motivation to developperformance database technology that can provide a common foundation forperformance data storage and access. Such technology could offer standardsolutions for how to represent the performance data, how to store them in amanageable way, how to interface with the database in a portable manner, andhow to provide performance information services to a broad set of analysistools and users. A performance database system built on this technology couldserve both as a core module in a performance measurement and analysis system,as well as a central repository of performance information contributed to andshared by several groups.

14
To address the performance data management problem, we designed thePerformance DataBase Framework (PerfDBF) architecture shown in Figure5. The PerfDBF architecture separates the framework into three components:performance data input, database storage, database query and analysis. Theperformance data is organized in a hierarchy of applications, experiments, andtrials. Application performance studies are seen as constituting a set of experi-ments, each representing a set of associated performance measurements. A trialis a measurement instance of an experiment. We designed a Performance DataMeta Language (PerfDML) and PerfDML translators to make it possible to con-vert raw performance data into the PerfDB internal storage. The PerformanceDataBase (PerfDB) is structured with respect to the application/experiment/trialhierarchy. An object-relational DBMS is specified to provide a standard SQLinterface for performance information query. A Performance DataBase Toolkit(PerfDBT) provides commonly used query and analysis utilities for interfacingperformance analysis tools.
Figure 5. TAU performance database framework
To evaluate the PerfDBF architecture, we developed a prototype for the TAUperformance system for parallel performance profiles. The prototype PerfDBFconverts the raw profiles to PerfDML form, which is realized using XML tech-nology. Database input tools read the PerfDML documents and store the per-formance profile information in the database. Analysis tools then utilize thePerfDB interface to perform intra-trial, inter-trial, and cross-experiment queryand analysis. To demonstrate the usefulness of the PerfDBF, we have devel-oped a scalability analysis tool. Given a set of experiment trials, representing
Advances in the TAU Performance System 15
execution of a program across varying numbers of processors, the tool can com-pute scalability statistics for every routine for every performance metric. Asan extension of this work, we are applying the PerfDBF prototype in a perfor-mance regression testing system to track performance changes during softwaredevelopment.
The main purpose of the PerfDBF work is to fill a gap in parallel performancetechnology that will make it possible for performance tools to interoperate.The PPerfDB [8] and Aksum [6] projects have demonstrated the benefit ofproviding such technology support and we have hopes to merge our efforts. Wealready see benefits within the TAU toolset. Our parallel performance profile,ParaProf, is able to read profiles that are stored in PerfDBF. In general, webelieve the key will be to find common representations of performance data anddatabase interfaces that can be adopted as the lingua franca among performanceinformation producers and consumers. Its implementation will be an importantenabling step forward in performance tool research.
7. Conclusions
The research work we presented in this paper reflects our view that advancesin performance technology will be a product of both innovative ideas and strongengineering. More importantly, as the performance complexity of parallel anddistributed systems increases, it will be important to develop performance toolson a robust technology foundation, leveraging existing capabilities to realizemore sophisticated functionality. We believe the tools described above demon-strate this result. Each is or will be implemented in a form that can be distributedwith the TAU performance system. While this may go beyond what is necessaryto “prove” a research result, it is in the application of a performance tool on realperformance problems where its merit will be truly determined.
References
[1] APART, IST Working Group on Automatic Performance Analysis: Real Tools. Seehttp://www.fz-juelich.de.
[2] R. Armstrong, et al., “Toward a Common Component Architecture for High-PerformanceScientific Computing,” High Performance Distributed Computing Conference, 1999. Seehttp://www.cca-forum.org.
[3] S. Browne, J. Dongarra, N. Garner, G. Ho, and P. Mucci, “A Portable ProgrammingInterface for Performance Evaluation on Modern Processors,” International Journal ofHigh Performance Computing Applications, 14(3), pp. 189–204, Fall 2000.
[4] B. Buck and J. Hollingsworth, “An API for Runtime Code Patching,” International Journalof High Performance Computing Applications, 14(4), pp. 317–329, Winter 2000.
[5] Luiz DeRose and Felix Wolf, “CATCH - A Call-Graph Based Automatic Tool for Captureof Hardware Performance Metrics for MPI and OpenMP Applications,” Euro-Par 2002,pp. 167–176.

16
[6] T. Fahringer and C. Seragiotto, “Experience with Aksum: A Semi-Automatic Multi-Experiment Performance Analysis Tool for Parallel and Distributed Applications,” Work-shop on Performance Analysis and Distributed Computing, 2002.
[7] R. Hornung and S. Kohn, “Managing Application Complexity in the SAMRAI Object-Oriented Framework, Concurrency and Computation: Practice and Experience, specialissue on Software Architectures for Scientific Applications, 2001.
[8] K. Karavanic, PPerfDB. See http://www.cs.pdx.edu/ karavan/research.htm.
[9] A. Malony and S. Shende, “Performance Technology for Complex Parallel and DistributedSystems,” in Distributed and Parallel Systems From Instruction Parallelism to ClusterComputing, G. Kotsis and P. Kacsuk (Eds.), Kluwer, pp. 37–46, 2000.
[10] A. Malony, “Tools for Parallel Computing: A Performance Evaluation Perspective,” inHandbook on Parallel and Distributed Processing, J. Blazewicz, K. Ecker, B. Plateau, anD. Trystram (Eds.), 2000, Springer-Verlag, pp. 342–363.
[11] W.Nagel, A.Arnold, M.Weber, H.Hoppe, and K.Solchenbach, “Vampir: Visualization andAnalysis of MPI Resources,” Supercomputing, 12(1):69–80, 1996.
[12] Paraver, European Center for Parallelism of Barcelona, Technical University of Catalonia.See http://www.cepba.upc.es/paraver/index.html.
[13] S. Parker, D. Weinstein, and C. Johnson, “The SCIRun Computational Steering SoftwareSystem,” in Modern Software Tools in Scientific Computing, E. Arge, A. Bruaset, and H.Langtangen (Eds.), Birkhauser Press, pp. 1–44, 1997.
[14] Sameer S. Shende, “The Role of Instrumentation and Mapping in Performance Measure-ment,” PhD Thesis, University of Oregon, 2001.
[15] J. St. Germain, J. McCorquodale, S. Parker, and C. Johnson, “Uintah: A Massively ParallelProblem Solving Environment,”High Performance Distributed Computing Conference,pp. 33–41, 2000.
[16] J. St. Germain, A. Morris, S. G. Parker, A. D. Malony, and S. Shende, “Integrating Perfor-mance Analysis in the Uintah Software Development Cycle,” International Symposiumon High Performance Computing, pp. 190–206, 2002.
[17] TAU (Tuning and Analysis Utilities). See http://www.acl.lanl.gov/tau.
[18] VTF, Virtual Test Shock Facility, Center for Simulation of Dynamic Response of Materials.See http://www.cacr.caltech.edu/ASAP.