advance in agriculture and biology using different statistical procedures for evaluating drought...
TRANSCRIPT

Adv. Agric. Biol.
4 (1), 2015: 19-30 © PSCI Publications
Advance in Agriculture and Biology www.pscipub.com/AAB
E-ISSN: 2310-9343 / P-ISSN: 2311-0163
DOI: 10.15192/PSCP.AAB.2015.4.1.1930
Using Different Statistical Procedures for Evaluating Drought
Tolerance Indices of Bread Wheat Genotypes
Ashraf A. Abd El-Mohsen, M. A. Abd El-Shafi, E. M. S. Gheith, H. S. Suleiman
Agronomy Department, Faculty of Agriculture, Cairo University
Corresponding author email: [email protected]
Paper Information A B S T R A C T
Received: 19 October, 2014
Accepted: 16 November, 2014
Published: 20 January, 2015
Citation
Ashraf A, El-Mohsen A, Abd El-Shafi MA, Gheith EMS,
Suleiman HS. 2015. Using Different Statistical Procedures
for Evaluating Drought Tolerance Indices of Bread Wheat
Genotypes. Advance in Agriculture and Biology, 4 (1), 19-
30. Retrieved from www.pscipub.com (DOI:
10.15192/PSCP.AAB.2015.4.1.1930)
In order to study the response of ten bread wheat genotypes to drought
stress, two field experiments were conducted in a split plot design with
randomized complete blocks (RCB) arrangement with three replications
under irrigated and water stress conditions during two successive wheat
growing seasons 2011/2012 and 2012/2013. The results of combined
analysis of variance for grain yield over years indicated significant
differences among main effects (years, water regimes and genotypes) and
their interactions (P< 0.01). Based on the results obtained, statistical
analysis revealed that grain yield significantly declined due to water deficit.
The estimates of stress tolerance attributes indicated that the identification
of drought-tolerant genotypes based on a single criterion was contradictory.
Result of correlation analysis between grain yield in both conditions and
calculated drought resistance indices revealed that stress tolerance index
(STI), mean productivity (MP), geometric mean productivity (GMP), yield
index (YI), harmonic mean (HM) and drought resistance index (DI) were
the best indices for identifying high yielding genotypes in both conditions
(drought tolerant genotypes). Therefore, these indices could be used
successfully as selection criteria for the screening of genotypes for
performance under various soil moisture levels. Screening drought tolerant
genotypes using mean rank, standard deviation of ranks and rank sum (RS)
distinguished genotypes, Cham 10, Sids 1, Cham 8 and Sahel 1 as the most
droughts tolerant. Cluster analysis showed that the genotypes, based on
indices tended to group into three groups: tolerant, semi-tolerant and
sensitive genotypes. Principal component analysis (PCA), indicated that
first and second components justified 99.87% of variations among drought
tolerance criteria. Biplot analysis showed significant positive correlation
between grain yield in the stress condition (Ys) with indicators STI, GMP,
MP, YI, and HM, accordingly they are discriminating drought tolerant
genotypes at the same manner. According to all different statistical
procedures: Among all genotypes, Bohouth 4, L-R 67 and Sids 1 were
identified as the genotype with high and stable yield in both conditions and
Sids 1, Sham 10, Sham 8 and Sahel 1 were identified as the most drought
tolerant to drought stress. Therefore, they are recommended to be used as
parents for improvement of drought tolerance in bread wheat in
hybridization programs.
© 2015 PSCI Publisher All rights reserved.
Key words: Bread wheat, drought tolerance indicators, biplot, ranking method, principal component analysis, cluster analysis.
Introduction Wheat (Triticum aestivum L.) is a major cereal crop in many parts of the world and it is commonly known as king
of cereals. It is the staple food for a large part of world population including Egypt. In 2011 wheat cultivated area in Egypt
was 1.28 million hectare which producing 8.4 million tones (FAO, 2013). Increasing wheat productivity is a national target
in Egypt to fill the gab between wheat consumption and production. Drought is one of the major environmental constraints
that severely limit wheat productivity. Global water shortage is very likely to become a serious problem by the year 2025,
especially in areas with high population density (Cosgrove and Rijsberman, 2000). One of the possible ways to ensure
future food needs of an increasing world population involves the better water use through the development of crop varieties
which need less water and are more tolerant to drought.
The main objectives of the wheat breeding programs are to increase yield potential, stability and adaptation, to
improve tolerance to abiotic stresses such as drought, heat, cold, salinity and pre-harvest sprouting and durable resistance to
diseases and pests, with medium to high flour quality for traditional flat bread baking (Saidi et al., 2000). Drought is a serious problem for agriculture that reduces the crop productivity. Therefore, the improvement of drought tolerance in crop
is a major objective of most crop breeding programs, particularly in arid and semi-arid areas of the world (Moustafa et

Adv. Agric. Biol. 4 (1), 2015: 19-30
20
al.,1996). Some estimates indicated that 50% of the approximately 230 Million hectares of under wheat cultivation
annually in the world is frequently affected by drought.
For successful breeding of bread wheat cultivars tolerant to drought through conventional approach, basic
information about the breeding material must be available to the breeders. Firstly, there must be significant variability in
genotypic responses to water stress and secondly, this variation must be genetically controlled. Thus, an understanding of
the knowledge of these two components about the breeding material under consideration is necessary (Mitra, 2001).
Various researchers have used different methods to evaluate genetic differences in drought tolerance. Drought resistance is
defined by Hall (1993) as the relative yield of a genotype compared to other genotypes subjected to the same drought
stress. Drought susceptibility of a genotype is often measured as a function of the reduction in yield under drought stress,
whilst the values are confounded with differential yield potential of genotypes (Ramirez and Kelly, 1998). To improve the
yield of wheat in different environments, there is need to identify selection criteria that can identify high-yielding genotypes in variable environments. To evaluate response of genotypes to drought stress, some selection indices based on
a mathematical relation between stress- and optimum conditions has been proposed. Several selection criteria have been
proposed to select genotypes based on their performance in stress and non–stress environments.
Stress tolerance index (STI) was defined as a useful tool for determining high yield and stress tolerance potential
of genotypes (Fernandez, 1992). Rosielle and Hamblin (1981) defined stress tolerance (TOL) as the differences in yield
between stress and irrigated environments and mean productivity (MP) as the average yield of genotypes under stress and
non-stress conditions. The geometric mean productivity (GMP) is often used by breeders interested in relative performance,
since drought stress can vary in severity in field environments over years (Fernandez, 1992). Fischer and Maurer (1978)
suggested the stress susceptibility index (SSI) for measurement of yield stability that apprehended the changes in both
potential and actual yields in variable environments. Clarke et al. (1992) used SSI to evaluate drought tolerance in wheat
genotypes and found year-to-year variation in SSI for genotypes and could rank their pattern. In spring wheat cultivars, Guttieri et al. (2001), using SSI, suggested that an SSI more than one indicated above-average susceptibility to drought
stress. The yield index (YI) suggested by Gavuzzi et al. (1997), yield stability index (YSI) suggested by Bouslamaand
Schapaugh (1984), yield reduction ratio (YR) suggested by Golestani-Araghi and Assad (1998) and harmonic mean (HM)
by Jafari et al. (2009) in order to evaluation the stability of genotypes in the both stress and non-stress conditions. Lan
(1988) defined new indices of drought resistance index (DI), which was commonly accepted to identify genotypes
producing high yield under both stress and non stress conditions.
Many statistical procedures have been used by plant breeders to evaluate the effectiveness of several drought
resistance indices for screening and identification of drought tolerant genotypes. For selection based on a combination of
indices, some researchers (Golabadi et al., 2006, Azizi-Chakherchaman et al., 2009, Majidi et al., 2011) have used principal
component analysis (PCA). PCA is one of the most successful techniques for reducing the multiple dimensions of the
observed variables to a smaller intrinsic dimensionality of independent variables (Johnson and Wichern, 2007). Ranking
methods and biplot analysis have been used for screening drought tolerant cultivars (Khalili et al., 2012), Farshadfar and Elyasi (2012) in wheat and Farshadfar et al. (2012) in bread wheat.
Keeping the importance of production of wheat crop in view, the present study was aimed to evaluate the
effectiveness of several drought resistance indices for screening and identification of drought tolerant wheat genotypes
using different statistical procedures.
Materials And Methods
Plant materials
Ten bread wheat genotypes were evaluated for water stress tolerance in the field. Names, pedigrees and origin of
these genotypes are presented in Table 1.
Table 1. Name, pedigree and origin of the studied wheat genotypes.
No. Name Pedigree Origin
G1 Sids 1 HD2172/Pavon ''S"// 1158.57/Maya 74 "S" - SD46 - 4SD – 1SD – oSD. Egypt
G2 Sahl 1 NS 732 / PIMA // VEERY "S" Egypt
G3 Cham 10 KAUZ//KAUZ/STAR CMBW90M4994-0T0PY-13M-015Y-4Y-0B-AP Syria
G4 Cham 8 JOPATICO-73/BLUE JAY//URES-81 CM67458 Syria
G5 Bohouth 8 KAUZ’S’/ABE ICW90-0510-0AP-0BR-5AP-0AP Syria
G6 Bohouth 6 CROW`S` CM 40457 Syria
G7 Bohouth 4 S-201 Syria
G8 L-R 40 KAUZ/STAR Sudan
G9 L-R 51 UP2338 Sudan
G10 L-R 67 14 YSN Yemen

Adv. Agric. Biol. 4 (1), 2015: 19-30
21
Experimental procedures
Two field evaluation experiments were carried out at the Agricultural Research and Experimental Station of the
Faculty of Agriculture, Cairo University, Giza, Egypt in two successive wheat growing seasons 2011/2012 and 2012/2013.
Each experiment included ten genotypes of bread wheat. Evaluation was carried out under two irrigation regimes, i.e., well-
watering (control treatment) where irrigation was applied every 21 days and water-stress (stress treatment) by giving only
two irrigations (sowing irrigation and the next one after 21 days) after which irrigation was stopped till the end of the
season.
A field experiment was conducted in a split plot design with randomized complete blocks (RCB) arrangement in 3
replications. Main plots were assigned to the two irrigation regimes and sub plots were assigned to the 10 genotypes. Each
sub-subplot consisted of 6 rows, 3 m long and 20 cm wide, (plot size = 3.6 m2). The harvested plot size was 2.4 m2 (4 rows
at the centre of each plot).The soil of the experimental site was clayey loam, containing 35% clay, 22% silt, 37% fine sand and 6% coarse sand with a pH of 7.8 (according to the analysis done by the Soil and Water Res. Inst., ARC, Egypt). All
other agricultural practices were followed according to the recommendations of ARC, Egypt. At harvest time, yield
potential (Yp) and stress yield (Ys) were measured. Grain yield (ton feddan-1), (feddan=4200 m2) was obtained by
converting the grain yield per plot to feddan.
Calculations, Statistical Analysis and Interpretation of Data
Keeping in view the objectives set out for the study, following statistical tools and methods have been deployed.
Analysis of variance
Collected data were subjected to the proper of statistical analysis of variance (ANOVA) of split plot design as
mentioned by Gomez and Gomez (1984) using MSTAT-C software package (Freed et al., 1989). Data were tested for violation of assumptions underlying the ANOVA. Data for the two years was tested for homogeneity using Bartlett's (1937)
test of homogeneity and it was found to be homogeneous so the data were combined for analysis. The combined ANOVA
was carried out according to Steel et al. (1997), to estimate the main effects of the different sources of variation and their
interactions. Duncan’s multiple range test (1955) was applied to detect statistical differences among irrigation and cultivar
treatment means, when the F-test for these treatments was significant at 5% probability level.
Table 2. Drought tolerance indices were calculated using the following equations:
Index name Outcome Formula Reference
Stress Tolerance Index (STI) The genotypes with high STI
values will be tolerant to drought
stress
STI=(YP×YS) /( Y P) 2
(Fernandez, 1992)
Mean Productivity (MP) The genotypes with high value of
this index will be more desirable
2
YYMP
ps
(Rosielle and Hamblin, 1981)
Geometric Mean Productivity
(GMP)
The genotypes with high value of
this index will be more desirable )()( sp YYGMP (Kristin et al., 1997)
Harmonic Mean (HM) The genotypes with high value of
this index will be more desirable
sp
sp
YY
YxYHM
)(2
(Jafari et al., 2009)
Tolerance index (TOL) The genotypes with low values of
this index are more stable in two
different conditions.
TOL = YP - YS (Rosielle and Hamblin, 1981)
Stress Susceptibility Index (SSI) The genotypes with SSI<1 are
more resistant to drought stress
conditions. )Y/Y(1
)Y/Y(1SSI
ps
ps
(Fisher and Maurer, 1978)
Yield Stability Index (YSI) The genotypes with high YSI
values can be regarded as stable
genotypes under stress and non-
stress conditions.
YSI = YS / YP (Bouslama and Schapaugh,1984)
Yield reduction ratio (YR) The genotypes with low value of
this index will be suitable for
drought stress condition
YR = 1- (YS/ YP)
(Golestani–Araghi and Assad,
1998)
Drought Resistance Index (DI) The genotypes with high value of
this index will be suitable for
drought stress condition pY
YpYsYsDI
)/(
(Lan, 1998)
Yield Index (YI) The genotypes with high value of
this index will be suitable for
drought stress condition
YI = YS / Y S (Gavuzzi et al., 1997)
Calculation of Drought Tolerance Indices Ten drought tolerance indices including stress tolerance index (STI), mean productivity (MP), geometric mean
productivity (GMP), harmonic mean (HM), tolerance index (TOL), stress susceptibility index (SSI), yield stability index

Adv. Agric. Biol. 4 (1), 2015: 19-30
22
(YSI), yield reduction ratio (YR), drought resistance index (DI) and yield index (YI) were calculated based on grain yield
under drought (Ys) and irrigated (Yp) conditions. Drought tolerance indices were calculated by using the equations cited in
(Table 2).
In the above formulas, Ys and Yp are the mean yield of genotypes under stress and non-stress conditions,
respectively. sY and pY are the mean yield of all genotypes under stress and non-stress conditions, respectively.
According to Fernandez (1992) theory, genotypes classified into four groups based on their performance in stress
and non-stress conditions, i,e. (1) genotypes producing high yield under both water stress and non-stress conditions (group
A), (2) genotypes with high yield under non-stress (group B), (3) stress conditions (group C) and (4) genotypes with poor
performance under both stress and non-stress conditions (group D).
Ranking Method
For screening drought tolerant genotypes a rank sum (RS) (Farshadfar and Elyasi, 2012) was calculated by the
following relationship:
Rank sum (RS) = Rank mean ( R ) + Standard deviation of rank (SDR). Standard deviation of ranks (SDR) was measured as:
SDR= 1
)(1
2
2
n
RR
S
m
i
iij
i
Where Rij is the rank of in vivo drought tolerance indicator and Ri. is the mean rank across all drought tolerance indicators
for the its genotype.
Correlation, cluster and principal component analysis
Correlation among indices and grain yield in two conditions was performed by SPSS Ver. 17. A principal
component analysis was performed using Statgraphics plus-win 2.1 software and PCs with Eigen-values greater than or
equal to 1.0 were selected, as proposed by Jeffers (1967). A biplot display of the first two components was used for
grouping genotypes under different stress conditions and illustrating the relationship between the genotypes and stress
tolerance indices. To identify the most desirable drought tolerance criteria, correlation coefficients between Ys (grain yield
under stress conditions), Yp (grain yield under non-stress conditions) and other quantitative indices of drought tolerance
were determined by the cosine of the angle between their vectors (Yan and Rajcan, 2002). In addition, cluster analysis was
also performed to assess the level of dissimilarity among the genotypes. A dendrogram was constructed based on squared
Euclidean distance.
Table 3. Combined analysis of variance for grain yield across two years (2011/2012 and 2012/2013) of 10 bread wheat genotypes under
water-stressed and non-stressed environments. SOV df Sum of squares Mean squares TSS%
Years (Y) 1 2.236 2.236** 6.65
R (Y) 4 0.031 0.008**
Irrigation regimes (I) 1 16.369 16.369** 48.74
Y×I 1 0.062 0.062**
Error a 4 0.002 0.0001
Genotypes (G) 9 13.775 1.531** 41.02
Y×G 9 0.268 0.030**
I×G 9 0.577 0.064**
Y×I×G 9 0.069 0.008**
Error b 72 0.192 0.003
Total 119 33.581
** Significant at 1% level of probability, TSS%–Percentage relative to total sum of squares.
Results presented in Table (4) show that the mean grain yield of genotypes under non-stress condition varied from
1.97 ton feddan-1 corresponding to L-R 40 to 3.29 ton/fed corresponding to Bohouth 4, by average of 2.56 ton feddan-1
while, mean grain yield of genotypes under stress condition ranged from 1.33 ton/fed corresponding to Bohouth 6 to 2.32
ton feddan-1 corresponding to Bohouth 4, by average of 1.82 ton feddan-1 (Table 4). Mean grain yield in stress conditions
was 29% lower than in irrigated conditions. Johari-Pireuvatlou (2010) reported that wheat yield decreased from 25 to 85%
under drought stress. The significant reduction in yield under water-stressed environment suggested the genetic variability for drought tolerance in the genotypes.
Results And Discussion
Combined ANOVA analysis and yield performance of genotypes
The results of the combined analysis of variance for grain yield under water-stressed and non-stressed
environments over two consecutive growing seasons 2011/2012 and 2012/2013 are presented in Table 3. Based on the

Adv. Agric. Biol. 4 (1), 2015: 19-30
23
results from analysis of variance for grin yield, the effects due to the irrigation regimes (I), year (Y), genotype (G), I×Y
interaction, I×G interaction and Y×G interaction were found to be highly significant (P< 0.01). The irrigation regimes (I)
effect was the most important source of yield variation, accounting for 48.74% of the total sums of squares (TSS) followed
by genotype effect and years which accounted for 41.02% and 6.65% of TSS, respectively (Table 3). There were highly
significant differences among genotypes in respect to grain yield (Table 3), which demonstrates high diversity among them
that enabled us to screen drought tolerant genotypes. Also, highly significant difference between grain yield in water-
stressed and non-stressed conditions indicates existence of genetic variation and possibility of selection for favorable
genotypes in both environments (Table 3). A similar trend of results was found by Mohammadi et al. (2011) and Yasir et
al. (2013).
Table 4. Mean comparison for grain yield of genotypes under normal irrigation and water stress conditions using Duncan's multiple range
test method.
Genotypes Grain yield (ton feddan
-1)
Normal irrigation Rank Water stress Rank Mean Rank
Sahel 1 2.50e 6 1.82
e 6 2.16
e 6
Cham 10 2.65d 4 1.94
d 4 2.30
d 4
Sids 1 2.84c 3 2.07
c 3 2.46
c 3
Bohouth 4 3.29a 1 2.32
a 1 2.80
a 1
L-R 40 1.97g 10 1.46
g 9 1.71
g 10
Cham 8 2.54e 5 1.84
e 5 2.19
e 5
L-R 67 3.03b 2 2.14
b 2 2.58
b 2
Bohouth 8 2.39f 7 1.54
g 8 1.96
f 8
L-R 51 2.26f 8 1.73
f 7 1.99
f 7
Bohouth 6 2.11g
9 1.33g 10 1.72
g 9
Mean 2.56 - 1.82 - 1.97 -
Means with different alphabets indicate significant difference between genotypes by Duncan’s multiple range test at p≤ 0.05.
Achieved results from mean comparisons of grain yield (Table 4) showed that the genotypes (Bohouth 4, L-R 67,
Sids 1 and Cham 10) with the highest yield productions under non-stress condition were also superior under stress
condition. Thus, indirect selection for a drought-prone environment based on the results of non-stress condition will be
efficient. The results in the same table revealed also that maximum grain yield (2.80 ton feddan-1) was found in Bohouth 4
and minimum (1.71 ton feddan-1) in L-R 40. The varietal differences were reported by other investigators including
Mohammadi et al. (2011), Yasir et al. (2013), Farshadfar et al. (2013) and Abd El-Mohsen and Abd El-Shafi (2014).
Screening drought tolerant genotypes and indices
Comparing genotypes based on the resistance/tolerance indices
To investigate suitable stress resistance indices for screening of genotypes under drought condition, grain yield of genotypes under both non-stress and stress conditions were measured for calculating different sensitivity and tolerance
indices (Table 5). A suitable index must have a significant correlation with grain yield under both conditions (Mitra, 2001).
Table 5. Mean grain yield (ton feddan-1) under normal and water stress conditions and measures of different screening methods for 10
bread wheat genotypes. Genotypes YP
YS
STI
TOL
MP
GMP
SSI
YI
YSI
YR
HM
DI
Sahel 1 2.50 1.82 0.69 0.68 2.16 2.13 0.94 1.00 0.73 0.27 2.10 0.73
Cham 10 2.65 1.94 0.79 0.71 2.30 2.27 0.93 1.07 0.73 0.27 2.24 0.78
Sids 1 2.84 2.07 0.90 0.76 2.46 2.43 0.93 1.14 0.73 0.27 2.40 0.83
Bohouth 4 3.29 2.32 1.16 0.97 2.80 2.76 1.02 1.27 0.70 0.30 2.72 0.90
L-R 40 1.97 1.46 0.44 0.52 1.71 1.69 0.90 0.80 0.74 0.26 1.67 0.59
Cham 8 2.54 1.84 0.71 0.71 2.19 2.16 0.96 1.01 0.72 0.28 2.13 0.73
L-R 67 3.03 2.14 0.99 0.89 2.58 2.54 1.02 1.17 0.71 0.29 2.50 0.83
Bohouth 8 2.39 1.54 0.56 0.84 1.96 1.92 1.22 0.85 0.65 0.35 1.87 0.55
L-R 51 2.26 1.73 0.60 0.52 1.99 1.98 0.80 0.95 0.77 0.23 1.96 0.73
Bohouth 6 2.11 1.33 0.43 0.79 1.72 1.67 1.29 0.73 0.63 0.37 1.63 0.46
Mean 2.56 1.82 0.73 0.74 2.19 2.15 1.00 1.00 0.71 0.29 2.12 0.71
YP = Yield under non-stress condition, YS = Yield under water stress condition, STI = Stress tolerance index, TOL = Tolerance index, MP = Mean productivity, GMP = Geometric Average productivity, SSI = Stress susceptibility index, YI = Yield index, YSI = Yield
stability index, YR = Yield reduction ratio, HM = Harmonic mean and DI = Drought resistance index.
Genotypes with high values of stress tolerance index (STI), geometric mean productivity (GMP) and mean
productivity (MP) can be selected as tolerant genotypes to water stress. According to STI, MP and GMP values, the four
genotypes namely Bohouth 4, L-R 67, Sids 1 and Cham 10 identified as drought tolerant genotypes. These genotypes had
greater values for STI, MP and GMP. While, genotypes such as Bohouth 6, L-R 40, Bohouth 8 and L-R 51 were identified
as susceptible genotypes, because of their low values for STI, MP and GMP.
Genotypes with low tolerance index (TOL) would be more tolerant to water stress. At the same time, stress susceptibility index (SSI) estimates the rate of change for each genotype in yield between the stress and non-stress
conditions relative to the mean change for all genotypes. Values of SSI lower than 1 denotes low drought susceptibility (or

Adv. Agric. Biol. 4 (1), 2015: 19-30
24
high yield stability) and values higher than 1 indicate high drought susceptibility (or poor yield stability). Clarke et al.
(1992) used stress susceptibility index (SSI) for evaluation of drought tolerance in wheat genotypes and found year-to-year
variation in SSI for genotypes and their ranking pattern. Guttieri et al. (2001) used SSI criterion and suggested that SSI
more than 1 indicated above-average susceptibility to drought stress.
Also, yield reduction ratio (YR) with low value would be more tolerant to water stress. Calculation of TOL, SSI
and YR showed that the highest stress tolerance (TOL) value and stress susceptibility index (SSI) value were related to the
three genotypes namely Bohouth 4, L-R 67, Bohouth 6 and Bohouth 8, indicating that these genotypes had higher grain
yield reduction under stress conditions and the highest drought sensitivity. Among all genotypes, L-R 40 and L-R 51 with
low SSI and TOL (Table 5) were identified as drought resistant genotypes and desirable for stress condition. It seems that
indices TOL and SSI had succeeded in selection of genotypes with high yield under drought stress, but had failed to select
genotypes with proper yield under both environments. The high values of (YI) characterize tolerant genotypes. So, genotypes such as Bohouth 4, L-R 67, Sids 1 and
Cham 10 were identified as drought tolerant genotypes. Finally, yield stability index (YSI), drought resistance index (DI)
and harmonic mean (HM) were also used in Table 5. The genotypes with high values of these parameters can be selected as
tolerant genotypes to water stress. In this study, genotypes such as Bohouth 4, L-R 67 and Sids 1 were identified as drought
tolerant genotypes. These genotypes had greater values for DI and HM. However, L-R51, L-R40 and Sids1 were identified
as drought tolerant genotypes for YSI.
Correlation analysis
To determine the most desirable drought tolerant criteria, the correlation coefficients between Yp, Ys, and other
quantitative indices of drought tolerance were calculated. In other words, correlation analysis between grain yield and
drought tolerance indices can be a good criterion for screening the best genotypes and indices used (Table 6). A suitable index must have a significant correlation with grain yield under both conditions (Mitra, 2001).
Table 6. Spearman's rank correlation coefficients of rank correlation between yields and drought tolerance/resistance indices over two
years. Index YP YS STI TOL MP GMP SSI
YI YSI
YR HM
YS 0 .98**
STI 0 .98**
1.00**
TOL -0.63* -0.49
ns -0.49
ns
MP 0.99**
0.99**
0.99**
-0.55 ns
GMP 0.98**
1.00**
1.00**
-0.49 ns
0.99**
SSI -0.18ns
0.02 ns
0.02 ns
0.80**
-0.08 ns
0.02 ns
YI 0 .98**
1.00**
1.00**
-0.49 ns
0.99**
1.00**
0.02 ns
YSI -0.21 ns
-0.02 ns
-0.02 ns
0 .84**
-0.12 ns
-0.02 0.99**
-0.02 ns
YR -0.21 ns
-0.02 ns
-0.02 ns
0.84**
-0.12 ns
-0.02 ns
0.99**
-0.02 ns
1 .00**
HM 0.98**
1 .00**
1.00**
-0.49 ns
0.99**
1.00**
0.02 ns
1.00**
-0.02 ns
-0.02 ns
DI 0.91**
0 .97**
0.97**
-0.36 ns
0 .95**
0.97**
0.19 ns
0 .97**
0.15 ns
0.15 ns
0.97**
ns, * and ** : Non-significant and significant at 5% , 1% probability levels , respectively. YP = Yield under non-stress condition, YS = Yield under water stress condition, STI = Stress tolerance index, TOL = Tolerance index, MP = Mean productivity, GMP = Geometric
Average productivity, SSI = Stress susceptibility index, YI = Yield index, YSI = Yield stability index, YR = Yield reduction ratio, HM = Harmonic mean and DI = Drought resistance index.
Spearman's rank correlation coefficients between the drought tolerance/resistance indices and mean yield under
stress and non-stress conditions are given in Table 6. Results from analysis of correlation revealed that grain yield under
water stress conditions had positive and highly significant correlation with grain yield under non-stress conditions (r =
0.98**). This result indicated that high grain yield performance under optimal conditions necessarily result in improved
yield under stress conditions.
From the correlation matrix, it is observed that significant positive correlation was found between grain yield in
the stress (Ys) and non-stress (Yp) conditions with stress tolerance index (STI), mean productivity (MP), geometric mean
productivity (GMP), yield index (YI), harmonic mean (HM) and drought resistance index (DI) indicating that these criteria discriminated drought tolerant genotypes with high grain yield under stress and non-stress environments (group A:
genotypes that express uniform superiority in both environmental conditions) (Fernandez 1992) (Table 6).
The results of this experiment demonstrated that the most appropriate index to select drought tolerant genotype is
an index which has a high correlation with grain yield under both non-stress and stress conditions. So, STI, MP, GMP, YI,
HM and DI were identified as appropriate indices to select drought tolerance genotypes. Toorchi et al. (2012) showed that
correlation between MP, GMP, Ys and Yp was positive. Dehghani et al. (2009) reported that GMP, MP and STI were
significantly and positively correlated with stress yield. Likewise, Khalili et al. (2012) reported that GMP, MP, and STI
were significantly and positively correlated with stress yield. Najaphy and Geravandi (2011) in bread wheat found that STI
and GMP were more suitable indices to select genotypes that perform well in both stress and non-stress conditions. Similar
results were reported by Zeynali-Khanghah et al. (2004), Sanjari- Pirevatlou (2008) and Karimizadeh et al. (2011).
By looking at the correlations between indices, no significant correlation was observed between (Ys) with
tolerance index (TOL), stress susceptibility index (SSI), yield stability index (YSI), and yield reduction ratio (YR), hence

Adv. Agric. Biol. 4 (1), 2015: 19-30
25
these indicators were not able to identify drought tolerant genotypes (group C). Significant correlations were not observed
between SSI, YSI and YR with yield in stress (Ys) and non-stress (Yp) conditions. Majidi et al. (2011) reported positive
and significant correlations between Yp with TOL, MP, GMP, STI, SSI and HM selection indices. They reported that
correlations between YS with GMP, STI, and HM showed that selection based on these indices may increase yield in stress
and non-stress conditions. Khalilzade and Karbalai-Khiavi (2002) and Farshadfar et al. (2001) illustrated that the most
appropriate indicators for selection of drought tolerant cultivars, are indices showing a relatively high correlation with grain
yield in both environmental conditions. In generally, the observed relations were consistent with those reported by
Fernandez (1992) in mungbean, Farshadfar and Sutka (2002) in maize, Golabadi et al. (2006) in durum wheat, Toorchi et
al. (2012) in canola and Farshadfar et al. (2014) in bread wheat.
Also, the correlation among STI, MP, GMP, YI, HM and DI were positive and highly significant. These results are
in agreement with those reported by Golabadi et al. (2006), Gholipouri et al. (2009) and Mohammadi et al. (2010). Grain yield under non-stress condition showed negative and significant association with TOL (r = -0.63*) and weak insignificant
negative associations with SSI, YSI and YR. No significant correlations were found between grain yield under stress
condition and SSI, TOL, YSI and YR indices.
Ranking method
The estimates of indicators of drought tolerance (Table 5) indicated that the identification of drought-tolerant
cultivars was contradictory based on a single criterion. Different indices introduced different genotypes as drought tolerant.
The following ranking method was used to have an overall judgment. To determine the most desirable drought tolerant
genotype according to all indices, mean rank, standard deviation of ranks and rank sum (RS) of all drought tolerance
criteria were calculated and based on these three criteria. The most desirable drought tolerant genotypes were identified in
Table 7.
Table 7. Rank, rank mean ( R ), standard deviation of ranks (SDR) and rank sum (RS) of drought resistance/tolerance indices.
Genotypes YP
YS
STI
TOL
MP
GMP
SSI
YI
YSI
YR HM DI R SDR RS
Sahel 1 6 6 6 3 6 6 5 6 4 4 6 6 5.33 1.07 6.40
Cham 10 4 4 4 4.5 4 4 3.5 4 4 4 4 4 4.00 0.21 4.21
Sids 1 3 3 3 6 3 3 3.5 3 4 4 3 2.5 3.42 0.92 4.34
Bohouth 4 1 1 1 10 1 1 7.5 1 8 8 1 1 3.46 3.67 7.13
L-R 40 10 9 9 1.5 10 9 2 9 2 2 9 8 6.71 3.60 10.31
Cham 8 5 5 5 4.5 5 5 6 5 6 6 5 6 5.29 0.54 5.83
L-R 67 2 2 2 9 2 2 7.5 2 7 7 2 2.5 3.92 2.78 6.70
Bohouth 8 7 8 8 8 8 8 9 8 9 9 8 9 8.25 0.62 8.87
L-R 51 8 7 7 1.5 7 7 1 7 1 1 7 6 5.04 2.92 7.96
Bohouth 6 9 10 10 7 9 10 10 10 10 10 10 10 9.58 0.90 10.48
YP = Yield under non-stress condition, YS = Yield under water stress condition, STI = Stress tolerance index, TOL = Tolerance index, MP = Mean productivity, GMP = Geometric Average productivity, SSI = Stress susceptibility index, YI = Yield index, YSI = Yield
stability index, YR = Yield reduction ratio, HM = Harmonic mean and DI = Drought resistance index.
In consideration to all indices, Cham 10 genotype, exhibited low standard deviation of rank, with least RS was the
most drought tolerant followed by the four genotypes namely Sids 1, Cham 8, Sahel 1 and L-R 67, while the genotypes
namely Bohouth 6, L-R 40 and Bohouth 8 were identified as the most drought sensitive (Table 7).
Therefore, these genotypes are recommended to be used as parents for genetic analysis and improvement of
drought tolerance in wheat. Ranking method has been used for screening drought tolerant cultivars by Khalili et al. (2012)
in canola, Farshadfar and Elyasi (2012) and Farshadfar et al. (2012) in bread wheat.
Cluster analysis In order to determine the variation among different genotypes and determination of the genotypes far or nearness,
the Cluster Analysis was applied to place the similar genotypes in one group. The cluster analysis based on squared
Euclidean distance was performed to classify the genotypes on the basis of drought tolerance indices. Using cluster analysis
with Unweighted Pair Group Method using Arithmetic means (UPGMA) and based on drought tolerance criteria, the result
of cluster analysis for studied genotypes has been presented in Fig. 1. As it is appear in Fig. 1, cluster analysis based on
drought tolerance indices and grain yield under stressed and non-stressed conditions classified the genotypes into three
groups with 4, 3 and 3 genotypes, respectively.
Cluster analysis showed that the genotypes, based on indices tended to group into three groups; tolerant, semi-
tolerant and sensitive genotypes (Fig.1). The 10 bread wheat genotypes based on grain yield and indices were classified in
three clusters, each cluster contained genotypes that were highly similar. The first cluster consists of four genotypes (Sahel
1, Cham 8, Cham 10 and L-R 51). These genotypes had high STI, MP, GMP, YI and YSI values, thus they considered to be the most desirable genotypes for both growth conditions (tolerant group). The second cluster comprising genotypes L-R 40,
Bohouth 6 and Bohouth 8. These genotypes had mean indicators values therefore, they identified as semi-tolerance or semi-
sensitive genotypes. Sids 1, L-R 67 and Bohouth 4 genotypes classified in the third cluster. In this cluster, two genotypes

Adv. Agric. Biol. 4 (1), 2015: 19-30
26
(L-R 67 and Bohouth 4) had high SSI, thus they were susceptible to drought and only suitable for irrigated conditions. In
general, these results were agreement with results obtained from biplot analysis. As group 1 and 3 showed the maximum
between group variance, therefore they are recommended for the genetic analysis using diallel or scaling test and QTLs
mapping of drought tolerance indices.
In the study conducted by Golabadi et al. (2006) in characterizing durum wheat segregating populations with
cluster analysis distinguished groups that contains superior lines for both drought stress and well-watered conditions,
superior lines for only drought stress conditions as well as superior lines for well-watered conditions with considering their
grain yield. Sajad-Bakaei et al. (2008) showed in their study that based on cluster analysis, in normal conditions genotypes
were divided into two groups while in mild and severe stress conditions genotypes were divided into 4 and 5 groups,
respectively. Based on results of Zahravi (2009) regarded to cluster analysis, genotypes were divided into three groups
resistant, semi-resistant and susceptible. Cluster analysis has been generally utilized for description of variation between genotypes and grouping based on drought tolerance indices (Golabadi et al., 2006; Malek-Shahi et al., 2009; Khalili et al.,
2012; Naghavi et al., 2013).
Figure 1. Dendrogram using Ward method between groups showing classification of genotypes based on resistance/tolerance indices.
Principal component and biplot analysis Plant breeders are employing PCA as a “pattern finding method” to complement cluster analysis Sajjad et al.
(2011). The main advantage of using PCA over cluster analysis is that each statistics can be assigned to one group only
(Khodadadi et al., 2011). The purpose of principal components analysis is to obtain a small number of linear combinations
of the 12 variables which account for most of the variability in the data. In this case, 2 components have been extracted, since 2 components had eigen values greater than or equal to 1.0. (Table 8).
Table 8. Principal components analysis for drought tolerance indices.
Drought tolerance indices Component
1 2
YP 0.33 0.15
YS 0.34 -0.01
STI 0.34 0.08
TOL 0.18 0.44
MP 0.34 0.08
GMP 0.34 0.06
SSI -0.12 0.49
YI 0.34 -0.01
YSI 0.11 -0.49
YR -0.11 0.49
HM 0.34 0.05
DI 0.33 -0.13
Eigen value 8.41 3.56
Percent of Variance 70.15 29.72
Cumulative Percentage 70.15 99.87
Extraction Method: Principal Component Analysis. Rotation Method: Varimax with Kaiser Normalization.
The results of the principle component analysis (PCA) showed that the first two components explained 70.15 and
29.72% of the total variation (Table 8). In fact, by the method, twelve indices were reduced to two independent
components. Eigen vectors in every component refer to the coefficients or the correlation between the component and the
indices. In each component, a high correlation between the component and an index indicating that the index is associated
with the direction of the maximum amount of variability in the data set. The first component (PC1) mostly was affected by

Adv. Agric. Biol. 4 (1), 2015: 19-30
27
Yp, Ys, STI, MP GMP, YI, HM and DI. Therefore, this component was related to yield potential and drought tolerance.
The genotypes which have high value of PC1 are expected to have high yield under both stress and non-stress conditions.
Similar results were reported by Golabadi et al. (2006) in durum wheat. The most effective indices in the second
component (PC2) were TOL, SSI and YR. This component was positively correlated with SSI, TOL and YR. Hence, PC2
is associated with yield under stress environment and stress susceptibility.
Evaluation of ten bread wheat genotypes under drought stress conditions 99.87% of cumulative variations were
justified by two first components and had latent roots more than one (Table 9). The first and second components had
70.15% and 29.73% variations, respectively. First component had high positive coefficients for indices Yp (0.33), YS
(0.34), STI (0.34), MP (0.34), GMP (0.34), YI (0.34), HM (0.34) and DI (0.33). Therefore, it was named grain yield under
both well-watered and drought stress conditions and detached tolerant genotypes with high grain. Second component had
high positive coefficients including TOL (0.44), SSI (0.49) and YR (0.49) indices. Therefore, this component was named as grain yield under drought stress conditions and separated susceptible genotypes. Hence, it is concluded that first component
was yield potential and second component was sensitive to stress (Table 8). At Zare, (2012) experiment for identifying
drought tolerant and susceptible genotypes with principal components analysis showed two components which explained
99% variations.
Higher PCA1 and lower PCA2 scores produced high yielding genotypes. It can be seen from the results that the
five genotypes, Bohouth 4, L-R 67, Sids 1, Cham 10 and Cham 8 had maximum amount of component I (Table 9). On the
other hand, among all genotypes, L-R 51, L-R 40, Sahel 1, Cham 10, Sids 1 and Cham 8 had minimum amount of
component II and the best rank based on it (Table 9). These results confirmed and supported by Kaya et al. (2002) found
that wheat genotypes with higher PC1 and lower PC2 values had high yields (stable genotypes) and genotypes with lower
PC1 and higher PC2 scores had low yield (unstable genotypes).
Table 9. Values of the principal components and ranking based on them of each Kabuli chickpea genotype.
Genotype Component 1 Rank Component 2 Rank
Sahel 1 0.46 6 -1.01 3
Cham 10 1.49 4 -0.69 4
Sids 1 2.63 3 -0.23 6
Bohouth 4 4.72 1 2.02 10
L-R 40 -2.53 9 -2.65 2
Cham 8 0.56 5 -0.58 5
L-R 67 3.18 2 1.13 7
Bohouth 8 -2.15 8 1.69 8
L-R 51 -0.10 7 -3.09 1
Bohouth 6 -4.12 10 1.70 9
According to principal component analysis the first two principal component analysis (PCAs) accounted for about 99.87% of total
variation (Table 8). The relationships among different indices are graphically displayed in a biplot of PCA1 and PCA2 (Fig. 2). The vector view of the biplot provides a summary of the interrelationships among the drought indicators. The analysis indicated that the first
PC explained 72.29% of the variation with SSI and TOL.
Figure 2. The biplot diagram of principle components analysis of 10 genotypes of bread wheat according to mean measured of drought
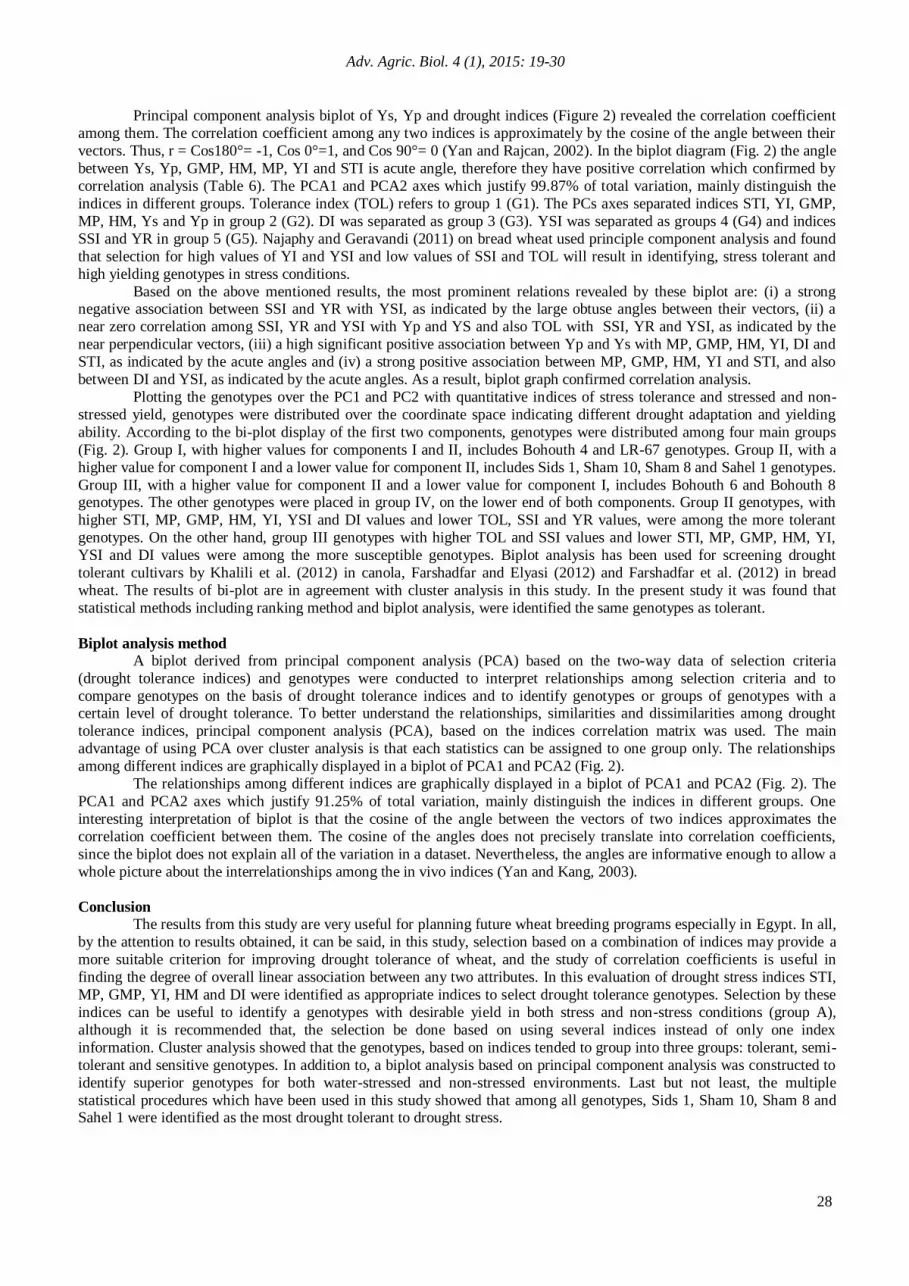
tolerance indices together with mean grain yield under stress (Ys) and irrigation (Yp) conditions.
Adv. Agric. Biol. 4 (1), 2015: 19-30
28
Principal component analysis biplot of Ys, Yp and drought indices (Figure 2) revealed the correlation coefficient
among them. The correlation coefficient among any two indices is approximately by the cosine of the angle between their
vectors. Thus, r = Cos180°= -1, Cos 0°=1, and Cos 90°= 0 (Yan and Rajcan, 2002). In the biplot diagram (Fig. 2) the angle
between Ys, Yp, GMP, HM, MP, YI and STI is acute angle, therefore they have positive correlation which confirmed by
correlation analysis (Table 6). The PCA1 and PCA2 axes which justify 99.87% of total variation, mainly distinguish the
indices in different groups. Tolerance index (TOL) refers to group 1 (G1). The PCs axes separated indices STI, YI, GMP,
MP, HM, Ys and Yp in group 2 (G2). DI was separated as group 3 (G3). YSI was separated as groups 4 (G4) and indices
SSI and YR in group 5 (G5). Najaphy and Geravandi (2011) on bread wheat used principle component analysis and found
that selection for high values of YI and YSI and low values of SSI and TOL will result in identifying, stress tolerant and
high yielding genotypes in stress conditions.
Based on the above mentioned results, the most prominent relations revealed by these biplot are: (i) a strong negative association between SSI and YR with YSI, as indicated by the large obtuse angles between their vectors, (ii) a
near zero correlation among SSI, YR and YSI with Yp and YS and also TOL with SSI, YR and YSI, as indicated by the
near perpendicular vectors, (iii) a high significant positive association between Yp and Ys with MP, GMP, HM, YI, DI and
STI, as indicated by the acute angles and (iv) a strong positive association between MP, GMP, HM, YI and STI, and also
between DI and YSI, as indicated by the acute angles. As a result, biplot graph confirmed correlation analysis.
Plotting the genotypes over the PC1 and PC2 with quantitative indices of stress tolerance and stressed and non-
stressed yield, genotypes were distributed over the coordinate space indicating different drought adaptation and yielding
ability. According to the bi-plot display of the first two components, genotypes were distributed among four main groups
(Fig. 2). Group I, with higher values for components I and II, includes Bohouth 4 and LR-67 genotypes. Group II, with a
higher value for component I and a lower value for component II, includes Sids 1, Sham 10, Sham 8 and Sahel 1 genotypes.
Group III, with a higher value for component II and a lower value for component I, includes Bohouth 6 and Bohouth 8 genotypes. The other genotypes were placed in group IV, on the lower end of both components. Group II genotypes, with
higher STI, MP, GMP, HM, YI, YSI and DI values and lower TOL, SSI and YR values, were among the more tolerant
genotypes. On the other hand, group III genotypes with higher TOL and SSI values and lower STI, MP, GMP, HM, YI,
YSI and DI values were among the more susceptible genotypes. Biplot analysis has been used for screening drought
tolerant cultivars by Khalili et al. (2012) in canola, Farshadfar and Elyasi (2012) and Farshadfar et al. (2012) in bread
wheat. The results of bi-plot are in agreement with cluster analysis in this study. In the present study it was found that
statistical methods including ranking method and biplot analysis, were identified the same genotypes as tolerant.
Biplot analysis method
A biplot derived from principal component analysis (PCA) based on the two-way data of selection criteria
(drought tolerance indices) and genotypes were conducted to interpret relationships among selection criteria and to
compare genotypes on the basis of drought tolerance indices and to identify genotypes or groups of genotypes with a certain level of drought tolerance. To better understand the relationships, similarities and dissimilarities among drought
tolerance indices, principal component analysis (PCA), based on the indices correlation matrix was used. The main
advantage of using PCA over cluster analysis is that each statistics can be assigned to one group only. The relationships
among different indices are graphically displayed in a biplot of PCA1 and PCA2 (Fig. 2).
The relationships among different indices are graphically displayed in a biplot of PCA1 and PCA2 (Fig. 2). The
PCA1 and PCA2 axes which justify 91.25% of total variation, mainly distinguish the indices in different groups. One
interesting interpretation of biplot is that the cosine of the angle between the vectors of two indices approximates the
correlation coefficient between them. The cosine of the angles does not precisely translate into correlation coefficients,
since the biplot does not explain all of the variation in a dataset. Nevertheless, the angles are informative enough to allow a
whole picture about the interrelationships among the in vivo indices (Yan and Kang, 2003).
Conclusion
The results from this study are very useful for planning future wheat breeding programs especially in Egypt. In all,
by the attention to results obtained, it can be said, in this study, selection based on a combination of indices may provide a
more suitable criterion for improving drought tolerance of wheat, and the study of correlation coefficients is useful in
finding the degree of overall linear association between any two attributes. In this evaluation of drought stress indices STI,
MP, GMP, YI, HM and DI were identified as appropriate indices to select drought tolerance genotypes. Selection by these
indices can be useful to identify a genotypes with desirable yield in both stress and non-stress conditions (group A),
although it is recommended that, the selection be done based on using several indices instead of only one index
information. Cluster analysis showed that the genotypes, based on indices tended to group into three groups: tolerant, semi-
tolerant and sensitive genotypes. In addition to, a biplot analysis based on principal component analysis was constructed to
identify superior genotypes for both water-stressed and non-stressed environments. Last but not least, the multiple
statistical procedures which have been used in this study showed that among all genotypes, Sids 1, Sham 10, Sham 8 and Sahel 1 were identified as the most drought tolerant to drought stress.

Adv. Agric. Biol. 4 (1), 2015: 19-30
29
Acknowledgements
At the end, we would like to take this time to thank all those who helped us in completing this research. The
author's thanks the filed staff of the Agricultural Research and Experimental Station of the Faculty of Agriculture, Cairo
University at Giza is gratefully acknowledged.
References Abd El-Mohsen AA, Abd El-Shafi MA.2014. Regression and path analysis in Egyptian bread wheat. J. Agri-Food and Appl. Sci., 2(5): 139-148.
Azizi-Chakherchaman SH, Mostafaei H, Imanparast L, Eivazian MR. 2009. Evaluation of drought tolerance in lentil advanced genotypes in Ardabil
region. J. Food Agric. Environ., 7:283-288.
Bartlett MS.1937. Some examples of statistical methods of research in agriculture and applied biology. J. Roy. Stat. Soc. Suppl., 4: 137- 185.
Bouslama M, Schapaugh WT.1984. Stress tolerance in soybean. Part 1: evaluation of three screening techniques for heat and drought tolerance. Crop. Sci.,
24: 933-937.
Clarke JM, De Pauw RM, Townley-Smith TM.1992. Evaluation of methods for quantification of drought tolerance in wheat. Crop Sci., 32: 728-732.
Cosgrove WJ, Rijsberman FR. 2000. World Water Vision, Earthscan Publications, London.
Dehghani GH, Malekshhi F, Alizadeh B.2009. A study of drought tolerance indices in canola (Brassica napus L.) genotypes. Journal of Science and
Technology of Agriculture and Natural Resources, 13(48): 77-90.
Duncan D. 1955. Multiple range and multiple "F" test. Biometrics 11:1- 42.
FAO.2013. Statistics Division 2013, 07 June.
Farshadfar E, Azadahe Sheibanirad A, Soltanian M.2014. Screening landraces of bread wheat genotypes for drought tolerance in the field and laboratory.
International J. Farming and Allied Sci., 3(3): 304-311.
Farshadfar E, Elyasi P, Aghaee M.2012. In Vitro selection for drought tolerance in common wheat (Triticum aestivum L.) genotypes by mature embryo
culture, Americ. J. Sci. Res., 48: 102-115.
Farshadfar E, Elyasi P.2012. Screening quantitative indicators of drought tolerance in bread wheat (Triticum aestivum L.) landraces, Eur. J. of Exper.
Biol., 2(3): 577-584.
Farshadfar E, Ghannadha M, Zahravi M, Sutka J. 2001. Genetic analysis of drought tolerance in wheat. Plant Breed., 114: 542-544.
Farshadfar E, Poursiahbidia MM, Safavia SM, Vosoughb A.2013. Screening of drought tolerant genotypes in bread wheat using a new integrated selection
index. Advanced Crop Sci., l3(3): 237–246.
Farshadfar E, Sutka J. 2002. Screening drought tolerance criteria in maize. Acta Agron. Hung, 50(4): 411–416.
Fernandez GCJ. 1992. Effective selection criteria for assessing plant stress tolerance. In: Proc, of the Int. Symp. On adaptation of vegetables and other
food crops in temperature and water stress. Tqiwan: 257-270.
Fischer AT, Maurer R.1978. Drought resistance in spring wheat cultivars. I. Grain yield responses. Aust. J. Agric. Res., 29: 897-912.
Freed R, Einensmith SP, Gutez S, Reicosky D, Smail VW, Wolberg P. 1989. Guide to MSTAT-C Analysis of Agronomic Research Experiments.
Michigan State University, East Lansing, USA, 152 p.
Gavuzzi P, Rizza F, Palumbo M, Campaline RG, Ricciardi GL, Borghi B. 1997. Evaluation of field and laboratory predictors of drought and heat
tolerance in winter cereals. Can. J. Plant. Sci., 77: 523-531.
Gholipouri A, Sedghi M, Sharifi RS, Nazari NM. 2009. Evaluation of drought tolerance indices and their relationship with grain yield in wheat cultivars.
Recent Res. Sci. Tech., 1(4): 195-198.
Golabadi M, Arzani A, Maibody M. 2006. Assessment of drought tolerance in segregating populations in durum wheat. African J. of Agric. Res., 1(5):
162-171.
Golestani -Araghi S, Assad MT.1998. Evaluation of four screening techniques for drought resistance and their relationship to yield reduction ratio in
wheat. Euphytica, 103: 293-299.
Gomez KA, Gomez AA.1984. Statistical Procedures for Agriculture Research (2nd Ed.). John Wiley and Sons Inc., New York, USA., 72: 203-206.
Guttieri MJ, Stark JC, Brien KO, Souza E. 2001. Relative sensitivity of spring wheat grain yield and quality parameters to moisture deficit. Crop Sci.,
41:327-335.
Hall AE.1993. Is dehydration tolerance relevant to genotypic differences in leaf senescence and crop adaptation to dry environments? In: Close TJ and
Bray EA (Eds) Plant Responses to cellular Dehydration during environmental stress, 1-10.
Jafari AA, Paknejad F, Jamial-Ahmadi M. 2009. Evaluation of selection indices for drought tolerance of corn (Zea mays L.) hybrids. Int. J. Plant. Prot., 3:
33-38.
Jeffers JNR.1967. Two case studies in the application of principal component analysis. Appl. Stat., 16:225-236.
Johari-Pireivatlou M.2010. Effect of soil water stress on yield and proline content of four wheat lines. Afr. J. Biotech., 9: 036-040.
Johnson RA, Wichern DW.2007. Applied Multivariate Statistical Analysis (6thEd.). Prentice-Hall International, Englewood Cliffs, NJ, USA.
Karimizadeh R, Mohammadi M, Ghaffaripour S, Karimpour F, Shefazadeh MK. 2011. Evaluation of physiological screening techniques for drought-
resistant breeding of durum wheat genotypes in Iran. Afr. J. Biotech., 10:12107-12117.
Kaya Y, Palta C, Taner S. 2002. Additive main effects and multiplicative interactions analysis of yield performances in bread wheat genotypes across
environments. Turkish J. of Agric. and Forestry, 26: 275-279.
Khalili M, Naghavi MR, Pour Aboughadareh AR, Talebzadeh J.2012. Evaluating of Drought Stress Tolerance based on selection indices in spring canola
cultivars (Brassica napus L.). JAS, 4(11):78-85.
Khalilzade GH, Karbalai-Khiavi H. 2002. Investigation of drought and heat stress on advanced lines of durum wheat. Paper presented at the 7th Iranian
congress of crop sciences. Univ. of Guilan, Iran, 25-27.
Khodadadi M, Fotokian MH, Miransari M.2011. Genetic diversity of wheat (Triticum aestivum L.) genotypes based on cluster and principal component
analyses for breeding strategies. Aust J Crop Sci., 5(1): 17-24.
Kristin AS, Senra RR, Perez FI, Enriquez BC, Gallegos JAA, Vallego PR, Wassimi N, Kelley JD.1997. Improving common bean performance under
drought stress. Crop Sci., 37: 43-50.
Lan J. 1988. Comparison of evaluating methods for agronomic drought resistance in crops. Acta Agric. Boreali-occidentalis Sinica, 7: 85–87.
Majidi M, Tavakoli V, Mirlohi A, Sabzalian MR.2011. Wild safflower species (Carthamus oxyacanthus Bieb.): A possible source of drought tolerance for
arid environments. Aust. J. Crop Sci., 5(8):1055-1063.
Malek-Shahi F, Dehghani H, Alizadeh B.2009. Study of drought tolerance indices in some cultivars of winter rapeseed (Brassica napus L.). J. of Sci. and
Tech. of Agric. and Natu. Resources, Water and Soil Sci., 48:78-89.
Mitra J. 2001. Genetics and genetic improvement of drought resistance in crop plants. Curr. Sci., 80: 758-762.
Mohammadi M, Karimizadeh R, Abdipour M. 2011. Evaluation of drought tolerance in bread wheat genotypes under dryland and supplemental irrigation
conditions. Austr. j. of Crop Sci., 5(4): 487-493.
Mohammadi R, Armion M, Kahrizi D, Amri A.2010. Efficiency of screening techniques for evaluating durum wheat genotypes under mild drought
conditions. Int. J. of Plant Product., 4(1): 1735-8043.

Adv. Agric. Biol. 4 (1), 2015: 19-30
30
Moustafa MA, Boersma L, Kronstad WE. 1996. Response of four spring wheat cultivars to drought stress. Crop Sci., 36: 982-986.
Naghavi MR, Pour-Aboughadareh AR, Khalili M.2013. Evaluation of drought tolerance indices for screening some of corn (Zea mays L.) cultivars under
environmental conditions. Notulae Scientia Biologicae, 5(3):388-393.
Najaphy A, Geravandi M.2011. Assessment of indices to identify wheat genotypes adapted to irrigated and rain-fed environments. Adv. in Environ.
Biology, 5(10): 3212-3218.
Ramirez P, Kelly J.1998. Traits related to drought resistance in common bean. Euphytica, 99: 127-136.
Rosielle AA, Hamblin J.1981. Theoretical aspect of selection for yield in stress and non-stress environment, Crop Sci., 21: 943-946.
Saidi A, Akbari A, Mozzaffari J, Heidari A, SerjaAzari M, Pirayeshfar B, Yazdansepas A, Salim SN, Saxena MC.2000. Adaptation of spring-sown
chickpea to the Mediterranean basin. 2. Factors influencing yield under drought. Field Crops Res., 34: 137–146.
Sajad-Bokaei A, Babaei H, Habibi D, Javidfar S, Mohammadi A. 2008. Evaluation of different soybean (Glycine max L.) genotypes under drought stress
conditions. J. Agronomy and Plant Breeding, 4(1): 28-38.
Sajjad M, Khan SH, Abdus Salam Khan A.2011. Exploitation of Germplasm for Grain Yield Improvement in Spring Wheat (Triticum aestivum L.). Int J
Agric Biol., 13:695-700.
Sanjari-Pireivatlou A, Yazdansepas A.2008. “Evaluation of wheat (Triticum aestivum L.) genotypes under pre and post-anthesis drought stress conditions.
J. Agric. Sci. Tech., 10: 109-121.
Steel RGD, Torrie GH, Dickey DA. 1997. Principles and Procedures of Statistics: A Biometrical Approach. 3rd
ed. McGraw-Hill, New York, USA, 450 p.
Toorchi M, Naderi R, Kanbar A, Shakiba MR.2012. Response of spring canola cultivars to sodium chloride stress. Annals of Biological Research, 2(5):
312-322.
Yan W, Kang MS. 2003. Biplot analysis: A graphical tool for breeders, geneticists and agronomist, CRC Press, Boca Raton FL., 313 p.
Yan W, Rajcan I.2002. Biplot analysis of test sites and trait relations of soybean in Ontario. Crop Sci., 42: 11-20.
Yasir TA, Chen X, Tian L, Condon AG, Yin-Gang HU.2013. Screening of Chinese bread wheat genotypes under two water regimes by various drought
tolerance indices. Austr. J. of Crop Sci., 7(13):2005-2013.
Zahravi M. 2009. Evaluation of Genotypes of Wild Barley (Hordeum spontaneum) Based on Drought Tolerance Indices. Seed and Plant, 25(4): 533-549.
Zare M. 2012. Evaluation of drought tolerance indices for the selection of Iranian barley (Hordeum vulgare L.) cultivars. Afr. J. Biotech., 11: 15975-
15981.
Zeinali-Khanghah H, Izanlo A, Hosseinzadeh A, Majnoun-Hosseini N.2004. Determine of appropriate drought resistance indices in imported soybean
cultivars. Iran J. Agric. Sci., 354: 875-885.