ads-b based sense and avoid applications for general aviation
TRANSCRIPT
UNIVERSITÀ DEGLI STUDI DI NAPOLI FEDERICO II
FACOLTÀ DI INGEGNERIA
Dipartimento di Ingegneria Industriale
DOTTORATO DI RICERCA IN INGEGNERIA AEROSPAZIALE NAVALE E
DELLA QUALITÀ XXVII CICLO
ADS-B BASED SENSE AND AVOID APPLICATIONS FOR
GENERAL AVIATION/UNMANNED AIRCRAFT
Coordinatore Prof. Luigi De Luca
Tutor Candidato Prof. Domenico Accardo Ing. Martina Orefice
Prof. Giancarmine Fasano
Ing. Federico Corraro
Marzo 2015

Index
i
Index
Abstract ................................................................................................. 1
Chapter 1 .............................................................................................. 2
Survey on Sense And Avoid Systems ................................................ 2
1.1 Introduction ......................................................................................................... 2
1.2 Regulatory state of the art of SAA systems ......................................................... 3
1.3 Challenges on Certification of SAA systems ........................................................ 5
1.4 SAA Available Technologies Survey ..................................................................... 7
1.4.1 Cooperative Technologies ........................................................................... 8
1.4.2 Cooperative technologies on UAV .............................................................. 9
1.4.3 Non-Cooperative Technologies ................................................................... 9
1.4.4 Cooperative and Non-cooperative technologies summary ...................... 12
1.4.5 SAA architectures and methods ................................................................ 15
Chapter 2 ............................................................................................ 22
Automatic Dependent Surveillance – Broadcast ............................ 22
2.1 Introduction ....................................................................................................... 22
2.2 ADS-B Description .............................................................................................. 22
2.3 ADS-B Messages and Reports ............................................................................ 24
2.4 ADS-B Regulations ............................................................................................. 29
2.5 Realities and Challenges in ADS-B system ......................................................... 31
Chapter 3 ............................................................................................ 33
System Description ............................................................................ 33
3.1 Introduction ....................................................................................................... 33
3.2 Software Architecture description .................................................................... 33
3.3 Surveillance Processing algorithm ..................................................................... 34
3.3.1 Track Generation and Maintenance ......................................................... 35
3.3.2 Track Termination algorithm .................................................................... 46
3.3.3 Common Time Track Extrapolation algorithm .......................................... 46
3.3.4 Traffic state file generation algorithm ...................................................... 47
3.4 Coarse Filtering algorithm ................................................................................. 47
Index
ii
3.5 Conflict detection algorithm .............................................................................. 48
3.5.1 Extra-size Radius computation: time-to-go approach .............................. 50
3.5.2 Extra-size Radius computation: uncertainties approach .......................... 50
3.6 Prioritization algorithm ...................................................................................... 52
3.6.1 Prioritization criterion: time-to-go approach ........................................... 53
3.6.2 Prioritization criterion: uncertainties approach ....................................... 53
Chapter 4 ............................................................................................ 55
Implementation and Test .................................................................. 55
4.1 Introduction ....................................................................................................... 55
4.2 Sense and Detect Algorithm modelling ............................................................. 55
4.2.1 Surveillance Processing Simulink Scheme ................................................. 55
4.2.2 Coarse Filtering: Simulink Scheme ............................................................ 62
4.2.3 Conflict detection and prioritization Simulink scheme: time-to-go
approach 62
4.2.4 Conflict detection and prioritization Simulink scheme: uncertainties
approach 65
4.3 Unitary Performance Tests ................................................................................ 66
4.3.1 Surveillance Processing: Tracking Filter Test ............................................ 66
4.3.2 Surveillance Processing Tests .................................................................... 71
4.3.3 Safety bubble extra-size radius computation ........................................... 74
4.4 Numerical Testing .............................................................................................. 78
4.4.1 Simulation Environment for Numerical Testing Description .................... 78
4.4.2 Numerical Testing Results ......................................................................... 80
4.5 Real-Time Testing .............................................................................................. 86
4.5.1 Simulation Facility Description .................................................................. 86
4.5.2 Real-Time Testing Results ......................................................................... 89
Conclusions ........................................................................................ 98
References .................................................................................................................... 99
Acronyms
iii
Acronyms
ACAS Airborne Collision Avoidance System
ADS-B Automatic Dependent Surveillance - Broadcast
ADS-R Automatic Dependent Surveillance – Re-broadcast
ARV Air Referenced Velocity
ATS Air Traffic Services
A/V Aircraft/Vehicle
ASACAS Autonomous Separation And Collision Avoidance System
CAB Civil Aeronautics Board (CAB)
CDTI Cockpit Display of Traffic Information
CFR Code of Federal Regulations
ENU East-North-Up
FAA Federal Aviation Administration
FLARE Flare Laboratory for Aeronautical Research
FOV Field Of View
GNC Guidance, Navigation and Control
IMC Instrument Meteorological Condition
LIDAR Laser Imaging Detection and Ranging
MASPS Minimum Aviation Systems Performance Standards
MMW Millimetre Wave
MOPS Minimum Operational Performance Standards
MS Mode Status
NACp Navigation Accuracy Category for Position
NACv Navigation Accuracy Category for Velocity
NAS National Airspace System
NED North-East-Down
SAA Sense And Avoid
SIL Surveillance Integrity Level
SV State Vector
TAS True Air Speed
TCAS Traffic Alert and Collision Avoidance System
Acronyms
iv
TIS-B Traffic Information Service - Broadcast
TSAA Traffic Situation Awareness with Alerting
UAV Unmanned Aerial Vehicle
VFR Visual Flight Rules
VLA Very Light Aircraft
VMC Visual Meteorological Condition
WP Way Point
Abstract
1
Abstract
This work focuses on the application of ADS-B surveillance data as inputs
for conflict detection algorithms, in order to support future self-separation as well
as collision avoidance systems. In particular, an approach is here proposed for
conflict detection between ownship and surrounding ADS-B OUT equipped
aircraft, which uses traffic position and velocity data provided by the on-board
ADS-B IN device. The intended system applicability is for both manned
commercial aircraft, as an aid to pilots, and Unmanned Aircraft Systems (UAS),
where high automation levels are required, as part of an autonomous Sense-And-
Avoid system.
In the first part of the work, a detailed analysis on state of the art of the SAA
systems is shown investigating the architectures based on cooperative and non-
cooperative sensors.
In the expected evolution of surveillance systems for aircraft applications in
the next years, the Automatic Dependent Surveillance Broadcast (ADS-B)
implementation on-board vehicles plays a fundamental role hence, in the second
part, a detailed analysis about ADS-B system is reported. The advantages and the
drawbacks related to the adoption of this sensor for a SAA architecture are also
investigated.
In the third part the architecture of the proposed system is presented
including a description of the software modules, focusing on the specific
applications devoted to surveillance data processing and conflicts identification
and prioritization.
Finally test scenarios, and the related results, are presented and discussed. In
particular off-line and real-time tests, with an hardware in the loop architecture,
have been carried out.
The activities hereafter reported have been carried out in the framework of a
collaboration between the Italian Aerospace Research Centre (CIRA), where the
author is employed in the field of air transport sustainability, and the University of
Naples “Federico II”.
Chapter 1 Survey on Sense And Avoid Systems
2
Chapter 1
Survey on Sense And Avoid Systems
1.1 Introduction
Unmanned Aerial Vehicles (UAVs) have grown exponentially in the last
decade and a lot of applications proved UAV reason for existence. Most of those
applications are military but more and more civil and commercial opportunities
are opening for UAVs. In fact, the size of UAVs is extremely variable and it
makes possible to perform some tasks impracticable or dangerous for manned
aircraft, such as detecting, monitoring and measuring the evolution of natural
disasters, like forest fires or landslips [1].
Especially in U.S., numerous efforts have been made, by governments and
industries, in order to integrate UAVs in the NAS. Among the years, an extensive
research has been carried out especially in the framework of navigation and
control techniques regarding UAVs [2] but some lacks still remain in terms of
safety. In fact the major obstacle to integrate UAVs in the NAS is the lack of a
sense-and-avoid capability similar to the one provided by on-board pilots, and the
consequent possibility of mid-air collisions. Therefore, although the efficiency of
those systems have been proved under different and various conditions, their
safety, reliability and compliance with aviation regulations still has to be proved.
Certainly, the fundamental difference between a UAV and a manned aircraft
is the physical absence of the pilot on-boards who also interacts with the ground-
based air traffic control (ATC) system. Essentially an UAV is remotely piloted
although it is capable of numerous automate operations. It implicates that the pilot
has not direct situational awareness and the one of the most significant challenges,
is the replacement of the “see-and-avoid” capability, with the “sense-and-avoid”
Chapter 1 Survey on Sense And Avoid Systems
3
one [3]. In the following a regulatory and technology survey of sense-and-avoid
systems will be reported.
1.2 Regulatory state of the art of SAA systems
Since the pilot remotely controls the UAV it is necessary to replace the
“see-and-avoid” capacity with the “sense-and-avoid” capacity.
The U.S. regulatory survey of sense-and-avoid, carried out by Douglas M.
Marshall et al. [4], gives an indication about the challenges related to the
integration of UAVs into the NAS.
The cornerstone of the current VFR, i.e. the concept of “see and be seen”
had its first appearance in a Federal regulation, in the Air Commerce Act of 1926.
Only in 1955 the CAB (the predecessor of FAA) inserted the sentence “see and be
seen” in a document [5] which stated “the philosophy behind the Visual Flight
Rules is that aircraft being flown in accordance with these rules are operated in
“see and be seen” weather conditions permitting the pilots to observe and avoid
other traffic”. Starting from this, in 1968, the FAA published an amendment
confirming the pilot’s responsibility and now the amendment 91 CFR states
“When weather conditions permit, regardless of whether an operation is
conducted under instrument flight rules or visual flight rules, vigilance shall be
maintained by each person operating an aircraft so as to see and avoid other
aircraft.” [6] and in addition pilots are responsible to not “operate an aircraft so
close to another aircraft as to create a collision hazard” [7].
Although the term “operate”, as reported in FAA Section 1.1 (“ [operate]
means use, cause to be used, or authorize to use aircraft, for the purpose…of air
navigation including the piloting of aircraft, with or without the right of legal
control” [8]) may include UAV operations, there isn’t a specific part set aside for
unmanned aircraft (but it exists the counterpart for the operation of moored
balloons, kites, unmanned rockets, and unmanned free balloons [9]). Only in 1981
the Advisory Circular 91.57 referred directly to unmanned aircraft: it introduced
the standards for model aircraft.
Over the years many efforts have been done in order to develop SAA
requirements and in 2004 the RTCA Special Committee 203 (SC-203) was
Chapter 1 Survey on Sense And Avoid Systems
4
formed. It had the task of produce the MASPS for several systems including the
MASPS for Sense And Avoid. The quantitative performance standards for a SAA
system (MASPS), would have been published on December 2013 [10] (but the
document will not be issued).
In 2005 and 2007 the FAA emitted two policy statements that pronounced
pilot’s duty to see-and-avoid other aircraft and, concerning the UAV, the
responsibility of the pilot to conducts visual line-of-sight operations [11].
Between December 2008 and March 2009, the FAA organized several
workshops in order to define the capabilities that a SAA system should have to be
compliant with the current rules governing the “see-and-avoid”. The workshop
published a document in October 2009 [12], where the sense-and-avoid concept
was defined as “the capability of [an unmanned aircraft] to remain well clear from
and avoid collisions with other airborne traffic”. Moreover the workshop defines
that a SAA system would be characterized by two components:
• A Self-Separation component that assures a safe separation based on
a variable time-based threshold. In this way the aircraft remain
“well-clear” of each other;
• A Collision Avoidance component that operates when the safe
separation is lost and an extreme manoeuver is needed to prevent a
collision, i.e. penetrating the collision volume. In fact, for the
collision avoidance maneuver, a distance based threshold is
considered.
The SC-203 sunset on June 2013 and, contextually, the SC-228 was created.
The committee has the task of produce the MOPS for Unmanned Aircraft Systems
planned for July 2016 [13]. The committee delivered two White Papers in
December 2013: Detect and Avoid (DAA) White Paper and Command and
Control (C2) White Paper [14].
Currently the FAA Regulation states that an UAV “must provide equivalent
levels of safety, comparable to see-and-avoid requirements for manned aircraft”
[15] and the UAV that wants to operate in U.S. NAS must obtain Certificates of
Authorization. Note that an equivalent level of safety to the see capabilities of
manned aircraft implies that the SAA system must be able to detect “other aircraft
Chapter 1 Survey on Sense And Avoid Systems
5
within a range of ±15° elevation and ±110° azimuth and respond in sufficient time
so that a collision is avoided by a minimum of 500 ft. The 500 ft margin of safety
derives from what is commonly defined as a near midair collision.” [16].
In the European framework, relevant effort is devoted to support the
definition of suitable standards allowing the integration of UAS into the civil
airspace. EDA (the European Defense Agency) funded the ongoing project
MIDCAS (Mid-air Collision Avoidance System), started in 2009 and expected to
be completed by 2015, whose budget has been set to approximately 50 M€. The
specific aim of MIDCAS is to identify adequate technology, contribute to
standardization and demonstrate a SAA system for UAS able to fulfill the
requirements for traffic separation and mid-air collision avoidance in non-
segregated airspace. The MIDCAS SAA system is currently in the final test
campaign, using a UAV in real world environment, and the project findings are
shared with European regulatory bodies to provide the technical background for
them to establish SAA standards. Therefore, the outcomes of the MIDCAS project
will be used as baseline input for the process of standardization of UAV
integration into non-segregated airspace
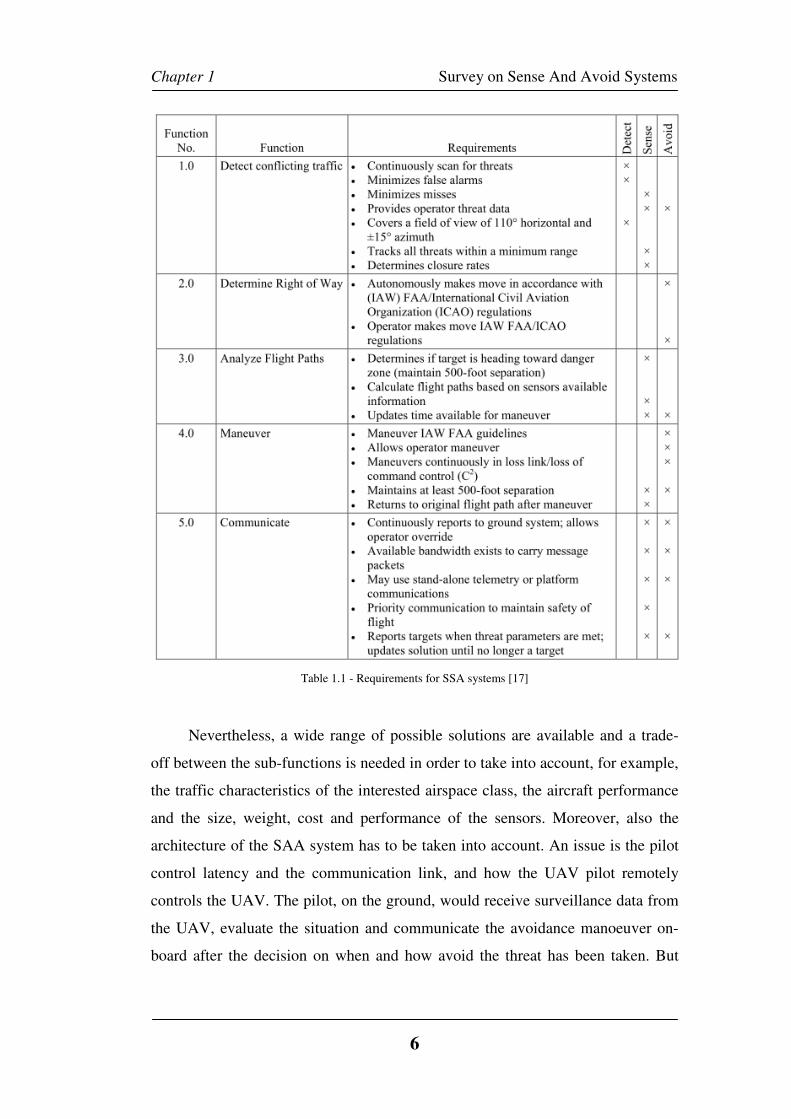
1.3 Challenges on Certification of SAA systems
In order to defines a set of SAA standards, for the certification and
operational approval of UAVs, the Workshop of 2009 identified a set of
requirements categorized by sub-function. They are reported in Table 1.1 that is
an extract of the document emitted by the FAA “Sense, and Avoid Technology for
Unmanned Aircraft Systems “ [17]:
Chapter 1 Survey on Sense And Avoid Systems
6
Table 1.1 - Requirements for SSA systems [17]
Nevertheless, a wide range of possible solutions are available and a trade-
off between the sub-functions is needed in order to take into account, for example,
the traffic characteristics of the interested airspace class, the aircraft performance
and the size, weight, cost and performance of the sensors. Moreover, also the
architecture of the SAA system has to be taken into account. An issue is the pilot
control latency and the communication link, and how the UAV pilot remotely
controls the UAV. The pilot, on the ground, would receive surveillance data from
the UAV, evaluate the situation and communicate the avoidance manoeuver on-
board after the decision on when and how avoid the threat has been taken. But
Chapter 1 Survey on Sense And Avoid Systems
7
another solution would be to use an automatic collision avoidance algorithm on-
board the UAV with no communication with the pilot [18].
Another trade-off is related to the interaction between the sensors and the
avoidance manoeuvres. In fact the accuracies and performance of the sensing
system are strictly related to the used sensors and so the collision avoidance
manoeuvre could respect the minimum required distance or consider an extra-size
in order to compensate the possible measurement errors [18].
For those reasons is not possible to adopt a common SAA algorithm for all
UAVs, unlike the manned collision avoidance system TCAS II that uses a single
threat algorithm [19].
In the following, a review on possible sensors solution and SAA
architecture will be given.
1.4 SAA Available Technologies Survey
“Currently is no recognized technology solution that could make these
aircraft capable of meeting regulatory requirements for see-and-avoid and
command and control” is a statement of Nick Sabatini (associate FAA
administrator for aviation safety) articulated before the House Committee on
Transportation and Infrastructure, Subcommittee on Aviation on Unmanned
Aircraft Activities in 2006 [20]. The situation is not very changed ever since, due
to the complexity of sense-and-avoid technologies and an initial FAA certification
of an airborne SAA will not take place until the next year [21]. For this reason, a
great effort has been made, during the lasts years, by industry and agencies in
order to identify a technological solution that could satisfy an equivalent level of
safety of manned aircraft.
The technologies that have been used, during the years, can be divided in
two macro-areas [22]:
• Cooperative Technologies that typically require a transponder on
board the aircraft; they require other aircraft to be equipped with the
same devices when sharing the same airspace.
Chapter 1 Survey on Sense And Avoid Systems
8
• Non Cooperative Technologies that identify all the aircraft not
equipped with a transponder or, for example, gliders, hot air
balloons and so on; they do not require other aircraft to be equipped
with the same devices when sharing the same airspace.
Note that, in a multi-sensor approach, a data fusion system is required to
integrate the best features of the dissimilar sensors while ensuring high reliability
and limiting the computational burden so as to enable real time software
implementation.
1.4.1 Cooperative Technologies
TCAS
Traffic Alert and Collision Avoidance System (TCAS) [19] is the principal
collision avoidance systems and it uses transponder in order to transmit
information. Therefore it generates alerts for the pilot for potential collision
threats related to transponder-equipped aircraft. In addition to traffic advisories
(TA) the TCAS II can provide resolution advisories (RA) supporting the pilot in
the conflict resolution [23]-[24]. Note that the suggested collision avoidance
maneuver is generated in a cooperative manner with the other aircraft. TCAS is
mandated on all aircraft with 10 seats or more. Nevertheless this systems was
never intended to replace see-and-avoid and, moreover, a safe horizontal
maneuver is not guaranteed due to the low accuracy of bearing measurements.
ADS-B
Automatic Dependent Surveillance – Broadcast (ADS-B) is a relatively new
technology and it was developed in order to support aircraft operation and
overcome the ground based radar surveillance [25]-[26]. Actually, it allows both
ground station and pilots to detect other ADS-B equipped aircraft with more much
precision than ever.
ADS–B consists of two different services: ADS-B OUT and ADS-B IN. In a
typical application, aircraft equipped with ADS-B OUT technology compute their
own precise position through satellite-based GPS. This information, along with
other such as altitude, velocity, identification (and others which will be described
Chapter 1 Survey on Sense And Avoid Systems
9
in the following chapter) are transmitted in broadcast via a discrete frequency via
a data-link. Those information can be received by other aircraft equipped with
ADS-B IN technology or ground station improving the awareness of pilots about
the surrounding traffic conditions and reducing the risk of misleading controllers
orders due to stress condition. The main expected outcome of ADS-B technology
is the improvement of the Separation Assurance function and in the future the
ADS-B will enable pilots to perform self-Separation Assurance manoeuvres [27]-
[28]. The introduction of ADS- B will provide specific benefits to support the
integration of UAV into civil airspace. Moreover, General Aviation aircraft will
be provided with a system that will ensure a remarkable increase in the overall
situational awareness and a reduction in the number of collision threats.
1.4.2 Cooperative technologies on UAV
Cooperative technologies are widely used on manned aircraft due to their
proved reliability. Moreover those systems have been already certified and
approved for use. Nevertheless there are some disadvantage that must be taken
into account when the cooperative sensors are intended to use on UAVs. First of
all, cooperative technologies, effectively, work only when all the aircraft in the
shared airspace possess and utilize them. They provide no SAA capability against
ground obstacles, i.e. terrain and mountains, and they were developed assuming
that a pilot would be in the loop evaluating warnings and taking the appropriate
manoeuvres. Moreover, some of those systems, such as TCAS, might be cost
prohibitive for some users. For these reasons, a recertification might be needed for
use in UAVs, in order to maintain the equivalent level of safety of manned aircraft
[17].
1.4.3 Non-Cooperative Technologies
Active Microwave Sensors
Active microwave sensors represent a suitable option to provide the
required situational awareness in the case of medium/large UAV platforms which
have to attain a reliable full autonomy from ground. In fact, airborne radars
Chapter 1 Survey on Sense And Avoid Systems
10
provide direct and typically accurate range estimates (also range rate if Doppler
processing is used). Moreover, they can guarantee large detection range, low
levels of missed or false detections (ground echoes have to be properly filtered),
and can be not much affected by weather conditions, so that the all-time all-
weather operation can be guaranteed.
It is worth noting that, in the choice of wavelength, maximizing detection
range, minimizing sensor dimensions to enable installation on-board a lightweight
aircraft, and improving as much as possible angular resolution are contradicting
requirements. In fact, radars operating at low frequencies are relatively unaffected
by atmosphere, but are large in size and unable to provide required spatial
resolution, due to main lobe width, which is directly proportional to operating
wavelength l
KdB
λσ =3 . The parameter K is a coefficient whose value depends
on the considered aperture and feeding, and l is the antenna length in the
considered direction. In conventional architectures the main lobe width coincides
with the achievable angular resolution. A higher frequency radar, instead, is
smaller in size and provides better resolution for given aperture size, but is more
susceptible to atmospheric and weather effects, and in particular to rain, as it
results if we consider atmospheric attenuation produced by fog and rain.
Frequencies ranging from C-band (about 6 GHz) to Ka and W band (35 and
94 GHz, respectively) have been used and/or proposed in sense and avoid
applications.
Besides angular resolution, other important performance parameters are the
detection range, the range and Doppler resolution, the achievable field of regard
and scan rate.
The detection range for a given target can be calculated in probabilistic
terms on the basis of achievable signal-to-noise ratio (SNR) and the number of
impulses integrated to perform target detection [29].
Given a field of regard, the achievable scan rate depends on the radar pulse
repetition frequency (PRF, which in its turn influences average power
consumption and maximum unambiguous range), number of integrated pulses for
each resolution cell, and main lobe width.
Chapter 1 Survey on Sense And Avoid Systems
11
Compared with mechanically scanned systems, electronically scanned
arrays have the significant advantage of beam agility, i.e., the beam can pointed
adaptively without the constraints of mechanical inertia. Thus, track update rate
for a given target can be increased without significant effects on the revisit rate in
the rest of the sensor field of regard.
However, electronic scanning allows beam pointing within angular limits
which are smaller than typical sense and avoid requirements. In general,
standalone radar architectures are typically characterized by coarse angular
resolutions (order 1°) and low update rates (order 1 Hz), since finer resolution
essentially implies larger antenna dimensions. In general radars are demanding in
terms of cost, size, weight and required electric power, so that they do not
represent an affordable sensing solution for small unmanned platforms,
considering current technological levels. However, increasing efforts are being
made towards miniaturization and adaptation to small UAV.
Laser (LIDAR)
Laser systems work similarly to conventional radar: laser scans are taken at
regular interval and processed by an echo-analysis software. The obstacles and
intruders can be used as input to automated collision avoidance systems [30]. Due
to their high configurability, laser systems can be used in several atmospheric
conditions reducing the false alarms. Moreover, they are capable to detect small
obstacles up to 5 mm of diameter and large obstacles such as buildings and
bridge.
Electro Optical Systems
Electro-optical sensors are largely used in the framework of collision
avoidance systems for small UAV thanks to the low cost, power consumption and
weight. In particular they are often used as standalone systems or in integrated
architectures comprising radar or other systems, to produce an estimate of vehicle
states through a multi sensor fusion.
In terms of wavelength, visible band sensors are usually exploited to detect
the sunlight scattering from other aircraft, while during nighttime when no Sun
Chapter 1 Survey on Sense And Avoid Systems
12
scattering is available, the best solution is to use a Thermal Infra Red sensor that
can detect the energy emitted by the same object.
Important parameters relevant to EO detection and tracking performance are
related to the available field of view and angular resolution.
In general, standalone EO systems require heavy computational resources in
order to fulfill real-time full image detection of obstacles, and their output can
suffer from a high false alarm rate since background removal processing is less
accurate as the image size increases. Moreover, EO detection range is very much
affected by weather and illumination conditions and it can be poor.
Acoustic Sensors
Acoustic sensors can be used to detect and track aircraft basing on the signal
emitted from a propeller-driven aircraft which comprises a strong narrowband
tone imposed onto a broadband random component.
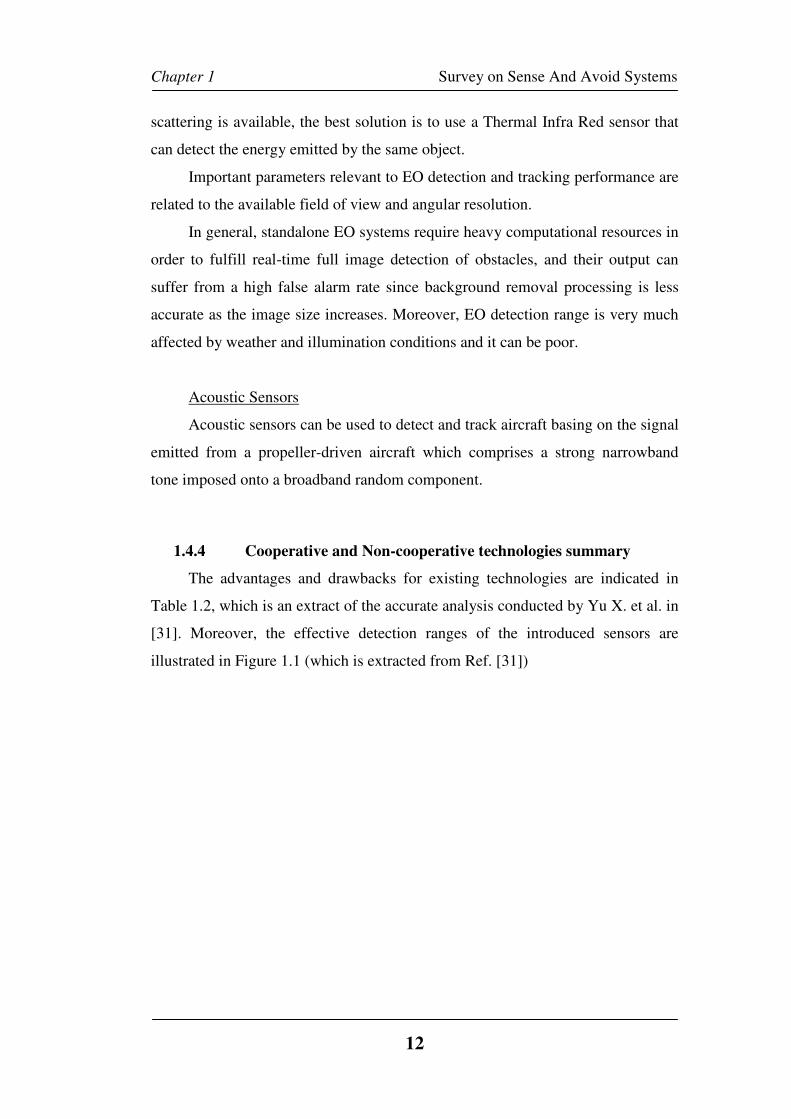
1.4.4 Cooperative and Non-cooperative technologies summary
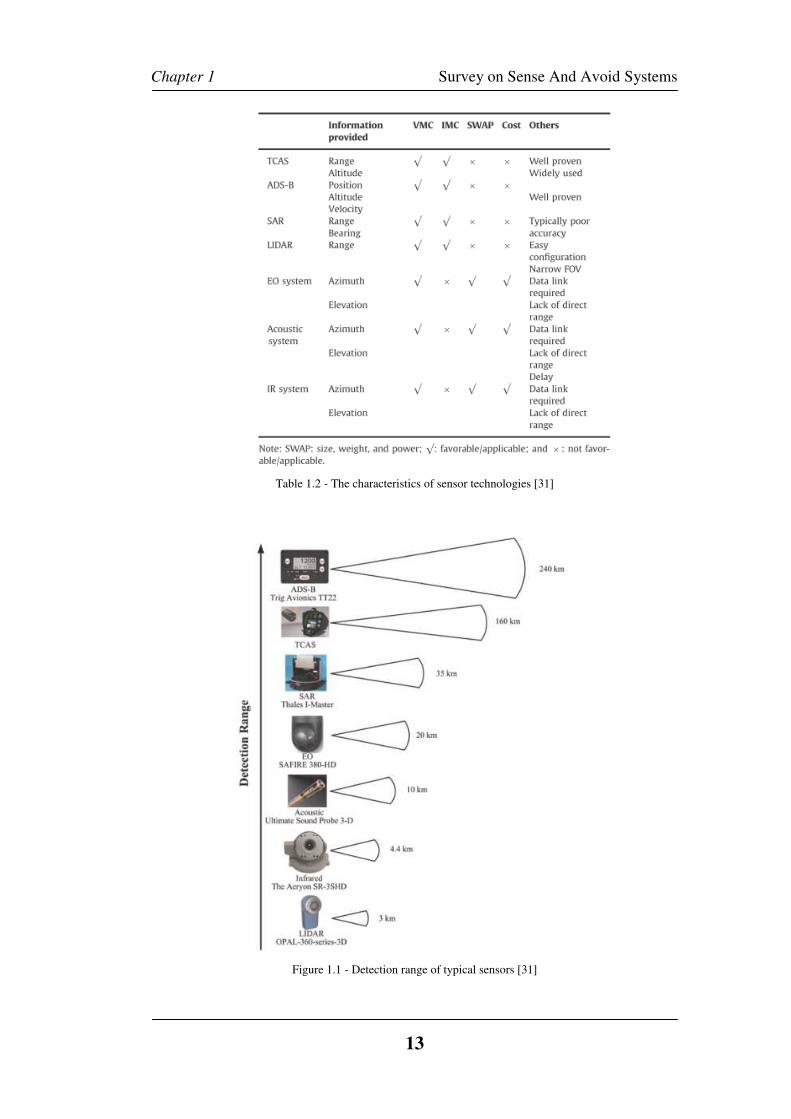
The advantages and drawbacks for existing technologies are indicated in
Table 1.2, which is an extract of the accurate analysis conducted by Yu X. et al. in
[31]. Moreover, the effective detection ranges of the introduced sensors are
illustrated in Figure 1.1 (which is extracted from Ref. [31])
Chapter 1 Survey on Sense And Avoid Systems
13
Table 1.2 - The characteristics of sensor technologies [31]
Figure 1.1 - Detection range of typical sensors [31]
Chapter 1 Survey on Sense And Avoid Systems
14
Moreover in [32] are reported the mainly characteristics of most used
sensors in SAA. They can be summarized as follows:
• Optical Sensors (Pixel/Visual):
- Low cost, size and weight;
- Suffer atmospheric disturbances;
- A visual radar is highly comparable to a human’s ability of
observe (equal level of safety);
- To achieve the required FOV, sensors have to be arrayed in
various position on the aircraft, taking up valuable external
area.
• Infrared Sensors:
- Higher cost than EO;
- Low size and weight;
- Able to conduct nighttime operations;
- Operate under harsh weather conditions;
- To achieve the required FOV, sensors have to be arrayed in
various position on the aircraft, taking up valuable external
area;
- Unable to pick up objects lacking some type of heat
signature (cables or gliders);
- Development and integration would be very costly.
• Microwave Radar (MMW Radar):
- Very mature technology;
- Detect intruder aircraft at great distances;
- High size and weight.
• Laser Radar (LIDAR):
- the size of the cone is very small and it makes possible to
target a specific obstacle;
- the revisit rate is poor and it takes multitude of laser sensors
to achieve the same rate as a microwave radar;
- extremely underdeveloped;
- High cost;
Chapter 1 Survey on Sense And Avoid Systems
15
- Inadequate in adverse weather (light can be absorbed and
reflected).
1.4.5 SAA architectures and methods
During the latest years a great effort has been made, by industry and
agencies in order to identify a technological solution that could satisfy an
equivalent level of safety of manned aircraft. In the following, a review on the
available SAA system architectures and algorithms is presented.
Regarding the “sense” function, for a sense-and-avoid system on UAVs,
MIT Lincoln Laboratory developed the Airborne Sense and Avoid (ABSAA)
Radar panel which is an unique light-weight sensor performing quick and
repeatable scanning of the search region. The radar solution meets the all-weather
and day/night requirements [33] - [34].This prototyping effort was focused on the
General Atomics Predator B which nominally could carry 2 or 3 separate radar
arrays to cover a total of 220° in azimuth and 30° in elevation [35]. Others radar
approaches for the sense function can be found in [36] and [37]. In the first a
prototype radar, for mini-UAV, is presented. This radar is able to differentiate
other miniature rotorcraft by their Doppler signature. Moreover a performance
analysis related to the signature matching algorithms is presented. The second
introduces a radar technology and shows the test that have been performed in
order to evaluate the performance of a digital beam forming concept associated
with flood light illumination: it allows combining wide angle coverage, high
velocity resolution, and high refresh rate.
Several different approaches have been considered in literature for vision-
based flying object detection, ranging from optical flow to morphological filtering
[38]. An emerging technologies based on the Active Electronically Scanned Array
(AESA) couple the radar-based technology and EO systems: the EO system scans
and records images while the radar is shifting through its various modes [39].
A visual approach is proposed by Zarandy A. et al. in [40]: their prototype
uses 5 pieces of 1.2 Megapixel miniature cameras, an FPGA board with a Spartan
6 (XC6SLX45T), and a 128Gbyte Solid-State Disk drive for recording raw video
data. The paper focus on image processing algorithms and it proves that the
Chapter 1 Survey on Sense And Avoid Systems
16
designed system is able to identify 10 meter sized aircraft from at least 2000
meters under regular daylight image conditions.
Another vision-based approach is proposed by Fasano et al. in [41]: the
obstacle detection and track confirmation are based on morphological filtering and
on a local image analysis. The tracking is performed through a Kalman Filter in
order to establish aircraft position and velocity. The proposed technique has been
tested using flight data gathered in a sense and avoid research project carried out
by the Italian Aerospace Research Center (CIRA) and the Department of
Industrial Engineering of the university of Naples “Federico II”
Two devices based on electro-optical systems, in order to perform the
“sense” function for a sense-and-avoid module, are reported in [42] and [43].
A trade analysis of EO sensors, used to provide a sense and avoid capability
for Global Hawk, is reported in [44]. It is assumed that Global Hawk has three
cameras, whose coverage do not overlap, that provide a FOV of ±100° by ±15°.
The analysis suggested that the EO system is suitable for detecting larger aircraft
but may not be ideal for detecting smaller aircraft with enough lead time for
Global Hawk to avoid them.
Detection and tracking strategies based on acoustic array can be found in
[45]÷[47]. These systems use array of microphones located on board an aircraft
and a combination of narrow and broad band processing techniques to
characterize the temporal variation of the received tone of an approaching aircraft
and estimate its propeller blade rate, together with its speed and the time and
distance to the closest point of approach.
Scientific Applications and Research Associates, Inc. (SARA) proposed an
acoustic sensor for use on small UAVs. The Passive Acoustic Non-cooperative
Collision Alert System (PANCAS) is characterized by a series of microphones
mounted in order to compute bearing information for sound at each frequency. A
proprietary algorithm is considered in order to minimize false alarms, due to fixed
and random errors (atmospheric effects, wind effects, signal processing errors),
and to determine the threshold to apply a collision avoidance manoeuver [48].
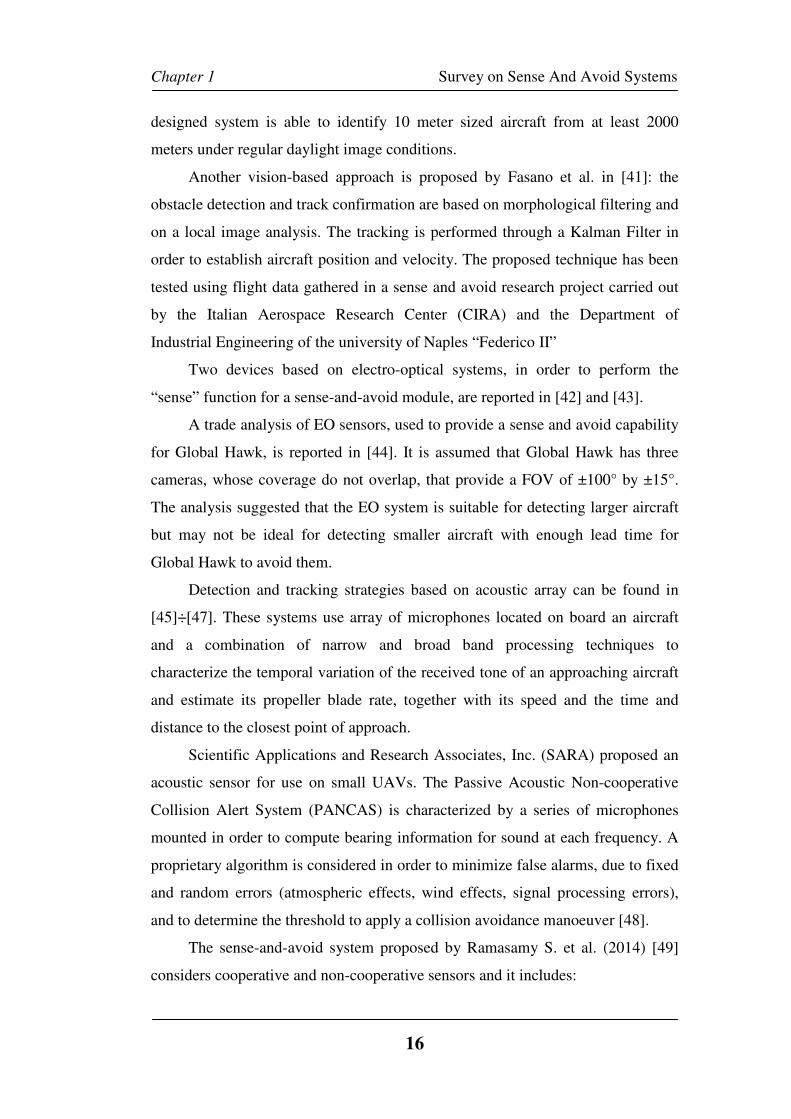
The sense-and-avoid system proposed by Ramasamy S. et al. (2014) [49]
considers cooperative and non-cooperative sensors and it includes:
Chapter 1 Survey on Sense And Avoid Systems
17
• Visual camera;
• Thermal camera;
• Lidar;
• MMW Radar;
• Acoustic Sensors;
• Transponder;
• ADS-B;
• TCAS/ACAS.
The avionic sensors and sensor decision tree is reported in Figure 1.2.
Figure 1.2- Avionic Sensors and Sensor Decision Tree proposed by Ramasamy S. et al [49]
Referring to non-cooperative sensors an high level tracking detection is
performed by using a Kalman filter starting from the continuous cameras
detection and range information provided by LIDAR. The Track-To-Track (T3)
algorithm is used for sensor fusion. This method combines the estimates instead
of the observation from different sensors. The ADS-B system is used to obtain the
state of the intruders and an Interacting Multiple Model (IMM) algorithm is
considered for data fusion [50]. The risk of collision is, then, evaluated
considering the probability of a near mid-air event for the predicted trajectory
over the time horizon by employing Monte Carlo approximations. Finally the
Chapter 1 Survey on Sense And Avoid Systems
18
volume that must be avoided by the host UAV can be obtained computing and
combining the navigation and tracking error ellipsoids.
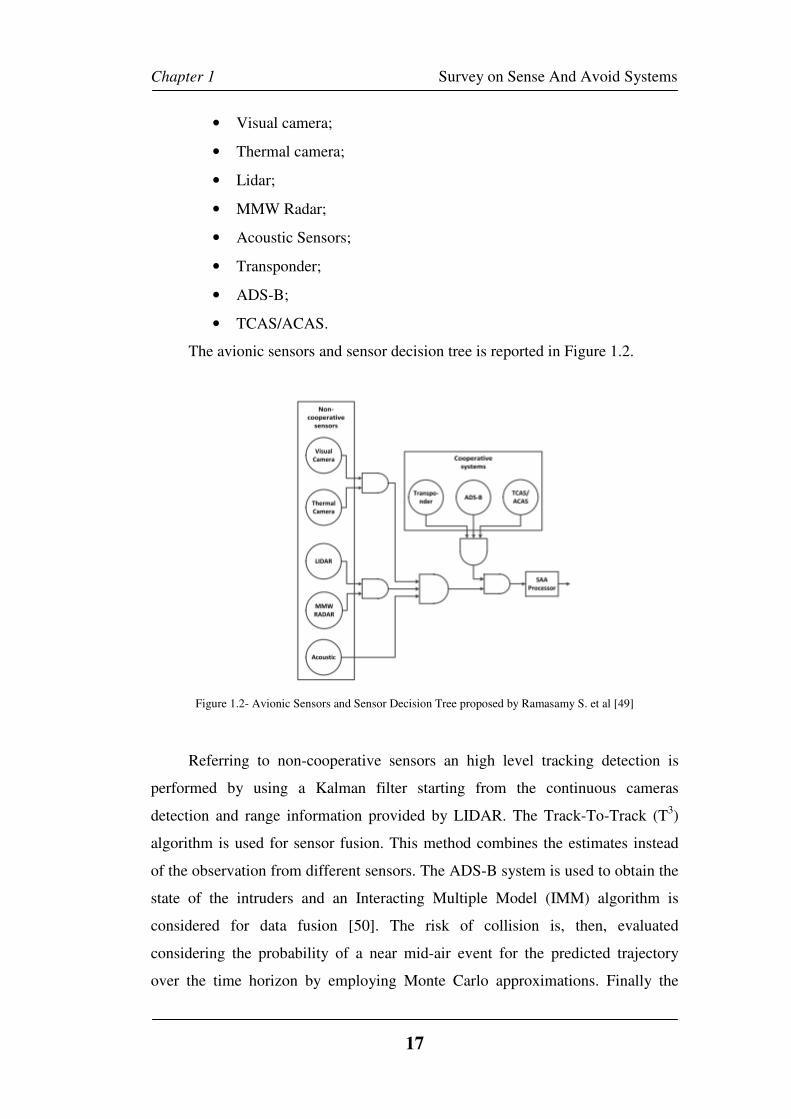
Another multi-sensor data integration for an autonomous sense-and-avoid
system is reported in [51] and [52]. The suite of SAA sensors used is shown in
Figure 1.3. The proposed system is called Multi-Sensor Integrated Conflict
Avoidance (MuSICA) and the data integration is performed by an Extended
Kalman Filter (EKF) and a measurements-to-track association. The collision
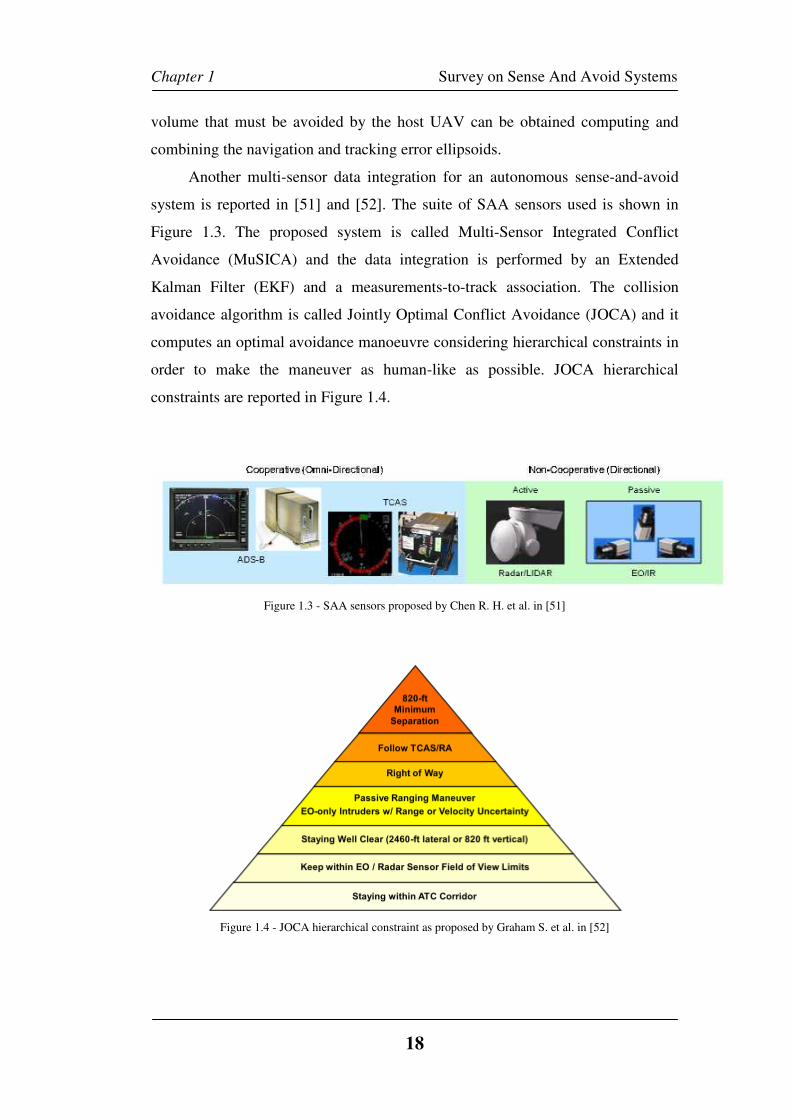
avoidance algorithm is called Jointly Optimal Conflict Avoidance (JOCA) and it
computes an optimal avoidance manoeuvre considering hierarchical constraints in
order to make the maneuver as human-like as possible. JOCA hierarchical
constraints are reported in Figure 1.4.
Figure 1.3 - SAA sensors proposed by Chen R. H. et al. in [51]
Figure 1.4 - JOCA hierarchical constraint as proposed by Graham S. et al. in [52]
Chapter 1 Survey on Sense And Avoid Systems
19
In [53] a SAA algorithm based on the Laser Obstacle Avoidance Marconi
(LOAM) system is proposed. LOAM system, developed and tested by SELEX-ES
and the Italian Air Force Research and Flight Test Centre [30], is a low-
weight/volume navigation aid system for rotary-wing/UA platform specially
designed to detect potentially dangerous obstacles placed in or nearby the flight
trajectory and to provide the crew with warnings and information of the detected
obstacles. A laser beam scans periodically the area around the flight trajectory in
the FOV and using a dedicated signal processing algorithms, optimized for low-
level obstacle detection, the system provides obstacle shapes. Measurements
uncertainties are taken into account, adding a Gaussian error to every data and
computing a statistic of the position error for obstacles near and far from the
aircraft. If a collision risk is established by the impact warning processing, a
collision avoidance maneuver is computed having the smaller possible correction
and which is compatible with a safe flight plan. Here too, an ellipsoidal avoidance
volume is associated to the obstacle considering the two-sigma standard deviation
of the total obstacle detection and tracking errors.
A SAA algorithm based on the surveillance data provided by electro-optical
sensors and an airborne radar can be found in [54]. The conflict detection criterion
is based on the definition of the closest point of approach and the resolution
maneuver is computed considering the minimum variation from the original path.
In particular, the collision volume is assumed to be spherical and the resolution
maneuver is computed considering the tangent to that sphere. The sphere radius is
related to the Near Mid-Air Collision (NMAC) parameter as defined in [55]: “A
Near Mid-Air Collision is defined as an incident associated with the operation of
an aircraft in which a possibility of collision occurs as a result of proximity of less
than 500 feet to another aircraft, or a report is received from a pilot or a flight
crew member stating that a collision hazard existed between two or more aircraft”.
A sense-and-avoid system, which uses an ADS-B Transceiver, is reported in
[56]-[57]. The collision detection algorithm considers the GPS position obtained
by the ADS-B device and a threat is declared if an aircraft or a fixed obstacle is
predicted to enter a collision or near collision course with the ownship aircraft
within a certain time frame. The collision avoidance algorithm considers a
Chapter 1 Survey on Sense And Avoid Systems
20
behavior-based approach derived from a guidance method developed for
unmanned maritime vehicles. In particular, it represent a multi-objective
optimization problems using a set of behavior that may include “Reach Target”,
“Avoid Small Threats”, “Avoid Large Threats” and “Follow Right-of-Way
Rules”. These behaviors may or may not produce objective functions for which a
priority weighting is assigned. Objective function are defined considering a set of
explicit constraints constructs representing the dynamic characteristics of the
UAV: horizontal velocity, vertical velocity, and direction. Note that the behaviors
are based on the closest point of approach. Hence, the sense-and-avoid algorithm
uses interval programming (IvP) methods to balance objective functions for each
behavior [58]. Concerning the avoidance volume computation, one possible
assumption considers the turning and climb-descendent performance, creating a
cylindrical volume. Another solution is to use time-based thresholds based on the
definition of tau parameter [19].
A range-based method used to create dynamic alerting thresholds is reported
in [59]. The relative dynamics of the incoming aircraft and the “sense” feature, are
assumed to be evaluated through the ADS-B system. The alerting thresholds are
defined based on the geometric relationship of the encounter and the UAV’s
maneuvering ability and the four kinds of alarms include: “Dangerously Close”,
“Perform Maneuver”, ”Vertical Maneuver” and “Super Maneuver Only”.
A collision avoidance approach, based on the conflict probing is presented
in [60]. Conflict probing consists of predicting the future separation between
ownship and hazards for a set of ownship velocity vectors, up to a predefined
prediction horizon. The probing data indicates which velocity vectors will lead to
a future conflict and the related time to conflict. Conflict probing can provide a
common framework for the computation of coordinated conflict avoidance
maneuvers that include integration of multiple types of hazards and constraints
such as vehicle performance and right-of-way rules.
Another approach relying on the use of ADS-B data for trajectory prediction
and conflict detection is proposed in [61]. The methodology addresses the
problem from a probabilistic point of view aimed to assess the conflict probability
based on the approximation of the conflict zone by a set of blocks.
Chapter 1 Survey on Sense And Avoid Systems
21
The Mid-Air Collision Avoidance (MIDCAS) Project proposes a SAA
system based on the data coming from a set of sensors comprising EO, IR, Radar,
ADS-B and Transponder. The collision volume can be defined in two ways,
starting from the NMAC parameter: the first one defines the collision volume as a
spheroid with vertical half axis of 350 ft, and horizontal half-axis of 500 ft; the
second defines the collision volume as a cylindrical volume centered on the UAV
with a horizontal radius of 500 ft and a vertical height of 200 ft. the system shows
threats information display and it computes an automated collision avoidance
maneuver [62].
Finally, in Europe, the general aviation and UAVs are currently
experiencing the introduction of other and cheaper cooperative means for conflict
detection (as alternative to TCAS), such as FLARM [63]. Each FLARM device
evaluates its position and altitude with a high precision GPS receiver. Based on
other information, such as speed, acceleration, heading, track, a flight plan can be
calculated and sent over a radio channel to all nearby aircraft equipped with
FLARM too. Therefore, a motion prediction algorithm calculates a collision risk
for each received aircraft based on an integrated risk model. The FLARM device
gives the alerts to the pilot which can take resolutive actions. The newer FLARM
incorporates a very accurate ADS-B and transponder (SSR) Mode-C/S receiver in
order to include all the transponder equipped aircraft in the collision prediction
algorithm.
Chapter 2 Automatic Dependent Surveillance - Broadcast
22
Chapter 2
Automatic Dependent Surveillance – Broadcast
2.1 Introduction
The Automatic Dependent Surveillance – Broadcast (ADS-B) is a,
relatively, new technology that has been under development several years before
its recent adoption [64]. This technology was, actually, developed for support air
traffic controllers improving the manned aircraft situational awareness: it was
intended to replace the primary and secondary surveillance radars. However, it
also appeared as a potential solution for the sense and avoid issue in UAVs.
2.2 ADS-B Description
The Automatic Dependent Surveillance - Broadcast is a cooperative
surveillance technology. There are two main services related to this technology:
• ADS-B OUT service supports the air traffic data transmission
between the aircraft and the ATC;
• ADS-B IN service supports the aircraft data transmission between
the aircraft themselves.
The aircraft equipped with ADS-B OUT technology compute their own
precise position through satellite-based GPS and automatically transmit these
parameters. The information are broadcasted via a radio-link and can be received
by ground operators or other aircraft equipped with ADS-B IN technology. The
FAA identified two links for the transmission of data:
• Universal Access Transceiver (UAT) for general aviation users that
operates at 978 MHz UHF frequency;
• 1090 MHz Mode S Extended Squitter (ES) for private or commercial
operators.
Chapter 2 Automatic Dependent Surveillance - Broadcast
23
The UAT data link is approved by FAA for use in all airspace except class
A (above 18000 ft) and it is intended to support also other services such as Flight
Information Service – Broadcast (FIS-B) and Traffic Information Service –
Broadcast (TIS-B). In this way UAT users can receive ground-based aeronautical
data (FIS-B) and reports from proximate traffic (TIS-B) through a multilink
gateway service that provides ADS-B reports for 1090ES-equipped aircraft and
non-ADS-B equipped radar traffic. This physical layer is now available only in
U.S. [65]. Moreover, through the ADS-R ground station it is possible to obtain on
the UAT link the data of aircraft transmitting on 1090 MHz link and vice versa:
messages are crosslink translated from UAT to 1090ES and from 1090ES to UAT
[66].
The existing mode S transponder supports a message type known as the
Extended Squitter (ES) message that may includes ADS-B data. ATC ground
station and aircraft equipped with TCAS already have the Mode S receiver and it
would be enhanced in order to support the ES information exchange according to
the TSO C–166B [67]. The technical link standards 1090ES does not support FIS-
B service due to the bandwidth limitations of ES. In Europe there is not a physical
layer for ADS-B and only the 1090ES link is used.
In both forms the position is updated, at least, once per second. There are
many benefits related to the introduction of ADS-B including the followings [68]:
• ADS-B implementation improves situational awareness of pilots and
air traffic controllers improving the shared information about the
surrounding traffic;
• Aircraft that uses UAT link can receive weather reports and weather
radar through FIS-B data;
• Aircraft that uses either UAT or 1090ES link can obtain NOTAMs
and others flight information;
• ADS-B ground stations are cheaper compared to primary and
secondary radar systems;
• ADS-B IN device is able to indicate traffic information with respect
to targets that may be located up to even 200 nautical miles far
awayfrom the device [69].
Chapter 2 Automatic Dependent Surveillance - Broadcast
24
2.3 ADS-B Messages and Reports
This section describes the information broadcasted through ADS-B OUT
devices according to REF DO-338 [67]. In the following it will be referred to
ADS-B Message to indicate a block of data, that is formatted and transmitted,
containing the information elements used to create ADS-B reports. On the other
hand, an ADS-B Report contains the information elements, assembled by an
ADS-B receiver, using messages received from a transmitting participant. Among
all types of reports that may be assembled by the ADS-B IN device the followings
will be considered:
• The Mode Status (MS) report contains operational information about
the transmitting participant;
• The State Vector (SV) report contains information about an aircraft
current kinematic state.
Reports may contain the following information:
1) Time of Applicability (TOA): it indicates the time at which the
reported values were valid. Time of Applicability is provided in all
reports. Note that the Time of Applicability of position
measurements (TOAp) may differ from the Time of Applicability of
velocity measurements (TOAv). The TOA field contains always the
TOAp. Also TOAp and TOAv are transmitted in SV report.
2) Identification:
- Call Sign/Flight ID: it is a message of 8 alphanumeric characters.
For aircraft not receiving ATS services and military aircraft it is
not required. It is reported in the MS report.
- Participant Address and Address Qualifier: this message is
necessary to differentiate a message transmitted by an A/V from
another A/V. Aircraft with Mode-S transponders using ICAO 24
bit address shall use the same one for ADS-B; another kind of
address is used otherwise. All A/Vs addresses must be unique in
the operational domain. The Address Qualifier message indicates
if the Address field contains the 24-bit ICAO address or another
Chapter 2 Automatic Dependent Surveillance - Broadcast
25
kind of address. Both Participant Address and Address Qualifier
are included in all ADS-B Reports.
- ADS-B Emitter Category: it is included in MS Report and it
describes the type of A/V (i.e. Light, Small Aircraft, Large
Aircraft).
- Mode 3/A Code: the ADS-B Transmitting Subsystem may have
the capability to disable the transmission of this information. The
broadcast of this information is only a transitional feature to
support ATC automation systems but may be removed in future.
3) A/V Length and Width Codes: these messages describe the amount
of space that an aircraft occupies. They are required to be transmitted
by aircraft above a certain size and they are included in the MS
report.
4) Position (it is included in the SV Report)
- Geometric position referenced to the WGS-84 ellipsoid
characterized by:
o Horizontal position (latitude and longitude);
o Geometric Height.
- Barometric Pressure Altitude;
5) Horizontal Velocity:
- Ground-referenced or geometric velocity: it is communicated in
the SV Report;
- Air-Referenced Velocity (ARV): it is communicate in the Air-
Referenced Velocity report (out of the scope of this work);
6) Vertical Rate: it is reported in the SV Report. One of the two types
of vertical rate (barometric and geometric) it is reported and it is
obtained from the best source.
7) Heading: it indicates the orientation of A/V and it is described as an
angle measured clockwise from magnetic north or true north ( the
reference direction is reported in the MS Report). The heading is
communicated in the SV Report and in the ARV report.
Chapter 2 Automatic Dependent Surveillance - Broadcast
26
8) Capability Class (CC) Code – used to indicate the capabilities of a
transmitting ADS-B participant:
- TCAS/ACAS Operational: the CC code shall be set to one if
the TCAS/ACAS system is operational, otherwise it shall be set
to zero;
- 1090 MHz ES Receiver Capability: the CC code for “1090ES
IN” shall be set to one if the transmitting aircraft has the
capability to receive ADS-B 1090ES Messages, otherwise zero;
- ARV Report Capability Flag;
- Target State (TS) Report Capability Flag;
- Trajectory Change (TC) Report Capability Level;
- UAT Receive Capability: the CC code for “UAT IN” shall be
set to zero if the aircraft is not fitted with the capability to
receive ADS-B UAT Messages; otherwise one;
- Other Capability Codes are expected to be defined in later
versions of the MASPS.
9) Operational Mode (OM) Codes – used to indicate the current
operating mode of a transmitting ADS-B participant.
- TCAS/ACAS Resolution Advisory Active Flag: the CC code
for “TCAS/ACAS Resolution Advisory Active” shall be set to
zero i it is certain that the TCAS II or ACAS computer is not
issuing a Resolution Advisory (RA); otherwise one.
- IDENT Switch: it is a one-bit field that is activated by an
IDENT switch. This flag shall be set to one for a period of 20±3
seconds, after it shall be reset to zero.
- Reserved For Receiving ATC Services Flag: it a one-bit OM
code and if it set to one indicates that the aircraft is receiving
ATC services; otherwise it is set to zero;
- Other Operational Mode Codes are expected to be defined in
later versions of the MASPS.
10) Navigation Integrity Category (NIC): it specifies an integrity
containment region. It is related to the Source Integrity Level (SIL)
Chapter 2 Automatic Dependent Surveillance - Broadcast
27
that specifies the probability of the reports horizontal position
exceeding the containment radius defined by the NIC without
alerting, assuming no avionics faults. It is reports in the SV Report.
11) Navigation Accuracy Category for Position (NACp): it is used to
describe the accuracy of position information in ADS-B Messages
and it reported in the MS Report.
12) Navigation Accuracy Category for Velocity (NACv): it is used to
describe the accuracy of velocity information in ADS-B Messages
and it reported in the MS Report.
13) Source Integrity Level (SIL): it specifies the probability of the
reports horizontal position exceeding the containment radius defined
by the NIC without alerting, assuming no avionics faults. This
probability is covered by the System Design Assurance (SDA)
parameter.
14) Barometric Altitude Integrity Code (NICBARO): it is a one-bit flag
that indicates if the barometric pressure altitude, in the SV Report,
has been cross-checked against another source of pressure altitude.
The NICBARO value is reported in the MS Report.
15) Emergency/Priority status: it is reported in MS Report.
16) Geometric Vertical Accuracy (GVA):it is a 2-bit field and it shall be
set by using the Vertical Figure of Merit (VFOM)(95%) from the
GNSS source used to report the geometric altitude.
17) TACAS/ACAS Resolution Advisory (RA) Data Block: the message
subfields are specified in RTCA DO-185B [19].
18) ADS-B Version Number: it is a 3-bit field that specify the ADS-B
Transmitting Subsystem Version.
19) Selected Altitude Type: it is a 1-bit field used to indicate the source
of Selected Altitude data.
20) MCP/FCU (Mode Control Panel/Flight Control Unit) or FMS (Flight
Management System) Selected Altitude Field: it is an 11-bit field
that shall contain either MCP/FCU Selected Altitude or FMS
Selected Altitude.
Chapter 2 Automatic Dependent Surveillance - Broadcast
28
21) Barometric Pressure Setting (Minus 800 millibars) Field;
22) Selected Heading Status Field;
23) Selected Heading Sign Field;
24) Selected Heading Field;
25) State of MCP/FCU Mode Bits;
26) Mode Indicator: Autopilot Engaged Field: it is a 1-bit field that is set
to zero if the Autopilot in not Engaged or Unknown; otherwise it is
set to one.
27) Mode Indicator: VNAV (Vertical Navigation) Mode Engaged Field:
it is a 1-bit field that is set to zero if the VNAV Mode is not Active
or Unknown; otherwise it is set to one.
28) Mode Indicator: Altitude Hold Mode Field: it is a 1-bit field that is
set to zero if the Altitude Hold Mode is not Active or Unknown;
otherwise it is set to one.
29) Mode Indicator: Approach Mode Field: it is a 1-bit field that is set to
zero if the Approach Mode is not Active or Unknown; otherwise it is
set to one.
30) Mode Indicator: LNAV (Lateral Navigation) Mode Field: it is a 1-bit
field that is set to zero if the LNAV Mode is not Active or Unknown;
otherwise it is set to one.
31) Single Antenna Flag (SAF): it is a 1-bit field that indicates if the
ADS-B transmitting Subsystem is operating with a single antenna
(the field is then set to one, otherwise to zero). The conventions shall
be applied both to Transponder-Based and Stand Alone ADS-B
Transmitting Subsystem.
32) System Design Assurance: it is a 2-bit field that shall define the
failure condition that the position transmission chain is designed to
support.
33) GPS Antenna Offset: it is an 8-bit field that define the position of the
GPS antenna in accordance with:
- Lateral Axis GPS Antenna Offset shall be used to encode the
lateral distance of the GPS Antenna from the longitudinal axis;
Chapter 2 Automatic Dependent Surveillance - Broadcast
29
- Longitudinal Axis GPS Antenna Offset shall be used to encode
the longitudinal distance of the GPS Antenna from the NOSE
of the Aircraft.
2.4 ADS-B Regulations
The use of ADS-B in the U.S. NAS for surveillance application has been
regulated by FAA in 2010 with some amendments to Part 91 [70]. In particular
the FAA published the Final Rule for ADS-B Out equipage and it mandates
performance requirements for ADS-B avionics that will be required to fly in
certain airspace by 1th
January 2020. Note that this rule does not mandate ADS-B
IN device: a new Aviation Rulemaking Committee (ARC) was expected in June
2010 to decide ADS-B IN strategy. The designed frequencies are:
• 1090 MHz Extended Squitter (1090ES) for commercial aircraft and
for all aircraft flying in Class A airspace (Flight Level 180 and
above);
• Universal Access Transceiver 978 MHz (UAT) for general aviation
and airport vehicles.
The final rule defines also the airspace where the ADS-B OUT will be
mandated.
Since 2009, several standards and guidance have been published.
Regarding ICAO documents there are:
• ICAO DOC 9871 Technical Provisions for Mode S Services and
External Squitter [71];
• ICAO DOC 9861 Manual on the Universal Access Transceiver
(UAT) [72].
The FAA provided the following Advisory Circulars:
• AC 20-165 Airworthiness Approval of Automatic Dependent
Surveillance - Broadcast (ADS-B) Out Systems [73];
• AC 90-114 Automatic Dependent Surveillance-Broadcast (ADS-B)
Operations [74];
• AC 150/5220-26 Airport Ground Vehicle Automatic Dependent
Surveillance – Broadcast (ADS-B) Out Squitter Equipment [75];
Chapter 2 Automatic Dependent Surveillance - Broadcast
30
• AC 20-172A Airworthiness Approval for ADS-B In Systems and
Applications [76].
The Technical Standard Order relate to the ADS-B service are:
• TSO-C166b Extended Squitter Automatic Dependent Surveillance -
Broadcast (ADS-B) and Traffic Information Service - Broadcast
(TIS-B) Equipment Operating on the Radio Frequency of 1090
Megahertz (MHz) [67];
• TSO-C154c, Universal Access Transceiver (UAT) Automatic
Dependent Surveillance Broadcast (ADS-B) Equipment Operating
on Frequency of 978 MHz [77];
• TSO-C195a, Avionics Supporting Automatic Dependent
Surveillance – Broadcast (ADS-B) Aircraft Surveillance
Applications (ASA) [78];
Concerning the RTCA documents there are:
• RTCA DO-260B Minimum Operational Performance Standards for
1090 MHz Extended Squitter Automatic Dependent Surveillance -
Broadcast (ADS-B) and Traffic Information Services - Broadcast
(TIS-B) [79];
• RTCA DO-282B Minimum Operational Performance Standards for
Universal Access Transceiver (UAT) Automatic Dependent
Surveillance - Broadcast (ADS-B) [80];
• RTCA DO-317B Minimum Operational Performance Standards
(MOPS) for Aircraft Surveillance Applications (ASA) System [81];
• RTCA DO-249 Development and Implementation Planning Guide
for Automatic Dependent Surveillance Broadcast (ADS-B)
Applications [82];
• RTCA DO-242A Minimum Aviation System Performance Standards
for Automatic Dependent Surveillance Broadcast (ADS-B) [83];
• RTCA DO-338 Minimum Aviation System Performance Standards
(MASPS) for ADS-B Traffic Surveillance Systems and Applications
(ATSSA) [66];
These and others documents can be found in [84].
Chapter 2 Automatic Dependent Surveillance - Broadcast
31
ADSB-Out application in the Europe has been regulated with UE 1207/2011 [85].
2.5 Realities and Challenges in ADS-B system
Starting from 2020 FAA, as well as EUROCONTROL, have mandated
ADS-B OUT in all aircraft as part of next generation air transportation systems
NextGen and SESAR. The employment of such a system may lead several
advantages such as [86]:
• Optimization of runway control/taxing improving the handling of
aircraft on the ground (their position is known with high precision);
• Improvement of accuracy and ATC safety during take-off and
landing;
• Reduction of mid-air collision risk;
• Introduction of UAV in NAS permitting the SAA function with high
precision.
Nevertheless, a lot of challenges still remains related to the integration of
ADS-B system.
An analysis carried out by Strohmeier et al. in [87], identified two relevant
problems:
• In dense airspace the ADS-B system is affected by message
collisions, especially when only the 1090 MHz link is used (i.e. in
Europe). The message collisions causes the most high loss rate: with
few aircraft the loss rate is of about 10 percent but it rises over 45
percent with 60 ADS-B transmitter participants. This is due to the
fact that not only Ads-B operates on 1090 MHz link and a solution
would be improving the channel capacity.
• There are security issues related to ADS-B. In fact, ADS-B is an
open-source and it is susceptible to radio frequency attack as
reported in [88]÷[90]. For example it is possible to modify the
aircraft virtual trajectory, delete all ADS-B messages sent by a
particular aircraft or modify the identifier of a particular aircraft.
Chapter 2 Automatic Dependent Surveillance - Broadcast
32
A solution to these problems can be found in [91]: a means to increase the
bandwidth capacity, through a modification of access and access protocol, is
proposed together with a means for protection of flight path in terms of
authentication and encryption on the data link.
Further analysis on the limitations of the ADS-B technology for the
application on unmanned aerial systems has been carried out in [92], where the
use of ADS-B based only surveillance on-board of small remotely piloted vehicles
is considered not suitable and the fusion with electro-optical sensors is suggested
as mostly mandatory.
More in particular a detailed analysis on the challenges related to a SAA
system based on the displayed ADS-B data is reported in [93]. First of all
requirements on the position quality have to been established. In fact, although
some performance requirements are stated in DO-317B for some application, such
as the enhanced visual acquisition, the performance for a SAA system must have
superior. Moreover, the position information will not be available for aircraft not
equipped with ADS-B or from aircraft that do not meet accuracy and integrity
requirements. Also the data coming from the ground stations suffers problems
such as availability, that may be limited in several ways, and low quality related
mostly on the rebroadcast of data. Also the ADS-B receiver and message
processing requirements have to be defined with an high level of design in order
to assure the required level of safety. Finally also the availability and quality of
ownship data and the Surveillance Processing are critical in the use of ADS-B
data because all the surveillance and the relevant ownship data comes together to
be processed for display and application-specific functions. Requirements have to
be defined too. Nevertheless, it is reported that “The FAA has plans to expand the
capability of ADS-B to include more advanced applications using delegated
separation and/or collision avoidance. […] This work plan recognizes the need for
development of increasingly complex ADS-B traffic applications from “Traffic
Situation Awareness with Alerts” to “ADS-B Integrated Collision Avoidance”
and even “Self Separation””.
Capitolo 3 System and Software Architecture
33
Chapter 3
System Description
3.1 Introduction
The ADS-B surveillance data can be used as input for conflict detection
algorithms in order to support future self-separation as well as collision avoidance
systems. In particular the proposed conflict detection algorithm is based on the
received data, of all ADS-B Out equipped aircraft, by the on-board ADS-B In
device.
The overall proposed system architecture aims to manage the ADS-B raw
data in order to provide the on-board application, with an usable structured
database with all the available information about the surrounding traffic. The such
obtained information is sent to a conflict detection algorithm and, subsequently,
the tracks are prioritized in terms of the most relevant threat. The obtained data
can be send to a CDTI display to support the pilot, incrementing the situational
awareness, or can be used for conflict resolution algorithms.
It is worth to note that, the proposed system, for tests scope, has been
involved in a conflict resolution architecture for an unmanned aircraft but, as
mentioned before, it can be used also in manned applications. The conflict
resolution module is out of the scope of this work.
In order to test the developed system a model of the software has been
implemented in Matlab and Simulink R2009A.
3.2 Software Architecture description
The functional architecture of the proposed system is reported in Figure 3.1.
The four main module are:
• Surveillance Processing Module;
Capitolo 3
• Coarse Filter Module;
• Conflict Detection Module;
• Prioritization Module.
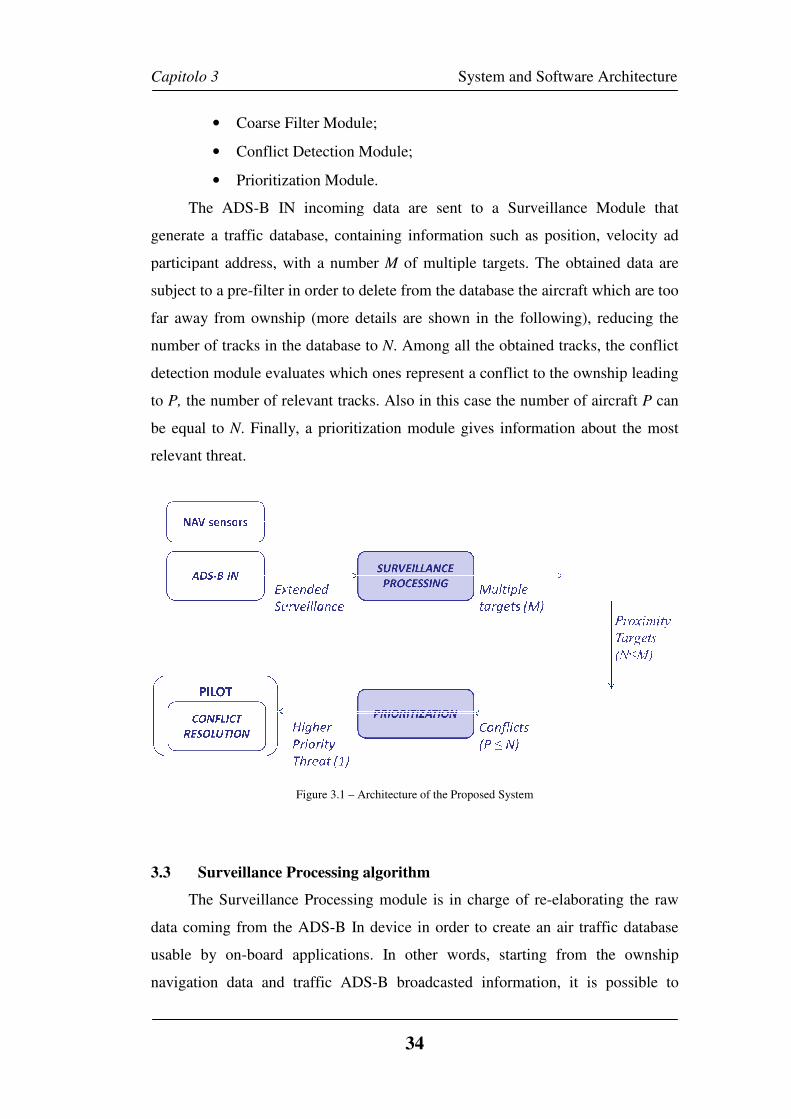
The ADS-B IN incoming data are sent
generate a traffic database, containing information such as position, velocity ad
participant address, with a number
subject to a pre-filter in order to delete from the database the aircraft which are too
far away from ownship (more details are shown in the following), reducing the
number of tracks in the database to
detection module evaluates which ones represent a conflict to the ownship leading
to P, the number of relevant tracks. Also in this case the number of aircraft
be equal to N. Finally, a prioritization module gives
relevant threat.
3.3 Surveillance Processing
The Surveillance Processing module i
data coming from the ADS
usable by on-board applications
navigation data and traffic ADS
Capitolo 3 System and Software Architecture
34
Coarse Filter Module;
Conflict Detection Module;
Prioritization Module.
B IN incoming data are sent to a Surveillance Module that
generate a traffic database, containing information such as position, velocity ad
participant address, with a number M of multiple targets. The obtained data are
filter in order to delete from the database the aircraft which are too
far away from ownship (more details are shown in the following), reducing the
the database to N. Among all the obtained track
detection module evaluates which ones represent a conflict to the ownship leading
the number of relevant tracks. Also in this case the number of aircraft
. Finally, a prioritization module gives information
Figure 3.1 – Architecture of the Proposed System
Surveillance Processing algorithm
Surveillance Processing module is in charge of re-elaborating
data coming from the ADS-B In device in order to create an air traffic
board applications. In other words, starting from
navigation data and traffic ADS-B broadcasted information, it is possible to
System and Software Architecture
to a Surveillance Module that
generate a traffic database, containing information such as position, velocity ad
of multiple targets. The obtained data are
filter in order to delete from the database the aircraft which are too
far away from ownship (more details are shown in the following), reducing the
ll the obtained tracks, the conflict
detection module evaluates which ones represent a conflict to the ownship leading
the number of relevant tracks. Also in this case the number of aircraft P can
information about the most
elaborating the raw
n air traffic database
, starting from the ownship
B broadcasted information, it is possible to
Capitolo 3 System and Software Architecture
35
generate a traffic state file database easily usable by the pilot or other applications.
The implemented Surveillance Processing functionalities are based on RTCA-
317A Appendix C specifications [94] but they are adapted to be useful in the
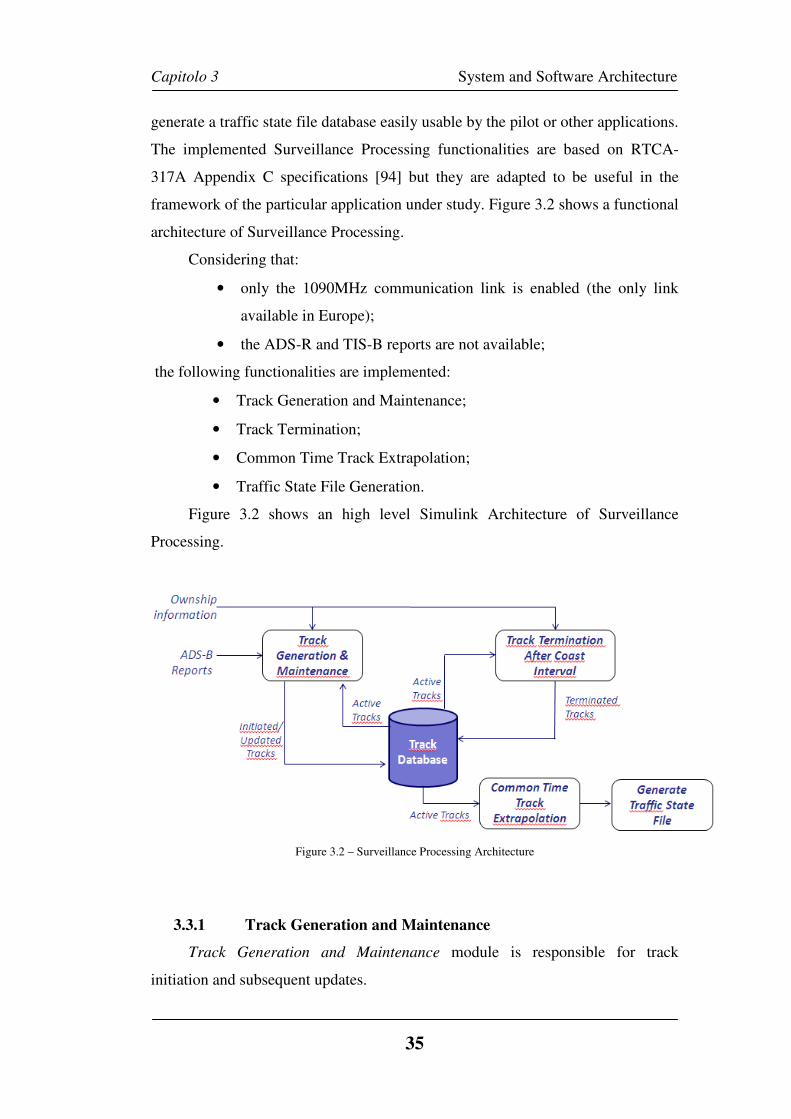
framework of the particular application under study. Figure 3.2 shows a functional
architecture of Surveillance Processing.
Considering that:
• only the 1090MHz communication link is enabled (the only link
available in Europe);
• the ADS-R and TIS-B reports are not available;
the following functionalities are implemented:
• Track Generation and Maintenance;
• Track Termination;
• Common Time Track Extrapolation;
• Traffic State File Generation.
Figure 3.2 shows an high level Simulink Architecture of Surveillance
Processing.
Figure 3.2 – Surveillance Processing Architecture
3.3.1 Track Generation and Maintenance
Track Generation and Maintenance module is responsible for track
initiation and subsequent updates.
Capitolo 3 System and Software Architecture
36
The module operates differently based on the received report type.
Upon a reception of a Mode Status report, the module searches, into a
database, for a stored track with the same 24-bit address:
• If no match is found the report shall be discarded;
• If a match is found NACp, NACv, and SIL values, and the other variables
related to Mode Status report, in the track shall be updated with the values
in the report.
The logic adopted when a State Vector report is received, is shown in high level
flow chart in
Figure 3.3 - SV report reception - high level flow chart of generation and maintenance module
.
Upon a reception of a State Vector report, the module search for a stored track
with the same 24-bit address as the report; there are two possible ways to operate:
1. If no match is found a new track could be generated. To generate a new
track, the sentences a. and b. shall be both verified:
a. The measurements in the reports shall be valid:
i. if the target is airborne, the validity flags of Geometric
Altitude, Horizontal Position, Vertical Rate and Horizontal
Velocity are considered;
ii. if the target is on the ground the validity flags of Geometric
Altitude, Horizontal Position, and Ground Speed are
considered;
b. Two consecutive reports of the same track shall correlate: upon
the reception of a new report, the latter is recorded but not stored
into the database. If a consecutively incoming report correlates
with the first, according to the same validation and correlation
criterion used for the updating of a track into the database and
discussed in the following, the new track is generated and stored
into the database. Otherwise, the first report is discarded and the
incoming one is recorded without generating a new track.
When a new track is generated track it is automatically validated and can be
considered as reference track for the incoming new reports.
Capitolo 3 System and Software Architecture
37
2. If a match is found, and the track has been previously validated, the
validity of the incoming report is checked, as shown in paragraph 3.3.1.1.
If the report validity checks are passed, the module could update an
existing track state component through the state assembly function,
otherwise the report is rejected.
The assembly function could generate a filtered state vector through
position or velocity measurements:
• if the target position measurements and velocity measurements are
valid the generation and maintenance module could update the state
vector through position or velocity measurements based on the most
recent measurement;
• if the target position measurements are valid but the Velocity
Measurements are invalid, the module could generate an assembled
state vector through position measurements;
• if the target Velocity Measurements are valid but the Position
measurements are invalid, the module could generate an assembled
state vector through velocity measurements.
In any of the previous cases, to effectively generate an assembled state
vector, the measurement time of applicability, of the position or velocity
depending on the case, shall be greater than the time of applicability of the
stored track but lower than the time of applicability of ownship
measurement data. Simultaneously the assembled state vector calculation,
also the assembled uncertainties are computed on the basis of the
uncertainties related to the measurements and the ones related to the stored
track. The state filtering equation are presented in the paragraphs 3.3.1.2.2
and 0. It is worth nothing that, when a match is found the stored track
position and velocity are extrapolated to the time of applicability of the
incoming report according to the paragraph 3.3.1.2.
If none of the previous condition is verifies the report is discarded and it is
not considered for update.
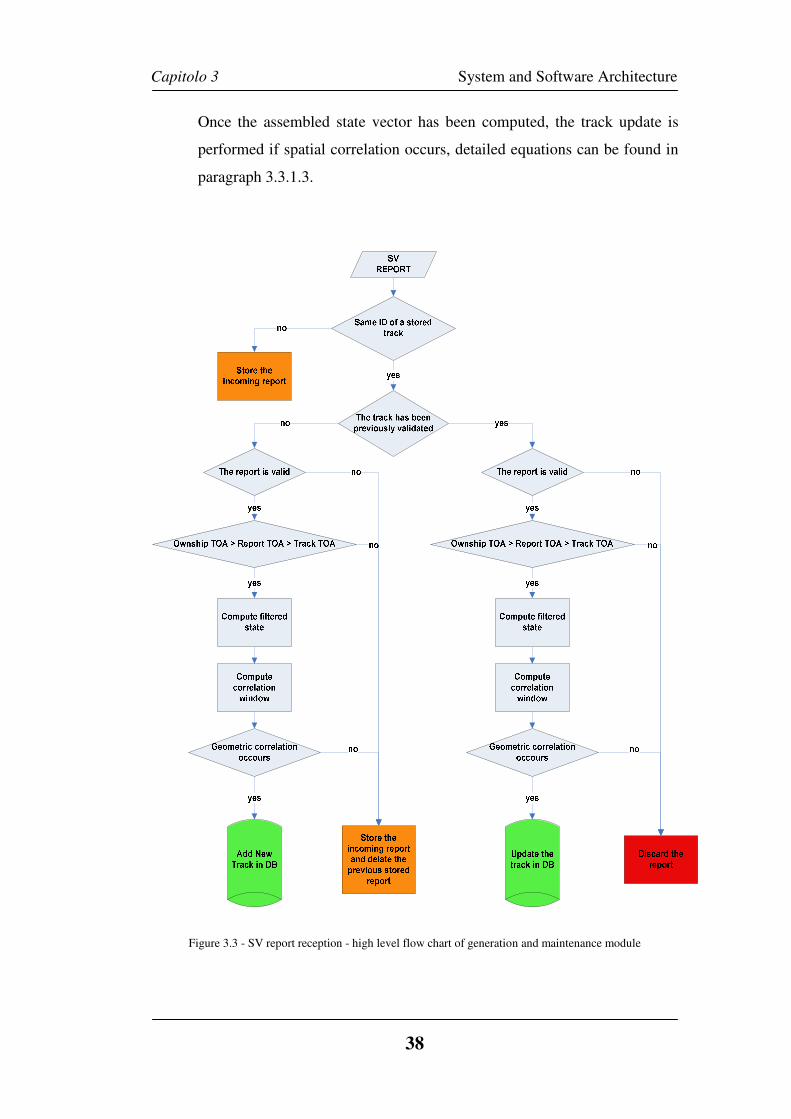
Capitolo 3 System and Software Architecture
38
Once the assembled state vector has been computed, the track update is
performed if spatial correlation occurs, detailed equations can be found in
paragraph 3.3.1.3.
Figure 3.3 - SV report reception - high level flow chart of generation and maintenance module
Capitolo 3 System and Software Architecture
39
Therefore, if spatial correlation occurs the module updates the track and in
particular the state vector and uncertainties with the assembled state and
assembled uncertainties, the time of applicability of the stored track with
the time of applicability used to generate the assembled state, and all the
other variables related to the State Vector report with the values in the
report.
If spatial correlation fails the state vector report is discarded.
3.3.1.1 Reports validity checks
The performed report validity checks are different based on the indication of
validity flag of the incoming measurements:
1. If position measurements and velocity measurements are valid the module
performs an horizontal velocity validation, an horizontal position
validation and a vertical position validation.
2. If the report contains only valid position measurements the horizontal
position validation and vertical position validation are performed.
3. Finally if only velocity measurements are valid the horizontal velocity
validation is performed.
The report validation criteria, according to RTCA 317 [94] Appendix D, are the
following.
Horizontal velocity validation
TAVVV u ⋅+⋅<− 201 (1)
Where, considering an ENU reference frame:
• 0V is the last validated velocity on the horizontal plane;
• 1V is the velocity on the horizontal plane, contained in the report to be
validated;
• uV is the velocity uncertainty;
• A is assumed to be 14.7 m/s2 as reported in [94] Appendix D;
• T is the time difference between the incoming report and the last validated
velocity report.
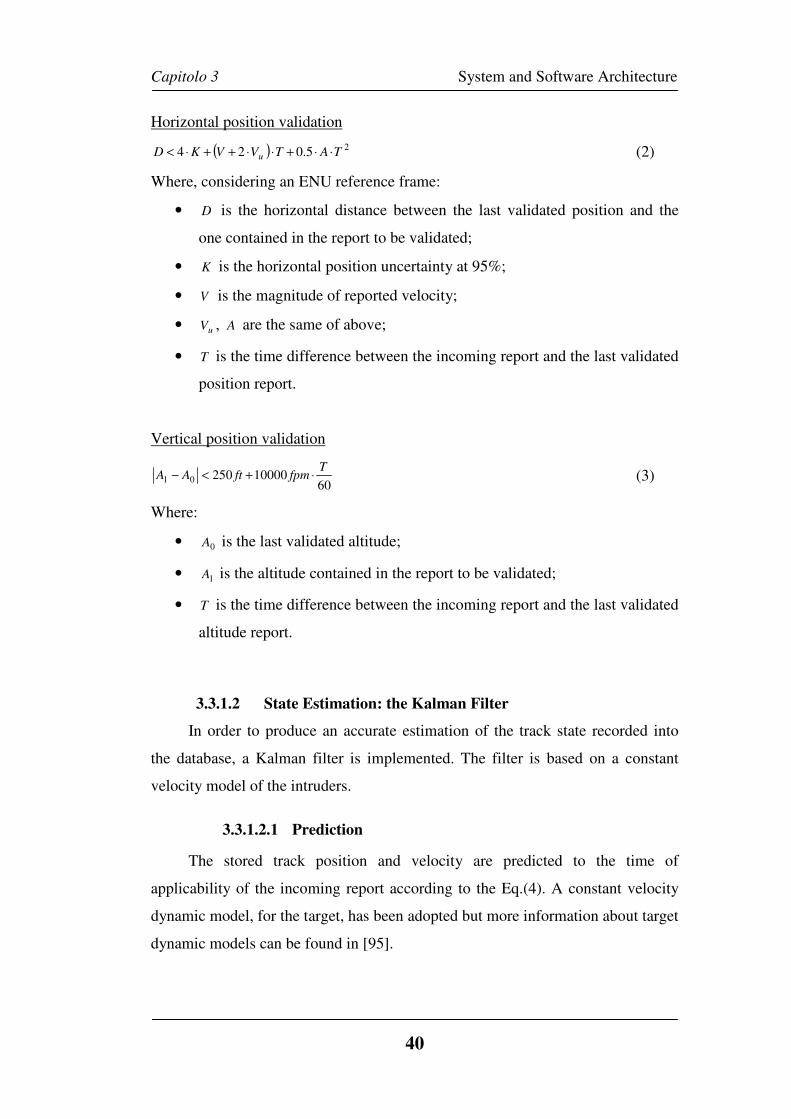
Capitolo 3 System and Software Architecture
40
Horizontal position validation
( ) 25.024 TATVVKD u ⋅⋅+⋅⋅++⋅< (2)
Where, considering an ENU reference frame:
• D is the horizontal distance between the last validated position and the
one contained in the report to be validated;
• K is the horizontal position uncertainty at 95%;
• V is the magnitude of reported velocity;
• uV , A are the same of above;
• T is the time difference between the incoming report and the last validated
position report.
Vertical position validation
601000025001
TfpmftAA ⋅+<− (3)
Where:
• 0A is the last validated altitude;
• 1A is the altitude contained in the report to be validated;
• T is the time difference between the incoming report and the last validated
altitude report.
3.3.1.2 State Estimation: the Kalman Filter
In order to produce an accurate estimation of the track state recorded into
the database, a Kalman filter is implemented. The filter is based on a constant
velocity model of the intruders.
3.3.1.2.1 Prediction
The stored track position and velocity are predicted to the time of
applicability of the incoming report according to the Eq.(4). A constant velocity
dynamic model, for the target, has been adopted but more information about target
dynamic models can be found in [95].
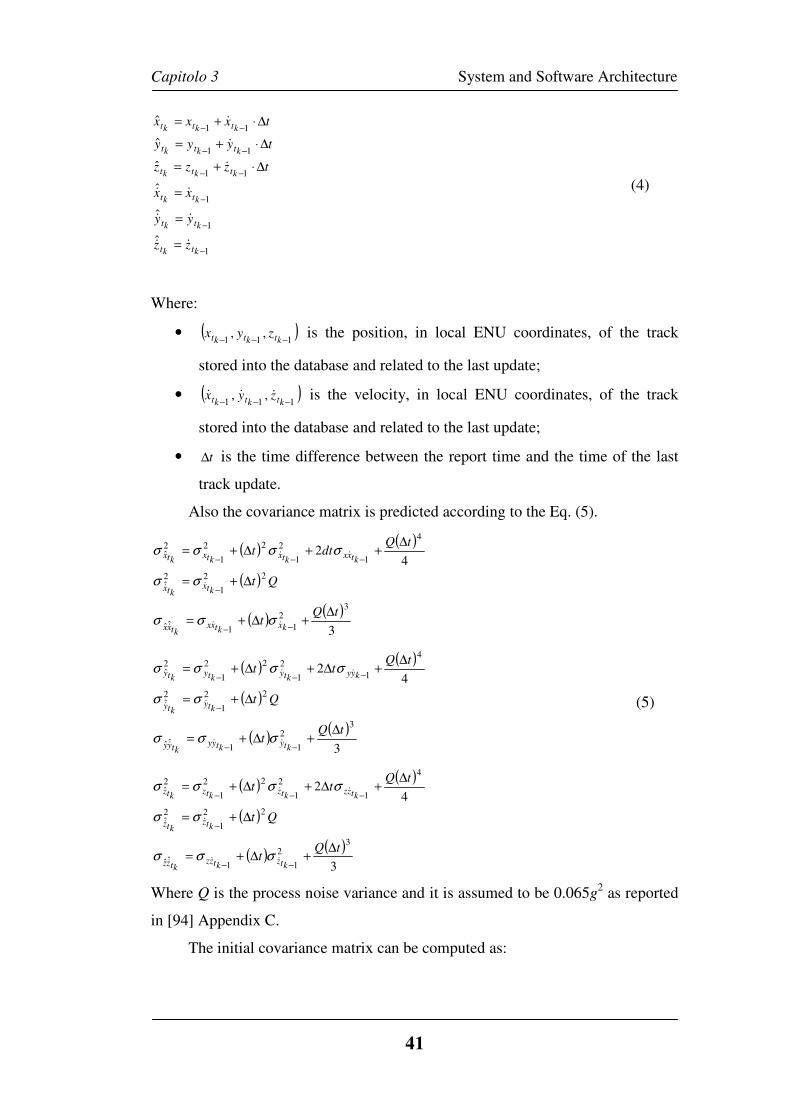
Capitolo 3 System and Software Architecture
41
1
1
1
11
11
11
ˆ
ˆ
ˆ
ˆ
ˆ
ˆ
−
−
−
−−
−−
−−
=
=
=
∆⋅+=
∆⋅+=
∆⋅+=
ktkt
ktkt
ktkt
ktktkt
ktktkt
ktktkt
zz
yy
xx
tzzz
tyyy
txxx
&&
&&
&&
&
&
&
(4)
Where:
• ( )111
,,−−− ktktkt
zyx is the position, in local ENU coordinates, of the track
stored into the database and related to the last update;
• ( )111
,,−−− ktktkt
zyx &&& is the velocity, in local ENU coordinates, of the track
stored into the database and related to the last update;
• t∆ is the time difference between the report time and the time of the last
track update.
Also the covariance matrix is predicted according to the Eq. (5).
( )( )
( )
( )( )3
42
32
11ˆˆ
22
1
2ˆ
4
1
2
1
22
1
2ˆ
tQt
Qt
tQdtt
kxkt
xxkt
xx
ktx
ktx
ktxx
ktx
ktx
ktx
∆+∆+=
∆+=
∆++∆+=
−−
−
−−−
&&&
&&
&&
σσσ
σσ
σσσσ
( )( )
( )
( )( )3
42
32
11ˆˆ
22
1
2ˆ
4
1
2
1
22
1
2ˆ
tQt
Qt
tQtt
kty
ktyy
ktyy
kty
kty
kyykt
ykt
ykt
y
∆+∆+=
∆+=
∆+∆+∆+=
−−
−
−−−
&&&
&&
&&
σσσ
σσ
σσσσ
( )( )
( )
( )( )3
42
32
11ˆˆ
22
1
2ˆ
4
1
2
1
22
1
2ˆ
tQt
Qt
tQtt
ktz
ktzz
ktzz
ktz
ktz
ktzz
ktz
ktz
ktz
∆+∆+=
∆+=
∆+∆+∆+=
−−
−
−−−
&&&
&&
&&
σσσ
σσ
σσσσ
(5)
Where Q is the process noise variance and it is assumed to be 0.065g2 as reported
in [94] Appendix C.
The initial covariance matrix can be computed as:
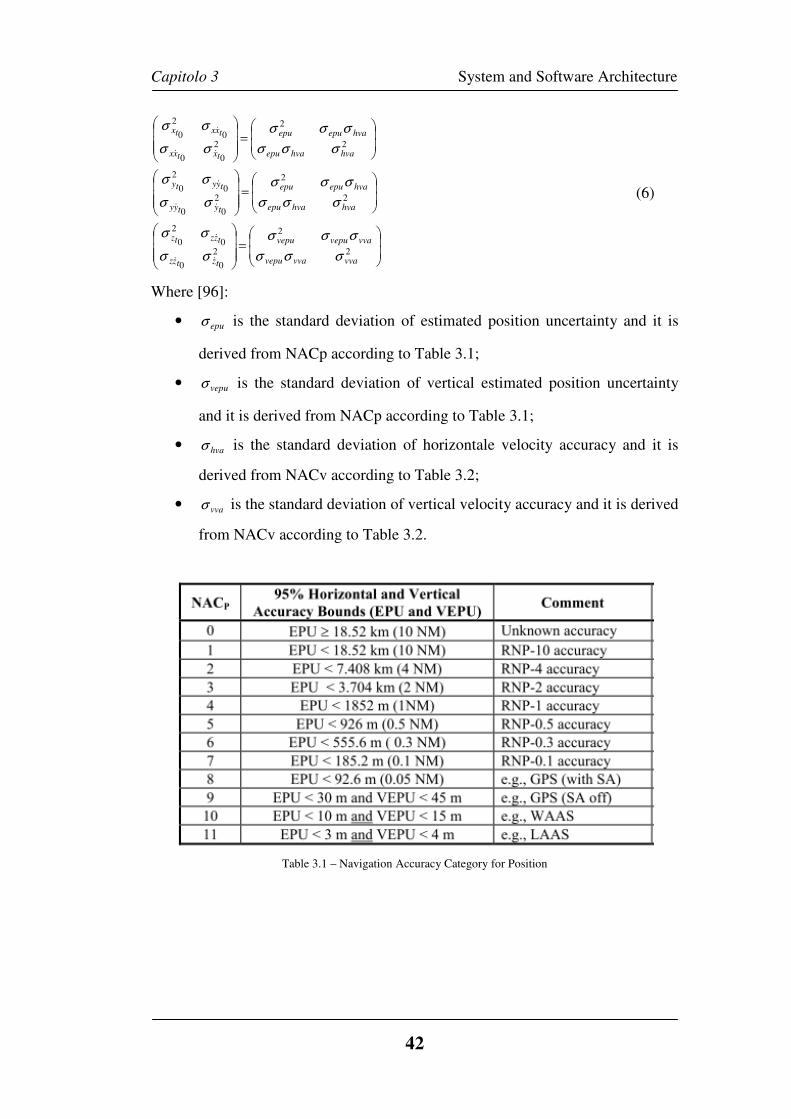
Capitolo 3 System and Software Architecture
42
=
=
=
2
2
2
00
0
2
0
2
2
2
00
0
2
0
2
2
2
00
0
2
0
vvavvavepu
vvavepuvepu
tztzz
tzztz
hvahvaepu
hvaepuepu
tytyy
tyyty
hvahvaepu
hvaepuepu
txtxx
txxtx
σσσ
σσσ
σσ
σσ
σσσ
σσσ
σσ
σσ
σσσ
σσσ
σσ
σσ
&&
&
&&
&
&&
&
(6)
Where [96]:
• epuσ is the standard deviation of estimated position uncertainty and it is
derived from NACp according to Table 3.1;
• vepuσ is the standard deviation of vertical estimated position uncertainty
and it is derived from NACp according to Table 3.1;
• hvaσ is the standard deviation of horizontale velocity accuracy and it is
derived from NACv according to Table 3.2;
• vvaσ is the standard deviation of vertical velocity accuracy and it is derived
from NACv according to Table 3.2.
Table 3.1 – Navigation Accuracy Category for Position
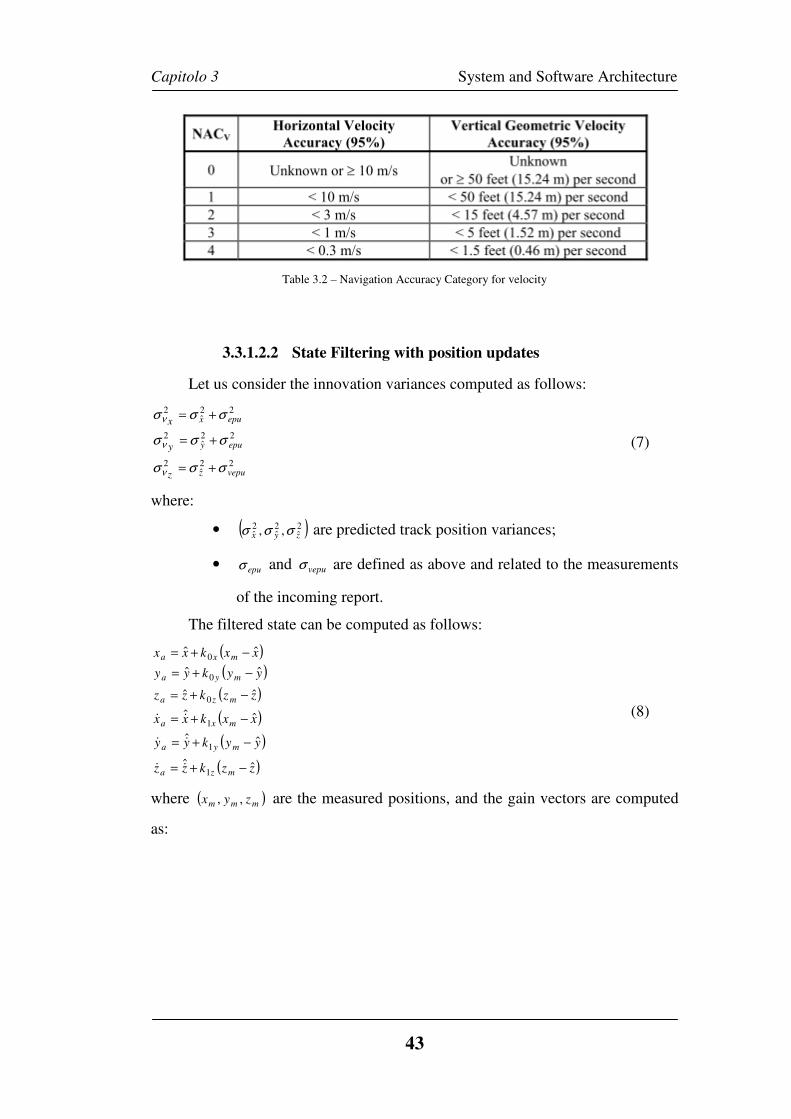
Capitolo 3 System and Software Architecture
43
Table 3.2 – Navigation Accuracy Category for velocity
3.3.1.2.2 State Filtering with position updates
Let us consider the innovation variances computed as follows:
22ˆ
2
22ˆ
2
22ˆ
2
vepuz
epuy
epux
z
y
x
σσσ
σσσ
σσσ
ν
ν
ν
+=
+=
+=
(7)
where:
• ( )2ˆ
2ˆ
2ˆ ,, zyx σσσ are predicted track position variances;
• epuσ and vepuσ are defined as above and related to the measurements
of the incoming report.
The filtered state can be computed as follows:
( )( )
( )
( )
( )
( )zzkzz
yykyy
xxkxx
zzkzz
yykyy
xxkxx
mza
mya
mxa
mza
mya
mxa
ˆˆ
ˆˆ
ˆˆ
ˆˆ
ˆˆ
ˆˆ
1
1
1
0
0
0
−+=
−+=
−+=
−+=
−+=
−+=
&&
&&
&& (8)
where ( )mmm zyx ,, are the measured positions, and the gain vectors are computed
as:
Capitolo 3 System and Software Architecture
44
2
ˆˆ12
2ˆ
0
2
ˆˆ
12
2ˆ
0
2
ˆˆ12
2ˆ
0
;
;
;
zz
yy
xx
zzy
zz
yy
y
y
y
xxx
xx
kk
kk
kk
νν
νν
νν
σ
σ
σ
σ
σ
σ
σ
σ
σ
σ
σ
σ
&
&
&
==
==
==
(9)
Also the assembled state covariance matrices are computed according to Eq.10-
12.
( )( )
xxxxax
xxxaxx
xxxa
k
k
k
ˆˆ12ˆ
2
ˆˆ0
2ˆ0
2
1
1
&&&
&&
σσσ
σσ
σσ
−=
−=
−=
(10)
( )( )
yyyyay
yyyayy
yyya
k
k
k
ˆˆ12ˆ
2
ˆˆ0
2ˆ0
2
1
1
&&&
&&
σσσ
σσ
σσ
−=
−=
−=
(11)
( )( )
zzzzaz
zzzazz
zzza
k
k
k
ˆˆ12ˆ
2
ˆˆ0
2ˆ0
2
1
1
&&&
&&
σσσ
σσ
σσ
−=
−=
−=
(12)
3.3.1.2.3 State Filtering with velocity updates
In the case of velocity updates, the innovation variances can be computed as
follows:
22ˆ
2
22ˆ
2
22ˆ
2
vvaz
hvay
hvax
z
y
x
σσσ
σσσ
σσσ
ν
ν
ν
+=
+=
+=
&
&
&
(13)
where:
• ( )2ˆ
2ˆ
2ˆ ,,
zyx &&&σσσ are extrapolated track velocity variances;
• hvaσ and vvaσ are defined as above.
As in the previous case, it is possible to define the gain vectors as:
Capitolo 3 System and Software Architecture
45
2
2ˆ
12
ˆˆ0
2
2ˆ
12
ˆˆ
0
2
2ˆ
12
ˆˆ0
;
;
;
zz
yy
xx
zx
zzz
y
y
yy
y
xx
xxx
kk
kk
kk
νν
νν
νν
σ
σ
σ
σ
σ
σ
σ
σ
σ
σ
σ
σ
&&
&&
&&
==
==
==
(14)
The filtered status and covariances are computed as shown in Eq. 15-18.
( )( )
( )( )( )
( )zzkzz
yykyy
xxkxx
zzkzz
yykyy
xxkxx
mza
mya
mxa
mza
mya
mxa
ˆˆ
ˆˆ
ˆˆ
ˆˆ
ˆˆ
ˆˆ
1
1
1
0
0
0
&&&&
&&&&
&&&&
&&
&&
&&
−+=
−+=
−+=
−+=
−+=
−+=
(15)
( )
( ) 2ˆ1
2
ˆˆ1
ˆˆ02ˆ
2
1
1
xxax
xxxaxx
xxxxxa
k
k
k
&&
&&
&
σσ
σσ
σσσ
−=
−=
−=
(16)
( )
( ) 2ˆ1
2
ˆˆ1
ˆˆ02ˆ
2
1
1
yyay
yyyayy
yyyyya
k
k
k
&&
&&
&
σσ
σσ
σσσ
−=
−=
−=
(17)
( )
( ) 2ˆ1
2
ˆˆ1
ˆˆ02ˆ
2
1
1
zzaz
zzzazz
zzzzza
k
k
k
&&
&&
&
σσ
σσ
σσσ
−=
−=
−=
(18)
where ( )mmm zyx &&& ,, are the measured velocities.
3.3.1.3 Spatial Correlation
In order to ensure that the incoming report represents an updated
measurement of the stored track, a spatial correlation test is performed. The
spatial correlation window is computed based on an estimated maximum distance
Capitolo 3 System and Software Architecture
46
between two positions. In particular is possible to estimate the maximum
horizontal ( hr ) and vertical ( vr ) distances between the filtered and the track
position; note that in Eq.16 'epuσ and '
vepuσ are computed through Table 3.1 using
NACp-1.
Therefore, the spatial correlation is proved if hh rd < and vv rd < where:
• ( ) ( )22yyxxd aah −+−= is the horizontal distance between filtered
and track horizontal position;
• zzd av −= is the vertical distance between filtered and track
horizontal position.
3.3.2 Track Termination algorithm
The Track Termination function deletes from the database, the tracks whose
time of applicability of the last correlated report is higher than a predefined
threshold. The threshold used in this application is 15s according to TSAA target
discontinuation threshold [97]-[98].
Moreover, this time interval is the needed time to exit the safety bubble in
the hypothesis that the intruder aircraft need to cover the max dimension of the
safety bubble. This statement will be better explained in paragraph 3.5.1.
3.3.3 Common Time Track Extrapolation algorithm
The Common Time Track Extrapolation function extrapolates all the track,
recorded into the database, at a common time of applicability. In particular, all the
tracks are extrapolated at ownship data time of applicability. In this way the
position and velocities of the surrounding aircraft are updated to the current time
and can provide the pilot, CDTI or any other application, with the most recent
data. The extrapolation process is performed assuming that the tracks are moving
with constant velocity:
dtzzz
dtyyy
dtxxx
tt
tt
tt
&
&
&
+=
+=
+=
(19)
Capitolo 3 System and Software Architecture
47
t
t
t
zz
yy
xx
&&
&&
&&
=
=
=
(20)
where:
• ( )zyx ,, are the tracks extrapolated positions;
• ( )zyx &&& ,, are the tracks extrapolated velocities;
• dt is the time difference between the ownship data time of applicability
and the last updated time of applicability of the tracks.
3.3.4 Traffic state file generation algorithm
The Traffic state file generation function adapts the database in order to
remove from database all the information not needed for the specific application
under study. In other words, among all the information communicated by the
ADS-B device only a subset is maintained. For this application the saved
information is:
• target latitude, longitude and geometric altitude;
• target Participant address;
• target north velocity, east velocity and vertical rate;
• target data time of applicability;
• number of stored reports.
3.4 Coarse Filtering algorithm
As mentioned in the previous Chapter, the ADS-B In device can receive
information about aircraft that may be located vary far from the ownship up to 40
nautical miles. Of course if the distance is too large the targets should not
represent a real possible threat for the ownship but in the case of separation and of
a possible conflict.
For this reason the Coarse filtering function is in charge to delete from
database all the aircraft which are far from the ownship more than a predefined
threshold. However the threshold cannot be excessively reduced due to the need
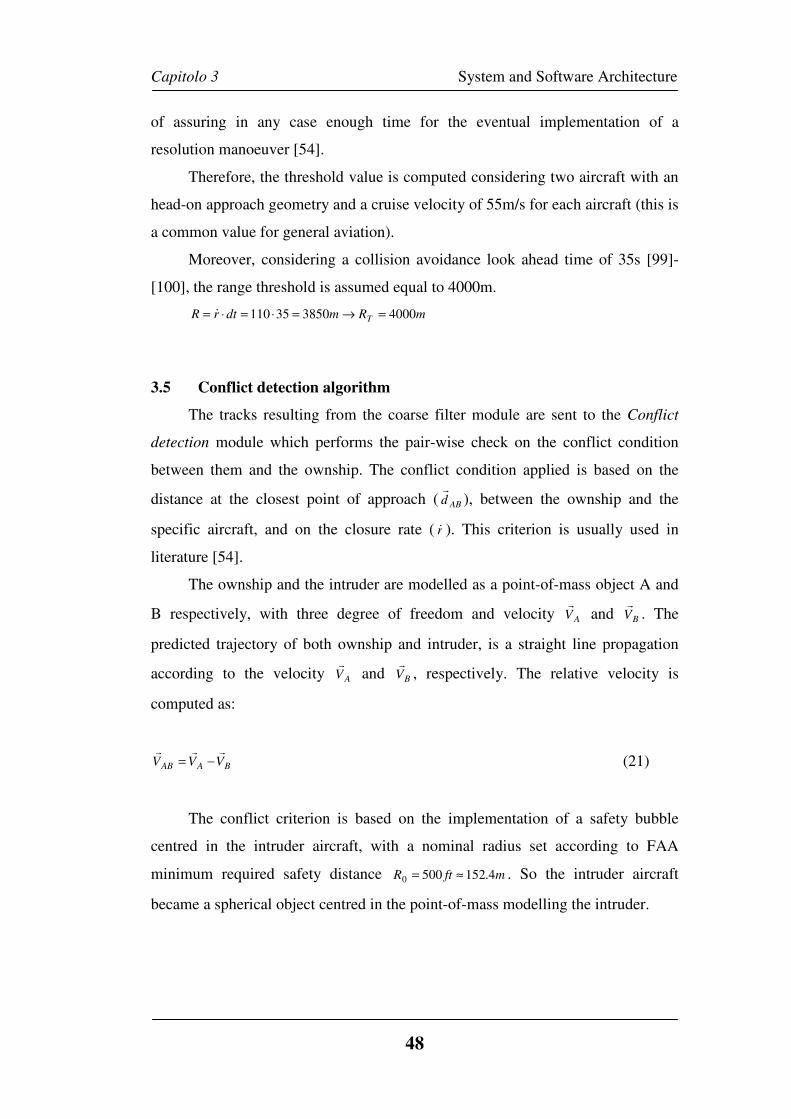
Capitolo 3 System and Software Architecture
48
of assuring in any case enough time for the eventual implementation of a
resolution manoeuver [54].
Therefore, the threshold value is computed considering two aircraft with an
head-on approach geometry and a cruise velocity of 55m/s for each aircraft (this is
a common value for general aviation).
Moreover, considering a collision avoidance look ahead time of 35s [99]-
[100], the range threshold is assumed equal to 4000m.
mRmdtrR T 4000385035110 =→=⋅=⋅= &
3.5 Conflict detection algorithm
The tracks resulting from the coarse filter module are sent to the Conflict
detection module which performs the pair-wise check on the conflict condition
between them and the ownship. The conflict condition applied is based on the
distance at the closest point of approach ( ABdr
), between the ownship and the
specific aircraft, and on the closure rate ( r& ). This criterion is usually used in
literature [54].
The ownship and the intruder are modelled as a point-of-mass object A and
B respectively, with three degree of freedom and velocity AVr
and BVr
. The
predicted trajectory of both ownship and intruder, is a straight line propagation
according to the velocity AVr
and BVr
, respectively. The relative velocity is
computed as:
BAAB VVVrrr
−= (21)
The conflict criterion is based on the implementation of a safety bubble
centred in the intruder aircraft, with a nominal radius set according to FAA
minimum required safety distance mftR 4.1525000 ≈= . So the intruder aircraft
became a spherical object centred in the point-of-mass modelling the intruder.
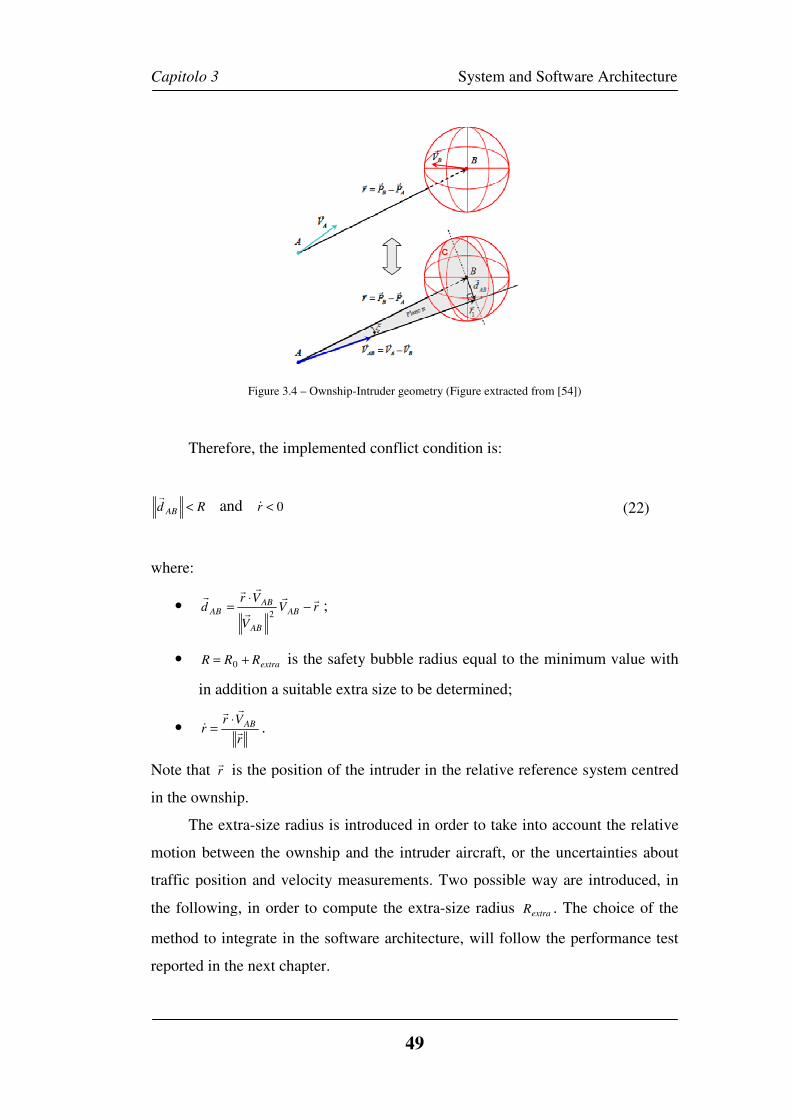
Capitolo 3
Figure 3
Therefore, the implemented conflict condition is:
Rd AB <r
and 0<r&
where:
• V
V
Vrd
AB
ABAB
r
r
rrr ⋅
=2
• extraRRR += 0
in addition a suitable extra size to be determined;
• r
Vrr AB
r
rr
&⋅
= .
Note that rr
is the position of the intruder in the relative reference system centred
in the ownship.
The extra-size radius is introduced in order to take into account the relative
motion between the ownship and the intruder aircraft, or the uncertainties
traffic position and velocity measurements.
the following, in order to compute the extra
method to integrate in the software architecture
reported in the next chapter
Capitolo 3 System and Software Architecture
49
3.4 – Ownship-Intruder geometry (Figure extracted from [54]
Therefore, the implemented conflict condition is:
rVAB
rr− ;
is the safety bubble radius equal to the minimum value with
in addition a suitable extra size to be determined;
is the position of the intruder in the relative reference system centred
size radius is introduced in order to take into account the relative
motion between the ownship and the intruder aircraft, or the uncertainties
traffic position and velocity measurements. Two possible way are introduced, in
the following, in order to compute the extra-size radius extraR . The choice of the
to integrate in the software architecture, will follow the performanc
reported in the next chapter.
System and Software Architecture
[54])
(22)
is the safety bubble radius equal to the minimum value with
is the position of the intruder in the relative reference system centred
size radius is introduced in order to take into account the relative
motion between the ownship and the intruder aircraft, or the uncertainties about
Two possible way are introduced, in
The choice of the
, will follow the performance test
Capitolo 3 System and Software Architecture
50
3.5.1 Extra-size Radius computation: time-to-go approach
The first method proposed for the computation of the safety bubble extra-
size radius, is based on the closure rate r& . In particular the safety bubble radius
can be computed as:
rkRR &⋅+= 0 (23)
Where k is a parameter (with time dimension) whose value has to be set. In the
application under study this value is set to 5s that is a mean value between the
value used along the horizontal direction (8s) and the vertical direction (2s) in the
TSAA application [97]. This assumption can be considered valid because the
safety bubble has been assumed with spherical shape so there are not differences
along the two directions.
Note that, considering an head-on conflict geometry between the ownship
and an intruder aircraft, with both aircraft moving at 55m/s the closure rate is
smr /110=& . The safety radius is:
mrkRR 70211054.1520 ≈⋅+≈⋅+= & (24)
Considering that the velocity of the intruder aircraft is 55m/s, it will take
about 13s to cover 702m. Therefore, in order to be conservative the maximum
data age for this application, introduced in paragraph 3.3.2, is of 15s.
3.5.2 Extra-size Radius computation: uncertainties approach
The second method proposed for the computation of the extra-size safety
bubble is related to the broadcast of two information such as the NACp and NACv
parameters related to each report. Those parameters give information regarding
the accuracy of the incoming position and velocity measurements. In particular,
the horizontal and vertical accuracy (σ ), at 95%, can be computed referring to
Table 3.1 for what concerns the position measurements, and to Table 3.2 for the
velocity measurements.
Capitolo 3 System and Software Architecture
51
In this case the safety radius is defined as:
cpadRR ∆+= σ0 (25)
where cpad∆σ is the variance of cpad estimate. It possible to verify that the closest
point of approach can be computed as in Eq. 26.
( ) ( )( )222
2
222
zyx
zzyyxx
zyxcpaVVV
VrVrVrrrrd
++
++−++= (26)
The differential of cpad is:
z
z
cpa
y
y
cpa
x
x
cpa
z
z
cpa
y
y
cpa
x
x
cpa
cpa
VV
dV
V
dV
V
d
rr
dr
r
dr
r
dd
∆⋅
∂
∂+∆⋅
∂
∂+∆⋅
∂
∂+
+∆⋅
∂
∂+∆⋅
∂
∂+∆
⋅
∂
∂=∆
222
222
(27)
Where:
⋅−=
∂
∂xx
x
cpaV
c
br
ar
d 1
⋅−=
∂
∂yy
y
cpaV
c
br
ar
d 1
⋅−=
∂
∂zz
z
cpaV
c
br
ar
d 1
(28)
Capitolo 3 System and Software Architecture
52
( )
+−=
∂
∂bVcr
c
b
aV
dxx
x
cpa
2
1
( )
+−=
∂
∂bVcr
c
b
aV
dyy
y
cpa
2
1
( )
+−=
∂
∂bVcr
c
b
aV
dzz
z
cpa
2
1
(29)
( ) ( )( )222
2
222
zyx
zzyyxx
zyxVVV
VrVrVrrrra
++
++−++=
zzyyxx VrVrVrb ++=
222zyx VVVc ++=
(30)
The variance can be computed as:
[ ] [ ] [ ] [ ]
[ ] [ ] [ ] 2varvarvar
varvarvarvar
cpadz
z
cpa
y
y
cpa
x
x
cpa
z
z
cpa
y
y
cpa
x
x
cpa
cpa
VV
dV
V
dV
V
d
rr
dr
r
dr
r
dd
∆=∆∂
∂+∆
∂
∂+∆
∂
∂+
+∆∂
∂+∆
∂
∂+∆
∂
∂=∆
σ
(31)
The values [ ] [ ] [ ] [ ] [ ] [ ]zyxzyx VVVrrr ∆∆∆∆∆∆ var,var,var,var,var,var can be computed
with NACp and NACv values through Table 3.1 and Table 3.2.
3.6 Prioritization algorithm
As result of conflict detection module, multiple conflicts can be detected. In
fact, more than one aircraft may pose a conflict to the ownship. For this reason a
proper prioritization criterion has to be implemented. The aim of this module is to
define the most dangerous vehicle.
The prioritization criterion is strictly connected to the conflict detection
algorithm and in particular to the dimensioning of the safety bubble radius.
Therefore, two possible approaches are presented related to the two safety
bubble dimensioning introduced above.
Capitolo 3 System and Software Architecture
53
3.6.1 Prioritization criterion: time-to-go approach
The first method presents a prioritization criterion based on the closure rate.
This criterion is a simplification of the ACAS tau parameter evaluation [99]-
[100].
In particular, the time-to-go (TTG) parameter is defined as [100]:
r
rTTG
&= (32)
Therefore, the aircraft with lower TTG has higher priority respect to the
ones with higher TTG. The priority target (PT) is therefore:
( )TTGr
rPT minmin =
=
& (33)
3.6.2 Prioritization criterion: uncertainties approach
As mentioned in paragraph 3.5.2, the safety bubble radius can be computed
adding to the nominal radius a value equal to the standard deviation of the
distance at the closest point of approach σ . It is possible to perform the conflict
detection check with respect to three spheres which surround the intruder aircraft:
σ+= 01 RR
σ202 += RR
σ303 += RR
(34)
In the hypothesis of normal distribution, it is possible to compute the three
probabilities of conflict related to three volumes. The first probability is related to
the sphere with radius:
σ+= 0RR (35)
Capitolo 3 System and Software Architecture
54
The second volume is the space included between the sphere at σ1 and the
one at σ2 . The third volume is included between the sphere at σ2 and the one at
σ3 . Therefore the conflict probabilities (CP) can be computed as:
{ } 6827.011 == σPCP
{ } { } 2718.06827.09545.0122 =−=−= σσ PPCP
{ } { } 0428.09545.09973.0233 =−=−= σσ PPCP
(36)
The prioritization criterion is then:
( ))(maxmax TTGinvCPr
rCPPT ⋅=
⋅=&
(37)
The TTG is included as a scale factor in order to take into account the
approaching geometry.
Note that, with this method, the extra-size value is related to the measurement
uncertainties and so to the NACp and NACv values.
Chapter 4 Implementation and Test
55
Chapter 4
Implementation and Test
4.1 Introduction
This section will show the algorithm modelling, the simulation environment
and the main test scenarios and related results.
In particular in the first part, a description of the algorithms, introduced
above, will be presented.
In the second part, tests will be shown in order to verify the effectiveness
working of the surveillance processing and in order to assess one of the two
methods, explained in the previous chapter, of conflict detection and
prioritization.
In the third part, the assessed software architecture will be inserted in an
more complex system to support a conflict resolution algorithm. Note that the
conflict resolution algorithm is out of the scope of this work and more information
can be found in [54]. Therefore offline test scenarios will be described and the
results will be shown and discussed.
The last part will be about the real-time simulation tests. Therefore a
description of the facility will be shown. Further the test scenarios will be
presented and the related results will be discussed.
4.2 Sense and Detect Algorithm modelling
The overall system architecture, and related algorithms, discussed in the
previous chapter have been modelled in Matlab and Simulink R2009A.
4.2.1 Surveillance Processing Simulink Scheme
Figure 4.6 shows the implemented Simulink scheme modelling the
Surveillance Processing algorithms. The represented scheme is slightly different
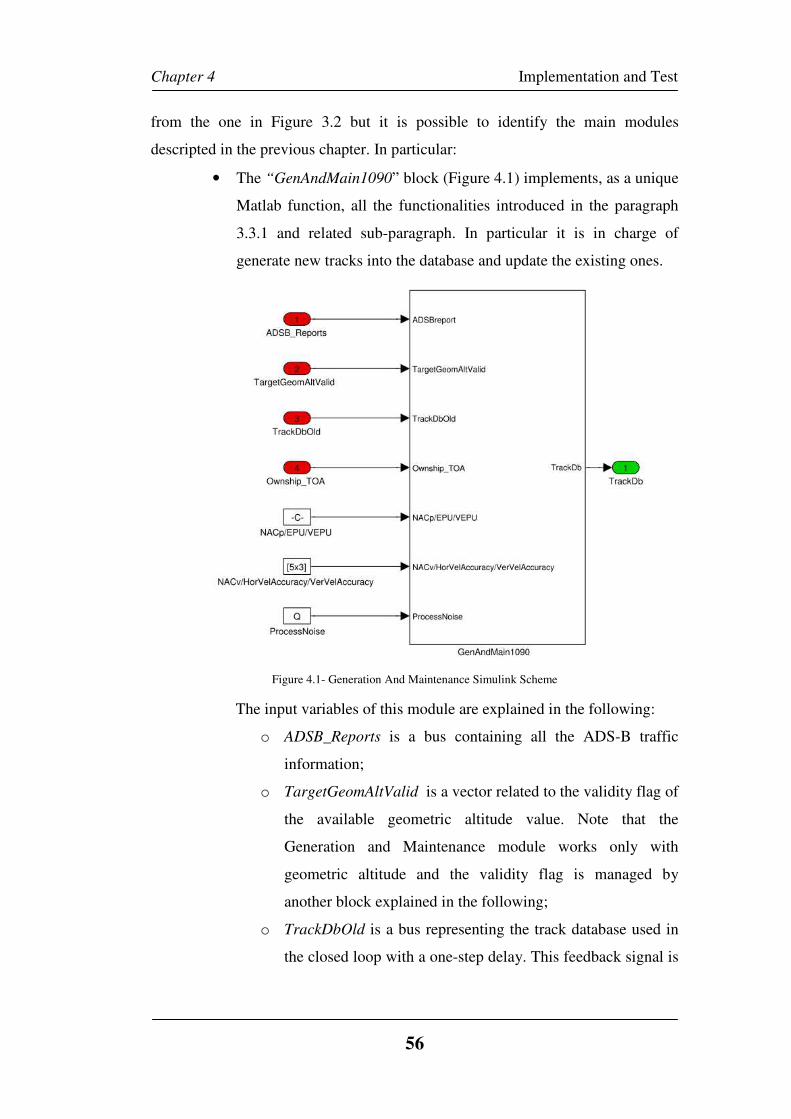
Chapter 4 Implementation and Test
56
from the one in Figure 3.2 but it is possible to identify the main modules
descripted in the previous chapter. In particular:
• The “GenAndMain1090” block (Figure 4.1) implements, as a unique
Matlab function, all the functionalities introduced in the paragraph
3.3.1 and related sub-paragraph. In particular it is in charge of
generate new tracks into the database and update the existing ones.
Figure 4.1- Generation And Maintenance Simulink Scheme
The input variables of this module are explained in the following:
o ADSB_Reports is a bus containing all the ADS-B traffic
information;
o TargetGeomAltValid is a vector related to the validity flag of
the available geometric altitude value. Note that the
Generation and Maintenance module works only with
geometric altitude and the validity flag is managed by
another block explained in the following;
o TrackDbOld is a bus representing the track database used in
the closed loop with a one-step delay. This feedback signal is
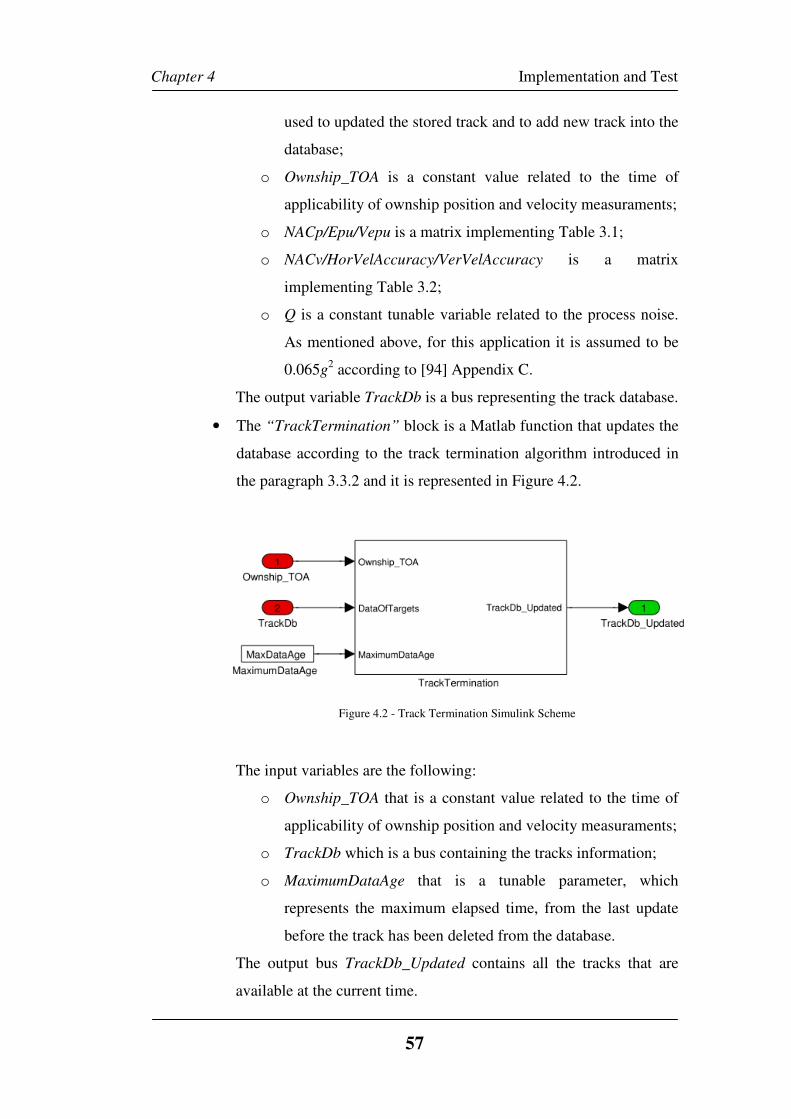
Chapter 4 Implementation and Test
57
used to updated the stored track and to add new track into the
database;
o Ownship_TOA is a constant value related to the time of
applicability of ownship position and velocity measuraments;
o NACp/Epu/Vepu is a matrix implementing Table 3.1;
o NACv/HorVelAccuracy/VerVelAccuracy is a matrix
implementing Table 3.2;
o Q is a constant tunable variable related to the process noise.
As mentioned above, for this application it is assumed to be
0.065g2 according to [94] Appendix C.
The output variable TrackDb is a bus representing the track database.
• The “TrackTermination” block is a Matlab function that updates the
database according to the track termination algorithm introduced in
the paragraph 3.3.2 and it is represented in Figure 4.2.
Figure 4.2 - Track Termination Simulink Scheme
The input variables are the following:
o Ownship_TOA that is a constant value related to the time of
applicability of ownship position and velocity measuraments;
o TrackDb which is a bus containing the tracks information;
o MaximumDataAge that is a tunable parameter, which
represents the maximum elapsed time, from the last update
before the track has been deleted from the database.
The output bus TrackDb_Updated contains all the tracks that are
available at the current time.
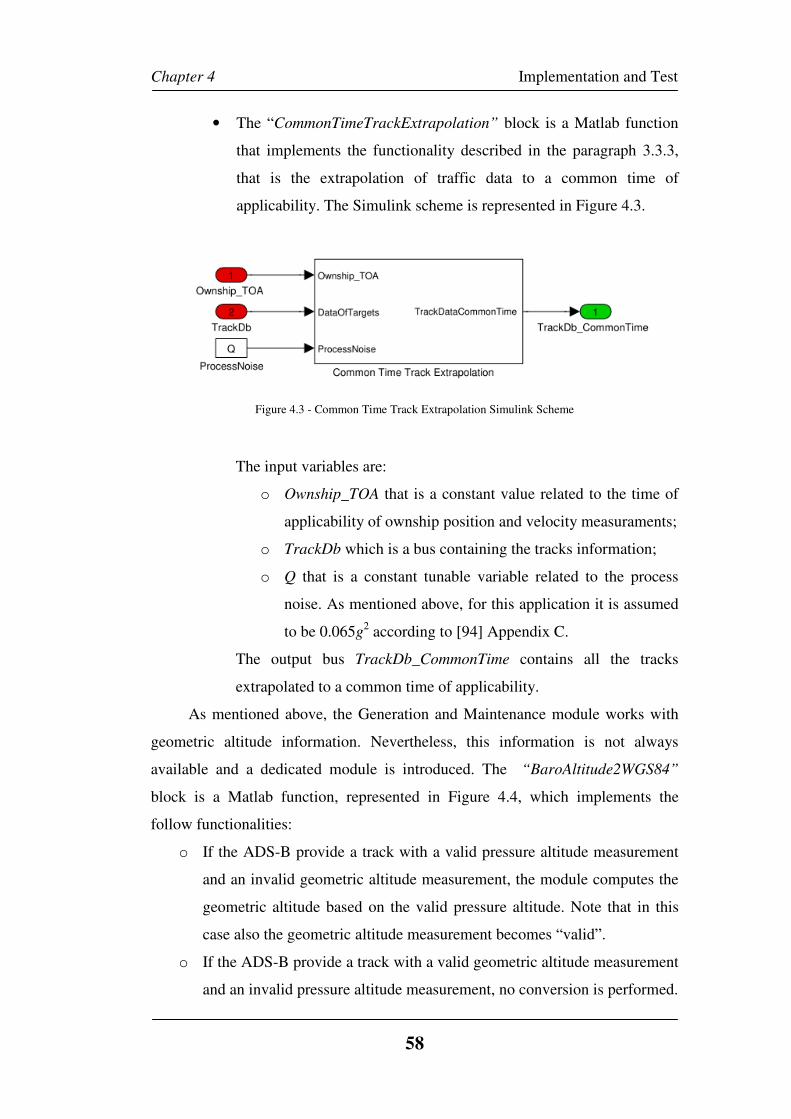
Chapter 4 Implementation and Test
58
• The “CommonTimeTrackExtrapolation” block is a Matlab function
that implements the functionality described in the paragraph 3.3.3,
that is the extrapolation of traffic data to a common time of
applicability. The Simulink scheme is represented in Figure 4.3.
Figure 4.3 - Common Time Track Extrapolation Simulink Scheme
The input variables are:
o Ownship_TOA that is a constant value related to the time of
applicability of ownship position and velocity measuraments;
o TrackDb which is a bus containing the tracks information;
o Q that is a constant tunable variable related to the process
noise. As mentioned above, for this application it is assumed
to be 0.065g2 according to [94] Appendix C.
The output bus TrackDb_CommonTime contains all the tracks
extrapolated to a common time of applicability.
As mentioned above, the Generation and Maintenance module works with
geometric altitude information. Nevertheless, this information is not always
available and a dedicated module is introduced. The “BaroAltitude2WGS84”
block is a Matlab function, represented in Figure 4.4, which implements the
follow functionalities:
o If the ADS-B provide a track with a valid pressure altitude measurement
and an invalid geometric altitude measurement, the module computes the
geometric altitude based on the valid pressure altitude. Note that in this
case also the geometric altitude measurement becomes “valid”.
o If the ADS-B provide a track with a valid geometric altitude measurement
and an invalid pressure altitude measurement, no conversion is performed.
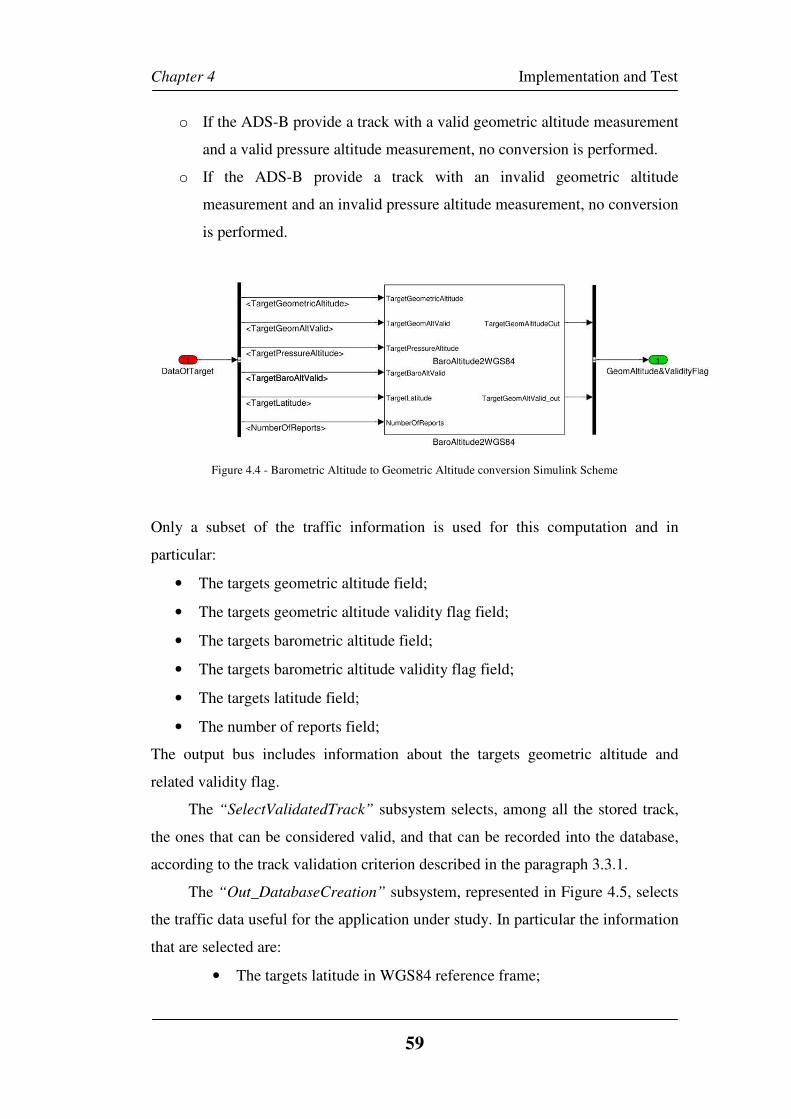
Chapter 4 Implementation and Test
59
o If the ADS-B provide a track with a valid geometric altitude measurement
and a valid pressure altitude measurement, no conversion is performed.
o If the ADS-B provide a track with an invalid geometric altitude
measurement and an invalid pressure altitude measurement, no conversion
is performed.
Figure 4.4 - Barometric Altitude to Geometric Altitude conversion Simulink Scheme
Only a subset of the traffic information is used for this computation and in
particular:
• The targets geometric altitude field;
• The targets geometric altitude validity flag field;
• The targets barometric altitude field;
• The targets barometric altitude validity flag field;
• The targets latitude field;
• The number of reports field;
The output bus includes information about the targets geometric altitude and
related validity flag.
The “SelectValidatedTrack” subsystem selects, among all the stored track,
the ones that can be considered valid, and that can be recorded into the database,
according to the track validation criterion described in the paragraph 3.3.1.
The “Out_DatabaseCreation” subsystem, represented in Figure 4.5, selects
the traffic data useful for the application under study. In particular the information
that are selected are:
• The targets latitude in WGS84 reference frame;
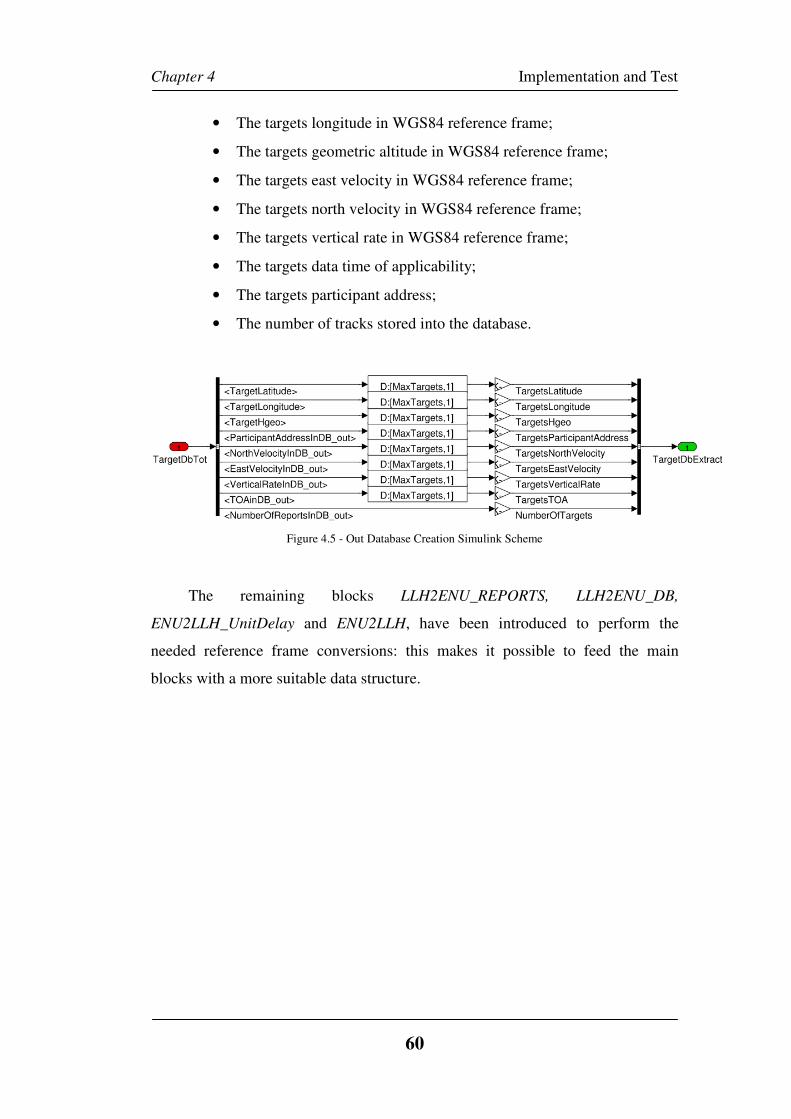
Chapter 4 Implementation and Test
60
• The targets longitude in WGS84 reference frame;
• The targets geometric altitude in WGS84 reference frame;
• The targets east velocity in WGS84 reference frame;
• The targets north velocity in WGS84 reference frame;
• The targets vertical rate in WGS84 reference frame;
• The targets data time of applicability;
• The targets participant address;
• The number of tracks stored into the database.
Figure 4.5 - Out Database Creation Simulink Scheme
The remaining blocks LLH2ENU_REPORTS, LLH2ENU_DB,
ENU2LLH_UnitDelay and ENU2LLH, have been introduced to perform the
needed reference frame conversions: this makes it possible to feed the main
blocks with a more suitable data structure.
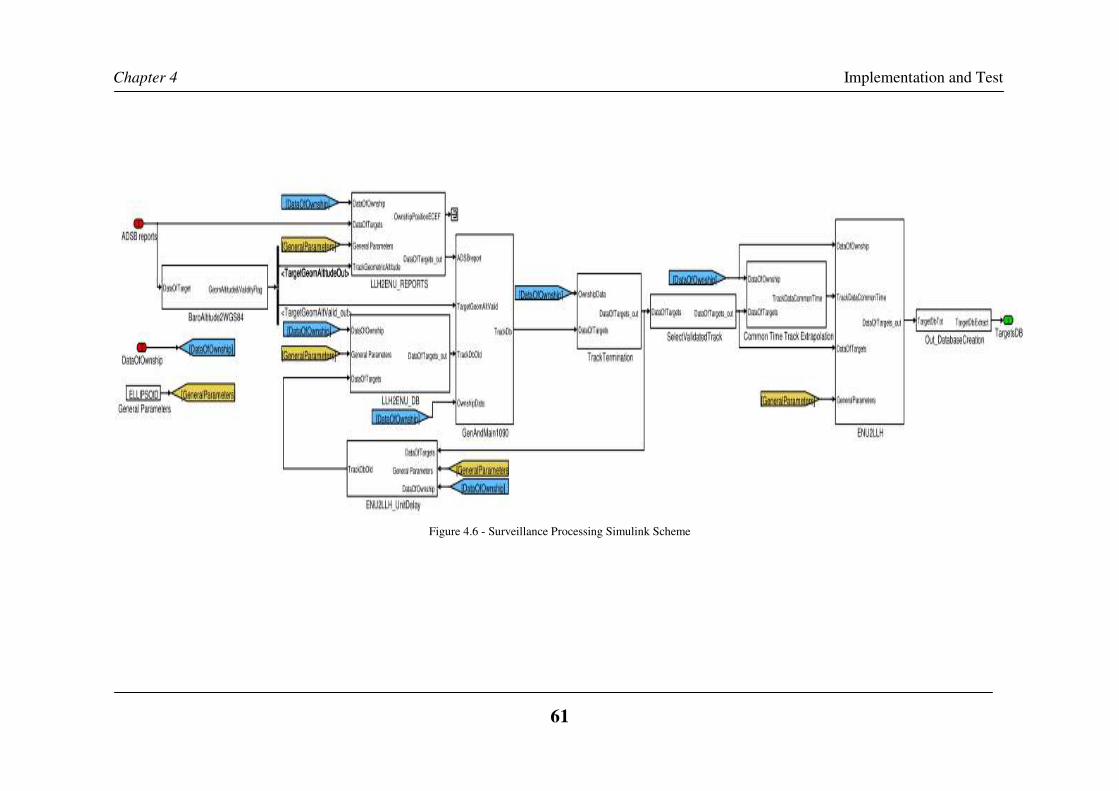
Chapter 4 Implementation and Test
61
Figure 4.6 - Surveillance Processing Simulink Scheme
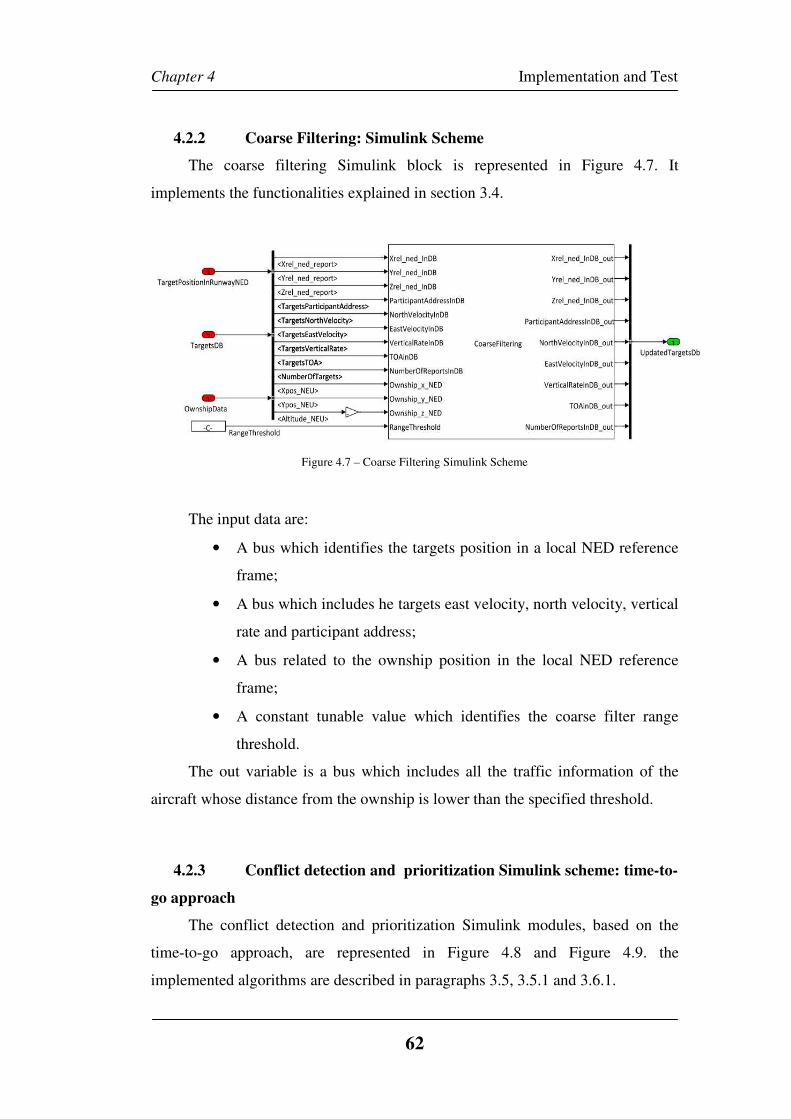
Chapter 4 Implementation and Test
62
4.2.2 Coarse Filtering: Simulink Scheme
The coarse filtering Simulink block is represented in Figure 4.7. It
implements the functionalities explained in section 3.4.
Figure 4.7 – Coarse Filtering Simulink Scheme
The input data are:
• A bus which identifies the targets position in a local NED reference
frame;
• A bus which includes he targets east velocity, north velocity, vertical
rate and participant address;
• A bus related to the ownship position in the local NED reference
frame;
• A constant tunable value which identifies the coarse filter range
threshold.
The out variable is a bus which includes all the traffic information of the
aircraft whose distance from the ownship is lower than the specified threshold.
4.2.3 Conflict detection and prioritization Simulink scheme: time-to-
go approach
The conflict detection and prioritization Simulink modules, based on the
time-to-go approach, are represented in Figure 4.8 and Figure 4.9. the
implemented algorithms are described in paragraphs 3.5, 3.5.1 and 3.6.1.
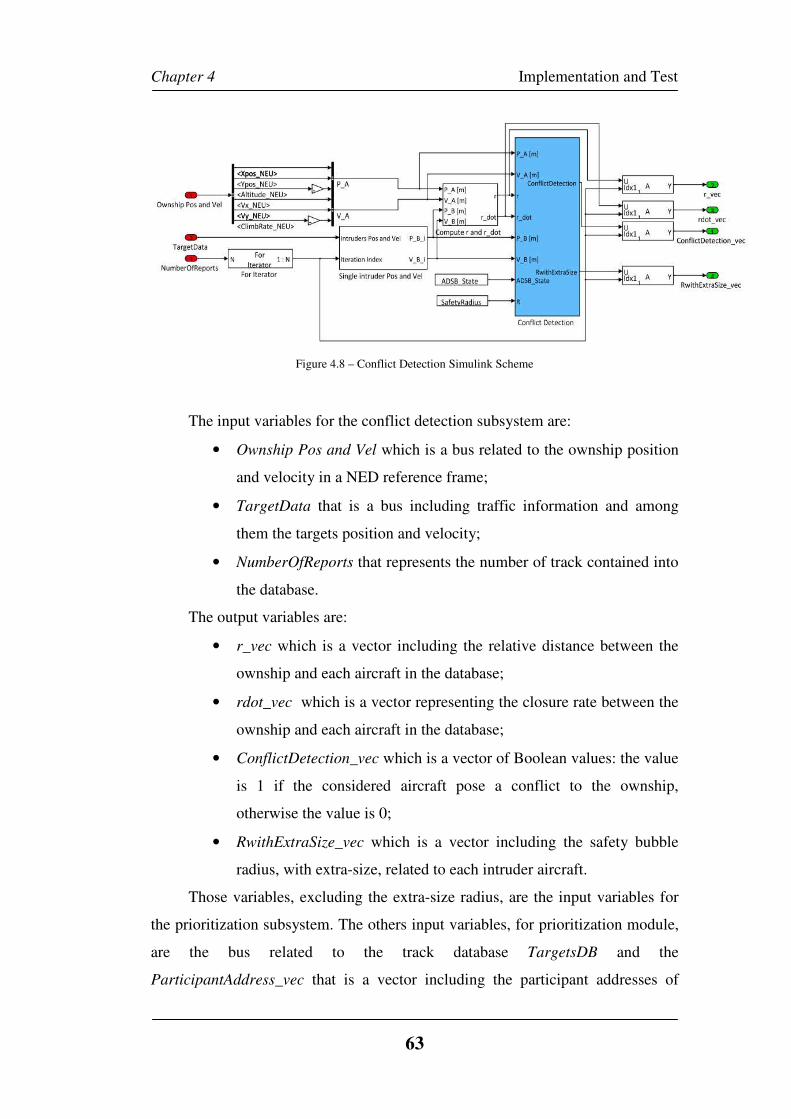
Chapter 4 Implementation and Test
63
Figure 4.8 – Conflict Detection Simulink Scheme
The input variables for the conflict detection subsystem are:
• Ownship Pos and Vel which is a bus related to the ownship position
and velocity in a NED reference frame;
• TargetData that is a bus including traffic information and among
them the targets position and velocity;
• NumberOfReports that represents the number of track contained into
the database.
The output variables are:
• r_vec which is a vector including the relative distance between the
ownship and each aircraft in the database;
• rdot_vec which is a vector representing the closure rate between the
ownship and each aircraft in the database;
• ConflictDetection_vec which is a vector of Boolean values: the value
is 1 if the considered aircraft pose a conflict to the ownship,
otherwise the value is 0;
• RwithExtraSize_vec which is a vector including the safety bubble
radius, with extra-size, related to each intruder aircraft.
Those variables, excluding the extra-size radius, are the input variables for
the prioritization subsystem. The others input variables, for prioritization module,
are the bus related to the track database TargetsDB and the
ParticipantAddress_vec that is a vector including the participant addresses of
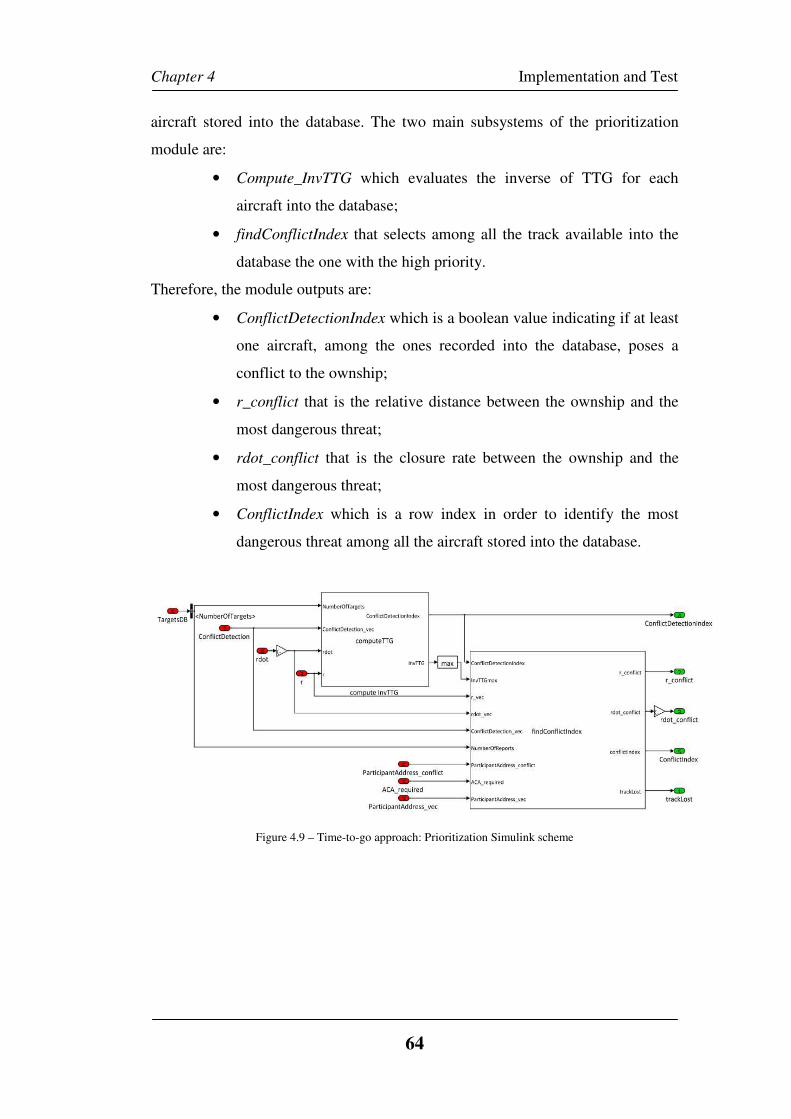
Chapter 4 Implementation and Test
64
aircraft stored into the database. The two main subsystems of the prioritization
module are:
• Compute_InvTTG which evaluates the inverse of TTG for each
aircraft into the database;
• findConflictIndex that selects among all the track available into the
database the one with the high priority.
Therefore, the module outputs are:
• ConflictDetectionIndex which is a boolean value indicating if at least
one aircraft, among the ones recorded into the database, poses a
conflict to the ownship;
• r_conflict that is the relative distance between the ownship and the
most dangerous threat;
• rdot_conflict that is the closure rate between the ownship and the
most dangerous threat;
• ConflictIndex which is a row index in order to identify the most
dangerous threat among all the aircraft stored into the database.
Figure 4.9 – Time-to-go approach: Prioritization Simulink scheme
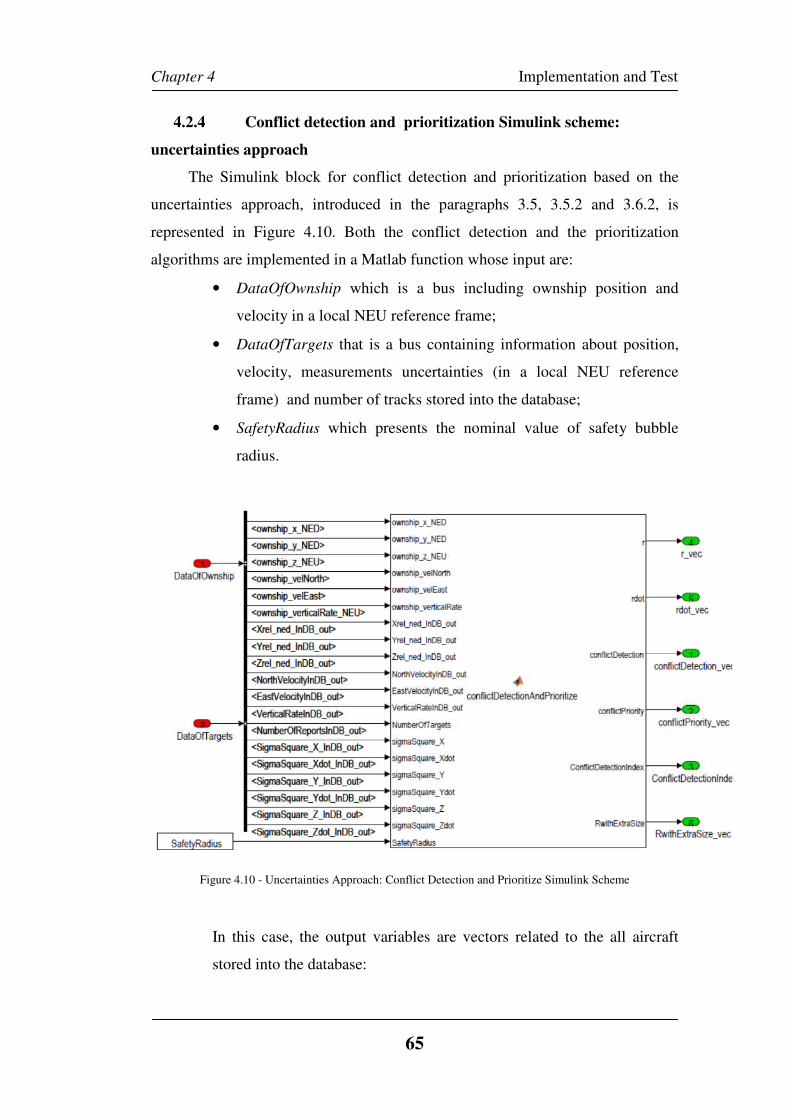
Chapter 4 Implementation and Test
65
4.2.4 Conflict detection and prioritization Simulink scheme:
uncertainties approach
The Simulink block for conflict detection and prioritization based on the
uncertainties approach, introduced in the paragraphs 3.5, 3.5.2 and 3.6.2, is
represented in Figure 4.10. Both the conflict detection and the prioritization
algorithms are implemented in a Matlab function whose input are:
• DataOfOwnship which is a bus including ownship position and
velocity in a local NEU reference frame;
• DataOfTargets that is a bus containing information about position,
velocity, measurements uncertainties (in a local NEU reference
frame) and number of tracks stored into the database;
• SafetyRadius which presents the nominal value of safety bubble
radius.
Figure 4.10 - Uncertainties Approach: Conflict Detection and Prioritize Simulink Scheme
In this case, the output variables are vectors related to the all aircraft
stored into the database:
Chapter 4 Implementation and Test
66
• r_vec is a vector containing the relative distance between the
ownship and all the aircraft in the database;
• rdot_vec is a vector including the closure rate between the ownship
and all the aircraft in the database;
• ConflictDetection_vec is a vector whose element are Boolean which
indicate if the generic aircraft in the database poses a conflict to the
ownship or not;
• ConflictPriority_vec is a vector indicating the order priority
according to the equation (37) (paragraph 3.6.2);
• ConflictDetectionIndex which is a boolean value indicating if at least
one aircraft, among the ones recorded into the database, poses a
conflict to the ownship;
• RwithExtraSize_vec which is a vector including the safety bubble
radius, with extra-size, related to each intruder aircraft.
4.3 Unitary Performance Tests
Prior to introduce the software architecture adopted to perform offline and
real-time test, a performance test campaign has been carried out in order to
establish the working of some modules. In particular unitary tests have been
performed on the following modules:
• Surveillance Processing module, in order to establish the module
performances;
• Safety bubble extra-size radius computation and Prioritization
modules, in order to define which approach, between the proposed
ones, has to be integrated in the assessed software architecture.
4.3.1 Surveillance Processing: Tracking Filter Test
In order to establish the performance of the introduced tracking filter, some
tests have been performed [101].
The test scenarios foresee the presence of the ownship (receiver participant)
and one intruder aircraft (transmitter participant) and both the aircraft move with
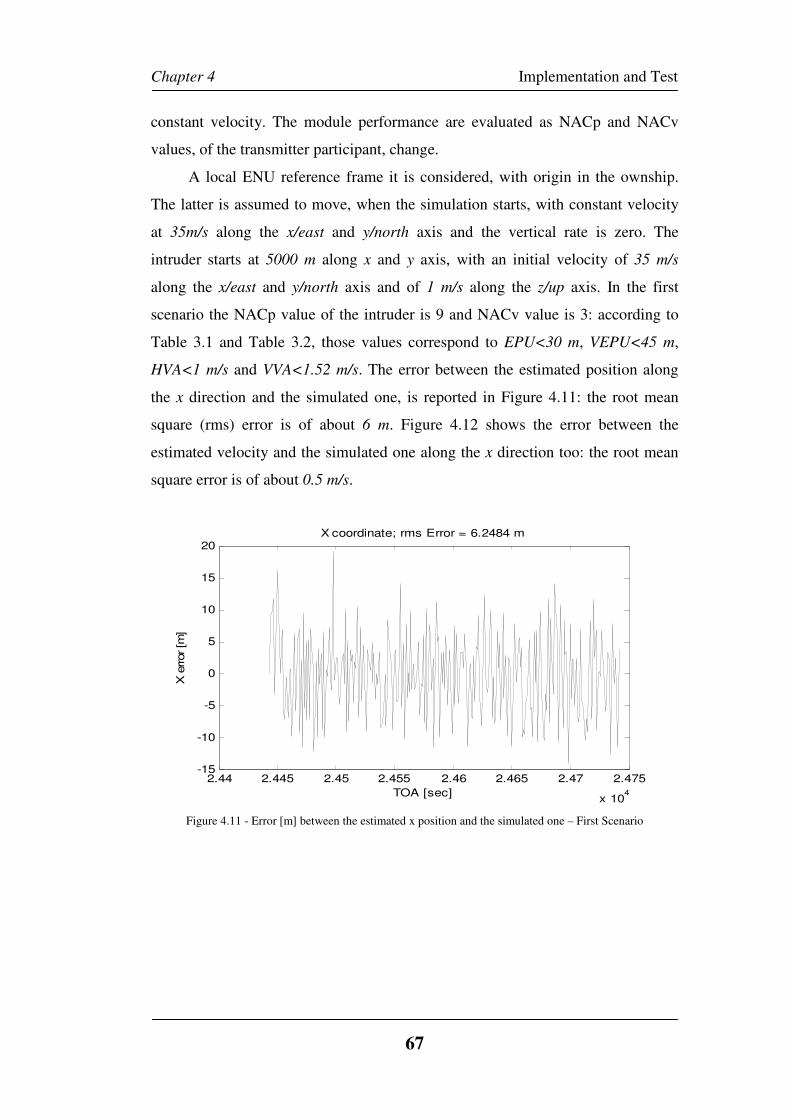
Chapter 4 Implementation and Test
67
constant velocity. The module performance are evaluated as NACp and NACv
values, of the transmitter participant, change.
A local ENU reference frame it is considered, with origin in the ownship.
The latter is assumed to move, when the simulation starts, with constant velocity
at 35m/s along the x/east and y/north axis and the vertical rate is zero. The
intruder starts at 5000 m along x and y axis, with an initial velocity of 35 m/s
along the x/east and y/north axis and of 1 m/s along the z/up axis. In the first
scenario the NACp value of the intruder is 9 and NACv value is 3: according to
Table 3.1 and Table 3.2, those values correspond to EPU<30 m, VEPU<45 m,
HVA<1 m/s and VVA<1.52 m/s. The error between the estimated position along
the x direction and the simulated one, is reported in Figure 4.11: the root mean
square (rms) error is of about 6 m. Figure 4.12 shows the error between the
estimated velocity and the simulated one along the x direction too: the root mean
square error is of about 0.5 m/s.
Figure 4.11 - Error [m] between the estimated x position and the simulated one – First Scenario
2.44 2.445 2.45 2.455 2.46 2.465 2.47 2.475
x 104
-15
-10
-5
0
5
10
15
20X coordinate; rms Error = 6.2484 m
TOA [sec]
X e
rror [m
]
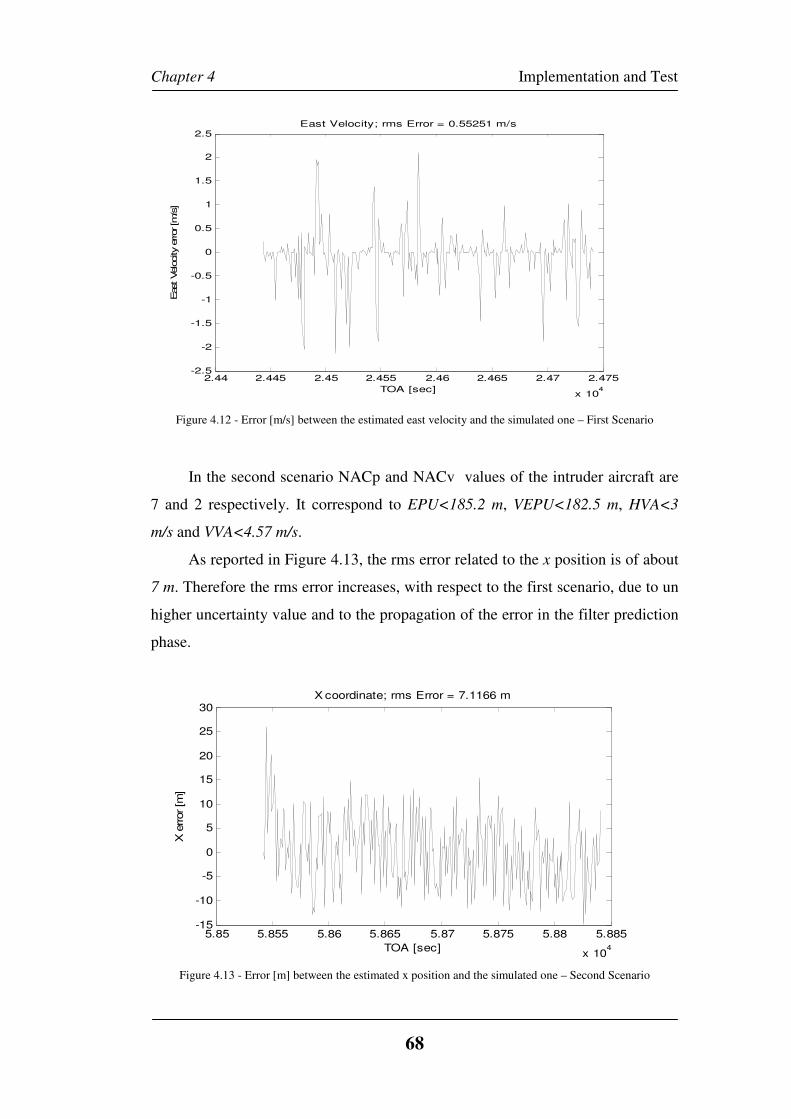
Chapter 4 Implementation and Test
68
Figure 4.12 - Error [m/s] between the estimated east velocity and the simulated one – First Scenario
In the second scenario NACp and NACv values of the intruder aircraft are
7 and 2 respectively. It correspond to EPU<185.2 m, VEPU<182.5 m, HVA<3
m/s and VVA<4.57 m/s.
As reported in Figure 4.13, the rms error related to the x position is of about
7 m. Therefore the rms error increases, with respect to the first scenario, due to un
higher uncertainty value and to the propagation of the error in the filter prediction
phase.
Figure 4.13 - Error [m] between the estimated x position and the simulated one – Second Scenario
2.44 2.445 2.45 2.455 2.46 2.465 2.47 2.475
x 104
-2.5
-2
-1.5
-1
-0.5
0
0.5
1
1.5
2
2.5East Velocity; rms Error = 0.55251 m/s
TOA [sec]
East Velocity e
rror [m
/s]
5.85 5.855 5.86 5.865 5.87 5.875 5.88 5.885
x 104
-15
-10
-5
0
5
10
15
20
25
30X coordinate; rms Error = 7.1166 m
TOA [sec]
X e
rror [m
]
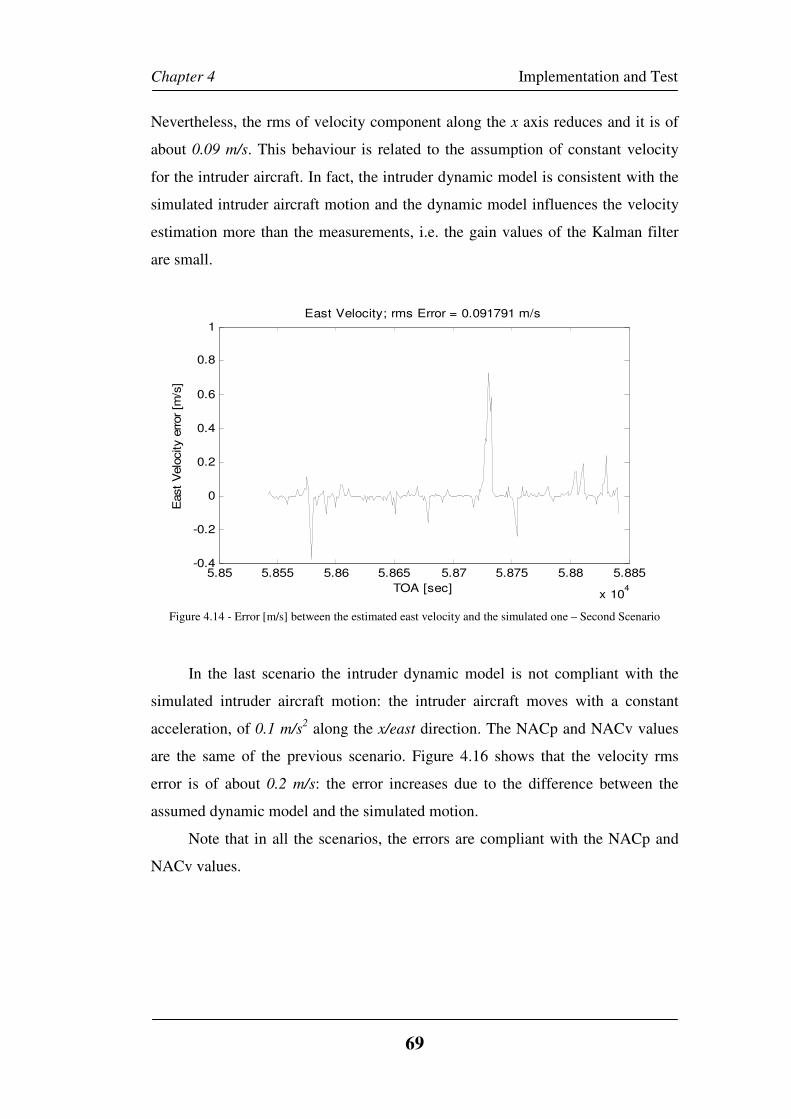
Chapter 4 Implementation and Test
69
Nevertheless, the rms of velocity component along the x axis reduces and it is of
about 0.09 m/s. This behaviour is related to the assumption of constant velocity
for the intruder aircraft. In fact, the intruder dynamic model is consistent with the
simulated intruder aircraft motion and the dynamic model influences the velocity
estimation more than the measurements, i.e. the gain values of the Kalman filter
are small.
Figure 4.14 - Error [m/s] between the estimated east velocity and the simulated one – Second Scenario
In the last scenario the intruder dynamic model is not compliant with the
simulated intruder aircraft motion: the intruder aircraft moves with a constant
acceleration, of 0.1 m/s2 along the x/east direction. The NACp and NACv values
are the same of the previous scenario. Figure 4.16 shows that the velocity rms
error is of about 0.2 m/s: the error increases due to the difference between the
assumed dynamic model and the simulated motion.
Note that in all the scenarios, the errors are compliant with the NACp and
NACv values.
5.85 5.855 5.86 5.865 5.87 5.875 5.88 5.885
x 104
-0.4
-0.2
0
0.2
0.4
0.6
0.8
1East Velocity; rms Error = 0.091791 m/s
TOA [sec]
East V
elo
city e
rror [m
/s]
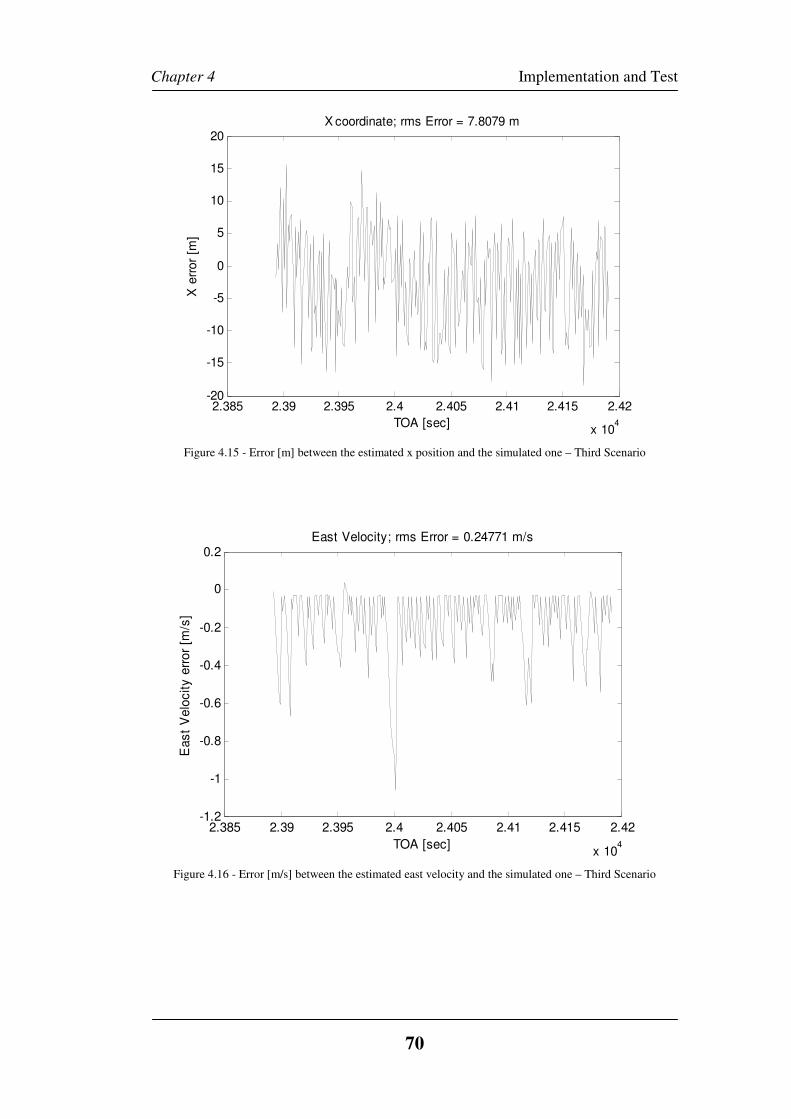
Chapter 4 Implementation and Test
70
Figure 4.15 - Error [m] between the estimated x position and the simulated one – Third Scenario
Figure 4.16 - Error [m/s] between the estimated east velocity and the simulated one – Third Scenario
2.385 2.39 2.395 2.4 2.405 2.41 2.415 2.42
x 104
-20
-15
-10
-5
0
5
10
15
20X coordinate; rms Error = 7.8079 m
TOA [sec]
X e
rror
[m]
2.385 2.39 2.395 2.4 2.405 2.41 2.415 2.42
x 104
-1.2
-1
-0.8
-0.6
-0.4
-0.2
0
0.2East Velocity; rms Error = 0.24771 m/s
TOA [sec]
East
Velo
city e
rror
[m/s
]
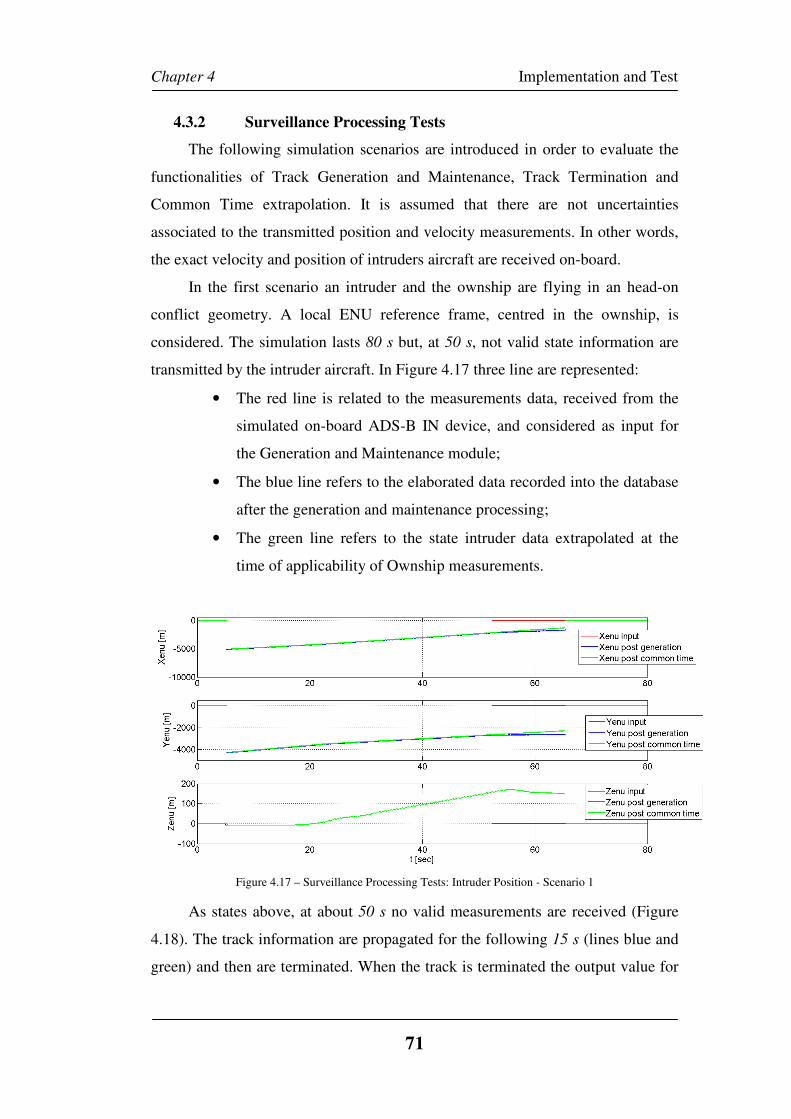
Chapter 4 Implementation and Test
71
4.3.2 Surveillance Processing Tests
The following simulation scenarios are introduced in order to evaluate the
functionalities of Track Generation and Maintenance, Track Termination and
Common Time extrapolation. It is assumed that there are not uncertainties
associated to the transmitted position and velocity measurements. In other words,
the exact velocity and position of intruders aircraft are received on-board.
In the first scenario an intruder and the ownship are flying in an head-on
conflict geometry. A local ENU reference frame, centred in the ownship, is
considered. The simulation lasts 80 s but, at 50 s, not valid state information are
transmitted by the intruder aircraft. In Figure 4.17 three line are represented:
• The red line is related to the measurements data, received from the
simulated on-board ADS-B IN device, and considered as input for
the Generation and Maintenance module;
• The blue line refers to the elaborated data recorded into the database
after the generation and maintenance processing;
• The green line refers to the state intruder data extrapolated at the
time of applicability of Ownship measurements.
Figure 4.17 – Surveillance Processing Tests: Intruder Position - Scenario 1
As states above, at about 50 s no valid measurements are received (Figure
4.18). The track information are propagated for the following 15 s (lines blue and
green) and then are terminated. When the track is terminated the output value for
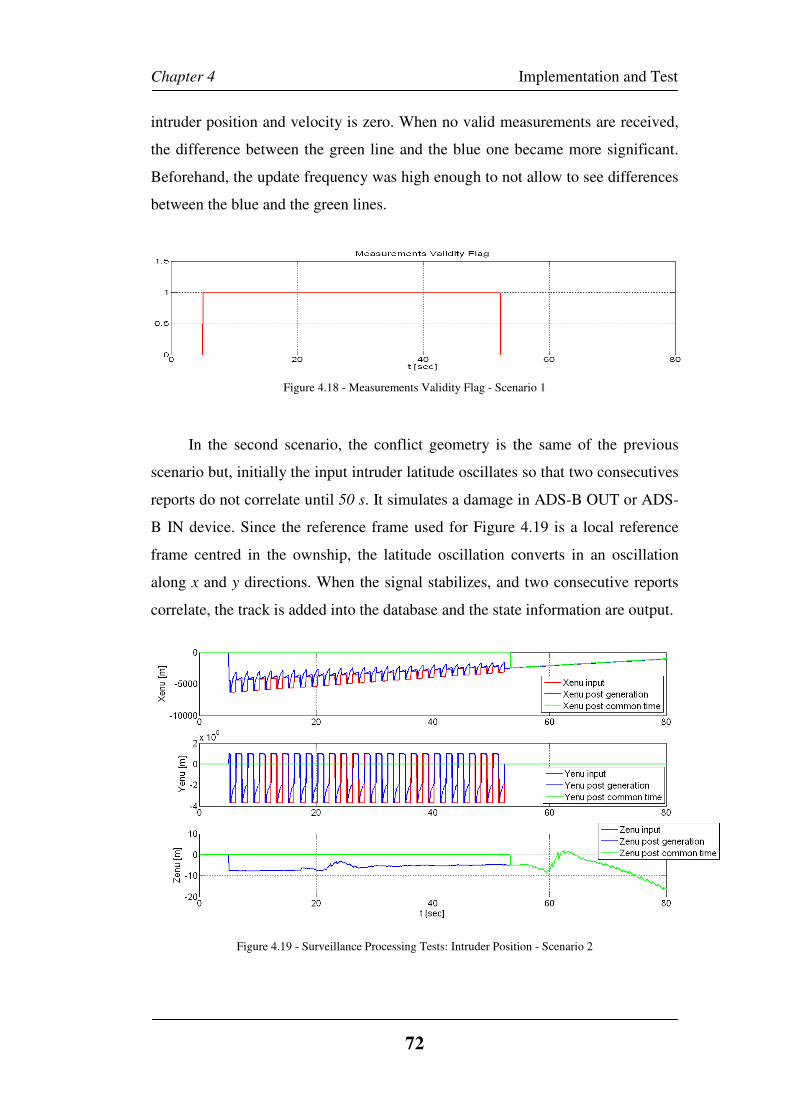
Chapter 4 Implementation and Test
72
intruder position and velocity is zero. When no valid measurements are received,
the difference between the green line and the blue one became more significant.
Beforehand, the update frequency was high enough to not allow to see differences
between the blue and the green lines.
Figure 4.18 - Measurements Validity Flag - Scenario 1
In the second scenario, the conflict geometry is the same of the previous
scenario but, initially the input intruder latitude oscillates so that two consecutives
reports do not correlate until 50 s. It simulates a damage in ADS-B OUT or ADS-
B IN device. Since the reference frame used for Figure 4.19 is a local reference
frame centred in the ownship, the latitude oscillation converts in an oscillation
along x and y directions. When the signal stabilizes, and two consecutive reports
correlate, the track is added into the database and the state information are output.
Figure 4.19 - Surveillance Processing Tests: Intruder Position - Scenario 2
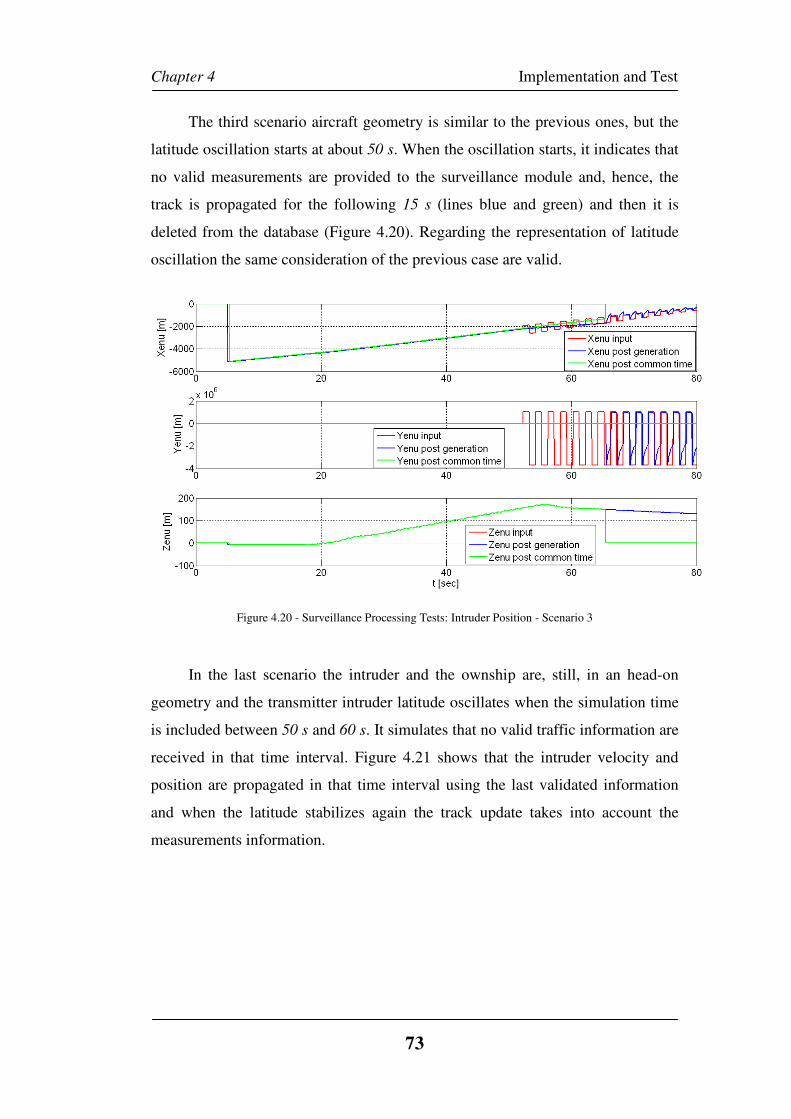
Chapter 4 Implementation and Test
73
The third scenario aircraft geometry is similar to the previous ones, but the
latitude oscillation starts at about 50 s. When the oscillation starts, it indicates that
no valid measurements are provided to the surveillance module and, hence, the
track is propagated for the following 15 s (lines blue and green) and then it is
deleted from the database (Figure 4.20). Regarding the representation of latitude
oscillation the same consideration of the previous case are valid.
Figure 4.20 - Surveillance Processing Tests: Intruder Position - Scenario 3
In the last scenario the intruder and the ownship are, still, in an head-on
geometry and the transmitter intruder latitude oscillates when the simulation time
is included between 50 s and 60 s. It simulates that no valid traffic information are
received in that time interval. Figure 4.21 shows that the intruder velocity and
position are propagated in that time interval using the last validated information
and when the latitude stabilizes again the track update takes into account the
measurements information.
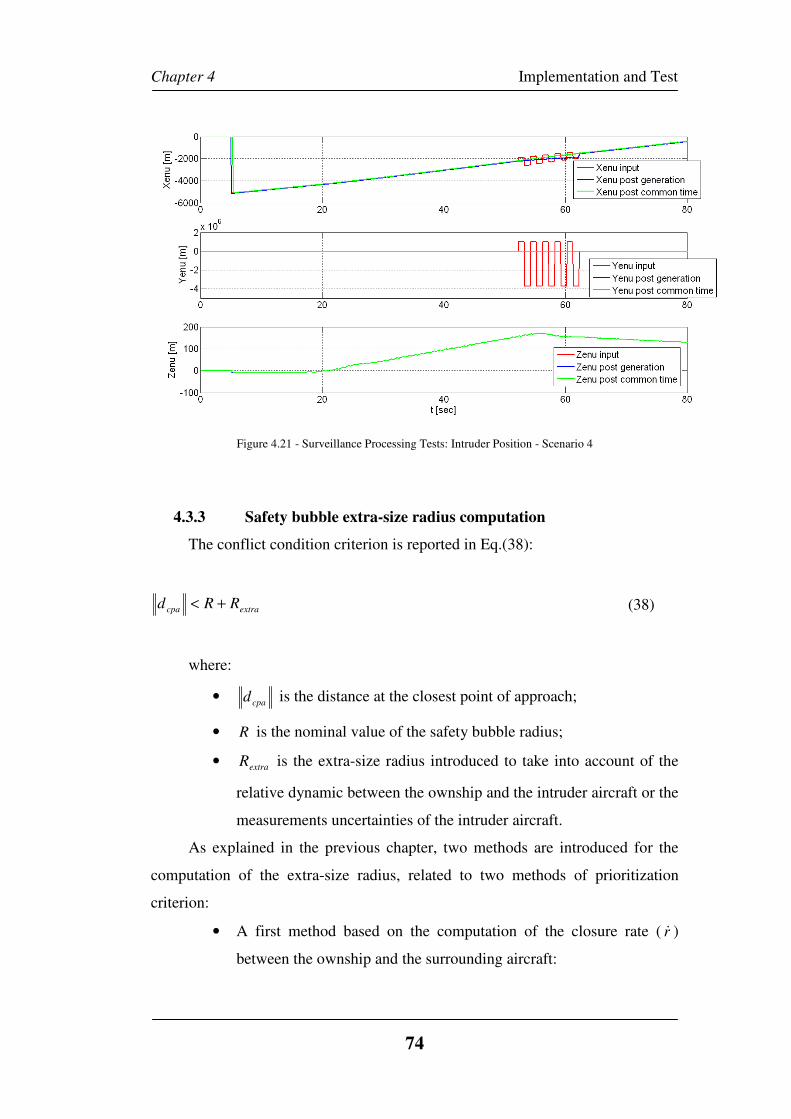
Chapter 4 Implementation and Test
74
Figure 4.21 - Surveillance Processing Tests: Intruder Position - Scenario 4
4.3.3 Safety bubble extra-size radius computation
The conflict condition criterion is reported in Eq.(38):
extracpa RRd +< (38)
where:
• cpad is the distance at the closest point of approach;
• R is the nominal value of the safety bubble radius;
• extraR is the extra-size radius introduced to take into account of the
relative dynamic between the ownship and the intruder aircraft or the
measurements uncertainties of the intruder aircraft.
As explained in the previous chapter, two methods are introduced for the
computation of the extra-size radius, related to two methods of prioritization
criterion:
• A first method based on the computation of the closure rate ( r& )
between the ownship and the surrounding aircraft:
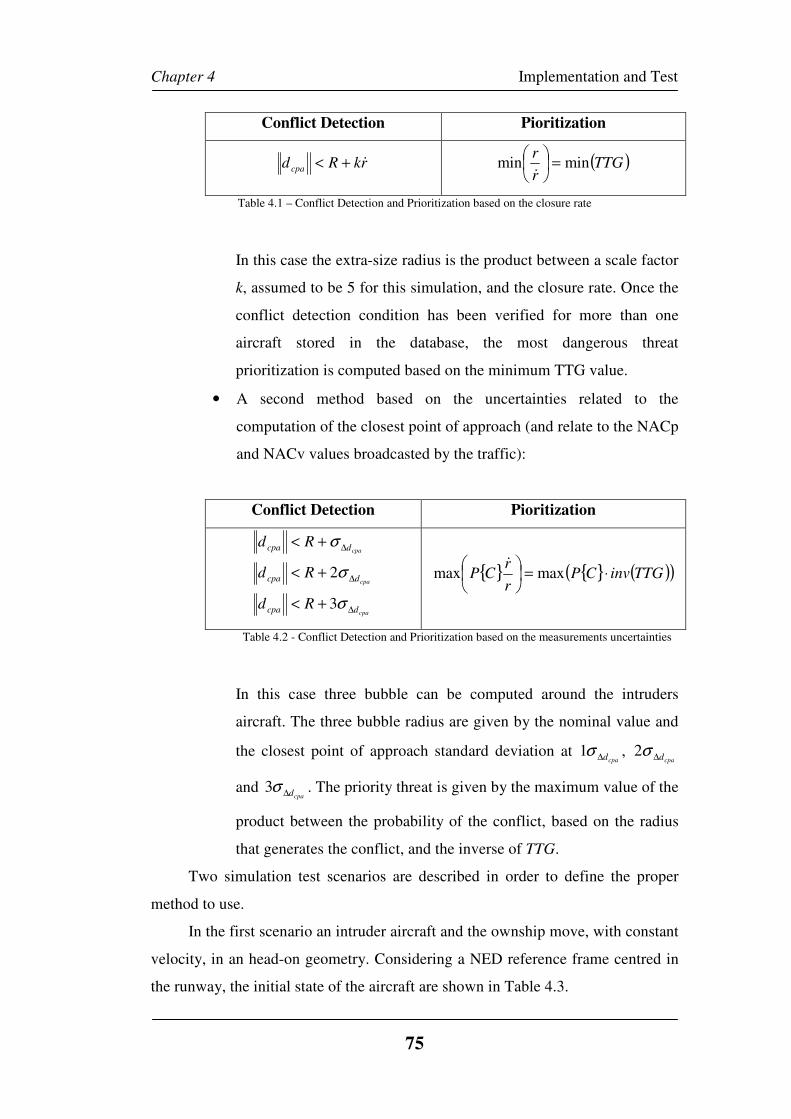
Chapter 4 Implementation and Test
75
Conflict Detection Pioritization
rkRd cpa&+< ( )TTG
r
rminmin =
&
Table 4.1 – Conflict Detection and Prioritization based on the closure rate
In this case the extra-size radius is the product between a scale factor
k, assumed to be 5 for this simulation, and the closure rate. Once the
conflict detection condition has been verified for more than one
aircraft stored in the database, the most dangerous threat
prioritization is computed based on the minimum TTG value.
• A second method based on the uncertainties related to the
computation of the closest point of approach (and relate to the NACp
and NACv values broadcasted by the traffic):
Conflict Detection Pioritization
cpa
cpa
cpa
dcpa
dcpa
dcpa
Rd
Rd
Rd
∆
∆
∆
+<
+<
+<
σ
σ
σ
3
2 { } { } ( )( )TTGinvCPr
rCP ⋅=
maxmax
&
Table 4.2 - Conflict Detection and Prioritization based on the measurements uncertainties
In this case three bubble can be computed around the intruders
aircraft. The three bubble radius are given by the nominal value and
the closest point of approach standard deviation at cpad∆σ1 ,
cpad∆σ2
and cpad∆σ3 . The priority threat is given by the maximum value of the
product between the probability of the conflict, based on the radius
that generates the conflict, and the inverse of TTG.
Two simulation test scenarios are described in order to define the proper
method to use.
In the first scenario an intruder aircraft and the ownship move, with constant
velocity, in an head-on geometry. Considering a NED reference frame centred in
the runway, the initial state of the aircraft are shown in Table 4.3.
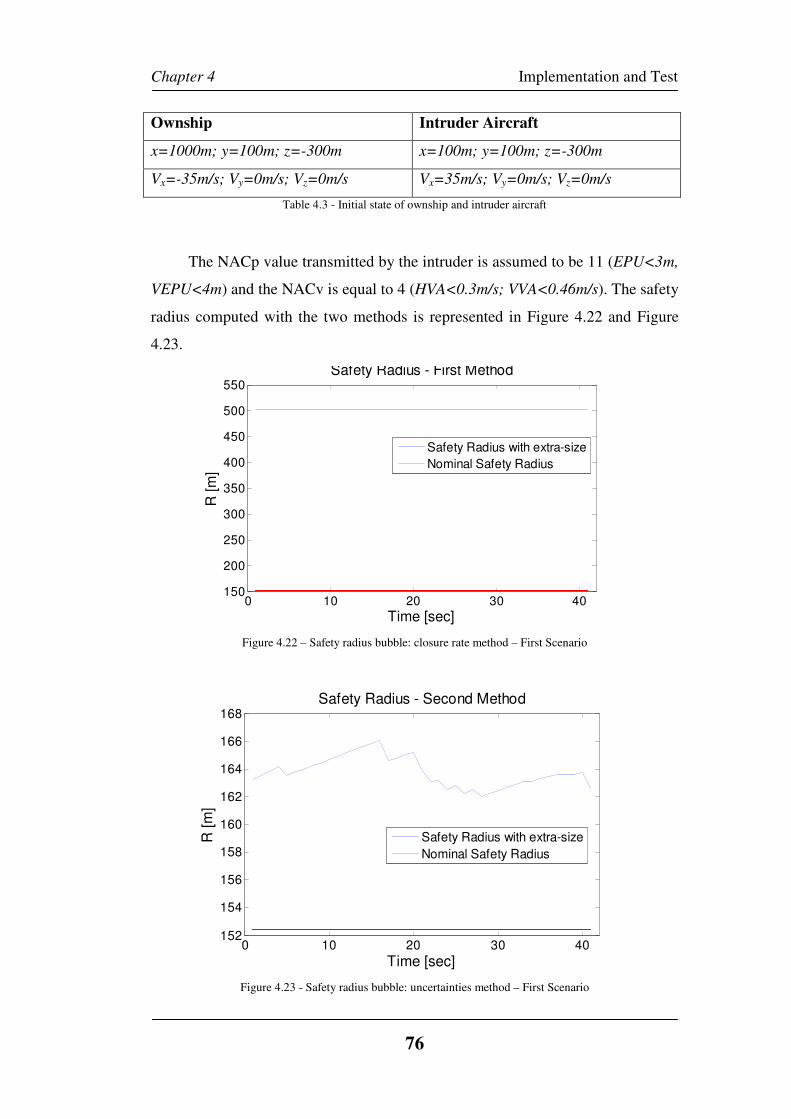
Chapter 4 Implementation and Test
76
Ownship Intruder Aircraft
x=1000m; y=100m; z=-300m x=100m; y=100m; z=-300m
Vx=-35m/s; Vy=0m/s; Vz=0m/s Vx=35m/s; Vy=0m/s; Vz=0m/s
Table 4.3 - Initial state of ownship and intruder aircraft
The NACp value transmitted by the intruder is assumed to be 11 (EPU<3m,
VEPU<4m) and the NACv is equal to 4 (HVA<0.3m/s; VVA<0.46m/s). The safety
radius computed with the two methods is represented in Figure 4.22 and Figure
4.23.
Figure 4.22 – Safety radius bubble: closure rate method – First Scenario
Figure 4.23 - Safety radius bubble: uncertainties method – First Scenario
0 10 20 30 40150
200
250
300
350
400
450
500
550
Time [sec]
R [m
]
Safety Radius - First Method
Safety Radius with extra-size
Nominal Safety Radius
0 10 20 30 40152
154
156
158
160
162
164
166
168
Time [sec]
R [m
]
Safety Radius - Second Method
Safety Radius with extra-size
Nominal Safety Radius
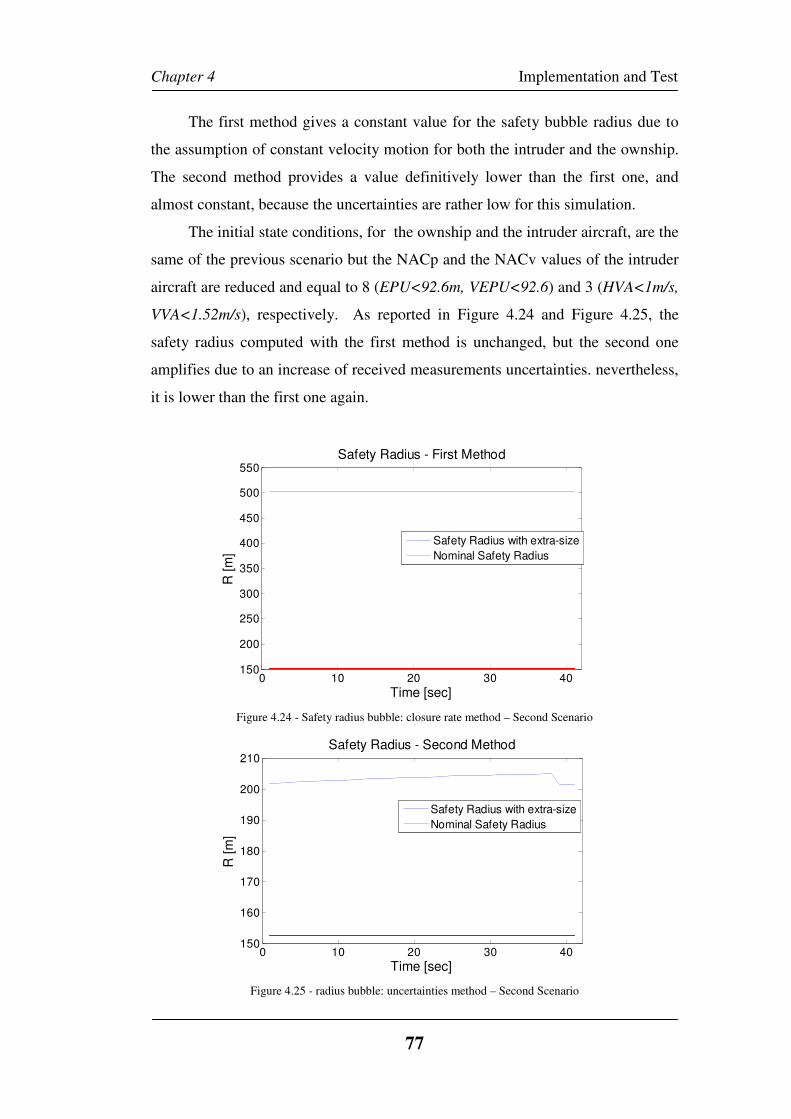
Chapter 4 Implementation and Test
77
The first method gives a constant value for the safety bubble radius due to
the assumption of constant velocity motion for both the intruder and the ownship.
The second method provides a value definitively lower than the first one, and
almost constant, because the uncertainties are rather low for this simulation.
The initial state conditions, for the ownship and the intruder aircraft, are the
same of the previous scenario but the NACp and the NACv values of the intruder
aircraft are reduced and equal to 8 (EPU<92.6m, VEPU<92.6) and 3 (HVA<1m/s,
VVA<1.52m/s), respectively. As reported in Figure 4.24 and Figure 4.25, the
safety radius computed with the first method is unchanged, but the second one
amplifies due to an increase of received measurements uncertainties. nevertheless,
it is lower than the first one again.
Figure 4.24 - Safety radius bubble: closure rate method – Second Scenario
Figure 4.25 - radius bubble: uncertainties method – Second Scenario
0 10 20 30 40150
200
250
300
350
400
450
500
550
Time [sec]
R [m
]
Safety Radius - First Method
Safety Radius with extra-size
Nominal Safety Radius
0 10 20 30 40150
160
170
180
190
200
210
Time [sec]
R [m
]
Safety Radius - Second Method
Safety Radius with extra-size
Nominal Safety Radius
Chapter 4 Implementation and Test
78
Therefore, the method based on the closure rate provides a safety radius
higher, but depending on the choice of the k parameter, than the safety radius
related to the uncertainties method. Nevertheless the safety radius provided by the
second method is strictly connected to the variation of the NACp and NACv
values that can significantly change during the flight and it could led to an
unstable algorithm.
The instability of the safety bubble computation and, consequently, the
instability of prioritization and conflict detection algorithms could compromise
the correct working of the whole architecture. Therefore, the closure rate based
algorithm is chosen to be integrated in the tested software architecture.
4.4 Numerical Testing
4.4.1 Simulation Environment for Numerical Testing Description
The proposed approach has been tested by means of numerical simulations
representing some relevant conflict scenarios, carried out with the aim of
assessing the applicability of ADS-B data for conflict detection purposes. The
intruders’ motion has been simulated by using simple kinematic 3D motion
model, whereas the ownship dynamics has been fully modelled by using 6
degrees-of-freedom aircraft model and suitable autopilot and auto-throttle systems
[54].
The developed ADS-B based subsystems, for the surveillance and conflict
detection functionalities, have been included in a more complex software
architecture for an autonomous GNC application. In other words, the system has
to guarantee the autonomous flight, during the entire flight mission, including the
autonomous mid-air flight, the take-off and the landing, and the collision
avoidance [54].
The software architecture of the whole system is represented in Figure 4.26.
A brief description of the represented subsystems is provided in the following:
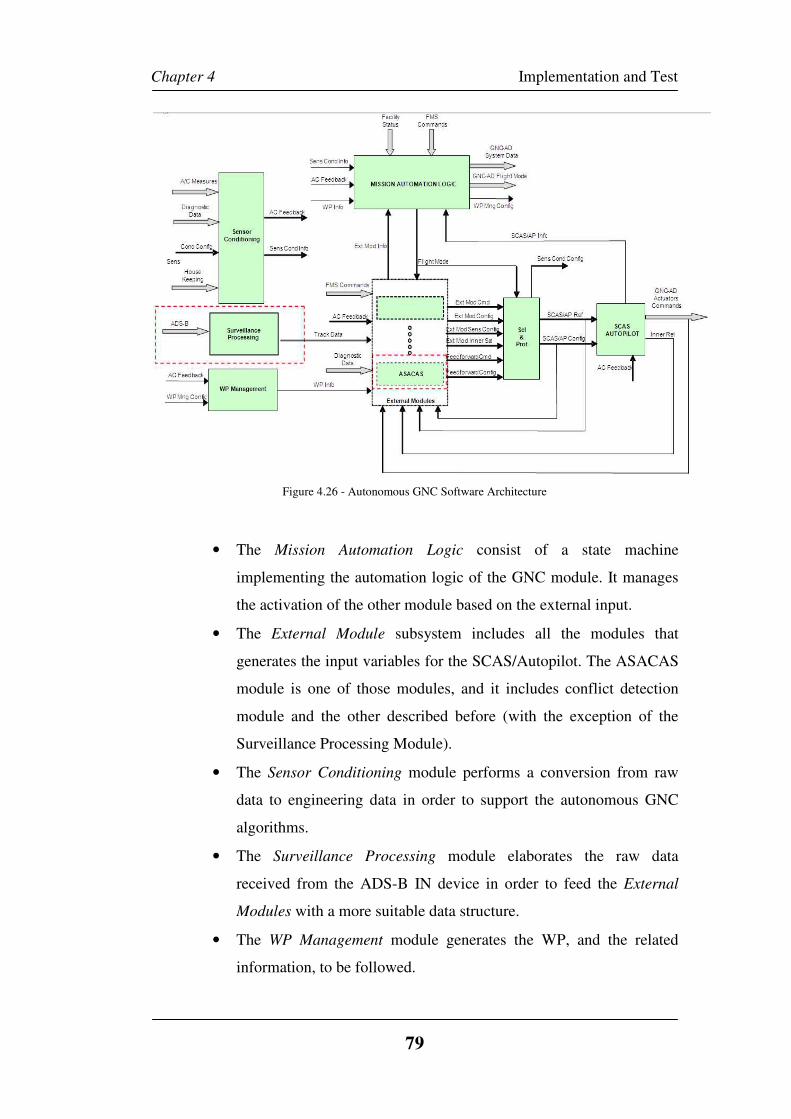
Chapter 4 Implementation and Test
79
Figure 4.26 - Autonomous GNC Software Architecture
• The Mission Automation Logic consist of a state machine
implementing the automation logic of the GNC module. It manages
the activation of the other module based on the external input.
• The External Module subsystem includes all the modules that
generates the input variables for the SCAS/Autopilot. The ASACAS
module is one of those modules, and it includes conflict detection
module and the other described before (with the exception of the
Surveillance Processing Module).
• The Sensor Conditioning module performs a conversion from raw
data to engineering data in order to support the autonomous GNC
algorithms.
• The Surveillance Processing module elaborates the raw data
received from the ADS-B IN device in order to feed the External
Modules with a more suitable data structure.
• The WP Management module generates the WP, and the related
information, to be followed.
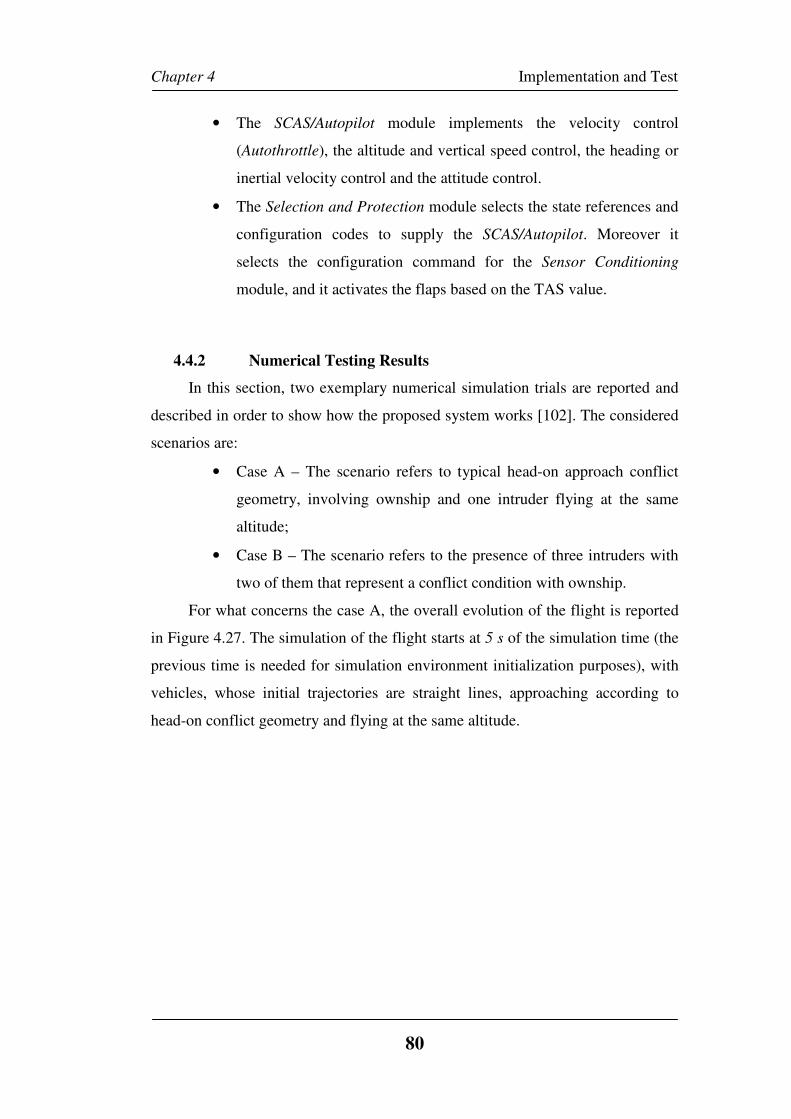
Chapter 4 Implementation and Test
80
• The SCAS/Autopilot module implements the velocity control
(Autothrottle), the altitude and vertical speed control, the heading or
inertial velocity control and the attitude control.
• The Selection and Protection module selects the state references and
configuration codes to supply the SCAS/Autopilot. Moreover it
selects the configuration command for the Sensor Conditioning
module, and it activates the flaps based on the TAS value.
4.4.2 Numerical Testing Results
In this section, two exemplary numerical simulation trials are reported and
described in order to show how the proposed system works [102]. The considered
scenarios are:
• Case A – The scenario refers to typical head-on approach conflict
geometry, involving ownship and one intruder flying at the same
altitude;
• Case B – The scenario refers to the presence of three intruders with
two of them that represent a conflict condition with ownship.
For what concerns the case A, the overall evolution of the flight is reported
in Figure 4.27. The simulation of the flight starts at 5 s of the simulation time (the
previous time is needed for simulation environment initialization purposes), with
vehicles, whose initial trajectories are straight lines, approaching according to
head-on conflict geometry and flying at the same altitude.
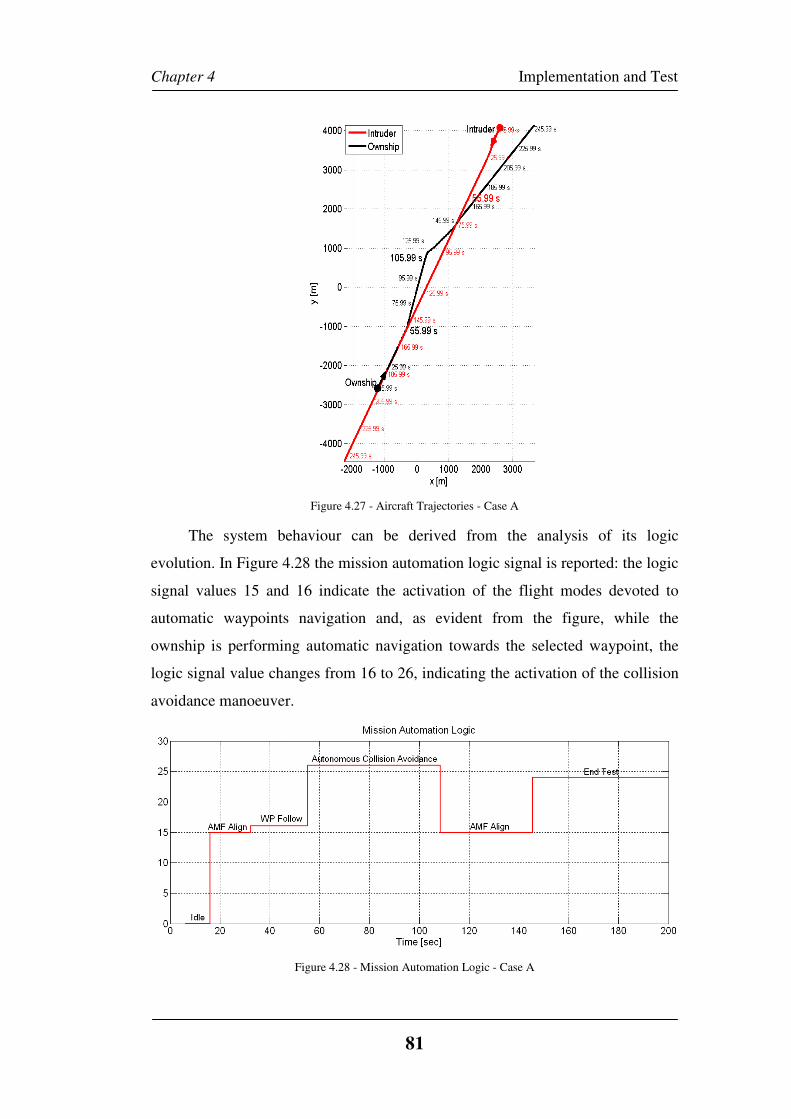
Chapter 4
The system behavio
evolution. In Figure 4
signal values 15 and 16 indicate t
automatic waypoints navigation and, as evident from the figure, while the
ownship is performing automatic navigation towards the selected waypoint, the
logic signal value changes from 16 to 26, indicating the ac
avoidance manoeuver.
Implementation
81
Figure 4.27 - Aircraft Trajectories - Case A
The system behaviour can be derived from the analysis of its logic
4.28 the mission automation logic signal is reported: the logic
signal values 15 and 16 indicate the activation of the flight modes devoted to
automatic waypoints navigation and, as evident from the figure, while the
ownship is performing automatic navigation towards the selected waypoint, the
logic signal value changes from 16 to 26, indicating the activation of the collision
avoidance manoeuver.
Figure 4.28 - Mission Automation Logic - Case A
Implementation and Test
r can be derived from the analysis of its logic
the mission automation logic signal is reported: the logic
he activation of the flight modes devoted to
automatic waypoints navigation and, as evident from the figure, while the
ownship is performing automatic navigation towards the selected waypoint, the
tivation of the collision
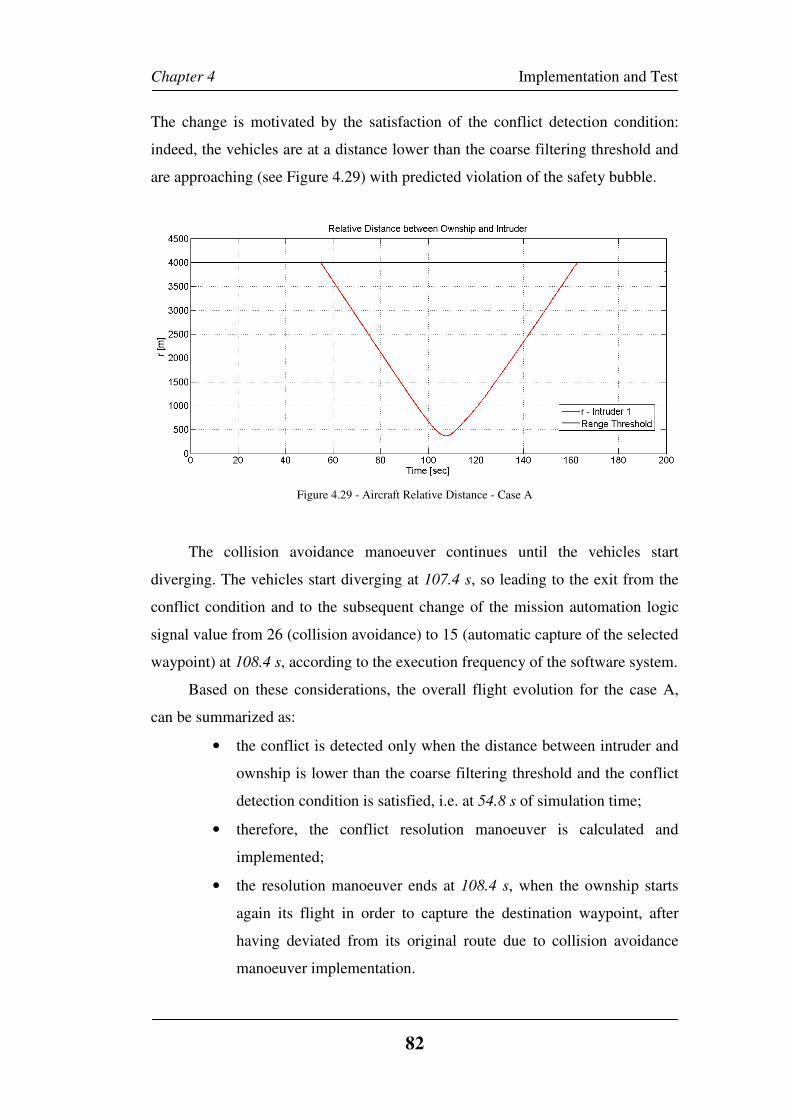
Chapter 4 Implementation and Test
82
The change is motivated by the satisfaction of the conflict detection condition:
indeed, the vehicles are at a distance lower than the coarse filtering threshold and
are approaching (see Figure 4.29) with predicted violation of the safety bubble.
Figure 4.29 - Aircraft Relative Distance - Case A
The collision avoidance manoeuver continues until the vehicles start
diverging. The vehicles start diverging at 107.4 s, so leading to the exit from the
conflict condition and to the subsequent change of the mission automation logic
signal value from 26 (collision avoidance) to 15 (automatic capture of the selected
waypoint) at 108.4 s, according to the execution frequency of the software system.
Based on these considerations, the overall flight evolution for the case A,
can be summarized as:
• the conflict is detected only when the distance between intruder and
ownship is lower than the coarse filtering threshold and the conflict
detection condition is satisfied, i.e. at 54.8 s of simulation time;
• therefore, the conflict resolution manoeuver is calculated and
implemented;
• the resolution manoeuver ends at 108.4 s, when the ownship starts
again its flight in order to capture the destination waypoint, after
having deviated from its original route due to collision avoidance
manoeuver implementation.
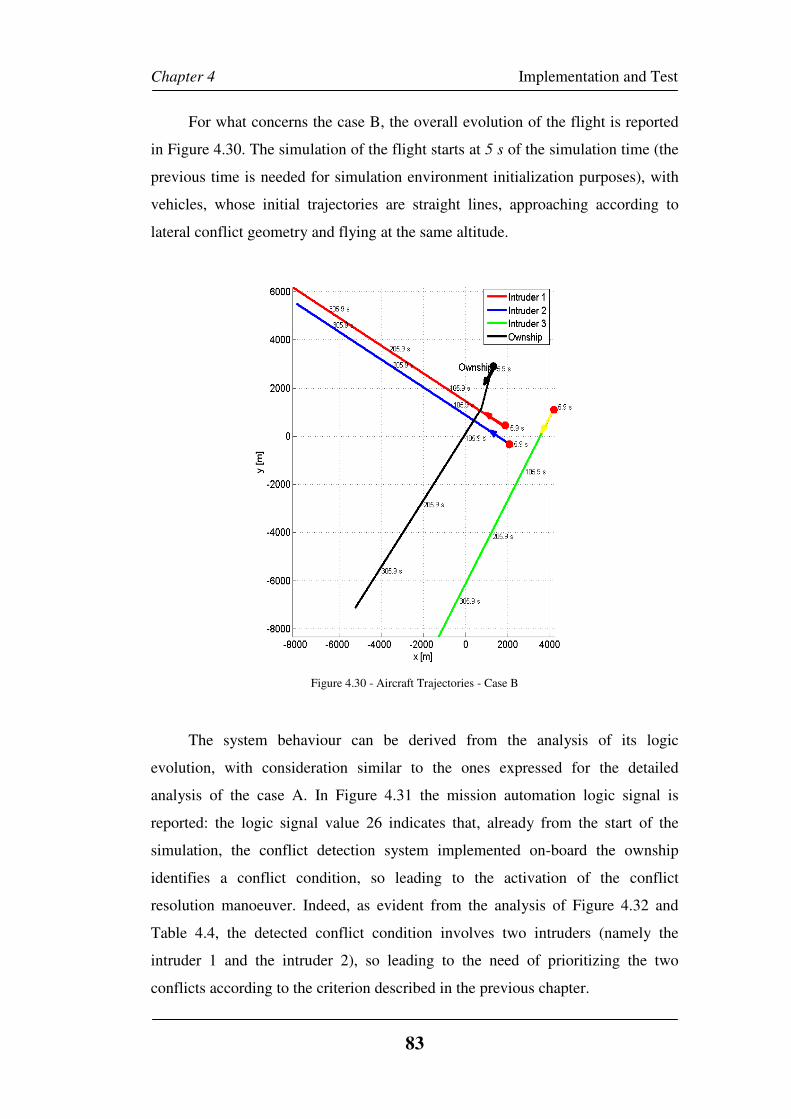
Chapter 4 Implementation and Test
83
For what concerns the case B, the overall evolution of the flight is reported
in Figure 4.30. The simulation of the flight starts at 5 s of the simulation time (the
previous time is needed for simulation environment initialization purposes), with
vehicles, whose initial trajectories are straight lines, approaching according to
lateral conflict geometry and flying at the same altitude.
Figure 4.30 - Aircraft Trajectories - Case B
The system behaviour can be derived from the analysis of its logic
evolution, with consideration similar to the ones expressed for the detailed
analysis of the case A. In Figure 4.31 the mission automation logic signal is
reported: the logic signal value 26 indicates that, already from the start of the
simulation, the conflict detection system implemented on-board the ownship
identifies a conflict condition, so leading to the activation of the conflict
resolution manoeuver. Indeed, as evident from the analysis of Figure 4.32 and
Table 4.4, the detected conflict condition involves two intruders (namely the
intruder 1 and the intruder 2), so leading to the need of prioritizing the two
conflicts according to the criterion described in the previous chapter.
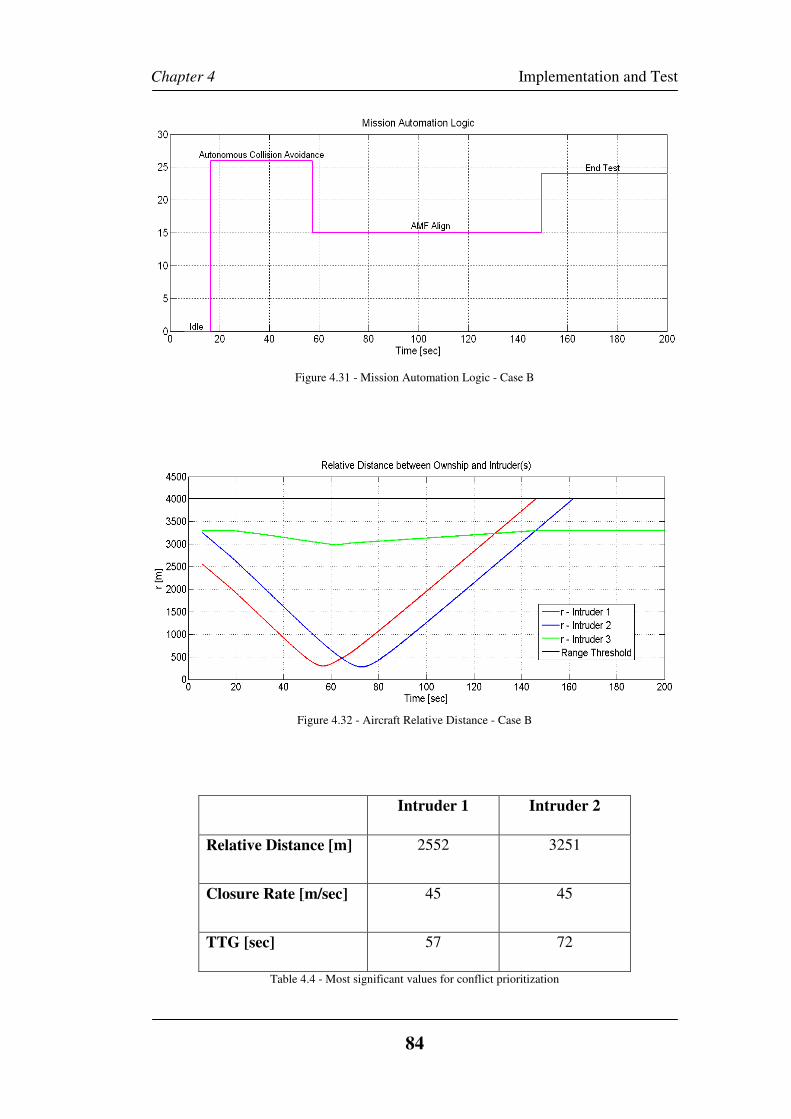
Chapter 4 Implementation and Test
84
Figure 4.31 - Mission Automation Logic - Case B
Figure 4.32 - Aircraft Relative Distance - Case B
Intruder 1 Intruder 2
Relative Distance [m] 2552 3251
Closure Rate [m/sec] 45 45
TTG [sec] 57 72
Table 4.4 - Most significant values for conflict prioritization
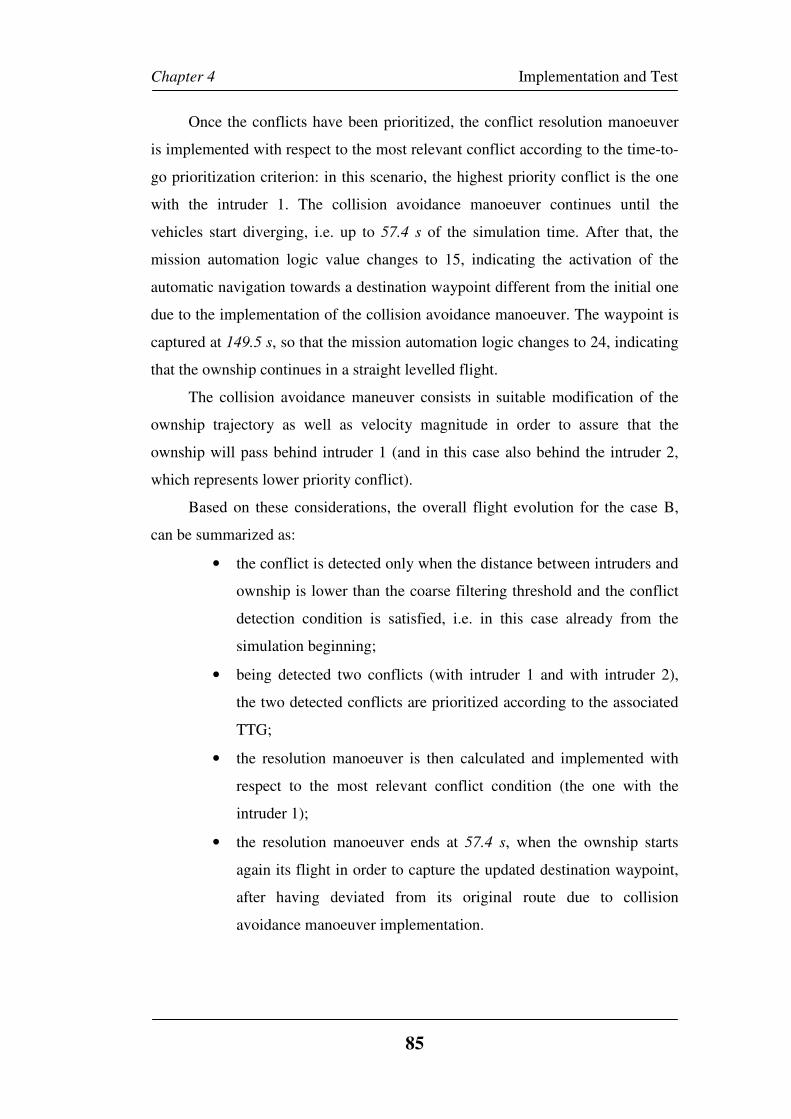
Chapter 4 Implementation and Test
85
Once the conflicts have been prioritized, the conflict resolution manoeuver
is implemented with respect to the most relevant conflict according to the time-to-
go prioritization criterion: in this scenario, the highest priority conflict is the one
with the intruder 1. The collision avoidance manoeuver continues until the
vehicles start diverging, i.e. up to 57.4 s of the simulation time. After that, the
mission automation logic value changes to 15, indicating the activation of the
automatic navigation towards a destination waypoint different from the initial one
due to the implementation of the collision avoidance manoeuver. The waypoint is
captured at 149.5 s, so that the mission automation logic changes to 24, indicating
that the ownship continues in a straight levelled flight.
The collision avoidance maneuver consists in suitable modification of the
ownship trajectory as well as velocity magnitude in order to assure that the
ownship will pass behind intruder 1 (and in this case also behind the intruder 2,
which represents lower priority conflict).
Based on these considerations, the overall flight evolution for the case B,
can be summarized as:
• the conflict is detected only when the distance between intruders and
ownship is lower than the coarse filtering threshold and the conflict
detection condition is satisfied, i.e. in this case already from the
simulation beginning;
• being detected two conflicts (with intruder 1 and with intruder 2),
the two detected conflicts are prioritized according to the associated
TTG;
• the resolution manoeuver is then calculated and implemented with
respect to the most relevant conflict condition (the one with the
intruder 1);
• the resolution manoeuver ends at 57.4 s, when the ownship starts
again its flight in order to capture the updated destination waypoint,
after having deviated from its original route due to collision
avoidance manoeuver implementation.
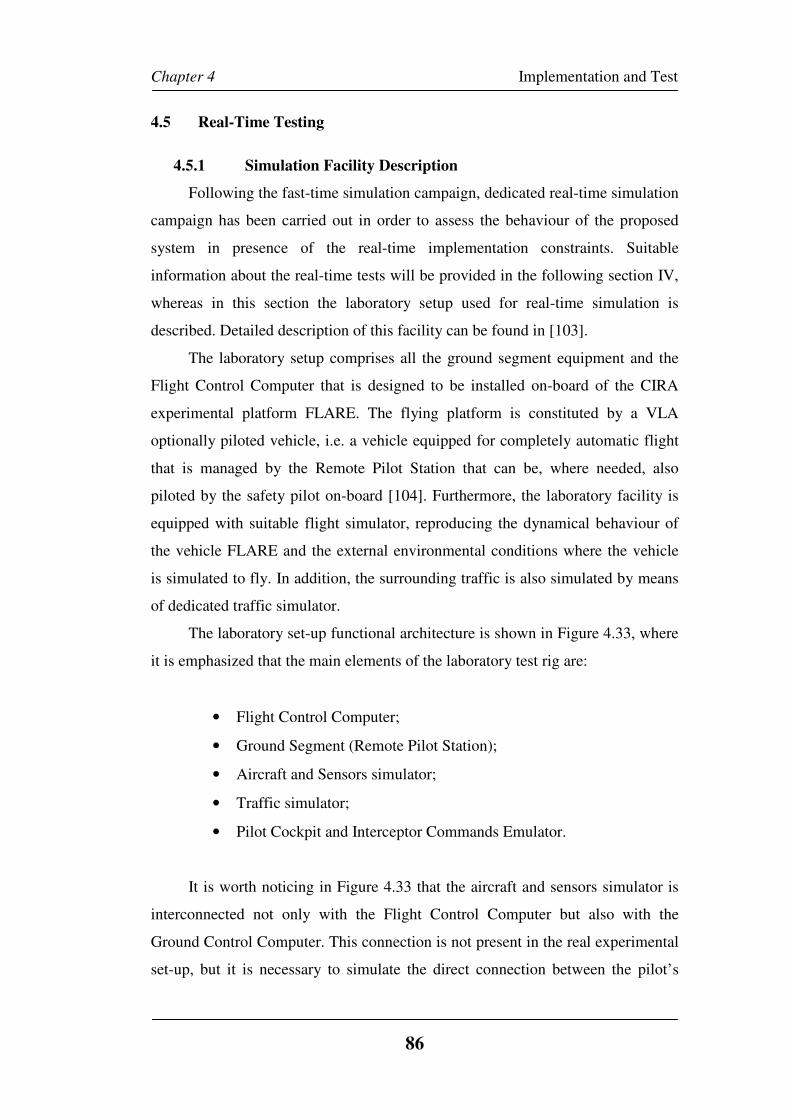
Chapter 4 Implementation and Test
86
4.5 Real-Time Testing
4.5.1 Simulation Facility Description
Following the fast-time simulation campaign, dedicated real-time simulation
campaign has been carried out in order to assess the behaviour of the proposed
system in presence of the real-time implementation constraints. Suitable
information about the real-time tests will be provided in the following section IV,
whereas in this section the laboratory setup used for real-time simulation is
described. Detailed description of this facility can be found in [103].
The laboratory setup comprises all the ground segment equipment and the
Flight Control Computer that is designed to be installed on-board of the CIRA
experimental platform FLARE. The flying platform is constituted by a VLA
optionally piloted vehicle, i.e. a vehicle equipped for completely automatic flight
that is managed by the Remote Pilot Station that can be, where needed, also
piloted by the safety pilot on-board [104]. Furthermore, the laboratory facility is
equipped with suitable flight simulator, reproducing the dynamical behaviour of
the vehicle FLARE and the external environmental conditions where the vehicle
is simulated to fly. In addition, the surrounding traffic is also simulated by means
of dedicated traffic simulator.
The laboratory set-up functional architecture is shown in Figure 4.33, where
it is emphasized that the main elements of the laboratory test rig are:
• Flight Control Computer;
• Ground Segment (Remote Pilot Station);
• Aircraft and Sensors simulator;
• Traffic simulator;
• Pilot Cockpit and Interceptor Commands Emulator.
It is worth noticing in Figure 4.33 that the aircraft and sensors simulator is
interconnected not only with the Flight Control Computer but also with the
Ground Control Computer. This connection is not present in the real experimental
set-up, but it is necessary to simulate the direct connection between the pilot’s
Chapter 4 Implementation and Test
87
cockpit and the aircraft because in the laboratory set-up the Ground Control
Computer manages also the communications with the pilot's cockpit simulation
computer.
Figure 4.33 - Laboratory Setup Architecture
Furthermore, in the laboratory setup the same hardware platform is used for
the acquisition of pilot direct link commands, for the management of the
laboratory pilot real cockpit and for the data communications management
between aircraft simulator and ground segment. This does not constitute a
limitation of the proposed real-time validation test rig, because the software
module devoted to the pilot commands acquisition and laboratory real cockpit
management does not have any link with the software module devoted to the data
Traffic
Simulator
ADSB
Chapter 4 Implementation and Test
88
management between the ground segment and the on board segment, even if they
are allocated on the same hardware.
The traffic simulator is connected only to aircraft and sensors simulator. It
provides the simulation of the ADS-B OUT signals sent by the surrounding
vehicles and received by the ADS-B IN device simulated on-board of the FLARE
platform. The simulation of the ADS-B OUT signal transmission includes the
possibility of reproducing also failures like link loss , delay and so on.
Nevertheless, it is worth to emphasize here that simulation of failures and/or
disturbances affecting the ADS-B signal broadcast has not been considered in the
real-time simulation campaign addressed in this paper, where ideal behaviour of
the ADS-B signal exchange has been reproduced. The external sensors interface
of the ADSB module, similarly to the interfaces of the other sensors, reproduces
the real protocol.
The aim of the laboratory set-up is to test the software implemented on the
Flight Control Computer and the ground segment software needed for the mission
management. Achieving this goal is done correctly simulating all sensors on
board. The software architecture of the aircraft and sensors simulator is composed
by the modules listed in the following:
• six degrees of freedom (6dof) aircraft model module;
• sensors simulation module;
• external interface sensors simulation module;
• actuators simulation module;
• external weather conditions simulation module;
• pilot’s cockpit management module.
The 6dof aircraft model module is the core of the whole simulation
software. The sensors and external interface sensors simulation modules are based
on the COTS elements installed on the experimental set-up. The actuators
simulation module implements the open loop model of each actuator. The external
weather simulation is necessary to reproduce wind gust, shear and turbulence in
all flight phases. Nevertheless, in the test cases presented in the next section, the
wind disturbances have not been reproduced, because the provided description
aims emphasizing the behaviour of the proposed conflict detection system and not
Chapter 4 Implementation and Test
89
the guidance system robustness with respect to external disturbances. It is worth
to emphasize here that for the description of the overall performances and
functionalities of the Guidance, Navigation and Control system implemented on-
board the FLARE vehicle the reader can be referred to literature papers in [105] -
[108].
The Pilot’s cockpit management, finally, is a software module which
acquires the laboratory pilot commands trough an Ethernet link between the 6dof
aircraft model of the vehicle and the pilot commands acquisition software
implemented on a PC104.
4.5.2 Real-Time Testing Results
Up to date the proposed system has been validated by means of fast-time
numerical simulations, including the analysis of relevant conflict scenarios. Those
scenarios have been defined with the aim of assessing the applicability of ADS-B
data for conflict detection purposes. The ownship dynamic has been simulated by
means of a 6dof aircraft model with autopilot and auto-throttle system, whereas
the intruders’ motion model has been simulated by means of a kinematic 3dof
motion model.
Based on the positive results obtained in the fast-time simulation campaign,
the activities devoted to the development of the proposed system addressed the
real-time simulation stage [109]. The real-time simulation campaign included
several scenarios, involving different conflict geometries and one or more
conflicting vehicles. Three significant real-time simulation trials are reported and
discussed, which are considered suitable to describe the testing of the overall
architecture paying particular attention to the conflict detection and the
prioritization modules. In all the scenarios here reported nominal behavior of the
ADS-B systems (both the OUT installed on-board the surrounding vehicles and
the IN installed on-board the ownship) has been supposed and no external
disturbances (such has wind) have been reproduced..
The considered scenarios are:
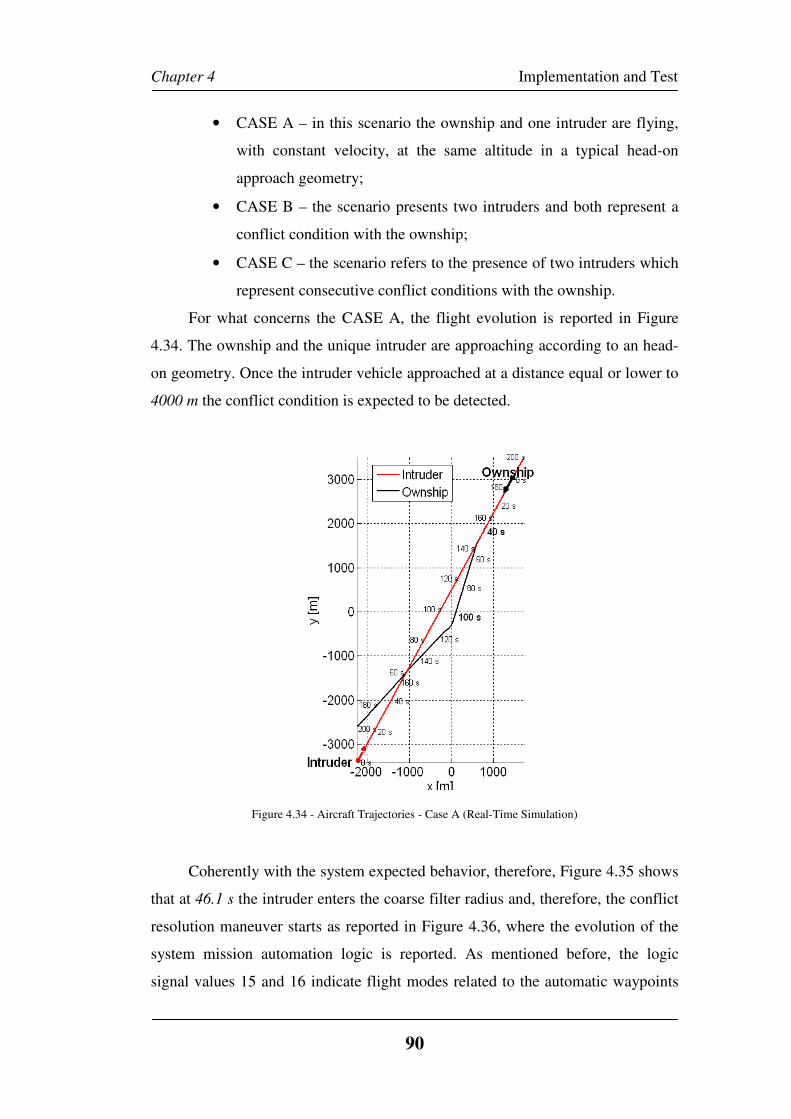
Chapter 4 Implementation and Test
90
• CASE A – in this scenario the ownship and one intruder are flying,
with constant velocity, at the same altitude in a typical head-on
approach geometry;
• CASE B – the scenario presents two intruders and both represent a
conflict condition with the ownship;
• CASE C – the scenario refers to the presence of two intruders which
represent consecutive conflict conditions with the ownship.
For what concerns the CASE A, the flight evolution is reported in Figure
4.34. The ownship and the unique intruder are approaching according to an head-
on geometry. Once the intruder vehicle approached at a distance equal or lower to
4000 m the conflict condition is expected to be detected.
Figure 4.34 - Aircraft Trajectories - Case A (Real-Time Simulation)
Coherently with the system expected behavior, therefore, Figure 4.35 shows
that at 46.1 s the intruder enters the coarse filter radius and, therefore, the conflict
resolution maneuver starts as reported in Figure 4.36, where the evolution of the
system mission automation logic is reported. As mentioned before, the logic
signal values 15 and 16 indicate flight modes related to the automatic waypoints
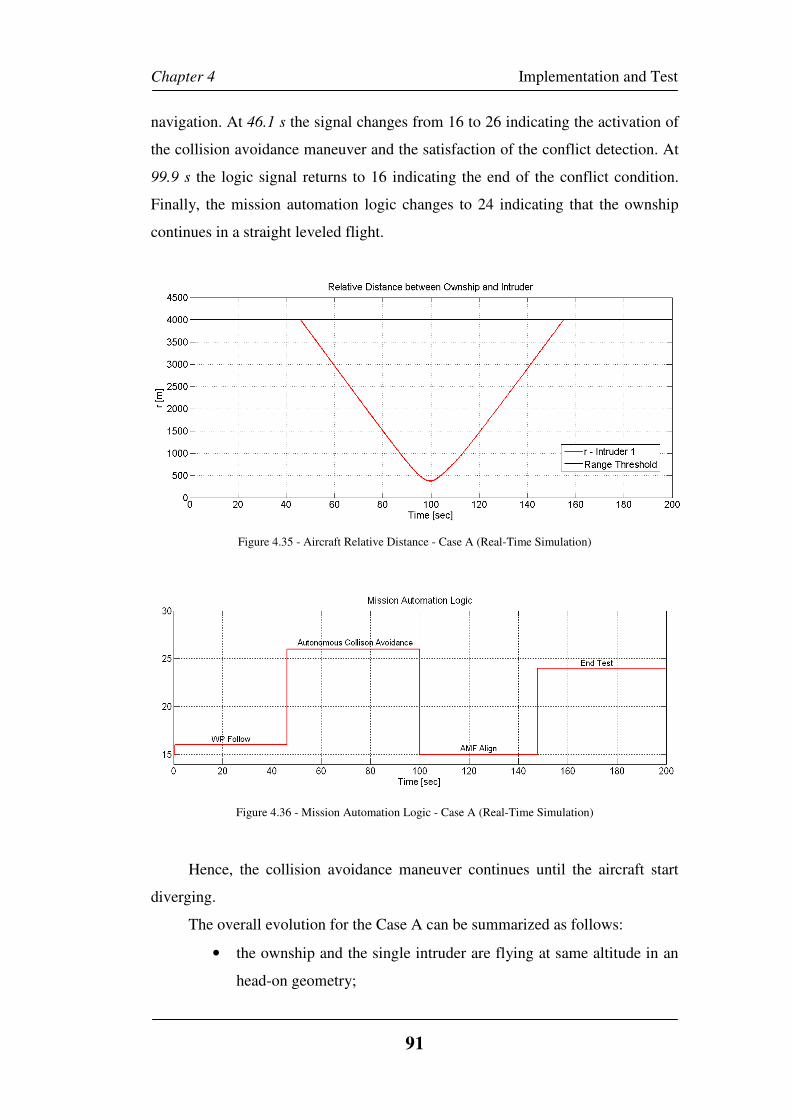
Chapter 4 Implementation and Test
91
navigation. At 46.1 s the signal changes from 16 to 26 indicating the activation of
the collision avoidance maneuver and the satisfaction of the conflict detection. At
99.9 s the logic signal returns to 16 indicating the end of the conflict condition.
Finally, the mission automation logic changes to 24 indicating that the ownship
continues in a straight leveled flight.
Figure 4.35 - Aircraft Relative Distance - Case A (Real-Time Simulation)
Figure 4.36 - Mission Automation Logic - Case A (Real-Time Simulation)
Hence, the collision avoidance maneuver continues until the aircraft start
diverging.
The overall evolution for the Case A can be summarized as follows:
• the ownship and the single intruder are flying at same altitude in an
head-on geometry;
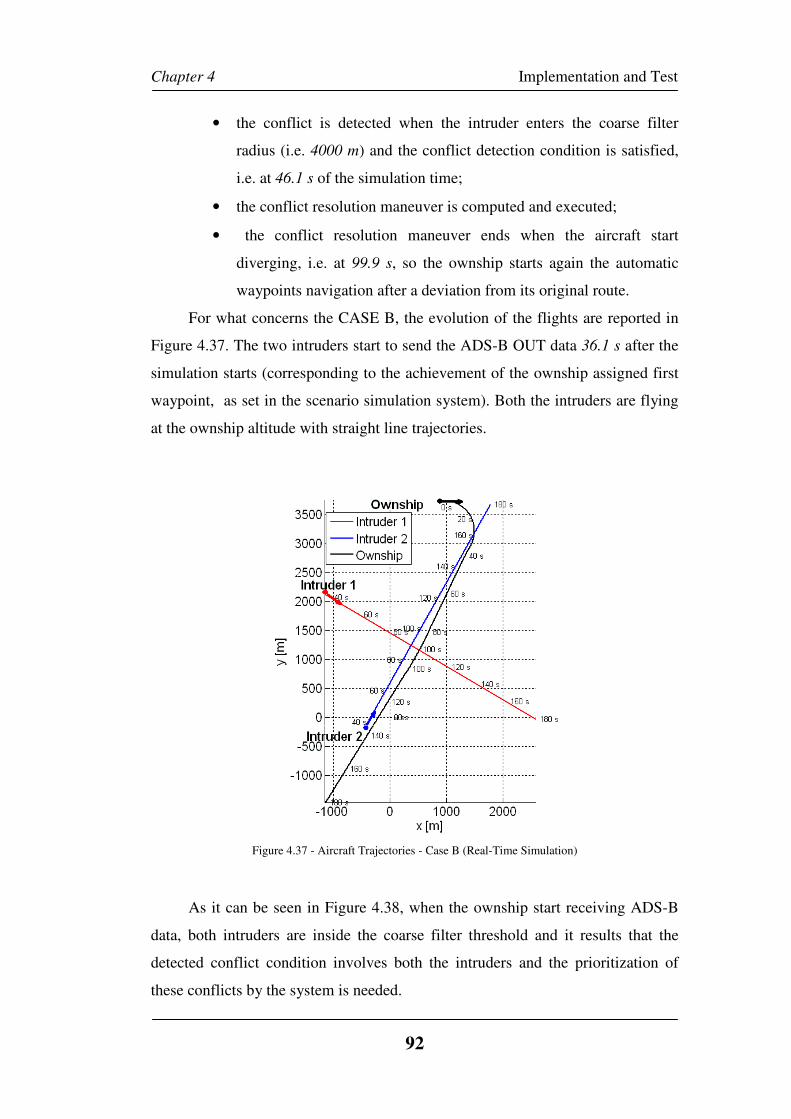
Chapter 4 Implementation and Test
92
• the conflict is detected when the intruder enters the coarse filter
radius (i.e. 4000 m) and the conflict detection condition is satisfied,
i.e. at 46.1 s of the simulation time;
• the conflict resolution maneuver is computed and executed;
• the conflict resolution maneuver ends when the aircraft start
diverging, i.e. at 99.9 s, so the ownship starts again the automatic
waypoints navigation after a deviation from its original route.
For what concerns the CASE B, the evolution of the flights are reported in
Figure 4.37. The two intruders start to send the ADS-B OUT data 36.1 s after the
simulation starts (corresponding to the achievement of the ownship assigned first
waypoint, as set in the scenario simulation system). Both the intruders are flying
at the ownship altitude with straight line trajectories.
Figure 4.37 - Aircraft Trajectories - Case B (Real-Time Simulation)
As it can be seen in Figure 4.38, when the ownship start receiving ADS-B
data, both intruders are inside the coarse filter threshold and it results that the
detected conflict condition involves both the intruders and the prioritization of
these conflicts by the system is needed.
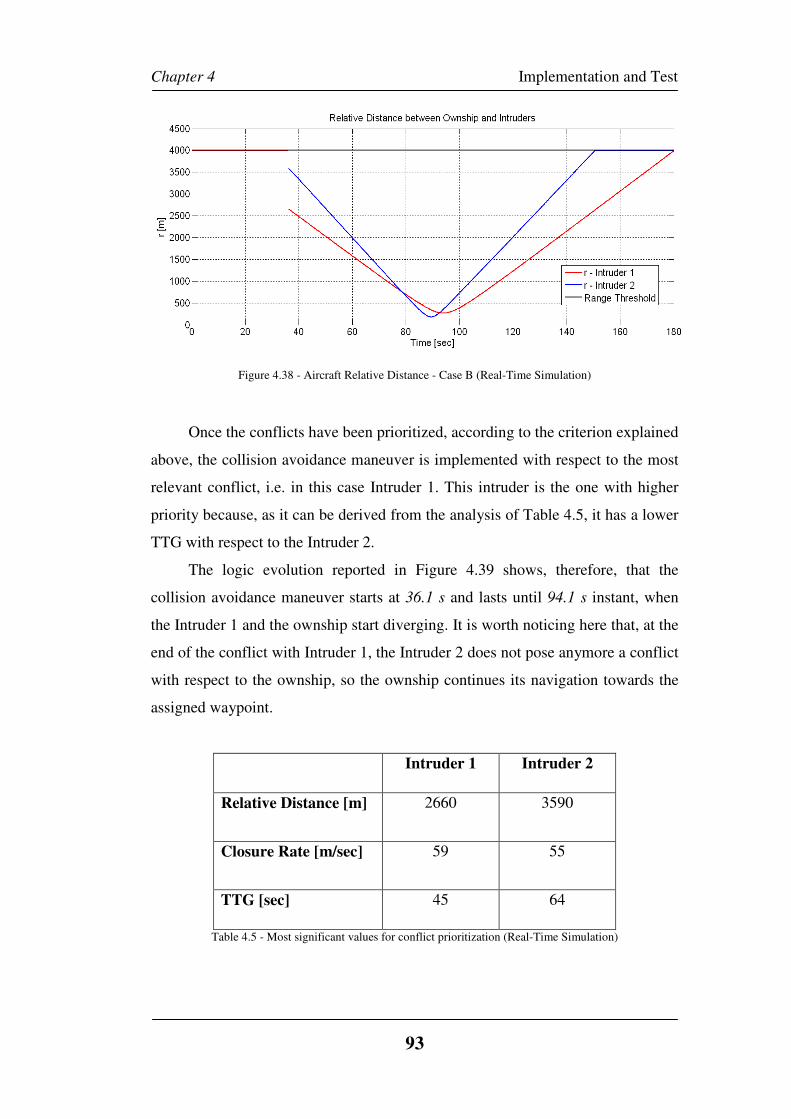
Chapter 4 Implementation and Test
93
Figure 4.38 - Aircraft Relative Distance - Case B (Real-Time Simulation)
Once the conflicts have been prioritized, according to the criterion explained
above, the collision avoidance maneuver is implemented with respect to the most
relevant conflict, i.e. in this case Intruder 1. This intruder is the one with higher
priority because, as it can be derived from the analysis of Table 4.5, it has a lower
TTG with respect to the Intruder 2.
The logic evolution reported in Figure 4.39 shows, therefore, that the
collision avoidance maneuver starts at 36.1 s and lasts until 94.1 s instant, when
the Intruder 1 and the ownship start diverging. It is worth noticing here that, at the
end of the conflict with Intruder 1, the Intruder 2 does not pose anymore a conflict
with respect to the ownship, so the ownship continues its navigation towards the
assigned waypoint.
Intruder 1 Intruder 2
Relative Distance [m] 2660 3590
Closure Rate [m/sec] 59 55
TTG [sec] 45 64
Table 4.5 - Most significant values for conflict prioritization (Real-Time Simulation)
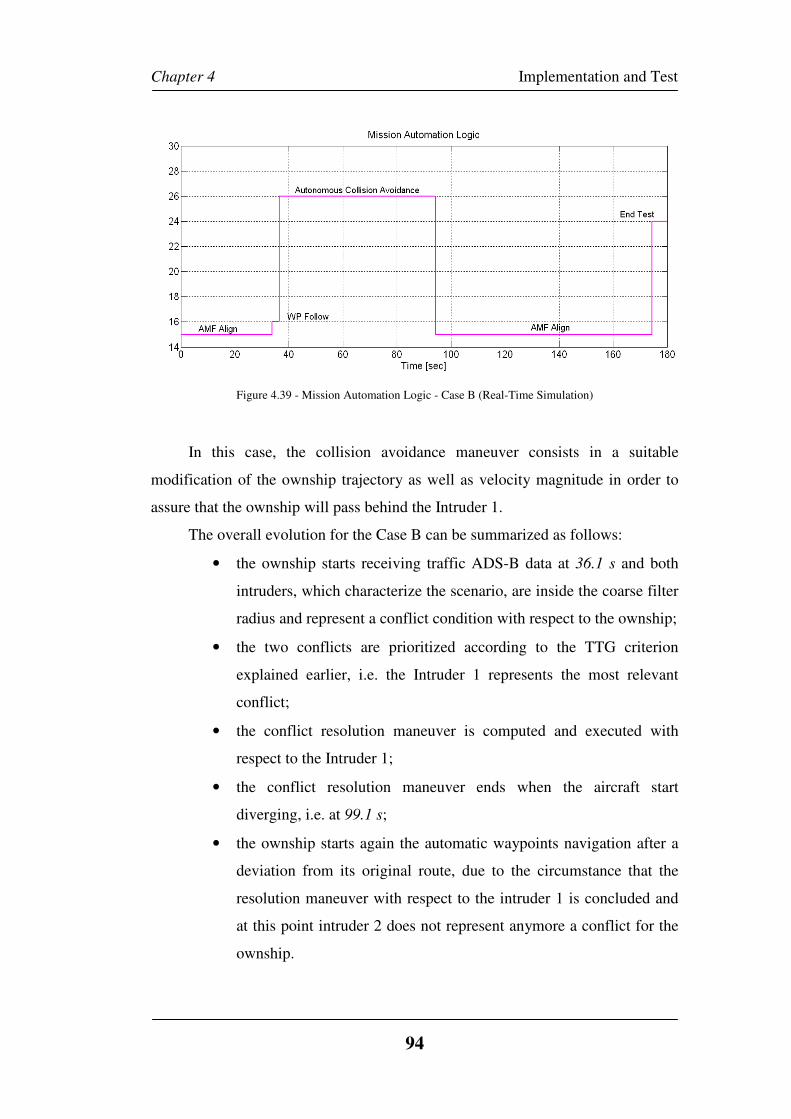
Chapter 4 Implementation and Test
94
Figure 4.39 - Mission Automation Logic - Case B (Real-Time Simulation)
In this case, the collision avoidance maneuver consists in a suitable
modification of the ownship trajectory as well as velocity magnitude in order to
assure that the ownship will pass behind the Intruder 1.
The overall evolution for the Case B can be summarized as follows:
• the ownship starts receiving traffic ADS-B data at 36.1 s and both
intruders, which characterize the scenario, are inside the coarse filter
radius and represent a conflict condition with respect to the ownship;
• the two conflicts are prioritized according to the TTG criterion
explained earlier, i.e. the Intruder 1 represents the most relevant
conflict;
• the conflict resolution maneuver is computed and executed with
respect to the Intruder 1;
• the conflict resolution maneuver ends when the aircraft start
diverging, i.e. at 99.1 s;
• the ownship starts again the automatic waypoints navigation after a
deviation from its original route, due to the circumstance that the
resolution maneuver with respect to the intruder 1 is concluded and
at this point intruder 2 does not represent anymore a conflict for the
ownship.
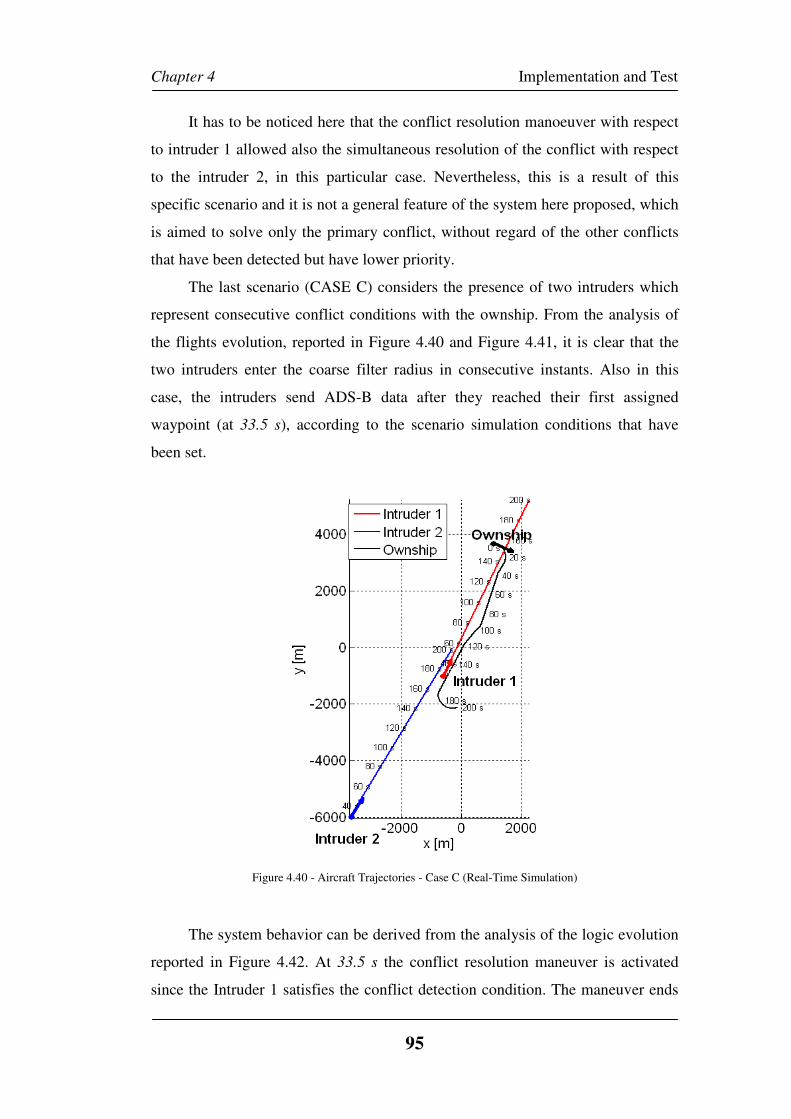
Chapter 4 Implementation and Test
95
It has to be noticed here that the conflict resolution manoeuver with respect
to intruder 1 allowed also the simultaneous resolution of the conflict with respect
to the intruder 2, in this particular case. Nevertheless, this is a result of this
specific scenario and it is not a general feature of the system here proposed, which
is aimed to solve only the primary conflict, without regard of the other conflicts
that have been detected but have lower priority.
The last scenario (CASE C) considers the presence of two intruders which
represent consecutive conflict conditions with the ownship. From the analysis of
the flights evolution, reported in Figure 4.40 and Figure 4.41, it is clear that the
two intruders enter the coarse filter radius in consecutive instants. Also in this
case, the intruders send ADS-B data after they reached their first assigned
waypoint (at 33.5 s), according to the scenario simulation conditions that have
been set.
Figure 4.40 - Aircraft Trajectories - Case C (Real-Time Simulation)
The system behavior can be derived from the analysis of the logic evolution
reported in Figure 4.42. At 33.5 s the conflict resolution maneuver is activated
since the Intruder 1 satisfies the conflict detection condition. The maneuver ends
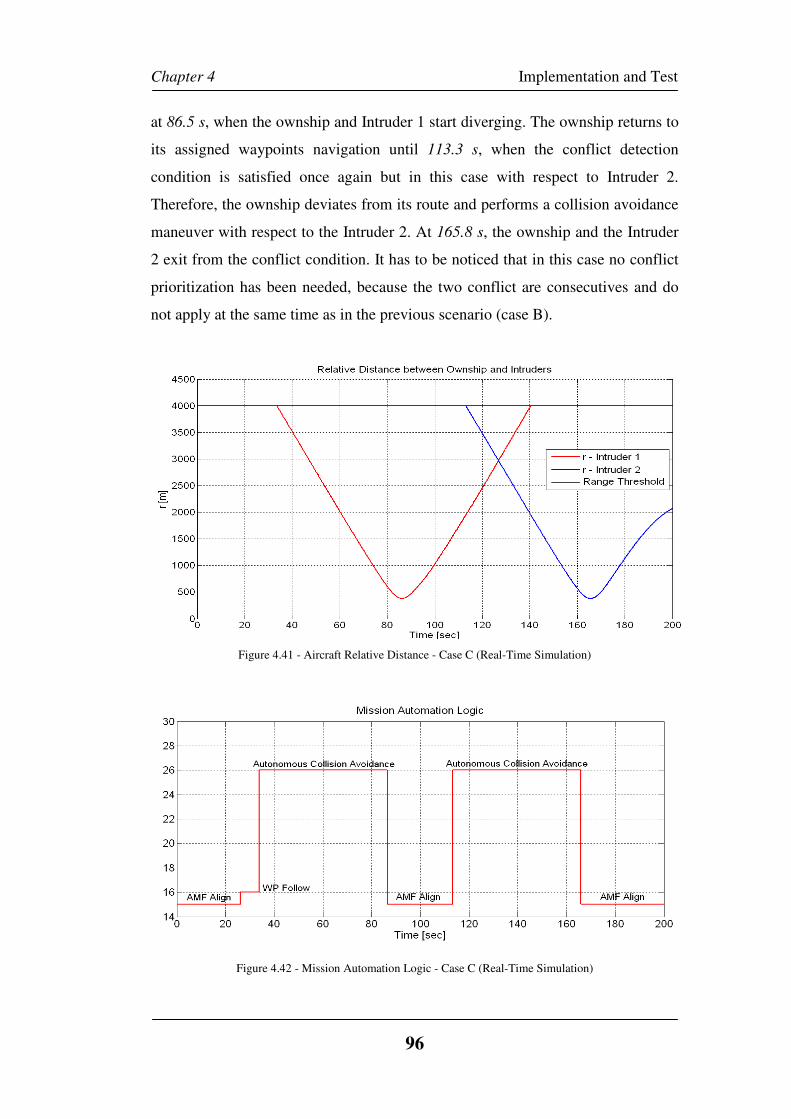
Chapter 4 Implementation and Test
96
at 86.5 s, when the ownship and Intruder 1 start diverging. The ownship returns to
its assigned waypoints navigation until 113.3 s, when the conflict detection
condition is satisfied once again but in this case with respect to Intruder 2.
Therefore, the ownship deviates from its route and performs a collision avoidance
maneuver with respect to the Intruder 2. At 165.8 s, the ownship and the Intruder
2 exit from the conflict condition. It has to be noticed that in this case no conflict
prioritization has been needed, because the two conflict are consecutives and do
not apply at the same time as in the previous scenario (case B).
Figure 4.41 - Aircraft Relative Distance - Case C (Real-Time Simulation)
Figure 4.42 - Mission Automation Logic - Case C (Real-Time Simulation)
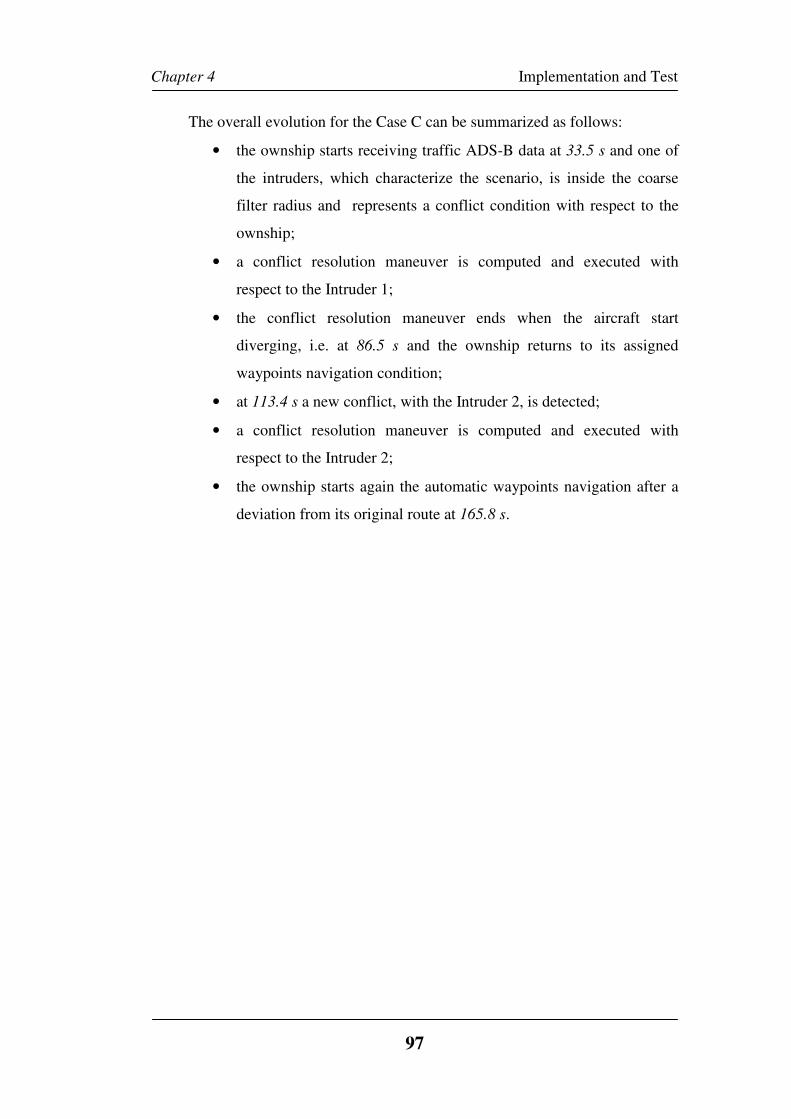
Chapter 4 Implementation and Test
97
The overall evolution for the Case C can be summarized as follows:
• the ownship starts receiving traffic ADS-B data at 33.5 s and one of
the intruders, which characterize the scenario, is inside the coarse
filter radius and represents a conflict condition with respect to the
ownship;
• a conflict resolution maneuver is computed and executed with
respect to the Intruder 1;
• the conflict resolution maneuver ends when the aircraft start
diverging, i.e. at 86.5 s and the ownship returns to its assigned
waypoints navigation condition;
• at 113.4 s a new conflict, with the Intruder 2, is detected;
• a conflict resolution maneuver is computed and executed with
respect to the Intruder 2;
• the ownship starts again the automatic waypoints navigation after a
deviation from its original route at 165.8 s.
Conclusions
98
Conclusions
The aim of the work is to introduce an innovative ADS-B data based
conflict detection system. The intended system applicability is for both manned
commercial aircraft, as an aid to pilots system, and UAS, where high automation
levels are required, as part of an autonomous sense and avoid system.
Based on the results of the simulations, the proposed approach shows to be
able to implement the use of the surveillance data provided by the ADS-B IN for
conflict detection purposes. This includes the possibility to support both advanced
mission visualization displays for pilot situation awareness and automatic
algorithms for conflict detection and resolution, for both tactical separation
assurance and emergency collision avoidance.
Moreover, the real-time simulated scenarios above reported show that the
proposed approach to conflict detection and prioritization based on the use of
ADS-B surveillance data is suitable for efficient real-time implementation with no
numerical and/or computational issues.
Test results demonstrated that the proposed system is suitable for integration
as part of a complete airborne sense and avoid systems although a robust safety
assessment would be needed through extensive simulation and flight test
campaigns.
Currently the proposed algorithms are included in the on-going European
project RAID (RPAS ATM Integration Demonstration) in the framework of
SESAR JU program. The project aims to verify the possibility of the proposed
system to support the airborne SAA system for either Self-Separation and
Collision Avoidance functionalities in order to assist the integration of UAVs in
the NAS.
References
99
References
[1] Han, J., Xu, Y., Di, L., Chen, Y.Q., Low-cost Multi-UAV Technologies for
Contour Mapping of Nuclear Radiation Field, Journal of Intelligent & Robotic
Systems, Volume 70, Issue 1-4, pp. 401-410, 2013.
[2] J. Zhang, W. Liu, Y. Wu, Novel Technique for Vision-Based UAV
Navigation, IEEE Aerospace and Electronic System, Volume 47, Issue 4, pp.
2731 – 2741, 2011.
[3] Cook, S. P., Lacher, A. R., Maroney, D. R., Zeitlin, A. D., UAS Sense and
Avoid Development – the Challenges of Technology, Standards, and
Certification, 50th
AIAA Aerospace Sciences Meeting, Nashville, Tennessee,
09 - 12 January, 2012.
[4] Marshall, D.M., Trapnell, B. M., Mendez, J. E., Berseth, B. L., Schultz, R. R.,
Semke, W. H., Regulatory and Technology Survey of Sense-and-Avoid for
UAS, AIAA Infotech@Aerospace Conference and Exhibit, Rohnert Park,
California, 7 – 10 May, 2007.
[5] Part 60-Scheduled Air Carrier Rules, 19 Fed. Reg. 6871, 1954.
[6] Code of Federal Regulations – Tiltle 14 Aeronautics and Space, Part 91
General operating and flight rules, Section 113, Right-of-way rules: Except
water operations.
[7] Code of Federal Regulations – Tiltle 14 Aeronautics and Space, Part 91
General operating and flight rules, Section 111, Operating Near other Aircraft.
[8] 14 C.F.R. Section 1.1, 2005.
[9] 14 C.F.R. Part 101, 2005.
[10] Walker, J., 2010-2011 UAS Yearbook – UAS: The Global Perspective, 8th
Edition, Copyright Blyenburgh & Co, Page 71, 2010.
[11] 72 FR 6689, 2007.
[12] Federal Aviation Administration, Sense And Avoid (SAA) for Unmanned
Aircraft Systems (UAS), October 2009.
[13] http://www.rtca.org/content.asp?pl=108&sl=33&contentid=121
[14] http://www.rtca.org/content.asp?pl=108&sl=33&contentid=178
References
100
[15] Federal Aviation Administration, Order 7610.4K, Special Military
Operation, 2004.
[16] Pellebergs, J., The MIDCAS Project, ICAS 2010, 27th International
Congress of the Aeronautical Sciences, Nice, France, 19-24 September, 2010.
[17] Hottman, S. B., Hansen, K. R., Berry, M.,, Literature Review on Detect,
Sense, and Avoid Technology for Unmanned Aircraft Systems, Federal
Aviation Administration DOT/FAA/AR-08/41, September, 2009.
[18] Zeitlin, A., Progress on Requirements and Standards for Sense & Avoid,
MITRE Corporation, 2010.
[19] RTCA, Inc., Minimum Operational Performance Standards for Traffic
Alert and Collision Avoidance System II (TCAS II) Version 7.1, DO-185B,
June, 2008.
[20] Sabatini, N., Statement of Nicholas A. Sabatini, Associate Administrator
for Aviation Safety, Testimony – Statement of Nicholas A. Sabatini, 29
March, 2006.
[21] Insinna, V., Military, Industry Racing to Create Sense-and-Avoid Systems,
National Defence Industrial Association, May, 2014.
[22] Muraru, A., A Critical Analysis of Sense and Avoid Technologies for
Modern UAVs, Advances in Mechanical Engineering, Volume 2, Number 1
March, 2012.
[23] Billingsley, T.B., Kochenderfer, M.J., Collision Avoidance for General
Aviation, IEEE Aerosp. Electron. Syst., 2012.
[24] Zeitlin, A. D., McLaughlin, M. P., Safety of cooperation collision
avoidance for unmanned aircraft, IEEE Aerosp. Electron. Syst., 2007.
[25] International Civil Aviation Organization, ADS-B Implementation and
Operations Guidance Document. Edition 3.0, 2007.
[26] Mozdzanowska, A., Weibel, R., Marais, K., Lester, E., Weigel, A.,
Hansman, R.J., Dynamics of Air Transportation System Transition and
Implications for ADS-B Equipage in Proceedings of7th AIAA Aviation
Technology, Integration and Operations Conference (ATIO), Belfast,
Northern Ireland, 2007.
References
101
[27] SESAR Consortium, Work Programme for 2008-2013, Doc. SESAR
Consortium No. DLM-0710-002-01-00, Bruxelles, Belgium, 2008.
[28] Joint Planning and Development Office, Concept of Operations for the
Next Generation Air Transportation System, v.2.0, 2007.
[29] Skolnik, M.I., Radar Handbook, McGraw Hill Professional. New York,
NY, USA, 1990.
[30] SELEX ES, LOAM – Laser Obstacle Avoidance System, from
http://www.selexelsag.com/internet/?open0=5338&open1=5350§ion=CO
MM&showentry=17089, 2015.
[31] Yu, X., Zhang, Y., Sense and avoid technologies with applications to
unmanned aircraft systems: Review and prospects, Progress in Aerospace
Sciences, Elsevier Ltd., 2015.
[32] Karhoff, B. C., Limb, J. I., Oravsky, S. W., Shephard, A. D., Eyes in the
Domestic Sky: An Assessment of Sense and Avoid Technology for the
Army’s “Warrior” Unmanned Aerial Vehicle, in Proc. Of IEEE System and
Information Engineering Design Symposium, Charlottesville, VA, USA,
2006.
[33] Lester, T., Cook, S., Noth, K., USAF Airborne Sense And Avoid
(ABSAA) Airworthiness and Operational Approval Approach, Version 1.0,
MITRE Corporation, 31 January, 2014.
[34] Lincoln Laboratory, Tech Notes on Airborne Sense and Avoid Radar
Panel, Massachusetts Institute of Technology (MIT), October, 2014 from
http://www.ll.mit.edu/publications/technotes/TechNote_ABSAAPanel.pdf
[35] Owen, M. P., Duffy, S. M., Edwards, M. W. M., Unmanned Aircraft Sense
and Avoid Radar: Surrogate Flight Testing Performance Evaluation, in Proc.
Of IEEE Radar Conference, Cincinnati, OH, USA, 2014.
[36] Itcia, E., Wasselin, J.P., Mazuel, S., Otten, M., Huizing, A., FMCW Radar
for Sense Fucntion of Sense & Avoid Systems onboard UAVs, Proc. Of SPIE
Vol 8899, Emerging Technologies in Security and Defence; and Quantum
Security II; and Unmanned Sensor Systems X, 889914, 23 October, 2013.
References
102
[37] Moses, A., Rutherford, M. J., Valavanis, K. P., Radar-based detection and
identification for miniature air vehicles, in Proc. Of the 2011 IEEE
International Conference on Control Applications, Denver, CO, USA 2011.
[38] Lai, J., Mejias, L., Ford, J.J., Airborne vision-based collision-detection
system, Journal of Field Robotics, Volume 28, Issue 2, pp. 137-157, 2011.
[39] Kopp, C., Active Electronically Steered Arrays, Air Power Australia
website, 30 May, 2007. http://www.ausairpower.net/aesa-intro.html
[40] Zarandy, A., Zsedrovits, T., Nagy, Z., Kiss, A., Roska, T., Visual sense-
and-avoid system for UAVs, Proc. Of 13th International Workshop on
Cellular Nanoscale Networks and their Applications, pp. 1–5, 2012.
[41] Fasano, G., Accardo, D., Tirri, A. E., Moccia, A., De Lellis, E.,
Morphological filtering and target tracking for vision-based UAS sense and
avoid, IEEE International Conference on Unmanned Aircraft Systems
(ICUAS), Orlando, FL, 27-30 May, 2014.
[42] Kim, J.-H., Lee, D. W., Cho, K.-R., Jo, S.-Y., Kim, J.-H., Min, C.-O., Han,
D.-I., Cho, S.-J., Development of an electro-optical system for small UAV,
Aerospace Scince and Technology, Elsevier Masson SAS., 2010.
[43] Minwalla, C., Thomas, P., Ellis, K., Hornsey, R., Jenings, Flight Test
Evaluation of a Prototype Optical Instrument for airborne Sense-and-Avoid
Applications, Proc. Of SPIE Vol. 8387, 2012.
[44] Griffith, J. D., Kochenderfer M. J., Kuchar J. K., Electro-Optical System
Analysis for Sense and Avoid, AIAA Guidance, Navigation and Control
Conference and Exhibit, Honolulu, Hawaii, 18-21 August 2008.
[45] Finn, A., Franklin, S., Acoustic Sense and Avoid for UAV’s, In Proc. Of
7th
International conference on Intelligent Sensors, Sensor Networks and
Information Processing, Adelaide, SA, Australia, 2011.
[46] Lo, K. W., Ferguson, B. G., Gai, Y. J., Maguer, A., Aircraft flight
parameter estimation using acoustic multipath delays, IEEE Trans. Aerosp.
Electron. Syst., 2003.
[47] Case, E. E., Zelnio, A. M., Rigling, B. D., Low-cost acoustic array for
small UAV detection and tracking, in Proc. Of IEEE National Aerospace and
Electronics Conference, Dayton, OH, USA, 2008.
References
103
[48] Milkie, T., Passive Acoustic Non-Cooperative Collision Alert System
(PANCAS) for UAV Sense and Avoid. Unpublished white paper by SARA,
Inc, 2007.
[49] Ramasamy, S., Sabatini, R., Gardi, A., Avionics Sensor Fusion for Small
Size Unmanned Aircraft Sense-and-Avoid, IEEE Metrology for Aerospace
(MetroAerospace) 2014, pp. 271-276, Benevento, Italy, 2014.
[50] Cornic, P., Garrec, P., KemKemian, S., Ratton, L., Sense and Avoid Radar
using DataFusion with Other Sensors, IEEE Aerospace Conference, Big Sky,
USA, March, 2010.
[51] Chen, R. H., Gevorkian, A., Fung, A., Chen, W.-Z., Multi-Sensor Data
Integration for Autonomous Sense and Avoid, Infotech @ Aerospace 2011, St.
Louis, Missouri, 29 -31 March, 2011.
[52] Graham, S., Chen, W.-Z., De Luca, J., Kay, J., Deschenes M., Weingarten,
N., Raska, V., Lee, X., Multiple Intruder Autonomous Avoidance Flight Test,
Infotech @ Aerospace 2011, St. Louis, Missouri, 29 -31 March, 2011.
[53] Sabatini, R., Gardi, A., Richardson, M. A., LIDAR Obstacle Warning and
Avoidance System for Unmanned Aircraft, International Journal of
Mechanical, Aerospace, Industrial and Mechatronics Engineering Vol8, No. 4,
2014.
[54] Fasano G., D. Accardo, A. Moccia, C. Carbone, U. Ciniglio, F. Corraro, S.
Luongo, “Multi-Sensor-Based Fully Autonomous Non-Cooperative Collision
Avoidance System for Unmanned Air Vehicles”, AIAA Journal of Aerospace
Computing, Information, and Communication, vol. 5, pp. 338-360, DOI:
10.2514/1.35145, October 2008.
[55] Federal Aviation Administration, Aeronautical Information Manual –
Official Guide to Basic Flight Information and ATC procedures, 3 August,
2006.
[56] Martel, F., Schultz, R. R., Semke, W. H., Wang, Z., Czarnomski, M.,
Unmanned Aircraft Systems Sense and Avoid Avionics Utilizing ADS-B
Transceiver, AIAA Infotech@Aerospace Conference, Seattle, Washington, 6-
9 April, 2009.
References
104
[57] Martel, F., Mullins, M., Kaabouch, N., Semke, W., Flight Testing of an
ADS-B-based Miniature 4D Sense and Avoid System for Small UAS, AIAA
Infotech@Aerospace Conference, St. Louis, Missouri, 29-31 March, 2011.
[58] Mullins, M., Holman, M., Foerster, K., Kaabouch, N., Semke, W.,
Dynamic Separation Thresholds for a Small Airborne Sense and Avoid
System, AIAA Infotech@Aerospace Conference, Boston, MA, 19-22 August,
2013.
[59] Huiyao, W., Zhihao, C., Yingxun, W., UAVs Autonomous Collision
Avoidance in Non-segregated Airspace using Dynamic Alerting Thresholds,
AIAA Infotech@Aerospace Conference, Boston, MA, 19-22 August, 2013.
[60] Tadema, J., Theunissen, E., An Integrated Conflict Avoidance Concept for
Aviation, IEEE/AIAA 28th
Digital Avionics Systems Conference, Orlando,
Florida, 23-29 October, 2009.
[61] Baek, K., Bang, H., ADS-B based Trajectory Prediction and Conflict
Detection for Air Traffic Management, Int. J. of Aeronautical & Space Sci.
13(3), 2012.
[62] Sellem-Delmar, S., Farjon, J., D2.2.2-1 MID-air Collision Avoidance
System (MIDCAS) Concept of Operations (CONOPS), EDA, 15 February,
2011.
[63] AA.VV., www.flarm.com/technology/.
[64] Automatic Dependent Surveillance – Broadcast (ADS-B) Out Performance
Requirements to Support Air Traffic (ATC) Service; Final Rule, Federal
Register, vol 75, May, 2010.
[65] http://www.duncanaviation.aero/straighttalk/adsb/how_it_works.php
[66] RTCA, DO-338 Minimum Aviation System Performance Standards
(MASPS) for ADS-B Traffic Surveillance Systems and Applications
(ATSSA), June, 2012.
[67] Federal Aviation Administration, TSO-C166b Extended Squitter
Automatic Dependent Surveillance – Broadcast (ADS-B) and Traffic
Information Service - Broadcast (TIS-B) Equipment Operating on the Radio
Frequency of 1090 Megahertz (MHz), February, 2009.
References
105
[68] Kunzi, F., Hansman, J., ADS-B Benefits to General Aviation and Barriers
to implementation, MIT International Center for Air Transportation (ICAT),
May, 2011.
[69] http://www.ads-b.com/
[70] Federal Aviation Administration, 14 CFR Part 91 Automatic Dependent
Surveillance – Broadcast (ADS-B) Out Performance Requirements To
Support Air Traffic Control (ATC) Service; Final rule, Part II Department of
Transportation, 28 May, 2010.
[71] ICAO, DOC 9871 Technical Provisions for Mode S Services and External
Squitter, 2008.
[72] ICAO, DOC 9861 Manual on the Universal Access Transceiver (UAT),
2009.
[73] FAA, AC 20-165 Airworthiness Approval of Automatic Dependent
Surveillance - Broadcast (ADS-B) Out Systems, 21 May, 2010.
[74] FAA, AC 90-114 Automatic Dependent Surveillance-Broadcast (ADS-B)
Operations, 21 September, 2012.
[75] FAA, AC 150/5220-26 Airport Ground Vehicle Automatic Dependent
Surveillance – Broadcast (ADS-B) Out Squitter Equipment, 1 September,
2012.
[76] FAA, AC 20-172A Airworthiness Approval for ADS-B In Systems and
Applications, 23 March, 2012.
[77] FAA, TSO-C154c Universal Access Transceiver (UAT) Automatic
Dependent Surveillance Broadcast (ADS-B) Equipment Operating on
Frequency of 978 MHz, 2 December, 2009.
[78] FAA, TSO-C195a, Avionics Supporting Automatic Dependent
Surveillance – Broadcast (ADS-B) Aircraft Surveillance Applications (ASA),
29 February, 2012.
[79] RTCA, DO-260B Minimum Operational Performance Standards for 1090
MHz Extended Squitter Automatic Dependent Surveillance - Broadcast (ADS-
B) and Traffic Information Services - Broadcast (TIS-B), 2 December, 2009.
References
106
[80] RTCA, DO-282B Minimum Operational Performance Standards for
Universal Access Transceiver (UAT) Automatic Dependent Surveillance -
Broadcast (ADS-B), 2 December, 2009.
[81] RTCA, DO-317B Minimum Operational Performance Standards (MOPS)
for Aircraft Surveillance Applications (ASA) System, 17 June, 2014.
[82] RTCA, DO-249 Development and Implementation Planning Guide for
Automatic Dependent Surveillance Broadcast (ADS-B) Applications, 6
October, 1999.
[83] RTCA, DO-242A Minimum Aviation System Performance Standards for
Automatic Dependent Surveillance Broadcast (ADS-B), 25 June, 2002.
[84] http://www.rtca.org/store_list.asp
[85] EUROCONTROL, UE 1207/2011 Requirements for the performance and
the interoperability of surveillance for the SES, 22 November, 2011.
[86] Atienza, E., Falah, R., Garcia, S., Gutierrez, L., Martinez, M. A. L.,
Robles, O., ADS-B: An Air Navigation Revolution, Rey Juan Carlos
University – Fuenlabrada Campus, 24 April, 2013
[87] Strohmeier, M., Schafer, M., Lenders, V., Martinovic, I., Realities and
Challenges of NextGen Air Traffic Management, IEEE Communications
Magazine, May, 2014.
[88] McCallie, D., Butts, J., Mills, R., Security Analysis of the ADS-B
Implementation in the Next Generation Air Transportation System, Int’I. J.
Critical Infrastructure Protection (IJCIP), vol. 4, August, 2011.
[89] Costin, A., Francillon, A., Ghost in the Air (Traffic): On Insecurity of
ADS-B Protocol and Practical Attacks on ADS-B Devices, Black Hat, July,
2012.
[90] Schafer, M., Lenders, V., Martinovic, I., Experimental Analysis of Attacks
on Next Generation Air Traffic Communication, Int’I. Conf. Applied
Cryptografy and Network Security (ACNS), Springer, June, 2013.
[91] Samuelson, K., Valovage, E., Hall, D., Enhanced ADS-B Research, IEEE
Aerospace Conference, Big Sky, MT, 2006.
[92] Stark, B., Stevenson, B., Chen, Y.Q., ADS-B for Small Unmanned Aerial
Systems: Case Study and Regulatory Practices, 2013 International Conference
References
107
on Unmanned Aircraft Systems (ICUAS), Grand Hyatt Atlanta, Atlanta, GA,
May 28-31, 2013.
[93] Unmanned Aircraft System Study Group (UASSG), The Use of Displayed
ADS-B Data for a Collision Avoidance Capability in an Unmanned Aircraft
System, Montreal, Canada, 23-27 April, 2012.
[94] RTCA, DO-317A Minimum Operational Performance Standards (MOPS)
for Aircraft Surveillance Applications (ASA) System, December 2011.
[95] X. Rong Li, V. P. Jilkov, “A survey of Maneuvering Target Tracking:
Dynamic Models” in Proceedings of SPIE Conference on Signal and Data
Processing of Small Targets, Orlando, FL, USA (200).
[96] RTCA, DO-289 Minimum Aviation System Performance Standards for
Aircraft Surveillance Applications (ASA), Volume1, December 9, 2003.
[97] RTCA, DO-317B Traffic Situation Awareness with Alerting (TSAA)
Application Sample Algorithm, Appendix T, 2014.
[98] F. Kunzi, Development of a High-Precision ADS-B Based Conflict
Alterting System for Operation in the Airport Enviroment, Massachusetts
Institute of Technology, October 2013.
[99] ICAO, Airborne Collision Avoidance System (ACAS) Manual, Doc 9863
AN/461, 2006
[100] Munoz C., Narkawicz A., Chamberlain J., A TCAS-II Resolution
Advisory Detection Algorithm, AIAA Guidance, Navigation and Control
Conference, August 19-22, 2013, Boston, USA.
[101] Orefice, M., Luongo, S., Accardo, D., Fasano, G., Corraro, F., Tracking
Architectures and Algorithms based on Cooperative and Non-Cooperative
Sensors for Multiple UAV Applications, In Proceedings of the Italian
Association of Aeronautics and Astronautics (AIDAA) XXII Conference,
Naples, Italy, 9-12 September, 2013.
[102] Orefice, M., Di Vito, V., Corraro, F., Accardo, D., Fasano, G., Aircraft
Conflict Detection Based on ADS-B Surveillance Data, In Proceedings of the
IEEE International Workshop on Metrology for Aerospace 2014, Benevento,
Italy, 29-30 May, 2014.
References
108
[103] Baraniello, V., “AsBuilt della facility FLARE HIL 0p0”, CIRA-CF-14-
1512, 2014.
[104] De Lellis, E., Di Vito, V., Marrone, C., Ciniglio, U., Corraro, “Flight
Testing of a Fully Adaptive Algorithm for Autonomous Fixed Wing Aircrafts
Landing”, Infotech@Aerospace 2012 Conference, Garden Grove, California
19 - 21 June 2012.
[105] Genito, N. De Lellis, E., Di Vito, V., Garbarino, L., Marrone, C.,
“Autonomous Take Off System: Development and Experimental Validation”,
3rd CEAS Air&Space Conference, 21st AIDAA Congress, CEAS 2011 The
International Conference of the European Aerospace Societies, Venice, Italy,
24-28 October 2011.
[106] De Lellis, E., Di Vito, V., Garbarino, L., Lai, C., Corraro, F., “Design
Process and Real-Time Validation of an Innovative Autonomous Mid-Air
Flight and Landing System”, World Academy of Science, Engineering and
Technology (WASET), Issue 79-2011, Proceedings of the ICAAE 2011 -
International Conference on Aeronautical and Astronautical Engineering,
Paris, France, 27-29 July 2011.
[107] Di Vito, V., De Lellis, E., Marrone, C., Corraro, F., Ciniglio, U., “UAV
Free Path Safe DGPS/AHRS Approach and Landing System with Dynamic
and Performance Constraints”, UAV 2007 International Conference,
Exhibition and Workshop, Paris, France, 12-14 June 2007.
[108] Di Vito, V., De Lellis, E., Genito, N., Marrone, C., Ciniglio, U., Corraro,
F., “UAV Free Path Safe DGPS/AHRS Autolanding: algorithm and flight
tests”, UAS 2008 International Technical Conference and Exhibition, Paris,
France, 10-12 June 2008
[109] Orefice, M., Di Vito, V., Garbarino, L., Corraro, F., Accardo, D., Fasano,
G., Real-Time Validation of an ADS-B Based Aircraft Conflict Detection
System, in Proceedings of the American Institute of Aeronautics and
Astronautics (AIAA) SciTech 2015 Conference, Kissimmee, Florida, 5-9
January, 2015.