actinic ultraviolet exposures to humans assessed with a dosimetric technique
TRANSCRIPT

ACTINIC ULTRAVIOLET EXPOSURES TO HUMANS
ASSESSED WITH A DOSIMETRIC TECHNIQUE
A.V. Parisi1,* and J.C.F. Wong2
1 Centre for Astronomy and Atmospheric Research, Faculty of Sciences, University of
Southern Queensland, TOOWOOMBA 4350 AUSTRALIA. Ph: 61 7 46312226,
FAX: 61 7 46312721, Email: [email protected]
2 Centre for Medical and Health Physics, Queensland University of Technology, GPO
Box 2434, BRISBANE 4001 AUSTRALIA
* To whom correspondence should be addressed.
Running title: Actinic Exposures to Humans
1

Abstract
A spectrum evaluator based on a system of four materials has been applied to the
evaluation of actinic ultraviolet exposures to humans. The exposures were evaluated
between early morning and near noon in summer and the actinic irradiances
calculated ranged from 3 μW cm-2 to 5 μW cm-2. Simultaneously, the broad band
irradiances which induced the actinic exposures and/or the biologically effective
exposures for any other process may be evaluated with the method. The erythemal
exposures ranged from 13 to 23 μW cm-2. The method can be useful both for solar UV
studies and research with UV lamps which possess radiation wavelengths shorter
than 295 nm where the actinic and erythemal action spectra differ significantly.
Keywords: actinic; ultraviolet; erythema; dosimeters;
2
INTRODUCTION
Excessive exposure to ultraviolet (UV) radiation both from the sun and from artificial
sources constitutes an environmental health hazard. In order to assess the effects of
human exposure to UV radiation, knowledge of the UV source spectral irradiance is
necessary in calculating the biologically effective irradiance (UVBE) for a particular
process. For a particular biological effect with an action spectrum A(λ), this is
defined as:
UV (1) S( )A( )dBE UV= ∫ λ λ, t λ
where S(λ,t) is the source spectral irradiance. The CIE (1987) erythemal action
spectrum for humans (Figure 1) has been employed widely for assessing the UV
effect on human skin. The IRPA (1989) actinic action spectrum (Figure 1) has been
employed for assessing the UV effects on both human skin and the human eye. The
actinic action spectrum differs from the erythemal action spectrum significantly in the
waveband shorter than 290 nm. The erythemal action spectrum is normalised to unity
at 298 nm and the actinic action spectrum is normalised at 270 nm. For solar
radiation, the energy spectrum cuts off at around 290 nm. Thus, the exposure to the
erythemally effective irradiance is approximately proportional to the exposure due to
the actinic irradiance. It is sufficient to use the erythemal exposure for assessing the
hazard of solar UV. For a lamp source, the energy spectrum may consist of
substantial amounts of radiation in the waveband shorter than 290 nm. As a result, the
actinic exposure may differ significantly from the erythemal exposure.
To assess the actinic irradiance, the source spectrum may be measured with a
spectroradiometer, then Eq. (1) may be used to calculate the irradiance. However, this
3
equipment is expensive, bulky and unsuitable for simultaneous multi-site
measurements over the object of study. Alternatively, the UVBE may be measured
directly with sensors with a spectral response that approximates the actinic action
spectrum. If the spectral response is substantially different from the actinic spectrum,
then the sensor must be calibrated against the source prior to the measurement. This is
not only inconvenient but also could be difficult as the source spectrum may vary
with time.
Although polysulphone (Davis et al, 1976) and CR-39 dosimeters (Wong et al, 1989)
are suitable for determining erythemal exposures, they are not suitable for the
application of assessing actinic exposures if the source contains wavelengths shorter
than 290 nm. There is no readily available dosimeter for measuring actinic exposures.
No readily available dosimeter can evaluate the actinic exposure at any orientation or
location over the object of study. Neither is it possible to obtain information about
actinic and erythemal irradiances simultaneously with one dosimeter unless the
spectral irradiance is measured with a spectroradiometer. In this paper, a method
developed previously (Parisi et al, 1997) for assessing the erythemal UV exposure by
the evaluation of the solar UV spectrum using a dosimetric technique is employed to
evaluate the UV source spectrum, from which the actinic UV is calculated.
Additionally, from the evaluated spectrum, the UV irradiance in any waveband and
the erythemal irradiance or the UVBE for any human biological process may be
calculated.
4

METHODS
Spectrum Evaluation
The materials polysulphone, nalidixic acid (NDA), 8-methoxypsoralen (8MOP), and
phenothiazine are sensitive to various wavebands of UV radiation and undergo a
change in optical absorbance upon exposure. The spectral response of these materials
(Parisi et al, 1997) extends over the entire ultraviolet waveband (200 – 400 nm). The
substances employed in a thin film form of the order of 26 to 40 μm thick are
mounted as described elsewhere (Parisi and Wong, 1996) in a holder 30 mm square
with four holes of 6 mm diameter with a different material in each of the holes as
shown in Figure 2. The holder is in the form of a sticky label folded in half and cut to
size. The holes were punched with a hole punch constructed for this application that
ensured the holes were at the same position for every holder. The materials were
mounted over the holes in subdued lighting and stored in the dark till used. The
system of four dosimeters will be referred to as a spectrum evaluator.
In each of the materials, exposure to UV radiation causes a deterioration that is
quantified by measuring the change in optical absorbance, (ΔA) with a
spectrophotometer. The wavelength selected for measuring ΔA is that at which the
largest change occurs, namely, 330 nm for polysulphone and NDA, 305 nm for 8MOP
and 280 nm for phenothiazine. In order to minimise errors due to any possible ‘dark
reaction’ following exposure, it was necessary to standardise the readout times. In this
case, the optical absorbance was measured immediately prior and post exposure.
However, some other readout time may have been employed provided it was
5

maintained as constant. The change in optical absorbance for each material for an
exposure period T, is given by:
ΔA T S( )R di UV i= ∫ λ λ( ) λ (2)
where S( )λ is the source spectrum averaged over the exposure period and Ri(λ) is the
spectral response of each material. Knowledge of the response function and
measurement of ΔA allows the evaluation of the source spectrum using a non-linear
iterative technique described previously by Parisi et al. (1997). The four materials
employed as dosimeters have been chosen as firstly, they possess different spectral
responses and secondly they undergo a measurable ΔA within a short solar exposure
period. The second is necessary as the method extracts a spectrum which is time
averaged over the exposure period.
Solar Exposures
The spectrum evaluators were exposed on a white background at a number of periods
to summer sunshine on 17 December 1994 at Brisbane, Australia within 30 cm of and
at the same level as the input aperture of the integrating sphere of a double
holographic grating spectroradiometer (Wong et al, 1995). This instrument has a
calibration traceable to the primary Australian standard lamp housed at the National
Measurement Laboratory, Lindfield, NSW, Australia. The spectroradiometer scan
was started at the beginning of the exposure period for the dosimetric system. The
uncertainty in measuring the solar spectral irradiance with the spectroradiometer is
less than 5% (Wong et al, 1995).
Six exposure periods were employed between 08:54 and 13:08 Australian Eastern
Standard Time (EST) with only light cloud during this period. A five minute exposure
6

period was chosen for the spectrum evaluators as a balance between producing a
measurable ΔA and a period over which the change in the solar spectrum was
minimised. The change in this period was less than 5% as measured by starting the
scan of the spectroradiometer at consecutive four minute intervals.
The evaluated spectra were weighted according to Equation 1 with the action
spectrum in Figure 1 for assessing human UV exposure to actinic radiation. As an
example to illustrate the advantage of the spectrum evaluators in providing a
knowledge of the source spectrum which can be employed to calculate the UVBE for
any biological process, the erythemal action spectrum in Figure 1 was employed to
calculate the erythemal irradiances. Additionally, the spectra were integrated over the
UVB, UVA and total UV wavebands to provide these broadband irradiances. These
broadband irradiances and the biologically effective irradiances were compared to
those obtained from the spectra measured with the calibrated spectroradiometer.
Lamp Actinic Exposures
The spectrum evaluator was applied in the laboratory to evaluate the spectrum from a
quartz tungsten halogen lamp powered by a current regulated power supply at 9.5 A
and producing an irradiance that contained wavelengths shorter than 290 nm. The
experiment was performed at distances of 10 cm and 14 cm from the lamp filament.
RESULTS
Spectrum Evaluation
The solar UV spectrum evaluated at 13:08 EST on 17 December 1994 is presented in
Figure 3 as the solid line. The square data points represent the spectra measured with
7

the calibrated spectroradiometer. This figure is provided as an example of the
comparison of the evaluated and measured spectra. The extracted spectra are
smoothed versions of the measured ones. For each exposure period, the differences
between the two spectra were quantified as an ‘integrated difference’ by summing the
absolute differences between the spectra at 1 nm intervals and dividing by the
integrated spectral irradiance of the spectrum measured with the calibrated
spectroradiometer. For each case, these differences were less than 20%.
Solar Exposures
The UVB, UVA and total UV irradiances calculated for both the evaluated and
measured spectra are shown in Table 1 for the exposure periods on 17 December. The
largest difference between the irradiances calculated with the evaluated and measured
spectra is 20%. The actinic exposures evaluated with the spectrum evaluators have
been compared in Table 2 with those calculated employing the spectra measured with
the spectroradiometer. The largest difference between the actinic irradiances
calculated from the evaluated and measured spectra is less than 20%. The spectral
actinic irradiance is calculated for 11:39 EST on 17 December using both the
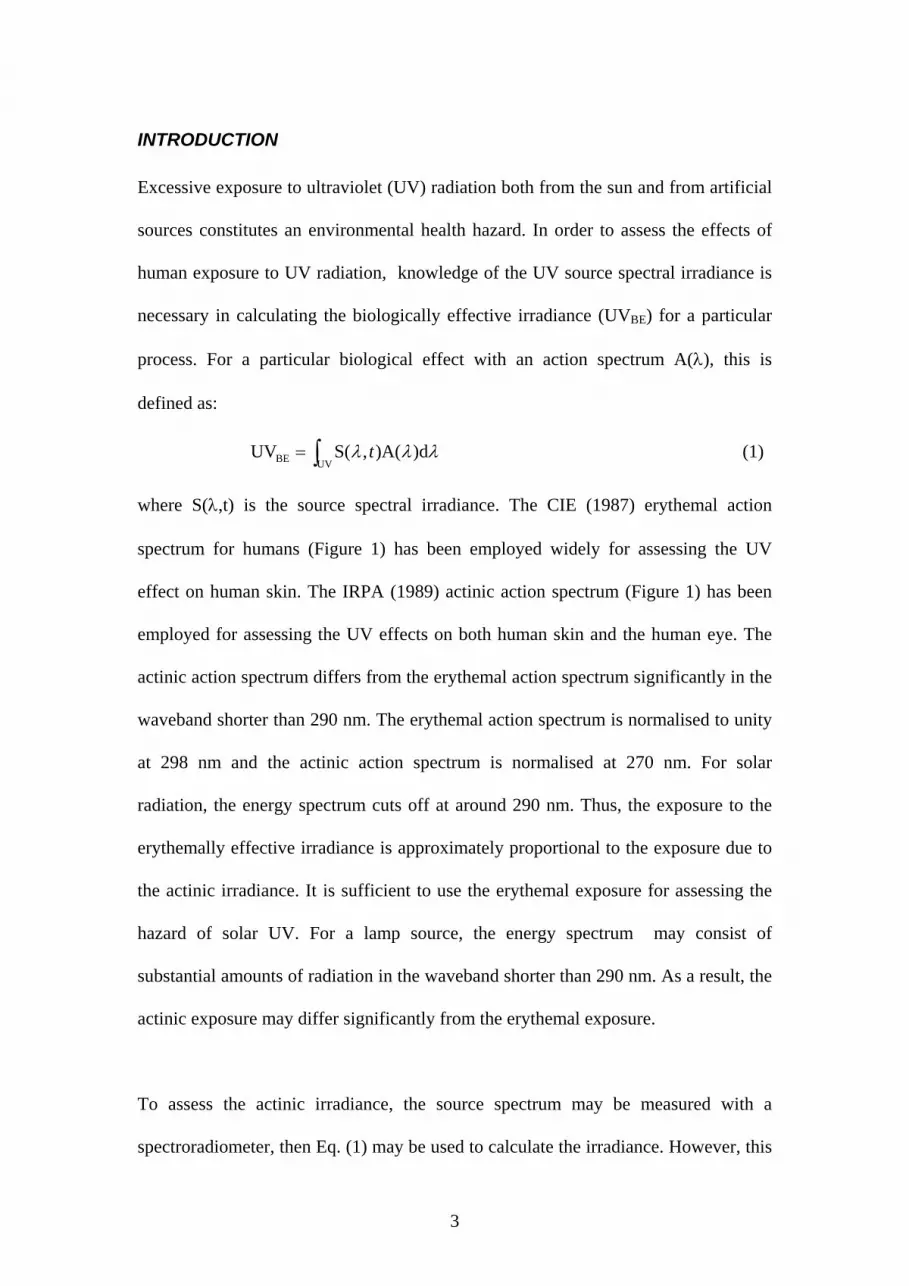
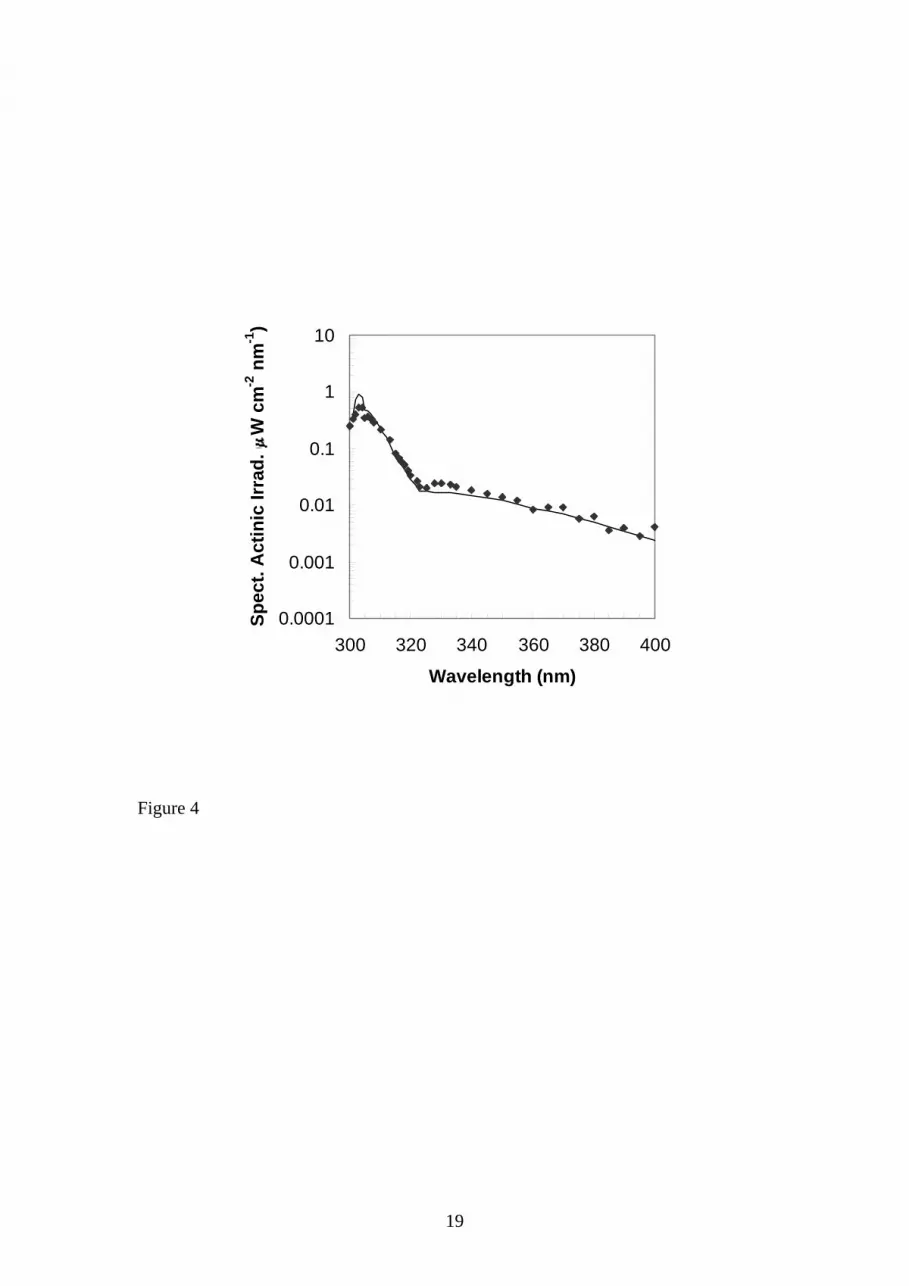
evaluated and measured spectra and the two plotted for comparison in Figure 4. The
advantage of the method for evaluating the UVBE for any biological process has been
illustrated by calculating, in this case, the erythemal irradiances for each of the
exposure periods as shown in Table 2. As expected, due to the higher relative spectral
effectiveness of the respective action spectra, the erythemal irradiances are higher
than the actinic irradiances for each exposure period.
8

The distribution of the actinic and erythemal irradiances during the measurement
period on 17 December are shown in Figure 5. The actinic irradiances increased from
about 3 μW cm-2 at 08:54 EST to a peak of 5 μW cm-2 at 11:39 EST. Similarly, the
erythemal irradiances increased from about 13 μW cm-2 to about 23 μW cm-2 over the
same interval.
Lamp Actinic Exposures
The actinic irradiances calculated from the evaluated spectra for the quartz halogen
lamp at distances of 10 cm and 14 cm are shown in Table 3. The ratio of the actinic
irradiances to erythemal irradiances for the lamp is approximately 0.6 compared to
approximately 0.2 for the solar UV spectra. This is due to the wavelengths shorter
than 290 nm present in the lamp output.
DISCUSSION
A spectrum evaluator based on a dosimetric technique has been applied to the
evaluation of the solar UV spectrum at a number of times in Brisbane, Australia. The
integrated difference between the evaluated spectra and the spectra measured with a
calibrated spectroradiometer was less than 20%. The result (Table 2) for solar
exposure yields a ratio of erythemal irradiance to actinic irradiance. The mean ratio is
4.8 with a maximum deviation of 0.2. If this ratio is used to calculate the actinic
exposure for the erythemal exposure tabulated in Table 3, it produces an error of more
than 65%. This suggests that unless the action spectrum resembles the spectral
response of the sensor, an error as high as 65% could be introduced for an
uncalibrated source of radiation.
9

The evaluated spectra also allow the evaluation of the actinic irradiances to be used in
assessing environmental human UV exposure. Conventional methods using electronic
systems, for example spectroradiometers to measure the spectrum for calculating the
actinic exposure are difficult to be used in the field because of their requirement for
the supply of electric power to the instruments. The bulk and size of the equipment
does not permit its attachment to the test body for measurements of solar spectra at
selected sites for any selected orientation with respect to the direct sunlight. The
method presented in this paper can be used to measure actinic exposures to humans at
multiple sites simultaneously for any selected orientation with respect to the direct
sunlight. The method is cost effective and rugged and ideal for application in field
studies.
CONCLUSIONS
The actinic exposures obtained with the method presented in this paper cannot be
provided with other dosimetric techniques such as polysulphone or CR-39 dosimeters
or radiometric methods, for example, Robertson Berger meters. A further advantage
of the method is that it is possible to extract the biologically effective exposure
simultaneously for any other biological process, for example, erythema. This is useful
both for solar UV studies and research with UV lamps that possess radiation
wavelengths shorter than 295 nm where the actinic and erythemal action spectra differ
significantly.
10
REFERENCES
CIE (International Commission on Illumination). (1987) A reference action spectrum
for ultraviolet induced erythema in human skin. CIE J. 6, 17-22.
Davis, A., Deane, G. H. W. and Diffey, B. L. (1976) Possible dosimeter for ultraviolet
radiation. Nature. 261, 169-70.
IRPA (International Radiation Protection Association). (1989) Proposed change to the
IRPA 1985 guidelines on limits of exposure to ultraviolet radiation. Health
Phys. 56, 971-2.
Parisi, A. V. and Wong, C. F. (1996) A new method for measurements of erythemal
irradiance. Photodermatol. Photoimmunol. Photomed. 12, 171-9.
Parisi, A. V., Wong, C. F. and Moore, G. I. (1997) Assessment of the exposure to
biologically effective UV radiation using a dosimetric technique to evaluate
the solar spectrum. Phys. Med. Biol. 42, 77-88.
Wong, C. F., Fleming, R. and Carter, S. J. (1989) A new dosimeter for ultraviolet-B
radiation. Photochem. Photobiol. 50, 611-5.
Wong, C. F., Toomey, S., Fleming, R. A. and Thomas, B. W. (1995) UV-B
radiometry and dosimetry for solar measurements. Health Phys. 68, 175-84.
11

Table 1 - UVB, UVA and total UV irradiances calculated from the spectra evaluated
with the spectrum evaluator and spectra measured with the calibrated
spectroradiometer.
Time of Evaluated irradiance (μW cm-2) Measured irradiance (μW cm-2)
day EST UVB UVA Total UV UVB UVA Total UV
08:54 183 3785 3968 221 4206 4427
09:18 231 4605 4837 265 5013 5278
09:59 248 5075 5323 295 5282 5577
11:04 303 4899 5202 344 6156 6500
11:39 317 5131 5448 344 6114 6458
13:08 288 4655 4943 312 5640 5951
12

Table 2 - Actinic and erythemal irradiances obtained with the spectrum evaluator
compared to those obtained with the spectroradiometer.
Actinic irradiance (μW cm-2) Erythemal irradiance (μW cm-2)
Time EST Spectrum
Evaluator
Spectroradiometer Spectrum
Evaluator
Spectroradiometer
08:54 2.8 3.2 13 13
09:18 3.5 4.0 17 16
09:59 3.8 4.6 18 18
11:04 4.5 5.6 22 22
11:39 4.8 5.7 23 22
13:08 4.3 4.9 21 20
13

Table 3 – Actinic and erythemal irradiances for the quartz tungsten halogen lamp.
Lamp height
(cm)
Actinic Irradiance
(μW cm-2)
Erythemal irradiance
(μW cm-2)
10 27 43
14 11 18
14

FIGURE CAPTIONS
Figure 1 – (1) Erythema action spectrum (CIE, 1987) and (2) actinic action spectrum
(IRPA, 1989).
Figure 2 - Spectrum evaluator of the dosimeter materials NDA, polysulphone, 8MOP
and phenothiazine (Parisi and Wong, 1996).
Figure 3 - Evaluated (⎯) and measured ( ) solar UV spectra at 13:08 EST on 17
December 1994.
Figure 4 - Spectral actinic irradiance at 11:39 EST calculated with the evaluated (⎯)
and measured solar ( ) spectra.
Figure 5 - Distribution of erythemal and actinic irradiances on 17 December 1994
calculated using the evaluated ( ) and measured ( ) spectra.
15

(1)
(2)
0.0
0.2
0.4
0.6
0.8
1.0
1.2
250 300 350 400
Wavelength (nm)
Rel
ativ
e Ef
fect
iven
ess
Figure 1
16

NDA
Polysulphone
8MOP
Phenothiazine
Figure 2.
17

0
30
60
90
120
150
280 320 360 400
Wavelength (nm)
Spec
tral
Irra
dian
ce (
W c
m-2
nm-1
)
Figure 3
18
0.0001
0.001
0.01
0.1
1
10
300 320 340 360 380 400
Wavelength (nm)
Spec
t. A
ctin
ic Ir
rad.
(W
cm
-2 n
m-1
)
Figure 4
19

0
5
10
15
20
25
8 10 12 14
Time of day (EST)
Eryt
hem
al Ir
radi
ance
(W
cm
-2)
0
2
4
6
8
10
8 10 12 14
Time of day (EST)
Act
inic
Irra
dian
ce (
W c
m-2
)
Figure 5
20