academic performance, characteristics and expenditures in new york city elementary and middle...
TRANSCRIPT
ED 462 457
AUTHOR
TITLE
INSTITUTIONSPONS AGENCY
PUB DATENOTE
AVAILABLE FROMPUB TYPEEDRS PRICEDESCRIPTORS
IDENTIFIERS
ABSTRACT
DOCUMENT RESUME
UD 034 312
Stiefel, Leanna; Schwartz, Amy Ellen; Iatarola, Patrice;Fruchter, NormAcademic Performance, Characteristics and Expenditures inNew York City Elementary and Middle Schools. ConditionReport.New York Univ., NY.New York State Education Dept., Albany.; State Univ. of NewYork, Albany. Office of the Regents.2000-04-0042p.; Report prepared for the Education Finance ResearchConsortium (New York, NY, 2000).For full text: http://www.albany.edu/edfin/StiefelCR.PDF.Reports Research (143)MF01/PCO2 Plus Postage.*Academic Achievement; Attendance; Educational Finance;Elementary Education; *Expenditure per Student; MiddleSchools; *Minority Group Children; *Poverty; Scores;Socioeconomic Influences; Special Education; StudentCharacteristics; Teacher Characteristics; Urban SchoolsNew York City Board of Education
This study examines the academic performance of students inNew York City's elementary and middle schools, investigating variationsacross grades and schools and documenting differences in student and teachercharacteristics and the pattern and level of expenditure between low, middle,and high performing schools. The study reports averages of student, teacher,and expenditure variables for each level of performance. The study used 2sources of 1997-98 school-level data published by the New York City Board ofEducation (BOE): "School Based Expenditure Reports" and "Annual SchoolReports." The study also used data obtained directly from the BOE to augmentmeasures of school-level student performance on citywide reading andmathematics examinations. Results confirmed years of previous research:low-performing New York City schools overwhelmingly serve students of colorwho are poor, are limited English proficient, have consistently lowattendance, and are taught by teachers who have very limited experience andearn the lowest average salaries. Moreover, these low performing schoolsreceive a higher per pupil expenditure than the aggregates for middle andhigh performing schools. There is a higher percentage of children infull-time special education in the lowest performing schools. Appended areextensive tables of research data. (SM)
Reproductions supplied by EDRS are the best that can be madefrom the original document.
ACADEMIC PERFORMANCE, CHARACTERISTICS AND EXPENDITURESIN NEW YORK CITY ELEMENTARY AND MIDDLE SCHOOLS
Leanna StiefelProfessor or Economics
Robert F. Wagner Graduate School of Public Service
Amy Ellen SchwartzAssociate Professor
Robert F. Wagner Graduate School of Public Service
Patrice IatarolaResearch Scientist and Doctoral Student
Institute for Education and Social Policy and Robert F. Wagner Graduate School of PublicService
Norm FruchterDirector
Institute for Education and Social Policy
New York University
April 2000
Condition Report prepared for the Education Finance Research Consortium sponsored by theNew York State Education Department, Spring 2000
The research in this report is solely attributable to the individual authors. The data presented, thestatements made, and the views expressed do not necessarily represent the New York State
Board of Regents or the New York State Education Department.
We greatly appreciate the research assistance of Younguck Kang.
U.S. DEPARTMENT OF EDUCATIONOffice of Educational Research and Improvement
EDUCATIONAL RESOURCES INFORMATIONCENTER (ERIC)d This document has been reproduced as
received from the person or organizationoriginating it.
0 Minor changes have been made toimprove reproduction quality.
Points of view or opinions stated in thisdocument do not necessarily representofficial OERI position or policy.
BEST COPY AVAILABLE
1
PERMISSION TO REPRODUCE ANDDISSEMINATE THIS MATERIAL HAS
BEEN GRANTED BY
TO THE EDUCATIONAL RESOURCESINFORMATION CENTER (ERIC)
ACADEMIC PERFORMANCE, CHARACTERISTICS AND EXPENDITURESIN NEW YORK CITY ELEMENTARY AND MIDDLE SCHOOLS
Leanna Stiefel, Amy Ellen Schwartz, Patrice Iatarola and Norm Fruchter
I. Introduction
The academic performance of New York City elementary and middle school students
varies widely across grades and schools, as do the characteristics of students, teachers and the
expenditures allocated to the schools. In this study we examine these variations, documenting
the differences in the characteristics of the students and teachers and the pattern and level of
expenditures between low, middle and high performing schools at the elementary and middle
school level. We report averages of student, teacher and expenditure variables for each level of
performance, using two performance measures. The purpose is to paint a statistical portrait of
New York City's high, middle and low performing schools in order to gain insight into the
similarities as well as the differences between them. These differences need to be interpreted
with caution because of the difficulty of distinguishing the causes and effects of performance on
the one hand and characteristics and expenditures on the other hand. This work lays the
foundation for future work that will seek to disentangle the factors determining the differences in
the academic performance of these schools. We examine the results of our analyses to draw out
the implications for policymakers where possible and to gain insight into directions for the future
work.
This study only became possible quite recently. Four years ago New York City began
producing annual school-based budget and expenditure reports, which detail school-level
2
2
spending. Combining those reports with the existing annual student-level report card data, we are
able to examine the level and pattern of school academic performance, characteristics, and
resources across New York City's public elementary and middle schools. The large size of the
New York City school district and the wide range of students, teachers, and schools make this
effort particularly important. While most districts in the state and country have about five
schools (typically one high school, one or two middle schools and two or three elementary
schools), New York City has roughly 880 elementary and middle schools and more than 200
high schools. Further, with more than 1.1 million students enrolled, New York City public
schools educate roughly a third of the students in New York State and more children than are
enrolled in public schools in 46 other states. The large number of children and schools in this
district makes it particularly important to understand the differences between low and high
performing schools, to gain insight into how to effect changes in outcomes, and to improve the
academic performance across the board.
II. Data
Sources
This study primarily relies on two sources of 1997-98 school-level data published by the
New York City Board of Education (BOE): School Based Expenditure Reports (SBER) and
Annual School Reports (ASR). The SBER provide rich and detailed data on school-level
spending. They categorize all school spending by function (classroom instruction, district costs,
etc.,),1 by student type (general education, part and full-time special education)2, by source of
t There are 45 detailed functional categories of spending and 15 summaries of the detailed functions. The functionsare categorized by three broad groupings; i) direct services to schools, ii) district/superintendency costs, iii) system-wide costs. Further categorization occurs within each of these three groups. For example, the direct services toschools grouping reflects spending on classroom instruction, instructional support, and other functions. Another
3
4

funds (city funds plus state operating aid and federal, state and private grants)3 and by object
(salaries, fringe benefits, and other than personal services). The ASR provide school-level data
on student and teacher characteristics and student academic performance. In addition to these
two sources, the study uses data obtained directly from the BOE to augment measures of school-
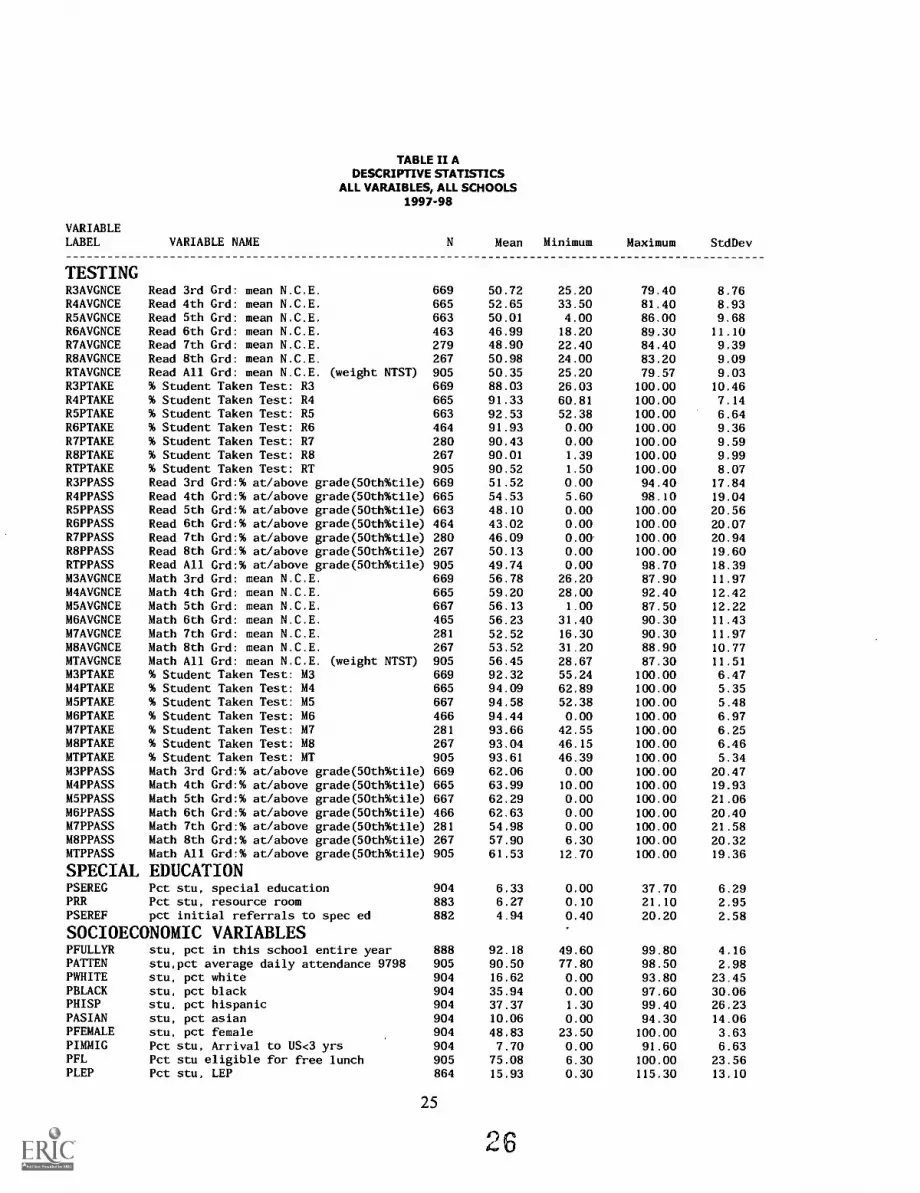
level student performance on citywide reading and mathematics exams. Table II A presents
descriptive statistics on all variables used in the report and Table II B shows the variable name,
description and source of each variable.
Student Performance
Student performance on New York City's reading (CTB) and mathematics (CAT)
standardized exams are reported for 3rd through 8th grades for each school. The BOE includes
data on the number of students for whom a test form has been prepared and the number of
students actually taking the test.4 Thus, the percentage of students taking the exam is calculated
by dividing the number taking the test by the number of forms prepared. The BOE reports scores
in a number of ways; we use Normal Curve Equivalents (NCEs), whose technical characteristics
are explained in the methods section. In addition, since the BOE reports the number and
proportion of students in each of four quartiles of performance, this study combines the figures
for the two highest quartiles to report the percent of students at or above the 50th percentile. As
Table II A shows, across all schools with a third grade, on average 88% of a school's third grade
students took the reading test and those students had an average NCE score of 51. (All numbers
level of functional detail is available as well, for example classroom instruction is a sum of expenditures on teachers,textbooks, professional development and other.2 Part-time special education students are a sub-set of general education students who are in need of resource room-type services.3 Federal, state and private grants sources are further identified by the specific grant or type of grant, such as federalTitle I or private foundations.
4
5
are rounded to two digits in this discussion although not in Table II A.) Nearly 52% of third
grade test takers scored at or above the 50th percentile. In order to analyze student performance
across all grades for elementary and middle schools, the detailed data by grade are combined into
an all grades school number. Thus, on average 91% of the students in all grades in a school took
the reading exam and on average half of test takers in all grades (3rd through 8th) scored at or
above the 50th percentile.
Special Education
Students in special education have been identified as in need of modified instructional
settings. These students alternatively are referred to as full-time special education students.
Depending on sub-district and school practice, full-time special education students may spend
part or most of their day in general educational settings, or they may be in their own classrooms.
On average over 6% of students in elementary and middle schools are classified as special
education students. The range across schools is quite wide, from 0% to 38% of all students in a
school. Students in general education programs who have been identified as in need of resource
room-type services, alternatively referred to as resource room or part-time special education
students, spend most of their day in general education settings.
Socioeconomic Variables
The ASR school-level data include information on student demographic and
socioeconomic characteristics. The race/ethnicity of students is reported in four groups; white,
black, Hispanic, and Asian/Pacific Islander. On average, elementary and middle schools are
17% white, 36% black, 37% Hispanic and 10% Asian students. Nearly 49% of students in
4 Students who did not take the exam fall into three reported categories, i) absent, ii) excused, iii) exempt.
5
6
elementary and middle schools are female and nearly 8% have immigrated to the United States
within the past three years. Approximately 75% of elementary and middle schools students are
poor, as measured by whether a student is eligible for free or reduce priced lunch. Nearly 16% in
the average school are identified as having limited English proficiency (LEP).
Teacher Characteristics
The ASR is the source of information on teacher characteristics and the SBER is the
source of information on average teacher salaries and expenditures. Teacher characteristics such
as licensure and type of assignment, stability, experience and education are reported as
proportions in dichotomous terms. For example, teacher experience is reported as the percent of
teachers in a school who have been teaching anywhere for five or more years (62%) and not as
the average number of years of experience. The average teacher salary for each school is derived
from information on the number of teachers and teacher expenditures as reported in the SBER
and other information provided by the BOE's division that prepares the SBER. The additional
information on teacher expenditures further classifies spending in terms of salaries for full-time
equivalent teacher positions, salaries paid to teachers for using their prep periods, and amounts
paid to per session or per diem substitute teachers. The average teacher salary in elementary and
middle schools is $43,257.
Resources
As mentioned above, the SBER are quite detailed and allow for the reporting of a wide
variety of resource measures. The groups of measures described in this section rely on a basic
understanding of the student counts and classifications. Restating what has been described above
and in a footnote, the SBER provide student counts for three types of students; general
6
7
education, part-time special education and full-time special education. Part-time special
education students are a subset of general education students. Thus, the total number of students
in a school is equal to the sum of general education students and full-time special education
students.
The first resource measure that is presented in Table II A is the pupil-teacher ratio. As
explained later in the report, this is NOT a measure of class size, rather it is calculated as the sum
of all students (general education plus full-time special education) divided by the total count of
full-time equivalent teacher positions. This definition highlights the limitations of the data.
Ideally one would like to sort out the general education teachers from the special education
teachers because class size regulations vary for the two groups of students and may even vary
within the full-time special education population of students. But the requisite breakdown of
teachers is not included in the SBER, therefore we aggregate all students and divide by all
teachers.
As alternative measures of resources, a variety of per pupil expenditures are analyzed in
this report. While there is limited flexibility with the SBER data in matching teachers and
student types, there is more flexibility in matching expenditures on the basis of student type.
Overall spending per pupil is a combination of spending on direct services to schools, including
teachers, textbooks, and building services, and district and systemwide costs and obligations,
such as administrative overhead and debt service. Therefore, a subset of the functional details
within the three broad areas of spending are presented as well.
The first set of per pupil expenditures represents spending for all students in a school. On
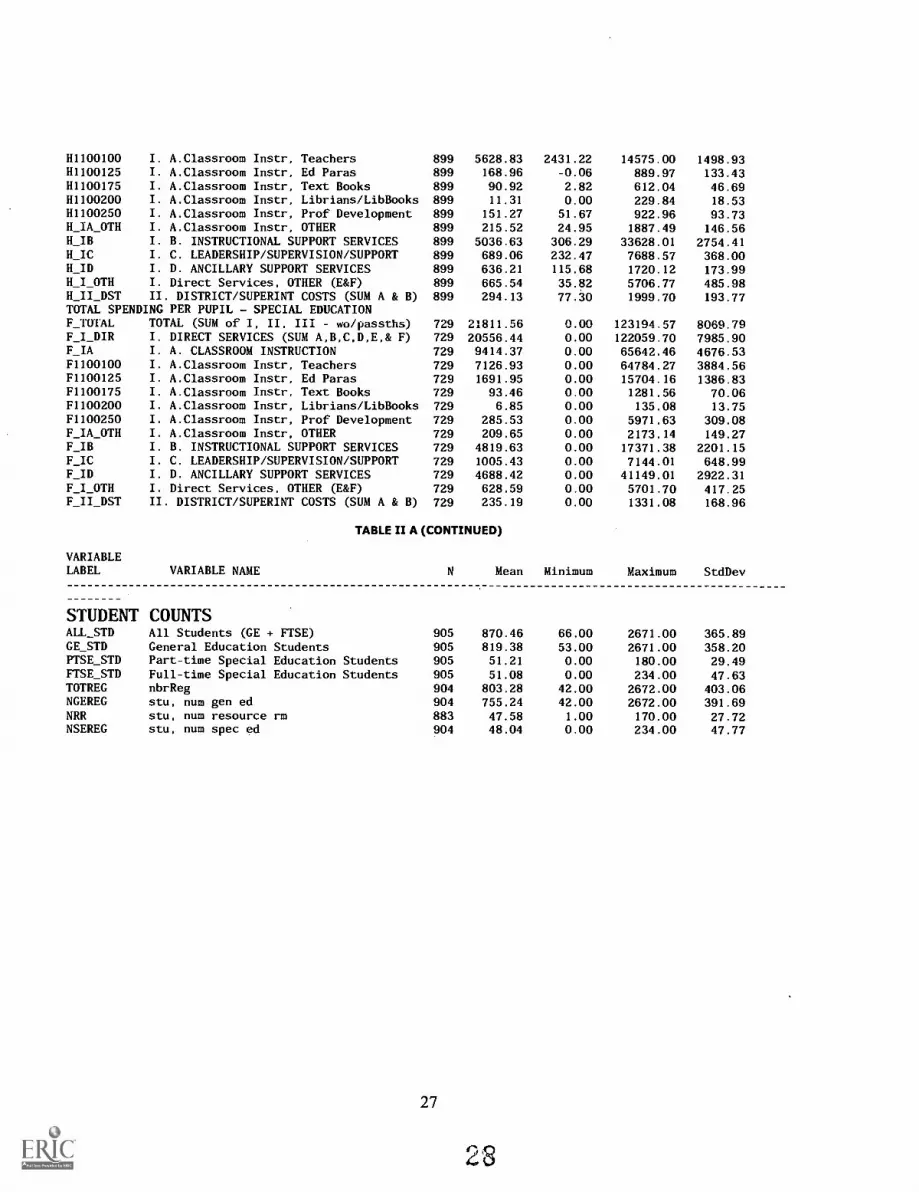
average $8,359 is spent per pupil. This per pupil spending figure combines resources spent on
7
general education, part-time special education and full-time special education students. It
overstates spending on the majority of students, those who are in general education, and
understates spending on the minority of students, those who are in full-time special education,
because these two particular types of students have radically different spending on a per pupil
basis. For example, spending per full-time special education student averages $21,812 for
elementary and middle schools while spending per general education student averages $7,017.
While resources for special education students may be used on behalf of all students, in this
particular analysis we cannot control for differential rates of special education students and
differential costs of the varying needs of special education students. Therefore, per pupil
expenditures for the different types of students are reported as well.
Breaking down the $7,017 per pupil expenditure for the general education student,
$6,210 is spent on direct services with $4,066 on classroom instruction. The great majority of
classroom expenditures are on teachers ($3,523 per pupil). While spending on other classroom
instruction categories, such as educational para professionals ($164), text books ($74), and
professional development ($108) are significantly less than that on teachers, it is important to
understand how schools and their sub-districts are spending resources.
Because a sub-set of general education students are in need of and receive resource room
services, spending per general education student understates the amount of resources spent on
their behalf. There are at least two different ways to conceptualize spending that incorporates
resources spent on part-time special education students. First, expenditures on behalf of the
general education students, who are also in part-time special education, are spread across all
general education students. While a large majority of general education students are not
8
9
identified as in need of resource room services, spreading the part-time special education
expenditures across all general education students gives a measure of resources available for a
body of general education students that may vary in needs across schools. Essentially, the full-
time special education students and spending on their behalf are excluded. The average per pupil
expenditure with part-time special education resources per general education student is $7,506
with $6,663 on direct services. Second, expenditures on behalf of part-time special education
students are calculated per part-time special education student and are added to the basic general
education expenditure per general education student. This measure represents the total amount
spent on behalf of a general education student who is also in part-time special education,
assuming that expenditures on part-time special education are spent only on behalf of those
students. The per pupil expenditure is $14,635 with $13,294 on direct services. These figures
are far below that of full-time special education students and double that of spending per general
education student.
In the case of part-time and full-time special education students, a significant proportion
of per pupil expenditures are for instructional support services, such as referral and evaluation
services, and ancillary support services, such as transportation. The per pupil expenditures on
teachers for special education students is higher than those for general education students,
because of the more stringent class size limitations in special education settings.
Student Counts
Each of the two main sources of data, SBER and ASR, provide student counts by similar
categories of general education, part-time special education or resource room, and full-time
special education. The per pupil expenditures are calculated using the student counts in the
SBER database and the socioeconomic characteristics are calculated using the student counts in
the ASR. Therefore, we report descriptive statistics for both sets of student counts in Table II A
and in the results tables, Tables V A and V B. On average, elementary and middle schools have
870 students with the smallest school having 66 students and the largest having 2,671 students,
according to the SBER data. Even though the two sources of data draw student counts from the
same information system at the BOE, there are differences that may be the result of the timing of
the data collection. The differences for the most part are more pronounced in the count of
general education students. Across both sources of data, each school has an average of
approximately 50 students in part-time special education and 50 students in full-time special
education.
III. Methods
The first step in examining differences in the characteristics and expenditures of schools
by performance level is to identify a method for dividing schools into performance groups.
These groupings require decisions about which performance measures to use, how many
different performance groups to use, whether performance measures can be combined and
whether grades can be combined into schools. We discuss each of these issues and its resolution
below.
Choosing Performance Measures
Performance at the elementary and middle school level is a multi-dimensional concept
that can include measures such as test scores, promotion rates, attendance rates, and,
conceptually, more qualitative evaluations by adults of pupil progress. For the purposes of this
report we focus on scores on New York City's reading (CTB) and mathematics (CAT) tests,
10
11
which are given to third through eighth graders each spring. While test scores have some
deficiencies as performance indicators, it is important to use measures that are available and
reasonably consistent for the majority of schools and students in each grade across the city. In
this report we use levels of scores and not changes in the scores or value added measures.
Test scores can be reported at the school level in a variety of ways - raw scores,
percentiles, grade equivalents and Normal Curve Equivalents (NCEs). Median scores, mean
scores, or even percentage passing can be used. In these analyses, we use the average NCEs for
each school, which are available since the reading and math tests are norm-referenced. NCEs are
an accepted way to convert raw scores into a scale with equal intervals between scores. For
example, the "distance" between an NCE score of 50 and 51 is the same as between a score of 75
and 76. That is, the increase in performance indicated by a one point increase in an NCE score is
the same whether the increase is from 50 to 51 or from 75 to 76. In contrast, the distance
between the 50th and 51st percentile is smaller than between the 75th and 76th percentile. This is
because more students are clustered around the 50th percentile and thus it does not take as large
an increase in the score interval to encompass an additional one percent of students as it takes at
the '75th percentile, where there are fewer students clustered. NCE intervals do not contain equal
percentages of students; rather the intervals are constant and the percentage of students in each
interval varies. This feature of equal intervals allows analysts to manipulate the scores
mathematically (aggregate across students, calculate averages and standard deviations, for
example) and compare scores across schools, without violating critical statistical properties of
the resulting summary statistic.
Defining High, Average, and Low Performing Schools
11
12
Based on the NCEs for math and reading, we assessed different ways to divide schools
into performance groups. The essential question is: How many different groups will the data
support, given that we need to have a reasonable number of schools in each to calculate the
average values of characteristics and expenditures? Groups also need to be different enough to
support inferences that the mean performance of the schools differs across groups. We looked for
any natural breakpoints @laces where there were gaps between scores) and found none. We tried
using the national standard deviation for the NCEs for individual students (21.06) to divide
schools by standard deviations, but found very few schools in either the high or low performing
tails because the New York City grade and school standard deviations are much lower (around
8.7 to 12). This is not surprising since our analyses do not use individual student data, but rather
data aggregated to grade and school NCE. We settled on use of the New York City grade or
school standard deviations of NCEs to form three performance groups for each grade or school
and test, based on schools whose mean NCE fell more than one standard deviation in either
direction (positive or negative) from the mean NCE. Thus, high performing schools are those
whose mean NCE score is greater than one standard deviation from the mean NCE, low
performing schools are ones whose mean NCE score is less than one standard deviation from the
mean NCE, and middle performing schools are ones whose mean NCE score falls in between
plus and minus one standard deviation from the mean NCE.
Combining Tests and/or Grades
Using standard deviations of NCEs for reading and mathematics tests in order to group
schools, we then analyzed whether we could combine the two tests and the grades (or
alternatively use just one test and one grade as representative of an all tests and grades). In order

to use just one test or grade, we would need to be confident that that there is high agreement
between tests and between grades. We found that that while the correlations in NCE scores were
relatively high, we were not confident that they are high enough for us to obtain the same
categorizations of schools if we chose just one test and one grade. Our analyses involved
calculations of the Pearson bivariate correlations between NCEs for each pair of tests (reading
and math) at a grade level and then for pairs of different grade levels for each test. We also
constructed tables to show the amount of agreement in the classification of schools by alternative
tests at the same grade and by the alternative grades for the same test, again using the standard
deviations to divide schools into three performance groups. Table III A shows an example of
these comparisons. The top part of the table illustrates the correlation and agreement in
classifications using third grade reading and math scores. The correlation, .899, while high for
many purposes, in our judgment is not high enough to warrant saying the two tests give the same
information. The table shows the number of schools that would be classified the same and
differently using the two scores. The diagonals illustrate schools falling in the same classification
and the off-diagonals illustrate the number of schools classified differently by the two tests. The
table shows that there are significant numbers of schools on the off-diagonals, supporting our
conclusion that the correlations between tests are not high enough to simply use one or the other
of them.
The bottom part of the table shows the agreement between reading tests in the 3Id and 5th
grades. Again the correlation is not extremely high for the purposes of classification and the
table shows significant disagreements in classifications of schools.
13
Correlations between tests in other grades and the same tests across different grades are
not exactly the same as ones shown in Table III A, but result in the same conclusions. We cannot
a priori eliminate any tests or grades in our efforts to classify schools. Because the use of two
tests and eight grades will lead to many tables of results and because New York City classifies its
schools into elementary and middle schools, we have added two aggregations that correspond to
the New York City classifications of schools. We show groups of schools based on the reading
and math scores, averaged at the elementary and middle school levels. In addition to the need to
average over grades, not all schools classified as one type contain the same grade spans. We
ignore this latter problem for these classifications and adopt the New York City labels for what is
an elementary and what is a middle school, no matter what the grade spans are in particular
schools.
Weighting Averages or Not
A final methodological consideration involves how the averages for the characteristics
and the expenditures will be calculated for each performance group. To be more concrete, given
performance groups based on 3rd grade reading scores, we calculate the average percent of
students in special education, the average percent of teachers who are licensed, the average
teacher salary etc. There are two ways to calculate these averages unweighted and weighted.
If we calculate a simple unweighted average add up all the values in the group and divide by
the number of schools we will obtain an "average school" number. On the other hand, if we
weight each number for each school by the number of students in the school, and then divide by
the number of students, we will get an "average student" number. This latter number will weight
the larger schools more heavily. Because the two may present different patterns and because a
priori one choice is not clearly the right one, we calculate both.
How many tables will our methodological choices produce? Table III B shows that the
answer is 32. There are six grades (3 to 8) and two levels of schools (elementary and middle);
there are two tests and two ways to calculate mean values. As the table shows, combining the
alternatives leads to 32 tables. While this represents the universe of possibilities, it is not useful
because there are too many results to discuss meaningfully in this report. In the results sections,
we therefore discuss the results by elementary and by middle schools based on their aggregated
performance in reading, using unweighted averages for characteristics and expenditures. All
other tables of results are in the appendices and their data will be used in future studies.
Although individual schools are classified differently depending upon test and grade used for
classification, the mean values of student and teacher characteristics as well as of expenditures
across performance levels do not vary much by test or grade in their general pattern. (Magnitudes
may vary and there are some exceptions.) Thus, when discussing empirical results, we analyze
aggregate elementary and middle school reading results as a way of reducing a large volume of
data to some understandable, interesting and important findings.
IV. Conceptual Issues
As described above, our analysis includes variables describing characteristics of the
students, characteristics of teachers, and patterns of expenditures and resources allocated to the
schools. These variables were chosen because previous empirical research or theory suggest
that they are related to school performance either because they are thought to influence
performance or because they are thought to be determined by performance. In many cases
15
16
'theory' suggests that the direction of causality can go either way. More specifically, we can
describe three general pathways through which these variables are related to performance. First,
the variable might affect performance directly as an example, smaller pupil-teacher ratios
might lead to better classroom interactions and better performing students. Second, the variable
might be itself determined by performance as an example, better performing schools may be
more engaging (demanding) for students and might lead to higher attendance or, alternatively,
the school district may target more resources at lower performing schools in an effort to boost
performance in successive years. Finally, the relationship might be driven by 'school selection'
by parents, by students or by teachers. To the extent that they choose between schools, parents,
students and teachers of different types may sort themselves into school communities that are
significantly different from one another. If they choose based upon school performance, there
will be differences by performance level. Thus, if non-poor parents have more flexibility in
choosing schools, their choices will contribute to a higher concentration of non-poor students in
high performing schools. Alternatively, if more experienced teachers have more flexibility and
prefer high performing schools, these schools will have higher concentrations of experienced
teachers. The analyses in this study cannot disentangle the direction of causality, or the effects of
selection. Instead, we try to gain some insight into the magnitude and importance of different
effects.
V. Empirical Analysis
As noted above, the analyses here are based on tables of elementary and middle school
reading performance, presented in Tables V A and V B.

Socioeconomic Characteristics of Students
Our data include some information on the demographic backgrounds of the students in
addition to variables that describe the special educational needs of students.
There is a great deal of existing research that has investigated the relationship between
demographic characteristics and school performance and some of the empirical findings are
disturbing. The results of previous studies would suggest that students in low performing schools
will be disproportionately black, Hispanic, poor, limited English proficient and have higher
mobility and lower attendance; high performing schools will be disproportionately Asian and
white, and have less poverty, fewer limited English proficient children, and better attendance.
Unfortunately, these patterns emerge quite strongly from our analysis of New York City's
schools.
Before turning to the results of specific analyses, we should point out one overarching
finding. With relatively few exceptions, the values of the analyzed variables consistently
(monotonically) increase or decrease with performance. As an example, attendance is lowest in
the low performing schools, somewhat higher in middle performing schools, and highest in the
high performing schools. While this is not evidence of causality, it does suggest the relationship
between performance and these variables is consistent and stable.
Elementary Schools
Beginning with the performance of elementary schools in reading (Table V A), the racial
and demographic composition of high, low and middle performing schools differ markedly.
While the low performing schools are roughly half black and half Hispanic (only 2% of the
students are Asian and 1% white), high performing schools are roughly half white, 13% black,
17% Hispanic and 19% Asian. As expected, poverty is more prevalent in the lowest performing
schools where almost 94% of the students are eligible for free or reduced price lunch. It is
noteworthy, however, that poverty is common in even the high performing schools, where almost
40% of the pupils are eligible for free or reduced price lunch. Roughly 21% of the students in
low performing schools are limited English proficient (LEP), only slightly higher than the 17%
in middle performing schools, but these are significantly higher than the 11% in the high
performing schools. The distribution of recent immigrants is interesting low performing
schools have the smallest representation at 5% while high and middle performing schools are
roughly 8.3% recent immigrants.
Middle Schools
Middle schools classified by reading performance show similar demographic patterns
(Table V B). High performing schools have more whites and Asians, low performing schools
more blacks and Hispanics, but the differences across performance levels are less pronounced
than in elementary schools. That is, high performing middle schools are roughly 38% white,
compared to 51% in elementary schools. Again, representation of children with limited English
proficiency and the representation of poor children decline with performance. Interestingly,
while elementary schools are consistently 48 or 49% female, in middle schools, the percentage
female increases with performance from a low of approximately 47% in the low performing
schools to a high of approximately 52%. (Note that this pattern, although not the magnitude, is
the same in the analyses based on performance on math tests. See Appendix Table 2.)
Representation of recent immigrants in middle performing middle schools is about the same as it
18
9
is in elementary schools, although representation is notably lower in the high performing schools
and higher in the low performing schools.
Special Education
Research on special education offers myriad and conflicting suggestions about why and
how schools place students in special education. These decisions, in turn, may affect academic
performance. One possibility is that more special education students might reflect more children
with special needs in the school community. Alternatively, special education enrollments could
reflect a greater propensity to classify children as needing special education possibly in an
effort to separate 'disruptive' children from regular classrooms. At the same time, parents and
teachers in some schools may be quicker to identify mild learning disabilities and direct children
into resource rooms where parents and teachers in other schools identify these disabilities only
when they become more severe and the children end up in full time special education. Maybe
the school has a special education program that serves a number of schools in the community
school district. These are only some of the many forces that may drive differences in special
education across schools.
Our analysis reveals a higher percentage of children in full-time special education in the
lowest performing elementary and middle schools; the percentage declines with performance.
Referrals follow a similar pattern. In elementary schools, representation of children in resource
room does not follow the pattern, however (Table V A). More children are receiving resource
room services in high performing schools (6.23%) than in middle (5.85%) or low performing
schools (5.49%). In middle schools, the pattern differs again (Table V B). The highest
percentage of students receiving resource room services are in middle performing schools, while
the lowest percentage are in high performing schools.
Attendance
Our analysis includes two attendance variables average daily attendance (ADA) and
percent of students in the same school for the whole year, which is a measure of student
mobility. Low performing schools have the lowest ADA, and the lowest percentage of students
remaining in the school for the entire school year and both are significantly lower than the values
in high performing schools.
Characteristics of Teachers
Our analyses reveal a consistent pattern in the distribution of teacher characteristics
across performance levels. On average, low performing schools have the fewest teachers who
are licensed and permanently assigned to the school, who have been in the particular school for
two or more years, who have five years or more of previous teaching experience, or who have a
master's degree or higher. All of these are highest in the high performing schools; middle
performing schools fall somewhere in between. Since these are the factors that trigger salary
increases according to the terms of the teachers' contract, average teacher salaries follow suit.
Interestingly, teacher attendance also follows a similar pattern teachers in low performing
elementary schools average 8.5 days absent each year; their colleagues in high performing
elementary schools average 7.7 days absent. Again, this analysis carmot reveal whether these
relate to the cause of low performance, or are a result of more difficult conditions in low
performing schools.
Our data also include information on additional salary spending by the schools prep
period salary per teacher and 'other' salary per teacher. While interpreting this is particularly
difficult, one noteworthy pattern is that low-performing schools spend more on prep period
salary per teacher essentially indicating that teachers in low performing schools are more likely
to spend their prep periods working for extra salary. This may be because teachers in low
performing schools are absent more frequently, because it is difficult to draw substitute teachers
to low performing schools, or because teachers in low performing schools are more easily drawn
into forgoing their prep periods for pay; we cannot distinguish the reasons from these patterns in
the data.
Expenditures and Resources
Beginning with the pupil/teacher ratio, it should be noted that this is NOT the same as
average class size and there may be a significant difference between these. Our analysis
indicates that high performing schools have significantly higher pupil-teacher ratios low
performing schools in elementary reading tests have a pupil-teacher ratio of approximately 14.2
compared to almost 17.5 for high performing schools. The disparity is greater in middle schools
(12.7 versus 17). Spending per pupil follows the opposite course. Low performing schools
receiving significantly more funding than high performing schools overall. (See TOTAL
spending per pupil ALL in Table V A.) Spending in low performing elementary schools
averages $9,136 while spending in the high performing schools is $1,220 per pupil lower at
$7,916. The divergence is more profound in middle schools spending in low performing
middle schools is $10,305 while high performing middle schools receive only $7,622.

One explanation for this might be that low performing schools get more resources
because of the higher representation of special education students. Unfortunately, the data
suggest this is not the explanation. The same pattern (although not magnitude) is observed in an
analysis of general education expenditures for general education students. Table V A
(elementary schools) shows that the difference in TOTAL spending per pupil GE ONLY is
$7,421 versus $6,579 or $842. The implication is that the higher average salaries of teachers in
high performing schools is less important in driving disparities in overall spending than the lower
pupil-teacher ratio in low performing schools. Note, however, that low performing schools also
spend more on almost everything - education paraprofessionals, textbooks, librarians and library
books, and professional development.
Incorporating the expenditures on part-time special education for general education
students reveals the same pattern, although with more moderate magnitudes. (See TOTAL
spending per pupil GE + PTSE in Table V A.) Interestingly, spending on part time special
education students per se is highest in high achieving elementary schools and lowest in the low
achieving elementary schools, although this pattern is not repeated at the middle school level.
(See TOTAL spending per pupil GE/GE + PTSE/PTSE in Tables V A and V B). In addition,
for this group, expenditures on instructional support services increases with performance.
Finally, turning to the full-time special education students, the expenditure pattern
reverses. (See TOTAL spending per pupil SPECIAL ED in Table V A.) Total spending is
highest in the high performing schools, lowest in the low performing schools and, interestingly,
while the middle performing schools are, again, in the middle, spending is much closer to that in
22
2 3
the low performing schools. These patterns are repeated for subcategories of spending on
teachers and paraprofessionals, instructional support, and leadership/supervision/support.
V. Conclusions
The findings detailed above are only the initial results of an extended study; much
remains to be investigated before whatever causalities underlying these results can be
established. But the initial findings are disheartening, both because they confirm years of
previous research and because the findings are so consistent poorly performing New York City
schools overwhelmingly serve students of color who are poor, have consistently low attendance,
and who are taught by teachers who have very limited experience, few if any credentials, and
who make the lowest average salaries. Moreover, these poorly performing schools receive a
higher per pupil expenditure than the aggregates for middle and high-performing schools.
The latest comprehensive effort to examine what structures these relationships, a series of
articles examining the causes of The Black-White Test Score Gap, edited by Christopher Jencks
and Meredith Phillips (Brookings Institution Press, Washington, D.C. 1998), suggests that the
quality of students' family preparation for schooling, the quality of students' pre-school
experience, and the quality of students' teachers explain much of the underlying causes of
disparate performance. Large-scale research studies of the Tennessee Star Program suggest that
reducing class size in the very early grades may well contribute to lowering the racial gap in test
score performance. Other researchers across the past three decades have advanced other
arguments about the causal mechanisms explaining the relationships this initial study documents.
The next steps in this study will explore some of the underlying mechanisms structuring
the relationships we report above. We will also investigate the extent of variation in these
23
patterns, at district or school levels within New York City, that might begin to suggest how these
relationships can be transformed. Clearly, efforts to break the correlations between race,
poverty, poor teaching quality and student achievement are critical to the improvement of the
New York City school systems and other urban systems across the country. Hopefully the
continuation of this research can make a modest contribution to helping those efforts become
successful.
VARIABLELABEL VARIABLE NAME
TABLE II ADESCRIPTIVE STATISTICS
ALL VARAIBLES, ALL SCHOOLS1997-98
llEsaim;R3AVGNCE Read 3rd Grd: mean N.C.E.R4AVGNCE Read 4th Grd: mean N.C.E.R5AVGNCE Read 5th Grd: mean N.C.E.R6AVGNCE Read 6th Grd: mean N.C.E.R7AVGNCE Read 7th Grd: mean N.C.E.R8AVGNCE Read 8th Grd: mean N.C.E.RTAVGNCE Read All Grd: mean N.C.E. (weight NTST)R3PTAKE % Student Taken Test: R3R4PTAKE % Student Taken Test: R4R5PTAKE % Student Taken Test: R5R6PTAKE % Student Taken Test: R6R7PTAKE % Student Taken Test: R7R8PTAKE % Student Taken Test: R8RTPTAKE % Student Taken Test: RTR3PPASS Read 3rd Grd:% at/above grade(50th%tile)R4PPASS Read 4th Grd:% at/above grade(50th%tile)R5PPASS Read 5th Grd:% at/above grade(50th%tile)R6PPASS Read 6th Grd:% at/above grade(50th%tile)R7PPASS Read 7th Grd:% at/above grade(50th%tile)R8PPASS Read 8th Grd:% at/above grade(50th%tile)RTPPASS Read All Grd:% at/above grade(50th%tile)M3AVGNCE Math 3rd Grd: mean N.C.E.M4AVGNCE Math 4th Grd: mean N.C.E.M5AVGNCE Math 5th Grd: mean N.C.E.M6AVGNCE Math 6th Grd: mean N.C.E.M7AVGNCE Math 7th Grd: mean N.C.E.M8AVGNCE Math 8th Grd: mean N.C.E.MTAVGNCE Math All Grd: mean N.C.E. (weight NTST)M3PTAKE % Student Taken Test: M3M4PTAKE % Student Taken Test: M4M5PTAKE % Student Taken Test: M5M6PTAKE % Student Taken Test: M6M7PTAKE % Student Taken Test: M7M8PTAKE % Student Taken Test: M8MTPTAKE % Student Taken Test: MTM3PPASS Math 3rd Grd:% at/above grade(50th%tile)M4PPASS Math 4th Grd:% at/above grade(50th%tile)M5PPASS Math 5th Grd:% at/above grade(50th%tile)M6PPASS Math 6th Grd:% at/above grade(50th%tile)M7PPASS Math 7th Grd:% at/above grade(50th%tile)M8PPASS Math 8th Grd:% at/above grade(50th%tile)MTPPASS Math All Grd:% at/above grade(50th%tile)
SPECIAL EDUCATIONPSEREG Pct stu, special educationPRR Pct stu, resource roomPSEREF pct initial referrals to spec ed
SOCIOECONOMIC VARIABLESPFULLYR stu, pct in this school entire yearPATTEN stu,pct average daily attendance 9798PWHITE stu, pct whitePBLACK stu. pct blackPHISP stu, pct hispanicPASIAN stu, pct asianPFEMALE stu, pct femalePIMMIG Pct stu, Arrival to US<3 yrsPFL Pct stu eligible for free lunchPLEP Pct stu, LEP
Mean Minimum Maximum StdDev
669 50.72 25.20 79.40 8.76665 52.65 33.50 81.40 8.93663 50.01 4.00 86.00 9.68463 46.99 18.20 89.30 11.10279 48.90 22.40 84.40 9.39267 50.98 24.00 83.20 9.09905 50.35 25.20 79.57 9.03669 88.03 26.03 100.00 10.46665 91.33 60.81 100.00 7.14663 92.53 52.38 100.00 6.64464 91.93 0.00 100.00 9.36280 90.43 0.00 100.00 9.59267 90.01 1.39 100.00 9.99905 90.52 1.50 100.00 8.07669 51.52 0.00 94.40 17.84665 54.53 5.60 98.10 19.04663 48.10 0.00 100.00 20.56464 43.02 0.00 100.00 20.07280 46.09 0.00 100.00 20.94267 50.13 0.00 100.00 19.60905 49.74 0.00 98.70 18.39669 56.78 26.20 87.90 11.97665 59.20 28.00 92.40 12.42667 56.13 1.00 87.50 12.22465 56.23 31.40 90.30 11.43281 52.52 16.30 90.30 11.97267 53.52 31.20 88.90 10.77905 56.45 28.67 87.30 11.51669 92.32 55.24 100.00 6.47665 94.09 62.89 100.00 5.35667 94.58 52.38 100.00 5.48466 94.44 0.00 100.00 6.97281 93.66 42.55 100.00 6.25267 93.04 46.15 100.00 6.46905 93.61 46.39 100.00 5.34669 62.06 0.00 100.00 20.47665 63.99 10.00 100.00 19.93667 62.29 0.00 100.00 21.06466 62.63 0.00 100.00 20.40281 54.98 0.00 100.00 21.58267 57.90 6.30 100.00 20.32905 61.53 12.70 100.00 19.36
904 6.33 0.00 37.70 6.29883 6.27 0.10 21.10 2.95882 4.94 0.40 20.20 2.58
888 92.18 49.60 99.80 4.16905 90.50 77.80 98.50 2.98904 16.62 0.00 93.80 23.45904 35.94 0.00 97.60 30.06904 37.37 1.30 99.40 26.23904 10.06 0.00 94.30 14.06904 48.83 23.50 100.00 3.63904 7.70 0.00 91.60 6.63905 75.08 6.30 100.00 23.56864 15.93 0.30 115.30 13.10
25
26

TEACHERSPTCHAPTCHFPTCHCPTCHDPTCHETFTSLTPRPSLTOTHSL
pct tch fully lic/perm assignedpct tch more than 2 yrs in this schoolpct tch more than 5 yrs teachingpct tch masters or higherpct tch avg num days absentFull-timeTch PER TCH: SalaryPrepPeriodTch PER TCH: SalaryOther Tch PER TCH: Salary
VARIABLE LABEL VARIABLE NAME
847 85.29 0.00 100.00 12.73847 67.92 0.00 100.00 16.52847 61.82 0.00 100.00 13.10847 78.67 41.70 100.00 10.39799 7.91 3.00 14.50 1.45905 43256.71 28198.59 80274.41 4172.72905 183.81 -0.47 1653.33 315.15905 1656.54 226.24 13731.82 1148.41
TABLE 11 A (CONTINUED)Mean Minimum Maximum StdDev
RESOURCESPUP_TCH Pupil:Teacher Ratio (ALL_STD:TCHR_TOT) 905 15.69 6.63 31.47 2.58TOTAL SPENDING PER PUPIL --ALLA_TOTAL TOTAL (SUM of I, II, III wo/passths) 905 8358.73 4761.49 22414.42 1878.06A_I_DIR I. DIRECT SERVICES (SUM A,B,C,D,E,& F) 905 7490.01 3960.54 21509.95 1829.63A_IA I. A. CLASSROOM INSTRUCTION 905 4506.49 2876.85 11358.11 885.48A1100100 I. A.Classroom Instr, Teachers 905 3854.78 2397.70 8990.60 724.33A1100125 I. A.Classroom Instr, Ed Paras 905 254.39 -0.06 1105.06 169.30A1100175 I. A.Classroom Instr, Text Books 905 76.72 2.75 602.64 43.00A1100200 I. A.Classroom Instr, Librians/LibBooks 905 9.45 0.00 228.41 16.78A1100250 I. A.Classroom Instr, Prof Development 905 121.11 27.44 1220.37 87.94AJA_OTH I. A.Classroom Instr, OTHER 905 190.04 25.11 1881.54 132.91A_18 I. B. INSTRUCTIONAL SUPPORT SERVICES 905 824.45 59.41 4104.49 444.99A IC I. C. LEADERSHIP/SUPERVISION/SUPPORT 905 633.44 183.98 3323.90 215.94A_ID I. D. ANCILLARY SUPPORT SERVICES 905 860.36 95.13 2972.62 344.75A_I_OTH I. Direct Services, OTHER (E&F) 905 665.27 35.42 5705.54 484.07A_II_DST II. DISTRICT/SUPERINT COSTS (SUM A & B) 905 176.89 53.68 1082.05 80.34TOTAL SPENDING PER PUPIL GE ONLYG_TOTAL TOTAL (SUM of I, II, III - wo/passths) 905 7017.42 4146.08 22266.33 1381.18G I DIR I. DIRECT SERVICES (SUM A,B,C,D,E,& F) 905 6210.01 3357.08 21365.03 1353.47G_IA I. A. CLASSROOM INSTRUCTION 905 4065.57 2436.97 10489.45 739.96G1100100 I. A.Classroom Instr, Teachers 905 3523.14 2025.14 8264.61 623.24GI100125 I. A.Classroom Instr, Ed Paras 905 163.75 -0.06 717.70 128.49G1100175 I. A.Classroom Instr, Text Books 905 74.38 2.81 582.19 42.94G1100200 I. A.Classroom Instr, Librians/LibBooks 905 9.46 0.00 228.27 17.09G1100250 I. A.Classroom Instr, Prof Development 905 107.98 26.35 1216.35 84.88GJA_OTH I. A.Classroom Instr, OTHER 905 186.86 23.73 1880.94 133.46G_IB I. B. INSTRUCTIONAL SUPPORT SERVICES 905 264.52 43.75 1483.69 144.87G_IC I. C. LEADERSHIP/SUPERVISION/SUPPORT 905 598.26 172.01 3323.89 208.16G_ID I. D. ANCILLARY SUPPORT SERVICES 905 615.50 95.04 1699.48 174.44G_I_OTH I. Direct Services, OTHER (E&F) 905 666.15 35.52 5706.47 485.56G_II_DST II. DISTRICT/SUPERINT COSTS (SUM A & B) 905 164.54 48.69 1051.38 80.09TOTAL SPENDING PER PUPIL - GE + PTSEGP_TOT TOTAL (SUM of I, II, III - wo/passths) 905 7505.73 4473.19 22316.03 1500.96GP_IDIR I. DIRECT SERVICES (SUM A,B,C,D,E,& F) 905 6663.40 3651.62 21411.56 1463.95GP_IA I. A. CLASSROOM INSTRUCTION 905 4213.41 2545.45 10490.25 780.74GP_1100 I. A.Classroom Instr, Teachers 905 3664.48 2126.10 8264.61 668.98GP_1125 I. A.Classroom Instr, Ed Paras 905 164.15 -0.06 717.91 128.54GP_I175 I. A.Classroom Instr, Text Books 905 75.47 2.81 586.03 42.96GP_1200 I. A.Classroom Instr, Librians/LibBooks 905 9.60 0.00 228.41 17.14GP_1250 I. A.Classroom Instr, Professional Devl 905 110.87 26.67 1216.35 85.39GP1A_OTH I. A.Classroom Instr, OTHER 905 188.83 23.79 1881.54 133.83GP_IB I. B. INSTRUCTIONAL SUPPORT SERVICES 905 562.87 59.41 4020.96 261.21GP_IC I. C. LEADERSHIP/SUPERVISION/SUPPORT 905 604.09 176.76 3323.90 209.89GP ID I. D. ANCILLARY SUPPORT SERVICES 905 616.84 95.11 1699.67 174.43GPI_OTH I. Direct Services, OTHER (E&F) 905 666.17 35.52 5706.51 485.56GP_IIDST II. DISTRICT/SUPERINT COSTS (SUM A & B) 905 173.26 53.68 1088.06 82.14TOTAL SPENDING PER PUPIL GE/GE + PTSE/PTSEH_TOTAL TOTAL (SUM of I, II, III - wo/passths) 899 14634.70 6668.17 44437.64 3636.64H_I_DIR I. DIRECT SERVICES (SUM A,B,C,D,E,& F) 899 13294.24 5878.17 43036.02 3595.35H_IA I. A. CLASSROOM INSTRUCTION 899 6266.81 3068.11 16346.63 1571.83
26
27
H1100100 I. A.Classroom Instr, Teachers 899 5628.83 2431.22 14575.00 1498.9381100125 I. A.Classroom Instr, Ed Paras 899 168.96 -0.06 889.97 133.43H1100175 I. A.Classroom Instr, Text Books 899 90.92 2.82 612.04 46.6981100200 I. A.Classroom Instr, Librians/LibBooks 899 11.31 0.00 229.84 18.53H1100250 I. A.Classroom Instr, Prof Development 899 151.27 51.67 922.96 93.73H_IA_OTH I. A.Classroom Instr, OTHER 899 215.52 24.95 1887.49 146.56H_IB I. B. INSTRUCTIONAL SUPPORT SERVICES 899 5036.63 306.29 33628.01 2754.41H_IC I. C. LEADERSHIP/SUPERVISION/SUPPORT 899 689.06 232.47 7688.57 368.00H_ID I. D. ANCILLARY SUPPORT SERVICES 899 636.21 115.68 1720.12 173.99H_I_OTH I. Direct Services, OTHER (E&F) 899 665.54 35.82 5706.77 485.98H_II_DST II. DISTRICT/SUPERINT COSTS (SUM A & B) 899 294.13 77.30 1999.70 193.77TOTAL SPENDING PER PUPIL - SPECIAL EDUCATIONF_TUFAL TOTAL (SUM of I, II, III - wo/passths) 729 21811.56 0.00 123194.57 8069.79F_I_DIR I. DIRECT SERVICES (SUM A,B,C,D,E,& F) 729 20556.44 0.00 122059.70 7985.90F_IA I. A. CLASSROOM INSTRUCTION 729 9414.37 0.00 65642.46 4676.53F1100100 I. A.Classroom Instr, Teachers 729 7126.93 0.00 64784.27 3884.56F1100125 I. A.Classroom Instr, Ed Paras 729 1691.95 0.00 15704.16 1386.83F1100175 I. A.Classroom Instr., Text Books 729 93.46 0.00 1281.56 70.06F1100200 I. A.Classroom Instr, Librians/LibBooks 729 6.85 0.00 135.08 13.75F1100250 I. A.Classroom Instr, Prof Development 729 285.53 0.00 5971.63 309.08F_IA_OTH I. A.Classroom Instr, OTHER 729 209.65 0.00 2173.14 149.27F_IB I. B. INSTRUCTIONAL SUPPORT SERVICES 729 4819.63 0.00 17371.38 2201.15F_IC I. C. LEADERSHIP/SUPERVISION/SUPPORT 729 1005.43 0.00 7144.01 648.99F_ID I. D. ANCILLARY SUPPORT SERVICES 729 4688.42 0.00 41149.01 2922.31F_I_OTH I. Direct Services, OTHER (E&F) 729 628.59 0.00 5701.70 417.25F_II_DST II. DISTRICT/SUPERINT COSTS (SUM A & B) 729 235.19 0.00 1331.08 168.96
TABLE II A (CONTINUED)
VARIABLELABEL VARIABLE NAME Mean Minimum Maximum StdDev
STUDENT MIMSALL_STD All Students (GE + FTSE) 905 870.46 66.00 2671.00 365.89GE_STD General Education Students 905 819.38 53.00 2671.00 358.20PTSE_STD Part-time Special Education Students 905 51.21 0.00 180.00 29.49FTSE_STD Full-time Special Education Students 905 51.08 0.00 234.00 47.63TOTREG nbrReg 904 803.28 42.00 2672.00 403.06NGEREG stu, num gen ed 904 755.24 42.00 2672.00 391.69NRR stu, num resource rm 883 47.58 1.00 170.00 27.72NSEREG stu, num spec ed 904 48.04 0.00 234.00 47.77
27
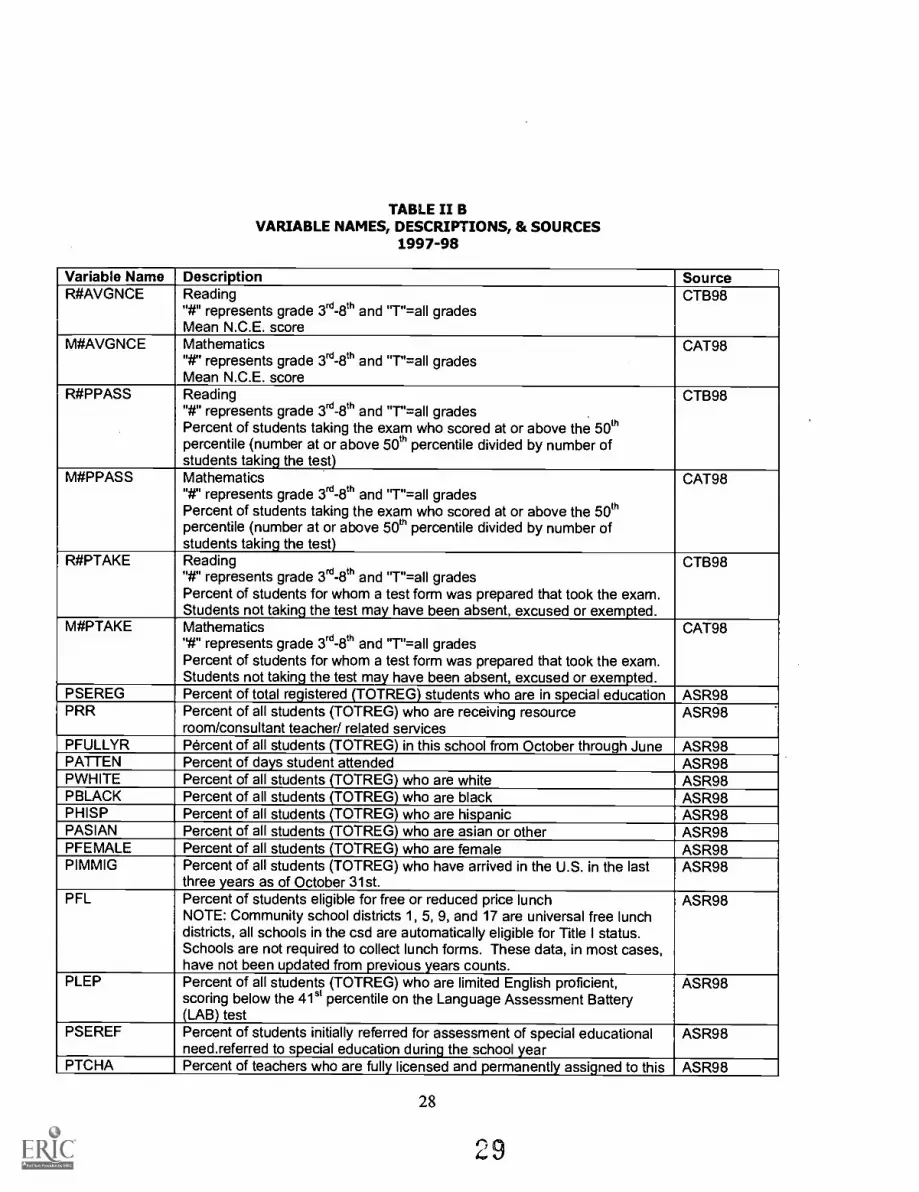
TABLE II BVARIABLE NAMES, DESCRIPTIONS, & SOURCES
1997-98
Variable Name Description SourceR#AVGNCE Reading
"#" represents grade 3rd_801 and "T"=all gradesMean N.C.E. score
CTB98
M#AVGNCE Mathematics"#" represents grade 3rd-8th and "T"=all gradesMean N.C.E. score
CAT98
R#PPASS Reading"#" represents grade 3rd-8th and "T"=all gradesPercent of students taking the exam who scored at or above the 50thpercentile (number at or above 50th percentile divided by number ofstudents taking the test)
CTB98
M#PPASS Mathematics"#" represents grade 3rd-8th and "T"=all gradesPercent of students taking the exam who scored at or above the 50thpercentile (number at or above 50th percentile divided by number ofstudents taking the test)
CAT98
R#PTAKE Reading"#" represents grade 3rd-8th and "r=all gradesPercent of students for whom a test form was prepared that took the exam.Students not taking the test may have been absent, excused or exempted.
CTB98
M#PTAKE Mathematics"#" represents grade 3rd-8th and "r=all gradesPercent of students for whom a test form was prepared that took the exam.Students not taking the test may have been absent, excused or exempted.
CAT98
PSEREG Percent of total registered (TOTREG) students who are in special education ASR98PRR Percent of all students (TOTREG) who are receiving resource
room/consultant teacher/ related servicesASR98
.
PFULLYR Percent of all students (TOTREG) in this school from October through June ASR98PATTEN Percent of days student attended ASR98PWHITE Percent of all students (TOTREG) who are white ASR98PBLACK Percent of all students (TOTREG) who are black ASR98PHISP Percent of all students (TOTREG) who are hispanic ASR98PASIAN Percent of all students (TOTREG) who are asian or other ASR98PFEMALE Percent of all students (TOTREG) who are female ASR98PIMMIG Percent of all students (TOTREG) who have arrived in the U.S. in the last
three years as of October 31st.ASR98
PFL Percent of students eligible for free or reduced price lunchNOTE: Community school districts 1, 5, 9, and 17 are universal free lunchdistricts, all schools in the csd are automatically eligible for Title I status.Schools are not required to collect lunch forms. These data, in most cases,have not been updated from previous years counts.
ASR98
PLEP Percent of all students (TOTREG) who are limited English proficient,scoring below the 41st percentile on the Language Assessment Battery(LAB) test
ASR98
PSEREF Percent of students initially referred for assessment of special educationalneed.referred to special education during the school year
ASR98
PTCHA Percent of teachers who are fully licensed and permanently assigned to this ASR98
28
4 9
Variable Name Description Sourceschool(9798 Human Resource division provided school level data to DAA)
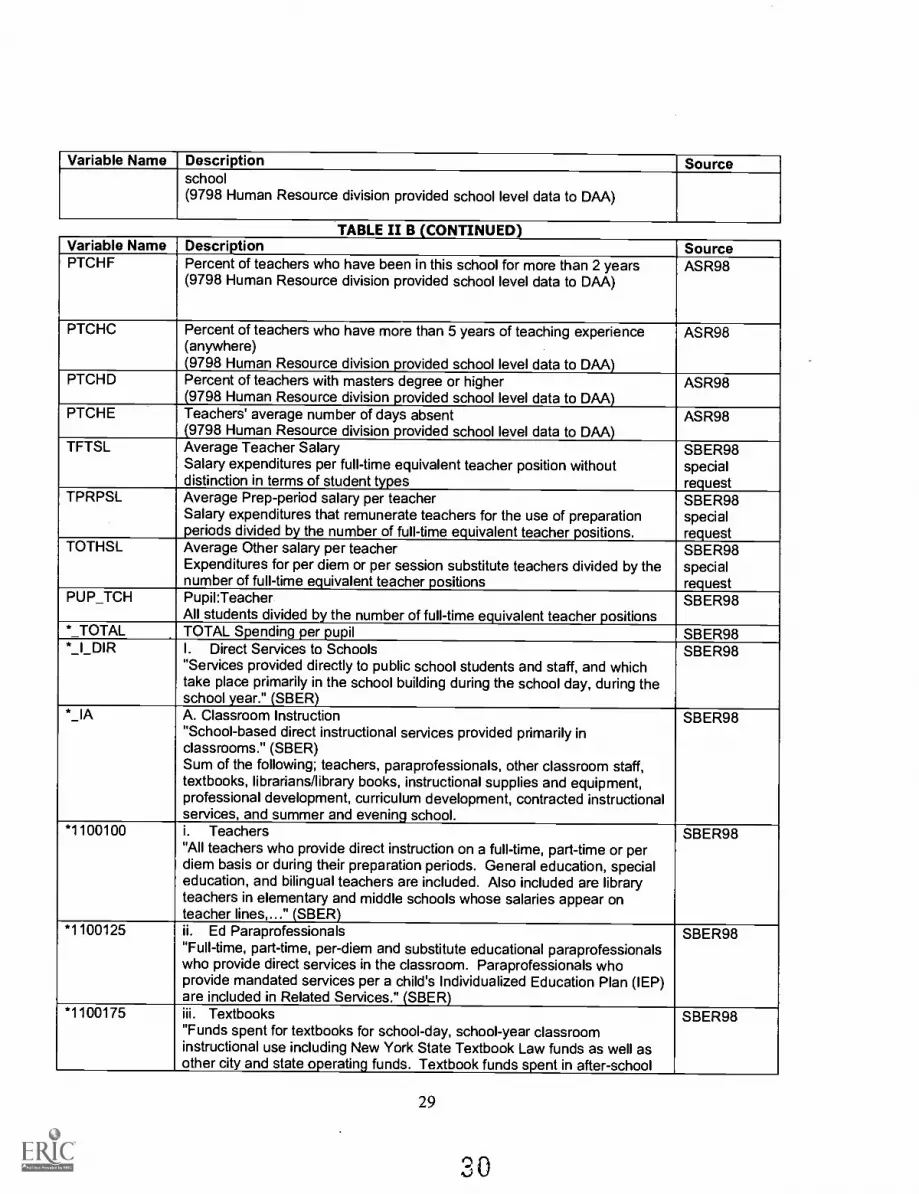
TABLE II B CONTINUEDVariable Name Description SourcePTCHF Percent of teachers who have been in this school for more than 2 years
(9798 Human Resource division provided school level data to DAA)ASR98
PTCHC Percent of teachers who have more than 5 years of teaching experience(anywhere)(9798 Human Resource division provided school level data to DAA)
ASR98
PTCHD Percent of teachers with masters degree or higher(9798 Human Resource division provided school level data to DAA)
ASR98
PTCHE Teachers' average number of days absent(9798 Human Resource division provided school level data to DAA)
ASR98
TFTSL Average Teacher SalarySalary expenditures per full-time equivalent teacher position withoutdistinction in terms of student types
SBER98specialrequest
TPRPSL Average Prep-period salary per teacherSalary expenditures that remunerate teachers for the use of preparationperiods divided by the number of full-time equivalent teacher positions.
SBER98specialrequest
TOTHSL Average Other salary per teacherExpenditures for per diem or per session substitute teachers divided by thenumber of full-time equivalent teacher positions
SBER98specialrequest
PUP_TCH Pupil:Teacher.All students divided by the number of full-time equivalent teacher positions
SBER98
*TOTAL TOTAL Spending per pupil SBER98* J_DIR I. Direct Services to Schools
"Services provided directly to public school students and staff, and whichtake place primarily in the school building during the school day, during theschool year." (SBER)
SBER98
* _IA A. Classroom Instruction"School-based direct instructional services provided primarily inclassrooms." (SBER)Sum of the following; teachers, paraprofessionals, other classroom staff,textbooks, librarians/library books, instructional supplies and equipment,professional development, curriculum development, contracted instructionalservices, and summer and evening school.
SBER98
*1100100 i. Teachers"All teachers who provide direct instruction on a full-time, part-time or perdiem basis or during their preparation periods. General education, specialeducation, and bilingual teachers are included. Also included are libraryteachers in elementary and middle schools whose salaries appear onteacher lines,..." (SBER)
SBER98
*1100125 ii. Ed Paraprofessionals"Full-time, part-time, per-diem and substitute educational paraprofessionalswho provide direct services in the classroom. Paraprofessionals whoprovide mandated services per a child's Individualized Education Plan (IEP)are included in Related Services." (SBER)
SBER98
*1100175 iii. Textbooks"Funds spent for textbooks for school-day, school-year classroominstructional use including New York State Textbook Law funds as well asother city and state operating funds. Textbook funds spent in after-school
SBER98
29
Variable Name Description Sourcebudgets are included in After-School Programs; textbook funds for summerschool are included in Summer School, etc. Thus, funds reported in thiscategory do not represent the entire budget for textbooks." (SBER)
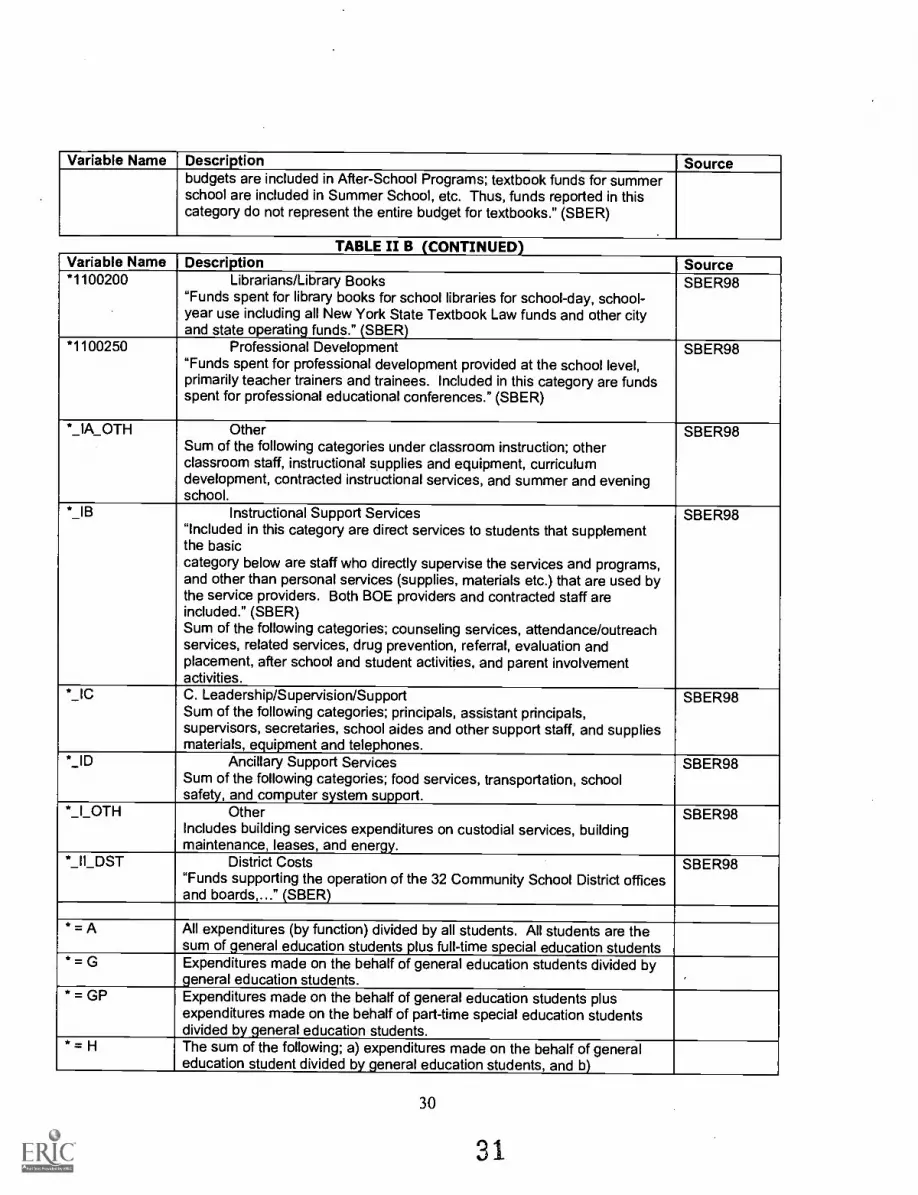
TABLE II B CONTINUEDVariable Name Description Source*1100200 Librarians/Library Books
"Funds spent for library books for school libraries for school-day, school-year use including all New York State Textbook Law funds and other cityand state operating funds." (SBER)
SBER98
*1100250 Professional Development"Funds spent for professional development provided at the school level,primarily teacher trainers and trainees. Included in this category are fundsspent for professional educational conferences." (SBER)
SBER98
*_IA_OTH OtherSum of the following categories under classroom instruction; otherclassroom staff, instructional supplies and equipment, curriculumdevelopment, contracted instructional services, and summer and eveningschool.
SBER98
* JB Instructional Support Services"Included in this category are direct services to students that supplementthe basiccategory below are staff who directly supervise the services and programs,and other than personal services (supplies, materials etc.) that are used bythe service providers. Both BOE providers and contracted staff areincluded." (SBER)Sum of the following categories; counseling services, attendance/outreachservices, related services, drug prevention, referral, evaluation andplacement, after school and student activities, and parent involvementactivities.
SBER98
*_lC C. Leadership/Supervision/SupportSum of the following categories; principals, assistant principals,supervisors, secretaries, school aides and other support staff, and suppliesmaterials, equipment and telephones.
SBER98
*_10 Ancillary Support ServicesSum of the following categories; food services, transportation, schoolsafety, and computer system support.
SBER98
*_l_OTH OtherIncludes building services expenditures on custodial services, buildingmaintenance, leases, and energy.
SBER98
*_II_DST District Costs"Funds supporting the operation of the 32 Community School District officesand boards,..." (SBER)
SBER98
* = A All expenditures (by function) divided by all students. All students are thesum of general education students plus full-time special education students
* = G Expenditures made on the behalf of general education students divided bygeneral education students.
* = GP Expenditures made on the behalf of general education students plusexpenditures made on the behalf of part-time special education studentsdivided by general education students.
* = H The sum of the following; a) expenditures made on the behalf of generaleducation student divided by general education students, and b)
30
31
Variable Name Description Sourceexpenditures made on the behalf of part-time special education studentsdivided by part-time special education students
" = F Expenditures made on the behalf of full-time special education studentsdivided by full-time special education students.
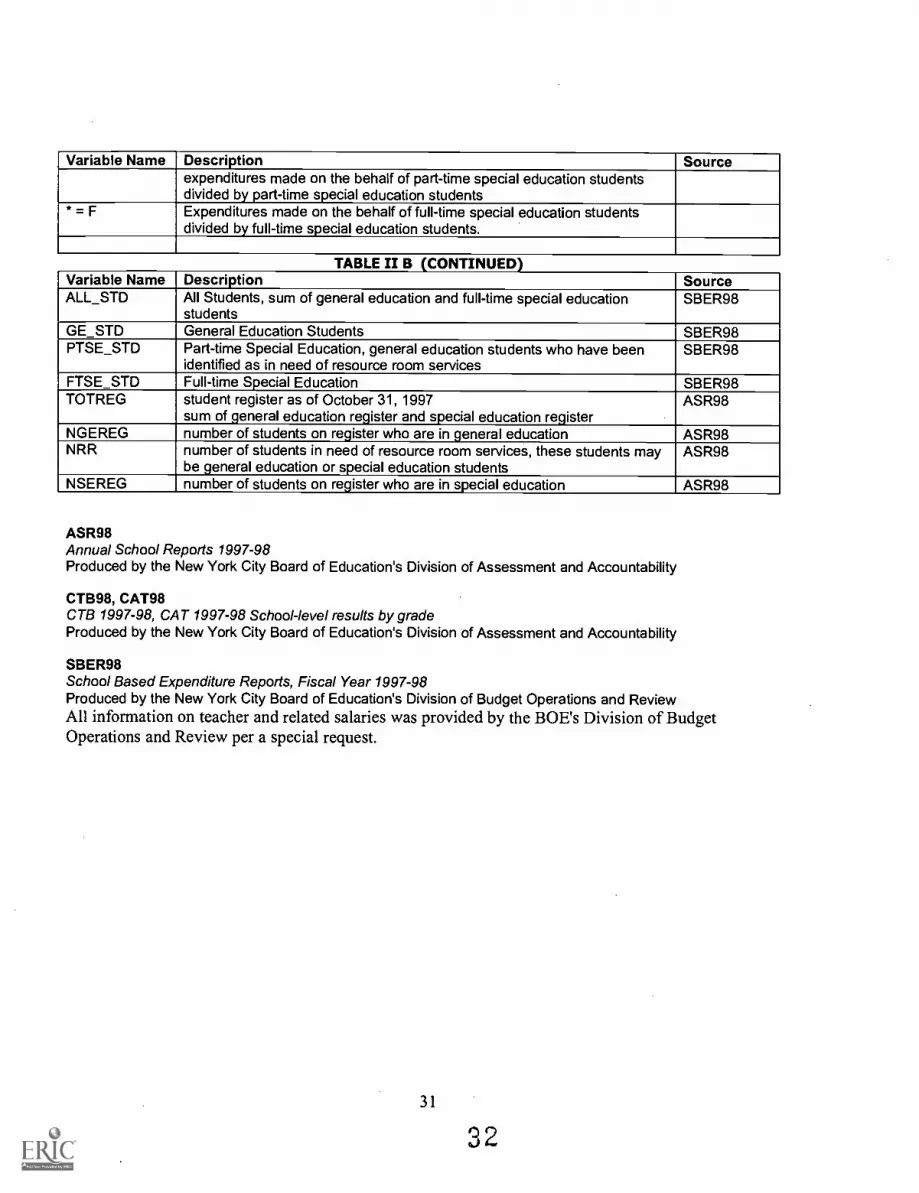
TABLE II B CONTINUEDVariable Name Description SourceALL_STD An Students, sum of general education and full-time special education
studentsSBER98
GE_STD General Education Students SBER98PTSE_STD Part-time Special Education, general education students who have been
identified as in need of resource room servicesSBER98
FTSE_STD Full-time Special Education SBER98TOTREG student register as of October 31, 1997
sum of general education register and special education registerASR98
NGEREG number of students on register who are in general education ASR98NRR number of students in need of resource room services, these students may
be general education or special education studentsASR98
NSEREG number of students on register who are in special education ASR98
ASR98Annual School Reports 1997-98Produced by the New York City Board of Education's Division of Assessment and Accountability
CTB98, CAT98CTB 1997-98, CAT 1997-98 School-level results by gradeProduced by the New York City Board of Education's Division of Assessment and Accountability
SBER98School Based Expenditure Reports, Fiscal Year 1997-98Produced by the New York City Board of Education's Division of Budget Operations and ReviewAll information on teacher and related salaries was provided by the BOE's Division of BudgetOperations and Review per a special request.
3 1
32
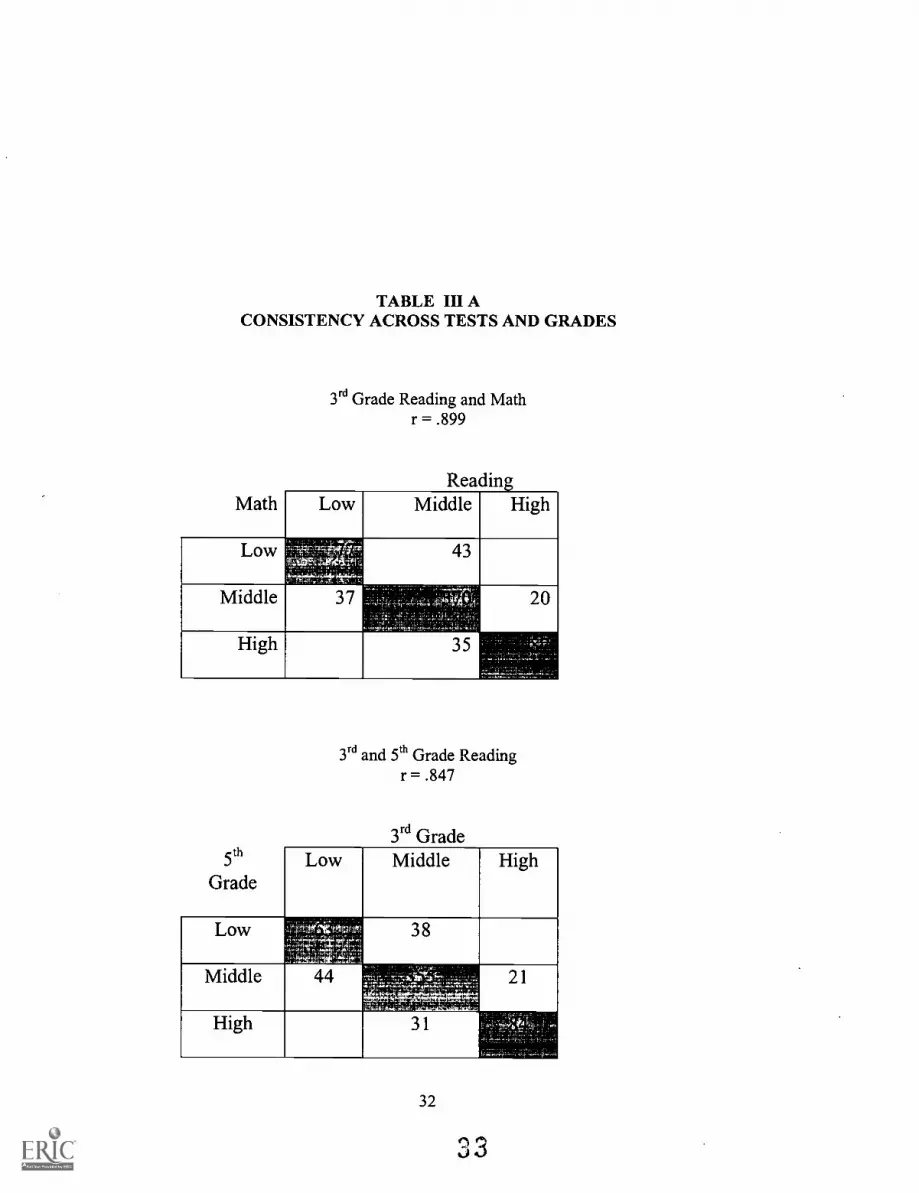
TABLE III ACONSISTENCY ACROSS TESTS AND GRADES
Math
Low
Middle
High
3`d Grade Reading and Mathr = .899
ReadingLow Middle
43
37
35
High
20
5th
Grade
3`d and 5th Grade Readingr = .847
3rd GradeLow Middle High
Low 38
Middle
High
32
0j
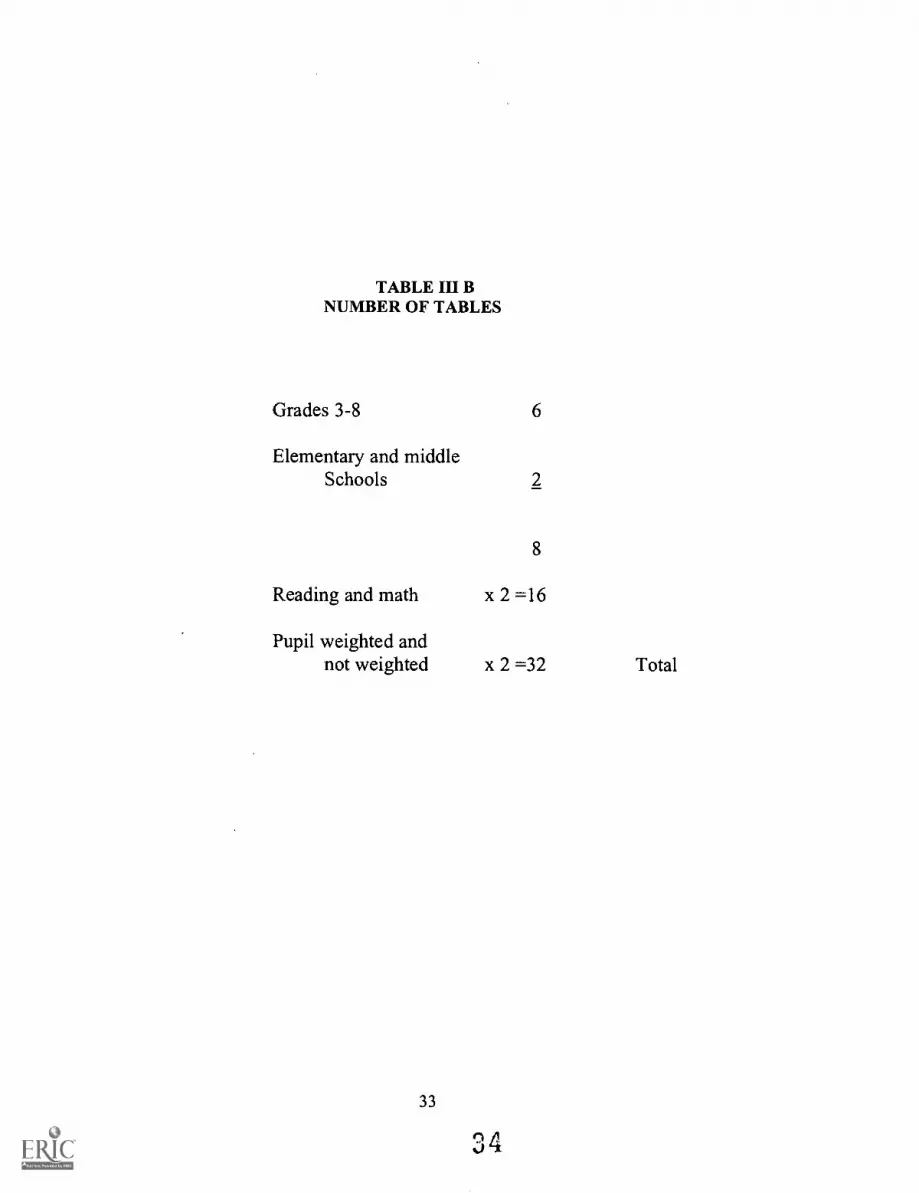
TABLE III BNUMBER OF TABLES
Grades 3-8 6
Elementary and middleSchools 2
8
Reading and math x 2 =16
Pupil weighted andnot weighted x 2 =32
33
`D4
Total
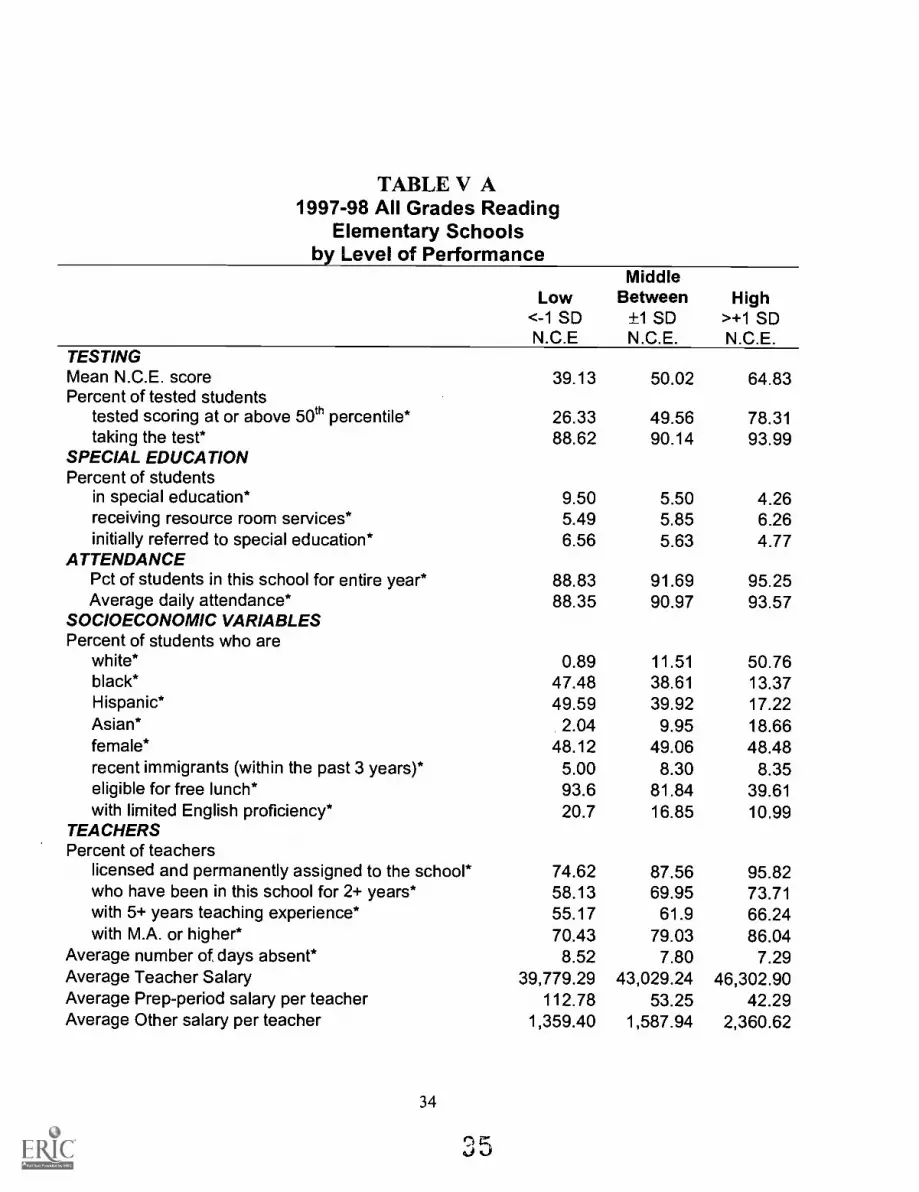
TABLE V A1997-98 All Grades Reading
Elementary Schoolsby Level of Performance
Low<-1 SDN.C.E
MiddleBetween
±1 SDN.C.E.
High>+1 SDN.C.E.
TESTINGMean N.C.E. score 39.13 50.02 64.83Percent of tested students
tested scoring at or above 50th percentile* 26.33 49.56 78.31taking the test* 88.62 90.14 93.99
SPECIAL EDUCATIONPercent of students
in special education* 9.50 5.50 4.26receiving resource room services* 5.49 5.85 6.26initially referred to special education* 6.56 5.63 4.77
ATTENDANCEPct of students in this school for entire year* 88.83 91.69 95.25Average daily attendance* 88.35 90.97 93.57
SOCIOECONOMIC VARIABLESPercent of students who are
white* 0.89 11.51 50.76black* 47.48 38.61 13.37Hispanic* 49.59 39.92 17.22Asian* 2.04 9.95 18.66female* 48.12 49.06 48.48recent immigrants (within the past 3 years)* 5.00 8.30 8.35eligible for free lunch* 93.6 81.84 39.61with limited English proficiency* 20.7 16.85 10.99
TEACHERSPercent of teachers
licensed and permanently assigned to the school* 74.62 87.56 95.82who have been in this school for 2+ years* 58.13 69.95 73.71with 5+ years teaching experience* 55.17 61.9 66.24with M.A. or higher* 70.43 79.03 86.04
Average number of days absent* 8.52 7.80 7.29Average Teacher Salary 39,779.29 43,029.24 46,302.90Average Prep-period salary per teacher 112.78 53.25 42.29Average Other salary per teacher 1,359.40 1,587.94 2,360.62
34
0 0
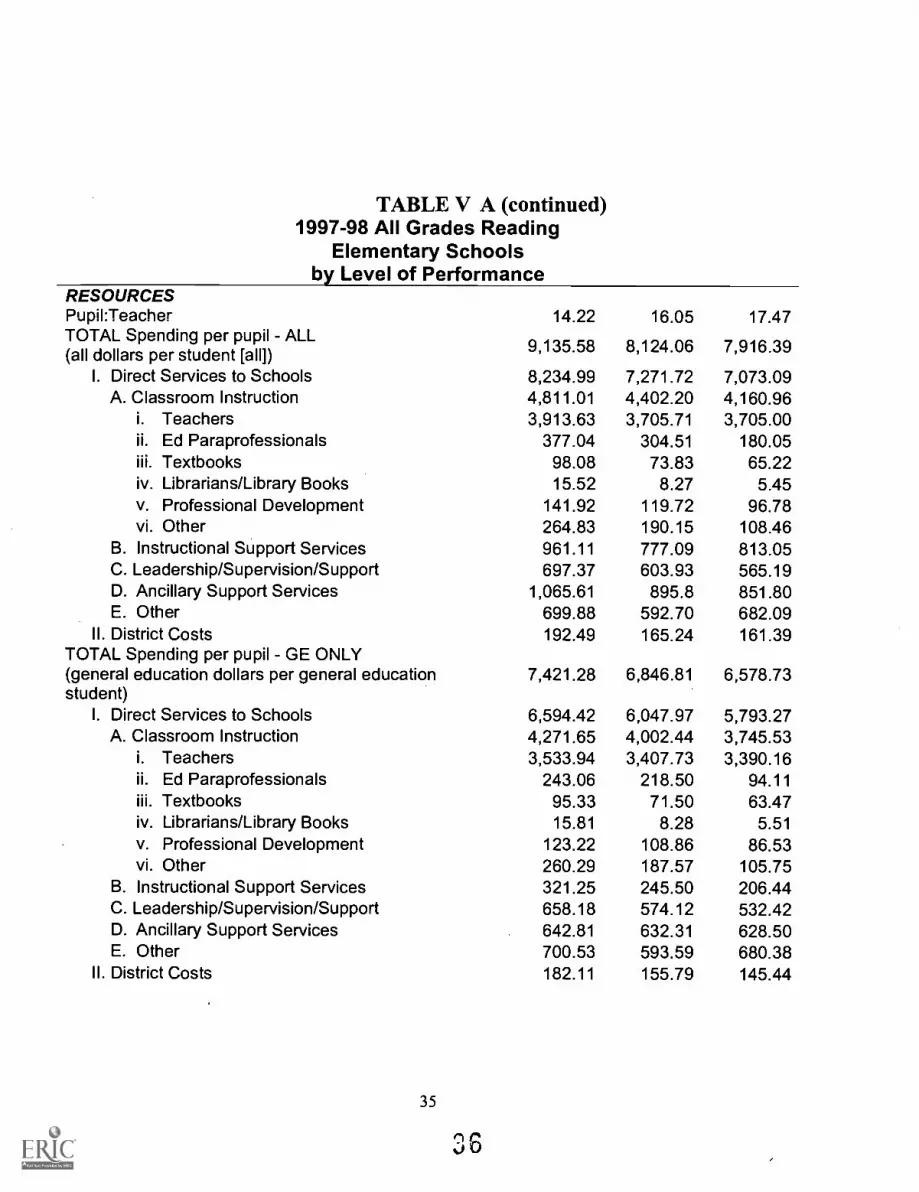
TABLE V A (continued)1997-98 All Grades Reading
Elementary Schoolsby Level of Performance
RESOURCESPupil:TeacherTOTAL Spending per pupil - ALL(all dollars per student [all])
I. Direct Services to SchoolsA. Classroom Instruction
i. Teachersii. Ed Paraprofessionalsiii. Textbooksiv. Librarians/Library Booksv. Professional Developmentvi. Other
B. Instructional Support ServicesC. Leadership/Supervision/SupportD. Ancillary Support ServicesE. Other
II. District CostsTOTAL Spending per pupil - GE ONLY(general education dollars per general educationstudent)
I. Direct Services to SchoolsA. Classroom Instruction
i. Teachersii. Ed Paraprofessionalsiii. Textbooksiv. Librarians/Library Booksv. Professional Developmentvi. Other
B. Instructional Support ServicesC. Leadership/Supervision/SupportD. Ancillary Support ServicesE. Other
II. District Costs
35
14.22 16.05 17.47
9,135.58 8,124.06 7,916.39
8,234.99 7,271.72 7,073.094,811.01 4,402.20 4,160.963,913.63 3,705.71 3,705.00
377.04 304.51 180.0598.08 73.83 65.2215.52 8.27 5.45
141.92 119.72 96.78264.83 190.15 108.46961.11 777.09 813.05697.37 603.93 565.19
1,065.61 895.8 851.80699.88 592.70 682.09192.49 165.24 161.39
7,421.28 6,846.81 6,578.73
6,594.42 6,047.97 5,793.274,271.65 4,002.44 3,745.533,533.94 3,407.73 3,390.16
243.06 218.50 94.1195.33 71.50 63.4715.81 8.28 5.51
123.22 108.86 86.53260.29 187.57 105.75321.25 245.50 206.44658.18 574.12 532.42642.81 632.31 628.50700.53 593.59 680.38182.11 155.79 145.44
o cu
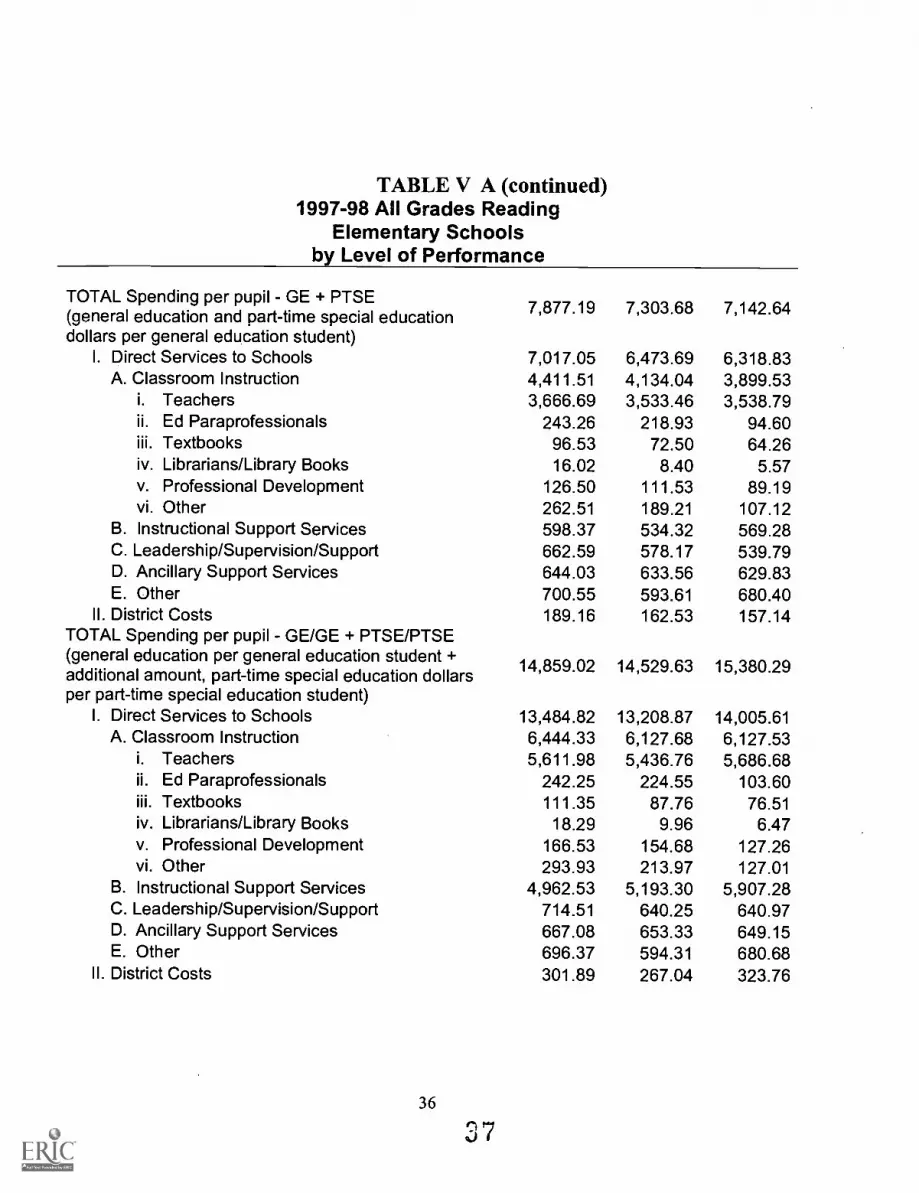
TABLE V A (continued)1997-98 All Grades Reading
Elementary Schoolsby Level of Performance
TOTAL Spending per pupil GE + PTSE(general education and part-time special educationdollars per general education student)
I. Direct Services to SchoolsA. Classroom Instruction
i. Teachersii. Ed Paraprofessionalsiii. Textbooksiv. Librarians/Library Booksv. Professional Developmentvi. Other
B. Instructional Support ServicesC. Leadership/Supervision/SupportD. Ancillary Support ServicesE. Other
II. District CostsTOTAL Spending per pupil - GE/GE + PTSE/PTSE(general education per general education student +additional amount, part-time special education dollarsper part-time special education student)
I. Direct Services to SchoolsA. Classroom Instruction
i. Teachersii. Ed Paraprofessionalsiii. Textbooksiv. Librarians/Library Booksv. Professional Developmentvi. Other
B. Instructional Support ServicesC. Leadership/Supervision/SupportD. Ancillary Support ServicesE. Other
II. District Costs
36
37
7,877.19 7,303.68 7,142.64
7,017.05 6,473.69 6,318.834,411.51 4,134.04 3,899.533,666.69 3,533.46 3,538.79
243.26 218.93 94.6096.53 72.50 64.2616.02 8.40 5.57
126.50 111.53 89.19262.51 189.21 107.12598.37 534.32 569.28662.59 578.17 539.79644.03 633.56 629.83700.55 593.61 680.40189.16 162.53 157.14
14,859.02 14,529.63 15,380.29
13,484.82 13,208.87 14,005.616,444.33 6,127.68 6,127.535,611.98 5,436.76 5,686.68
242.25 224.55 103.60111.35 87.76 76.5118.29 9.96 6.47
166.53 154.68 127.26293.93 213.97 127.01
4,962.53 5,193.30 5,907.28714.51 640.25 640.97667.08 653.33 649.15696.37 594.31 680.68301.89 267.04 323.76
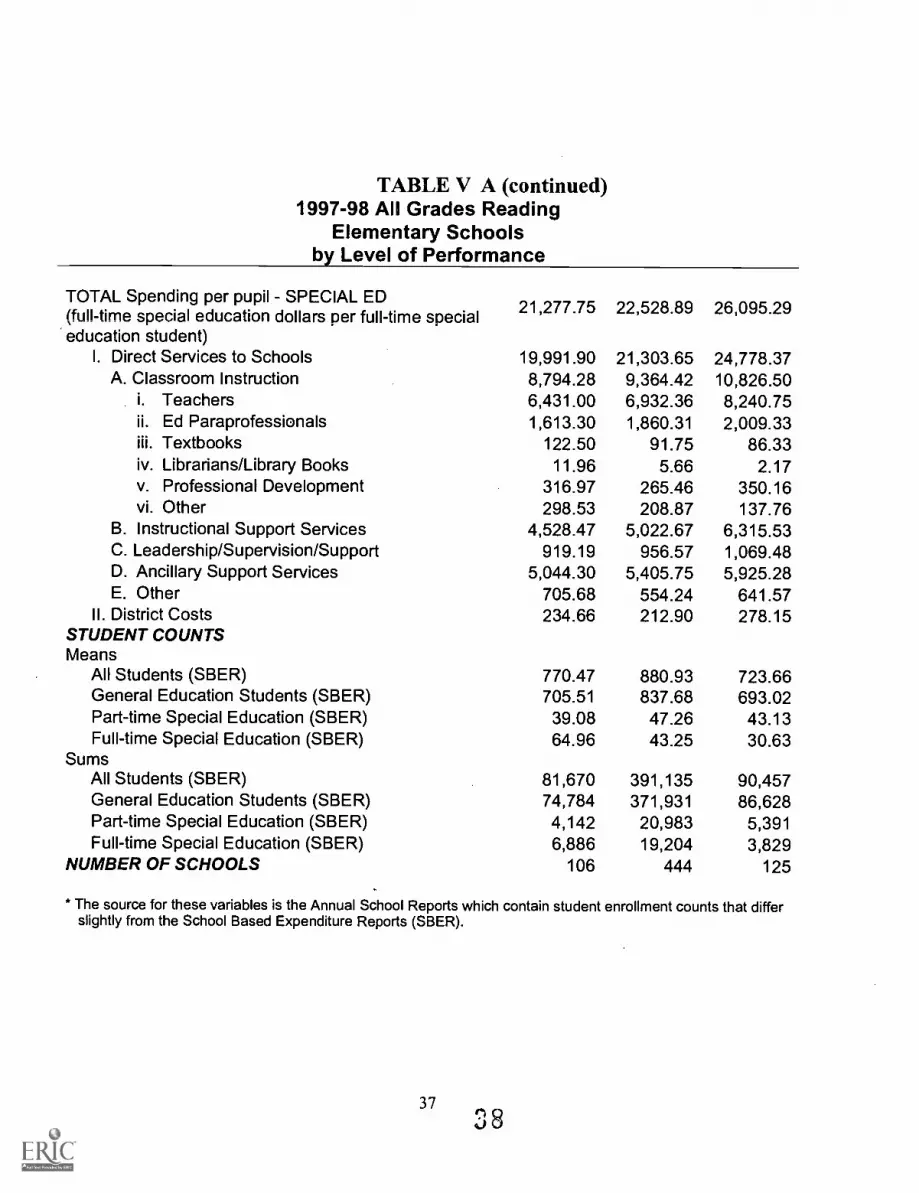
TABLE V A (continued)1997-98 All Grades Reading
Elementary Schoolsby Level of Performance
TOTAL Spending per pupil - SPECIAL ED(full-time special education dollars per full-time specialeducation student)
I. Direct Services to SchoolsA. Classroom Instruction
i. Teachersii. Ed Paraprofessionalsiii. Textbooksiv. Librarians/Library Booksv. Professional Developmentvi. Other
B. Instructional Support ServicesC. Leadership/Supervision/SupportD. Ancillary Support ServicesE. Other
II. District CostsSTUDENT COUNTSMeans
All Students (SBER)General Education Students (SBER)Part-time Special Education (SBER)Full-time Special Education (SBER)
SumsAll Students (SBER)General Education Students (SBER)Part-time Special Education (SBER)Full-time Special Education (SBER)
NUMBER OF SCHOOLS
21,277.75 22,528.89 26,095.29
19,991.908,794.286,431.001,613.30
122.5011.96
316.97298.53
4,528.47919.19
5,044.30705.68234.66
21,303.659,364.426,932.361,860.31
91.755.66
265.46208.87
5,022.67956.57
5,405.75554.24212.90
24,778.3710,826.508,240.752,009.33
86.332.17
350.16137.76
6,315.531,069.485,925.28
641.57278.15
770.47 880.93 723.66705.51 837.68 693.02
39.08 47.26 43.1364.96 43.25 30.63
81,670 391,135 90,45774,784 371,931 86,6284,142 20,983 5,3916,886 19,204 3,829
106 444 125
* The source for these variables is the Annual School Reports which contain student enrollment counts that differslightly from the School Based Expenditure Reports (SBER).
371 8
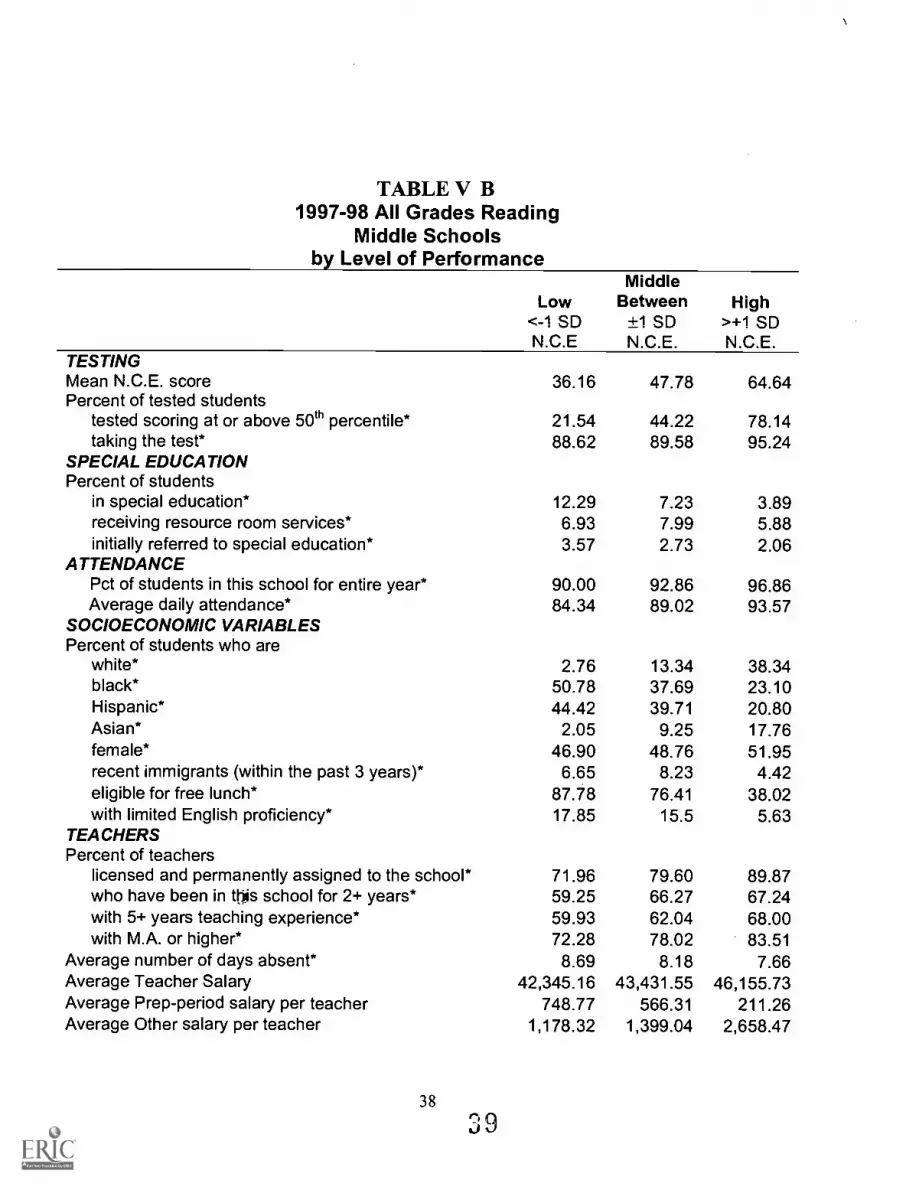
TABLE V B1997-98 All Grades Reading
Middle Schoolsby Level of Performance
Low<-1 SDN.C.E
MiddleBetween
±1 SDN.C.E.
High>+1 SDN.C.E.
TESTINGMean N.C.E. score 36.16 47.78 64.64Percent of tested students
tested scoring at or above 50th percentile* 21.54 44.22 78.14taking the test* 88.62 89.58 95.24
SPECIAL EDUCATIONPercent of students
in special education* 12.29 7.23 3.89receiving resource room services* 6.93 7.99 5.88initially referred to special education* 3.57 2.73 2.06
ATTENDANCEPct of students in this school for entire year* 90.00 92.86 96.86Average daily attendance* 84.34 89.02 93.57
SOCIOECONOMIC VARIABLESPercent of students who are
white* 2.76 13.34 38.34black* 50.78 37.69 23.10Hispanic* 44.42 39.71 20.80Asian* 2.05 9.25 17.76female* 46.90 48.76 51.95recent immigrants (within the past 3 years)* 6.65 8.23 4.42eligible for free lunch* 87.78 76.41 38.02with limited English proficiency* 17.85 15.5 5.63
TEACHERSPercent of teachers
licensed and permanently assigned to the school* 71.96 79.60 89.87who have been in this school for 2+ years* 59.25 66.27 67.24with 5+ years teaching experience* 59.93 62.04 68.00with M.A. or higher* 72.28 78.02 83.51
Average number of days absent* 8.69 8.18 7.66Average Teacher Salary 42,345.16 43,431.55 46,155.73Average Prep-period salary per teacher 748.77 566.31 211.26Average Other salary per teacher 1,178.32 1,399.04 2,658.47
38

TABLE V B (continued)1997-98 All Grades Reading
Middle Schoolsby Level of Performance
RESOURCESPupil:Teacher 12.68 14.69 16.96TOTAL Spending per pupil - ALL(all dollars per student [all]) 10,304.90 8,531.62 7,622.26
I. Direct Services to Schools 9,371.87 7,635.88 6,743.55A. Classroom Instruction 5,495.48 4,684.37 4,244.49
i. Teachers 4,694.19 4,150.83 3,845.77ii. Ed Paraprofessionals 195.95 141.05 80.98iii. Textbooks 111.46 73.78 64.91iv. Librarians/Library Books 15.01 10.78 8.06v. Professional Development 152.73 125.43 107.92vi. Other 326.14 182.49 136.85
B. Instructional Support Services 1,051.32 847.53 693.45C. Leadership/Supervision/Support 846.99 676.97 627.94D. Ancillary Support Services 799.13 686.29 665.94E. Other 1,178.95 740.73 511.74
II. District Costs 222.69 196.15 196.73TOTAL Spending per pupil GE ONLY(general education dollars per general educationstudent)
8,826.37 7,232.04 6,560.26
I. Direct Services to Schools 7,972.33 6,411.63 5,733.11A. Classroom Instruction 4,942.39 4,191.62 3,848.38
i. Teachers 4,275.99 3,762.66 3,524.02ii. Ed Paraprofessionals 97.72 58.26 20.55iii. Textbooks 107.86 71.21 63.87iv. Librarians/Library Books 14.69 10.63 8.35v. Professional Development 124.06 110.5 97.73vi. Other 322.06 178.37 133.85
B. Instructional Support Services 434.38 292.87 225.93C. Leadership/Supervision/Support 781.57 631.81 607.31D. Ancillary Support Services 634.27 551.64 538.32E. Other 1,179.71 743.69 513.17
II. District Costs 208.82 176.82 187.84
39
4 0
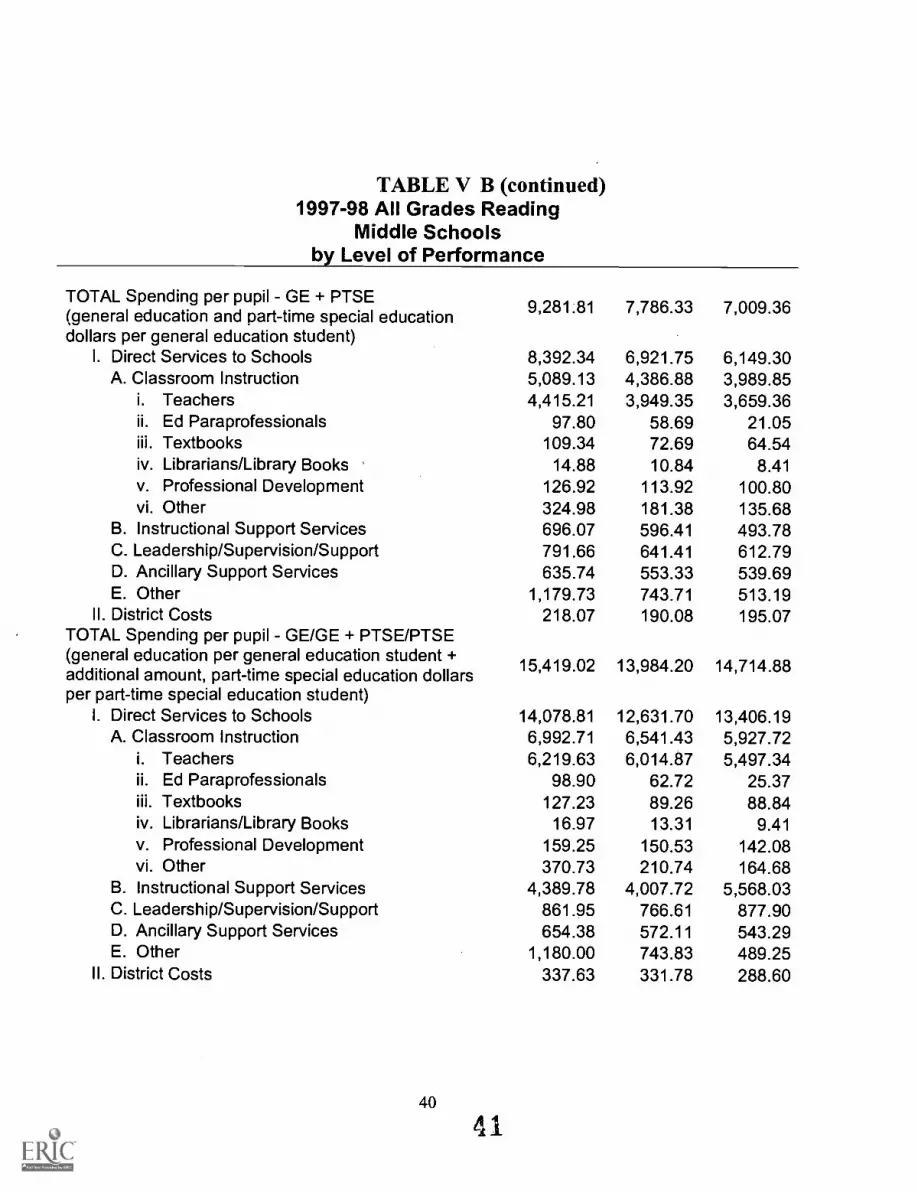
TABLE V B (continued)1997-98 All Grades Reading
Middle Schoolsby Level of Performance
TOTAL Spending per pupil - GE + PTSE(general education and part-time special educationdollars per general education student)
I. Direct Services to SchoolsA. Classroom Instruction
i. Teachersii. Ed Paraprofessionalsiii. Textbooksiv. Librarians/Library Booksv. Professional Developmentvi. Other
B. Instructional Support ServicesC. Leadership/Supervision/SupportD. Ancillary Support ServicesE. Other
II. District CostsTOTAL Spending per pupil - GE/GE + PTSE/PTSE(general education per general education student +additional amount, part-time special education dollarsper part-time special education student)
I. Direct Services to SchoolsA. Classroom Instruction
i. Teachersii. Ed Paraprofessionalsiii. Textbooksiv. Librarians/Library Booksv. Professional Developmentvi. Other
B. Instructional Support ServicesC. Leadership/Supervision/SupportD. Ancillary Support ServicesE. Other
II. District Costs
40
9,281.81 7,786.33 7,009.36
8,392.34 6,921.75 6,149.305,089.13 4,386.88 3,989.854,415.21 3,949.35 3,659.36
97.80 58.69 21.05109.34 72.69 64.5414.88 10.84 8.41
126.92 113.92 100.80324.98 181.38 135.68696.07 596.41 493.78791.66 641.41 612.79635.74 553.33 539.69
1,179.73 743.71 513.19218.07 190.08 195.07
15,419.02 13,984.20 14,714.88
14,078.81 12,631.70 13,406.196,992.71 6,541.43 5,927.726,219.63 6,014.87 5,497.34
98.90 62.72 25.37127.23 89.26 88.84
16.97 13.31 9.41159.25 150.53 142.08370.73 210.74 164.68
4,389.78 4,007.72 5,568.03861.95 766.61 877.90654.38 572.11 543.29
1,180.00 743.83 489.25337.63 331.78 288.60
41
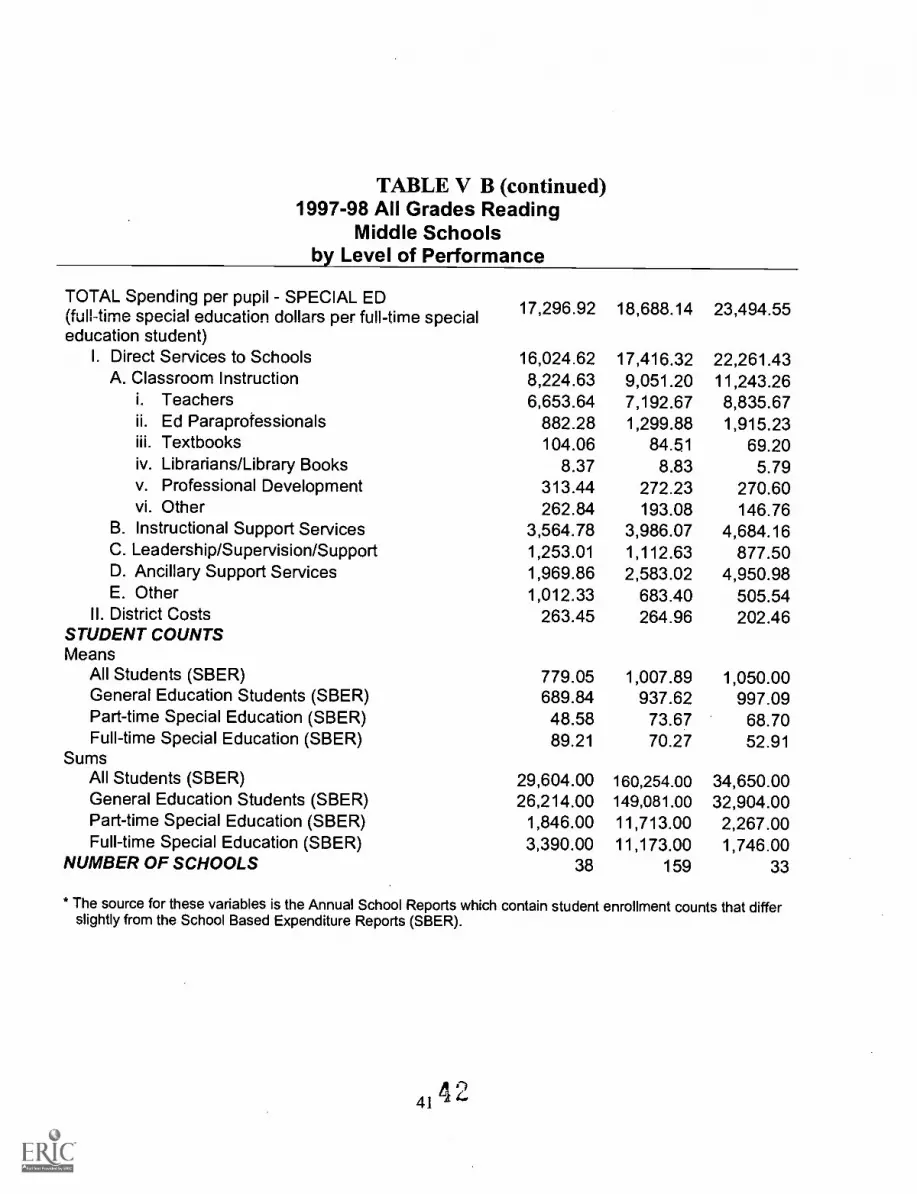
TABLE V B (continued)1997-98 All Grades Reading
Middle Schoolsby Level of Performance
TOTAL Spending per pupil SPECIAL ED(full-time special education dollars per full-time specialeducation student)
I. Direct Services to SchoolsA. Classroom Instruction
i. Teachersii. Ed Paraprofessionalsiii. Textbooksiv. Librarians/Library Booksv. Professional Developmentvi. Other
B. Instructional Support ServicesC. Leadership/Supervision/SupportD. Ancillary Support ServicesE. Other
II. District CostsSTUDENT COUNTSMeans
All Students (SBER)General Education Students (SBER)Part-time Special Education (SBER)Full-time Special Education (SBER)
SumsAll Students (SBER)General Education Students (SBER)Part-time Special Education (SBER)Full-time Special Education (SBER)
NUMBER OF SCHOOLS
17,296.92 18,688.14 23,494.55
16,024.62 17,416.32 22,261.438,224.63 9,051.20 11,243.266,653.64 7,192.67 8,835.67
882.28 1,299.88 1,915.23104.06 84.51 69.20
8.37 8.83 5.79313.44 272.23 270.60262.84 193.08 146.76
3,564.78 3,986.07 4,684.161,253.01 1,112.63 877.501,969.86 2,583.02 4,950.981,012.33 683.40 505.54
263.45 264.96 202.46
779.05 1,007.89 1,050.00689.84 937.62 997.0948.58 73.67 68.7089.21 70.27 52.91
29,604.00 160,254.00 34,650.0026,214.00 149,081.00 32,904.00
1,846.00 11,713.00 2,267.003,390.00 11,173.00 1,746.00
38 159 33
* The source for these variables is the Annual School Reports which contain student enrollment counts that differslightly from the School Based Expenditure Reports (SEER).
41 4
U.S. 'Department of EducationOffice of Educational Research and Improvement (OERI)
National Library of Education (NLE)Educational Resources Information Center (ERIC)
CTI ELE SE(Specific Document)
Tiri)
(;"7.)
(AD 034 3i2-
OCU ENT IDENTIFICATION:
Title: eteleM(C- 4,17c/rign 62_ C_Aata-e_1(2-c-e-dz,e a_r_ri L-7-va,rdocre,c.
in /) ati/ 6A a-At -----k/410-4Acciaid AdhSc-iterb /cc ep70.((Author(s):A.14/14 9V-7E40) /,,-/il $e,A tw7L-zCorporate Source:
-/A),
/cLPublication Dhtp:
11 1Ct)0/H. REPRODUCTION RELEASE:
In order to disseminate as widely as possible timely and significant materials of interest to the educational coinmunity, documents announced in themonthly abstract journal of the ERIC system, Resources in Education (RIE), are usually made available to users in microfiche, reproduced paper copy,and electronic media, and sold through the ERIC Document Reproduction Service (EDRS). Credit is given to the source of each document, and, ifreproduction release is granted, one of the following notices is affixed to the document.
If permission is granted to reproduce and disseminate the identified document, please CHECK ONE of the following three options and sign at the bottomof the page.
The sample sticker shown below will beaffixed to all Level 1 documents
The sample sticker shown below will be The sample sticker shown below will beaffixed to all Level 2A documents affixed to all Level 2B documents
PE:;,,;ISSION TO REPRCIDUCE .,\ND:NSSEViii,IATE THIS MATERIAL :tAS
(3EEN GRANTED EY
EDI.t.';ATON.A.L RESOURCESCENTER ER!C)
Check here for Level 1 release, permittingreproduction and dissemination in microfiche or other
ERIC archival media (e.g., electronic) and papercopy.
Signhere,--;please
PERMISSION TO REPRODUCEDISSEMINATE THIS MATERIAL iN
MICROFICHE, ANC IN ELECTRONIC MEDIAFOR ERIC COLLECTION SUBSCRIBERS ONLY,
HAS SEEN GRANTED SY
0
TO THE EDUCATIONAL RESOURCESINFORMATION CEWER ERIC)
:1A
Check here for Level 2A release, permittingreproduction and dissemination in microfiche and in
electronic media for ERIC archival collectionsubscribers only
PERMISSION TO REPRODUCE ANDDISSEMINATE THIS MATERIAL IN
MICROFICHE ONLY HAS BEEN GRANTED BY
,K4e
TO THE EDUCATIONAL RESOURCESINFORMATION CENTER (ERIC)
Level 2I3
Check here for Level 28 release, permittingreproduction and dissemination in microfiche only
Documents will be processed as indicated provided reproduction quality permits.If permission to reproduce is granted, but no box is checked, documents will be processed at Level 1.
I hereby grant to the Educational Resources Information Center (ERIC) nonexclusive permission to reproduce and disseminate this documentas indicated above. Reproduction from the ERIC microfiche or electronic media by persons other than ERIC employees and its systemcontractors requires permission from the copyright holder. Exception is made for non-profit reproduction by libraries and other service agenciesto satisfy information needs of educators in response to discrete inquiries.
Signa :
Organizatiun/Address:
62-1/taic6A-b-4-e VOttrY104//i0(77 t fiy 7u1 6.00
Printed Name/Position/Title:
leg Ral- -el Ad 47Z--FA/
cT),,,ToneW 7V 37 3e70Date:
edu (over)
III. 0 CUMENT AVAILA BUTY INFORMATION (F M N N-EROC SOURCE):
If permission to reproduce is not granted to ERIC, or, if you wish ERIC to cite the availability of the document from another source, pleaseprovide the following information regarding the availability of the document. (ERIC will not announce a document unless it is publiclyavailable, and a dependable source can be specified. Contributors should also be aware that ERIC selection criteria are significantly morestringenffo(clocuments that cannot be made available through EDRS.)
Publisher/Distributor:
Address:
Price:
0V. IREFE * F E IC TO C 11) PYRIGHT/REP UCTI N RIGHTS H ER:
If the right to grant this reproduction release is held by someone other than the addressee, please provide the appropriate name andaddress:
Name:
Address:
V. WHERE TO SEND THIS FOR
Send this form to the following ERIC Clearinghouse:
ERIC Clearinghouse on Urban EducationBox 40, Teachers CollegeColumbia University525 W. 120th Street, Mam Hall 303New York, NY 10027
Tel: 212-678-3433 / 800-601-4868Fax: 212-678-4012
http://eric-web.tc.columbia.edu
However, if solicited by the ERIC Facility, or if making an unsolicited contribution to ERIC, return this form (and the document beingcontributed) to:
C Processing and Reference F83-A Forbes Boulevar
La Maryland- 06
EFF-088 (Rev. 212000)
-4200ree: 800-799-37
FAX: 301-552-4700
e-mail: [email protected]: http://ericfac.piccard.csc.com
tY