abehavioralmalwaredetectionframeworkforandroid devices
TRANSCRIPT
J Intell Inf Syst (2012) 38:161–190DOI 10.1007/s10844-010-0148-x
“Andromaly”: a behavioral malware detectionframework for android devices
Asaf Shabtai · Uri Kanonov · Yuval Elovici ·Chanan Glezer · Yael Weiss
Received: 22 August 2010 / Revised: 27 October 2010 / Accepted: 17 November 2010 /Published online: 6 January 2011© Springer Science+Business Media, LLC 2011
Abstract This article presents Andromaly—a framework for detecting malware onAndroid mobile devices. The proposed framework realizes a Host-based MalwareDetection System that continuously monitors various features and events obtainedfrom the mobile device and then applies Machine Learning anomaly detectors toclassify the collected data as normal (benign) or abnormal (malicious). Since nomalicious applications are yet available for Android, we developed four maliciousapplications, and evaluated Andromaly’s ability to detect new malware based onsamples of known malware. We evaluated several combinations of anomaly detec-tion algorithms, feature selection method and the number of top features in orderto find the combination that yields the best performance in detecting new malwareon Android. Empirical results suggest that the proposed framework is effective indetecting malware on mobile devices in general and on Android in particular.
Keywords Mobile devices · Machine learning · Malware · Security · Android
1 Introduction
Personal Digital Assistants (PDAs), mobile phones and recently smartphones haveevolved from simple mobile phones into sophisticated yet compact minicomputers
A. Shabtai (B) · U. Kanonov · Y. Elovici · C. Glezer · Y. WeissDeutsche Telekom Laboratories at Ben-Gurion University, Department of InformationSystems Engineering, Ben-Gurion University, Be’er Sheva 84105, Israele-mail: [email protected]
U. Kanonove-mail: [email protected]
Y. Elovicie-mail: [email protected]
C. Glezere-mail: [email protected]
162 J Intell Inf Syst (2012) 38:161–190
which can connect to a wide spectrum of networks, including the Internet and cor-porate intranets. Designed as open, programmable, networked devices, smartphonesare susceptible to various malware threats such as viruses, Trojan horses, and worms,all of which are well-known from desktop platforms. These devices enable users toaccess and browse the Internet, receive and send emails, SMSs, and MMSs, connectto other devices for exchanging information/synchronizing, and activate variousapplications, which make these devices attack targets (Leavitt 2005; Shih et al. 2008).
A compromised smartphone can inflict severe damages to both users and thecellular service provider. Malware on a smartphone can make the phone par-tially or fully unusable; cause unwanted billing; steal private information (possiblyby Phishing and Social Engineering); or infect every name in a user’s phone-book (Piercy 2004). Possible attack vectors into smartphones include: Cellularnetworks, Internet connections (via Wi-Fi, GPRS/EDGE or 3G network access);USB/ActiveSync/Docking and other peripherals (Cheng et al. 2007).
The challenges for smartphone security are becoming very similar to those thatpersonal computers encounter (Muthukumaran et al. 2008) and common desktop-security solutions are often being downsized to mobile devices. As a case in point,(Botha et al. 2009) analyzed common desktop security solutions and evaluatedtheir applicability to mobile devices. However, some of the desktop solutions (i.e.,antivirus software) are inadequate for use on smartphones as they consume too muchCPU and memory and might result in rapid draining of the power source. In addition,most antivirus detection capabilities depend on the existence of an updated malwaresignature repository, therefore the antivirus users are not protected whenever anattacker spreads previously un-encountered malware. Since the response time ofantivirus vendors may vary between several hours to several days to identify thenew malware, generate a signature, and update their clients’ signature database,hackers have a substantial window of opportunity (Dagon et al. 2004). Some malwareinstances may target a specific and relatively small number of mobile devices (e.g.,for extracted confidential information or track owner’s location) and will thereforetake quite a time till they are discovered.
In this research we describe a generic and modular framework for detectingmalware on Android mobile devices. This is accomplished by continuously monitor-ing mobile devices to detect suspicious and abnormal activities using a supervisedanomaly detection technique (Chandola et al. 2009). The framework relies on alight-weight application, installed on the mobile device that samples various systemmetrics and analyzes them in order to make inferences about the well-being state ofthe device. The main assumption is that system metrics such as CPU consumption,number of sent packets through the Wi-Fi, number of running processes, batterylevel etc. can be employed for detection of previously un-encountered malware byexamining similarities with patterns of system metrics induced by known malware(Cheng et al. 2007; Emm 2006). This concept was initially presented by (Lee et al.1999) who proposed a data mining framework that supports the task of intrusiondetection. The central idea was to utilize auditing programs to extract an extensiveset of features that describe each network connection or host session, and apply datamining methods to learn rules that capture the behavior of intrusions and normalactivities. These rules can then be used for misuse detection and anomaly detection.New detection models are then incorporated into an existing IDS through a meta-
J Intell Inf Syst (2012) 38:161–190 163
learning (or co-operative learning) process, which produces a meta-detection modelthat combines evidence from multiple models.
The primary goal of our study is to identify an optimal mix of a classificationmethod, feature selection method and the number of monitored features, that yieldsthe best performance in accurately detecting new malware on Android.
2 Related work
The related work to this study in described in the following subsections. In Section 2.1we present a review on general malware detection techniques followed by Section 2.2that review malware detection techniques in mobile devices.
2.1 Malware detection techniques
Modern computer and communication infrastructures are highly susceptible tovarious types of attack. A common way of launching these attacks is by means ofmalicious software (malware) such as worms, viruses, and Trojan horses, which,when spread, can cause severe damage to private users, commercial companies andgovernments. The recent growth in high-speed Internet connections has led to anincrease in the creation of new malware.
Several analysis techniques for detecting malware have been proposed. Basicallystatic and dynamic analysis is distinguished. In Dynamic Analysis (also known asbehavioral-based analysis) the detection consists of information that is collected fromthe operating system at runtime (i.e., during the execution of the program) such assystem calls, network access and files and memory modifications (Rieck et al. 2008;Moskovitch et al. 2008). Systems such as Panorama (Yin et al. 2007) and the BHOSpyware Taint Analyzer (Egele et al. 2007) demonstrate the feasibility of dynamicmethods by capturing suspicious information access patterns and processing behav-iors (i.e., information flow analysis) that are common to different types of malware.Transforming these detection approaches to a mobile environment, however, is notstraight forward due to resource constraints (i.e., CPU, power, memory) imposed bysmartphones.
In Static Analysis, information about the program or its expected behavior consistsof explicit and implicit observations in its binary/source code. While being fast andeffective, static analysis techniques are limited, mainly due to the fact that variousobfuscation techniques can be used to evade static analysis and thus render theirability to cope with polymorphic malware limited (Moser et al. 2007).
In the dynamic analysis approach the problems resulting from the various obfus-cation methods do not exist, since the actual behavior of the program is monitored.However, this approach suffers from other disadvantages. First, it is difficult tosimulate the appropriate conditions, in which the malicious functions of the programwill be activated (such as the vulnerable application that the malware exploits).Second, it is not clear what is the required period of time needed to observe theappearance of the malicious activity for each malware.
Static and dynamic analysis solutions are primarily implemented using two meth-ods: signature-based and heuristic-based. Signature-based is a common method used
164 J Intell Inf Syst (2012) 38:161–190
by antivirus vendors and it relies on the identification of unique signatures that definethe malware (Griffin et al. 2009). While being very precise, signature-based methodsare useless against unknown malicious code. The heuristic-based methods are basedon rules which are either determined by experts or by machine learning techniquesthat define a malicious or a benign behavior, in order to detect unknown malware(Jacob et al. 2008; Gryaznov 1999).
Recently, classification algorithms were employed to automate and extend theidea of heuristic-based methods. In these methods, the binary code of a file or thebehavior of the application during execution is represented, and classifiers are usedto learn patterns in order to classify new (unknown) applications as malicious orbenign (Moskovitch et al. 2008; Shabtai et al. 2009c; Menahem et al. 2008).
2.2 Malware detection in mobile devices
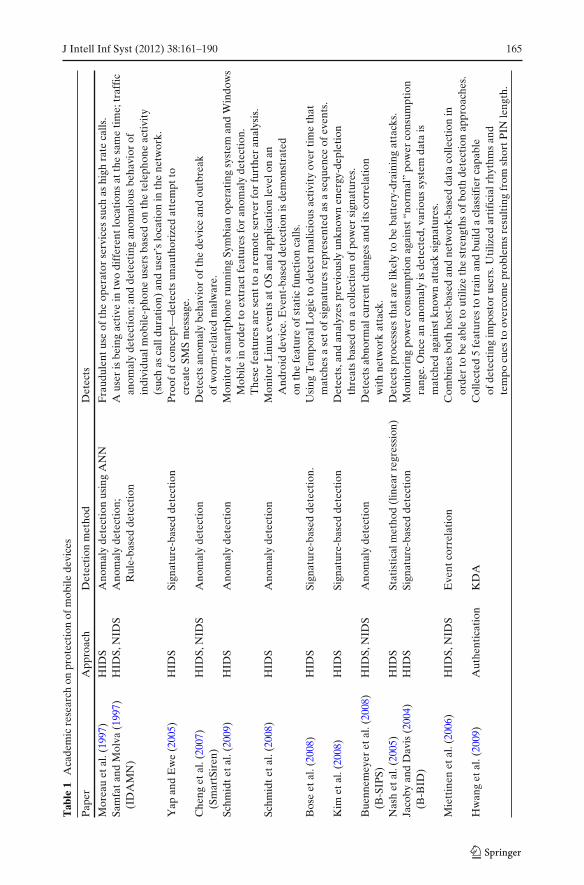
Our overview of related academic literature indicates that most extant research onprotection of mobile devices has focused on dynamic analysis approaches. In themajority of cases, these studies have proposed and evaluated Host-based IntrusionDetection Systems (HIDS). These systems (using anomaly- (Garcia-Teodoro et al.2009) or rule-based detection methods), extract and analyze (either locally or by aremote server) a set of features indicating the state of the device at runtime. Severalsystems are reviewed in this section as summarized in Table 1. Only a handful ofsystems employ static analysis for detecting malware on mobile devices. Chaudhuri(2009) presented a formal language for describing Android applications and dataflow among application components which was later incorporated in the ScanDroid(Adam et al. 2009).
Artificial Neural Networks (ANNs) were used in Moreau et al. (1997) order todetect anomalous behavior indicating a fraudulent use of the operator services (e.g.registration with a false identity and using the phone to high tariff destinations). TheIntrusion Detection Architecture for Mobile Networks (IDAMN) system (Samfat andMolva 1997) uses both rule-based and anomaly detection methods. IDAMN offersthree levels of detection: location-based detection (a user active in two differentlocations at the same time); traffic anomaly detection (an area having normallylow network activity, suddenly experiencing high network activity); and detectinganomalous behavior of individual mobile-phone users. Yap and Ewe (2005) employa behavior checker solution that detects malicious activities in a mobile system. Theypresent a proof-of-concept scenario using a Nokia Mobile phone running a SymbianOS. In the demonstration, a behavioral detector detects a simulated Trojan attempt-ing to use the message server component without authorization to create an SMSmessage. The behavioral checker, however, cannot detect new attacks since it relieson specific definitions of malware behaviors. Cheng et al. (2007) present SmartSiren,a collaborative proxy-based virus detection and alert system for smartphones. Single-device and system-wide abnormal behaviors are detected by the joint analysis ofcommunication activity of monitored smartphones. The evaluation of SmartSirenfocused on detecting SMS viruses by monitoring the amount of SMSs send by asingle device. Schmidt et al. (2009) monitored a smartphone running a SymbianOS in order to extract features that describe the state of the device and which canbe used for anomaly detection. These features were collected by a Symbian mon-itoring client and forwarded to a remote anomaly detection system (RADS). The
J Intell Inf Syst (2012) 38:161–190 165
Tab
le1
Aca
dem
icre
sear
chon
prot
ecti
onof
mob
ilede
vice
s
Pap
erA
ppro
ach
Det
ecti
onm
etho
dD
etec
ts
Mor
eau
etal
.(19
97)
HID
SA
nom
aly
dete
ctio
nus
ing
AN
NF
raud
ulen
tuse
ofth
eop
erat
orse
rvic
essu
chas
high
rate
calls
.Sa
mfa
tand
Mol
va(1
997)
HID
S,N
IDS
Ano
mal
yde
tect
ion;
Aus
eris
bein
gac
tive
intw
odi
ffer
entl
ocat
ions
atth
esa
me
tim
e;tr
affi
c(I
DA
MN
)R
ule-
base
dde
tect
ion
anom
aly
dete
ctio
n;an
dde
tect
ing
anom
alou
sbe
havi
orof
indi
vidu
alm
obile
-pho
neus
ers
base
don
the
tele
phon
eac
tivi
ty(s
uch
asca
lldu
rati
on)
and
user
’slo
cati
onin
the
netw
ork.
Yap
and
Ew
e(2
005)
HID
SSi
gnat
ure-
base
dde
tect
ion
Pro
ofof
conc
ept—
dete
cts
unau
thor
ized
atte
mpt
tocr
eate
SMS
mes
sage
.C
heng
etal
.(20
07)
HID
S,N
IDS
Ano
mal
yde
tect
ion
Det
ects
anom
aly
beha
vior
ofth
ede
vice
and
outb
reak
(Sm
artS
iren
)of
wor
m-r
elat
edm
alw
are.
Schm
idte
tal.
(200
9)H
IDS
Ano
mal
yde
tect
ion
Mon
itor
asm
artp
hone
runn
ing
Sym
bian
oper
atin
gsy
stem
and
Win
dow
sM
obile
inor
der
toex
trac
tfea
ture
sfo
ran
omal
yde
tect
ion.
The
sefe
atur
esar
ese
ntto
are
mot
ese
rver
for
furt
her
anal
ysis
.Sc
hmid
teta
l.(2
008)
HID
SA
nom
aly
dete
ctio
nM
onit
orL
inux
even
tsat
OS
and
appl
icat
ion
leve
lon
anA
ndro
idde
vice
.Eve
nt-b
ased
dete
ctio
nis
dem
onst
rate
don
the
feat
ure
ofst
atic
func
tion
calls
.B
ose
etal
.(20
08)
HID
SSi
gnat
ure-
base
dde
tect
ion.
Usi
ngT
empo
ralL
ogic
tode
tect
mal
icio
usac
tivi
tyov
erti
me
that
mat
ches
ase
tofs
igna
ture
sre
pres
ente
das
ase
quen
ceof
even
ts.
Kim
etal
.(20
08)
HID
SSi
gnat
ure-
base
dde
tect
ion
Det
ects
,and
anal
yzes
prev
ious
lyun
know
nen
ergy
-dep
leti
onth
reat
sba
sed
ona
colle
ctio
nof
pow
ersi
gnat
ures
.B
uenn
emey
eret
al.(
2008
)H
IDS,
NID
SA
nom
aly
dete
ctio
nD
etec
tsab
norm
alcu
rren
tcha
nges
and
its
corr
elat
ion
(B-S
IPS)
wit
hne
twor
kat
tack
.N
ash
etal
.(20
05)
HID
SSt
atis
tica
lmet
hod
(lin
ear
regr
essi
on)
Det
ects
proc
esse
sth
atar
elik
ely
tobe
batt
ery-
drai
ning
atta
cks.
Jaco
byan
dD
avis
(200
4)H
IDS
Sign
atur
e-ba
sed
dete
ctio
nM
onit
orin
gpo
wer
cons
umpt
ion
agai
nst“
norm
al”
pow
erco
nsum
ptio
n(B
-BID
)ra
nge.
Onc
ean
anom
aly
isde
tect
ed,v
ario
ussy
stem
data
ism
atch
edag
ains
tkno
wn
atta
cksi
gnat
ures
.M
iett
inen
etal
.(20
06)
HID
S,N
IDS
Eve
ntco
rrel
atio
nC
ombi
nes
both
host
-bas
edan
dne
twor
k-ba
sed
data
colle
ctio
nin
orde
rto
beab
leto
utili
zeth
est
reng
ths
ofbo
thde
tect
ion
appr
oach
es.
Hw
ang
etal
.(20
09)
Aut
hent
icat
ion
KD
AC
olle
cted
5fe
atur
esto
trai
nan
dbu
ilda
clas
sifi
erca
pabl
eof
dete
ctin
gim
post
orus
ers.
Uti
lized
arti
fici
alrh
ythm
san
dte
mpo
cues
toov
erco
me
prob
lem
sre
sult
ing
from
shor
tPIN
leng
th.
166 J Intell Inf Syst (2012) 38:161–190
gathered data can be used for anomaly detection methods in order to distinguishbetween normal and abnormal behavior; however, (Schmidt et al. 2008) demon-strated the ability of differentiating applications using the collected features and theframework was not tested for detecting abnormal behavior (i.e., malicious behavior).Additionally, the processing of the collected data was performed on a remote server,whereas in this paper we attempt to understand the feasibility of applying thedetection on the device. Schmidt et al. (2008) focus on monitoring events at thekernel; that is, identifying critical kernel, log file, file system and network activityevents, and devising efficient mechanisms to monitor them in a resource limitedenvironment. They demonstrated their framework on static function call analysis andperformed a statistical analysis on the function calls used by various applications.
An interesting behavioral detection framework is proposed in Bose et al. (2008)to detect mobile worms, viruses and Trojans. The method employs a temporallogic approach to detect malicious activity over time. An efficient representation ofmalware behaviors is proposed based on a key observation that the logical orderingof an application’s actions over time often reveals malicious intent even when eachaction alone may appear harmless. The ability of this framework to detect new typesof malware is still dubious as it requires a process of specifying temporal patterns forthe malicious activities.
Special efforts were invested in research pertaining Intrusion Detection Systems(IDS) that analyze generic battery power consumption patterns to block DistributedDenial of Service (DDoS) attacks or to detect malicious activity via power depletion.For example, Kim et al. (2008) present a power-aware, malware-detection frame-work that monitors, detects, and analyzes previously unknown energy-depletionthreats.
Buennemeyer et al. (2008) introduced capabilities developed for a Battery-SensingIntrusion Protection System (B-SIPS) for mobile computers, which alerts whenabnormal current changes are detected. Nash et al. (2005) presented a design foran intrusion detection system that focuses on the performance, energy, and memoryconstraints of mobile computing devices. Jacoby and Davis (2004) presented a hostBattery-Based Intrusion Detection System (B-BID) as a mean of improving mobiledevice security. The basic idea is that monitoring the device’s electrical current andevaluating its correlation with known signatures and patterns, can facilitate attackdetection and even identification.
Miettinen et al. (2006) claim that host-based approaches are required, sincenetwork-based monitoring alone is not sufficient to encounter the future threats.They adopt a hybrid network/host-based approach. A correlation engine on theback-end server filters the received alarms according to correlation rules in itsknowledge base and forwards the correlation results to a security monitoring GUIto be analyzed by security-monitoring administrators. Hwang et al. (2009) evaluatedthe effectiveness of Keystroke Dynamics-based Authentication (KDA) on mobiledevices. Their empirical evaluation focused on short PIN numbers (four digits) andthe proposed method yielded a 4% misclassification rate.
All in all, the aforementioned frameworks and systems proved valuable in protect-ing mobile devices in general however, they do not leverage Android’s capabilitiesto their full extent. Since Android is an open source and extensible platform itallows to extract as many features as we would like. This enables to provide richerdetection capabilities, not relying merely on the standard call records (Emm 2006),
J Intell Inf Syst (2012) 38:161–190 167
or power consumption patterns (Kim et al. 2008; Buennemeyer et al. 2008; Nashet al. 2005; Jacoby and Davis 2004). Our research is innovative in that is evaluatesthe ability to detect malicious activity on an Android device, by employing MachineLearning algorithms using a variety of monitored features. To ensure scalabilityand maintain low resource consumption of the detection process, we used simple,standard, Machine Learning algorithms.
3 The proposed andromaly framework
Google’s Android1 is a comprehensive software framework targeted towards suchsmart mobile devices (i.e., smartphones, PDAs), and it includes an operating system,a middleware and a set of key applications. Android emerged as an open-source,community-based framework which provides APIs to most of the software andhardware components. Specifically, it allows third-party developers to develop theirown applications. The applications are written in the Java programming languagebased on the APIs provided by the Android Software Development Kit (SDK), butdevelopers can also develop and modify kernel-based functionalities, which is notcommon for smartphone platforms.
The security model of Android (and that of many other phone operating systems)is “system centric” (i.e., the system focuses on protecting itself). Applications stat-ically identify the permissions that govern the rights to their data and interfaces atinstallation time. However, the application/developer has limited ability thereafterto govern to whom those rights are given or how they are later exercised (Ongtanget al. 2009).
In order to overcome this limitation we propose a lightweight Malware DetectionSystem (in terms of CPU, memory and battery consumption) for Android-basedmobile devices in order to assist users in detecting (and optionally reporting to theAndroid community) suspicious activities on their handsets. The basis of the malwaredetection process consists of real-time, monitoring, collection, preprocessing andanalysis of various system metrics, such as CPU consumption, number of sent packetsthrough the Wi-Fi, number of running processes and battery level. System andusage parameters, changed as a result of specific events, may also be collected (e.g.,keyboard/touchscreen pressing, application start-up).
After collection and preprocessing, the system metrics are sent to analysis byvarious detection units, namely processors, each employing its own expertise todetect malicious behavior and generate a threat assessment (TA) accordingly. Thepending threat assessments are weighted to produce an integrated alert. The weight-ing process is per threat type, i.e., virus TAs are weighted separately from worm TAsand also includes a smoothing phase (combining the generated alert with the pasthistory of alerts) in order to avoid instantaneous false alarms. After the weightingphase, a proper notification is displayed to the user. Moreover, the alert is matchedagainst a set of automatic or manual actions that can be undertaken to mitigate thethreat. Automatic actions include among others: uninstalling an application, killing
1http://www.android.com
168 J Intell Inf Syst (2012) 38:161–190
a process, disconnecting all radios, encrypting data, changing firewall policies andmore. A manual action can be uninstalling an application subject to user consent.
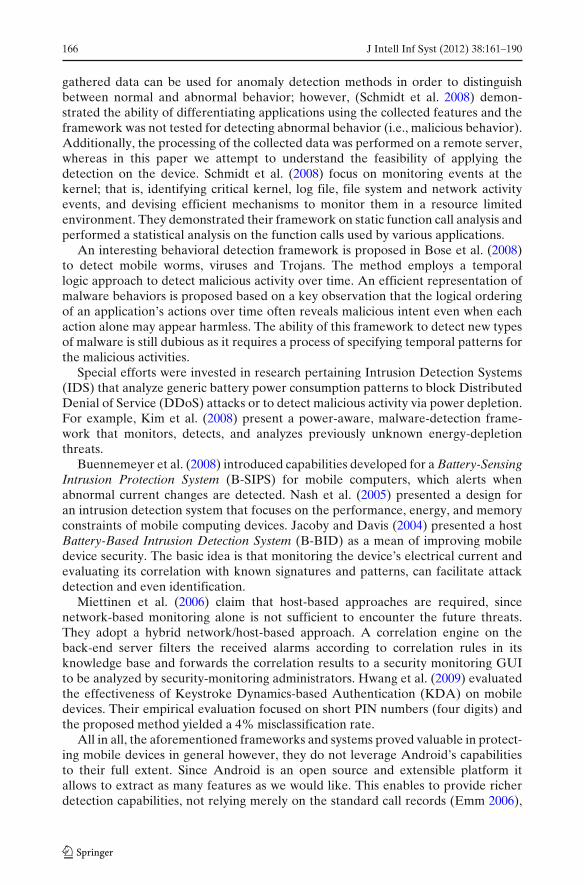
The components of the proposed application are clustered into four main groups(see Fig. 1): Feature Extractors, Processors, Main Service, and the Graphical UserInterface (GUI). The Feature Extractors communicate with various components ofthe Android framework, including the Linux kernel and the Application Frameworklayer in order to collect feature metrics, while the Feature Manager triggers theFeature Extractors and requests new feature measurements every pre-defined timeinterval. In addition, the Feature Manager may apply some pre-processing on theraw features that are collected by the Feature Extractors.
A Processor is an analysis and detection unit. It is preferred that the processor willbe provided as a pluggable external component which can be seamlessly installed andun-installed. Its role is to receive feature vectors from the Main Service, analyze themand output threat assessments to the Threat Weighting Unit. Each processor mayexpose an advanced configuration screen. Processors can be rule-based, knowledge-based, or classifiers/anomaly detectors employing Machine Learning methods.
The Threat Weighting Unit (TWU) obtains the analysis results from all activeprocessors and applies an ensemble algorithm (such as Majority Voting, DistributionSummation etc.) in order to derive a final coherent decision regarding a device’sinfection level. The Alert Manager receives the final ranking as produced by theTWU. It can then apply some smoothing function in order to provide a morepersistent alert and to avoid instantaneous false alarms. Examples of such functionscan be moving average and leaky-bucket. The smoothed infection level is thencompared with pre-defined minimum and maximum thresholds.
The Main Service is the most important component. This service synchronizes fea-ture collection, malware detection and alert process. The Main Service manages the
Fig. 1 The andromaly architecture
J Intell Inf Syst (2012) 38:161–190 169
detection flow by requesting new samples of features, sending newly sampled metricsto the processors and receiving the final recommendation from the Alert Manager.The Loggers provide logging options for debugging, calibration and experimentationwith detection algorithms. The Conf iguration Manager manages the configuration ofthe application (such as active processors, active feature extractors, alert threshold,active loggers, sampling temporal interval, detection mode configuration, etc.) TheAlert Handler triggers an action as a result of a dispatched alert (e.g., visual alert inthe notification bar, uninstalling an application sending notification via SMS or email,locking the device, disconnecting any communication channels). The ProcessorManager registers/unregisters processors, and activates/deactivates processors. TheOperation Mode Manager changes the application from one operation mode toanother based on the desired configuration. This will activate/deactivate processorsand feature extractors. Changing from one operation mode to another (i.e. fromFull Security mode to Normal mode) is triggered as a result of changes in availableresources levels (battery, CPU, Network).
The last component is the Graphical User Interface which provides the user withthe means to configure application’s parameters, activate/deactivate (for experimen-tal usage only), visual alerting, and visual exploration of collected data.
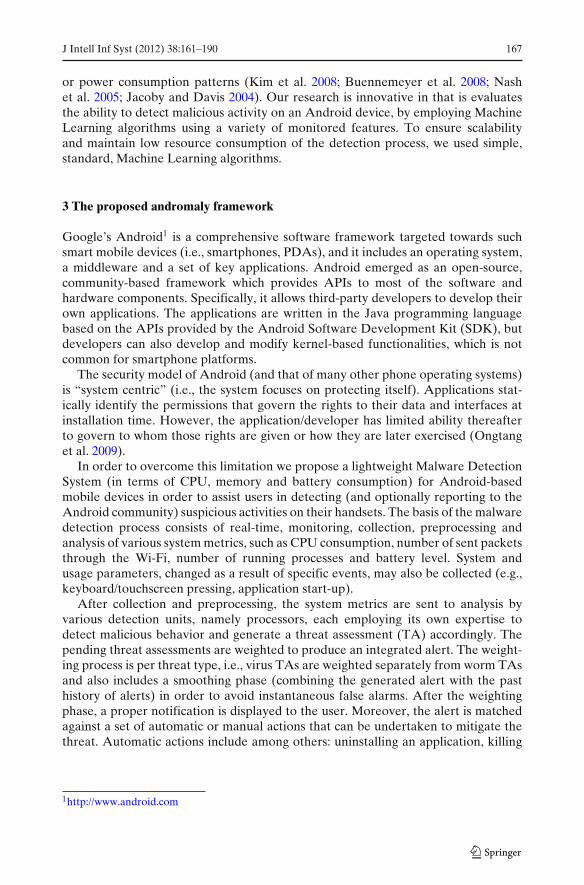
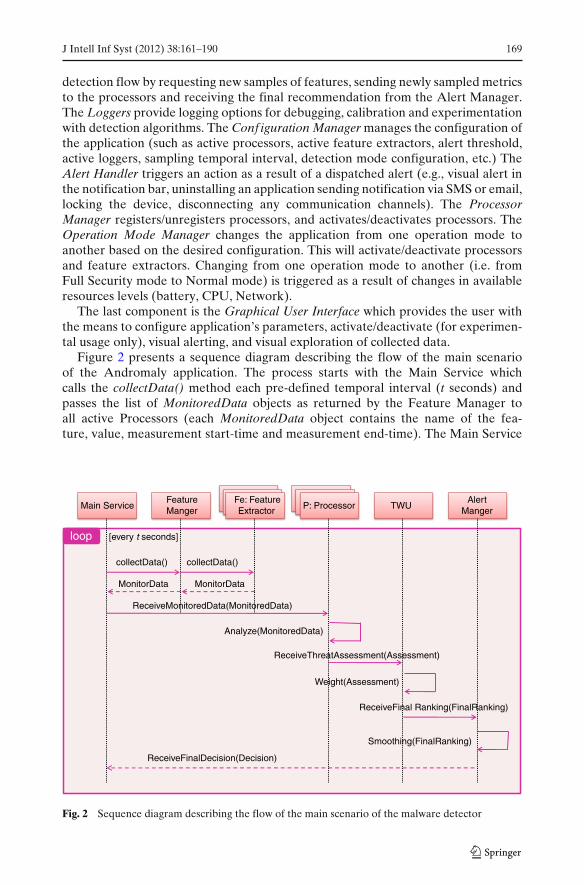
Figure 2 presents a sequence diagram describing the flow of the main scenarioof the Andromaly application. The process starts with the Main Service whichcalls the collectData() method each pre-defined temporal interval (t seconds) andpasses the list of MonitoredData objects as returned by the Feature Manager toall active Processors (each MonitoredData object contains the name of the fea-ture, value, measurement start-time and measurement end-time). The Main Service
Main ServiceFeatureManger
Fe: FeatureExtractor
collectData()
P: Processor TWUAlert
Manger
Analyze(MonitoredData)
ReceiveThreatAssessment(Assessment)
Weight(Assessment)
Smoothing(FinalRanking)
ReceiveFinalDecision(Decision)
[every t seconds]
collectData()
MonitorDataMonitorData
ReceiveMonitoredData(MonitoredData)
ReceiveFinal Ranking(FinalRanking)
loop
Fig. 2 Sequence diagram describing the flow of the main scenario of the malware detector
170 J Intell Inf Syst (2012) 38:161–190
passes the list of MonitoredData objects by calling the Processors’ receiveMoni-toredData(MonitoredData) method. This is where the processing of the informationoccurs. Upon completion, a threat assessment is prepared by the processors andis dispatched to the Threat Weighting Unit (TWU). The TWU collects all of theprocessors’ assessments and applies an ensemble algorithm to derive a coherentdecision regarding the level of risk. The final ranking is further processed by theAlert Manager which informs the Main Service whether a malicious behavior wasdetected and what action to take.
4 Detection method
4.1 Using machine learning for malware detection
The proposed framework employs Machine Learning classification techniques forrealizing a Malware Detection System. Under such an approach, the malware detec-tor continuously monitors various features and events obtained from the system andthen applies standard Machine Learning classifiers to classify collected observationsas either normal (benign) or abnormal (malicious). Based on previous experienceand after weighing the resource consumption issue, we decided to evaluate thefollowing candidate classifiers: k-Means (Jain et al. 1999), Logistic Regression (Neteret al. 1996), Histograms (Endler 1998), Decision Tree (Quinlan 1993), BayesianNetworks (Pearl 1988) and Naïve Bayes (Russel and Norvig 2002; John and Langley1995; Domingos and Pazzani 1997).
Evaluation of Machine Learning classifiers is typically split into two subsequentphases: training and testing. In the first phase, a training-set of benign and maliciousfeature vectors is provided to the system. These feature vectors are collected bothduring normal operation of the system (reflecting benign behavior) and whenmalware is activated (reflecting abnormal behavior of the system). The represen-tative feature vectors in the training set and the real classification of each vector(benign/malicious) are assumed to be known to the learning algorithms and byprocessing these vectors, the algorithm generates a trained classifier. Next, duringthe testing phase, a different collection (the testing-set) containing both benign andmalicious feature vectors is classified by the trained classifier. In the testing phase, theperformance of the classifier is evaluated by extracting standard evaluation measuresfor classifiers. Thus, it is necessary to know the real class of the feature vectors in thetest-set in order to compare the actual (i.e., real) class with the class generated by thetrained classifier.
4.2 Feature selection
In Machine Learning applications, a large number of extracted features, some ofwhich redundant or irrelevant, present several problems such as—misleading thelearning algorithm, over-fitting, reducing generality, and increasing model complex-ity and run-time. These adverse effects are even more crucial when applying MachineLearning methods on mobile devices, since they are often restricted by processingand storage-capabilities, as well as battery power. Applying fine feature selection in apreparatory stage enabled to use our malware detector more efficiently, with a faster
J Intell Inf Syst (2012) 38:161–190 171
detection cycle. Nevertheless, reducing the amount of features should be performedwhile preserving a high level of accuracy.
We used a Filter approach for feature selection, due to its fast execution timeand its generalization ability—as it isn’t bound to the biases of any classifier (unlikethe Wrapper approach) (Mitchell 1997). Under a Filter approach, an objectivefunction evaluates features by their information content and estimates their expectedcontribution to the classification task. Three feature selection methods were appliedto the datasets: Chi-Square (CS) (Imam et al. 1993), Fisher Score (FS) (Golubet al. 1999) and Information Gain (Shannon 1948). These feature selection methodsfollows the Feature Ranking approach and, using a specific metric, compute andreturn a score for each feature individually.
A problem was raised when we had to decide how many features to choose forthe classification task from the feature selection algorithms’ output ranked lists. Inorder to avoid any bias by selecting an arbitrary number of features, we used, foreach feature selection algorithm, three different configurations: 10, 20 and 50 featuresthat were ranked the highest out of the 88 featured ranked by the feature selectionalgorithms.
5 Evaluation
In order to evaluate our malware detection framework we performed several ex-periments. The research questions that we attempt to answer using the experimentsare described in Section 5.1. In Section 5.2 we describe the dataset created forthe experiments. Section 5.3 describes the scheme of the four experiments andSection 5.4 presents the obtained results. Finally, in Section 5.5 we discuss the impactof the malware detection framework on the handset resources.
5.1 Research questions
We evaluated the proposed framework through a set of four subsequent experi-ments, aimed at answering the following questions:
1. Is it possible to detect unknown malicious applications on Android devices usingthe Andromaly framework?
2. Is it possible to learn the behavior of applications on a set of Android devicesand perform the detection on other devices?
3. Which classification algorithm is most accurate in detecting malware on Androiddevices: DT, NB, BN, k-Means, Histogram or Logistic Regression?
4. Which number of extracted features and feature selection method yield the mostaccurate detection results: 10, 20 or 50 top-features selected using Chi-Square,Fisher Score or InfoGain?
5. Which specific features yield maximum detection accuracy?
In order to perform the comparison between the various detection algorithmsand feature selection schemes, we employed the following standard metrics: TruePositive Rate (TPR) measure,2 which is the proportion of positive instances (i.e.,
2Also known as Detection Rate in the intrusion detection community.
172 J Intell Inf Syst (2012) 38:161–190
feature vectors of malicious applications) classified correctly (1); False Positive Rate(FPR),3 which is the proportion of negative instances (i.e., feature vectors of benignapplications) misclassified (2); and Total Accuracy, which measures the proportionof absolutely correctly classified instances, either positive or negative (3); where, TPis number of positive instances classified correctly; FP is the number of negativeinstances misclassified; FN is the number of positive instances misclassified; and TNis the number of negative instances classified correctly.
Additionally, we used the Receiver Operating Characteristic (ROC) curve and cal-culated the Area-Under-Curve (AUC). The ROC curve is a graphical representationof the trade-off between the TPR and FPR for every possible detection cut-off.
TPR = TPTP + FN
(1)
FPR = FPFP + TN
(2)
Total Accuracy = TP + TNTP + TN + FP + FN
(3)
5.2 Creating the dataset for the experiments
There are several types of threats targeting mobile malware. In our research we focuson attacks against the phones themselves and not the service provider’s infrastructure(Guo et al. 2004). Four classes of attacks on a mobile device were identified (Bothaet al. 2009): unsolicited information, theft-of-service, information theft and Denial-of-Service (DoS). Since Android is a relatively new platform and at the time we hadperformed our experiments there were no known instances of Android malware atour disposal, we opted to developed four malicious applications that perform Denial-of-Service and information theft attacks. DoS attacks against mobile phones can becategorized into the two types. The first attempts to flood and overwhelm a deviceby issuing fraudulent service requests, and the second attempts to drain the powerresources of the device. Information theft attacks against mobile devices can beclassified as targeting either transient information or static information. Transientinformation includes a mobile device’s location, power usage patterns, and othertemporal data which a mobile device typically doesn’t record (Koong et al. 2008).Static information refers to any information that a mobile device intentionally andpersistently maintains/sends on behalf of its owner, i.e., device identification data,contact information, phone numbers, programs and media files. Attackers mayattempt to steal both types of information if they perceive it as valuable.
Tip Calculator In this study we developed the Tip Calculator malicious application,a calculator which unobtrusively performs a DoS attack. When a user clicks the“calculate” button to calculate the tip, the application starts a background servicethat waits for some time and then launches several hundreds of CPU-consuming
3Also known as False Alarm Rate in the intrusion detection community.
J Intell Inf Syst (2012) 38:161–190 173
threads. The effect of this attack is an almost absolute paralysis of the device. Thesystem becomes very unresponsive and the only effective choice is to shutdown thedevice (which also takes some time). An interesting observation is that the Androidsystem often kills a CPU-consuming service but always keeps on re-launching it afew seconds later.
Schedule SMS and Lunar Lander The first malware, which belongs to the classof information-theft, includes two Android applications, Schedule SMS and LunarLander, exploiting the Shared-User-ID feature. In Android each application requestsa set of permissions which is granted at installation time. The Shared-User-ID featureenables multiple applications to share their permission sets, provided they are allsigned with the same key and explicitly request the sharing. It is noteworthy that thesharing is done behind the scenes without informing the user or asking for approval,resulting in implicit granting of permissions. The first application is Schedule SMS, atruly benign application that enables to send delayed SMS messages to people froma contact list, for which the application requests necessary permissions. The secondapplication, Lunar Lander, is a seemingly benign game that requests no permissions.Nevertheless, once both applications are installed and the Lunar Lander obtainsan ability to read the contacts and send SMS messages, it exhibits a Trojan-likebehavior leaking all of contact names and phone numbers through SMS messagesto a pre-defined number. This resembles RedBrowser—a Trojan masquerading as abrowser that infects mobile phones running J2ME by obtaining and exploiting SMSpermissions.
Snake The second information-theft application masquerades as a Snake game andmisuses the devices camera to spy on the unsuspecting user. The Snake game requestsInternet permission for uploading top scores and while depicting the game on thescreen, the application is unobtrusively taking pictures and sending them to a remoteserver.
HTTP upload The third and last malicious information-theft application we devel-oped, HTTP Upload, also steals information from the device. It exploits the fact thataccess to the SD-card does not require any permission. Therefore, all applicationscan read and write to/from the SD-card. The application requires only the Internetpermission and in the background it accesses the SD card, steals its contents andsends them through the Internet to a predefined address.
In addition to malicious applications, 20 benign game and 20 benign tool applica-tions were used, 11 of them were available on the Android framework, while therest were obtained from the Android Market. All games and tools were verifiedto be virus-free before installation by manually exploring the permissions that theapplications required, and by using a static analysis of.dex files.4 In order to applystatic analysis on.dex files we developed and used a.dex file parser. This parseranalyzes the contents of a.dex file to extract meaningful information thereby canfacilitating manual inspection and verification of Android applications (Shabtai et al.
4Android uses a proprietary format for Java bytecode called.dex (Dalvik Executable), designed tobe more compact and memory-efficient than regular Java class files.
174 J Intell Inf Syst (2012) 38:161–190
2009a). Examples of such information are lists of Android framework’s methods,classes and types used by the application.
The aforementioned applications (i.e., 20 benign games, 20 benign tools and fourmalicious applications) were installed on two Android devices. The two devices weresimilar in the platform (HTC G1) with the same firmware and software versions. Thetwo devices were used regularly by two different users and thus varied in the amountand type of applications installed as well as usage patterns. It was important to cross-validate the experiments among the devices in order to see if one can create a genericdetection model on one device and later replicate that model to other devices. Thisindicates whether the selected features are dependent on the specific device and user.The malware detection application, which continuously sampled various features onthe device, was installed and activated on the devices under regulated conditions, andmeasurements were logged on the SD-card.
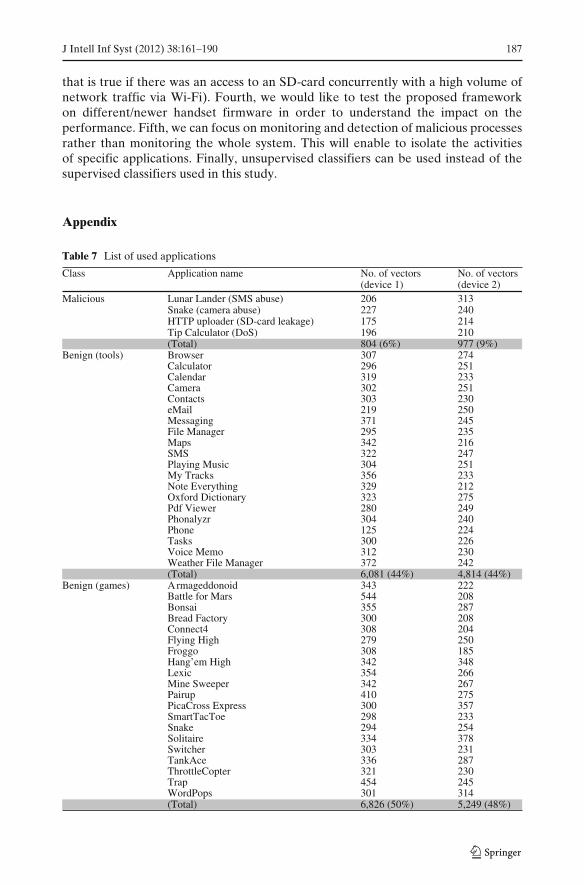
Both Android devices had one user each who used all 44 applications for 10 min,while in the background the malware detection system collected new feature vectorsevery 2 s. Therefore, a total of approximately 300 feature vectors were collected pereach application and device. All the vectors in the datasets were labeled with theirtrue class: ‘game’, ‘tool’ or ‘malicious’. The Table 7 in Appendix presents the numberof vectors collected for each malicious, tool and game applications on the two testeddevices.
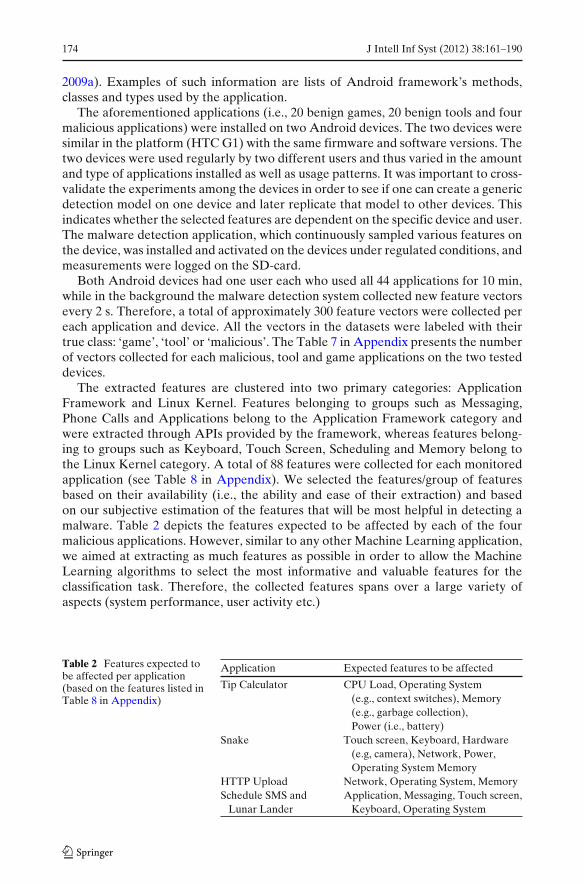
The extracted features are clustered into two primary categories: ApplicationFramework and Linux Kernel. Features belonging to groups such as Messaging,Phone Calls and Applications belong to the Application Framework category andwere extracted through APIs provided by the framework, whereas features belong-ing to groups such as Keyboard, Touch Screen, Scheduling and Memory belong tothe Linux Kernel category. A total of 88 features were collected for each monitoredapplication (see Table 8 in Appendix). We selected the features/group of featuresbased on their availability (i.e., the ability and ease of their extraction) and basedon our subjective estimation of the features that will be most helpful in detecting amalware. Table 2 depicts the features expected to be affected by each of the fourmalicious applications. However, similar to any other Machine Learning application,we aimed at extracting as much features as possible in order to allow the MachineLearning algorithms to select the most informative and valuable features for theclassification task. Therefore, the collected features spans over a large variety ofaspects (system performance, user activity etc.)
Table 2 Features expected tobe affected per application(based on the features listed inTable 8 in Appendix)
Application Expected features to be affected
Tip Calculator CPU Load, Operating System(e.g., context switches), Memory(e.g., garbage collection),Power (i.e., battery)
Snake Touch screen, Keyboard, Hardware(e.g, camera), Network, Power,Operating System Memory
HTTP Upload Network, Operating System, MemorySchedule SMS and Application, Messaging, Touch screen,
Lunar Lander Keyboard, Operating System
J Intell Inf Syst (2012) 38:161–190 175
Tab
le3
Sub-
expe
rim
ents
desc
ript
ion
Exp
erim
ent
No.
ofN
o.of
No.
ofN
o.of
No.
ofN
o.of
Tot
alT
rain
ing/
Tes
ting
onde
vice
sde
tect
ion
feat
ure
top
data
sets
iter
atio
nsnu
mbe
rte
stin
gap
plic
atio
nsal
gori
thm
sse
lect
ion
feat
ures
ofru
nspe
rfor
med
noti
nm
etho
dsgr
oups
onth
etr
aini
ngse
tsa
me
devi
ce
I2
63
310
1010
,800
+−
II2
63
310
44,
320
++
III
26
33
101
1,08
0−
−IV
26
33
104
4,32
0−
+
176 J Intell Inf Syst (2012) 38:161–190
5.3 Agenda of experiments
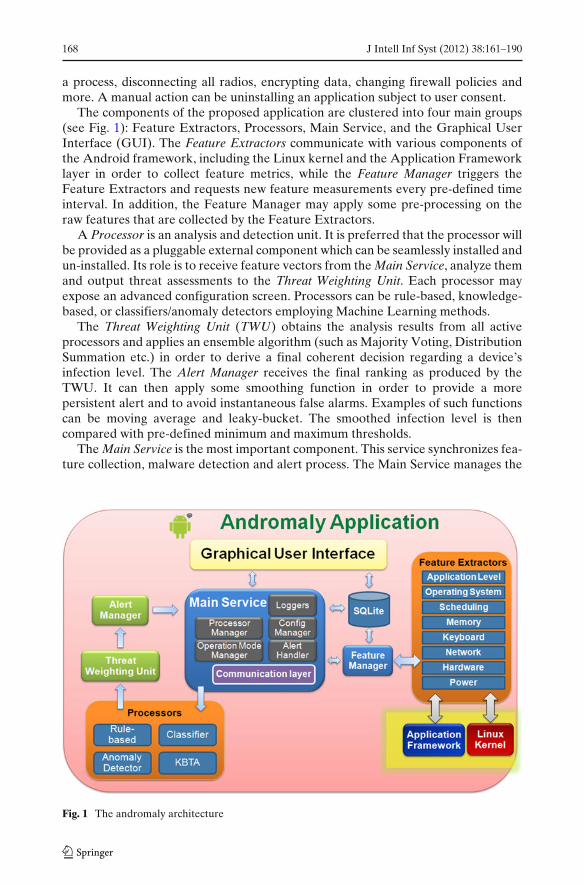
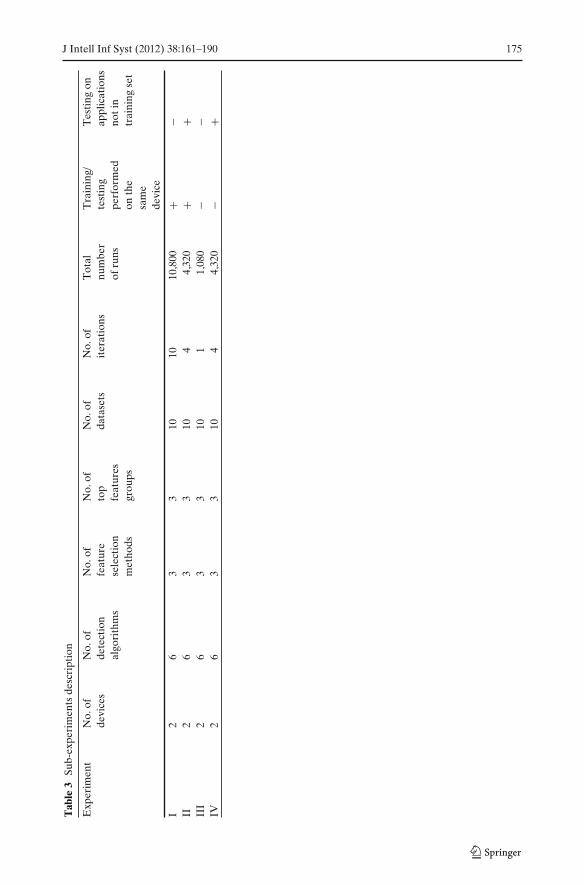
The purpose of the experiments was to evaluate the ability of the proposed detectionmethods to distinguish between benign and malicious applications. The followingset of experiment contains four segments (sub-experiments), examining the per-formance of the malware detection system in different situations. For each sub-experiment we used 10 datasets extracted from two different devices, on whichwe evaluated six detection algorithms, three feature selection methods, and threesizes of top features groups (10, 20 and 50) as presented in Table 3. As presentedin Section 5.2, the datasets were collected by activating 44 applications for 10 mineach. The applications and the amount of feature vectors are presented in Table 7 inAppendix.
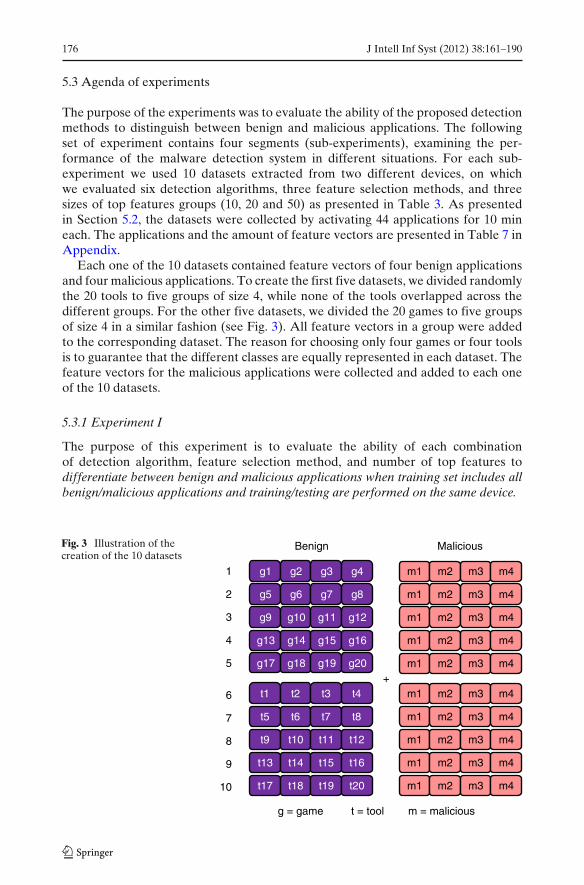
Each one of the 10 datasets contained feature vectors of four benign applicationsand four malicious applications. To create the first five datasets, we divided randomlythe 20 tools to five groups of size 4, while none of the tools overlapped across thedifferent groups. For the other five datasets, we divided the 20 games to five groupsof size 4 in a similar fashion (see Fig. 3). All feature vectors in a group were addedto the corresponding dataset. The reason for choosing only four games or four toolsis to guarantee that the different classes are equally represented in each dataset. Thefeature vectors for the malicious applications were collected and added to each oneof the 10 datasets.
5.3.1 Experiment I
The purpose of this experiment is to evaluate the ability of each combinationof detection algorithm, feature selection method, and number of top features todifferentiate between benign and malicious applications when training set includes allbenign/malicious applications and training/testing are performed on the same device.
Fig. 3 Illustration of thecreation of the 10 datasets
m1 m2 m3 m4
m1 m2 m3 m4
m1 m2 m3 m4
m1 m2 m3 m4
m1 m2 m3 m4
g1 g2 g3 g4
g17 g18 g19 g20
g5 g6 g7 g8
g9 g10 g11 g12
g13 g14 g15 g16
t1 t2 t3 t4
t17 t18 t19 t20
t5 t6 t7 t8
t9 t10 t11 t12
t13 t14 t15 t16
1
2
5
4
3
6
7
10
9
8
Benign Malicious
m1 m2 m3 m4
m1 m2 m3 m4
m1 m2 m3 m4
m1 m2 m3 m4
m1 m2 m3 m4
+
g = game t = tool m = malicious
J Intell Inf Syst (2012) 38:161–190 177
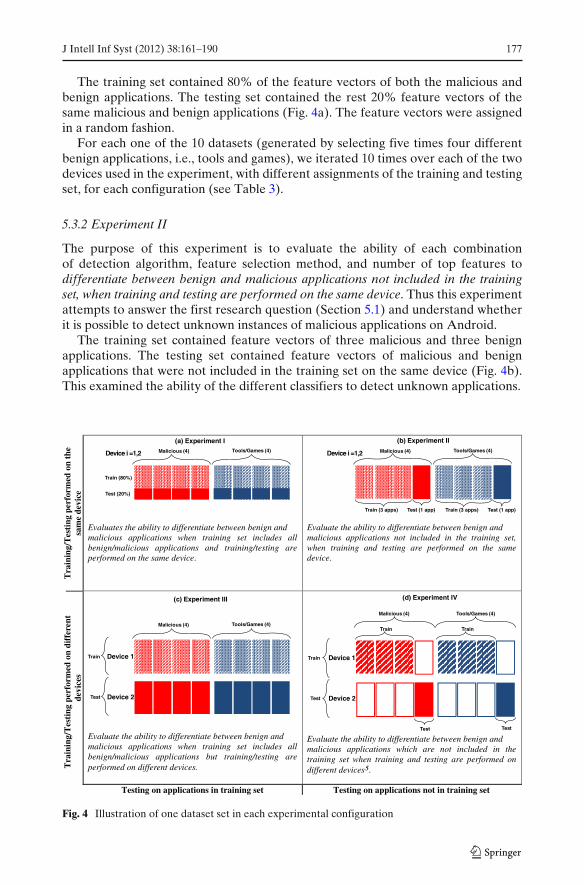
The training set contained 80% of the feature vectors of both the malicious andbenign applications. The testing set contained the rest 20% feature vectors of thesame malicious and benign applications (Fig. 4a). The feature vectors were assignedin a random fashion.
For each one of the 10 datasets (generated by selecting five times four differentbenign applications, i.e., tools and games), we iterated 10 times over each of the twodevices used in the experiment, with different assignments of the training and testingset, for each configuration (see Table 3).
5.3.2 Experiment II
The purpose of this experiment is to evaluate the ability of each combinationof detection algorithm, feature selection method, and number of top features todifferentiate between benign and malicious applications not included in the trainingset, when training and testing are performed on the same device. Thus this experimentattempts to answer the first research question (Section 5.1) and understand whetherit is possible to detect unknown instances of malicious applications on Android.
The training set contained feature vectors of three malicious and three benignapplications. The testing set contained feature vectors of malicious and benignapplications that were not included in the training set on the same device (Fig. 4b).This examined the ability of the different classifiers to detect unknown applications.
Tra
inin
g/T
esti
ng p
erfo
rmed
on
the
Tra
inin
g/T
esti
ng p
erfo
rmed
on
diff
eren
tsa
me
devi
ce
Evaluates the ability to differentiate between benign and malicious applications when training set includes all benign/malicious applications and training/testing are performed on the same device.
Evaluate the ability to differentiate between benign andmalicious applications not included in the training set, when training and testing are performed on the same device.
devi
ces
Evaluate the ability to differentiate between benign and
performed on different devices.
malicious applications when training set includes allbenign/malicious applications but training/testing are
Malicious (4) Tools/Games (4)
Train
Test
Train
Test
Device 1
Device 2
Device 1
Device 2
Train Train
Test Test
(d) Experiment IV
Evaluate the ability to differentiate between benign and
different devices .
malicious applications which are not included in the training set when training and testing are performed on
Testing on applications in training set Testing on applications not in training set
Malicious (4) Tools/Games (4)
(c) Experiment III
(a) Experiment I (b) Experiment II
Malicious (4) Tools/Games (4)
Train (80%)
Device i =1,2 Malicious (4) Tools/Games (4)Device i =1,2
Test (20%)
Train (3 apps) Test (1 app) Train (3 apps) Test (1 app)
5
Fig. 4 Illustration of one dataset set in each experimental configuration
178 J Intell Inf Syst (2012) 38:161–190
For each one of the 10 datasets, we iterated over each device four times, andeach time a different malicious application and different benign application werenot included in the training set but were included in the testing set (see Table 3).
5.3.3 Experiment III
The purpose of this experiment is to compare the ability of each combinationof detection algorithm, feature selection method, and number of top features todifferentiate between benign and malicious applications when training set includes allbenign/malicious applications but training/testing are performed on different devices.Thus, this experiment attempts to answer the second research question (Section 5.1)and understand whether it is possible to detect malicious behavior on “unlearned”devices.
We divided the data to training set and testing set as follows: The training setcontained all the feature vectors of the four benign applications and four maliciousapplications collected from the first device. The testing set contained all the featurevectors of the same four benign and malicious applications as in the training setcollected from the second device which was not used for training (Fig. 4c).
We ran this experiment for each one of the 10 datasets and for each configuration.Each time the feature vectors of a different device were included in the training setand the feature vectors of the other device were used to produce the testing set (seeTable 3).
5.3.4 Experiment IV
The purpose of this experiment is to compare the ability of each combinationof detection algorithm, feature selection method, and number of top features todifferentiate between benign and malicious applications which are not included inthe training set when training and testing are performed on different devices. Thus,this experiment attempts to answer both the first and second research questions(Section 5.1) and understand whether it is possible to detect unknown maliciousapplications on “unlearned” devices.
The datasets were divided as follows: The training set contains feature vectors ofthree benign applications and three malicious applications collected from one of thedevices. The testing set contained feature vectors collected from the second devicefor the remaining game/tool and malicious applications that were not included in thetraining set of the first device (Fig. 4d).
For each one of the 10 datasets, we iterated over each device four times, andeach time different malicious application and different benign application were notincluded in the training set but were included in the testing set of the other device,for each configuration (see Table 3).
5.4 Experimental results
First, we wanted to answer the 3rd research question (Section 5.1) and identify themost accurate classifier for detecting malware on Android. Table 4 presents, foreach experiment, the average FPR, TPR, AUC and Accuracy of the two deviceswhen combined together, for each detector and for each benign type (tool or game).
J Intell Inf Syst (2012) 38:161–190 179
Table 4 Average FPR, TPR, AUC and accuracy for each one of the detectors
Experiment Detectors Games Tools
FPR TPR AUC Accuracy FPR TPR AUC Accuracy
I BN 0.000 0.985 1.000 0.993 0.000 0.983 1.000 0.992DTJ48 0.000 0.999 1.000 1.000 0.001 0.999 0.999 0.999Histogram 0.081 0.958 0.984 0.934 0.082 0.940 0.982 0.928Kmeans 0.115 0.697 0.791 0.813 0.175 0.681 0.753 0.774Logistic 0.001 0.999 1.000 0.999 0.001 0.998 1.000 0.999
regressionNB 0.007 0.926 0.995 0.962 0.009 0.901 0.991 0.947
II BN 0.057 0.436 0.912 0.609 0.044 0.458 0.911 0.658DTJ48 0.113 0.907 0.895 0.908 0.122 0.796 0.837 0.860Histogram 0.322 0.630 0.748 0.691 0.279 0.606 0.768 0.709Kmeans 0.191 0.549 0.679 0.744 0.166 0.483 0.658 0.710Logistic 0.118 0.816 0.920 0.874 0.115 0.622 0.789 0.794
regressionNB 0.103 0.837 0.925 0.891 0.169 0.777 0.838 0.819
III BN 0.063 0.392 0.874 0.579 0.120 0.464 0.806 0.560DTJ48 0.208 0.360 0.572 0.623 0.318 0.509 0.596 0.638Histogram 0.367 0.708 0.723 0.660 0.439 0.700 0.719 0.610Kmeans 0.154 0.457 0.652 0.692 0.216 0.411 0.597 0.600Logistic 0.227 0.798 0.916 0.809 0.179 0.451 0.720 0.673
regressionNB 0.147 0.913 0.918 0.880 0.231 0.878 0.877 0.828
IV BN 0.056 0.171 0.735 0.441 0.121 0.216 0.678 0.403DTJ48 0.166 0.312 0.573 0.643 0.312 0.343 0.515 0.581Histogram 0.425 0.550 0.644 0.527 0.415 0.561 0.682 0.532Kmeans 0.167 0.374 0.603 0.669 0.202 0.374 0.586 0.615Logistic 0.210 0.608 0.803 0.759 0.257 0.311 0.563 0.595
regressionNB 0.178 0.825 0.898 0.857 0.297 0.747 0.760 0.761
The results show that the best detectors (classifiers) in experiments I and II are DT,Logistic Regression and NB, while in experiment III and IV the NB outperformedother classifiers.
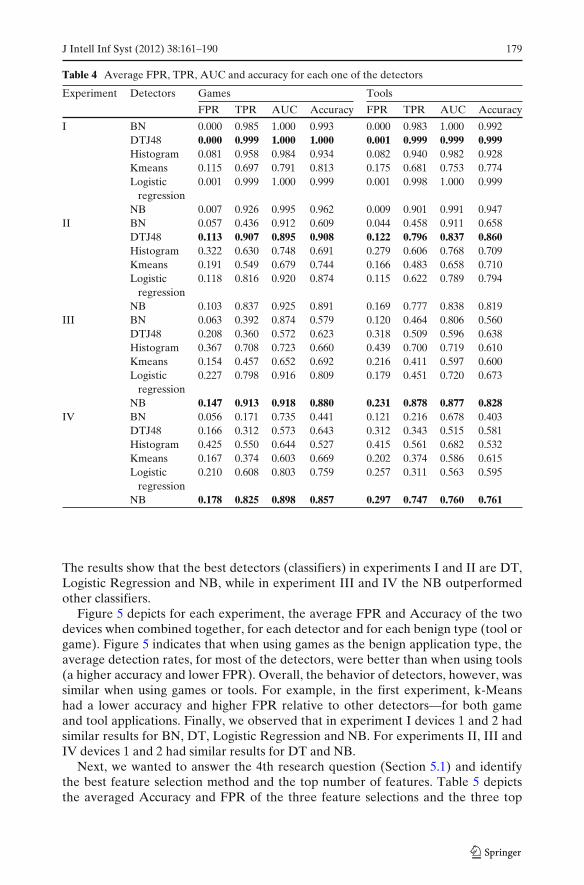
Figure 5 depicts for each experiment, the average FPR and Accuracy of the twodevices when combined together, for each detector and for each benign type (tool orgame). Figure 5 indicates that when using games as the benign application type, theaverage detection rates, for most of the detectors, were better than when using tools(a higher accuracy and lower FPR). Overall, the behavior of detectors, however, wassimilar when using games or tools. For example, in the first experiment, k-Meanshad a lower accuracy and higher FPR relative to other detectors—for both gameand tool applications. Finally, we observed that in experiment I devices 1 and 2 hadsimilar results for BN, DT, Logistic Regression and NB. For experiments II, III andIV devices 1 and 2 had similar results for DT and NB.
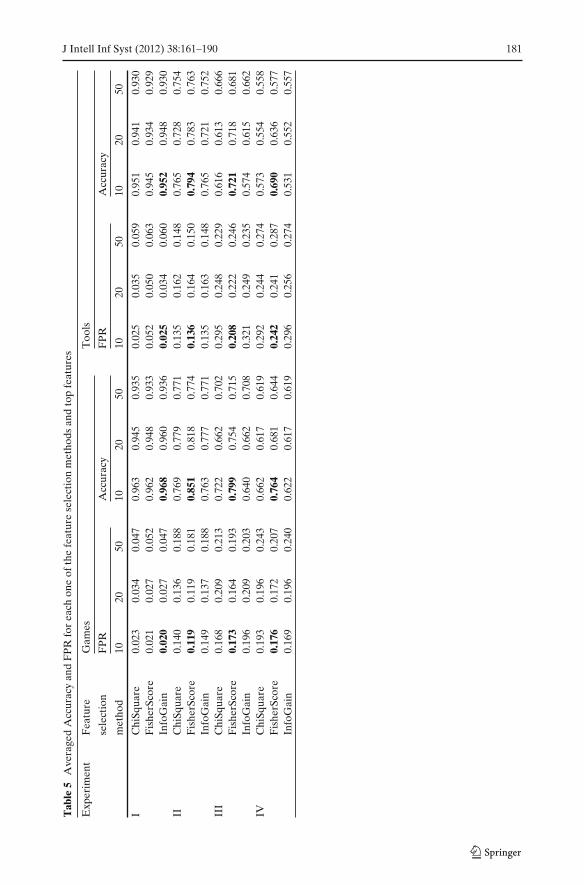
Next, we wanted to answer the 4th research question (Section 5.1) and identifythe best feature selection method and the top number of features. Table 5 depictsthe averaged Accuracy and FPR of the three feature selections and the three top
180 J Intell Inf Syst (2012) 38:161–190
Fig. 5 Average accuracy and FPR for each one of the detectors
numbers of selected features. The result indicate that for experiment I, InfoGainwith top 10 features outperformed all the others combinations. For experiments II,III and IV Fisher score with top 10 outperformed all the others. Furthermore, almostall the feature selection methods performed better when the benign type was a game.Finally, the majority of feature selection methods preformed better when top 10features were selected than when top 20 or 50 features were selected.
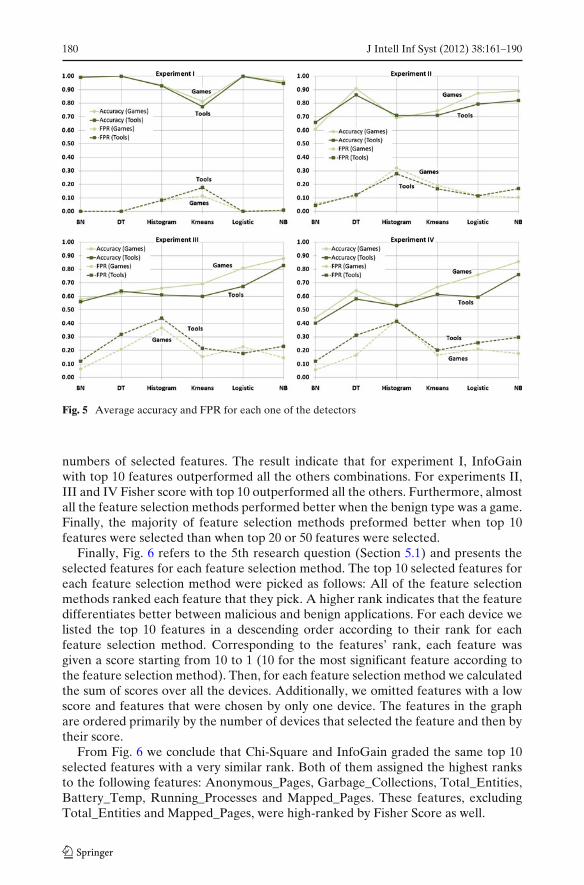
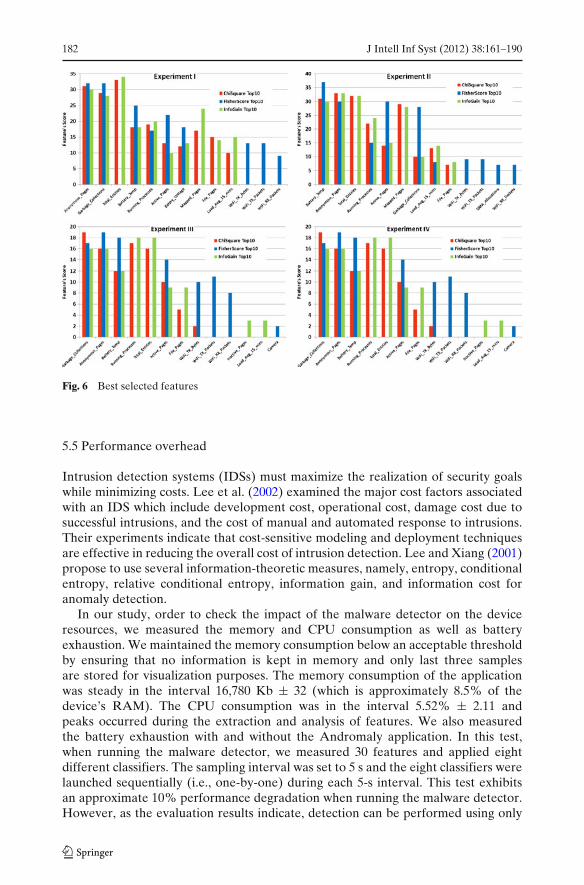
Finally, Fig. 6 refers to the 5th research question (Section 5.1) and presents theselected features for each feature selection method. The top 10 selected features foreach feature selection method were picked as follows: All of the feature selectionmethods ranked each feature that they pick. A higher rank indicates that the featuredifferentiates better between malicious and benign applications. For each device welisted the top 10 features in a descending order according to their rank for eachfeature selection method. Corresponding to the features’ rank, each feature wasgiven a score starting from 10 to 1 (10 for the most significant feature according tothe feature selection method). Then, for each feature selection method we calculatedthe sum of scores over all the devices. Additionally, we omitted features with a lowscore and features that were chosen by only one device. The features in the graphare ordered primarily by the number of devices that selected the feature and then bytheir score.
From Fig. 6 we conclude that Chi-Square and InfoGain graded the same top 10selected features with a very similar rank. Both of them assigned the highest ranksto the following features: Anonymous_Pages, Garbage_Collections, Total_Entities,Battery_Temp, Running_Processes and Mapped_Pages. These features, excludingTotal_Entities and Mapped_Pages, were high-ranked by Fisher Score as well.
J Intell Inf Syst (2012) 38:161–190 181
Tab
le5
Ave
rage
dA
ccur
acy
and
FP
Rfo
rea
chon
eof
the
feat
ure
sele
ctio
nm
etho
dsan
dto
pfe
atur
es
Exp
erim
ent
Fea
ture
Gam
esT
ools
sele
ctio
nF
PR
Acc
urac
yF
PR
Acc
urac
y
met
hod
1020
5010
2050
1020
5010
2050
IC
hiSq
uare
0.02
30.
034
0.04
70.
963
0.94
50.
935
0.02
50.
035
0.05
90.
951
0.94
10.
930
Fis
herS
core
0.02
10.
027
0.05
20.
962
0.94
80.
933
0.05
20.
050
0.06
30.
945
0.93
40.
929
Info
Gai
n0.
020
0.02
70.
047
0.96
80.
960
0.93
60.
025
0.03
40.
060
0.95
20.
948
0.93
0II
Chi
Squa
re0.
140
0.13
60.
188
0.76
90.
779
0.77
10.
135
0.16
20.
148
0.76
50.
728
0.75
4F
ishe
rSco
re0.
119
0.11
90.
181
0.85
10.
818
0.77
40.
136
0.16
40.
150
0.79
40.
783
0.76
3In
foG
ain
0.14
90.
137
0.18
80.
763
0.77
70.
771
0.13
50.
163
0.14
80.
765
0.72
10.
752
III
Chi
Squa
re0.
168
0.20
90.
213
0.72
20.
662
0.70
20.
295
0.24
80.
229
0.61
60.
613
0.66
6F
ishe
rSco
re0.
173
0.16
40.
193
0.79
90.
754
0.71
50.
208
0.22
20.
246
0.72
10.
718
0.68
1In
foG
ain
0.19
60.
209
0.20
30.
640
0.66
20.
708
0.32
10.
249
0.23
50.
574
0.61
50.
662
IVC
hiSq
uare
0.19
30.
196
0.24
30.
662
0.61
70.
619
0.29
20.
244
0.27
40.
573
0.55
40.
558
Fis
herS
core
0.17
60.
172
0.20
70.
764
0.68
10.
644
0.24
20.
241
0.28
70.
690
0.63
60.
577
Info
Gai
n0.
169
0.19
60.
240
0.62
20.
617
0.61
90.
296
0.25
60.
274
0.53
10.
552
0.55
7
182 J Intell Inf Syst (2012) 38:161–190
Fig. 6 Best selected features
5.5 Performance overhead
Intrusion detection systems (IDSs) must maximize the realization of security goalswhile minimizing costs. Lee et al. (2002) examined the major cost factors associatedwith an IDS which include development cost, operational cost, damage cost due tosuccessful intrusions, and the cost of manual and automated response to intrusions.Their experiments indicate that cost-sensitive modeling and deployment techniquesare effective in reducing the overall cost of intrusion detection. Lee and Xiang (2001)propose to use several information-theoretic measures, namely, entropy, conditionalentropy, relative conditional entropy, information gain, and information cost foranomaly detection.
In our study, order to check the impact of the malware detector on the deviceresources, we measured the memory and CPU consumption as well as batteryexhaustion. We maintained the memory consumption below an acceptable thresholdby ensuring that no information is kept in memory and only last three samplesare stored for visualization purposes. The memory consumption of the applicationwas steady in the interval 16,780 Kb ± 32 (which is approximately 8.5% of thedevice’s RAM). The CPU consumption was in the interval 5.52% ± 2.11 andpeaks occurred during the extraction and analysis of features. We also measuredthe battery exhaustion with and without the Andromaly application. In this test,when running the malware detector, we measured 30 features and applied eightdifferent classifiers. The sampling interval was set to 5 s and the eight classifiers werelaunched sequentially (i.e., one-by-one) during each 5-s interval. This test exhibitsan approximate 10% performance degradation when running the malware detector.However, as the evaluation results indicate, detection can be performed using only
J Intell Inf Syst (2012) 38:161–190 183
10 features and a smaller number of classifiers thus the results of this test depict theimpact on the battery in the worst case scenario.
6 Discussion
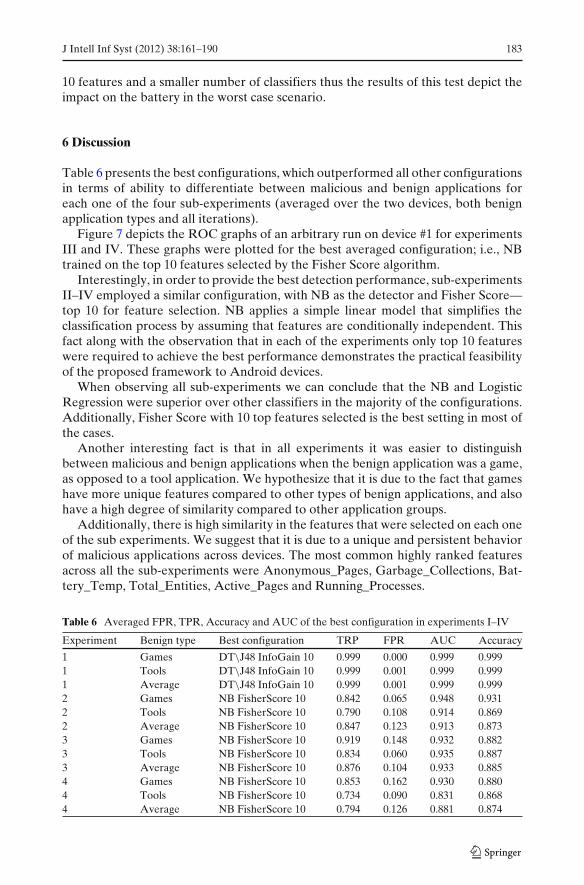
Table 6 presents the best configurations, which outperformed all other configurationsin terms of ability to differentiate between malicious and benign applications foreach one of the four sub-experiments (averaged over the two devices, both benignapplication types and all iterations).
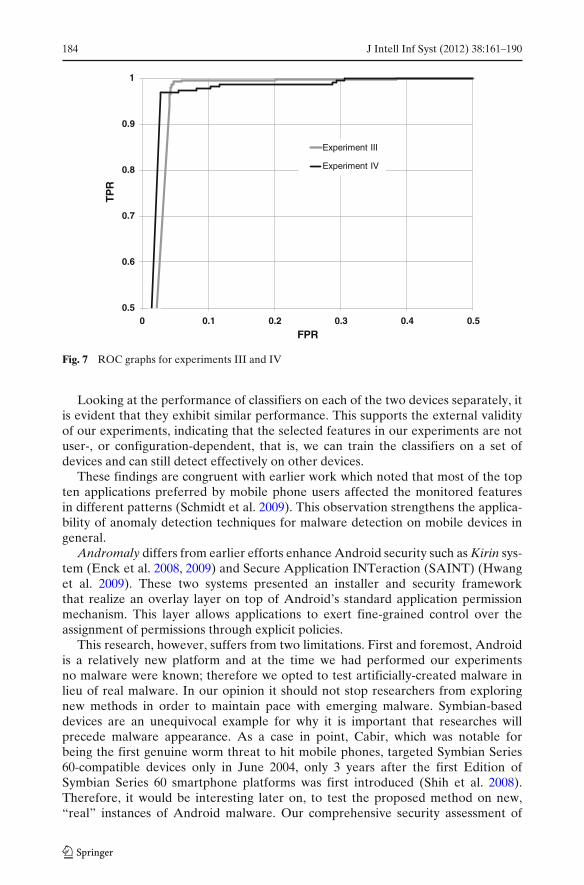
Figure 7 depicts the ROC graphs of an arbitrary run on device #1 for experimentsIII and IV. These graphs were plotted for the best averaged configuration; i.e., NBtrained on the top 10 features selected by the Fisher Score algorithm.
Interestingly, in order to provide the best detection performance, sub-experimentsII–IV employed a similar configuration, with NB as the detector and Fisher Score—top 10 for feature selection. NB applies a simple linear model that simplifies theclassification process by assuming that features are conditionally independent. Thisfact along with the observation that in each of the experiments only top 10 featureswere required to achieve the best performance demonstrates the practical feasibilityof the proposed framework to Android devices.
When observing all sub-experiments we can conclude that the NB and LogisticRegression were superior over other classifiers in the majority of the configurations.Additionally, Fisher Score with 10 top features selected is the best setting in most ofthe cases.
Another interesting fact is that in all experiments it was easier to distinguishbetween malicious and benign applications when the benign application was a game,as opposed to a tool application. We hypothesize that it is due to the fact that gameshave more unique features compared to other types of benign applications, and alsohave a high degree of similarity compared to other application groups.
Additionally, there is high similarity in the features that were selected on each oneof the sub experiments. We suggest that it is due to a unique and persistent behaviorof malicious applications across devices. The most common highly ranked featuresacross all the sub-experiments were Anonymous_Pages, Garbage_Collections, Bat-tery_Temp, Total_Entities, Active_Pages and Running_Processes.
Table 6 Averaged FPR, TPR, Accuracy and AUC of the best configuration in experiments I–IV
Experiment Benign type Best configuration TRP FPR AUC Accuracy
1 Games DT\J48 InfoGain 10 0.999 0.000 0.999 0.9991 Tools DT\J48 InfoGain 10 0.999 0.001 0.999 0.9991 Average DT\J48 InfoGain 10 0.999 0.001 0.999 0.9992 Games NB FisherScore 10 0.842 0.065 0.948 0.9312 Tools NB FisherScore 10 0.790 0.108 0.914 0.8692 Average NB FisherScore 10 0.847 0.123 0.913 0.8733 Games NB FisherScore 10 0.919 0.148 0.932 0.8823 Tools NB FisherScore 10 0.834 0.060 0.935 0.8873 Average NB FisherScore 10 0.876 0.104 0.933 0.8854 Games NB FisherScore 10 0.853 0.162 0.930 0.8804 Tools NB FisherScore 10 0.734 0.090 0.831 0.8684 Average NB FisherScore 10 0.794 0.126 0.881 0.874
184 J Intell Inf Syst (2012) 38:161–190
0.5
0.6
0.7
0.8
0.9
1
0 0.1 0.2 0.3 0.4 0.5
TP
R
FPR
Experiment III
Experiment IV
Fig. 7 ROC graphs for experiments III and IV
Looking at the performance of classifiers on each of the two devices separately, itis evident that they exhibit similar performance. This supports the external validityof our experiments, indicating that the selected features in our experiments are notuser-, or configuration-dependent, that is, we can train the classifiers on a set ofdevices and can still detect effectively on other devices.
These findings are congruent with earlier work which noted that most of the topten applications preferred by mobile phone users affected the monitored featuresin different patterns (Schmidt et al. 2009). This observation strengthens the applica-bility of anomaly detection techniques for malware detection on mobile devices ingeneral.
Andromaly differs from earlier efforts enhance Android security such as Kirin sys-tem (Enck et al. 2008, 2009) and Secure Application INTeraction (SAINT) (Hwanget al. 2009). These two systems presented an installer and security frameworkthat realize an overlay layer on top of Android’s standard application permissionmechanism. This layer allows applications to exert fine-grained control over theassignment of permissions through explicit policies.
This research, however, suffers from two limitations. First and foremost, Androidis a relatively new platform and at the time we had performed our experimentsno malware were known; therefore we opted to test artificially-created malware inlieu of real malware. In our opinion it should not stop researchers from exploringnew methods in order to maintain pace with emerging malware. Symbian-baseddevices are an unequivocal example for why it is important that researches willprecede malware appearance. As a case in point, Cabir, which was notable forbeing the first genuine worm threat to hit mobile phones, targeted Symbian Series60-compatible devices only in June 2004, only 3 years after the first Edition ofSymbian Series 60 smartphone platforms was first introduced (Shih et al. 2008).Therefore, it would be interesting later on, to test the proposed method on new,“real” instances of Android malware. Our comprehensive security assessment of
J Intell Inf Syst (2012) 38:161–190 185
the Android framework indicates that malware penetration to the device is likely tohappen, not only at the Linux level but in the application level (Java) while exploitingthe Android permission mechanism and thus exploring methods for protecting theAndroid framework is essential (Shabtai et al. 2009d, 2010b).
We tried to overcome this limitation as much as possible by: 1) using separate re-search groups one for developing and evaluating the malware detector and the otherfor developing malware for Android; 2) development of malware for Android wasdone after a thorough 18-months research of Android platform, its vulnerabilities,and weakness as well as malware from other mobile platforms; 3) moreover, we useda large and heterogeneous pool of features (88) in order to avoid any bias. Most ofthe features were low level system features independent of specific applications.
A second limitation stems from the fact that the variety of malware applicationswas quite small (using only four malware instances). This is again due to the factthat Android is a new platform and no known malware yet exists. This limitation issomewhat mitigated by the fact that we performed a preliminary evaluation of theproposed detection model on 20 tools and 20 games across two Android devices. Sim-ilar four sub-experiments were conducted and yielded similar performance, therebyproviding a positive indication about the validity of our findings and about the abilityof such methods to learn and model the behavior of an Android application andpotentially detect malicious applications, even when the number of sampled featuresis small. One important and interesting note is that the four malware instances usedin the evaluation were significantly different in behavior and in impact/effect on thesystem and yet yielded relatively good results.
7 Conclusions and future work
Since Android has been introduced, it has been (and still is) explored for its inherentsecurity mechanisms, and several targeted security solutions where proposed toaugment these mechanisms. From our assessment of Android’s security (Shabtaiet al. 2009c, 2010a), we believe that additional security mechanisms should be appliedto Android. Furthermore, similar to the PC platform, there is no “silver-bullet”when dealing with security. A security suite for mobile devices or smartphones(especially open-source) such as Android include a collection of tools operatingin collaboration. This includes: signature-based anti-virus, firewalling capabilities,better access-control mechanism and also a malware/intrusion detection platform.
In this paper we presented a malware detection framework for Android whichemploys Machine Learning and tested various feature selection methods and clas-sification/anomaly detection algorithms. The detection approach and algorithms arelight-weight and run on the device itself. There is however also an option to performthe detection at a centralized location, or at least report the analysis results, derivedlocally on each device, to such a centralized location. This can be useful in detectionof malware propagation patterns across a community of mobile devices. As statedby Rich Cannings,5 Google’s Android Security Leader, the Android Market placewas chosen to be the place for reporting security issues by users. Users can markapplications as harmful, thereby triggering a security team to launch an investigation
5http://www.usenix.org/events/sec09/tech/tech.html#cannings
186 J Intell Inf Syst (2012) 38:161–190
(as in the case of the MemoryUp application6). Andromaly can be used for reportingsuspicious behavior of applications to the Android Market.
Andromaly is open and modular and, as such, can easily accommodate multiplemalware detection techniques (e.g., rule-based inferences (Moreau et al. 1997), andthe behavioral checker approach (Samfat and Molva 1997)). Overall, our empiricalfindings indicate that using Machine Learning algorithms for anomaly detection isa viable approach for enhancing security of Android devices. We also found thatFeature Extractors are in the critical execution loop and as such must be opti-mized aggressively. Some of the mechanisms used to prevent them from becomingperformance bottle necks are: using a small number of features for the detection;implementing resource exhaustive feature extractors as native code; and sendingonly the required features to each processor to reduce the Binder communicationoverhead. Furthermore, the fact that the detection can still be effective even whenusing a small number features and simple detection algorithms ensures that stringentresource constraints (i.e., CPU, battery) on the device are met.
The proposed detection approach is recommended for detecting continuousattacks (e.g., DoS, worm infection) and needs to be trained on a broad range ofexamples. Since one of the primary requirements of such detector is to maintain alow false alarm rate, alerting a user on each instance of detected anomaly is notacceptable; therefore the prevalent approach would be to dispatch an alert only incase the anomaly persists. This approach however, will fail to detect instantaneousand abrupt attacks. Thus, the main conclusion emanating from this study is that amore suitable approach when implementing a malware detection system for Androidwould be to mesh the following two methods: classification and anomaly detectionand misuse-based detectors (e.g., rule-based, knowledge-based). When they operatein a synergy they can yield an optimal recall rate and low false alarms.
We identified several challenges that complicate the use of anomaly detection inan Android platform: (1) malicious activities can be very short; thus not providingsufficient data to learn from or detect (e.g., the SMS leakage malware); (2) there arenot enough malicious applications to use in the training phase; and (3) the maliciousbehavior may vary between attacks, resulting in many types (i.e., classes) of maliciousbehaviors (4) The small number of malicious applications introduced us with the classimbalance problem. The class imbalance problem occurs when one of the classesis represented by a very small number of cases compared to the other classes. Wedecided to cope with this problem by under-sampling the benign class, in other words,using only part of the benign applications that were generated for the first set ofexperiments, and duplicating the vectors of malicious applications.
Several avenues can be explored for future research. First and foremost we canalert about a detected anomaly when it persists for a long time. Mechanisms such asa Leaky Bucket, Moving Average, and the Knowledge-Based Temporal Abstraction(KBTA) (Shabtai et al. 2009b, 2010a) can assist in this task. Second, we can detectfeatures with high variance between different devices and remove them, and alsoadd new and valuable features such as system calls. Third, we can add a temporalperspective by augmenting the collected features with a time stamp (e.g., use thechange of the battery level in the last 10 min rather than the level of the batteryat a certain point in time), or logging sequences of events (e.g., a Boolean feature
6http://www.geek.com/articles/mobile/google-says-that-memoryup-has-no-malware-20090128/
J Intell Inf Syst (2012) 38:161–190 187
that is true if there was an access to an SD-card concurrently with a high volume ofnetwork traffic via Wi-Fi). Fourth, we would like to test the proposed frameworkon different/newer handset firmware in order to understand the impact on theperformance. Fifth, we can focus on monitoring and detection of malicious processesrather than monitoring the whole system. This will enable to isolate the activitiesof specific applications. Finally, unsupervised classifiers can be used instead of thesupervised classifiers used in this study.
Appendix
Table 7 List of used applications
Class Application name No. of vectors No. of vectors(device 1) (device 2)
Malicious Lunar Lander (SMS abuse) 206 313Snake (camera abuse) 227 240HTTP uploader (SD-card leakage) 175 214Tip Calculator (DoS) 196 210(Total) 804 (6%) 977 (9%)
Benign (tools) Browser 307 274Calculator 296 251Calendar 319 233Camera 302 251Contacts 303 230eMail 219 250Messaging 371 245File Manager 295 235Maps 342 216SMS 322 247Playing Music 304 251My Tracks 356 233Note Everything 329 212Oxford Dictionary 323 275Pdf Viewer 280 249Phonalyzr 304 240Phone 125 224Tasks 300 226Voice Memo 312 230Weather File Manager 372 242(Total) 6,081 (44%) 4,814 (44%)
Benign (games) Armageddonoid 343 222Battle for Mars 544 208Bonsai 355 287Bread Factory 300 208Connect4 308 204Flying High 279 250Froggo 308 185Hang’em High 342 348Lexic 354 266Mine Sweeper 342 267Pairup 410 275PicaCross Express 300 357SmartTacToe 298 233Snake 294 254Solitaire 334 378Switcher 303 231TankAce 336 287ThrottleCopter 321 230Trap 454 245WordPops 301 314(Total) 6,826 (50%) 5,249 (48%)
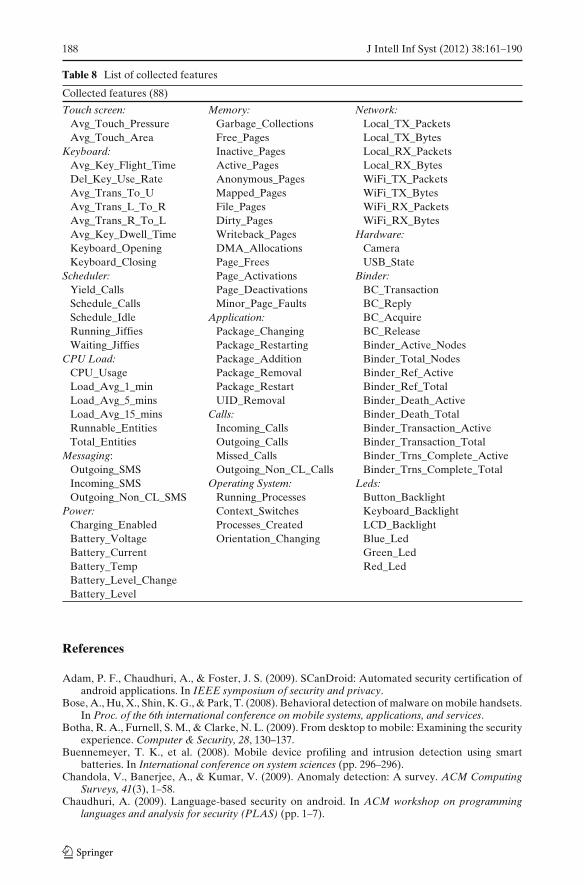
188 J Intell Inf Syst (2012) 38:161–190
Table 8 List of collected features
Collected features (88)
Touch screen: Memory: Network:Avg_Touch_Pressure Garbage_Collections Local_TX_PacketsAvg_Touch_Area Free_Pages Local_TX_Bytes
Keyboard: Inactive_Pages Local_RX_PacketsAvg_Key_Flight_Time Active_Pages Local_RX_BytesDel_Key_Use_Rate Anonymous_Pages WiFi_TX_PacketsAvg_Trans_To_U Mapped_Pages WiFi_TX_BytesAvg_Trans_L_To_R File_Pages WiFi_RX_PacketsAvg_Trans_R_To_L Dirty_Pages WiFi_RX_BytesAvg_Key_Dwell_Time Writeback_Pages Hardware:Keyboard_Opening DMA_Allocations CameraKeyboard_Closing Page_Frees USB_State
Scheduler: Page_Activations Binder:Yield_Calls Page_Deactivations BC_TransactionSchedule_Calls Minor_Page_Faults BC_ReplySchedule_Idle Application: BC_AcquireRunning_Jiffies Package_Changing BC_ReleaseWaiting_Jiffies Package_Restarting Binder_Active_Nodes
CPU Load: Package_Addition Binder_Total_NodesCPU_Usage Package_Removal Binder_Ref_ActiveLoad_Avg_1_min Package_Restart Binder_Ref_TotalLoad_Avg_5_mins UID_Removal Binder_Death_ActiveLoad_Avg_15_mins Calls: Binder_Death_TotalRunnable_Entities Incoming_Calls Binder_Transaction_ActiveTotal_Entities Outgoing_Calls Binder_Transaction_Total
Messaging: Missed_Calls Binder_Trns_Complete_ActiveOutgoing_SMS Outgoing_Non_CL_Calls Binder_Trns_Complete_TotalIncoming_SMS Operating System: Leds:Outgoing_Non_CL_SMS Running_Processes Button_Backlight
Power: Context_Switches Keyboard_BacklightCharging_Enabled Processes_Created LCD_BacklightBattery_Voltage Orientation_Changing Blue_LedBattery_Current Green_LedBattery_Temp Red_LedBattery_Level_ChangeBattery_Level
References
Adam, P. F., Chaudhuri, A., & Foster, J. S. (2009). SCanDroid: Automated security certification ofandroid applications. In IEEE symposium of security and privacy.
Bose, A., Hu, X., Shin, K. G., & Park, T. (2008). Behavioral detection of malware on mobile handsets.In Proc. of the 6th international conference on mobile systems, applications, and services.
Botha, R. A., Furnell, S. M., & Clarke, N. L. (2009). From desktop to mobile: Examining the securityexperience. Computer & Security, 28, 130–137.
Buennemeyer, T. K., et al. (2008). Mobile device profiling and intrusion detection using smartbatteries. In International conference on system sciences (pp. 296–296).
Chandola, V., Banerjee, A., & Kumar, V. (2009). Anomaly detection: A survey. ACM ComputingSurveys, 41(3), 1–58.
Chaudhuri, A. (2009). Language-based security on android. In ACM workshop on programminglanguages and analysis for security (PLAS) (pp. 1–7).
J Intell Inf Syst (2012) 38:161–190 189
Cheng, J., Wong, S. H., Yang, H., & Lu, S. (2007). SmartSiren: Virus detection and alert forsmartphones. In Proceedings of the 5th international conference on mobile systems, applicationsand services.
Dagon, C., Martin, T., & Starner, T. (2004). Mobile phones as computing devices the viruses arecoming. Pervasive Computing, 3, 11–15.
Domingos, P., & Pazzani, M. (1997). On the optimality of simple Bayesian classifier under zero-oneloss. Machine Learning, 29, 103–130.
Egele, M., Krugel, C., Kirda, E., Yin, H., & Song, D. (2007). Dynamic spyware analysis. In USENIXannual technical conference (pp. 233–246).
Emm, D. (2006). Mobile malware – new avenues. Network Security, 2006(11), 4–6.Enck, W., Ongtang, M., & McDaniel, P. (2008). Mitigating android software misuse before it happens.
Tech. report NAS-TR-0094–2008, Network and Security Research Ctr., Dept. Computer Scienceand Eng., Pennsylvania State Univ.
Enck, W., Ongtang, M., & McDaniel, P. (2009). Understanding android security. IEEE Security &Privacy Magazine, 7(1), 50–57.
Endler, D. (1998). Intrusion detection: Applying machine learning to solaris audit data. In Proceed-ings of the 14th annual computer security applications conference.
Garcia-Teodoro, P., Diaz-Verdejo, J., Macia-Fernandez, G., & Vazquez, E. (2009). Anomaly-basednetwork intrusion detection: Techniques, systems and challenges. Computers & Security, 28(1–2),18–28.
Golub, T., et al. (1999). Molecular classification of cancer: Class discovery and class prediction bygene expression monitoring. Science, 286, 531–537.
Griffin, K., Schneider, S., Hu, X., & Chiueh, T. (2009). Automatic generation of string signatures formalware detection. In Proc. of the 12th international symposium on recent advances in intrusiondetection.
Gryaznov, D. (1999). Scanners of the year 2000: Heuritics. The 5th international virus bulletin.Guo, C., Wang, H. J., & Zhu, W. (2004). Smart-phone attacks and defenses. In HotNets III.Hwang, S. S., Cho, S., & Park, S. (2009). Keystroke dynamics-based authentication for mobile
devices. Computer & Security, 28, 85–93.Imam, I. F., Michalski, R. S., & Kerschberg, L. (1993). Discovering attribute dependence in databases
by integrating symbolic learning and statistical analysis techniques. In Proceeding of the AAAI-93 workshop on knowledge discovery in databases.
Jacob, G., Debar, H., & Filiol, E. (2008). Behavioral detection of malware: From a survey towardsan established taxonomy. Journal in Computer Virology, 4, 251–266.
Jacoby, G. A., & Davis, N. J. (2004). Battery-based intrusion detection. In Global telecommunica-tions conference (GLOBECOM’04).
Jain, A. K., Murty, M. N., & Flynn, P. J. (1999). Data clustering. ACM Computing Surveys, 31(3):264–296.
John, G. H., & Langley, P. (1995). Estimating continuous distributions in bayesian classifiers. In Proc.of the conference on uncertainty in artif icial intelligence (pp. 338–345).
Kim, H., Smith, J., & Shin, K. G. (2008). Detecting energy-greedy anomalies and mobile malwarevariants. In Proceeding of the 6th international conference on mobile systems, applications, andservices.
Koong, K. S., Liu, L. C., Bai, S., & Lin, B. (2008). Identity theft in the USA: Evidence from 2002 to2006. International Journal of Mobile Communications, 6(2), 199–216.
Leavitt, N. (2005). Mobile phones: The next frontier for hackers? Computer, 38(4), 20–23.Lee, W., & Xiang, D. (2001). Information-theoretic measures for anomaly detection. In Proc. of the
IEEE symposium on security and privacy (pp. 130–143).Lee, W., Stolfo, S., & Mok, K. (1999). A data mining framework for building intrusion detection
models. In Proc. of the 1999 IEEE symposium on security and privacy. Oakland.Lee, W., Fan, W., Miller, M., Stolfo, S., & Zadok, E. (2002). Toward cost-sensitive modeling for
intrusion detection and response. Journal of Computer Security, 10(1–2), 5–22.Menahem, E., Shabtai, A., Rokach, L., & Elovici, Y. (2008). Improving malware detection by
applying multi-inducer ensemble. Computational Statistics and Data Analysis, 53(4), 1483–1494.Miettinen, M., Halonen, P., & Hätönen, K. (2006). Host-based intrusion detection for advanced
mobile devices. In Proc. of the 20th international conference on advanced information networkingand applications.
Mitchell, T. (1997). Machine learning. New York: McGraw-Hill.Moreau, Y., Preneel, B., Burge, P., Shawe-Taylor, J., Stoermann, C., & Cooke, C. (1997). Novel
techniques for fraud detection in mobile telecommunication networks. In ACTS mobile summit.
190 J Intell Inf Syst (2012) 38:161–190
Moser, A., Kruegel, C., & Kirda, E. (2007). Limits of static analysis for malware detection. In Annualcomputer security applications conference (pp. 421–430).
Moskovitch, R., Elovici, Y., & Rokach, L. (2008). Detection of unknown computer worms basedon behavioral classification of the host. Computational Statistics and Data Analysis, 52(9), 4544–4566.
Muthukumaran, D., et al. (2008). Measuring integrity on mobile phone systems. In Proceedings ofthe 13th ACM symposium on access control models and technologies.
Nash, D. C., et al. (2005). Towards an intrusion detection system for battery exhaustion attacks onmobile computing devices. In Pervasive computing and communications workshops.
Neter, J., Kutner, M. H., Nachtsheim, C. J., & Wasserman, W. (1996). Applied linear statisticalmodels. McGraw-Hill.
Ongtang, M., McLaughlin, S., Enck, W., & McDaniel, P. (2009). Semantically rich application-centricsecurity in android. In Proceedings of the 25th annual computer security applications conference(ACSAC). Honolulu.
Pearl, J. (1988). Probabilistic reasoning in intelligent systems: Networks of plausible inference.Massachusetts: Morgan Kaufmann.
Piercy, M. (2004). Embedded devices next on the virus target list. IEEE Electronics Systems andSoftware, 2, 42–43.
Quinlan, J. R. (1993). C4.5: Programs for machine learning. San Francisco: Morgan Kaufmann.Rieck, K., Holz, T., Willems, C., Düssel, P., & Laskov, P. (2008). Learning and classification of mal-
ware behavior. In Proc. of the conference on detection of intrusions and malware & vulnerabilityassessment (pp. 108–125).
Russel, S., & Norvig, P. (2002). Artif icial intelligence: A modern approach. Prentice Hall.Samfat, D., & Molva, R. (1997). IDAMN: An intrusion detection architecture for mobile networks.
IEEE Journal on Selected Areas in Communications, 15(7), 1373–1380.Schmidt, A. D., Schmidt, H. G., Yüksel, K. A., Kiraz, O., Camptepe, S. A., & Albayrak, S. (2008).
Enhancing security of linux-based android devices. In Proc. of the 15th international linux systemtechnology conference.
Schmidt, A. D., Peters, F., Lamour, F., Scheel, C., Camtepe, S. A., & Albayrak, S. (2009). Monitor-ing smartphones for anomaly detection. Mobile Networks and Applications (MONET), 14(1),92–106.
Shabtai, A., Fledel, Y., & Elovici, Y. (2009a). Detecting malicious applications on android by apply-ing machine learning classifiers to static features (Poster). Presented in the 25th annual computersecurity applications conference (ACSAC). Honolulu, Hawaii.
Shabtai, A., Fledel, Y., Elovici, Y., & Shahar, Y. (2009b). Knowledge-based temporal abstraction inclinical domains. Journal in Computer Virology, 8(3), 267–298.
Shabtai, A., Moskovitch, R., Elovici, Y., & Glezer, C. (2009c). Detection of malicious code byapplying machine learning classifiers on static features: A state-of-the-art survey. InformationSecurity Technical Report, 14(1):1–34.
Shabtai, A., Fledel, Y., Kanonov, U., Elovici, Y., & Dolev, S. (2009d). Google android: A state-of-the-art review of security mechanisms. CoRR abs/0912.5101.
Shabtai, A., Kanonov, U., & Elovici, Y. (2010a). Intrusion detection on mobile devices using theknowledge based temporal-abstraction method. Journal of Systems and Software, 83(8), 1524–1537.
Shabtai, A., Fledel, Y., Kanonov, U., Elovici, Y., Dolev, S., & Glezer, C. (2010b) Google android:A comprehensive security assessment. IEEE Security and Privacy Magazine. doi:10.1109/MSP.2010.2.
Shannon, C. E. (1948). The mathematical theory of communication. The Bell system TechnicalJournal, 27(3), 379–423.
Shih, D. H., Lin, B., Chiang, H. S., & Shih, M. H. (2008). Security aspects of mobile phone virus: Acritical survey. Industrial Management & Data Systems, 108(4), 478–494.
Yap, T. S., & Ewe, H. T. (2005). A mobile phone malicious software detection model with behaviorchecker. Lecture Notes in Computer Science, 3597, 57–65.
Yin, H., Song, D., Egele, M., Krugel, C., & Kirda, E. (2007). Panorama: Capturing system-wideinformation flow for malware detection and analysis. In ACM conference on computer andcommunications security.