aar chapter 11 - arctic monitoring and assessment programme
TRANSCRIPT
Contents11.1. Introduction . . . . . . . . . . . . . . . . . . . . . . . . . . . . . . . . . . . . . . 71711.2. Climate change. . . . . . . . . . . . . . . . . . . . . . . . . . . . . . . . . . . . 718
11.2.1. Dynamic interactions . . . . . . . . . . . . . . . . . . . . . . . . . . . 71811.2.1.1. Energy balance . . . . . . . . . . . . . . . . . . . . . . . . 71811.2.1.2. Trace gas balance . . . . . . . . . . . . . . . . . . . . . . 71911.2.1.3. Hydrological cycle . . . . . . . . . . . . . . . . . . . . . 719
11.2.2. Climate change: Methods of assessment and recent trends 72011.2.2.1. Temperature records . . . . . . . . . . . . . . . . . . . . 72011.2.2.2. Radiatively important trace substances . . . . . . 72311.2.2.3. Water vapor . . . . . . . . . . . . . . . . . . . . . . . . . . 72311.2.2.4. Precipitation . . . . . . . . . . . . . . . . . . . . . . . . . . 72311.2.2.5. Hydroclimatology . . . . . . . . . . . . . . . . . . . . . 72511.2.2.6. Sea ice . . . . . . . . . . . . . . . . . . . . . . . . . . . . . . . 72511.2.2.7. Vegetation . . . . . . . . . . . . . . . . . . . . . . . . . . . 72511.2.2.8. Soils and permafrost . . . . . . . . . . . . . . . . . . . . 72611.2.2.9. Glaciers and ice sheets. . . . . . . . . . . . . . . . . . . 72611.2.2.10. Ice and sediment cores . . . . . . . . . . . . . . . . . 726
11.2.2.10.1. Ice cores . . . . . . . . . . . . . . . . . . . 72611.2.2.10.2. Paleoecological records . . . . . . . . 727
11.2.2.11. Historical and archaeological evidence . . . . . 72811.2.3. Ability to predict . . . . . . . . . . . . . . . . . . . . . . . . . . . . . . 72811.2.4. Components of the Arctic . . . . . . . . . . . . . . . . . . . . . . . 729
11.2.4.1. Oceanic regime . . . . . . . . . . . . . . . . . . . . . . . . 72911.2.4.1.1. Ocean stratification and water
circulation. . . . . . . . . . . . . . . . . . . 72911.2.4.1.2. Sea ice . . . . . . . . . . . . . . . . . . . . . . 730
Leads and polynyas . . . . . . . . 730Snow cover . . . . . . . . . . . . . . . 731Melt ponds . . . . . . . . . . . . . . . 731
11.2.4.2. Terrestrial regime . . . . . . . . . . . . . . . . . . . . . . 73111.2.4.2.1. Soil . . . . . . . . . . . . . . . . . . . . . . . . 73111.2.4.2.2. Permafrost . . . . . . . . . . . . . . . . . . 73111.2.4.2.3. Runoff . . . . . . . . . . . . . . . . . . . . . 73211.2.4.2.4. Snow . . . . . . . . . . . . . . . . . . . . . . 73211.2.4.2.5. Terrestrial ecosystems – Physical
properties . . . . . . . . . . . . . . . . . . . 73311.2.4.2.6. Arctic glaciers and ice sheets . . . . . 733
11.2.4.3. Atmospheric regime . . . . . . . . . . . . . . . . . . . . 73411.2.4.3.1. Atmospheric structure and components 734
Temperature . . . . . . . . . . . . . . 734Surface winds . . . . . . . . . . . . . 734Clouds . . . . . . . . . . . . . . . . . . 735
11.2.4.3.2. Radiatively important trace substances 735Carbon dioxide . . . . . . . . . . . 736Methane (CH4) . . . . . . . . . . . 736Carbon monoxide . . . . . . . . . 736Nitrous oxide (N2O) . . . . . . . 736Chloroflourocarbons (CFCs) . 737Water vapor . . . . . . . . . . . . . . 737Aerosols . . . . . . . . . . . . . . . . . 737Tropospheric ozone . . . . . . . . 738
11.3. Arctic stratospheric ozone . . . . . . . . . . . . . . . . . . . . . . . . . . 73911.3.1. Arctic stratospheric ozone . . . . . . . . . . . . . . . . . . . . . . . 73911.3.2. Chemistry of ozone depletion – Polar vortex dynamics . 73911.3.3. Measurements of stratospheric ozone . . . . . . . . . . . . . . 74011.3.4. Results of measurements . . . . . . . . . . . . . . . . . . . . . . . . 74011.3.5. Arctic ozone anomalies . . . . . . . . . . . . . . . . . . . . . . . . . 742
11.3.5.1. Type 1 Arctic ozone anomaly . . . . . . . . . . . . . 74211.3.5.2. Type 2 Arctic ozone anomaly . . . . . . . . . . . . . 744
11.4. UV radiation . . . . . . . . . . . . . . . . . . . . . . . . . . . . . . . . . . . . . 74411.4.1. Measurements . . . . . . . . . . . . . . . . . . . . . . . . . . . . . . . . 74511.4.2. Modeling . . . . . . . . . . . . . . . . . . . . . . . . . . . . . . . . . . . . 74611.4.3. Biologically relevant UV. . . . . . . . . . . . . . . . . . . . . . . . . 746
11.4.3.1. Spectral considerations . . . . . . . . . . . . . . . . . . 74611.4.3.2. Geometrical considerations . . . . . . . . . . . . . . . 746
11.4.4. UV on land . . . . . . . . . . . . . . . . . . . . . . . . . . . . . . . . . . 74711.4.5. UV penetration in aquatic systems . . . . . . . . . . . . . . . . . 748
11.5. Effects of climate change and UV radiation on the biosphere 74911.5.1. Terrestrial ecosystems . . . . . . . . . . . . . . . . . . . . . . . . . . 749
11.5.1.1. Climate change effects on terrestrial ecosystems 74911.5.1.1.1. Vegetation. . . . . . . . . . . . . . . . . . . 749
Plant communities . . . . . . . . . 749Nutrient availability . . . . . . . . 750Permafrost and vegetation . . . 750Water stress . . . . . . . . . . . . . . 750
11.5.1.1.2. Invertebrates . . . . . . . . . . . . . . . . . 75011.5.1.1.3. Vertebrates . . . . . . . . . . . . . . . . . . 750
11.5.1.2. UV effects on terrestrial ecosystems . . . . . . . . 75111.5.1.2.1. Dwarf shrubs, mosses, and lichens 75111.5.1.2.2. Decomposition . . . . . . . . . . . . . . . 75111.5.1.2.3. Animals. . . . . . . . . . . . . . . . . . . . . 752
11.5.2. Aquatic ecosystems . . . . . . . . . . . . . . . . . . . . . . . . . . . . 75211.5.2.1. Climate change and marine ecosystems. . . . . . 752
11.5.2.1.1. Marine fish . . . . . . . . . . . . . . . . . . 75211.5.2.1.2. Larger animals . . . . . . . . . . . . . . . 752
11.5.2.2. Photochemical effects of UV – Dissolved organic matter. . . . . . . . . . . . . . . . . 752
11.5.2.3. UV and marine ecosystem. . . . . . . . . . . . . . . . 75311.5.2.3.1. Primary producers . . . . . . . . . . . . 75411.5.2.3.2. Bacteria . . . . . . . . . . . . . . . . . . . . 75511.5.2.3.3. Zooplankton. . . . . . . . . . . . . . . . . 75511.5.2.3.4. Invertebrates . . . . . . . . . . . . . . . . . 75511.5.2.3.5. Fish populations . . . . . . . . . . . . . . 75511.5.2.3.6. Larger animals . . . . . . . . . . . . . . . 755
11.5.2.4. Climate change and Arctic freshwater. . . . . . . 75511.5.2.4.1. Climate change and Arctic lakes
and ponds . . . . . . . . . . . . . . . . . . . 75511.5.2.4.2. Climate change and rivers and streams 756
11.5.2.5. UV and Arctic freshwater . . . . . . . . . . . . . . . . 756
11.6. Effects of climate change and UV radiation on Arctic peoples 75711.6.1. Pre-historical and historical effects of climate change . . 75711.6.2. Settlement and resource use . . . . . . . . . . . . . . . . . . . . . . 75711.6.3. Economic activities . . . . . . . . . . . . . . . . . . . . . . . . . . . . 758
11.6.3.1. Commercial fisheries . . . . . . . . . . . . . . . . . . . . 75811.6.3.2. Reindeer herding. . . . . . . . . . . . . . . . . . . . . . . 75811.6.3.3. Transportation . . . . . . . . . . . . . . . . . . . . . . . . 75811.6.3.4. Forestry. . . . . . . . . . . . . . . . . . . . . . . . . . . . . . 75811.6.3.5. Agriculture . . . . . . . . . . . . . . . . . . . . . . . . . . . 759
11.6.4. Effects of UV radiation on human health. . . . . . . . . . . . 759
11.7. International efforts . . . . . . . . . . . . . . . . . . . . . . . . . . . . . . . 75911.7.1. Agreements . . . . . . . . . . . . . . . . . . . . . . . . . . . . . . . . . . 75911.7.2. Programs . . . . . . . . . . . . . . . . . . . . . . . . . . . . . . . . . . . . 76011.7.3. Assessments . . . . . . . . . . . . . . . . . . . . . . . . . . . . . . . . . . 760
11.7.3.1. Climate change . . . . . . . . . . . . . . . . . . . . . . . . 76011.7.3.2. Ozone and UV . . . . . . . . . . . . . . . . . . . . . . . . 760
11.8. Conclusions and recommendations . . . . . . . . . . . . . . . . . . 76111.8.1. Climate change: Conclusions . . . . . . . . . . . . . . . . . . . . . 76111.8.2. Climate change: Recommendations . . . . . . . . . . . . . . . . 76111.8.3. Ozone: Conclusions . . . . . . . . . . . . . . . . . . . . . . . . . . . . 76111.8.4. Ozone: Recommendations . . . . . . . . . . . . . . . . . . . . . . . 76111.8.5. UV: Conclusions . . . . . . . . . . . . . . . . . . . . . . . . . . . . . . 76111.8.6. UV: Recommendations . . . . . . . . . . . . . . . . . . . . . . . . . 76211.8.7. Climate change and UV effects on ecosystems: Conclusions 76211.8.8. Climate change and UV effects on ecosystems:
Recommendations . . . . . . . . . . . . . . . . . . . . . . . . . . . . 76211.8.9. Climate change and UV effects on humans: Conclusions 76211.8.10. Climate change and UV effects on humans:
Recommendations . . . . . . . . . . . . . . . . . . . . . . . . . . . . 762
Acknowledgments . . . . . . . . . . . . . . . . . . . . . . . . . . . . . . . . . . . . . 762
References . . . . . . . . . . . . . . . . . . . . . . . . . . . . . . . . . . . . . . . . . . . . 763
11.1. IntroductionGlobal climate change is a growing concern, especially inArctic regions where increases in temperature from anthro-pogenic influences could be considerably higher than theglobal average. Climatic changes are not new to the Arcticor its peoples. Indigenous peoples of the far north haveadapted to the austere climate; different groups have foundtheir own unique ways to harvest food and provide clothing,tools, and shelter. At times the climate has warmed or cooledrelatively suddenly and people have either adapted, moved,or died off. The paleo-archaeological record, indigenouspeoples’ oral history, and historical documents provide evi-dence of climatic changes for thousands of years. Today,people of the Arctic, whether they continue to live close tothe land or live in urban centers, must again confront rapidchanges in climate. Various records over the last 40 years
717
Chapter 11
Climate Change, Ozone, and Ultraviolet Radiation––––––––––––––––––––––––––––––––––––––––––––––––––––––––––––––––––––––––––––––––––––
Go back to opening screen

718 AMAP Assessment Report
dressed. Little effort has been expended to study the effectsof UV on the Arctic biosphere, including human health, al-though the International Arctic Science Committee con-cluded in 1995 that ‘There is a pressing need to quantifyozone-dependent UV-B effects on diverse Arctic ecosystemsunder their current conditions.’
This chapter provides an overview of current researchand knowledge on climate change, ozone depletion, andUV-B radiation in the Arctic. After this brief introduction,the second section gives an overview of climate change, in-cluding evidence and measurements of climate change aswell as what is known about the various components of theclimate change system in the Arctic. Section three addressesstratospheric ozone, and section four covers UV radiation inthe Arctic. The general effects of climate change and UV ra-diation on aquatic and terrestrial ecosystems are examinedin section five, and section six examines their effects on Arc-tic peoples and their communities. Section seven provides anoverview of major international programs involving researchand assessments. Recommendations for further internationalefforts are made in section eight.
11.2. Climate change11.2.1. Dynamic interactionsThe complexity of climate change in the Arctic can be ob-served through the strong and dynamic changes in the en-ergy, trace gas and hydrological balances of the Arctic. Solarradiation inside the Arctic Circle varies seasonally from con-tinuous sunlight to no sunlight. Depending on ambient con-ditions, the Arctic can be either a source or a sink of particu-lar trace gases. The water balance of the Arctic is highly dy-namic in its exchange between ice, water, and water vapor.Virtually all components and aspects of the Arctic climatesystem, from sea ice to surface temperature, are determinedintegrally by the energy, trace gas, and hydrological cycles.The balance of these three systems will be discussed first toallow an overview before the individual components of theArctic climate system are covered in more detail.
11.2.1.1. Energy balance
Alteration of the Earth’s radiation balance is the most directway to affect climate. The Earth’s surface temperature is aresult of the balance between the energy fluxes in a smalllayer near the surface. The amount of solar radiation ab-sorbed by the surface is determined by many factors. Apartfrom solar elevation angle and day length, the most impor-tant factors are atmospheric scattering and absorption byclouds, haze, atmospheric chemistry, and surface albedo.Net radiation (the balance between longwave and shortwavefluxes) in the Arctic is strongly positive in the summer andnegative in the winter. The interactions and feedbacks be-tween cloud cover, albedo (percentage of incoming radiationreflected), radiation, sea ice, and snow cover are importantmodulators of the radiation balance and represent key un-certainties in evaluating the role of the Arctic in the globalclimate system. The latent heat flux is near zero in the win-ter, when there is very little capacity for the air to hold mois-ture; in the summer it is usually negative, indicating evapo-ration. The sensible heat flux is a principal component ofthe surface energy balance in the winter over continents asis the conductive flux over the oceans. The conductive fluxdepends on the ice thickness and snow cover and is thecause of the relatively warm temperatures observed overthe frozen oceans.
confirm that the rate of global warming has been greatestover Eurasia and North America between 40°N and 70°N(IPCC 1996a). Arctic research substantiates these observa-tions through direct and indirect indicators of climate change.Sea ice, snow cover, glaciers, tundra, permafrost, boreal for-ests, and peatlands are all responsive to subtle variations insunlight, surface temperature, ocean heat transport, air andocean chemistry, and aerosols in the atmosphere. Comparedwith the rest of the globe, the Arctic climate is very sensitiveto change because of a complex series of interactions andpositive feedback processes among the region’s oceanic andatmospheric circulation patterns, temperature regime, hy-drologic cycle, and sea ice formation (Barry et al. 1993a,Kellogg 1983, Mysak 1995).
Present models of the Arctic climate system suggest thatpositive feedbacks in high-latitude systems amplify anthro-pogenically-induced atmospheric changes and that distur-bances in the circumpolar Arctic climate may substantiallyinfluence global climate (IPCC 1990a, 1992a, 1996a). Theextreme sensitivity of the Arctic’s climatic and ecologicalsystems implies that the Arctic will be profoundly affectedby anthropogenic climate change (Quadfasel et al. 1991,Walsh 1991). Both positive and negative feedbacks compli-cate Arctic climate change, making it difficult to model orpredict. A number of different positive feedbacks have beenidentified for the Arctic. For example, sea ice and snow re-flect a much larger fraction of incident sunlight than waterand soil, so that a reduction of sea ice and snow causes aperturbation in the energy budget, amplifying warming inthe Arctic. This warming is transferred globally and, at thesame time, feeds back regionally to further reduce snow andice extent. Concurrently, as temperature rises the air is ableto hold more moisture which increases the greenhouse ef-fect, adding to the temperature increase. Of course, actualprocesses of climate change are not so simple and dataanalyses reveal conflicting trends in climate and tempera-ture. Other subtle systemic feedback mechanisms whichcould offset the primary feedbacks may be present. In sum-mary, while strong positive feedback mechanisms have beenidentified and are expected to play major roles in climatechange in the future, the complex interactions of these andother environmental feedbacks, both positive and negative,are not fully understood.
Another major factor affecting climate is stratosphericozone. Stratospheric ozone is an important indicator, aswell as an agent, of climate change. Stratospheric cooling,a direct result of what is generally referred to as globalwarming, allows for increased ozone destruction in the Arc-tic. As an absorber of solar radiation, ozone partly controlsthe temperature structure of the atmosphere, influencingdynamical as well as thermal properties of the atmosphere.Ozone depletion is an increasing concern in the Arctic asanomalously low levels of ozone have been recorded in re-cent years. The Scientific Assessment of Ozone Depletion:1994 concluded that ‘Chlorine- and bromine-catalyzedozone loss has been confirmed in the Arctic Winter’ (WMO1995). The destruction of ozone increases UV radiation atthe earth’s surface, making ozone critically important to thewell-being of the biosphere and human health.
The increase in UV has become more significant sinceevidence shows that changes in UV levels due to ozone de-pletion can be large, particularly in spring-time. Elevated UVlevels adversely affect aquatic and terrestrial ecosystems, aswell as humans. A combination of high early-summer bio-logical activity and changes in UV levels makes the Arctic anarea where ozone depletion may have notable effects in thenear future. Many questions remain which need to be ad-

719Chapter 11 · Climate Change, Ozone, and Ultraviolet Radiation
Changes in sea ice extent have a major bearing on the en-ergy related processes between ocean and atmosphere. Thisdependence has been described as sea ice-albedo feedback,i.e. the chain of events following an initial warming of thenear-surface temperatures, a reduction in sea ice, and a sub-sequently enhanced energy transfer from atmosphere to ocean,which leads to further reductions in sea ice. This dependenceis shown in Figure 11·1. A similar process operates oversnow-covered land.
Cloud cover, extent of sea ice, and snow cover can influ-ence the planetary albedo and large-scale albedo gradients,with consequent impacts on atmospheric circulation. As sur-face fluxes of solar and long-wave radiation are strongly in-fluenced by cloud cover, variations in cloudiness affect polarsea ice and snow cover. Along with a direct effect on the ra-diation balance, clouds have an indirect bearing on the sta-bility of the atmospheric boundary layer and thus on thesensible and latent heat fluxes.
11.2.1.2. Trace gas balance
The greenhouse effect, i.e. the warming of the troposphereand the Earth’s surface from the absorption of infrared radi-ation by certain gases, is one of the important forcing mech-anisms of climate. Carbon dioxide (CO2), methane (CH4),nitrous oxide (N2O), tropospheric ozone (O3), and chloro-fluorocarbons (CFCs) are the most important ones, and theiratmospheric abundances have all increased since the last cen-tury. The calculated direct global mean change in the surfaceradiative heat balance is +2.5 W/m2 due to the addition ofthe above gases (O3 not included), without taking any poten-tial feedbacks into consideration (IPCC 1996a). This amountis equal to one percent of the global mean solar radiativeforcing at the surface.
Greenhouse gases are emitted, stored, and absorbed byecosystems on the land and in the oceans as a result of nat-ural processes. The concentrations of these gases can bealtered as a result of industrial development. Long-livedtrace gases (>1 year) have global influences because they areredistributed by transport in the atmosphere. A shorter-livedgas such as ozone has a more regional influence. Because ofgreater atmospheric stability, the concentrations of manytrace gases in the Arctic tend to be somewhat higher in thecold season.
Perturbations to climate in the Arctic may increase theemissions of CO2, CH4, and N2O, which will feed back intothe global forcing of climate. The emissions are influencedby a host of factors, such as soil temperature and moisture,nutrient deposition/loss, snow cover, cloud cover, and sea iceextent. Acting slowly over decades, but no less important tothe trace gas balance, are changes in the species compositionof Arctic ecosystems that are likely to result from climatechange. All of these processes are poorly or incompletely un-derstood. Understanding the complex systems governingtrace gases is crucial to predicting future climate changes.
11.2.1.3. Hydrological cycle
The hydrological cycle of the Arctic encompasses a varietyof components (Figure 11·2) including precipitation, sea ice,river run-off, glaciers, icebergs, clouds, and humidity. Water
A change:temperatures
warm
Sea ice covermelts and
shrinks
Ocean watersabsorb more solar
radiation thanhighly reflective
sea ice
Temperatureswarm
Temperatureswarm
Sea ice covermelts and
shrinks
Figure 11·1. An example of a positive feedback loop. Warming leads to a de-crease in sea ice cover which in turn leads to a decrease in albedo over theocean, the result of which is further warming and further decreases in thesea ice cover. In the reverse situation, if sea ice cover, and hence albedo, wereto increase, the feedback would lead to cooler air temperatures, thus promot-ing greater sea ice cover. In either case, the feedback loops are positive, i.e.the change is amplified by the system feeding-back onto itself. Negative feed-backs help regulate a system causing changes to be moderated or diminished.
R
S
P
R
R
R
II
Ice
Ocean
FLFL
Fc
L cloud
L cloud
L ice L air
TT P
Sun
F: Turbulent heat flux in water ( FL - Latent heat flux due to evaporation and condensation, Fc - Convective flux) I: Absorbed radiation L: Thermal infrared radiationfluxes P: Precipitation R: Albedo (Reflection) S: Solar infrared radiation fluxes T: Net advection of moist static energy.
Ice
Figure 11·2. The hydrologic balance in the Arctic is highly dynamic on the seasonal time scale with large and rapid ice melts in the spring. On land, thisice and snow melting results in large rapid floods and surges in rivers. In the oceans, the ice melt results in large areas of the Arctic becoming availablefor biological growth and activity. On longer time scales, climate change in the Arctic could release glacial waters increasing the present sea level globally.
720 AMAP Assessment Report
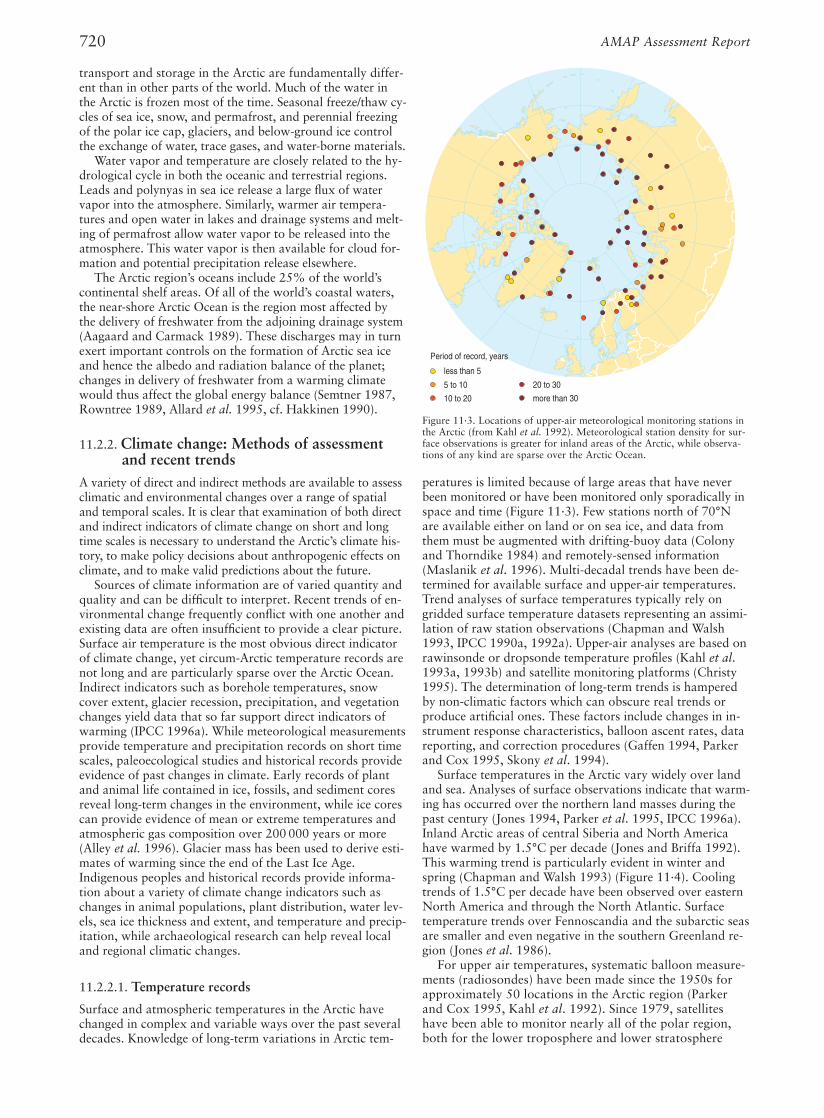
peratures is limited because of large areas that have neverbeen monitored or have been monitored only sporadically inspace and time (Figure 11·3). Few stations north of 70°Nare available either on land or on sea ice, and data fromthem must be augmented with drifting-buoy data (Colonyand Thorndike 1984) and remotely-sensed information(Maslanik et al. 1996). Multi-decadal trends have been de-termined for available surface and upper-air temperatures.Trend analyses of surface temperatures typically rely ongridded surface temperature datasets representing an assimi-lation of raw station observations (Chapman and Walsh1993, IPCC 1990a, 1992a). Upper-air analyses are based onrawinsonde or dropsonde temperature profiles (Kahl et al.1993a, 1993b) and satellite monitoring platforms (Christy1995). The determination of long-term trends is hamperedby non-climatic factors which can obscure real trends orproduce artificial ones. These factors include changes in in-strument response characteristics, balloon ascent rates, datareporting, and correction procedures (Gaffen 1994, Parkerand Cox 1995, Skony et al. 1994).
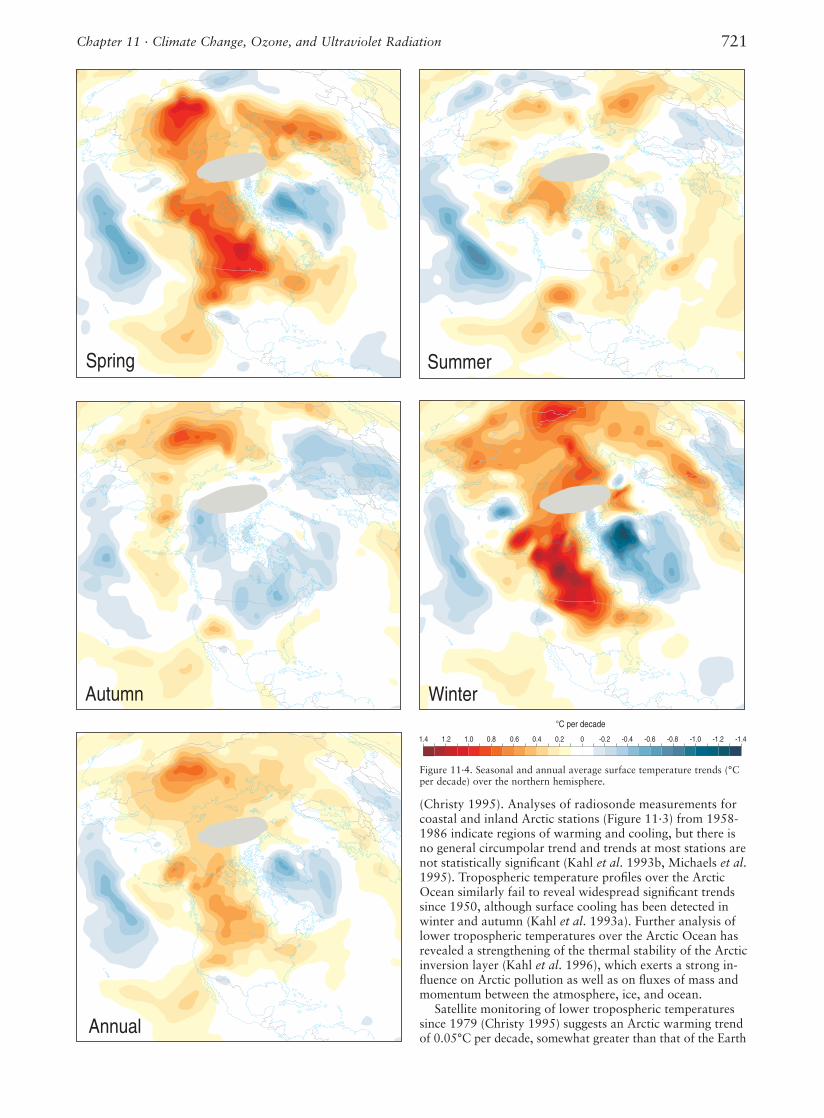
Surface temperatures in the Arctic vary widely over landand sea. Analyses of surface observations indicate that warm-ing has occurred over the northern land masses during thepast century (Jones 1994, Parker et al. 1995, IPCC 1996a).Inland Arctic areas of central Siberia and North Americahave warmed by 1.5°C per decade (Jones and Briffa 1992).This warming trend is particularly evident in winter andspring (Chapman and Walsh 1993) (Figure 11·4). Coolingtrends of 1.5°C per decade have been observed over easternNorth America and through the North Atlantic. Surfacetemperature trends over Fennoscandia and the subarctic seasare smaller and even negative in the southern Greenland re-gion (Jones et al. 1986).
For upper air temperatures, systematic balloon measure-ments (radiosondes) have been made since the 1950s forapproximately 50 locations in the Arctic region (Parkerand Cox 1995, Kahl et al. 1992). Since 1979, satelliteshave been able to monitor nearly all of the polar region,both for the lower troposphere and lower stratosphere
transport and storage in the Arctic are fundamentally differ-ent than in other parts of the world. Much of the water inthe Arctic is frozen most of the time. Seasonal freeze/thaw cy-cles of sea ice, snow, and permafrost, and perennial freezingof the polar ice cap, glaciers, and below-ground ice controlthe exchange of water, trace gases, and water-borne materials.
Water vapor and temperature are closely related to the hy-drological cycle in both the oceanic and terrestrial regions.Leads and polynyas in sea ice release a large flux of watervapor into the atmosphere. Similarly, warmer air tempera-tures and open water in lakes and drainage systems and melt-ing of permafrost allow water vapor to be released into theatmosphere. This water vapor is then available for cloud for-mation and potential precipitation release elsewhere.
The Arctic region’s oceans include 25% of the world’scontinental shelf areas. Of all of the world’s coastal waters,the near-shore Arctic Ocean is the region most affected bythe delivery of freshwater from the adjoining drainage system(Aagaard and Carmack 1989). These discharges may in turnexert important controls on the formation of Arctic sea iceand hence the albedo and radiation balance of the planet;changes in delivery of freshwater from a warming climatewould thus affect the global energy balance (Semtner 1987,Rowntree 1989, Allard et al. 1995, cf. Hakkinen 1990).
11.2.2. Climate change: Methods of assessment and recent trends
A variety of direct and indirect methods are available to assessclimatic and environmental changes over a range of spatialand temporal scales. It is clear that examination of both directand indirect indicators of climate change on short and longtime scales is necessary to understand the Arctic’s climate his-tory, to make policy decisions about anthropogenic effects onclimate, and to make valid predictions about the future.
Sources of climate information are of varied quantity andquality and can be difficult to interpret. Recent trends of en-vironmental change frequently conflict with one another andexisting data are often insufficient to provide a clear picture.Surface air temperature is the most obvious direct indicatorof climate change, yet circum-Arctic temperature records arenot long and are particularly sparse over the Arctic Ocean.Indirect indicators such as borehole temperatures, snowcover extent, glacier recession, precipitation, and vegetationchanges yield data that so far support direct indicators ofwarming (IPCC 1996a). While meteorological measurementsprovide temperature and precipitation records on short timescales, paleoecological studies and historical records provideevidence of past changes in climate. Early records of plantand animal life contained in ice, fossils, and sediment coresreveal long-term changes in the environment, while ice corescan provide evidence of mean or extreme temperatures andatmospheric gas composition over 200 000 years or more(Alley et al. 1996). Glacier mass has been used to derive esti-mates of warming since the end of the Last Ice Age.Indigenous peoples and historical records provide informa-tion about a variety of climate change indicators such aschanges in animal populations, plant distribution, water lev-els, sea ice thickness and extent, and temperature and precip-itation, while archaeological research can help reveal localand regional climatic changes.
11.2.2.1. Temperature records
Surface and atmospheric temperatures in the Arctic havechanged in complex and variable ways over the past severaldecades. Knowledge of long-term variations in Arctic tem-
less than 5
5 to 10
10 to 20 more than 30
20 to 30
Period of record, years
Figure 11·3. Locations of upper-air meteorological monitoring stations inthe Arctic (from Kahl et al. 1992). Meteorological station density for sur-face observations is greater for inland areas of the Arctic, while observa-tions of any kind are sparse over the Arctic Ocean.
721Chapter 11 · Climate Change, Ozone, and Ultraviolet Radiation
(Christy 1995). Analyses of radiosonde measurements forcoastal and inland Arctic stations (Figure 11·3) from 1958-1986 indicate regions of warming and cooling, but there isno general circumpolar trend and trends at most stations arenot statistically significant (Kahl et al. 1993b, Michaels et al.1995). Tropospheric temperature profiles over the ArcticOcean similarly fail to reveal widespread significant trendssince 1950, although surface cooling has been detected inwinter and autumn (Kahl et al. 1993a). Further analysis oflower tropospheric temperatures over the Arctic Ocean hasrevealed a strengthening of the thermal stability of the Arcticinversion layer (Kahl et al. 1996), which exerts a strong in-fluence on Arctic pollution as well as on fluxes of mass andmomentum between the atmosphere, ice, and ocean.
Satellite monitoring of lower tropospheric temperaturessince 1979 (Christy 1995) suggests an Arctic warming trendof 0.05°C per decade, somewhat greater than that of the Earth
Spring
Autumn
Annual
Summer
Winter
0.20.40.60.81.01.21.4 -0.2 -0.4 -0.6 -0.8 -1.0 -1.2 -1.4
°C per decade
0
Figure 11·4. Seasonal and annual average surface temperature trends (°Cper decade) over the northern hemisphere.
722 AMAP Assessment Report
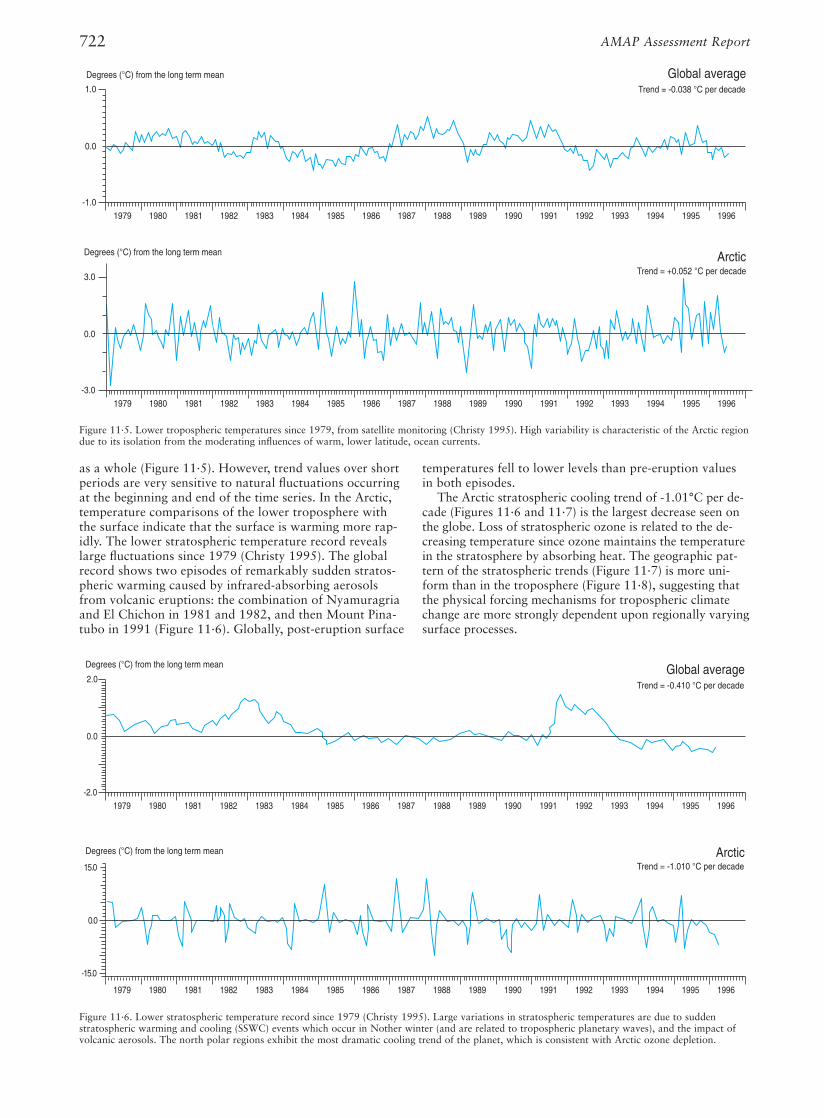
temperatures fell to lower levels than pre-eruption valuesin both episodes.
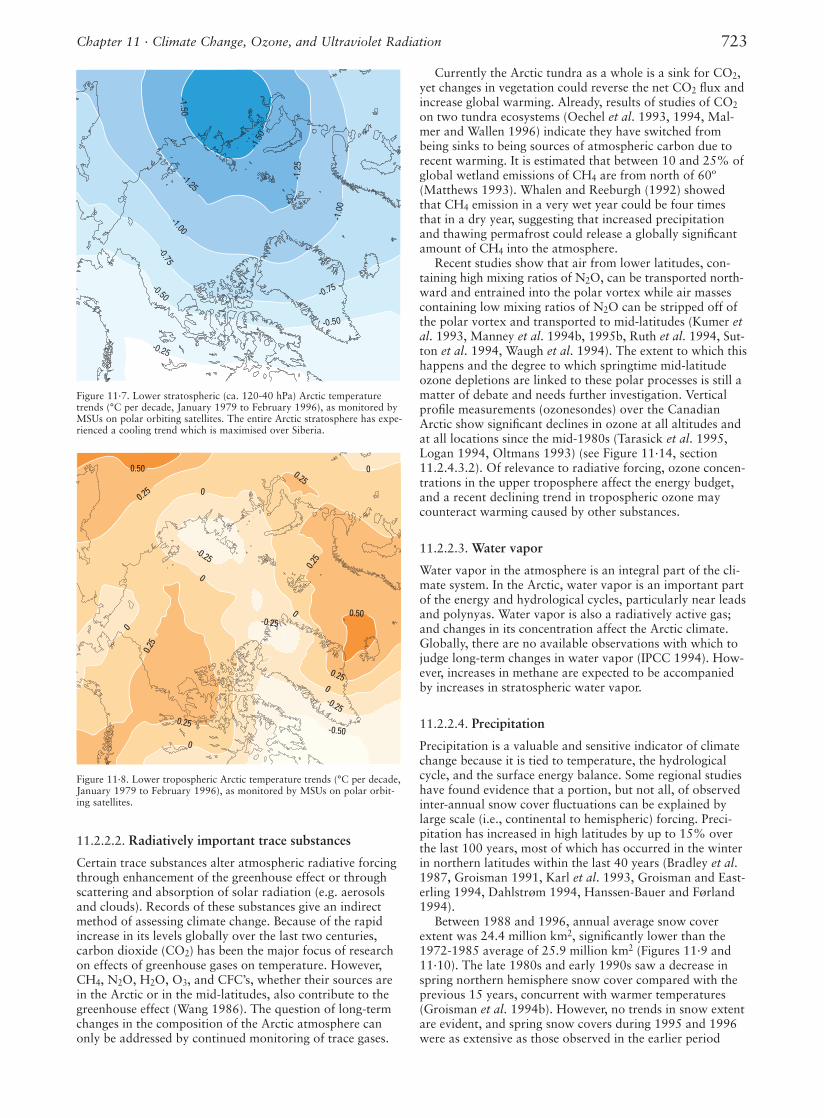
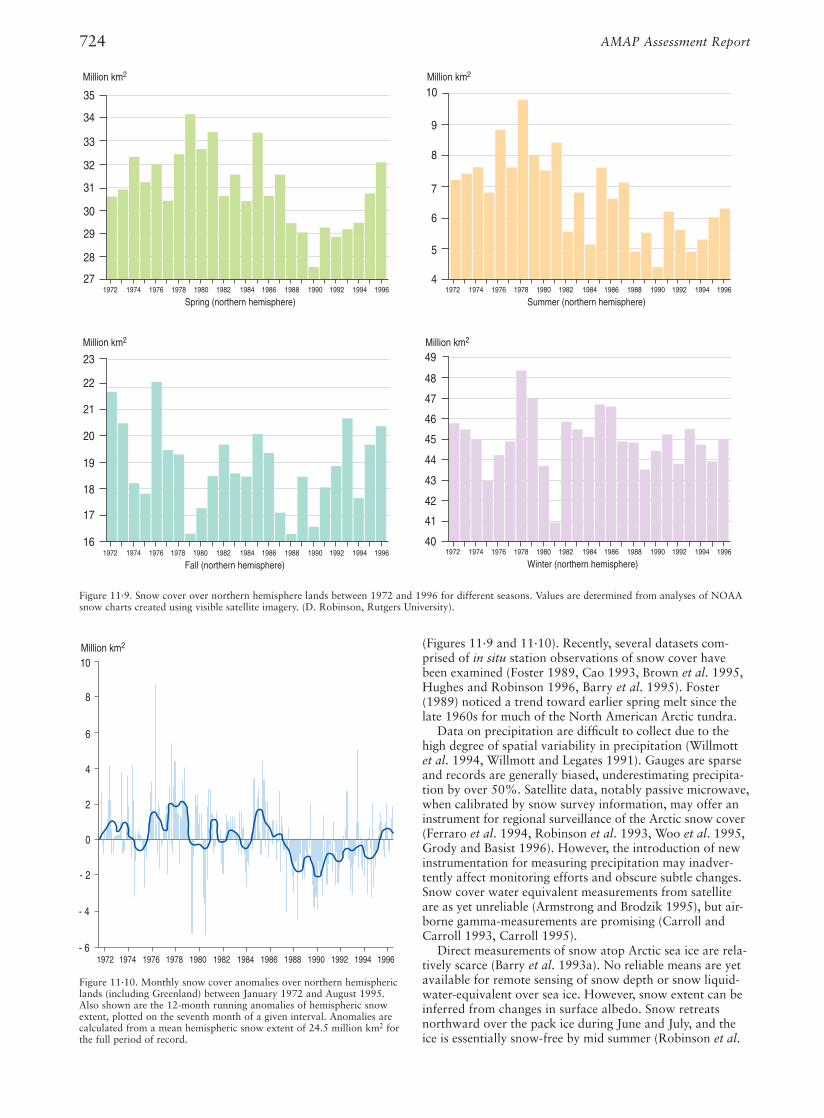
The Arctic stratospheric cooling trend of -1.01°C per de-cade (Figures 11·6 and 11·7) is the largest decrease seen onthe globe. Loss of stratospheric ozone is related to the de-creasing temperature since ozone maintains the temperaturein the stratosphere by absorbing heat. The geographic pat-tern of the stratospheric trends (Figure 11·7) is more uni-form than in the troposphere (Figure 11·8), suggesting thatthe physical forcing mechanisms for tropospheric climatechange are more strongly dependent upon regionally varyingsurface processes.
as a whole (Figure 11·5). However, trend values over shortperiods are very sensitive to natural fluctuations occurringat the beginning and end of the time series. In the Arctic,temperature comparisons of the lower troposphere withthe surface indicate that the surface is warming more rap-idly. The lower stratospheric temperature record revealslarge fluctuations since 1979 (Christy 1995). The globalrecord shows two episodes of remarkably sudden stratos-pheric warming caused by infrared-absorbing aerosolsfrom volcanic eruptions: the combination of Nyamuragriaand El Chichon in 1981 and 1982, and then Mount Pina-tubo in 1991 (Figure 11·6). Globally, post-eruption surface
0.0
-1.0
1.0
1979 1980 1981 1982 1983 1984 1985 1986 1987 1988 1989 1990 1991 1992 1993 1994 1995 1996
0.0
-3.0
3.0
1979 1980 1981 1982 1983 1984 1985 1986 1987 1988 1989 1990 1991 1992 1993 1994 1995 1996
Trend = -0.038 °C per decade
Degrees (°C) from the long term mean Global average
ArcticTrend = +0.052 °C per decade
Degrees (°C) from the long term mean
Figure 11·5. Lower tropospheric temperatures since 1979, from satellite monitoring (Christy 1995). High variability is characteristic of the Arctic regiondue to its isolation from the moderating influences of warm, lower latitude, ocean currents.
0.0
-2.0
2.0
1979 1980 1981 1982 1983 1984 1985 1986 1987 1988 1989 1990 1991 1992 1993 1994 1995 1996
0.0
-15.0
15.0
1979 1980 1981 1982 1983 1984 1985 1986 1987 1988 1989 1990 1991 1992 1993 1994 1995 1996
Trend = -0.410 °C per decade
Global average
ArcticTrend = -1.010 °C per decade
Degrees (°C) from the long term mean
Degrees (°C) from the long term mean
Figure 11·6. Lower stratospheric temperature record since 1979 (Christy 1995). Large variations in stratospheric temperatures are due to suddenstratospheric warming and cooling (SSWC) events which occur in Nother winter (and are related to tropospheric planetary waves), and the impact ofvolcanic aerosols. The north polar regions exhibit the most dramatic cooling trend of the planet, which is consistent with Arctic ozone depletion.
723Chapter 11 · Climate Change, Ozone, and Ultraviolet Radiation
11.2.2.2. Radiatively important trace substances
Certain trace substances alter atmospheric radiative forcingthrough enhancement of the greenhouse effect or throughscattering and absorption of solar radiation (e.g. aerosolsand clouds). Records of these substances give an indirectmethod of assessing climate change. Because of the rapidincrease in its levels globally over the last two centuries,carbon dioxide (CO2) has been the major focus of researchon effects of greenhouse gases on temperature. However,CH4, N2O, H2O, O3, and CFC’s, whether their sources arein the Arctic or in the mid-latitudes, also contribute to thegreenhouse effect (Wang 1986). The question of long-termchanges in the composition of the Arctic atmosphere canonly be addressed by continued monitoring of trace gases.
Currently the Arctic tundra as a whole is a sink for CO2,yet changes in vegetation could reverse the net CO2 flux andincrease global warming. Already, results of studies of CO2on two tundra ecosystems (Oechel et al. 1993, 1994, Mal-mer and Wallen 1996) indicate they have switched frombeing sinks to being sources of atmospheric carbon due torecent warming. It is estimated that between 10 and 25% ofglobal wetland emissions of CH4 are from north of 60º(Matthews 1993). Whalen and Reeburgh (1992) showedthat CH4 emission in a very wet year could be four timesthat in a dry year, suggesting that increased precipitationand thawing permafrost could release a globally significantamount of CH4 into the atmosphere.
Recent studies show that air from lower latitudes, con-taining high mixing ratios of N2O, can be transported north-ward and entrained into the polar vortex while air massescontaining low mixing ratios of N2O can be stripped off ofthe polar vortex and transported to mid-latitudes (Kumer etal. 1993, Manney et al. 1994b, 1995b, Ruth et al. 1994, Sut-ton et al. 1994, Waugh et al. 1994). The extent to which thishappens and the degree to which springtime mid-latitudeozone depletions are linked to these polar processes is still amatter of debate and needs further investigation. Verticalprofile measurements (ozonesondes) over the CanadianArctic show significant declines in ozone at all altitudes andat all locations since the mid-1980s (Tarasick et al. 1995,Logan 1994, Oltmans 1993) (see Figure 11·14, section11.2.4.3.2). Of relevance to radiative forcing, ozone concen-trations in the upper troposphere affect the energy budget,and a recent declining trend in tropospheric ozone maycounteract warming caused by other substances.
11.2.2.3. Water vapor
Water vapor in the atmosphere is an integral part of the cli-mate system. In the Arctic, water vapor is an important partof the energy and hydrological cycles, particularly near leadsand polynyas. Water vapor is also a radiatively active gas;and changes in its concentration affect the Arctic climate.Globally, there are no available observations with which tojudge long-term changes in water vapor (IPCC 1994). How-ever, increases in methane are expected to be accompaniedby increases in stratospheric water vapor.
11.2.2.4. Precipitation
Precipitation is a valuable and sensitive indicator of climatechange because it is tied to temperature, the hydrologicalcycle, and the surface energy balance. Some regional studieshave found evidence that a portion, but not all, of observedinter-annual snow cover fluctuations can be explained bylarge scale (i.e., continental to hemispheric) forcing. Preci-pitation has increased in high latitudes by up to 15% overthe last 100 years, most of which has occurred in the winterin northern latitudes within the last 40 years (Bradley et al.1987, Groisman 1991, Karl et al. 1993, Groisman and East-erling 1994, Dahlstrøm 1994, Hanssen-Bauer and Førland1994).
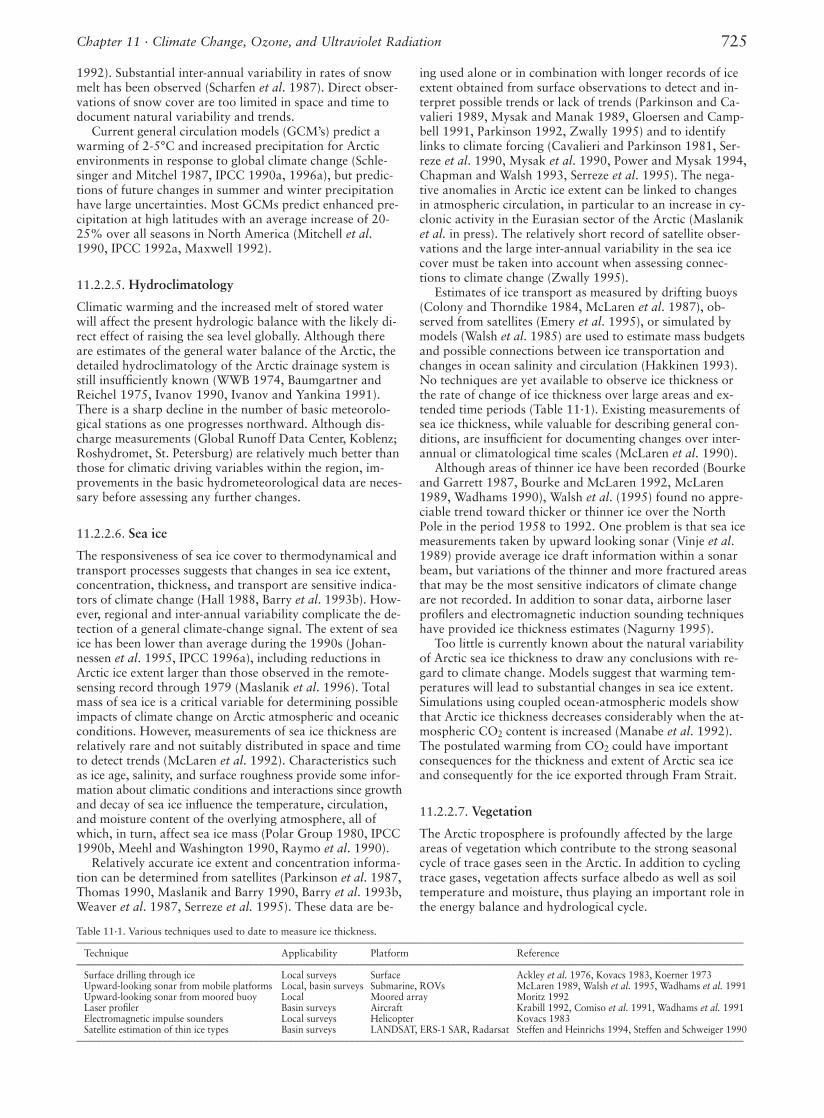
Between 1988 and 1996, annual average snow coverextent was 24.4 million km2, significantly lower than the1972-1985 average of 25.9 million km2 (Figures 11·9 and11·10). The late 1980s and early 1990s saw a decrease inspring northern hemisphere snow cover compared with theprevious 15 years, concurrent with warmer temperatures(Groisman et al. 1994b). However, no trends in snow extentare evident, and spring snow covers during 1995 and 1996were as extensive as those observed in the earlier period
-1.5
0
-1.25
-1.00
-0.75
-0.50
-0.25
-1.50
-1.2
5
-1.0
0
-0.75
-0.50
Figure 11·7. Lower stratospheric (ca. 120-40 hPa) Arctic temperaturetrends (°C per decade, January 1979 to February 1996), as monitored byMSUs on polar orbiting satellites. The entire Arctic stratosphere has expe-rienced a cooling trend which is maximised over Siberia.
00.25
-0.25
0
0.25
0.25
0.50
0.25
0.50
-0.25
-0.50
0
-0.250
0
0
0.25
0.250
Figure 11·8. Lower tropospheric Arctic temperature trends (°C per decade,January 1979 to February 1996), as monitored by MSUs on polar orbit-ing satellites.
724 AMAP Assessment Report
(Figures 11·9 and 11·10). Recently, several datasets com-prised of in situ station observations of snow cover havebeen examined (Foster 1989, Cao 1993, Brown et al. 1995,Hughes and Robinson 1996, Barry et al. 1995). Foster(1989) noticed a trend toward earlier spring melt since thelate 1960s for much of the North American Arctic tundra.
Data on precipitation are difficult to collect due to thehigh degree of spatial variability in precipitation (Willmottet al. 1994, Willmott and Legates 1991). Gauges are sparseand records are generally biased, underestimating precipita-tion by over 50%. Satellite data, notably passive microwave,when calibrated by snow survey information, may offer aninstrument for regional surveillance of the Arctic snow cover(Ferraro et al. 1994, Robinson et al. 1993, Woo et al. 1995,Grody and Basist 1996). However, the introduction of newinstrumentation for measuring precipitation may inadver-tently affect monitoring efforts and obscure subtle changes.Snow cover water equivalent measurements from satelliteare as yet unreliable (Armstrong and Brodzik 1995), but air-borne gamma-measurements are promising (Carroll andCarroll 1993, Carroll 1995).
Direct measurements of snow atop Arctic sea ice are rela-tively scarce (Barry et al. 1993a). No reliable means are yetavailable for remote sensing of snow depth or snow liquid-water-equivalent over sea ice. However, snow extent can beinferred from changes in surface albedo. Snow retreatsnorthward over the pack ice during June and July, and theice is essentially snow-free by mid summer (Robinson et al.
23
20
19
18
17
16
21
22
10
9
8
7
35
34
33
32
27
Million km2
1972
Spring (northern hemisphere)
31
30
29
28
1974 1976 1978 1980 1982 1984 1988 1990 1992 1994 19961986
6
5
41972
Summer (northern hemisphere)1974 1976 1978 1980 1982 1984 1988 1990 1992 1994 19961986
1972
Fall (northern hemisphere)1974 1976 1978 1980 1982 1984 1988 1990 1992 1994 19961986 1972
Winter (northern hemisphere)1974 1976 1978 1980 1982 1984 1988 1990 1992 1994 19961986
49
48
47
46
45
44
43
42
41
40
Million km2
Million km2 Million km2
Figure 11·9. Snow cover over northern hemisphere lands between 1972 and 1996 for different seasons. Values are determined from analyses of NOAAsnow charts created using visible satellite imagery. (D. Robinson, Rutgers University).
- 6
0
2
1972
Million km2
- 4
- 2
4
6
8
10
1974 1976 1978 1980 1982 1984 1986 1988 1990 1992 1994 1996
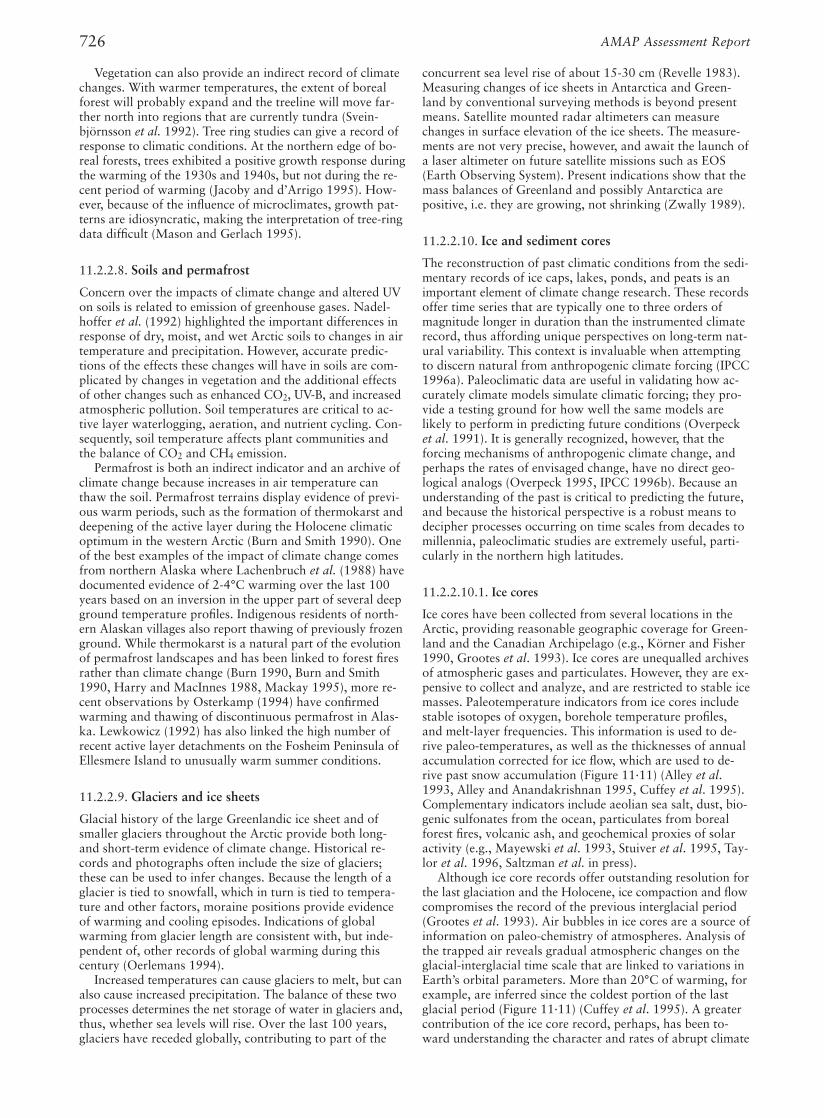
Figure 11·10. Monthly snow cover anomalies over northern hemisphericlands (including Greenland) between January 1972 and August 1995.Also shown are the 12-month running anomalies of hemispheric snowextent, plotted on the seventh month of a given interval. Anomalies arecalculated from a mean hemispheric snow extent of 24.5 million km2 forthe full period of record.
725Chapter 11 · Climate Change, Ozone, and Ultraviolet Radiation
1992). Substantial inter-annual variability in rates of snowmelt has been observed (Scharfen et al. 1987). Direct obser-vations of snow cover are too limited in space and time todocument natural variability and trends.
Current general circulation models (GCM’s) predict awarming of 2-5°C and increased precipitation for Arcticenvironments in response to global climate change (Schle-singer and Mitchel 1987, IPCC 1990a, 1996a), but predic-tions of future changes in summer and winter precipitationhave large uncertainties. Most GCMs predict enhanced pre-cipitation at high latitudes with an average increase of 20-25% over all seasons in North America (Mitchell et al.1990, IPCC 1992a, Maxwell 1992).
11.2.2.5. Hydroclimatology
Climatic warming and the increased melt of stored waterwill affect the present hydrologic balance with the likely di-rect effect of raising the sea level globally. Although thereare estimates of the general water balance of the Arctic, thedetailed hydroclimatology of the Arctic drainage system isstill insufficiently known (WWB 1974, Baumgartner andReichel 1975, Ivanov 1990, Ivanov and Yankina 1991).There is a sharp decline in the number of basic meteorolo-gical stations as one progresses northward. Although dis-charge measurements (Global Runoff Data Center, Koblenz;Roshydromet, St. Petersburg) are relatively much better thanthose for climatic driving variables within the region, im-provements in the basic hydrometeorological data are neces-sary before assessing any further changes.
11.2.2.6. Sea ice
The responsiveness of sea ice cover to thermodynamical andtransport processes suggests that changes in sea ice extent,concentration, thickness, and transport are sensitive indica-tors of climate change (Hall 1988, Barry et al. 1993b). How-ever, regional and inter-annual variability complicate the de-tection of a general climate-change signal. The extent of seaice has been lower than average during the 1990s (Johan-nessen et al. 1995, IPCC 1996a), including reductions inArctic ice extent larger than those observed in the remote-sensing record through 1979 (Maslanik et al. 1996). Totalmass of sea ice is a critical variable for determining possibleimpacts of climate change on Arctic atmospheric and oceanicconditions. However, measurements of sea ice thickness arerelatively rare and not suitably distributed in space and timeto detect trends (McLaren et al. 1992). Characteristics suchas ice age, salinity, and surface roughness provide some infor-mation about climatic conditions and interactions since growthand decay of sea ice influence the temperature, circulation,and moisture content of the overlying atmosphere, all ofwhich, in turn, affect sea ice mass (Polar Group 1980, IPCC1990b, Meehl and Washington 1990, Raymo et al. 1990).
Relatively accurate ice extent and concentration informa-tion can be determined from satellites (Parkinson et al. 1987,Thomas 1990, Maslanik and Barry 1990, Barry et al. 1993b,Weaver et al. 1987, Serreze et al. 1995). These data are be-
ing used alone or in combination with longer records of iceextent obtained from surface observations to detect and in-terpret possible trends or lack of trends (Parkinson and Ca-valieri 1989, Mysak and Manak 1989, Gloersen and Camp-bell 1991, Parkinson 1992, Zwally 1995) and to identifylinks to climate forcing (Cavalieri and Parkinson 1981, Ser-reze et al. 1990, Mysak et al. 1990, Power and Mysak 1994,Chapman and Walsh 1993, Serreze et al. 1995). The nega-tive anomalies in Arctic ice extent can be linked to changesin atmospheric circulation, in particular to an increase in cy-clonic activity in the Eurasian sector of the Arctic (Maslaniket al. in press). The relatively short record of satellite obser-vations and the large inter-annual variability in the sea icecover must be taken into account when assessing connec-tions to climate change (Zwally 1995).
Estimates of ice transport as measured by drifting buoys(Colony and Thorndike 1984, McLaren et al. 1987), ob-served from satellites (Emery et al. 1995), or simulated bymodels (Walsh et al. 1985) are used to estimate mass budgetsand possible connections between ice transportation andchanges in ocean salinity and circulation (Hakkinen 1993).No techniques are yet available to observe ice thickness orthe rate of change of ice thickness over large areas and ex-tended time periods (Table 11·1). Existing measurements ofsea ice thickness, while valuable for describing general con-ditions, are insufficient for documenting changes over inter-annual or climatological time scales (McLaren et al. 1990).
Although areas of thinner ice have been recorded (Bourkeand Garrett 1987, Bourke and McLaren 1992, McLaren1989, Wadhams 1990), Walsh et al. (1995) found no appre-ciable trend toward thicker or thinner ice over the NorthPole in the period 1958 to 1992. One problem is that sea icemeasurements taken by upward looking sonar (Vinje et al.1989) provide average ice draft information within a sonarbeam, but variations of the thinner and more fractured areasthat may be the most sensitive indicators of climate changeare not recorded. In addition to sonar data, airborne laserprofilers and electromagnetic induction sounding techniqueshave provided ice thickness estimates (Nagurny 1995).
Too little is currently known about the natural variabilityof Arctic sea ice thickness to draw any conclusions with re-gard to climate change. Models suggest that warming tem-peratures will lead to substantial changes in sea ice extent.Simulations using coupled ocean-atmospheric models showthat Arctic ice thickness decreases considerably when the at-mospheric CO2 content is increased (Manabe et al. 1992).The postulated warming from CO2 could have importantconsequences for the thickness and extent of Arctic sea iceand consequently for the ice exported through Fram Strait.
11.2.2.7. Vegetation
The Arctic troposphere is profoundly affected by the largeareas of vegetation which contribute to the strong seasonalcycle of trace gases seen in the Arctic. In addition to cyclingtrace gases, vegetation affects surface albedo as well as soiltemperature and moisture, thus playing an important role inthe energy balance and hydrological cycle.
Table 11·1. Various techniques used to date to measure ice thickness.––––––––––––––––––––––––––––––––––––––––––––––––––––––––––––––––––––––––––––––––––––––––––––––––––––––––––––––––––––––––––––––––––––
Technique Applicability Platform Reference––––––––––––––––––––––––––––––––––––––––––––––––––––––––––––––––––––––––––––––––––––––––––––––––––––––––––––––––––––––––––––––––––––
Surface drilling through ice Local surveys Surface Ackley et al. 1976, Kovacs 1983, Koerner 1973Upward-looking sonar from mobile platforms Local, basin surveys Submarine, ROVs McLaren 1989, Walsh et al. 1995, Wadhams et al. 1991Upward-looking sonar from moored buoy Local Moored array Moritz 1992Laser profiler Basin surveys Aircraft Krabill 1992, Comiso et al. 1991, Wadhams et al. 1991Electromagnetic impulse sounders Local surveys Helicopter Kovacs 1983Satellite estimation of thin ice types Basin surveys LANDSAT, ERS-1 SAR, Radarsat Steffen and Heinrichs 1994, Steffen and Schweiger 1990
––––––––––––––––––––––––––––––––––––––––––––––––––––––––––––––––––––––––––––––––––––––––––––––––––––––––––––––––––––––––––––––––––––
726 AMAP Assessment Report
concurrent sea level rise of about 15-30 cm (Revelle 1983).Measuring changes of ice sheets in Antarctica and Green-land by conventional surveying methods is beyond presentmeans. Satellite mounted radar altimeters can measurechanges in surface elevation of the ice sheets. The measure-ments are not very precise, however, and await the launch ofa laser altimeter on future satellite missions such as EOS(Earth Observing System). Present indications show that themass balances of Greenland and possibly Antarctica arepositive, i.e. they are growing, not shrinking (Zwally 1989).
11.2.2.10. Ice and sediment cores
The reconstruction of past climatic conditions from the sedi-mentary records of ice caps, lakes, ponds, and peats is animportant element of climate change research. These recordsoffer time series that are typically one to three orders ofmagnitude longer in duration than the instrumented climaterecord, thus affording unique perspectives on long-term nat-ural variability. This context is invaluable when attemptingto discern natural from anthropogenic climate forcing (IPCC1996a). Paleoclimatic data are useful in validating how ac-curately climate models simulate climatic forcing; they pro-vide a testing ground for how well the same models arelikely to perform in predicting future conditions (Overpecket al. 1991). It is generally recognized, however, that theforcing mechanisms of anthropogenic climate change, andperhaps the rates of envisaged change, have no direct geo-logical analogs (Overpeck 1995, IPCC 1996b). Because anunderstanding of the past is critical to predicting the future,and because the historical perspective is a robust means todecipher processes occurring on time scales from decades tomillennia, paleoclimatic studies are extremely useful, parti-cularly in the northern high latitudes.
11.2.2.10.1. Ice cores
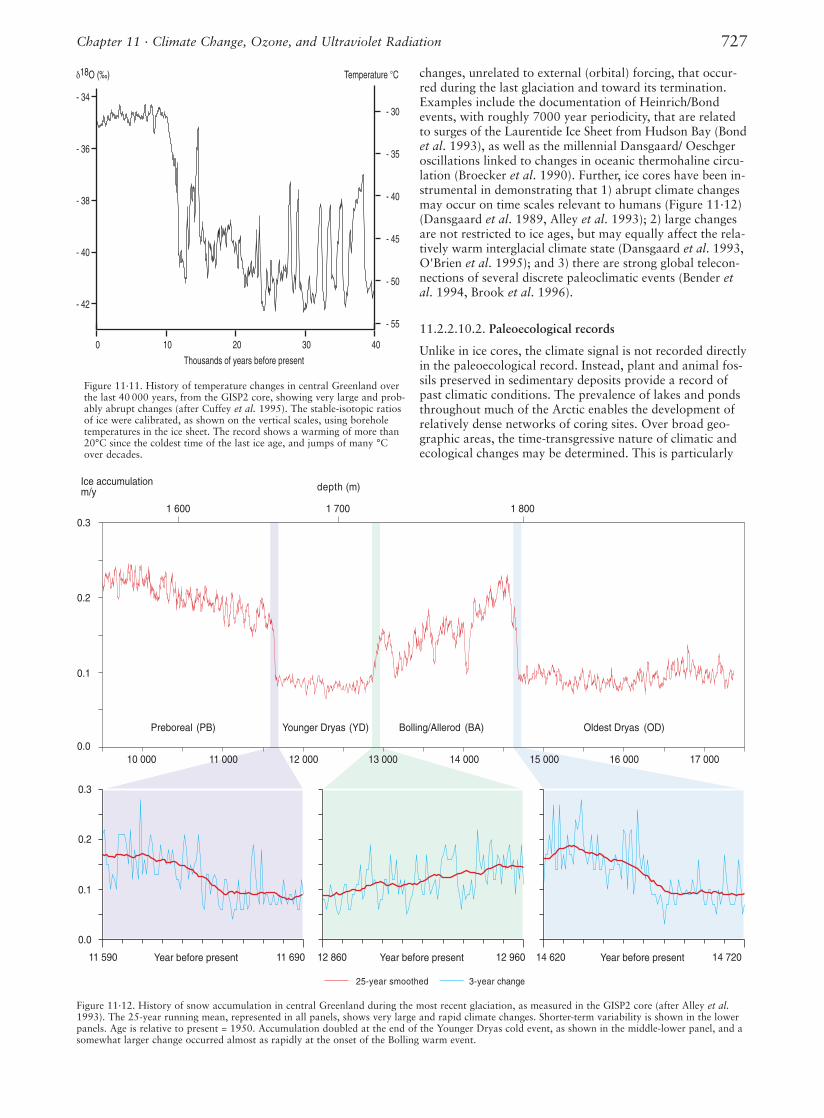
Ice cores have been collected from several locations in theArctic, providing reasonable geographic coverage for Green-land and the Canadian Archipelago (e.g., Körner and Fisher1990, Grootes et al. 1993). Ice cores are unequalled archivesof atmospheric gases and particulates. However, they are ex-pensive to collect and analyze, and are restricted to stable icemasses. Paleotemperature indicators from ice cores includestable isotopes of oxygen, borehole temperature profiles,and melt-layer frequencies. This information is used to de-rive paleo-temperatures, as well as the thicknesses of annualaccumulation corrected for ice flow, which are used to de-rive past snow accumulation (Figure 11·11) (Alley et al.1993, Alley and Anandakrishnan 1995, Cuffey et al. 1995).Complementary indicators include aeolian sea salt, dust, bio-genic sulfonates from the ocean, particulates from borealforest fires, volcanic ash, and geochemical proxies of solaractivity (e.g., Mayewski et al. 1993, Stuiver et al. 1995, Tay-lor et al. 1996, Saltzman et al. in press).
Although ice core records offer outstanding resolution forthe last glaciation and the Holocene, ice compaction and flowcompromises the record of the previous interglacial period(Grootes et al. 1993). Air bubbles in ice cores are a source ofinformation on paleo-chemistry of atmospheres. Analysis ofthe trapped air reveals gradual atmospheric changes on theglacial-interglacial time scale that are linked to variations inEarth’s orbital parameters. More than 20°C of warming, forexample, are inferred since the coldest portion of the lastglacial period (Figure 11·11) (Cuffey et al. 1995). A greatercontribution of the ice core record, perhaps, has been to-ward understanding the character and rates of abrupt climate
Vegetation can also provide an indirect record of climatechanges. With warmer temperatures, the extent of borealforest will probably expand and the treeline will move far-ther north into regions that are currently tundra (Svein-björnsson et al. 1992). Tree ring studies can give a record ofresponse to climatic conditions. At the northern edge of bo-real forests, trees exhibited a positive growth response duringthe warming of the 1930s and 1940s, but not during the re-cent period of warming (Jacoby and d’Arrigo 1995). How-ever, because of the influence of microclimates, growth pat-terns are idiosyncratic, making the interpretation of tree-ringdata difficult (Mason and Gerlach 1995).
11.2.2.8. Soils and permafrost
Concern over the impacts of climate change and altered UVon soils is related to emission of greenhouse gases. Nadel-hoffer et al. (1992) highlighted the important differences inresponse of dry, moist, and wet Arctic soils to changes in airtemperature and precipitation. However, accurate predic-tions of the effects these changes will have in soils are com-plicated by changes in vegetation and the additional effectsof other changes such as enhanced CO2, UV-B, and increasedatmospheric pollution. Soil temperatures are critical to ac-tive layer waterlogging, aeration, and nutrient cycling. Con-sequently, soil temperature affects plant communities andthe balance of CO2 and CH4 emission.
Permafrost is both an indirect indicator and an archive ofclimate change because increases in air temperature canthaw the soil. Permafrost terrains display evidence of previ-ous warm periods, such as the formation of thermokarst anddeepening of the active layer during the Holocene climaticoptimum in the western Arctic (Burn and Smith 1990). Oneof the best examples of the impact of climate change comesfrom northern Alaska where Lachenbruch et al. (1988) havedocumented evidence of 2-4°C warming over the last 100years based on an inversion in the upper part of several deepground temperature profiles. Indigenous residents of north-ern Alaskan villages also report thawing of previously frozenground. While thermokarst is a natural part of the evolutionof permafrost landscapes and has been linked to forest firesrather than climate change (Burn 1990, Burn and Smith1990, Harry and MacInnes 1988, Mackay 1995), more re-cent observations by Osterkamp (1994) have confirmedwarming and thawing of discontinuous permafrost in Alas-ka. Lewkowicz (1992) has also linked the high number ofrecent active layer detachments on the Fosheim Peninsula ofEllesmere Island to unusually warm summer conditions.
11.2.2.9. Glaciers and ice sheets
Glacial history of the large Greenlandic ice sheet and ofsmaller glaciers throughout the Arctic provide both long-and short-term evidence of climate change. Historical re-cords and photographs often include the size of glaciers;these can be used to infer changes. Because the length of aglacier is tied to snowfall, which in turn is tied to tempera-ture and other factors, moraine positions provide evidenceof warming and cooling episodes. Indications of globalwarming from glacier length are consistent with, but inde-pendent of, other records of global warming during thiscentury (Oerlemans 1994).
Increased temperatures can cause glaciers to melt, but canalso cause increased precipitation. The balance of these twoprocesses determines the net storage of water in glaciers and,thus, whether sea levels will rise. Over the last 100 years,glaciers have receded globally, contributing to part of the
727Chapter 11 · Climate Change, Ozone, and Ultraviolet Radiation
changes, unrelated to external (orbital) forcing, that occur-red during the last glaciation and toward its termination.Examples include the documentation of Heinrich/Bondevents, with roughly 7000 year periodicity, that are relatedto surges of the Laurentide Ice Sheet from Hudson Bay (Bondet al. 1993), as well as the millennial Dansgaard/ Oeschgeroscillations linked to changes in oceanic thermohaline circu-lation (Broecker et al. 1990). Further, ice cores have been in-strumental in demonstrating that 1) abrupt climate changesmay occur on time scales relevant to humans (Figure 11·12)(Dansgaard et al. 1989, Alley et al. 1993); 2) large changesare not restricted to ice ages, but may equally affect the rela-tively warm interglacial climate state (Dansgaard et al. 1993,O'Brien et al. 1995); and 3) there are strong global telecon-nections of several discrete paleoclimatic events (Bender etal. 1994, Brook et al. 1996).
11.2.2.10.2. Paleoecological records
Unlike in ice cores, the climate signal is not recorded directlyin the paleoecological record. Instead, plant and animal fos-sils preserved in sedimentary deposits provide a record ofpast climatic conditions. The prevalence of lakes and pondsthroughout much of the Arctic enables the development ofrelatively dense networks of coring sites. Over broad geo-graphic areas, the time-transgressive nature of climatic andecological changes may be determined. This is particularly
- 42
- 40
- 38
- 36
- 34- 30
- 35
- 40
- 45
- 50
- 55
0 10 20 30 40
Thousands of years before present
δ18O (‰) Temperature °C
1 600 1 700 1 8000.3
0.2
0.1
0.010 000 11 000 12 000 14 000 15 000 16 00013 000 17 000
depth (m)Ice accumulationm/y
0.3
0.2
0.1
0.0
11 590 11 690 12 860 14 620 14 72012 960Year before present
Preboreal (PB) Younger Dryas (YD) Bolling/Allerod (BA) Oldest Dryas (OD)
25-year smoothed 3-year change
Year before present Year before present
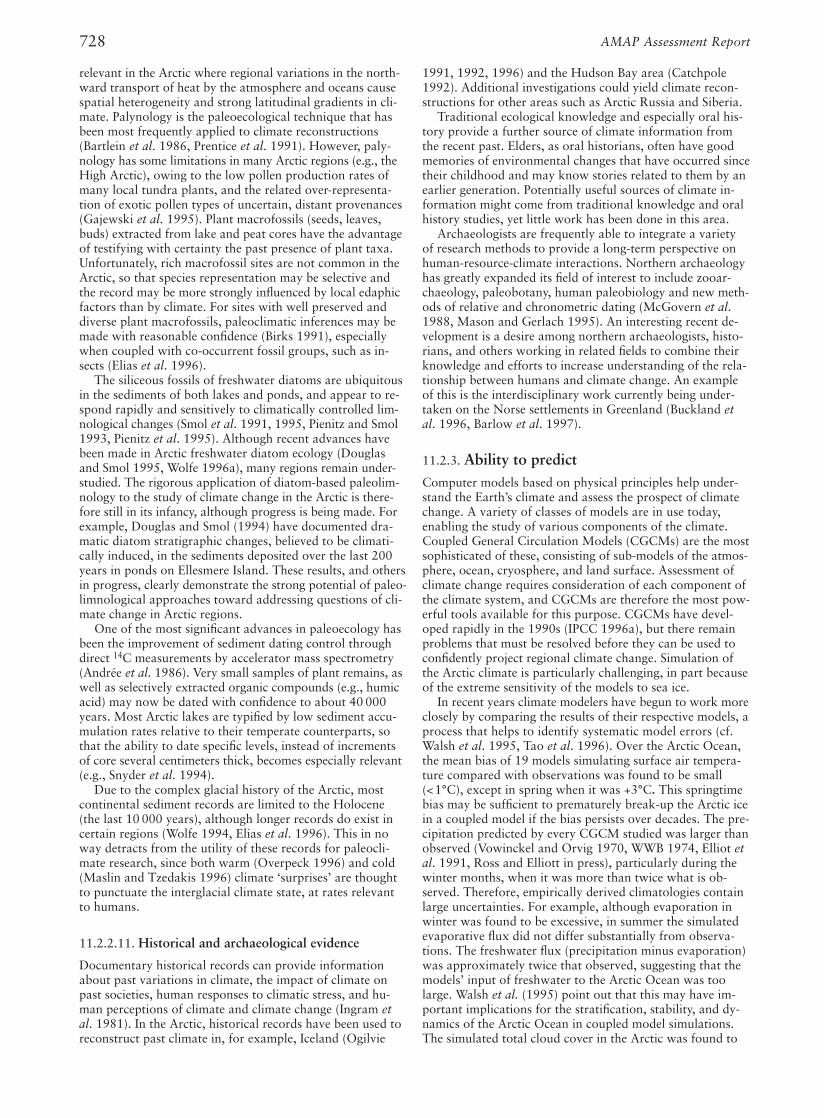
Figure 11·12. History of snow accumulation in central Greenland during the most recent glaciation, as measured in the GISP2 core (after Alley et al.1993). The 25-year running mean, represented in all panels, shows very large and rapid climate changes. Shorter-term variability is shown in the lowerpanels. Age is relative to present = 1950. Accumulation doubled at the end of the Younger Dryas cold event, as shown in the middle-lower panel, and asomewhat larger change occurred almost as rapidly at the onset of the Bolling warm event.
Figure 11·11. History of temperature changes in central Greenland overthe last 40 000 years, from the GISP2 core, showing very large and prob-ably abrupt changes (after Cuffey et al. 1995). The stable-isotopic ratiosof ice were calibrated, as shown on the vertical scales, using boreholetemperatures in the ice sheet. The record shows a warming of more than20°C since the coldest time of the last ice age, and jumps of many °Cover decades.
728 AMAP Assessment Report
1991, 1992, 1996) and the Hudson Bay area (Catchpole1992). Additional investigations could yield climate recon-structions for other areas such as Arctic Russia and Siberia.
Traditional ecological knowledge and especially oral his-tory provide a further source of climate information fromthe recent past. Elders, as oral historians, often have goodmemories of environmental changes that have occurred sincetheir childhood and may know stories related to them by anearlier generation. Potentially useful sources of climate in-formation might come from traditional knowledge and oralhistory studies, yet little work has been done in this area.
Archaeologists are frequently able to integrate a varietyof research methods to provide a long-term perspective onhuman-resource-climate interactions. Northern archaeologyhas greatly expanded its field of interest to include zooar-chaeology, paleobotany, human paleobiology and new meth-ods of relative and chronometric dating (McGovern et al.1988, Mason and Gerlach 1995). An interesting recent de-velopment is a desire among northern archaeologists, histo-rians, and others working in related fields to combine theirknowledge and efforts to increase understanding of the rela-tionship between humans and climate change. An exampleof this is the interdisciplinary work currently being under-taken on the Norse settlements in Greenland (Buckland etal. 1996, Barlow et al. 1997).
11.2.3. Ability to predictComputer models based on physical principles help under-stand the Earth’s climate and assess the prospect of climatechange. A variety of classes of models are in use today,enabling the study of various components of the climate.Coupled General Circulation Models (CGCMs) are the mostsophisticated of these, consisting of sub-models of the atmos-phere, ocean, cryosphere, and land surface. Assessment ofclimate change requires consideration of each component ofthe climate system, and CGCMs are therefore the most pow-erful tools available for this purpose. CGCMs have devel-oped rapidly in the 1990s (IPCC 1996a), but there remainproblems that must be resolved before they can be used toconfidently project regional climate change. Simulation ofthe Arctic climate is particularly challenging, in part becauseof the extreme sensitivity of the models to sea ice.
In recent years climate modelers have begun to work moreclosely by comparing the results of their respective models, aprocess that helps to identify systematic model errors (cf.Walsh et al. 1995, Tao et al. 1996). Over the Arctic Ocean,the mean bias of 19 models simulating surface air tempera-ture compared with observations was found to be small(<1°C), except in spring when it was +3°C. This springtimebias may be sufficient to prematurely break-up the Arctic icein a coupled model if the bias persists over decades. The pre-cipitation predicted by every CGCM studied was larger thanobserved (Vowinckel and Orvig 1970, WWB 1974, Elliot etal. 1991, Ross and Elliott in press), particularly during thewinter months, when it was more than twice what is ob-served. Therefore, empirically derived climatologies containlarge uncertainties. For example, although evaporation inwinter was found to be excessive, in summer the simulatedevaporative flux did not differ substantially from observa-tions. The freshwater flux (precipitation minus evaporation)was approximately twice that observed, suggesting that themodels’ input of freshwater to the Arctic Ocean was toolarge. Walsh et al. (1995) point out that this may have im-portant implications for the stratification, stability, and dy-namics of the Arctic Ocean in coupled model simulations.The simulated total cloud cover in the Arctic was found to
relevant in the Arctic where regional variations in the north-ward transport of heat by the atmosphere and oceans causespatial heterogeneity and strong latitudinal gradients in cli-mate. Palynology is the paleoecological technique that hasbeen most frequently applied to climate reconstructions(Bartlein et al. 1986, Prentice et al. 1991). However, paly-nology has some limitations in many Arctic regions (e.g., theHigh Arctic), owing to the low pollen production rates ofmany local tundra plants, and the related over-representa-tion of exotic pollen types of uncertain, distant provenances(Gajewski et al. 1995). Plant macrofossils (seeds, leaves,buds) extracted from lake and peat cores have the advantageof testifying with certainty the past presence of plant taxa.Unfortunately, rich macrofossil sites are not common in theArctic, so that species representation may be selective andthe record may be more strongly influenced by local edaphicfactors than by climate. For sites with well preserved anddiverse plant macrofossils, paleoclimatic inferences may bemade with reasonable confidence (Birks 1991), especiallywhen coupled with co-occurrent fossil groups, such as in-sects (Elias et al. 1996).
The siliceous fossils of freshwater diatoms are ubiquitousin the sediments of both lakes and ponds, and appear to re-spond rapidly and sensitively to climatically controlled lim-nological changes (Smol et al. 1991, 1995, Pienitz and Smol1993, Pienitz et al. 1995). Although recent advances havebeen made in Arctic freshwater diatom ecology (Douglasand Smol 1995, Wolfe 1996a), many regions remain under-studied. The rigorous application of diatom-based paleolim-nology to the study of climate change in the Arctic is there-fore still in its infancy, although progress is being made. Forexample, Douglas and Smol (1994) have documented dra-matic diatom stratigraphic changes, believed to be climati-cally induced, in the sediments deposited over the last 200years in ponds on Ellesmere Island. These results, and othersin progress, clearly demonstrate the strong potential of paleo-limnological approaches toward addressing questions of cli-mate change in Arctic regions.
One of the most significant advances in paleoecology hasbeen the improvement of sediment dating control throughdirect 14C measurements by accelerator mass spectrometry(Andrée et al. 1986). Very small samples of plant remains, aswell as selectively extracted organic compounds (e.g., humicacid) may now be dated with confidence to about 40 000years. Most Arctic lakes are typified by low sediment accu-mulation rates relative to their temperate counterparts, sothat the ability to date specific levels, instead of incrementsof core several centimeters thick, becomes especially relevant(e.g., Snyder et al. 1994).
Due to the complex glacial history of the Arctic, mostcontinental sediment records are limited to the Holocene(the last 10 000 years), although longer records do exist incertain regions (Wolfe 1994, Elias et al. 1996). This in noway detracts from the utility of these records for paleocli-mate research, since both warm (Overpeck 1996) and cold(Maslin and Tzedakis 1996) climate ‘surprises’ are thoughtto punctuate the interglacial climate state, at rates relevantto humans.
11.2.2.11. Historical and archaeological evidence
Documentary historical records can provide informationabout past variations in climate, the impact of climate onpast societies, human responses to climatic stress, and hu-man perceptions of climate and climate change (Ingram etal. 1981). In the Arctic, historical records have been used toreconstruct past climate in, for example, Iceland (Ogilvie

729Chapter 11 · Climate Change, Ozone, and Ultraviolet Radiation
vary tremendously from one model to the next. During thesummer, for example, the cloud cover was found to varyfrom 30% to more than 90%. Finally, in most models thesnow depth of Greenland was not in equilibrium, because ineach successive year of a 10-year simulation there was moresnowfall than the sum of evaporation and melting.
From the studies of Walsh et al. (1995) and Tao et al.(1996) it is clear that state-of-the-art atmospheric modelsdo not adequately simulate the present Arctic climate.Improvements in models will be necessary before they canproduce credible predictions regarding future temperatures,circulation patterns, or consequent ozone concentrations.Efforts are underway to more closely study CGCM simula-tions and improve the understanding of coupled model sim-ulations. Further development of atmosphere, ocean, cryo-sphere, and land surface models are all high priority effortsin the climate community, as it is clear that advancements ineach are vital to the development of the coupled climatemodels used to understand the prospects of climate changein the polar regions.
11.2.4. Components of the ArcticThe Arctic climate system is one of the most complex anddynamic climate systems on the earth. The strong interac-tions between various components make understanding theArctic, and therefore predicting future changes, extremelycomplex. Each component is dynamically tied to the othercomponents through energy, water, and trace gases exchange.
11.2.4.1. Oceanic regime
The Arctic Ocean influences global climate change throughits effects on surface heat balance and thermohaline circula-tion in the Arctic Basin (Aagaard and Carmack 1994). Bothprocesses are closely linked to the salinity structure and seaice cover of the Arctic Ocean. The atmosphere-ocean ex-change of energy and matter, which is strongly modified bythe presence or absence of sea ice, controls the flow of heatand water vapor from low to high latitude regions. In addi-tion, the presence of sea ice and its associated snow coversignificantly affects the surface albedo and radiation budget.Any discussion of climate change must include considerationof salinity (cf. Rooth 1982), sea ice (cf. Lange et al. 1990),and the Arctic Ocean circulation (cf. Stigebrandt 1981, Aa-gaard and Carmack 1994).
11.2.4.1.1. Ocean stratification and water circulation
Water tends to evaporate in regions where temperatures arehigh and condense in regions where temperatures are low.For this simple reason, the cold polar oceans maintain fresh-ened surface waters floating over more saline deep waters.Through brine rejection, freezing serves to further separatesalt and fresh water, acting as the high-latitude counterpartto evaporation (Aagaard and Carmack 1989, Macdonaldand Carmack 1991). This basic stratification acts to inhibitthermally forced convection and thus is a dominant factorcontrolling ice cover, surface albedo, and material transportin high-latitude oceans. Changes in freshwater flux to theoceans associated with melting ice and other environmentalchanges could trigger large and abrupt climatic changes(Broecker 1994, Alley 1995). Sea level rise of 1-2 mm peryear in restricted and sensitive regions of the North Atlanticfrom melting of land ice is nearly as big as the freshwaterfluxes modeled to cause major reductions of deepwater for-mation (Rahmstorf 1995). Reductions in deep water forma-
tion in the North Atlantic would have a direct impact on cli-mates throughout the rest of the world.
The principal waters entering the Arctic Ocean are therelatively warm and saline waters from the Atlantic viaFram Strait and the Barents Sea and the relatively fresh wa-ters from the North Pacific via Bering Strait. These watersflow in a counterclockwise direction around the four majorbasins where they are subsequently modified by air/sea/iceinteractions, river inflow, and exchange with surroundingshelf regions. The large volume of relatively fresh waterstored in the upper 200-300 m of the Arctic Ocean reflectsinputs from river inflow, sea-ice melt, net precipitation, andthe inflow of Pacific water (Aagaard and Carmack 1989,Treshnikov 1985, Macdonald and Bewers 1996).
Underneath the surface mixed layer is a cold isothermallayer with markedly increasing salinity called the Arctichalocline. This halocline layer overlies warm Atlantic water,and inhibits convection, which would otherwise release heatfrom the Atlantic layer and hinder ice formation in the Arc-tic (Aagaard et al. 1981, Melling and Lewis 1982, Wallaceet al. 1987). The halocline is weaker in the eastern Arcticthan in the western Arctic which is more strongly affectedby low-salinity Pacific waters. Thickness and horizontal ex-tent of the halocline layer also affects the areal extent of sea-ice cover, and thus has direct implications for climate. Re-cent observations suggest that the boundary between thesetwo regimes may move across ridge systems in the vicinity ofthe Lomonosov Ridge (McLaughlin et al. 1996).
Salinity distributions dominate the density structure with-in the Arctic Ocean, and thus determine the large-scale ther-mohaline flow (Aagaard et al. 1985, Coachman and Aagaard1974, Semtner 1987, Hakkinen 1993). Pathways of flow arecreated by salinity-dominated buoyancy fluxes (both positiveand negative) around the basin perimeter (Gawarkiewiczand Chapman 1995). Fresh water components, such asbrackish seawater and ice, exit the Arctic Ocean throughFram and Davis straits into the North Atlantic, where theymay supply buoyancy to the upper ocean, slow the rate ofdeepwater formation, and thus impact the global thermoha-line circulation by affecting rates of water mass transforma-tion in the Greenland, Iceland, and Labrador Seas (Dicksonet al. 1988, Aagaard and Carmack 1989). The thermohalinecirculation is, in turn, responsible for as much as half of theEarth’s poleward heat transport, affecting all aspects ofglobal climate (Broecker et al. 1985a).
The formation of deep water in the North Atlantic, andmore specifically in the basins of the Greenland, Icelandic,and Norwegian Seas (Nordic Seas), is a major component ofglobal oceanic circulation. This is one of only three places inthe world’s oceans where an exchange between warm, less-saline water and deeper, more-saline water takes place. Thus,the existence and strength of this exchange has major conse-quences for the world ocean and the marine biosphere, asdeep water formation enables entrainment and transport ofoxygen and nutrients to deeper parts of the world ocean.The traces of this entrainment can be seen well beyond theequatorial region of the Atlantic.
The importance of deep water formation and related pro-cesses in the Nordic Seas goes beyond the oceanic regime. Italso controls the strength and geometry of thermohaline cir-culation in the North Atlantic and basically controls theamount of warm water exported by the Gulf Stream to north-ern Europe and into the Barents Sea. Thus, climate condi-tions in northern Europe depend on and may be changed byalterations in deep water formation in the North Atlantic.
The convective processes in the Nordic Seas occur in dif-ferent stable configurations, each of which is accompanied
730 AMAP Assessment Report
with synoptic systems can significantly advect pack ice (e.g.,Dey 1980) at roughly 2% of the surface wind speed, pro-duce coastal polynyas (Pease 1987), and affect the organiza-tion and fractional coverage of leads (e.g., Walter and Over-land 1993).
Leads and polynyasLeads and polynyas exert a prevalent and immediate effecton the surface energy balance as well as the hydrologicalcycle. They are often locations of plankton blooms and feed-ing areas for marine mammals. Inuit continue to use bothleads and polynyas for hunting marine mammals as theyhave for the past three millennia (Schledermann 1980).
Leads are long, roughly linear openings, or breaks, in thepack ice caused by variations in the wind stress. They rangein width from a few meters to a few kilometers and in lengthfrom a few kilometers to hundreds of kilometers. In the cen-tral Arctic the areas of open water and thin ice, or the effec-tive lead fraction, averages about 3% in the winter andspring, rising to 6% in the summer (Lindsay and Rothrock1994). The effective lead fraction in the peripheral seas wasfound to be between 5% and 10% in the winter, while in thesummer the peripheral seas are often ice free. In the summer,open water is much more prevalent, occupying as much as10% of the area in the interior of the pack, although there islittle or no temperature differential between the ice and theopen water.
The effect of leads on the surface energy balance occursdue to the large difference in albedo between thick ice andopen water or thin ice in leads, and to the large contrastspossible between lead surface temperatures and the overly-ing air. In winter, open water has a temperature of –1.8°C,as much as 40°C or more warmer than the surrounding iceand atmosphere. The sensible heat flux from the open wateris high, and the open water in a lead often freezes withinhours of the lead’s formation. In the winter, the sensible heatflux changes sign, from roughly 10 or 20 W/m2 downwardover thick ice to as much as 500 W/m2 upward over openwater with high winds (Andreas and Murphy 1986). Thesensible heat flux from leads is sometimes enough to changethe sign of the regional-average sensible heat flux from a netdownward flux to a net upward flux. In a warming climatethis can have important ramifications in the structure of theatmospheric boundary layer, which becomes unstably strati-fied instead of being stably stratified (Serreze et al. 1992).
Cloud plumes originating from leads are often observedin satellite images. Leads are a vast source of moisture forthe atmosphere. While they may not provide enough to in-crease snowfall, they can significantly increase cloud cover.An increase in effective lead area from climatic warming islikely to increase cloud cover in the Arctic.
Polynyas are larger regions of thin ice or open water thatoccur repeatedly in similar locations throughout the polarwinter. Changes in air temperature will impact their size andlocation and the magnitude of their influence on ocean cir-culation, ice formation, and the energy balance. Polynyasare maintained by divergence in the ice drift or melt fromoceanic heat flux, and they range in size from a few hundredsquare meters to hundreds of square kilometers (Smith et al.1990). Common locations are on the lee sides of islands orpeninsulas or at the edge of fast ice. In both cases, windblows the ice away from the open-water area, maintainingthe polynya. The near-surface air temperature is much warm-er over the polynya than over the surrounding ice, yet muchcolder than the surface water temperature. Thus polynyaswill drive a strong sensible heat flux from the water that canamount to a few hundred W/m2. Polynyas are large sources
by significantly different climatic conditions in northernEurope and the European Arctic. If, however, the conditionof the warm water is changed, e.g. through a lesser salt con-tent or even higher water temperature (an expected conse-quence of climatic warming), a major part of the convectivesystem in the Nordic Seas breaks down. This leads to a de-crease in the magnitude of thermohaline convection, i.e. adecrease in warm water flow to the North Atlantic, and apossible enlargement of the southward extent of sea ice.The balance leading to one or the other of the stable condi-tions is extremely fragile and can be considered as a ‘switch’for northern European climate. It is hypothesized that alter-ations in this balance in the past have led to short-term changesin regional climate such as that during the Younger Dryas.
11.2.4.1.2. Sea ice
Sea ice is one of the defining properties of the Arctic oceans;it affects the biosphere, human populations, the energy bal-ance, and water vapor exchange between the ocean and theatmosphere. The Arctic Ocean sea ice cover is a mass of dif-ferent amounts and concentrations of ice of various ages,surface characteristics, and properties. It extends over about15 �106 km2 of the ocean in winter but shrinks to 8 �106
km2 in summer (Gloersen et al. 1992). Regional variationsin open water within the sea ice cover contribute signifi-cantly to modifying ocean salinity (Martin and Cavalieri1989) and heat and moisture fluxes into the atmosphere(LeDrew et al. 1991).
One of the major characteristics of sea ice in the polarseas is its seasonal variation in thickness and extent. The an-nual cycle of sea ice growth and decay is a driver of tempera-ture and salinity variations in the upper layers of the ArcticOcean. The structure of sea ice largely reflects its evolution.The presence of brine creates an ice microstructure which isvery sensitive to temperature changes, resulting in large sea-sonal variations within the ice that directly affect such prop-erties as strength, thermal conductivity, albedo, microwaveemissivity and optical extinction (Weeks and Ackley 1982).For example, in midwinter leads, the brine released down-ward from rapidly growing thin ice induces and intensifiesthermohaline circulation in the mixed layer (Carmack 1986);brine rejected upward toward the surface of the ice affectsits brightness, temperature, and other microwave properties.
Sea ice modulates the energy exchange between the oceanbelow and atmosphere above, effectively insulating the oceanfrom the atmosphere. Sea ice mass balance is determined bycalculating ice extent, concentration, thickness, and motionover time (Thorndike et al. 1992). The mass of sea ice con-tributes most of the fresh water supplied to the GreenlandSea and thereby impacts deep convection, bottom water for-mation, and global thermohaline circulation. Climatic warm-ing could lead to a decrease in both the thickness and theareal extent of sea ice, significantly affecting ocean heatingand the ocean-atmosphere heat flux at high latitudes.
Changes in climate variables other than temperature canalso directly act upon sea ice. Drag forces exerted by surfacewind on the sea ice act upon atmosphere-sea ice interac-tions. Surface winds are mostly responsible for the smallerscale motion of the sea ice cover, while large scale geo-strophic circulation patterns account for about half of thelarge scale motion of sea ice; the other half is influenced byocean circulation (Thorndike and Colony 1982). The majordrift patterns of Arctic sea ice and its mean velocities arecharacterized by a linear component (the Transpolar Drift)and a circular movement pattern (the Beaufort Gyre). Ontime scales of days, the winds and their changes associated

731Chapter 11 · Climate Change, Ozone, and Ultraviolet Radiation
of brine rejection caused by the high rates of ice production.This brine contributes to water-mass formation and ocean-current dynamics.
Snow coverSnow is an effective insulator that controls the rate of heatconduction from the base to the surface of the ice and thusaffects ice growth rates (Maykut 1978). An increase in pre-cipitation, and thus snow cover, impacts not only ice growthbut also the surface energy balance. Fresh snow on sea iceincreases surface albedo and further reduces any energytransfer between ocean and atmosphere due to its low ther-mal conductivity. In addition, snow may become part of thesea ice cover through the formation of snow-ice, thus influ-encing the mass balance of the sea ice cover (Lange et al.1990). The distribution of snow depth on sea ice is affectedchiefly by sea ice topography, which is in turn a function ofice age and ice motion (Buzuev and Dubovtsev 1978). Snowdepth measurements from the drifting ice stations of theFormer Soviet Union indicate that the maximum snow depthon thick ice is in mid-May and averages 0.35 m. The snowusually, but not always, disappears in July and August.Snow cover is a reservoir of fresh water and plays a key rolein melt pond formation.
Melt pondsThe seasonal variation of the sea ice surface directly affectsthe radiation balance and is one of the key elements of theice-albedo feedback mechanism. A substantial portion of thesea ice is covered by dark melt ponds in the summer. Thislowers the albedo but does not substantially change the sur-face temperature. The area of melt ponds reaches a maxi-mum of 50-60% in early summer, and then decreases to aminimum of about 10% at the end of summer, causing astrong seasonal contrast in the average surface albedo (May-kut 1986, Grenfell and Maykut 1977, Grenfell and Perovich1984, Perovich 1996). As the area of melt ponds increases,the area of lower albedo increases which leads to an increasein solar radiation absorption at the surface. However, laterin the summer as the ponds warm and increase in size anddepth, they drain through the base and/or margins of the icefloes; consequently, total pond coverage decreases, increas-ing albedo. Numerical, thermodynamic ice-growth modelsshow that the simulated ice thickness is sensitive to the frac-tion of meltwater that runs off floes and to the melt pondcoverage (Ebert and Curry 1993).
11.2.4.2. Terrestrial regime
The vast land masses of the Northern Hemisphere providethe Arctic climate system with a complex set of variablesthat make climate change in the Arctic difficult to predict ormodel. The land masses contribute warmer air to the polarregion, disrupting the polar vortex. Thus, the Arctic’s atmos-pheric dynamics and processes of climate change are dis-tinctly different than those in the Antarctic. Soil and per-mafrost dynamics affect trace gas fluxes, surface tempera-tures, and the hydrological balance. Precipitation and runoffinfluence ocean temperature, salinity, and circulation. Veg-etation types and snow cover affect albedo and thus surfaceradiation balance. Under a warming climate the terrestrialsurface plays an important role in trace gas feedback effects.Vegetation along with soil moisture and temperature affecttrace gas fluxes and thus cause large seasonal differences inchemical atmospheric dynamics. Historically, terrestrialecosystems have stored CO2, helping to cool the Earth.Glaciers and ice sheets have a large influence on sea level
and on ocean circulation patterns. All of these processes willbe affected by changes in climate. Changes to the Arctic havethe potential to affect global climate through the response ofthe Arctic trace gas and hydrologic systems.
11.2.4.2.1. Soil
The soils of Arctic regions are particularly vulnerable tochanges in climate because of the dominant role of tempera-ture on their physical properties and biological processes.Arctic soils are highly varied in pH balance, particle size,and moisture content. Because of the differing soil proper-ties, the effect of climate change varies considerably; whilesome responses will be large and rapid, others will be barelydetectable. Depth of the active layer and the associated tem-perature and moisture regimes are the primary controls ofprocesses of decomposition which determine the rate andamount of organic matter accumulation and trace gas fluxfrom soils. An increase in the depth of thaw and the lengthof the active season from warming temperatures will be neg-atively related to the moisture content (positively correlatedto the soil moisture deficit) (Nadelhoffer et al. 1992). Changesin moisture content are hard to predict because changes inprecipitation are uncertain and soil moisture is also affectedby snow melt, drainage, and evapotranspiration. Moist andwet soils may become drier as a result of increased evapo-transpiration and lowering of the water table.
Soil moisture, to a large extent, determines the tempera-ture profile, depth of permafrost, and soil organic mattercontent. Thermal conductivity, which is strongly regulatedby the moisture content of the soil, is an important elementof soil/atmosphere temperature dynamics. Water has a lowerthermal conductivity than air and organic soils have a ther-mal conductivity almost an order of magnitude lower thanthat of frozen, nearly saturated mineral soils (Kane et al.1992). Dry soils with cushion, heath, and lichen vegetationand thin organic mats tend to occur on slopes or well drainedstony areas in the High Arctic. They have a relatively deepthaw or active layer because of limited insulation by the or-ganic layer and their high thermal conductivity. Moist soilsconstitute much of the patterned ground and tussock tun-dra, with low relief and moderate depths of organic matter,which are typical of much of the low Arctic. The permafrostis thinner in these soils because of insulation by the surfaceorganic layer and high water content. Wet and waterloggedsoils dominated by sedges and mosses occur in poorly drainedareas of the low Arctic. The thick organic layers which haveaccumulated because of the waterlogged and anaerobic con-ditions insulate the soil and help to retain moisture, thus re-ducing thermal diffusion and accounting for the shallow ac-tive layer.
11.2.4.2.2. Permafrost
Permafrost is ‘ground that remains at or below 0°C for atleast 2 years’ (Permafrost Subcommittee 1988). It occurs ex-tensively in Arctic and subarctic regions, affecting up to80% of Alaska and 50% of Canada and Russia. Permafrostis divided into continuous and discontinuous zones definedby location and areal extent of cryotic ground. Depths rangefrom > 1000 m (1450 m in Siberia) to only a few metersnear the southern limit (Heginbottom et al. 1993, Smith1993, Williams and Smith 1989). During the summer, thesurface of the ground thaws. The depth of this active layerranges from a few decimeters in the High Arctic to morethan 2 meters in parts of the discontinuous zone. The sea-sonal freezing and thawing of the active layer and the sea-

732 AMAP Assessment Report
prevails in those with greater thaw depths. Water balancedynamics, specifically run-off generation, evapotranspira-tion, and changes in soil moisture, are intimately connectedto permafrost dynamics. The most important factor control-ling evapotranspiration in the Arctic has been reported to besoil moisture in the active layer (Kane and Hinzman 1988).Increase in active layer depth would simultaneously increaseinfiltration, soil moisture, evapotranspiration, and the lateralredistribution of water through enhanced groundwater flow.Woo and Marsh (1990) found that groundwater inflow intofen environments was also critical in maintaining soil mois-ture during the summer. Rainfall run-off studies in the Arcticsuggest that drainage basins underlain by permafrost main-tain ‘flashier’ stream hydrographs compared with non-per-mafrost areas (Haugen et al. 1982).
Because meltwater is stored in the snowpacks, on thebasin slopes, and within channels, the initiation of stream-flow often lags behind the commencement of snowmelt byseveral days or more. Once the flow begins, it usually ex-hibits a marked diurnal rhythm, reflecting the daily snow-melt cycle. In some instances, slush flow along a valley mayconvey water and snow rapidly downstream (Barsch et al.1993). Annual peak flows are common during this period(Kane et al. 1992) and many rivers are prone to flooding.After the snow is depleted in the basin, streamflow subsidesexcept during some heavy rain events. Warming tempera-tures and ensuing thinner ice, increased precipitation, andearlier spring melt could alter run-off dynamics and meanresidence times. The situation is far from straightforward,however, as increases in precipitation, also predicted by nu-merous GCM’s for the region between 50-70°N (IPCC 1990a,Boer et al. 1992a, 1992b), could enhance the formation ofsaturation overland flow.
11.2.4.2.4. Snow
Because both the deposition and duration of snow on theground during all seasons are associated with atmosphericdynamics and thermodynamics, and high latitudes are be-lieved to be especially sensitive to global warming due tocryospheric feedbacks, snow cover fluctuations can poten-tially be used as an indicator of global climate change. Snowcover changes the surface albedo, regulates surface tempera-ture, affects air mass formation, and insulates the groundand vegetation from severe cold temperatures. The snowcover-albedo feedback amplifies any climatic changes andimpacts global climate variability (Cess et al. 1991, Randallet al. 1994, Groisman et al. 1994a, 1994b). The huge differ-ence in albedo between snow cover and vegetation signifi-cantly impacts the energy balance. The albedo of fresh snowmay exceed 0.80 and be as much as 4-5 times the value foropen water or tundra (Kondratyev 1969, Grenfell and War-ren 1994). Inter-annual fluctuations of snow cover over theNorthern Hemisphere, though much smaller than seasonalones, are sufficiently large to affect global and regional ra-diative and thermal energy budgets (Barry 1985, Shine et al.1990). Snow contributes to the hydrologic cycle regionallyand globally and is a key element in ocean thermohaline cir-culation (Broecker 1991).
The insulation value of the snow is important to soil pro-cesses and to the winter survival of many species of plantsand animals. The accessibility of vegetation to herbivores ispartly determined by the depth, density, and location ofsnow, and thus snow affects their populations and distribu-tion. A persistent increase or decrease in the extent, or achange in the type, of snow cover could severely affect sur-vival of vegetation and animals.
sonal pattern of temperature change in the upper part ofpermafrost produce distinctive features unique to Arctictundra, such as patterned ground, gelifluction lobes, activelayer detachments, seasonal frost mounds, and frost cracks.
Permafrost reflects a thermodynamic balance betweenground surface temperature and the geothermal gradient.The spatial distribution and depth of permafrost are closelyrelated to climate and are expected to change with climatechanges. Much extant permafrost is close to 0°C and inher-ently unstable. Thawing could cause the degradation of ex-isting discontinuous permafrost, a decrease in the distribu-tion of continuous permafrost, and potential terrain instabil-ity (Smith 1993). There are serious concerns that there willbe increased erosion, mass wasting, disruption of surfacevegetation, and changes in surface drainage systems includ-ing drainage of critical wetlands (Fitzharris 1996). Perma-frost degradation due to climate warming is complicated byits effect on vegetation and potential increases in trace gasfluxes (Nisbet 1989); these changes could then create condi-tions that would further affect climate.
Locally, the nature of the ground surface, including slopeangle and aspect, surface water, vegetation, and snow cover,creates boundary layer conditions that determine the degreeto which air temperature controls ground thermal regimes.Geologic, tectonic, and subsurface hydrologic conditionsfurther influence permafrost.
The freezing of water in the ground produces an assort-ment of ground ice forms ranging from disseminated icecrystals in a soil matrix (pore ice) to thick (10-20 m), hori-zontally layered bodies of nearly pure ice which extend forseveral square kilometers. The type and rate of permafrostformation involve a complex set of processes including soilparticle size, temperature, water content and chemistry, andwater transfer processes and rates. Ground ice content some-times exceeds the saturated moisture content of its host sedi-ments. When permafrost containing excess ice thaws, theground subsides in proportion to the volume of excess ice,forming thermokarst.
Of central importance in the investigation of ground iceand climate change are the distribution, nature, and originof ice-rich permafrost and massive ground ice (e.g. Harry etal. 1988, Lawson 1983, Mackay 1992, Pollard and French1980, Pollard and Dallimore 1988). Few investigations havebeen made of massive ground ice in the Arctic Archipelago(French et al. 1986, Lorrain and Demeur 1985, Pollard1991, Barry and Pollard 1992), but considerable literaturedoes exist for ground ice occurring in northern Russia. Ofparticular interest are studies on buried ice (Astakhov andIasayev 1988), the gas content of ground ice (Arkhangelovand Novgorodova 1991), and ice petrography (Solomatin1986).
11.2.4.2.3. Runoff
The potential impacts on Arctic terrestrial water balance ofelevated temperatures associated with the greenhouse effectoccur through the complex interactions of land surface hy-drology and the freeze/thaw cycle. Winter freezing of theactive layer of permafrost as well as shallow groundwater,lakes, and rivers inhibits the movement of water. During theearly thaw period, melting of snow above the frozen surfaceentrains and accelerates surface run-off of both water andconstituents, with overland flow (not interflow or baseflow)serving as the dominant input into river systems (Kane andHinzman 1988).
Woo and Steer (1983) show that overland flow predomi-nates in sites with a shallow active layer, while infiltration

733Chapter 11 · Climate Change, Ozone, and Ultraviolet Radiation
11.2.4.2.5. Terrestrial ecosystems: Physical properties
The terrestrial ecosystems of the Arctic currently cool theEarth in three basic ways: by reflecting incoming radiationfrom high-albedo surfaces such as snow and ice; by exchang-ing energy and water with the atmosphere; and by takingCO2 out of the atmosphere and storing the carbon in organ-ic soils and peats. Terrestrial ecosystems will respond to cli-matic changes, resulting in positive feedbacks to the atmos-phere through mechanisms such as alterations in the balanceof trace gas emissions, particularly CO2 and methane; al-tered albedo as vegetation cover increases and forest extendsinto tundra areas; and plant responses to UV and enhancedCO2. The net result of the array of feedback effects may bepositive or negative; overall effects remain inconclusive be-cause of the complexity of the many interactions.
For approximately the last 10 000 years, many tundraterrestrial ecosystems have taken carbon out of the atmos-phere, reducing the natural greenhouse effect, because therespiration of CO2 (dry habitats) and CH4 (wet habitats)from soil microbial respiration during the decompositioncycle is slower than the uptake of atmospheric CO2 in green
plant photosynthesis (Figure 11·13). This process has re-sulted in the tundra and boreal regions storing 14% of theworld’s organic soil carbon. However, if the soils warm andmicrobial activity increases, there is concern that much ofthis carbon will be returned to the atmosphere in anotherpositive feedback by increasing the concentrations of thegreenhouse gas CO2.
The tundra has a high albedo compared with the neigh-boring dark boreal coniferous forest or taiga. Changes inspecies composition might greatly affect albedo and thus theradiative balance. A northward migration of the tree linewould reduce albedo and provide a positive feedback to theclimate system, i.e., warming would encourage trees to re-place the short tundra vegetation which would further de-crease albedo and increase climatic warming. However, pol-len records from the end of the last ice age indicate thattrees of the taiga move more slowly than the rates of pre-dicted climate change. Possible feedback effects from achange in vegetation would be dampened by this lag. Per-mafrost disturbance also affects plant species compositionand thus albedo.
The greatest change in Arctic ecosystems and thus feed-backs to climate, should be expected where species are attheir higher rather than lower temperature-related distribu-tion limits, i.e. at their southern and lower altitudinal bound-aries, and where they are in proximity with potential com-petitors. The tundra/taiga ecotone is, therefore, a critical re-gion of potential change.
11.2.4.2.6. Arctic glaciers and ice sheets
Glaciers and ice sheets are among the defining elements ofthe Arctic. They are tightly coupled to climate change andhave been shrinking, contributing to sea-level rise; positivefeedbacks associated with global warming will acceleratethis melting of fresh water. Glaciers also play a role in globalradiation balance and are an important ‘climate archive’.Land ice in the Arctic includes the massive Greenland icesheet and smaller ice caps and glaciers. The Greenland icesheet covers 1.7 �106 km2, or 80% of the island of Green-land; an additional 0.1 �106 km2 of the island is under smal-ler ice caps and glaciers. Ice cover in other areas of the Arc-tic (including coastal Alaska) amounts to almost 0.4 �106
km2 (Meier 1984).Glacier mass is tied to precipitation and temperature.
Warming will cause most glaciers to recede. Many modelsassume that, for the Greenland ice sheet, warming will pro-duce both increased melting at low altitudes and increasedsnowfall at high altitudes, the latter linked to increased satu-ration vapor pressure (e.g., IPCC 1996a). However, paleocli-mate records do not show much dependence of high-altitudeaccumulation on temperature (e.g., Cuffey and Clow inpress). A change in mass balance will produce a time-laggedchange in ice flow and glacier extent. Glaciers which termi-nate at tideline can advance over long distances as a func-tion of submarine moraines (Powell 1990). It is possible thatclimate changes can influence maintenance of a glacier on itsprotective moraine. Run-off from glaciers that grow shouldincrease due to summer melting. Eventually, however, tem-perature increases will lead to glacial recession.
A compilation of studies (Meier 1993) suggests that aglobal warming of 1°C will lead to ≈ 1 mm per year of sea-level rise from small ice caps and glaciers, with the Arcticsupplying over half of the total, and an additional 0.3-0.4mm per year contributed from the Greenland ice sheet (IPCC1990a). Over longer time scales (a century or more) thesmall glaciers will shrink as the ice melts. The total volume
Permafrost (P)
LE DOC
Nu
Nu
MOMO
MOD D
Cr
CrCr
CrCr
CO2
CpCp
ActiveLayer
Figure 11·13. Schematic illustration of ecosystem carbon fluxes and nutri-ent circulation in the tundra (adapted from Callaghan and Jonasson 1995).Carbon and nutrient pathways are shown by dashed and continuous lines,respectively. Atmospheric CO2 is fixed in the plants through photosynthe-sis (C p). Dead parts of plants with organic carbon and nutrients fall to theground as litter and enter the decomposition cycle (D) where they are trans-formed into soil organic matter. The organic matter with its nutrients un-dergoes complicated transformations in the soil microbial biomass (MO).Carbon is continuously lost to the atmosphere as CO2 through microbialand plant respiration (Cr) and made available directly for plant photosyn-thesis or added to the atmospheric pool (CO2). Nutrients are circulatedwithin the microbial system of the soil or traded-off and taken-up by theplants (Nu). Microbial activity is limited by, among other things, low tem-peratures due to permafrost (P). Some carbon and nutrients can be lostfrom the system as dissolved organic matter (DOC) or nutrient leachate(LE) and transported to adjacent systems. Climate change acts on the sys-tem mainly by controlling the rate of CO2 uptake by plants, and the activ-ity of micro-organisms. Tundra ecosystems differ from others in that thecold soils have large stores of nutrients and carbon, and the microbial bio-mass has low rates of CO2 uptake, i.e. low productivity.
734 AMAP Assessment Report
TemperatureThe cold polar night is a dominant characteristic of the Arc-tic climate. Indeed, the Arctic is often defined solely in termsof low temperature, i.e. as that area where the average tem-perature for the warmest month is below 10°C. Temperaturedisparities in the Arctic, between oceans and continents,across latitudes, and between seasons, are complex. Thecontrast between summer and winter climates in the interiorland masses of the subarctic is particularly extreme. For ex-ample, Verkhoyansk, Siberia recorded an absolute Januarylow of – 67.8°C and a summer high of 36.7°C. Steep tem-perature inversions characterize the Arctic boundary layer inwinter; these inversions are particularly strong over land.
Air temperatures over the sea ice cover tend to be warmerrelative to continental temperatures in the winter and a nearconstant 0°C in the summer. The uniform and relativelywarm winter temperature is maintained by a balance be-tween the net radiation, which amounts to about –30 W/m2,and the conductive flux and sensible heat flux, which aver-age about +15 W/m2 each (Maykut 1982). In the summer,the strong positive net radiation, 80 W/m2 in July, is mostlybalanced by melt.
Air temperatures over the winter pack ice are colder nearthe Canadian archipelago than on the Siberian side of theArctic Ocean. The ice-free regions in the peripheral seaswarm above freezing in summer, depending on location andlocal wind and ocean current regimes. In the winter theseareas are covered for the most part by thin, first-year ice, re-sulting in both warmer surface temperatures and more leads.Strong horizontal temperature gradients are observed nearthe ice edge where there are large variations in the surfacefluxes and surface temperatures, depending on whether thewind flows on or off the ice (Overland and Guest 1991).
The diurnal cycle influences air temperature in the spring,summer, and fall seasons except near the Pole where the sunmaintains a constant height above the horizon. Synoptic-scale variations, with periods between 2 and 8 days, domi-nate the air temperature variability, except in summer whenfluctuations are small. The winter air temperature is stronglycorrelated with cloud cover and wind speed. In the winter,the air temperature is an average of about 9°C warmerunder cloudy skies than under clear skies, and 1.2°C warmerfor every meter per second increase in the wind speed.
The temperature increase caused by stronger wind speedsis due to breakdown of the low-level temperature inversionthrough mixing. This increase in temperature with altitude isa characteristic feature of the polar boundary-layer climate.Primarily driven by radiation deficits at the surface and warmair advection aloft, the inversion typically extends to alti-tudes of ≈1 km over the Arctic Ocean, with temperature dif-ferences of ≈10°C. It is strongest during winter, although asecondary peak exists during the late summer due to meltingat the ice-air interface. The seasonal and inter-annual vari-ability in the Arctic inversion layer has been reported in sev-eral studies (Serreze et al. 1992, Skony et al. 1994, Kahl etal. 1996).
Surface windsSurface winds are an important climatic parameter becauseof their influence on ambient temperatures, as well as en-ergy, trace gas, and humidity fluxes. Longer period changesin atmospheric circulation, including both air temperatureand winds, drive variations in sea ice extent (Rogers and vanLoon 1979, Walsh and Johnson 1979, Walsh and Sater 1981,Fang and Wallace 1994). The surface stresses at the air–iceinterface are communicated to the water and ultimately areresponsible for the gross aspects of the basin-wide circula-
of ice in smaller glaciers is not known with high accuracydue to a scarcity of thickness measurements, but it is probab-ly enough to raise sea level ≈0.3 m if melted (IPCC 1996a).Long-term persistence of warming of more than 3°C is pre-dicted to cause the Greenland ice sheet to shrink and splitinto northern and southern domes. Warming of more than6°C, a plausible value, is predicted to remove the ice sheetentirely over ≈10 000 years (Letreguilly et al. 1991). The2.6 �106 km3 of water in the ice sheet, plus up to an addi-tional 0.1 �106 km3 in smaller glaciers on Greenland, wouldraise global sea level over 7 m if completely melted.
The residence time (how long typical snowfall spends inthe ice, obtained by dividing the volume of the glacier by theinput rate) averages a few centuries for the ice caps and gla-ciers of the Arctic, but several thousand years for the Green-land ice sheet. Because glaciers are controlled by the physicalprocesses of ice motion as well as by snowfall and melting,changes in glacier size typically lag climatic changes (byyears to decades for typical mountain glaciers), and recordsmoothed versions of any change (see Paterson 1994). TheGreenland ice sheet typically responds much more slowly toclimate change than other ice masses in the Arctic. If climatechange is amplified in polar regions as expected (IPCC 1990a,1992a, 1996a, Cuffey et al. 1995), Arctic glaciers will havea greater influence on the global water balance than esti-mated here.
11.2.4.3. Atmospheric regime
The atmosphere, along with the oceans, directly ties the Arc-tic environment to the rest of the world. Atmospheric trans-port of trace gases, including greenhouse gases, aerosols,and water, directly affects the Arctic environment. Many ofthe observed changes to the atmosphere are anthropogeni-cally driven and it may, to some extent, be possible to con-trol them through international agreements. The effects ofatmospheric changes on the Arctic are particularly strongbecause of positive feedback processes.
11.2.4.3.1. Atmospheric structure and components
The troposphere is the lowest portion of the atmosphere andis where the interaction with the surface and the ocean/landinteractions are most dynamic. The troposphere can be di-vided into the boundary layer, which is close to the earth’ssurface, and the free troposphere, where the exchange ofgases with the stratosphere can be important. The atmos-pheric boundary layer contains moisture, trace gases, andaerosols from localized sources and is characterized by rapidcirculation. The height of the boundary layer in the Arcticcan range from a few meters to a few kilometers. The bio-sphere is immediately affected by processes and constituentsin the boundary layer.
The stratosphere, roughly 10-30 km above the earth’ssurface, is the portion of the atmosphere where most of thetotal column ozone is located. The dynamic nature andchemical composition of the stratosphere exert a major in-fluence on ozone concentrations and are extremely impor-tant to climate change. The stratosphere is less affected bylocal sources and sinks of gas and is therefore more sensitiveto global emissions than the troposphere. At higher levels inthe Arctic stratosphere, the cooling effects of both ozone de-pletion and greenhouse gas increases should be clearly evi-dent against the background of natural variability. In theArctic winter, stratospheric flow is dominated by extensive,and more or less circumpolar, cyclonic systems. These sys-tems are referred to as the ‘polar vortices’.
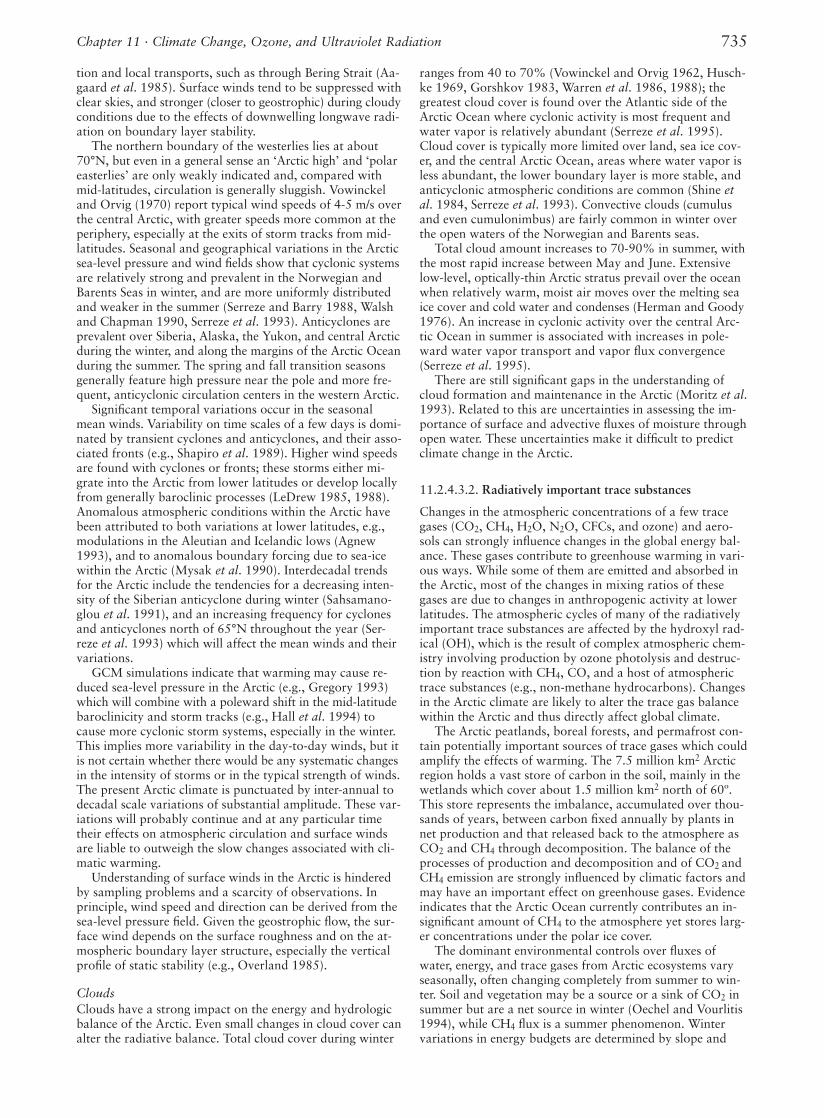
735Chapter 11 · Climate Change, Ozone, and Ultraviolet Radiation
tion and local transports, such as through Bering Strait (Aa-gaard et al. 1985). Surface winds tend to be suppressed withclear skies, and stronger (closer to geostrophic) during cloudyconditions due to the effects of downwelling longwave radi-ation on boundary layer stability.
The northern boundary of the westerlies lies at about70°N, but even in a general sense an ‘Arctic high’ and ‘polareasterlies’ are only weakly indicated and, compared withmid-latitudes, circulation is generally sluggish. Vowinckeland Orvig (1970) report typical wind speeds of 4-5 m/s overthe central Arctic, with greater speeds more common at theperiphery, especially at the exits of storm tracks from mid-latitudes. Seasonal and geographical variations in the Arcticsea-level pressure and wind fields show that cyclonic systemsare relatively strong and prevalent in the Norwegian andBarents Seas in winter, and are more uniformly distributedand weaker in the summer (Serreze and Barry 1988, Walshand Chapman 1990, Serreze et al. 1993). Anticyclones areprevalent over Siberia, Alaska, the Yukon, and central Arcticduring the winter, and along the margins of the Arctic Oceanduring the summer. The spring and fall transition seasonsgenerally feature high pressure near the pole and more fre-quent, anticyclonic circulation centers in the western Arctic.
Significant temporal variations occur in the seasonalmean winds. Variability on time scales of a few days is domi-nated by transient cyclones and anticyclones, and their asso-ciated fronts (e.g., Shapiro et al. 1989). Higher wind speedsare found with cyclones or fronts; these storms either mi-grate into the Arctic from lower latitudes or develop locallyfrom generally baroclinic processes (LeDrew 1985, 1988).Anomalous atmospheric conditions within the Arctic havebeen attributed to both variations at lower latitudes, e.g.,modulations in the Aleutian and Icelandic lows (Agnew1993), and to anomalous boundary forcing due to sea-icewithin the Arctic (Mysak et al. 1990). Interdecadal trendsfor the Arctic include the tendencies for a decreasing inten-sity of the Siberian anticyclone during winter (Sahsamano-glou et al. 1991), and an increasing frequency for cyclonesand anticyclones north of 65°N throughout the year (Ser-reze et al. 1993) which will affect the mean winds and theirvariations.
GCM simulations indicate that warming may cause re-duced sea-level pressure in the Arctic (e.g., Gregory 1993)which will combine with a poleward shift in the mid-latitudebaroclinicity and storm tracks (e.g., Hall et al. 1994) tocause more cyclonic storm systems, especially in the winter.This implies more variability in the day-to-day winds, but itis not certain whether there would be any systematic changesin the intensity of storms or in the typical strength of winds.The present Arctic climate is punctuated by inter-annual todecadal scale variations of substantial amplitude. These var-iations will probably continue and at any particular timetheir effects on atmospheric circulation and surface windsare liable to outweigh the slow changes associated with cli-matic warming.
Understanding of surface winds in the Arctic is hinderedby sampling problems and a scarcity of observations. Inprinciple, wind speed and direction can be derived from thesea-level pressure field. Given the geostrophic flow, the sur-face wind depends on the surface roughness and on the at-mospheric boundary layer structure, especially the verticalprofile of static stability (e.g., Overland 1985).
CloudsClouds have a strong impact on the energy and hydrologicbalance of the Arctic. Even small changes in cloud cover canalter the radiative balance. Total cloud cover during winter
ranges from 40 to 70% (Vowinckel and Orvig 1962, Husch-ke 1969, Gorshkov 1983, Warren et al. 1986, 1988); thegreatest cloud cover is found over the Atlantic side of theArctic Ocean where cyclonic activity is most frequent andwater vapor is relatively abundant (Serreze et al. 1995).Cloud cover is typically more limited over land, sea ice cov-er, and the central Arctic Ocean, areas where water vapor isless abundant, the lower boundary layer is more stable, andanticyclonic atmospheric conditions are common (Shine etal. 1984, Serreze et al. 1993). Convective clouds (cumulusand even cumulonimbus) are fairly common in winter overthe open waters of the Norwegian and Barents seas.
Total cloud amount increases to 70-90% in summer, withthe most rapid increase between May and June. Extensivelow-level, optically-thin Arctic stratus prevail over the oceanwhen relatively warm, moist air moves over the melting seaice cover and cold water and condenses (Herman and Goody1976). An increase in cyclonic activity over the central Arc-tic Ocean in summer is associated with increases in pole-ward water vapor transport and vapor flux convergence(Serreze et al. 1995).
There are still significant gaps in the understanding ofcloud formation and maintenance in the Arctic (Moritz et al.1993). Related to this are uncertainties in assessing the im-portance of surface and advective fluxes of moisture throughopen water. These uncertainties make it difficult to predictclimate change in the Arctic.
11.2.4.3.2. Radiatively important trace substances
Changes in the atmospheric concentrations of a few tracegases (CO2, CH4, H2O, N2O, CFCs, and ozone) and aero-sols can strongly influence changes in the global energy bal-ance. These gases contribute to greenhouse warming in vari-ous ways. While some of them are emitted and absorbed inthe Arctic, most of the changes in mixing ratios of thesegases are due to changes in anthropogenic activity at lowerlatitudes. The atmospheric cycles of many of the radiativelyimportant trace substances are affected by the hydroxyl rad-ical (OH), which is the result of complex atmospheric chem-istry involving production by ozone photolysis and destruc-tion by reaction with CH4, CO, and a host of atmospherictrace substances (e.g., non-methane hydrocarbons). Changesin the Arctic climate are likely to alter the trace gas balancewithin the Arctic and thus directly affect global climate.
The Arctic peatlands, boreal forests, and permafrost con-tain potentially important sources of trace gases which couldamplify the effects of warming. The 7.5 million km2 Arcticregion holds a vast store of carbon in the soil, mainly in thewetlands which cover about 1.5 million km2 north of 60º.This store represents the imbalance, accumulated over thou-sands of years, between carbon fixed annually by plants innet production and that released back to the atmosphere asCO2 and CH4 through decomposition. The balance of theprocesses of production and decomposition and of CO2 andCH4 emission are strongly influenced by climatic factors andmay have an important effect on greenhouse gases. Evidenceindicates that the Arctic Ocean currently contributes an in-significant amount of CH4 to the atmosphere yet stores larg-er concentrations under the polar ice cover.
The dominant environmental controls over fluxes ofwater, energy, and trace gases from Arctic ecosystems varyseasonally, often changing completely from summer to win-ter. Soil and vegetation may be a source or a sink of CO2 insummer but are a net source in winter (Oechel and Vourlitis1994), while CH4 flux is a summer phenomenon. Wintervariations in energy budgets are determined by slope and
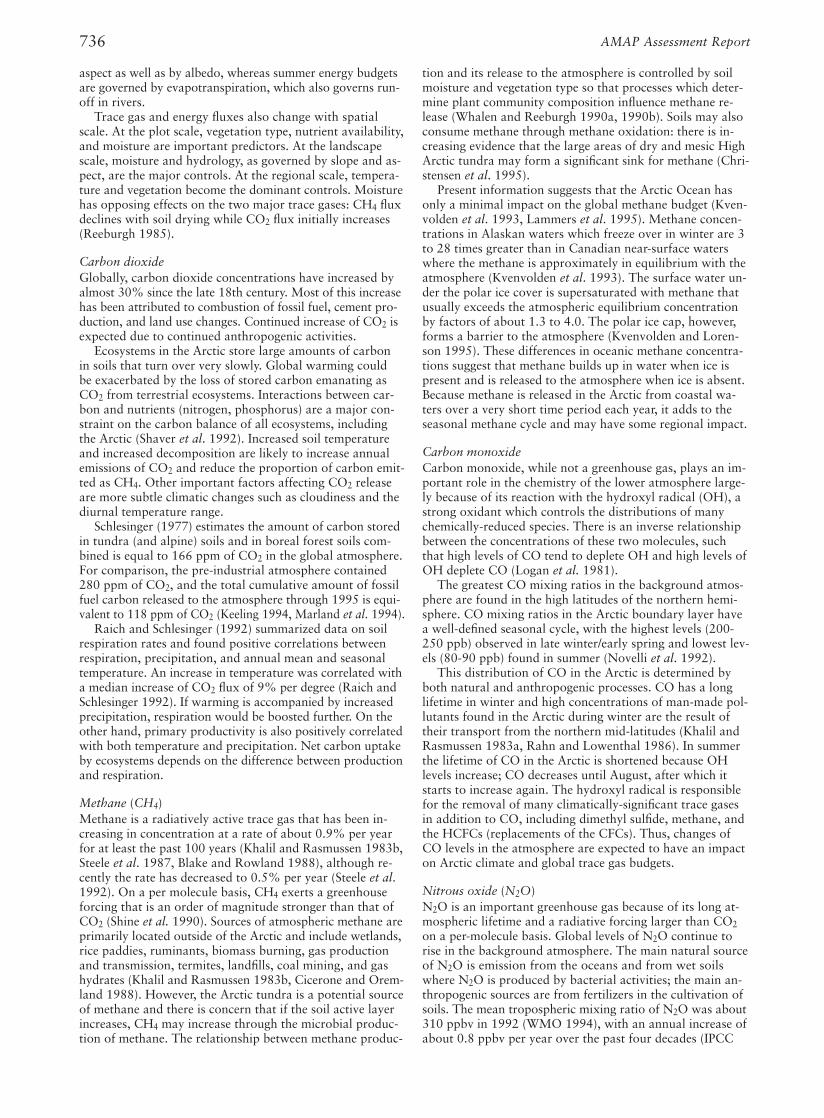
736 AMAP Assessment Report
tion and its release to the atmosphere is controlled by soilmoisture and vegetation type so that processes which deter-mine plant community composition influence methane re-lease (Whalen and Reeburgh 1990a, 1990b). Soils may alsoconsume methane through methane oxidation: there is in-creasing evidence that the large areas of dry and mesic HighArctic tundra may form a significant sink for methane (Chri-stensen et al. 1995).
Present information suggests that the Arctic Ocean hasonly a minimal impact on the global methane budget (Kven-volden et al. 1993, Lammers et al. 1995). Methane concen-trations in Alaskan waters which freeze over in winter are 3to 28 times greater than in Canadian near-surface waterswhere the methane is approximately in equilibrium with theatmosphere (Kvenvolden et al. 1993). The surface water un-der the polar ice cover is supersaturated with methane thatusually exceeds the atmospheric equilibrium concentrationby factors of about 1.3 to 4.0. The polar ice cap, however,forms a barrier to the atmosphere (Kvenvolden and Loren-son 1995). These differences in oceanic methane concentra-tions suggest that methane builds up in water when ice ispresent and is released to the atmosphere when ice is absent.Because methane is released in the Arctic from coastal wa-ters over a very short time period each year, it adds to theseasonal methane cycle and may have some regional impact.
Carbon monoxideCarbon monoxide, while not a greenhouse gas, plays an im-portant role in the chemistry of the lower atmosphere large-ly because of its reaction with the hydroxyl radical (OH), astrong oxidant which controls the distributions of manychemically-reduced species. There is an inverse relationshipbetween the concentrations of these two molecules, suchthat high levels of CO tend to deplete OH and high levels ofOH deplete CO (Logan et al. 1981).
The greatest CO mixing ratios in the background atmos-phere are found in the high latitudes of the northern hemi-sphere. CO mixing ratios in the Arctic boundary layer havea well-defined seasonal cycle, with the highest levels (200-250 ppb) observed in late winter/early spring and lowest lev-els (80-90 ppb) found in summer (Novelli et al. 1992).
This distribution of CO in the Arctic is determined byboth natural and anthropogenic processes. CO has a longlifetime in winter and high concentrations of man-made pol-lutants found in the Arctic during winter are the result oftheir transport from the northern mid-latitudes (Khalil andRasmussen 1983a, Rahn and Lowenthal 1986). In summerthe lifetime of CO in the Arctic is shortened because OHlevels increase; CO decreases until August, after which itstarts to increase again. The hydroxyl radical is responsiblefor the removal of many climatically-significant trace gasesin addition to CO, including dimethyl sulfide, methane, andthe HCFCs (replacements of the CFCs). Thus, changes ofCO levels in the atmosphere are expected to have an impacton Arctic climate and global trace gas budgets.
Nitrous oxide (N2O)N2O is an important greenhouse gas because of its long at-mospheric lifetime and a radiative forcing larger than CO2on a per-molecule basis. Global levels of N2O continue torise in the background atmosphere. The main natural sourceof N2O is emission from the oceans and from wet soilswhere N2O is produced by bacterial activities; the main an-thropogenic sources are from fertilizers in the cultivation ofsoils. The mean tropospheric mixing ratio of N2O was about310 ppbv in 1992 (WMO 1994), with an annual increase ofabout 0.8 ppbv per year over the past four decades (IPCC
aspect as well as by albedo, whereas summer energy budgetsare governed by evapotranspiration, which also governs run-off in rivers.
Trace gas and energy fluxes also change with spatialscale. At the plot scale, vegetation type, nutrient availability,and moisture are important predictors. At the landscapescale, moisture and hydrology, as governed by slope and as-pect, are the major controls. At the regional scale, tempera-ture and vegetation become the dominant controls. Moisturehas opposing effects on the two major trace gases: CH4 fluxdeclines with soil drying while CO2 flux initially increases(Reeburgh 1985).
Carbon dioxideGlobally, carbon dioxide concentrations have increased byalmost 30% since the late 18th century. Most of this increasehas been attributed to combustion of fossil fuel, cement pro-duction, and land use changes. Continued increase of CO2 isexpected due to continued anthropogenic activities.
Ecosystems in the Arctic store large amounts of carbonin soils that turn over very slowly. Global warming couldbe exacerbated by the loss of stored carbon emanating asCO2 from terrestrial ecosystems. Interactions between car-bon and nutrients (nitrogen, phosphorus) are a major con-straint on the carbon balance of all ecosystems, includingthe Arctic (Shaver et al. 1992). Increased soil temperatureand increased decomposition are likely to increase annualemissions of CO2 and reduce the proportion of carbon emit-ted as CH4. Other important factors affecting CO2 releaseare more subtle climatic changes such as cloudiness and thediurnal temperature range.
Schlesinger (1977) estimates the amount of carbon storedin tundra (and alpine) soils and in boreal forest soils com-bined is equal to 166 ppm of CO2 in the global atmosphere.For comparison, the pre-industrial atmosphere contained280 ppm of CO2, and the total cumulative amount of fossilfuel carbon released to the atmosphere through 1995 is equi-valent to 118 ppm of CO2 (Keeling 1994, Marland et al. 1994).
Raich and Schlesinger (1992) summarized data on soilrespiration rates and found positive correlations betweenrespiration, precipitation, and annual mean and seasonaltemperature. An increase in temperature was correlated witha median increase of CO2 flux of 9% per degree (Raich andSchlesinger 1992). If warming is accompanied by increasedprecipitation, respiration would be boosted further. On theother hand, primary productivity is also positively correlatedwith both temperature and precipitation. Net carbon uptakeby ecosystems depends on the difference between productionand respiration.
Methane (CH4)Methane is a radiatively active trace gas that has been in-creasing in concentration at a rate of about 0.9% per yearfor at least the past 100 years (Khalil and Rasmussen 1983b,Steele et al. 1987, Blake and Rowland 1988), although re-cently the rate has decreased to 0.5% per year (Steele et al.1992). On a per molecule basis, CH4 exerts a greenhouseforcing that is an order of magnitude stronger than that ofCO2 (Shine et al. 1990). Sources of atmospheric methane areprimarily located outside of the Arctic and include wetlands,rice paddies, ruminants, biomass burning, gas productionand transmission, termites, landfills, coal mining, and gashydrates (Khalil and Rasmussen 1983b, Cicerone and Orem-land 1988). However, the Arctic tundra is a potential sourceof methane and there is concern that if the soil active layerincreases, CH4 may increase through the microbial produc-tion of methane. The relationship between methane produc-
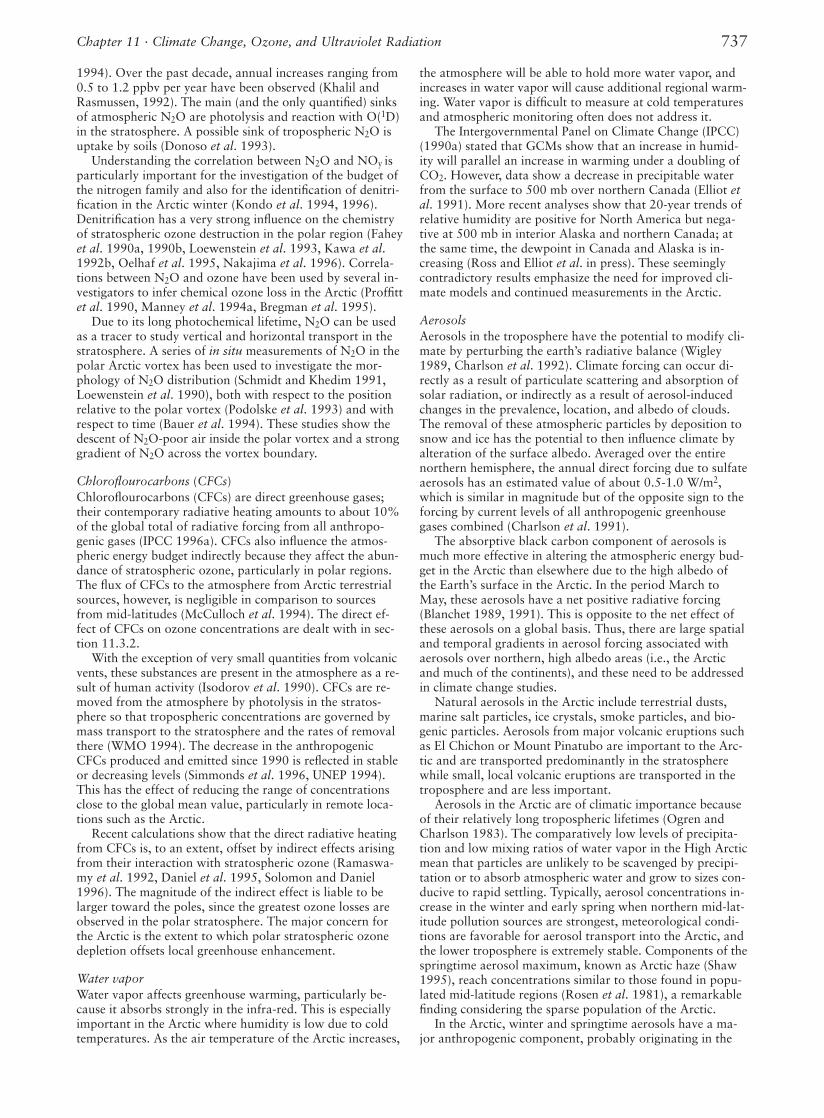
737Chapter 11 · Climate Change, Ozone, and Ultraviolet Radiation
1994). Over the past decade, annual increases ranging from0.5 to 1.2 ppbv per year have been observed (Khalil andRasmussen, 1992). The main (and the only quantified) sinksof atmospheric N2O are photolysis and reaction with O(1D)in the stratosphere. A possible sink of tropospheric N2O isuptake by soils (Donoso et al. 1993).
Understanding the correlation between N2O and NOy isparticularly important for the investigation of the budget ofthe nitrogen family and also for the identification of denitri-fication in the Arctic winter (Kondo et al. 1994, 1996).Denitrification has a very strong influence on the chemistryof stratospheric ozone destruction in the polar region (Faheyet al. 1990a, 1990b, Loewenstein et al. 1993, Kawa et al.1992b, Oelhaf et al. 1995, Nakajima et al. 1996). Correla-tions between N2O and ozone have been used by several in-vestigators to infer chemical ozone loss in the Arctic (Proffittet al. 1990, Manney et al. 1994a, Bregman et al. 1995).
Due to its long photochemical lifetime, N2O can be usedas a tracer to study vertical and horizontal transport in thestratosphere. A series of in situ measurements of N2O in thepolar Arctic vortex has been used to investigate the mor-phology of N2O distribution (Schmidt and Khedim 1991,Loewenstein et al. 1990), both with respect to the positionrelative to the polar vortex (Podolske et al. 1993) and withrespect to time (Bauer et al. 1994). These studies show thedescent of N2O-poor air inside the polar vortex and a stronggradient of N2O across the vortex boundary.
Chloroflourocarbons (CFCs)Chloroflourocarbons (CFCs) are direct greenhouse gases;their contemporary radiative heating amounts to about 10%of the global total of radiative forcing from all anthropo-genic gases (IPCC 1996a). CFCs also influence the atmos-pheric energy budget indirectly because they affect the abun-dance of stratospheric ozone, particularly in polar regions.The flux of CFCs to the atmosphere from Arctic terrestrialsources, however, is negligible in comparison to sourcesfrom mid-latitudes (McCulloch et al. 1994). The direct ef-fect of CFCs on ozone concentrations are dealt with in sec-tion 11.3.2.
With the exception of very small quantities from volcanicvents, these substances are present in the atmosphere as a re-sult of human activity (Isodorov et al. 1990). CFCs are re-moved from the atmosphere by photolysis in the stratos-phere so that tropospheric concentrations are governed bymass transport to the stratosphere and the rates of removalthere (WMO 1994). The decrease in the anthropogenicCFCs produced and emitted since 1990 is reflected in stableor decreasing levels (Simmonds et al. 1996, UNEP 1994).This has the effect of reducing the range of concentrationsclose to the global mean value, particularly in remote loca-tions such as the Arctic.
Recent calculations show that the direct radiative heatingfrom CFCs is, to an extent, offset by indirect effects arisingfrom their interaction with stratospheric ozone (Ramaswa-my et al. 1992, Daniel et al. 1995, Solomon and Daniel1996). The magnitude of the indirect effect is liable to belarger toward the poles, since the greatest ozone losses areobserved in the polar stratosphere. The major concern forthe Arctic is the extent to which polar stratospheric ozonedepletion offsets local greenhouse enhancement.
Water vaporWater vapor affects greenhouse warming, particularly be-cause it absorbs strongly in the infra-red. This is especiallyimportant in the Arctic where humidity is low due to coldtemperatures. As the air temperature of the Arctic increases,
the atmosphere will be able to hold more water vapor, andincreases in water vapor will cause additional regional warm-ing. Water vapor is difficult to measure at cold temperaturesand atmospheric monitoring often does not address it.
The Intergovernmental Panel on Climate Change (IPCC)(1990a) stated that GCMs show that an increase in humid-ity will parallel an increase in warming under a doubling ofCO2. However, data show a decrease in precipitable waterfrom the surface to 500 mb over northern Canada (Elliot etal. 1991). More recent analyses show that 20-year trends ofrelative humidity are positive for North America but nega-tive at 500 mb in interior Alaska and northern Canada; atthe same time, the dewpoint in Canada and Alaska is in-creasing (Ross and Elliot et al. in press). These seeminglycontradictory results emphasize the need for improved cli-mate models and continued measurements in the Arctic.
AerosolsAerosols in the troposphere have the potential to modify cli-mate by perturbing the earth’s radiative balance (Wigley1989, Charlson et al. 1992). Climate forcing can occur di-rectly as a result of particulate scattering and absorption ofsolar radiation, or indirectly as a result of aerosol-inducedchanges in the prevalence, location, and albedo of clouds.The removal of these atmospheric particles by deposition tosnow and ice has the potential to then influence climate byalteration of the surface albedo. Averaged over the entirenorthern hemisphere, the annual direct forcing due to sulfateaerosols has an estimated value of about 0.5-1.0 W/m2,which is similar in magnitude but of the opposite sign to theforcing by current levels of all anthropogenic greenhousegases combined (Charlson et al. 1991).
The absorptive black carbon component of aerosols ismuch more effective in altering the atmospheric energy bud-get in the Arctic than elsewhere due to the high albedo ofthe Earth’s surface in the Arctic. In the period March toMay, these aerosols have a net positive radiative forcing(Blanchet 1989, 1991). This is opposite to the net effect ofthese aerosols on a global basis. Thus, there are large spatialand temporal gradients in aerosol forcing associated withaerosols over northern, high albedo areas (i.e., the Arcticand much of the continents), and these need to be addressedin climate change studies.
Natural aerosols in the Arctic include terrestrial dusts,marine salt particles, ice crystals, smoke particles, and bio-genic particles. Aerosols from major volcanic eruptions suchas El Chichon or Mount Pinatubo are important to the Arc-tic and are transported predominantly in the stratospherewhile small, local volcanic eruptions are transported in thetroposphere and are less important.
Aerosols in the Arctic are of climatic importance becauseof their relatively long tropospheric lifetimes (Ogren andCharlson 1983). The comparatively low levels of precipita-tion and low mixing ratios of water vapor in the High Arcticmean that particles are unlikely to be scavenged by precipi-tation or to absorb atmospheric water and grow to sizes con-ducive to rapid settling. Typically, aerosol concentrations in-crease in the winter and early spring when northern mid-lat-itude pollution sources are strongest, meteorological condi-tions are favorable for aerosol transport into the Arctic, andthe lower troposphere is extremely stable. Components of thespringtime aerosol maximum, known as Arctic haze (Shaw1995), reach concentrations similar to those found in popu-lated mid-latitude regions (Rosen et al. 1981), a remarkablefinding considering the sparse population of the Arctic.
In the Arctic, winter and springtime aerosols have a ma-jor anthropogenic component, probably originating in the
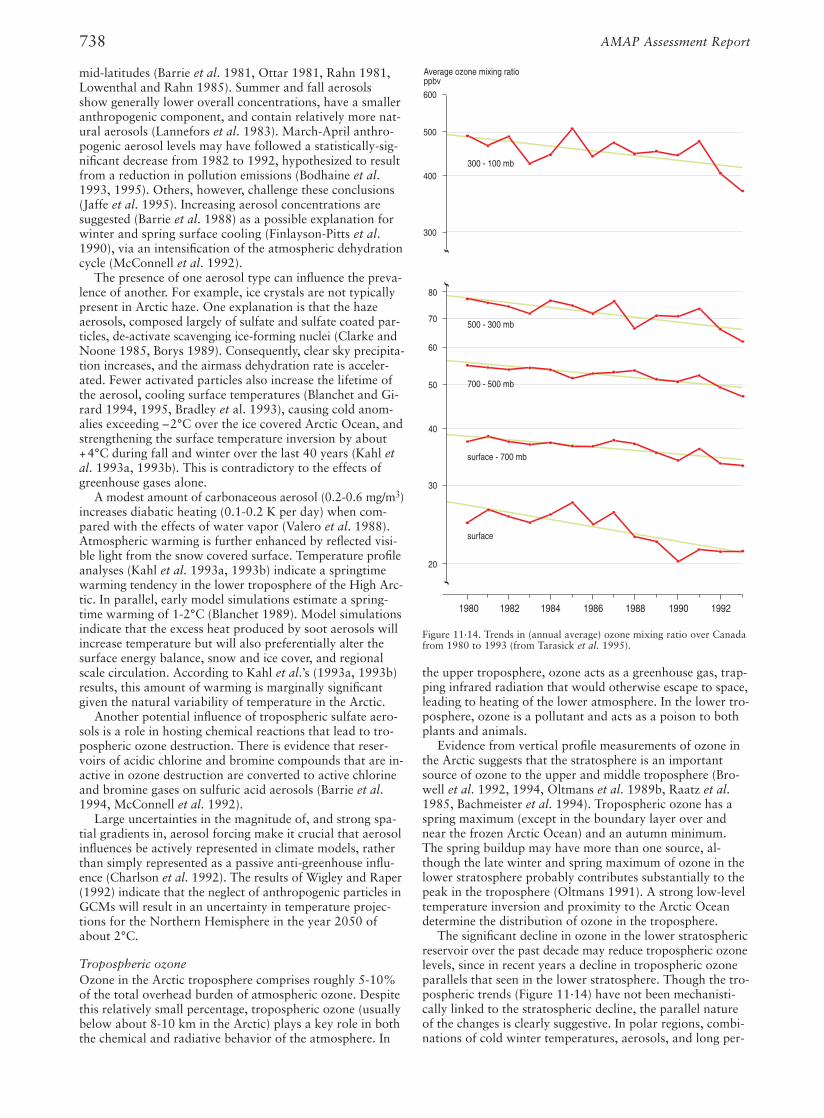
738 AMAP Assessment Report
the upper troposphere, ozone acts as a greenhouse gas, trap-ping infrared radiation that would otherwise escape to space,leading to heating of the lower atmosphere. In the lower tro-posphere, ozone is a pollutant and acts as a poison to bothplants and animals.
Evidence from vertical profile measurements of ozone inthe Arctic suggests that the stratosphere is an importantsource of ozone to the upper and middle troposphere (Bro-well et al. 1992, 1994, Oltmans et al. 1989b, Raatz et al.1985, Bachmeister et al. 1994). Tropospheric ozone has aspring maximum (except in the boundary layer over andnear the frozen Arctic Ocean) and an autumn minimum.The spring buildup may have more than one source, al-though the late winter and spring maximum of ozone in thelower stratosphere probably contributes substantially to thepeak in the troposphere (Oltmans 1991). A strong low-leveltemperature inversion and proximity to the Arctic Oceandetermine the distribution of ozone in the troposphere.
The significant decline in ozone in the lower stratosphericreservoir over the past decade may reduce tropospheric ozonelevels, since in recent years a decline in tropospheric ozoneparallels that seen in the lower stratosphere. Though the tro-pospheric trends (Figure 11·14) have not been mechanisti-cally linked to the stratospheric decline, the parallel natureof the changes is clearly suggestive. In polar regions, combi-nations of cold winter temperatures, aerosols, and long per-
mid-latitudes (Barrie et al. 1981, Ottar 1981, Rahn 1981,Lowenthal and Rahn 1985). Summer and fall aerosolsshow generally lower overall concentrations, have a smalleranthropogenic component, and contain relatively more nat-ural aerosols (Lannefors et al. 1983). March-April anthro-pogenic aerosol levels may have followed a statistically-sig-nificant decrease from 1982 to 1992, hypothesized to resultfrom a reduction in pollution emissions (Bodhaine et al.1993, 1995). Others, however, challenge these conclusions(Jaffe et al. 1995). Increasing aerosol concentrations aresuggested (Barrie et al. 1988) as a possible explanation forwinter and spring surface cooling (Finlayson-Pitts et al.1990), via an intensification of the atmospheric dehydrationcycle (McConnell et al. 1992).
The presence of one aerosol type can influence the preva-lence of another. For example, ice crystals are not typicallypresent in Arctic haze. One explanation is that the hazeaerosols, composed largely of sulfate and sulfate coated par-ticles, de-activate scavenging ice-forming nuclei (Clarke andNoone 1985, Borys 1989). Consequently, clear sky precipita-tion increases, and the airmass dehydration rate is acceler-ated. Fewer activated particles also increase the lifetime ofthe aerosol, cooling surface temperatures (Blanchet and Gi-rard 1994, 1995, Bradley et al. 1993), causing cold anom-alies exceeding –2°C over the ice covered Arctic Ocean, andstrengthening the surface temperature inversion by about+4°C during fall and winter over the last 40 years (Kahl etal. 1993a, 1993b). This is contradictory to the effects ofgreenhouse gases alone.
A modest amount of carbonaceous aerosol (0.2-0.6 mg/m3)increases diabatic heating (0.1-0.2 K per day) when com-pared with the effects of water vapor (Valero et al. 1988).Atmospheric warming is further enhanced by reflected visi-ble light from the snow covered surface. Temperature profileanalyses (Kahl et al. 1993a, 1993b) indicate a springtimewarming tendency in the lower troposphere of the High Arc-tic. In parallel, early model simulations estimate a spring-time warming of 1-2°C (Blanchet 1989). Model simulationsindicate that the excess heat produced by soot aerosols willincrease temperature but will also preferentially alter thesurface energy balance, snow and ice cover, and regionalscale circulation. According to Kahl et al.’s (1993a, 1993b)results, this amount of warming is marginally significantgiven the natural variability of temperature in the Arctic.
Another potential influence of tropospheric sulfate aero-sols is a role in hosting chemical reactions that lead to tro-pospheric ozone destruction. There is evidence that reser-voirs of acidic chlorine and bromine compounds that are in-active in ozone destruction are converted to active chlorineand bromine gases on sulfuric acid aerosols (Barrie et al.1994, McConnell et al. 1992).
Large uncertainties in the magnitude of, and strong spa-tial gradients in, aerosol forcing make it crucial that aerosolinfluences be actively represented in climate models, ratherthan simply represented as a passive anti-greenhouse influ-ence (Charlson et al. 1992). The results of Wigley and Raper(1992) indicate that the neglect of anthropogenic particles inGCMs will result in an uncertainty in temperature projec-tions for the Northern Hemisphere in the year 2050 ofabout 2°C.
Tropospheric ozoneOzone in the Arctic troposphere comprises roughly 5-10%of the total overhead burden of atmospheric ozone. Despitethis relatively small percentage, tropospheric ozone (usuallybelow about 8-10 km in the Arctic) plays a key role in boththe chemical and radiative behavior of the atmosphere. In
1980 1982 1984 1986 1988 1990 1992
20
30
40
50
60
80
70
300 - 100 mb
500 - 300 mb
700 - 500 mb
surface - 700 mb
surface
Average ozone mixing ratioppbv
300
400
500
600
Figure 11·14. Trends in (annual average) ozone mixing ratio over Canadafrom 1980 to 1993 (from Tarasick et al. 1995).
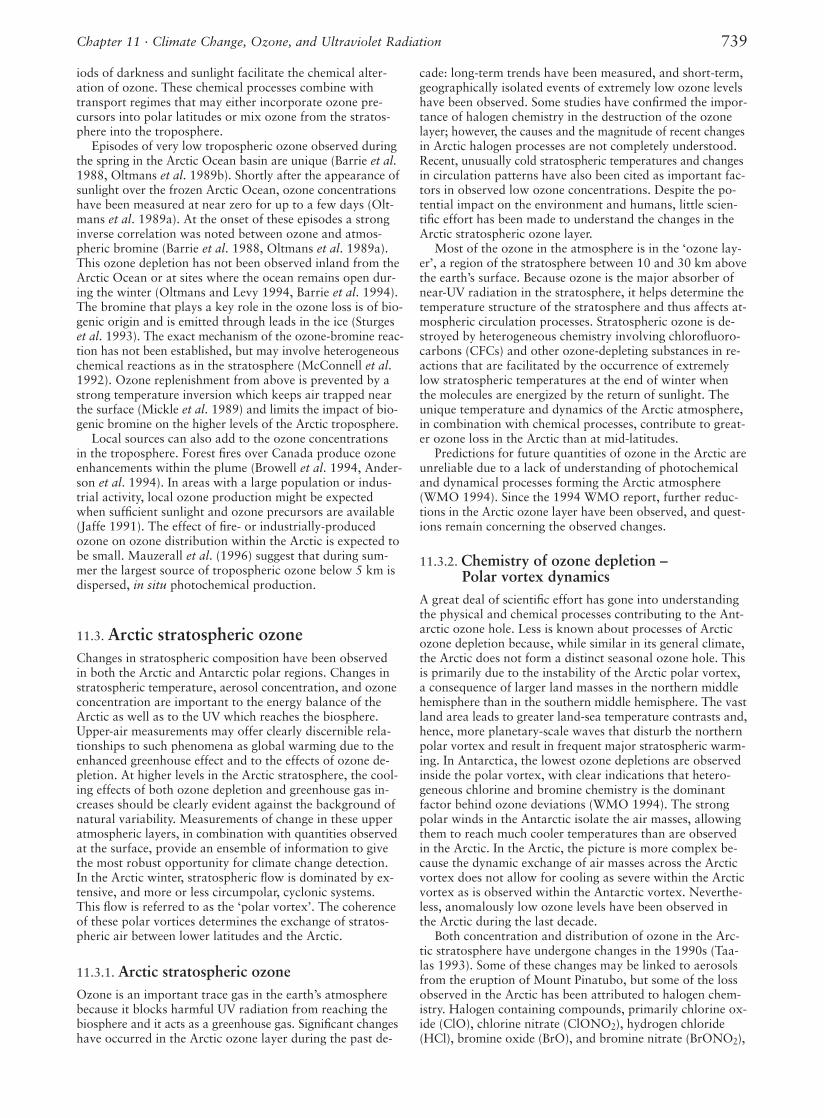
739Chapter 11 · Climate Change, Ozone, and Ultraviolet Radiation
iods of darkness and sunlight facilitate the chemical alter-ation of ozone. These chemical processes combine withtransport regimes that may either incorporate ozone pre-cursors into polar latitudes or mix ozone from the stratos-phere into the troposphere.
Episodes of very low tropospheric ozone observed duringthe spring in the Arctic Ocean basin are unique (Barrie et al.1988, Oltmans et al. 1989b). Shortly after the appearance ofsunlight over the frozen Arctic Ocean, ozone concentrationshave been measured at near zero for up to a few days (Olt-mans et al. 1989a). At the onset of these episodes a stronginverse correlation was noted between ozone and atmos-pheric bromine (Barrie et al. 1988, Oltmans et al. 1989a).This ozone depletion has not been observed inland from theArctic Ocean or at sites where the ocean remains open dur-ing the winter (Oltmans and Levy 1994, Barrie et al. 1994).The bromine that plays a key role in the ozone loss is of bio-genic origin and is emitted through leads in the ice (Sturgeset al. 1993). The exact mechanism of the ozone-bromine reac-tion has not been established, but may involve heterogeneouschemical reactions as in the stratosphere (McConnell et al.1992). Ozone replenishment from above is prevented by astrong temperature inversion which keeps air trapped nearthe surface (Mickle et al. 1989) and limits the impact of bio-genic bromine on the higher levels of the Arctic troposphere.
Local sources can also add to the ozone concentrationsin the troposphere. Forest fires over Canada produce ozoneenhancements within the plume (Browell et al. 1994, Ander-son et al. 1994). In areas with a large population or indus-trial activity, local ozone production might be expectedwhen sufficient sunlight and ozone precursors are available(Jaffe 1991). The effect of fire- or industrially-producedozone on ozone distribution within the Arctic is expected tobe small. Mauzerall et al. (1996) suggest that during sum-mer the largest source of tropospheric ozone below 5 km isdispersed, in situ photochemical production.
11.3. Arctic stratospheric ozoneChanges in stratospheric composition have been observedin both the Arctic and Antarctic polar regions. Changes instratospheric temperature, aerosol concentration, and ozoneconcentration are important to the energy balance of theArctic as well as to the UV which reaches the biosphere.Upper-air measurements may offer clearly discernible rela-tionships to such phenomena as global warming due to theenhanced greenhouse effect and to the effects of ozone de-pletion. At higher levels in the Arctic stratosphere, the cool-ing effects of both ozone depletion and greenhouse gas in-creases should be clearly evident against the background ofnatural variability. Measurements of change in these upperatmospheric layers, in combination with quantities observedat the surface, provide an ensemble of information to givethe most robust opportunity for climate change detection.In the Arctic winter, stratospheric flow is dominated by ex-tensive, and more or less circumpolar, cyclonic systems.This flow is referred to as the ‘polar vortex’. The coherenceof these polar vortices determines the exchange of stratos-pheric air between lower latitudes and the Arctic.
11.3.1. Arctic stratospheric ozoneOzone is an important trace gas in the earth’s atmospherebecause it blocks harmful UV radiation from reaching thebiosphere and it acts as a greenhouse gas. Significant changeshave occurred in the Arctic ozone layer during the past de-
cade: long-term trends have been measured, and short-term,geographically isolated events of extremely low ozone levelshave been observed. Some studies have confirmed the impor-tance of halogen chemistry in the destruction of the ozonelayer; however, the causes and the magnitude of recent changesin Arctic halogen processes are not completely understood.Recent, unusually cold stratospheric temperatures and changesin circulation patterns have also been cited as important fac-tors in observed low ozone concentrations. Despite the po-tential impact on the environment and humans, little scien-tific effort has been made to understand the changes in theArctic stratospheric ozone layer.
Most of the ozone in the atmosphere is in the ‘ozone lay-er’, a region of the stratosphere between 10 and 30 km abovethe earth’s surface. Because ozone is the major absorber ofnear-UV radiation in the stratosphere, it helps determine thetemperature structure of the stratosphere and thus affects at-mospheric circulation processes. Stratospheric ozone is de-stroyed by heterogeneous chemistry involving chlorofluoro-carbons (CFCs) and other ozone-depleting substances in re-actions that are facilitated by the occurrence of extremelylow stratospheric temperatures at the end of winter whenthe molecules are energized by the return of sunlight. Theunique temperature and dynamics of the Arctic atmosphere,in combination with chemical processes, contribute to great-er ozone loss in the Arctic than at mid-latitudes.
Predictions for future quantities of ozone in the Arctic areunreliable due to a lack of understanding of photochemicaland dynamical processes forming the Arctic atmosphere(WMO 1994). Since the 1994 WMO report, further reduc-tions in the Arctic ozone layer have been observed, and quest-ions remain concerning the observed changes.
11.3.2. Chemistry of ozone depletion – Polar vortex dynamics
A great deal of scientific effort has gone into understandingthe physical and chemical processes contributing to the Ant-arctic ozone hole. Less is known about processes of Arcticozone depletion because, while similar in its general climate,the Arctic does not form a distinct seasonal ozone hole. Thisis primarily due to the instability of the Arctic polar vortex,a consequence of larger land masses in the northern middlehemisphere than in the southern middle hemisphere. The vastland area leads to greater land-sea temperature contrasts and,hence, more planetary-scale waves that disturb the northernpolar vortex and result in frequent major stratospheric warm-ing. In Antarctica, the lowest ozone depletions are observedinside the polar vortex, with clear indications that hetero-geneous chlorine and bromine chemistry is the dominantfactor behind ozone deviations (WMO 1994). The strongpolar winds in the Antarctic isolate the air masses, allowingthem to reach much cooler temperatures than are observedin the Arctic. In the Arctic, the picture is more complex be-cause the dynamic exchange of air masses across the Arcticvortex does not allow for cooling as severe within the Arcticvortex as is observed within the Antarctic vortex. Neverthe-less, anomalously low ozone levels have been observed inthe Arctic during the last decade.
Both concentration and distribution of ozone in the Arc-tic stratosphere have undergone changes in the 1990s (Taa-las 1993). Some of these changes may be linked to aerosolsfrom the eruption of Mount Pinatubo, but some of the lossobserved in the Arctic has been attributed to halogen chem-istry. Halogen containing compounds, primarily chlorine ox-ide (ClO), chlorine nitrate (ClONO2), hydrogen chloride(HCl), bromine oxide (BrO), and bromine nitrate (BrONO2),

740 AMAP Assessment Report
larly significant in the stratosphere over the South Pole dur-ing the austral spring, where ozone depletion is constrainedwithin the Antarctic polar vortex, leading to the ozone hole.They are potentially more important in the Arctic region be-cause of the high level of biological activity in the Arcticwhich would be directly affected by increased UV radiation.Reductions of over 40% have been observed in the winterstratosphere at high northern latitudes (SESAME 1995). Theimpact of these reductions in ozone on UV radiation and itseffect on biological systems are not yet fully understood.
11.3.3. Measurements of stratospheric ozoneGround-based, airborne (such as balloon and aircraft), andsatellite instruments are used to monitor ozone and supplydata to determine ozone trends in the stratosphere. Some in-struments monitor only total atmospheric ozone, while oth-ers measure ozone profiles with varying degrees of verticalresolution and range. The ground-based Dobson network,used for measuring total ozone above the location of eachinstrument, was first established in 1958 (Dobson 1968a).Today, data from about 50 stations are used for analyzingglobal trends in ozone (Bojkov et al. 1995a) (Table 11·2).
Since the late-1970s, satellites have been used to measureozone globally. Many of these satellites are not appropriatefor Arctic research, however, because of limited latitudinalrange or dependence on sunlight (Miller 1989, WMO 1988).Satellite measurements have helped advance understandingof both dynamical and chemical processes that determinethe distribution of stratospheric ozone. The satellite instru-ments listed in Table 11·3 use several different techniquesto measure ozone in the stratosphere. Not all of the satelliteinstruments are appropriate for year-round monitoring ofthe polar ozone layer. Two satellites presently in orbit con-tain ozone monitoring equipment appropriate for the Arctic.The Global Ozone Monitoring Experiment (GOME) onERS-2 satellite, launched in 1995, takes measurements ofArctic ozone daily. The EarthProbe satellite, launched in1997, also has a Total Ozone Mapping System (TOMS) in-strument aboard.
11.3.4. Results of measurementsA variety of analyses of ozone data have shown a decreasein Arctic ozone over the past three decades, most of whichhas occurred since 1980. Results from some of these analy-ses are summarized in Table 11·4. A major part of the ob-served ozone decrease is attributed to increased amounts ofstratospheric chlorine (ClO) and resulting heterogeneouschemical losses on polar stratospheric cloud particles andsulfate aerosols (WMO 1992, 1995). Many aspects of theobserved changes in Arctic ozone are not well understood,and the relative importance of additional processes, includ-ing stratospheric cooling and dynamical changes, is an areaof active research. Complicating the search for long-termtrends are natural, nonlinear disturbances, such as the signi-ficant decrease in ozone which occurred during the early1990s following the injection of sulfate aerosols by theMount Pinatubo volcanic eruption (Randel et al. 1995).Longer-term variations in other variables such as tempera-ture and aerosol surface area distribution may also havecontributed to the magnitude and timing of ozone losses inthe northern hemisphere (Solomon and Daniel 1996).
Because of the temperature dependence of heterogeneousreaction rates, decreased temperature in the lower stratos-phere may further accelerate chemical losses of ozone (e.g.,Herman and Larko 1994). Randel and Cobb (1994) sug-
appear to be most important. Cold temperatures and polarstratospheric clouds or aerosols found in the Arctic activate thehalogen chemical processes that facilitate ozone destruction.
Stratospheric halogens arise primarily from anthropo-genic emission of chlorine- and bromine-containing sub-stances in the troposphere. These CFCs do not react in thetroposphere and are transported into the stratosphere. Thistransport occurs primarily across the tropical tropopauseand can take 2-3 years (Schmidt and Khedim 1991). TheCFCs then circulate toward the polar regions and to higheraltitudes in the stratosphere, where they are photolysed byultraviolet radiation (SORG 1987). CFCs photolyse as theypass poleward: the stratospheric concentration of CFC-11,for example, at 20 km is 10-20% of that in the troposphere(Fraser et al. 1994). CFCs can also act as tracers: the shapeof the CFC-12 concentration profile has been used by Not-holt (1994) to show the subsidence of stratospheric air dur-ing winter above Ny-Ålesund, Spitsbergen.
Almost all of the CFC-11 and a significant portion of theother abundant CFCs (CFC-12 and CFC-113) are decom-posed by photolysis during transport from the troposphere tothe stratosphere (Kawa et al. 1992a, Woodbridge et al. 1995).The photolysis products that most affect stratospheric chem-istry are chlorine (Cl) and chlorine oxide (ClO), which reactwith ozone in a catalytic cycle that regenerates the chlorineatom. Chlorine eventually forms stable reservoir species thatare inactive toward ozone, such as hydrogen chloride andchlorine nitrate. In the presence of polar stratospheric clouds,however, these reservoir species can decompose and augmentthe abundance of active chlorine in the polar stratosphere.Current global concentrations of active stratospheric chlo-rine are about 3.5 ppbv, substantially higher than the nat-ural background of 0.6 ppbv which arises mainly from thestratospheric degradation of methyl chloride (WMO 1995).
The importance of ClO lies in its ability to catalyze thedestruction of ozone. By a sequence of reactions involvingClO, BrO, and sunlight, the ozone concentration in thepolar stratosphere is reduced. These reactions are particu-
Table 11·2. Total column ozone measurement stations a.–––––––––––––––––––––––––––––––––––––––––––––––––––––––––––––––––
Toron- Year Longi-to data- measure- Lati- tude, °base ments Location Location tude, (negative,St.no. started name country °N if west)
–––––––––––––––––––––––––––––––––––––––––––––––––––––––––––––––––005 1957 Dikson Island Russia 73.50 80.23018 1957 Alert Canada 82.50 –62.30024 1957 Resolute Canada 74.72 –94.98042 1957 St. Petersburg Russia 59.97 30.30043 1952 Lerwick UK 60.13 –1.18051 1952 Reykjavik Iceland 64.13 –21.90052 1943 Tromsø Norway 69.65 18.95089 1990 Ny-Ålesund, Svalbard Norway 78.93 11.88105 1963 Fairbanks USA 64.82 –147.87114 1974 Heiss Island Russia 80.62 58.10117 1961 Murmansk Russia 68.97 33.05118 1962 Nagaevo Russia 59.58 150.78123 1973 Yakutsk Russia 62.08 129.75129 1973 Pechora Russia 65.12 57.10140 1990 Thule Greenland 76.52 –68.76142 1973 Igarka Russia 67.47 86.57144 1973 Markovo Russia 64.68 170.42145 1974 Olenek Russia 68.50 112.43148 1973 Vitim Russia 59.45 112.58150 1974 Mansijsk Russia 60.97 69.07165 1946 Oslo Norway 59.91 10.72186 1975 Tiksi Russia 71.58 128.92189 1970 Hornsund, Svalbard Norway 77.00 15.55
–––––––––––––––––––––––––––––––––––––––––––––––––––––––––––––––––a. Total column ozone levels have been measured for the past several de-
cades in or near the Arctic. Despite their importance for scientific re-search and long-term monitoring, many of these stations are underthreat of being shut down due to budget considerations. The data fromthese stations are available from the World Ozone and UV Data Centerin Toronto, Canada.
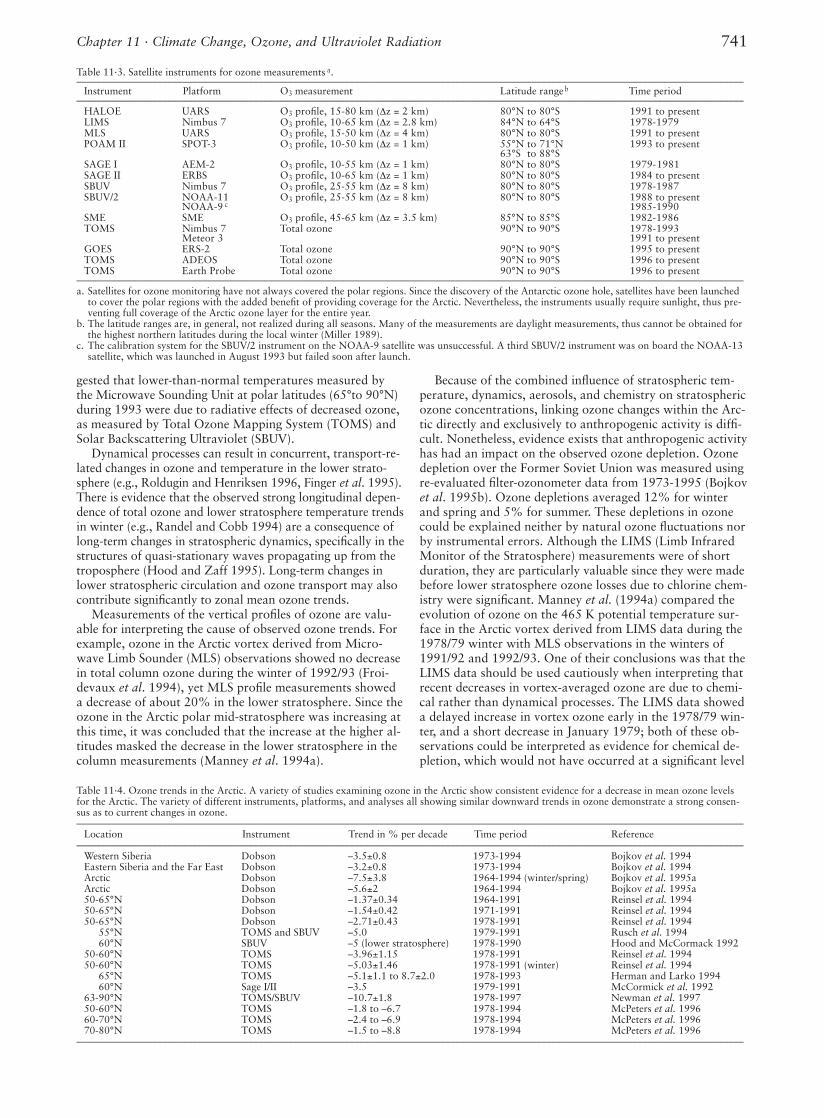
741Chapter 11 · Climate Change, Ozone, and Ultraviolet Radiation
gested that lower-than-normal temperatures measured bythe Microwave Sounding Unit at polar latitudes (65°to 90°N)during 1993 were due to radiative effects of decreased ozone,as measured by Total Ozone Mapping System (TOMS) andSolar Backscattering Ultraviolet (SBUV).
Dynamical processes can result in concurrent, transport-re-lated changes in ozone and temperature in the lower strato-sphere (e.g., Roldugin and Henriksen 1996, Finger et al. 1995).There is evidence that the observed strong longitudinal depen-dence of total ozone and lower stratosphere temperature trendsin winter (e.g., Randel and Cobb 1994) are a consequence oflong-term changes in stratospheric dynamics, specifically in thestructures of quasi-stationary waves propagating up from thetroposphere (Hood and Zaff 1995). Long-term changes inlower stratospheric circulation and ozone transport may alsocontribute significantly to zonal mean ozone trends.
Measurements of the vertical profiles of ozone are valu-able for interpreting the cause of observed ozone trends. Forexample, ozone in the Arctic vortex derived from Micro-wave Limb Sounder (MLS) observations showed no decreasein total column ozone during the winter of 1992/93 (Froi-devaux et al. 1994), yet MLS profile measurements showeda decrease of about 20% in the lower stratosphere. Since theozone in the Arctic polar mid-stratosphere was increasing atthis time, it was concluded that the increase at the higher al-titudes masked the decrease in the lower stratosphere in thecolumn measurements (Manney et al. 1994a).
Because of the combined influence of stratospheric tem-perature, dynamics, aerosols, and chemistry on stratosphericozone concentrations, linking ozone changes within the Arc-tic directly and exclusively to anthropogenic activity is diffi-cult. Nonetheless, evidence exists that anthropogenic activityhas had an impact on the observed ozone depletion. Ozonedepletion over the Former Soviet Union was measured usingre-evaluated filter-ozonometer data from 1973-1995 (Bojkovet al. 1995b). Ozone depletions averaged 12% for winterand spring and 5% for summer. These depletions in ozonecould be explained neither by natural ozone fluctuations norby instrumental errors. Although the LIMS (Limb InfraredMonitor of the Stratosphere) measurements were of shortduration, they are particularly valuable since they were madebefore lower stratosphere ozone losses due to chlorine chem-istry were significant. Manney et al. (1994a) compared theevolution of ozone on the 465 K potential temperature sur-face in the Arctic vortex derived from LIMS data during the1978/79 winter with MLS observations in the winters of1991/92 and 1992/93. One of their conclusions was that theLIMS data should be used cautiously when interpreting thatrecent decreases in vortex-averaged ozone are due to chemi-cal rather than dynamical processes. The LIMS data showeda delayed increase in vortex ozone early in the 1978/79 win-ter, and a short decrease in January 1979; both of these ob-servations could be interpreted as evidence for chemical de-pletion, which would not have occurred at a significant level
Table 11·3. Satellite instruments for ozone measurements a.––––––––––––––––––––––––––––––––––––––––––––––––––––––––––––––––––––––––––––––––––––––––––––––––––––––––––––––––––––––––––––––––––––
Instrument Platform O3 measurement Latitude rangeb Time period––––––––––––––––––––––––––––––––––––––––––––––––––––––––––––––––––––––––––––––––––––––––––––––––––––––––––––––––––––––––––––––––––––
HALOE UARS O3 profile, 15-80 km (∆z = 2 km) 80°N to 80°S 1991 to presentLIMS Nimbus 7 O3 profile, 10-65 km (∆z = 2.8 km) 84°N to 64°S 1978-1979MLS UARS O3 profile, 15-50 km (∆z = 4 km) 80°N to 80°S 1991 to presentPOAM II SPOT-3 O3 profile, 10-50 km (∆z = 1 km) 55°N to 71°N 1993 to present
63°S to 88°SSAGE I AEM-2 O3 profile, 10-55 km (∆z = 1 km) 80°N to 80°S 1979-1981SAGE II ERBS O3 profile, 10-65 km (∆z = 1 km) 80°N to 80°S 1984 to presentSBUV Nimbus 7 O3 profile, 25-55 km (∆z = 8 km) 80°N to 80°S 1978-1987SBUV/2 NOAA-11 O3 profile, 25-55 km (∆z = 8 km) 80°N to 80°S 1988 to present
NOAA-9 c 1985-1990SME SME O3 profile, 45-65 km (∆z = 3.5 km) 85°N to 85°S 1982-1986TOMS Nimbus 7 Total ozone 90°N to 90°S 1978-1993
Meteor 3 1991 to presentGOES ERS-2 Total ozone 90°N to 90°S 1995 to presentTOMS ADEOS Total ozone 90°N to 90°S 1996 to presentTOMS Earth Probe Total ozone 90°N to 90°S 1996 to present
––––––––––––––––––––––––––––––––––––––––––––––––––––––––––––––––––––––––––––––––––––––––––––––––––––––––––––––––––––––––––––––––––––a. Satellites for ozone monitoring have not always covered the polar regions. Since the discovery of the Antarctic ozone hole, satellites have been launched
to cover the polar regions with the added benefit of providing coverage for the Arctic. Nevertheless, the instruments usually require sunlight, thus pre-venting full coverage of the Arctic ozone layer for the entire year.
b. The latitude ranges are, in general, not realized during all seasons. Many of the measurements are daylight measurements, thus cannot be obtained forthe highest northern latitudes during the local winter (Miller 1989).
c. The calibration system for the SBUV/2 instrument on the NOAA-9 satellite was unsuccessful. A third SBUV/2 instrument was on board the NOAA-13satellite, which was launched in August 1993 but failed soon after launch.
Table 11·4. Ozone trends in the Arctic. A variety of studies examining ozone in the Arctic show consistent evidence for a decrease in mean ozone levelsfor the Arctic. The variety of different instruments, platforms, and analyses all showing similar downward trends in ozone demonstrate a strong consen-sus as to current changes in ozone.––––––––––––––––––––––––––––––––––––––––––––––––––––––––––––––––––––––––––––––––––––––––––––––––––––––––––––––––––––––––––––––––––––
Location Instrument Trend in % per decade Time period Reference––––––––––––––––––––––––––––––––––––––––––––––––––––––––––––––––––––––––––––––––––––––––––––––––––––––––––––––––––––––––––––––––––––
Western Siberia Dobson –3.5±0.8 1973-1994 Bojkov et al. 1994Eastern Siberia and the Far East Dobson –3.2±0.8 1973-1994 Bojkov et al. 1994Arctic Dobson –7.5±3.8 1964-1994 (winter/spring) Bojkov et al. 1995aArctic Dobson –5.6±2 1964-1994 Bojkov et al. 1995a50-65°N Dobson –1.37±0.34 1964-1991 Reinsel et al. 199450-65°N Dobson –1.54±0.42 1971-1991 Reinsel et al. 199450-65°N Dobson –2.71±0.43 1978-1991 Reinsel et al. 199400-55°N TOMS and SBUV –5.0 1979-1991 Rusch et al. 199400-60°N SBUV –5 (lower stratosphere) 1978-1990 Hood and McCormack 199250-60°N TOMS –3.96±1.15 1978-1991 Reinsel et al. 199450-60°N TOMS –5.03±1.46 1978-1991 (winter) Reinsel et al. 199400-65°N TOMS –5.1±1.1 to 8.7±2.0 1978-1993 Herman and Larko 199400-60°N Sage I/II –3.5 1979-1991 McCormick et al. 199263-90°N TOMS/SBUV –10.7±1.8 1978-1997 Newman et al. 199750-60°N TOMS –1.8 to –6.7 1978-1994 McPeters et al. 199660-70°N TOMS –2.4 to –6.9 1978-1994 McPeters et al. 199670-80°N TOMS –1.5 to –8.8 1978-1994 McPeters et al. 1996
––––––––––––––––––––––––––––––––––––––––––––––––––––––––––––––––––––––––––––––––––––––––––––––––––––––––––––––––––––––––––––––––––––
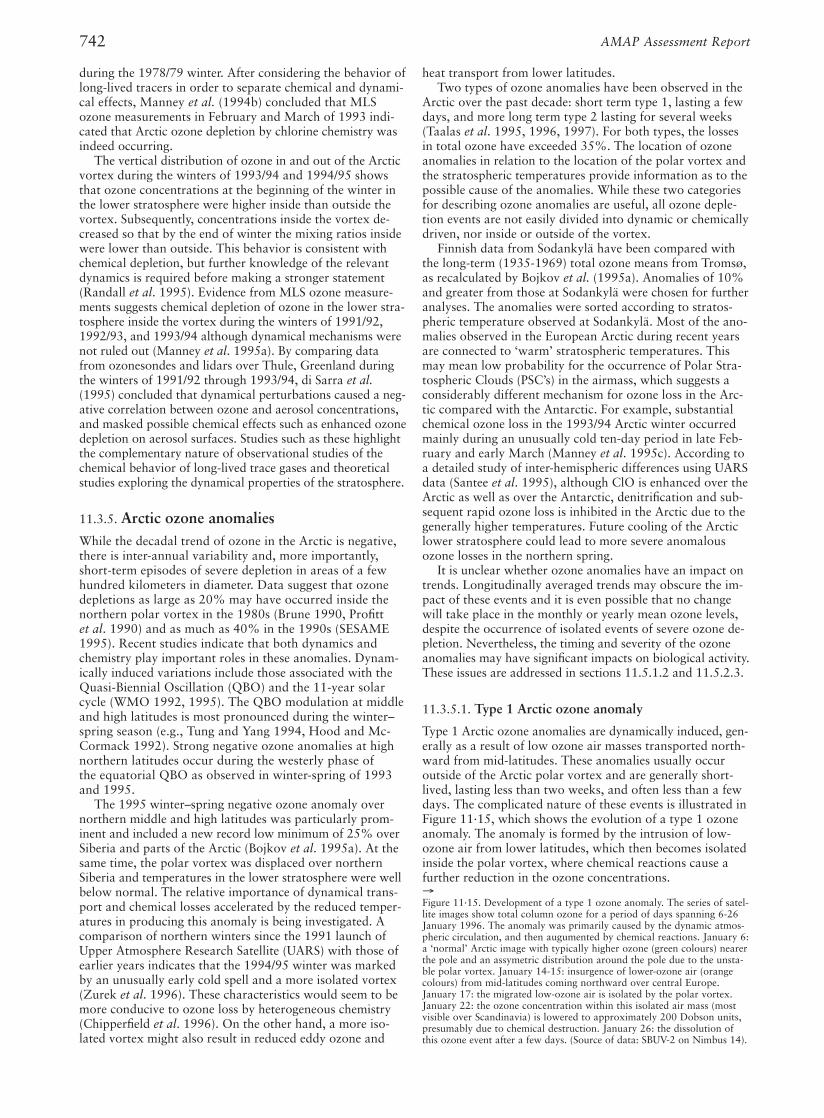
742 AMAP Assessment Report
heat transport from lower latitudes.Two types of ozone anomalies have been observed in the
Arctic over the past decade: short term type 1, lasting a fewdays, and more long term type 2 lasting for several weeks(Taalas et al. 1995, 1996, 1997). For both types, the lossesin total ozone have exceeded 35%. The location of ozoneanomalies in relation to the location of the polar vortex andthe stratospheric temperatures provide information as to thepossible cause of the anomalies. While these two categoriesfor describing ozone anomalies are useful, all ozone deple-tion events are not easily divided into dynamic or chemicallydriven, nor inside or outside of the vortex.
Finnish data from Sodankylä have been compared withthe long-term (1935-1969) total ozone means from Tromsø,as recalculated by Bojkov et al. (1995a). Anomalies of 10%and greater from those at Sodankylä were chosen for furtheranalyses. The anomalies were sorted according to stratos-pheric temperature observed at Sodankylä. Most of the ano-malies observed in the European Arctic during recent yearsare connected to ‘warm’ stratospheric temperatures. Thismay mean low probability for the occurrence of Polar Stra-tospheric Clouds (PSC’s) in the airmass, which suggests aconsiderably different mechanism for ozone loss in the Arc-tic compared with the Antarctic. For example, substantialchemical ozone loss in the 1993/94 Arctic winter occurredmainly during an unusually cold ten-day period in late Feb-ruary and early March (Manney et al. 1995c). According toa detailed study of inter-hemispheric differences using UARSdata (Santee et al. 1995), although ClO is enhanced over theArctic as well as over the Antarctic, denitrification and sub-sequent rapid ozone loss is inhibited in the Arctic due to thegenerally higher temperatures. Future cooling of the Arcticlower stratosphere could lead to more severe anomalousozone losses in the northern spring.
It is unclear whether ozone anomalies have an impact ontrends. Longitudinally averaged trends may obscure the im-pact of these events and it is even possible that no changewill take place in the monthly or yearly mean ozone levels,despite the occurrence of isolated events of severe ozone de-pletion. Nevertheless, the timing and severity of the ozoneanomalies may have significant impacts on biological activity.These issues are addressed in sections 11.5.1.2 and 11.5.2.3.
11.3.5.1. Type 1 Arctic ozone anomaly
Type 1 Arctic ozone anomalies are dynamically induced, gen-erally as a result of low ozone air masses transported north-ward from mid-latitudes. These anomalies usually occuroutside of the Arctic polar vortex and are generally short-lived, lasting less than two weeks, and often less than a fewdays. The complicated nature of these events is illustrated inFigure 11·15, which shows the evolution of a type 1 ozoneanomaly. The anomaly is formed by the intrusion of low-ozone air from lower latitudes, which then becomes isolatedinside the polar vortex, where chemical reactions cause afurther reduction in the ozone concentrations.
during the 1978/79 winter. After considering the behavior oflong-lived tracers in order to separate chemical and dynami-cal effects, Manney et al. (1994b) concluded that MLSozone measurements in February and March of 1993 indi-cated that Arctic ozone depletion by chlorine chemistry wasindeed occurring.
The vertical distribution of ozone in and out of the Arcticvortex during the winters of 1993/94 and 1994/95 showsthat ozone concentrations at the beginning of the winter inthe lower stratosphere were higher inside than outside thevortex. Subsequently, concentrations inside the vortex de-creased so that by the end of winter the mixing ratios insidewere lower than outside. This behavior is consistent withchemical depletion, but further knowledge of the relevantdynamics is required before making a stronger statement(Randall et al. 1995). Evidence from MLS ozone measure-ments suggests chemical depletion of ozone in the lower stra-tosphere inside the vortex during the winters of 1991/92,1992/93, and 1993/94 although dynamical mechanisms werenot ruled out (Manney et al. 1995a). By comparing datafrom ozonesondes and lidars over Thule, Greenland duringthe winters of 1991/92 through 1993/94, di Sarra et al.(1995) concluded that dynamical perturbations caused a neg-ative correlation between ozone and aerosol concentrations,and masked possible chemical effects such as enhanced ozonedepletion on aerosol surfaces. Studies such as these highlightthe complementary nature of observational studies of thechemical behavior of long-lived trace gases and theoreticalstudies exploring the dynamical properties of the stratosphere.
11.3.5. Arctic ozone anomaliesWhile the decadal trend of ozone in the Arctic is negative,there is inter-annual variability and, more importantly,short-term episodes of severe depletion in areas of a fewhundred kilometers in diameter. Data suggest that ozonedepletions as large as 20% may have occurred inside thenorthern polar vortex in the 1980s (Brune 1990, Profittet al. 1990) and as much as 40% in the 1990s (SESAME1995). Recent studies indicate that both dynamics andchemistry play important roles in these anomalies. Dynam-ically induced variations include those associated with theQuasi-Biennial Oscillation (QBO) and the 11-year solarcycle (WMO 1992, 1995). The QBO modulation at middleand high latitudes is most pronounced during the winter–spring season (e.g., Tung and Yang 1994, Hood and Mc-Cormack 1992). Strong negative ozone anomalies at highnorthern latitudes occur during the westerly phase ofthe equatorial QBO as observed in winter-spring of 1993and 1995.
The 1995 winter–spring negative ozone anomaly overnorthern middle and high latitudes was particularly prom-inent and included a new record low minimum of 25% overSiberia and parts of the Arctic (Bojkov et al. 1995a). At thesame time, the polar vortex was displaced over northernSiberia and temperatures in the lower stratosphere were wellbelow normal. The relative importance of dynamical trans-port and chemical losses accelerated by the reduced temper-atures in producing this anomaly is being investigated. Acomparison of northern winters since the 1991 launch ofUpper Atmosphere Research Satellite (UARS) with those ofearlier years indicates that the 1994/95 winter was markedby an unusually early cold spell and a more isolated vortex(Zurek et al. 1996). These characteristics would seem to bemore conducive to ozone loss by heterogeneous chemistry(Chipperfield et al. 1996). On the other hand, a more iso-lated vortex might also result in reduced eddy ozone and
→Figure 11·15. Development of a type 1 ozone anomaly. The series of satel-lite images show total column ozone for a period of days spanning 6-26January 1996. The anomaly was primarily caused by the dynamic atmos-pheric circulation, and then augumented by chemical reactions. January 6:a ‘normal’ Arctic image with typically higher ozone (green colours) nearerthe pole and an assymetric distribution around the pole due to the unsta-ble polar vortex. January 14-15: insurgence of lower-ozone air (orangecolours) from mid-latitudes coming northward over central Europe.January 17: the migrated low-ozone air is isolated by the polar vortex.January 22: the ozone concentration within this isolated air mass (mostvisible over Scandinavia) is lowered to approximately 200 Dobson units,presumably due to chemical destruction. January 26: the dissolution ofthis ozone event after a few days. (Source of data: SBUV-2 on Nimbus 14).
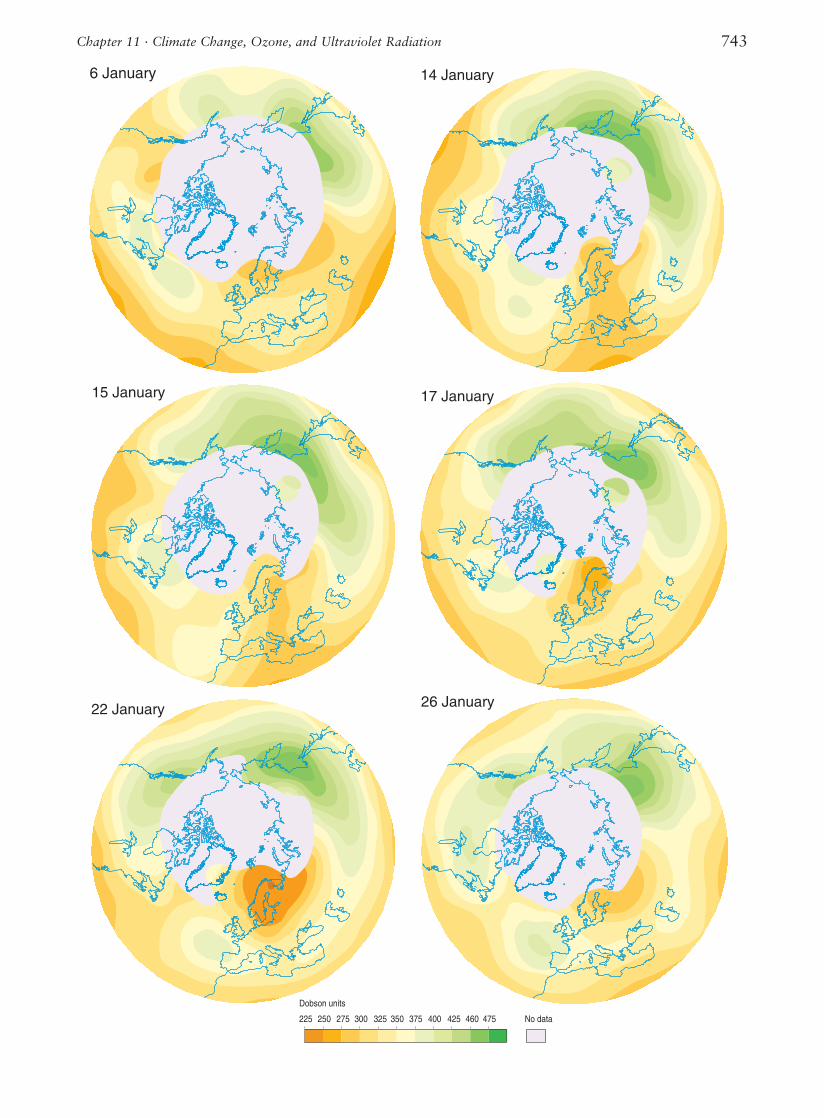
743Chapter 11 · Climate Change, Ozone, and Ultraviolet Radiation
6 January
15 January
22 January 26 January
17 January
14 January
275 300 325 350 375 400 425 460 475250 No data225
Dobson units
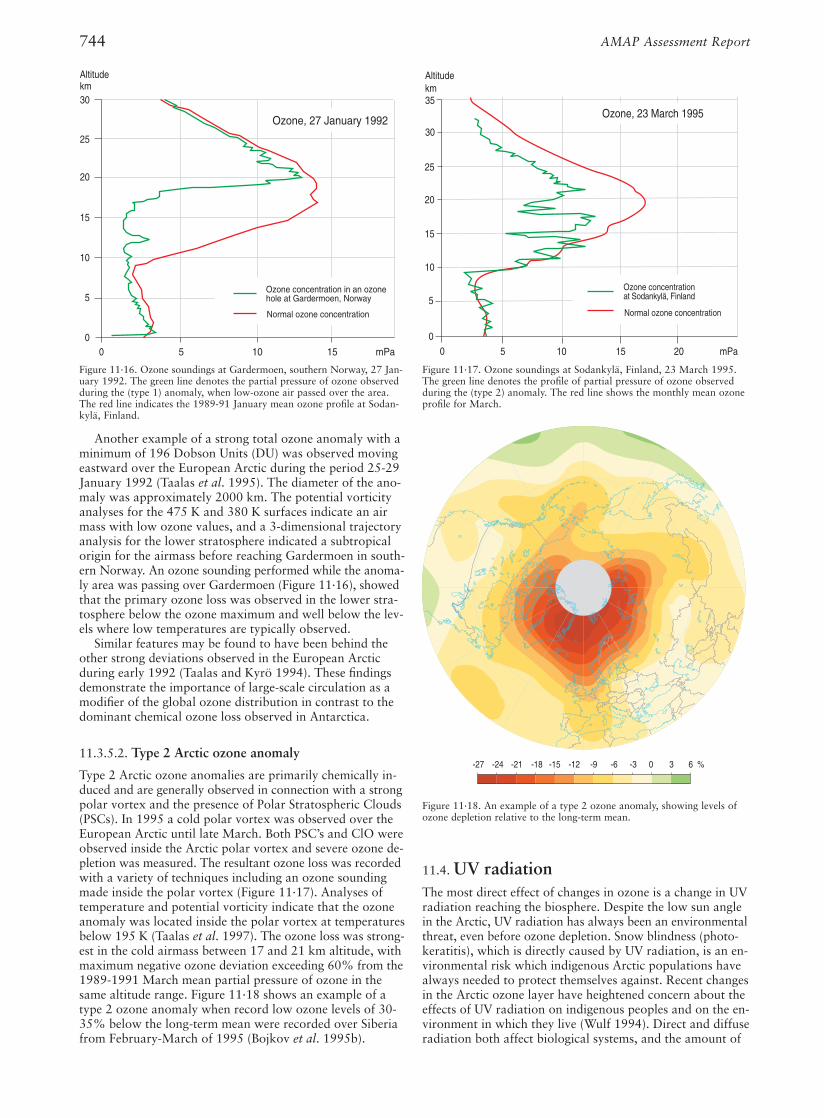
744 AMAP Assessment Report
11.4. UV radiationThe most direct effect of changes in ozone is a change in UVradiation reaching the biosphere. Despite the low sun anglein the Arctic, UV radiation has always been an environmentalthreat, even before ozone depletion. Snow blindness (photo-keratitis), which is directly caused by UV radiation, is an en-vironmental risk which indigenous Arctic populations havealways needed to protect themselves against. Recent changesin the Arctic ozone layer have heightened concern about theeffects of UV radiation on indigenous peoples and on the en-vironment in which they live (Wulf 1994). Direct and diffuseradiation both affect biological systems, and the amount of
Another example of a strong total ozone anomaly with aminimum of 196 Dobson Units (DU) was observed movingeastward over the European Arctic during the period 25-29January 1992 (Taalas et al. 1995). The diameter of the ano-maly was approximately 2000 km. The potential vorticityanalyses for the 475 K and 380 K surfaces indicate an airmass with low ozone values, and a 3-dimensional trajectoryanalysis for the lower stratosphere indicated a subtropicalorigin for the airmass before reaching Gardermoen in south-ern Norway. An ozone sounding performed while the anoma-ly area was passing over Gardermoen (Figure 11·16), showedthat the primary ozone loss was observed in the lower stra-tosphere below the ozone maximum and well below the lev-els where low temperatures are typically observed.
Similar features may be found to have been behind theother strong deviations observed in the European Arcticduring early 1992 (Taalas and Kyrö 1994). These findingsdemonstrate the importance of large-scale circulation as amodifier of the global ozone distribution in contrast to thedominant chemical ozone loss observed in Antarctica.
11.3.5.2. Type 2 Arctic ozone anomaly
Type 2 Arctic ozone anomalies are primarily chemically in-duced and are generally observed in connection with a strongpolar vortex and the presence of Polar Stratospheric Clouds(PSCs). In 1995 a cold polar vortex was observed over theEuropean Arctic until late March. Both PSC’s and ClO wereobserved inside the Arctic polar vortex and severe ozone de-pletion was measured. The resultant ozone loss was recordedwith a variety of techniques including an ozone soundingmade inside the polar vortex (Figure 11·17). Analyses oftemperature and potential vorticity indicate that the ozoneanomaly was located inside the polar vortex at temperaturesbelow 195 K (Taalas et al. 1997). The ozone loss was strong-est in the cold airmass between 17 and 21 km altitude, withmaximum negative ozone deviation exceeding 60% from the1989-1991 March mean partial pressure of ozone in thesame altitude range. Figure 11·18 shows an example of atype 2 ozone anomaly when record low ozone levels of 30-35% below the long-term mean were recorded over Siberiafrom February-March of 1995 (Bojkov et al. 1995b).
-27 -24 -21 -18 -15 -12 -9 -6 -3 0 3 6 %
11£19d01
1510500
5
10
15
30
25
20
km
Ozone, 27 January 1992
Altitude
mPa
Ozone concentration in an ozonehole at Gardermoen, Norway
Normal ozone concentration
2015500
5
10
15
30
25
20
km
Ozone, 23 March 1995
10
35
mPa
Altitude
Ozone concentrationat Sodankylä, Finland
Normal ozone concentration
Figure 11·16. Ozone soundings at Gardermoen, southern Norway, 27 Jan-uary 1992. The green line denotes the partial pressure of ozone observedduring the (type 1) anomaly, when low-ozone air passed over the area.The red line indicates the 1989-91 January mean ozone profile at Sodan-kylä, Finland.
Figure 11·17. Ozone soundings at Sodankylä, Finland, 23 March 1995.The green line denotes the profile of partial pressure of ozone observedduring the (type 2) anomaly. The red line shows the monthly mean ozoneprofile for March.
Figure 11·18. An example of a type 2 ozone anomaly, showing levels ofozone depletion relative to the long-term mean.
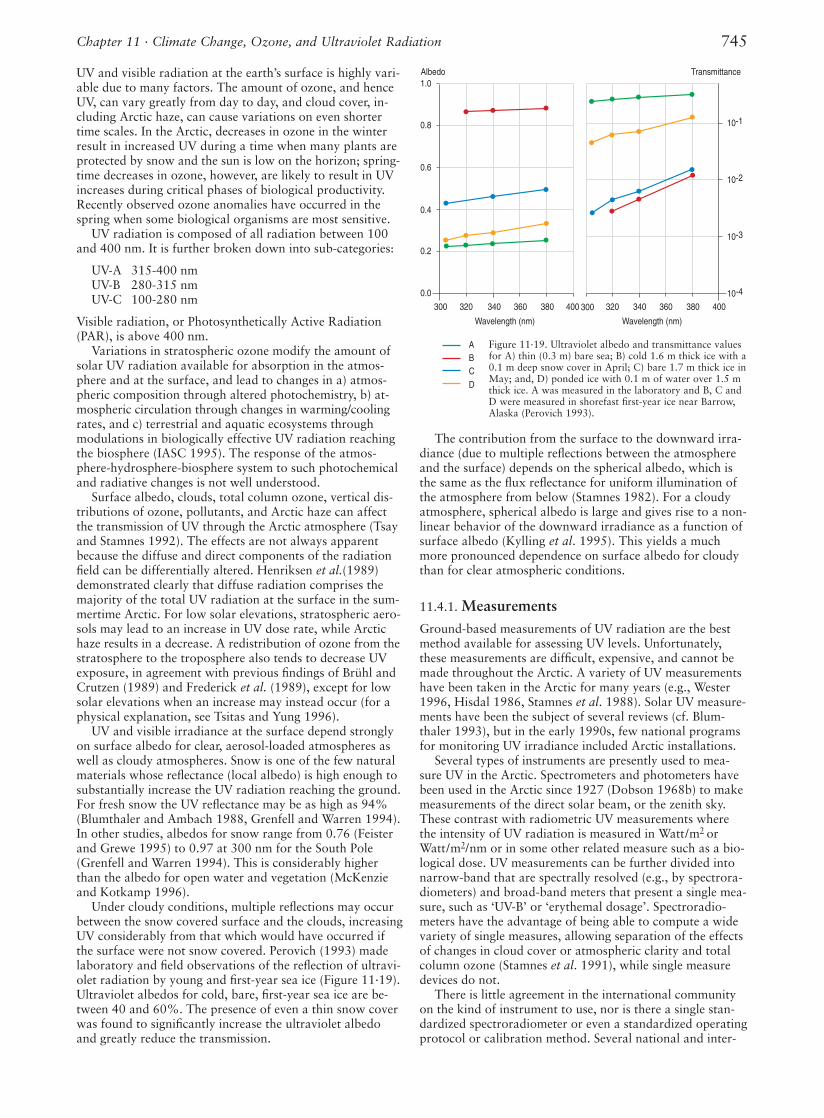
745Chapter 11 · Climate Change, Ozone, and Ultraviolet Radiation
UV and visible radiation at the earth’s surface is highly vari-able due to many factors. The amount of ozone, and henceUV, can vary greatly from day to day, and cloud cover, in-cluding Arctic haze, can cause variations on even shortertime scales. In the Arctic, decreases in ozone in the winterresult in increased UV during a time when many plants areprotected by snow and the sun is low on the horizon; spring-time decreases in ozone, however, are likely to result in UVincreases during critical phases of biological productivity.Recently observed ozone anomalies have occurred in thespring when some biological organisms are most sensitive.
UV radiation is composed of all radiation between 100and 400 nm. It is further broken down into sub-categories:
UV-A 315-400 nmUV-B 280-315 nmUV-C 100-280 nm
Visible radiation, or Photosynthetically Active Radiation(PAR), is above 400 nm.
Variations in stratospheric ozone modify the amount ofsolar UV radiation available for absorption in the atmos-phere and at the surface, and lead to changes in a) atmos-pheric composition through altered photochemistry, b) at-mospheric circulation through changes in warming/coolingrates, and c) terrestrial and aquatic ecosystems throughmodulations in biologically effective UV radiation reachingthe biosphere (IASC 1995). The response of the atmos-phere-hydrosphere-biosphere system to such photochemicaland radiative changes is not well understood.
Surface albedo, clouds, total column ozone, vertical dis-tributions of ozone, pollutants, and Arctic haze can affectthe transmission of UV through the Arctic atmosphere (Tsayand Stamnes 1992). The effects are not always apparentbecause the diffuse and direct components of the radiationfield can be differentially altered. Henriksen et al.(1989)demonstrated clearly that diffuse radiation comprises themajority of the total UV radiation at the surface in the sum-mertime Arctic. For low solar elevations, stratospheric aero-sols may lead to an increase in UV dose rate, while Arctichaze results in a decrease. A redistribution of ozone from thestratosphere to the troposphere also tends to decrease UVexposure, in agreement with previous findings of Brühl andCrutzen (1989) and Frederick et al. (1989), except for lowsolar elevations when an increase may instead occur (for aphysical explanation, see Tsitas and Yung 1996).
UV and visible irradiance at the surface depend stronglyon surface albedo for clear, aerosol-loaded atmospheres aswell as cloudy atmospheres. Snow is one of the few naturalmaterials whose reflectance (local albedo) is high enough tosubstantially increase the UV radiation reaching the ground.For fresh snow the UV reflectance may be as high as 94%(Blumthaler and Ambach 1988, Grenfell and Warren 1994).In other studies, albedos for snow range from 0.76 (Feisterand Grewe 1995) to 0.97 at 300 nm for the South Pole(Grenfell and Warren 1994). This is considerably higherthan the albedo for open water and vegetation (McKenzieand Kotkamp 1996).
Under cloudy conditions, multiple reflections may occurbetween the snow covered surface and the clouds, increasingUV considerably from that which would have occurred ifthe surface were not snow covered. Perovich (1993) madelaboratory and field observations of the reflection of ultravi-olet radiation by young and first-year sea ice (Figure 11·19).Ultraviolet albedos for cold, bare, first-year sea ice are be-tween 40 and 60%. The presence of even a thin snow coverwas found to significantly increase the ultraviolet albedoand greatly reduce the transmission.
The contribution from the surface to the downward irra-diance (due to multiple reflections between the atmosphereand the surface) depends on the spherical albedo, which isthe same as the flux reflectance for uniform illumination ofthe atmosphere from below (Stamnes 1982). For a cloudyatmosphere, spherical albedo is large and gives rise to a non-linear behavior of the downward irradiance as a function ofsurface albedo (Kylling et al. 1995). This yields a muchmore pronounced dependence on surface albedo for cloudythan for clear atmospheric conditions.
11.4.1. MeasurementsGround-based measurements of UV radiation are the bestmethod available for assessing UV levels. Unfortunately,these measurements are difficult, expensive, and cannot bemade throughout the Arctic. A variety of UV measurementshave been taken in the Arctic for many years (e.g., Wester1996, Hisdal 1986, Stamnes et al. 1988). Solar UV measure-ments have been the subject of several reviews (cf. Blum-thaler 1993), but in the early 1990s, few national programsfor monitoring UV irradiance included Arctic installations.
Several types of instruments are presently used to mea-sure UV in the Arctic. Spectrometers and photometers havebeen used in the Arctic since 1927 (Dobson 1968b) to makemeasurements of the direct solar beam, or the zenith sky.These contrast with radiometric UV measurements wherethe intensity of UV radiation is measured in Watt/m2 orWatt/m2/nm or in some other related measure such as a bio-logical dose. UV measurements can be further divided intonarrow-band that are spectrally resolved (e.g., by spectrora-diometers) and broad-band meters that present a single mea-sure, such as ‘UV-B’ or ‘erythemal dosage’. Spectroradio-meters have the advantage of being able to compute a widevariety of single measures, allowing separation of the effectsof changes in cloud cover or atmospheric clarity and totalcolumn ozone (Stamnes et al. 1991), while single measuredevices do not.
There is little agreement in the international communityon the kind of instrument to use, nor is there a single stan-dardized spectroradiometer or even a standardized operatingprotocol or calibration method. Several national and inter-
10-4
10-3
10-2
380360340320300380360320300
0.0
0.2
0.4
0.6
1.0Albedo Transmittance
10-1
400340
0.8
Wavelength (nm) Wavelength (nm)
400
ABCD
Figure 11·19. Ultraviolet albedo and transmittance valuesfor A) thin (0.3 m) bare sea; B) cold 1.6 m thick ice with a0.1 m deep snow cover in April; C) bare 1.7 m thick ice inMay; and, D) ponded ice with 0.1 m of water over 1.5 mthick ice. A was measured in the laboratory and B, C andD were measured in shorefast first-year ice near Barrow,Alaska (Perovich 1993).
746 AMAP Assessment Report
ently to the various components of UV-A and UV-B radia-tion, it is difficult to summarize UV radiation for biologicaluse. Furthermore, standard methods of monitoring UV areinappropriate for research on UV effects in Arctic conditions.
11.4.3.1. Spectral considerations
The total amount of UV radiation does not adequately de-scribe the amount of harmful UV radiation because of thediffering efficacies of photons within the UV spectrum: theshorter wavelength photons are several orders of magnitudemore damaging than the longer wavelengths (UNEP 1994,SCOPE 1993). The relative harmfulness of the various re-gions within UV may be summarized by a Biological Weight-ing Function (BWF) which is unique to the process beingstudied. Biologically relevant UV is determined by weightingthe spectral radiation by its biological effectiveness.
Biologically effective UV can be summarized in terms ofits response to changes in ozone. At mid-latitudes, a changeof one percent in ozone may result in a change of betweenone and three percent in biologically weighted UV, depend-ing on the action spectra being considered. The percent in-crease in UV dose rate per percent decrease in ozone amount(radiation amplification factor) is largest (and tends to increasewith solar zenith angle) for biological responses which areheavily weighted toward UV-B radiation (e.g. plant response),while biological effects with significant response to UV-A ra-diation (e.g. erythema) will have a smaller amplification fac-tor that decreases with increasing solar zenith angle. Largechanges in ozone result in non-linear changes in UV (Boothand Madronich 1994). These relationships were derived byexamining the relationship between ozone and UV at mid-latitudes; further work needs to be done to determine therelevance of these relationships in polar regions.
11.4.3.2. Geometrical considerations
To reach biological receptors in the Arctic, UV radiationmust often travel through snow, water, or ice. Even biologi-cal receptors which are on open land require special consid-erations in parameterizing UV radiation. Traditionally, theexposure of human populations and ecosystems to solar UVradiation is commonly described using measurements of thebiologically weighted irradiance hitting horizontal surfaceswhich is at best an approximation because UV hits biologi-cal organisms at many different angles. New methods of pa-rameterizing UV become particularly important when tryingto assess UV effects in the Arctic. Previous methods haveproven inadequate and vastly under-estimate the impact ofUV on Arctic ecosystems and human inhabitants because ofthe increased fraction of UV radiation that is scattered rela-tive to direct UV radiation.
national UV instrument intercomparisons have been held toaddress problems with measuring UV (Koskela 1994, McKen-zie et al. 1993, Seckmeyer et al. 1994, Gardiner and Kirsch1995). There are several national UV monitoring networksthat include Arctic sites (see Table 11·5) (Kerr and Wardle1993, Johnsen 1996). The Nordic countries, Sweden, Finland,Norway, Denmark, and Iceland, are organized into the Nor-dic Ozone Group; each country operates its own UV monitor-ing network with strong cooperation between the scientists.
11.4.2. ModelingModels of UV radiation, using satellite data to estimate therelevant components of the atmosphere, provide estimates ofUV in regions where UV monitoring does not exist. How-ever, the complexity of the atmospheric and environmentalconditions makes estimates difficult in the Arctic, particu-larly in partly cloudy situations. Considerable progress hasbeen made in understanding the relationship between atmos-pheric conditions and the UV irradiance incident on theground for mid-latitudes. But, the limitations in predictingor modeling ground level UV are greatest in polar regionswhere a combination of uncertainty in albedo due to chang-ing snow or ice conditions, frequent cloud cover, and the in-creased uncertainty in radiative transfer models at low solarangles greatly complicate the estimation of surface UV usingsatellites. The use of ground-based UV measurements is cru-cial to the development of reliable algorithms for using satel-lite information to estimate UV levels in the Arctic.
One of the least understood components of this complexsystem is the radiative effects of particulate clouds, as wellas the environmental conditions leading to their formationand dissipation. The effects of molecular multiple scattering,solar elevation, surface albedo, and cloud properties (suchas optical depth, altitude, and cloud fraction) on ozone ab-sorption have been studied using radiative transfer modelsof varying degrees of sophistication (Shettle and Green1974, Luther and Gelinas 1976, Spinhirne and Green 1978,Nicolet et al. 1982, Thompson 1984, Madronich 1987,Frederick and Lubin 1988, Frederick and Snell 1990, Smithet al. 1992, Stamnes et al. 1990, 1992).
11.4.3. Biologically relevant UVThe present understanding of the relationship between theUV climatology and biological exposure in snow coveredregions is inadequate to fully assess the impacts of ozonedepletion on the Arctic. Three factors make assessing bio-logically relevant UV difficult in the Arctic: a) the high sur-face albedo; b) extremely low sun angle; and c) many of thebiological receptors in the Arctic are under snow, water, orice. Because different biological processes respond differ-
Table 11·5. UV monitoring sites inside the Arctic Circle. Most UV monitoring efforts in the Arctic were started within the last decade, making long-termassessments of UV difficult. The lack of sites in the Russian Arctic limits our ability to monitor changes in Arctic UV levels today.–––––––––––––––––––––––––––––––––––––––––––––––––––––––––––––––––––––––––––––––––––––––––––––––––––––––––––––––––––––––––––––––––––
Location Coordinates Operator Instrument Established–––––––––––––––––––––––––––––––––––––––––––––––––––––––––––––––––––––––––––––––––––––––––––––––––––––––––––––––––––––––––––––––––––
Tromsø, Norway 70°N, 019°E University of Tromsø JY32D, GUV-511 1987Ny-Ålesund, Norway 79°N, 012°E NPI GUV-511, SL500, SL501 1990Longyearbyen, Norway 78°N, 016°E Univ. Tromsø JY H32D 1991Barrow, Alaska 71°N, 156°W NSF, (Biospherical) SUV-100 1990Resolute, Canada 75°N, 095°W AES Canada Brewer 1992Alert, Canada 82°N, 062°W AES Canada Brewer 1992Eureka, Canada 80°N, 086°W AES Canada Brewer 1993Thule, Greenland 76°N, 069°W DMI DMI (.22 m double) 1994Søndrestrøm, Greenland 67°N, 051°W DMI Brewer MkII 1990Abisko, Sweden 68°N, 019°E Univ. Lund SL501Kiruna, Sweden 67°N, 021°E SMHI SL500 1989Sodankylä, Finland 67°N, 027°E FMI Brewer MkII 1989Varrio, Finland 67°N, 030°E University of Helsinki SL501A 1995
–––––––––––––––––––––––––––––––––––––––––––––––––––––––––––––––––––––––––––––––––––––––––––––––––––––––––––––––––––––––––––––––––––
r
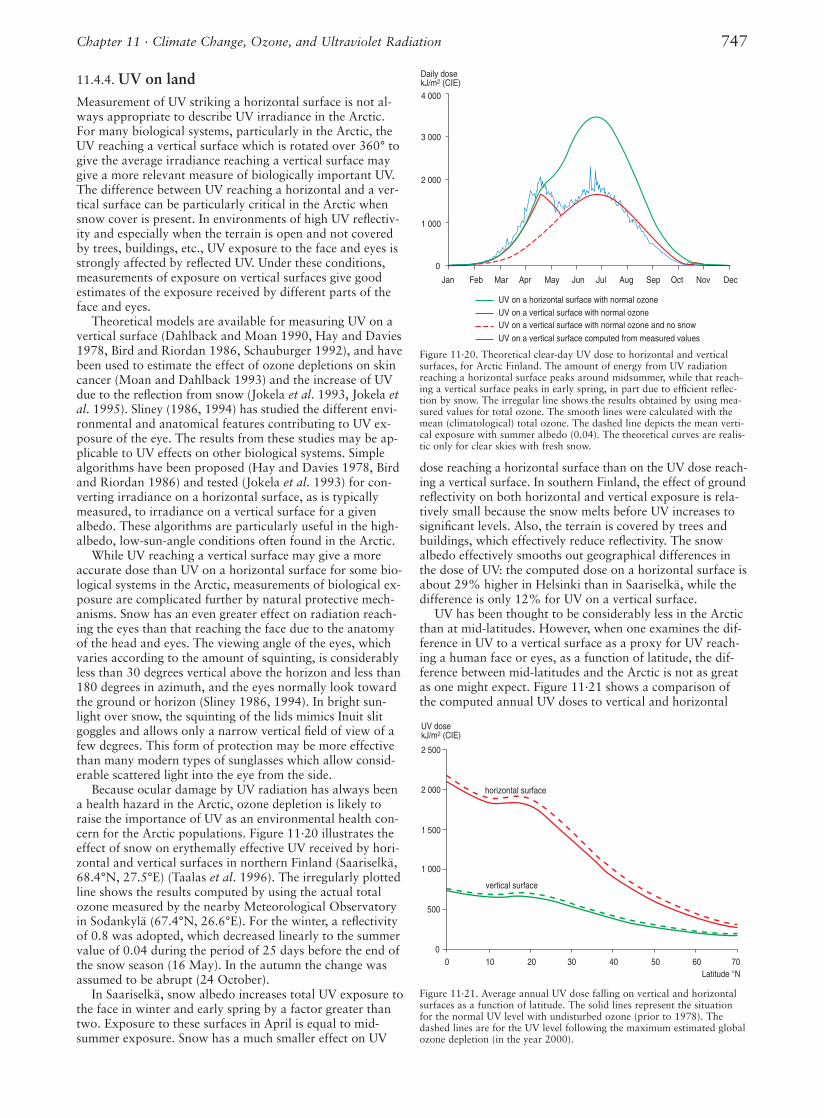
747Chapter 11 · Climate Change, Ozone, and Ultraviolet Radiation
11.4.4. UV on landMeasurement of UV striking a horizontal surface is not al-ways appropriate to describe UV irradiance in the Arctic.For many biological systems, particularly in the Arctic, theUV reaching a vertical surface which is rotated over 360° togive the average irradiance reaching a vertical surface maygive a more relevant measure of biologically important UV.The difference between UV reaching a horizontal and a ver-tical surface can be particularly critical in the Arctic whensnow cover is present. In environments of high UV reflectiv-ity and especially when the terrain is open and not coveredby trees, buildings, etc., UV exposure to the face and eyes isstrongly affected by reflected UV. Under these conditions,measurements of exposure on vertical surfaces give goodestimates of the exposure received by different parts of theface and eyes.
Theoretical models are available for measuring UV on avertical surface (Dahlback and Moan 1990, Hay and Davies1978, Bird and Riordan 1986, Schauburger 1992), and havebeen used to estimate the effect of ozone depletions on skincancer (Moan and Dahlback 1993) and the increase of UVdue to the reflection from snow (Jokela et al. 1993, Jokela etal. 1995). Sliney (1986, 1994) has studied the different envi-ronmental and anatomical features contributing to UV ex-posure of the eye. The results from these studies may be ap-plicable to UV effects on other biological systems. Simplealgorithms have been proposed (Hay and Davies 1978, Birdand Riordan 1986) and tested (Jokela et al. 1993) for con-verting irradiance on a horizontal surface, as is typicallymeasured, to irradiance on a vertical surface for a givenalbedo. These algorithms are particularly useful in the high-albedo, low-sun-angle conditions often found in the Arctic.
While UV reaching a vertical surface may give a moreaccurate dose than UV on a horizontal surface for some bio-logical systems in the Arctic, measurements of biological ex-posure are complicated further by natural protective mech-anisms. Snow has an even greater effect on radiation reach-ing the eyes than that reaching the face due to the anatomyof the head and eyes. The viewing angle of the eyes, whichvaries according to the amount of squinting, is considerablyless than 30 degrees vertical above the horizon and less than180 degrees in azimuth, and the eyes normally look towardthe ground or horizon (Sliney 1986, 1994). In bright sun-light over snow, the squinting of the lids mimics Inuit slitgoggles and allows only a narrow vertical field of view of afew degrees. This form of protection may be more effectivethan many modern types of sunglasses which allow consid-erable scattered light into the eye from the side.
Because ocular damage by UV radiation has always beena health hazard in the Arctic, ozone depletion is likely toraise the importance of UV as an environmental health con-cern for the Arctic populations. Figure 11·20 illustrates theeffect of snow on erythemally effective UV received by hori-zontal and vertical surfaces in northern Finland (Saariselkä,68.4°N, 27.5°E) (Taalas et al. 1996). The irregularly plottedline shows the results computed by using the actual totalozone measured by the nearby Meteorological Observatoryin Sodankylä (67.4°N, 26.6°E). For the winter, a reflectivityof 0.8 was adopted, which decreased linearly to the summervalue of 0.04 during the period of 25 days before the end ofthe snow season (16 May). In the autumn the change wasassumed to be abrupt (24 October).
In Saariselkä, snow albedo increases total UV exposure tothe face in winter and early spring by a factor greater thantwo. Exposure to these surfaces in April is equal to mid-summer exposure. Snow has a much smaller effect on UV
dose reaching a horizontal surface than on the UV dose reach-ing a vertical surface. In southern Finland, the effect of groundreflectivity on both horizontal and vertical exposure is rela-tively small because the snow melts before UV increases tosignificant levels. Also, the terrain is covered by trees andbuildings, which effectively reduce reflectivity. The snowalbedo effectively smooths out geographical differences inthe dose of UV: the computed dose on a horizontal surface isabout 29% higher in Helsinki than in Saariselkä, while thedifference is only 12% for UV on a vertical surface.
UV has been thought to be considerably less in the Arcticthan at mid-latitudes. However, when one examines the dif-ference in UV to a vertical surface as a proxy for UV reach-ing a human face or eyes, as a function of latitude, the dif-ference between mid-latitudes and the Arctic is not as greatas one might expect. Figure 11·21 shows a comparison ofthe computed annual UV doses to vertical and horizontal
DecNovOctSepAugJulJunMayAprMarFebJan
0
1 000
2 000
3 000
4 000
Daily dosekJ/m2 (CIE)
UV on a horizontal surface with normal ozoneUV on a vertical surface with normal ozoneUV on a vertical surface with normal ozone and no snow
UV on a vertical surface computed from measured values
0
500
1 000
1 500
2 000
UV dosekJ/m2 (CIE)
0 10 20 30 40 50 60 70Latitude °N
2 500
horizontal surface
vertical surface
Figure 11·20. Theoretical clear-day UV dose to horizontal and verticalsurfaces, for Arctic Finland. The amount of energy from UV radiationreaching a horizontal surface peaks around midsummer, while that reach-ing a vertical surface peaks in early spring, in part due to efficient reflec-tion by snow. The irregular line shows the results obtained by using mea-sured values for total ozone. The smooth lines were calculated with themean (climatological) total ozone. The dashed line depicts the mean verti-cal exposure with summer albedo (0.04). The theoretical curves are realis-tic only for clear skies with fresh snow.
Figure 11·21. Average annual UV dose falling on vertical and horizontalsurfaces as a function of latitude. The solid lines represent the situationfor the normal UV level with undisturbed ozone (prior to 1978). Thedashed lines are for the UV level following the maximum estimated globalozone depletion (in the year 2000).
748 AMAP Assessment Report
The maximum penetration of UV-B is found in oceanicwaters, while in coastal seawater the penetration is less dueto a larger amount of Dissolved Organic Matter (DOM), es-pecially humic substances (Smith and Baker 1979). For theestuarine areas of the Arctic Ocean this is of major impor-tance (Höjerslev and Aas 1991). In the waters off Svalbardand western Greenland, diffuse attenuation coefficients rep-resenting 10% radiation levels at 310 nm (Kd( 310)) wereshown to be around 0.2, or a little more than 10 m, while inthe North Sea the corresponding irradiation levels were at adepth of around 5 m and in Hardangerfjord, Norway levelswere 1-2 m (calculated from Højerslev and Aas 1991).
Theoretical estimates indicate that the presence of a seaice cover causes a significant reduction in the amount of UVtransmitted and that UV-B radiation is attenuated more thanUV-A radiation or visible light. Even a modest snow cover(≈0.15 m) reduces UV levels by nearly two orders of magni-tude (Perovich 1993). For young, thin sea ice UV transmit-tance is large, roughly 20%, while for cold first year icetransmittances are less than 2%. Extinction coefficients forcold bare ice are between 2.5 and 3 per meter, in the rangeof visible values observed for the interior of white ice andthe surface scattering layer of white ice (Grenfell and May-kut 1977). In all cases, a larger portion of PAR is transmit-ted than of the UV radiation. Wavelength-integrated extinc-tion coefficients for PAR are smaller than UV values.
Models for solar radiative transfer through the coupledatmosphere-snow/ice-ocean system have also been developed(Jin et al. 1994a, 1994b, Zeng et al. 1993). However, dataon optical properties for snow, ice, and water in the UV arescarce (see Trodahl and Buckley 1990) and few spectral irra-diance measurements exist for testing of such models. Simul-taneous spectral measurements of Arctic surface (snow andice) and underwater UV optical properties, as well as UV ir-radiance and radiance measurements, are needed. Progressawaits comprehensive experiments executed in the Arcticenvironment.
Recently there has been growing concern about the im-pact of enhanced UV levels on ice biota in the Arctic as well.Diatom mats cover the undersurface of the ice over vast ex-panses and form the basis of a food chain that extends fromcopepods and amphipods to cod, seals, and polar bears.Determining how much enhanced UV radiation at the sur-face reaches biological organisms living in and under the icecover is difficult. This problem is complicated by the tempo-ral and spatial variability in the physical and therefore opti-cal properties of sea ice.
Penetration of UV in lakes and ponds varies greatly asa function of amount of dissolved organic matter; ice andsnow cover also absorb UV-B for much of the year. Hessen(1996) found 10% attenuation at 10 m for 310 nm inalpine, subarctic lakes, while Arctic ponds that are slightlymore influenced by Dissolved Organic Carbon (DOC)have a 10% attenuation at a depth of 2-4 m for 310 nm.A number of these lakes have maximum depths of less than2 m. For Arctic lakes of Alaska, more influenced by humiccompounds, Morris et al. (1995) also recorded low attenu-ation depths relative to high UV-B transparency in clearalpine lakes.
There is a limited number of underwater measurementsfrom Arctic and subarctic sites (Scully and Lean 1994, Hes-sen 1993, 1996). In general, high latitude and high altitudelocalities are low in DOC, implying low absorbance of UV-B. Some alpine lakes are extremely UV transparent (Hessen1993, Schindler et al. 1997), while High Arctic localities at80°N span from extremely clear lakes to shallow pondsslightly influenced by colored organic matter (Hessen 1996).
surfaces as a function of latitude. Additionally, the estimatedeffect of global ozone depletion is shown (Taalas et al. 1996).Annual doses were corrected for the effects of clouds (Fred-erick and Lubin 1988) and reflection from the snow at 60°Nand at 70°N. The latitudinal difference of the ratio of verti-cal to horizontal dose is 0.35 at the equator and increases to0.5 at high latitudes. This is mainly due to the relative in-crease of diffuse radiation from the sky and ground com-pared with the direct radiation from the sun.
The relative increase of the UV dose on a vertical surfaceat high latitudes may have some influence on the relation-ship between the ozone depletion and the incidence of skincancers at different latitudes. Atmospheric, epidemiologicaland animal studies show that the relative incidence of a skincarcinoma increases exponentially:
I1 / I2 = (D1/D2) � BAF = (O31/O32) � RAF � BAF
where I1 / I2 is the relative cancer incidence, D1/D22 is therelative annual UV dose, O31/O32 is the relative totalozone. Index 1 refers to the depleted and index 2 to unde-pleted conditions. BAF is the Biological Amplification Fac-tor and RAF is the Radiation Amplification Factor. Whenthe ozone depletion is below 10%, the amplification factorsare approximately the factors by which the percentagechange of the UV dose or ozone depletion must be multi-plied in order to obtain the percentage change in the cancerincidence or UV dose, respectively. For Squamous Cell Can-cer (SCC) the current estimate for the BAF is BAF = 2.5 ± 0.7(de Gruijl and van der Leun 1993). The erythemally effec-tive UV radiation RAF decreases from approximately 1.2to 1 from the equator to high latitudes. The BAFs havebeen derived from the measured erythemal horizontal UVat different latitudes.
Estimates of vertical BAF can be made by making as-sumptions about the angular distribution of radiation andapplying a conversion factor derived from the calculationsof annual doses on both horizontal and vertical surfaces.This conversion results in the increase of the BAF for theSCC from 2.5 to 3.2. It is interesting that the increasedBAF is closer to the murine BAF, which varies from 3.2to 4.4 (de Gruijl and van der Leun 1993). The increase ofthe BAF based on the UV reaching a vertical surface is inqualitative agreement with the results of Moan and Dahl-back (1993), which examined the dependence of the ampli-fication factors from the receiving surface for the Norwe-gian population. They found that the RAF does not signifi-cantly depend on the exposure geometry, but the total am-plification factor increases slightly from the exposure tohorizontal and vertical surfaces. Since the total amplifica-tion factor is the product of RAF and BAF, the latter mustincrease. Although the irradiation on a vertical surface de-scribes better the actual UV exposure than the horizontal,it is still a very crude approximation of the complex expo-sure patterns.
11.4.5. UV penetration in aquatic systemsThe penetration of radiation in the PAR and UV regionsin ocean and lake water depends on dissolved substancesand particles that attenuate light. Natural levels of UV-Bradiation are known to penetrate to ecologically signifi-cant depths in many bodies of water (cf. Smith et al. 1992,Scully and Lean 1994, Morris et al. 1995, Hessen 1996).Increases in UV-B radiation due to ozone depletion alterthe spectral balance of UV-A, UV-B, and PAR and increasethe exposure of aquatic ecosystems to UV radiation (Smithet al. 1992).

749Chapter 11 · Climate Change, Ozone, and Ultraviolet Radiation
11.5. Effects of climate change and UV radiation on the biosphere
Climate change will affect biological processes and physicalproperties of the oceans and land, directly impacting the livesof humans living in Arctic regions. The most obvious effectsof warming in the Arctic will most likely involve changes tothe cryosphere (glaciers, permafrost, sea ice cover, and snow),with consequent changes in biotic and biogeochemical pro-cesses. Accurate predictions of change are complicated bycomplex interactions: on land between permafrost, the feed-back effects of soil changes on vegetation, and alterations insnow cover and precipitation; in the atmosphere betweentrace gas amounts, changes in ozone and atmospheric pollu-tants, and seasonal temperature and light regimes; and in theoceans between the sea ice albedo feedback, and changes insea ice extent and thermohaline circulation.
Temperature and precipitation are not the only environ-mental variables that are changing and the balance betweenopposing responses to different environmental factors is notclear yet. Increases in CO2 and UV radiation have the poten-tial to change the chemical quality of plant tissues whichmight reduce microbial decomposition rates by as much as10% (Couteaux et al. 1991, Gehrke et al. 1995) and slowthe release of carbon to the atmosphere. Increased UV cou-pled with climatic warming and acidification may increasethe rate at which DOM is cycled in fresh water and increasethe CO2 flux to the atmosphere (Schindler et al. 1997). Evensubtle changes in plant community distribution may have ef-fects on canopy roughness and the turbulent transfer of en-ergy and water between vegetation and atmosphere. Effectsof climate change and UV are often counterintuitive andlong term in situ studies are needed.
The Mackenzie Basin Impact Study (MBIS), which con-sisted of 30 research activities and consultations with stake-holders, represents one of the first attempts at an integratedassessment of the impact of climate change on a region andits inhabitants (Cohen 1996, 1997). Climate warming sce-narios of 4-5ºC were obtained from three GCMs and a com-posite analogue based on paleoecological data. Results fromtwo studies from the ecosystem component on boreal peat-lands are provided in Nicholson and Gignac (1995) andNicholson et al. (1996).
11.5.1. Terrestrial ecosystems11.5.1.1. Climate change effects on terrestrial ecosystems
The impacts of climate change on Arctic terrestrial ecosys-tems are complex and difficult to predict because of themany interactions which exist within ecosystems and be-tween many concurrently changing environmental variables(Chapin et al. 1992, Callaghan and Jonasson 1995). Primaryproduction can be affected by higher temperatures, atmos-pheric CO2 concentrations, and UV-B radiation; impactsfrom such changes are uncertain and depend on the re-sponses of soil microbial decomposer activity to changes insoil temperature, moisture, and plant litter quality. Increasesin atmospheric CO2 are expected to increase plant produc-tion, increase translocation of carbon to below ground, re-duce nitrogen and increase lignin and tannin concentrationsin plant litters. Some of these changes are closely tied to UV-B increases. Thawing permafrost can disturb the soil, whichwould warm and further disturb vegetation, resulting in achange in species composition. A change in species composi-tion due to competition effects from less sensitive local spe-cies and from intruding southerly species is also expected(Chapin et al. 1992, Körner 1994).
Many Arctic plant species are currently stressed by theharsh environment. Vegetation is subject to periodically fro-zen soil, strong winds and ice crystal abrasion, short grow-ing seasons, and extreme temperature variations. Microbialdecomposer activity is limited by cold, shallow soils overly-ing permafrost so that few nutrients are available for plants.Soils are often either dry as in the polar deserts, or water-logged and anaerobic as in mires and polygonal sedge mead-ows; much of the year they are frozen. Changes in air tem-perature will warm the soil and will induce changes in thedepth and moisture of the active layer where hydrologic,geomorphic, chemical, and biological processes occur thatprofoundly affect ecosystems at the landscape level (Rey-nolds and Tenhunen 1996). In many systems, warming mayincrease soil biological processes of trace gas emission, de-composition of soil organic matter, and nutrient availabilityto plants but the resulting increase in leaf area index mayreduce the penetration of solar radiation to the soil therebynegating longer term soil warming or even resulting in soilcooling (Callaghan and Jonasson 1995). Increased soil mois-ture content in already wet soils may reduce the rates ofthese processes through a shift in the balance of aerobic andanaerobic conditions.
Harsh Arctic conditions have acted as a filter to biodiver-sity, which is further constrained by the relative youth ofmost tundra ecosystems. While biodiversity is low at thespecies level (Chapin and Körner 1995), populations areoften large and geographical distributions extensive whichshould mitigate against losses in biodiversity due to climatechanges. Arctic species have successfully survived changes inthe past, such as climatic warming in medieval times, the re-covery from the Little Ice Age over the past 150 years, andconsiderable variability in temperature between years in thepresent period (Havström et al. 1995).
11.5.1.1.1. Vegetation
Plant communitiesWithin the Arctic, the variation in vegetation ranges fromclosed, relatively productive communities of the subarcticwhich support a diversity of herbivores, to sparse, unpro-ductive vegetation of the High Arctic. This geographicalvariation in structure of plant communities and environ-ments within the Arctic will result in different responses tofuture climatic changes by different plant community types.Although Arctic organisms can survive current harsh envi-ronments, many can also tolerate higher temperatures ex-pected to occur following climatic warming.
Plants exhibiting traits of slow growth, compact forms,and parsimonious nutrient use are predisposed to tolerateArctic conditions but are also sensitive to competition fromopportunistic, aggressive species from farther south. In awarmer Arctic, the competition from more responsive spe-cies would probably threaten Arctic flora more than the en-vironment per se because many Arctic plants are sensitive toshade and other competitive mechanisms (Callaghan andJonasson 1995). However, Arctic latitudes are broad and themigrations of plants from southern latitudes will occur moreslowly than temperature changes. For example, a warmingof 2°C could result in a 4-5° latitude northward shift of theclimatic zone associated with the taiga of Eurasia (Velichkoet al. 1990), i.e., a shift of 400-500 km by the year 2020. Ifthe taiga forests could migrate at this rate, tundra would betotally displaced from the Eurasian mainland. However, ex-pected tree migration rates of 10-1000 meters per year areinsufficient to accomplish this. The disparity between ratesof predicted climate change and tree migration will result in
750 AMAP Assessment Report
climatic warming and increased precipitation on soil mois-ture are hard to predict and may be site or regionally spe-cific. Increased temperatures may, however, desiccate moistsoils and hence cause water stress to plants. Although littleresearch has been conducted on Arctic species, an increase inCO2 may also affect tundra ecosystems via plant water rela-tions because, in general, water use efficiency increases withenhanced atmospheric CO2 (Oberbauer and Dawson 1992).Increased efficiency might offset soil drying and allow spe-cies to colonize marginal or barren areas of the High Arcticwhich would change the albedo and thus affect the energybalance (Lashof 1989). Plant communities along rivers andstreams may be negatively affected by climate change. De-creased river and streamflow affects riparian ecosystems andthe animals that inhabit them. A decrease in flooding andsubsequent drying of deltaic ecosystems will alter plant com-position and reduce migratory bird habitat.
11.5.1.1.2. Invertebrates
One of the likely effects of climate change accompanying en-hanced temperature is a change in the pattern of outbreaksof pests and pathogens. The species involved may be indi-genous but currently benign, or they may be immigrantsfrom the lower latitudes.
Invertebrates with relatively short generation times mayshow great population dynamic responses to increased tem-perature (Strathdee et al. 1995). Populations of some inver-tebrate pests which defoliate large areas of Fennoscandiansubarctic birch forests are controlled by the sensitivity ofover-wintering eggs to low temperatures (Tenow and Holm-gren 1987); warmer winters will likely lead to increased pestpopulations and greater deforestation. Which species willbecome harmful is unpredictable, but the probability of oc-currence is high. Such outbreak events could be an impor-tant factor determining the future pattern and timing of veg-etation change.
Increasing insect outbreak may also result in greater fuelloads, linking insect outbreak and wildfire. The coupling ofmore frequent insect outbreaks and fire is likely to decreasesurface albedo because there will be less green foliage inwinter; this change in albedo may cause positive feedbacksto climate (Bryant et al. 1991).
11.5.1.1.3. Vertebrates
Animals of the Arctic are ultimately dependent on plants forenergy and nutrients. Climate change can affect animals di-rectly through an increase in extreme events such as droughtor ice layer formation over forage in winter and throughslower processes such as changes in the amount and qualityof food available. Altered winter snow conditions will affectnot only the availability of moisture, food, and shelter forwinter residents, but also the spring and summer moistureregime. Quality and quantity of forage for herbivores candecline through an increase in plant defense mechanisms orby a change in species composition (Bryant et al. 1991).Migratory mammals and birds can probably adjust morereadily than non-migratory species to changes in the quan-tity and distribution of their food plants or prey in the Arc-tic, but vertebrate and invertebrate herbivores may faceproblems with changes in the quality of their food plants.
Long-term experiments by Chapin and Shaver (1996)show warming of Arctic tundra is likely to result in replace-ment of cotton grass (Eriophorum vaginatum) by deciduousshrub and, in particular, dwarf birch (Betula exilis – for-merly B. nana ssp. nana). This vegetation change could be
some tundra areas experiencing supra-optimal thermalregimes which could adversely affect plant carbon balanceand survival.
At a much smaller scale, those genotypes, or ecotypes,within individual species which are more responsive tochange may out-compete those best adapted to the harshestenvironments. Different ecotypes of the same species cangrow close to each other but have different distributions;some, for example, prefer sheltered, moist depressions, whileothers prefer more exposed sites. (Crawford et al. 1995)Again however, slow rates of spread, i.e. small scale migra-tion, will limit change. Plants of the harshest Arctic environ-ments, sparsely located in a landscape, growing at 2 mm peryear (Molau 1996), may take centuries to replace a neigh-boring genotype.
Nutrient availabilityIn many tundra ecosystems the response of plants to climatechanges will be influenced by the availability of nutrients, in-cluding those released by decomposition of organic matterand mineralization from parent materials. Thus it is possiblethat the growth potential of plants may not be realized be-cause of limitations in nutrient availability if the supply ofnutrients from soil is less than or asynchronous with de-mand. The available evidence indicates that nitrogen andphosphorus mineralization will increase in mesic more thanin dry tundra. Also, the increased depth of the active layer inorganic soils will tend to allow deeper rooting to access themineral horizons which were previously inaccessible (Na-delhoffer et al. 1992, Berendse and Jonasson 1992). Pro-jected increases in nitrogen fixation of 65-85% (Chapin andBledsoe 1992) are also likely to minimize nitrogen limita-tions to plant growth under projected climate changes.However, extrapolation of nutrient information over timeand space must be treated with caution. Enhanced releaseof nutrients does not necessarily lead to increased plant up-take and there is considerable variation between responsesin different sites (Jonasson et al. 1993, Parsons et al. 1994).Transport from lower latitudes of atmospheric pollutants,especially nitrogen compounds, may also influence nutrientavailability.
Permafrost and vegetationA major cause of disturbance to vegetation is, and will in-creasingly be, the dynamics of permafrost. Thawing of theactive layer each summer allows plant roots to function.Vegetation, and mosses in particular, restrict the degree ofsoil warming in continuous summer daylight, but when theupheaval of the permafrost and soil results in drainage andlack of moss cover, the permafrost can thaw at the surfaceand retreat. This leads to soil slumping and active layer de-tachment by which the soil can slide down the surface ofsloping permafrost at a rate of up to 5 m per week (Edlund1989). At the coast, thermal abrasion of soil and permafrostcan occur at 14 m per year.
A particular threat to Arctic biota from soil warming isan increase in thermokarst disturbance. The disturbance tovegetation from thawing permafrost opens up new habitatsfor colonization and the low biodiversity of the tundra couldincrease, with the risk of competition from immigrating spe-cies displacing the existing species. Slow plant growth andsporadic recruitment of individuals to populations could re-sult in recovery taking decades or centuries.
Water stressVegetation composition and structure in the Arctic are tiedto soil moisture and nutrient availability. Actual effects of
751Chapter 11 · Climate Change, Ozone, and Ultraviolet Radiation
very detrimental to populations of caribou and reindeer(Rangifer tarandus). At the time of calving and in early lac-tation, these animals depend heavily first on flowers of cot-ton grass and, later, leaves of willow for a high protein foodsource. High protein food is necessary for calf productionand survival and hence herd maintenance (Kuropat 1984).This shift in species composition would therefore likely re-sult in significant herd declines, especially in Siberia andNorth America.
Warming in high latitudes may also result in migration oftaiga woody species into regions now occupied by tundra.Taiga woody species appear to be more heavily defendedchemically against mammalian herbivores than are tundrashrubs. An increase in the defense level of tundra vegetationwould also stress herds of tundra herbivores such as caribou(Bryant et al. 1991).
11.5.1.2. UV effects on terrestrial ecosystems
The literature on effects of UV radiation on Arctic terrestrialecosystems is limited and many assumptions are extrapo-lated from data on organisms in temperate regions (IASC1995, Björn et al. 1997). In polar regions, the low air andground temperatures and low solar zenith angle, even duringthe vegetation growth period, affect ecosystems in variousways. Under unperturbed ozone and cloud conditions, UV-Birradiance is low. Consequently, Arctic plants have fewerprotective pigments and are more UV-B susceptible thancomparable plants from other regions of the world (Rob-berecht et al. 1980, Barnes et al. 1987). Repair processesare slower at cooler temperatures, while photochemicaldamage to DNA and other molecules can proceed as rapidlyas at higher temperatures, thus sensitivity to UV-B is morepronounced at lower temperatures (Takeuchi et al. 1993).Therefore, an increase in UV radiation is an ecological con-cern in the Arctic, and further ozone depletion is a potentialthreat.
11.5.1.2.1. Dwarf shrubs, mosses, and lichens
The responses of subarctic plants to UV-B are subtle andsometimes surprising, vary from species to species, and can-not be predicted without detailed experimentation. There issome evidence that stem growth inhibition from increasedUV-B in perennial plants increases over time. Although it istoo early to make any detailed statements, the effects of al-tered UV-B radiation on certain plant species is expected tohave an impact on complex ecological interactions.
Growth and morphology of dwarf shrubs exhibit changesin leaf thickness and relative shoot growth under increasesin UV-B radiation. Species-specific changes have implicationsfor plant community composition and plant nutritive valuefor herbivores. In UV enhancement experiments, the leavesof Vaccinium vitis-idaea became thicker (by 4 to 9% de-pending on year) and those of the deciduous dwarf shrubsthinner (by 4 to 10% depending on year and species) (Jo-hanson et al. 1995a). Enhanced UV radiation caused in-creases of 24% to leaf dry weight and 29% to leaf area forV. uliginosum (Johanson et al. 1995b).
The relative longitudinal shoot growth (i.e. shoot growthunder enhanced UV-B divided by growth of the same shootduring the year before application of enhanced UV-B) wasreduced in Empetrum hermaphroditum by 14% after oneyear of enhanced UV-B and by 33% after two years. For theVaccinium species, no significant effects on longitudinalgrowth of shoots were found after one year of irradiation,but after two years there was a reduction of 14% for V.
myrtillus, of 12% for V. uliginosum, and of 27% for V.vitis-idaea (Johanson et al. 1995b).
Mosses as well as dwarf shrubs react to increased expo-sure to UV radiation. Mosses and lichens are particularlyimportant components of Arctic vegetation, and are oftencritical to ecosystem function. Mosses mediate the exchangeof water and energy between soil and atmosphere while li-chens are the winter forage of caribou and reindeer (Rangi-fer tarandus). Quite unexpectedly, growth of the moss Hylo-comium splendens was strongly stimulated by UV-B, pro-vided the moss received additional water (Gehrke et al. 1996).The stimulation of annual growth in length by enhancedUV-B (15% enhancement calculated for cloudless skies) was,in three successive growing periods in the field, 15%, 31%,and 27%. The stimulation of growth in length by UV-B wasobserved also in a greenhouse experiment. For in situ H.splendens receiving only water naturally available, however,there was no effect (first year of irradiation), or an inhibitionof growth in length (by 25% during the second year and18% during the third year).
Thalli of lichens (Cladonia arbuscula, Cetraria islandicaand Steroecaulon paschale) collected at Abisko (68°N) werecompared to thalli of the same species collected in southernSweden (56°N). Experiments were carried out under 350,600, and 1000 ppm CO2. UV-B exposure increased the pho-tochemical quantum yield of photosystem II as measuredwith pulse modulated fluorimetry, (F’m-Ft)/F’m, under lowCO2 (except late in the season, i.e. August), but not underthe highest concentration. The ratio was greater for lichensfrom Abisko than for those from southern Sweden (Sones-son et al. 1995).
11.5.1.2.2. Decomposition
The relative weight of indirect effects of UV-B on decompo-sition (via changes in litter chemistry) versus direct effects(via photodegradation of lignin, etc.) are liable to differ be-tween tundra habitats. In High Arctic habitats and fellfieldswith open plant canopies, direct effects may outweigh indi-rect effects when litter intercepts UV-B. In closed vegetationregions of the mid- and subarctic, direct effects of photochem-ical degradation may predominate when living leaves inter-cept UV-B (Moorhead and Callaghan 1994). Whichever path-way prevails, alterations in nutrient availability to plants aresignificant in the nutrient-limited ecosystems of the Arctic.
Exposure of V. uliginosum leaf litter to enhanced UV-Bchanges the litter composition toward a decrease in celluloseand the cellulose/lignin ratio and an increase in tannins(Gehrke et al. 1995). UV-B exposure during decompositiondecreases the proportion of lignin and decreases fungal colo-nization and total microbial respiration. Of three fungalspecies investigated, Mucor hiemalis and Truncatella trun-cata were more UV-B sensitive than was Penicillium brevi-compactum (Gehrke et al. 1995). Leaf litter from treated(UV-B supplemented) V. myrtillus plants is decomposedmore slowly by microorganisms than is litter from controlplants (Gehrke et al. 1995). The increase in UV-B radiation,although possibly lethal for some soil microorganisms, willhave little direct effect because of its very limited transmis-sion into the soil. Changes in plant chemistry in response toUV-B will probably have much greater influence on soil pro-cesses (Caldwell et al. 1989, Gehrke et al. 1995).
Positive responses of mosses to enhanced UV-B couldcounteract future impacts of climatic warming, but, as inthe example of H. splendens, predictions of future waterbalance under warming in the Arctic suggest greater stresswhich would result in repressed growth due to UV-B.
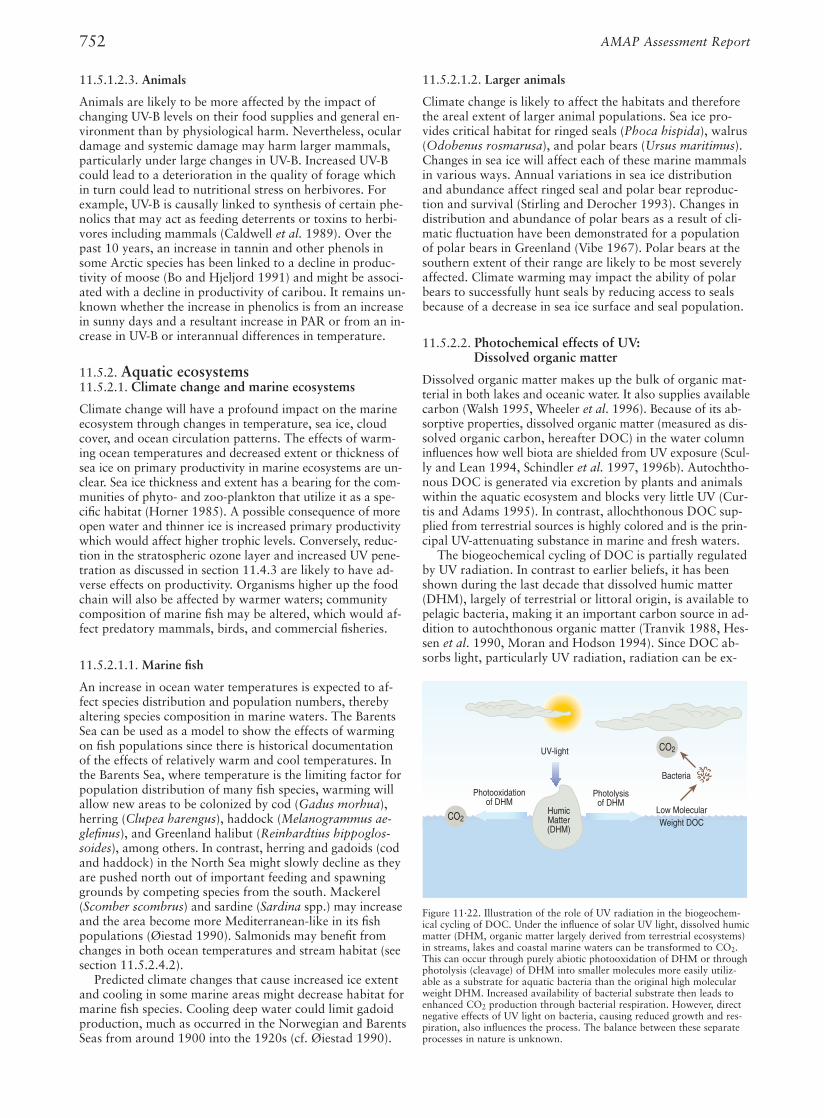
752 AMAP Assessment Report
11.5.2.1.2. Larger animals
Climate change is likely to affect the habitats and thereforethe areal extent of larger animal populations. Sea ice pro-vides critical habitat for ringed seals (Phoca hispida), walrus(Odobenus rosmarusa), and polar bears (Ursus maritimus).Changes in sea ice will affect each of these marine mammalsin various ways. Annual variations in sea ice distributionand abundance affect ringed seal and polar bear reproduc-tion and survival (Stirling and Derocher 1993). Changes indistribution and abundance of polar bears as a result of cli-matic fluctuation have been demonstrated for a populationof polar bears in Greenland (Vibe 1967). Polar bears at thesouthern extent of their range are likely to be most severelyaffected. Climate warming may impact the ability of polarbears to successfully hunt seals by reducing access to sealsbecause of a decrease in sea ice surface and seal population.
11.5.2.2. Photochemical effects of UV: Dissolved organic matter
Dissolved organic matter makes up the bulk of organic mat-terial in both lakes and oceanic water. It also supplies availablecarbon (Walsh 1995, Wheeler et al. 1996). Because of its ab-sorptive properties, dissolved organic matter (measured as dis-solved organic carbon, hereafter DOC) in the water columninfluences how well biota are shielded from UV exposure (Scul-ly and Lean 1994, Schindler et al. 1997, 1996b). Autochtho-nous DOC is generated via excretion by plants and animalswithin the aquatic ecosystem and blocks very little UV (Cur-tis and Adams 1995). In contrast, allochthonous DOC sup-plied from terrestrial sources is highly colored and is the prin-cipal UV-attenuating substance in marine and fresh waters.
The biogeochemical cycling of DOC is partially regulatedby UV radiation. In contrast to earlier beliefs, it has beenshown during the last decade that dissolved humic matter(DHM), largely of terrestrial or littoral origin, is available topelagic bacteria, making it an important carbon source in ad-dition to autochthonous organic matter (Tranvik 1988, Hes-sen et al. 1990, Moran and Hodson 1994). Since DOC ab-sorbs light, particularly UV radiation, radiation can be ex-
11.5.1.2.3. Animals
Animals are likely to be more affected by the impact ofchanging UV-B levels on their food supplies and general en-vironment than by physiological harm. Nevertheless, oculardamage and systemic damage may harm larger mammals,particularly under large changes in UV-B. Increased UV-Bcould lead to a deterioration in the quality of forage whichin turn could lead to nutritional stress on herbivores. Forexample, UV-B is causally linked to synthesis of certain phe-nolics that may act as feeding deterrents or toxins to herbi-vores including mammals (Caldwell et al. 1989). Over thepast 10 years, an increase in tannin and other phenols insome Arctic species has been linked to a decline in produc-tivity of moose (Bo and Hjeljord 1991) and might be associ-ated with a decline in productivity of caribou. It remains un-known whether the increase in phenolics is from an increasein sunny days and a resultant increase in PAR or from an in-crease in UV-B or interannual differences in temperature.
11.5.2. Aquatic ecosystems11.5.2.1. Climate change and marine ecosystems
Climate change will have a profound impact on the marineecosystem through changes in temperature, sea ice, cloudcover, and ocean circulation patterns. The effects of warm-ing ocean temperatures and decreased extent or thickness ofsea ice on primary productivity in marine ecosystems are un-clear. Sea ice thickness and extent has a bearing for the com-munities of phyto- and zoo-plankton that utilize it as a spe-cific habitat (Horner 1985). A possible consequence of moreopen water and thinner ice is increased primary productivitywhich would affect higher trophic levels. Conversely, reduc-tion in the stratospheric ozone layer and increased UV pene-tration as discussed in section 11.4.3 are likely to have ad-verse effects on productivity. Organisms higher up the foodchain will also be affected by warmer waters; communitycomposition of marine fish may be altered, which would af-fect predatory mammals, birds, and commercial fisheries.
11.5.2.1.1. Marine fish
An increase in ocean water temperatures is expected to af-fect species distribution and population numbers, therebyaltering species composition in marine waters. The BarentsSea can be used as a model to show the effects of warmingon fish populations since there is historical documentationof the effects of relatively warm and cool temperatures. Inthe Barents Sea, where temperature is the limiting factor forpopulation distribution of many fish species, warming willallow new areas to be colonized by cod (Gadus morhua),herring (Clupea harengus), haddock (Melanogrammus ae-glefinus), and Greenland halibut (Reinhardtius hippoglos-soides), among others. In contrast, herring and gadoids (codand haddock) in the North Sea might slowly decline as theyare pushed north out of important feeding and spawninggrounds by competing species from the south. Mackerel(Scomber scombrus) and sardine (Sardina spp.) may increaseand the area become more Mediterranean-like in its fishpopulations (Øiestad 1990). Salmonids may benefit fromchanges in both ocean temperatures and stream habitat (seesection 11.5.2.4.2).
Predicted climate changes that cause increased ice extentand cooling in some marine areas might decrease habitat formarine fish species. Cooling deep water could limit gadoidproduction, much as occurred in the Norwegian and BarentsSeas from around 1900 into the 1920s (cf. Øiestad 1990).
UV-light
HumicMatter(DHM)
CO2
Photooxidationof DHM
Photolysisof DHM
Low MolecularWeight DOC
Bacteria
CO2
Figure 11·22. Illustration of the role of UV radiation in the biogeochem-ical cycling of DOC. Under the influence of solar UV light, dissolved humicmatter (DHM, organic matter largely derived from terrestrial ecosystems)in streams, lakes and coastal marine waters can be transformed to CO2.This can occur through purely abiotic photooxidation of DHM or throughphotolysis (cleavage) of DHM into smaller molecules more easily utiliz-able as a substrate for aquatic bacteria than the original high molecularweight DHM. Increased availability of bacterial substrate then leads toenhanced CO2 production through bacterial respiration. However, directnegative effects of UV light on bacteria, causing reduced growth and res-piration, also influences the process. The balance between these separateprocesses in nature is unknown.
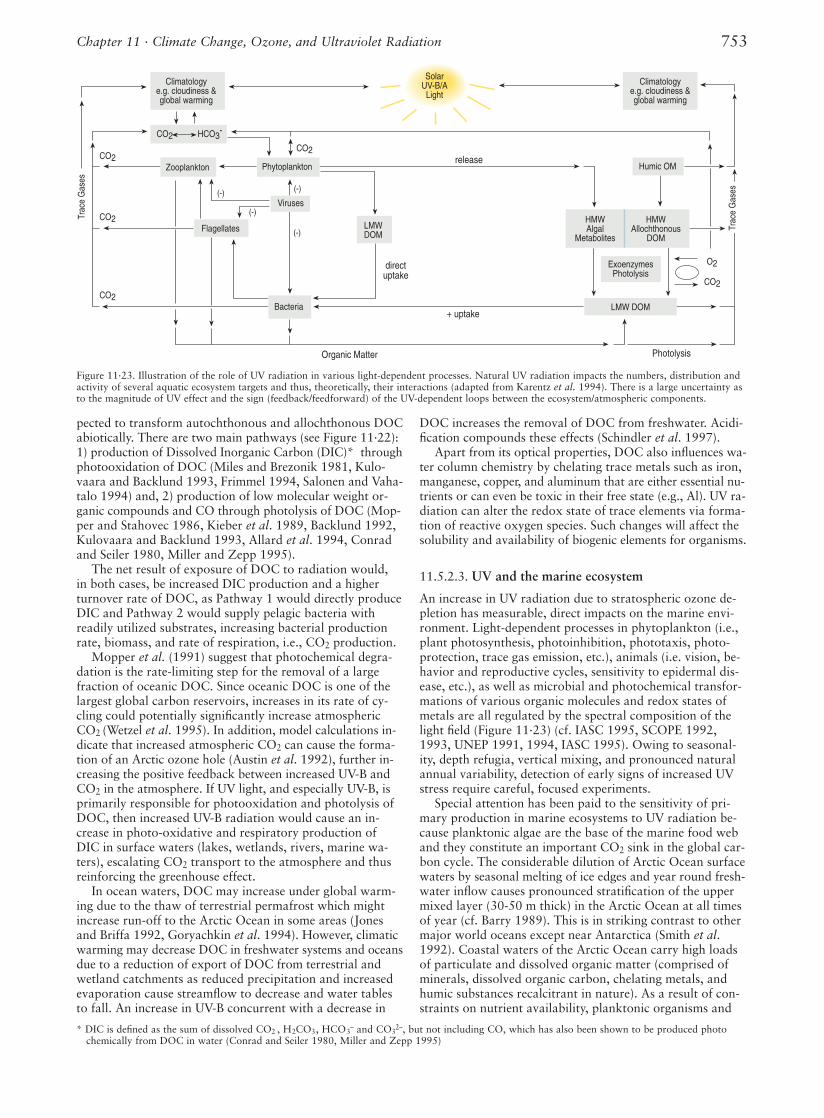
753Chapter 11 · Climate Change, Ozone, and Ultraviolet Radiation
pected to transform autochthonous and allochthonous DOCabiotically. There are two main pathways (see Figure 11·22):1) production of Dissolved Inorganic Carbon (DIC)* throughphotooxidation of DOC (Miles and Brezonik 1981, Kulo-vaara and Backlund 1993, Frimmel 1994, Salonen and Vaha-talo 1994) and, 2) production of low molecular weight or-ganic compounds and CO through photolysis of DOC (Mop-per and Stahovec 1986, Kieber et al. 1989, Backlund 1992,Kulovaara and Backlund 1993, Allard et al. 1994, Conradand Seiler 1980, Miller and Zepp 1995).
The net result of exposure of DOC to radiation would,in both cases, be increased DIC production and a higherturnover rate of DOC, as Pathway 1 would directly produceDIC and Pathway 2 would supply pelagic bacteria withreadily utilized substrates, increasing bacterial productionrate, biomass, and rate of respiration, i.e., CO2 production.
Mopper et al. (1991) suggest that photochemical degra-dation is the rate-limiting step for the removal of a largefraction of oceanic DOC. Since oceanic DOC is one of thelargest global carbon reservoirs, increases in its rate of cy-cling could potentially significantly increase atmosphericCO2 (Wetzel et al. 1995). In addition, model calculations in-dicate that increased atmospheric CO2 can cause the forma-tion of an Arctic ozone hole (Austin et al. 1992), further in-creasing the positive feedback between increased UV-B andCO2 in the atmosphere. If UV light, and especially UV-B, isprimarily responsible for photooxidation and photolysis ofDOC, then increased UV-B radiation would cause an in-crease in photo-oxidative and respiratory production ofDIC in surface waters (lakes, wetlands, rivers, marine wa-ters), escalating CO2 transport to the atmosphere and thusreinforcing the greenhouse effect.
In ocean waters, DOC may increase under global warm-ing due to the thaw of terrestrial permafrost which mightincrease run-off to the Arctic Ocean in some areas (Jonesand Briffa 1992, Goryachkin et al. 1994). However, climaticwarming may decrease DOC in freshwater systems and oceansdue to a reduction of export of DOC from terrestrial andwetland catchments as reduced precipitation and increasedevaporation cause streamflow to decrease and water tablesto fall. An increase in UV-B concurrent with a decrease in
DOC increases the removal of DOC from freshwater. Acidi-fication compounds these effects (Schindler et al. 1997).
Apart from its optical properties, DOC also influences wa-ter column chemistry by chelating trace metals such as iron,manganese, copper, and aluminum that are either essential nu-trients or can even be toxic in their free state (e.g., Al). UV ra-diation can alter the redox state of trace elements via forma-tion of reactive oxygen species. Such changes will affect thesolubility and availability of biogenic elements for organisms.
11.5.2.3. UV and the marine ecosystem
An increase in UV radiation due to stratospheric ozone de-pletion has measurable, direct impacts on the marine envi-ronment. Light-dependent processes in phytoplankton (i.e.,plant photosynthesis, photoinhibition, phototaxis, photo-protection, trace gas emission, etc.), animals (i.e. vision, be-havior and reproductive cycles, sensitivity to epidermal dis-ease, etc.), as well as microbial and photochemical transfor-mations of various organic molecules and redox states ofmetals are all regulated by the spectral composition of thelight field (Figure 11·23) (cf. IASC 1995, SCOPE 1992,1993, UNEP 1991, 1994, IASC 1995). Owing to seasonal-ity, depth refugia, vertical mixing, and pronounced naturalannual variability, detection of early signs of increased UVstress require careful, focused experiments.
Special attention has been paid to the sensitivity of pri-mary production in marine ecosystems to UV radiation be-cause planktonic algae are the base of the marine food weband they constitute an important CO2 sink in the global car-bon cycle. The considerable dilution of Arctic Ocean surfacewaters by seasonal melting of ice edges and year round fresh-water inflow causes pronounced stratification of the uppermixed layer (30-50 m thick) in the Arctic Ocean at all timesof year (cf. Barry 1989). This is in striking contrast to othermajor world oceans except near Antarctica (Smith et al.1992). Coastal waters of the Arctic Ocean carry high loadsof particulate and dissolved organic matter (comprised ofminerals, dissolved organic carbon, chelating metals, andhumic substances recalcitrant in nature). As a result of con-straints on nutrient availability, planktonic organisms and
PhotolysisOrganic Matter
directuptake
+ uptake
release
Trac
e G
ases
CO2CO2
CO2
CO2
(-)
(-)
(-)
(-)
Trac
e G
ases
SolarUV-B/ALight
Flagellates
Zooplankton Phytoplankton
Viruses
LMWDOM
CO2 HCO3-
Climatologye.g. cloudiness &global warming
Bacteria LMW DOM
Humic OM
HMWAlgal
Metabolites
HMWAllochthonous
DOM
ExoenzymesPhotolysis
CO2
O2
Climatologye.g. cloudiness &global warming
Figure 11·23. Illustration of the role of UV radiation in various light-dependent processes. Natural UV radiation impacts the numbers, distribution andactivity of several aquatic ecosystem targets and thus, theoretically, their interactions (adapted from Karentz et al. 1994). There is a large uncertainty asto the magnitude of UV effect and the sign (feedback/feedforward) of the UV-dependent loops between the ecosystem/atmospheric components.
* DIC is defined as the sum of dissolved CO2 , H2CO3, HCO3– and CO3
2–, but not including CO, which has also been shown to be produced photochemically from DOC in water (Conrad and Seiler 1980, Miller and Zepp 1995)
754 AMAP Assessment Report
radiation are uptake, assimilation, mineralization, and nitro-gen fixation, since all of these occur in the upper part of thewater column. Phytoplankton productivity in the ArcticOcean varies widely from the least productive Central PolarBasin to ice-free coastal upwelling areas and episodic blooms,especially red tides, during periods of spring/summer stratifi-cation (cf. Andersen 1989, Smith and Sakshaug 1990, Smithand Grebmeier 1994).
Little effort has been made to understand the effects ofUV-B on in situ primary production in the Arctic Ocean.Effects of UV-B radiation on in situ primary production inthe oceans near Antarctica have been examined by incubat-ing either unialgal cultures or the ambient natural popu-lations. By modeling the results from these experiments,often based on irradiation from inside and outside anozone hole, scenarios for reduced primary production havebeen calculated (e.g., Smith et al. 1980, 1992, Smith andBaker 1982, Holm-Hansen et al. 1993b, Cullen et al. 1992,Cullen and Neale 1994). In general, it is assumed that UV-B irradiation reduces total water column photosynthesis by5-6% under normal Antarctic ozone levels, while during anozone hole the reduction can increase to 6-18% (cf. Scho-field et al. 1995). It is evident that ambient radiation (PAR,UV-A and UV-B) during normal levels of stratosphericozone inhibits primary production close to the surface, andthereby enhanced UV-B radiation will increase the UV-Bdependent inhibition. There are no indications that similarscenarios could not be expected in the Arctic. Recent re-search indicates that post-bloom phytoplankton communi-ties from northern Norway are more sensitive to ambientUV-B radiation than those from the southern ocean (Helb-ling et al. 1996).
The above-mentioned conclusions are all based on short-term experiments but results suggest that UV-B radiationwill induce changes in species composition that will causelong-term effects at a community level. Unfortunately, ex-perimental data describing the long-term effects of UV-B ra-diation on phytoplankton communities are very limited, butchanges in species composition of phytoplankton communi-ties have been shown in long-term experiments with naturalphytoplankton communities (Worrest et al. 1981, Helblinget al. 1992, Wängberg et al. 1996, El-Sayed et al. 1990).Evaluation of the effects of UV-B irradiation on the marineecosystem lack long-term experiments on the biological andchemical processes in planktonic food webs. Not enoughdata are available to make a valid risk assessment (Wäng-berg et al. 1996).
Experiments with natural assemblages of phytoplanktonusing additions of 15N-labeled nutrients have shown nitro-gen uptake and assimilation to be negatively affected by UV-B (e.g., Döhler et al. 1991, Döhler 1992). Enhanced UV-Bmight then increase the nitrogen demand in phytoplanktonbecause of protein degradation. Proteins are known to beabsorbers of UV-B radiation (Karentz 1994); an increase inprotein degradation followed by resynthesis in order to re-place UV-B-sensitive proteins could thus be expected duringUV-B exposure (Cullen and Neale 1994). Nitrogen-depletedphytoplankton might therefore be more susceptible to UV-Bradiation. In addition, UV has a regulatory effect on the up-take of inorganic nitrogen and phosphorous required forgrowth (Dohler 1992, Tyagi et al. 1992, Behrenfeld et al.1995). On longer time scales, if phytoplankton fix less car-bon, grow slower, or increase rates of organic excretion inthe presence of UV radiation, there may be indirect conse-quences to the biogeochemical cycling of nutrients and there-fore to the vitality of higher trophic levels within aquaticecosystems.
larvae are confined to the upper reaches of the water columnand thus may be particularly vulnerable to increased UV ra-diation, especially in the spring months when ozone deple-tion appears most severe and when migratory species of ani-mals come to breed in the Arctic Ocean and its freshwatertributaries.
Each marine plant ecosystem, whether free-floating, em-bedded in the undersides of ice, or attached to the surfaceof the sediments, serves the needs of different sets of ani-mals, plays an important and often distinct role in the bio-geochemistry of the Arctic Ocean, and is likely differentlyaffected by changing UV climatology over Arctic latitudes(IASC 1995). UV also directly affects the vitality and chemi-cal activity of viruses, bacterioplankton, protozoans, andmicrozooplankton (Herndl et al. 1993, Hunter et al. 1979,Williamsen and Zagarese 1994, Helbling et al. 1995, Mül-ler-Niklas et al. 1995, Vetter 1996). Because the amount ofUV-B reaching marine plants varies, the effects of increasedUV-B will also vary. In the long run, some organisms mayadapt to enhanced UV-B radiation and thereby a successiontoward more tolerant species will occur. Adaptive mecha-nisms such as synthesis of screening pigments, capacity toavoid UV-B, and increased enzymatic repair might reducethe inhibitory effects of UV-B if phytoplankton are exposedduring longer time periods (Karentz 1994). However, thesensitivity to UV-B radiation and the adaptive mechanismsdiffer widely between species.
11.5.2.3.1. Primary producers
Physiological responses of primary producers to UV havebeen observed in cell DNA, protein, nitrogen metabolism,lipid metabolism, motility, screening pigments (mycosporine-like amino acids), photosynthetic machinery (photosystemII, the carboxylating enzyme, the Calvin-Benson cycle), andrepair mechanisms (e.g., Holm-Hansen et al. 1993a, Vincentand Roy 1993, Häder et al. 1995). UV can inhibit motilityin flagellated phytoplankton (Ekelund 1990, Häder 1993)and alter cell composition (Vosjan et al. 1990, Goes et al.1994, 1995) and cell structure (Karentz et al. 1991, Beh-renfeld et al. 1992). UV-B radiation is known to reduceshort-term growth rates and primary production of a num-ber of polar aquatic phytoplankton communities (cf. Holm-Hansen et al. 1993a, Vincent and Roy 1993, Karentz et al.1994, Prézelin et al. 1994a, 1994b, 1995, 1996, 1997, Bou-cher and Prézelin 1996).
There is a nonlinear relationship between changing UVclimatology and UV sensitivity of natural phytoplanktoncommunities, making the accuracy of future spectral model-ing of UV effects on primary production dependent upon theavailability of in situ BWFs (see section 11.4.3.1) for theaquatic ecosystem under study. To extrapolate results of en-hanced UV-B on phytoplankton growth into consequencesof increased UV-B radiation, the correct BWF needs to beapplied. Results from Antarctica show that BWFs vary ontime intervals as short as two hours, reflecting diel periodi-city in both cell biology and the magnitude and spectral bal-ance of the natural light field. Also, BWFs differ significantlyover the austral springtime and may reflect different lighthistories, taxon-specific biology, or changing physiologicalstates of the phytoplankton communities.
The Arctic and subarctic surface waters exhibit low nutri-ent (nitrogen, silicate, and phosphate) concentrations whichusually become exhausted during summer. Both nitrate andsilicate have been considered to limit primary production(Kristiansen and Farbot 1991, Harrison and Cota 1991).The nitrogen transformations liable to be affected by UV-B
755Chapter 11 · Climate Change, Ozone, and Ultraviolet Radiation
Phytobenthos and macroalgae play important roles inthe extensive coastal areas of the Arctic Ocean, contributing≥50% of total primary production of shelf systems. Macro-algae produce organohalogens that are released to the water.It has been suggested that these volatile gases play a role intrace gas chemistry of the atmosphere (Gschwend et al.1985). Hence, the influence of UV radiation on macroalgalgrowth might have various secondary consequences of con-cern for climate change issues (IASC 1995). Both laboratorystudies under artificial light sources and field studies undernatural light suggest that UV radiation inhibits productionand growth in many different benthic, lithotrophic, andmacroalgal taxa, as well as seagrasses, but that the magni-tude of the impact may well vary between taxa and as afunction of a photoadaptive state (Trocine et al. 1981, Wood1987, Larkum and Wood 1993, Evens et al. 1994, Grobeand Murphy 1994).
11.5.2.3.2. Bacteria
The capacity of bacteria to resist or adapt to UV-B irradia-tion varies widely. Ambient UV-B irradiation can inhibitbacterial DNA replication, protein synthesis, and degrada-tive enzyme activities in some species (Herndl et al. 1993,Helbling et al. 1996, Müller-Niklas et al. 1995). Other gen-era seem to have an extreme resistance to UV-B irradiationand some are even stimulated in population growth by low-level exposure (Herndl et al. 1993, Karentz 1994).
Photochemical degradation of DOC, causing increasedavailability of low molecular weight compounds, could alsostimulate bacterial activity. Lindell et al. (1995) and Wetzelet al. (1995) found enhanced bacterial numbers and cell vol-umes concomitantly with a reduction in DOC when expos-ing natural limnic water to moderate UV-B irradiation; theyinterpreted this to be a result of enhanced availability ofbacterial substrates. The net effect of these processes maydepend on the humic content and absorption of the water(Lindell et al. 1995), although the balance between theseeffects needs to be further evaluated before the long-termresponse of an ecosystem can be determined (Karentz et al.,1994). Heterotrophic bacteria compete efficiently with phy-toplankton for nutrients (Goldman and Dennett 1991). Anenhanced nitrogen uptake relative to carbon fixation ratesin natural plankton communities exposed to UV-B radiationduring a one week experiment indicated a proliferating bac-terial population. A 35-40% increase in thymidine incorpo-ration activities has also been found in in situ enclosure(5 m3) experiments with natural pelagic communities ex-posed to enhanced UV-B radiation for a fortnight. Althoughindividual phytoplankton species may not be harmed by ormay be adapted to increased UV-B radiation, phytoplanktonproductivity in nitrogen limited waters might decrease dueto competition by bacteria for nutrients.
11.5.2.3.3. Zooplankton
Natural irradiances of UV-B have been shown to be lethal tozooplankton; the numbers, survival and fecundity of theireggs and nauplii are reduced by short-term UV-B exposure(Karanas et al. 1979, Damkaer et al. 1980, 1981, Damkaerand Dey 1983, Ringelberg et al. 1984, Thomson 1986).That certain zooplankton will be able to adapt, or alreadyhave protective systems, is suggested by the lower mortalityrates often encountered in zooplankton containing photo-protective compounds such as astaxanthin, melanin, andmycosporine-like amino acids (Hairston 1976, 1980, Rin-gelberg 1980, Ringelberg et al. 1984, Dunlap et al. 1986,
Herbert and Emery 1990, Karentz et al. 1991). Increased UVcould cause a change in species composition and thereby asuccession that may alter the planktonic food webs.
11.5.2.3.4. Invertebrates
Little research has been done on the responses of inverte-brates to enhanced UV in the Arctic and few publicationsare available on invertebrate responses to UV radiation inany region of the globe. Exceptions are the work of Hatcherand Paul (1994) and Newsham et al. (1996) which showthat invertebrate herbivores can be affected both by changesin food plant quality and by apparent artifacts associatedwith methods of increasing UV exposure. Recent studiessuggest that UV inhibits blackfly (Simulidae and Diptera)colonization in boreal and alpine streams (Bothwell et al.1994, Williamson et al. 1996).
11.5.2.3.5. Fish populations
Fish species of highest risk in Arctic areas could be thosespecies that settle in shallow waters in the early spring andspecies with pelagic drifting eggs and larvae. Many impor-tant fish stocks (i.e., herring, pollock, cod, and salmonids)spawn in fully exposed shallow waters where they are ex-posed to epidermal and pineal effects that may be aggra-vated by UV-B radiation. Fish larvae are generally very sus-ceptible to UV-B damage, and even ambient solar radiationhas the potential to affect their viability (Hunter et al. 1979).The larvae of several fish species, including salmonids andherring, are particularly vulnerable to UV radiation sincespawning occurs in very shallow waters and the larvae re-main in the vicinity during their early stages of growth. Skinand gill lesions caused by UV-B radiation have been observedin adult fish in lower latitudes (Robberts and Bullock 1981,Bullock 1985, Bullock and Coutts 1985). Research needs tobe carried out on Arctic organisms that have evolved in lowUV environments. Important for evaluating the potential ef-fects of UV radiation on fish are timing of the spawn, thedistribution of species within the water column (Holm-Han-sen et al. 1993a), and the degree of vertical mixing in thewater column.
Indirect effects of enhanced UV-B on the fisheries mayarise from changes in the planktonic food webs. Perturba-tions in food webs, however, are difficult to predict becausethey depend on the long-term adaptation of species andchanges in community structure. Long-term experiments onnatural communities and ecosystems are warranted in orderto predict such changes.
11.5.2.3.6. Larger animals
If the secondary productivity of the Arctic aquatic ecosystemis challenged, then so too is the viability of sea birds andland predators (i.e., seals, foxes, bears) which feed on aquaticorganisms. The ocular effects of increased UV on anadro-mous fish and also birds, seals, and polar bears need to beconsidered as well (IASC 1995).
11.5.2.4. Climate change and Arctic freshwater11.5.2.4.1. Climate change and Arctic lakes and ponds
The amount of ice and snow accumulated on a lake or pond,and the duration of ice cover, have profound effects on thelimnological characteristics of all northern aquatic systems.Especially in the High Arctic, where the entire ice free sea-son may only be a few weeks in duration (Schindler et al.
756 AMAP Assessment Report
Although several environmental gradients exist in theArctic, the location of Arctic treeline is climate-related,closely matching the mean July position of the Arctic Front(Bryson 1966). The presence or absence of coniferous treesthat are associated with the Arctic treeline (e.g., spruce) haveprofound effects on the limnology of lakes draining thesecatchments (MacDonald et al. 1993, Pienitz and Smol 1993).If the tree line moves north, patterns of wind mixing andsubsequent lake stratification may be altered by the presenceof trees (Rhodes and Davis 1995, Schindler et al. 1990), andDOC released from litter may increase (Schindler et al. 1992).Changes in DOC can affect lake and pond water clarity andcolor, heat absorption, PAR and UV transmission, and nutri-ent cycling, which in turn affect the biota of the lakes (Sa-lonen et al. 1992, Schindler et al. 1990, 1992, 1996a, 1997).
Although generally considered rare in the Arctic, athalas-sic lakes (inland, saline, non-marine lakes) occur in some re-gions (Pienitz et al. 1992, Veres et al. 1995). These closed-basin systems are especially sensitive to climate change be-cause slight alterations in evaporation and precipitation cangreatly affect lakewater salinity levels, which then can strong-ly influence the biota in these systems (Hammer 1986). Be-cause many of these lakes are shallow, the possibility existsof total desiccation for some systems with increased evapo-ration rates.
Climatic warming could offset a positive feedback onlight regimes and UV penetration in lakes, since warmingand drought strongly reduces DOC and increases UV pene-tration. This has been demonstrated for North Americanlakes (Schindler et al. 1996a, 1997). These effects could in-fluence Arctic lakes and coastal areas as well.
11.5.2.4.2. Climate change and Arctic rivers and streams
Climatic warming and resultant changes in precipitationand glacial melt are likely to have a major impact on Arcticstreams and rivers and organisms inhabiting them. Thermalregimes in glacier-fed rivers could become colder whilesmaller streams could become warmer. Sediment and flowregimes are likely to change as a result of glacier and per-mafrost melting, soil drying, and changes in spring breakup(Oswood 1989).
Some of the most obvious consequences of a warming cli-mate are increases in ice-free days and water temperatures innon-glacial freshwater systems. The effect of a milder ther-mal regime may change the biogeography of freshwater fish.Increased water temperatures combined with year-roundgroundwater flow (from decreased permafrost) might changethe suitability of streams for some fish species (Eaton andScheller 1996).
Studies at the freshwater ecosystem level are few. Allardet al. (1994) noted that in the subarctic river Kalix (northernSweden) there was a higher humic fraction DOC during win-ter (dark period) than during summer. The authors interpretthis as an effect from photodegradation of dissolved humicmatter in river water during the long daylight periods of theArctic summer.
11.5.2.5. UV and Arctic freshwater
The effects of UV on Arctic freshwater will be highly depen-dent on the transparency and DOC level of the water. Arcticfreshwater may be expected to be altered from increased UV,especially water of high transparency and low DOC. It maybe anticipated that most species and populations are locallyadapted to present-day irradiance; however, plankton inboth Arctic and alpine waters are commonly light stressed
1974, Douglas and Smol 1994), even modest climatic warm-ing can significantly increase the growing season.
Arctic ponds (sensu Sheath 1986) are defined as shallow(generally < 2 m deep, and in many cases <1 m) systems thatfreeze to the bottom each winter. Fish and other vertebratepredators are generally absent (with the exception of somemigratory birds), and thus food webs are relatively simple.These shallow ponds are a dominant feature of many Arcticlandscapes, yet few data are available on the limnology ofthese systems (e.g., Hobbie 1980, Douglas and Smol 1994,Havas and Hutchinson 1983).
The most obvious effect of a warmer Arctic would be toincrease pondwater temperatures. Because the vast majorityof these sites are so shallow, the ponds closely track ambientair temperatures (Douglas and Smol 1994). With warmertemperatures and reduced ice cover, many aspects of thepond system would change (Rouse et al. 1997, Douglas andSmol 1993, 1994). Reduced ice and snow cover may resultin a lengthened growing season, which will affect manychemical, physical, and biological processes. In some lakestotal annual primary production may increase, and morecomplex periphytic assemblages may develop (Douglas andSmol 1993, 1995). In deeper lakes, however, primary pro-duction may decrease after break-up so that earlier break-upwould have a negative effect on production (Kalff andWelch 1974).
On the other hand, if precipitation does not increase sig-nificantly, evaporation from ponds would increase with cli-matic warming and the net water balance could be affected.As a result, pondwater conductivity values might increase,as might pondwater pH (Douglas and Smol 1994). A moresignificant manifestation of increased evaporation rateswould be that some of the shallower ponds would desiccatecompletely.
The relationship between lakewater acidity and climatechange may prove to be a significant determinant of Arcticecosystems. Climate might control lakes via pH through theeffects on water renewal and relative yields of base cationsand strong acid anions (Psenner and Schmidt 1992, Schind-ler et al. 1996a). Climatic warming and increased evapora-tion cause increased in-lake removal of sulfate and return ofbase cations from sediments, both of which increase as wa-ter renewal time increases; thus alkalinity increases. In areasthat are strongly affected by acid rain, however, the effectsof climatic warming and increased UV-B may increase cy-cling of DOC (Schindler et al. 1996a).
High Arctic lakes would similarly be affected by climaticwarming, although maximum water temperatures would beless affected than in ponds, as deeper lakes have much higherthermal capacities. High Arctic lakes are characterized byextended snow and ice covers, with some lakes remainingcovered by a central float of ice throughout the short summer.Production in High Arctic lakes occurs whenever snow isabsent and the sun is above the horizon. Much of the annualproduction occurs under total ice cover, since many lakes arenot clear of ice until late July or early August (Kalff andWelch 1974, Welch et al. 1989). Strong winds and low snow-falls generally keep lakes snow free for much of the year.
Temperature has been found to immediately affect pro-ductivity. Some preliminary results from a littoral zone of aboreal lake indicate higher primary production with 2°C risein temperature, even in the absence of additional nutrientloading (Kankaala et al. 1994). However, Schindler et al.’s(1997) 20-year study found no change in production with2°C temperature increase in boreal lakes. Phytoplanktonbiomass declined in proportion to reduced phosphorus con-centrations and inputs caused by declining streamflow.
757Chapter 11 · Climate Change, Ozone, and Ultraviolet Radiation
and exhibit low repair capacities (Luecke and O’Brien 1983,Hebert and Emery 1990, Hessen et al. 1990). A further in-crease in UV-B could thus cause detrimental effects on vari-ous taxa. Organisms in shallow ponds without depth refugiacould, in particular, be susceptible to UV. Recent studies ofUV-B effects on bacteria and zooplankton have been under-taken in experimental enclosures in the Canadian Arctic(Lean unpubl.). Combinations of in situ and lab studies havebeen performed with phytoplankton in subarctic alpineareas (Hessen et al. 1995, Van Donk and Hessen 1996), andparticularly with zooplankton in the Canadian Arctic (He-bert and Emery 1990) and Norwegian subarctic and HighArctic at Svalbard (79ºN) (Hessen 1993, 1994, 1996). Thework with phytoplankton demonstrates high susceptibilityof flagellum status, phosphorus uptake, growth rate, and cellwall morphology. A particularly intriguing discovery is thatUV exposure induces cell wall changes that reduce digestibil-ity of phytoplankton for zooplankton (Van Donk and Hes-sen 1995). The zooplankton studies focus on the widespreadkey genus Daphnia, and studies on melanic (UV tolerant)and hyaline (UV susceptible) natural clones have been per-formed. These studies are intimately linked to populationgenetics and evolutionary history of these clones.
11.6. Effects of climate change and UV radiation on Arctic peoples
An understanding of contemporary patterns of settlementand resource use combined with evidence from historicaland archeological records can help estimate the magnitudeof potential impacts of climate change to Arctic communi-ties. To the extent that Arctic peoples continue to harvestplant and animal foods, live permanently or seasonally oncoastal spits and along river banks and lake shorelines, anduse snow mobiles and dog sleds for transportation, climatechanges will directly impact their lives.
Climate change affects people on different scales; glob-ally, regionally, and subregionally. While a general warmingof the Arctic is predicted, regional weather patterns are prob-ably more important to human use and habitation as someareas will become cooler while others warm. Should glaciersand ice sheets melt significantly over the coming decades, sealevel rise will impact village location, transportation, tourism,water resources, and other facets of Arctic life. If climaticwarming results in less sea ice and better access to northernoceans, it is reasonable to project that activities such as ship-ping, mining, and on-and offshore oil development will in-crease. To understand the impacts of climate change oncommunities and regions, it is important to identify associ-ated regional policy concerns (Yin and Cohen 1994).
Potential effects of climate change on settlement and re-source abundance can be inferred from the past record. Tothe peoples living in the North, normal seasonal variation hasalways been considerable, commonly demanding or enablingroutine changes of settlement area, social grouping, houseform, subsistence activity, mode of transportation, and diet.While access to modern resources may mitigate the effects ofclimate change, impacts upon the ability of northern popula-tions to continue traditional ways of life might be overwhelm-ing. Establishment of permanent villages and towns may alsocompound the effects as people today are tied to villages andless able to move with shifting resources. In some areas then,climate change might further remove people from culturallyimportant hunting, gathering, and fishing activities and asso-ciated spiritual and social relationships, knowledge transfer-ence, and other traditional economic endeavors.
11.6.1. Prehistorical and historical effects of climate change
Oceanographic and terrestrial factors related to indigenousoccupation of the Arctic center around cyclic resource abun-dance or biological productivity. In Northwest Alaska, pastperiods of warming are associated with intensive occupationof coastal sites while cold periods supported inland occupa-tion by Iñupiat (Mason and Gerlach 1995). Ocean dynamicsand especially areas of nutrient upwelling influence locationand hence availability of marine mammals and fish. Areas inclose proximity to polynyas have historically and prehistori-cally been productive areas for human settlement, as haveinland areas supporting large numbers of caribou and fish.Changes in ocean dynamics resulting in changes in polynyalocation have caused shifts in settlement patterns (Schleder-mann 1980, Mason and Gerlach 1995). Sudden decreases incaribou populations or sudden changes in caribou migrationroutes have forced indigenous peoples to abandon someareas for more productive ones; some past changes in cari-bou concentrations have been attributed to climate change.
Variations in climate may crucially alter societies living inregions which are environmentally and climatically marginalas certain economic activities, particularly those based onagriculture, become inviable (Parry 1978). In pre-twentiethcentury Iceland, for example, periods of cooling were fre-quently associated with poor harvests, and subsequent mal-nutrition and death among livestock and humans (Ogilvie1982, 1984). In Greenland, the Norse settlement was aban-doned around 1350 AD. Computer modeling of the climateand agricultural data indicate that a combination of reducedsummer growing season for fodder and an extended winterfeeding period for imported European domestic animals mayhave placed the Norse economy under extreme stress (Buck-land et al. 1996, Barlow et al. 1997). Inuit living in the samearea of Greenland, with seal hunting forming their maineconomic base, continued to thrive. From these and otherexamples, it is possible to infer that dependence upon localresources and the vulnerability of local environments andgeography to changes in parameters such as precipitation,temperature, sea level, and ice cover can lead to large-scaleshifts in resource use and settlement patterns in the Arctic.
11.6.2. Settlement and resource useIndigenous patterns of resource use and settlement locationare based on stable patterns of resource availability. Settle-ments have been established where food, water, shelter, andtransportation are reliable. Today hunting and fishing campsare set where resource abundance can be predicted for certaintimes of the year; as resource availability shifts so do hunt-ing and fishing camps. While today many would describe theeconomy of northern peoples as mixed, the robustness of theindigenous economies depends on their abilities to accom-modate the annual variability in local plant and animal re-sources as well as the physical environment (Langdon 1986).
Many coastal settlements in the Arctic, particularly inAlaska and Russia, are on low-lying coastal plains and riverdeltas. Storms during summer and fall have historicallycaused damage to these communities. Coastal erosionthreatens several villages in Alaska, and some have alreadymoved to more protected areas. Changes in ice formationand breakup could increase flooding along rivers. A rise insea level will threaten many more communities as coastalplains and spits are flooded and the geography of majorriver deltas transformed. Detailed information on commu-nity response to floods is provided by Newton (1995).

758 AMAP Assessment Report
be shaded by other factors besides climate change, includingglobal economic forces, technological changes, and politicaldevelopments. This is evident in the Mackenzie Basin ImpactStudy (MBIS) case from northwest Canada (Cohen 1997).
11.6.3.1. Commercial fisheries
The effects of both warmer and cooler ocean temperatureson fish populations are discussed in section 11.5.2.1.1.A warmer ocean could bring large economic benefit to Arc-tic residents if fish populations increase. However, somepopulations might decline as species composition changes.Aquaculture would probably profit from a temperature in-crease. However, toxic algae and new fish diseases mightcause increasing problems in a warmer ocean as might occa-sional episodes of high surface water temperatures (Øiestad1990). Beneficial influences on wild salmon populationsmight come from river and stream temperatures, flow rate,and sediment amount. As discussed in section 11.5.2.4.2,some fish species, including salmonids, are likely to benefitfrom effects of a warming climate. In some areas whereocean temperatures decrease and the extent of sea ice ex-pands fisheries would be expected to collapse (Øiestad 1990).
11.6.3.2. Reindeer herding
In Fennoscandia and Eurasia domestic reindeer herding is animportant livelihood among indigenous pastoralists. It is animportant food source, a foundation of cultural heritage,and a vital economic resource. Changes to reindeer herdingcaused by increased precipitation and temperature and resul-tant changes in vegetation composition and nutritive valueare difficult to predict. Displacement of high quality forageby low quality or non-food species as described in section11.5.1.1 may severely reduce grazing lands impacting theeconomies of reindeer herders (Bryant et al. 1991). Changesin timing of break-up or increased river levels could make itdifficult to move animals between pasturage.
11.6.3.3. Transportation
Warmer temperature and a possible reduction in seasonaland annual sea ice cover may increase the opportunities forshipping in the Arctic through the Northern Sea Route andthe Northwest Passage as well as by increasing ice-free daysfor some harbors. At the same time, regional decreases inocean temperature may have the opposite effect and closeoff areas to year-round shipping. Changes to regional ship-ping practices including cruise ships will also depend on re-gional economic activity, which may be affected by a changein ocean access or other climate-affected parameters.
11.6.3.4. Forestry
The northern treeline is expected to move north as the cli-mate warms and conditions become more favorable (Mac-Donald et al. 1993, Sveinbjornsson et al. 1992). In areas ofnutrient availability trees are also expected to grow morequickly; this could supply more harvestable trees in the fu-ture. However, as a result of decreased summer precipitationand drier foliage and leaf litter, outbreaks of defoliating in-sects might increase resulting in increased forest fires as dis-cussed in section 11.5.1.1.2.
Fire may have beneficial effects if the intensity of fire isnot too great. Fire can fertilize the forest floor and stimulategrowth of early successional deciduous trees that providehabitat for moose and other large herbivores. On the other
Loss of permafrost from climate warming may alsothreaten existing structures such as buildings, undergroundstorage, roads, and pipelines. Areas that presently have largeamounts of massive ground ice could become particularlyunstable, causing increased problems for existing roads andbuildings and new construction. At the same time, construc-tion methods may become easier in some areas as soils thaw,dry out, and become more stable.
Precipitation and river flow are also important considera-tions for village location. Temperature and humidity changesmay affect both the energy balance of ecosystems and theavailability of water and snow cover. Much of the Arctic re-ceives little precipitation, and a decrease in snowfall or raincould reduce water supplies for villages and towns. In thelarge areas of coastal plain and wet tundra, an increase inprecipitation could make lands unusable for settlement.Changes in snow cover and sea ice would also affect travel-ing conditions over the land and sea respectively, altering theability of hunters to reach other villages and hunting loca-tions in winter. Increased precipitation and run-off couldalso interfere with springtime travel.
Thus, climatic changes would impact geophysical andbiological processes. Changes in air and water temperature,precipitation, and storm patterns could affect availability offish, land and marine animals, and plant foods to humans.Indigenous hunting strategies are the result of the interplayof complex variables such as the distribution of numerousgame species, dietary needs, transportation possibilities, andenergy expenditures of different hunting forms (Freeman1984). Animal and fish species which often seem abundantare largely composed of seasonal migrants to specific feedinggrounds where food production can be intense but short.
Changes in vegetation and precipitation could shift themigration of terrestrial mammals and alter the breeding andmolting areas of birds. Cooling or warming of rivers andlakes would probably affect the distribution and abundanceof all types of freshwater and anadromous fish.
Marine mammals are important cultural and dietary re-sources for indigenous people of the Arctic (Lantis 1938,Worl 1980). Human exploitation of marine mammals is de-pendent on sea ice conditions, including lead and polynyaformation, ice extent, and location of shorefast ice. At thesame time, the population density of many marine mammalsincluding ringed seals and walrus is positively correlatedwith the distribution and condition of coastal sea ice (Mac-Laren 1961). Climate change might cause ringed seals,whales, or walrus to migrate in new paths, thereby signifi-cantly affecting subsistence harvesting. All of the abovechanges may directly impact the way indigenous peoples areable to obtain food resources and maintain their economies.
Increases in off-shore oil development and shipping dueto a decrease in sea ice might affect populations of marinemammals in general. Of particular concern are culturallyand nutritionally important animals such as ringed seals,whales, walrus, and polar bears (Stirling and Calvert 1983,Stirling 1988, Stirling and Derocher 1993). An increasedability for humans to live in the north may also increasehuman-bear interactions, and bears could be pushed out ofparts of their present range.
11.6.3. Economic activitiesA warmer climate will impact communities economically andsocially. Accounting for these factors requires considerationof the nature of Arctic communities, which often includeboth wage and non-wage (subsistence) economies and life-styles (Peterson and Johnson 1995). Adaptation responses will
759Chapter 11 · Climate Change, Ozone, and Ultraviolet Radiation
hand, drier, windy conditions that may coincide with cli-matic warming may cause intense fires which burn off theorganic layer and release nutrients from the system (Ka-sischke et al. 1995, Starfield and Chapin 1996, Flanniganand Van Wagner 1991).
11.6.3.5. Agriculture
Arable land in the Arctic is mainly limited by surface andsoil temperatures. Temperature records from four sites inAlaska show a general increase in the agricultural growingseason between 1924 and 1989 although regional patternswere inconclusive (Sharratt 1992). Lengthened growing sea-son was due to earlier last spring freezes, later first fallfreezes, or both. These trends are similar to mid-latitudetrends and do not indicate an Arctic amplification of grow-ing season length. In a study based on soil surveys and cli-mate in Alaska and northwestern Canada, the impact of adoubling of CO2 on arable land was modeled (Mills 1994).Potentially arable lands showed increased moisture deficitsand an improved climatic capability for agriculture with anincrease of nearly 160 000 km2 (16 M Ha) of arable land inthe study area due to warming temperatures. Moisture limi-tations, it is predicted, would limit the use of some of thisland, and serious questions remain about the adaptation ofexisting plant species to higher CO2 levels (Mills 1994).
11.6.4. Effects of UV radiation on human healthUV radiation is linked to a variety of skin disorders and anincrease in UV dose to northern populations is a health con-cern. The effects of UV radiation on human health are cov-ered more fully in chapter 12, section 12.2.4.2. The healtheffects of UV radiation include skin disorders (cancer, changesin elasticity and hypersensitivity), eye damage, and immunesuppression. Skin disorders have been shown to affect differ-ent northern populations in different ways. Both carcinomasand malignant melanomas of the skin are less common inthe Greenland Inuit population than in the general Danishpopulation. Several reasons have been posed for this, includ-ing the low UV radiation historically received in the Arcticand the pigmentation of the native people. Changes in elas-tosis of the skin, which can be linked to UV exposure, havebeen observed in Inuit (Wulf et al. 1989). Erythema (sun-burn) while a temporary irritant, has also been linked to ma-lignant melanoma. Young children who get severe sunburnsare particularly prone to skin cancer later in life (WHO1993). A preliminary investigation has suggested that poly-morphic light eruption, a photodermatosis resulting fromsun exposure, is more common in the Arctic than at lowerlatitudes. The ratio of UV-B to UV-A has been proposed asan explanation for the disorder at high latitudes. Actinicprurigo, another idiopathic photodermatosis, has beenfound to be frequent in the Canadian Inuit population andhas been linked to UV-B sensitivity (Orr and Birt 1984).Ozone depletion may, therefore, reduce the incidence ofpolymorphic light eruption and increase the incidence ofactinic prurigo in the Arctic. Some of these effects are miti-gated in the Arctic because most skin is covered by clothingfor much of the year. Changes in personal exposure patternscan have a greater effect than small changes in stratosphericozone.
Ocular damage linked to UV exposure includes photo-keratitis, cataracts, and pterygium. The highly reflectivesnow covered surfaces in the Arctic can help reflect ambientUV to the eye, increasing the UV exposure to levels higherthan those observed at lower latitudes. Photokeratitis, com-
monly referred to as snow blindness, has always been aproblem in the Arctic, as evidenced by Inuit ocular shields.Cataract formation has been linked to a variety of causes,including UV radiation. There has been some evidence tolink cortical cataracts with chronic ocular UV-B exposure(Dolin 1995). Increasing UV-B should be considered a prob-lem which could be costly for remote health care (IASC1995). Other eye diseases such as spheroidal degeneration ofthe cornea and conjunctivea (climatic droplet keratopathy)and pterygium may or may not be associated with UV-B ex-posure. However, pterygium mainly occurs under conditionsof climatic extremes and might, therefore, be of special rele-vance for UV-B in the Arctic (IASC 1995, WHO 1993).
UV-B radiation is able to suppress the immune systemwhich may exacerbate a variety of existing health threats.This immune suppression can cause the reactivation of vi-ruses including herpes, chicken pox, Epstein-Barr, and thewart virus. Immunosuppression appears to be independentof skin pigmentation, and very small doses of UV-B are ableto start the reaction (Olivarius et al. 1996). It is unclear howmuch exposure is necessary to induce a systemic immunesuppression (IASC 1995).
11.7. International efforts11.7.1. AgreementsThe Montreal Protocol on Substances That Deplete theOzone Layer and its amendments have set standards to re-duce the production of CFCs and other ozone depleting sub-stances. The impetus for these international agreements hasbeen the discovery of ozone holes in Antarctica. Projectionsregarding the Arctic ozone layer are not directly addressedby these agreements but, because of the likely link betweenstratospheric cooling and ozone depletion in the Arctic, fur-ther investigation is warranted to determine if measuresneed to be taken to assure the protection of the Arctic stra-tospheric ozone layer. Compliance with the Montreal Proto-col is still of some concern. Bulgaria, Poland, Russia, Ukraine,and Belarus have each said that they may not be able toreach their agreed phase-out goals. Evidence of illegal tradein the controlled substances may undermine the goals of theMontreal Protocol and amendments. Continued re-examina-tion of the available science and compliance information isnecessary to assure the success of the Montreal Protocol’s ef-forts to reduce ozone depleting substances.
The United Nations convened the FrameworkConvention on Climate Change at the Rio Earth Summit in1992. 162 countries signed the agreement to implement na-tional policies to monitor and attempt to reduce greenhousegas emissions. Significant to the Arctic climate, it was alsoagreed that sustainable management of greenhouse gas sinks(natural ecosystems which can remove greenhouse gases fromthe atmosphere) should be promoted. At the more recentBerlin conference, timeframes to reduce greenhouse gaseswere set, but no new targets were agreed upon. Appropriategreenhouse targets are critical to the Arctic environment be-cause of its high sensitivity to climate change. While re-search to determine the appropriate targets may take manyyears, efforts should be made immediately to assure themost cautionary levels are agreed upon as soon as possible.The presently proposed system of management depends onindividual countries reaching concentration goals withintheir country limits. This form of regulation may not be suf-ficient to protect the Arctic, which is under no single nation-al control. The newly-formed Arctic Council, however, maytake up this issue. Further efforts will be needed to assure
760 AMAP Assessment Report
The Nordic Ozone and UV Group has coordinated researchon ozone and UV for the Nordic countries. This group hasbeen very effective in focusing research needs and intercom-paring results. Further benefits would be gained from partici-pation from Canada, the United States, and Russia.
The International Arctic Science Committee (IASC), a non-governmental organization established in 1990 to encourageand facilitate Arctic research, has proposed a comprehensiveprogram to assess the effects of UV radiation on the Arctic en-vironment and the regional impacts of climate change in theBarents and Bering Seas. The program is presently in searchof funding to implement the proposed research program.
11.7.3. AssessmentsThis AMAP document is the first document sponsored by alarge, international committee to assess what is known aboutclimate change, ozone, and UV, and their effects in the Arc-tic. Some of the information presented in this chapter hasbeen presented in other assessments. For the most part, how-ever, the information has not previously been brought to-gether in the context of Arctic research. Several importantassessments have been written concerning global climatechange, ozone, and UV radiation, yet most effort has beenplaced on northern mid-latitude and Antarctic changes. Con-siderably less effort has been placed on the Arctic. In somecases, the Arctic environment is not addressed at all; in othercases, the Arctic environment is addressed as part of the po-lar environments. Such grouping ignores the vast differencesbetween Arctic and Antarctic environments and concerns.
11.7.3.1. Climate change
The Intergovernmental Panel on Climate Change (IPCC),jointly established by the World Meteorological Organi-zation and the United Nations Environmental Programme in1988, has produced a number of documents, most notablyfour scientific assessments (IPCC 1990a, 1992a, 1994, 1996a)summarizing the present understanding of the science of cli-mate change, and four assessments of the impacts of climatechange (IPCC 1990b, 1992b, 1996b). These assessmentshave focused on modeling and model predictions for futurelevels. The IPCC documents have illuminated serious prob-lems in the existing models for Arctic climate. At present nointernational programs exist to promote the advancements ofthe climate models for future predictions in the Arctic, al-though scientists continue to work on improving their indi-vidual models. The IPCC scientific assessments take a moregeneral view and do not focus on any region of the Earth.Because of the unique qualities of the Arctic environmentand its interactive processes, many of the general results arenot applicable to the Arctic. Focused effort, on the part ofthe IPCC, to examine the Arctic’s responsivity to climatechange through available data from the Arctic would be ap-propriate and useful to understanding global climate change.
11.7.3.2. Ozone and UV
The World Meteorological Organization, in conjunctionwith the United Nations Environmental Program (UNEP),the US National Oceanic and Atmospheric Administration(NOAA), and the US National Aeronautic and Space Agency(NASA), has produced several assessments addressing thepresent understanding of ozone depletion. The most recentreport, Ozone Depletion: 1994 (WMO 1994), documentsobserved ozone loss in the Arctic which is consistent withphotochemical model calculations. However, the recent
that Arctic levels due to transport do not exceed set stan-dards. The treaty signed in 1979 at the Geneva Conventionconcerning long-range transports may be invoked to aid inthe control of greenhouse gases in the Arctic. Furthermore,while the United States and the European Union have agreedthat a binding treaty should be drawn up with regard togreenhouse gas emissions, many other countries prefer thatthis agreement remain voluntary.
11.7.2. ProgramsThe Arctic has many unique attributes which make it parti-cularly susceptible to climate change, ozone depletion, andUV enhancement, more so than mid-latitude and even Ant-arctic environments. While many programs address climatechange at mid-latitudes and ozone in the Antarctic, the in-ternational community has only recently begun to addressthese problems in the Arctic. Individual efforts to under-stand climate change, ozone, and UV radiation in the Arcticare on-going at a number of institutions around the world.Several international programs have been started in the lastdecade to address issues of climate change, ozone, and UVradiation in the Arctic.
The EU has been active in climate change issues and hassponsored a number of projects related to ozone and UV inthe European Arctic. The European Commission’s Environ-ment Research Programme has supported European ArcticStratospheric Ozone Experiment (EASOE) and Second Eu-ropean Stratospheric Arctic and Mid-latitude Experiment(SESAME) as well as a recent project, Ultraviolet Radiationin the Arctic; Past, Present and Future (UVRAPPF) to exam-ine ozone and UV in northern Europe. The European Com-mission has also funded a program of experimental researchinto the impacts of enhanced UV-B radiation on Europeanheathlands (UVECOS), which includes several different eco-systems within the European Arctic from Lapland to HighArctic Svalbard. These efforts have revealed and broughtinto focus many questions which still need to be answered.Because issues of climate change, ozone depletion, and UVradiation affect the entire Arctic, these programs would ben-efit from expansion or coordination with North Americanand Russian research communities in order to obtain morecomplete information on the Arctic environment.
The World Meteorological Organization (WMO) hassponsored and coordinated a number of scientific activitiesrelated to climate change, ozone, and UV radiation. TheGlobal Atmosphere Watch (GAW) program coordinatesmonitoring sites around the globe, including in the Arctic.The World Climate Research Programme within the WMOhas established Stratospheric Processes and their Role inClimate (SPARC). These programs need to be expanded togive more emphasis to Arctic issues in line with the impor-tance of the Arctic in the global climate system. The WorldClimate Research Programme has also established the ArcticClimate System Study (ACSYS) to examine freshwater bal-ance, runoff, and sea ice in the Arctic. A useful productwhich may result from this program is the ACSYS precipi-tation data center to be established in Germany.
Toronto hosts the WMO’s Ozone and UV Database cen-ter which offers data over the Internet. There is increasedneed to include more ozone and UV data from the Arctic inthis center. The responsibility for inputting ozone and UVdata lies with the individual countries and agencies collect-ing the data. The data, once available, need to be examinedin a regional, rather than national, perspective in order tounderstand observations with respect to the Arctic. This isbeyond the present scope of the WMO data center.
761Chapter 11 · Climate Change, Ozone, and Ultraviolet Radiation
ozone anomalies, which had not been well documentedwhen the last report was written, need to be addressed infuture documents. The Arctic has been grouped togetherwith the Antarctic in past reports. In light of recent under-standing of the different character of ozone in the Arcticversus the Antarctic, future assessments should address theArctic separately, with full attention to what is known aboutthe Arctic and the observed anomalies. Future assessmentsshould also address the issue of UV radiation in the Arcticin more depth than previous reports.
UNEP has co-sponsored several important reports on UVradiation and its effects. However, very little attention hasbeen given to the Arctic environment in any of these reports.The Scientific Committee on Problems of the Environment(SCOPE) has also sponsored several important reports onUV radiation, again with no significant attention to the Arc-tic. The effects of UV radiation in the Arctic were reviewedby the International Arctic Science Committee (IASC). Theresulting reports offer an extensive evaluation of what isknown about UV effects in the Arctic and underlines howlittle is known about the effects of UV on Arctic species,ecosystems, and human inhabitants (IASC 1995, 1996).
11.8. Conclusions and recommendations11.8.1. Climate change: ConclusionsThe climate of the Arctic affects both the inhabitants of theArctic and the global climate system. Anthropogenically-dri-ven climate change is likely to be most severe in the Arcticbecause of the strong feedback mechanisms. The Arctic hasundergone rapid changes in the past. Recent changes havebeen linked to anthropogenic forcing; but despite the globalconsequence of changes in the Arctic climate, monitoring ofbasic climatic parameters, such as sea ice, precipitation, andthe atmosphere, are not adequate to assess these recentchanges. Present monitoring in the Arctic is not adequate toassess the impacts of global climate change. The uneven geo-graphical location of present monitoring stations limits thepresent ability to understand the climate system.
In preparing this document it became evident that knowl-edge from Arctic people is underutilized in climate changeresearch. Arctic peoples have passed down informationthrough generations on climate change which has been use-ful for their survival. Traditional knowledge is a valuablesource of information on present climate dynamics andneeds to be documented and included in future assessments.
Changes in sea ice coverage and thickness are the primarydriving forces in the polar amplification of global warmingforecast by many climate models. Yet there are few continu-ous and ongoing measurements of the surface energy bal-ance, of the ice thickness distribution, or of the structure ofthe upper ocean. In the past, the drifting ice stations of theFormer Soviet Union provided many key measurements, butthat series of manned camps has ended and none from anynation are likely to replace them.
Prediction of Arctic climate is not reliable at this time.The complex interactions of the various components of theArctic make climate modeling and therefore climate predic-tions extremely difficult and uncertain at this time. The cli-mate models in existence do not agree well with currentmeasurements, nor do they agree with each other with re-spect to predictions when applied to the Arctic. Sea ice dy-namics and trace gas balance, particularly over land, arevery important aspects of the climate system in the Arctic,yet very little is known about changes taking place in eitherof these components.
11.8.2. Climate change: RecommendationsThere is a strong need to improve understanding of theclimate system and to develop reliable methods of climateprediction for the Arctic. Baseline information is neededthroughout the Arctic to be able to assess any future changes.Ice and lake sediment cores, peat cores, biological records,archaeological records, and historical documents should beexamined to determine the climate of the past few hundredyears for the Arctic. Traditional knowledge needs to be doc-umented and incorporated into the present scientific knowl-edge of climate change. Crucial aspects of climate in theArctic, particularly the hydrological and trace gas cycles,are insufficiently understood. Increased knowledge of thesesystems is necessary before reliable predictions can estimatefuture changes. The role of gaseous exchange in Arctic ter-restrial areas requires further investigation to understandboth the Arctic climate and the global climate. Existing at-mospheric models need to better incorporate the dynamicalnature of the Arctic feedback mechanisms to provide validestimates.
Every effort should be made to increase the number ofclimatologically useful observations on, above, and belowthe ice pack, with a concentration of effort in critical regionsthat are particularly sensitive to climate change, such asshelf regions and the Arctic Ocean’s primary outflow region,Fram Strait. Buoys, moorings, aerial surveys, and satellite re-mote sensing are likely sources of the information needed tomonitor the state of the Arctic ice pack. Increased support ofsuch measurement programs is important to understandingchanges in Arctic climate.
11.8.3. Ozone: ConclusionsIn the last 20 years, ozone concentrations in the Arctic havebeen changing more than those at mid-latitudes, with ob-served trends of in excess of 10% per decade. Of more con-cern than the average trend is the occurrence of short-termepisodes of extreme ozone depletion. There are indicationsthat the occurrence of these episodes is increasing, yet theirfull cause is not well understood. Because ozone depletion inthe Arctic is linked to stratospheric cooling, future climatechange is expected to have a strong influence on future ozonelevels. The reductions of CFC’s alone may not be enough torestore the Arctic ozone layer to pre-1980s levels.
11.8.4. Ozone: RecommendationsThe recent changes in the ozone concentrations in the Arcticrequire further examination. Both the mean trends and dis-tributions in the Arctic ozone layer need to be understoodbefore confidence may be placed on predictions about theArctic ozone layer. There is a pressing need to accurately ex-plain the mechanisms responsible for the recently documentedozone anomalies in the Arctic. The cause and impact ofthese anomalies need to be further understood. The poten-tial link between climate change, in particular the cooling ofthe stratosphere, and Arctic ozone concentrations requiresimmediate further research.
11.8.5. UV: ConclusionsUV radiation in the Arctic is not negligible, as is often as-sumed, because of the large amount of diffuse radiation.In the Arctic, UV is difficult to measure and difficult to esti-mate from satellite information, yet existing UV ground-monitoring stations in the Arctic are very unevenly distri-buted, so that the present spatial coverage of UV monitoring
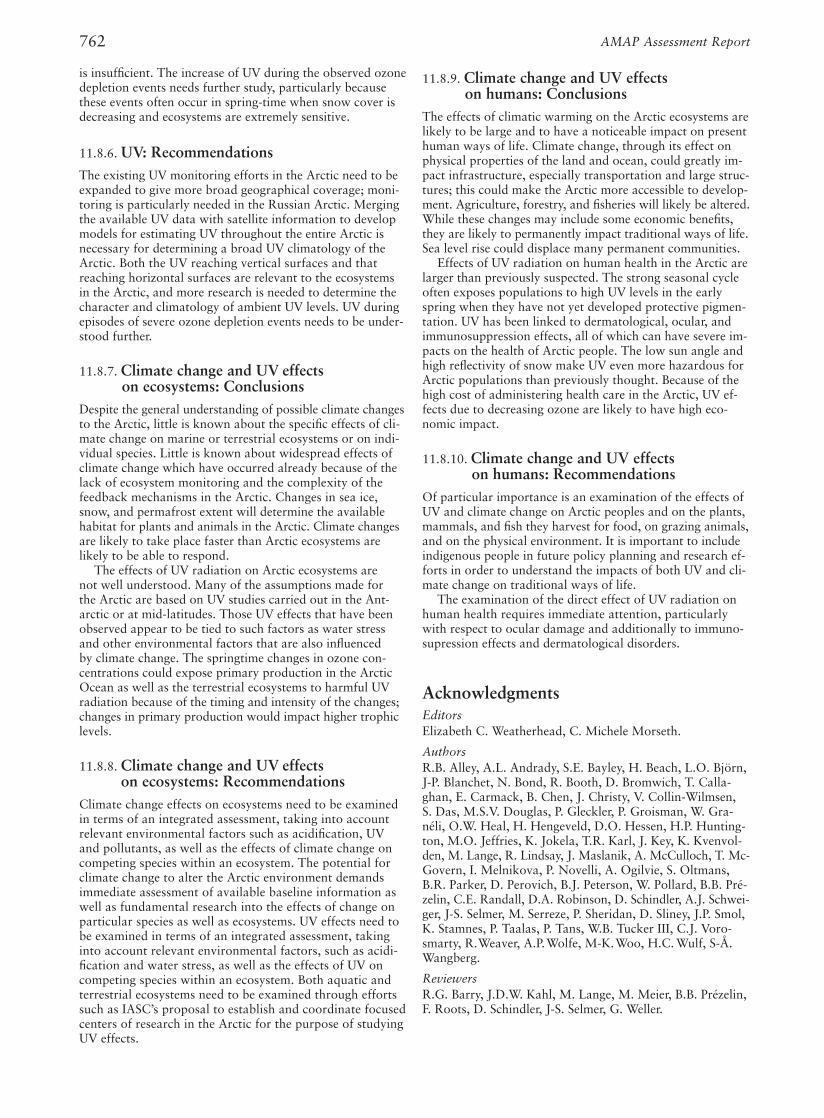
762 AMAP Assessment Report
11.8.9. Climate change and UV effectson humans: Conclusions
The effects of climatic warming on the Arctic ecosystems arelikely to be large and to have a noticeable impact on presenthuman ways of life. Climate change, through its effect onphysical properties of the land and ocean, could greatly im-pact infrastructure, especially transportation and large struc-tures; this could make the Arctic more accessible to develop-ment. Agriculture, forestry, and fisheries will likely be altered.While these changes may include some economic benefits,they are likely to permanently impact traditional ways of life.Sea level rise could displace many permanent communities.
Effects of UV radiation on human health in the Arctic arelarger than previously suspected. The strong seasonal cycleoften exposes populations to high UV levels in the earlyspring when they have not yet developed protective pigmen-tation. UV has been linked to dermatological, ocular, andimmunosuppression effects, all of which can have severe im-pacts on the health of Arctic people. The low sun angle andhigh reflectivity of snow make UV even more hazardous forArctic populations than previously thought. Because of thehigh cost of administering health care in the Arctic, UV ef-fects due to decreasing ozone are likely to have high eco-nomic impact.
11.8.10. Climate change and UV effects on humans: Recommendations
Of particular importance is an examination of the effects ofUV and climate change on Arctic peoples and on the plants,mammals, and fish they harvest for food, on grazing animals,and on the physical environment. It is important to includeindigenous people in future policy planning and research ef-forts in order to understand the impacts of both UV and cli-mate change on traditional ways of life.
The examination of the direct effect of UV radiation onhuman health requires immediate attention, particularlywith respect to ocular damage and additionally to immuno-supression effects and dermatological disorders.
AcknowledgmentsEditorsElizabeth C. Weatherhead, C. Michele Morseth.
AuthorsR.B. Alley, A.L. Andrady, S.E. Bayley, H. Beach, L.O. Björn,J-P. Blanchet, N. Bond, R. Booth, D. Bromwich, T. Calla-ghan, E. Carmack, B. Chen, J. Christy, V. Collin-Wilmsen,S. Das, M.S.V. Douglas, P. Gleckler, P. Groisman, W. Gra-néli, O.W. Heal, H. Hengeveld, D.O. Hessen, H.P. Hunting-ton, M.O. Jeffries, K. Jokela, T.R. Karl, J. Key, K. Kvenvol-den, M. Lange, R. Lindsay, J. Maslanik, A. McCulloch, T. Mc-Govern, I. Melnikova, P. Novelli, A. Ogilvie, S. Oltmans,B.R. Parker, D. Perovich, B.J. Peterson, W. Pollard, B.B. Pré-zelin, C.E. Randall, D.A. Robinson, D. Schindler, A.J. Schwei-ger, J-S. Selmer, M. Serreze, P. Sheridan, D. Sliney, J.P. Smol,K. Stamnes, P. Taalas, P. Tans, W.B. Tucker III, C.J. Voro-smarty, R.Weaver, A.P.Wolfe, M-K.Woo, H.C. Wulf, S-Å.Wangberg.
ReviewersR.G. Barry, J.D.W. Kahl, M. Lange, M. Meier, B.B. Prézelin,F. Roots, D. Schindler, J-S. Selmer, G. Weller.
is insufficient. The increase of UV during the observed ozonedepletion events needs further study, particularly becausethese events often occur in spring-time when snow cover isdecreasing and ecosystems are extremely sensitive.
11.8.6. UV: RecommendationsThe existing UV monitoring efforts in the Arctic need to beexpanded to give more broad geographical coverage; moni-toring is particularly needed in the Russian Arctic. Mergingthe available UV data with satellite information to developmodels for estimating UV throughout the entire Arctic isnecessary for determining a broad UV climatology of theArctic. Both the UV reaching vertical surfaces and thatreaching horizontal surfaces are relevant to the ecosystemsin the Arctic, and more research is needed to determine thecharacter and climatology of ambient UV levels. UV duringepisodes of severe ozone depletion events needs to be under-stood further.
11.8.7. Climate change and UV effects on ecosystems: Conclusions
Despite the general understanding of possible climate changesto the Arctic, little is known about the specific effects of cli-mate change on marine or terrestrial ecosystems or on indi-vidual species. Little is known about widespread effects ofclimate change which have occurred already because of thelack of ecosystem monitoring and the complexity of thefeedback mechanisms in the Arctic. Changes in sea ice,snow, and permafrost extent will determine the availablehabitat for plants and animals in the Arctic. Climate changesare likely to take place faster than Arctic ecosystems arelikely to be able to respond.
The effects of UV radiation on Arctic ecosystems arenot well understood. Many of the assumptions made forthe Arctic are based on UV studies carried out in the Ant-arctic or at mid-latitudes. Those UV effects that have beenobserved appear to be tied to such factors as water stressand other environmental factors that are also influencedby climate change. The springtime changes in ozone con-centrations could expose primary production in the ArcticOcean as well as the terrestrial ecosystems to harmful UVradiation because of the timing and intensity of the changes;changes in primary production would impact higher trophiclevels.
11.8.8. Climate change and UV effects on ecosystems: Recommendations
Climate change effects on ecosystems need to be examinedin terms of an integrated assessment, taking into accountrelevant environmental factors such as acidification, UVand pollutants, as well as the effects of climate change oncompeting species within an ecosystem. The potential forclimate change to alter the Arctic environment demandsimmediate assessment of available baseline information aswell as fundamental research into the effects of change onparticular species as well as ecosystems. UV effects need tobe examined in terms of an integrated assessment, takinginto account relevant environmental factors, such as acidi-fication and water stress, as well as the effects of UV oncompeting species within an ecosystem. Both aquatic andterrestrial ecosystems need to be examined through effortssuch as IASC’s proposal to establish and coordinate focusedcenters of research in the Arctic for the purpose of studyingUV effects.

763Chapter 11 · Climate Change, Ozone, and Ultraviolet Radiation
ReferencesAagaard, K. and E.C. Carmack, 1989. The role of sea ice and other fresh
water in the Arctic circulation. J. Geophys. Res. 94: 11485-11498.Aagaard, K. and E.C. Carmack, 1994. The Arctic ocean and climate: A
perspective in the polar oceans and their role in shaping the global en-vironment. pp 5-20, In: O.M. Johannessen, R.D. Muench and J.E.Overland (eds.). The Nansen Centennial Volume, Geophys. Monogr.Ser. 85, AGU, Washington, D.C.
Aagaard, K., A.T. Roach and J.D. Schumacher, 1985. On the wind-drivenvariability of the flow through Bering Strait. J. Geophys. Res. 90: 7213-7221.
Aagaard, K., L.K. Coachman and E.C. Carmack, 1981. On the haloclineof the Arctic Ocean. Deep-Sea Res. 28: 529-545.
Ackley, S.F., W.D. Hibler III, F.K. Kugzruk, A. Kovacs and W.F. Weeks,1976. Thickness and roughness variations of Arctic multiyear sea ice.CRREL Report 76-18, U.S. Army Cold Regions Research andEngineering Laboratory, Hanover, New Hampshire. 25p.
Agnew, T., 1993. Simultaneous winter sea-ice and atmospheric circulationanomaly patterns. Atmosphere-Ocean 31: 259-280.
Akagawa, S. and M. Fakuda, 1991. Frost heave mechanism in welded tuff.Permafrost and Periglacial Processes 2: 301-309.
Allard, B., H. Born, C. Pettersson and G. Zhang, 1994. Degradation ofhumic substances by UV radiation. Environ. Internat. 20: 97-101.
Allard, R., R. Preller and S Piacsek, 1995. Variations of river influences inthe Arctic basin. Fourth Conference on Polar Meteorology and Oceano-graphy, Dallas, Texas, American Meteorological Society, 193-199.
Alley, R.B., 1995. Resolved: the Arctic controls global climate change. pp.263-283, In: W.O Smith Jr. and J.M. Grebmeier (eds.). Arctic Oceano-graphy: Marginal ice zone and continental shelves. American Geophys-ical Union Coastal and Estuarine Studies 49.
Alley, R.B. and S. Anandakrishnan, 1995. Variations in melt-layer fre-quency in the GISP2 ice core: implications for Holocene summer tem-peratures in central Greenland. Annals of Glaciology 21: 64-70.
Alley, R.B., D.A. Meese, C.A. Shuman, A.J. Gow, K.C. Taylor, P.M. Grootes,J.W.C. White, M. Ram, E.D. Waddington, P.A. Mayewski and G.A.Zielinski, 1993. Abrupt increase in Greenland snow accumulation atthe end of the Younger Dryas event. Nature 362: 527-528.
Alley, R.B., P. Mayewski, D. Peel and B. Stauffer, 1996. Twin ice coresfrom Greenland reveal history of climate change. EOS (American Geo-physical Union) 77(22): 209-210.
Andersen, O.G.N., 1989. Primary production, chlorophyll, light and nutri-ents beneath the Arctic sea ice. pp. 147-191, In: Y. Herman (ed.). TheArctic Seas: Climatology, Oceanography, Geology, and Biology. BanNostrand Reinhold Co., N.Y.
Anderson, B.E., G.L. Gregory, J.D.W. Barricks, J.E. Collins Jr., G.W. Sachse,M.C. Shipham and C.H. Hudgins, 1994. Summertime troposphericozone distributions over central and eastern Canada. J. Geophys. Res.99: 1781-1792.
Anderson, S.P., 1988. The upfreezing process: experiments with a singleclast. Geol. Soc. of Amer. Bull. 100: 609-21.
Andreas, E.L. and B. Murphy, 1986. Bulk transfer coefficients for heat andmomentum over leads and polynyas. J. Phys. Oceanogr. 16(11): 1875-1883.
Andrée, M., H. Oeschger, U. Siegenthaler, T. Riesen, M. Moell, B. Am-mann and K. Toboloski, 1986. 14C dating of plant macrofossils in lakesediments. Radiocarbon 28: 411-416.
Arkhangelov, A.A. and E.V. Novgorodova, 1991. Genesis of massive ice at“Ice Mountain”, Yenesei river, western Siberia, according to results ofgas analyses. Permafrost and Periglacial Processes 2(2): 167-170.
Armstrong, R.L. and M.J. Brodzik, 1995. An earth-gridded SSM/I data setfor cryospheric studies and global change monitoring. Advances inSpace Research 16(10): 155-163.
Astakhov, V. and L. Isayeva, 1988. The “Ice Hill”; an example of retardedglaciation in Siberia. Quaternary Science Reviews 7: 29-40.
Austin, J. and N. Butchart, 1994. The influence of climate change and thetiming of stratospheric warmings on Arctic ozone depletion. J. Geo-phys. Res. 99: 1127-1145.
Austin, J.H., N. Butchart and K.P. Shine, 1992. Possibility of an Arcticozone hole in a doubled-CO2 climate. Nature 360: 221-225.
Bachmeister, A.S., M.C. Shipham, E.V. Browell, W.B. Grant and J.M.Klassen, 1994. Stratospheric/tropospheric exchange affecting the north-ern wetlands regions of Canada during summer 1990. J. Geophys. Res.99: 1793-1804.
Backlund, P., 1992. Degradation of aquatic humic material by UV light.Chemosphere 25: 1869-1878.
Barlow, L.K., J.P. Sadler, A.E.J. Ogilvie, P.C. Buckland, T. Amorosi, J.H.Ingimundarson, P. Skidmore, A.J. Dugmore, T.H. McGovern, 1997.Bad weather, bad luck or bad planning? Interdisciplinary investigationsof the end of the Norse Western Settlement in Greenland. The Holo-cene. In review.
Barnes, P.W., S.D. Flint and M.M. Caldwell, 1987. Photosynthesis damageand protective pigments in plants from a latitudinal arctic/alpine gradi-ent exposed to supplemental ultraviolet-B radiation in the field. ArcticAlpine Res. 19: 21-27.
Barrie, L.A., J.W. Bottenheim and W. Hart, 1994. An overview of PolarSunrise Experiment 1992. J. Geophys. Res. 99D: 25313-25314.
Barrie, L.A., J.W. Bottenheim, R.C. Schnell, P.J. Crutzen and R.A.Rasmussen, 1988. Ozone destruction and photochemical reactions atpolar sunrise in the low arctic atmosphere. Nature 334: 138-141.
Barrie, L.A., R.M. Hoff and S.M. Daggupaty, 1981. The influence of mid-latitudinal pollution sources on haze in the Canadian Arctic. Atmos.Environ. 15(8): 1407-1419.
Barry, P. and W. Pollard, 1992. Ground probing radar investigation ofground ice on the Fosheim Peninsula, Ellesmere Island, N.W.T. Musk-Ox, 39: 59-67.
Barry, R G., M.C. Serreze, J.A. Maslanik, and R.H. Preller, 1993a. TheArctic sea ice climate system: observations and modelling. Rev. Geo-phys. 31: 397-422.
Barry, R.G, J.A. Maslanik, K. Steffen, R.L. Weaver, V. Troisi, D.J. Cava-lieri, and S. Martin, 1993b. Advances in sea ice research based on re-motely sensed passive microwave data. Oceanography 6(1): 5-13.
Barry, R.G., R.L. Armstrong and J.-M. Fallot, 1995. Assessing decadalchanges in the cryosphere: Eurasian snow cover, Proc. Fifth Symposiumof Global Change Studies, Nashville TN, American MeteorologicalSociety, 148-155.
Barry, R.G., 1989. The present climate of the Arctic Ocean and possiblepast and future states. pp. 1-46, In: Y. Herman (ed.). The Arctic Seas:Climatology, Oceanography, Geology, and Biology. Ban NostrandReinhold Co., New York.
Barry, R., 1985. The cryosphere and climatic change. pp. 109-148, In:M.C. MacCracken and F.M. Luther (eds.). Detecting the ClimaticEffects of Increasing Carbon Dioxide. U.S. Dept. Energy, Washington,D.C. DOE/ER-0235.
Barsch, D., M. Gude, R. Mausbacher, G. Schukraft, A. Schulte and D.Strauch, 1993. Slush stream phenomena – Process and impact. Zeit-schrift für Geomorphologie 92: 39-53.
Bartlein, P.J., I.C. Prentice and T. Webb III, 1986. Climate response sur-faces from pollen data for some eastern North Amercan taxa. J. ofBiogeography 13: 35-57.
Bauer, R., A. Engel, H. Franken, E. Klein, G. Kulessa, C. Schiller, U.Schmidt, R. Borchers and J. Lee, 1994. Monitoring the vertical struc-ture of the Arctic polar vortex over northern Scandinavia duringEASOE: Regular N2O profile observations. Geophys. Res. Lett. 21:1211-1214.
Baumgartner, A. and E. Reichel, 1975. The World Water Balance. Meanannual global, continental, and maritime precipitation, evaporationand runnoff. Elsevier, Amsterdam. 179p.
Behrenfeld, M.J., D.R.S. Lean and H. Lee, 1995. Ultraviolet-B radiation ef-fects on inorganic nitrogen uptake by natural assemblages of oceanicplankton. J. Phycol. 31: 25-36.
Behrenfeld, M.J., J.T. Hardy and H. Lee, 1992. Chronic effects of ultravio-let-B radiation on growth and cell volume of Phaeodactylum tricornu-tum (Bacillariophyceae). J. Phycol. 58: 757-760.
Beltrami, H. and D. Chapman, 1994. Drilling for a past. New Scientist142, April 23: 36-40.
Bender, M.L., T. Sowers, M.-L. Dickson, J. Orchardo, P. Grootes, P.A.Mayewski and D.A. Meese, 1994. Climate correlations betweenGreenland and Antarctica during the past 100,000 years. Nature 372:663-666.
Berendse, F. and S. Jonasson, 1992. Nutrient use and nutrient cycling innorthern ecosystems. pp 337-356, In: F.S. Chapin III, R.L. Jefferies, J.F.Reynolds, G.R. Shaver and J. Svoboda (eds.). Arctic ecosystems in achanging climate; an ecophysiological perspective. Academic Press, SanDiego, California.
Bird, R.E. and C. Riordan, 1986. Simple solar spectral model for directand diffuse irradiance on horizontal and tilted planes at the earth’s sur-face for cloudless atmospheres. J. of Climate and Applied Meteorology.25: 97-97.
Birks, H.H., 1991. Holocene vegetational history and climate change inWest Spitsbergen: plant macrofossils from Skadtj_rna, an Arctic lake.The Holocene 1: 209-218.
Bjorn, L.O., T.V. Callaghan, C. Gehrke, D. Gwynn-Jones, B. Holmgren, U.Johanson and M. Sonesson, 1997. Effects of enhanced ultraviolet-B ra-diation on subarctic vegetation. Chapter 11, pp 241-248, In: S. Woodinand M. Marquiss (eds.). Ecology of Arctic Environments, SpecialPublication No. 13 of the British Ecological Society. Blackwell Science,Oxford.
Blake, D.R. and Rowland, F.S., 1988. Continuing worldwide increase intropospheric methane, 1978 to 1987. Science 240: 634-637.
Blanchet, J.P., 1989. Toward estimation of climatic effects due to Arcticaerosols. Atmos. Environ. 23(11): 2609-2625.
Blanchet, J.P., 1991. Potential climate change from Arctic air pollution. In:W.T. Sturges (ed.). Pollution of the Arctic Atmosphere. Elsevier Press,London.
Blanchet, J.P. and E. Girard, 1994. Arctic Greenhouse Effect. Nature 371:383-.
Blanchet, J.P. and E. Girard, 1995. Water vapour-temperature feedback inthe formation of continental Arctic air: Its implication for climate. Sci.Total Environ. 160/161: 793-802
Blumthaler, M., 1993. Solar UV measurements. In: M. Tevini (ed.).Ultraviolet-B Radiation and ozone depletion: Effects on humans, ani-mals, plants, microorganisms and materials. Lewis Pub., Boca Raton,Florida.
Blumthaler, M. and W. Ambach, 1988. Solar ultraviolet-B-albedo of vari-ous surfaces. Photochem. and Photobiol. 48: 85-88.
Bo, S. and O. Hjeljord, 1991. Do continental moose ranges improve dur-ing cloudy summers? Can. J. Zool. 69: 1875-1879.
Bodhaine, B. A. and E. G. Dutton, 1993. A long-term decrease in arctichaze at Barrow, Alaska. Geophys. Res. Lett. 20(10): 947-950.
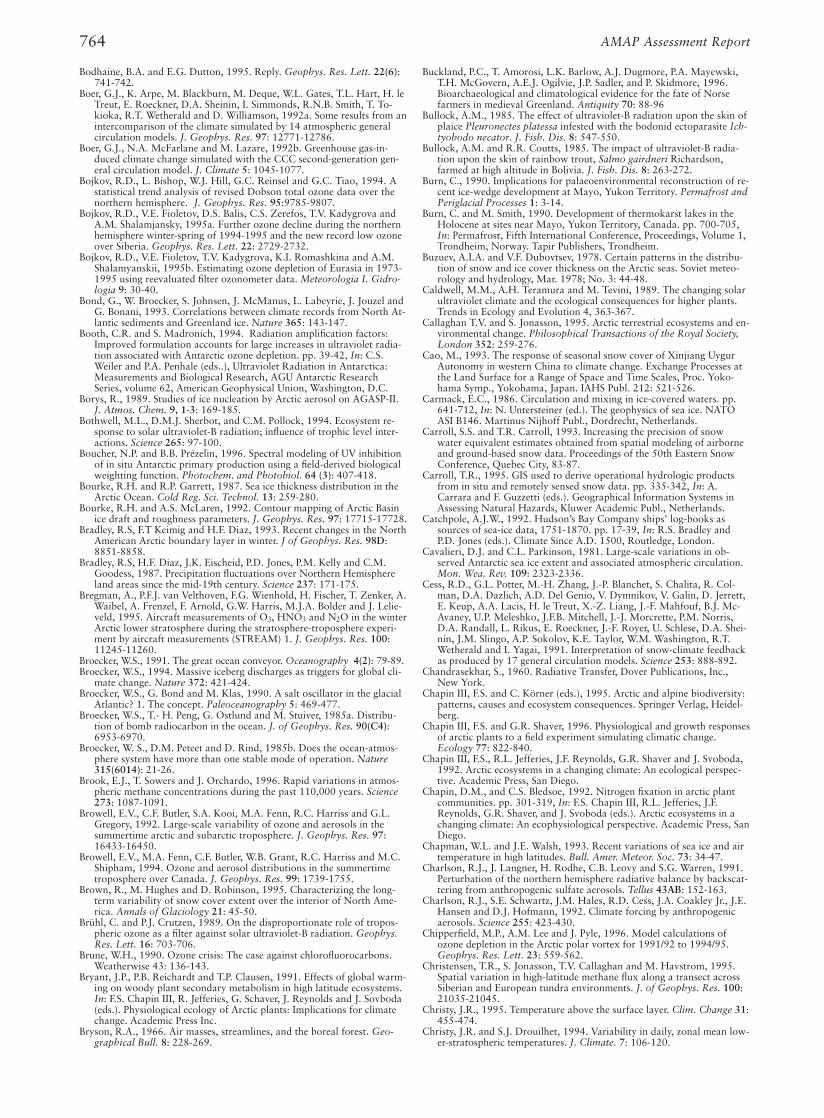
764 AMAP Assessment Report
Buckland, P.C., T. Amorosi, L.K. Barlow, A.J. Dugmore, P.A. Mayewski,T.H. McGovern, A.E.J. Ogilvie, J.P. Sadler, and P. Skidmore, 1996.Bioarchaeological and climatological evidence for the fate of Norsefarmers in medieval Greenland. Antiquity 70: 88-96
Bullock, A.M., 1985. The effect of ultraviolet-B radiation upon the skin ofplaice Pleuronectes platessa infested with the bodonid ectoparasite Ich-tyobodo necator. J. Fish. Dis. 8: 547-550.
Bullock, A.M. and R.R. Coutts, 1985. The impact of ultraviolet-B radia-tion upon the skin of rainbow trout, Salmo gairdneri Richardson,farmed at high altitude in Bolivia. J. Fish. Dis. 8: 263-272.
Burn, C., 1990. Implications for palaeoenvironmental reconstruction of re-cent ice-wedge development at Mayo, Yukon Territory. Permafrost andPeriglacial Processes 1: 3-14.
Burn, C. and M. Smith, 1990. Development of thermokarst lakes in theHolocene at sites near Mayo, Yukon Territory, Canada. pp. 700-705,In: Permafrost, Fifth International Conference, Proceedings, Volume 1,Trondheim, Norway. Tapir Publishers, Trondheim.
Buzuev, A.I.A. and V.F. Dubovtsev, 1978. Certain patterns in the distribu-tion of snow and ice cover thickness on the Arctic seas. Soviet meteo-rology and hydrology, Mar. 1978; No. 3: 44-48.
Caldwell, M.M., A.H. Teramura and M. Tevini, 1989. The changing solarultraviolet climate and the ecological consequences for higher plants.Trends in Ecology and Evolution 4, 363-367.
Callaghan T.V. and S. Jonasson, 1995. Arctic terrestrial ecosystems and en-vironmental change. Philosophical Transactions of the Royal Society,London 352: 259-276.
Cao, M., 1993. The response of seasonal snow cover of Xinjiang UygurAutonomy in western China to climate change. Exchange Processes atthe Land Surface for a Range of Space and Time Scales, Proc. Yoko-hama Symp., Yokohama, Japan. IAHS Publ. 212: 521-526.
Carmack, E.C., 1986. Circulation and mixing in ice-covered waters. pp.641-712, In: N. Untersteiner (ed.). The geophysics of sea ice. NATOASI B146. Martinus Nijhoff Publ., Dordrecht, Netherlands.
Carroll, S.S. and T.R. Carroll, 1993. Increasing the precision of snowwater equivalent estimates obtained from spatial modeling of airborneand ground-based snow data. Proceedings of the 50th Eastern SnowConference, Quebec City, 83-87.
Carroll, T.R., 1995. GIS used to derive operational hydrologic productsfrom in situ and remotely sensed snow data. pp. 335-342, In: A.Carrara and F. Guzzetti (eds.). Geographical Information Systems inAssessing Natural Hazards, Kluwer Academic Publ., Netherlands.
Catchpole, A.J.W., 1992. Hudson’s Bay Company ships’ log-books assources of sea-ice data, 1751-1870. pp. 17-39, In: R.S. Bradley andP.D. Jones (eds.). Climate Since A.D. 1500, Routledge, London.
Cavalieri, D.J. and C.L. Parkinson, 1981. Large-scale variations in ob-served Antarctic sea ice extent and associated atmospheric circulation.Mon. Wea. Rev. 109: 2323-2336.
Cess, R.D., G.L. Potter, M.-H. Zhang, J.-P. Blanchet, S. Chalita, R. Col-man, D.A. Dazlich, A.D. Del Genio, V. Dymnikov, V. Galin, D. Jerrett,E. Keup, A.A. Lacis, H. le Treut, X.-Z. Liang, J.-F. Mahfouf, B.J. Mc-Avaney, U.P. Meleshko, J.F.B. Mitchell, J.-J. Morcrette, P.M. Norris,D.A. Randall, L. Rikus, E. Roeckner, J.-F. Royer, U. Schlese, D.A. Shei-nin, J.M. Slingo, A.P. Sokolov, K.E. Taylor, W.M. Washington, R.T.Wetherald and I. Yagai, 1991. Interpretation of snow-climate feedbackas produced by 17 general circulation models. Science 253: 888-892.
Chandrasekhar, S., 1960. Radiative Transfer, Dover Publications, Inc.,New York.
Chapin III, F.S. and C. Körner (eds.), 1995. Arctic and alpine biodiversity:patterns, causes and ecosystem consequences. Springer Verlag, Heidel-berg.
Chapin III, F.S. and G.R. Shaver, 1996. Physiological and growth responsesof arctic plants to a field experiment simulating climatic change.Ecology 77: 822-840.
Chapin III, F.S., R.L. Jefferies, J.F. Reynolds, G.R. Shaver and J. Svoboda,1992. Arctic ecosystems in a changing climate: An ecological perspec-tive. Academic Press, San Diego.
Chapin, D.M., and C.S. Bledsoe, 1992. Nitrogen fixation in arctic plantcommunities. pp. 301-319, In: F.S. Chapin III, R.L. Jefferies, J.F.Reynolds, G.R. Shaver, and J. Svoboda (eds.). Arctic ecosystems in achanging climate: An ecophysiological perspective. Academic Press, SanDiego.
Chapman, W.L. and J.E. Walsh, 1993. Recent variations of sea ice and airtemperature in high latitudes. Bull. Amer. Meteor. Soc. 73: 34-47.
Charlson, R.J., J. Langner, H. Rodhe, C.B. Leovy and S.G. Warren, 1991.Perturbation of the northern hemisphere radiative balance by backscat-tering from anthropogenic sulfate aerosols. Tellus 43AB: 152-163.
Charlson, R.J., S.E. Schwartz, J.M. Hales, R.D. Cess, J.A. Coakley Jr., J.E.Hansen and D.J. Hofmann, 1992. Climate forcing by anthropogenicaerosols. Science 255: 423-430.
Chipperfield, M.P., A.M. Lee and J. Pyle, 1996. Model calculations ofozone depletion in the Arctic polar vortex for 1991/92 to 1994/95.Geophys. Res. Lett. 23: 559-562.
Christensen, T.R., S. Jonasson, T.V. Callaghan and M. Havstrom, 1995.Spatial variation in high-latitude methane flux along a transect acrossSiberian and European tundra environments. J. of Geophys. Res. 100:21035-21045.
Christy, J.R., 1995. Temperature above the surface layer. Clim. Change 31:455-474.
Christy, J.R. and S.J. Drouilhet, 1994. Variability in daily, zonal mean low-er-stratospheric temperatures. J. Climate. 7: 106-120.
Bodhaine, B.A. and E.G. Dutton, 1995. Reply. Geophys. Res. Lett. 22(6):741-742.
Boer, G.J., K. Arpe, M. Blackburn, M. Deque, W.L. Gates, T.L. Hart, H. leTreut, E. Roeckner, D.A. Sheinin, I. Simmonds, R.N.B. Smith, T. To-kioka, R.T. Wetherald and D. Williamson, 1992a. Some results from anintercomparison of the climate simulated by 14 atmospheric generalcirculation models. J. Geophys. Res. 97: 12771-12786.
Boer, G.J., N.A. McFarlane and M. Lazare, 1992b. Greenhouse gas-in-duced climate change simulated with the CCC second-generation gen-eral circulation model. J. Climate 5: 1045-1077.
Bojkov, R.D., L. Bishop, W.J. Hill, G.C. Reinsel and G.C. Tiao, 1994. Astatistical trend analysis of revised Dobson total ozone data over thenorthern hemisphere. J. Geophys. Res. 95:9785-9807.
Bojkov, R.D., V.E. Fioletov, D.S. Balis, C.S. Zerefos, T.V. Kadygrova andA.M. Shalamjansky, 1995a. Further ozone decline during the northernhemisphere winter-spring of 1994-1995 and the new record low ozoneover Siberia. Geophys. Res. Lett. 22: 2729-2732.
Bojkov, R.D., V.E. Fioletov, T.V. Kadygrova, K.I. Romashkina and A.M.Shalamyanskii, 1995b. Estimating ozone depletion of Eurasia in 1973-1995 using reevaluated filter ozonometer data. Meteorologia I. Gidro-logia 9: 30-40.
Bond, G., W. Broecker, S. Johnsen, J. McManus, L. Labeyrie, J. Jouzel andG. Bonani, 1993. Correlations between climate records from North At-lantic sediments and Greenland ice. Nature 365: 143-147.
Booth, C.R. and S. Madronich, 1994. Radiation amplification factors:Improved formulation accounts for large increases in ultraviolet radia-tion associated with Antarctic ozone depletion. pp. 39-42, In: C.S.Weiler and P.A. Penhale (eds..), Ultraviolet Radiation in Antarctica:Measurements and Biological Research, AGU Antarctic ResearchSeries, volume 62, American Geophysical Union, Washington, D.C.
Borys, R., 1989. Studies of ice nucleation by Arctic aerosol on AGASP-II.J. Atmos. Chem. 9, 1-3: 169-185.
Bothwell, M.L., D.M.J. Sherbot, and C.M. Pollock, 1994. Ecosystem re-sponse to solar ultraviolet-B radiation; influence of trophic level inter-actions. Science 265: 97-100.
Boucher, N.P. and B.B. Prézelin, 1996. Spectral modeling of UV inhibitionof in situ Antarctic primary production using a field-derived biologicalweighting function. Photochem. and Photobiol. 64 (3): 407-418.
Bourke, R.H. and R.P. Garrett, 1987. Sea ice thickness distribution in theArctic Ocean. Cold Reg. Sci. Technol. 13: 259-280.
Bourke, R.H. and A.S. McLaren, 1992. Contour mapping of Arctic Basinice draft and roughness parameters. J. Geophys. Res. 97: 17715-17728.
Bradley, R.S, F.T Keimig and H.F. Diaz, 1993. Recent changes in the NorthAmerican Arctic boundary layer in winter. J of Geophys. Res. 98D:8851-8858.
Bradley, R.S, H.F. Diaz, J.K. Eischeid, P.D. Jones, P.M. Kelly and C.M.Goodess, 1987. Precipitation fluctuations over Northern Hemisphereland areas since the mid-19th century. Science 237: 171-175.
Bregman, A., P.F.J. van Velthoven, F.G. Wienhold, H. Fischer, T. Zenker, A.Waibel, A. Frenzel, F. Arnold, G.W. Harris, M.J.A. Bolder and J. Lelie-veld, 1995. Aircraft measurements of O3, HNO3 and N2O in the winterArctic lower stratosphere during the stratosphere-troposphere experi-ment by aircraft measurements (STREAM) 1. J. Geophys. Res. 100:11245-11260.
Broecker, W.S., 1991. The great ocean conveyor. Oceanography 4(2): 79-89.Broecker, W.S., 1994. Massive iceberg discharges as triggers for global cli-
mate change. Nature 372: 421-424.Broecker, W.S., G. Bond and M. Klas, 1990. A salt oscillator in the glacial
Atlantic? 1. The concept. Paleoceanography 5: 469-477.Broecker, W.S., T.- H. Peng, G. Ostlund and M. Stuiver, 1985a. Distribu-
tion of bomb radiocarbon in the ocean. J. of Geophys. Res. 90(C4):6953-6970.
Broecker, W. S., D.M. Peteet and D. Rind, 1985b. Does the ocean-atmos-phere system have more than one stable mode of operation. Nature315(6014): 21-26.
Brook, E.J., T. Sowers and J. Orchardo, 1996. Rapid variations in atmos-pheric methane concentrations during the past 110,000 years. Science273: 1087-1091.
Browell, E.V., C.F. Butler, S.A. Kooi, M.A. Fenn, R.C. Harriss and G.L.Gregory, 1992. Large-scale variability of ozone and aerosols in thesummertime arctic and subarctic troposphere. J. Geophys. Res. 97:16433-16450.
Browell, E.V., M.A. Fenn, C.F. Butler, W.B. Grant, R.C. Harriss and M.C.Shipham, 1994. Ozone and aerosol distributions in the summertimetroposphere over Canada. J. Geophys. Res. 99: 1739-1755.
Brown, R., M. Hughes and D. Robinson, 1995. Characterizing the long-term variability of snow cover extent over the interior of North Ame-rica. Annals of Glaciology 21: 45-50.
Brühl, C. and P.J. Crutzen, 1989. On the disproportionate role of tropos-pheric ozone as a filter against solar ultraviolet-B radiation. Geophys.Res. Lett. 16: 703-706.
Brune, W.H., 1990. Ozone crisis: The case against chlorofluorocarbons.Weatherwise 43: 136-143.
Bryant, J.P., P.B. Reichardt and T.P. Clausen, 1991. Effects of global warm-ing on woody plant secondary metabolism in high latitude ecosystems.In: F.S. Chapin III, R. Jefferies, G. Schaver, J. Reynolds and J. Sovboda(eds.). Physiological ecology of Arctic plants: Implications for climatechange. Academic Press Inc.
Bryson, R.A., 1966. Air masses, streamlines, and the boreal forest. Geo-graphical Bull. 8: 228-269.
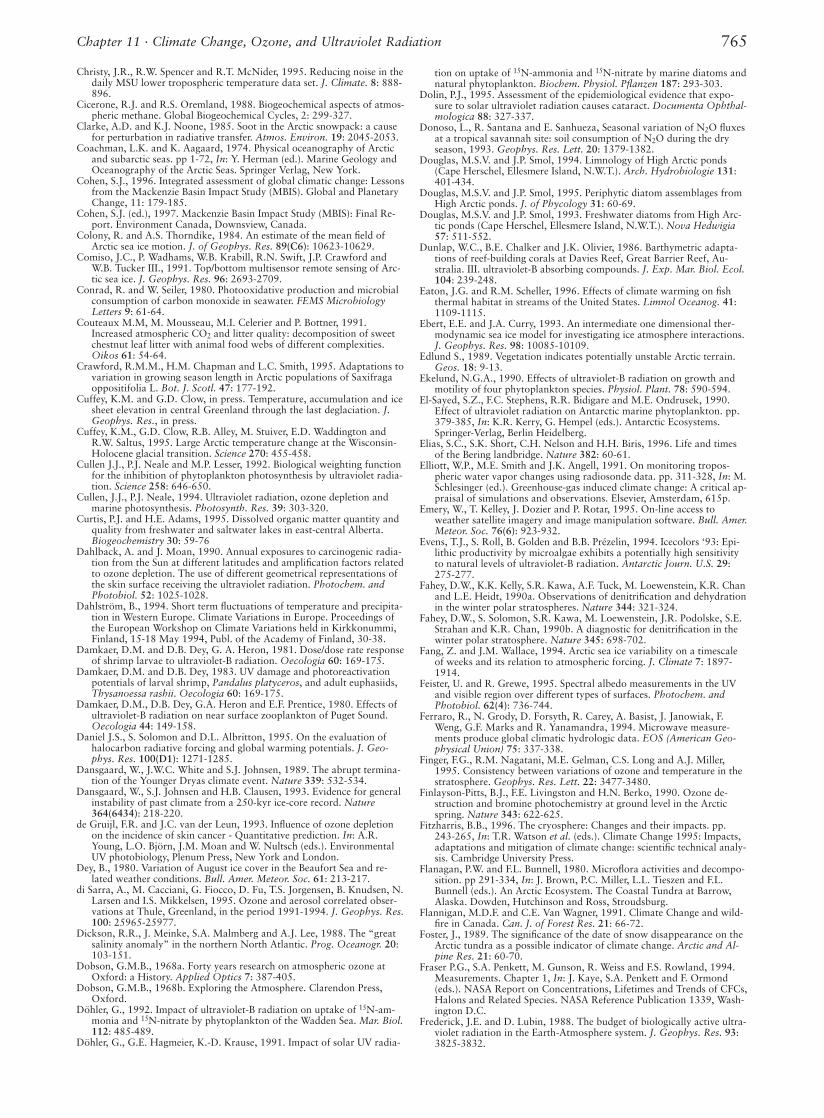
765Chapter 11 · Climate Change, Ozone, and Ultraviolet Radiation
Christy, J.R., R.W. Spencer and R.T. McNider, 1995. Reducing noise in thedaily MSU lower tropospheric temperature data set. J. Climate. 8: 888-896.
Cicerone, R.J. and R.S. Oremland, 1988. Biogeochemical aspects of atmos-pheric methane. Global Biogeochemical Cycles, 2: 299-327.
Clarke, A.D. and K.J. Noone, 1985. Soot in the Arctic snowpack: a causefor perturbation in radiative transfer. Atmos. Environ. 19: 2045-2053.
Coachman, L.K. and K. Aagaard, 1974. Physical oceanography of Arcticand subarctic seas. pp 1-72, In: Y. Herman (ed.). Marine Geology andOceanography of the Arctic Seas. Springer Verlag, New York.
Cohen, S.J., 1996. Integrated assessment of global climatic change: Lessonsfrom the Mackenzie Basin Impact Study (MBIS). Global and PlanetaryChange, 11: 179-185.
Cohen, S.J. (ed.), 1997. Mackenzie Basin Impact Study (MBIS): Final Re-port. Environment Canada, Downsview, Canada.
Colony, R. and A.S. Thorndike, 1984. An estimate of the mean field ofArctic sea ice motion. J. of Geophys. Res. 89(C6): 10623-10629.
Comiso, J.C., P. Wadhams, W.B. Krabill, R.N. Swift, J.P. Crawford andW.B. Tucker III., 1991. Top/bottom multisensor remote sensing of Arc-tic sea ice. J. Geophys. Res. 96: 2693-2709.
Conrad, R. and W. Seiler, 1980. Photooxidative production and microbialconsumption of carbon monoxide in seawater. FEMS MicrobiologyLetters 9: 61-64.
Couteaux M.M, M. Mousseau, M.I. Celerier and P. Bottner, 1991.Increased atmospheric CO2 and litter quality: decomposition of sweetchestnut leaf litter with animal food webs of different complexities.Oikos 61: 54-64.
Crawford, R.M.M., H.M. Chapman and L.C. Smith, 1995. Adaptations tovariation in growing season length in Arctic populations of Saxifragaoppositifolia L. Bot. J. Scotl. 47: 177-192.
Cuffey, K.M. and G.D. Clow, in press. Temperature, accumulation and icesheet elevation in central Greenland through the last deglaciation. J.Geophys. Res., in press.
Cuffey, K.M., G.D. Clow, R.B. Alley, M. Stuiver, E.D. Waddington andR.W. Saltus, 1995. Large Arctic temperature change at the Wisconsin-Holocene glacial transition. Science 270: 455-458.
Cullen J.J., P.J. Neale and M.P. Lesser, 1992. Biological weighting functionfor the inhibition of phytoplankton photosynthesis by ultraviolet radia-tion. Science 258: 646-650.
Cullen, J.J., P.J. Neale, 1994. Ultraviolet radiation, ozone depletion andmarine photosynthesis. Photosynth. Res. 39: 303-320.
Curtis, P.J. and H.E. Adams, 1995. Dissolved organic matter quantity andquality from freshwater and saltwater lakes in east-central Alberta.Biogeochemistry 30: 59-76
Dahlback, A. and J. Moan, 1990. Annual exposures to carcinogenic radia-tion from the Sun at different latitudes and amplification factors relatedto ozone depletion. The use of different geometrical representations ofthe skin surface receiving the ultraviolet radiation. Photochem. andPhotobiol. 52: 1025-1028.
Dahlström, B., 1994. Short term fluctuations of temperature and precipita-tion in Western Europe. Climate Variations in Europe. Proceedings ofthe European Workshop on Climate Variations held in Kirkkonummi,Finland, 15-18 May 1994, Publ. of the Academy of Finland, 30-38.
Damkaer, D.M. and D.B. Dey, G. A. Heron, 1981. Dose/dose rate responseof shrimp larvae to ultraviolet-B radiation. Oecologia 60: 169-175.
Damkaer, D.M. and D.B. Dey, 1983. UV damage and photoreactivationpotentials of larval shrimp, Pandalus platyceros, and adult euphasiids,Thysanoessa rashii. Oecologia 60: 169-175.
Damkaer, D.M., D.B. Dey, G.A. Heron and E.F. Prentice, 1980. Effects ofultraviolet-B radiation on near surface zooplankton of Puget Sound.Oecologia 44: 149-158.
Daniel J.S., S. Solomon and D.L. Albritton, 1995. On the evaluation ofhalocarbon radiative forcing and global warming potentials. J. Geo-phys. Res. 100(D1): 1271-1285.
Dansgaard, W., J.W.C. White and S.J. Johnsen, 1989. The abrupt termina-tion of the Younger Dryas climate event. Nature 339: 532-534.
Dansgaard, W., S.J. Johnsen and H.B. Clausen, 1993. Evidence for generalinstability of past climate from a 250-kyr ice-core record. Nature364(6434): 218-220.
de Gruijl, F.R. and J.C. van der Leun, 1993. Influence of ozone depletionon the incidence of skin cancer - Quantitative prediction. In: A.R.Young, L.O. Björn, J.M. Moan and W. Nultsch (eds.). EnvironmentalUV photobiology, Plenum Press, New York and London.
Dey, B., 1980. Variation of August ice cover in the Beaufort Sea and re-lated weather conditions. Bull. Amer. Meteor. Soc. 61: 213-217.
di Sarra, A., M. Cacciani, G. Fiocco, D. Fu, T.S. Jorgensen, B. Knudsen, N.Larsen and I.S. Mikkelsen, 1995. Ozone and aerosol correlated obser-vations at Thule, Greenland, in the period 1991-1994. J. Geophys. Res.100: 25965-25977.
Dickson, R.R., J. Meinke, S.A. Malmberg and A.J. Lee, 1988. The “greatsalinity anomaly” in the northern North Atlantic. Prog. Oceanogr. 20:103-151.
Dobson, G.M.B., 1968a. Forty years research on atmospheric ozone atOxford: a History. Applied Optics 7: 387-405.
Dobson, G.M.B., 1968b. Exploring the Atmosphere. Clarendon Press,Oxford.
Döhler, G., 1992. Impact of ultraviolet-B radiation on uptake of 15N-am-monia and 15N-nitrate by phytoplankton of the Wadden Sea. Mar. Biol.112: 485-489.
Döhler, G., G.E. Hagmeier, K.-D. Krause, 1991. Impact of solar UV radia-
tion on uptake of 15N-ammonia and 15N-nitrate by marine diatoms andnatural phytoplankton. Biochem. Physiol. Pflanzen 187: 293-303.
Dolin, P.J., 1995. Assessment of the epidemiological evidence that expo-sure to solar ultraviolet radiation causes cataract. Documenta Ophthal-mologica 88: 327-337.
Donoso, L., R. Santana and E. Sanhueza, Seasonal variation of N2O fluxesat a tropical savannah site: soil consumption of N2O during the dryseason, 1993. Geophys. Res. Lett. 20: 1379-1382.
Douglas, M.S.V. and J.P. Smol, 1994. Limnology of High Arctic ponds(Cape Herschel, Ellesmere Island, N.W.T.). Arch. Hydrobiologie 131:401-434.
Douglas, M.S.V. and J.P. Smol, 1995. Periphytic diatom assemblages fromHigh Arctic ponds. J. of Phycology 31: 60-69.
Douglas, M.S.V. and J.P. Smol, 1993. Freshwater diatoms from High Arc-tic ponds (Cape Herschel, Ellesmere Island, N.W.T.). Nova Hedwigia57: 511-552.
Dunlap, W.C., B.E. Chalker and J.K. Olivier, 1986. Barthymetric adapta-tions of reef-building corals at Davies Reef, Great Barrier Reef, Au-stralia. III. ultraviolet-B absorbing compounds. J. Exp. Mar. Biol. Ecol.104: 239-248.
Eaton, J.G. and R.M. Scheller, 1996. Effects of climate warming on fishthermal habitat in streams of the United States. Limnol Oceanog. 41:1109-1115.
Ebert, E.E. and J.A. Curry, 1993. An intermediate one dimensional ther-modynamic sea ice model for investigating ice atmosphere interactions.J. Geophys. Res. 98: 10085-10109.
Edlund S., 1989. Vegetation indicates potentially unstable Arctic terrain.Geos. 18: 9-13.
Ekelund, N.G.A., 1990. Effects of ultraviolet-B radiation on growth andmotility of four phytoplankton species. Physiol. Plant. 78: 590-594.
El-Sayed, S.Z., F.C. Stephens, R.R. Bidigare and M.E. Ondrusek, 1990.Effect of ultraviolet radiation on Antarctic marine phytoplankton. pp.379-385, In: K.R. Kerry, G. Hempel (eds.). Antarctic Ecosystems.Springer-Verlag, Berlin Heidelberg.
Elias, S.C., S.K. Short, C.H. Nelson and H.H. Biris, 1996. Life and timesof the Bering landbridge. Nature 382: 60-61.
Elliott, W.P., M.E. Smith and J.K. Angell, 1991. On monitoring tropos-pheric water vapor changes using radiosonde data. pp. 311-328, In: M.Schlesinger (ed.). Greenhouse-gas induced climate change: A critical ap-praisal of simulations and observations. Elsevier, Amsterdam, 615p.
Emery, W., T. Kelley, J. Dozier and P. Rotar, 1995. On-line access toweather satellite imagery and image manipulation software. Bull. Amer.Meteor. Soc. 76(6): 923-932.
Evens, T.J., S. Roll, B. Golden and B.B. Prézelin, 1994. Icecolors ‘93: Epi-lithic productivity by microalgae exhibits a potentially high sensitivityto natural levels of ultraviolet-B radiation. Antarctic Journ. U.S. 29:275-277.
Fahey, D.W., K.K. Kelly, S.R. Kawa, A.F. Tuck, M. Loewenstein, K.R. Chanand L.E. Heidt, 1990a. Observations of denitrification and dehydrationin the winter polar stratospheres. Nature 344: 321-324.
Fahey, D.W., S. Solomon, S.R. Kawa, M. Loewenstein, J.R. Podolske, S.E.Strahan and K.R. Chan, 1990b. A diagnostic for denitrification in thewinter polar stratosphere. Nature 345: 698-702.
Fang, Z. and J.M. Wallace, 1994. Arctic sea ice variability on a timescaleof weeks and its relation to atmospheric forcing. J. Climate 7: 1897-1914.
Feister, U. and R. Grewe, 1995. Spectral albedo measurements in the UVand visible region over different types of surfaces. Photochem. andPhotobiol. 62(4): 736-744.
Ferraro, R., N. Grody, D. Forsyth, R. Carey, A. Basist, J. Janowiak, F.Weng, G.F. Marks and R. Yanamandra, 1994. Microwave measure-ments produce global climatic hydrologic data. EOS (American Geo-physical Union) 75: 337-338.
Finger, F.G., R.M. Nagatani, M.E. Gelman, C.S. Long and A.J. Miller,1995. Consistency between variations of ozone and temperature in thestratosphere. Geophys. Res. Lett. 22: 3477-3480.
Finlayson-Pitts, B.J., F.E. Livingston and H.N. Berko, 1990. Ozone de-struction and bromine photochemistry at ground level in the Arcticspring. Nature 343: 622-625.
Fitzharris, B.B., 1996. The cryosphere: Changes and their impacts. pp.243-265, In: T.R. Watson et al. (eds.). Climate Change 1995: Impacts,adaptations and mitigation of climate change: scientific technical analy-sis. Cambridge University Press.
Flanagan, P.W. and F.L. Bunnell, 1980. Microflora activities and decompo-sition. pp 291-334, In: J. Brown, P.C. Miller, L.L. Tieszen and F.L.Bunnell (eds.). An Arctic Ecosystem. The Coastal Tundra at Barrow,Alaska. Dowden, Hutchinson and Ross, Stroudsburg.
Flannigan, M.D.F. and C.E. Van Wagner, 1991. Climate Change and wild-fire in Canada. Can. J. of Forest Res. 21: 66-72.
Foster, J., 1989. The significance of the date of snow disappearance on theArctic tundra as a possible indicator of climate change. Arctic and Al-pine Res. 21: 60-70.
Fraser P.G., S.A. Penkett, M. Gunson, R. Weiss and F.S. Rowland, 1994.Measurements. Chapter 1, In: J. Kaye, S.A. Penkett and F. Ormond(eds.). NASA Report on Concentrations, Lifetimes and Trends of CFCs,Halons and Related Species. NASA Reference Publication 1339, Wash-ington D.C.
Frederick, J.E. and D. Lubin, 1988. The budget of biologically active ultra-violet radiation in the Earth-Atmosphere system. J. Geophys. Res. 93:3825-3832.

766 AMAP Assessment Report
genated organic compounds released to seawater from temperate ma-rine macroalgae. Science 227: 1033-1035.
Häder, D.-P., 1993. Effects of enhanced solar ultraviolet radiation onaquatic ecosystems. pp. 152-192, In: M. Tevini (ed.). Ultraviolet-BRadiation and Ozone Depletion. Effects on Humans, Animals, Plants,Microorganisms and Materials. Lewis, Boca Raton, Florida.
Häder, D.-P., R.C. Worrest, H.D. Kumar, R.C. Smith, 1995. Effects of in-creased solar ultraviolet radiation on aquatic ecosystems. Ambio 24:174-180.
Hairston Jr., N.G., 1976. Photoprotection by carotenoid pigments in thecopepod Diatomus nevadensis. Proc. Natl. Acad. Sci. USA 73: 971-974.
Hairston Jr., N.G., 1980. The vertical distribution of diaptomid copepodsin relation to body pigmentation. pp. 98-110, In: W.C. Keerfoot (ed.).Ecology and Evolution of Zooplankton Communities. University ofNew England Press, Hanover, New Hampshire.
Hakkinen, S., 1990. Models and their applications to polar oceanography.Polar Oceanography, Part A: Physical Science. Academic Press. pp.335-385.
Hakkinen, S., 1993. An Arctic source for the Great Salinity Anomaly: Asimulation of the Arctic ice/ocean system for 1955-1975. J. Geophys.Res. 98: 16397-16410.
Hall, D.K., 1988. Assessment of polar climate change using satellite tech-nology. Reviews of Geophysics, 26(1): 26-39.
Hall, N.M.J., B.J. Hoskins, P.J. Valdes and C.A. Senior, 1994. Storm tracksin a high-resolution GCM with doubled carbon dioxide. Quart. J. Roy.Met. Soc. 120: 1209-1230.
Hallet, B., 1990. Self-organization in freezing soils: from microscopic icelenses to patterned ground. Can. J. of Phys. 26: 842-52.
Hallet, B. and E. Waddington, 1992. Buoyancy forces induced by freeze-thaw in the active layer: implications for diapirism and soil circulation.pp. 251-279, In: J.C. Dixon and A.D. Abrahams (eds.). Periglacial geo-morphology. J. Wiley and Sons Ltd.
Hammer, U.T., 1986. Saline lake ecosystems of the World. Dr. W. JunkPublishers, Boston. 616p.
Hanssen-Bauer, I. and E.J. Førland, 1994. Homogenizing long Norwegianprecipitation series. J. Climate 6(7): 1001-1011.
Harrison, W.G. and G. F. Cota, 1991. Primary production in polar waters:relation to nutrient availability. Polar Res. 10: 87-104.
Harry, D.G. and K. MacInnes, 1988. The effect of forest fires on perma-frost terrain stability, Little Chicago-Travaillant Lake area, MackenzieValley, NWT. pp. 91-94, In: Current Research Part D, GeologicalSurvey of Canada Paper 88(1D).
Harry, D.G., H.M. French and W.H. Pollard, 1988. Massive ground iceand ice-cored terrain near Sabine Point, Yukon Coastal Plain. Can. J. ofEarth Sciences 25: 1846-1856.
Hatcher, P.E. and N.D. Paul, 1994. The effects of elevated UV-B radiationon herbivory of pea by Autographagamma. Entomol. Exp. Appl. 71:227-233.
Haugen, R.K., S.I. Outcalt and J.C. Harle, 1982. Relationships between es-timated mean annual air and permafrost temperatures in northern cen-tral Alaska. pp. 462-467, In: Permafrost-Fourth International Con-ference Proceedings, vol. 1, Washington, D.C., National Academy ofScience.
Havas, M. and T.C. Hutchinson, 1983. Effect of low pH on the chemicalcomposition of aquatic invertebrates from tundra ponds at the Smo-king Hills, N.W.T., Canada, Can. J. Zool. 61: 241-249.
Havström, M., T.V. Callaghan, J. Svoboda and S. Jonasson, 1995. Littleice age temperature estimated by growth and flowering differences be-tween subfossil and extant shoots of Cassiope tetragona, an Arcticheather. Functional Ecology 9: 650-654.
Hay, J. and J.C. Davies, 1978. Calculation of the solar radiation incidenton an inclined surface. In: J.E. Hat and T.K. Won (eds.). Proc. FirstCanadian Solar Radiation Data Workshop, Toronto, Ontario, Canada.
Hebert, P.D.N. and C.J. Emery, 1990. The adaptive significance of cuticu-lar pigmentation in Daphnia. Functional Ecology 4: 703-710.
Heginbottom, J.A., E.S. Brown, and O. J. Ferrians Jr., 1993. Circumarcticmap of permafrost and ground ice conditions. pp. 1132-1136, In: SixthInternational Conference on Permafrost (Beijing, China, 5-9 July1993), Proceedings, V. 2. South China University of Technology Press,Wushan, China.
Helbling, E.W., E.R. Marguet, V.E. Villafale and O. Holm-Hansen, 1995.Bacterioplankton viability in Antarctic waters as affected by solar ultra-violet radiation. Mar. Ecol. Prog. Ser. 126: 293-298.
Helbling, E.W., H.C. Eilersen, V.E. Villafale and O. Holm-Hansen, 1996.Effects of UV radiation on post-bloom phytoplankton populations inKvalsund, North Norway. J. Photochem. Photobiol. B: Biology 99(33):255-259.
Helbling, E.W., V. Villafale, M. Ferrario and O. Holm-Hansen, 1992.Impact of natural ultraviolet radiation on rates of photosynthesis andon specific marine phytoplankton species. Mar. Ecol. Prog. Ser. 80: 89-100.
Henriksen, K., K. Stamnes and P. Ostensen, 1989. Measurements of solarUV, visible and near IR irradiance at 78 N. Atmos. Environ. 23: 1573-1579.
Herbert, P.D.N., C.J. Emery, 1990. The adaptive significance of cuticularpigmentation in Daphnia. Functional Ecology. 4: 703-710.
Herman, G. and R. Goody, 1976. Formation and persistence of Arcticstratus clouds. J. Atmos. Sci. 33: 1537-1553.
Herman, J.R. and D. Larko, 1994. Low ozone amounts during 1992-1993
Frederick, J.E. and H.E. Snell, 1990. Tropospheric influence on solar ultra-violet radiation: The role of clouds. J. Clim. 3: 373-381.
Frederick, J.E., H.E. Snell and E.K. Haywood, 1989. Solar ultraviolet radi-ation at the earth’s surface. Photochem. and Photobiol. 50: 443-450.
Freeman, M., 1984. Arctic ecosystems. In: D. Dumas (ed.). Vol. 5: Arctic.In: W. Sturtevant (ed.). Handbook of North American Indians. Smith-sonian Institution, Washington, D.C.
French, H.M., L. Bennet and D.W. Hayley, 1986. Ground ice conditions atRae Point and Sabine Peninsula, Eastern Melville Is. Can. J. of EarthSciences 22: 1389-1400.
Frimmel, F.H., 1994. Photochemical aspects related to humic substances.Environ. Internat. 20: 373-385.
Froidevaux, L., J.W. Waters, W.G. Read, L.S. Elson, D.A. Flower and R.F.Jarnot, 1994. Global ozone observations from the UARS MLS: Anoverview of zonal-mean results. J. Atmos. Sci. 51: 2846-2866.
Gaffen, D.J., 1994. Temporal inhomogeneities in radiosonde temperaturerecords. J of Geophys. Res. 99: 3667-3676.
Gajewski, K., M. Garneau and J.C. Bourgeois, 1995. Paleoenvironments ofthe Canadian High Arctic derived from pollen and plant macrofossils:problems and potentials. Quaternary Science Reviews 14: 609-629.
Gardiner, B.G. and P.J. Kirsch, 1995. Setting standards for European ultra-violet spectroradiometers. EUR 16153. Air pollution research report53. European Commission, Luxembourg.
Gawarkiewicz, G. and D.C. Chapman, 1995. A numerical study of densewater formation and transport on a shallow, sloping continental shelf.J. Geophys. Res. 100: 4489-4507.
Gehrke, C., U. Johanson, D. Gwynn-Jones, L.O. Björn, T.V. Callaghan andJ.A. Lee, 1996. Effects of enhanced ultraviolet-B radiation on terrestrialsubarctic ecosystems and implications for interactions with increasedatmospheric CO2. Ecol. Bull. 45: 192-203.
Gehrke, C., U. Johanson, T.V. Callaghan, D. Chadwick and C.H. Robin-son, 1995. The impact of enhanced ultraviolet-B radiation on litterquality and decomposition processes in Vaccinium leaves from the sub-arctic. Oikos 72: 213-222.
Gloersen, P. and W.J. Campbell, 1991. Recent variations in Arctic andAntarctic sea ice covers. Nature 352: 33-36.
Gloersen, P., W.J. Campbell, D.J. Cavalieri, J.C. Comiso, C.L. Parkinsonand H.J. Zwally, 1992. Arctic and Antarctic Sea Ice, 1978-1987:Satellite Passive Microwave Observations and Analysis. NASA SP511.National Aeronautics and Space Administration, Washington, D.C.
Goes, J.I., N. Handa, S. Taguchi and T. Hama, 1994. Effect of ultraviolet-B radiation on the fatty acid composition of the marine phytoplankterTetraselmis sp.: Relationship to cellular pigments. Mar. Ecol. Prog. Ser.114: 259-274.
Goes, J.I., N. Handa, S. Taguchi and T. Hama, 1995. Changes in the pat-terns of biosynthesis and composition of amino acids in a marine phy-toplankter exposed to ultraviolet-B radiation: nitrogen limitation impli-cated. Photochem. and Photobiol. 62: 703-710.
Goldman, J.C., M.R. Dennett, 1991. Ammonium regeneration and carbonutilization by marine bacteria grown on mixed substrates. Mar. Biol.109: 369-378.
Gorshkov, S.G. (ed.), 1983. World Ocean Atlas, Vol. 3, Arctic Ocean. Per-gamon Press, Oxford. 184p.
Goryarchin, S.V., R.I. Zlotin and G.M. Tertitsky (eds.), 1994. Russian-Swedish expedition Tundra Ecology-94: Diversity of natural ecosystemsin the Russian Arctic, a guidebook. University of Lund, Sweden, 106p.
Gregory, J.M., 1993. Sea level changes under increasing atmospheric CO2in a transient coupled ocean-atmosphere GCM experiment. J. Climate6: 2247-2262.
Grenfell, T.C. and G.A. Maykut, 1977. The optical properties of ice andsnow in the Arctic Basin. J. of Glaciology 18: 445-463.
Grenfell, T.C. and D.K. Perovich, 1984. Spectral albedos of sea ice and in-cident solar irradiance in the southern Beaufort Sea. J. of Geophys.Res. 89: 7447-7450.
Grenfell, T.C. and S.G. Warren, 1994. Reflection of solar radiation by theAntarctic snow surface at ultraviolet, visible and near-infrared wave-lengths. J. Geophys. Res. 99: 18669-18684.
Grobe, C.W. and T.M. Murphy, 1994. Inhibition of growth of Ulva ex-pansa (Chlorophyta) by ultraviolet-B radiation. J. Phycol. 30: 783-790.
Grody, N.C. and A.N. Basist, 1996. Global identification of snowcoverusing SSM/I measurements. IEEE Transactions on Geoscience and Re-mote Sensing, 34: 237-249.
Groisman P.Ya., 1991. Data on present-day precipitation changes in theextratropical part of the Northern hemisphere. pp. 297-310, In: M.E.Schlesinger (ed.). Greenhouse-Gas- Induced Climatic Change: A Criti-cal Appraisal of Simulations and Observations. Elsevier, Amsterdam.615p.
Groisman, P.Y. and D.R. Easterling, 1994. Variability and trends of precip-itation and snowfall over the United States and Canada. J. Climate 7:184-205.
Groisman, P.Y. and T. R. Karl and R.W. Knight, 1994a. Observed impactof snow cover on the rise of continental spring temperatures. Science263: 198-200.
Groisman, P.Y. and T.R. Karl, R.W. Knight and G. Stenchikov, 1994b.Changes of snow cover, temperature and the radiative heat balanceover the Northern Hemisphere. J. Climate 7: 1633-1656.
Grootes, P.M., M. Stuiver, J.W.C. White, S. Johnsen and J. Jouzel, 1993.Comparison of oxygen isotope records from the GISP2 and GRIPGreenland ice cores. Nature 366: 552-554.
Gschwend, P.M., J.K. MacFarlane and K.A. Newman, 1985. Volatile halo-

767Chapter 11 · Climate Change, Ozone, and Ultraviolet Radiation
from Nimbus 7 and Meteor 3 total ozone mapping spectrometers. J.Geophys. Res. 99: 3483-3496.
Herndl, G.J., G. Müller-Niklas, J. Frick, 1993. Major role of ultraviolet-Bin controlling bacterioplankton growth in the surface layer of theocean. Nature 361: 717-718.
Hessen, D.O., 1993. DNA-damage and pigmentation in alpine and Arcticzooplankton as bioindicators of UV-radiation. Verh. Internat. Verein.Limnol. 25: 482-486.
Hessen, D.O., 1994. Daphnia responses to UV-light. Arch. Hydrobiol.Beih. Ergebn. Limnol. 43: 185-195.
Hessen, D.O., 1996. Competitive trade-off strategies in Arctic Daphnialinked to melanism and ultraviolet-B stress. Polar Biology 16: 573-579.
Hessen, D.O., T. Andersen and A. Lyche, 1990. Carbon metabolism in ahumic lake: pool sizes and cycling through zooplankton. Limnol.Oceanogr. 35: 84-99.
Hessen, D.O., E. Van Donk and T. Andersen, 1995. Growth responses, P-uptake and loss of flagellae in Chlamydomonas reinhardtii exposed toultraviolet-B. J. Plankton Res. 17: 17-27.
Hisdal, V., 1986. Spectral distribution of global and diffuse solar radiationin Ny-Alesund, Spitsbergen. Polar Res. 5: 1-27.
Hobbie, J.E. (ed.), 1980. Limnology of tundra ponds. Dowden, Hutchin-son and Ross, Inc., Stroudsburg, Pa.. 514p.
Højerslev, N.K. and E. Aas, 1991. A relationship for the penetration ofultraviolet-B radiation in the Norwegian Sea. J. Geophys. Res. 96:17003-17005.
Holm-Hansen, O., D. Lubin and E.W. Helbling, 1993a. UV radiation andits effects on organisms in aquatic environments. pp. 379-425, In: A.R.Young, L.O. Björn, J. Moan and W. Nultsch (eds.). Environmental UVPhotobiology. Plenum Press, New York.
Holm-Hansen, O., E.W. Helbing and D. Lubin, 1993b. Ultraviolet radia-tion in Antarctica: inhibition of primary production. Photochem. andPhotobiol. 58: 567-570.
Hood, L.L. and J.P. McCormack, 1992. Components of interannual ozonechange based on Nimbus 7 TOMS data. Geophys. Res. Lett. 19: 2309-2312.
Hood, L.L. and Da.A. Zaff, 1995. Lower stratospheric stationary wavesand the longitude dependence of ozone trends in winter. J. Geophys.Res. 100: 25791-25800.
Horner R.A., 1985. Ecology of sea ice microalgae. pp. 83-103, In: R.A.Horne (ed.). Sea Ice Biota. CRC Press, Boca Raton, Florida.
Hughen, K.A., J.T. Overpeck, R.F. Anderson and K.M. Williams, 1996.The potential for paleoclimate records from varved Arctic lake sedi-ments: Baffin Island, Eastern Canadian Arctic. pp. 57-71, In: A.E.S.Kemp (ed.). Palaeoclimatology and Palaeoceanography from Lami-nated Sediments. Geological Society Special Publication, London. 116p.
Hughes, M. and D. Robinson, 1996. Historical snow cover variability inthe Great Plains region of the United States: 1910 through 1993. Int. J.Climatol. 16(9): 1005-1032.
Hunter, J.R., J.H. Taylor, H.G. Moser, 1979. Effect of ultraviolet irradia-tion on eggs and larvae of the northern anchovy, Engraulis mordax andthe Pacific mackerel, Scomber japonicus, during the embryonic stage.Photochem. and Photobiol. 29: 325-338.
Huschke, R.E., 1969. Arctic cloud statistics from air calibrated surfaceweather observations. Mem. RM-6173-PR. Rand Corp., Santa Monica,California. 79p.
IASC (International Arctic Science Committee), 1995. Effects of increasedultraviolet radiation in the Arctic. IASC Report no. 2. 56p.
IASC (International Arctic Science Committee), 1996. Ultraviolet interna-tional research centers (UVIRCs): A proposal for interdisciplinary UVBresearch in the Arctic. IASC Report no. 7. 36p.
Ingram, M.J., G. Farmer and T.M.L. Wigley, 1981. Past climates and theirimpact on man: A review. pp. 4-19, In: T.M.L. Wigley, M.J. Ingramand G. Farmer (eds.). Climate and History: Studies of past climates andtheir impact on Man. Cambridge University Press, Cambridge, U.K.
IPCC, 1990a. Climate Change: The IPCC Scientific Assessment. J.T.Houghton, G.J. Jenkins and J.J. Ephraums (eds.). Cambridge UniversityPress, Cambridge, U.K.
IPCC, 1990b. Climate Change: The IPCC Impacts Assessment, CambridgeUniversity Press, Cambridge, U.K.
IPCC, 1992a: Climate Change 1992: The Supplementary Report to theIPCC Scientific Assessment. J.T. Houghton, B.A. Callander and S.K.Varney (eds.). Cambridge University Press, Cambridge, U.K. 200p.
IPCC, 1992b. Climate Change 1992: The Supplementary Report to theIPCC Impacts Assessment. Cambridge University Press, Cambridge,U.K.
IPCC, 1994. Climate Change 1994: Radiative forcing of Climate Changeand an evaluation of the IPCC IS92 emission scenarios. CambridgeUniversity Press, Cambridge, U.K.
IPCC, 1996a. Climate Change 1995: Second Assessment Report on Cli-mate Change. Cambridge University Press, Cambridge, U.K. 572p.
IPCC, 1996b. Climate Change 1995: Impacts, Adaptations and Mitigationof Climate Change: Scientific-Technical Analyses. Cambridge Univer-sity Press, Cambridge, U.K. 878p.
Isodorov V.A., I.G. Zenkevich and B.V. Ioffe, 1990. Volatile organic com-pounds in solfataric gases. J. Atmos. Chem. 10: 329-340.
Ivanov, V.V., 1990. The Arctic water resources and their studies: The state-of-the-art and future plans. Arctic Research, Advances and Prospects,Proceedings of the Conference of Arctic and Nordic Countries on Co-ordination of Research in the Arctic. Nauka, Leningrad, Moscow.
Ivanov, V.V. and V.A. Yankina, 1991. Water resources of the Arctic.
Problemy Arkt. Antarkt. 66: 118-128. (In Russian).Jacoby, G.C. and R.D. D’Arrigo, 1995. Tree ring width and density evi-
dence of climatic and potential forest change in Alaska. Global Bio-geochemical Cycles 9: 227-234.
Jaffe, D.A., 1991. Local sources of ozone in the Arctic: From Prudhoe Bayto the Taz Peninsula. pp. 255-287, In: W.T. Sturges (ed.). Pollution ofthe Arctic Atmosphere. Elsevier Applied Science, New York.
Jaffe, D., T. Iverson and G. Shaw, 1995. Comment on a long-term decreasein Arctic haze at Barrow, Alaska by B.A. Bodhaine and E.G. Dutton.Geophys. Res. Lett. 22(6): 739-740.
Jin, Z., K. Stamnes and W.F. Weeks, 1994a. Transport of photosyntheti-cally active radiation in sea ice and ocean. pp. 954-964, In: J. Jaffe(ed.). Ocean Optics XII, Proc. SPIE 2258.
Jin, Z., K. Stamnes, W.F. Weeks and S.C. Tsay, 1994b. The effect of sea iceon the solar energy budget in the atmosphere-sea ice-ocean system: Amodel study. J. Geophys. Res. 99: 25281-25294.
Johannessen, O.M., M. Miles and E. Bjorgo, 1995. Arctic’s shrinking seaice. Nature 376: 126-127.
Johanson, U., C. Gehrke, L.O. Björn and T.V. Callaghan, 1995b. The ef-fects of enhanced ultraviolet-B radiation on the growth of dwarf shrubsin a subarctic heathland. Functional Ecology 9: 713-719.
Johanson, U., C. Gehrke, L.O. Björn, T.V. Callaghan and M. Sonesson,1995a. The effects of enhanced ultraviolet-B radiation on a subarcticheath ecosystem. Ambio 24(2): 106-111.
Johnsen, B., 1996. UV monitoring in Norway: past, present and future. In:B.L. Diffey (ed.). Measurement and trends of terrestrial ultraviolet-Bradiation in Europe. OEMF, Milan.
Jokela, K., K. Leszczynski and R. Visuri, 1993. Effects of Arctic ozone de-pletion and of snow on UV exposure in Finland. Photochem. and Pho-tobiol. 58: 559-566.
Jokela, K., K. Leszczynski, R. Visuri and L. Ylianttila, 1995. Increased UVexposure in Finland in 1993. Photochem. and Photobiol. 62: 101-107.
Jonasson, S., M. Havstrom, M. Jensen and T.V. Callaghan, 1993. In situmineralization of nitrogen and phosphorus of Arctic soils after pertur-bations simulating climate change. Oecologia 95: 179-186.
Jones, P.D., 1994. Hemispheric surface air temperature variations: A re-analysis and update to 1993. J. Climate 7: 1794-1802.
Jones, P.D. and K.R. Briffa, 1992. Global surface air temperature varia-tions during the twentieth century: Part 1. Spatial, temporal and sea-sonal detail. The Holocene 2: 165-179.
Jones, P.D., S.C.B. Raper, R.S. Bradley, H.F. Diaz, P.M. Kelly, T.M.L.Wigley, 1986. Northern Hemisphere surface air temperature variations,1851-1984. J. Clim. Appl. Meteor. 25: 161-179.
Kahl, J.D.W., D.A. Martinez and N.A. Zaitseva, 1996. Long-term variabil-ity in the low-level inversion layer over the Arctic Ocean. Int. J. Clima-tol. 16: 1297-1313.
Kahl, J.D., D.J. Charlevoix, N.A. Zaitseva, R.C. Schnell and M.C. Serreze,1993a. Absence of evidence for greenhouse warming over the ArcticOcean in the past 40 Years. Nature 361: 335-337.
Kahl, J.D., M.C. Serreze, S. Shiotani, S.M. Skony and R.C. Schnell, 1992.In-situ meteorological sounding archives for Arctic studies. Bull. Amer.Meteor. Soc. 73: 1824-1830.
Kahl, J.D., M.C. Serreze, R.S. Stone, S. Shiotani, M. Kisley and R.C.Schell, 1993b. Tropospheric temperature trends in the Arctic: 1958-86.J. Geophys. Res. 98: 12825-12838.
Kalff, J. and H.E. Welch, 1974. Phytoplankton production in Char Lake, anatural polar lake in Meretta Lake, a polluted polar lake, CornwallisIsland, Northwest Territories. J. Fish. Res. Board Canada 31: 621-636.
Kane, D.L. and L.D. Hinzman, 1988. Permafrost hydrology of a smallArctic watershed. pp. 590-595, In: K. Sennest (ed.). Permafrost, FifthInternational Conference, Proceedings, Trondheim, Norway. TapirPublishers, Trondheim.
Kane, D.L., L.D. Hinzman, M.K. Woo, K.R. Everett, F.S. Chapin III, R.L.Jefferies, J.F. Reynolds, G.R. Shaver, J. Svoboda, E. . Chu (eds.), 1992.Arctic ecosystems in a changing climate: an ecophysiological perspec-tive. Academic Press, San Diego.
Kankaala, P., L. Ojala, L. Arvola and T. Tuolonen, 1994. Impact of climatechange on the carbon cycle in freshwater ecosystems. pp. 140-145, In:M. Kanninen and P. Heikinheimo (eds.). The Finnish Research Pro-gramme on Climate Change, Second Progress Report. Publications ofthe Academy of Finland 1/94. Helsinki.
Karanas, J.J., H. van Dyke, R.C. Worrest, 1979. Mid-ultraviolet (ultravio-let-B) sensitivity of Acartia claussii Giesbrecht (Copepoda). Limnol.Oceanogr. 24: 1104-1116.
Karentz, D., 1994. Ultraviolet tolerance mechanisms in Antarctic marineorganisms. pp. 93-110, In: C.S. Weiler and P.A. Penhale (eds.). Ultra-violet radiation in Antarctica: measurements and biological effects.Antarctic Research Series 62.
Karentz, D., J.E. Cleaver and D.L. Mitchell, 1991. Cell survival character-istics and molecular responses of antarctic phytoplankton to ultravio-let-B radiation. J. Phycol. 27: 326-341.
Karentz, D., M.L. Bothwell, R.B. Coffin, A. Hanson, G.J. Herndl, S.S. Kil-ham, M.P. Lesser, M. Lindell, R.E. Moeller, D.P. Morris, P.J. Neale,R.W. Sanders, C.S. Weiler and R.G. Wetzel, 1994. Impact of ultravio-let-B radiation on pelagic freshwater ecosystems: Report of workinggroup on bacteria and phytoplankton. pp. 31-69, In: C.E. Williamsonand Zagarese (eds.). Advances in Limnology: Impact of ultraviolet-Bradiation on pelagic ecosystems. Arch. Hydrobiologie 43.
Karl, T.R., P.Y. Groisman, R.R. Heim Jr. and R.W. Knight, 1993. Recentvariations of snow cover and snowfall in North America and their rela-
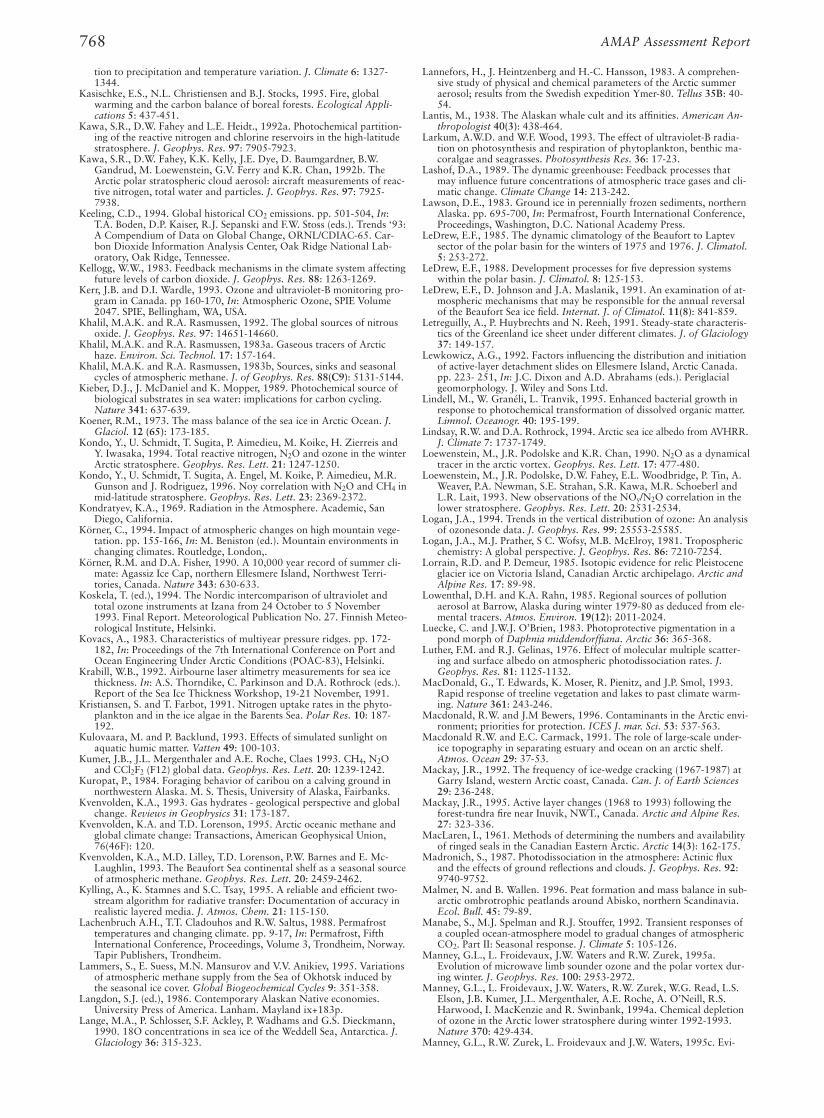
768 AMAP Assessment Report
Lannefors, H., J. Heintzenberg and H.-C. Hansson, 1983. A comprehen-sive study of physical and chemical parameters of the Arctic summeraerosol; results from the Swedish expedition Ymer-80. Tellus 35B: 40-54.
Lantis, M., 1938. The Alaskan whale cult and its affinities. American An-thropologist 40(3): 438-464.
Larkum, A.W.D. and W.F. Wood, 1993. The effect of ultraviolet-B radia-tion on photosynthesis and respiration of phytoplankton, benthic ma-coralgae and seagrasses. Photosynthesis Res. 36: 17-23.
Lashof, D.A., 1989. The dynamic greenhouse: Feedback processes thatmay influence future concentrations of atmospheric trace gases and cli-matic change. Climate Change 14: 213-242.
Lawson, D.E., 1983. Ground ice in perennially frozen sediments, northernAlaska. pp. 695-700, In: Permafrost, Fourth International Conference,Proceedings, Washington, D.C. National Academy Press.
LeDrew, E.F., 1985. The dynamic climatology of the Beaufort to Laptevsector of the polar basin for the winters of 1975 and 1976. J. Climatol.5: 253-272.
LeDrew, E.F., 1988. Development processes for five depression systemswithin the polar basin. J. Climatol. 8: 125-153.
LeDrew, E.F., D. Johnson and J.A. Maslanik, 1991. An examination of at-mospheric mechanisms that may be responsible for the annual reversalof the Beaufort Sea ice field. Internat. J. of Climatol. 11(8): 841-859.
Letreguilly, A., P. Huybrechts and N. Reeh, 1991. Steady-state characteris-tics of the Greenland ice sheet under different climates. J. of Glaciology37: 149-157.
Lewkowicz, A.G., 1992. Factors influencing the distribution and initiationof active-layer detachment slides on Ellesmere Island, Arctic Canada.pp. 223- 251, In: J.C. Dixon and A.D. Abrahams (eds.). Periglacialgeomorphology. J. Wiley and Sons Ltd.
Lindell, M., W. Granéli, L. Tranvik, 1995. Enhanced bacterial growth inresponse to photochemical transformation of dissolved organic matter.Limnol. Oceanogr. 40: 195-199.
Lindsay, R.W. and D.A. Rothrock, 1994. Arctic sea ice albedo from AVHRR.J. Climate 7: 1737-1749.
Loewenstein, M., J.R. Podolske and K.R. Chan, 1990. N2O as a dynamicaltracer in the arctic vortex. Geophys. Res. Lett. 17: 477-480.
Loewenstein, M., J.R. Podolske, D.W. Fahey, E.L. Woodbridge, P. Tin, A.Weaver, P.A. Newman, S.E. Strahan, S.R. Kawa, M.R. Schoeberl andL.R. Lait, 1993. New observations of the NOy/N2O correlation in thelower stratosphere. Geophys. Res. Lett. 20: 2531-2534.
Logan, J.A., 1994. Trends in the vertical distribution of ozone: An analysisof ozonesonde data. J. Geophys. Res. 99: 25553-25585.
Logan, J.A., M.J. Prather, S C. Wofsy, M.B. McElroy, 1981. Troposphericchemistry: A global perspective. J. Geophys. Res. 86: 7210-7254.
Lorrain, R.D. and P. Demeur, 1985. Isotopic evidence for relic Pleistoceneglacier ice on Victoria Island, Canadian Arctic archipelago. Arctic andAlpine Res. 17: 89-98.
Lowenthal, D.H. and K.A. Rahn, 1985. Regional sources of pollutionaerosol at Barrow, Alaska during winter 1979-80 as deduced from ele-mental tracers. Atmos. Environ. 19(12): 2011-2024.
Luecke, C. and J.W.J. O’Brien, 1983. Photoprotective pigmentation in apond morph of Daphnia middendorffiana. Arctic 36: 365-368.
Luther, F.M. and R.J. Gelinas, 1976. Effect of molecular multiple scatter-ing and surface albedo on atmospheric photodissociation rates. J.Geophys. Res. 81: 1125-1132.
MacDonald, G., T. Edwards, K. Moser, R. Pienitz, and J.P. Smol, 1993.Rapid response of treeline vegetation and lakes to past climate warm-ing. Nature 361: 243-246.
Macdonald, R.W. and J.M Bewers, 1996. Contaminants in the Arctic envi-ronment; priorities for protection. ICES J. mar. Sci. 53: 537-563.
Macdonald R.W. and E.C. Carmack, 1991. The role of large-scale under-ice topography in separating estuary and ocean on an arctic shelf.Atmos. Ocean 29: 37-53.
Mackay, J.R., 1992. The frequency of ice-wedge cracking (1967-1987) atGarry Island, western Arctic coast, Canada. Can. J. of Earth Sciences29: 236-248.
Mackay, J.R., 1995. Active layer changes (1968 to 1993) following theforest-tundra fire near Inuvik, NWT., Canada. Arctic and Alpine Res.27: 323-336.
MacLaren, I., 1961. Methods of determining the numbers and availabilityof ringed seals in the Canadian Eastern Arctic. Arctic 14(3): 162-175.
Madronich, S., 1987. Photodissociation in the atmosphere: Actinic fluxand the effects of ground reflections and clouds. J. Geophys. Res. 92:9740-9752.
Malmer, N. and B. Wallen. 1996. Peat formation and mass balance in sub-arctic ombrotrophic peatlands around Abisko, northern Scandinavia.Ecol. Bull. 45: 79-89.
Manabe, S., M.J. Spelman and R.J. Stouffer, 1992. Transient responses ofa coupled ocean-atmosphere model to gradual changes of atmosphericCO2. Part II: Seasonal response. J. Climate 5: 105-126.
Manney, G.L., L. Froidevaux, J.W. Waters and R.W. Zurek, 1995a.Evolution of microwave limb sounder ozone and the polar vortex dur-ing winter. J. Geophys. Res. 100: 2953-2972.
Manney, G.L., L. Froidevaux, J.W. Waters, R.W. Zurek, W.G. Read, L.S.Elson, J.B. Kumer, J.L. Mergenthaler, A.E. Roche, A. O’Neill, R.S.Harwood, I. MacKenzie and R. Swinbank, 1994a. Chemical depletionof ozone in the Arctic lower stratosphere during winter 1992-1993.Nature 370: 429-434.
Manney, G.L., R.W. Zurek, L. Froidevaux and J.W. Waters, 1995c. Evi-
tion to precipitation and temperature variation. J. Climate 6: 1327-1344.
Kasischke, E.S., N.L. Christiensen and B.J. Stocks, 1995. Fire, globalwarming and the carbon balance of boreal forests. Ecological Appli-cations 5: 437-451.
Kawa, S.R., D.W. Fahey and L.E. Heidt., 1992a. Photochemical partition-ing of the reactive nitrogen and chlorine reservoirs in the high-latitudestratosphere. J. Geophys. Res. 97: 7905-7923.
Kawa, S.R., D.W. Fahey, K.K. Kelly, J.E. Dye, D. Baumgardner, B.W.Gandrud, M. Loewenstein, G.V. Ferry and K.R. Chan, 1992b. TheArctic polar stratospheric cloud aerosol: aircraft measurements of reac-tive nitrogen, total water and particles. J. Geophys. Res. 97: 7925-7938.
Keeling, C.D., 1994. Global historical CO2 emissions. pp. 501-504, In:T.A. Boden, D.P. Kaiser, R.J. Sepanski and F.W. Stoss (eds.). Trends ‘93:A Compendium of Data on Global Change, ORNL/CDIAC-65. Car-bon Dioxide Information Analysis Center, Oak Ridge National Lab-oratory, Oak Ridge, Tennessee.
Kellogg, W.W., 1983. Feedback mechanisms in the climate system affectingfuture levels of carbon dioxide. J. Geophys. Res. 88: 1263-1269.
Kerr, J.B. and D.I. Wardle, 1993. Ozone and ultraviolet-B monitoring pro-gram in Canada. pp 160-170, In: Atmospheric Ozone, SPIE Volume2047. SPIE, Bellingham, WA, USA.
Khalil, M.A.K. and R.A. Rasmussen, 1992. The global sources of nitrousoxide. J. Geophys. Res. 97: 14651-14660.
Khalil, M.A.K. and R.A. Rasmussen, 1983a. Gaseous tracers of Arctichaze. Environ. Sci. Technol. 17: 157-164.
Khalil, M.A.K. and R.A. Rasmussen, 1983b, Sources, sinks and seasonalcycles of atmospheric methane. J. of Geophys. Res. 88(C9): 5131-5144.
Kieber, D.J., J. McDaniel and K. Mopper, 1989. Photochemical source ofbiological substrates in sea water: implications for carbon cycling.Nature 341: 637-639.
Koener, R.M., 1973. The mass balance of the sea ice in Arctic Ocean. J.Glaciol. 12 (65): 173-185.
Kondo, Y., U. Schmidt, T. Sugita, P. Aimedieu, M. Koike, H. Zierreis andY. Iwasaka, 1994. Total reactive nitrogen, N2O and ozone in the winterArctic stratosphere. Geophys. Res. Lett. 21: 1247-1250.
Kondo, Y., U. Schmidt, T. Sugita, A. Engel, M. Koike, P. Aimedieu, M.R.Gunson and J. Rodriguez, 1996. Noy correlation with N2O and CH4 inmid-latitude stratosphere. Geophys. Res. Lett. 23: 2369-2372.
Kondratyev, K.A., 1969. Radiation in the Atmosphere. Academic, SanDiego, California.
Körner, C., 1994. Impact of atmospheric changes on high mountain vege-tation. pp. 155-166, In: M. Beniston (ed.). Mountain environments inchanging climates. Routledge, London,.
Körner, R.M. and D.A. Fisher, 1990. A 10,000 year record of summer cli-mate: Agassiz Ice Cap, northern Ellesmere Island, Northwest Terri-tories, Canada. Nature 343: 630-633.
Koskela, T. (ed.), 1994. The Nordic intercomparison of ultraviolet andtotal ozone instruments at Izana from 24 October to 5 November1993. Final Report. Meteorological Publication No. 27. Finnish Meteo-rological Institute, Helsinki.
Kovacs, A., 1983. Characteristics of multiyear pressure ridges. pp. 172-182, In: Proceedings of the 7th International Conference on Port andOcean Engineering Under Arctic Conditions (POAC-83), Helsinki.
Krabill, W.B., 1992. Airbourne laser altimetry measurements for sea icethickness. In: A.S. Thorndike, C. Parkinson and D.A. Rothrock (eds.).Report of the Sea Ice Thickness Workshop, 19-21 November, 1991.
Kristiansen, S. and T. Farbot, 1991. Nitrogen uptake rates in the phyto-plankton and in the ice algae in the Barents Sea. Polar Res. 10: 187-192.
Kulovaara, M. and P. Backlund, 1993. Effects of simulated sunlight onaquatic humic matter. Vatten 49: 100-103.
Kumer, J.B., J.L. Mergenthaler and A.E. Roche, Claes 1993. CH4, N2Oand CCl2F2 (F12) global data. Geophys. Res. Lett. 20: 1239-1242.
Kuropat, P., 1984. Foraging behavior of caribou on a calving ground innorthwestern Alaska. M. S. Thesis, University of Alaska, Fairbanks.
Kvenvolden, K.A., 1993. Gas hydrates - geological perspective and globalchange. Reviews in Geophysics 31: 173-187.
Kvenvolden, K.A. and T.D. Lorenson, 1995. Arctic oceanic methane andglobal climate change: Transactions, American Geophysical Union,76(46F): 120.
Kvenvolden, K.A., M.D. Lilley, T.D. Lorenson, P.W. Barnes and E. Mc-Laughlin, 1993. The Beaufort Sea continental shelf as a seasonal sourceof atmospheric methane. Geophys. Res. Lett. 20: 2459-2462.
Kylling, A., K. Stamnes and S.C. Tsay, 1995. A reliable and efficient two-stream algorithm for radiative transfer: Documentation of accuracy inrealistic layered media. J. Atmos. Chem. 21: 115-150.
Lachenbruch A.H., T.T. Cladouhos and R.W. Saltus, 1988. Permafrosttemperatures and changing climate. pp. 9-17, In: Permafrost, FifthInternational Conference, Proceedings, Volume 3, Trondheim, Norway.Tapir Publishers, Trondheim.
Lammers, S., E. Suess, M.N. Mansurov and V.V. Anikiev, 1995. Variationsof atmospheric methane supply from the Sea of Okhotsk induced bythe seasonal ice cover. Global Biogeochemical Cycles 9: 351-358.
Langdon, S.J. (ed.), 1986. Contemporary Alaskan Native economies.University Press of America. Lanham. Mayland ix+183p.
Lange, M.A., P. Schlosser, S.F. Ackley, P. Wadhams and G.S. Dieckmann,1990. 18O concentrations in sea ice of the Weddell Sea, Antarctica. J.Glaciology 36: 315-323.
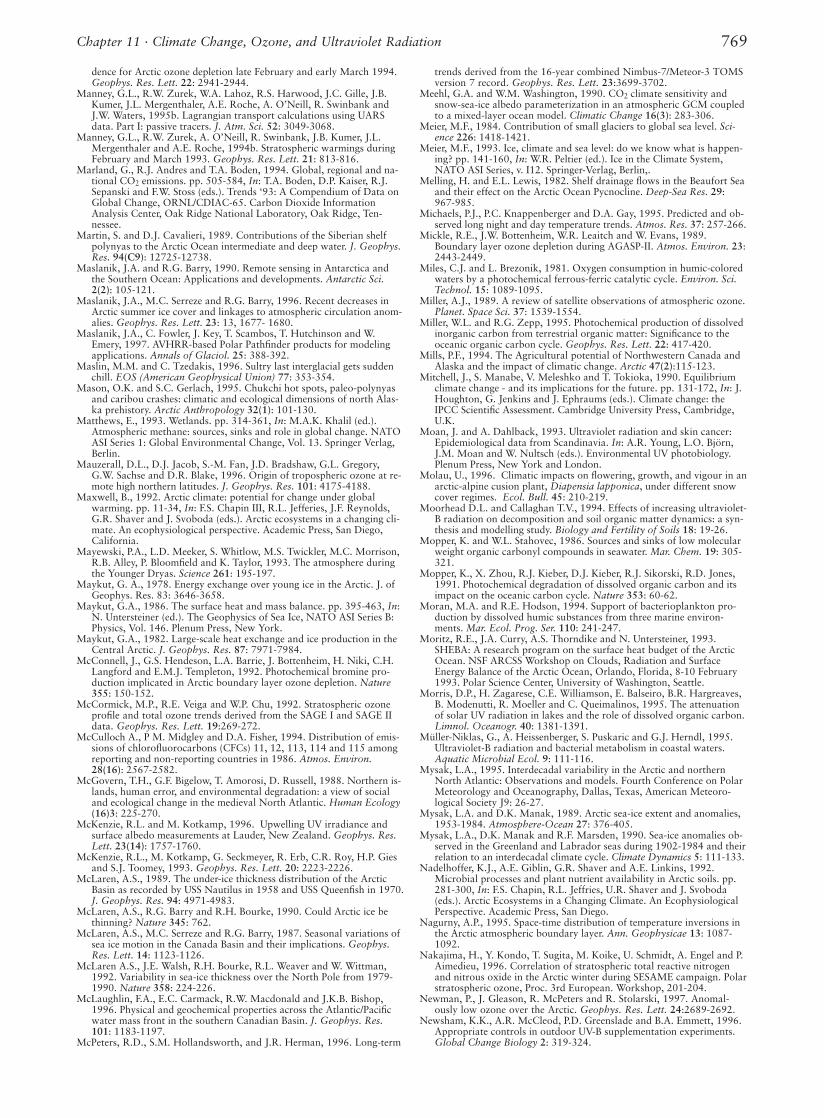
769Chapter 11 · Climate Change, Ozone, and Ultraviolet Radiation
dence for Arctic ozone depletion late February and early March 1994.Geophys. Res. Lett. 22: 2941-2944.
Manney, G.L., R.W. Zurek, W.A. Lahoz, R.S. Harwood, J.C. Gille, J.B.Kumer, J.L. Mergenthaler, A.E. Roche, A. O’Neill, R. Swinbank andJ.W. Waters, 1995b. Lagrangian transport calculations using UARSdata. Part I: passive tracers. J. Atm. Sci. 52: 3049-3068.
Manney, G.L., R.W. Zurek, A. O’Neill, R. Swinbank, J.B. Kumer, J.L.Mergenthaler and A.E. Roche, 1994b. Stratospheric warmings duringFebruary and March 1993. Geophys. Res. Lett. 21: 813-816.
Marland, G., R.J. Andres and T.A. Boden, 1994. Global, regional and na-tional CO2 emissions. pp. 505-584, In: T.A. Boden, D.P. Kaiser, R.J.Sepanski and F.W. Stoss (eds.). Trends ‘93: A Compendium of Data onGlobal Change, ORNL/CDIAC-65. Carbon Dioxide InformationAnalysis Center, Oak Ridge National Laboratory, Oak Ridge, Ten-nessee.
Martin, S. and D.J. Cavalieri, 1989. Contributions of the Siberian shelfpolynyas to the Arctic Ocean intermediate and deep water. J. Geophys.Res. 94(C9): 12725-12738.
Maslanik, J.A. and R.G. Barry, 1990. Remote sensing in Antarctica andthe Southern Ocean: Applications and developments. Antarctic Sci.2(2): 105-121.
Maslanik, J.A., M.C. Serreze and R.G. Barry, 1996. Recent decreases inArctic summer ice cover and linkages to atmospheric circulation anom-alies. Geophys. Res. Lett. 23: 13, 1677- 1680.
Maslanik, J.A., C. Fowler, J. Key, T. Scambos, T. Hutchinson and W.Emery, 1997. AVHRR-based Polar Pathfinder products for modelingapplications. Annals of Glaciol. 25: 388-392.
Maslin, M.M. and C. Tzedakis, 1996. Sultry last interglacial gets suddenchill. EOS (American Geophysical Union) 77: 353-354.
Mason, O.K. and S.C. Gerlach, 1995. Chukchi hot spots, paleo-polynyasand caribou crashes: climatic and ecological dimensions of north Alas-ka prehistory. Arctic Anthropology 32(1): 101-130.
Matthews, E., 1993. Wetlands. pp. 314-361, In: M.A.K. Khalil (ed.).Atmospheric methane: sources, sinks and role in global change. NATOASI Series 1: Global Environmental Change, Vol. 13. Springer Verlag,Berlin.
Mauzerall, D.L., D.J. Jacob, S.-M. Fan, J.D. Bradshaw, G.L. Gregory,G.W. Sachse and D.R. Blake, 1996. Origin of tropospheric ozone at re-mote high northern latitudes. J. Geophys. Res. 101: 4175-4188.
Maxwell, B., 1992. Arctic climate: potential for change under globalwarming. pp. 11-34, In: F.S. Chapin III, R.L. Jefferies, J.F. Reynolds,G.R. Shaver and J. Svoboda (eds.). Arctic ecosystems in a changing cli-mate. An ecophysiological perspective. Academic Press, San Diego,California.
Mayewski, P.A., L.D. Meeker, S. Whitlow, M.S. Twickler, M.C. Morrison,R.B. Alley, P. Bloomfield and K. Taylor, 1993. The atmosphere duringthe Younger Dryas. Science 261: 195-197.
Maykut, G. A., 1978. Energy exchange over young ice in the Arctic. J. ofGeophys. Res. 83: 3646-3658.
Maykut, G.A., 1986. The surface heat and mass balance. pp. 395-463, In:N. Untersteiner (ed.). The Geophysics of Sea Ice, NATO ASI Series B:Physics, Vol. 146. Plenum Press, New York.
Maykut, G.A., 1982. Large-scale heat exchange and ice production in theCentral Arctic. J. Geophys. Res. 87: 7971-7984.
McConnell, J., G.S. Hendeson, L.A. Barrie, J. Bottenheim, H. Niki, C.H.Langford and E.M.J. Templeton, 1992. Photochemical bromine pro-duction implicated in Arctic boundary layer ozone depletion. Nature355: 150-152.
McCormick, M.P., R.E. Veiga and W.P. Chu, 1992. Stratospheric ozoneprofile and total ozone trends derived from the SAGE I and SAGE IIdata. Geophys. Res. Lett. 19:269-272.
McCulloch A., P M. Midgley and D.A. Fisher, 1994. Distribution of emis-sions of chlorofluorocarbons (CFCs) 11, 12, 113, 114 and 115 amongreporting and non-reporting countries in 1986. Atmos. Environ.28(16): 2567-2582.
McGovern, T.H., G.F. Bigelow, T. Amorosi, D. Russell, 1988. Northern is-lands, human error, and environmental degradation: a view of socialand ecological change in the medieval North Atlantic. Human Ecology(16)3: 225-270.
McKenzie, R.L. and M. Kotkamp, 1996. Upwelling UV irradiance andsurface albedo measurements at Lauder, New Zealand. Geophys. Res.Lett. 23(14): 1757-1760.
McKenzie, R.L., M. Kotkamp, G. Seckmeyer, R. Erb, C.R. Roy, H.P. Giesand S.J. Toomey, 1993. Geophys. Res. Lett. 20: 2223-2226.
McLaren, A.S., 1989. The under-ice thickness distribution of the ArcticBasin as recorded by USS Nautilus in 1958 and USS Queenfish in 1970.J. Geophys. Res. 94: 4971-4983.
McLaren, A.S., R.G. Barry and R.H. Bourke, 1990. Could Arctic ice bethinning? Nature 345: 762.
McLaren, A.S., M.C. Serreze and R.G. Barry, 1987. Seasonal variations ofsea ice motion in the Canada Basin and their implications. Geophys.Res. Lett. 14: 1123-1126.
McLaren A.S., J.E. Walsh, R.H. Bourke, R.L. Weaver and W. Wittman,1992. Variability in sea-ice thickness over the North Pole from 1979-1990. Nature 358: 224-226.
McLaughlin, F.A., E.C. Carmack, R.W. Macdonald and J.K.B. Bishop,1996. Physical and geochemical properties across the Atlantic/Pacificwater mass front in the southern Canadian Basin. J. Geophys. Res.101: 1183-1197.
McPeters, R.D., S.M. Hollandsworth, and J.R. Herman, 1996. Long-term
trends derived from the 16-year combined Nimbus-7/Meteor-3 TOMSversion 7 record. Geophys. Res. Lett. 23:3699-3702.
Meehl, G.A. and W.M. Washington, 1990. CO2 climate sensitivity andsnow-sea-ice albedo parameterization in an atmospheric GCM coupledto a mixed-layer ocean model. Climatic Change 16(3): 283-306.
Meier, M.F., 1984. Contribution of small glaciers to global sea level. Sci-ence 226: 1418-1421.
Meier, M.F., 1993. Ice, climate and sea level: do we know what is happen-ing? pp. 141-160, In: W.R. Peltier (ed.). Ice in the Climate System,NATO ASI Series, v. I12. Springer-Verlag, Berlin,.
Melling, H. and E.L. Lewis, 1982. Shelf drainage flows in the Beaufort Seaand their effect on the Arctic Ocean Pycnocline. Deep-Sea Res. 29:967-985.
Michaels, P.J., P.C. Knappenberger and D.A. Gay, 1995. Predicted and ob-served long night and day temperature trends. Atmos. Res. 37: 257-266.
Mickle, R.E., J.W. Bottenheim, W.R. Leaitch and W. Evans, 1989.Boundary layer ozone depletion during AGASP-II. Atmos. Environ. 23:2443-2449.
Miles, C.J. and L. Brezonik, 1981. Oxygen consumption in humic-coloredwaters by a photochemical ferrous-ferric catalytic cycle. Environ. Sci.Technol. 15: 1089-1095.
Miller, A.J., 1989. A review of satellite observations of atmospheric ozone.Planet. Space Sci. 37: 1539-1554.
Miller, W.L. and R.G. Zepp, 1995. Photochemical production of dissolvedinorganic carbon from terrestrial organic matter: Significance to theoceanic organic carbon cycle. Geophys. Res. Lett. 22: 417-420.
Mills, P.F., 1994. The Agricultural potential of Northwestern Canada andAlaska and the impact of climatic change. Arctic 47(2):115-123.
Mitchell, J., S. Manabe, V. Meleshko and T. Tokioka, 1990. Equilibriumclimate change - and its implications for the future. pp. 131-172, In: J.Houghton, G. Jenkins and J. Ephraums (eds.). Climate change: theIPCC Scientific Assessment. Cambridge University Press, Cambridge,U.K.
Moan, J. and A. Dahlback, 1993. Ultraviolet radiation and skin cancer:Epidemiological data from Scandinavia. In: A.R. Young, L.O. Björn,J.M. Moan and W. Nultsch (eds.). Environmental UV photobiology.Plenum Press, New York and London.
Molau, U., 1996. Climatic impacts on flowering, growth, and vigour in anarctic-alpine cusion plant, Diapensia lapponica, under different snowcover regimes. Ecol. Bull. 45: 210-219.
Moorhead D.L. and Callaghan T.V., 1994. Effects of increasing ultraviolet-B radiation on decomposition and soil organic matter dynamics: a syn-thesis and modelling study. Biology and Fertility of Soils 18: 19-26.
Mopper, K. and W.L. Stahovec, 1986. Sources and sinks of low molecularweight organic carbonyl compounds in seawater. Mar. Chem. 19: 305-321.
Mopper, K., X. Zhou, R.J. Kieber, D.J. Kieber, R.J. Sikorski, R.D. Jones,1991. Photochemical degradation of dissolved organic carbon and itsimpact on the oceanic carbon cycle. Nature 353: 60-62.
Moran, M.A. and R.E. Hodson, 1994. Support of bacterioplankton pro-duction by dissolved humic substances from three marine environ-ments. Mar. Ecol. Prog. Ser. 110: 241-247.
Moritz, R.E., J.A. Curry, A.S. Thorndike and N. Untersteiner, 1993.SHEBA: A research program on the surface heat budget of the ArcticOcean. NSF ARCSS Workshop on Clouds, Radiation and SurfaceEnergy Balance of the Arctic Ocean, Orlando, Florida, 8-10 February1993. Polar Science Center, University of Washington, Seattle.
Morris, D.P., H. Zagarese, C.E. Williamson, E. Balseiro, B.R. Hargreaves,B. Modenutti, R. Moeller and C. Queimalinos, 1995. The attenuationof solar UV radiation in lakes and the role of dissolved organic carbon.Limnol. Oceanogr. 40: 1381-1391.
Müller-Niklas, G., A. Heissenberger, S. Puskaric and G.J. Herndl, 1995.Ultraviolet-B radiation and bacterial metabolism in coastal waters.Aquatic Microbial Ecol. 9: 111-116.
Mysak, L.A., 1995. Interdecadal variability in the Arctic and northernNorth Atlantic: Observations and models. Fourth Conference on PolarMeteorology and Oceanography, Dallas, Texas, American Meteoro-logical Society J9: 26-27.
Mysak, L.A. and D.K. Manak, 1989. Arctic sea-ice extent and anomalies,1953-1984. Atmosphere-Ocean 27: 376-405.
Mysak, L.A., D.K. Manak and R.F. Marsden, 1990. Sea-ice anomalies ob-served in the Greenland and Labrador seas during 1902-1984 and theirrelation to an interdecadal climate cycle. Climate Dynamics 5: 111-133.
Nadelhoffer, K.J., A.E. Giblin, G.R. Shaver and A.E. Linkins, 1992.Microbial processes and plant nutrient availability in Arctic soils. pp.281-300, In: F.S. Chapin, R.L. Jeffries, U.R. Shaver and J. Svoboda(eds.). Arctic Ecosystems in a Changing Climate. An EcophysiologicalPerspective. Academic Press, San Diego.
Nagurny, A.P., 1995. Space-time distribution of temperature inversions inthe Arctic atmospheric boundary layer. Ann. Geophysicae 13: 1087-1092.
Nakajima, H., Y. Kondo, T. Sugita, M. Koike, U. Schmidt, A. Engel and P.Aimedieu, 1996. Correlation of stratospheric total reactive nitrogenand nitrous oxide in the Arctic winter during SESAME campaign. Polarstratospheric ozone, Proc. 3rd European. Workshop, 201-204.
Newman, P., J. Gleason, R. McPeters and R. Stolarski, 1997. Anomal-ously low ozone over the Arctic. Geophys. Res. Lett. 24:2689-2692.
Newsham, K.K., A.R. McCleod, P.D. Greenslade and B.A. Emmett, 1996.Appropriate controls in outdoor UV-B supplementation experiments.Global Change Biology 2: 319-324.

770 AMAP Assessment Report
Atmos. Environ. 15(8): 1439-1445.Overland, J.E., 1985. Atmospheric boundary layer structure and drag coef-
ficients over sea ice. J. Geophys. Res. 90: 9029-9049.Overland, J.E. and P.S. Guest, 1991. The Arctic snow and temperature
budget over sea ice during winter. J. Geophys. Res. 96: 4651-4662.Overpeck, J.T., 1995. Paleoclimatology and climate system dynamics.
Review of Geophysics 33, Supplement B: 863-871.Overpeck, J.T., 1996. Warm climate surprises. Nature 271: 1820-1821.Overpeck, J.T., P.J. Bartlein and T. Webb III, 1991. Potential magnitude of
future vegetation change in eastern North America: comparisons withthe past. Science 254: 692-695.
Parker, D.E. and D.I. Cox, 1995. Towards a consistent global climatologi-cal radiosonde data base. Internat. J. of Climatology 15: 473-496.
Parker, D.E., C.K. Folland and M. Jackson, 1995. Marine surface tempera-ture: Observed variations and data requirements. Clim. Change 31:559-600
Parkinson, C.L., 1992. Spatial patterns of increases and decreases in thelength of the sea ice season in the north polar region, 1979-1986. J.Geophys. Res. 97: 14377-14388.
Parkinson, C.L. and D.J. Cavalieri, 1989. Arctic sea ice 1973-1987. sea-sonal, regional and interannual variability. J. Geophys. Res. 94: 14499-14523.
Parkinson, C.L., J. Comiso, H.J. Zwally, D.J. Cavalieri, P. Gloersen andW.J. Campbell, 1987. Arctic sea ice, 1973-1976: Satellite passive mi-crowave observations, NASA Special Publication, SP-489. 295p.
Parry, M.L., 1978. Climatic Change, Agriculture and Settlement, Studies inHistorical Geography. Dawson, Folkestone.
Parsons, A.N., J.M. Welker, P.A. Wookey, M.C. Press, T.V. Callaghan andJ.A. Lee, 1994. Growth responses of four sub-arctic dwarf shrubs tosimulated environmental change. J. of Ecology 82: 307-318.
Paterson, W.S.B., 1994. The Physics of Glaciers, Third Edition. PergamonPress, Oxford.
Pease, C.H., 1987. The size of wind-driven coastal polynyas. J. Geophys.Res. 92, 7049-7059.
Permafrost Subcommittee, 1988. Glossary of permafrost and relatedground-ice terms. Associate Committee on Geotechnical Research,National Research Council of Canada, Ottawa. 156p.
Perovich, D.K., 1993. A theoretical model of ultraviolet light transmissionthrough Antarctic sea ice. J. Geophys. Res. 98: 22579-22587.
Perovich, D.K., 1996. The optical properties of sea ice. CRREL Mono-graph 96-1, U.S. Cold Regions Research and Engineering Laboratory,Hanover, NH. 25p.
Peterson, D.L. and D.R. Johnson (eds.), 1995. Human Ecology and Cli-mate Change: People and Resources in the Far North. Taylor andFrancis, Washington DC.
Petzoldt, K., B. Najjokat and K. Neugebohren., 1994. Correlation betweenstratospheric temperature, total ozone and tropospheric weather sys-tems. Geophys. Res. Lett. 21(13): 1203-1206.
Pienitz, R. and J.P. Smol, 1993. Diatom assemblages and their relationshipto environmental variables in lakes from the boreal forest-tundra eco-tone near Yellowknife, Northwest Territories, Canada. Hydrobiologia269/270: 391-404.
Pienitz, R., I.R. Walker, B.A. Zeeb, J.P. Smol and P.R. Leavitt, 1992. Bio-monitoring past salinity changes in an athalassic sub-arctic lake. Int. J.Salt Lake Res. 1(2): 91-123.
Pienitz, R., J.P. Smol and H.J.B. Birks, 1995. Assessment of freshwater di-atoms as quantitative indicators of past climatic change in the Yukonand Northwest Territories, Canada. J. Paleolimnology 13: 21-49.
Podolske, J.R., M. Loewenstein, A. Weaver, S.E. Strahan and K.R. Chan,1993. Northern hemisphere nitrous oxide morphology during the 1989AASE and the 1991-1992 AASE II campaigns. Geophys. Res. Lett. 20:2535-2538.
Polar Group, The, 1980. Polar atmosphere-ice-ocean processes: A reviewof polar problems in climate research. D.J. Baker, U. Radok and G.Weller (eds.). Reviews of Geophysics and Space Physics 18: 525-543.
Pollard, W.H., 1991. Observations on massive ground ice on the FosheimPeninsula, N.W.T. pp. 223-231, In: Current Research, Part E, Geo-logical Survey of Canada Paper 91(1E).
Pollard, W.H. and S.R. Dallimore, 1988. Petrographic characteristics ofmassive ground ice, Yukon Coastal Plain, Canada. pp. 224-229, In:Permafrost, Fifth International Conference, Proceedings, Volume 1,Trondheim, Norway. Tapir Publishers, Trondheim.
Pollard, W.H. and H.M. French, 1980. A first approximation of the vol-ume of ground ice, Richard Is., Pleistocene Mackenzie Delta, NWT.Canadian Geotechnical Journal 17: 509-16.
Powell, R.D., 1990. Advance of glacial tidewater fronts in Glacier Bay,Alaska. pp. 67-73, In: A.M. Milner, J.D. Wood Jr. (eds.). Proceeding ofthe Second Glacier Bay Science Symposium.. U.S. Dept of the Interior,National Park Service. Anchorage, Alaska 99503.
Power, S.B. and L.A. Mysak, 1994. On the interannual variability of Arcticsea-level pressure and sea ice. Atmosphere-Ocean 33: 1-23.
Prentice, I.C., P.J. Bartlein and T. Webb III, 1991. Vegetation and climatechange in eastern North America since the last glacial maximum.Ecology 72: 2038-2056.
Prézelin, B.B., N.P. Boucher and O. Schofield, 1994a. Evaluation of fieldstudies of ultraviolet-B radiation effects on Antarctic marine primaryproductivity. pp. 181-194, In: H. Biggs and M. E. B. Joyner (eds.).Stratospheric Ozone Depletion/ ultraviolet-B Radiation in the Bio-sphere. NATO ASI (Advance Study Institute) Series 118. Springer-Verlag, Heidelberg.
Newton, J., 1995. An assessment of coping with environmental hazards inNorthern aboriginal communities. Canadian Geographer 39(2): 112-120.
Nicholson, B.J., and L.D. Gignac, 1995. Ecotope dimensions of peatlandbryophyte indicator species along gradients in the Mackenzie RiverBasin, Canada. The Bryologist 98: 437-451.
Nicholson, B.J., L.D. Gignac, and S.E. Bayley, 1996. Effects of ecologicaland climatic gradients on the distribution of peatland bryophyte com-munities in the Mackenzie River Basin. Vegetatio 1-6(2): 119-133.
Nicolet, M., R.R. Meier and D.E. Anderson Jr., 1982. Radiation field inthe troposphere and stratosphere from 240 to 1000 nm, II - Numericalanalysis. Planet. Space Sci. 30: 935-983.
Nisbet, E.G., 1989. Some northern sources of atmospheric methane: pro-duction, history and future implications. Can. J. of Earth Sciences 26:1603-1611.
Notholt J., 1994. FTIR measurements of HF, N2O and CFCs during theArctic polar night with the moon as light source, subsidence duringwinter 1992/3. Geophys. Res. Lett. 21(22): 2385-2399.
Novelli, P.C., L.P. Steele, and P.P. Tans, 1992. Mixing ratios of carbonmonoxide in the troposphere. J. Geophys. Res. 97: 20731-20750.
O’Brien, S.R., P.A. Mayewski, L.D. Meeker, D.A. Meese, M.S. Twicklerand S.I. Whitlow, 1995. Complexity of Holocene climate as recon-structed from a Greenland ice core. Science 270: 1962-1964.
Oberbauer, S.F. and T.E. Dawson, 1992. Water relations of arctic vascularplants. pp. 259-279, In: F.S. Chapin III, R.L. Jefferies, J.F. Reynolds,G.R. Shaver and J. Svoboda (eds.). Arctic Ecosystems in ChangingClimate: An ecophysiological perspective. Academic Press: San Diego,California.
Oechel, W.C. and G.L. Vourlitis, 1994. The effects of climate change onland-atmosphere feedbacks in arctic tundra regions. Trends in Ecologyand Evolution 9: 304-329.
Oechel, W.C., S. Cowles, N. Grulke, S.J. Hastings, B. Lawrence, T. Prud-homme, G. Riechers, B. Strain, D. Tissue and G. Vourlitis, 1994.Transient nature of CO2 fertilization in Arctic tundra. Nature 371:500-503.
Oechel, W.C., S.J. Hastings, M. Jenkins, G. Reichers, N. Grulke and G.Vorlitis, 1993. Recent change of Arctic tundra ecosystems from a car-bon sink to a source. Nature 361: 520-526.
Oelhaf, H., T.V. Clarmann and H. Fischer, 1994. Stratospheric ClONO2and HNO3 profiles inside the Arctic vortex from MIPA’s-B Limb emis-sion spectra obtained during EASOE. Geophys. Res. Lett. 21(13):1263-1273.
Oerlemans, J., 1994. Quantifying global warming from the retreat of glaci-ers. Science 264: 243- 245.
Ogilvie, A.E.J., 1982. Climate and society in Iceland from the medieval pe-riod to the late eighteenth century. Ph. D. Thesis, School of Environ-mental Sciences, University of East Anglia, Norwich, U.K.
Ogilvie, A E.J., 1984. The impact of climate on grass growth and hay yieldin Iceland: A.D. 1601 to 1780. pp. 343-352, In: N.-A. Morner and W.Karlen (eds.). Climate Changes on a Yearly to Millennial Basis. Reidel,Dordrecht.
Ogilve, A.E.J., 1991. Climatic changes in Iceland A.D. c. 865 to 1598. pp.233-251, In: G.F. Bigelow (presentor). The Norse of the North At-lantic. Acta Archaeologica 61-1990. Munksgaard, Copenhagen.
Ogilve, A.E.J., 1992. Documentary evidence for changes in the climate ofIceland, A.D. 1500 to 1800. pp. 92-117, In: R.S. Bradley and P.D.Jones (eds.). Climate Since A.D. 1500. Routledge, London,.
Ogilvie, A.E.J., 1996. Sea-ice conditions off the coasts Iceland A.D. 1601-1850 with special reference to part of the Maunder Minimum period(1675-1715). AmS-Varia 25, Archaeological Museum of Stavanger,Norway, 9-12.
Ogren, J.A. and R.J. Charlson, 1983. Elemental carbon in the atmosphere:Cycle and lifetime. Tellus 35B: 241-254.
Oiestad, F., 1990. Effects of climate change on fisheries and fish farming,Univ. of Tromsø. FiskenHav, vol 2. (In Norwegian).
Olivarius, F. de Fine, H.C. Wulf, J. Crosby and M. Norval, 1996. Theusnscreening effect of urocanic acid. Photodermatol. Photoimmunol.Photomed. 22(3): 95-105.
Oltmans, S.J., 1991. Arctic ozone chemistry. pp.195-215, In: W.T. Sturges(ed..). Pollution of the Arctic Atmosphere. Elsevier, London.
Oltmans, S.J., 1993. Climatology of Arctic and Antarctic troposphericozone. pp. 26-40, In: H. Niki and K.H. Becker (eds.). The troposphericchemistry of ozone in the polar regions. NATO ASI series, vol. 17.Springer-Verlag, Berlin.
Oltmans, S.J. and H. Levy II, 1994. Surface ozone measurements from aglobal network. Atmos. Environ. 28: 9-24.
Oltmans, S.J., W.E. Raatz and W.D. Komhyr, 1989a. On the transfer ofstratospheric ozone into the troposphere near the North Pole. J. Atmos.Chem. 9: 245-253.
Oltmans, S.J., R.C. Schnell, P.J. Sheridan, R.E. Peterson, S.M. Li, J.W.Winchester, P.P. Tans, W.T. Sturges, J.D. Kahl and L.A. Barrie, 1989b.Seasonal surface ozone and filterable bromine relationship in the HighArctic. Atmos. Environ. 23: 2431-2441.
Orr, P.H. and A.R. Birt, 1984. Hereditary polymorphic light erruption inCanadian Inuit. Int. G. Dermatol. 7: 472-475.
Osterkamp, T., 1994. Evidence for warming and thawing of discontinuouspermafrost in Alaska. EOS (American Geophysical Union) 75(44): 85.
Oswood, M., 1989. Community structure of benthic invertebrates in inte-rior Alaskan (USA) streams and rivers. Hydrobiologia, v. 172.
Ottar, B., 1981. The transfer of airborne pollutants to the Arctic region.
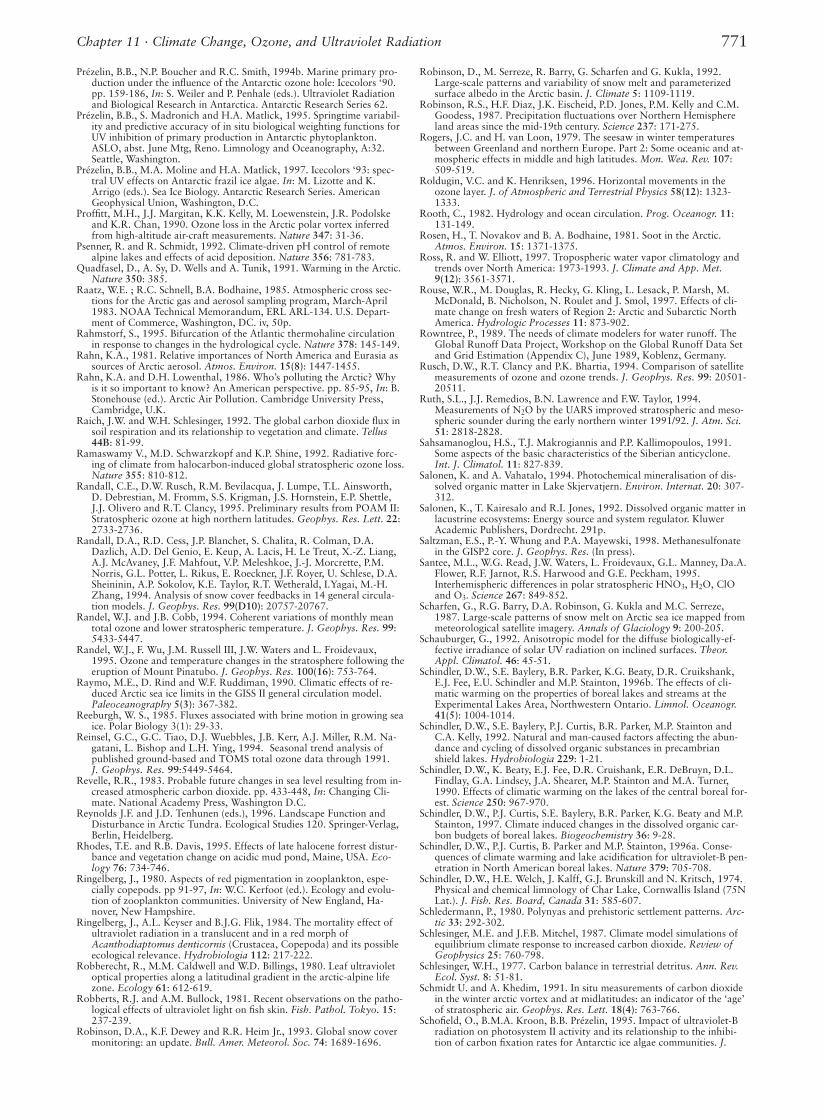
771Chapter 11 · Climate Change, Ozone, and Ultraviolet Radiation
Prézelin, B.B., N.P. Boucher and R.C. Smith, 1994b. Marine primary pro-duction under the influence of the Antarctic ozone hole: Icecolors ‘90.pp. 159-186, In: S. Weiler and P. Penhale (eds.). Ultraviolet Radiationand Biological Research in Antarctica. Antarctic Research Series 62.
Prézelin, B.B., S. Madronich and H.A. Matlick, 1995. Springtime variabil-ity and predictive accuracy of in situ biological weighting functions forUV inhibition of primary production in Antarctic phytoplankton.ASLO, abst. June Mtg, Reno. Limnology and Oceanography, A:32.Seattle, Washington.
Prézelin, B.B., M.A. Moline and H.A. Matlick, 1997. Icecolors ‘93: spec-tral UV effects on Antarctic frazil ice algae. In: M. Lizotte and K.Arrigo (eds.). Sea Ice Biology. Antarctic Research Series. AmericanGeophysical Union, Washington, D.C.
Proffitt, M.H., J.J. Margitan, K.K. Kelly, M. Loewenstein, J.R. Podolskeand K.R. Chan, 1990. Ozone loss in the Arctic polar vortex inferredfrom high-altitude air-craft measurements. Nature 347: 31-36.
Psenner, R. and R. Schmidt, 1992. Climate-driven pH control of remotealpine lakes and effects of acid deposition. Nature 356: 781-783.
Quadfasel, D., A. Sy, D. Wells and A. Tunik, 1991. Warming in the Arctic.Nature 350: 385.
Raatz, W.E. ; R.C. Schnell, B.A. Bodhaine, 1985. Atmospheric cross sec-tions for the Arctic gas and aerosol sampling program, March-April1983. NOAA Technical Memorandum, ERL ARL-134. U.S. Depart-ment of Commerce, Washington, DC. iv, 50p.
Rahmstorf, S., 1995. Bifurcation of the Atlantic thermohaline circulationin response to changes in the hydrological cycle. Nature 378: 145-149.
Rahn, K.A., 1981. Relative importances of North America and Eurasia assources of Arctic aerosol. Atmos. Environ. 15(8): 1447-1455.
Rahn, K.A. and D.H. Lowenthal, 1986. Who’s polluting the Arctic? Whyis it so important to know? An American perspective. pp. 85-95, In: B.Stonehouse (ed.). Arctic Air Pollution. Cambridge University Press,Cambridge, U.K.
Raich, J.W. and W.H. Schlesinger, 1992. The global carbon dioxide flux insoil respiration and its relationship to vegetation and climate. Tellus44B: 81-99.
Ramaswamy V., M.D. Schwarzkopf and K.P. Shine, 1992. Radiative forc-ing of climate from halocarbon-induced global stratospheric ozone loss.Nature 355: 810-812.
Randall, C.E., D.W. Rusch, R.M. Bevilacqua, J. Lumpe, T.L. Ainsworth,D. Debrestian, M. Fromm, S.S. Krigman, J.S. Hornstein, E.P. Shettle,J.J. Olivero and R.T. Clancy, 1995. Preliminary results from POAM II:Stratospheric ozone at high northern latitudes. Geophys. Res. Lett. 22:2733-2736.
Randall, D.A., R.D. Cess, J.P. Blanchet, S. Chalita, R. Colman, D.A.Dazlich, A.D. Del Genio, E. Keup, A. Lacis, H. Le Treut, X.-Z. Liang,A.J. McAvaney, J.F. Mahfout, V.P. Meleshkoe, J.-J. Morcrette, P.M.Norris, G.L. Potter, L. Rikus, E. Roeckner, J.F. Royer, U. Schlese, D.A.Sheininin, A.P. Sokolov, K.E. Taylor, R.T. Wetherald, I.Yagai, M.-H.Zhang, 1994. Analysis of snow cover feedbacks in 14 general circula-tion models. J. Geophys. Res. 99(D10): 20757-20767.
Randel, W.J. and J.B. Cobb, 1994. Coherent variations of monthly meantotal ozone and lower stratospheric temperature. J. Geophys. Res. 99:5433-5447.
Randel, W.J., F. Wu, J.M. Russell III, J.W. Waters and L. Froidevaux,1995. Ozone and temperature changes in the stratosphere following theeruption of Mount Pinatubo. J. Geophys. Res. 100(16): 753-764.
Raymo, M.E., D. Rind and W.F. Ruddiman, 1990. Climatic effects of re-duced Arctic sea ice limits in the GISS II general circulation model.Paleoceanography 5(3): 367-382.
Reeburgh, W. S., 1985. Fluxes associated with brine motion in growing seaice. Polar Biology 3(1): 29-33.
Reinsel, G.C., G.C. Tiao, D.J. Wuebbles, J.B. Kerr, A.J. Miller, R.M. Na-gatani, L. Bishop and L.H. Ying, 1994. Seasonal trend analysis ofpublished ground-based and TOMS total ozone data through 1991.J. Geophys. Res. 99:5449-5464.
Revelle, R.R., 1983. Probable future changes in sea level resulting from in-creased atmospheric carbon dioxide. pp. 433-448, In: Changing Cli-mate. National Academy Press, Washington D.C.
Reynolds J.F. and J.D. Tenhunen (eds.), 1996. Landscape Function andDisturbance in Arctic Tundra. Ecological Studies 120. Springer-Verlag,Berlin, Heidelberg.
Rhodes, T.E. and R.B. Davis, 1995. Effects of late halocene forrest distur-bance and vegetation change on acidic mud pond, Maine, USA. Eco-logy 76: 734-746.
Ringelberg, J., 1980. Aspects of red pigmentation in zooplankton, espe-cially copepods. pp 91-97, In: W.C. Kerfoot (ed.). Ecology and evolu-tion of zooplankton communities. University of New England, Ha-nover, New Hampshire.
Ringelberg, J., A.L. Keyser and B.J.G. Flik, 1984. The mortality effect ofultraviolet radiation in a translucent and in a red morph ofAcanthodiaptomus denticornis (Crustacea, Copepoda) and its possibleecological relevance. Hydrobiologia 112: 217-222.
Robberecht, R., M.M. Caldwell and W.D. Billings, 1980. Leaf ultravioletoptical properties along a latitudinal gradient in the arctic-alpine lifezone. Ecology 61: 612-619.
Robberts, R.J. and A.M. Bullock, 1981. Recent observations on the patho-logical effects of ultraviolet light on fish skin. Fish. Pathol. Tokyo. 15:237-239.
Robinson, D.A., K.F. Dewey and R.R. Heim Jr., 1993. Global snow covermonitoring: an update. Bull. Amer. Meteorol. Soc. 74: 1689-1696.
Robinson, D., M. Serreze, R. Barry, G. Scharfen and G. Kukla, 1992.Large-scale patterns and variability of snow melt and parameterizedsurface albedo in the Arctic basin. J. Climate 5: 1109-1119.
Robinson, R.S., H.F. Diaz, J.K. Eischeid, P.D. Jones, P.M. Kelly and C.M.Goodess, 1987. Precipitation fluctuations over Northern Hemisphereland areas since the mid-19th century. Science 237: 171-275.
Rogers, J.C. and H. van Loon, 1979. The seesaw in winter temperaturesbetween Greenland and northern Europe. Part 2: Some oceanic and at-mospheric effects in middle and high latitudes. Mon. Wea. Rev. 107:509-519.
Roldugin, V.C. and K. Henriksen, 1996. Horizontal movements in theozone layer. J. of Atmospheric and Terrestrial Physics 58(12): 1323-1333.
Rooth, C., 1982. Hydrology and ocean circulation. Prog. Oceanogr. 11:131-149.
Rosen, H., T. Novakov and B. A. Bodhaine, 1981. Soot in the Arctic.Atmos. Environ. 15: 1371-1375.
Ross, R. and W. Elliott, 1997. Tropospheric water vapor climatology andtrends over North America: 1973-1993. J. Climate and App. Met.9(12): 3561-3571.
Rouse, W.R., M. Douglas, R. Hecky, G. Kling, L. Lesack, P. Marsh, M.McDonald, B. Nicholson, N. Roulet and J. Smol, 1997. Effects of cli-mate change on fresh waters of Region 2: Arctic and Subarctic NorthAmerica. Hydrologic Processes 11: 873-902.
Rowntree, P., 1989. The needs of climate modelers for water runoff. TheGlobal Runoff Data Project, Workshop on the Global Runoff Data Setand Grid Estimation (Appendix C), June 1989, Koblenz, Germany.
Rusch, D.W., R.T. Clancy and P.K. Bhartia, 1994. Comparison of satellitemeasurements of ozone and ozone trends. J. Geophys. Res. 99: 20501-20511.
Ruth, S.L., J.J. Remedios, B.N. Lawrence and F.W. Taylor, 1994.Measurements of N2O by the UARS improved stratospheric and meso-spheric sounder during the early northern winter 1991/92. J. Atm. Sci.51: 2818-2828.
Sahsamanoglou, H.S., T.J. Makrogiannis and P.P. Kallimopoulos, 1991.Some aspects of the basic characteristics of the Siberian anticyclone.Int. J. Climatol. 11: 827-839.
Salonen, K. and A. Vahatalo, 1994. Photochemical mineralisation of dis-solved organic matter in Lake Skjervatjern. Environ. Internat. 20: 307-312.
Salonen, K., T. Kairesalo and R.I. Jones, 1992. Dissolved organic matter inlacustrine ecosystems: Energy source and system regulator. KluwerAcademic Publishers, Dordrecht. 291p.
Saltzman, E.S., P.-Y. Whung and P.A. Mayewski, 1998. Methanesulfonatein the GISP2 core. J. Geophys. Res. (In press).
Santee, M.L., W.G. Read, J.W. Waters, L. Froidevaux, G.L. Manney, Da.A.Flower, R.F. Jarnot, R.S. Harwood and G.E. Peckham, 1995.Interhemispheric differences in polar stratospheric HNO3, H2O, ClOand O3. Science 267: 849-852.
Scharfen, G., R.G. Barry, D.A. Robinson, G. Kukla and M.C. Serreze,1987. Large-scale patterns of snow melt on Arctic sea ice mapped frommeteorological satellite imagery. Annals of Glaciology 9: 200-205.
Schauburger, G., 1992. Anisotropic model for the diffuse biologically-ef-fective irradiance of solar UV radiation on inclined surfaces. Theor.Appl. Climatol. 46: 45-51.
Schindler, D.W., S.E. Baylery, B.R. Parker, K.G. Beaty, D.R. Cruikshank,E.J. Fee, E.U. Schindler and M.P. Stainton, 1996b. The effects of cli-matic warming on the properties of boreal lakes and streams at theExperimental Lakes Area, Northwestern Ontario. Limnol. Oceanogr.41(5): 1004-1014.
Schindler, D.W., S.E. Baylery, P.J. Curtis, B.R. Parker, M.P. Stainton andC.A. Kelly, 1992. Natural and man-caused factors affecting the abun-dance and cycling of dissolved organic substances in precambrianshield lakes. Hydrobiologia 229: 1-21.
Schindler, D.W., K. Beaty, E.J. Fee, D.R. Cruishank, E.R. DeBruyn, D.L.Findlay, G.A. Lindsey, J.A. Shearer, M.P. Stainton and M.A. Turner,1990. Effects of climatic warming on the lakes of the central boreal for-est. Science 250: 967-970.
Schindler, D.W., P.J. Curtis, S.E. Baylery, B.R. Parker, K.G. Beaty and M.P.Stainton, 1997. Climate induced changes in the dissolved organic car-bon budgets of boreal lakes. Biogeochemistry 36: 9-28.
Schindler, D.W., P.J. Curtis, B. Parker and M.P. Stainton, 1996a. Conse-quences of climate warming and lake acidification for ultraviolet-B pen-etration in North American boreal lakes. Nature 379: 705-708.
Schindler, D.W., H.E. Welch, J. Kalff, G.J. Brunskill and N. Kritsch, 1974.Physical and chemical limnology of Char Lake, Cornwallis Island (75NLat.). J. Fish. Res. Board, Canada 31: 585-607.
Schledermann, P., 1980. Polynyas and prehistoric settlement patterns. Arc-tic 33: 292-302.
Schlesinger, M.E. and J.F.B. Mitchel, 1987. Climate model simulations ofequilibrium climate response to increased carbon dioxide. Review ofGeophysics 25: 760-798.
Schlesinger, W.H., 1977. Carbon balance in terrestrial detritus. Ann. Rev.Ecol. Syst. 8: 51-81.
Schmidt U. and A. Khedim, 1991. In situ measurements of carbon dioxidein the winter arctic vortex and at midlatitudes: an indicator of the ‘age’of stratospheric air. Geophys. Res. Lett. 18(4): 763-766.
Schofield, O., B.M.A. Kroon, B.B. Prézelin, 1995. Impact of ultraviolet-Bradiation on photosystem II activity and its relationship to the inhibi-tion of carbon fixation rates for Antarctic ice algae communities. J.
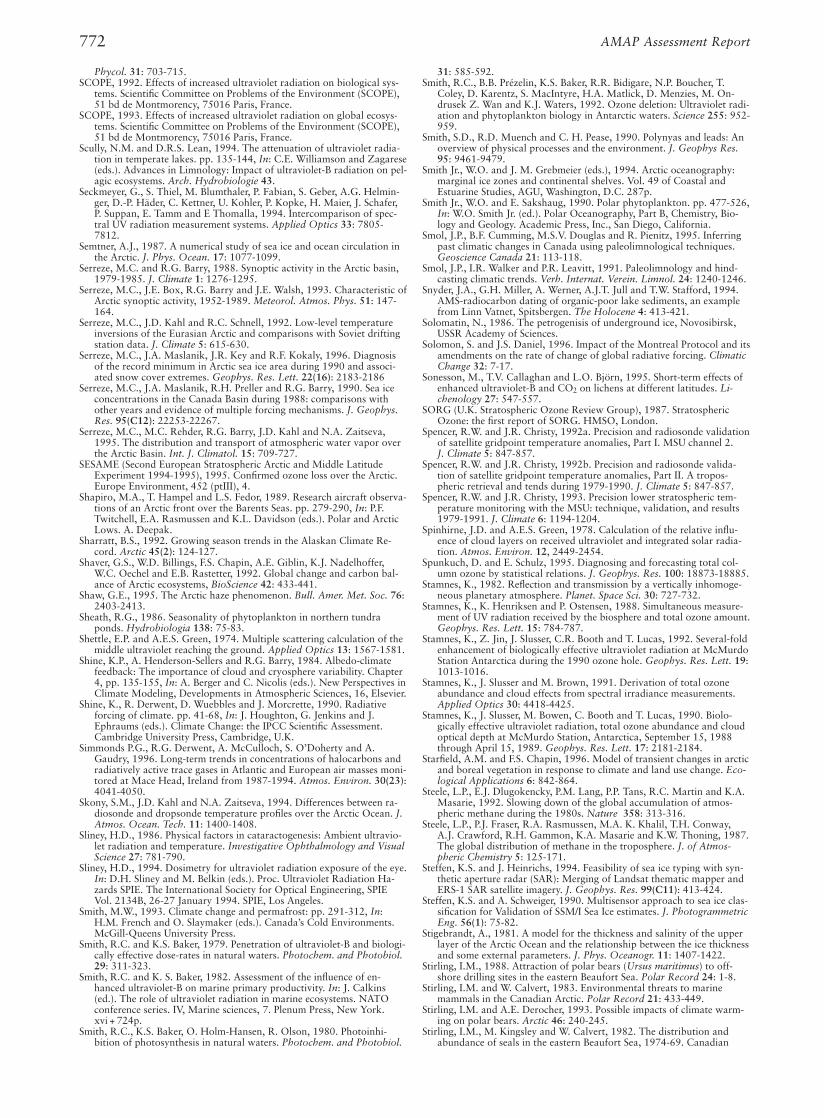
772 AMAP Assessment Report
31: 585-592.Smith, R.C., B.B. Prézelin, K.S. Baker, R.R. Bidigare, N.P. Boucher, T.
Coley, D. Karentz, S. MacIntyre, H.A. Matlick, D. Menzies, M. On-drusek Z. Wan and K.J. Waters, 1992. Ozone deletion: Ultraviolet radi-ation and phytoplankton biology in Antarctic waters. Science 255: 952-959.
Smith, S.D., R.D. Muench and C. H. Pease, 1990. Polynyas and leads: Anoverview of physical processes and the environment. J. Geophys Res.95: 9461-9479.
Smith Jr., W.O. and J. M. Grebmeier (eds.), 1994. Arctic oceanography:marginal ice zones and continental shelves. Vol. 49 of Coastal andEstuarine Studies, AGU, Washington, D.C. 287p.
Smith Jr., W.O. and E. Sakshaug, 1990. Polar phytoplankton. pp. 477-526,In: W.O. Smith Jr. (ed.). Polar Oceanography, Part B, Chemistry, Bio-logy and Geology. Academic Press, Inc., San Diego, California.
Smol, J.P., B.F. Cumming, M.S.V. Douglas and R. Pienitz, 1995. Inferringpast climatic changes in Canada using paleolimnological techniques.Geoscience Canada 21: 113-118.
Smol, J.P., I.R. Walker and P.R. Leavitt, 1991. Paleolimnology and hind-casting climatic trends. Verh. Internat. Verein. Limnol. 24: 1240-1246.
Snyder, J.A., G.H. Miller, A. Werner, A.J.T. Jull and T.W. Stafford, 1994.AMS-radiocarbon dating of organic-poor lake sediments, an examplefrom Linn Vatnet, Spitsbergen. The Holocene 4: 413-421.
Solomatin, N., 1986. The petrogenisis of underground ice, Novosibirsk,USSR Academy of Sciences.
Solomon, S. and J.S. Daniel, 1996. Impact of the Montreal Protocol and itsamendments on the rate of change of global radiative forcing. ClimaticChange 32: 7-17.
Sonesson, M., T.V. Callaghan and L.O. Björn, 1995. Short-term effects ofenhanced ultraviolet-B and CO2 on lichens at different latitudes. Li-chenology 27: 547-557.
SORG (U.K. Stratospheric Ozone Review Group), 1987. StratosphericOzone: the first report of SORG. HMSO, London.
Spencer, R.W. and J.R. Christy, 1992a. Precision and radiosonde validationof satellite gridpoint temperature anomalies, Part I. MSU channel 2.J. Climate 5: 847-857.
Spencer, R.W. and J.R. Christy, 1992b. Precision and radiosonde valida-tion of satellite gridpoint temperature anomalies, Part II. A tropos-pheric retrieval and tends during 1979-1990. J. Climate 5: 847-857.
Spencer, R.W. and J.R. Christy, 1993. Precision lower stratospheric tem-perature monitoring with the MSU: technique, validation, and results1979-1991. J. Climate 6: 1194-1204.
Spinhirne, J.D. and A.E.S. Green, 1978. Calculation of the relative influ-ence of cloud layers on received ultraviolet and integrated solar radia-tion. Atmos. Environ. 12, 2449-2454.
Spunkuch, D. and E. Schulz, 1995. Diagnosing and forecasting total col-umn ozone by statistical relations. J. Geophys. Res. 100: 18873-18885.
Stamnes, K., 1982. Reflection and transmission by a vertically inhomoge-neous planetary atmosphere. Planet. Space Sci. 30: 727-732.
Stamnes, K., K. Henriksen and P. Ostensen, 1988. Simultaneous measure-ment of UV radiation received by the biosphere and total ozone amount.Geophys. Res. Lett. 15: 784-787.
Stamnes, K., Z. Jin, J. Slusser, C.R. Booth and T. Lucas, 1992. Several-foldenhancement of biologically effective ultraviolet radiation at McMurdoStation Antarctica during the 1990 ozone hole. Geophys. Res. Lett. 19:1013-1016.
Stamnes, K., J. Slusser and M. Brown, 1991. Derivation of total ozoneabundance and cloud effects from spectral irradiance measurements.Applied Optics 30: 4418-4425.
Stamnes, K., J. Slusser, M. Bowen, C. Booth and T. Lucas, 1990. Biolo-gically effective ultraviolet radiation, total ozone abundance and cloudoptical depth at McMurdo Station, Antarctica, September 15, 1988through April 15, 1989. Geophys. Res. Lett. 17: 2181-2184.
Starfield, A.M. and F.S. Chapin, 1996. Model of transient changes in arcticand boreal vegetation in response to climate and land use change. Eco-logical Applications 6: 842-864.
Steele, L.P., E.J. Dlugokencky, P.M. Lang, P.P. Tans, R.C. Martin and K.A.Masarie, 1992. Slowing down of the global accumulation of atmos-pheric methane during the 1980s. Nature 358: 313-316.
Steele, L.P., P.J. Fraser, R.A. Rasmussen, M.A. K. Khalil, T.H. Conway,A.J. Crawford, R.H. Gammon, K.A. Masarie and K.W. Thoning, 1987.The global distribution of methane in the troposphere. J. of Atmos-pheric Chemistry 5: 125-171.
Steffen, K.S. and J. Heinrichs, 1994. Feasibility of sea ice typing with syn-thetic aperture radar (SAR): Merging of Landsat thematic mapper andERS-1 SAR satellite imagery. J. Geophys. Res. 99(C11): 413-424.
Steffen, K.S. and A. Schweiger, 1990. Multisensor approach to sea ice clas-sification for Validation of SSM/I Sea Ice estimates. J. PhotogrammetricEng. 56(1): 75-82.
Stigebrandt, A., 1981. A model for the thickness and salinity of the upperlayer of the Arctic Ocean and the relationship between the ice thicknessand some external parameters. J. Phys. Oceanogr. 11: 1407-1422.
Stirling, I.M., 1988. Attraction of polar bears (Ursus maritimus) to off-shore drilling sites in the eastern Beaufort Sea. Polar Record 24: 1-8.
Stirling, I.M. and W. Calvert, 1983. Environmental threats to marinemammals in the Canadian Arctic. Polar Record 21: 433-449.
Stirling, I.M. and A.E. Derocher, 1993. Possible impacts of climate warm-ing on polar bears. Arctic 46: 240-245.
Stirling, I.M., M. Kingsley and W. Calvert, 1982. The distribution andabundance of seals in the eastern Beaufort Sea, 1974-69. Canadian
Phycol. 31: 703-715.SCOPE, 1992. Effects of increased ultraviolet radiation on biological sys-
tems. Scientific Committee on Problems of the Environment (SCOPE),51 bd de Montmorency, 75016 Paris, France.
SCOPE, 1993. Effects of increased ultraviolet radiation on global ecosys-tems. Scientific Committee on Problems of the Environment (SCOPE),51 bd de Montmorency, 75016 Paris, France.
Scully, N.M. and D.R.S. Lean, 1994. The attenuation of ultraviolet radia-tion in temperate lakes. pp. 135-144, In: C.E. Williamson and Zagarese(eds.). Advances in Limnology: Impact of ultraviolet-B radiation on pel-agic ecosystems. Arch. Hydrobiologie 43.
Seckmeyer, G., S. Thiel, M. Blumthaler, P. Fabian, S. Geber, A.G. Helmin-ger, D.-P. Häder, C. Kettner, U. Kohler, P. Kopke, H. Maier, J. Schafer,P. Suppan, E. Tamm and E Thomalla, 1994. Intercomparison of spec-tral UV radiation measurement systems. Applied Optics 33: 7805-7812.
Semtner, A.J., 1987. A numerical study of sea ice and ocean circulation inthe Arctic. J. Phys. Ocean. 17: 1077-1099.
Serreze, M.C. and R.G. Barry, 1988. Synoptic activity in the Arctic basin,1979-1985. J. Climate 1: 1276-1295.
Serreze, M.C., J.E. Box, R.G. Barry and J.E. Walsh, 1993. Characteristic ofArctic synoptic activity, 1952-1989. Meteorol. Atmos. Phys. 51: 147-164.
Serreze, M.C., J.D. Kahl and R.C. Schnell, 1992. Low-level temperatureinversions of the Eurasian Arctic and comparisons with Soviet driftingstation data. J. Climate 5: 615-630.
Serreze, M.C., J.A. Maslanik, J.R. Key and R.F. Kokaly, 1996. Diagnosisof the record minimum in Arctic sea ice area during 1990 and associ-ated snow cover extremes. Geophys. Res. Lett. 22(16): 2183-2186
Serreze, M.C., J.A. Maslanik, R.H. Preller and R.G. Barry, 1990. Sea iceconcentrations in the Canada Basin during 1988: comparisons withother years and evidence of multiple forcing mechanisms. J. Geophys.Res. 95(C12): 22253-22267.
Serreze, M.C., M.C. Rehder, R.G. Barry, J.D. Kahl and N.A. Zaitseva,1995. The distribution and transport of atmospheric water vapor overthe Arctic Basin. Int. J. Climatol. 15: 709-727.
SESAME (Second European Stratospheric Arctic and Middle LatitudeExperiment 1994-1995), 1995. Confirmed ozone loss over the Arctic.Europe Environment, 452 (ptIII), 4.
Shapiro, M.A., T. Hampel and L.S. Fedor, 1989. Research aircraft observa-tions of an Arctic front over the Barents Seas. pp. 279-290, In: P.F.Twitchell, E.A. Rasmussen and K.L. Davidson (eds.). Polar and ArcticLows. A. Deepak.
Sharratt, B.S., 1992. Growing season trends in the Alaskan Climate Re-cord. Arctic 45(2): 124-127.
Shaver, G.S., W.D. Billings, F.S. Chapin, A.E. Giblin, K.J. Nadelhoffer,W.C. Oechel and E.B. Rastetter, 1992. Global change and carbon bal-ance of Arctic ecosystems, BioScience 42: 433-441.
Shaw, G.E., 1995. The Arctic haze phenomenon. Bull. Amer. Met. Soc. 76:2403-2413.
Sheath, R.G., 1986. Seasonality of phytoplankton in northern tundraponds. Hydrobiologia 138: 75-83.
Shettle, E.P. and A.E.S. Green, 1974. Multiple scattering calculation of themiddle ultraviolet reaching the ground. Applied Optics 13: 1567-1581.
Shine, K.P., A. Henderson-Sellers and R.G. Barry, 1984. Albedo-climatefeedback: The importance of cloud and cryosphere variability. Chapter4, pp. 135-155, In: A. Berger and C. Nicolis (eds.). New Perspectives inClimate Modeling, Developments in Atmospheric Sciences, 16, Elsevier.
Shine, K., R. Derwent, D. Wuebbles and J. Morcrette, 1990. Radiativeforcing of climate. pp. 41-68, In: J. Houghton, G. Jenkins and J.Ephraums (eds.). Climate Change: the IPCC Scientific Assessment.Cambridge University Press, Cambridge, U.K.
Simmonds P.G., R.G. Derwent, A. McCulloch, S. O’Doherty and A.Gaudry, 1996. Long-term trends in concentrations of halocarbons andradiatively active trace gases in Atlantic and European air masses moni-tored at Mace Head, Ireland from 1987-1994. Atmos. Environ. 30(23):4041-4050.
Skony, S.M., J.D. Kahl and N.A. Zaitseva, 1994. Differences between ra-diosonde and dropsonde temperature profiles over the Arctic Ocean. J.Atmos. Ocean. Tech. 11: 1400-1408.
Sliney, H.D., 1986. Physical factors in cataractogenesis: Ambient ultravio-let radiation and temperature. Investigative Ophthalmology and VisualScience 27: 781-790.
Sliney, H.D., 1994. Dosimetry for ultraviolet radiation exposure of the eye.In: D.H. Sliney and M. Belkin (eds.). Proc. Ultraviolet Radiation Ha-zards SPIE. The International Society for Optical Engineering, SPIEVol. 2134B, 26-27 January 1994. SPIE, Los Angeles.
Smith, M.W., 1993. Climate change and permafrost: pp. 291-312, In:H.M. French and O. Slaymaker (eds.). Canada’s Cold Environments.McGill-Queens University Press.
Smith, R.C. and K.S. Baker, 1979. Penetration of ultraviolet-B and biologi-cally effective dose-rates in natural waters. Photochem. and Photobiol.29: 311-323.
Smith, R.C. and K. S. Baker, 1982. Assessment of the influence of en-hanced ultraviolet-B on marine primary productivity. In: J. Calkins(ed.). The role of ultraviolet radiation in marine ecosystems. NATOconference series. IV, Marine sciences, 7. Plenum Press, New York.xvi + 724p.
Smith, R.C., K.S. Baker, O. Holm-Hansen, R. Olson, 1980. Photoinhi-bition of photosynthesis in natural waters. Photochem. and Photobiol.
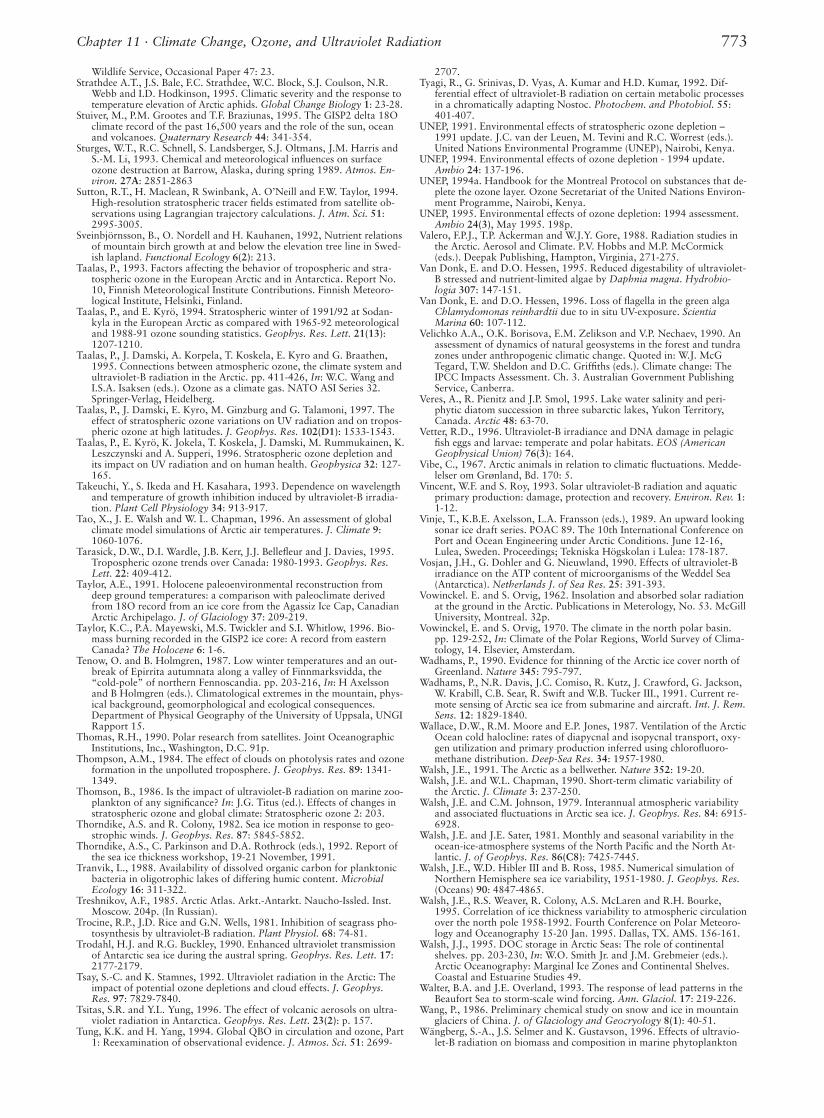
773Chapter 11 · Climate Change, Ozone, and Ultraviolet Radiation
Wildlife Service, Occasional Paper 47: 23.Strathdee A.T., J.S. Bale, F.C. Strathdee, W.C. Block, S.J. Coulson, N.R.
Webb and I.D. Hodkinson, 1995. Climatic severity and the response totemperature elevation of Arctic aphids. Global Change Biology 1: 23-28.
Stuiver, M., P.M. Grootes and T.F. Braziunas, 1995. The GISP2 delta 18Oclimate record of the past 16,500 years and the role of the sun, oceanand volcanoes. Quaternary Research 44: 341-354.
Sturges, W.T., R.C. Schnell, S. Landsberger, S.J. Oltmans, J.M. Harris andS.-M. Li, 1993. Chemical and meteorological influences on surfaceozone destruction at Barrow, Alaska, during spring 1989. Atmos. En-viron. 27A: 2851-2863
Sutton, R.T., H. Maclean, R Swinbank, A. O’Neill and F.W. Taylor, 1994.High-resolution stratospheric tracer fields estimated from satellite ob-servations using Lagrangian trajectory calculations. J. Atm. Sci. 51:2995-3005.
Sveinbjörnsson, B., O. Nordell and H. Kauhanen, 1992, Nutrient relationsof mountain birch growth at and below the elevation tree line in Swed-ish lapland. Functional Ecology 6(2): 213.
Taalas, P., 1993. Factors affecting the behavior of tropospheric and stra-tospheric ozone in the European Arctic and in Antarctica. Report No.10, Finnish Meteorological Institute Contributions. Finnish Meteoro-logical Institute, Helsinki, Finland.
Taalas, P., and E. Kyrö, 1994. Stratospheric winter of 1991/92 at Sodan-kyla in the European Arctic as compared with 1965-92 meteorologicaland 1988-91 ozone sounding statistics. Geophys. Res. Lett. 21(13):1207-1210.
Taalas, P., J. Damski, A. Korpela, T. Koskela, E. Kyro and G. Braathen,1995. Connections between atmospheric ozone, the climate system andultraviolet-B radiation in the Arctic. pp. 411-426, In: W.C. Wang andI.S.A. Isaksen (eds.). Ozone as a climate gas. NATO ASI Series 32.Springer-Verlag, Heidelberg.
Taalas, P., J. Damski, E. Kyro, M. Ginzburg and G. Talamoni, 1997. Theeffect of stratospheric ozone variations on UV radiation and on tropos-pheric ozone at high latitudes. J. Geophys. Res. 102(D1): 1533-1543.
Taalas, P., E. Kyrö, K. Jokela, T. Koskela, J. Damski, M. Rummukainen, K.Leszczynski and A. Supperi, 1996. Stratospheric ozone depletion andits impact on UV radiation and on human health. Geophysica 32: 127-165.
Takeuchi, Y., S. Ikeda and H. Kasahara, 1993. Dependence on wavelengthand temperature of growth inhibition induced by ultraviolet-B irradia-tion. Plant Cell Physiology 34: 913-917.
Tao, X., J. E. Walsh and W. L. Chapman, 1996. An assessment of globalclimate model simulations of Arctic air temperatures. J. Climate 9:1060-1076.
Tarasick, D.W., D.I. Wardle, J.B. Kerr, J.J. Bellefleur and J. Davies, 1995.Tropospheric ozone trends over Canada: 1980-1993. Geophys. Res.Lett. 22: 409-412.
Taylor, A.E., 1991. Holocene paleoenvironmental reconstruction fromdeep ground temperatures: a comparison with paleoclimate derivedfrom 18O record from an ice core from the Agassiz Ice Cap, CanadianArctic Archipelago. J. of Glaciology 37: 209-219.
Taylor, K.C., P.A. Mayewski, M.S. Twickler and S.I. Whitlow, 1996. Bio-mass burning recorded in the GISP2 ice core: A record from easternCanada? The Holocene 6: 1-6.
Tenow, O. and B. Holmgren, 1987. Low winter temperatures and an out-break of Epirrita autumnata along a valley of Finnmarksvidda, the“cold-pole” of northern Fennoscandia. pp. 203-216, In: H Axelssonand B Holmgren (eds.). Climatological extremes in the mountain, phys-ical background, geomorphological and ecological consequences.Department of Physical Geography of the University of Uppsala, UNGIRapport 15.
Thomas, R.H., 1990. Polar research from satellites. Joint OceanographicInstitutions, Inc., Washington, D.C. 91p.
Thompson, A.M., 1984. The effect of clouds on photolysis rates and ozoneformation in the unpolluted troposphere. J. Geophys. Res. 89: 1341-1349.
Thomson, B., 1986. Is the impact of ultraviolet-B radiation on marine zoo-plankton of any significance? In: J.G. Titus (ed.). Effects of changes instratospheric ozone and global climate: Stratospheric ozone 2: 203.
Thorndike, A.S. and R. Colony, 1982. Sea ice motion in response to geo-strophic winds. J. Geophys. Res. 87: 5845-5852.
Thorndike, A.S., C. Parkinson and D.A. Rothrock (eds.), 1992. Report ofthe sea ice thickness workshop, 19-21 November, 1991.
Tranvik, L., 1988. Availability of dissolved organic carbon for planktonicbacteria in oligotrophic lakes of differing humic content. MicrobialEcology 16: 311-322.
Treshnikov, A.F., 1985. Arctic Atlas. Arkt.-Antarkt. Naucho-Issled. Inst.Moscow. 204p. (In Russian).
Trocine, R.P., J.D. Rice and G.N. Wells, 1981. Inhibition of seagrass pho-tosynthesis by ultraviolet-B radiation. Plant Physiol. 68: 74-81.
Trodahl, H.J. and R.G. Buckley, 1990. Enhanced ultraviolet transmissionof Antarctic sea ice during the austral spring. Geophys. Res. Lett. 17:2177-2179.
Tsay, S.-C. and K. Stamnes, 1992. Ultraviolet radiation in the Arctic: Theimpact of potential ozone depletions and cloud effects. J. Geophys.Res. 97: 7829-7840.
Tsitas, S.R. and Y.L. Yung, 1996. The effect of volcanic aerosols on ultra-violet radiation in Antarctica. Geophys. Res. Lett. 23(2): p. 157.
Tung, K.K. and H. Yang, 1994. Global QBO in circulation and ozone, Part1: Reexamination of observational evidence. J. Atmos. Sci. 51: 2699-
2707.Tyagi, R., G. Srinivas, D. Vyas, A. Kumar and H.D. Kumar, 1992. Dif-
ferential effect of ultraviolet-B radiation on certain metabolic processesin a chromatically adapting Nostoc. Photochem. and Photobiol. 55:401-407.
UNEP, 1991. Environmental effects of stratospheric ozone depletion –1991 update. J.C. van der Leuen, M. Tevini and R.C. Worrest (eds.).United Nations Environmental Programme (UNEP), Nairobi, Kenya.
UNEP, 1994. Environmental effects of ozone depletion - 1994 update.Ambio 24: 137-196.
UNEP, 1994a. Handbook for the Montreal Protocol on substances that de-plete the ozone layer. Ozone Secretariat of the United Nations Environ-ment Programme, Nairobi, Kenya.
UNEP, 1995. Environmental effects of ozone depletion: 1994 assessment.Ambio 24(3), May 1995. 198p.
Valero, F.P.J., T.P. Ackerman and W.J.Y. Gore, 1988. Radiation studies inthe Arctic. Aerosol and Climate. P.V. Hobbs and M.P. McCormick(eds.). Deepak Publishing, Hampton, Virginia, 271-275.
Van Donk, E. and D.O. Hessen, 1995. Reduced digestability of ultraviolet-B stressed and nutrient-limited algae by Daphnia magna. Hydrobio-logia 307: 147-151.
Van Donk, E. and D.O. Hessen, 1996. Loss of flagella in the green algaChlamydomonas reinhardtii due to in situ UV-exposure. ScientiaMarina 60: 107-112.
Velichko A.A., O.K. Borisova, E.M. Zelikson and V.P. Nechaev, 1990. Anassessment of dynamics of natural geosystems in the forest and tundrazones under anthropogenic climatic change. Quoted in: W.J. McGTegard, T.W. Sheldon and D.C. Griffiths (eds.). Climate change: TheIPCC Impacts Assessment. Ch. 3. Australian Government PublishingService, Canberra.
Veres, A., R. Pienitz and J.P. Smol, 1995. Lake water salinity and peri-phytic diatom succession in three subarctic lakes, Yukon Territory,Canada. Arctic 48: 63-70.
Vetter, R.D., 1996. Ultraviolet-B irradiance and DNA damage in pelagicfish eggs and larvae: temperate and polar habitats. EOS (AmericanGeophysical Union) 76(3): 164.
Vibe, C., 1967. Arctic animals in relation to climatic fluctuations. Medde-lelser om Grønland, Bd. 170: 5.
Vincent, W.F. and S. Roy, 1993. Solar ultraviolet-B radiation and aquaticprimary production: damage, protection and recovery. Environ. Rev. 1:1-12.
Vinje, T., K.B.E. Axelsson, L.A. Fransson (eds.), 1989. An upward lookingsonar ice draft series. POAC 89. The 10th International Conference onPort and Ocean Engineering under Arctic Conditions. June 12-16,Lulea, Sweden. Proceedings; Tekniska Högskolan i Lulea: 178-187.
Vosjan, J.H., G. Dohler and G. Nieuwland, 1990. Effects of ultraviolet-Birradiance on the ATP content of microorganisms of the Weddel Sea(Antarctica). Netherlands J. of Sea Res. 25: 391-393.
Vowinckel. E. and S. Orvig, 1962. Insolation and absorbed solar radiationat the ground in the Arctic. Publications in Meterology, No. 53. McGillUniversity, Montreal. 32p.
Vowinckel, E. and S. Orvig, 1970. The climate in the north polar basin.pp. 129-252, In: Climate of the Polar Regions, World Survey of Clima-tology, 14. Elsevier, Amsterdam.
Wadhams, P., 1990. Evidence for thinning of the Arctic ice cover north ofGreenland. Nature 345: 795-797.
Wadhams, P., N.R. Davis, J.C. Comiso, R. Kutz, J. Crawford, G. Jackson,W. Krabill, C.B. Sear, R. Swift and W.B. Tucker III., 1991. Current re-mote sensing of Arctic sea ice from submarine and aircraft. Int. J. Rem.Sens. 12: 1829-1840.
Wallace, D.W., R.M. Moore and E.P. Jones, 1987. Ventilation of the ArcticOcean cold halocline: rates of diapycnal and isopycnal transport, oxy-gen utilization and primary production inferred using chlorofluoro-methane distribution. Deep-Sea Res. 34: 1957-1980.
Walsh, J.E., 1991. The Arctic as a bellwether. Nature 352: 19-20.Walsh, J.E. and W.L. Chapman, 1990. Short-term climatic variability of
the Arctic. J. Climate 3: 237-250.Walsh, J.E. and C.M. Johnson, 1979. Interannual atmospheric variability
and associated fluctuations in Arctic sea ice. J. Geophys. Res. 84: 6915-6928.
Walsh, J.E. and J.E. Sater, 1981. Monthly and seasonal variability in theocean-ice-atmosphere systems of the North Pacific and the North At-lantic. J. of Geophys. Res. 86(C8): 7425-7445.
Walsh, J.E., W.D. Hibler III and B. Ross, 1985. Numerical simulation ofNorthern Hemisphere sea ice variability, 1951-1980. J. Geophys. Res.(Oceans) 90: 4847-4865.
Walsh, J.E., R.S. Weaver, R. Colony, A.S. McLaren and R.H. Bourke,1995. Correlation of ice thickness variability to atmospheric circulationover the north pole 1958-1992. Fourth Conference on Polar Meteoro-logy and Oceanography 15-20 Jan. 1995. Dallas, TX. AMS. 156-161.
Walsh, J.J., 1995. DOC storage in Arctic Seas: The role of continentalshelves. pp. 203-230, In: W.O. Smith Jr. and J.M. Grebmeier (eds.).Arctic Oceanography: Marginal Ice Zones and Continental Shelves.Coastal and Estuarine Studies 49.
Walter, B.A. and J.E. Overland, 1993. The response of lead patterns in theBeaufort Sea to storm-scale wind forcing. Ann. Glaciol. 17: 219-226.
Wang, P., 1986. Preliminary chemical study on snow and ice in mountainglaciers of China. J. of Glaciology and Geocryology 8(1): 40-51.
Wängberg, S.-A., J.S. Selmer and K. Gustavson, 1996. Effects of ultravio-let-B radiation on biomass and composition in marine phytoplankton
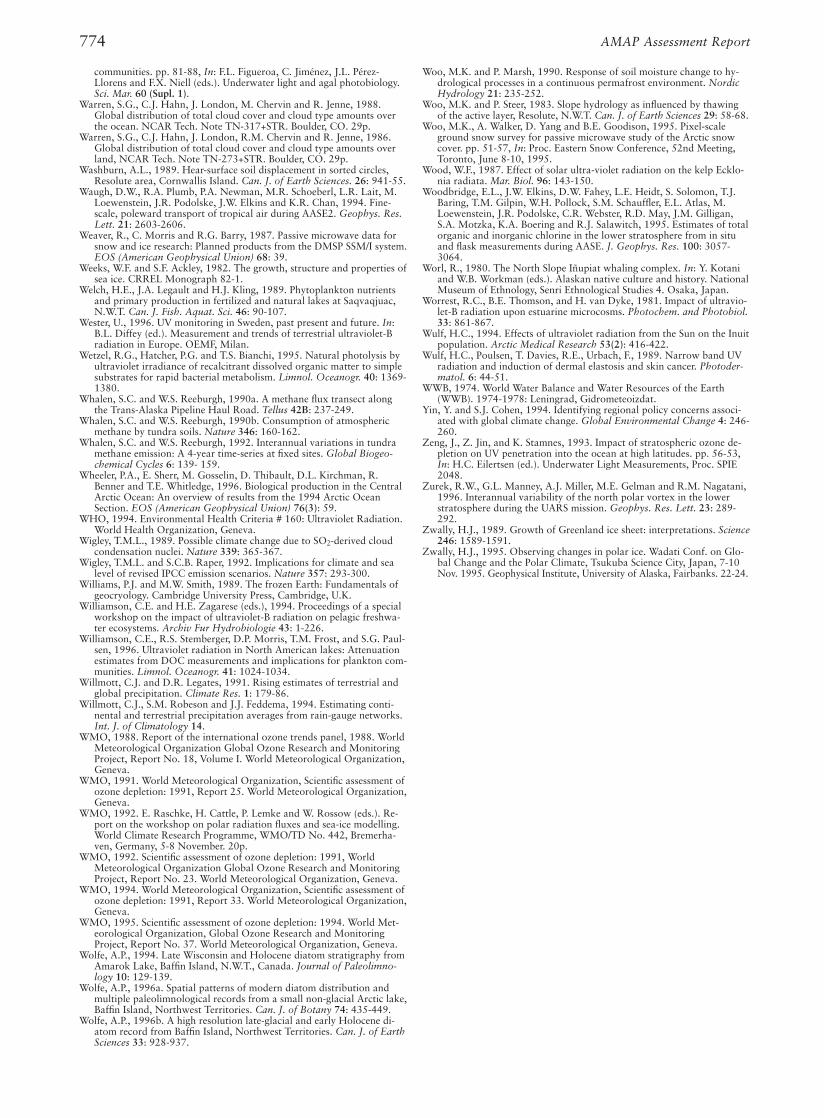
774 AMAP Assessment Report
Woo, M.K. and P. Marsh, 1990. Response of soil moisture change to hy-drological processes in a continuous permafrost environment. NordicHydrology 21: 235-252.
Woo, M.K. and P. Steer, 1983. Slope hydrology as influenced by thawingof the active layer, Resolute, N.W.T. Can. J. of Earth Sciences 29: 58-68.
Woo, M.K., A. Walker, D. Yang and B.E. Goodison, 1995. Pixel-scaleground snow survey for passive microwave study of the Arctic snowcover. pp. 51-57, In: Proc. Eastern Snow Conference, 52nd Meeting,Toronto, June 8-10, 1995.
Wood, W.F., 1987. Effect of solar ultra-violet radiation on the kelp Ecklo-nia radiata. Mar. Biol. 96: 143-150.
Woodbridge, E.L., J.W. Elkins, D.W. Fahey, L.E. Heidt, S. Solomon, T.J.Baring, T.M. Gilpin, W.H. Pollock, S.M. Schauffler, E.L. Atlas, M.Loewenstein, J.R. Podolske, C.R. Webster, R.D. May, J.M. Gilligan,S.A. Motzka, K.A. Boering and R.J. Salawitch, 1995. Estimates of totalorganic and inorganic chlorine in the lower stratosphere from in situand flask measurements during AASE. J. Geophys. Res. 100: 3057-3064.
Worl, R., 1980. The North Slope Iñupiat whaling complex. In: Y. Kotaniand W.B. Workman (eds.). Alaskan native culture and history. NationalMuseum of Ethnology, Senri Ethnological Studies 4. Osaka, Japan.
Worrest, R.C., B.E. Thomson, and H. van Dyke, 1981. Impact of ultravio-let-B radiation upon estuarine microcosms. Photochem. and Photobiol.33: 861-867.
Wulf, H.C., 1994. Effects of ultraviolet radiation from the Sun on the Inuitpopulation. Arctic Medical Research 53(2): 416-422.
Wulf, H.C., Poulsen, T. Davies, R.E., Urbach, F., 1989. Narrow band UVradiation and induction of dermal elastosis and skin cancer. Photoder-matol. 6: 44-51.
WWB, 1974. World Water Balance and Water Resources of the Earth(WWB). 1974-1978: Leningrad, Gidrometeoizdat.
Yin, Y. and S.J. Cohen, 1994. Identifying regional policy concerns associ-ated with global climate change. Global Environmental Change 4: 246-260.
Zeng, J., Z. Jin, and K. Stamnes, 1993. Impact of stratospheric ozone de-pletion on UV penetration into the ocean at high latitudes. pp. 56-53,In: H.C. Eilertsen (ed.). Underwater Light Measurements, Proc. SPIE2048.
Zurek, R.W., G.L. Manney, A.J. Miller, M.E. Gelman and R.M. Nagatani,1996. Interannual variability of the north polar vortex in the lowerstratosphere during the UARS mission. Geophys. Res. Lett. 23: 289-292.
Zwally, H.J., 1989. Growth of Greenland ice sheet: interpretations. Science246: 1589-1591.
Zwally, H.J., 1995. Observing changes in polar ice. Wadati Conf. on Glo-bal Change and the Polar Climate, Tsukuba Science City, Japan, 7-10Nov. 1995. Geophysical Institute, University of Alaska, Fairbanks. 22-24.
communities. pp. 81-88, In: F.L. Figueroa, C. Jiménez, J.L. Pérez-Llorens and F.X. Niell (eds.). Underwater light and agal photobiology.Sci. Mar. 60 (Supl. 1).
Warren, S.G., C.J. Hahn, J. London, M. Chervin and R. Jenne, 1988.Global distribution of total cloud cover and cloud type amounts overthe ocean. NCAR Tech. Note TN-317+STR. Boulder, CO. 29p.
Warren, S.G., C.J. Hahn, J. London, R.M. Chervin and R. Jenne, 1986.Global distribution of total cloud cover and cloud type amounts overland, NCAR Tech. Note TN-273+STR. Boulder, CO. 29p.
Washburn, A.L., 1989. Hear-surface soil displacement in sorted circles,Resolute area, Cornwallis Island. Can. J. of Earth Sciences. 26: 941-55.
Waugh, D.W., R.A. Plumb, P.A. Newman, M.R. Schoeberl, L.R. Lait, M.Loewenstein, J.R. Podolske, J.W. Elkins and K.R. Chan, 1994. Fine-scale, poleward transport of tropical air during AASE2. Geophys. Res.Lett. 21: 2603-2606.
Weaver, R., C. Morris and R.G. Barry, 1987. Passive microwave data forsnow and ice research: Planned products from the DMSP SSM/I system.EOS (American Geophysical Union) 68: 39.
Weeks, W.F. and S.F. Ackley, 1982. The growth, structure and properties ofsea ice. CRREL Monograph 82-1.
Welch, H.E., J.A. Legault and H.J. Kling, 1989. Phytoplankton nutrientsand primary production in fertilized and natural lakes at Saqvaqjuac,N.W.T. Can. J. Fish. Aquat. Sci. 46: 90-107.
Wester, U., 1996. UV monitoring in Sweden, past present and future. In:B.L. Diffey (ed.). Measurement and trends of terrestrial ultraviolet-Bradiation in Europe. OEMF, Milan.
Wetzel, R.G., Hatcher, P.G. and T.S. Bianchi, 1995. Natural photolysis byultraviolet irradiance of recalcitrant dissolved organic matter to simplesubstrates for rapid bacterial metabolism. Limnol. Oceanogr. 40: 1369-1380.
Whalen, S.C. and W.S. Reeburgh, 1990a. A methane flux transect alongthe Trans-Alaska Pipeline Haul Road. Tellus 42B: 237-249.
Whalen, S.C. and W.S. Reeburgh, 1990b. Consumption of atmosphericmethane by tundra soils. Nature 346: 160-162.
Whalen, S.C. and W.S. Reeburgh, 1992. Interannual variations in tundramethane emission: A 4-year time-series at fixed sites. Global Biogeo-chemical Cycles 6: 139- 159.
Wheeler, P.A., E. Sherr, M. Gosselin, D. Thibault, D.L. Kirchman, R.Benner and T.E. Whitledge, 1996. Biological production in the CentralArctic Ocean: An overview of results from the 1994 Arctic OceanSection. EOS (American Geophysical Union) 76(3): 59.
WHO, 1994. Environmental Health Criteria # 160: Ultraviolet Radiation.World Health Organization, Geneva.
Wigley, T.M.L., 1989. Possible climate change due to SO2-derived cloudcondensation nuclei. Nature 339: 365-367.
Wigley, T.M.L. and S.C.B. Raper, 1992. Implications for climate and sealevel of revised IPCC emission scenarios. Nature 357: 293-300.
Williams, P.J. and M.W. Smith, 1989. The frozen Earth: Fundamentals ofgeocryology. Cambridge University Press, Cambridge, U.K.
Williamson, C.E. and H.E. Zagarese (eds.), 1994. Proceedings of a specialworkshop on the impact of ultraviolet-B radiation on pelagic freshwa-ter ecosystems. Archiv Fur Hydrobiologie 43: 1-226.
Williamson, C.E., R.S. Stemberger, D.P. Morris, T.M. Frost, and S.G. Paul-sen, 1996. Ultraviolet radiation in North American lakes: Attenuationestimates from DOC measurements and implications for plankton com-munities. Limnol. Oceanogr. 41: 1024-1034.
Willmott, C.J. and D.R. Legates, 1991. Rising estimates of terrestrial andglobal precipitation. Climate Res. 1: 179-86.
Willmott, C.J., S.M. Robeson and J.J. Feddema, 1994. Estimating conti-nental and terrestrial precipitation averages from rain-gauge networks.Int. J. of Climatology 14.
WMO, 1988. Report of the international ozone trends panel, 1988. WorldMeteorological Organization Global Ozone Research and MonitoringProject, Report No. 18, Volume I. World Meteorological Organization,Geneva.
WMO, 1991. World Meteorological Organization, Scientific assessment ofozone depletion: 1991, Report 25. World Meteorological Organization,Geneva.
WMO, 1992. E. Raschke, H. Cattle, P. Lemke and W. Rossow (eds.). Re-port on the workshop on polar radiation fluxes and sea-ice modelling.World Climate Research Programme, WMO/TD No. 442, Bremerha-ven, Germany, 5-8 November. 20p.
WMO, 1992. Scientific assessment of ozone depletion: 1991, WorldMeteorological Organization Global Ozone Research and MonitoringProject, Report No. 23. World Meteorological Organization, Geneva.
WMO, 1994. World Meteorological Organization, Scientific assessment ofozone depletion: 1991, Report 33. World Meteorological Organization,Geneva.
WMO, 1995. Scientific assessment of ozone depletion: 1994. World Met-eorological Organization, Global Ozone Research and MonitoringProject, Report No. 37. World Meteorological Organization, Geneva.
Wolfe, A.P., 1994. Late Wisconsin and Holocene diatom stratigraphy fromAmarok Lake, Baffin Island, N.W.T., Canada. Journal of Paleolimno-logy 10: 129-139.
Wolfe, A.P., 1996a. Spatial patterns of modern diatom distribution andmultiple paleolimnological records from a small non-glacial Arctic lake,Baffin Island, Northwest Territories. Can. J. of Botany 74: 435-449.
Wolfe, A.P., 1996b. A high resolution late-glacial and early Holocene di-atom record from Baffin Island, Northwest Territories. Can. J. of EarthSciences 33: 928-937.