a9-119-30c.pdf - california air resources board
TRANSCRIPT
SECTION 9
FOOD AND AGRICULTURE PROCESSING
9.1 INTRODUCTION
The processing of agricultural products includes many operations which produce fine particle emissions. These include drying, shipping, conveying, cleaning, milling, and grinding._ There are many variables which affect the fine particle emissions from a given process. Some of these variables are: the type of crop being processed, its growing location and methods, the method used to harvest the crop, and the amount of cleaning which has already been done.
The major point sources of fine particle emissions in the food and agricultural processing industries in California, as determined from EIS data (California Air Resources Board, 1980), are covered in this section. They are:
1. Rice drying 2. Grain drying 3. Alfalfa drying 4. Grain and feed milling 5. Cotton ginning
Shipping and handling operations are major sources of dust. However, only 12-15%. by weight are less than 3µm in diameter according to Fa rant et al. (197 8).
9.2 RICE DRYING 9.2.1 Process Description
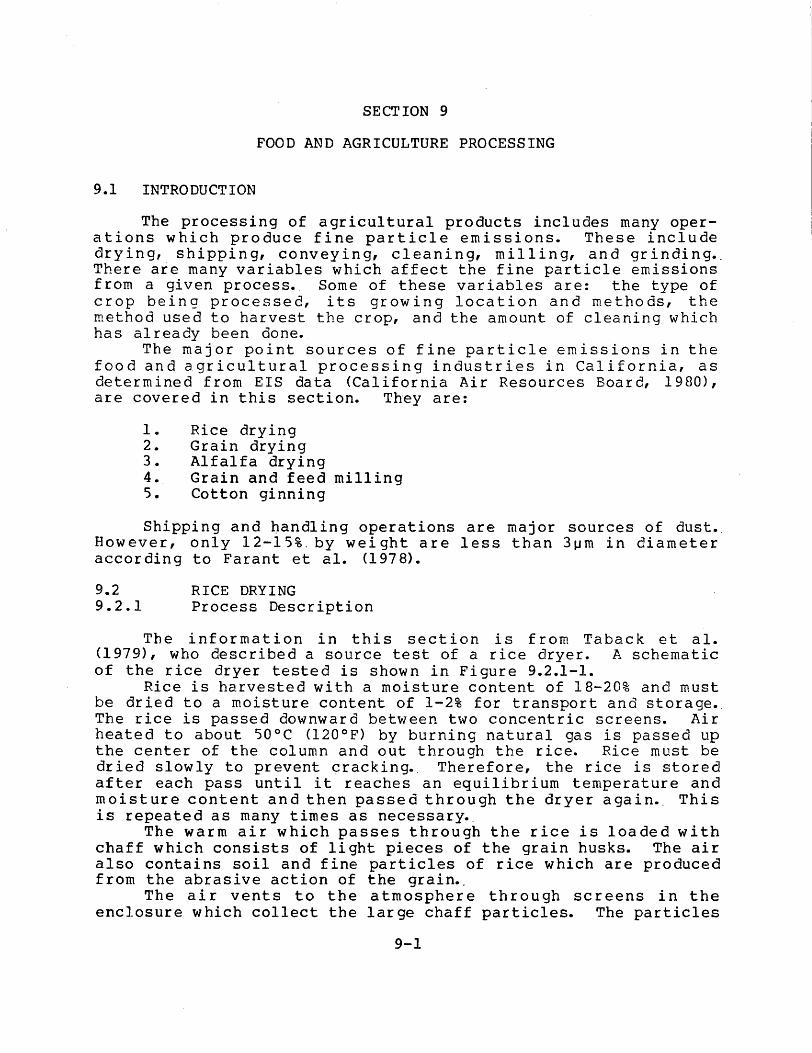
The information in this section is from Taback et al. (1979), who described a source test of a rice dryer. A schematic of the rice dryer tested is shown in Figure 9.2.1-1.
Rice is harvested with a moisture content of 18-20% and must be dried to a moisture content of 1-2% for transport and storage•. The rice is passed downward between two concentric screens. Air heated to about 50°C (120°F) by burning natural gas is passed up the center of the column and out through the rice. Rice must be dried slowly to prevent crackin~ Therefore, the rice is stored after each pass until it reaches an equilibrium temperature and moisture content and then passed through the dryer again._ This is repeated as many times as necessary._
The warm air which passes through the rice is loaded with chaff which consists of light pieces of the grain husks. The air also contains soil and fine particles of rice which are produced from the abrasive action of the grain._
The air vents to the atmosphere through screens in the enclosure which collect the large chaff particles. The particles
9-1
I..O I
N
Rice from
_...,~
Enclosed Room
•----.u:o
It H fl
Vacuum Wand-Collects Chaff from Screen Screen-Vents to Atmosphere
.. ..
.... .. 11,c..,~,c1-;s;, ,,_-,,-," ,-. To Storage Chaff
Figure 9.2.1-1. Rice dryer (Taback et al., 1979).
on the screens are removed by vacuum wands and collected by cyclones._ The finer particles are exhausted to the atmosphere._
9.2.2 Source Characteristics
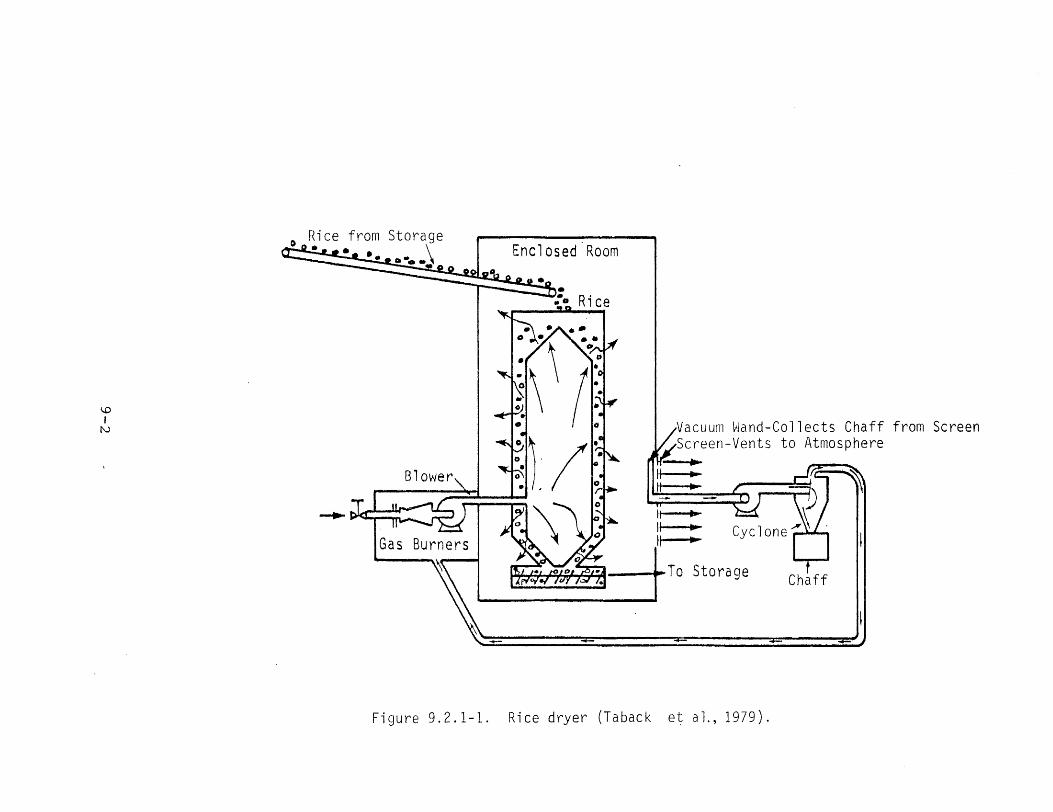
Figure 9.2.2-1 shows size distribution data for dust sampled at a rice dryer._ The source was uncontrolled, however, some of the chaff was collected by screen vents as described by Taback et a 1. (1 9 7 9) • . Tab 1 e 9. 2. 2-1 shows the chemica 1 composition of the particles collected in this test •. Other particle characteristics are shown in Table 9.2.2-2. Gas characteristics for rice drying are given in Table 9.2.2-3.
9.2.3 Control Technology
The cyclone is the primary control device used in rice drying and in most food and agricultural processing operations. Cyclones are not efficient collection devices for fine particles (see Section 7). There can also be a problem in containing the exhaust air. In the case depicted in Figure 9.2.1-1, most of the exhaust air was vented to the atmosphere rather than being drawn through the cyclone._
9.3 GRAIN DRYING 9.3.1 Process Description
Grain dryers are used at elevators, feed mills, and large farms to remove ex·cess moisture from the grain prior to storage._ Column dryers and tray dryers are used for grain drying._ The column dryers are similar to the rice dryer described in Section 9.2.1. In tray dryers, the grain is placed on trays in the dryer. Heated air is circulated over the wet grain until the desired moisture content is reached•. According to Danielson Cl973), tray dryers emit negligible amounts of dust•.
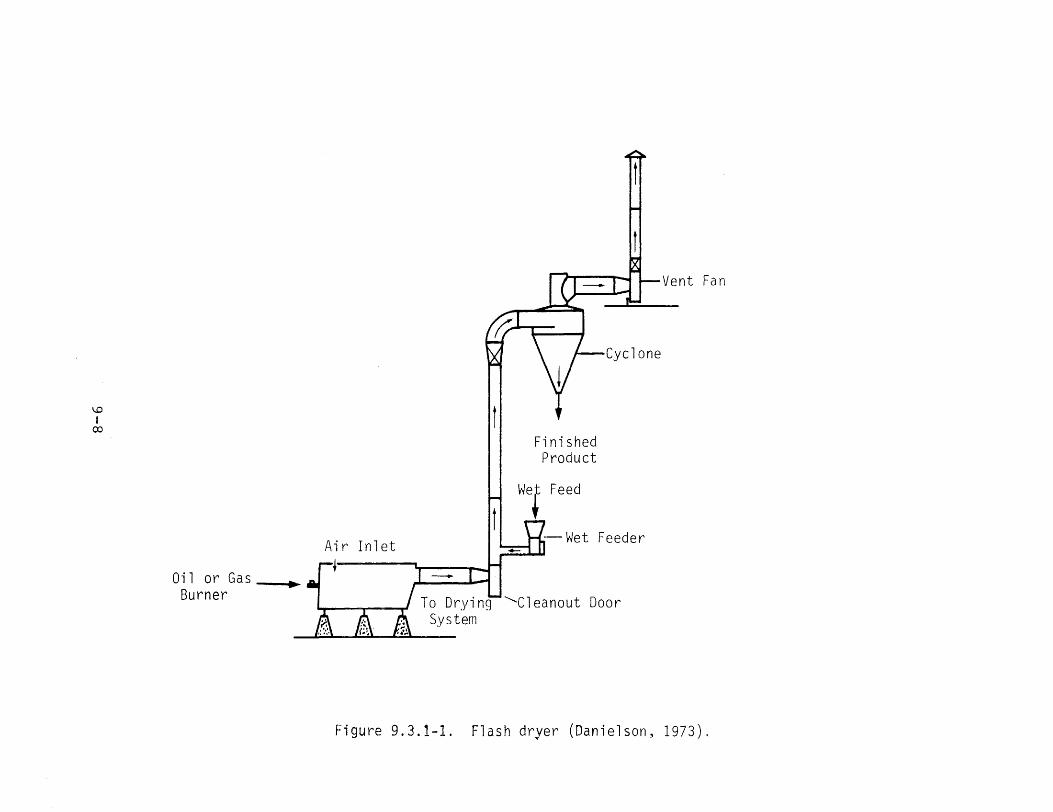
For feed processing, flash dryers, also known as pneumatic conveying dryers, are used. This technique is normally used when disintegration of grain is desired ( Hardison, 1973). A simple flash dryer is shown in Figure 9.3.1-1. The wet grain is dispersed into a hot gas stream moving at a high velocity through a duct. The hot gas dries the grain and transports it to a collection cyclone._ The gas is vented from the top of the cyclone as shown. A cage mill is often used to feed the wet material to the dryer because it disperses the material better than an auger.
9.3.2 Source Characteristics
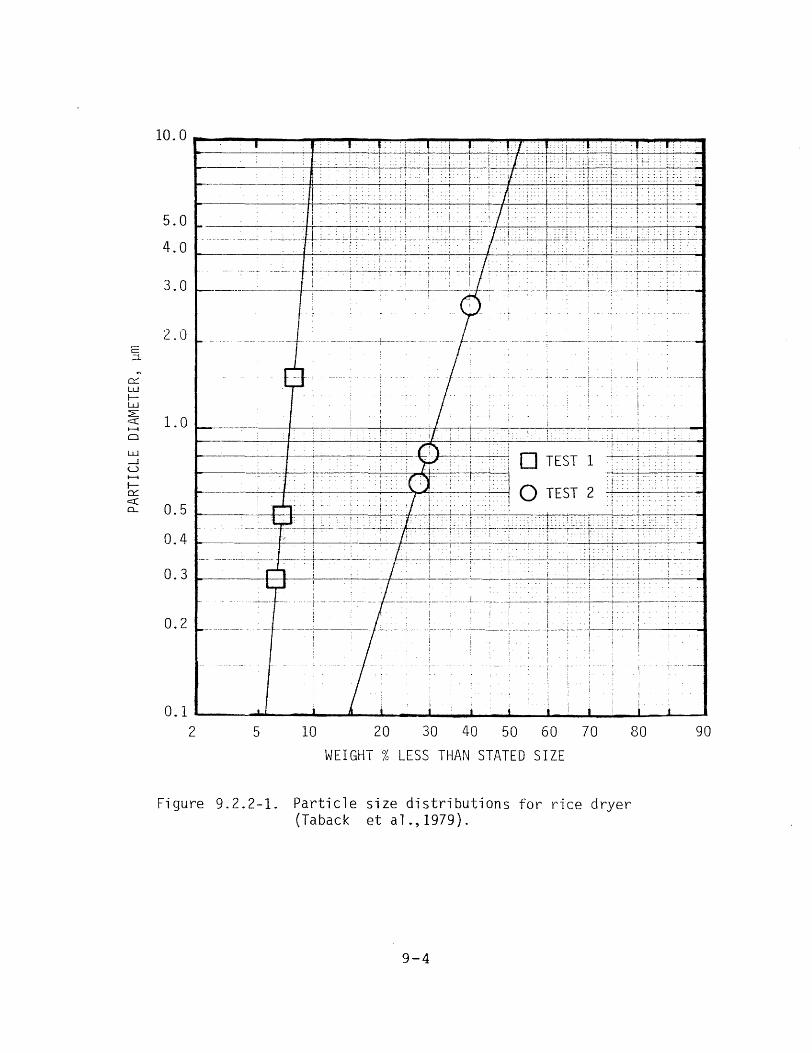
The particles emitted from grain dryers will vary with grain types and the amount of residual soil and other contarninents remaining after cleaning (Vandegrift et al., 1970). Particle size distribution data has not been obtained for grain dryers._ Figure 9.3.2-1 shows particle size distribution data for
9-3
... 0::: w 1-w ~ <::::( 1----i
0
w _J
u 1----i
lo::: <::::( CL
_ __._ _..,_ ___.____.._________ 2 5 10 20 30 40 50 60 70 80 90
WEIGHT% LESS THAN STATED SIZE
5.0
4.0 1------:........;_+.-i-_c__-'--'----+------+-_;._---+--+---;----l-----"---,--,---+---II
3.0
2.0
0. 5
-~----+-------------..·--·-------' .. I '.
0.2 ! j I
0.1 --~-------------...._
Figure 9.2.2-1. Particle size distributions for rice dryer (Taback et al .,1979).
9-4
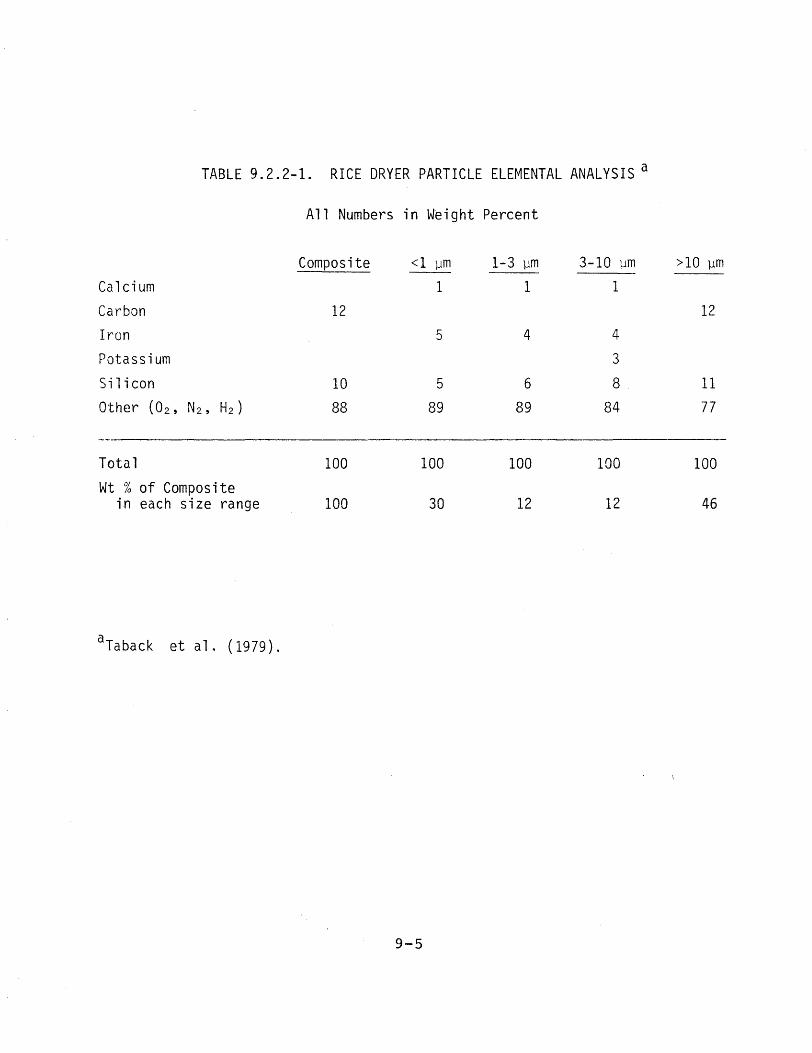
TABLE 9.2.2-1. RICE DRYER PARTICLE ELEMENTAL ANALYSIS a
All Numbers in Weight Percent
Composite <l µm 1-3 µm 3-10 µm >10 µm
Calcium 1 1 1
Carbon 12 12
Iron 5 4 4
Potassium 3
Silicon 10 5 6 8 11
Other (02, N2, H2) 88 89 89 84 77
Total 100 100 100 100 100
Wt% of Composite in each size range 100 30 12 12 46
aTaback et al . ( 1979).
9-5
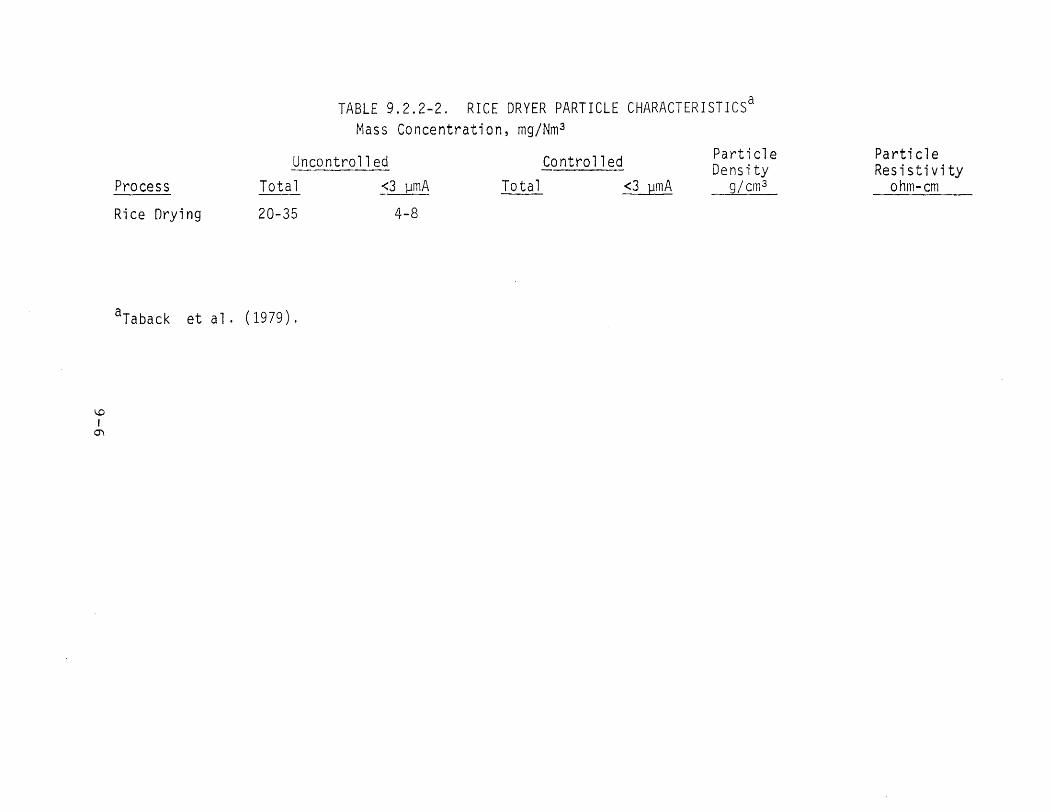
TABLE 9.2.2-2. RICE DRYER PARTICLE CHARACTERISTICSa Mass Concentration, mg/Nm 3
Process
Uncontrolled
Total <3 µmA Controlled
Total <3 gmA
Particle Density
g/cm 3
Particle Resistivity
ohm-cm
Rice Drying 20-35 4-8
aTaback et al . (1979).
i..o I
O'\
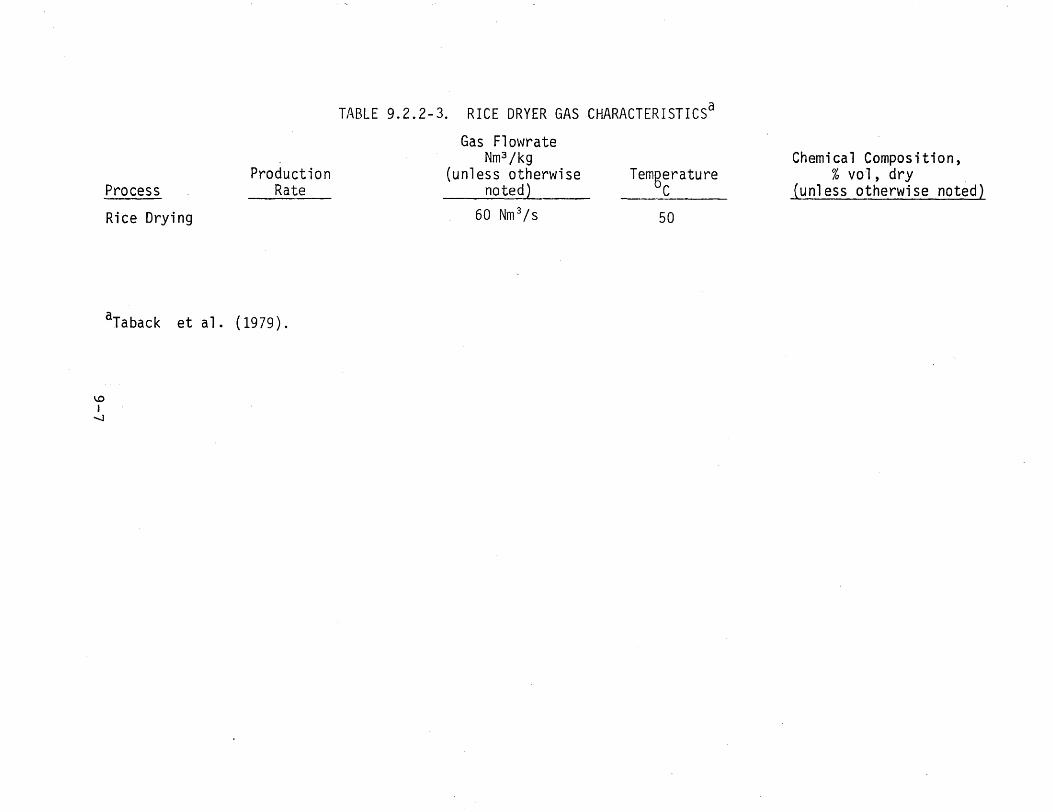
TABLE 9.2.2-3. RICE DRYER GAS CHARACTERISTICSa
Gas Flowrate Nm 3 /kg Chemical Composition,
Production (unless otherwise Temgerature %vol, dry . Process Rate noted2 C (unless otherwise noted)
Rice Drying 60 Nm 3 /s 50
aTaback et al. (1979).
\.0 I
...J
Vent Fan
\.0 I
co
-Wet FeederAir Inlet ~ '; I _J
Oil or Gas ► Burner To Dryi ng'---Cl eanout Door
System
-,
Finished Product
Wet Feed
Figure 9.3.1-1. Flash dryer (Danielson, 1973).
5.01---~-c--+-~,,.......,---+::-~,--,-+-~~~~-,--:-:-,:-~~±a,,~-±,-;-~~e±~~-:-t-=~~.,,........
4.0 1------.._;__;__;_+-+--+-,~~~~~.;...+-~~.;.c..;_;_~--i-;..;~.;..;...;....~-i:-;..;..~_;_;_;_~~~-~-~·---
E ;:::1.
" 0::: w 1-LLJ :E: c:( 1----t
0
1-z w _J c:(
1.0 ~-~~-J,-,-,--~+,,----,-tc-,--,--:-~f-,-~~~~+-,-+,.,,-,+-..,.+~~+-~·-r.·-+--r-,------
> 1-1 ::::, CY w u 1----t
~ c:( z >-0 0 0::: w c:(
:: i.
....L-~---+ 2.0
I . . l ' , I1-+~-.-+-_-_._________--,-__
ii... ... l.
0.5 1---------+----+--+-~r---+-.-.--+---4
0.4 ______....:..__ _.,;...____c-:-....:.._-+-..;:_;..._..;...;......;...::..:....;...;:::.,.;;..;..~~-+-------.::.;....;...:.;.,;;..::;...;;~;.;;;.;..;.:.;i.:.=....:;;..,;..a
0.2 .-----+-----+----+-----+--+--+--+--+--+--.-..---+-----I---+---: I ·I
1 -------H -- -t -• ; •1- -\ )tit-.-+--.----<:i_:_·--+- i-:-+---4-i_:-4--'-- .--l-1_---i-•--__ ,-....;.- __ -_
- ' I . - ' I .. I I- ! I ! ·I· .. - .. I. . . ·f 1 ____ I I · _________I· ' ..._ ! ! 1--,___________
• •0.1 ._ __.__.... I _______· .._______
1 ·
2 5 10 20 30 40 50 60 70 80 90
WEIGHT% LESS THAN STATED SIZE
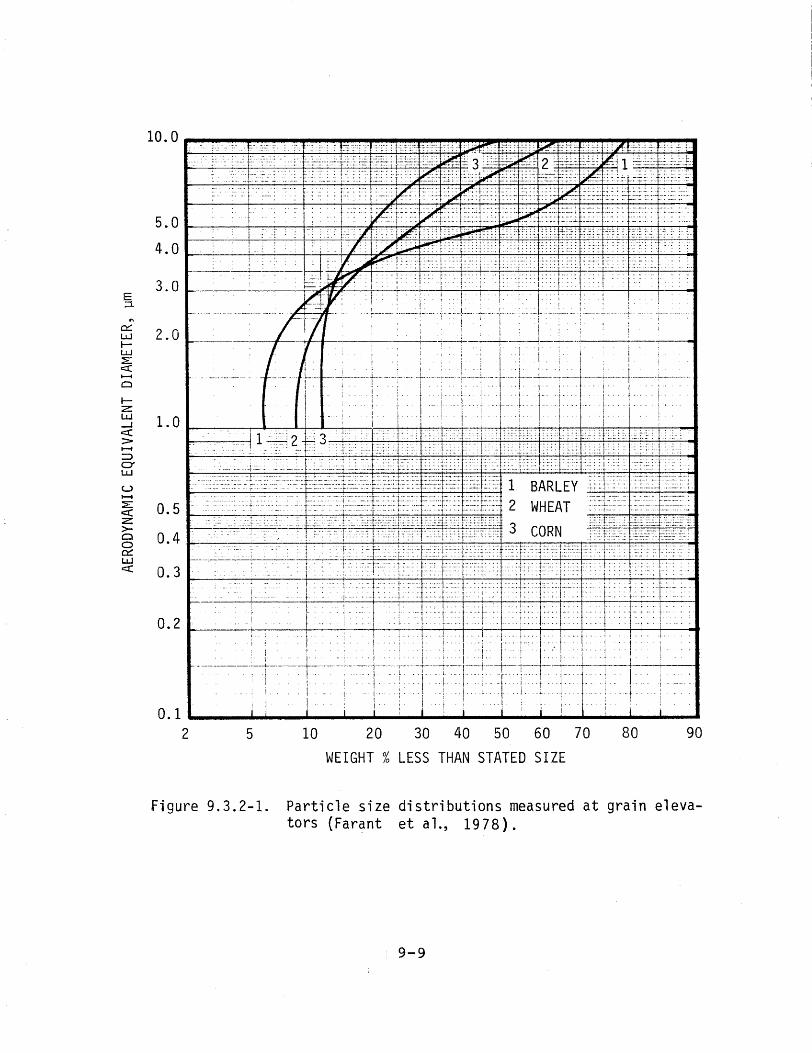
Figure 9.3.2-1. Particle size distributions measured at grain elevators (Farant et al., 1978).
9-9
emissions measured at a grain elevator reported by Farant et al. (1978). The term "aerodynamic equivalent diameter" was not defined. Table 9.3.2-1 shows chemical composition reported for grain by Taback et al •. (1979). Tables 9.3.2-2 and 9.3.2-3 show particle and gas characteristics which have been reported for grain dryers•.
9.3.3 Control Technology
The cyclone shown on the flash dryer in Figure 9.3.1-1 is primarily for the collection of the dried product rather than for air pollution control._ Particle emissions are a problem as are emissions of odorous gases according to Hardison (1973). The moisture content of the gas from drying operations can cause clogging problems in high efficiency cyclones and in baghouses (Cowherd, 1971).
9.4 ALFALFA DRYING 9.4.1 Process Description
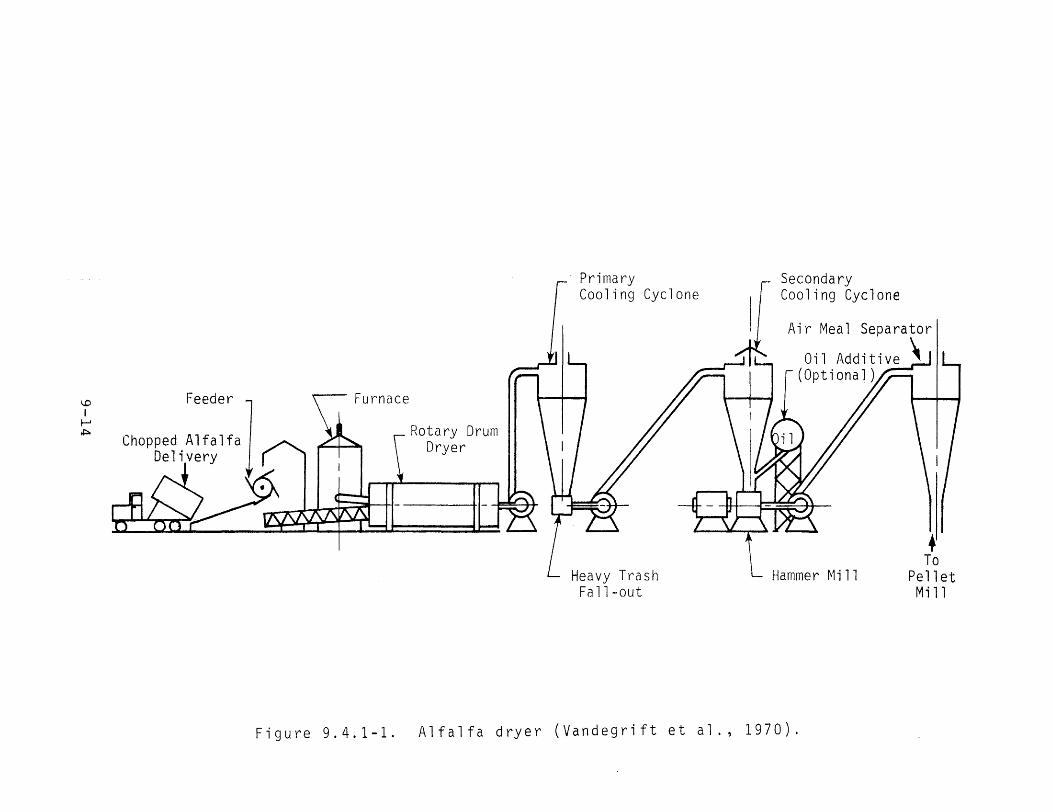
Fresh cut alfalfa (60-80% moisture according to Cowherd, 1971) is fed into a direct-fired rotary dryer. The dryer, shown in Figure 9.4.1-1, consists of a rotating drum supplied with air at approximately 1040~C Cl900°F) according to Vandegrift et al. (1970)._ Metal protrusions inside the rotating drum lift the material and shower it through the hot gas as shown in Figure 9.4.1-2 ..
The dried alfalfa (8-16% moisture) is pneumatically conveyed through one or two cooling cyclones, both of which are sources of emissions.. The alfalfa is then ground by a hammerrnill into meal._ The air meal separator cyclone is a source of finer particle emissions than the cooling cyclones (Vandegrift et al., 1970). The alfalfa meal is then further processed into pellets to be use a in an i rn a 1 fee a.
9.4.2 Source Character is tics
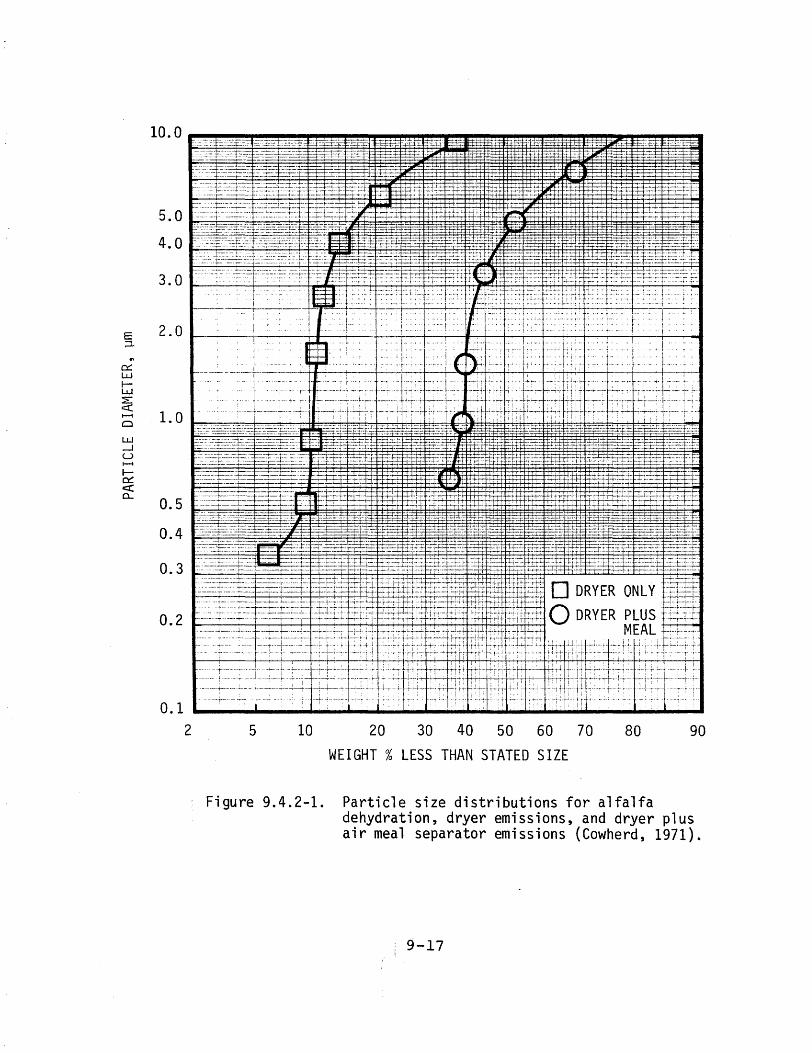
Figure 9.4.2-1 shows size distribution data reported by Cowherd Cl971). One case is for the emissions from the primary cooling cyclone._ In the second case, exhaust air from the air meal separator was vented through the primary cooling cyclone•. This curve is notated as "Dryer and Meal" •.
Tables 9.4.2-1 and 9.4.2-2 show the particle and gas characteristics.
9.4.3 Control Technology
The product collection cyclones used in alfalfa dehydrating produce fine,. lightweight emissions._ Cowherd (1971) reported that about 80% of the dust emissions in a dehydrating plant are from the drying operation and that overdrying can greatly TABL~
9-10
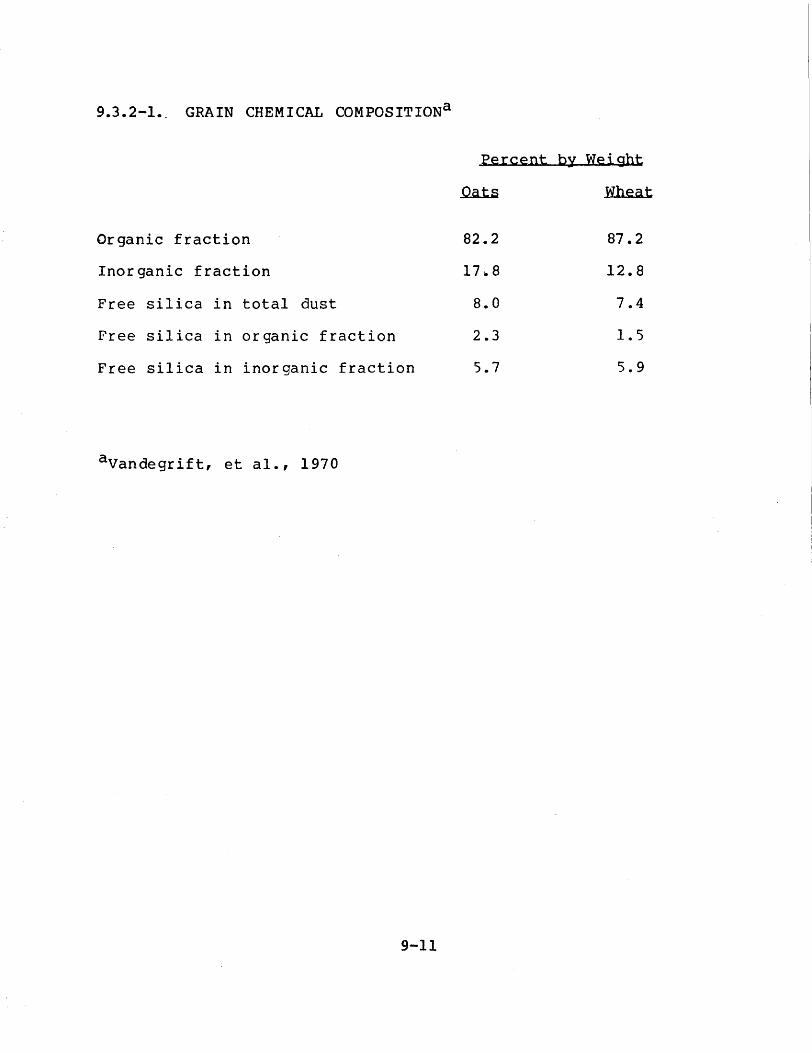
9.3.2-1. GRAIN CHEMICAL COMPOSITIONa
Percent by Weight
.Qali Wheat
Organic fraction 82.2 87. 2
Inorganic fraction 17~8 12.8
Free silica in total dust 8.0 7.4
Free silica in organic fraction 2.3 1.5
Free silica in inorganic fraction 5.7 5.9
avandegrift, et al.1 1970
9-11
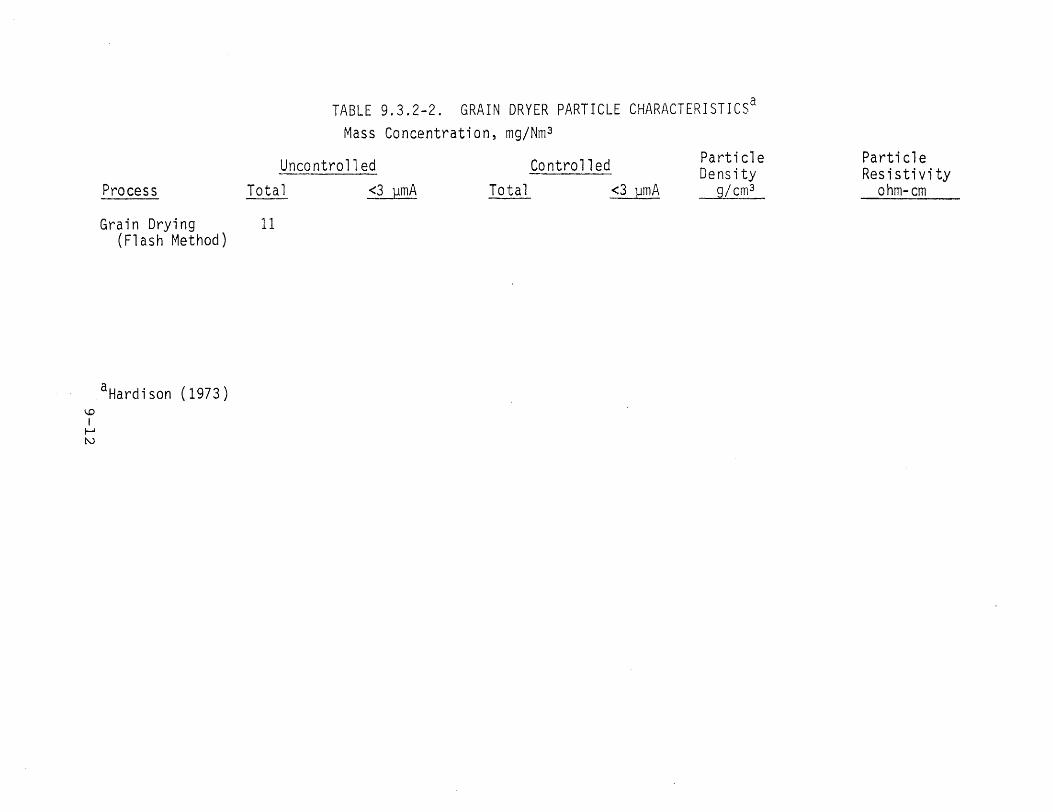
TABLE 9.3.2-2. GRAIN DRYER PARTICLE CHARACTERISTICSa Mass Concentration, mg/Nm 3
Particle ParticleUncontrolled Centro 11 ed Density Resistivity Process Total <3 l!mA Total <3 gmA g/cm 3 ohm-cm
Grain Drying 11 (Flash Method)
aHardison (1973) I..O I
f--l N
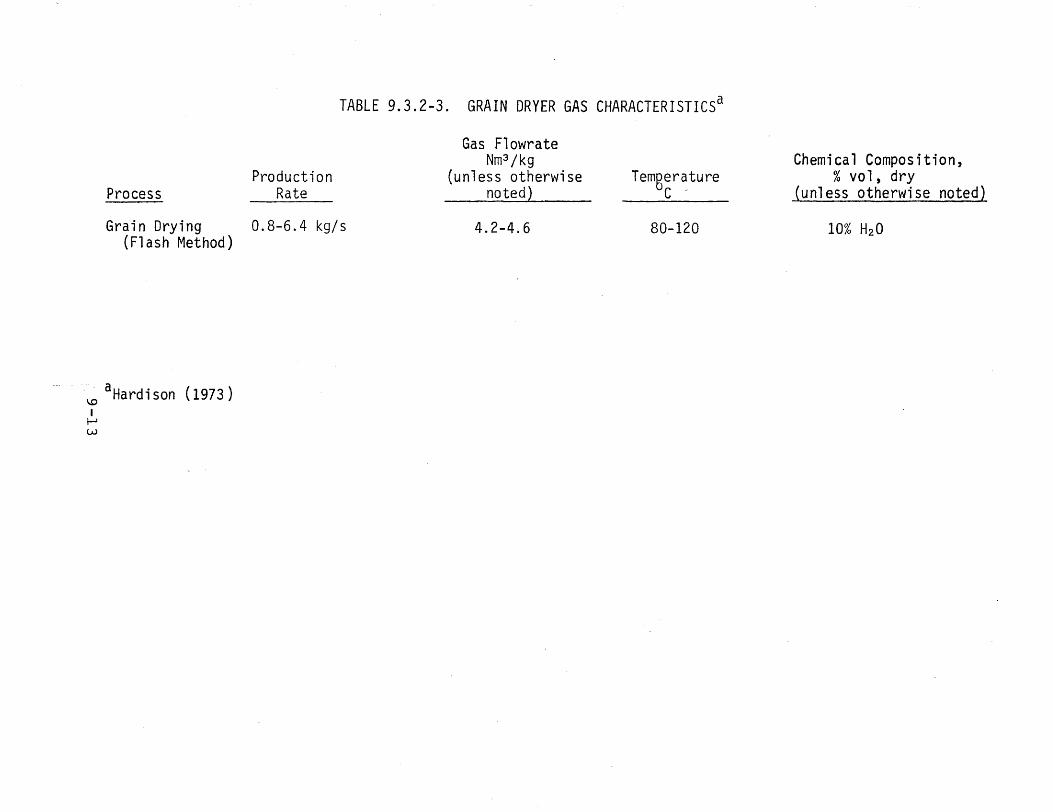
TABLE 9.3.2-3. GRAIN DRYER GAS CHARACTERISTICSa
Gas Flowrate Nm 3 /kg Chemical Composition,
Production (unless otherwise Temgerature %vol,dry Process Rate noted} C - (unless otherwise noted)
Grain Drying 0.8-6.4 kg/s 4.2-4.6 80-120 10% H20 (Flash Method)
··~ aHardison (1973) I ~ w
I..D I
f--l ~
Feeder
Chopped AlfalfaD , .
Furnace
Rotary Drum Dryer
Primary Cooling Cyclone
Heavy Trash
Secondary Cooling Cyclone
Air Meal Separator
Hammer Mill
\
♦ To
Pellet Fall-out Mi 11
Figure 9.4.1-1. Alfalfa dryer (Vandegrift et al., 1970).
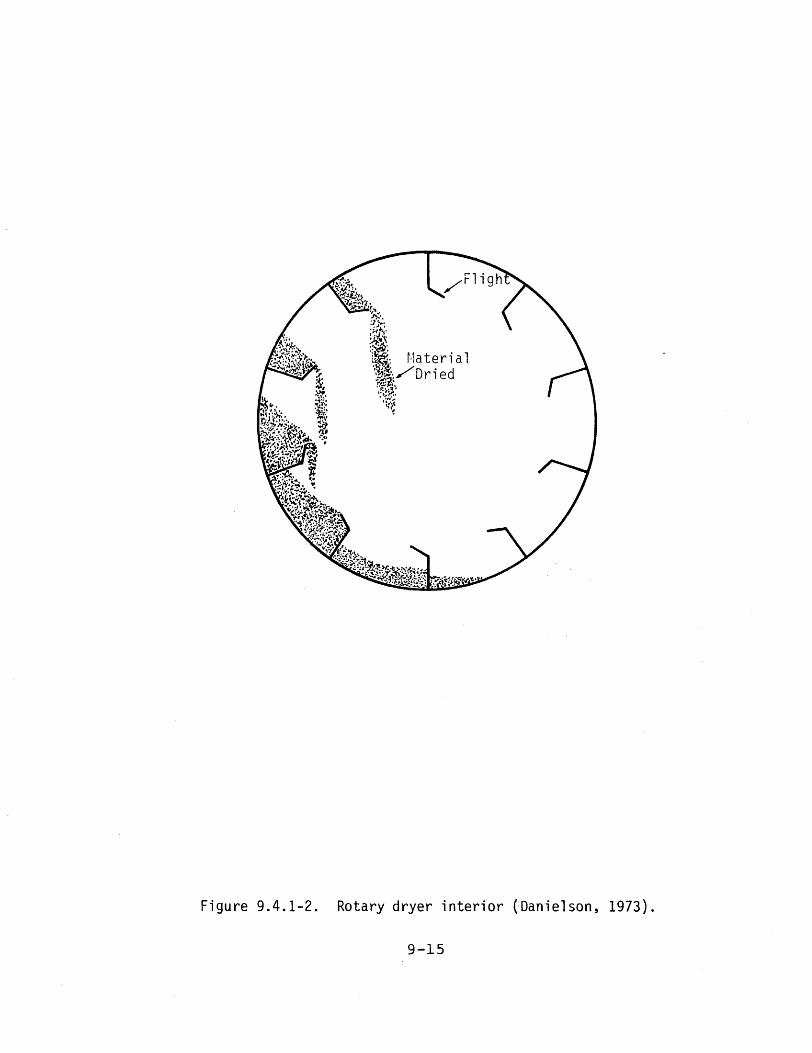
Figure 9.4.1-2. Rotary dryer interior (Danielson, 1973).
9-15
increase emissions. Therefore, control of the dryer operation is important.
Cowherd (1971) stated that the efficiency of a cyclone decreases rapidly for particle diameters below 5 µm._ Problems occur in high efficiency, multicyclones because the moist particles can cause clogging._ Clogging of baghouses due to high moisture content is also a problem._
An afterburner for combustion of the waste is highly efficient for controlling particle emissions, according to Cowherd (1971). Odors, as well as particles, are also controlled.
A small amount of animal fat is sometimes added to the alfalfa meal as shown in Figure 9.4.1-1. This technique reduces the particulate emissions from the cyclone as well as improving the food value of the alfalfa, according to Annis et al. (1970). It can cause problems in using control devices such as baghouses.
9.5 GRAIN GRINDING AND MILLING 9.5.1 Process Description
Grinding of grain is done in both the manufacture of animal feed and to produce flour. Hardison (1973) provided descriptions for grain milling operations._ In feed manufacture a hammer mill is normally used._ The grain is pulverized by swinging hammers and then sifted through screens with openings from 0.3-1.3 cm depending on the type of feed being produced. Oversized pieces are reground._
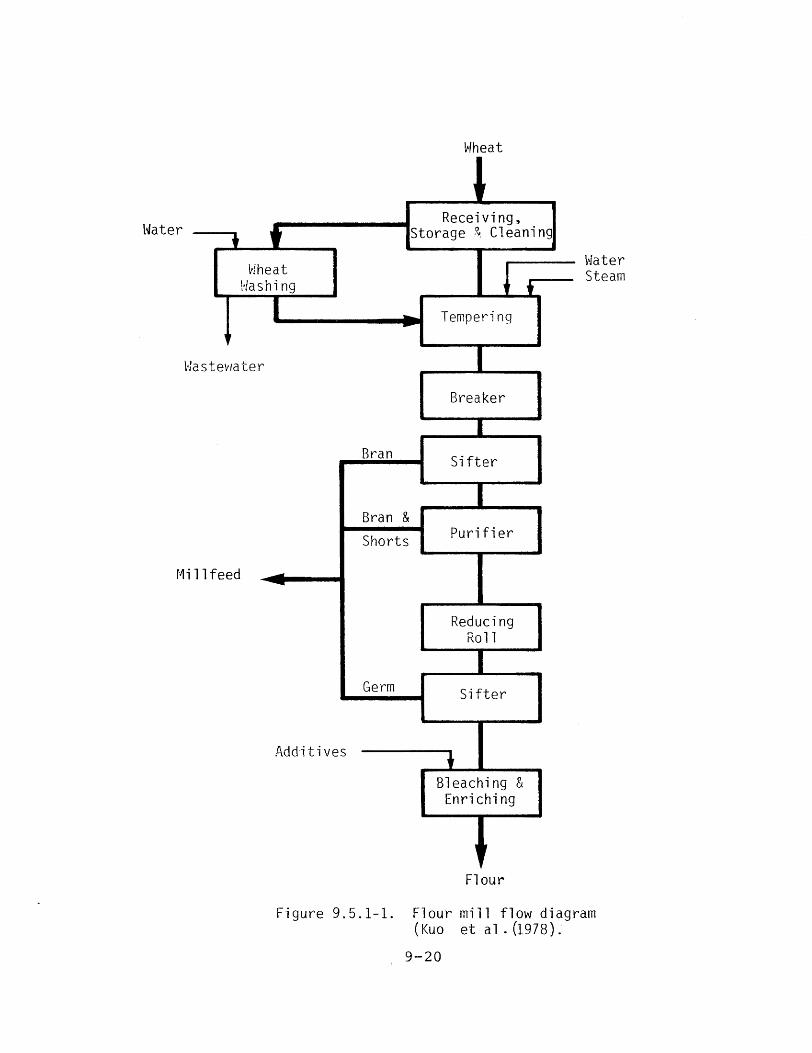
The process of flour milling involves many steps to clean and prepare the grain for grindin~ Figure 9.5.1-1 shows a flour mill flow diagram. Wheat must be brought up to a moisture content of 15-19% prior to grinding. iernpering and conditioning are two processes by which this is accomplished.
The actual grinding is done in roller mills. The wheat passes between pairs of rollers which move in opposite directions and at different speeds. The rollers are spaced so that the grain is not crushed but broken up by shearing forces instead. The first series of rollers is designed to break the bran and the endosperm apart. Each pair of rollers is followed by a sifting system._
The endospserrn passes on to the next series of rolls where it is ground into flour._ The bran and germ are collected from the first series of rolls and used for other products._
9.5.2 Source Characteristics
Tables 9.5.2-1 and 9.5.2-2 show particle and gas characteristics for feed milling and flour millin~ Size distribution and chemical composition data were not located in the literature survey._
9-16
10.0
5.0
4.0
3.0
E 2.0 ;::l..
0::: Lu ILu :a: <:::( 1--1 1.0□
Lu .....J u 1--1
lo:: c:r:: Cl..
0.5
0.4
0.3
0.2
0.1 2 5 10 20 30 40 50 60 70 80 90
WEIGHT% LESS THAN STATED SIZE
Fi gu re 9 . 4 . 2-1. Particle size distributions for alfalfa dehydration, dryer emissions, and dryer plusair meal separator emissions (Cowherd, 1971).
9-17
- -·-·-- -1- -···--· ::·-:~--=---=-···.:-___ -1.•• _.r_:- ..
·:.::.~~ - -:-- ,----··· i---- f---••·••··--- ·+·
• :::,7=t=
I
I
-.-•--•··-•·-'·----.-..
I '
t·t·
l-4
!"'
1--- .: .. ,..
-:t:.::::±:=
I
.~~:::tt ---i ;..,•.,
7 Tf-
J__ ,...,. ,------ ~-1 • --•··-----
. : '
·---~-. -- -+· 'I
: i I
I I i :i , ':, 1 ··t,-:•--lh--<l..,...:...h:·1-;,.Jl-i-+-•-i-i-+--,--•,· ;+,, i' I, '
,,,(.,. -i- !..: ' i
! : ' >',
_,_.,. ·--
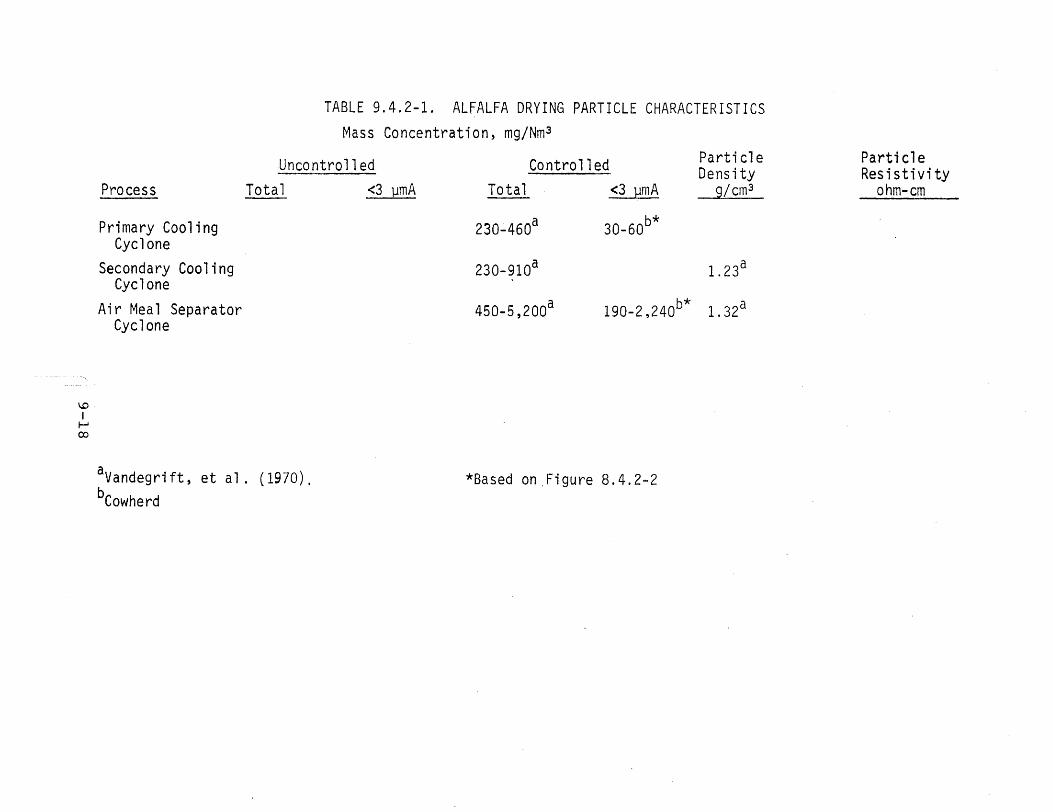
TABLE 9.4.2-1. ALFALFA DRYING PARTICLE CHARACTERISTICS
Process
Mass Concentration, mg/Nm 3
Uncontrolled Controlled Total <3 gmA Total <3 ~mA
Particle Density
g/cm3
Particle Resistivity
ohm-cm
Primary Cooling Cyclone
Secondary CoolingCyclone
Air Meal SeparatorCyclone
230.:.460a
230-910a
450-5,200a
30-60b*
190-2,24ob*
1. 23a
1.32a
~ I
I-' 00
aVandegrift, et al. (1970). *Based on _Figure 8.4.2-2 bcowherd
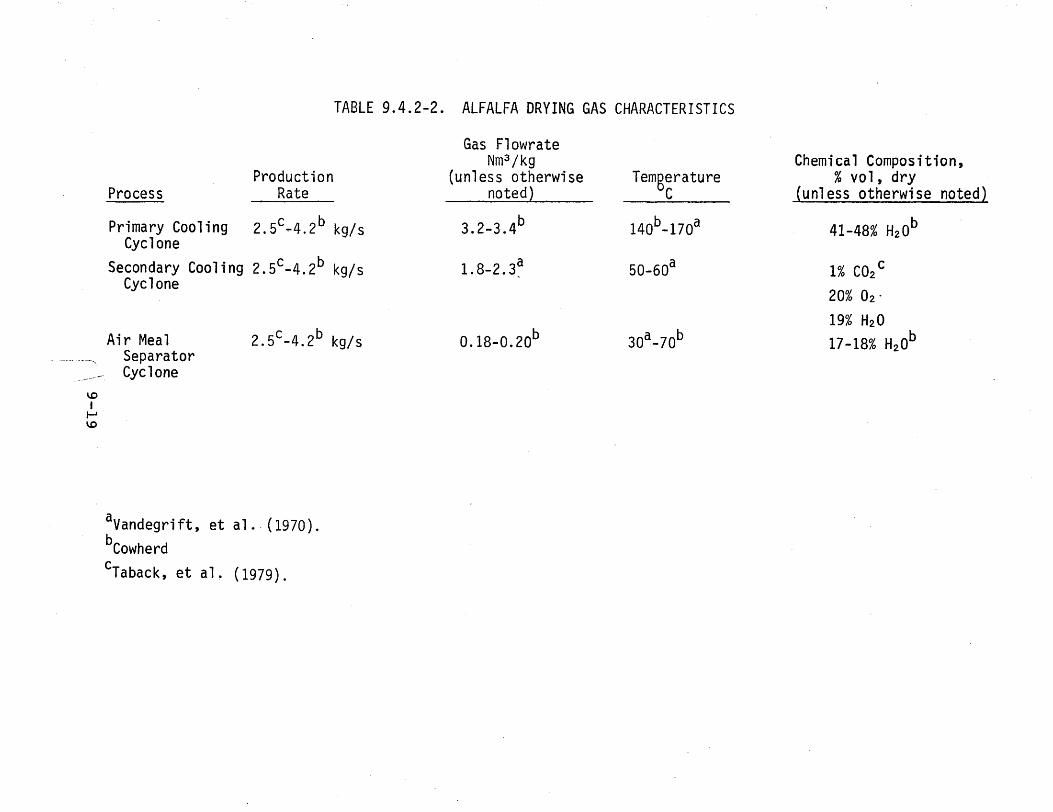
TABLE 9.4.2-2. ALFALFA DRYING GAS CHARACTERISTICS
Gas Flowrate Nm3 /kg
(unless otherwise noted}
3.2-3.4b
1. 8-2. 3,a
0.18-0.20b
Temgerature C
140b-170a
50-60a
30a-70b
Chemical Composition, % vol, dry
(unless otherwise noted)
41-48% H20b
1% C02c
20% 02· 19% H20 17-18% H20b
----~-\0 I
I-' \0
Process
Primary Cooling Cyclone
Production Rate
2.sc ... 4.2b kg/s
Secondary Cooling 2.5c-4.2b kg/sCyclone
Air Meal 2.5c-4.2b kg/sSeparator Cyclone
aVandegri ft, et al .. ( 1970). bCowherd
cTaback, et al. ( 1979).
ti-fheat
t t vJheat
l·Ja shi ng
I
1 '
Receiving,Storage &Cleaning
l .-Tempering
Water Steam
,, VJastev1ater
Mi 11 feed
Breaker
Bran
Bran & Shorts
---
Germ
Add·iti ves
Sifter
Purifier
Reducing Roll
Sifter
♦ Bleaching & Enriching
1 ,
Flour
Figure 9.5.1-1. Flour mill flow diagram (Kuo et al.(1978).
9-20
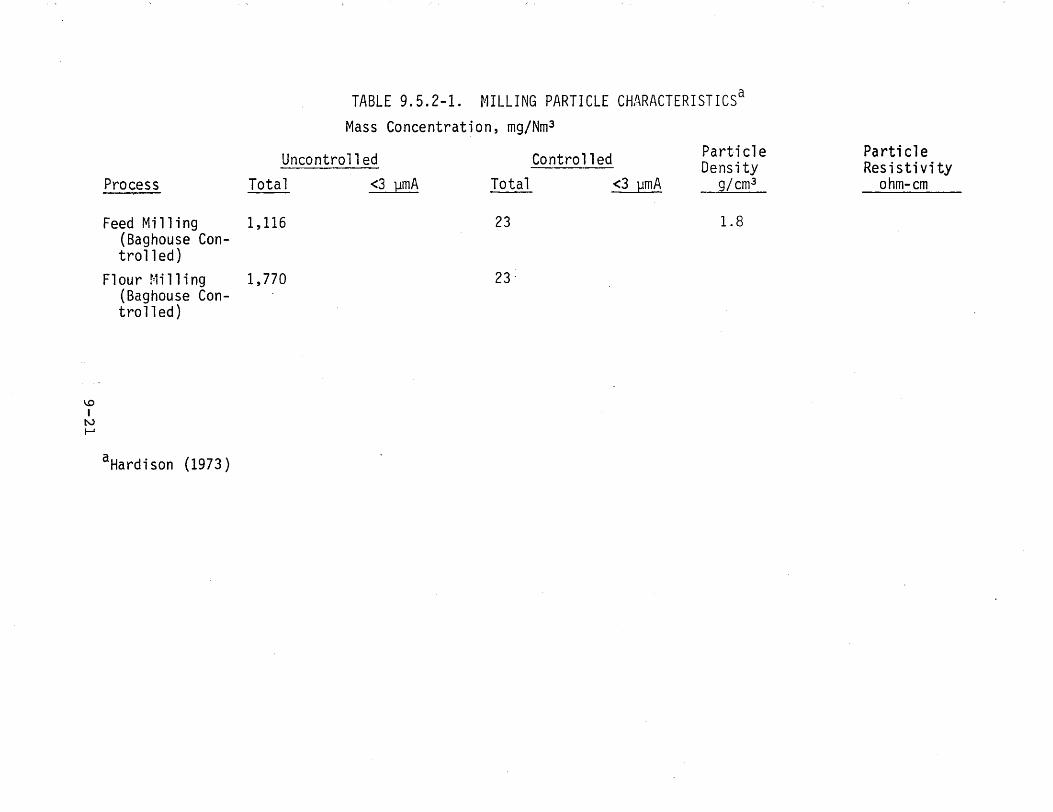
TABLE 9.5.2-1. MILLING PARTICLE CHARACTERISTICSa Mass Concentration, mg/Nm3
Particle ParticleUncontro11 ed Controlled Density Resistivity Process Total <3 ~mA Total <3 ~mA g/cm3 ohm-cm
Feed Milling 1,116 23 1.8 (Baghouse Controlled)
Flour Milling 1,770 23· (Baghouse Con-tra11 ed)
I.O I
N f-1
aHardison (1973)
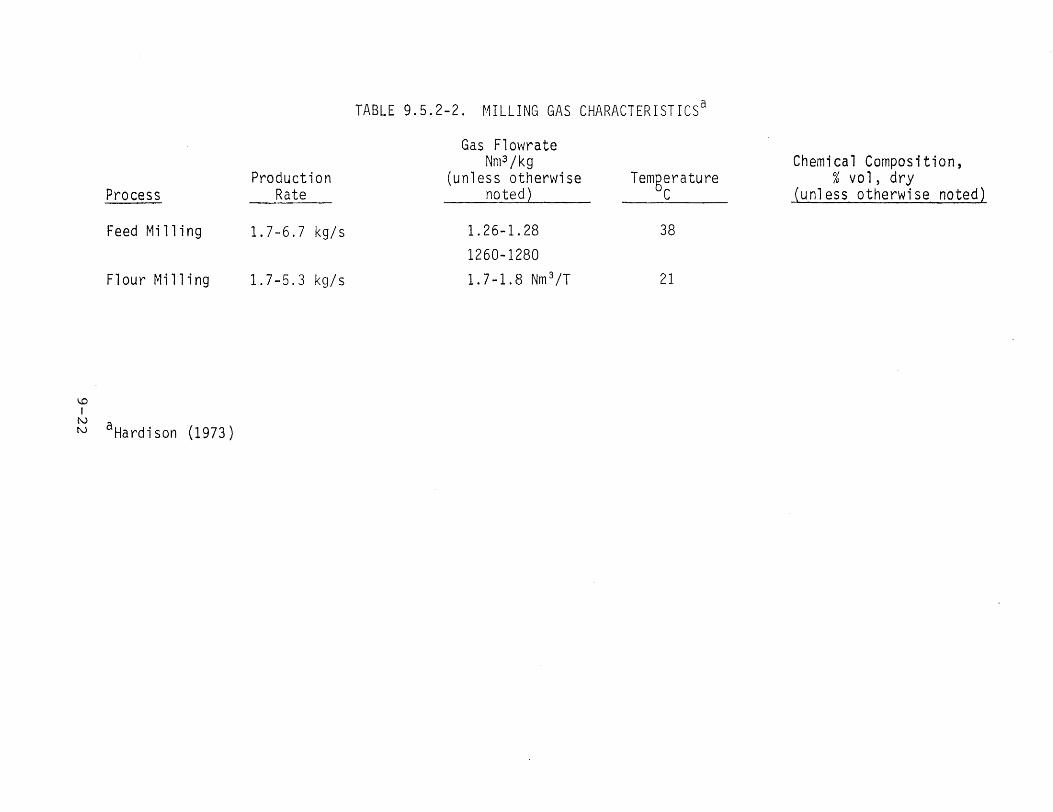
TABLE 9.5.2-2. MILLING GAS CHARACTERISTICSa
Gas Flowrate Nm 3 /kg Chemical Composition,
Production (unless otherwise Temgerature % vol, dry Process Rate noted C (unless otherwise noted)
Feed Milling 1.7-6.7 kg/s 1.26-1.28 38
1260-1280 Flour Milling 1.7-5.3 kg/s 1. 7-1. 8 Nm 3 /T 21
I..O I
N N a Hardi son (1973)
9.5.3 Control Technology
Cyclones are widely used in the grain industry for both product collection and dust control. Baghouse devices are common in flour mills and other grain operations.. They can achieve efficiencies close to 99% (Hardison, 1973)._
Because of the tendency of grain dust to clog the small entrance openings, multicyclones are not commonly used. Electrostatic precipitators and wet scrubbers are rarely used. This is due to the dust explosion hazard and the desire for a dry byproduct. The explosion and fire hazard is also a problem in baghouses, but it can be reduced by careful design (McLouth et al., 1961).
9.6 COTTON GINNING 9.6.1 Process Description
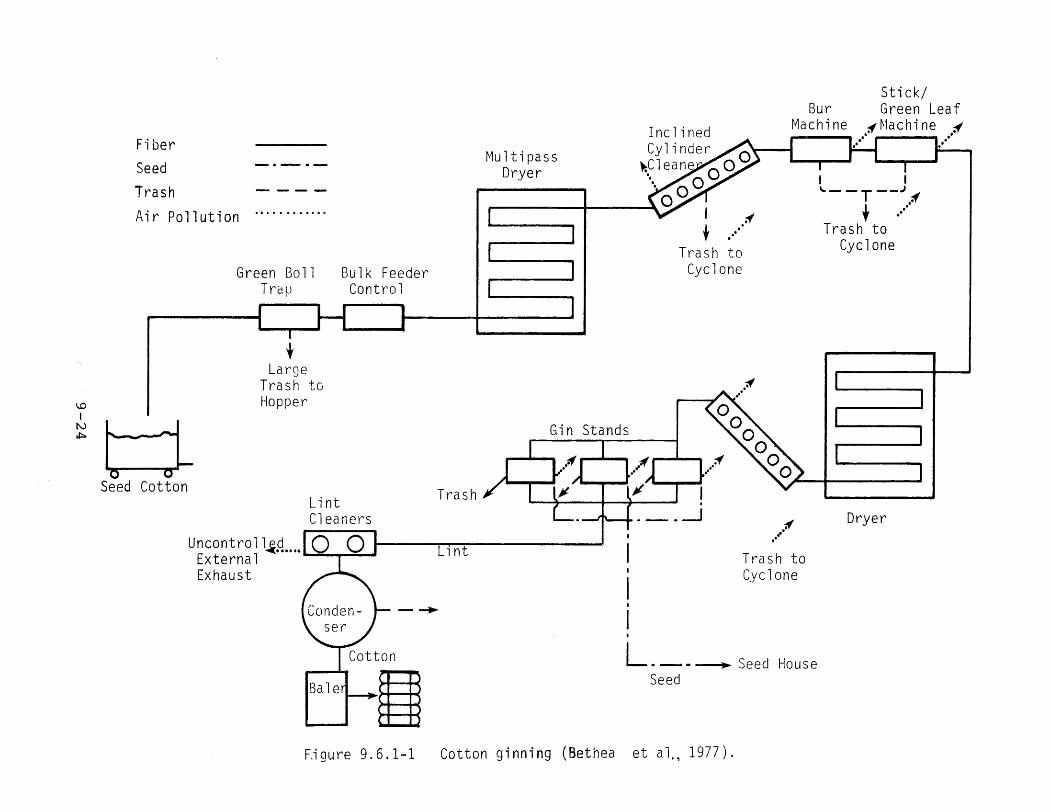
Cotton ginning is a seasonal operation, running less than three months each year (Wesley et al., 1978b). The process of cotton ginning involves several operations which are shown in Figure 9.6.1-1 •. According to Wesley et al. Cl978a), the steps involved in cotton ginning are: cleaning the seed cotton, drying it, separating the cotton seed from the lint (done at the gin stand), cleaning the 1 int,. passing it through a condenser, and finally, baling it•.
Both the cotton fiber and the material removed from it are conveyed pneumatically. The material removed from the cotton in the various cleaning operations includes portions of the cotton plant and other vegetation, as well as sand and soil. This trash is collected in cyclones which have efficiencies of 90% or less (Roddy, 1978)._ The trash is either disposed of by incineration or by returning it to the land.. A 1966 survey by the U. s•. Department of Agriculture, as reported by Pendleton (1967), indicated that 94% of the gins in California returned the trash to the land.
A study has been performed for the California ~nergy Commission on the feasibility of burning cotton gin trash to heat air for the dryers (Agrotherm Division, Norman Pitt, Inc., 1980). The pilot plant studied used a cyclone and baghouse to collect the fly ash produced. It was reported that 40% of the fly ash produced by the combustion of the cotton gin trash was submicron in s i z e. . Out1et size data was not reportea. . If this practice is adopted by the gins it will most probably be a source of fine particle emissions•. In addition, incineration of gin trash is known to be a source of arsenic emissions CU. s.. Department of Health, Education and Welfare, 1967). This problem was not addressed in the report by Agrotherm (1980)._
Dust is emitted from the trash collector cyclones as well as points in the process stream. Two primary sources of lint and fine dust emissions are the open front of the gin stands and the lint cleaners. Emissions also occur from leaks in the pneumatic
9-23
___
I I '---T--"' .:f
f .... Trash to
Cyclone
Dryer
Stick/ Bur Green Leaf
Machine :(Machine :fInclined ..F·i ber Cylin ~.Cl
----.···.. 1··· Multi pass
Seed Dryer Trash
Air Pollution l ..:f' ..• Trash to
Green Bo 11 Bulk Feeder Cyclone Traµ Control
f Large
Trash to HopperI..O
I N Gin Stands.i::,.
,
_...,.
__,fn..-...J..
•.:f I i/1't=:LSeed Cotton Trash JI I I
Lint . _JCleaners
".--:f Uncontroll~R .... , ..
LintExternal Trash to Exhaust Cyclone
L___ ~ Seed House Seed
F.igure 9.6.1-1 Cotton ginning (Bethea et al., 1977).
conveying system.
9.6.2 Source Characteristics
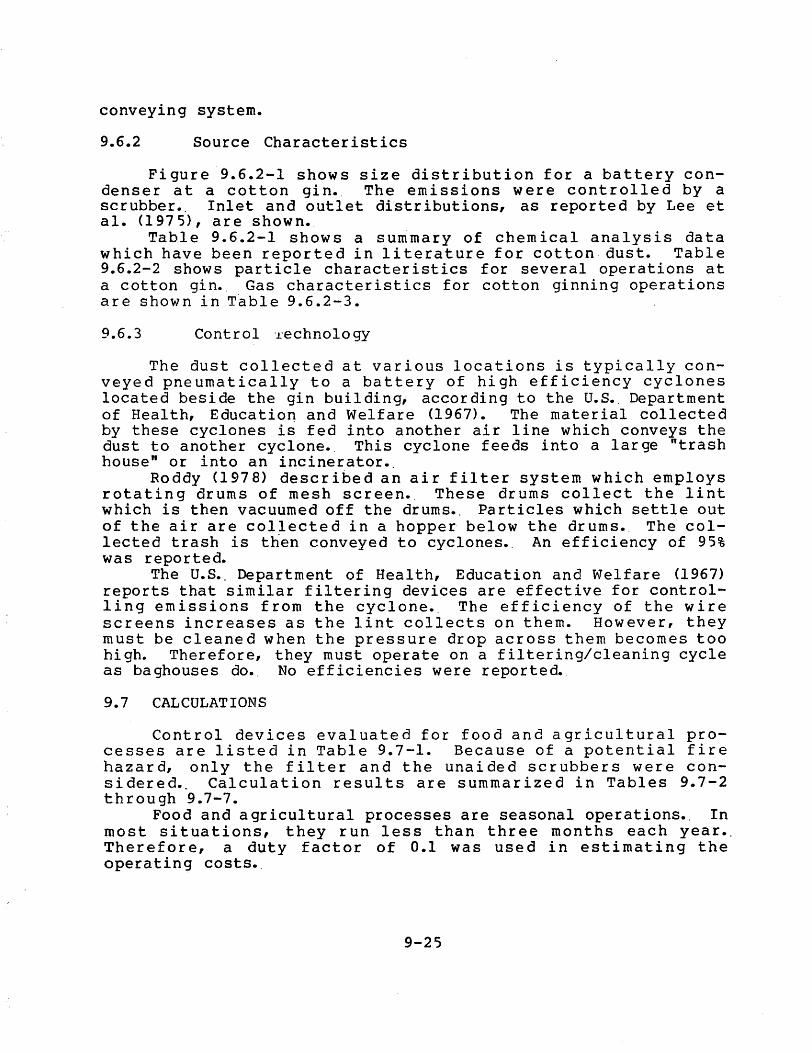
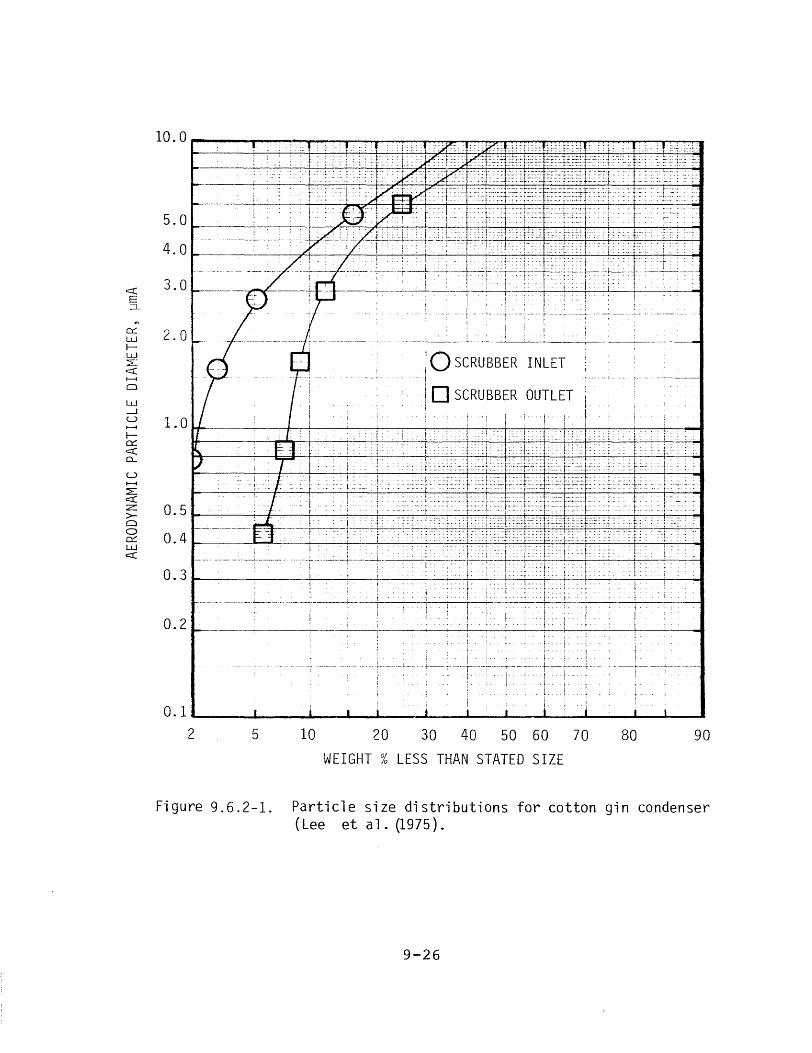
Figure 9.6.2-1 shows size distribution for a battery condenser at a cotton gin._ The emissions were controlled by a scrubber.. Inlet and outlet distributions, as reported by Lee et al. (197 5}, are shown._
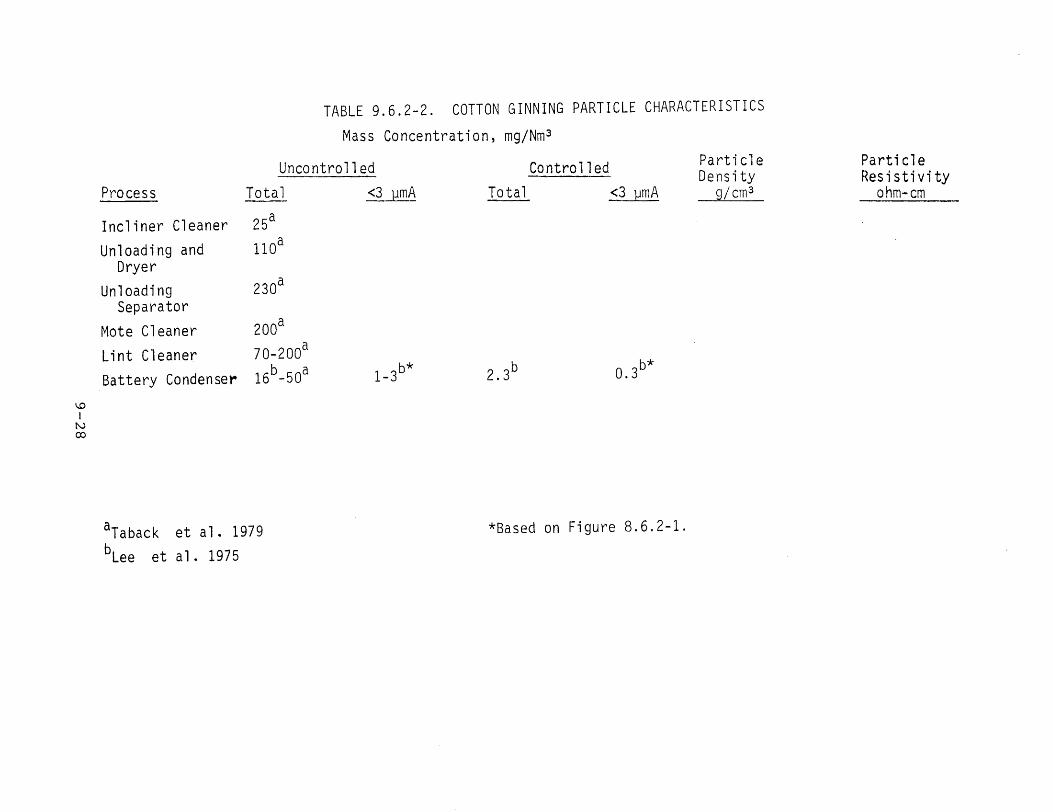
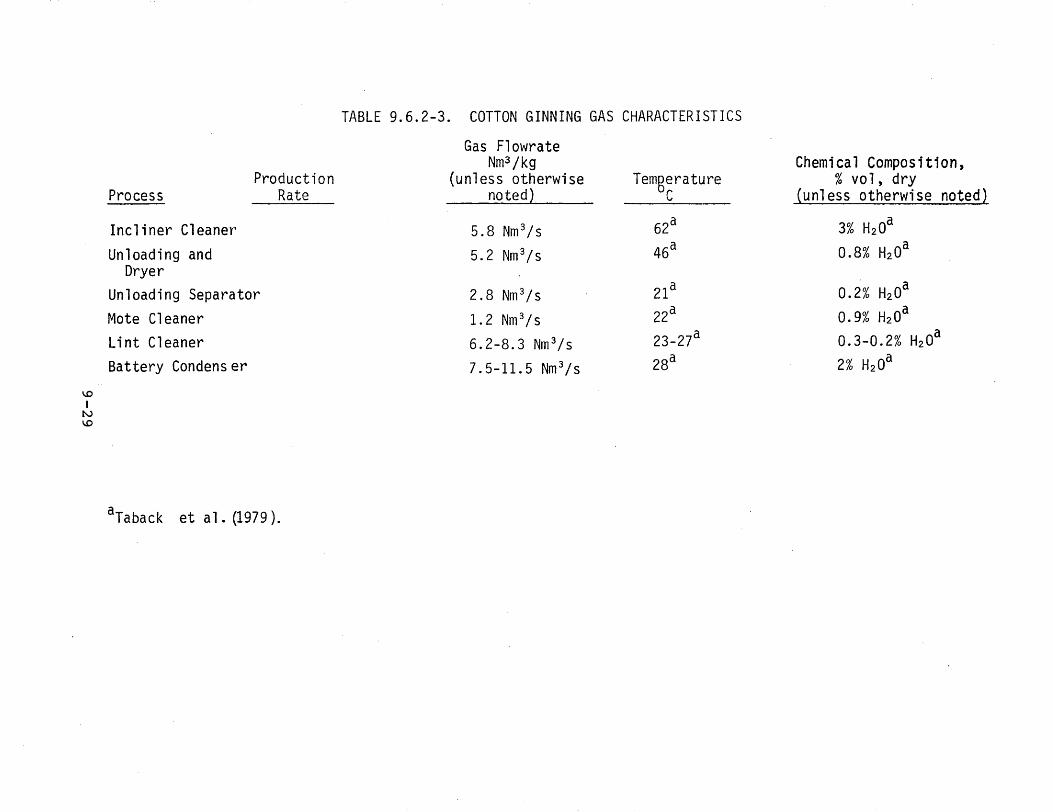
Table 9.6.2-1 shows a summary of chemical analysis data which have been reported in literature for cotton dust. Table 9.6.2-2 shows particle characteristics for several operations at a cotton gin._ Gas characteristics for cotton ginning operations are shown in T·able 9.6.2-3.
9.6.3 Control Technology
The dust collected at various locations is typically conveyed pneumatically to a battery of high efficiency cyclones located beside the gin building, according to the U.S._ Department of Health, Education and Welfare (1967). The material collected by these cyclones is fed into another air line which conveys the dust to another cyclone.. This cyclone feeds into a large "trash house" or into an incinerator._
Roddy Cl 97 8) described an air filter system which employs rotating drums of mesh screen•. These drums collect the lint which is then vacuumed off the drums._ Particles which settle out of the air are collected in a hopper below the drums._ The collected trash is then conveyed to cyclones._ An efficiency of 95% was reported.
The U.S._ Department of Health, Education and Welfare (1967} reports that similar filtering devices are effective for controlling emissions from the cyclone._ The efficiency of the wire screens increases as the lint collects on them. However, they must be cleaned when the pressure drop across them becomes too high. Therefore, they must operate on a filtering/cleaning cycle as baghouses do._ No efficiencies were reported.
9.7 CALCULATIONS
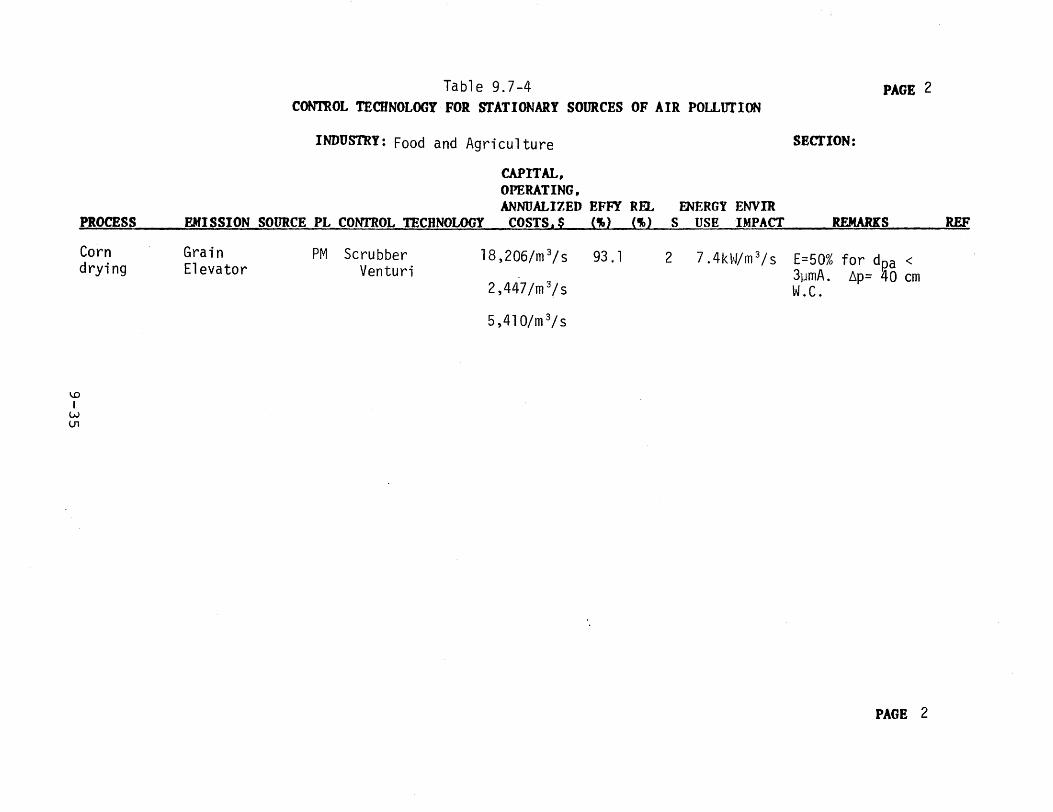
Control devices evaluated for food and agricultural processes are listed in Table 9.7-1. Because of a potential fire hazard, only the filter and the unaided scrubbers were considered._ Calculation results are summarized in Tables 9.7-2 through 9.7-7.
Food and a gr icul tural processes are seasonal operations.. In most situations, they run less than three months each year._ Therefore, a duty factor of 0.1 was used in estimating the operating costs._
9-25
,:::::c: E ;:1.
... 0:::: w I-w '.2:.: ,:::::c: 1--l
Cl
w _J
u 1--l
I-0:::: ,:::::c: 0...
L) 1--l
~ ,:::::c: z >-Cl 0 0:::: w ,:::::c:
5.0
4.0
3.0
I
2.0
0 SCRUBBER INLET
0 SCRUBBER OUTLET l 1.0
0.5
0.4
0.3 : 1
0.2 . I: l i·
1
0.11,___....&,...___.__.....L----l..__ _ __.__ _._ __.,_..;.__._.._..._____.....___
2 5 10 20
WEIGHT% 30 40 50 60
LESS THAN STATED SIZE 70 80 90
Figure 9.6.2-1. Particle size distributions for (Lee et al. µ975).
cotton gin condenser
9-26
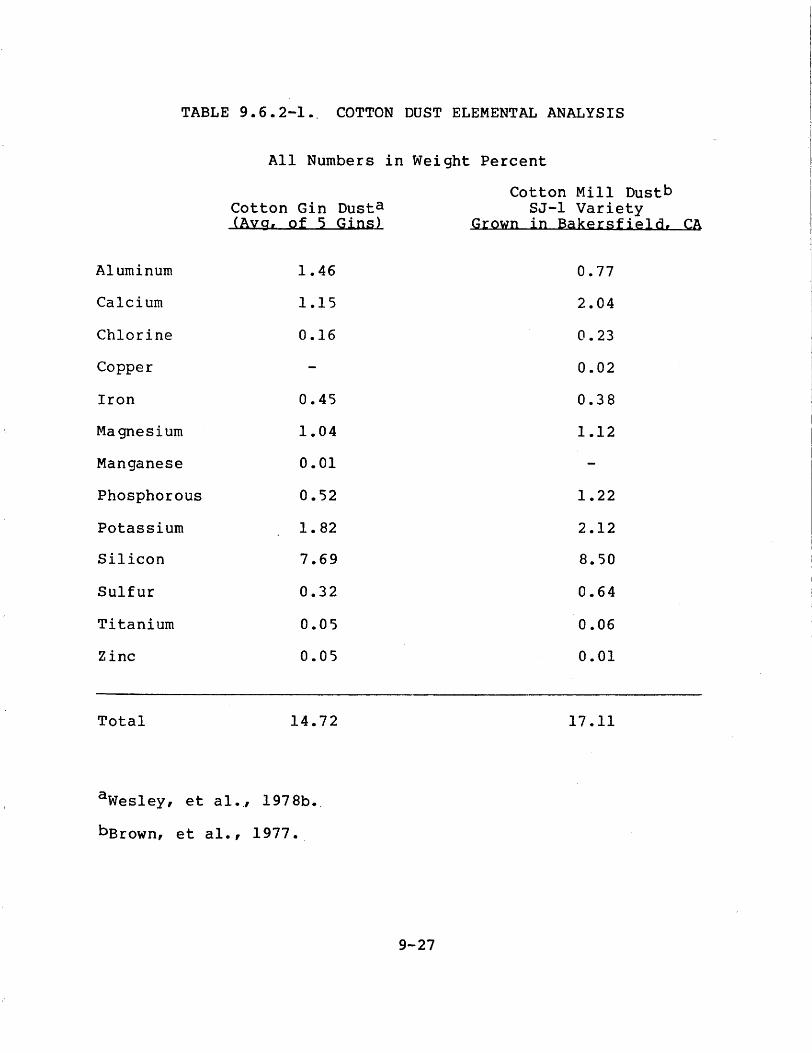
TABLE 9.6.2-1. COTTON DUST ELEMENTAL ANALYSIS
All Numbers in Weight Percent
Aluminum
Calcium
Chlorine
Copper
Iron
Magnesium
Manganese
Phosphorous
Potassium
Silicon
Sulfur
Titanium
Zinc
Cotton Gin Dusta <Avg, of 5 Gins>
1.46
1.15
0.16
0.45
1.04
0.01
0.52
1. 82
7.69
0.32
0.05
0.05
Cotton Mill Dustb SJ-1 Variety
Grown in Bakersfield, CA
0.77
2.04
0.23
0.02
0. 3 8
1.12
1.22
2.12
8.50
0.64
0.06
0.01
Total 14.72 17.11
awesley, et al.., 1978b•.
barown, et al., 1977.
9-27
Process
Incliner Cleaner Unloading and
Dryer Unloading
Separator
Mote Cleaner
Lint Cleaner Battery Condenser
'-.0 I
N co
TABLE 9.6.2-2. COTTON GINNING PARTICLE CHARACTERISTICS
Mass Concentration, mg/Nm 3
ParticleUncontrolled Controlled Density Total <3 HmA Tota1 <3 ~mA g/cm 3
25a 110a
230a
200a
70-200a 16b-50a 1-3b* 2.3b 0. 3b*
*Based on Figure 8.6.2-1.aTaback et al. 1979 bLee et al. 1975
Particle Resistivity
ohm-cm
Process
Incliner Cleaner Unloading and
Dryer
Production Rate
Unloading Separator Mote Cleaner Lint Cleaner Battery Condenser
\.0 I
N \.0
aTaback et a 1 . (1979).
TABLE 9.6.2-3. COTTON GINNING GAS
Gas Flowrate Nm3 /kg
(unless otherwise noted}
5.8 Nm 3 /s 5.2 Nm 3/s
2.8 Nm 3/s
1. 2 Nm 3 /s 6.2-8.3 Nm 3/s
7. 5-11. 5 Nm 3 / s
CHARACTERISTICS
Temgerature C
62a
46a
21a 22a
23-27a 28a
Chemical Composition, % VO 1, dry
(unless otherwise noted)
3% H20a 0.8% H20a
0.2% H20a 0.9% H20a 0.3-0.2% H20a 2% H20a
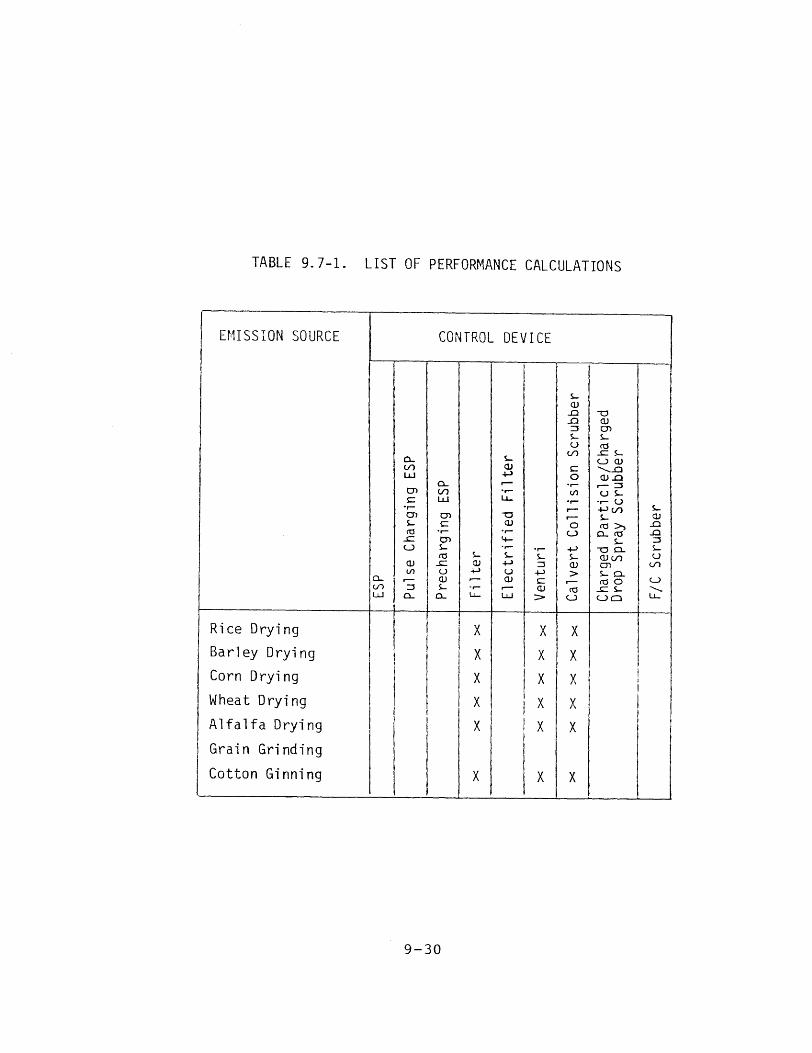
TABLE 9.7-1. LIST OF PERFORMANCE CALCULATIONS
I
EMISSION SOURCE CONTROL DEVICE
0.. (../')
w
a.. (/) w 0)
C •,-en S-t'Cl
..c: u Cl) Ul
r--:::,
a..
a.. (/) w O> C
•r-O'l S-t'Cl
..c: u QJ S-
a..
s.. a., .µ ,--..... LL..
S-Cl) .µ ,--·.-LJ..
-0 (JJ
•r-4-•,-S-.µ u Cl)
,--LL.I
•r-s.. :::, .µ C Cl)
>
S-Cl)
..Q
..Q :::, S-u
(/)
C 0
·r-(/')
•r-,--r--0
u .µ S-Cl)
> r--t'Cl
u
-0 QJ en S-(1j
..c: S-u QJ ---......a Cl) .0
r-- :::s u S-
·r- u .µ (/) S-t'Cl >, a.. t'Cl
S--0 0.. Cl)(/) O"l S- 0.. Cd 0
..c: S-uo
S-Cl)
..Cl
..Cl :::, S-u
(./)
u .......... LI...
Rice Drying
Barley Drying
Corn Drying
Wheat Drying
Alfalfa Drying
Grain Grinding
Cotton Ginning
X
X
X
X
X
X
X
X
I X I
XI I X
X
X
X
X
X
X
X
I I
I
I
I
9-30
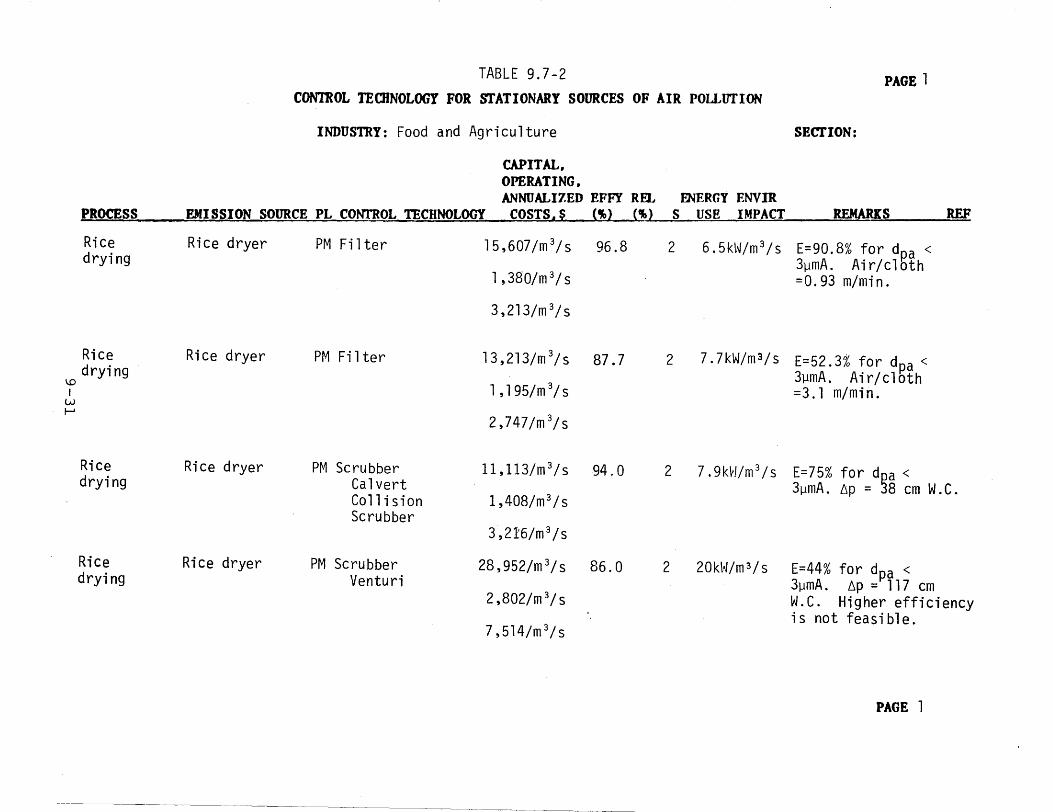
TABLE 9.7-2 PAGE l CON'mOL TECHNOLOGY FOR STATIONARY SOURCES OF AIR POLLUl'ION
INDUSTRY: Food and Agriculture SECTION:
CAPITAL, OPERATING, ANNUALIZED EFFY REL ENERGY ENVIR
P_ROCE_SS EMISSION SOURCE PL_ CONTROL TECHNOLOGY__ ~COSTS, $ (~) (ll,) S USE IMPACT REMARKS REF
Rice Rice dryer PM Filter 15,607/m 3/s 96.8 2 6.5kW/m 3/s E=90.8% for dpa <drying 3µmA. Air/clothl ,380/m 3/s =0.93 m/min.
3,213/m 3/s
Rice Rice dryer PM Filter 13,213/m 3/s 87.7 2 7. 7kW/m 3 /s E=52.3% for dpa <drying 3µmA. Air/cloth\D
I l ,195/m 3 / s =3.1 m/min.w
I--'
2,747/m 3/s
Rice Rice dryer PM Scrubber ll,113/m 3/s 94.0 2 7. 9kvl/m 3 / s E=75% for d~a <drying Calvert 3µmA. ~p = 8 cm W.C.
Collision 1,408/m 3 /sScrubber
3,21:6/m 3 /s
Rice Rice dryer PM Scrubber 28,952/m 3/s 86.0 2 20kH/m3/s E=44% for dpa <drying Venturi 3µmA. 6p = 117 cm 2,802/m 3/s w.c. Higher efficiency
is not feasible. 7,514/m 3/s
PAGE l
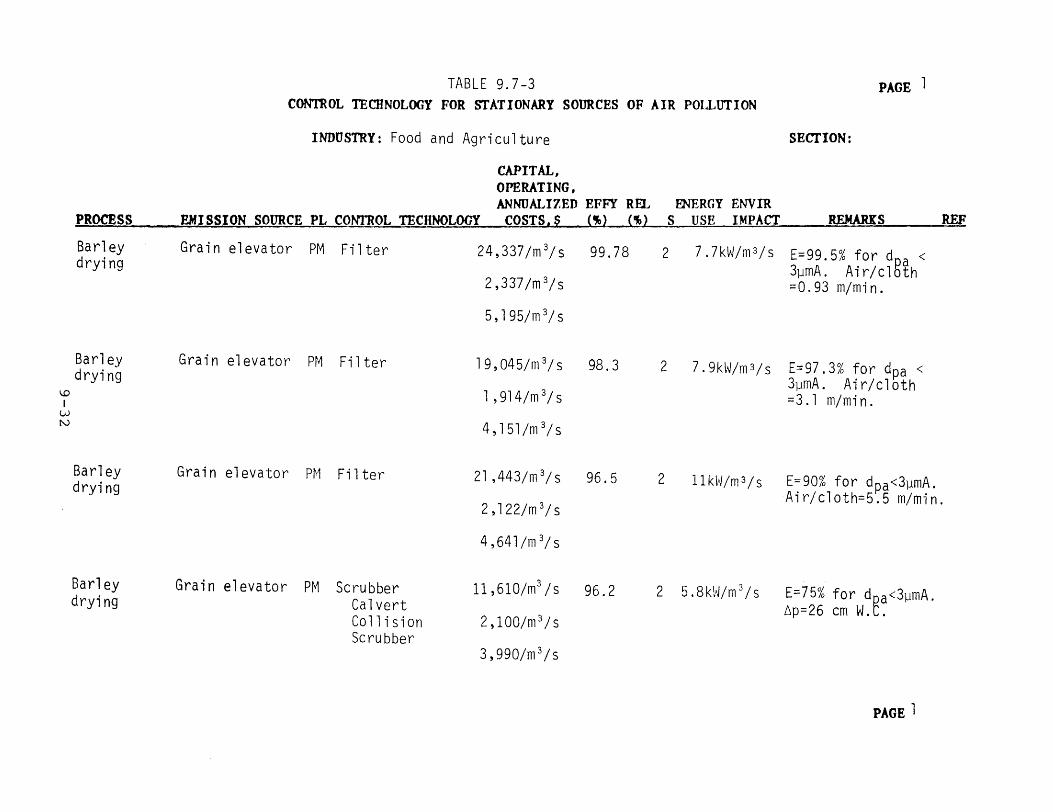
l TABLE 9.7-3 PAGE CON"m.OL TECHNOLOGY FOR STATIONARY SOURCES OF AIR POLLUTION
INDUSTRY: Food and Agriculture SECTION:
CAPITAL, OPERATING, ANNUALIZED EFFY Ra ENERGY ENVIR
PROCESS EMISSION SOURCE PL CONTROL TECHNOLOGY ~· ~COSTS, S ("} (~) S USE IMPACT REMARKS REF
Barley Grain elevator PM Filter 24,337/rn 3/s 99. 78 2 7 .7kW/m 3/s E=99.5% for dga <drying 3µrnA. Air/cl th2,337/rn 3/s =0.93 rn/rnin.
5, l 95/rn 3/s
Barley Grain elevator PM Filter l9,045/rn 3/s 98.3 2 7.9kW/rn3/s E=97.3% for dpa <drying 3µmA. Air/clothI..O l ,914/rn 3/s =3 . l rn/ rn i n . I w N 4, 151 /rn 3
/ s
Barley Grain elevator PM Filter 21 ,443/rn 3/s 96.5 2 llkW/m3/s E=90% for dpa<3µrnA.drying Air/cloth=5.5 rn/rnin.
2, l 22/rn 3/s
4,641 /rn 3/ s
Barley Grain elevator PM Scrubber 11,610/rn3/s 96.2 2 5.8kt•J/rn 3 /s E=?5% for dQa<3µrnA.drying Calvert 6p-26 cm W.C.Collision 2, 100/rn 3/ s Scrubber
3,990/rn 3/s
PAGE 1
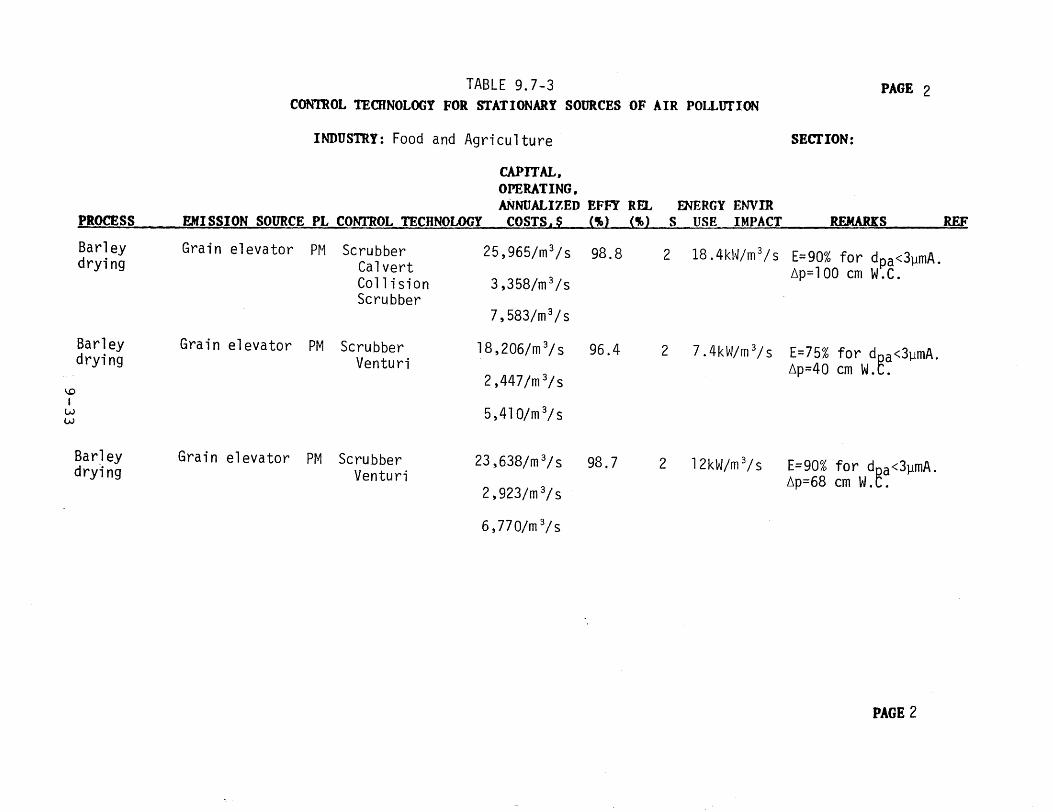
TABLE 9.7-3 PAGE 2 CON'mOL TECHNOLOGY FOR STATIONARY SOURCES OF AIR POLLUTION
INDUSTRY: Food and Agriculture SECTION:
CAPITAL, OPERATING, ANNUALIZED EFFY Rll. F.NERGY ENVIR
PROCESS l!J{I~SSION SOURCE PL~ COm-ROL TECHNOLOGY~-~COSTS, S (~) (-..) S USE IMPACT REMARKS REE
Barley Grain elevator PM Scrubber 25,965/m 3/s 98.8 2 18. 4kt~/m 3 Is E= 90% for dpa <3µmA.drying Calvert ~p=lOO cm W.C.Co 11 i si on 3,358/m 3/sScrubber
7,583/m 3/s
Barley Grain elevator PM Scrubber 1 8 , 2 06/ m / s 96.4 23 7.4kW/m 3/s E=~5% for dQa<3µmA.drying Venturi ~p-40 cm W.c.
2,447/m 3/s ~
I w 5,410/m 3/ sw
Barley Grain elevator PM Scrubber 23,638/m 3/s 98.7 2 12kW/m 3/s E=~O% for dga<3µmA.dry1ng Venturi ~p-68 cm W.c.2, 923/m 3Is
6, 770/m 3/s
PAGE 2
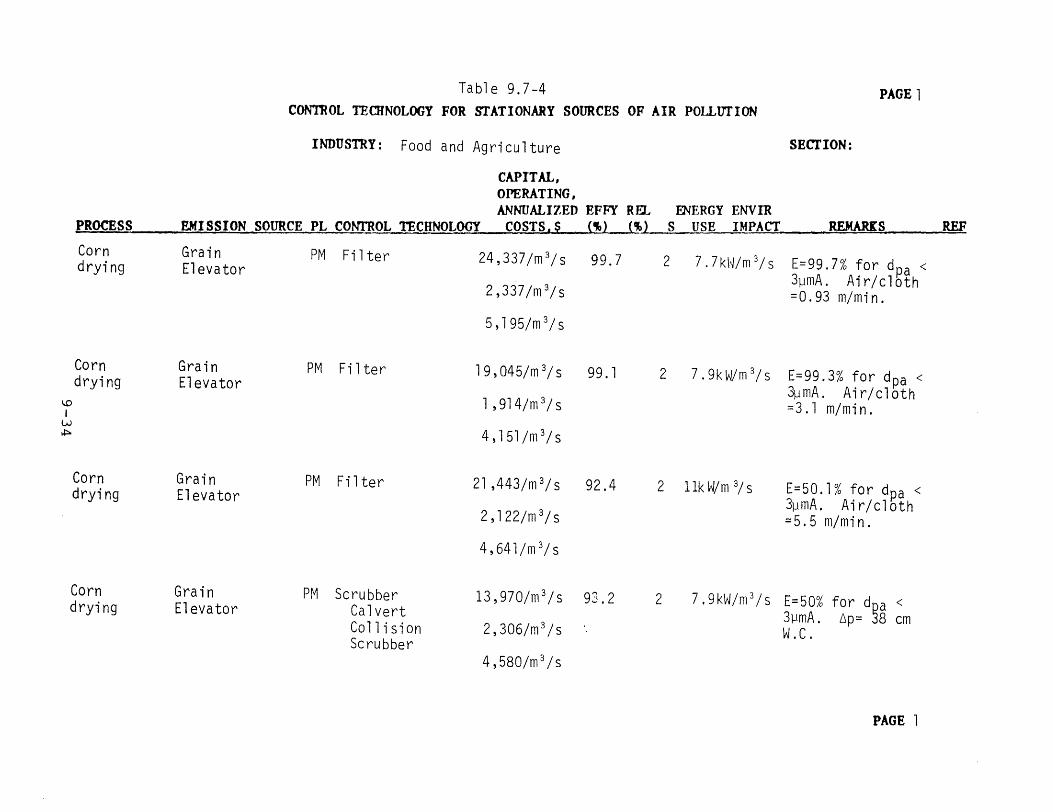
Table 9.7-4 PAGE l CC>NnOL TECHNOLOGY FOR STATIONARY SOURCES OF AIR POLLUI'ION
INDUSTRY: Food and Agriculture SECTION:
CAPITAL, OPERATING, ANNUALIZED EFFY RF.l., F.NERGY ENVIR
PROCESS EMISSION SOURCE PL COm-ROL TECHNOLOGY COSTS,~ ('l (~l s USE IMPACT_ _ REMARKS_~-- REF
Grain PM FilterCorn 24,337/m 3/s 99. 7 2 7. 7kl~/m 3/ sdrying Elevator E=99.7% for dpa <
3µmA. Air/cloth2,337/m 3/s =0.93 m/min.
5, 195/m 3 / s
Corn Grain PM Filter l9,045/m 3/s 99. l 2 7.9kW/m 3/s E=99.3% for dpa <drying Elevator 3µ mA . Ai r / c 1 o th
1 , 914/m 3/ sI..O I =3.l m/min.
w i,I:::,,, 4,l51/m 3/s
Corn Grain PM Filter 21,443/m 3/s 92.4 2 l lk Wm 3/ s E=50.1% for dpa <drying Elevator
3µ mA . Ai r /cl o th 2,122/m 3/s =5.5 m/min.
4,64l/m 3/s
Corn Grain PM Scrubber 13,970/m 3 /s 93.2 2 7.9kW/m 3 /s E=50% for d~a <drying Elevator Calvert 3µmA. 6p= 8 cmCollision 2,306/m 3 /s W.C.Scrubber
4,580/m 3 /s
PAGE l
CONTROL TECHNOLOGY Table 9.7-4 FOR m'ATIONARY SOURCES OF AIR POLLtrrION
PAGE 2
INDUSTRY: Food and Agriculture SECTION:
PROCESS
CAPITAL, OPERATING, ANNUALIZED EFFY Rll.
EMISSION~~SOURCR PL~ CONTROL TECHNOLOGY ~~~COSTS, S (4') (.-,) ENERGY
S USE ENVIR IMPACT REMARKS REF
Corn drying
Grain Elevator
PM Scrubber Venturi
18,206/m 3/s
2,447/m 3/s
93.l 2 7. 4k \IJ/m 3 / s E=50% for d[)a
3µmA. t6.p= 40 W.C.
< cm
5,410/m 3/s
I..O I
w U1
PAGE 2
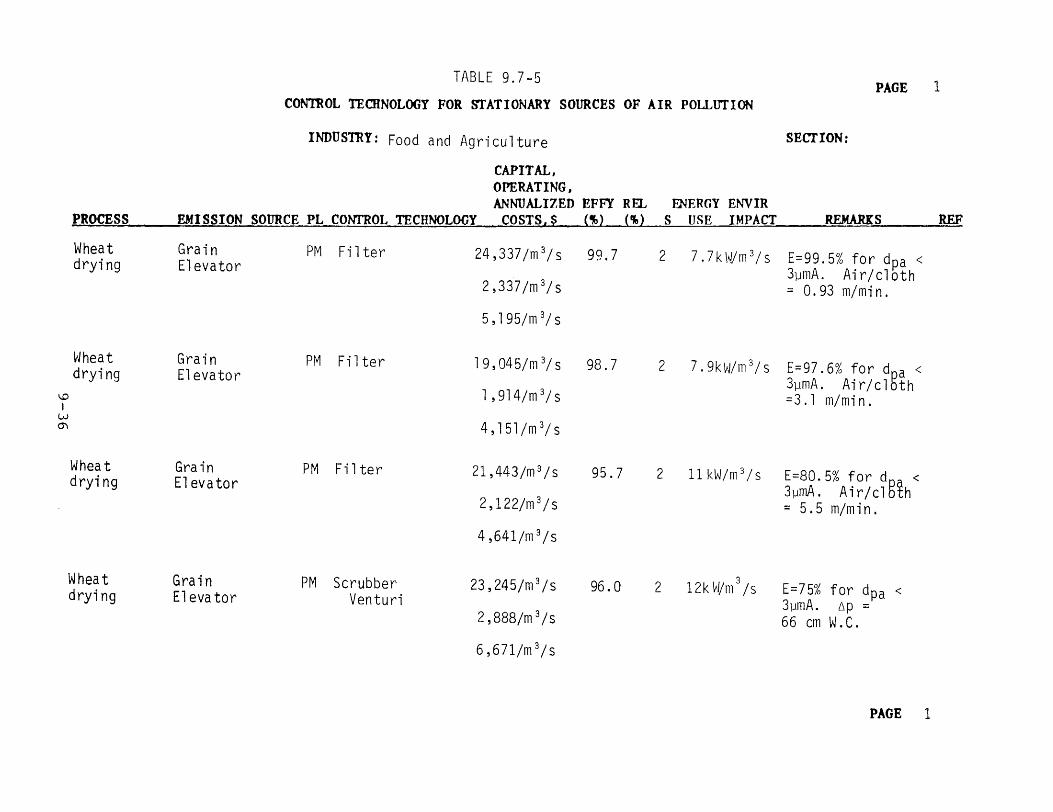
TABLE 9.7-5 PAGE 1
CONTROL TECHNOLOGY FOR STATIONARY SOURCES OF AIR POLLUTION
INDUSTRY: Food and Agriculture SECTION:
CAPITAL, OPERATING, ANNUALIZED EFFY REL °'1ERGY ENVIR
PROCESS EMISSION SOURCE PL COm-ROL TECHNOLOGY~ _~COSTS,$ ('3) (') s USE IMPACT REMARKS REF
Wheat Grain PM Filter 24,337/m 3/s 99.7 2 7. 7k Wm 3/ s E=99.5% for dpa <drying Elevator 3µmA. Air/cloth
2,337/m 3/s = 0.93 m/min.
5, 195/m 3/ s
vJhea t Grain PM Filter l 9 , 04 5 / m 3/ s 98.7 2 7. 9k vJ/m 3 / s E=97.6% for dpa <drying Eleva tor 3µmA. Air/cloth
l ,914/m 3/s"° I =3.1 m/min.
w O"I 4,151/m 3/s
Wheat Grain PM Fi 1ter drying Eleva tor
21,443/m 3 /s 95.7 2 11 kW/m 3 / s E=80.5% for dgi <
3µmA • A i r / c 1 h2,122/m 3 /s = 5.5 m/min.
4,641/m 3 /s
Wheat Grain 3PM Scrubber 23,245/m 3/s 96. 0 2 12k Wm /s E=75% for dpa <drying Eleva tor Venturi 3µmA. 6p = 2,888/m 3/s 66 cm W.C.
6,671/m 3 /s
PAGE 1
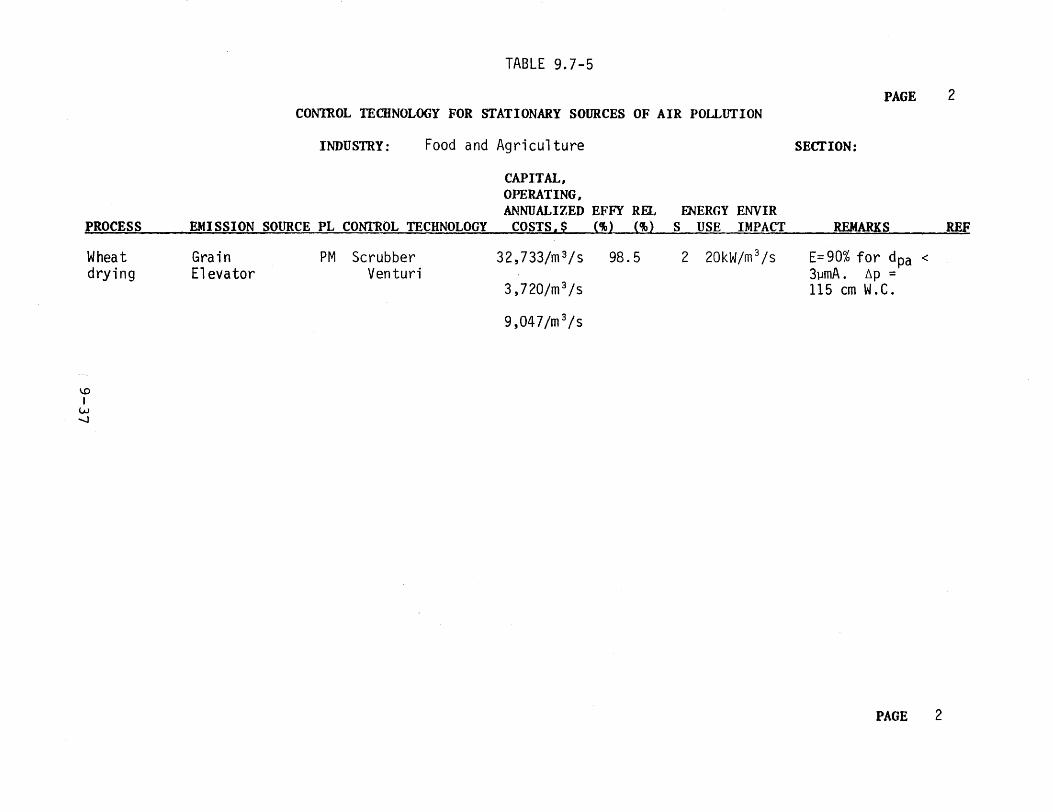
TABLE 9.7-5
CONnOL TECHNOLOGY FOR STATIONARY SOURCES OF AIR POLLUTION PAGE 2
INDUSTRY: Food and Agriculture SECTION:
PROCESS EMISSION·SOURCE PL CONTROL TECHNOLOGY
CAPITAL, OPERATING, ANNUALIZED EFJ.Y REL
COSTS,$ (%) (%) ENERGY
S USE ENVIR IMPACT REMARKS REF
Wheat drying
Grain Elevator
PM Scrubber Venturi
32,733/m 3 /s
3,720/m 3 /s
98.5 2 20kW/m 3 /s E= 90% for dpa 3µmA. Lip = 115 cm W. C.
<
9,047/m 3 /s
\.0 I
w -..J
PAGE 2
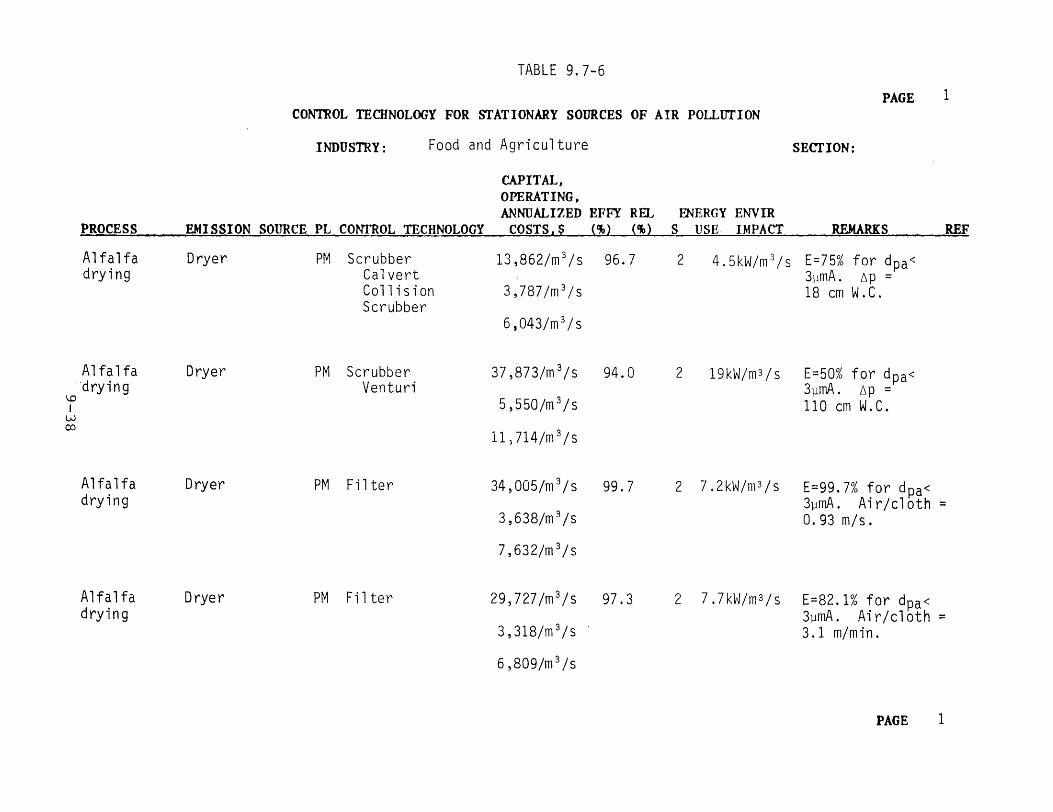
TABLE 9. 7-6
PAGE 1 CONTROL TECHNOLOGY FOR STATIONARY SOURCES OF AIR POU,OTJON
INDUSTRY: Food and Agriculture SECTION:
CAPITAL, OPERATING, ANNUALIZED EFFY REL ENERGY ENVIR
PROCESS EMISSION SOURCR PL~ CONTROL TECHNOLOGY~~~ COSTS,$ (%) (%) S USE IMPACT REMARKS REF
Alfalfa Dryer PM Scrubber 13,862/m 3 /s 96.7 2 4.5kW/m 3 /s E=75% for dpa<drying Calvert 3µmA. t1p =
Collision 3,787/m 3 /s 18 cm W.C. Scrubber
6,043/m 3 /s
Alfalfa Dryer PM Scrubber 37,873/m 3/s 94.0 2 19kW/m 3 /s E=50% for dpa<·drying Venturi 3µmA. 6p =
I..O I 5,550/m 3/s 110 cm W. C.
w CD
11; 714/m 3 /s
Alfalfa Dryer PM Filter 34,005/m 3/s 99.7 2 7.2kW/m 3 /s E=99.7% for dpa<drying 3µmA. Air/cloth=
3,638/m 3/s 0. 93 m/s.
7,632/m 3/s
Alfalfa Dryer PM Filter 29,727/m 3 /s 97.3 2 7.7kW/m 3 /s E=82.1%fordpa<drying 3µmA. Air/cloth=
3,318/m 3/s 3.1 m/min.
6 ,809/m 3 /s
PAGE 1
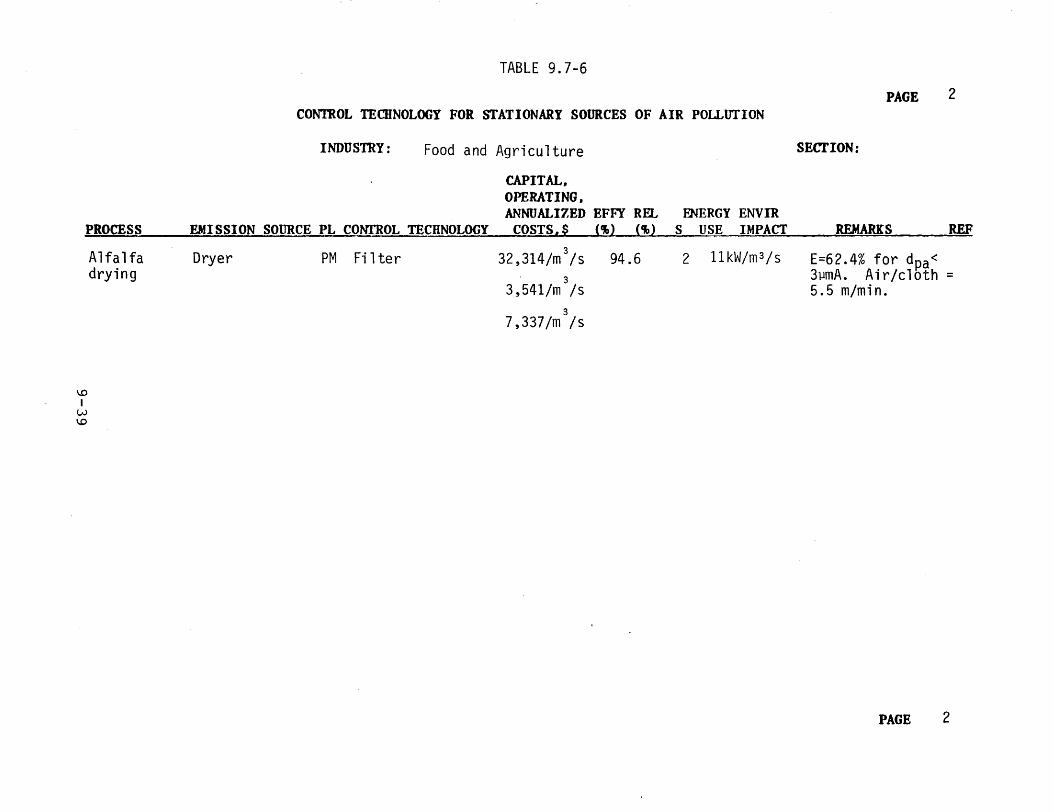
TABLE 9.7-6
PAGE 2 CONTROL TECHNOLOGY FOR STATIONARY SOURCES OF AIR POLLUTION
INDUSTRY: Food and Agriculture SECTION:
CAPITAL~ OPERATING, ANNUALIZED EFFY REL F.NERGY ENVIR
PROCESS EMISSION SOURCE_pL _CONTROL TECHNOLOGY COSTS,$ (~) (~) S USE IMPACT REMARKS REF
Alfalfa Dryer PM Filter 32,314/m 3 /s 94.6 2 llkW/m 3 /s E=62.4% for dpa<
drying 3 3µmA. Air/cloth=3,541/m /s 5.5 m/min.
37,337/m /s
I.O I
w I.O
PAGE 2
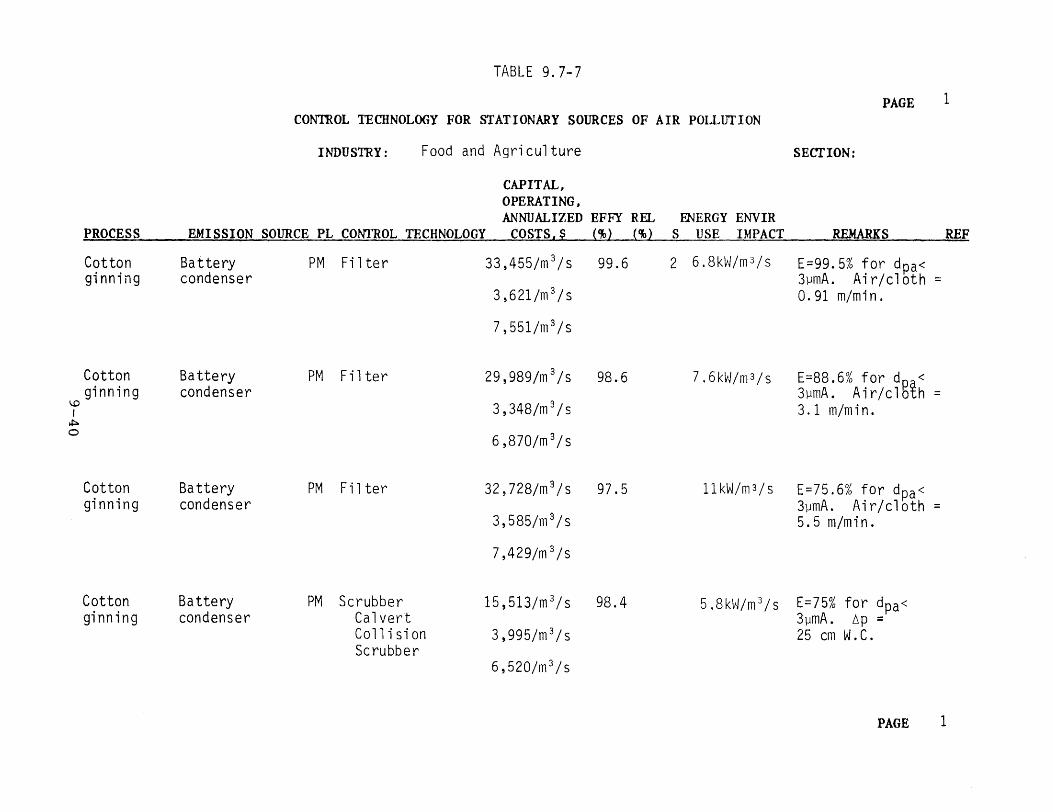
TABLE 9. 7-7
1PAGE CON'IBOL TECHNOLOGY FOR STATIONARY SOURCES OF AIR POLLUTION
INDUSTRY: Food and Agriculture SECTION:
CAPITAL, OPERATING, ANNUALIZED EFFY REL ENERGY ENVIR
PROCESS EMISSION SOURCE PL CONTROL TECHNOLOGY COSTS,$ {%~ {%~ s USE IMPACT _ _~. REM.ARKS _REF
Cotton Battery PM Filter 33,455/m 3/s 99.6 2 6.8k~J/m3/s E=99.5% for dpa<ginning condenser 3µmA. Air/cloth=
3,621 /m 3/ s 0.91 m/min.
7,551/m 3 /s
Cotton Battery PM Filter 29,989/m 3/s 98.6 7 . 6 k ~J/ m 3 / s E=88.6% ford < ginning condenser 3µmA. Air/clgih =
I..O I 3,348/m 3/s 3.1 m/min. ~ 0
6,870/m 3/s
Cotton Battery PM Filter 32, 728/m 3 /s 97.5 llkW/m3/s E=75.6% for dpa<ginning condenser 3µmA. Air/cloth=
3,585/m 3 /s 5.5 m/min.
7,429/m 3 /s
Cotton Battery PM Scrubber 15,513/m 3/s 98.4 5.8kW/m 3 /s E=75% for dpa<ginning condenser Calvert 3µmA. tp =
Collision 3,995/m 3 /s 25 cm W.C. Scrubber
6,520/m 3 /s
PAGE 1
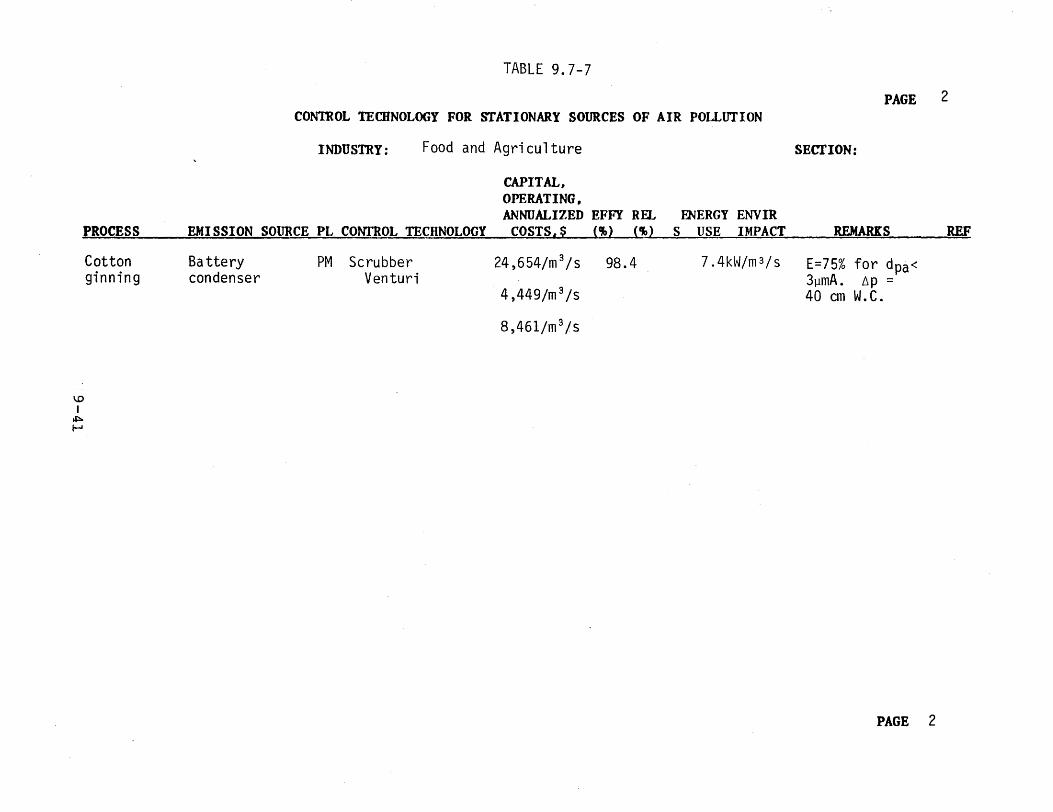
TABLE 9.7-7
PAGE 2 CONTROL TECHNOLOGY FOR STATIONARY SOURCES OF AIR POLLUTION
INDUSTRY: Food and Agriculture SECTION:
CAPITAL, OPERATING, ANNUALIZED EFFY REL ENERGY ENVIR
PROCESS EMISSION SOURCE PL~ CONTROL TECHNOLOGY COSTS,$ (%) (%) S USE IMPACT REMARKS REF
Cotton Battery PM Scrubber 24,654/m 3/s 98.4 7.4kW/m 3/s E=75% for dpa<ginning condenser Venturi 3µmA. tip =
4,449/m 3/s 40 cm W.C.
8,461/m 3/s
\.0 I ~ I-'
PAGE 2
SECTION 9
REFERENCES
Agrotherm Division, Norman Pitt, Inc., 1980._ Cotton Gin Trash Incinerator-Air Heat Project. PS00-80-018, Caliifornia Energy Commission, Sacramento, California, 29 pp._
Annis, J._ C., S._ L._ Lima, V. E. Headley, 1970. Evaluation of the Liquid Fat Injection Method of Controlling Alfalfa Dehydrator r;ffluent. Journal of the Air Pollution Control Association, 20:23:30.
Bethea, R. M.• , and P. R._ Morey, 1977. Occupational Dust Exposures in West Texas Cotton Gins. American Industrial Hygiene Association, 38:284-294.
Brown, D. F.1 E. R. McCall, B. Piccolo, V. W. Tripp, 1977. Survey of Effects of Variety and Growing Location of Cotton on Cardroom Dust Composition. American Industrial Hygiene Association Journal, 38:107-115.
California Air Resources Board, 1980. Emission Inventory System Computer Data; Food and Agricultural Sources._ Sacramento, California.
Cowherd, Jr., Chatten, 1971. Particle Emissions and Process Conditions at Representative Alfalfa Dehydrating Mills. American Dehydrators Association, Kansas City, Missouri, 38 pp.
Da n i e 1 son, John A. , e ai to r , 1 9 7 3 • Ai r Po 11 u t i on En g i n e e r i n g Manual, 2nd Edition. AP40, U.S. Environmental Protection Agency, Washington, D.C., 892 pp.
Farant, Jean-Pierre and C. F._ Morre, 1978._ Dust Exposures in the Canadian Grain Industry. American Industrial Hygiene Association Journal, 39:177-194._
Hardison, L.C., 1973. Air Pollution Control and Costs in Seven Selected Areas. EPA450/3-73-010, U.S. Environmental Protection Agency, Research Triangle Park, North Carolina, 707 pp.
Kuo, M.C.T., and P._ E. Kyle, 1978. Overview of the Environmental Control Measures and Problems in the Food Processing Industries, Appendix 15, Grain Milling Industry. U. s. Environmental Protection Agency, Cincinnati, Ohio, 10 pp.
9-42
Lee, Jr., R. E., H. L. Grist, A. E. Hiley, K. E._ MacLeod, 1975. Concentration and Size of Trace Metal Emissions from a Power Plant, a Steel Plant, and a Cotton Gin. Environmental Science and Technology, 9:643-647.
McLouth, M. E. and H. J._ Paulus, 1961. Air Pollution from the Grain Industry.. Journal of the Air Pollution Control Association, 11:313-317 •.
Pendleton, H. M., 1966. Current Gin Trash Disposal Techniques In: Control and Disposal of Cotton-Ginning Wastes. u. s. Department of Health, Education and Welfare, Cincinnati, Ohio, 103 pp.
Roddy, W. J., 1978. Controlling Cotton Gin Emissions. Journal of the Air Pollution control Association, 28:637-638.
Sittig, Marshall, 1977~ Particulates and tine Dust Removal. Noyes Data Corp., Park Ridge, New Jersey, 605 pp.
Taback, H. J., A._ R._ Brienza, J._ Marko, N._ Brunetz, 1979. Fine Particle Emissions from Stationary and Miscellaneous Sources in the South Coast Air Basin•. California Air Resources Board, Sacramento, California, 561 pp._
U. s. Department of Health, Education and Welfare, 1967. Control and Disposal of Cotton-Ginning Wastes._ Cincinnati, Ohio, 103 pp.. . .
Vandegrift, A•. E. and L. J._ Shannon, 1970. Handbook of Emissions, Effluents, and Control Practices for Stationary Particulate Pollution Sources.. National Air Pollution Control Association, Cincinnati, Ohio, 607 pp •.
W e s 1 e y, R. A. , J. . D. Ha t ch e r , 0. . L. Mc Ca s k i 11, an d J. . B. Co c k e , 1978a. uust Levels and Particle Size Distributions in High Capacity Cotton Gins.. American Industrial Hygiene Association Journal, 39:368-384.
Wesley, Richard A • ., and James H. Wall, 1978b. Levels and Chemical Composition of Cotton Gin Dust. American Industrial Hygiene Association Journal, 39:962-975.
9-43

SECTION 10
METALLURGICAL SOURCES
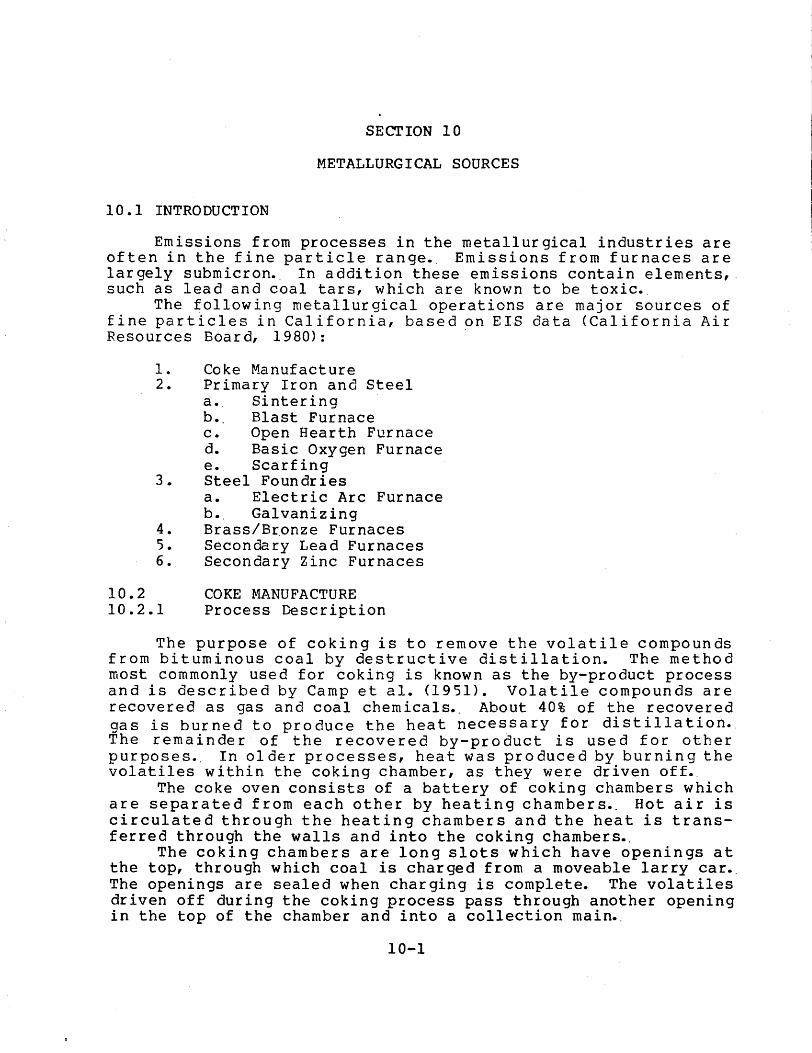
10.1 INTRODUCTION
Emissions from processes in the metallurgical industries are often in the fine particle range._ Emissions from furnaces are largely submicron._ In addition these emissions contain elements,. such as lead and coal tars, which are known to be toxic.
The following metallurgical operations are major sources of fine particles in California, based on EIS data (California Air Resources Boar a, 19 80):
1. Coke Manufacture 2. Primary Iron and Steel
a._ Sintering b. Blast Furnace c. Open Hearth Furnace a. Basic Oxygen Furnace e. Scarfing
3. Steel Foundries a. Electric Arc Furnace b._ Galvanizing
4. Brass/Bronze Furnaces 5. Secondary Lead Furnaces 6 •. Secondary Zinc Furnaces
10.2 COKE MANUFACTURE 10.2.1 Process Description
The purpose of coking is to remove the volatile compounds from bituminous coal by destructive distillation. The method most commonly used for coking is known as the by-product process and is described by Camp et al. (1951). Volatile compounds are recovered as gas and coal chemicals._ About 40% of the recovered gas is burned to produce the heat necessary for distillation._ The remainder of the recovered by-product is used for other purposes .. In older processes, heat was produced by burning the volatiles within the coking chamber, as they were driven off._
The coke oven consists of a battery of coking chambers which are separated from each other by heating chambers.. Hot air is circulated through the heating chambers and the heat is transferred through the walls and into the coking chambers._
The coking chambers are long slots which have openings at the top, through which coal is charged from a moveable larry car._ The openings are sealed when charging is complete. The volatiles driven off during the coking process pass through another opening in the top of the chamber and into a collection main._
10-1
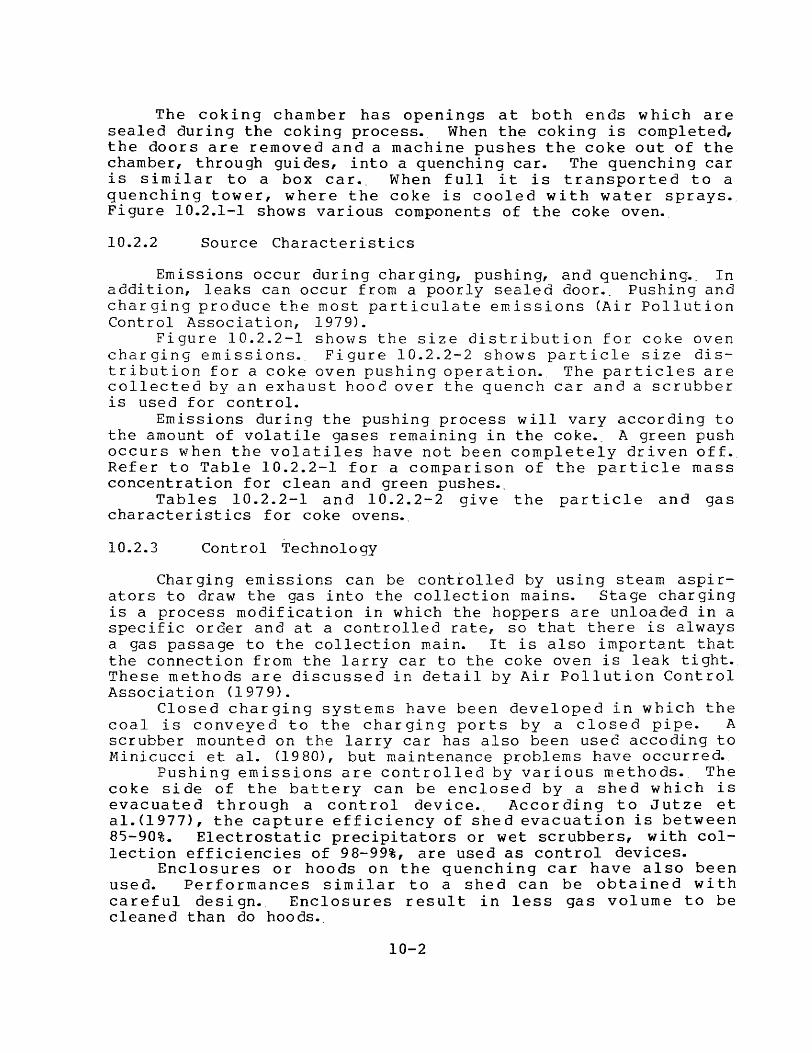
The coking chamber has openings at both ends which are sealed during the coking process. When the coking is completed, the doors are removed and a machine pushes the coke out of the chamber, through guides, into a quenching car. The quenching car is similar to a box car._ When full it is transported to a quenching tower, where the coke is cooled with water sprays. Figure 10.2.1-1 shows various components of the coke oven._
10.2.2 Source Character is tics
Emissions occur during charging, pushing, and quenching._ In addition, leaks can occur from a poorly sealed door._ Pushing and charging produce the most particulate emissions (Air Pollution Control Association, 1979).
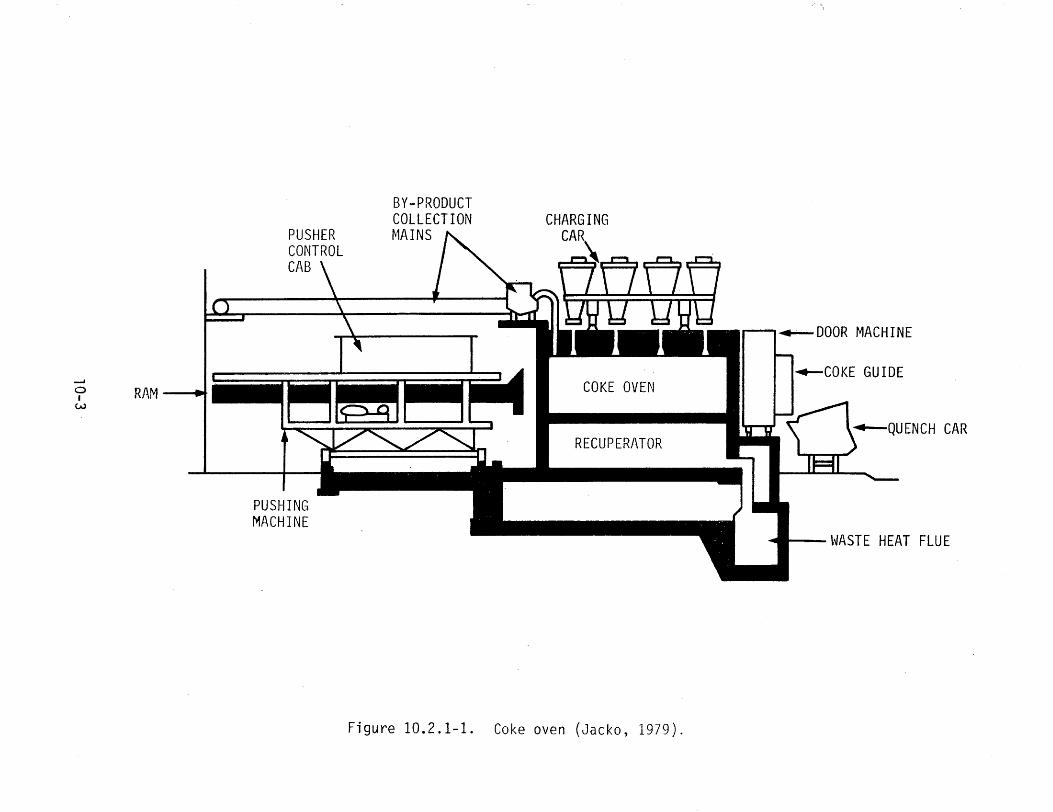
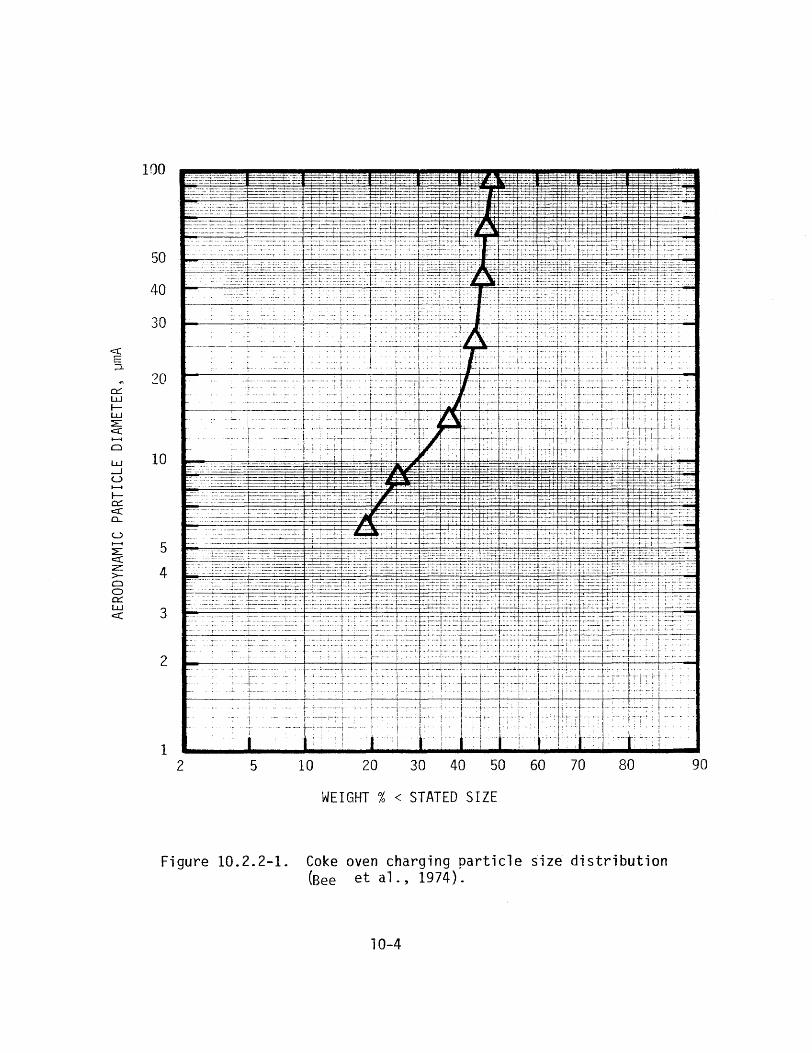
Figure 10.2.2-1 shows the size distribution for coke oven charging emissions. Figure 10.2.2-2 shows particle size distribution for a coke oven pushing operation._ The particles are collected by an exhaust hood over the quench car and a scrubber is used for control.
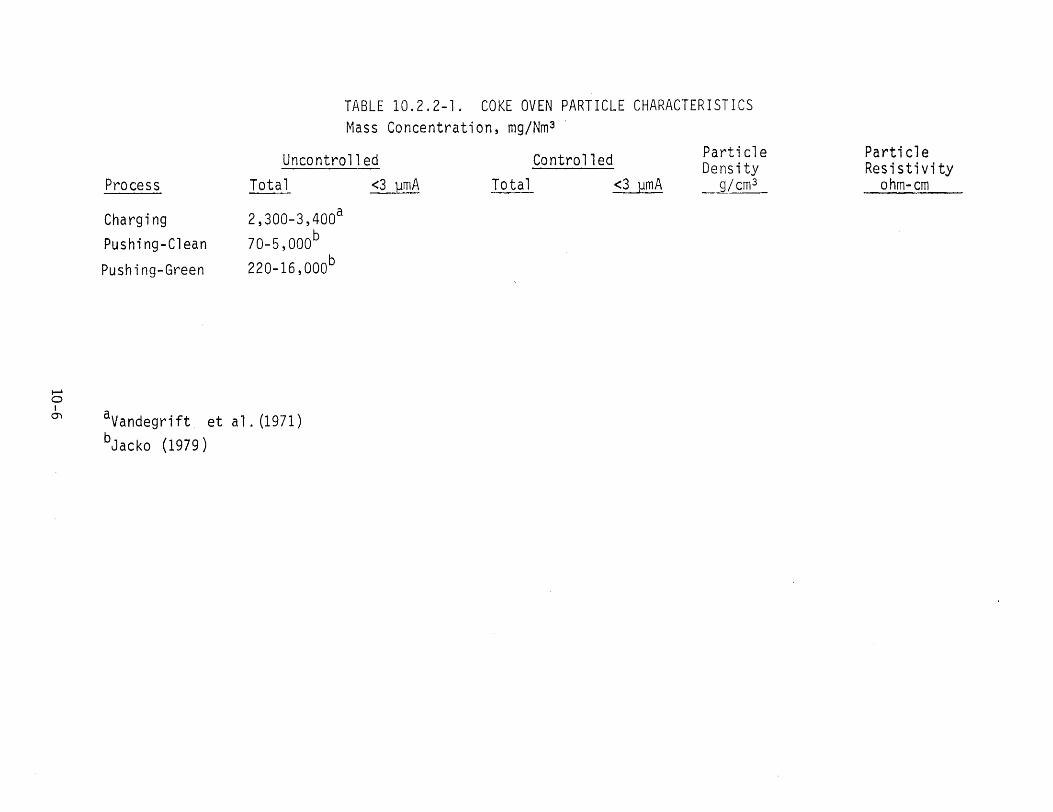
Emissions during the pushing process will vary according to the amount of volatile gases remaining in the coke._ A green push occurs when the volatiles have not been completely driven off._ Refer to Table 10.2.2-1 for a comparison of concentration for clean and green pushes•.
Tables 10.2.2-1 and 10.2.2-2 give the characteristics for coke ovens.
the particle mass
particle and gas
10.2.3 Control Technology
Charging emissions can be controlled by using steam aspirators to draw the gas into the collection mains. Stage charging is a process modification in which the hoppers are unloaded in a specific order and at a controlled rate, so that there is always a gas passage to the collection main. It is also important that the connection from the larry car to the coke oven is leak tight. These methods are discussed in detail by Air Pollution Control Association (1979).
Closed charging systems have been developed in which the coal is conveyed to the charging ports by a closed pipe. A scrubber mounted on the larry car has also been used accoding to Minicucci et al. (1980), but maintenance problems have occurred.
Pushing emissions are controlled by various methods._ The coke side of the battery can be enclosed by a shed which is evacuated through a control device._ According to Jutze et al. (1977), the capture efficiency of shed evacuation is between 85-90%. Electrostatic precipitators or wet scrubbers, with collection efficiencies of 98-99%, are used as control devices.
Enclosures or hoods on the quenching car have also been used. Performances similar to a shed can be obtained with careful design._ Enclosures result in less gas volume to be cleaned than do hoods.
10-2
BY-PRODUCT COLLECTION CHARGING
PUSHER MAINS CAR CONTROL CAB
.,_COKE GUIDE __, 0 I RAM ... w
COKE OVEN
RECUPERATOR
PUSHING MACHINE
t11 WASTE HEAT FLUE
Figure 10.2.1-1. Coke oven (Jacko, 1979).
100
50
40
30
<C E ::i
20 O::'. w I-w :E: <C 1--1
0
w 10 _J u 1--1
I-O::'. c:( 0..
u 1--1
:E 5 c::( z >--0
4 0 O::'. w c::c 3
2
1 2 5 10 20 30 40 50 60 70 80 90
WEIGHT%< STATED SIZE
Figure 10.2.2-1. Coke oven charging particle size distribution (Bee et al., 1974).
10-4
10.0
V) w :c u z: 1-4
0::: w 1-w
-~ 1-4 C)
LL.I ...J u 1-1
1-- ~.::-==. ----+::--+ -+-·· ~=- -l--t;:~.::_:,:::=t_::-} tJf -~ ~+:r- + ::;~ -- ~-=:=~::::::~ff£.0::: ct: 0.. ---- -- ------- - ------ :::=;:.:~-:i.::~ :~?lfrf3~1- -~i:t ~: .11~!:rt~•+t $ ~~ ~a T. it -· ~ -t •--H--ti:~:dI ...J 0.5
-----~-~: · :+:::..~:::±.c::·,.:. .:.....=:r:_:;· :c ·:-~ -'!t=t'c ::ffJ:I ~:.': .ff :'fff:t, FF ~--It-1: -:c'g ,.it'. ii±i ,rte: .,. · ..:T;.:~; .-~l:.:°.:•:'ct: u ;:::._7 ·· -' - r: :::-L ~-~Tf_:J:t:: ;:::§_f .r-:::J=: ff:;:f::
-- - -+-+---+-1--- .,1-+
' i- +-t-
1.0
1-1 V) >:c 0..
.,
2 5 10 20 30 40 50 60 70 80
WEIGHT%< STATED SIZE
Fi gu re 10 . 2 . 2-2 . Coke oven pushing particle size distribution (Cooper et al., 1977).
10-5
90
Process
TABLE 10.2.2-1. COKE OVEN PARTICLE CHARACTERISTICS Mass Concentration, mg/Nm 3
ParticleUncontrolled Controlled Density Total <3 ~mA Total <3 ~mA g/cm3
Particle Resistivity
ohm-cm
Charging Pushing-Clean
Pushing-Green
2,300-3,400a 70-5,000b 220-16,000b
...... 0 I 0) avandegri ft et a 1. (1971)
bJacko (1979)
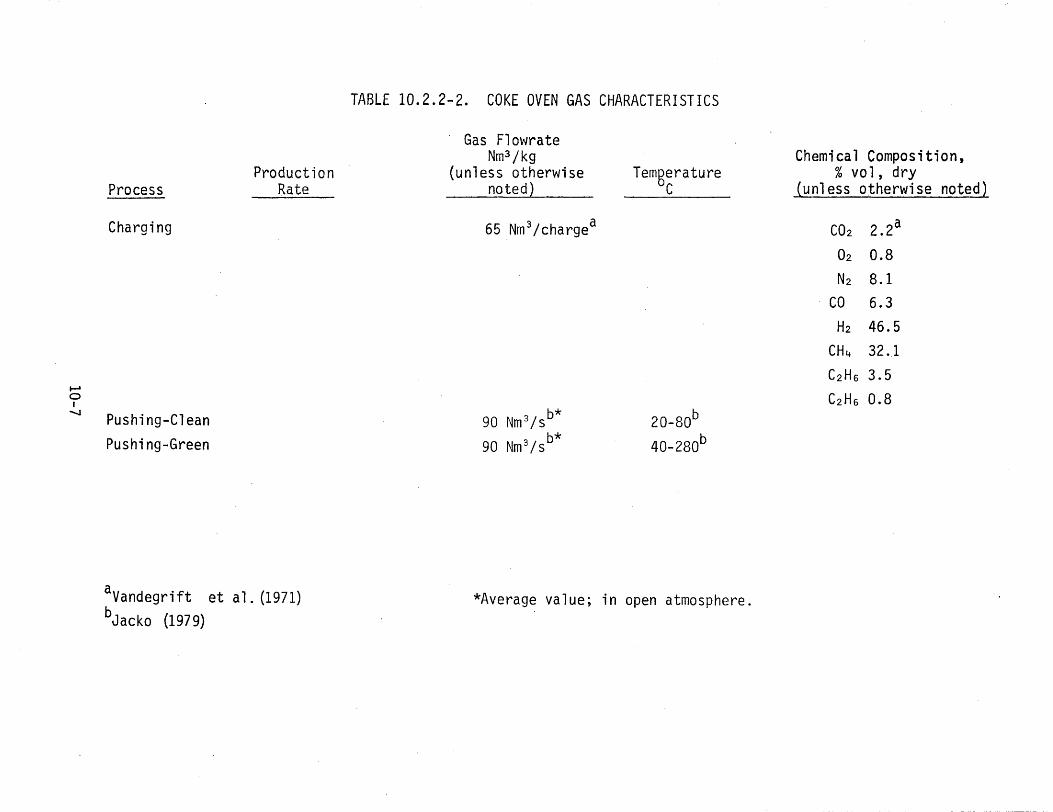
TABLE 10.2.2-2. COKE OVEN GAS CHARACTERISTICS
· Gas Flowrate Nm3 /kg Chemical Composition,
Production (unless otherwise Temgerature %vol,dry Process Rate noted2 C (unless otherwise noted)
Charging 65 Nm 3 /chargea CO2 2.2a
02 0.8
N2 8.1 . co 6.3
H2 46.5
CH4 32.1
C2HG 3.5 0 ~
I C2HG 0.8 --..J Pushing-Clean 90 Nm 3 /sb* 20-80b
b*Pushing-Green 90 Nm 3/s 40-280b
aVandegri ft et al. (1971) *Average value; in open atmosphere. b Jacko (1979)
A spray, ch a r gin g and trapping s c r u b be r ( SCAT) which uses air curtains to contain the push plume and direct it into a portable scrubber is being developed. The use of air curtains will allow easier access by the workers to the ovens according to Yung et al.. (1981).
An important process control is the reduction of green pushes._ A green push greatly increases the load on the collection and control system according to Jacko (1979).
10.3 PRIMARY IRON AND STEEL 10.3.1 Process Descriptions
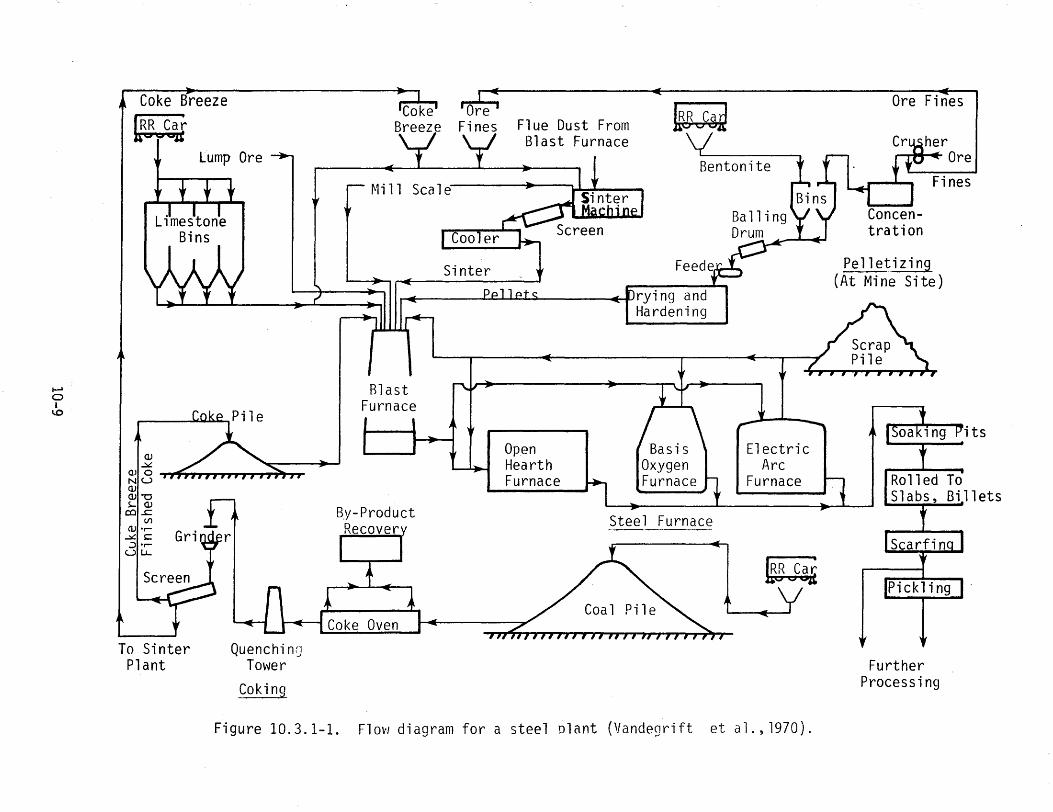
The production of iron and steel involves many processes as shown in Figure 10.3.1-1. The production of coke has been discussed will co
in the previous section, 10.2. ver the following processes:
Discussion in this section
1. 2. 3. 4. 5.
Sintering Iron Blast Furnace Open Hearth Steel Furnace Basic Oxygen Steel Furnace Scarfing
10.3.1 10.3.1.1
Process Descriptions Sintering
The sintering process converts iron ore fines, blast furnace flue dust, and mill scale into a product which is charged into the blast furnace. Coke breeze (the fines from coke), and a limestone flux are mixed with these iron-bearing residues and the mixture is fed onto a traveling grate,. according to Camp et al. (1951).
The coke b r e e z e i s i gn it ea i n an o i 1 or gas f i re a i gn it ion furnace. Combustion is maintained by a downdraft of air through the porous bed of the mixture._ The space under the bed is divided into compartments, known as wind boxes, which maintain a uniform distribution of the combustion air._ This process heats the mixture to the temperature at which the iron bearing particles fuse into larger agglomerates .. These are then crushed, screened, and cooled prior to being used to charge the blast furnace.
10.3.1.2 Blast Furnace
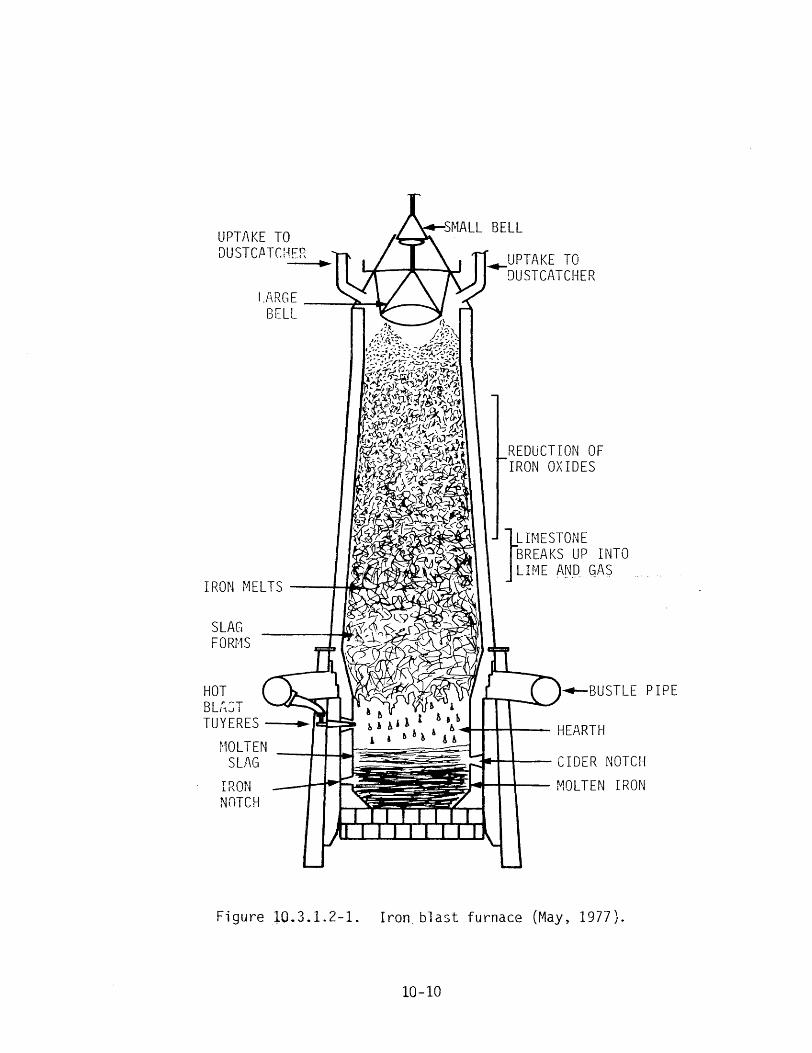
The blast furnace is a large upright cylinder called a cupola, as shown in Figure 10.3.1.2-1.. Iron bearing materials, coke, .and limestone and dolomite flux are charged into the top of the furnace. Hot, compressed air is blown in at the bottom of the furnace through tuyeres._ The charge descends downward, with the products collecting at the bottom. The gases are exhausted out the top.
10-8
Bentonite
Pelletizing (At Mine
Coke Breeze Flue Dust FromLRJ\,coif Breeze M Blast Furnace
Lump Ore
• LI Y
Feed
ce••e•> ..,,,rying and Hardening
I I f; S » I » I S Ji » » S J r"I I I
Mi 11 Sea 1 e
• ..-
Steel Furnace
Electric Arc
Furnace To Bi 11 ets----
•r-LL.
1--1 0 I
1..0
OJ ~
OJ O NU OJ OJ -c S- OJ
co ..c 1/)
<1J •r~ s::
Blast Furnace
By-Product Recover
Open Hearth Furnace
Basis Oxygen Furnace
.::, u
To Sinter Plant
kills~
Quenching To1t,er
Coking
Ore Fines
her ••" • Ore
Fines
Site)
its
Further Processing
Figure 10.3.1-1. Flow diagram for a steel olant (Vandegrift et al., 1970).
UPTAKE TO DUSTC,llTCHF.R
SLAG FORMS
HOT
TUYERES ----...Jl!!!:C~
MOLTEN SL/\G
IRON NOTCH
REDUCTION OF IRON OX IDES
LIMEST.BREAKSGr.·.JEUP INTO] LIME A!~.0 GAS .
.,_BUSTLE PIPE
~~--CIDER NOTCH MOLTEN IRON
Figure l0.3.1.2-1. Iron. blast furnace (May, 1977).
10-10
The combustion of the coke supplies the heat necessary fo·r melting and reduction of the iron. The carbon in the coke accounts for about 20% of the reduction in the furnace.. The remaining 80% is due to CO which forms from the coke and the bl-ast air •. The molten iron forms a pool in the bottom of the furnace.. The flux oxidizes the metalloids (sulphur, silicon and phosphorous) and forms a slag which floats on top of the molten iron•.
ihe gases leaving the top of the furnace typically go to an afterburner to cornbust the remaining CO. Heat recuperators or steam boilers are used in some installations to recover some of the heat from the flue gas. The ingoing blast air may be compressed by steam driven compressors and then heated in the heat recuperators to l,000°C-l,250°C before being blown through the tuyeres.
Uncontrolled emissions occur when the molten metal is tapped. As the metal flows through the runner to the ladle, it cools and gives off graphite particles known as kish•. The kish particles are light and flaky but large enough to settle out, which causes additional dust control problems due to reentrainrnent. Iron oxide particles are also emitted during tapping.
10.3.1.3 Open Hearth Furnace
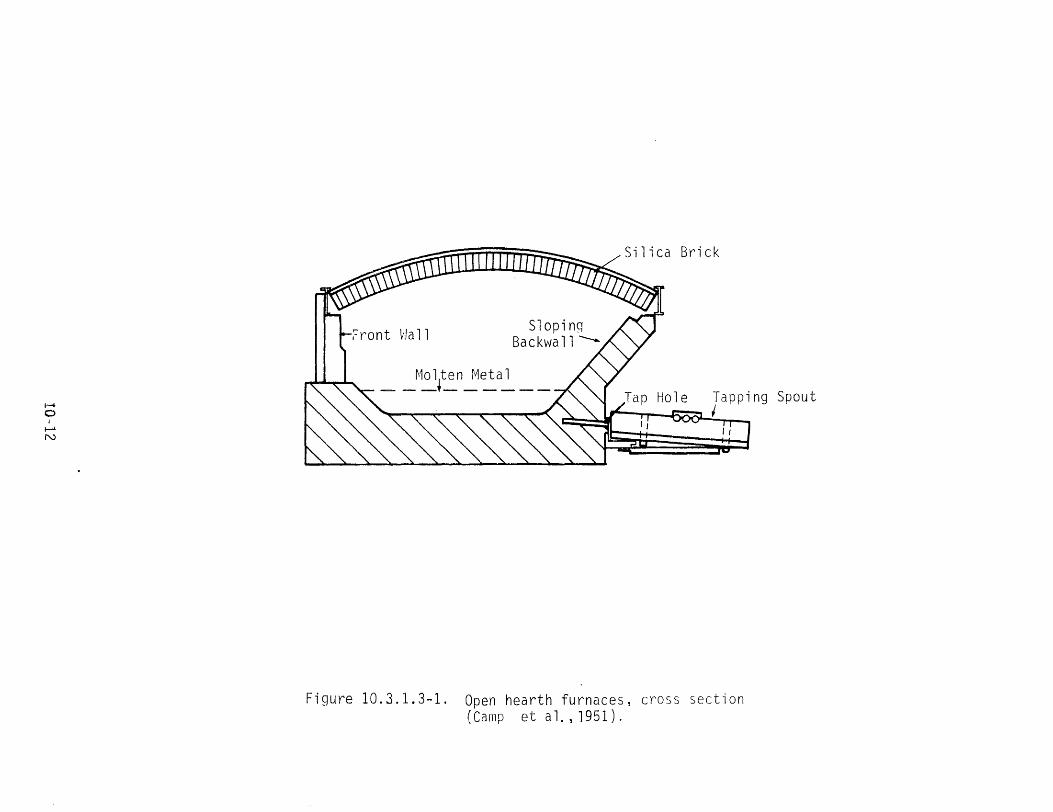
The hearth of an open hearth furnace is a shallow rectangular basin enclosed by walls and roof, both made of refractory material •. A cro~s-section of the hearth is shown in Figure 10.3.1.3-1. The process is described by Camp et al. (1951). Limestone is charged into the hearth first •. Pig iron, steel scrap, and iron ore are added in varying amounts. This charge is known as the heat and is melted by a flame which travels the length of the furnace, above tbe charge._ The flame is produced by the combustion of fuel which can include coke oven or natural gas, oil tar, or pitch.
At a certain stage in the melting process, rnol ten pig iron is added.. At this point oxygen lancing is begun. Oxygen lancing is the use of high velocity streams of pure oxygen to aid in the decarbonization of the molten metal.
Dust emissions vary from stage to stage within the cycle and according to operating conditions and the type of charge used.. Table 10.3.1.3-1 shows particle mass concentrations for various stages of steel making. Notice especially the increase in emissions due to oxygen lancin~-
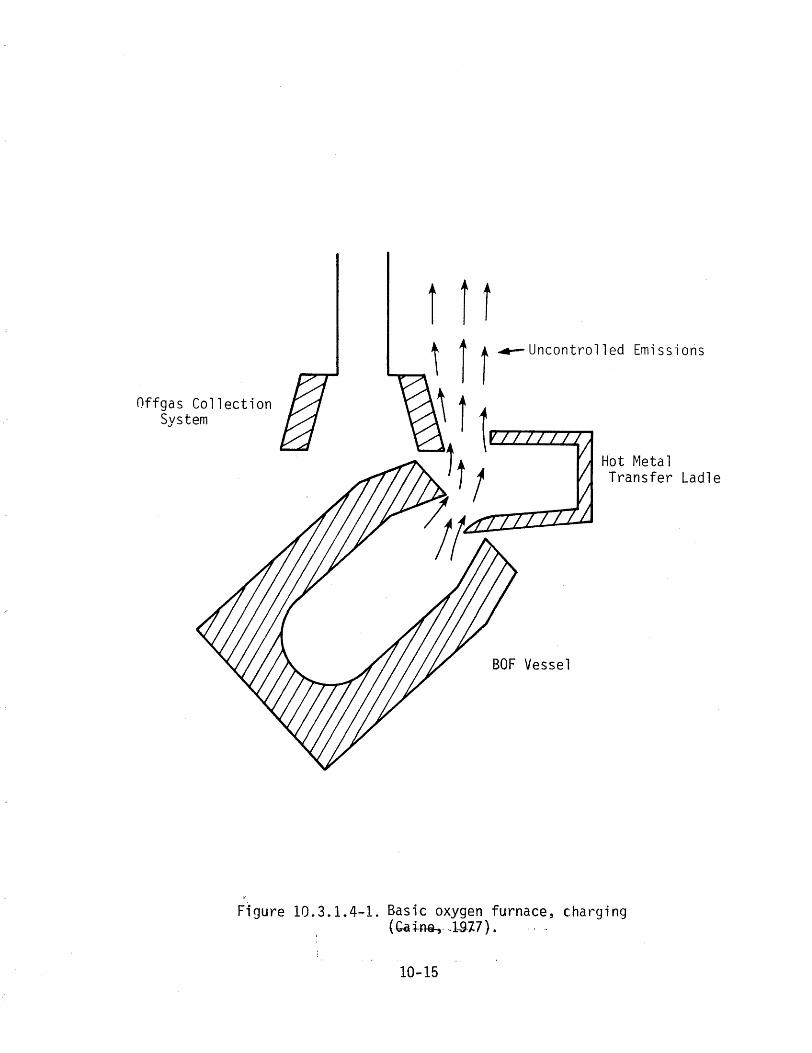
10.3.1.4 Basic Oxygen Furnace
The basic oxygen furnace is a pear shaped vessel with a refractory lining which can be rotated about a horizontal axis •. The top of the vessel is open, and when it is in the upright position the gas is exhausted through a water cooled hood•.
The furnace is tipped about 45° from the upright position
10-11
Silica Brick
i'1a l l
Mo \ten Metal ___,______ Spout......
0 I
I--' N
Figure 10.3.1.3-1. Open hearth furnaces, cross section (Camp et al. , 1951) .
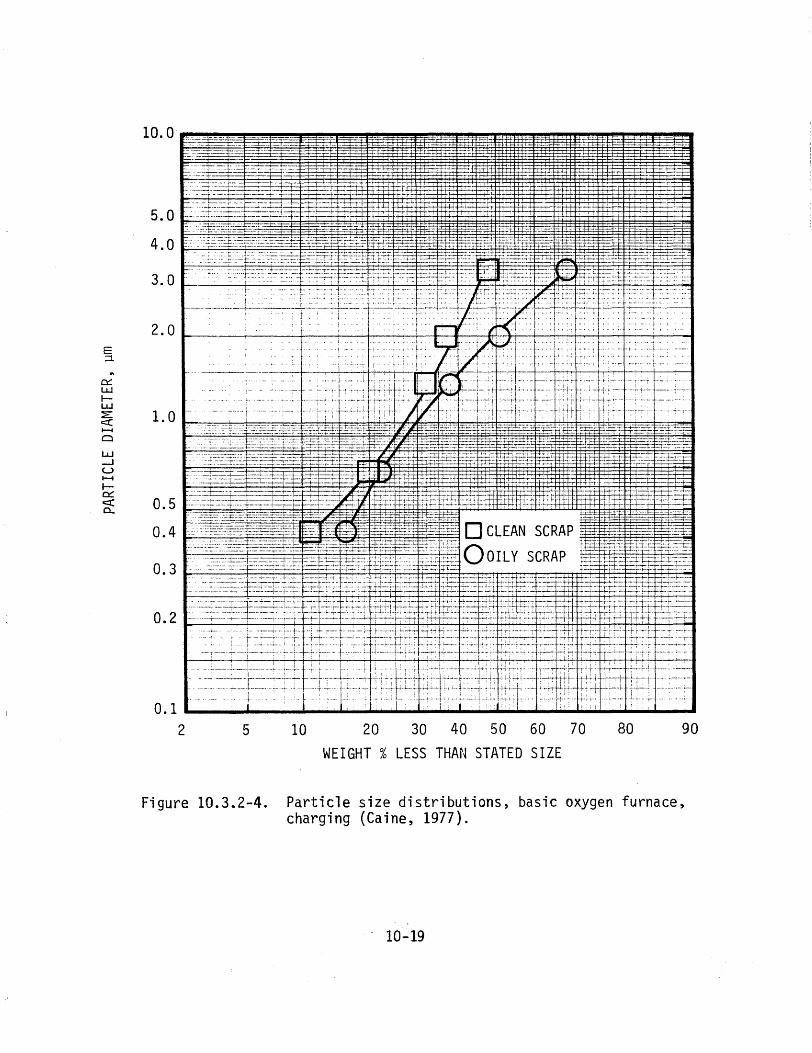
when it is charged. Figure 10.3.1.4-1 shows this process, and the emissions which occur. The charge consists of molten metal, steel scrap, and flux materials •. The particle emissions are primarily graphite particles emitted from the molten metal as it contacts the scrap. Emissions vary with the type of scrap being used according to Caine (1977), but the degree of variation has not been determined.
After charging, pure oxygen is forced below the surface by a water cooled lance. This process is known as blowing. No external heat is required to melt the scrap and refine the steel. Heat is supplied by the molten metal and the exothermic reactions between the oxygen and the metalloids (carbon and silicon) in the charge. The amount of steel scrap is limited to 30% of the charge ..
The time required for each cycle, or batch of steel, in the basic oxygen furnace is 30-60 minutes. The open hearth process can require up to 10 hours for one cycle .. However, the basic oxygen furnace requires a much larger quantity of molten metal•.
The emissions include silica particles and submicron iron oxide particles. When the carbon begins to oxidize, excess air is often added to the exhaust gas to reduce the CO concentrations •.
10.3.1.5 Scarfing
Ingots of cast steel are rolled into shapes known as slabs, billets, or blooms which are rectangles, squares, or rounds of various dimensions.. Surface defects must then be removed before further milling is done. This is accomplished by the process of scarfing in which jets of oxygen are directed at the heated steel. A scarfing machine removes about 0.3 cm (1/8 in.) of metal from four sides of slabs, blooms, or billets as they pass through it, according to Camp et al. (1951). This process is similar to cutting metal with a torch._
10.3.2 Source Character is tics
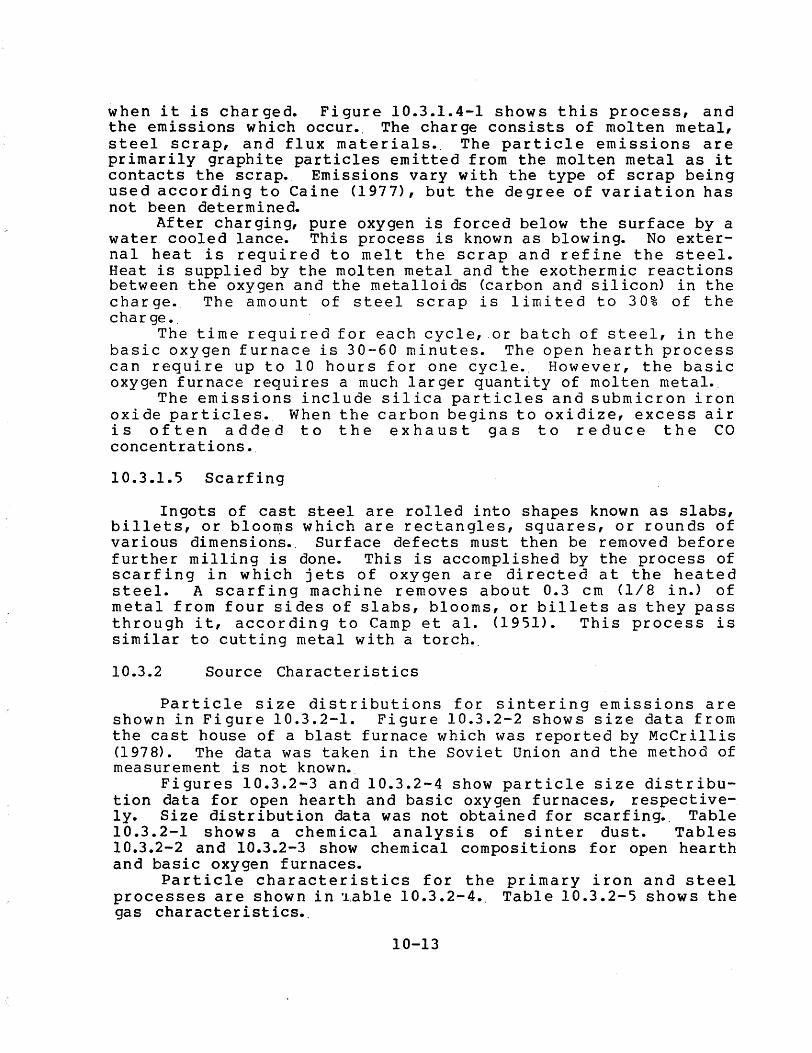
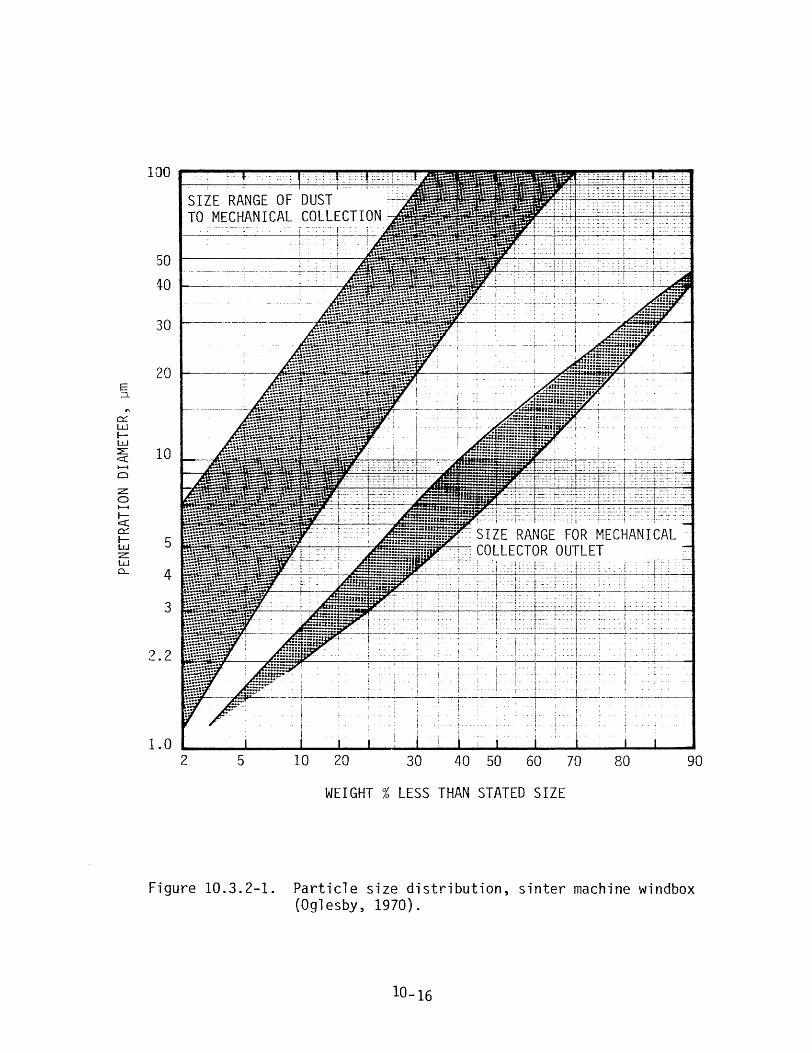
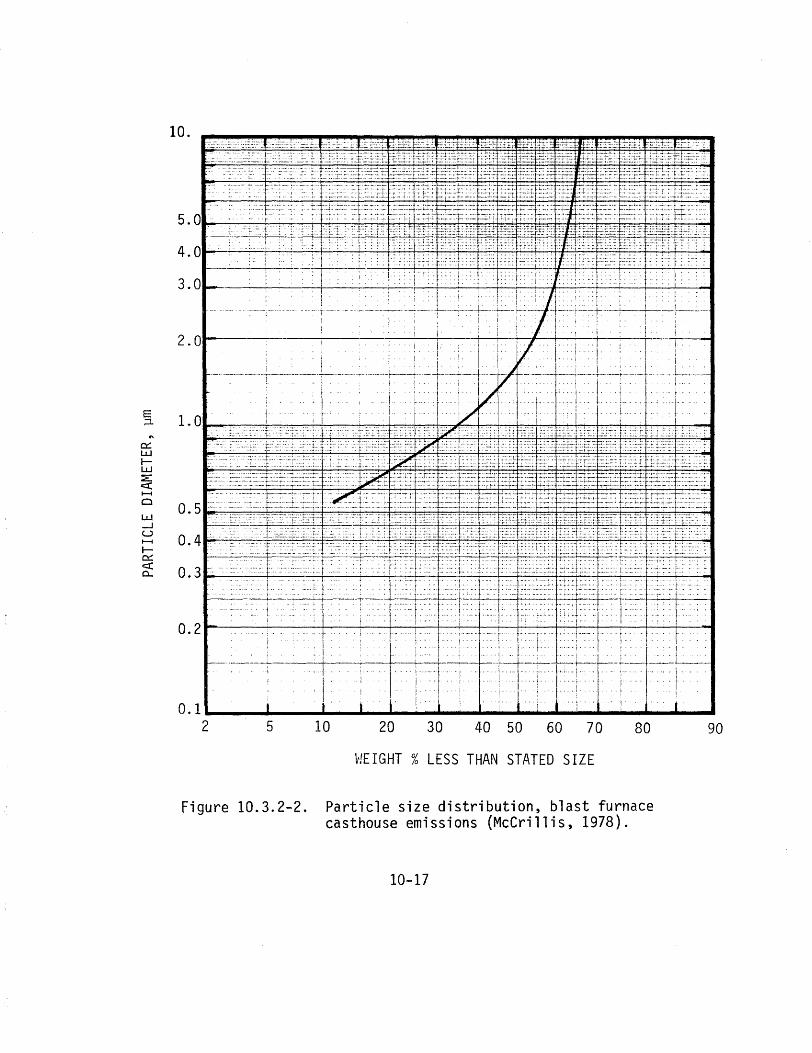
Particle size distributions for sintering emissions are show n in Fi g u r e 1 0 . 3 . 2 -1. Fi g u re 1 0 • 3 • 2- 2 show s s i z e data f r om the cast house of a blast furnace which was reported by McCrillis (1978). The data was taken in the Soviet Union and the method of measurement is not known.
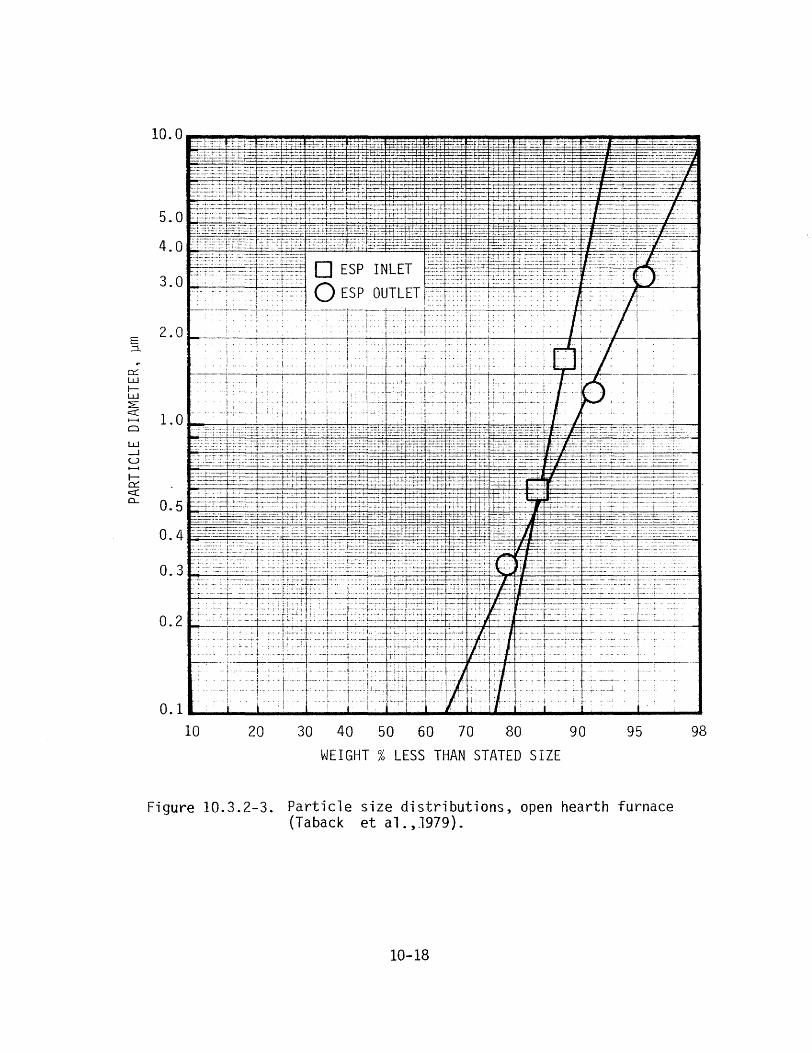
Figures 10.3.2-3 and 10.3.2-4 show particle size distribution data for open hearth and basic oxygen furnaces, respectively. Size distribution data was not obtained for scarfing._ Table 10.3.2-1 shows a chemical analysis of sinter dust. Tables 10.3.2-2 and 10.3.2-3 show chemical compositions for open hearth and basic oxygen furnaces.
Particle characteristics for the primary iron and steel processes are shown in ·1,able 10 .3. 2-4._ Table 10 .3. 2-5 shows the gas characteristics•.
10-13
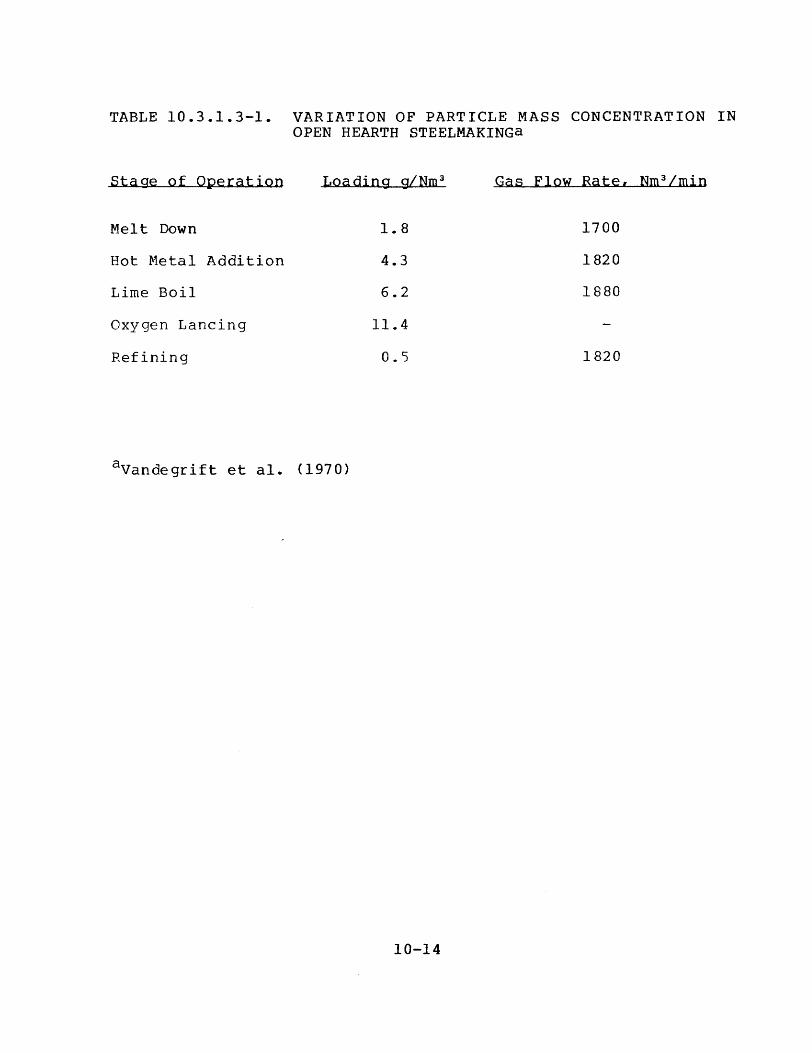
TABLE 10.3.1.3-1. VARIATION OF PARTICLE MASS CONCENTRATION IN OPEN HEARTH STEELMAKINGa
stage of Operation
Melt Down
Hot Metal Addition
Lime Boil
Oxygen Lancing
Refining
Loading g/Nm 3
1.8
4.3
6.2
11.4
0.5
avandegrift et al. (1970)
Gas Flow Rate, Nm 3 /min
1700
1820
1880
1820
10-14
Offgas Collection
-411- Uncontrolled Emissions
BOF Vessel
System
Figure 10.3.1.4-1. Basic oxygen furnace, charging {Ca 1-AQ..,- -19.i:7}.
10-15
100
50
1-0
30
20 E ;::l..
0:: LLJ 1-LLJ :::E c:::( 10 1--1
Cl
z: 0 1--1
le::( 0:: 1-LLJ 5 z LLJ 0.... 4
3
2.2
1.0
SIZE RANGE OF DU TO
I.
I i I i
-'-1_·--~--+----_!_____·_· ~------;
1·· I 1 r
60 70 80
j. I
2 5 10 20 30 40 50
WEIGHT% LESS THAN STATED SIZE
Figure 10. 3. 2-1. Particle size distribution, sinter machine windbox (Oglesby, 1970).
l0-15
90
10.
E ,::1.
c:::: w 1-w ~ c::c 1-1
Cl
w _J
u ·---~:___ ..:.-~:;..... :_·r.. .- -- · - .....:_ ~ _r_ ·:t~-~- -~•·._;:·i_...:);·;. _:_·:... 1::. •••• _.-:_~<-.: ··· -- -· ·_r-· ·:.: _·}:~-:-!) ~:-~~~---- ~ __ .. :~.- I- r .._::· ;:_-::· 1-1
I Q.41-;...:..~~~;;__.:~::.::::-···=---~-•~c.=.. ~ ...;;.:.j: ..~~-:-~=-~-.:~·:·--_+;;.;.;.+=-=: ..:+...~~--·~i~~~~~t,_~:i::..;:;.~i'-L,i;_~.-::.;;.:;·~,~~~ __ ~~::~~:~~....-~,.4_=;:..:=~~~~t~~:.~~.::..;..·~'.=F.~..~ ...:;.;:;.:~ .. ..~ ..~ .. ~:~·-ji __ ... ~L::~~~~J C:::: ·t. • ..1. ' ... . ... I ••c::c 0... 0 . 3,-----,---+-----,---~·---+--:--+---+·-~··_>_::....,.l_.. _.-➔-+-+-+--f-:--:-;-··•··-,'"..;.·.,·_...·._.··+··:_.. :._·._·t-L_:._:·_:·_:+--"·.,..•.;.·_-+----
;_.
I .
i·1
L.•..
. · ·- - :: t•.·::.. _:__:.: : --l~·-:. :·· ·:·· : · · · ·• -- · - • 1.[:,:: ..... · :.:: ::i·::: :;>1>
l l<:: :t: o.2----~--...+-,--.:...-----4--.--+--+--+--+-....j.....;_+-----<~_-1-.--+-_.;._-- t'_...:....·__.__ _ -l-~· __
1
i \·· .. \· , • . I
-1: f-· ----·-·····-·-•:
·r ·I·· ....--·----+----,---+----+--+---,---+--+-··-··-+-··-•--·-+-·~-~·,_:_:__ .,...1_·____· i_·___
: t.
! II j i·
·j · I I •··t.
i,·. I
._____• ..___...._ _._....,________._._____._..._I.....·.·;_,_.________, ____
i
2 5 10 20 30 40
WEIGHT% LESS THAN
50 60 70
STATED SIZE
80 90
Figure 10.3.2-2. Particle size distribution, blast furnace casthouse emissions (McCrillis, 1978).
10-17
E .=1..
0::: w I-w ~ <( 1--1
0
w _J
u 1--1
I-0::: <( CL
10 20 98
Figure 10.3.2-3.
5.0
4.0
3.0
2.0
1.0
0.5
0.4
0.3
0.2
---:--·-7:---·r•·· ! : T- -i t
I '
-------·-·•--·
30 40 50 60 70 80 90 95
WEIGHT% LESS THAN STATED SIZE
Particle size distributions, open hearth furnace (Taback et al.,1979).
10-18
10.0
5.0
4.0
3.0
2.0 E ;::l
0::: LL.I ILL.I ::E: 1.0c::(..... C)
LL.I ....I u ..... lo:: c::( 0.50..
0.4
0.3
0.2
0.1
-·--- .... ---- ----- - -- -··•-- ~----- --- -:-~·.:·:= __ --:~~ -~· -~-=---~~·-~--- ~:-· ~-~~t #fI~i~~~~:~:t~~;r1= ifil +~I:~ fit~iiE -~r± ~ f: it: :§:*=t~--=-;~~r-~;~~--___::~--:::.:.::::·..-· -----------~ ---· :.~- --~ ~:_ ~:-Fitffi~!=£~-~-~:11t· !-filf~§~:t-~~t --11:·---=1::lf =?~-;~:~ ~4~1~--=
~:.:-~·.~;r=~·--:--::--=:: _-+-_t=~:-L=!~~;.; l·.+ :t n-1:rgg;::.::."=1-t±l-i :q:j±~~ _ -l-~t--.:.-:;:t:j.:·=+i-t-·, -,-.'.-
:~-:-~:;::~:.--~·::·: -=~=~-=~;;:~-~ JM~ ~i!t# :IT-ffEff~~tfff1ilifftl~· ~:+r -£fi-~=sl1:-·. :x::;:·::;,·f;_:::~i~C:;=0~td:~f:·-~::i,?-f- F*°$ ":'i"F...f ~g= .L::f ~f:f-E ---H-•· :;=:::~:,,:: :: ·:1~:;;;...
I
2 5 10 20 30 40 50 60 70 80 90
WEIGHT% LESS THAN STATED SIZE
..::~= .. ··+-
:
...•... J.
:,',
Figure 10.3.2-4. Particle size distributions, basic oxygen furnace, charging (Caine, 1977).
10-19
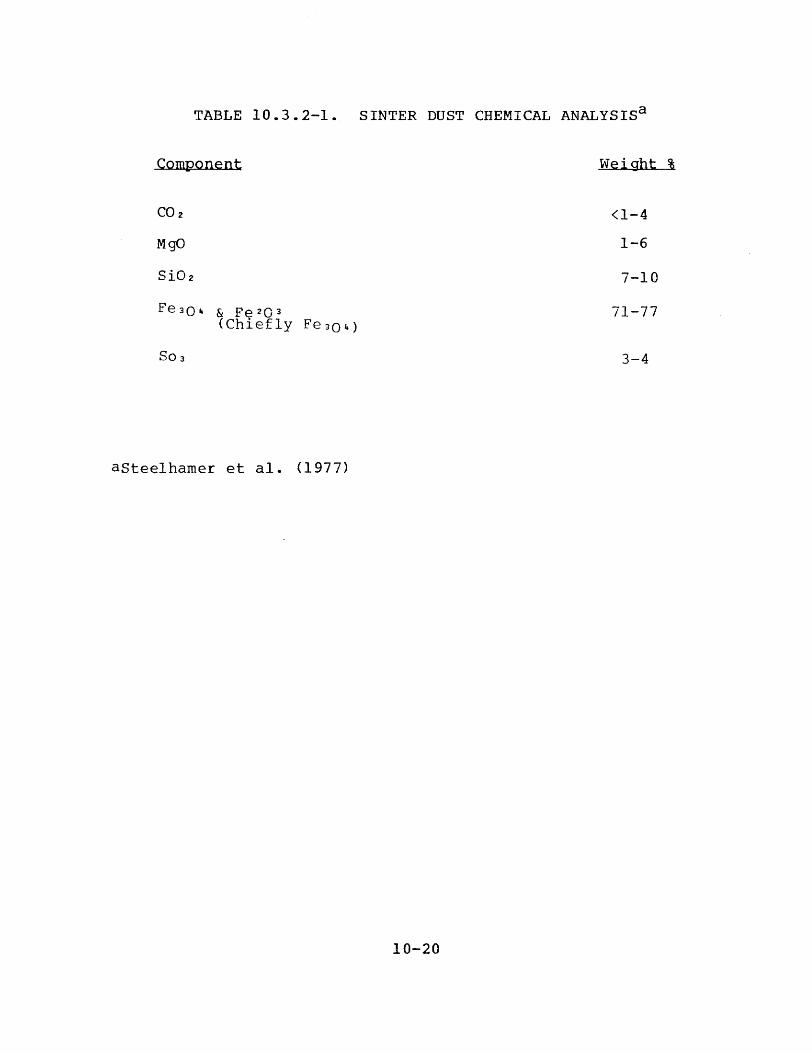
TABLE 10.3.2-1. SINTER DUST CHEMICAL ANALYSISa
Component Weight %
CO2 <1-4
MgO 1-6
Si02 7-10
Fe 3Qti & p~2Q3 71-77 (Chiefly Fe 3Q 4)
S03 3-4
asteelharner et al. (1977)
10-20
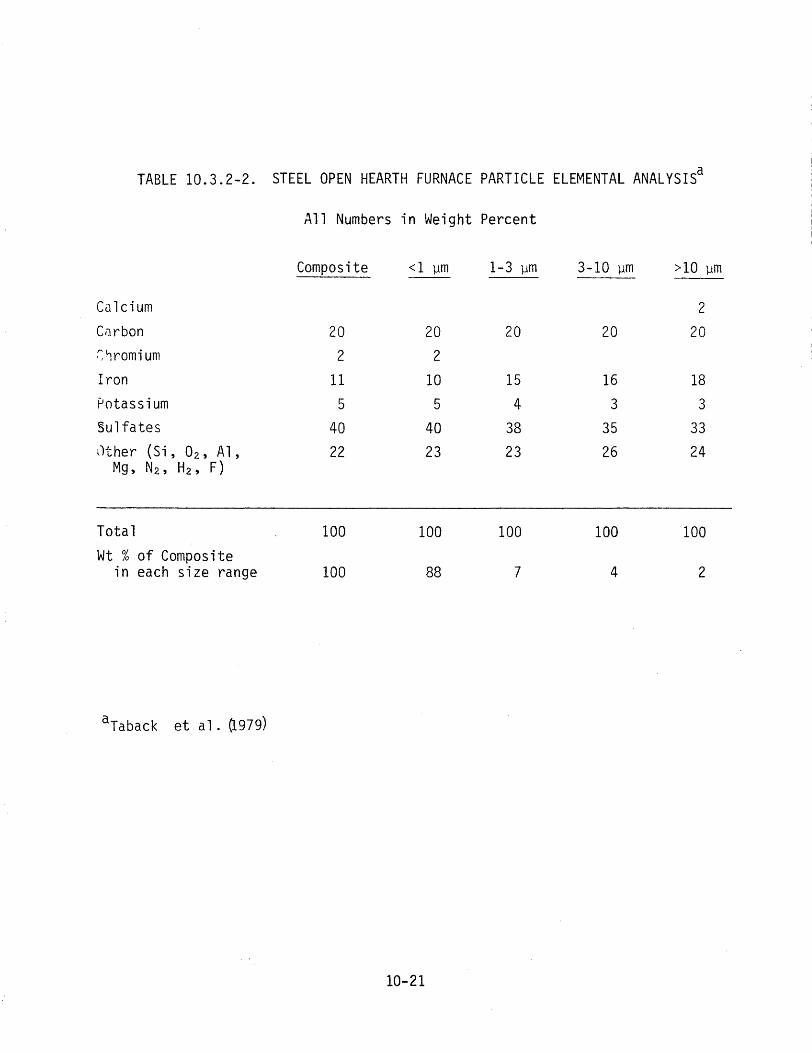
TABLE 10.3.2-2.
Cu.lei um
Ci1rbon ~ '1romi um Iron Potassium Sulfates
Ycher (Si, 02, Al, Mg, N2, H2, F)
STEEL OPEN HEARTH FURNACE PARTICLE ELEMENTAL ANALYSISa
All Numbers in Weight Percent
Composite <l µm 1-3 µm 3-10 µm >10 µm
2
20 20 20 20 20
2 2
11 10 15 16 18
5 5 4 3 3
40 40 38 35 33
22 23 23 26 24
Total 100 100 100 100 100
Wt% of Composite in each size range 100 88 7 4 2
aTaback et al. 0.979)
10-21
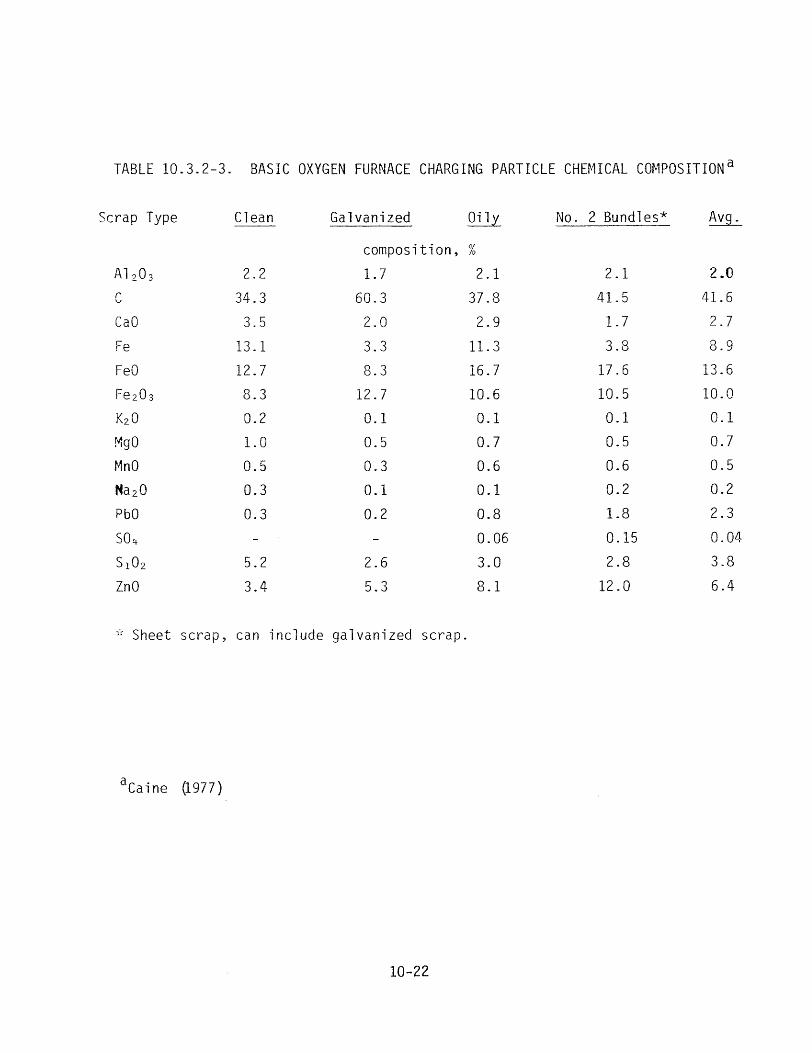
TABLE 10.3.2-3. BASIC OXYGEN FURNACE CHARGING PARTICLE CHEMICAL COMPOSITIONa
Scrap Type Clean Galvanized
composition,
Al203 2.2 1. 7 r I.., 34.3 60.3
CaO 3.5 2.0
Fe 13.1 3.3
FeO 12.7 8.3
Fe203 8.3 12.7
K20 0.2 0.1
MgO 1.0 0.5
MnO 0.5 0.3
Na20 0.3 0.1
PbO 0.3 0.2
so4 S102 5.2 2.6
ZnO 3.4 5.3
,': Sheet scrap, can include galvanized scrap.
aCaine (1977)
QD_y
%
2.1
37.8
2.9
11. 3
16.7
10.6
0.1
0.7
0.6
0.1
0.8
0.06
3.0
8.1
No. 2 Bundles* ~
2.1 2.0
41. 5 41.6
1. 7 2.7
3.8 8.9
17.6 13.6
10.5 10.0
0.1 0.1
0.5 0.7
0.6 0.5
0.2 0.2
1.8 2.3
0.15 0.04
2.8 3.8
12.0 6.4
10-22
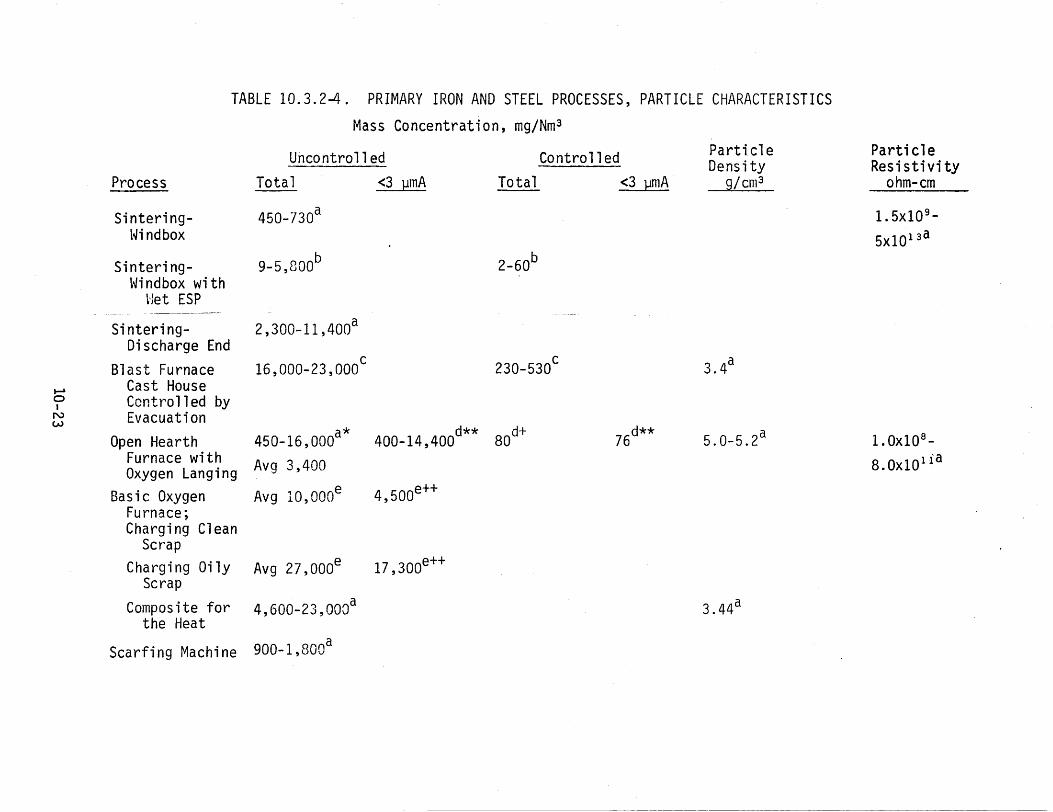
TABLE 10.3.2-4. PRIMARY IRON AND STEEL PROCESSES, PARTICLE CHARACTERISTICS
Process
Sinteringl~i ndbox
SinteringWindbox with
t·1et ESP
Sintering-Discharge End
Blast Furnace ...... Cast House 0 I Controlled by
N w Evacuation
Open Hearth Furnace with Oxygen Langing
Basic Oxygen Furnace; Charging Clean
Scrap Charging Oily
Scrap
Composite for the Heat
Scarfing Machine
Mass Concentration, mg/Nm 3
Uncontrolled Controlled
Total <3 gmA Total <3 J:!mA
450-730a
9-5,800b 2-60b
2,300-11,400a
16,000-23,000C 230-530c
450-16,000a* 400-14,400d** BOd+ 76d**
3Avg , 4oo Avg 10,000e 4,500e++
Avg 27,000e 17,300e++
4,600-23,000a
900-1,SOOa
Particle Density
g/cm3
3.4a
5.0-5.2a
3.44a
Particle Resistivity
ohm-cm
1.5xl0 9-
5x101 3a
1. Oxl0 8 -
8. 0xl011a
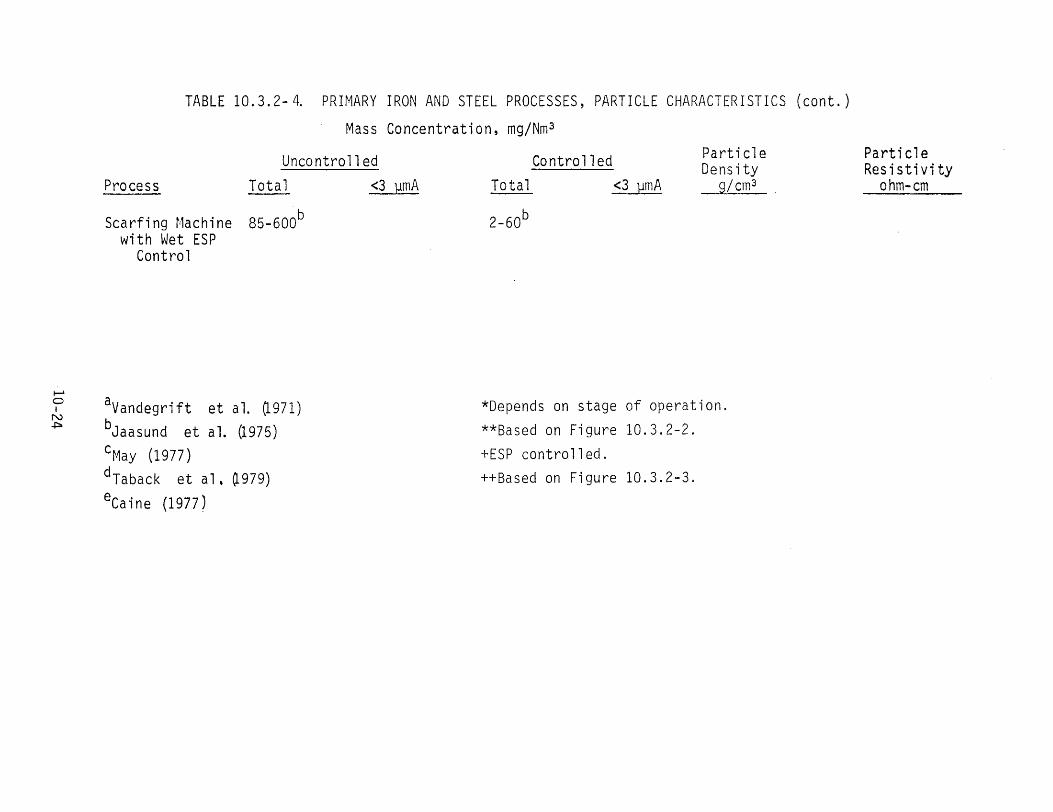
TABLE 10.3.2-4. PRIMARY IRON AND STEEL PROCESSES, PARTICLE CHARACTERISTICS (cont.)
Mass Concentration, mg/Nm 3
Process
Scarfing Machine with Wet ESP
Control
1--'
Uncontrolled Tota 1 <3 gmA
85-600b
I N
0 aVandegri ft et al. (1971) .p. bJaasund et al. U975)
c~•1ay (1977)
dTaback et al, ~979) eCaine (1977)
Particle ParticleControlled Density ResistivityTotal <3 HmA g/cm3 ohm-cm
2-60b
*Depends on stage of operation. **Based on Figure 10.3.2-2.
+ESP contro 11 ed. ++Based on Figure 10.3.2-3.
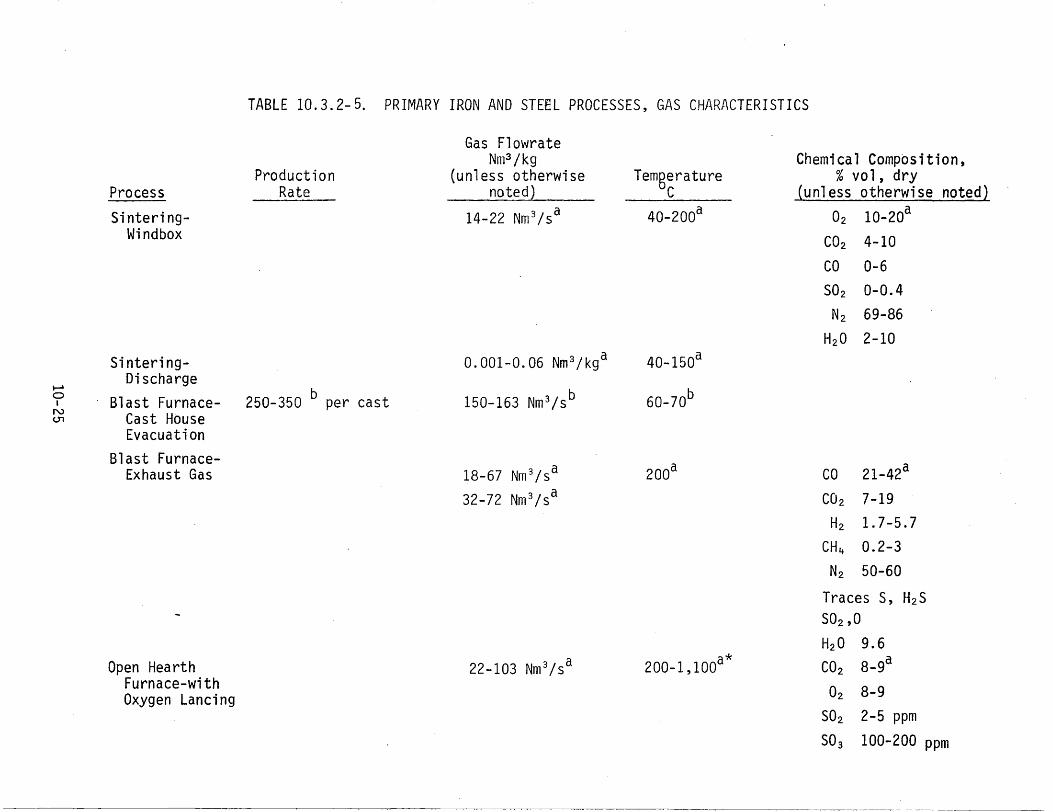
TABLE 10.3.2-5. PRIMARY IRON AND STEEL PROCESSES, GAS CHARACTERISTICS
Process Production
Rate
Gas Flowrate Nm3 /kg
(unless otherwise noted}
Temgerature C
Chemical Composition, % vol, dry
(unless otherwise noted}
Sintering- 14-22 Nm 3 /sa 40-200a 02 10-20a Windbox CO2 4-10
co 0-6 S02 0-0.4
N2 69-86
H20 2-10 Sintering- 0.001-0.06 Nm 3/kga 40-150a
Discharge...... 0 Blast Furnace- 250-350 b per cast 150-163 Nm 3 /sb 60-70bI N u, Cast House
Evacuation Blast Furnace-
Exhaust Gas 18-67 Nm 3 /sa 200a co 21-42a
32-72 Nm 3 /sa CO2 7-19 H2 1.7-5.7
CH 4 0.2-3
N2 50-60
Traces S, H2S S02,0
H20 9.6 Open Hearth 22-103 Nm 3 /sa 200-1,lOOa* CO2 8-9a
Furnace-with 02 8-9Oxygen Lancing S02 2-5 ppm S0 3 100-200 ppm
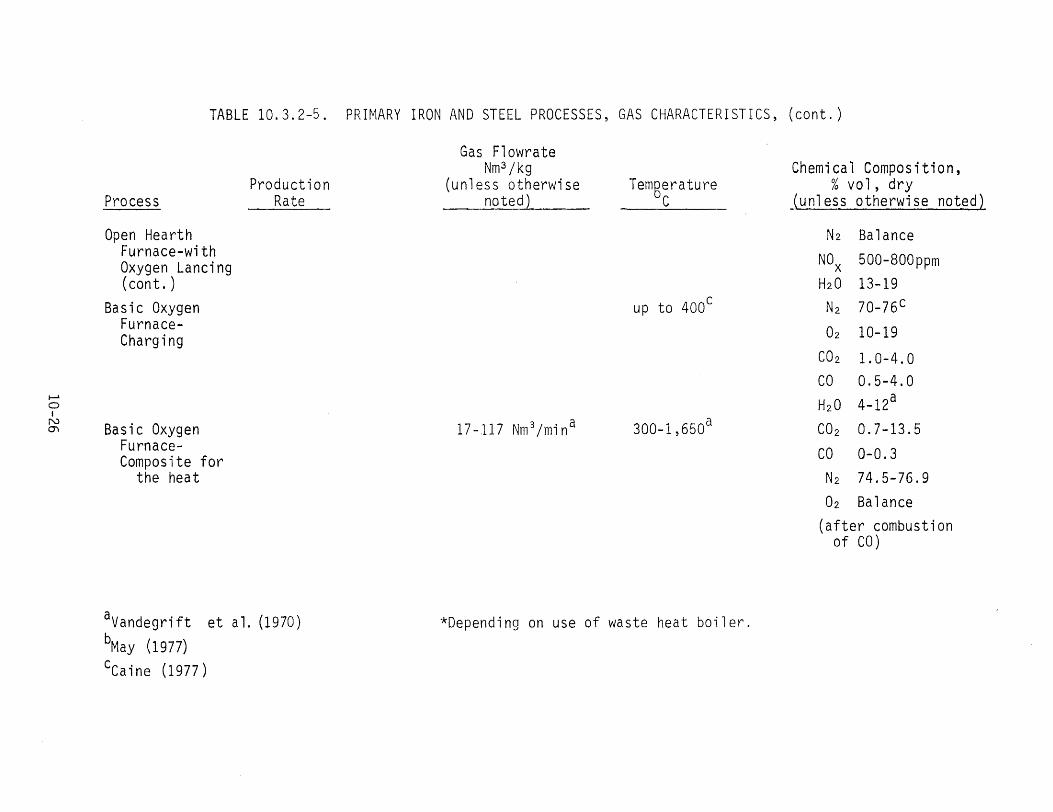
TABLE 10.3.2-5. PRIMARY IRON AND STEEL PROCESSES, GAS CHARACTERISTICS, (cont.)
Gas Flowrate Nm 3 /kg Chemical Composition,
Production (unless otherwise Temgerature % vo 1 , dry Process Rate noted} C (unless otherwise noted)
Open Hearth N2 Balance Furnace-with NOx 500-800ppmOxygen Lancing (cont. ) H20 13-19
Basic Oxygen up to 400c N2 70-76c Furnace 02 10-19Charging
CO2 1.0-4.0 co 0.5-4.0
I-' a 0 H20 4-12 I
O') N Basic Oxygen 17-117 Nm 3 /mina 300-1,650a CO2 0.7-13.5
Furnace co 0-0.3Composite for the heat N2 74.5-76.9
02 Balance (after combustion
of CO)
aVandegrift et al. (1970) *Depending on use of waste heat boiler. bMay (1977) cCaine (1977)
10.3.3 Control 1echnology
Much of the difficulty in controlling emissions from the metallurgical process is in containing the emissions. This is particularly true of emissions from charging and tapping.
The gas exhausting from the sinter machine windbox is well contained. However, the discharge end of the sinter machine, and the sinter cooler needs to be enclosed and ventilated according to Jutze et al. (1977). The emissions from the screening operation emissions can be collected by a fixed hood. Cyclones, baghouses, scrubbers and dry and wet ESP's are used as control devices. Minicucci et al. (1980} reported a gravel bed filter with partial recirculation of the gases to control windbox emissions.
An effective method of capturing emissions from charging, tapping and casting operations is total building evacuation according to Jutze et al. (1977). However, the flow rates are extremely high for this method._ Fixed and moveable hoods are used over various emission points. These are enhanced by the use of curtains or partitions to contain the emissions._
Some basic oxygen furnaces and tapping areas are completely enclosed and evacuated The charging emissions can be collected by the off gas collection system shown in Figure 10.3.1.4-1, if special hood designs are used, according to Caine (1977).
An air curtain could also be used to contain the emissions which would then be controlled by a spray, charging and trapping (SCAT) scrubber according to Yung et al. Cl 981).
The flue gas from basic oxygen furnaces is cleaned by highefficiency scrubbers or ESP's, according to Hardison et al. (197 2). Open hearth furnaces generally use ESP' s, but scrubbers and baghouses have also been used.
Hooding is used to control emissions from scarfing according to Jutze et a 1. Cl 977). Cyclones, scrubbers and dry and wet ESP's are all used to collect the particles.
10.4 STEEL FOUNDRIES 10.4.1 Process Description
Fine particle emission sources in steel foundries include: furnaces, sand handling operations and galvanizing according to the EIS data (California Air Resources Board, 1980). Sand handling operations are discussed in section 11.8. Foundry furnaces and galvanizing are discussed here._
Foundries produce steel for casting from scrap iron and steel which has been melted. Various types of furnaces are used in foundries. In California foundries, the electric arc furnace is predominant according to the EIS data.
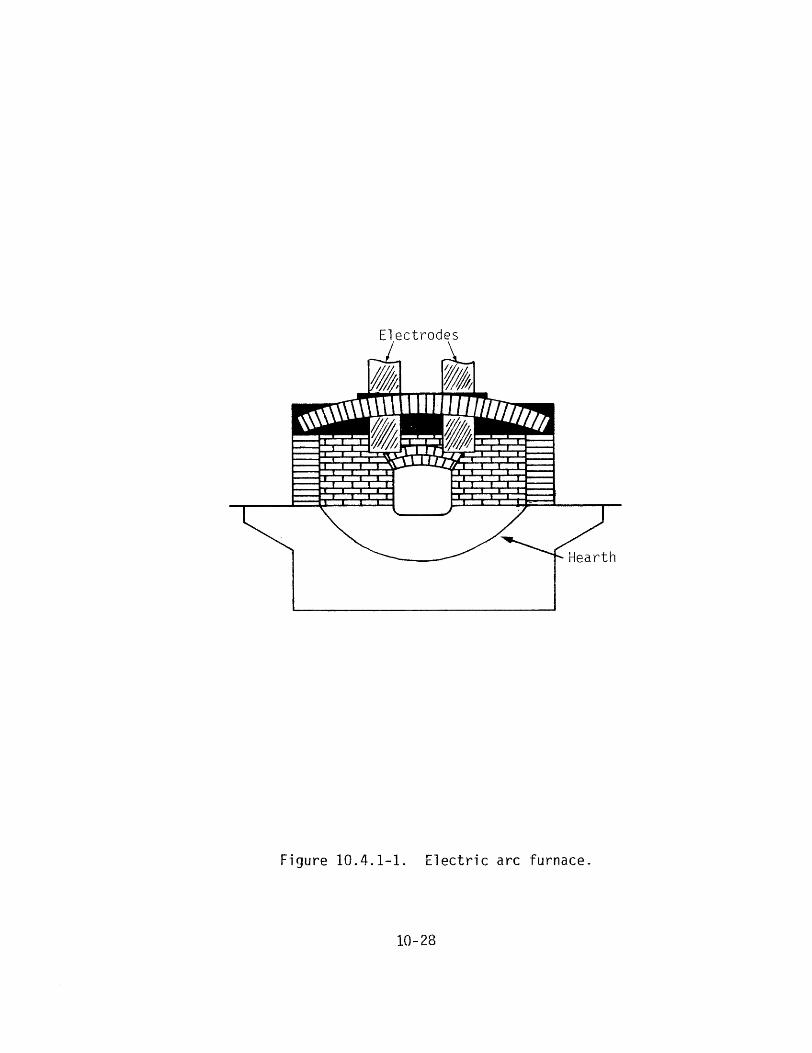
Figure 10 .4.1-1 shows a basic diagram of a direct-arc furnace. The three electrodes are cylinders of baked carbon or graphite. The current passes from the electrode into the bath and back to a second electrode. In some designs the furnace
10-27
Electrodes
Figure 10.4.1-1. Electric arc furnace.
10-28
hearth also conducts the arc. Heat is generated by the arc and by the resistance effect of the bath according to Camp et al. (1951). As the electrodes are consumed within the bath, additional lengths are attached at the top and the electrodes are lowered.
The furnace roof, including the electrodes, is generally removed for charging and tapping. Some furnaces are charged from the side and are tipped with the roof in place during tapping.
Oxygen lancing is used in electric arc furnaces. Refer to Section 10.3.1.3 for a description of oxygen lancing.
Certain steel products are coated with zinc to protect them from corrosion. This process is known as galvanizing and involves degreasing, pickling, and applying a zinc coating to the steel. It is described by Danielson (1973).
After an article is degreased and pickled, it is immersed in molten zinc which has a flux floating on top. The flux is formed by the addition of ammonium foaming agents to the zinc. The hydrogen chloride gas, which forms in the flux, removes the oxide film from the steel as it is lowered into the tank. The article, while immersed, is moved to another section of the tank where there is no flux cover._ The articles are then removed from the bath and, in some cases, dusted with powdered ammonium chloride to improve the finish.
10.4.2 Source Characteristics
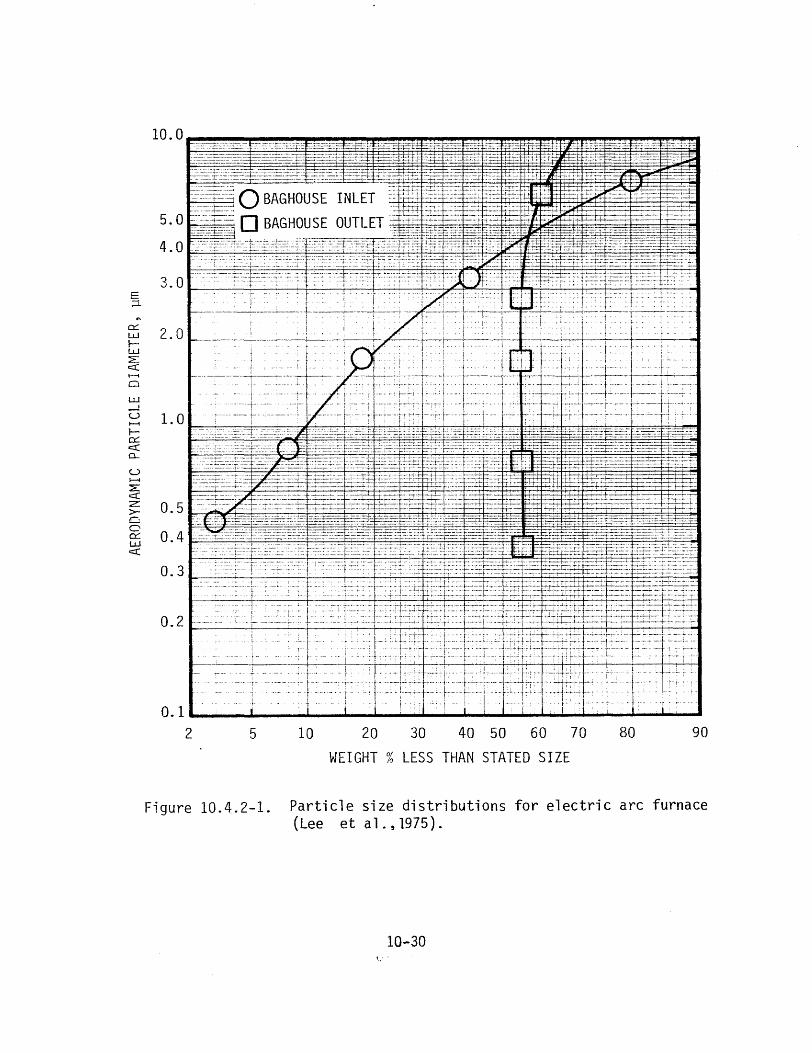
Figure 10.4.2-1 shows particle size distribution curves for the inlet and outlet of a baghouse on an electric arc steel furnace, reported by Lee et al. (1975). Table 10.4.2-1 presents typical chemical analysis from electric arc furnace fume._
Table 10.4.2-2 gives particle characteristics for electric arc furnaces and Table 10.4.2-3 gives gas characteristics.
In galvanizing operations, emissions occur whenever the flux is disturbed. When articles are added some agitation results. The greater the agitation, the greater the fuming. Addition of flux also causes fuming. Emissions include ammonium chloride, zinc, zinc chloride, and oil. The emissions of zinc and zinc chloride are believed to be due to mechanical entrainment rather than vaporization. Improper degreasing results in emissions of oil mist. The diameter of the emissions from galvanizing are on the order of 2 µm, according to Danielson (1973).
10.4.3 Control Technology
Fumes from electric arc furnaces are captured by various method~-- Direct shell evacuation (evacuation of the furnace itself) is one method used according to Jutze et al. (1977). Building evacuation and canopy hooding are also used, sometimes in combination with direct shell evacuation. Baghouses are the most common control device used. Venturi scrubbers and electrostatic precipitators are also used.
10-29
E ;:::1.
0:::: w 1-w z::: c::( 1--1
Cl
w ....J u 1--1
lo:::: c::( CL
u f--1
:E:: c::(z: >-0 0 0:: w c::(
• - •• - ► - -
' - . - - ' . . -
: f . -- . - . i •. t : __ ,'_,, -- ) ....
----------'. ·- ',. :........... ~ ..
- .... ~ . . ~---' :-·· - . -:- . ·- -. .. .. - -- .. -- .,.. . -~-- .. ' .----. --
·--r--··"•• - ---·-----·-
0.4
2 5 10 20 30 40 50 60 70 80 90
WEIGHT% LESS THAN STATED SIZE
Figure 10.4.2-1. Particle size distributions for electric arc furnace (Lee et al.,1975).
10-30
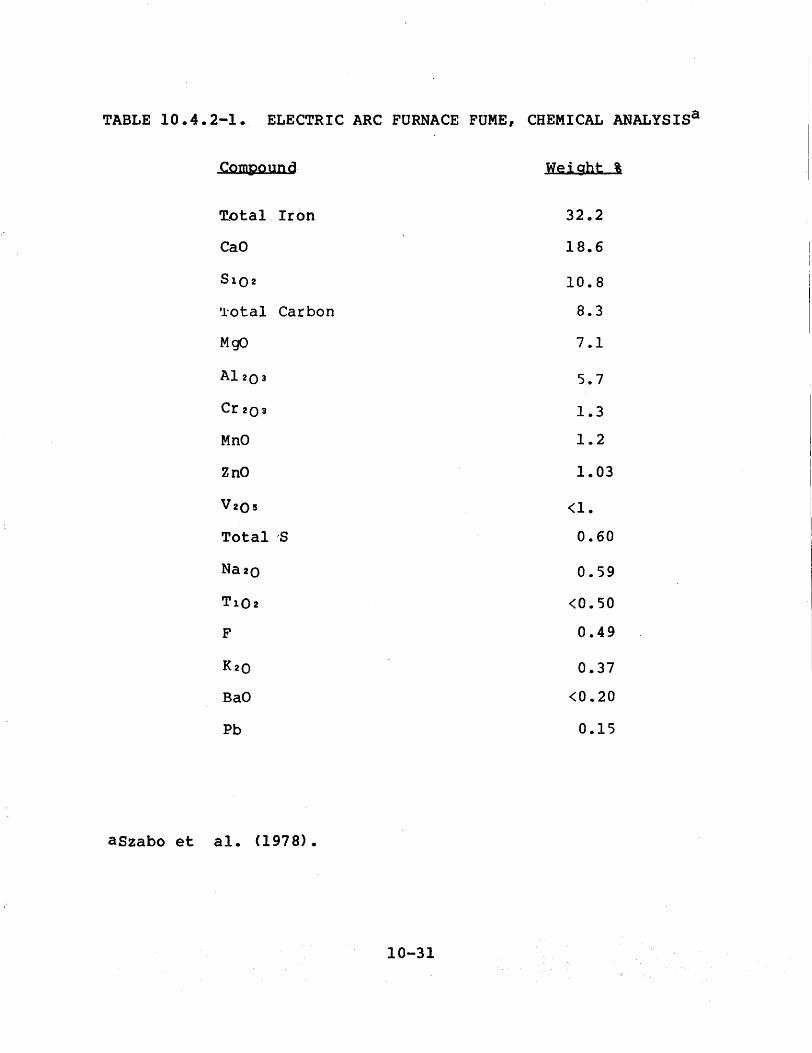
TABLE 10.4.2-1. ELECTRIC ARC FURNACE FUME, CHEMICAL ANALYSISa
compound Weight %
T.otal Iron 32.2
Cao 18.6
S102 10.8
•1·otal Carbon 8.3
MgO 7.1
Al203 5.7
Cr203 1.3
MnO 1.2
ZnO 1.03
V2os <1.
Total -s 0.60
Na20 0.59
T1Q2 <0.50
F 0.49
K20 0.37
BaO <0.20
Pb 0.15
aszabo et al. (1978).
10-31
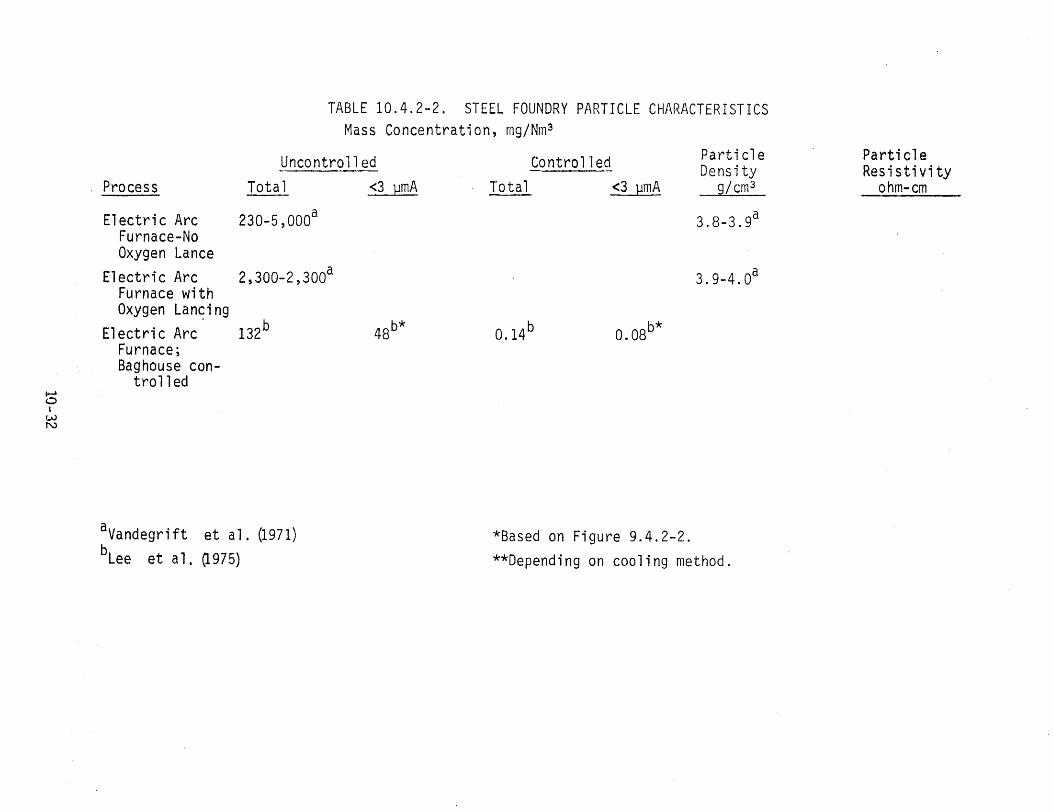
TABLE 10.4.2-2. STEEL FOUNDRY PARTICLE CHARACTERISTICS Mass Concentration, mg/Nm 3
Particle ParticleUncontrolled Controlled Density Resistivity
Process Tota 1 <3 J:!mA Total <3 ~mA g/cm 3 ohm-cm
Electric Arc 230-5,000a 3.8-3.9a Furnace-No Oxygen Lance
Electric Arc 2,300-2,300a 3.9-4.0a Furnace with Oxygen Lancing
Electric Arc· 132b 48b* 0.14b 0.08b* Furnace; Baghouse con
trolled F"' 0 t w N
aVandegrift et al. U971) *Based on Figure 9.4.2-2. blee et al. (197 5) **Depending on cooling method.
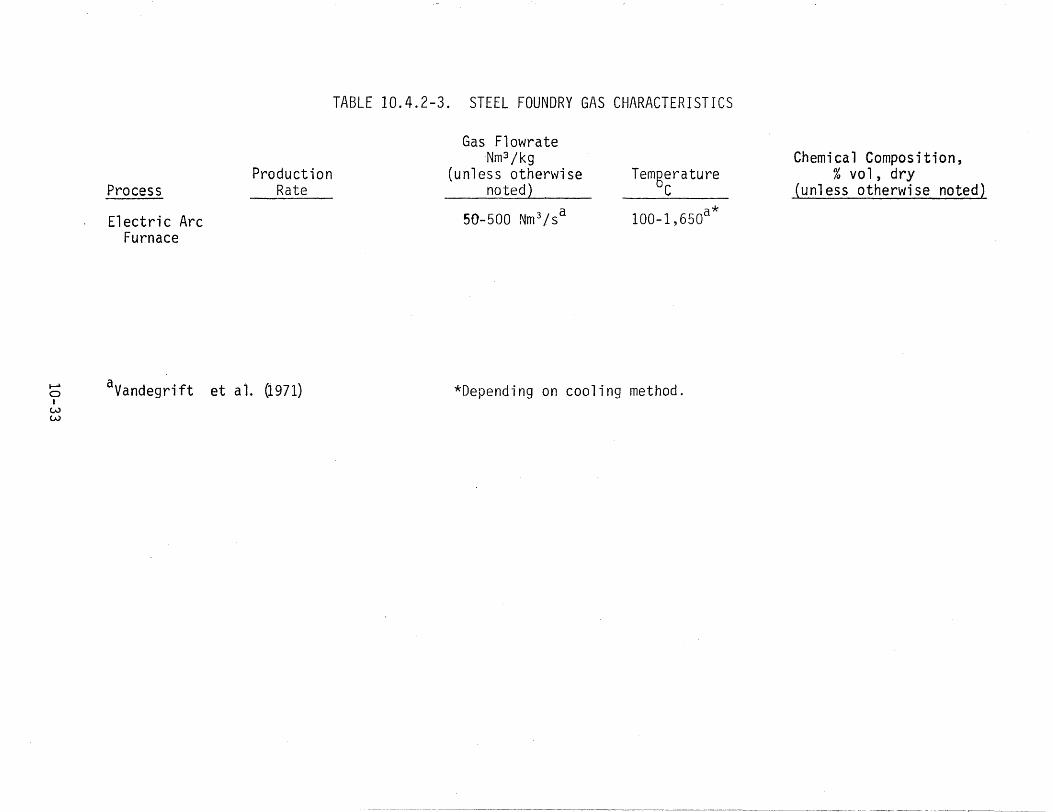
TABLE 10.4.2-3. STEEL FOUNDRY GAS CHARACTERISTICS
Gas Flowrate Nm3 /kg Chemical Composition,
Production (unless otherwise Temgerature %vol,dry Process Rate noted2 C (unless otherwise noted)
Electric Arc 50-500 Nm 3 /sa 100-1, 65oa* Furnace
...... aVandegrift et al. (1971) *Depending on cooling method.0 I
w w
-~---~~-·
Hooding is used to capture the fumes from galvanizing. Baghouses and to Danie1 son
ESP's are (197 3) •
used for particles collection, according
10. 5 10.5.1
BRASS/BRONZE Process Description
Brass and bronze are alloys of copper. Brass includes zinc and bronze includes tin. According to the EIS data (California Air Resources Board, 1980) three types of furnaces are most commonly found in the secondary brass and bronze industry in California. These are the reverberatory furnace, the rotary furnace and the electric induction furnace.
One style of reverberatory furnace is similar to the open hearth steel furnace described in Section 10.3.1. However, waste heat is not collected from the exhaust gases by checkers.
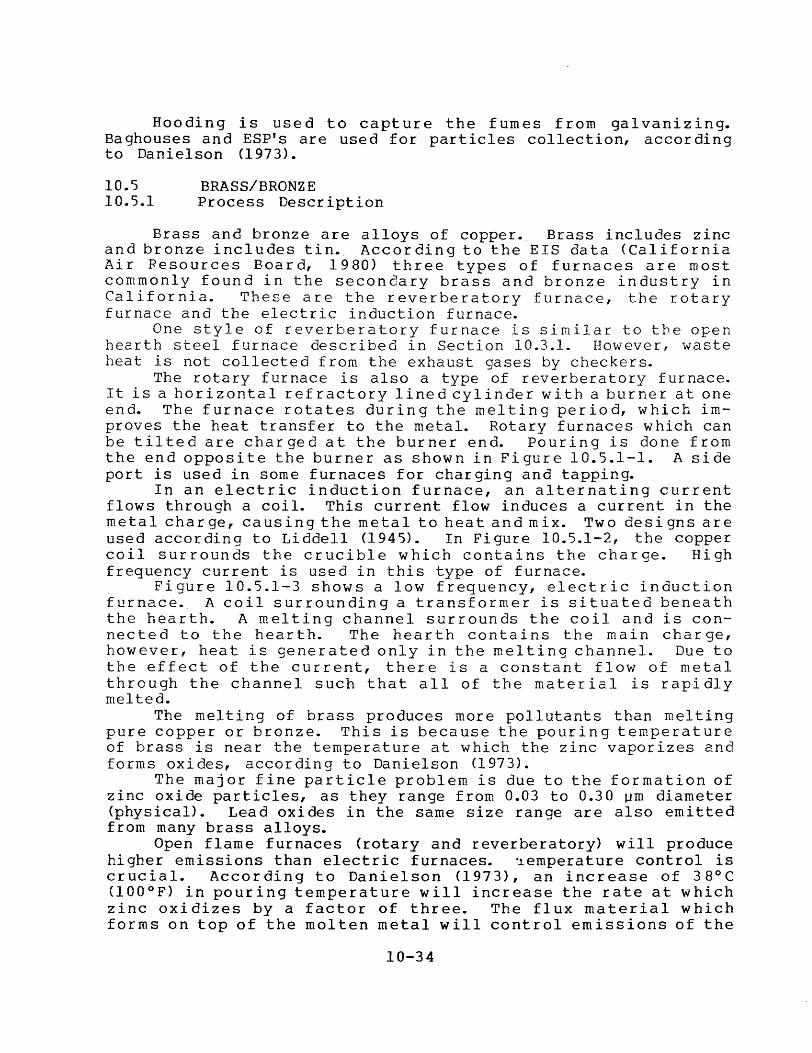
The rotary furnace is also a type of reverberatory furnace. It is a horizontal refractory lined cylinder with a burner at one end. The furnace rotates during the melting period, which improves the heat transfer to the metal. Rotary furnaces which can be tilted are charged at the burner end. Pouring is done from the end opposite the burner as shown in Figure 10.5.1-1. A side port is used in some furnaces for charging and tapping.
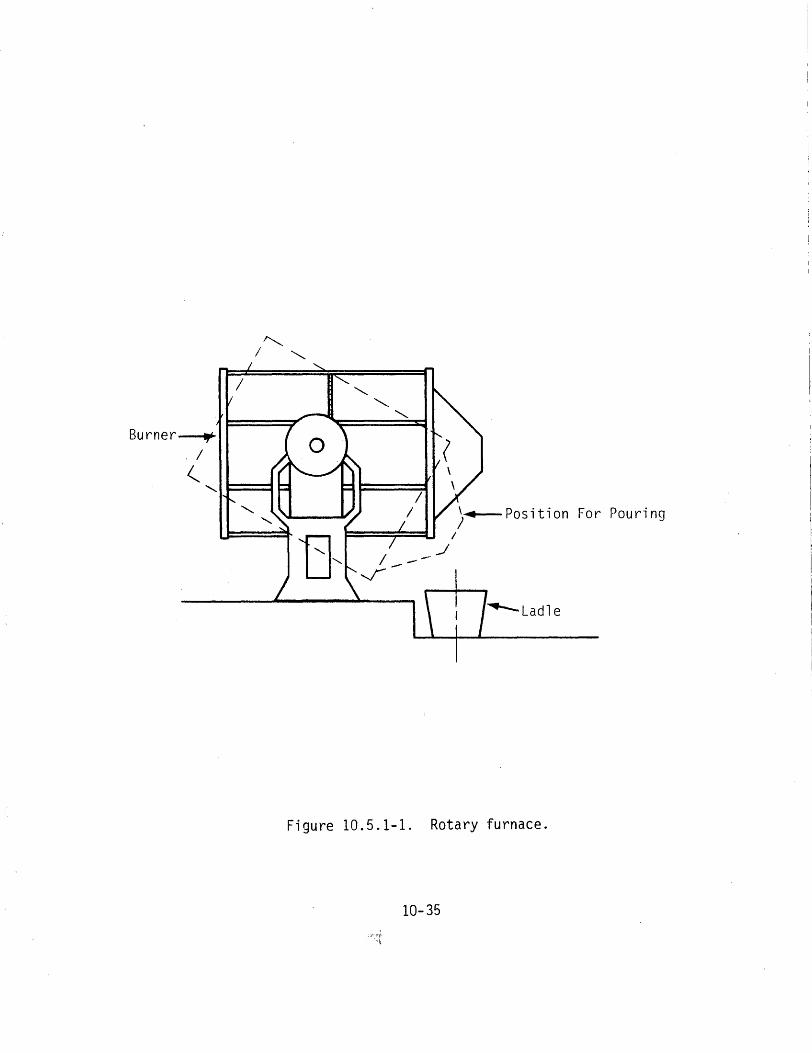
In an electric induction furnace, an alternating current flows through a coil. This current flow induces a current in the metal charge, causing the metal to heat and mix. Two designs are used according to Liddell (1945). In Figure 10.5.1-2, the copper coil surrounds the crucible which contains the charge. High frequency current is used in this type of furnace.
Figure 10.5.1-3 shows a low frequency, electric induction furnace._ A coil surrounding a transformer is situated beneath the hearth. A melting channel surrounds the coil and is connected to the hearth. The hearth contains the main charge, however, heat is generated only in the melting channel. Due to the effect of the current, there is a constant flow of metal through the channel such that all of the material is rapidly melted.
The melting of brass produces more pollutants than melting pure copper or bronze. This is because the pouring temperature of brass is near the temperature at which the zinc vaporizes and forms oxides, according to Dani el son (197 3).
The major fine particle problem is due to the formation of zinc oxide particles, as they range from 0.03 to 0.30 µm diameter (physical). Lead oxides in the same size range are also emitted from many brass alloys.
Open flame furnaces (rotary and reverberatory) will produce higher emissions than electric furnaces. ~emperature control is crucial. According to Danielson (1973), an increase of 38°C (100°F) in pouring temperature will increase the rate at which zinc oxidizes by a factor of three. The flux material which forms on top of the molten metal will control emissions of the
10-34
Burner---../ (
- _I
Position For Pouring I
Figure 10.5.1-1. Rotary furnace.
10-35
Crucible
1sss1t Charge
•.::.1M Cha rc;e ,_. 0 I Coil
w O'I Melting Transformer
Channel Core
Figure 10.5.1-2. High frequency induction Figure 10.5.1-3. Low frequency induction furnace (Liddell, 1945). furnace (Liddell, 1945).
oxide to some extent. Most emissions occur when the slag is not present, during charging, pouring, and when alloy is added after removal of the slag.
1 o.5.2 Source Characteristics
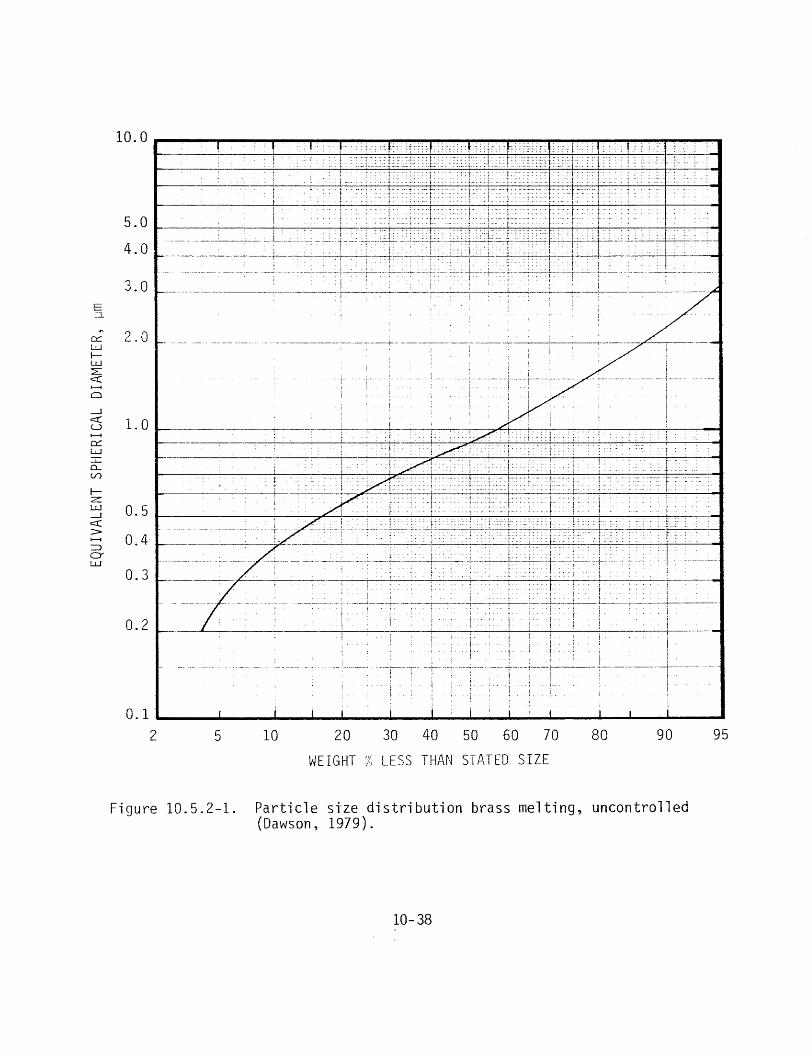
Figure 10.5.2-1 shows particle size distribution data for brass melting. The definition of equivalent spherical diameter was not given in the reference. Table 10.5.2-1 gives chemical analysis of a baghouse catch at a brass and bronze smelter.
Particle and gas characteristics for secondary brass and bronze furnaces are given in ~ables 10.5.2-2 and 10.5.2-3 respectively.
10. 5 .3 Control Technology
Maintaining the temperature of the melt as low as possible is effective for reducing emissions, especially during tapping. Hoods can be used to collect emissions from tapping and charging. The use of side curtains to contain the emissions will increase the capture efficiency of the hood, according to Jutze et al. (1977). Baghouses are used to collect the captured particles, a ccor ding to Danie1son <197 3 > and Mini cucc i et a1. <1 9 8 O) •
10.6 SECONDARY LEAD 10.6.1 Process Description
Two types of furnaces are most common in California (California Air Resources Board, 1980). These are the pot furnace and the electric induction furnace. The electric induction furnace is described in Section 10. 5.1.
The pot furnace consists of an iron or steel pot in which the charge is placed, according to Danielson (1973). The pot is heated by one or more burners, usually gas-fired. Capacities range from one to fifty tons._ The pot furnace is used for melting, adding alloys and refining the lead.
Pot and induction furnaces release less contaminants than reverberatory furnaces, according to Danielson (1973).
10.6.2 Source Characteristics
Figure 10.6.2-1 shows size analysis of dust from a baghouse on a secondary lead smelting furnace. Tables 10.6.2-1 and 10.6.2-2 give particle and gas characteristics for secondary lead furnaces.
10.6 .3 Control Technology
Control technology for secondary lead furnaces is similar to that for steel furnaces. First, the emissions must be captured, by furnace evacuation, hooding or building evacuation. Baghouses
10-37
5.0 ----------------+---1-____._-,--'---1--~----,____-'--__-4--__
4.0 ----------------+-----+---i----'---+----J--l-----+---+---+-----i----'-----+-----a
3.0 \ • I. : . ·: ' : : -----·•l·"·-·--
.. ·. i
E ;:1
... 0:::: w 1-w L c:::( 1--1
Cl
2.0
_J c:::( u 1--i
0:::: w I Q_ V) . f 1-z w 0.5_J c:::(
> r-1
::J 0.4
CT w
0.3
ti·0.2 j :1
i i I
I iI . I !I J i
..... · -··-·· -··. 1····-:··-·1f---.--: - --t -0.1 _____________________.____________________...._________
I !
2 5 10 20 30 40 50 60 70 80 90 95
WEIGHT% LESS THAN STATED SIZE
Figure 10.5.2-1. Particle si'ze distribution brass melting, uncontrolled (Dawson, 1979).
10-38
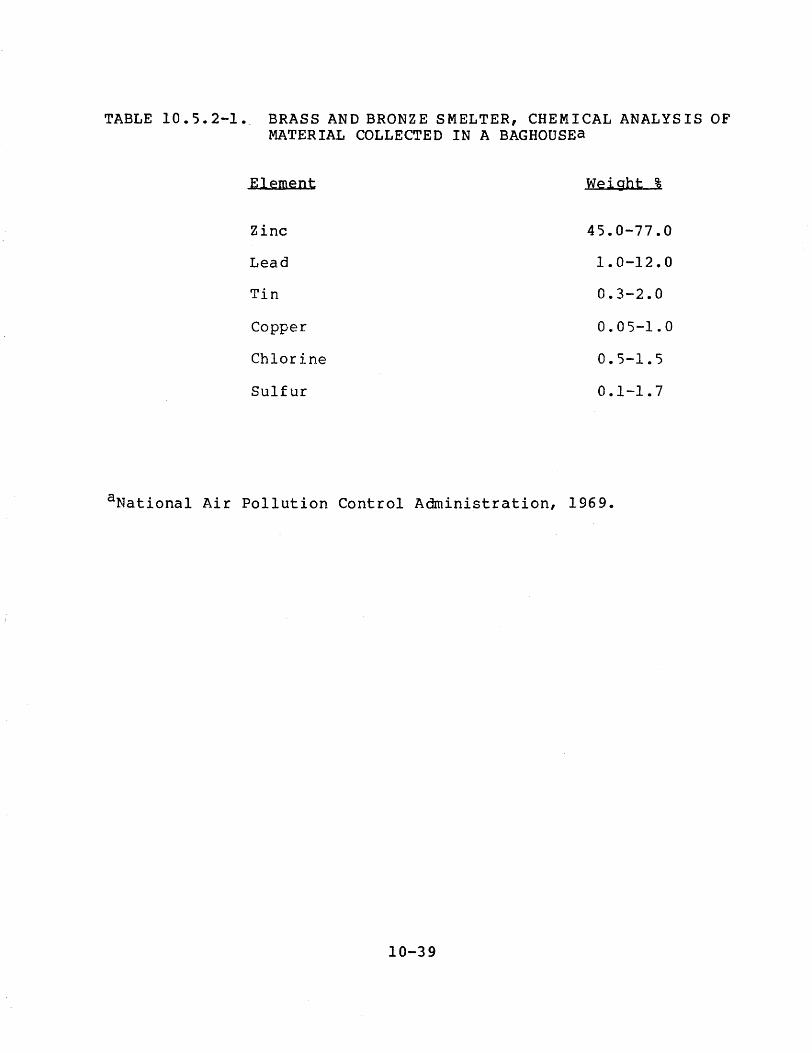
TABLE 10.5.2-1 •. BRASS AND BRONZE SMELTER, CHEMICAL ANALYSIS OF MATERIAL COLLECTED IN A BAGHOUSEa
Element Weight %
Zinc 45.0-77.0
Lead 1.0-12.0
Tin 0.3-2.0
Copper 0.05-1.0
Chlorine 0.5-1.5
Sulfur 0.1-1.7
aNational Air Pollution Control Administration, 1969.
10-39
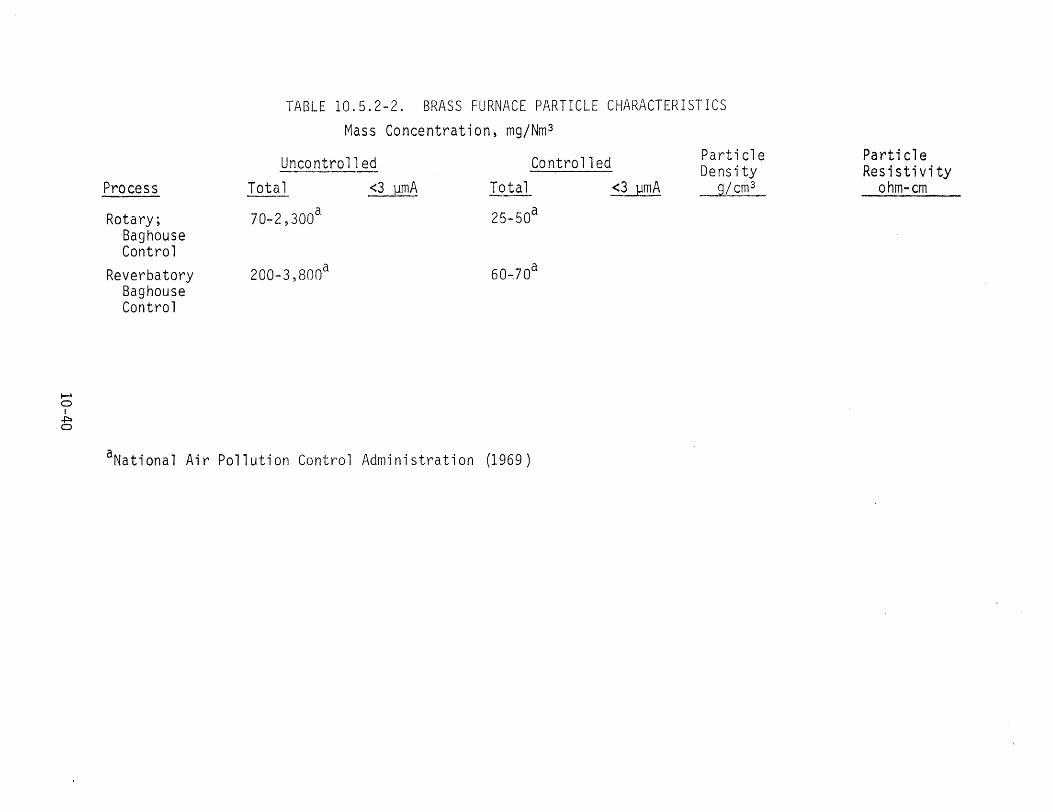
TABLE 10.5.2-2. BRASS FURNACE PARTICLE CHARACTERISTICS
Mass Concentration, mg/Nm 3
Particle ParticleUncontrolled Controlled Density Resistivity Process Total <3 gmA Total <3 ~mA g/cm 3 ohm-cm
Rotary; 70-2,300a 25-50a Baghouse Control
Reverbatory 200-3,800a 60-70a Baghouse Control
1--' a I
+:a a
aNational Air Pollution Control Administration (1969)
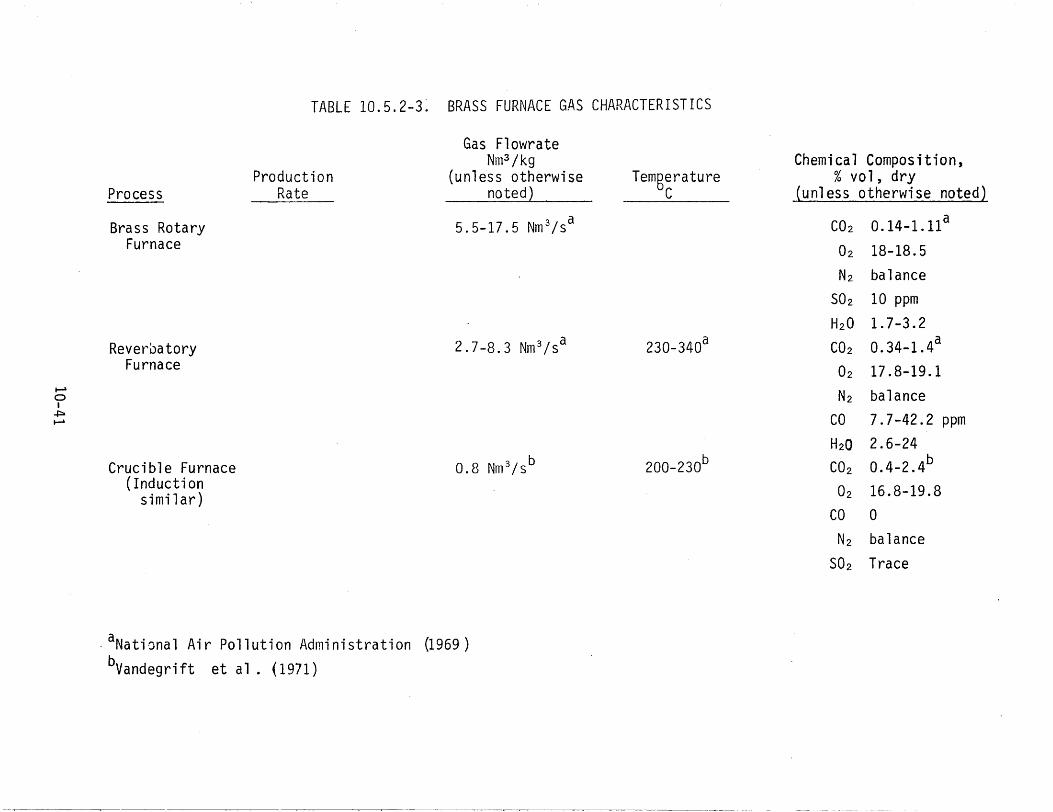
TABLE 10.5.2-3~ BRASS FURNACE GAS CHARACTERISTICS
Gas Flowrate Nm 3 /kg Chemical Composition,
Production (unless otherwise Temgerature % VO 1, dry Process Rate noted} C (unless otherwise noted)
Brass Rotary Furnace
Rever0atoryFurnace
...... 0 I
.pa
......
Crucible Furnace (Induction
similar)
- aNational Air Pollution Administration bvandegrift et al. (1971)
5.5-17.5 Nm 3/sa
2.7-8.3 Nm 3 /sa
0.8 Nm 3 /sb
0969)
CO2
02 N2
S02 H20
230-340a CO2 02 N2
co H2Q
200-230b CO2 02
co N2
S02
0.14-1.11a
18-18.5 balance 10 ppm 1.7-3.2 0.34-1.4a
17.8-19.1 balance 7.7-42.2 ppm 2.6-24 0.4-2.4b
16.8-19.8 0
balance Trace
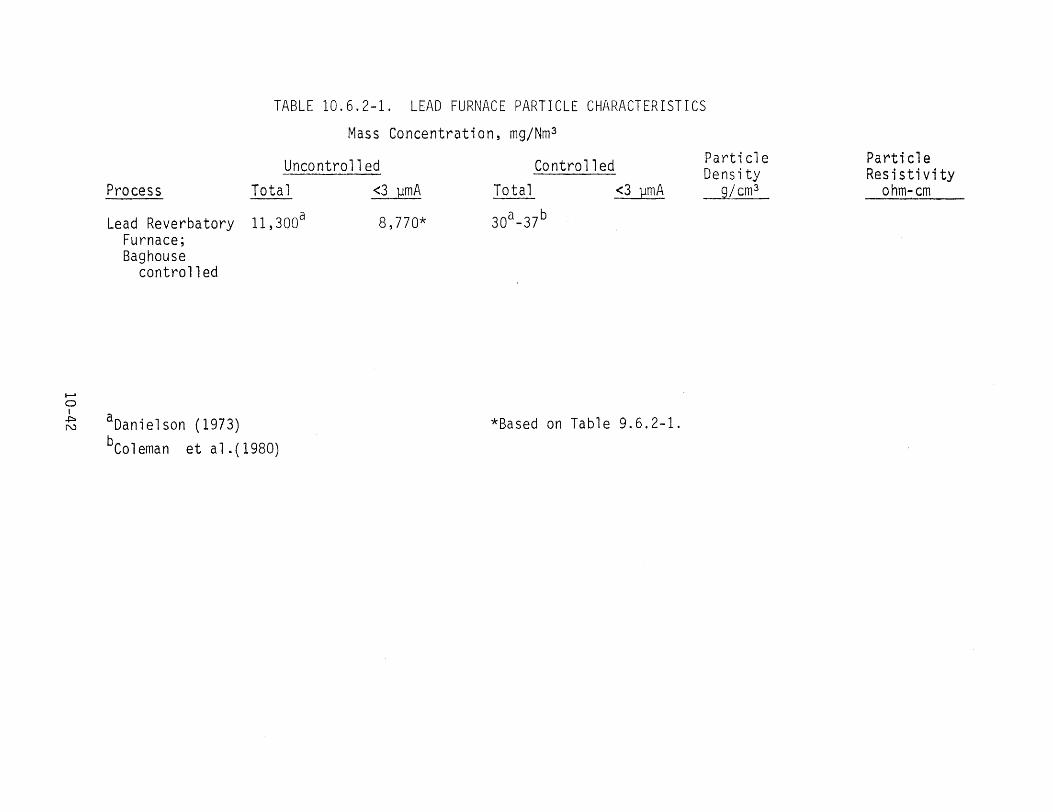
TABLE 10.6.2-1. LEAD FURNACE PARTICLE CHARACTERISTICS
Mass Concentration, mg/Nm 3
...... 0 I
+::> N
Particle ParticleUncontrolled Controlled Density Res i st i vity Process Total <3 gmA Total ~mA g/cm3 ohm-cm
Lead Reverbatory 11, 3003 8, 770* 303 -37b
Furnace; Baghouse
controlled
aDanielson (1973) *Based on Table 9.6.2-1.
bColeman et al .(1980)
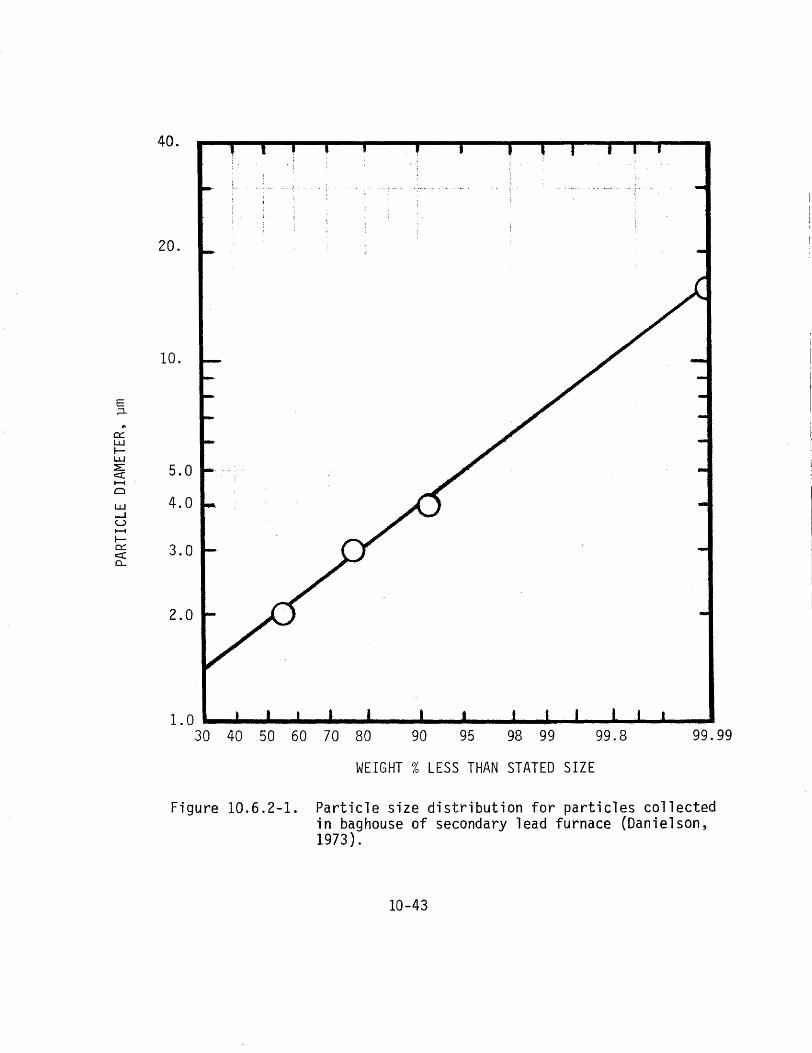
40.
20.
10.
5.0
4.0
3.0
2.0
1.0 ......._ ....______..__ _._...-i..__...__ .... _..._ ..............__•
E ;::1.
._ 0::: w I-w ~ c::( 1----4
Cl
w _J u 1----4
I-0::: c::( 0...
30 40 50 60 70 80 90 95 98 99 99.8 99.99
WEIGHT% LESS THAN STATED SIZE
Figure 10.6.2-1. Particle size distribution for particles collected in baghouse of secondary lead furnace (Danielson, 1973).
10-43
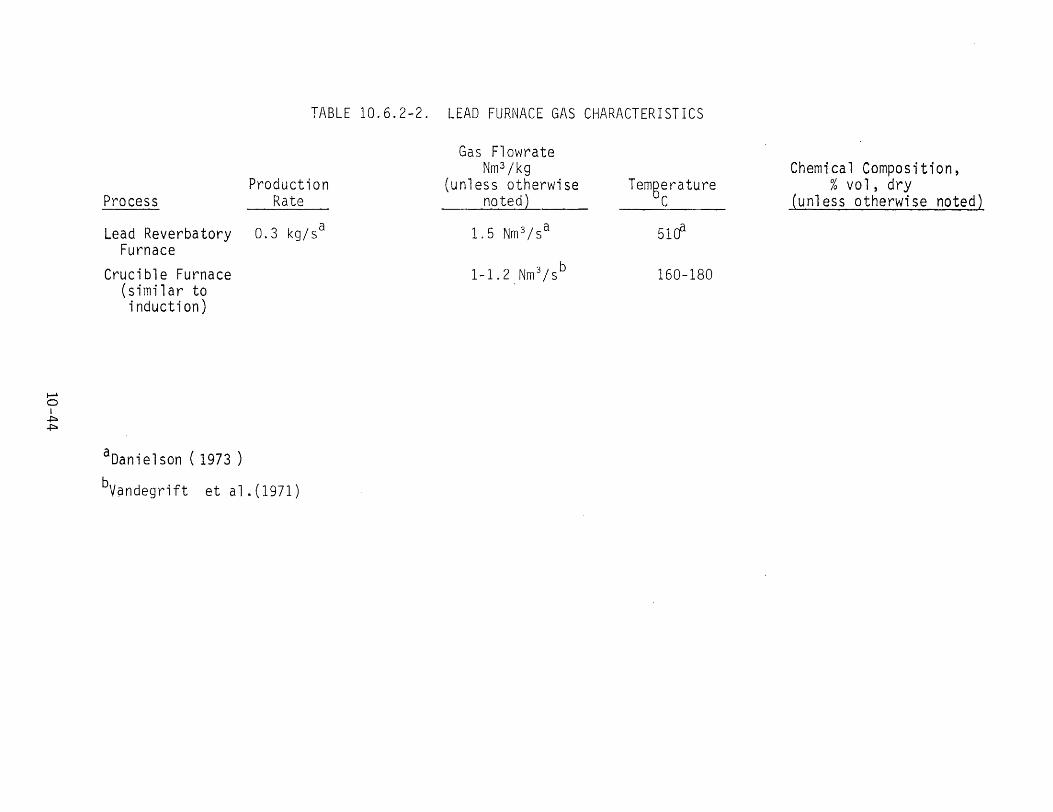
TABLE 10.6.2-2. LEAD FURNACE GAS CHARACTERISTICS
Gas Flowrate Nm 3 /kg Chemical Composition,
Production (unless otherwise Temgerature % VO 1 , dry Process Rate noted) C (unless otherwise noted)
Lead Reverbatory 0.3 kg/sa 1. 5 Nm 3 / sa 51cf Furnace
Crucible Furnace 1- 1. 2 . Nm 3 / s b 160-180
(similar to induction)
I-' a I ~ ~
aDanielson ( 1973)
bV9ndegrift et al .(1971)
are generally used to collect the particles, according to Danielson (1973). Minicucci et al. (1980) reported the use of Venturi scrubbers.
Control of charging and tapping rates are effective in reducing emissions. Using only clean scrap also reduces emissions, but this is not usually possible, according to Jutze et al. Cl 977).
10.7 SECONDARY ZINC 10.7.1 Process Description
The furnaces remelting are the
used most comreverberatory
monly sweat
in Califfurnace
ornia and
for the
zinc retort
furnace (California Air Resources Board, 1980). Both types are used to separate the zinc from other elements.
The reverberatory sweat furnace is similar to the reverberatory furnace described in 10.5.1. It is a small open hearth furnace with the hearth having a slight incline to the rear of the furnace •. In a sweat furnace, the charge consists of scrap metal containing various impurities. The zinc is recovered by heating the charge to the point where the zinc will melt and separate from the solid charge. The molten metal is continuously tapped. Normally this is a batch operation and the residual scrap is periodically raked from the hearth, according to Danielson (197 3).
In a retort furnace zinc oxides are converted to zinc ( Dan i e 1 son, 1 9 7 3 } • F i g u r e 1 0 • 7 .1 -1 show s a Be 1 g i an r et o r t f u r -nace. The ceramic retorts have an inside diameter of 20 cm (8 in.) and are 1.2-1.5 rn (4 or 5 ft) long. Hundreds of these can be heated in one furnace. The charge consists of zinc oxide and powdered coke, which has been wetted with water. The zinc oxide is reduced to zinc vapor by carbon monoxide and is then condensed.
10.7.2 Source Characteristics.
rarticle size distribution data was not found for secondary zinc furnaces. Figure 10.7.2-1 shows size distribution for a primary zinc retort furnace. Table 1 0. 7 .2-1 gives chemical data for zinc sweating processes.
Particle and gas characteristics are given in Tables 10.7.2-2 and 10.7.2-3.
10.7.3 Control Technology
Hoods are used to capture emissions from charging and tapping of retort and zinc melting furances. Baghouses are used for control of the particle emissions (Jutze et al., 1977).
10-45
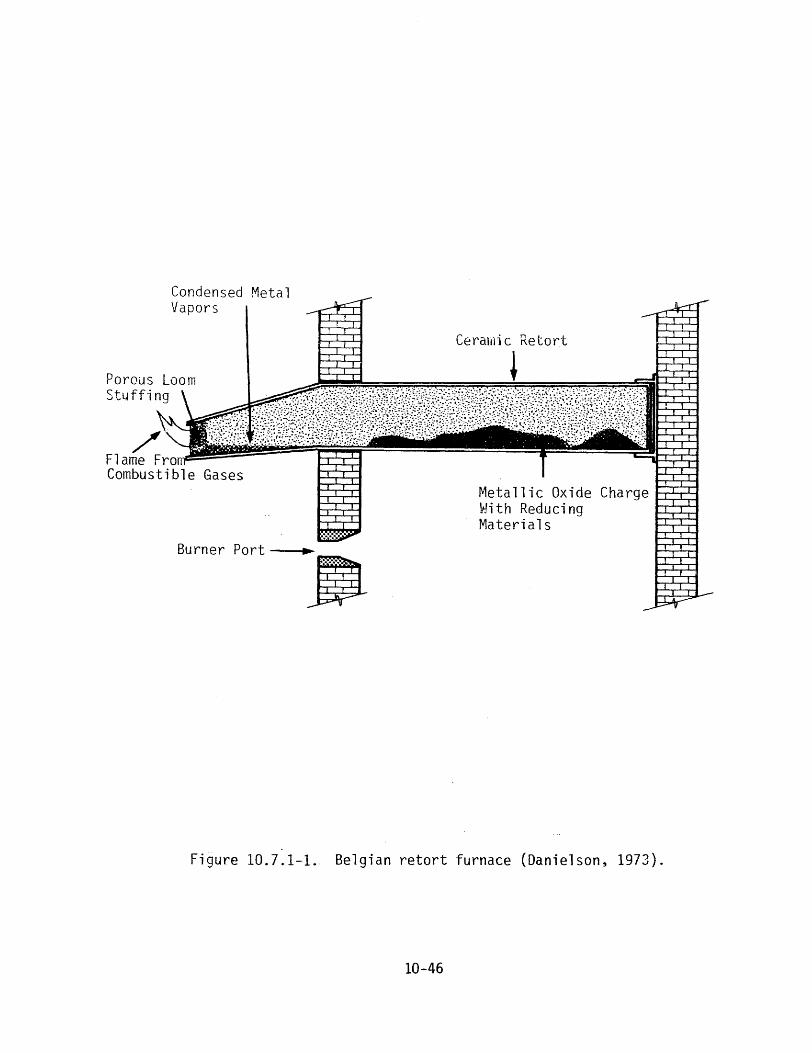
Condensed Metal
/
Vapors
Flame Fro Combustible Gases
Burner Port----~►
•
Ceramic Retort
!
Metallic Oxide ~Ji th Reducing Materials
Figure 10.7.1-1. Belgian retort furnace (Danielson, 1973).
10-46
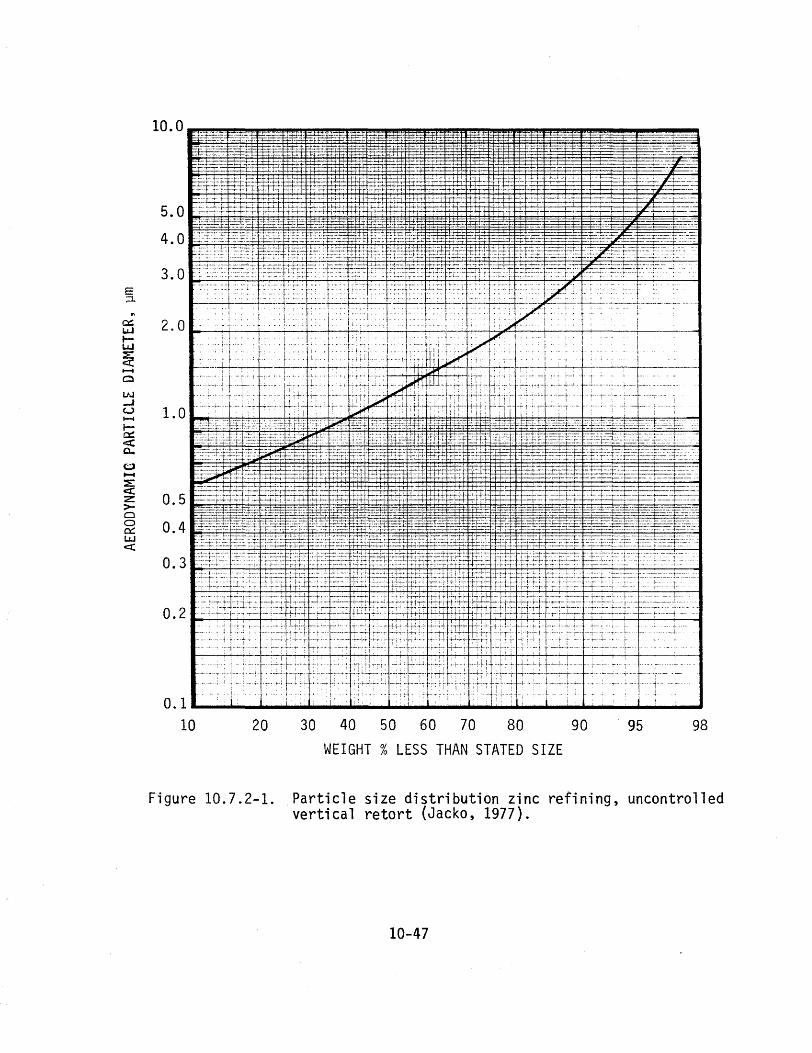
10.0 ::r~Jf.:;,~:=.f:.t¥. kf- -¥.±. ~=- "'"._:: ~+:"?: ~-Fi~ ::t+:i: ~.t:!: .
5.0
4.0
E ;:::1.
a:;
t~
LLJ
~ ...... c:::i
w ...I CJ ..... lo::c::c a. u ..... ~ c(z: >Cl 0 ~ 0.4 LJ.J c(
.__ .:..:.:::::~-~-t.:-+ ::r.::t_;;~k ~~.:t.. .... ~~ ~-~ ~;:.t: ~-r ------;--L---·-·
;__
20 30 40 50 60 70 80 90 95 98
WEIGHT% LESS THAN STATED SIZE
Figure 10. 7 .2-1. Particle size distribution zinc refining, uncontrolled vertical retort (Jacko, 1977).
10-47
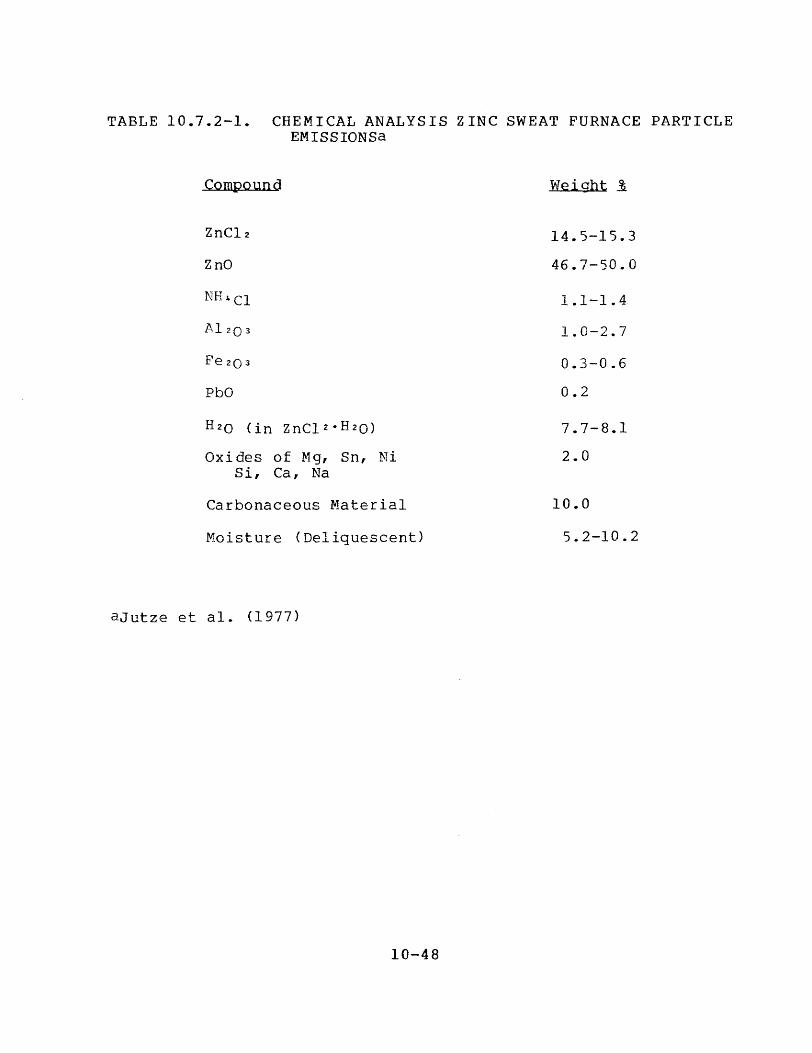
TABLE 10.7.2-1. CHEMICAL ANALYSIS ZINC SWEAT FURNACE PARTICLE EMISSIONSa
Compound Weight l.
ZnCl2 14.5-15.3
ZnO 46.7-50.0
NHr.cl 1.1-1.4
Al203 1.0-2.7
Fe203 0.3-0.6
PbO 0.2
7.7-8.1
Oxides of Mg, Sn, Ni 2.0 Si, Ca, Na
Carbonaceous Material 10.0
Moisture (Deliquescent) 5.2-10.2
aJutze et al. (1977)
10-48
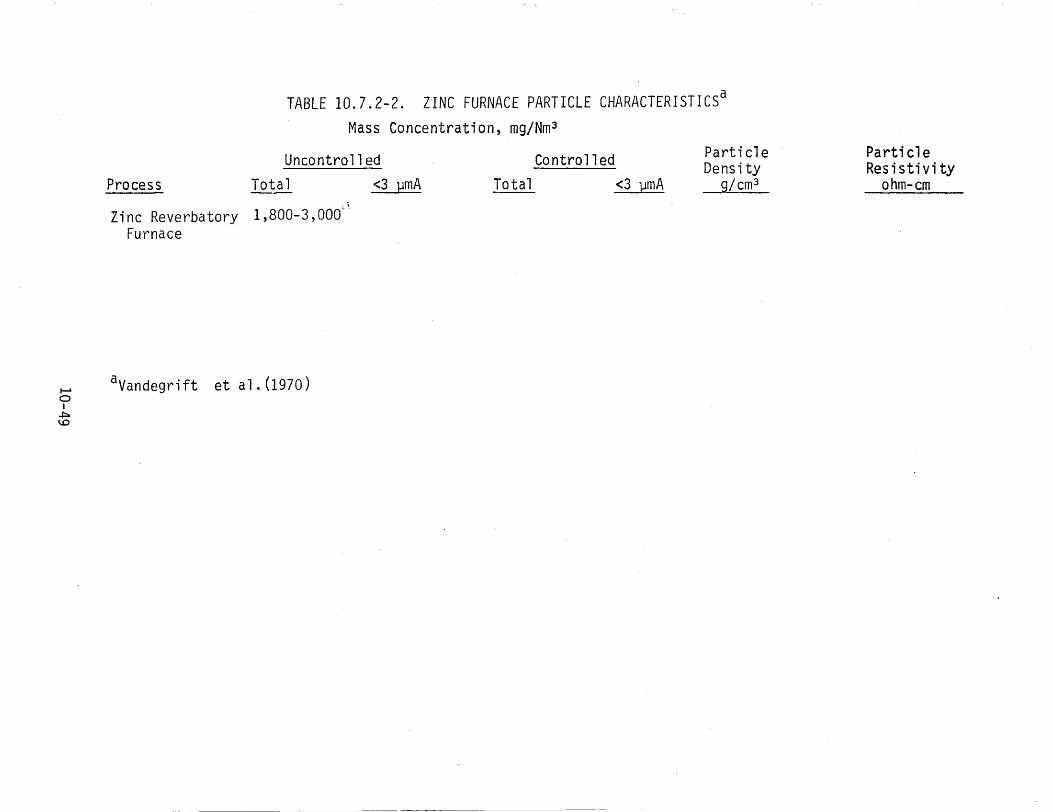
TABLE 10.7.2-2. ZINC FURNACE PARTICLE CHARACTERISTICSa Mass Concentration, mg/Nm 3
ParticleUncontrolled Controlled Density Process Total <3 gmA Total <3 gmA g/cm3
Zfnc Reverbatory 1,800-3,000~' Furnace
avandegrift et al.(1970)...... 0 I
.p. \,0
Particle Resistivity
ohm-cm
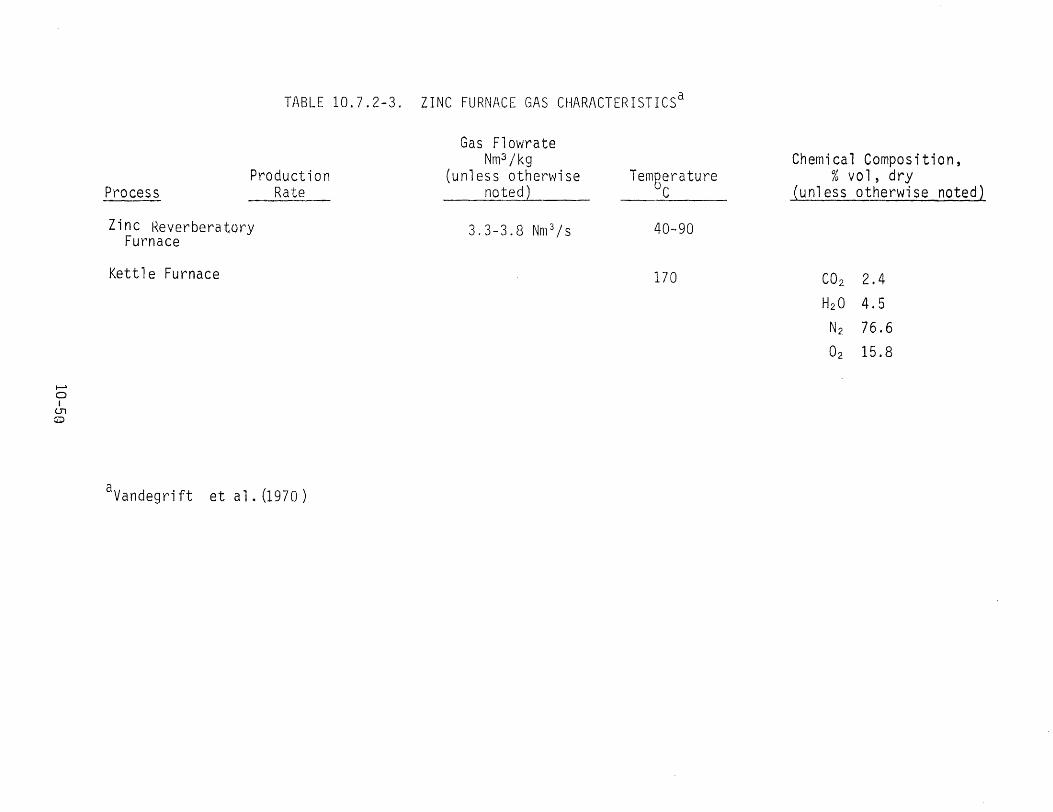
TABLE 10. 7 .2-3. ZINC FURNACE GAS CHARACTERISTICSa
Gas Flowrate Nm 3 /kg Chemical Composition,
Production (unless otherwise Temgerature % vol, dry Process Rate noted} C (unless otherwise noted)
Zinc Reverbera tory 3.3-3.8 Nm 3 /s 40-90 Furnace
Kett 1 e Furnace 170 CO2 2.4
H20 4.5
N2 76.6
02 15.8
._. 0 I
(J1
Z>
aVandegrift et al. (1970)
10.8 CALCULATIONS
Control devices evaluated for metallurgical sources are listed in Table 10.8.1. The calculation results are summarized in Tables 10.8.2 through 10.8.12.
A duty factor of 0.8 was used in estimating the operating costs.
10-51
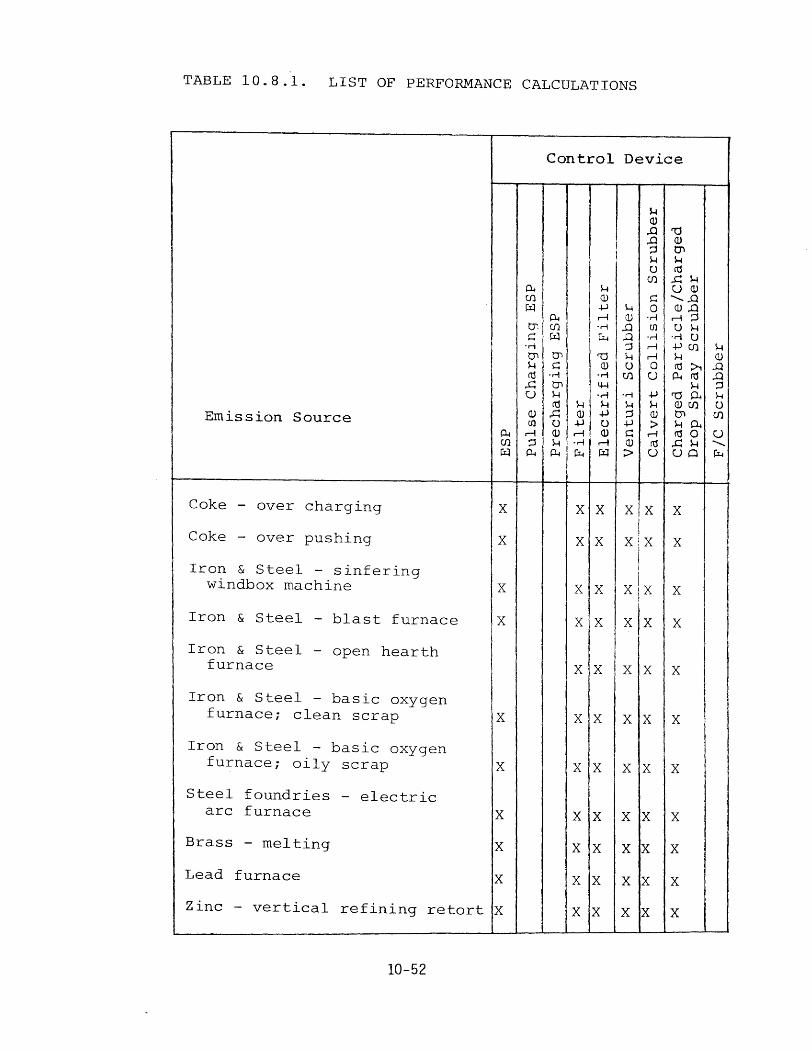
TABLE 10.8.1. LIST OF PERFORMANCE CALCULATIONS
Control Device
Emission Source
Coke - over charging
Coke - over pushing
Iron & Steel - sinfering windbox machine
Iron & Steel - blast furnace
Iron & Steel furnace
- open hearth
Iron & Steel - basic oxygen furnace; clean scrap
Iron & Steel - basic oxygenfurnace; oily scrap
Steel foundries - electric arc furnace
Brass - melting
Lead furnace
Zinc - vertical refining retort
10-52
P-i CJ) µ::j
X
X
X
X
X
X
X
X
X
X
P-i (/) µ::j
tJ', C ·rl tn H nj
..c: CJ
Q) en
.-I :::l ~
P-i CJ) µ:l
tJ'l s::
·r-4 tn H m
..c: 0 (l)
H P-i
H (1) ..µ .-I ·r-4 µ'..,t
X
X
X
X
X
X
X
X
X
X
X
I I
H <1) ..µ H ,--I Cl) ·rl ..Q µ.i ..Q
:l H
<1) "d
0 ·rl CJ)
~ ·rl·r-l
H H .µ :l
..µ (l) 0
s:: rl OJ i:i:::i >
X
X
X
X
X
X
X
X
X
X
X
X
X
X
X
X
X
X
X
X
X
X
~ (1)
.a
..0 :;:j H u (/)
C 0
·rl en
·r-4 ,-, rl 0 u ..µ H (l)
>,-, nj u
X
X
X
X
X
X
X
X
X
X
X
'd Q)
H °' rn ..C:: H u (lJ ......... ..Q
(1) ..Q ,--I :;:j 0 H
·r-4 U ..µ CJ)
H m >i P-i cu
H "d Ci Q) (fl
H Ci °' mo ..C:: H UQ
X
X
X
X
X
X
X
X
X
X
X
H <1)
..Q
..a :l H 0 C/l
u ......... ~
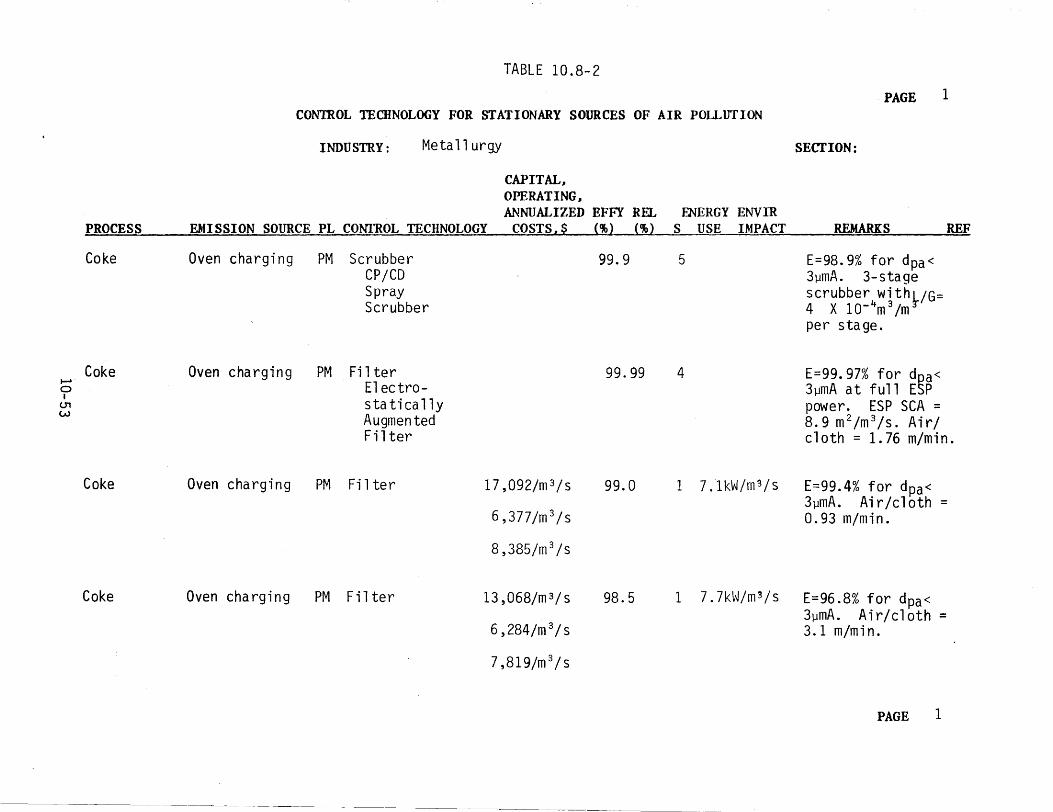
TABLE 10.8-2
PAGE 1 CON1ROL TECIINOLOOY FOR STATIONARY SOURCES OF AIR POLLITTION
INDUSTRY: Meta 11 urgy SECTION:
CAPITAL, OPERATING, ANNUALIZED EFFY RFL ENERGY ENVIR
PROCESS EMISSION SOURCE PL_ CONI'ROL_ TECHNOLOGY __ COS'I'S, $ (%) (%) S USE IMPACT REMARKS REF
Coke Oven charging PM Scrubber 99.9 5 E=98.9% for dpa<CP/CD 3µmA. 3-stageSpray scrubber with, /G=Scrubber 4 X 10- 4m3 /m r
per stage.
Coke Oven charging PM Fi 1ter 99.99 4 E=99.97% for dga<.-0 Electro- 3µmA at full ESP u, I
sta ti ca lly power. ESP SCA= w Augmented 8.9 m2 /m 3/s. Air/Filter cloth= 1.76 m/min.
Coke Oven charging PM Fi 1ter 17,092/m3/s 99.0 1 7.lkW/m 3/s E==99.4% for dpa< 3µmA. Air/cloth=
6,377/m 3/s 0.93 m/min.
8,385/m 3 /s
Coke Oven charging PM Filter 13,068/m3/s 98.5 1 7.7kW/m 3/s E==96.8% for dpa< 3µmA. Air/cloth=
6,284/m 3/s 3.1 m/min.
7,819/m 3 /s
PAGE 1
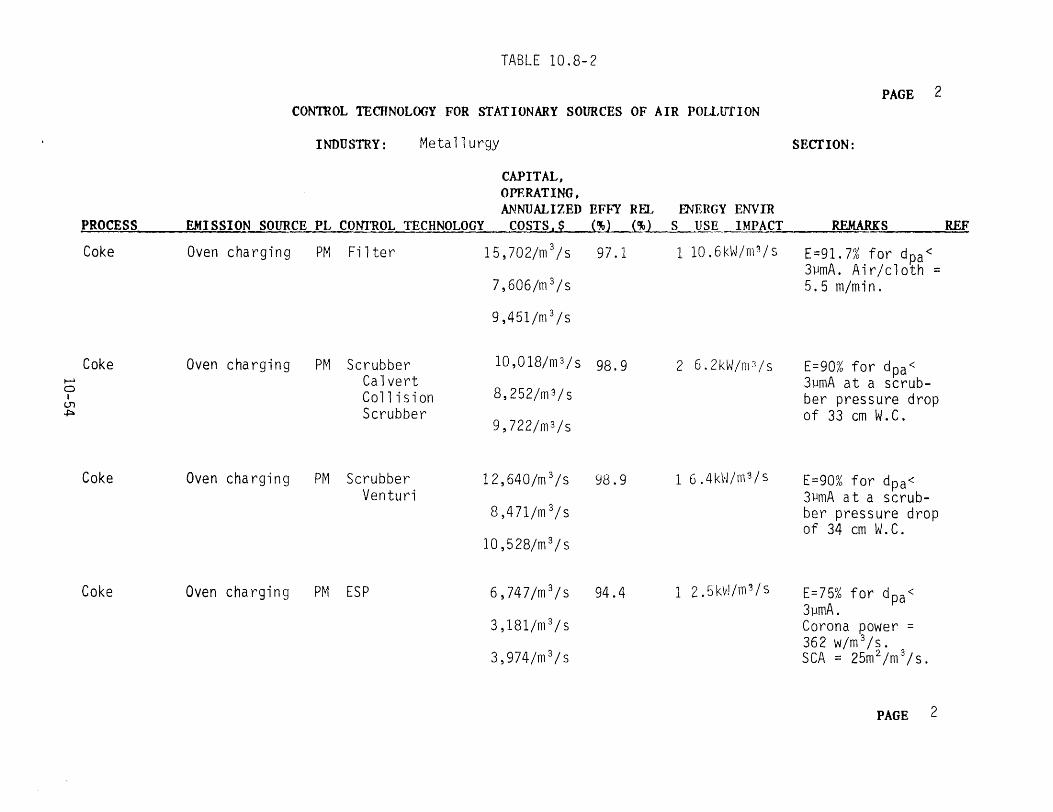
TABLE 10. 8-2
PAGE 2 CON1ROL TECHNOLOGY FOR STATIONARY SOURCES OF AIR POU,UTION
INDUSTRY: Meta 11 urgy SECTION:
CAPITAL, OPERATING, ANNUALIZED EFFY Ra ENERGY ENVIR
PROCESS EMISSION SOURCE PL CONTROL TECHNOLOGY COSTS,$ (%) (%) S USE IMPACT REMARKS REF
Coke Oven charging PM Filter 15,702/m 3/s 97.1 110.6kW/m 3/s E=91.7% for dpa< 3µmA. Air/cloth=
7,606/m 3/s 5.5 m/min.
9,451/m 3 /s
Coke Oven charging PM Scrubber 10,018/m3/s 98.9 2 6.2kW/m 1 /s E=90% for dpa< ~
0 Calvert 3µmA at a scrub
8,252/m 3 /sI Coll is ion ber pressure drop +=-U1
Scrubber of 33 cm W.C.9, 722/m3 /s
Coke Oven charging PM Scrubber 12,640/m 3/s 98.9 1 6 . 4 k \·J / m3 / s E=90% for dpa<Venturi JµmA at a scrub
8,471/m 3/s ber pressure drop of 34 cm W.C.
10,528/m 3/s
Coke Oven charging PM ESP 6,747/m 3/ s 94.4 1 2.5kvl/rn 3 /s E=75% for dpa< 3µmA.
3,181/m 3/s Corona power= 362 w/m 3 /s.
3,974/m 3/s SCA= 25m 2 /m 3/s.
PAGE 2
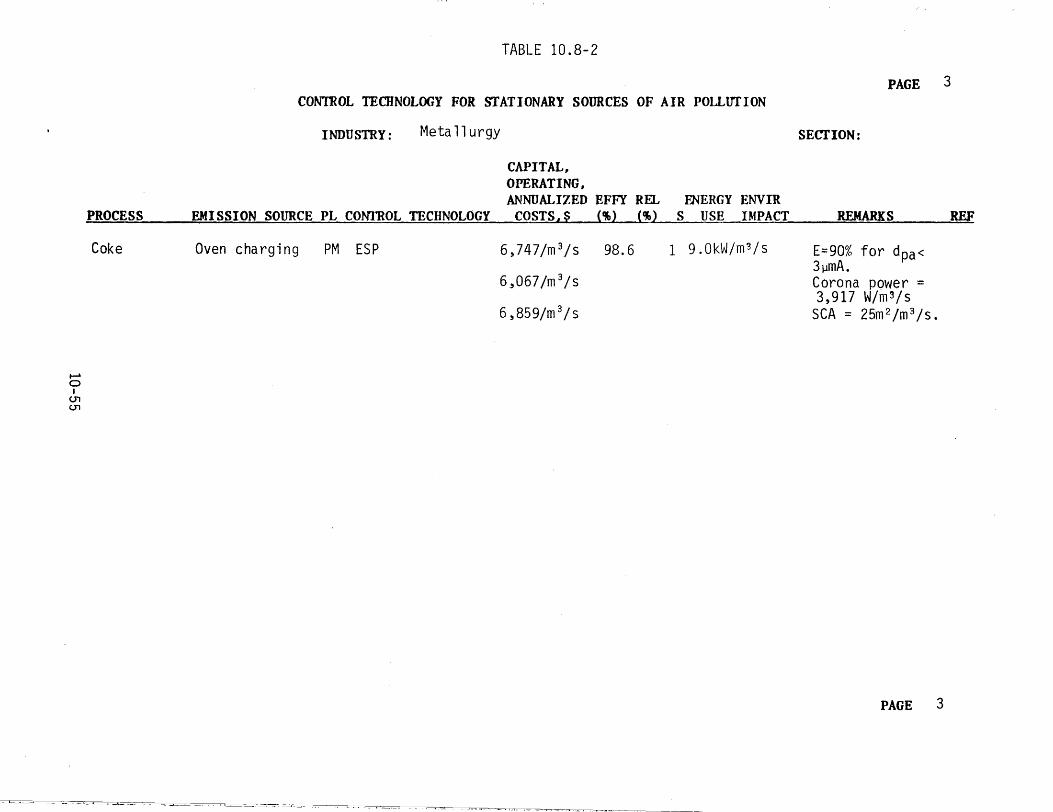
3
TABLE 10.8-2
CONTROL TECHNOLOGY FOR STATIONARY SOURCES OF AIR POLLtrrION
INDUSTRY: Meta 11 urgy
CAPITAL, OPERATING, ANNUALIZED EFFY REL fNERGY ENVIR
PROCESS EMISSION SOURCE PL CONTROL TECHNOLOGY COSTS,$ (%) (%) S USE IMPACT
Coke Oven charging PM ESP 6,747/m 3/s 98.6 1 9 .OkW/ms/s
6~067/m 3/s
6,859/m 3/s
....... 0 I
u, u,
PAGE
SECTION:
REMARKS REF
E=90% for dpa<3µmA . Corona power=3,917 W/m3/s
SCA= 25m 2 /m 3/s.
PAGE 3
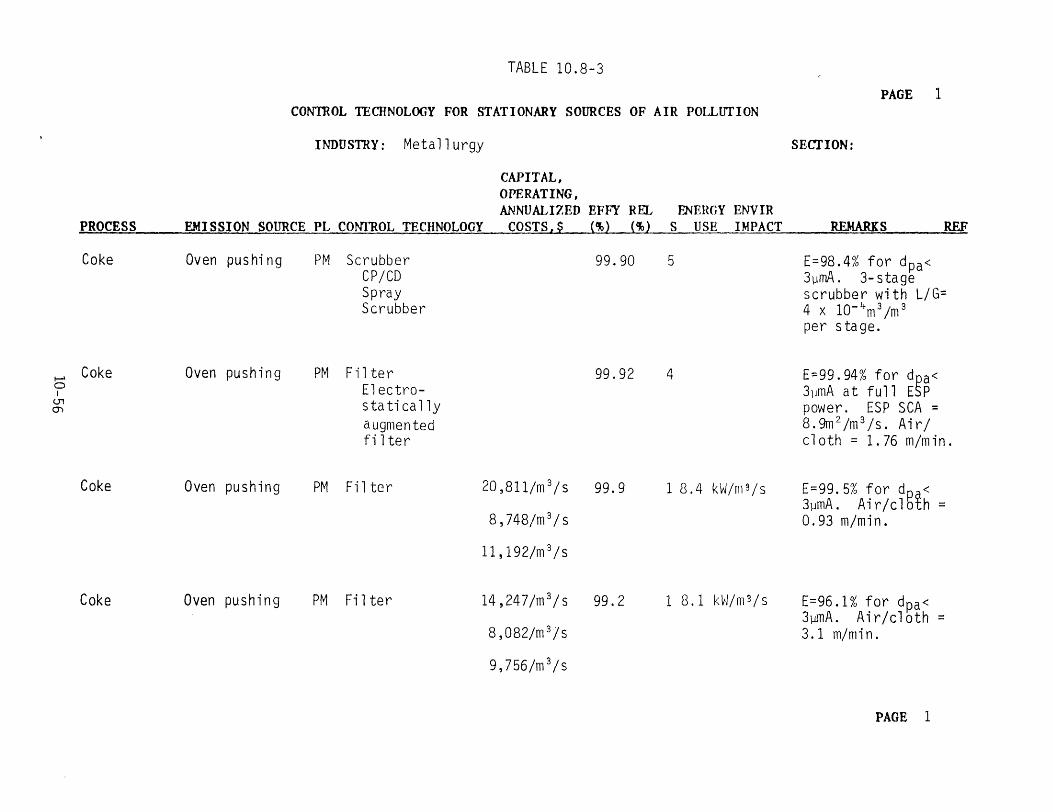
TABLE 10.8-3
PAGE 1 CON1ROL TECHNOLOGY FOR STATIONARY SOURCES OF AIR POlLIITION
INDUSTRY: Metallurgy SECTION:
CAPITAL, OPERATING, ANNUALIZED EFFY REL ~ERGY ENVIR
PROCESS EMISSION SOURCE PL CONTROL TECHNOLOGY COSTS,$ (%) (%) S USE IMPACT REMARKS REF
Coke Oven pushing PM Scrubber 99.90 5 E=98.4% for dpa< CP/CD 3µmA. 3- stageSpray scrubber with L/G=Scrubber 4 x 10- 4 m3 /m 3
per stage.
f-l Coke Oven pushing PM Fi 1ter 99.92 4 E=99.94% for dpa<0 Electro- 3µmA at full ESPI (.J1 O'> s ta ti cal ly power. ESP SCA=
augmented 8.9m 2 /m 3 /s. Air/ filter cloth= 1.76 m/min.
Coke Oven pushing PM Fi 1ter 20 ,811/m 3 / s 99.9 1 8.4 kW/rng/s E=99.5% for dpQ<
3µmA. Air/cloth=8,748/m 3 /s 0.93 m/min.
11, 192/m 3 / s
Coke Oven pushing PM Fi 1ter 14,247/m 3 /s 99.2 1 8.1 kvJ/m3/s E=96.1% for dpa<3].llTIA. Air/cloth=
8,082/m 3 /s 3.1 m/min.
9,756/m 3 /s
PAGE 1
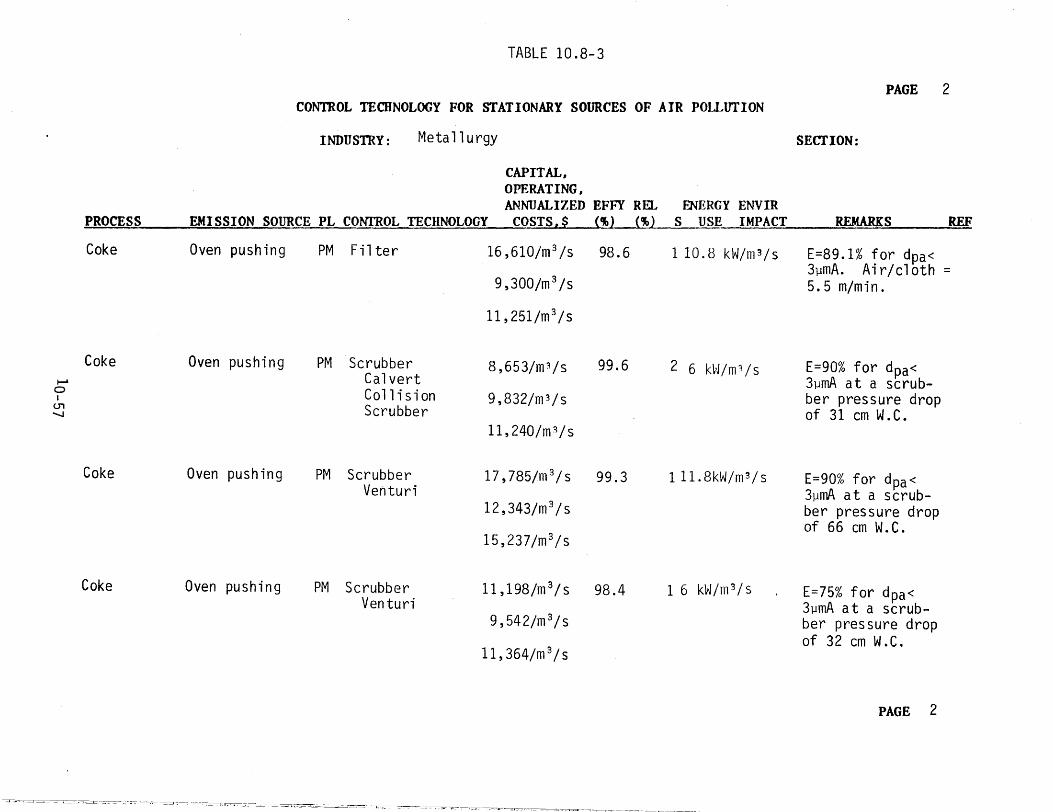
TABLE 10.8-3
PAGE 2 CONTROL TECHNOLOGY FOR STATIONARY SOURCES OF AIR POlLIITION
INDUSTRY: Meta 11 urgy SECTION:
CAPITAL, OPERATING, ANNUALIZED EFFY REL ENERGY ENVIR
PROCESS EMISSION SOURCE PL CONTROL TECHNOLOGY COSTS,$ (~) {%} s USE IMPACT REMARKS REF
Coke Oven pushing PM Fi 1ter 16,61O/m 3 /s 98.6 110.8 kW/m3/s E=89.1% for dpa<3µmA. Air/cloth=
9,3OO/m 3 /s 5.5 m/min.
11, 251/m 3 /s
Coke Oven pushing PM Scrubber 8,653/m 3/s 99.6 2 6 k~~/m 3 / s E=9O% for dpa< ...... Calvert
0 3µmA at a scrub-I
u, Collision 9,832/m3/s ber pressure drop
'-J Scrubber of 31 cm W.C. 11, 24O/m:i / s
Coke Oven pushing PM Scrubber 17,785/m 3/s 99.3 l ll.8kW/m3/s E=9O% for dpa<Venturi 3µmA at a scrub-
12,343/m 3/s ber pressure drop of 66 cm W.C.
15,237/m3/s
Coke Oven pushing PM Scrubber 11 , 198/m 3/ s 98.4 1 6 kW/m 3 /s E=75% for dpa<Venturi 3µmA at a scrub-
9, 542/m 3/s ber pressure drop of 32 cm W.C.
ll,364/m 3/s
PAGE 2
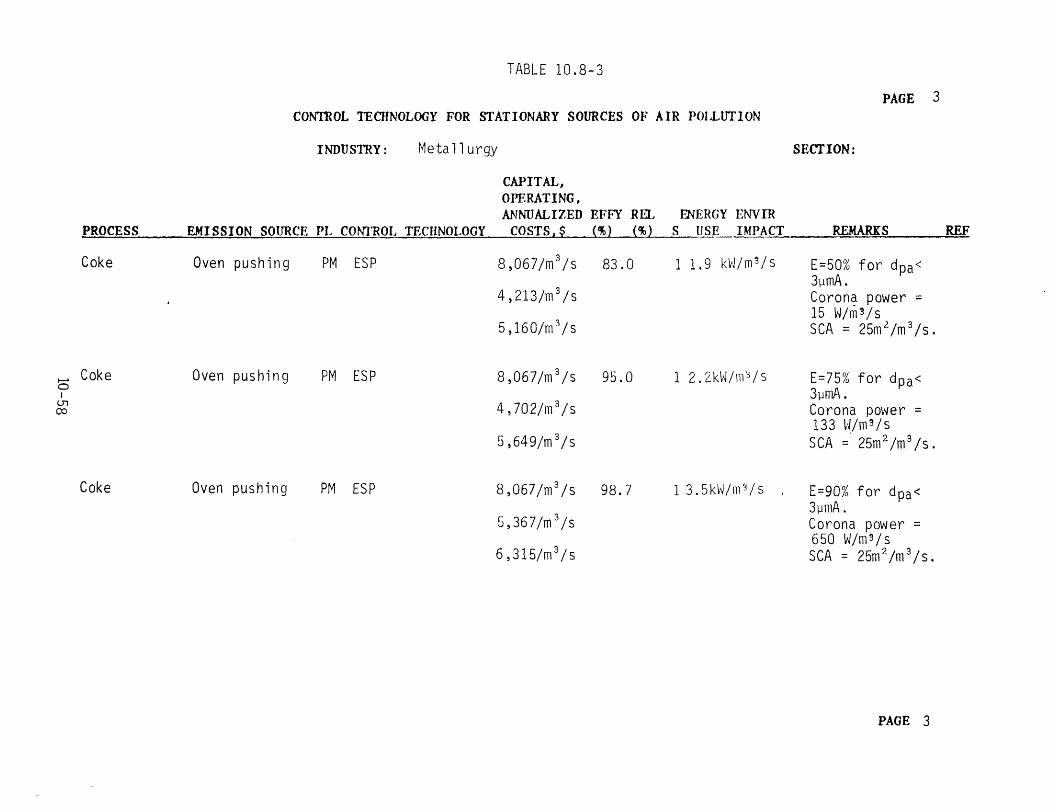
TABLE 10.8-3
PAGE 3 CON'mOL TECHNOLOGY FOR STATIONARY SOURCES OF AIR POLLtrrION
INDUSTRY: Meta 11 urgy SECTION:
CAPITAL, OPERATING, ANNUALIZED EFFY REL ENERGY ENVIR
PROCESS EMISSION SOURCE PL CON'I~OL TECHNOLOGY COSTS,$ ~%} ~%} s USE IMPACT REMARKS REF
Coke Oven pushing PM ESP 8,067/m 3 /s 83.0 1 1. 9 kvJ / m3 / s E=50% for dpa<3µmA.
4,213/m 3 /s Coron~ power=15 ~✓ /mg/s
5,160/m 3/s SCA= 25m 2 /m 3/s.
I-' Coke Oven pushing PM ESP 8,067/m 3 /s 95.0 1 2.2kW/m'3 /s E=75% for dpa<0 3µmA.I
co u, 4,702/m 3/s Corona power=
133 ~~/m 3 / s 5,649/m 3/s SCA =· 25m 2 /m 3 /s.
Coke Oven pushing PM ESP 8,067/m 3 /s 98.7 1 3.5k~~/m 3 /s E=90% for dpa<' 3µmA.
5,367/m 3 /s Corona power = 650 W/m3/s
6 ,315/m 3 /s SCA = 25m 2 /m 3 /s.
PAGE 3
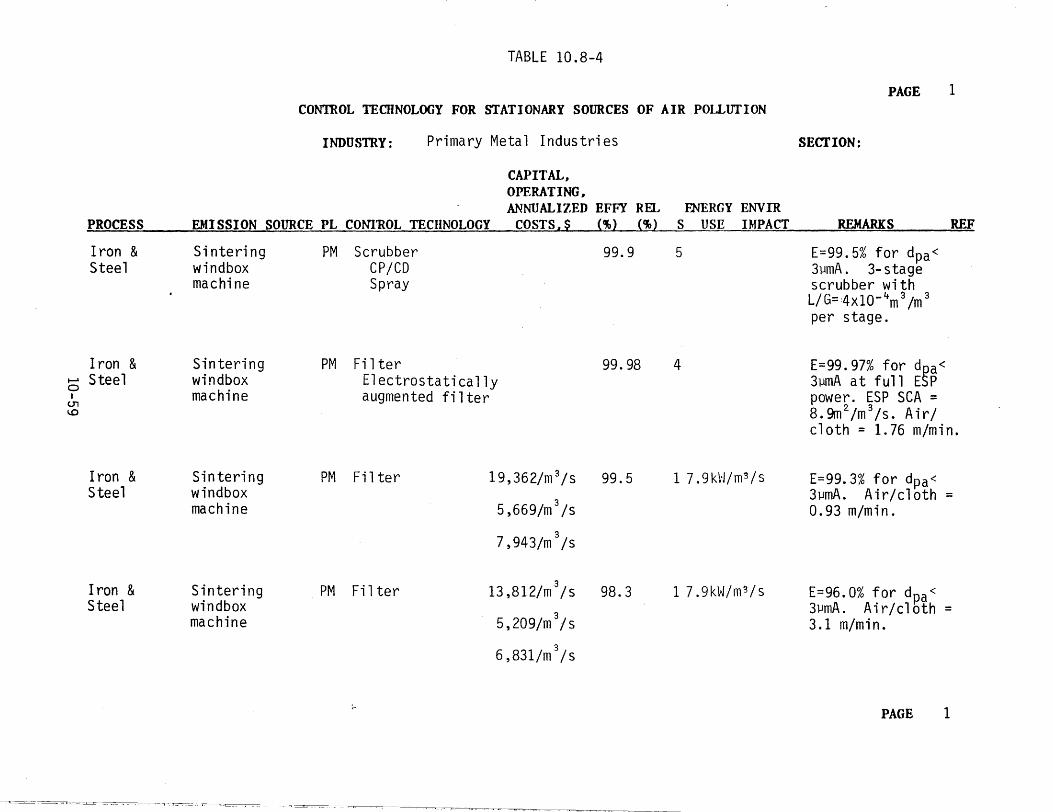
TABLE 10. 8-4
PAGE 1 CON1ROL TECHNOLOGY FOR STATIONARY SOURCES OF AIR POlLlITION
INDUSTRY: Primary Metal Industries SECTION:
CAPITAL, OPERATING, ANNUALIZED EFFY REL ENERGY ENVIR
PROCESS EMISSION SOURCE PL CONI'ROL TECHNOLOGY COSTS,$ (%) (%) S USE IMPACT REMARKS REF
Iron & Sintering PM Scrubber 99.9 5 E=99.5% for dpa<Steel windbox CP/CD 3µmA. 3-stage
machine Spray scrubber with 3 /m 3L/G=:4xl0- 4m
per stage.
Iron & Sin tering PM Filter 99.98 4 E=99.97% for dpa<5 Steel windbox Electrostatically 3µmA at full ESP I machine augmented filter power. ESP SCA=
I.O (.J1
8.9m 2 /m 3 /s. Air/ cloth= 1.76 m/min.
Iron & Sin teri ng PM Filter l 9,362/m 3 /s 99.5 1 7.9kH/m3 /s E=99.3% for dpa<Steel windbox 3µmA. Air/cloth=
machine 5,669/m 3 /s 0.93 m/min.
7,943/m 3 /s
Iron & Sintering PM Fi 1ter 13 ,812/m 3 /s 98.3 1 7 .9kW/m 3 /s E=96.0% for dpa<Steel windbox 3µmA. Air/cloth=
machine 5,209/m 3 /s 3.1 m/min.
6,831/m 3 /s
:. PAGE 1
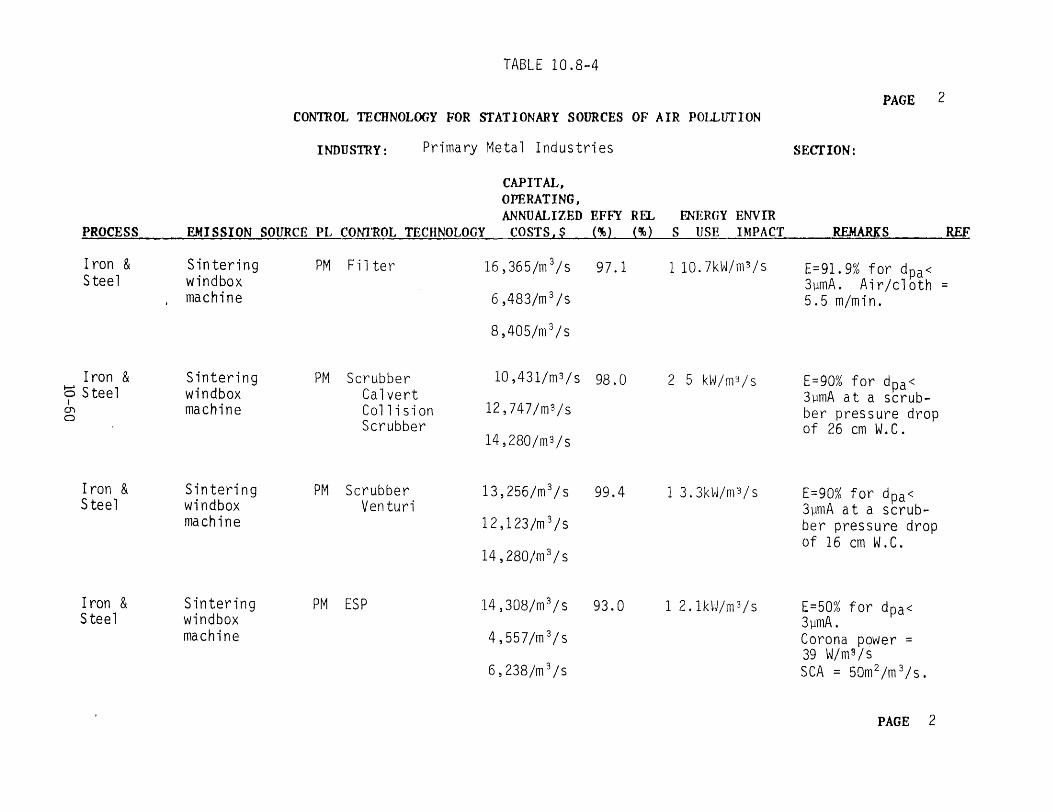
TABLE 10.8-4
PAGE 2 CONTROL TECHNOLOGY FOR STATIONARY SOURCES OF AIR POL.LlJfION
INDUSTRY: Primary Metal Industries SECTION:
CAPITAL, OPERATING, ANNUALIZED EFFY REL ENERGY ENVIR
PROCESS EMISSION SOURCE PL CONTROL TECHNOLOGY COSTS,$ (,,) (%) S USE IMPACT REMARKS REF
I ran & Sin teri ng PM Filter 16,365/m 3/s 97.1 l 10.7kW/m3 /s E=91. 9% for dpa<Steel windbox 3µmA. Air/cloth=
machine 6,483/m 3 /s 5.5 m/min.
8,405/m 3/s
Iron & Sintering PM Scrubber 10,431/m3/s 98.0 2 5 kW/m 3 /s E=90% for dpa <5 Steel windbox Calvert 3µmA at a scrubI machine Co 11 is ion 12,747/m3 /sCJ') ber pressure drop0
Scrubber of 26 cm W.C. 14,280/m3/s
Iron & Sin teri n g PM Scrubber 13,256/m 3/s 99.4 1 3.3kW/m3/s E=90% for dpa<Steel windbox Venturi 3µmA at a scrub
machine 12,123/m 3 / s ber pressure drop
of 16 cm W.C. 14,280/m 3/s
Iron & Sintering PM ESP 14,308/m 3/s 93.0 1 2 . 1 k lJ / m3 / s E=50% for dpa<Steel windbox 3µmA.
machine 4,557/m 3 / s Corona power=
39 ~✓ /m~/s 6, 238/m 3 /s SCA= 50m 2 /m 3 /s.
PAGE 2
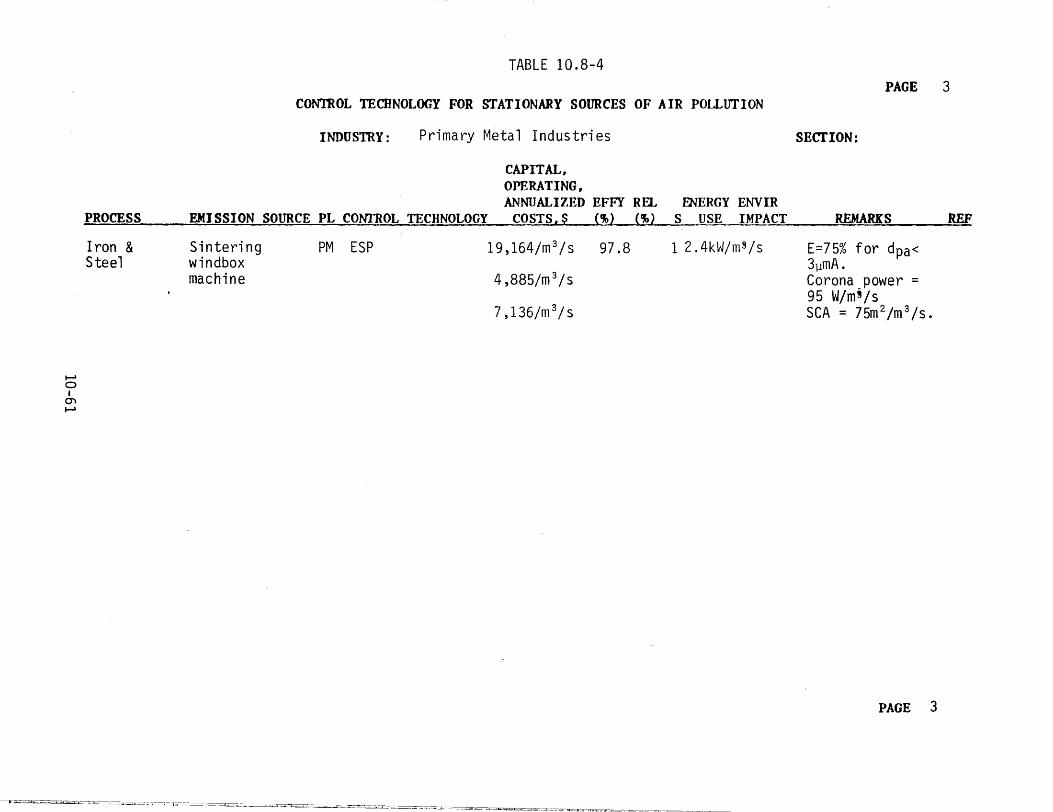
TABLE 10.8-4 PAGE 3
CONTROL TECHNOLOGY FOR STATIONARY SOURCES OF AIR POLLUTION
INDUSTRY: Primary Metal Industries SECTION:
CAPITAL. OPERATING. ANNUALIZED EFFY REL IWERGY ENVIR
PROCESS EMISSION SOURCE PL CONTROL TECHNOLOGY COSTS,$ (%) (%) S USE IMPACT REMARKS REF
Iron & Sinteri ng PM ESP 19,164/m 3 /s 97.8 1 2 . 4 kt✓/ m' / s E=75% for dpa<Steel windbox 3µmA.
machine 4,885/m 3/s Corona power= 95 W/m 9/s
7,136/m 3/s SCA= 75m 2 /m 3/s.
1--' 0 I
1--'"'
PAGE 3
.1--:_.-::_-_--~_:___.-~~
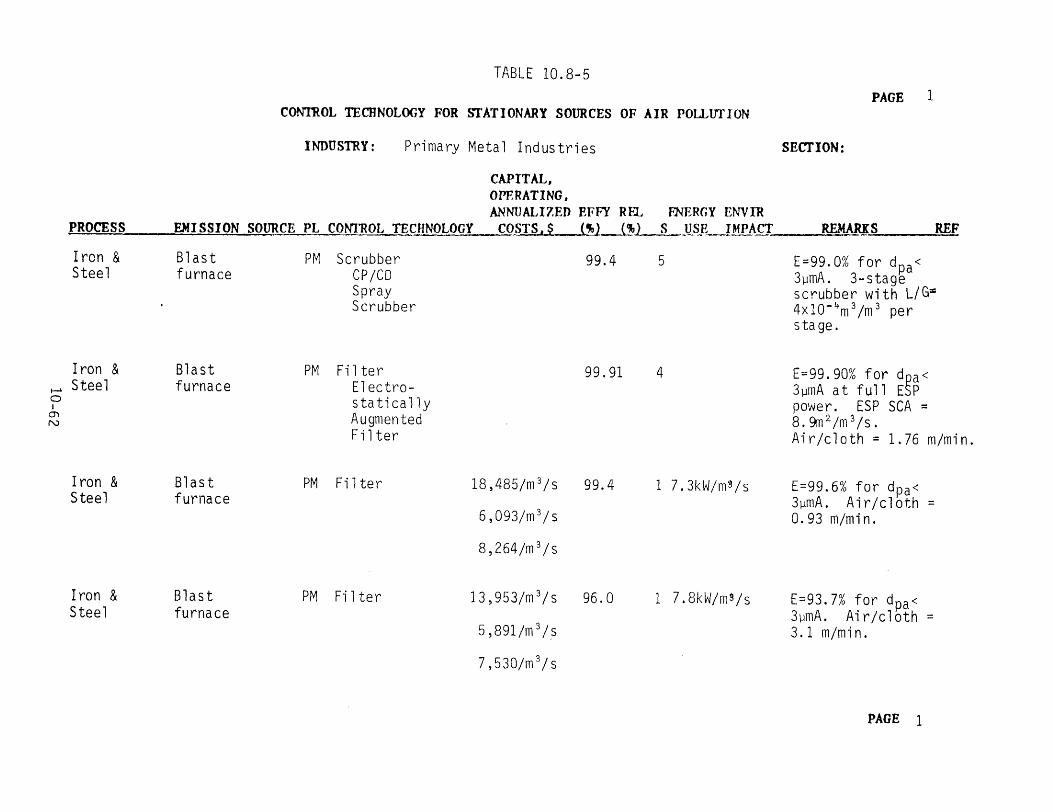
TABLE 10.8-5
PAGE 1 CONTROL TECBNOLOGY FOR STATIONARY SOURCES OF AIR POLLUTION
INDUSTRY: Primary Metal Industries SECTION:
CAPITAL, OPERATING, ANNUALIZED EFFY REL FNERGY ENVIR
PROCESS EMISSION SOURCE PL CON'I~OL TECHNOLOGY COSTS,$ (~) (%J S USE IMPACT REMARKS REF
Iron & Blast PM Scrubber 99.4 5 E=99.0% for dpa<Steel furnace CP/CO 3µmA. 3-stage
Spray scrubber with L/G=Scrubber 4xl0- 4 m3 /m 3 per
stage.
Iron & Blast PM Filter 99.91 4 E=99.90% for dpa< 1--> Steel furnace Electro- 3µmA at full ESP I
C)
0 stat i ca 11 y power. ESP SCA= N Augmented 8 . 5m 2 /m 3
/ s • Filter Air/cloth= 1.76 m/min.
Iron & Bl as t PM Filter 18,485/m 3/s 99.4 1 7.3kW/mg/s E=99.6% for dpa<Steel furnace 3µmA. Air/cloth=
6,093/m 3/s 0.93 m/min.
8,264/m 3/s
Iron & Blast PM Filter 13,953/m 3/s 96.0 1 7.8kW/mg/s E=93.7% for dpa<Steel furnace 3µmA. Air/cloth=
5,891 /m 3 1,s 3.1 m/min.
7,530/m 3/s
PAGE 1
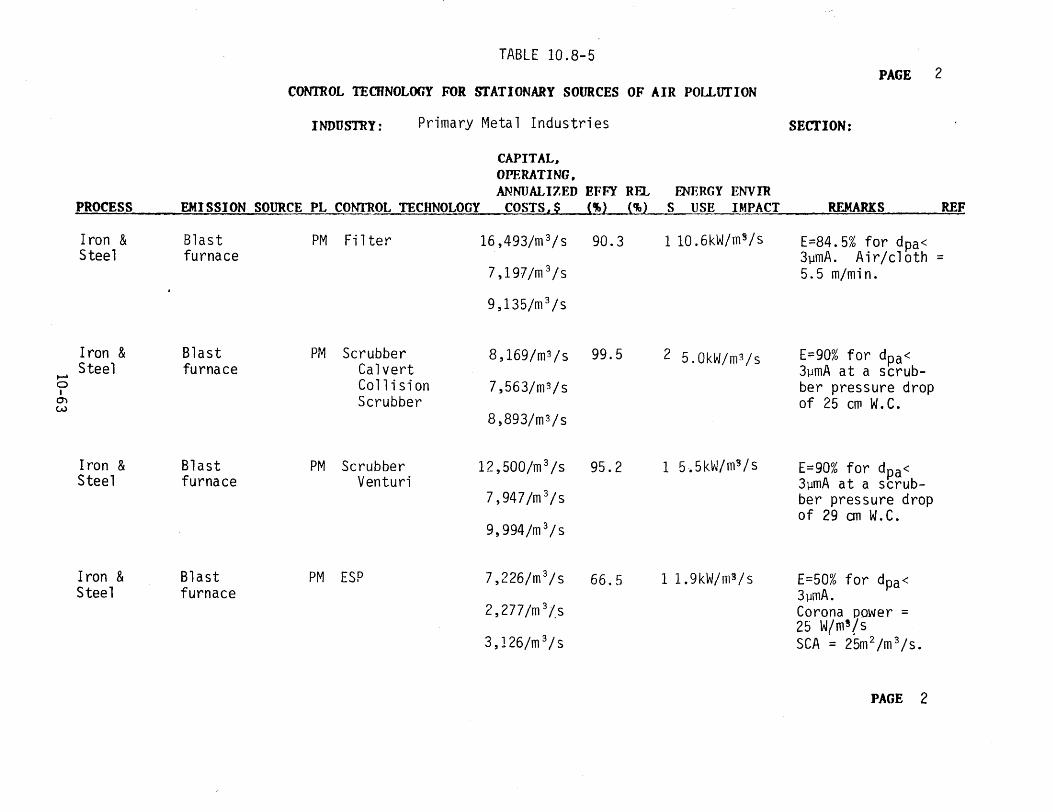
TABLE 10.8-5 PAGE 2
CON'IROL TEt1JNOLOGY FOR STATIONARY SOURCES OF AIR POLLtrrION
INDUSTRY: Primary Metal Industries SECTION:
CAPITAL, OPERATING, ANNUALIZED EFFY REL BmRGY ENVIR
PROCESS EMISSION SOURCE PL CONTROL TECHNOLOGY COSTS,$ (") (%) s USE IMPACT REMARKS REF
Iron & Blast PM Filter 16,493/m 3/s 90.3 110.6kW/m~/s E=84.5% for dpa<Steel furnace 3µmA. Air/cloth=
7,197/m 3 /s 5.5 m/min.
9,135/m 3 /s
Iron & Blast PM Scrubber 8,169/m3/s 99.5 E=90% for dpa<2 5.0kW/m3 /s ..... Steel furnace Calvert JµmA at a scrub-a I
Collision 7 ,563/m3/s ber pressure drop 0) Scrubber of 25 crn W.C.w
8,893/m3/s
3Iron & Blast PM Scrubber 12,500/m 3 /s 95.2 1 5-. 5kW/ m / s E=90% for dpa<Steel furnace Venturi 3µmA at a scrub-
7,947/m 3/s ber pressure drop of 29 cm W.C.
9,994/m 3/s
Iron & Blast PM ESP 7,226/m 3/s 66.5 1 1. 9kW/m' / s E=50% for dpa<Steel furnace 3µmA.
2,277/m 3/s Corona power = 25 W/m'/s
3,126/m 3/s SCA ~ 25m 2 /m 3 /s.
PAGE 2
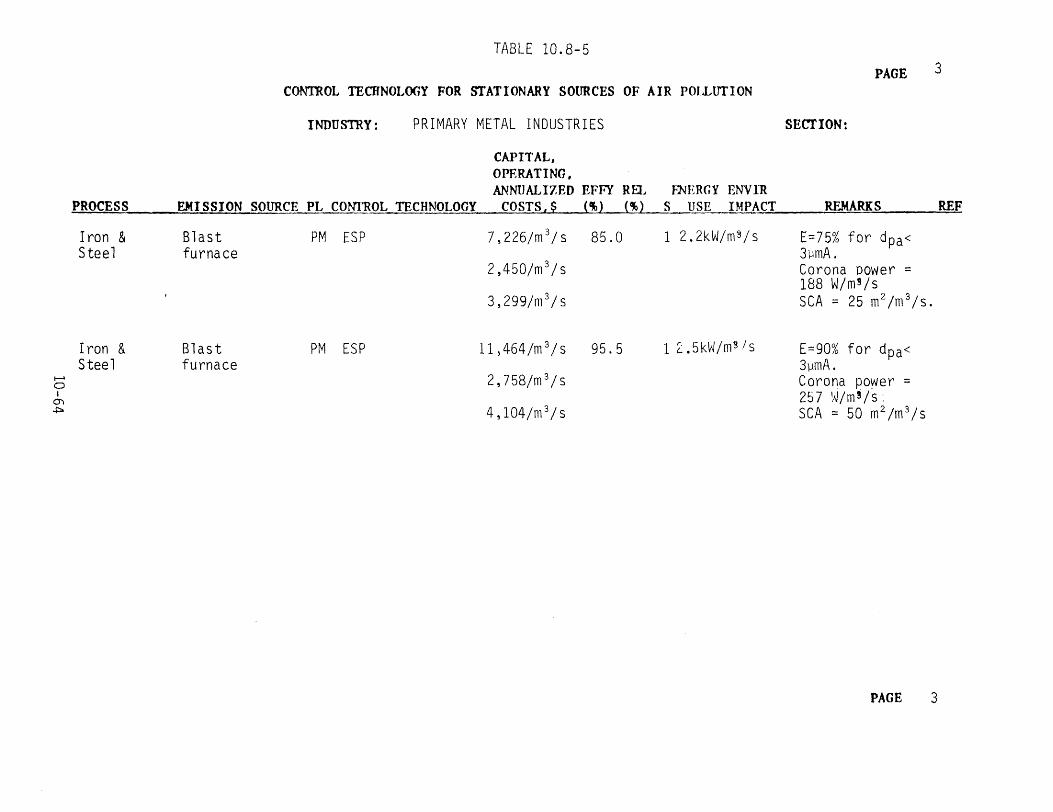
TABLE 10.8-5 3PAGE
CONTROL TECHNOLOGY FOR STATIONARY SOURCES OF AIR POLJ.,lITION
INDUSTRY: PRIMARY METAL INDUSTRIES SECTION:
CAPITAL, OPERATING, ANNUALIZED EFFY REL ENERGY ENVIR
PROCESS EMISSION SOURCE PL CON1~0L TECHNOLOGY COSTS,$ (~) (%) S USE IMPACT REM.ARKS REF
Iron & Blast PM ESP 7,226/m 3/s 85.0 1 2.2kW/m9/s E=75% for dpa< Steel furnace 3µmA.
2,450/m 3 /s Corona Power= 188 W/m'/s
3,299/m 3/s SCA= 25 m2 /m 3/s.
Iron & Blast PM ESP 11 , 464 /m 3 / s 95.5 1 2 .5kW/m3 Is E=90% for dpa<
Steel furnace 3µmA. a ~ 2,758/m 3/s Corona po~wer = I 257Wm!/s.O') ~ 4, 104/m 3
/ s SCA= 50 m2 /m 3 /s
PAGE 3
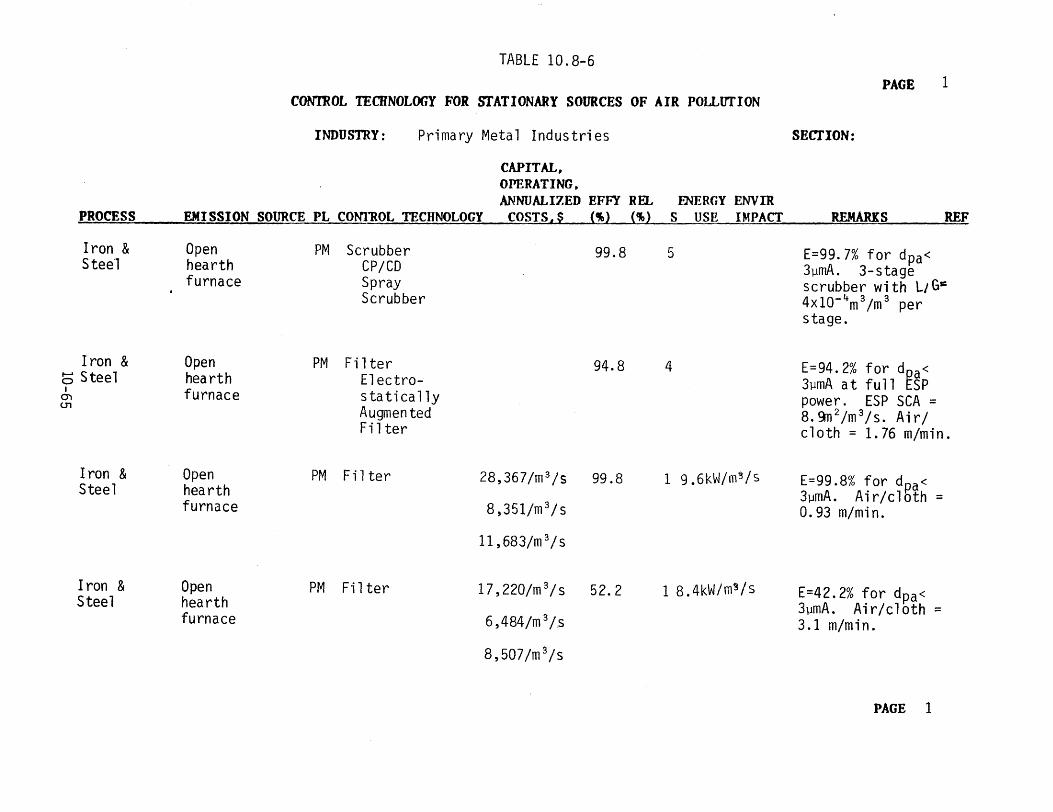
TABLE 10.8-6
PAGE 1 CON'IROL TEOINOLOGY FOR STATIONARY SOURCES OF AIR POI.LOTION
INDUSTRY: Primary Metal Industries SECTION:
CAPITAL, OPERATING. ANNUALIZED EFFY REL fNERGY ENVIR
PROCESS EMISSION SOURCE PL CON'l~OL TECHNOLOGY COSTS,$ (~) (~) S USE IMPACT REMARKS REF
Iron & Open PM Scrubber 99.8 5 E=99.7% for dpa<Steel hearth CP/CD 3µmA. 3-s tage furnace Spray scrubber with L1G=
Scrubber 4xl0- 4m3 /m 3 per stage.
Iron & Open PM Filter 94.8 4 E=94.2% for dQa<5 Steel hearth Electro- 3µmA at full ESP O'l I furnace s ta ti ca lly
u, power. ESP SCA=Augmented 8. 9TI 2 /m 3/ s. Air/Filter cloth= 1.76 m/min.
Iron & Open PM Fi 1ter 28,367/m 3 /s 99.8 1 9.6kW/m3/s E=99.8% for dpa<Steel hearth 3µmA. Air/cloth=furnace 8,351/m 3/s 0.93 m/min.
11, 683/m 3/ s
Iron & Open PM Filter 17,220/m 3/s 52.2 1 8.4kW/m~/s E=42.2% for dpa<Steel hearth 3µmA. Air/cloth=furnace 6,484/m 3/.s 3.1 m/min.
8,507/m 3/s
PAGE 1
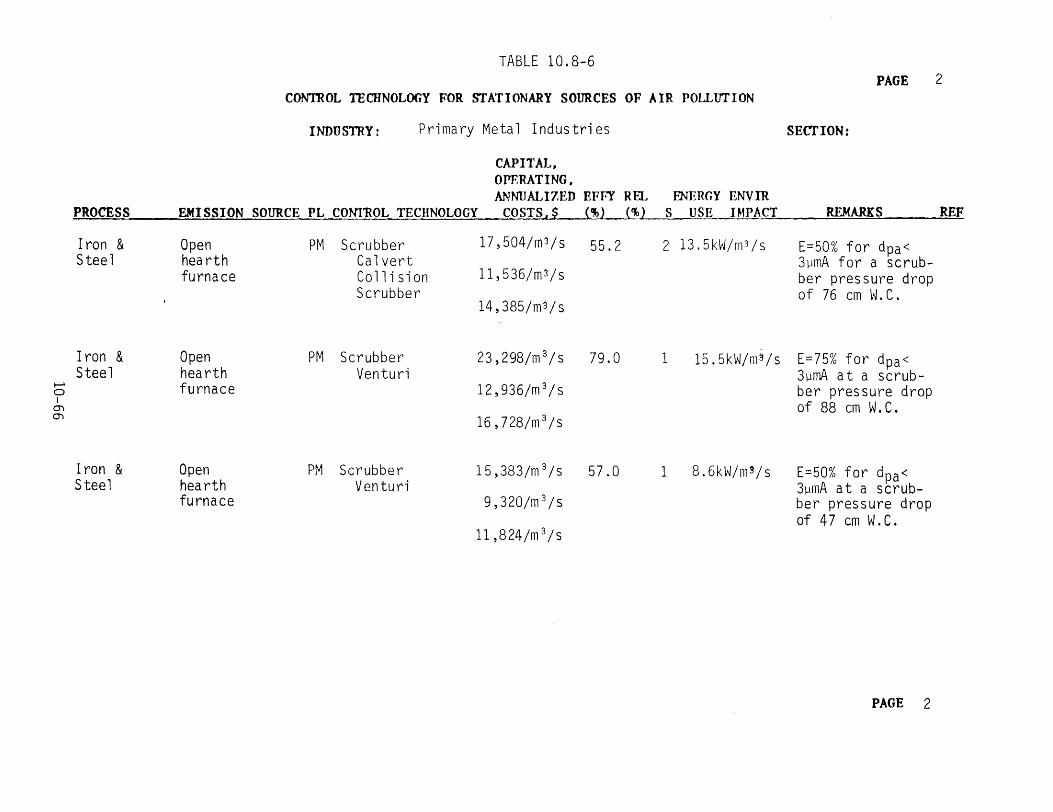
TABLE 10.8-6 PAGE 2
CON'rnOL TECHNOLOGY FOR STATIONARY SOURCES OF AIR POLLtrrION
INDUSTRY: Primary Metal Industries SECTION:
CAPITAL, OPRRATING, ANNUALIZED EFFY REL FNERGY ENVIR
PROCESS EMISSION SOURCE PL CON'I~OL TECHNOLOGY COSTS,$ {%} {%} s USE IMPACT REMARKS REF- -· --- -
Iron & Open PM Scrubber 17,504/m3/s 55.2 2 13 . 5 k vJ I m3 / s E=50% for dpa<Steel hearth Calvert 3µmA for a scrub-
ll,536/m3/sfurnace Collision ber pressure dropScrubber of 76 cm W.C.
14,385/m3/s
Iron & Open PM Scrubber 23,298/m 3/s 79.0 1 15.5kW/mS/s E=75% for dpa<Steel hearth Venturi 3µmA at a scrub-
I-' 0 furnace 12,936/m 3/s ber pressure drop m I of 88 cm W.C.
m 16 , 728/ m 3 / s
Iron & Open PM Scrubber 15 ,383/m 3 /s 57.0 1 8.6kW/mg/s E=50% for dpa<Steel hearth Venturi 3µmA at a scrub-
furnace 9,320/m 3 /s ber pressure drop of 47 cm W.C.
11,824/m 3 /s
PAGE 2
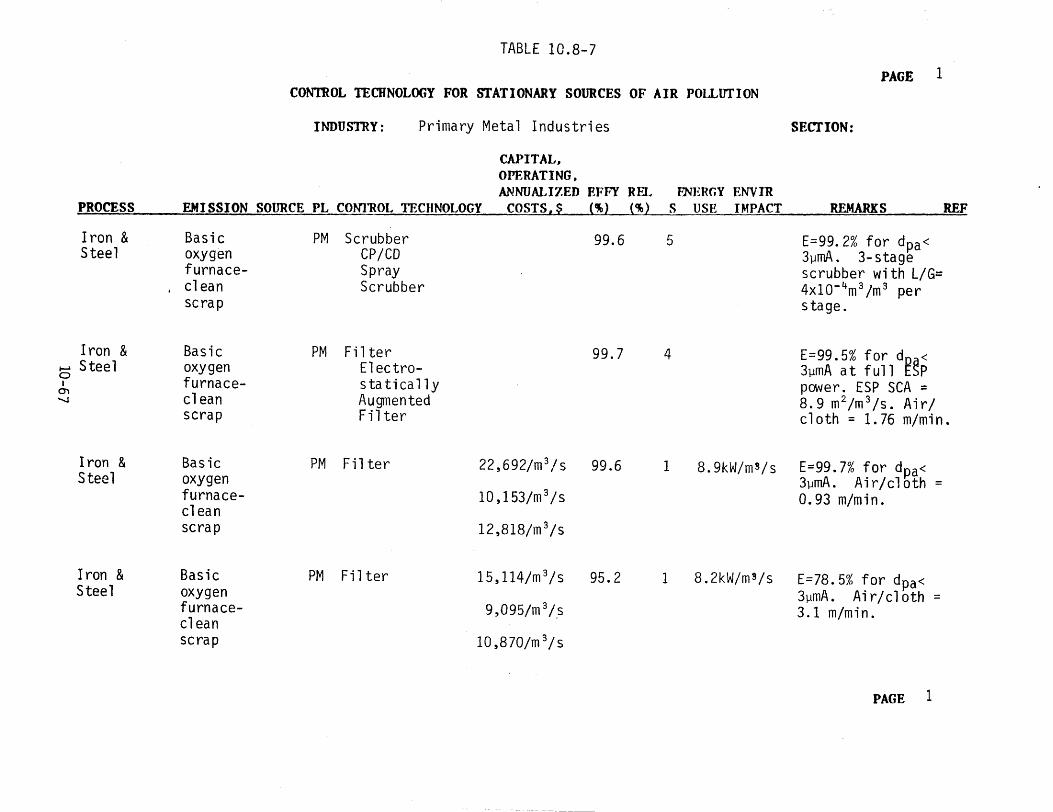
TABLE 10.8-7
PAGE 1 CONTROL TECHNOLOGY FOR STATIONARY SOURCES OF AIR POLLtrrION
INDUSTRY: Primary Metal Industries SECTION:
CAPITAL, OPERATING, ANNUALIZED EFFY Ra fNERGY ENVIR
PROCESS EMISSION SOURCE PL CON'I~OL TECHNOLOGY COSTS,$ (~) (%) S USE IMPACT REMARKS REF
Iron & Basic PM Scrubber 99.6 5 E=99.2% for dpa<Steel oxygen CP/CD 3µmA. 3-stage
furnace Spray scrubber with L/G=clean Scrubber 4x10- 4m3 /m 3 per scrap stage.
Iron & Basic PM Filter 99.7 4 E=99.5% for doa< ~ Steel oxygen Electro-0 3µmA at full l:.~P m I furnace s ta ti ca lly power. ESP SCA=
'-.I clean Augmented 8.9 m2 /m 3 /s. Air/scrap Filter cloth= 1.76 m/min.
Iron & Basic PM Filter 22,692/m 3 /s 99.6 1 8.9kW/m'/s E=99.7% for dpa<Steel oxygen 3µmA. Air/cloth=
furnace 10 , 153/m 3 / s 0.93 m/min.
clean scrap 12,818/m 3/s
Iron & Basic PM Filter 15,114/m 3/s 95.2 1 8.2kW/m'/s E=78.5% for dpa<Steel oxygen 3µmA. Air/cloth=
furnace 9,095/m 3/s 3 .1 m/min.clean scrap 10,870/m 3/s
PAGE 1
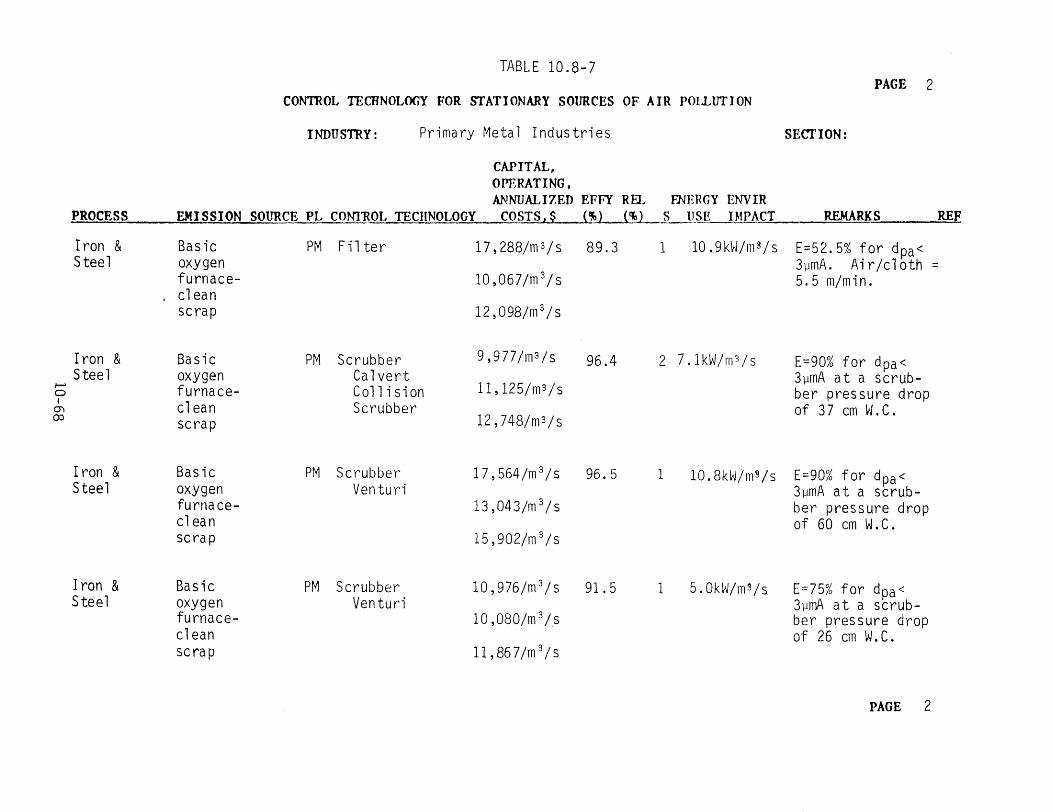
CONTROL TECHNOLOGY FOR
TABLE 10.8-7
STATIONARY SOURCES OF AIR POU.lITION PAGE 2
INDUSTRY: Primary Meta 1 Industries SECTION:
PROCESS EMISSION SOURCE PL com'ROL TECHNOLOGY
CAPITAL, OPERATING, ANNUALIZED
COSTS,$ EFFY (~)
REL (%)
FNERGY s USE
ENVIR IMPACT REMARKS REF
Iron & Steel
,
Basic oxygen furnace-clean scrap
PM Fi 1ter 17, 288/m 3 / s
10,067/m 3 /s
12,098/m 3/s
89.3 1 10.9kW/m 3 /s E=52.5% for dpa< 3µmA. Air/cloth= 5.5 m/min.
,_.. 0 I
O"l co
Iron & Steel
Basic oxygen furnaceclean scrap
PM Scrubber Calvert Co11 is ion Scrubber
9,977/m3/s
ll,125/m3/s
12,748/m3/s
96.4 2 7.lkW/m 3 /s E=90% for dpa< 3µmA at a scrubber pressure drop of 37 cm W.C.
Iron & Steel
Basic oxygen furnaceclean scrap
PM Scrubber Venturi
17,564/m 3 /s
13 ,04 3/m 3/ s
15,902/m 3/s
96.5 1 10.SkW/mg/s E=90% for dpa< 3µmA at a scrubber pressure drop of 60 cm W.C.
Iron & Steel
Basic oxygen furnaceclean scrap
PM Scrubber Venturi
10,976/m 3 /s
10,080/m 3/s
11 , 86 7/m 3 / s
91. 5 1 5.0kW/mg/s E=75% for dpa< 3µrrA at a scrubber pressure drop of 26 cm W.C.
PAGE 2
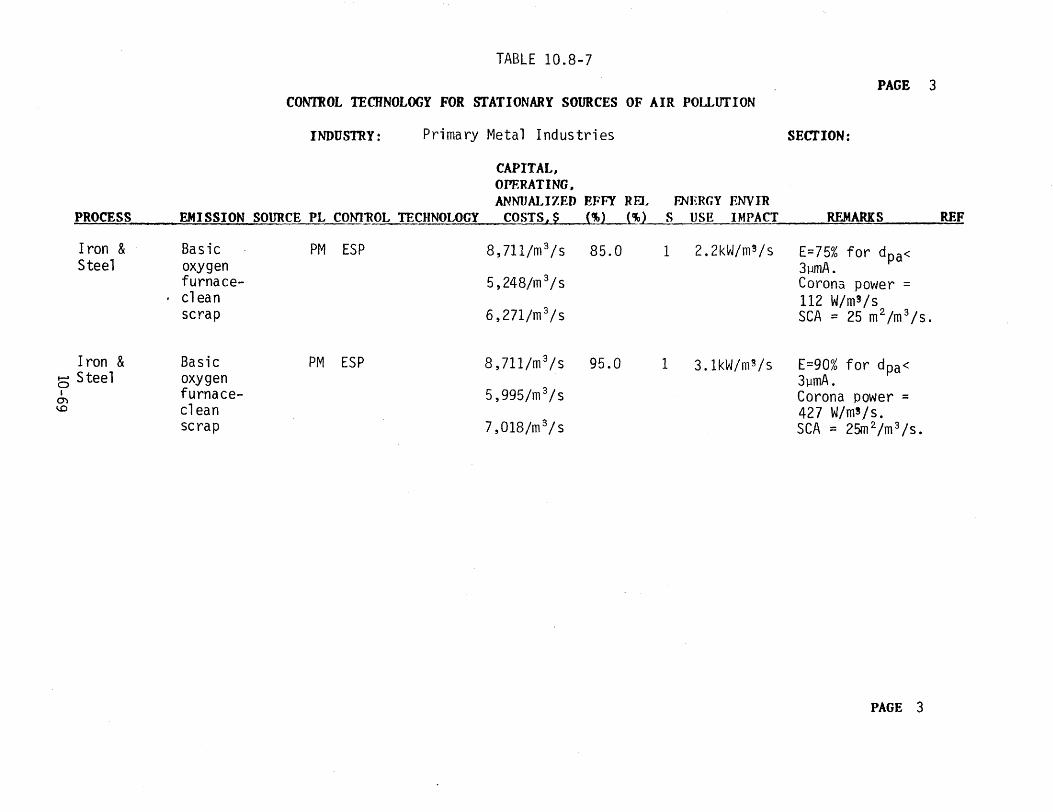
TABLE 10.8-7
PAGE 3 CONTROL TECHNOLOGY FOR STATIONARY SOURCES OF AIR POLLUTION
INDUSTRY: Primary Metal Industries SECTION:
CAPITAL, OPERATING. ANNUALIZED EFFY REL FNERGY ENVIR
PROCESS EMISSION SOURCE PL CONTROL TECHNOLOGY COSTS,$ (1>) (%J S USE IMPACT REMARKS REF
Iron & Basic PM ESP 8, 711/m 3 /s 85.0 1 2.2kW/mg/s E=75% for dpa<Steel oxygen 3l1ITIA.
furnace- 5,248/m 3/s Corona power= . clean 112 W/m 9 /s
scrap 6,271/m 3/s SCA= 25 m2 /m 3 /s.
Iron & Basic PM ESP 8,711/m 3/s 95.0 1 3.lkW/m3/s E=90% for dpa<5 Steel oxygen 3µmA. I
m furnace 5,995/m 3/s Corona power= \.0 clean 427 W/m!/s.
scrap 7 ,018/m 3 / s SCA = 25m 2 /m 3 /s.
PAGE 3
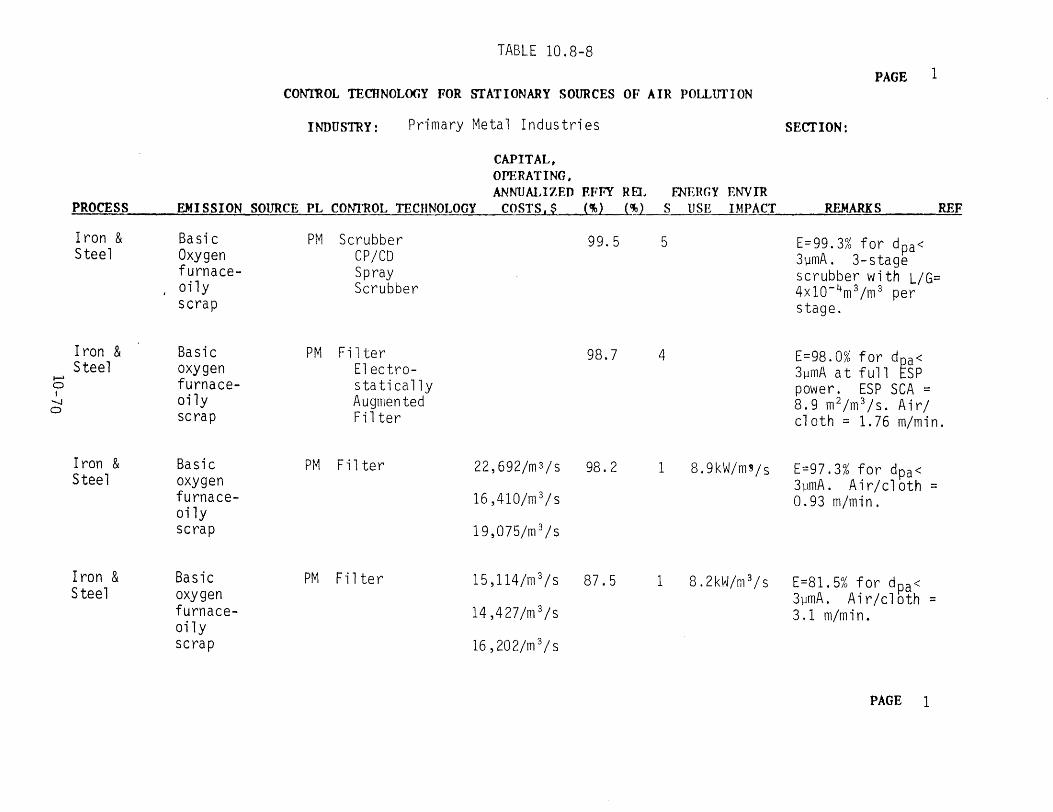
TABLE 10.8-8
CON'IROL TECHNOLOGY FOR STATIONARY SOURCES OF AIR POLLUI'ION PAGE 1
INDUSTRY: Primary Metal Industries SECTION:
PROCESS
Iron & Steel
,
EMISSION
Basic Oxygen furnace-oily scrap
SOURCE PL com~OL TECHNOLOGY
PM Scrubber CP/CD Spray Scrubber
CAPITAL, OPERATING, ANNUALIZED
COSTS,$ EFFY REL (%) (%)
99.5
ENERGY s USE
5
ENVIR IMPACT REMARKS REF
E=99.3% for dpa< 3µmA. 3-stage scrubber with L/G=4x10- 4 m3 /m 3 per stage.
1-l 0 I
-....J 0
I ran & Steel
Basic oxygen furnaceoily scrap
PM Filter Electro-s ta ti ca lly Augmented Filter
98.7 4 E=98.0% for dpa<3µmA at full ESP power. ESP SCA= 8.9 m2 /m 3 /s. Air/ cloth= 1.76 m/min.
Iron & Steel
Basic oxygen furnaceoily scrap
PM Filter 22,692/m3/s
16,410/m 3/s
19,075/m 3 /s
98. 2 1 8.9kW/m'/s E=97.3% for dpa< 3µmA. Air/cloth= 0.93 m/min.
Iron & Steel
Basic oxygen furnaceoily scrap
PM Filter 15,114/m 3 /s
14,427/m 3/s
16,202/m 3 /s
87.5 1 8.2kW/m 3 /s E=81.5% for dpa< 3µmA. Air/cloth= 3.1 m/min.
PAGE 1
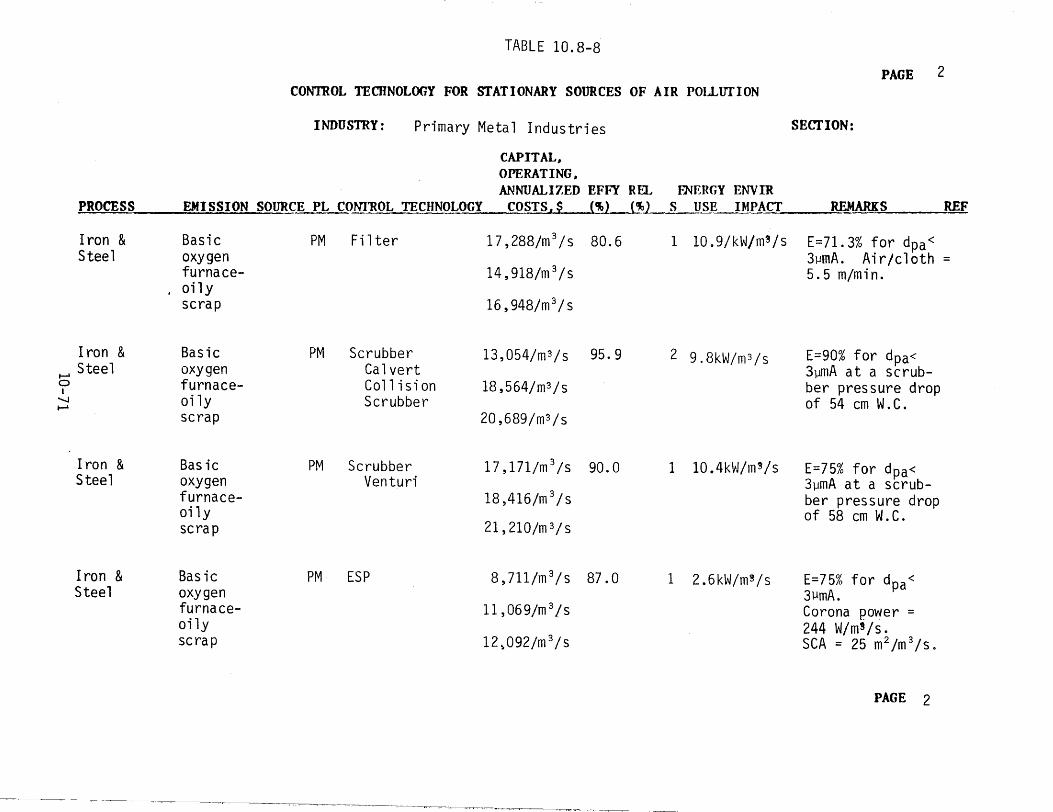
PROCESS EMISSION
Iron & Basic Steel oxygen
furnace-. oily
scrap
Iron & Basic Steel oxygen
0 I furnace
-....J
I-'
I-' oily scrap
Iron & Basic Steel oxygen
furnaceoily scrap
Iron & Basic Steel oxygen
furnaceoily scrap
TABLE 10.8-8
CONTROL TECHNOLOGY FOR STATIONARY SOURCES
INDUSTRY: Primary Metal Industries
CAPITAL, OPERATING, ANNUALIZED EFFY
SOURCE PL CON'l~OL TECHNOLOGY COSTS,$ (%)
PM Filter 17,288/m 3 /s 80.6
14,918/m 3 /s
16, 948/m 3 / s
PM Scrubber 13,054/m3/s 95. 9 Calvert Collision 18,564/m3/sScrubber
20,689/m3/s
PM Scrubber 17,171/m 3 /s 90.0 Venturi
18,416/m 3/s
21 , 210 /m 3 / s
PM ESP 8,711/m 3/s 87.0
11 ,069/ml/s
12~092/m 3/s
OF AIR POlLlITION
REL ~ERGY ENVIR (%) S USE IMPACT
1 10.9/kW/m3 /s
2 9. 8kW/m 3 /s
1 10 • 4 k ~J / m' / s
1 2.6kW/m 3 /s
PAGE 2
SECTION:
REMARKS REF
E=71. 3% for dpa < 3µmA. Air/cloth= 5.5 m/min.
E=90% for dpa< 3µmA at a scrubber pressure drop of 54 cm W.C.
E=75% for dpa<3µmA at a scrubber pressure dropof 58 cm W.C.
E=75% for dpa<3µmA. Corona power = 244 W/m9/s. SCA= 25 m2 /m 3/s.
PAGE 2
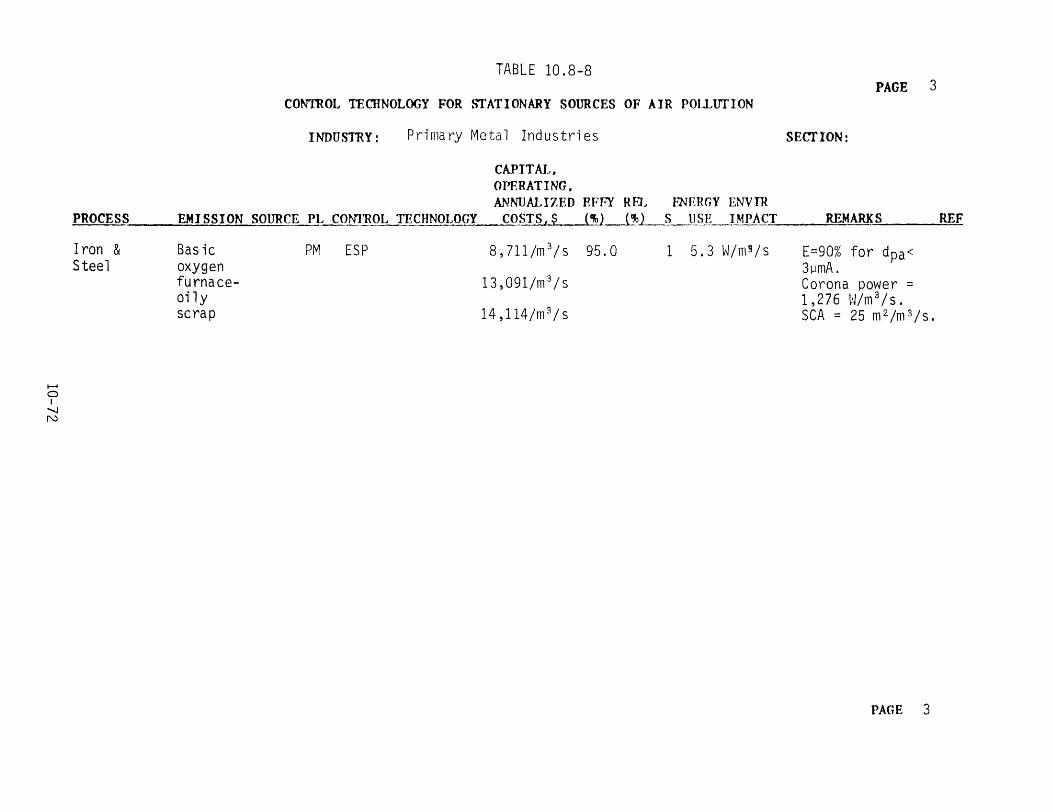
TABLE 10.8-8 PAGE 3
CONTROL TECHNOLOGY FOR STATIONARY SOURCES OF AIR POLLITT'ION
INDUSTRY: Primary Metal Industries SECTION:
CAPITAL, OPERATING. ANNUALIZED EFFY REL FNERGY ENVIR
PROCESS EMISSION SOURCE PL C01'll1WL TECHNOLOGY COSTS,$ (%) (%) S USE IMPACT REMARKS REF
Iron & Basic PM ESP 8,711/m 3 /s 95.0 1 5.3 W/m'/s E=90% for dpa<Steel oxygen 3µmA.
furnace 13,091/m 3/s Corona power=oily 1,2 7 6 t·J/m3
/ s • scrap 14,114/m 3/s SCA= 25 m2 /m 3 /s.
I--' a I
-...J N
PAGE 3
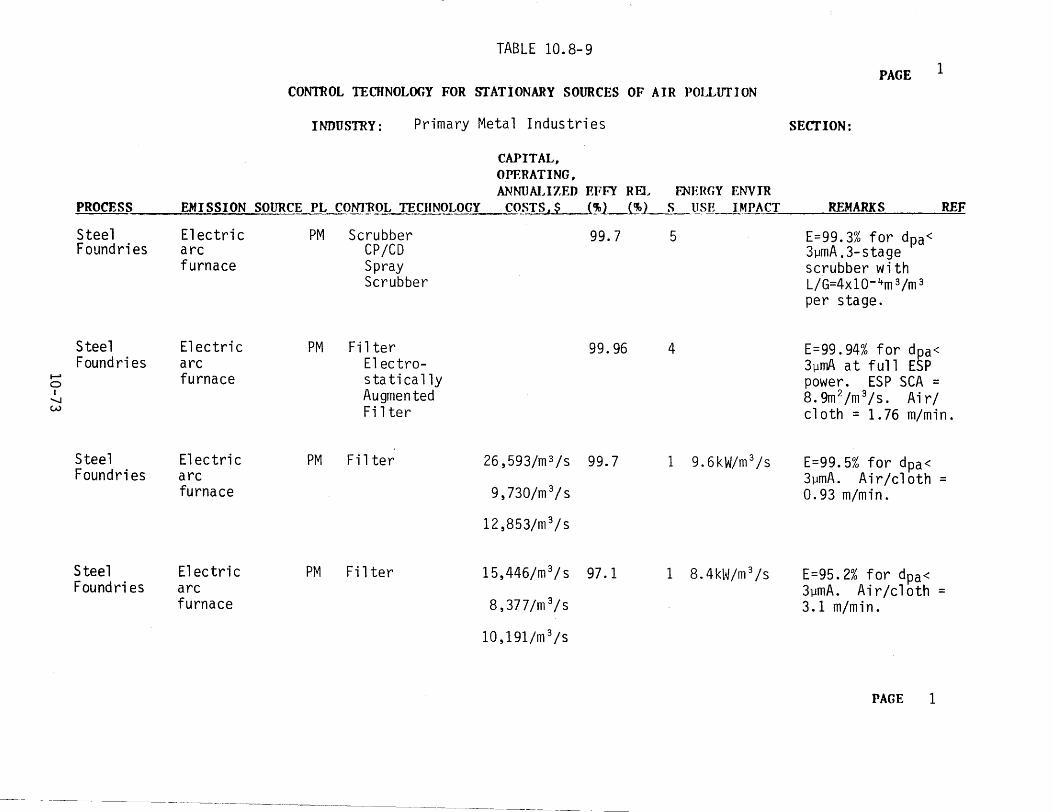
1
PROCESS
Steel Foundries
Steel Foundries
1---' 0 I
-...J w
Steel Foundries
Steel Foundries
EMISSION
Electric arc furnace
Electric arc furnace
Electric arc furnace
Electric arc furnace
TABLE 10.8-9
CON'rnOL TECHNOLOGY FOR STATIONARY SOURCES OF
INDUSTRY: Primary Metal Industries
CAPITAL, OPERATING, ANNUALIZED F,FFY REL
SOURCE PL CO~rROL TECHNOLOGY COSTS,$ (%) (%)
PM Scrubber 99.7 CP/CD Spray Scrubber
PM Filter 99.96 Electro-sta ti cal ly Augmented Filter
PM Filter 26,593/m 3 /s 99.7
9,730/m 3/s
12,853/m 3/s
PM Filter 15,446/m 3/s 97.1
8,377/m 3/s
10,191/m 3/s
AIR POLLITTION
fl\JERGY ENVIR s u~m IMPACT
5
4
1 9 . 6kW/m3 / s
1 8. 4 kl~/m3 / s
PAGE
SECTION:
REMARKS REF
E=99.3% for dpa<3µmA. 3-s tage scrubber with L/G=4x10- 4m3/m 3
per stage.
E=99.94% for dpa< 3µm'\ at full ESP power. ESP SCA= 8.9m 2 /m 3/s. Air/ cloth= 1.76 m/min.
E=99.5% for dpa< 3µmA. Air/cloth= 0.93 m/min.
E=95.2% for dpa< 3µmA. Air/cloth= 3.1 m/min.
PAGE 1
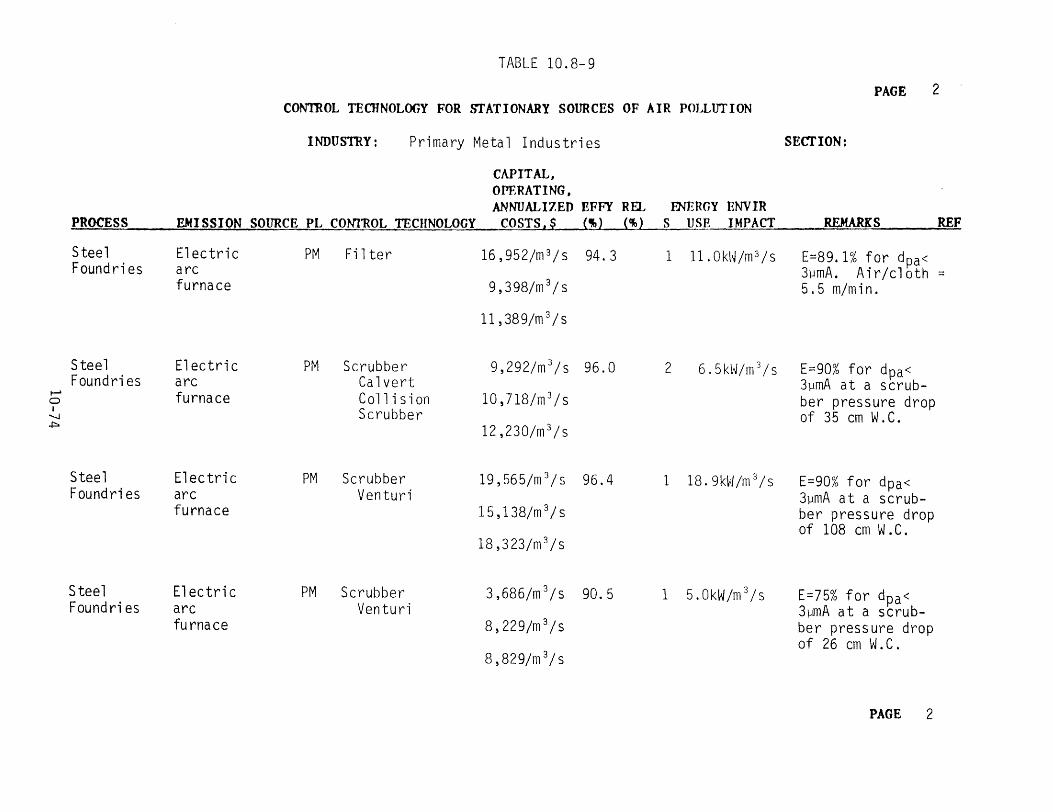
TABLE 10.8-9
PAGE 2 CONTROL TECHNOLOGY FOR STATIONARY SOURCES OF AIR POLLTITION
INDUSTRY: Primary Metal Industries SECTION:
CAPITAL, OPERATING, ANNUALIZED EFFY REL fNERGY ENVIR
PROCESS EMISSION SOURCE PL com~oL TECHNOLOGY COSTS,$ (i,,) (%) s USE IMPACT REMARKS REF
Steel Electric PM Filter 16,952/m 3/s 94. 3 1 11. OktUm 3 /s E=89.1% for dpa<Foundries arc 3µmA. Air/cloth=
furnace 9,398/m 3/s 5.5 m/min.
11 ,38 9/m 3 / s
Steel Electric PM Scrubber 9,292/m 3 /s 96.0 2 6 . 5 kl✓/ m3 / s E=90% for dpa<
Foundries arc Calvert 3µmA at a scrub-0 1--' furnace Co11 i s ion 10,718/m 3/s ber pressure dropI Scrubber of 35 cm W.C.--...J
-i::,. 12,230/m 3/s
Steel Electric PM Scrubber 19,565/m 3/s 96.4 1 18 . 9k~l /m 3 / s E=90% for dpa<
Foundries arc Venturi 3µmA at a scrub-furnace 15, 138/m 3/ s ber pressure drop
of 108 cm W. C . 18,323/m 3/s
Steel Electric PM Scrubber 3,686/m 3 /s 90.5 1 5.0kW/m 3/s E=75% for dpa<Foundries arc Venturi 3µmA at a scrub-
furnace 8,229/m 3/s ber pressure drop of 26 cm W.C.
8,829/m 3/s
PAGE 2
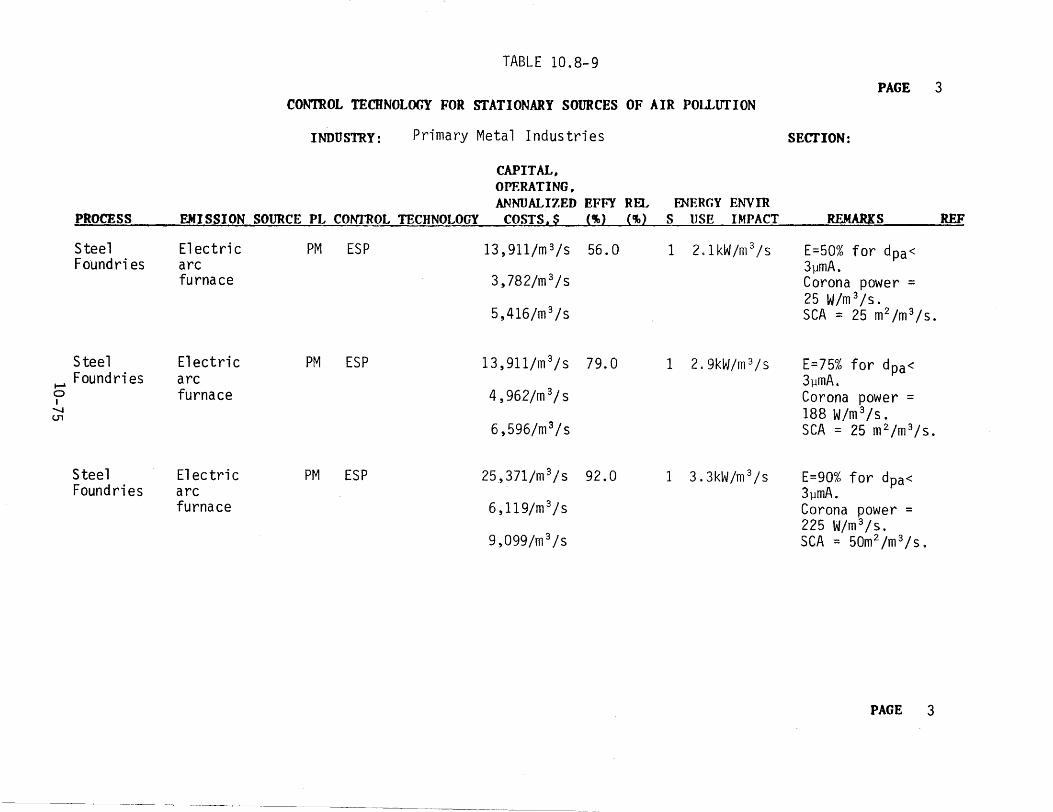
TABLE 10. 8-9
PAGE 3 CON'IROL TECHNOLOGY FOR STATIONARY SOURCES OF AIR POU..trrION
INDUSTRY: Primary Metal Industries SECTION:
CAPITAL, OPERATING, ANNUALIZED EFFY REL fNERGY ENVIR
PROCESS EMISSION_SOURCE PL CONTROL TECHNOLOGY COSTS,$ {'Ai} {lli2 s USE IMPACT REMARKS REF
Steel Electric PM ESP 13,911/m 3 /s 56. 0 1 2.1 kW/m 3 /s E=50% for dpa<Foundries arc 3µmA.
furnace 3,782/m 3/s Corona power= 25 W/m 3 /s.
5,416/m 3 /s SCA= 25 m2 /m 3 /s.
Steel Electric PM ESP 13, 911/m 3 / s 79.0 1 2.9k~J/m 3/s E=75% for dpa<
..... Foundries arc 3µmA. 0 I
furnace 4, 962/m 3/ s Corona power= .....,_J 188 W/m 3 /s .(J1
6,596/m 3/s SCA= 25 m2 /m 3/s.
Steel Electric PM ESP 25,371/m 3/s 92.0 1 3.3kW/m 3 /s E=90% for dpa<Foundries arc 3µmA.
furnace 6,119/m 3/s Corona power= 225 W/m 3/s.
9,099/m 3 /s SCA= 50m 2 /m 3/so
PAGE 3
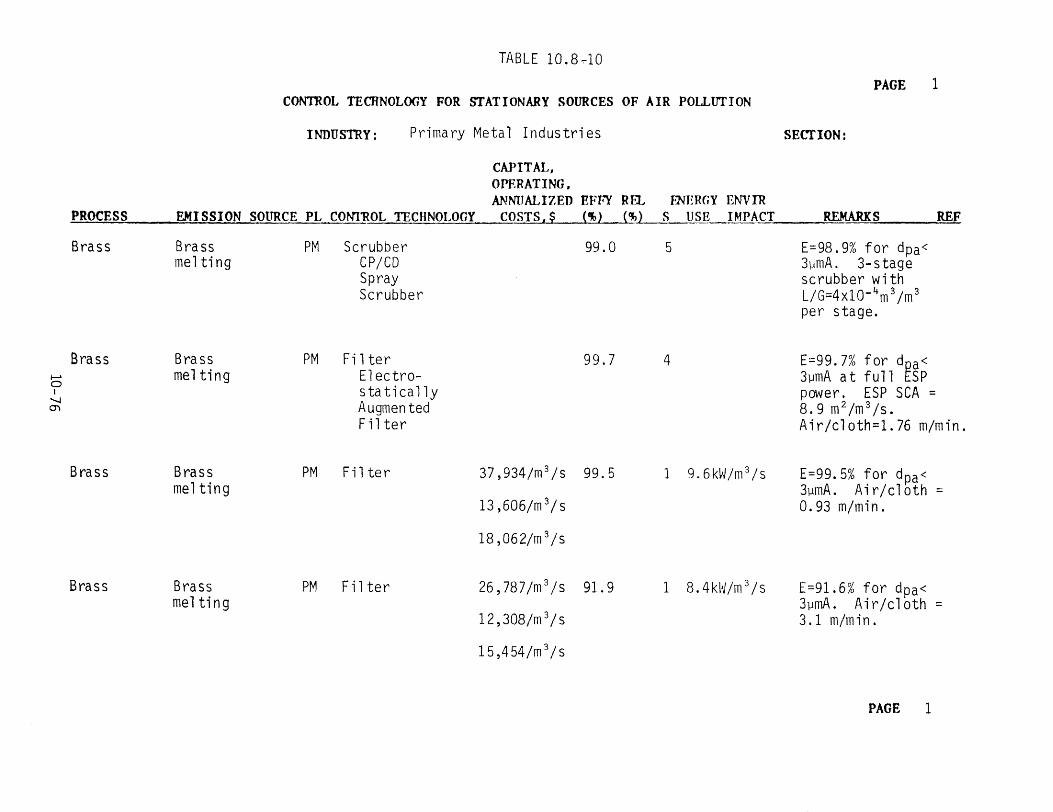
TABLE 10.8~10
PAGE 1 CONTROL TECHNOLOGY FOR STAT IONARY SOURCES OF AIR POU.UT ION
INDUSTRY: Primary Metal Industries SECTION:
CAPITAL, OPERATING. ANNUALIZED EFFY REL FNERGY ENVIR
PROCESS EMISSION SOURCE PL com'ROL TECHNOLOGY COSTS,$ ('11 (%1 s USE IMPACT REMARKS -~----REF
Brass Brass PM Scrubber 99.0 5 E=98.9% for dpa<melting CP/CO 3µmA. 3- stage
Spray scrubber with Scrubber L/G=4xl0- 4 m3 /m 3
per stage.
Brass Brass PM Filter 99.7 4 E=99.7% for d~a< ...... melting Electro- 3µmA at full SP0 statically power. ESP SCA=I
O"I '-I Augmented 8 . 9 m2 /m 3
/ s . Filter Air/cloth=l.76 m/min.
Brass Brass PM Filter 37,934/m 3 /s 99.5 1 9.6kW/m 3 /s E=99.5% for dpa<melting 3µmA. Air/cloth=
13,606/m 3/s 0.93 m/min.
18 ,062/m 3 /s
Brass Brass PM Filter 26,787/m 3 /s 91. 9 1 8.4kl*J/m 3 /s E=91.6% for dpa<melting 3µmA. Air/cloth=
12,308/m 3/s 3.1 m/min.
1 5 , 4 54 / m 3 / s
PAGE 1
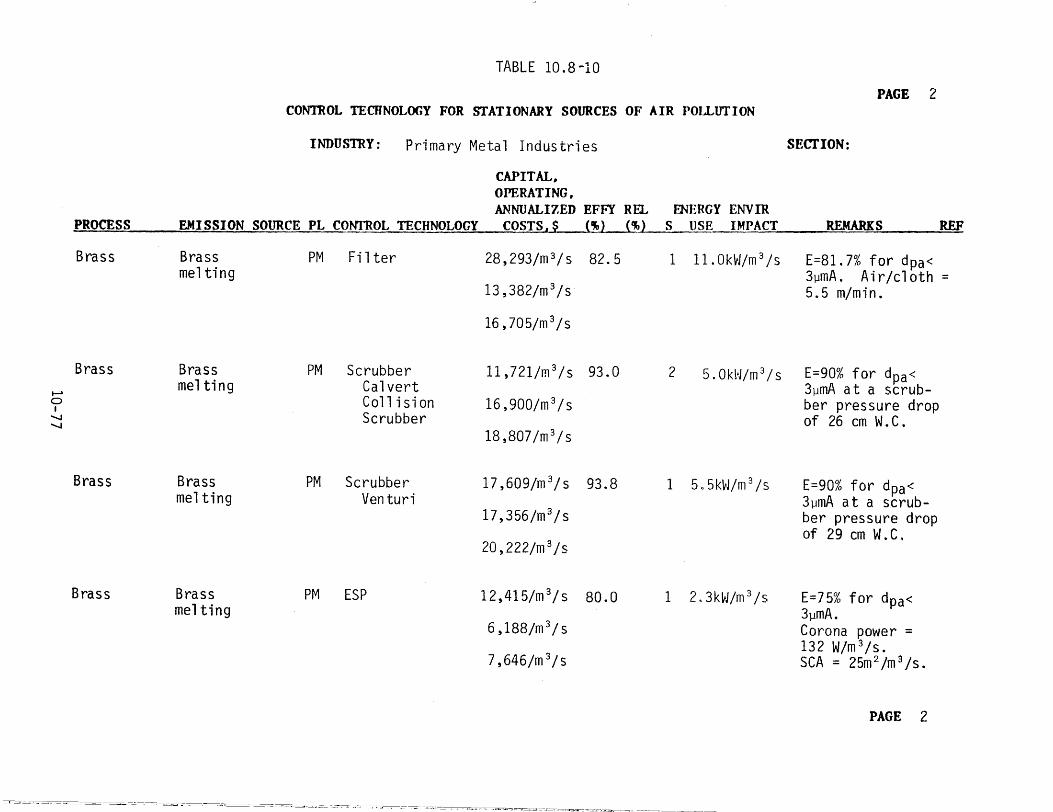
TABLE 10.8-10
PAGE 2 CON1ROL TECHNOLOGY FOR STATIONARY SOURCES OF AIR POI.LlITION
INDUSTRY: Primary Metal Industries SECTION:
CAPITAL-OPERATING, ANNUALIZED EFFY REL fNERGY ENV IR
PROCESS EMISSION SOURCE PL CONTROL TECHNOLOGY COSTS,$ (%) (%) s USE IMPACT REMARKS ~.~ __ REF
Brass Brass PM Filter 28,293/m 3/s 82.5 1 ll.OkvJ/m 3 /s E=81. 7% for dpa<melting 3µmA. Air/cloth=
13,382/m 3/s 5.5 m/min.
16, 705/m 3 /s
Brass Brass PM Scrubber ll ,721/m 3 /s 93.0 2 5.0kt-J/m 3/s E=90% for dpa< ._. melting Calvert 3µmA at a scrub-0 Collision 16,900/m 3/s ber pressure drop -...J I
Scrubber of 26 cm W.C.-...J
18,807/m 3/s
Brass Brass PM Scrubber 17 , 6 o9/m 3Js 93.8 1 5. 5k~J/m 3 /s E=90% for dpa<melting Venturi 3µmA at a scrub-
17 , 3 56 /m 3 / s ber pressure drop
of 2 9 cm W. C ,,20,222/m 3/s
Brass Brass PM ESP 12,415/m 3/s 80.0 1 2. 3k~J/m 3 /s E=75% for dpa<melting 3µmA.
6 ,188/m 3 Is Corona power= 132 W/m 3/s.
7,646/m 3/s SCA= 25m 2/m 3/s.
PAGE 2
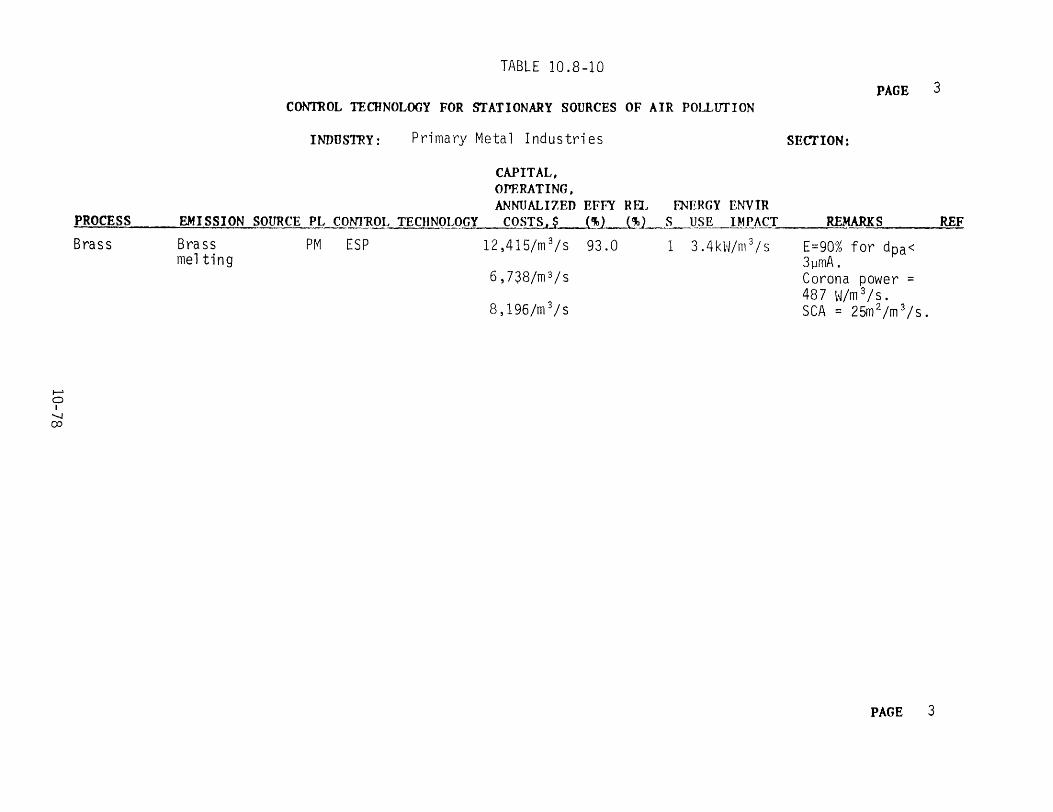
TABLE 10.8-10
PAGE 3 CONTROL TECHNOLOGY FOR STATIONARY SOURCES OF AIR POLLlITION
INDUSTRY: Primary Metal Industries SECTION:
CAPITAL, OPERATING, ANNUALIZED EFFY Rfl., FNERGY ENVIR
PROCESS EMISSION SOURCE PL com1WL TECHNOLOGY COSTS,$ ('1) (%J S USE IMPACT REMARKS REF
Brass Brass PM ESP 12,415/m 3/s 93.0 1 3 . 4 k l·J/m 3 / s E=90% for dpa<
melting 3µmA. 6,738/m 3/s Corona power=
48 7 ~✓ /m 3 / s .
8, 196/m 3 / s SCA = 25m 2 /m 3 /s.
1--' 0 I
-....J co
PAGE 3
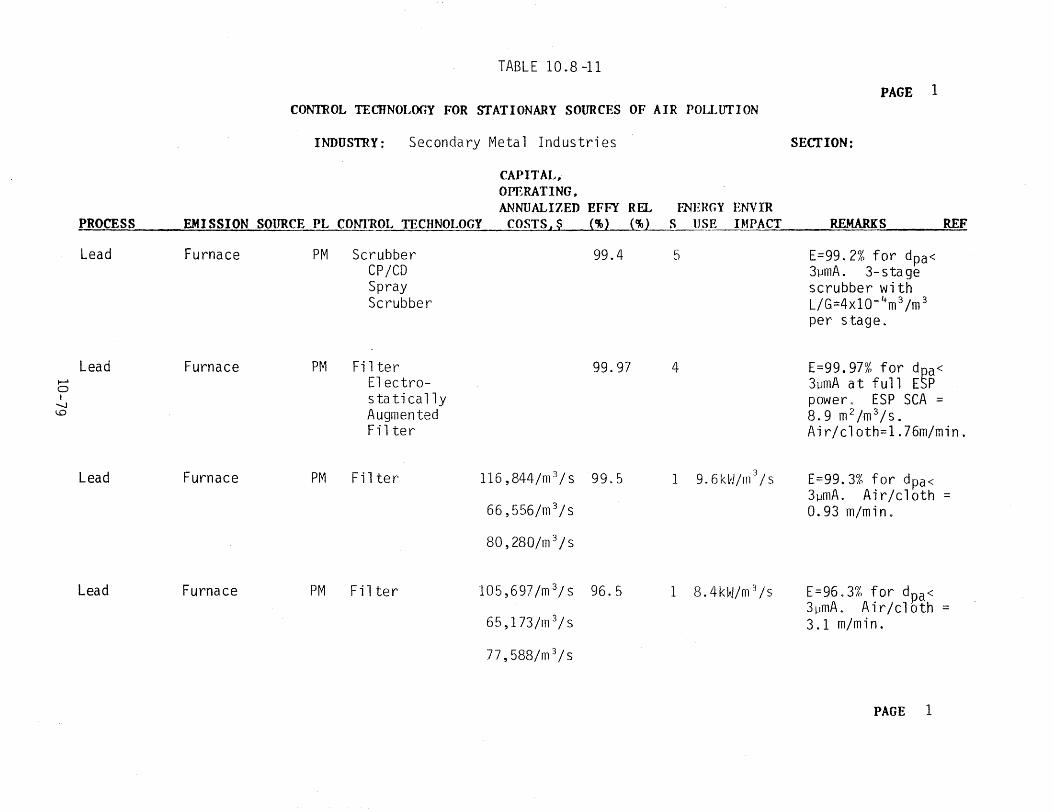
TABLE 10 .8 -11
PAGE 1 CONTROL TEOJNOLOGY FOR STATIONARY SOURCES OF AIR POLLITTION
INDUSTRY: Secondary Metal Industries SECTION:
CAPITAL, OPERATING. ANNUALIZED EFFY REl. FNERGY ENVIR
PROCESS EMISSION SOURCE PL CONTROL TECHNOLOGY COSTS,$ (%) (%j S USE IMPACT REMARKS REF
Lead Furnace PM Scrubber 99.4 5 E=99.2% for dpa<CP/CD 3µmA. 3-s ta geSpray scrubber with Scrubber L/G=4xl0- 4 m3 /m 3
per stage.
Lead Furnace PM Filter 99.97 4 E=99.97% for dpa< 0 ~ Electro- 3umA at full ESP I s ta ti cally power,, ESP SCA=-....J
I..D Augmented 8.9 m2 /m 3/s.Filter Air/cloth=l.76m/min.
Lead Furnace PM Filter 116 , 844 /m 3 / s 99.5 1 9.6kvJ/m
'3 /s E=99.3% for dpa< 3µmA. Air/cloth=
66,556/m 3/s 0.93 m/min.
80,280/m 3 /s
Lead Furnace PM Filter 105,697 /m 3/S 96. 5 1 8 . 4 k ti.J / m3 / s E=96.3% for dpa<
3µmA. Air/cloth= 65,173/m 3/s 3.1 m/min.
77,588/m 3 /s
PAGE 1
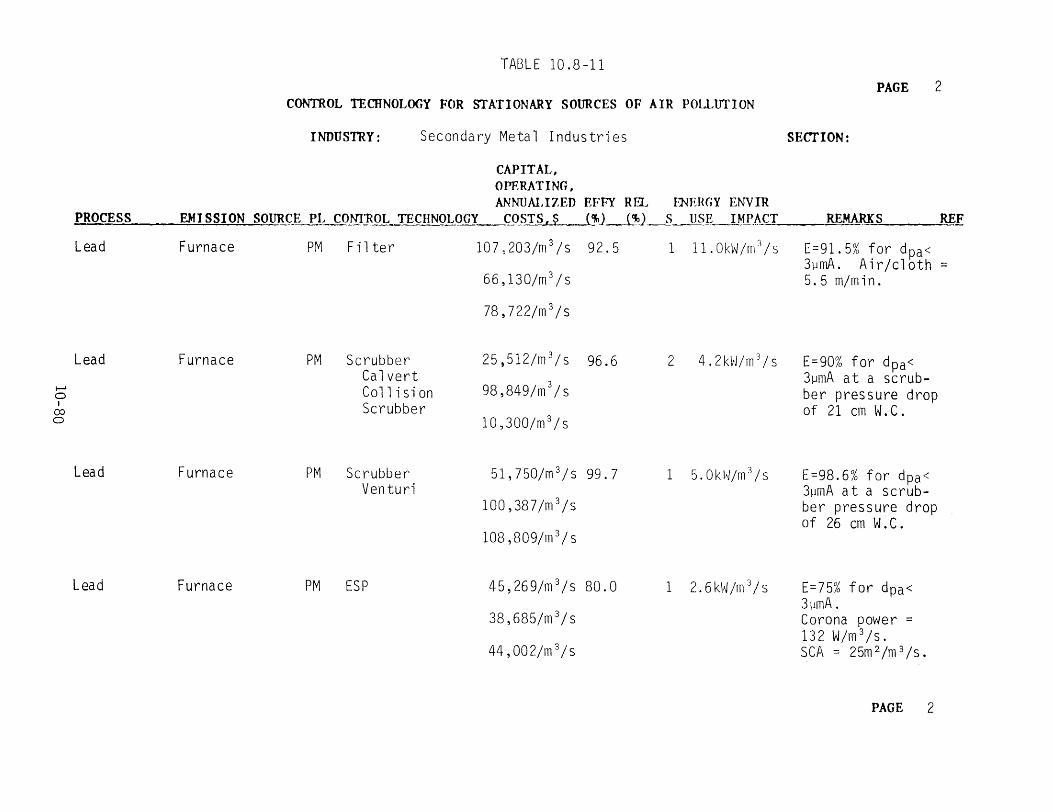
TAB L E 10 . 8 -11 PAGE 2
CONTROL TECHNOLOGY FOR STATIONARY SOURCES OF AIR POLLlITION
INDUSTRY: Secondary Metal Industries SECTION:
CAPITAL, OPERATING, ANNUALIZED EFFY REL ENERGY ENV IR
PROCESS EMISSION SOURCE PL com~OL TECHNOLOGY COSTS,$ {%} (%1 s USE IMPACT REMARKS REF
Lead Furnace PM Filter 107~203/m 3 /s 92.5 1 ll.OkW/m 3 /s E=91. 5% for dpa< JµmA. Air/cloth=
66,130/m 3 /s 5.5 m/min.
78, 722/rn 3 /s
Lead Furnace PM Scrubber 25,512/m 3 /s 96.6 2 4 . 2 k vi/ rn 3 / s E=90% for dpa<
Calvert JµrnA at a scrub-I--' 0 Co 11 is ion 98,849/rn 3 /s ber pressure drop cc I Scrubber of 21 cm W.C.
0 10,300/rn 3 /s
Lead Furnace PM Scrubber 51,750/m 3 /s 99.7 1 5 . 0 k 111/m 3 / s E=98.6% for dpa<
Venturi JµmA at a scrub-100,387/m 3 /s ber pressure drop
of 26 cm W.C. 108 ,809/m 3
/ s
Lead Furnace PM ESP 45,269/m 3 /s 80.0 1 2. 6kl~J /rn 3 / s E=75% for dpa<
3pmA. 38,685/m 3 /s Corona power =
13 2 W/m 3 /s.44,002/rn 3 /s SCA= 25m 2 /m 3 /s.
PAGE 2
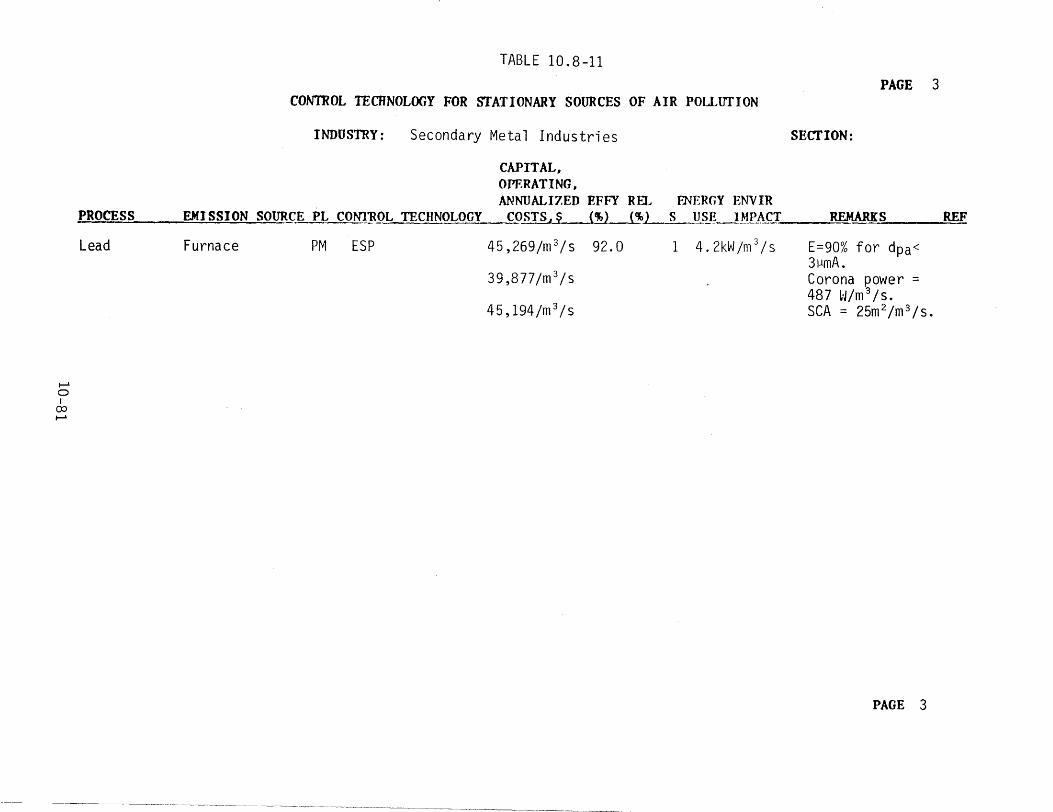
TABLE 10. 8-11
PAGE 3 CONTROL TEl1INOLOGY FOR STATIONARY SOURCES OF AIR P01LIITION
INDUSTRY: Secondary Metal Industries SECTION:
CAPITAL., OPERATING. ANNUALIZED EFFY REL FNERGY ENVIR
PROCESS EMISSION SOURCE PL CONTROL TECHNOLOGY COSTS,$ ('1) (%) S USE IMPACT REMARKS REF
Lead Furnace PM ESP 45,269/m 3/s 92.0 1 4 • 2 kW /m 3 / s E=90% for dpa<
3µmA. 39,877/m 3 /s Corona power =
487 LUm 3 /s.45,194/m 3 /s SCA= 25m 2 /m 3 /s.
1--' 0 I
co 1--'
PAGE 3
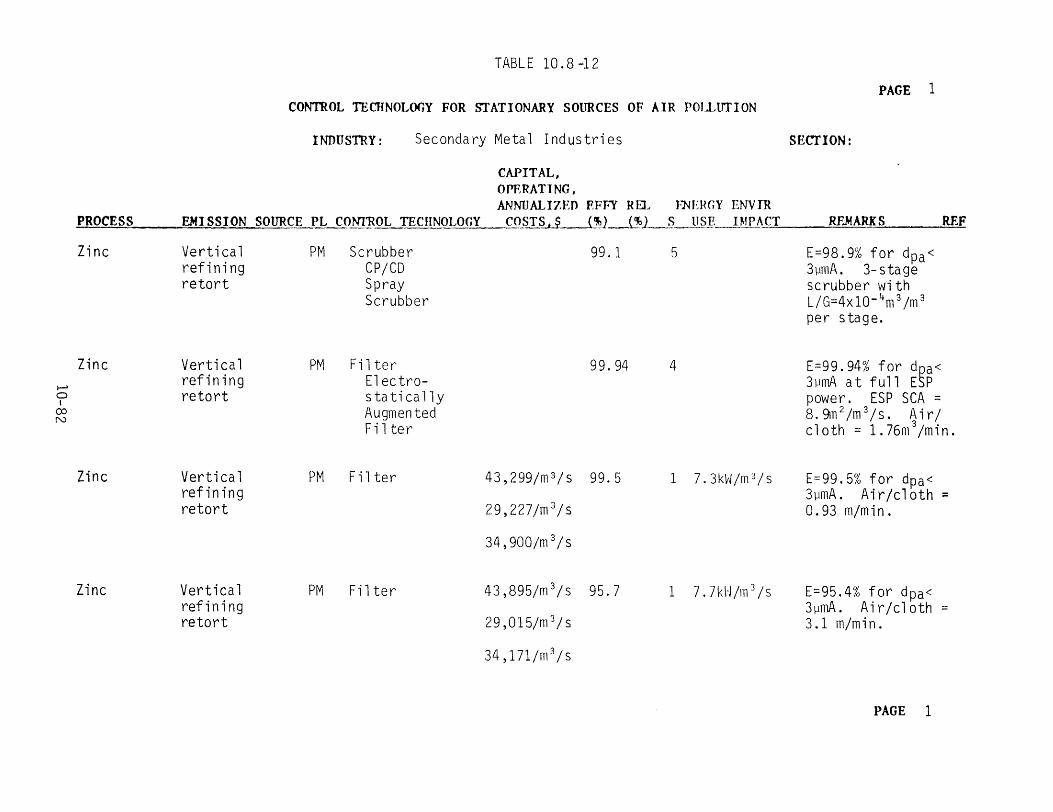
TABLE 10 . 8 -12
PAGE 1 CONTROL TEaINOLOGY FOR STATIONARY SOURCES OF AIR POU..,lJTION
INDUSTRY: Secondary Meta 1 Ind us tries SECTION:
CAPITAL, OPERATING, ANNUALIZED EFFY Ra 8'JEHGY ENVTR
PROCESS EMISSION SOURCE PL CONTROL TECHNOLOGY COSTS,$ (~~) S USE IMPACT REMARKS REF
Zinc Vertical PM Scrubber 99. 1 5 E=98.9% for dpa<refining CP/CD 31-1mA. 3- stage retort Spray scrubber with
Scrubber L/G==4x10- 4 m3 /m 3
per stage.
Zinc Vertical PM Filter 99. 94 4 E=99.94% for dpa< i-->
refining Electro- 3wnA at full ESP 0 I
retort s ta ti ca 11 y power. ESP SCA= 00 N
Augmented 8.~n 2 /rn 3 /s. Air/Filter cloth= 1.76rn 3/rnin.
Zinc Vertical PM Filter 43,299/m 3/s 99.5 1 7 . 3 k vJ / m3 / s E=99.5% for dpa<refining 31-1mA. Air/cloth= retort 29,227/m 3/s 0.93 m/rnin.
34,900/m 3/s
Zinc Vertical PM Filter 43,895/m 3/s 95.7 1 7 . 7k\'J /rn 3 / s E=95.4% for dpa<
refining 3µrnA. Air/cloth= retort 29, 015/m 3
/ s 3.1 m/min.
34,171/m 3/s
PAGE 1
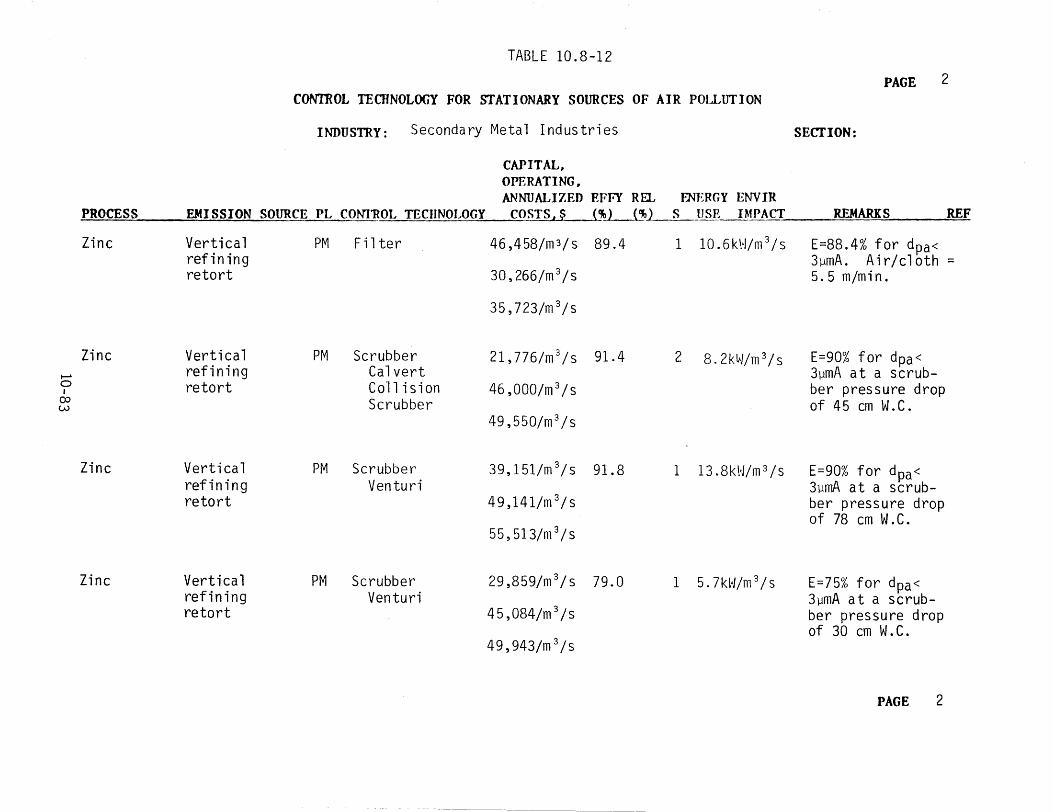
TABLE 10.8-12 2PAGE
CON"rnOL TEOINOLOGY FOR STATIONARY SOURCES OF AIR POLLUTION
INDUSTRY: Secondary Metal Industries SECTION:
CAPITAL, OPERATING,, ANNUALIZED EFFY Ra FNERGY ENVIR
PROCESS EMISSION SOURCE PL CONTROL TECHNOLOGY COSTS,$ (%} (%J s USE IMPACT REMARKS REF
Zinc Vertical PM Filter 4 6 , 4 58/ m 3 / s 89.4 1 1 0 . 6 k ':I Im 3 / s E=88.4% for dpa<
refining 3µmA. Air/cloth= retort 30,266/m 3 /s 5.5 m/min.
35,723/m 3/s
Zinc Vertical PM Scrubber 21,776/m 3 /s 91.4 2 8 . 2 k vJ/ m3 / s E=90% for dpa<
refining Calvert 3µmA at a scrub-0 ~
retort Coll is ion 46,000/m 3 /s ber pressure dropI co w Scrubber of 45 cm W.C.
49,550/m 3 /s
Zinc Vertical PM Scrubber 39,151/m 3/s 91.8 1 13 .8kt,J/m 3 /s E=90% for dpa<refining Venturi 3µmA at a scrub-retort 4 9, 141/m 3
/ s ber pressure drop of 78 cm W.C.
55,513/m 3/s
Zinc Vertical PM Scrubber 29 ,859/m 3 Is 79.0 1 5.7kH/m 3 /s E=75% for dpa<refining Venturi 3µmA at a scrub-retort 45,084/m 3 /s ber pressure drop
of 30 cm W.C. 49,943/m 3/s
PAGE 2
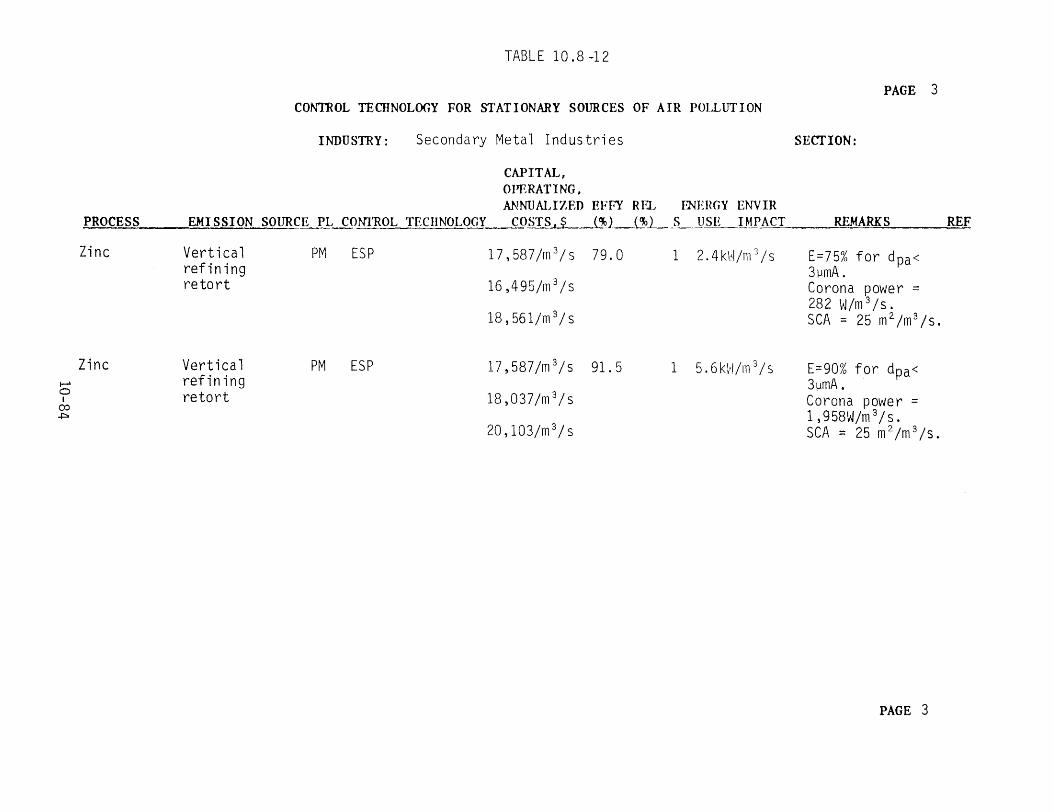
TABLE 10.8-12
CON'ffiOL TECHNOLOGY FOR STATIONARY SOURCES OF AIR POLLUTION PAGE 3
INDUSTRY: Secondary Metal Industries SECTION:
PROCESS EMISSION SOURCE PL CONTROL TECHNOLOGY
CAPITAL, OPERATING, ANNUALIZED
COSTS,$ EFFY (%)
REL (%J
FNERGY S USE
ENVIR IMPACT REMARKS REF
Zinc Vertical refining retort
PM ESP 1 7 , 587/m 3 / s
16,495/m 3 /s
18, 561/m 3 / s
79.0 1 2. 4kl.·l/m 1 / s E=75% for dpa<
3wmA. Corona power= 282 vJ/m 3 /s. SCA= 25 m2 /m 3 /s.
I-' 0 I
co ..p.
Zinc Vertical refining retort
PM ESP 17,587/m 3 /s
18,037/m 3 /s
20, 103/m 3 /s
91. 5 1 5.6k\.//m 3 /s E=90% for dpa< 31-1mA. Corona power= 1 '9 5m.J/m 3
/ s. SCA= 25 m2 /m 3 /s.
PAGE 3
SECTION 10
REFERENCES
Air Pollution Emissions Pittsburg,
Control Association, 1979. Control of Air from Coke Plants. Conference Proceedings, Pennsylvania, 192 pp.
Bee, R.W., G. Erskine, R. B. Shaller, R. W. Speutek, A. Wallo III, and W. L. Wheaton, 1974. Coke Oven Charging Emission Control Test Program-Volume I. EPA-650/2-79-062, U. s. Environmental Protection Agency, Washington, D.C., 163 pp.
Ca i n e , R. E. , J r . , 1 9 7 7 • Dev e 1 op m e n t o f Tech no 1 o gy f o r Co n t r o 1-1 in g BOP Charging Emissions. EPA 600/2-77-218, U. S. Environmental Protection Agency, Washington, D.C., 157 pp.
California Air Resources Board, 1980. Emission Inventory System Computer Data; Met a 11 u r g i ca 1 Sources, Sacra tn en to, California.
Camp, J. M. and C. B. Francis, 1951. The Making, Shaping and Treating of Steel, 6th Edition. United States Steel Company, Pittsburgh, Pennsylvania, 1584 pp.
Coleman, R. T. and R. Vandervort, 1980. Evaluation of Paul Ber gsoe and Son Secondary Lea a Smelter. EPA 60 0/2-80-0 22, U. s. Environmental Protection Agency, Washington, D.C.,9Spp.
Cooper, Fred, Thomas Loch, John Mutchler, and Janet Vecchio, 1977. Emission Testing and Evaluation of Ford/Koppers Coke Pushing Control System, Vol. I, Final Report. EPA-600/2-77-187a, U. S. Environmental Protection Agency, Washington D. C., 263 pp.
Danie 1 son, John A. , e di tor , 1 9 7 3 . Ai r Po 11 u t ion Engineer in g Manual, 2nd Edition. AP40, u. s. Environmental Protection Agency, Washington, D.C., 892 pp.
Dawson, P. R., 1979. The WSL Approach to Metallurgical Fume Emissions. In: Control of Particulate Emissions in the Primary Nonferrous Metals Industry: Symposium Proceedings. EPA 600/2-79-211, u. s. Environmental Protection Agency, Cincinnati, Ohio, 414-433 pp.
Hardison, L. C. and C. A. Greathouse, 1972. Air Pollution Control Technology and Costs in Nine Selected Areas. APTD-1555, U. s. Environmental Protection Agency, Durham, North Carolina, 587 pp.
10-85
Hussain, S. M., P. F. Cilicone, A. B. Cherry, w. J. wasylenko, Jr., 1979. Applicability of Coke Plant Control Technology to Coal Conversion. EPA 600/7-79-189, U. S. Environmental Protection Agency, Washington, D.C., 200 pp.
Jaasund, s. A. and M. R. Mazer, 1977. the Applicaton of Wet Electrostatic Precipitators for the Control of Emissions from Three Metallurgical Processes. In: Proceeding: Particulate Collection Problems Using ESP's in the Metallurgical Industry. EPA 600/2-77-208, u. S. Environmental Protection Agency, Research Triangle Park, North Carolina, 1-22 pp.
Jacko, R. B. and D. W. Neuendorf, 1977. Trace Metal Particulate Emission Test Results from a Number of Industrial and Municipal Point Sources. Journal of the Air Pollution Control Association, 27:989-994 pp.
Jacko, Robert B., 1979. Fugitive Emissions from the By-Product Coke Oven rushing Operation. In: Third Symposium on Fugitive Emissions :t--:easurement and Control. EPA-600/7-79-182, U. s. Environmental Protection Agency, Washington, D.C., pp 91-102.
Jutze, George A., et al., 1977. Technical Guidance for Control of Industrial Process Fugitive Particle Emissions. EPA 450/3-77-010, U. S. Environmental Protection Agency, Washington, D.C., 447 pp.
Lee, Jr., E., H. L. Grist, A. E. Riley, K. E. MacLeod, 1975. Concentration and Size of Trace Metal Emissions from a Power Plant, a Steel Plant, and a Cotton Gin. Environmental Science and Technology, 9:643-694 pp.
Liddell, D. M., 1945. Handbook of Nonferrous Metallurgy: Principles and Processes, 2nd Edition. McGraw-Hill, New York, New York, 656 pp.
May, W. P., 1977. Blast Furnace Cast House .... mission Control Technology Assessment. EPA 600/277231, U. S. Environmental Protection Agency, Research Triangle Park, North Carolina, 158 pp.
Minicucci, D., M. Berther, L. Babb, and W. Kuby, 1980. Assessment of Control Technology for Stationaary Sources, Vol. II: Control Technology Data Tables. California Air Resources Board, Contract No. A212030, Sacramento, California.
10'--86
McCrillis, Robert, 1978. Basic Iron Blast Furnace Cast House Emissions and Emissions Control. Presented at 71st Annual Meeting of the Air Pollution Control Association, HG>uston, Texas.
National Air Pollution Control Administration, 1969. Air Pollution Aspects of Brass ana Bronze Smelting and Refining I n au s t r y. AP 5 3 , U. S. Depa r t men t of He a 1 th , Edu ca t i on, an d Welfare, 63 pp.
Oglesby, s., Jr., 1970. A Manual of Electrostatic Precipitation TeCh nO10 gy, part I I Application Areas. Contract CPA2269-73, National Air Pol l ut ion Control Administration, Cincinnati, Ohio.
Steelhamrner, J. C., D. R. Nogash, and D. M. Polizzotti, 1977. Laboratory Electrostatic Precipitators Studies Related to the Steel Industry. In: Proceedings: Particulate Collection Problems Using ESP's in the Metallurgical Industry. EPA 600/277208, u. S. Environmental Protection Agency, Research Triangle Park, North Carolina, 5471 pp.
Szabo, Michael F. and R. W. Gerstle, 1978. Operation and Maintenance of Particulate Control Devices on Selected Steel and Ferroalloy Processes. EPA 600/278037, u. s. Environmental Protection Agency, hesearch Triangle Park, North Carolina, 247 pp.
Taback, H. J., A. R. Brienza, J. Marko, N. Brunetz, 1979. Fine Particle Emissions from Stationary and Miscellaneous Sources in the South Coast Air Basin. California Air Resources Board, Sacramento, California, 561 pp.
Yung, S. C., J. Curran and S. Calvert. Spray Charging and Trapping Scrubber for Fugitive Emission Control. EPA-600/7-81-125, July 1981.
10-87
