a transforming digital retailer - annualreports.com
TRANSCRIPT

Continuing our transformationN Brown Group plcAnnual Report and Accounts 2022
STRATEGIC REPORTOur business 2Chair’s statement 4Chief Executive’s statement 5Strategic update 8Key Performance Indicators 18Marketplace 20Business model 22Financial performance 24Risk management 32Principal risks and uncertainties 34Section 172 statement 38Board engagement with the workforce 40Sustain 42
GOVERNANCE REPORTIntroduction from the Chair 55LEADERSHIP AND PURPOSEGroup Board Directors 56Executive Board Directors 58DIVISION OF RESPONSIBILITYGovernance structure 62COMPOSITION, SUCCESSION AND EVALUATIONBoard composition 64Nominations and Governance Committee report
67
AUDIT, RISK AND INTERNAL CONTROLAudit and Risk Committee report 68Financial Services Board Committee report 74REMUNERATIONRemuneration Committee report 75ADDITIONAL DISCLOSURES 94Viability statement 95
FINANCIAL STATEMENTSFor the detailed contents of the statements go to p98.
98
INDEPENDENT AUDITOR’S REPORT 99GROUP ACCOUNTS 107Notes to the Group accounts 111Going concern 118COMPANY ACCOUNTSNotes to the Company accounts 150SHAREHOLDER INFORMATION 157
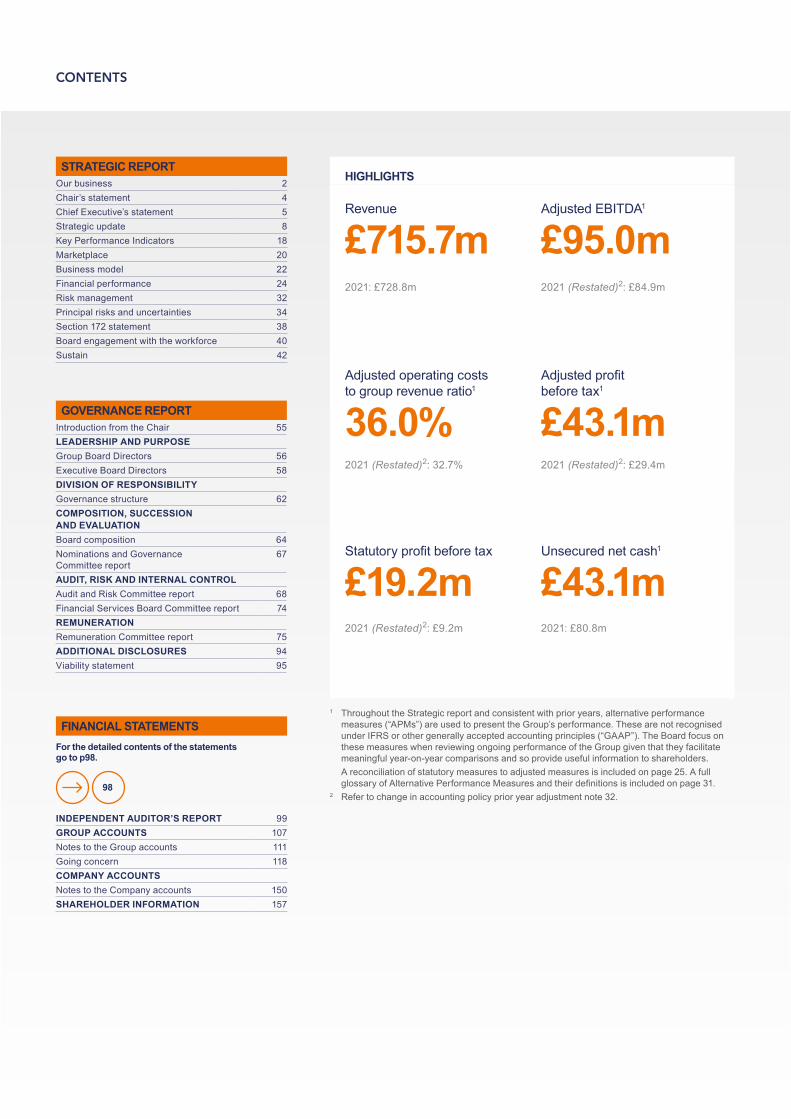
HIGHLIGHTS
Revenue Adjusted EBITDA1
£715.7m £95.0m2021: £728.8m 2021 (Restated)2: £84.9m
Adjusted operating costs to group revenue ratio1
Adjusted profit before tax1
36.0% £43.1m2021 (Restated)2: 32.7% 2021 (Restated)2: £29.4m
Statutory profit before tax Unsecured net cash1
£19.2m £43.1m2021 (Restated)2: £9.2m 2021: £80.8m
1 Throughout the Strategic report and consistent with prior years, alternative performance measures (“APMs”) are used to present the Group’s performance. These are not recognised under IFRS or other generally accepted accounting principles (“GAAP”). The Board focus on these measures when reviewing ongoing performance of the Group given that they facilitate meaningful year-on-year comparisons and so provide useful information to shareholders.
A reconciliation of statutory measures to adjusted measures is included on page 25. A full glossary of Alternative Performance Measures and their definitions is included on page 31.
2 Refer to change in accounting policy prior year adjustment note 32.
CONTENTS
OUR VISION AND PURPOSE
2
CONTINUING OUR TRANSFORMATION
The last 12 months have seen a continuation of our transformation, supported by significant improvements to our customer proposition and brands. The business is now better placed than pre-pandemic and we are committed to ensuring that we capitalise on our position within the rapidly evolving online retail market.
Our strong balance sheet will enable us to continue investing in our digital capabilities, accelerate our growth strategy and build a foundation that will deliver sustainable returns for shareholders.
FIN
AN
CIA
L S
TAT
EM
EN
TS
GO
VE
RN
AN
CE
RE
PO
RT
ST
RA
TE
GIC
RE
PO
RT
N Brown Group plc Annual Report and Accounts 2022 1nbrown.co.uk
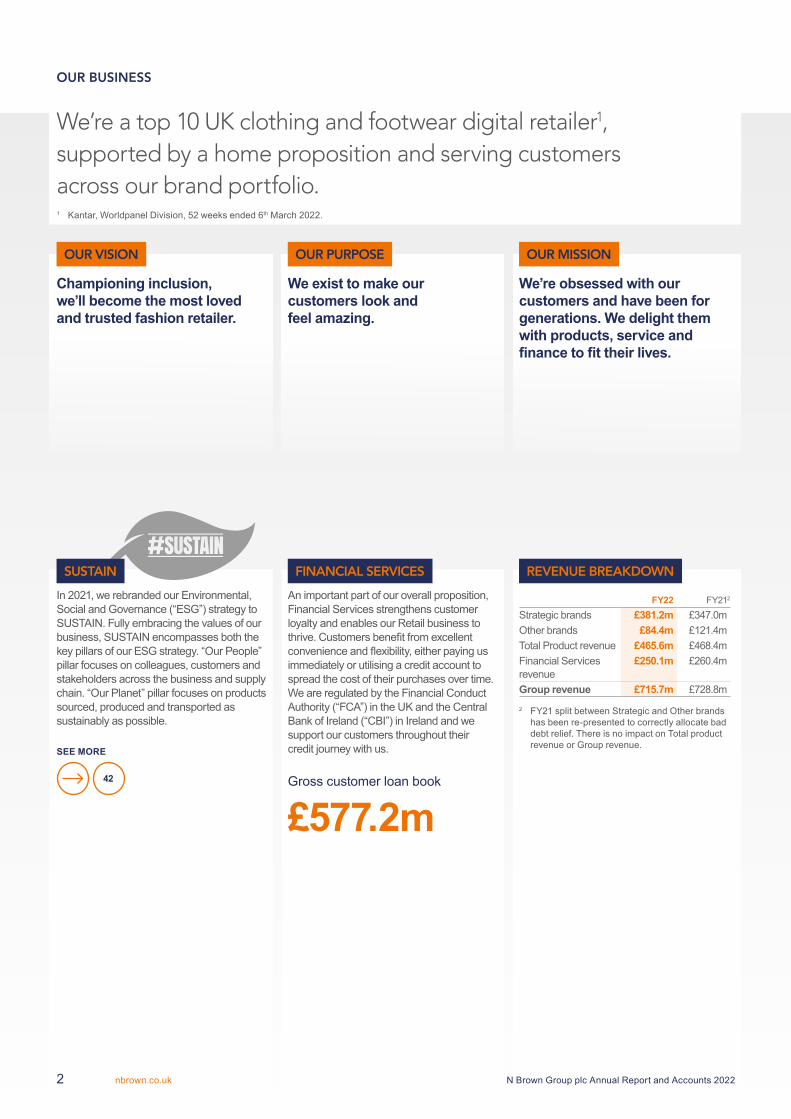
Championing inclusion, we’ll become the most loved and trusted fashion retailer.
We’re obsessed with our customers and have been for generations. We delight them with products, service and finance to fit their lives.
We exist to make our customers look and feel amazing.
FY22 FY212
Strategic brands £381.2m £347.0mOther brands £84.4m £121.4mTotal Product revenue £465.6m £468.4mFinancial Services revenue
£250.1m £260.4m
Group revenue £715.7m £728.8m
2 FY21 split between Strategic and Other brands has been re-presented to correctly allocate bad debt relief. There is no impact on Total product revenue or Group revenue.
An important part of our overall proposition, Financial Services strengthens customer loyalty and enables our Retail business to thrive. Customers benefit from excellent convenience and flexibility, either paying us immediately or utilising a credit account to spread the cost of their purchases over time. We are regulated by the Financial Conduct Authority (“FCA”) in the UK and the Central Bank of Ireland (“CBI”) in Ireland and we support our customers throughout their credit journey with us.
In 2021, we rebranded our Environmental, Social and Governance (“ESG”) strategy to SUSTAIN. Fully embracing the values of our business, SUSTAIN encompasses both the key pillars of our ESG strategy. “Our People” pillar focuses on colleagues, customers and stakeholders across the business and supply chain. “Our Planet” pillar focuses on products sourced, produced and transported as sustainably as possible.
SEE MORE
42 Gross customer loan book
£577.2m
1 Kantar, Worldpanel Division, 52 weeks ended 6th March 2022.
OUR BUSINESS
OUR VISION OUR MISSION
We’re a top 10 UK clothing and footwear digital retailer1, supported by a home proposition and serving customers across our brand portfolio.
OUR PURPOSE
SUSTAIN FINANCIAL SERVICES REVENUE BREAKDOWN
N Brown Group plc Annual Report and Accounts 20222 nbrown.co.uk

OUR BRANDS
An online boutique shopping experience showcasing own brand and third-party brand fashion and home product for 45 – 65 year old women.
An online womenswear brand for the more mature customer, supported by home, showcasing own brand and third-party brands targeting women aged 65+.
A size-inclusive online brand showcasing own brand and third-party brand fashion and beauty for women aged 25 – 45.
A size-inclusive online fashion and grooming brand for men, showcasing own brand and third-party brands targeting men aged 25 – 50.
A one-stop home brand offering own brand and third-party brand modern homeware helping customers to ‘dress their homes’. The target customer is mums aged 25 – 45 with children at home.
FIN
AN
CIA
L S
TAT
EM
EN
TS
GO
VE
RN
AN
CE
RE
PO
RT
ST
RA
TE
GIC
RE
PO
RT
N Brown Group plc Annual Report and Accounts 2022 3nbrown.co.uk
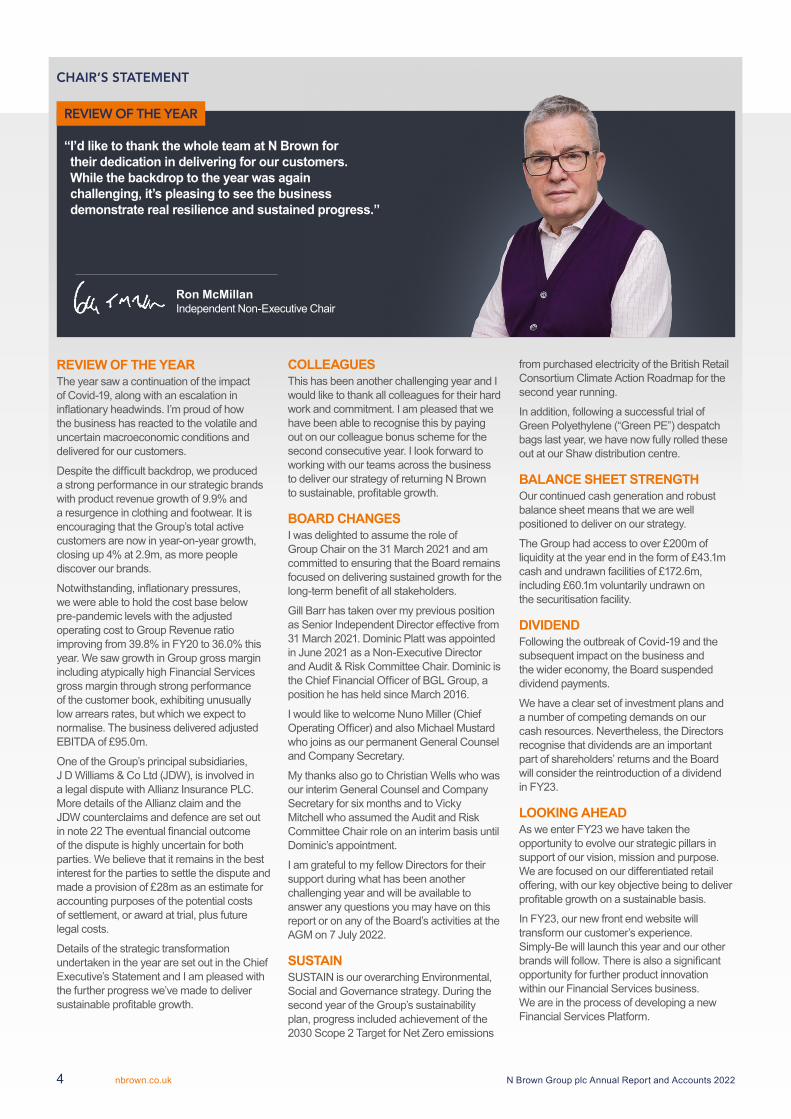
“ I’d like to thank the whole team at N Brown for their dedication in delivering for our customers. While the backdrop to the year was again challenging, it’s pleasing to see the business demonstrate real resilience and sustained progress.”
REVIEW OF THE YEARThe year saw a continuation of the impact of Covid-19, along with an escalation in inflationary headwinds. I’m proud of how the business has reacted to the volatile and uncertain macroeconomic conditions and delivered for our customers.
Despite the difficult backdrop, we produced a strong performance in our strategic brands with product revenue growth of 9.9% and a resurgence in clothing and footwear. It is encouraging that the Group’s total active customers are now in year-on-year growth, closing up 4% at 2.9m, as more people discover our brands.
Notwithstanding, inflationary pressures, we were able to hold the cost base below pre-pandemic levels with the adjusted operating cost to Group Revenue ratio improving from 39.8% in FY20 to 36.0% this year. We saw growth in Group gross margin including atypically high Financial Services gross margin through strong performance of the customer book, exhibiting unusually low arrears rates, but which we expect to normalise. The business delivered adjusted EBITDA of £95.0m.
One of the Group’s principal subsidiaries, J D Williams & Co Ltd (JDW), is involved in a legal dispute with Allianz Insurance PLC. More details of the Allianz claim and the JDW counterclaims and defence are set out in note 22 The eventual financial outcome of the dispute is highly uncertain for both parties. We believe that it remains in the best interest for the parties to settle the dispute and made a provision of £28m as an estimate for accounting purposes of the potential costs of settlement, or award at trial, plus future legal costs.
Details of the strategic transformation undertaken in the year are set out in the Chief Executive’s Statement and I am pleased with the further progress we’ve made to deliver sustainable profitable growth.
COLLEAGUESThis has been another challenging year and I would like to thank all colleagues for their hard work and commitment. I am pleased that we have been able to recognise this by paying out on our colleague bonus scheme for the second consecutive year. I look forward to working with our teams across the business to deliver our strategy of returning N Brown to sustainable, profitable growth.
BOARD CHANGESI was delighted to assume the role of Group Chair on the 31 March 2021 and am committed to ensuring that the Board remains focused on delivering sustained growth for the long-term benefit of all stakeholders.
Gill Barr has taken over my previous position as Senior Independent Director effective from 31 March 2021. Dominic Platt was appointed in June 2021 as a Non-Executive Director and Audit & Risk Committee Chair. Dominic is the Chief Financial Officer of BGL Group, a position he has held since March 2016.
I would like to welcome Nuno Miller (Chief Operating Officer) and also Michael Mustard who joins as our permanent General Counsel and Company Secretary.
My thanks also go to Christian Wells who was our interim General Counsel and Company Secretary for six months and to Vicky Mitchell who assumed the Audit and Risk Committee Chair role on an interim basis until Dominic’s appointment.
I am grateful to my fellow Directors for their support during what has been another challenging year and will be available to answer any questions you may have on this report or on any of the Board’s activities at the AGM on 7 July 2022.
SUSTAINSUSTAIN is our overarching Environmental, Social and Governance strategy. During the second year of the Group’s sustainability plan, progress included achievement of the 2030 Scope 2 Target for Net Zero emissions
from purchased electricity of the British Retail Consortium Climate Action Roadmap for the second year running.
In addition, following a successful trial of Green Polyethylene (“Green PE”) despatch bags last year, we have now fully rolled these out at our Shaw distribution centre.
BALANCE SHEET STRENGTH Our continued cash generation and robust balance sheet means that we are well positioned to deliver on our strategy.
The Group had access to over £200m of liquidity at the year end in the form of £43.1m cash and undrawn facilities of £172.6m, including £60.1m voluntarily undrawn on the securitisation facility.
DIVIDENDFollowing the outbreak of Covid-19 and the subsequent impact on the business and the wider economy, the Board suspended dividend payments.
We have a clear set of investment plans and a number of competing demands on our cash resources. Nevertheless, the Directors recognise that dividends are an important part of shareholders’ returns and the Board will consider the reintroduction of a dividend in FY23.
LOOKING AHEADAs we enter FY23 we have taken the opportunity to evolve our strategic pillars in support of our vision, mission and purpose. We are focused on our differentiated retail offering, with our key objective being to deliver profitable growth on a sustainable basis.
In FY23, our new front end website will transform our customer’s experience. Simply-Be will launch this year and our other brands will follow. There is also a significant opportunity for further product innovation within our Financial Services business. We are in the process of developing a new Financial Services Platform.
Ron McMillan Independent Non-Executive Chair
CHAIR’S STATEMENT
REVIEW OF THE YEAR
N Brown Group plc Annual Report and Accounts 20224 nbrown.co.uk
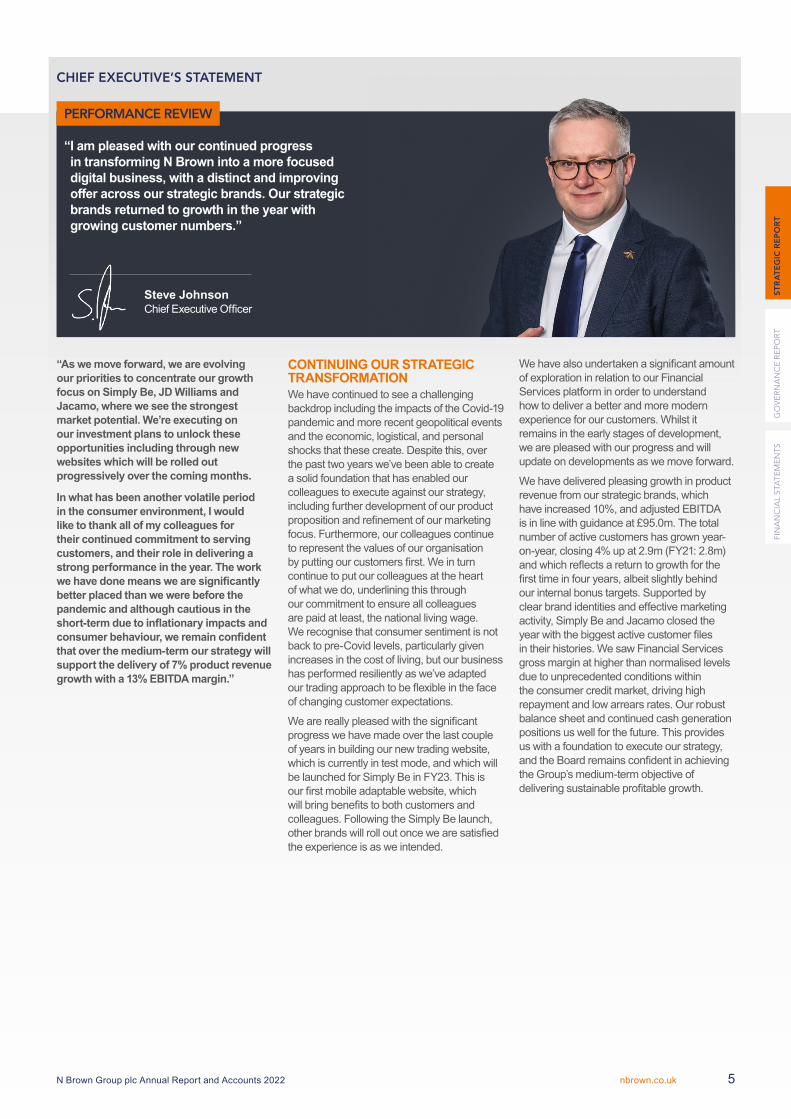
“As we move forward, we are evolving our priorities to concentrate our growth focus on Simply Be, JD Williams and Jacamo, where we see the strongest market potential. We’re executing on our investment plans to unlock these opportunities including through new websites which will be rolled out progressively over the coming months.
In what has been another volatile period in the consumer environment, I would like to thank all of my colleagues for their continued commitment to serving customers, and their role in delivering a strong performance in the year. The work we have done means we are significantly better placed than we were before the pandemic and although cautious in the short-term due to inflationary impacts and consumer behaviour, we remain confident that over the medium-term our strategy will support the delivery of 7% product revenue growth with a 13% EBITDA margin.”
“ I am pleased with our continued progress in transforming N Brown into a more focused digital business, with a distinct and improving offer across our strategic brands. Our strategic brands returned to growth in the year with growing customer numbers.”
Steve Johnson Chief Executive Officer
CONTINUING OUR STRATEGIC TRANSFORMATIONWe have continued to see a challenging backdrop including the impacts of the Covid-19 pandemic and more recent geopolitical events and the economic, logistical, and personal shocks that these create. Despite this, over the past two years we’ve been able to create a solid foundation that has enabled our colleagues to execute against our strategy, including further development of our product proposition and refinement of our marketing focus. Furthermore, our colleagues continue to represent the values of our organisation by putting our customers first. We in turn continue to put our colleagues at the heart of what we do, underlining this through our commitment to ensure all colleagues are paid at least, the national living wage. We recognise that consumer sentiment is not back to pre-Covid levels, particularly given increases in the cost of living, but our business has performed resiliently as we’ve adapted our trading approach to be flexible in the face of changing customer expectations.
We are really pleased with the significant progress we have made over the last couple of years in building our new trading website, which is currently in test mode, and which will be launched for Simply Be in FY23. This is our first mobile adaptable website, which will bring benefits to both customers and colleagues. Following the Simply Be launch, other brands will roll out once we are satisfied the experience is as we intended.
We have also undertaken a significant amount of exploration in relation to our Financial Services platform in order to understand how to deliver a better and more modern experience for our customers. Whilst it remains in the early stages of development, we are pleased with our progress and will update on developments as we move forward.
We have delivered pleasing growth in product revenue from our strategic brands, which have increased 10%, and adjusted EBITDA is in line with guidance at £95.0m. The total number of active customers has grown year-on-year, closing 4% up at 2.9m (FY21: 2.8m) and which reflects a return to growth for the first time in four years, albeit slightly behind our internal bonus targets. Supported by clear brand identities and effective marketing activity, Simply Be and Jacamo closed the year with the biggest active customer files in their histories. We saw Financial Services gross margin at higher than normalised levels due to unprecedented conditions within the consumer credit market, driving high repayment and low arrears rates. Our robust balance sheet and continued cash generation positions us well for the future. This provides us with a foundation to execute our strategy, and the Board remains confident in achieving the Group’s medium-term objective of delivering sustainable profitable growth.
CHIEF EXECUTIVE’S STATEMENT
PERFORMANCE REVIEW
FIN
AN
CIA
L S
TAT
EM
EN
TS
GO
VE
RN
AN
CE
RE
PO
RT
ST
RA
TE
GIC
RE
PO
RT
N Brown Group plc Annual Report and Accounts 2022 5nbrown.co.uk
ENHANCED DIGITAL EXPERIENCE TO INCREASE CUSTOMER CONVERSION We’ve made significant progress on the continued development and deployment of our new front-end platform for the trading websites, ensuring that the technology is established for release in FY23. Simply Be is the first trading website to be migrated onto the new web platform, with beta testing currently taking place.
In addition to development of the platform, our user experience team have focused on delivering incremental improvements across the customer journey, developing efficiencies across digital product pages to enable a smooth checkout experience for customers.
Our commitment to digital transformation supported the development of Robotic Process Automation (“RPA”), which focused primarily on Merchandising, replacing repeated manual tasks with automated processes to improve speed, accuracy, and efficiency.
FLEXIBLE CREDIT TO HELP CUSTOMERS SHOP Financial Services is an integral part of our customer proposition, and we remain committed to providing great products for our customers and ensuring that we support them in appropriate ways. Over the course of the year, we completed a detailed design phase for our new Financial Services platform, which will commence build in 2022. We will continue to enhance our existing proposition where possible including a six-month 0% interest campaign for new customers. We continue to support customers categorised as being in persistent debt, by providing a solution to ensure balance paydown in a reasonable period and prevent any future reoccurrence. This is an integral part of ensuring our customers are protected.From a regulatory perspective, we’ve successfully implemented Stronger Customer Authentication (“SCA”) as part of the PSD2 regulation, ahead of the deadline, minimising any impact on our customers. Having rolled out the Senior Managers and Certification Regime (“SMCR”) from the FCA in 2020, we have now embedded this within the organisation. In addition, we have worked closely with the CBI in the Republic of Ireland, setting up an appropriate Board structure and investing in our technology for improved ID checking and verification.
ATTRACT BROADER RANGES OF CUSTOMERS In June 2020 we set out to simplify our brand portfolio through focused propositions with clear target customers. Having done substantial work in FY21 to simplify the portfolio with the closure of House of Bath, High and Mighty and the integration of Figleaves into Simply Be, the emphasis this year has been on propositional development and building awareness on strategic brands.
Overall, we’ve made good progress; we now have more than two million followers on social media, and across the strategic brands the customer file grew by 6% over the course of the year. We’ve also invested in our creative infrastructure with a new LED studio environment which produces film quality photography and enables shooting of video to showcase our product to best advantage.
In JD Williams we focused on increasing visibility and relevance with our target customer, through brand ambassador partnerships with Davina McCall and Amanda Holden.
Simply Be’s core message is around inclusivity and fit, and our marketing campaigns have showcased this through elevating the importance of product, such as lingerie and denim where fit is key. Influencers have become an increasingly important part of Simply Be’s brand building strategy, and alongside this we were pleased to be a part of Instagram’s UK pilot of “Instagram checkout” where customers can purchase directly via Instagram.
On Jacamo, campaign work has been focused on positioning size as a positive, working with influencers like Big Zuu to build the brands credentials in the market. Home Essentials formed a brand ambassador partnership with Frankie Bridge and Nicki Bamford-Bowes alongside a series of other influencers.
IMPROVED PRODUCT TO DRIVE CUSTOMER FREQUENCY We continue to optimise our range breadth across clothing, footwear and beauty, reducing SKUs by 7% to 25k, creating a clearer customer proposition and buying efficiency. As part of our focus on inclusivity we have extended our core size ranges and now offer 13 sizes across womenswear and 10 sizes across menswear. To continue to strengthen our product handwriting, we have invested substantially in our design capabilities, and the proportion of unique product designed in house is now 53% from 40% across men’s and women’s clothing. We have continued to add aspirational 3rd party brands to extend the “best” element of the range including Nobody’s Child and Hope & Ivy on Simply Be, which are uniquely available in our sizing. Selected Femme and Finery have both launched on JD Williams. Through the year, we’ve also built on our existing strong partnerships with Joe Browns and Monsoon in womenswear and Ralph Lauren and Hugo Boss in menswear. The success of these initiatives has given us the confidence to continue to develop both Jacamo and JD Williams as multi-brand platforms. From a sourcing perspective we have continued to rationalise the number of suppliers we work with from 979 to 805 (a 18% reduction) across the year resulting in improved relationships and efficiency.
NEW HOME OFFERING FOR CUSTOMERS TO SHOP MORE ACROSS CATEGORIES Our existing Home offering enabled us to capitalise on the Homeware boom through the pandemic, with our brands able to pivot towards this category by maximising customers demand. JD Williams, as a multi-category platform, represented the largest share of home sales for the Group at 39%. The Home category continues to evolve with the acceleration of own design product which is unique to us. We continue to design, develop, and procure furnishings in key categories across Home and Tech, with 70% of our Home and Furniture offer being own design. The success of the approach is reflected on 18% year-on-year reduction in returns.Within the technology category we’ve secured more premium brands such as LG and Samsung and grown our existing offer in areas that resonate with the customer at key times. Premium brands present our customers with an opportunity to shop more aspirational products, with flexibility around payment options in conjunction with a credit account.
FY22 LOOK BACK
CHIEF EXECUTIVE’S STATEMENT CONTINUED
N Brown Group plc Annual Report and Accounts 20226 nbrown.co.uk
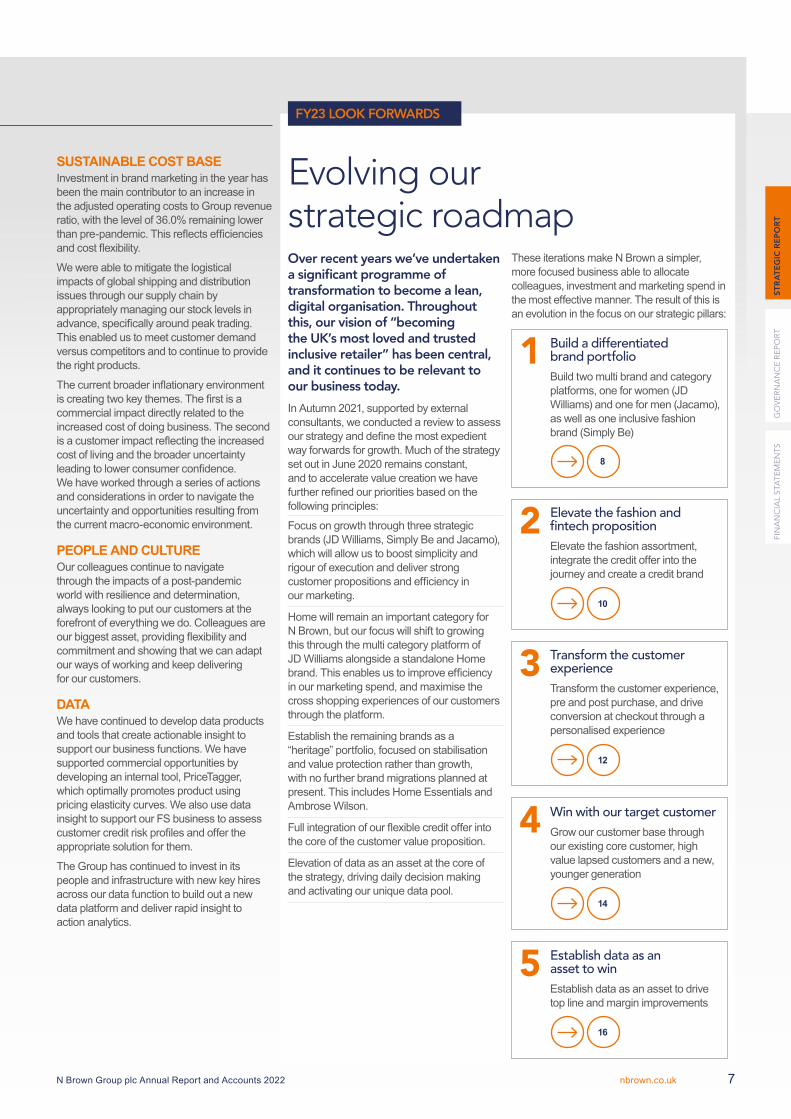
Evolving our strategic roadmapOver recent years we’ve undertaken a significant programme of transformation to become a lean, digital organisation. Throughout this, our vision of “becoming the UK’s most loved and trusted inclusive retailer” has been central, and it continues to be relevant to our business today.
In Autumn 2021, supported by external consultants, we conducted a review to assess our strategy and define the most expedient way forwards for growth. Much of the strategy set out in June 2020 remains constant, and to accelerate value creation we have further refined our priorities based on the following principles:
Focus on growth through three strategic brands (JD Williams, Simply Be and Jacamo), which will allow us to boost simplicity and rigour of execution and deliver strong customer propositions and efficiency in our marketing.
Home will remain an important category for N Brown, but our focus will shift to growing this through the multi category platform of JD Williams alongside a standalone Home brand. This enables us to improve efficiency in our marketing spend, and maximise the cross shopping experiences of our customers through the platform.
Establish the remaining brands as a “heritage” portfolio, focused on stabilisation and value protection rather than growth, with no further brand migrations planned at present. This includes Home Essentials and Ambrose Wilson.
Full integration of our flexible credit offer into the core of the customer value proposition.
Elevation of data as an asset at the core of the strategy, driving daily decision making and activating our unique data pool.
These iterations make N Brown a simpler, more focused business able to allocate colleagues, investment and marketing spend in the most effective manner. The result of this is an evolution in the focus on our strategic pillars:
8
1 Build a differentiated brand portfolioBuild two multi brand and category platforms, one for women (JD Williams) and one for men (Jacamo), as well as one inclusive fashion brand (Simply Be)
10
2 Elevate the fashion and fintech propositionElevate the fashion assortment, integrate the credit offer into the journey and create a credit brand
12
3 Transform the customer experience Transform the customer experience, pre and post purchase, and drive conversion at checkout through a personalised experience
14
4 Win with our target customerGrow our customer base through our existing core customer, high value lapsed customers and a new, younger generation
16
5 Establish data as an asset to win Establish data as an asset to drive top line and margin improvements
SUSTAINABLE COST BASE Investment in brand marketing in the year has been the main contributor to an increase in the adjusted operating costs to Group revenue ratio, with the level of 36.0% remaining lower than pre-pandemic. This reflects efficiencies and cost flexibility.
We were able to mitigate the logistical impacts of global shipping and distribution issues through our supply chain by appropriately managing our stock levels in advance, specifically around peak trading. This enabled us to meet customer demand versus competitors and to continue to provide the right products.
The current broader inflationary environment is creating two key themes. The first is a commercial impact directly related to the increased cost of doing business. The second is a customer impact reflecting the increased cost of living and the broader uncertainty leading to lower consumer confidence. We have worked through a series of actions and considerations in order to navigate the uncertainty and opportunities resulting from the current macro-economic environment.
PEOPLE AND CULTUREOur colleagues continue to navigate through the impacts of a post-pandemic world with resilience and determination, always looking to put our customers at the forefront of everything we do. Colleagues are our biggest asset, providing flexibility and commitment and showing that we can adapt our ways of working and keep delivering for our customers.
DATAWe have continued to develop data products and tools that create actionable insight to support our business functions. We have supported commercial opportunities by developing an internal tool, PriceTagger, which optimally promotes product using pricing elasticity curves. We also use data insight to support our FS business to assess customer credit risk profiles and offer the appropriate solution for them.
The Group has continued to invest in its people and infrastructure with new key hires across our data function to build out a new data platform and deliver rapid insight to action analytics.
FY23 LOOK FORWARDS
FIN
AN
CIA
L S
TAT
EM
EN
TS
GO
VE
RN
AN
CE
RE
PO
RT
ST
RA
TE
GIC
RE
PO
RT
N Brown Group plc Annual Report and Accounts 2022 7nbrown.co.uk

Continuing the momentum built in FY22, our focus is on building awareness and driving growth across the strategic brands of Simply Be, Jacamo and JD Williams.
Simply Be is an inclusive fashion brand for young women, focused primarily on own label design and expertise in fit. We launched a new creative approach with our Spring/Summer campaign, where we are asking women to reject bad fit, joining us in a “fit revolution”. We will explicitly shift our focus to include all sizes – welcoming all women to Simply Be through the campaign. We launched with a new media strategy which moved away from traditional TV advertising, focusing on the digital channels where our customer spends her time (digital, social, influencer), as well as high impact channels like out-of-home advertising.
JD Williams is a fashion and lifestyle platform for grown women. As a platform it is multi category (selling clothing and homeware) and includes own label and third-party brands. The Irish brand Oxendales will also transition to being the offer of JD Williams for the Irish market. JD Williams will continue to work with Davina McCall and Amanda Holden as brand ambassadors in FY23, showing how we have a relevant offer for every occasion for our customer, “a collection for every moment”.
Jacamo is an inclusive fashion platform for all men. Our marketing strategy is evolving to showcase the styles, brands and sizes relevant ‘for every man’, this will be showcased through the year. Our spring/summer campaign launched in May with a focus on key clothing categories, showing how we have the right offer for all men. By using ‘archetypes’ of different men and their style, we showcased the breadth of our offer to convey relevant sizes, brands and styles. This went live across digital video, out-of-home, and social channels in mid-May. For Autumn we are developing a new long-term creative approach, and looking at media and third-party partnerships to land this with significant impact.
STRATEGIC UPDATE
FY23 LOOK FORWARD
Build a differentiated brand portfolio1
N Brown Group plc Annual Report and Accounts 20228 nbrown.co.uk

FIN
AN
CIA
L S
TAT
EM
EN
TS
GO
VE
RN
AN
CE
RE
PO
RT
ST
RA
TE
GIC
RE
PO
RT
N Brown Group plc Annual Report and Accounts 2022 9nbrown.co.uk
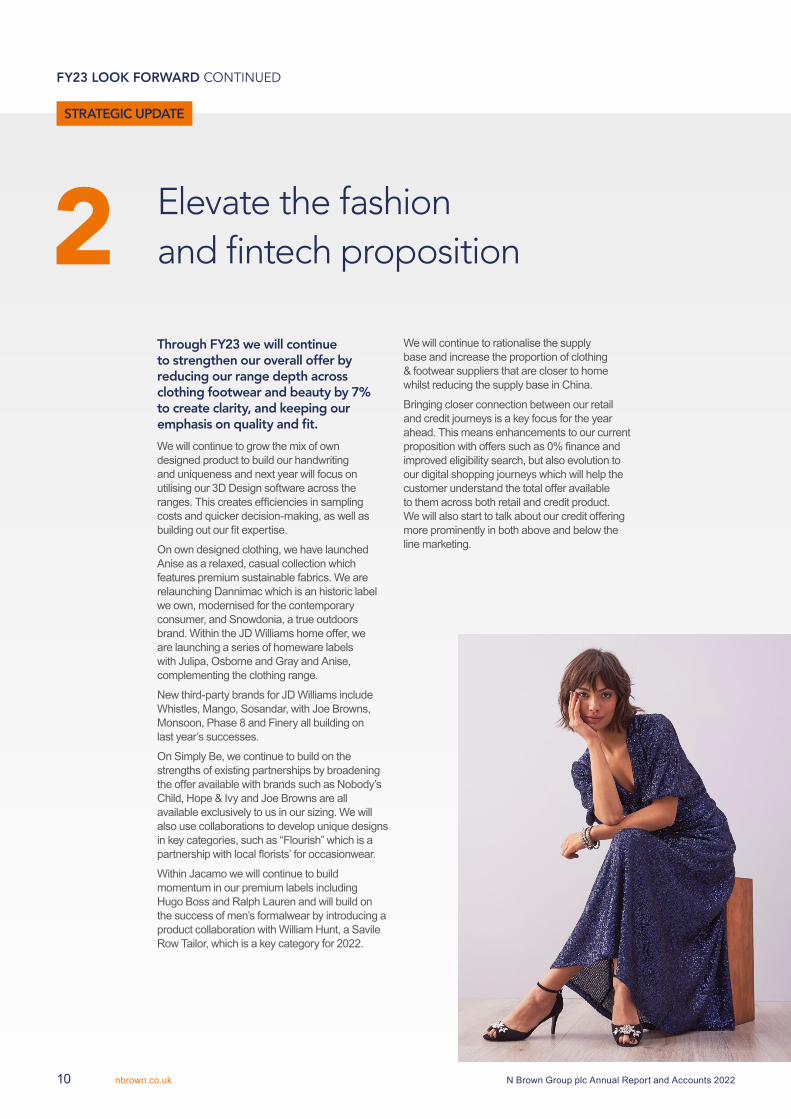
Through FY23 we will continue to strengthen our overall offer by reducing our range depth across clothing footwear and beauty by 7% to create clarity, and keeping our emphasis on quality and fit.
We will continue to grow the mix of own designed product to build our handwriting and uniqueness and next year will focus on utilising our 3D Design software across the ranges. This creates efficiencies in sampling costs and quicker decision-making, as well as building out our fit expertise.
On own designed clothing, we have launched Anise as a relaxed, casual collection which features premium sustainable fabrics. We are relaunching Dannimac which is an historic label we own, modernised for the contemporary consumer, and Snowdonia, a true outdoors brand. Within the JD Williams home offer, we are launching a series of homeware labels with Julipa, Osborne and Gray and Anise, complementing the clothing range.
New third-party brands for JD Williams include Whistles, Mango, Sosandar, with Joe Browns, Monsoon, Phase 8 and Finery all building on last year’s successes.
On Simply Be, we continue to build on the strengths of existing partnerships by broadening the offer available with brands such as Nobody’s Child, Hope & Ivy and Joe Browns are all available exclusively to us in our sizing. We will also use collaborations to develop unique designs in key categories, such as “Flourish” which is a partnership with local florists’ for occasionwear.
Within Jacamo we will continue to build momentum in our premium labels including Hugo Boss and Ralph Lauren and will build on the success of men’s formalwear by introducing a product collaboration with William Hunt, a Savile Row Tailor, which is a key category for 2022.
We will continue to rationalise the supply base and increase the proportion of clothing & footwear suppliers that are closer to home whilst reducing the supply base in China.
Bringing closer connection between our retail and credit journeys is a key focus for the year ahead. This means enhancements to our current proposition with offers such as 0% finance and improved eligibility search, but also evolution to our digital shopping journeys which will help the customer understand the total offer available to them across both retail and credit product. We will also start to talk about our credit offering more prominently in both above and below the line marketing.
FY23 LOOK FORWARD CONTINUED
STRATEGIC UPDATE
Elevate the fashion and fintech proposition2
N Brown Group plc Annual Report and Accounts 202210 nbrown.co.uk

FIN
AN
CIA
L S
TAT
EM
EN
TS
GO
VE
RN
AN
CE
RE
PO
RT
ST
RA
TE
GIC
RE
PO
RT
N Brown Group plc Annual Report and Accounts 2022 11nbrown.co.uk
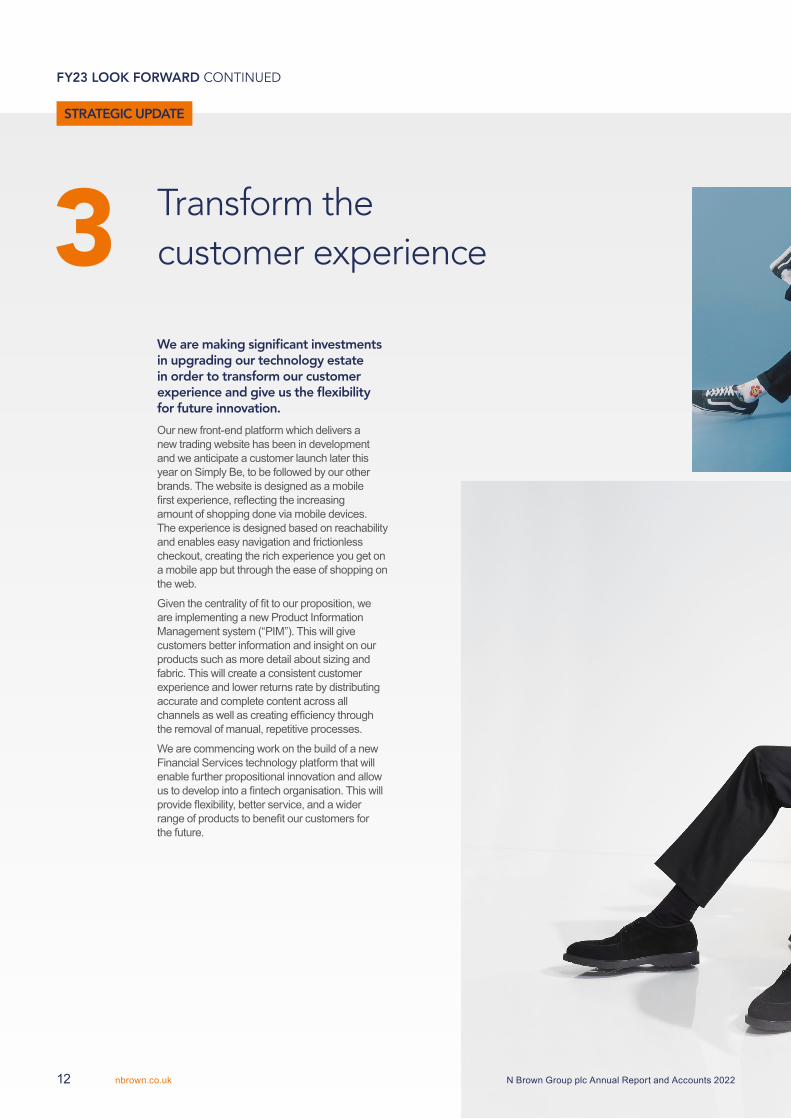
We are making significant investments in upgrading our technology estate in order to transform our customer experience and give us the flexibility for future innovation.
Our new front-end platform which delivers a new trading website has been in development and we anticipate a customer launch later this year on Simply Be, to be followed by our other brands. The website is designed as a mobile first experience, reflecting the increasing amount of shopping done via mobile devices. The experience is designed based on reachability and enables easy navigation and frictionless checkout, creating the rich experience you get on a mobile app but through the ease of shopping on the web.
Given the centrality of fit to our proposition, we are implementing a new Product Information Management system (“PIM”). This will give customers better information and insight on our products such as more detail about sizing and fabric. This will create a consistent customer experience and lower returns rate by distributing accurate and complete content across all channels as well as creating efficiency through the removal of manual, repetitive processes.
We are commencing work on the build of a new Financial Services technology platform that will enable further propositional innovation and allow us to develop into a fintech organisation. This will provide flexibility, better service, and a wider range of products to benefit our customers for the future.
FY23 LOOK FORWARD CONTINUED
STRATEGIC UPDATE
Transform the customer experience3
N Brown Group plc Annual Report and Accounts 202212 nbrown.co.uk

FIN
AN
CIA
L S
TAT
EM
EN
TS
GO
VE
RN
AN
CE
RE
PO
RT
ST
RA
TE
GIC
RE
PO
RT
N Brown Group plc Annual Report and Accounts 2022 13nbrown.co.uk

One of our key focuses for the next financial year is to grow our customer base, with a particular emphasis on better engagement with existing customers and bringing back former customers who have lapsed. Through the integration of credit through the customer journey, improved product story telling in our trading stories and accelerated use of first-party data we’ll create a more compelling relationship with our customers.
This approach will drive better engagement, increase re-trade rates within our customer file and most importantly, improve the loyalty of our customers to our strategic brands. To facilitate this, we are developing our approach to CRM. The intent is to create an ecosystem of relevant, personalised communications on a customer-by-customer journey, that is delivered at the right time for the customer. This year will be focused on developing the people, process and data requirements and foundations in place to start delivering more personalised, relevant content to the customer.
Being clearer on who our target customer is allows us to refine our proposition tailored to their needs. It also allows us to be more effective with our marketing strategy. This will give us a sharper view of our target customer, designing our creative and media approaches around them. The content we create will reflect this, with a storytelling approach and a choice of models that resonates with each audience, underpinning our drive for greater inclusivity and delivering more engaging content formats.
FY23 LOOK FORWARD CONTINUED
STRATEGIC UPDATE
Win with our target customer4
N Brown Group plc Annual Report and Accounts 202214 nbrown.co.uk

FIN
AN
CIA
L S
TAT
EM
EN
TS
GO
VE
RN
AN
CE
RE
PO
RT
ST
RA
TE
GIC
RE
PO
RT
N Brown Group plc Annual Report and Accounts 2022 15nbrown.co.uk

Data was already an enabler to our strategy, and we have elevated it to be a core part as we move forwards. We want to use our data to help better decision making in the business to enable teams to be empowered and move at pace.
Last year, we saw huge success with the build of our internal tool PriceTagger, which helps us optimally promote product using pricing elasticity curves. Alongside developing our core data platform we will focus on driving margin improvement through the following areas: dynamic pricing and promotions to adjust pricing within season, markdown optimisation which defines optimal timing and size of end-of-season markdowns, customer centric buying which is making in-season buying adjustments based on early detection of sales performance and online traffic movements, and, in-session personalisation to help show the right customers to the right products based on their personal profile.
FY23 LOOK FORWARD CONTINUED
STRATEGIC UPDATE
Establish data as an asset to win5
N Brown Group plc Annual Report and Accounts 202216 nbrown.co.uk

FIN
AN
CIA
L S
TAT
EM
EN
TS
GO
VE
RN
AN
CE
RE
PO
RT
ST
RA
TE
GIC
RE
PO
RT
N Brown Group plc Annual Report and Accounts 2022 17nbrown.co.uk
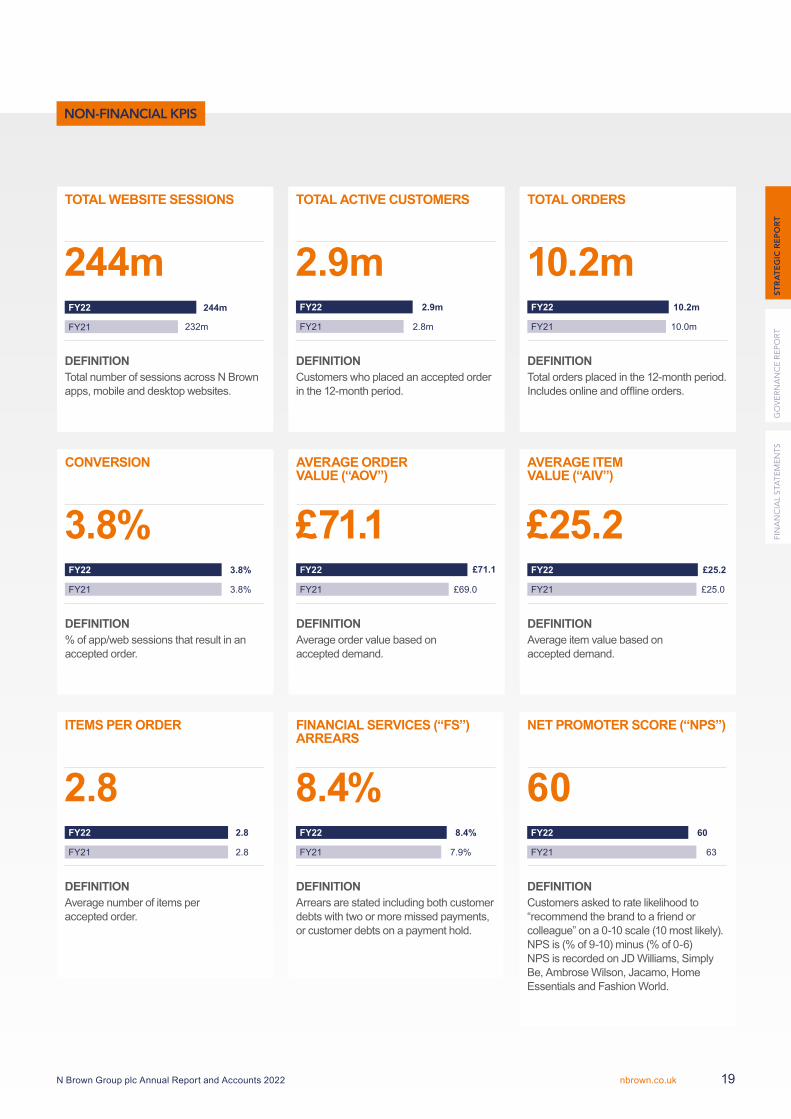
KEY PERFORMANCE INDICATORS (“KPIs”)As a digital retailer committed to accelerating our strategy and navigating a post-pandemic environment, we continue to report various digital customer metrics, which provide operational measures of how our strategy is progressing. The disclosure below reflects our performance in FY22.
Total website sessions during the period increased by 5% due to expanded marketing spend across our strategic brands, particularly in brand advertising to drive awareness. Conversion was flat against FY21 at 3.8%, due to similar levels of online browsing. The 10.2m orders in FY22 reflecting customer demand and included a significant pivot back to Clothing and Footwear, as the UK was able to socialise again.
Average order value (“AOV”) improved by 3.0% and we achieved a 0.7% increase in average item value (“AIV”). These were each driven by a mix back towards higher priced dresses and outer clothing from more casual clothing sold during the onset of the Covid-19 pandemic with items per order remaining in line with prior year.
Total active customers increased in the year driven by acquisition in our strategic brands, representing a return to growth in full year active customers for the first time in four years, albeit was behind the internal target included within bonus metrics. This included some attrition through a cohort of customers who bought one off home products during lockdown periods not returning to shop.
FS arrears showed a small increase following some normalisation in payment rates as a result of an unusually high propensity of credit customers paying down balances in FY21. However, arrears rates have yet to return to FY20 levels.
NPS stepped back from FY21 performance, behind the internal target included within bonus metrics. This was driven by supply chain disruption, and in particular a lack of delivery drivers during peak trading due to Covid-19.
FY23 OUTLOOKOur expectation for FY23 Adjusted EBITDA remains unchanged from our year end trading statement issued on 3 March 2022. This reflected Adjusted EBITDA at a level similar to that reported in FY21, before growing again as the Group’s strategy is executed.
We are confident in continued revenue growth from strategic brands and see the managed decline in revenues from heritage brands moderating as we no longer cycle against the drag from the Figleaves website closure. The trading environment has become more challenging since the start of FY23, with inflation impacting consumer confidence and resulting in a slightly softer level of volumes and revenue growth than previously anticipated. As a result our continued focus on product margin, its improved trajectory in the second half of FY22 and volume variable cost savings, we expect this to be mitigated.
We expect product mix to further normalise, with clothing driving demand and a continued shift back into categories such as dresses and formalwear. The previously reported softer conditions in the online home market have continued into FY23 and we do not anticipate these abating in the short-term.
We remain confident in the resilience of our business model and in our strategic direction. We expect to drive product margin improvements through the Group’s pricing response to cost inflation, the movement of the product mix back into clothing, and continued initiatives include data usage to optimise pricing strategies.
Financial Services revenue is expected to decline albeit at a lower rate than in prior years, and Financial Services gross margin to normalise to a low to mid 50s per cent range.
We anticipate a net increase in the adjusted operating costs to Group revenue ratio in FY23 as a result of inflationary pressures. This is inclusive of continuing our strategic investments in areas such as brand marketing. Operating costs will also increase due to a higher level of project spend included within operating expenses. Management actions are planned across all areas to mitigate the effect of these pressures.
The business is well positioned to continue delivering strategic change through FY23 and beyond. At the end of FY23, we expect the Group to maintain a strong unsecured net cash position and for net debt to be broadly in line with FY22’s closing position.
The Board remains confident that over the medium term our strategy will support the delivery of 7% product revenue growth with a 13%1 EBITDA margin.
SUMMARY FY22 was a year of continued progress. The business is in a much stronger position relative to the start of the pandemic as a result of the hard work of the team over the last two years. We made strategic progress during the year, including strengthening and refining the product offering and marketing approach and have achieved a return to growth in customer numbers.
We remain a double-digit EBITDA margin rate business, with a strong balance sheet and are cash generative. Our improved retail proposition and our credit offer sets us up well to support customers as they look to spread the cost of their purchases and manage their monthly budgets. We will continue to invest in our strategy and remain confident of achieving our medium-term objectives, however, we remain cautious in the short-term given the inflationary pressures businesses and customers are experiencing as we do not see these pressures abating this year.
1 Medium term Adjusted EBITDA target reduced from 14% to 13% to reflect a higher level of project spend included within operating expenses rather than capitalised.
CHIEF EXECUTIVE’S STATEMENT CONTINUED
N Brown Group plc Annual Report and Accounts 202218 nbrown.co.uk
TOTAL ACTIVE CUSTOMERS
2.9m
2.8m
FY22
FY21
2.9m
DEFINITIONCustomers who placed an accepted order in the 12-month period.
TOTAL ORDERS
10.2m
10.0m
10.2mFY22
FY21
DEFINITIONTotal orders placed in the 12-month period. Includes online and offline orders.
TOTAL WEBSITE SESSIONS
244mFY22
FY21
244m
232m
DEFINITIONTotal number of sessions across N Brown apps, mobile and desktop websites.
AVERAGE ORDER VALUE (“AOV”)
£71.1
£69.0
£ 71.1FY22
FY21
DEFINITIONAverage order value based on accepted demand.
AVERAGE ITEM VALUE (“AIV”)
£25.2
£25.0
£25.2FY22
FY21
DEFINITIONAverage item value based on accepted demand.
ITEMS PER ORDER
2.8
2.8
2.8FY22
FY21
DEFINITIONAverage number of items per accepted order.
CONVERSION
3.8%
3.8%
3.8%FY22
FY21
DEFINITION% of app/web sessions that result in an accepted order.
NET PROMOTER SCORE (“NPS”)
60
63
6 0FY22
FY21
DEFINITIONCustomers asked to rate likelihood to “recommend the brand to a friend or colleague” on a 0-10 scale (10 most likely). NPS is (% of 9-10) minus (% of 0-6) NPS is recorded on JD Williams, Simply Be, Ambrose Wilson, Jacamo, Home Essentials and Fashion World.
FINANCIAL SERVICES (“FS”) ARREARS
8.4%
7.9%
8.4%FY22
FY21
DEFINITIONArrears are stated including both customer debts with two or more missed payments, or customer debts on a payment hold.
NON-FINANCIAL KPIS
FIN
AN
CIA
L S
TAT
EM
EN
TS
GO
VE
RN
AN
CE
RE
PO
RT
ST
RA
TE
GIC
RE
PO
RT
N Brown Group plc Annual Report and Accounts 2022 19nbrown.co.uk
RETAIL MARKET
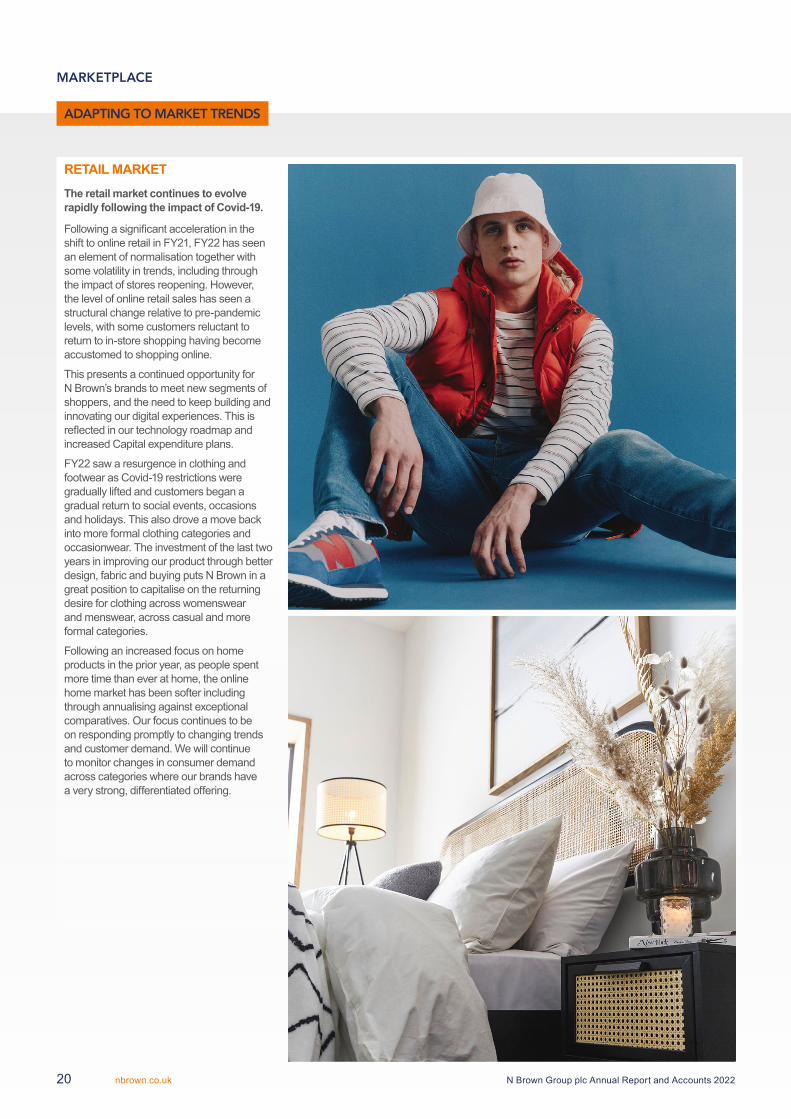
The retail market continues to evolve rapidly following the impact of Covid-19.
Following a significant acceleration in the shift to online retail in FY21, FY22 has seen an element of normalisation together with some volatility in trends, including through the impact of stores reopening. However, the level of online retail sales has seen a structural change relative to pre-pandemic levels, with some customers reluctant to return to in-store shopping having become accustomed to shopping online.
This presents a continued opportunity for N Brown’s brands to meet new segments of shoppers, and the need to keep building and innovating our digital experiences. This is reflected in our technology roadmap and increased Capital expenditure plans.
FY22 saw a resurgence in clothing and footwear as Covid-19 restrictions were gradually lifted and customers began a gradual return to social events, occasions and holidays. This also drove a move back into more formal clothing categories and occasionwear. The investment of the last two years in improving our product through better design, fabric and buying puts N Brown in a great position to capitalise on the returning desire for clothing across womenswear and menswear, across casual and more formal categories.
Following an increased focus on home products in the prior year, as people spent more time than ever at home, the online home market has been softer including through annualising against exceptional comparatives. Our focus continues to be on responding promptly to changing trends and customer demand. We will continue to monitor changes in consumer demand across categories where our brands have a very strong, differentiated offering.
ADAPTING TO MARKET TRENDS
MARKETPLACE
N Brown Group plc Annual Report and Accounts 202220 nbrown.co.uk

CONSUMER CREDIT
Our credit proposition has remained a key differentiator this year, providing convenient financial services to customers and giving them access to fantastic products across our portfolio of brands. Our credit customers remain our most loyal customers who not only shop more frequently but also score the highest when it comes to customer satisfaction.
As our retail brands refine their propositions in line with the Group strategy, our financial services offering is being updated to appeal to more affluent consumers, whilst continuing to champion inclusion by offering affordable credit to customers who are underserved by the mainstream credit market. The new financial services platform is the strategic enabler for our future credit proposition and we have made good progress this year to move towards delivery, adopting a more agile approach to release early value where possible.
Prior to the financial services platform being delivered, we have launched an improved 0% interest for 6 months promotional offer for new customers. As the credit market recovers from the impact of the pandemic, where record levels of balance repayments were seen across the industry, this offer has helped to drive new credit customer acquisition and sales.
Throughout the year we continued to provide support to customers impacted by the Covid-19 pandemic as we reached the end of the FCA’s specific Covid-19
forbearance and the Government furlough scheme. Customers received the tailored support they needed and all customers have now exited Covid-19 forbearance. In general our customers have been able to handle the uncertain Covid-19 situation well, with overall levels of financial difficulty at relative lows and good customer outcomes being achieved. We recognise the current cost pressures facing consumers and are committed to serve customers’ needs through this time whilst continuing to act as a responsible lender.
We have continued to develop and enhance our use of other sources of data and analytical tools and techniques to drive better decisions that bring commercial value and drive better outcomes for customers. DataRobot is a cloud based AI platform on which we have successfully deployed machine learning models to optimise initial credit limits and reduce instances of first payment defaults. We see further opportunities in this area to help drive incremental improvement in the new financial year.
MARKETPLACE OUTLOOKOur success as a business is determined by demand for our products, which stems from consumer confidence, our ability to benefit and service that demand by cultivating brands that resonate, products that stand out, and a strong digital customer experience supported by the convenience of our Financial Services offer.
The latest GfK Consumer Confidence Index shows a decline in the Overall Index Score in early 2022 to -38 at April. This followed an overall improvement during 2021, albeit with some reduction in the latter part of the year. We recognise that there are currently elevated fears about the impact of price rises including food, fuel and utilities, as well as increased taxation and interest rates, and these are impacting consumer confidence.
A lack of restrictions and further return to normality following a volatile and uncertain two years means that there is an opportunity for clothing and particularly categories which have been suppressed to further rebound, such as holiday apparel and occasionwear. Our ability to pivot our different brands into product categories to meet consumer demand, alongside our flexible credit offer and targeted increases in marketing investment, is key to supporting our overall strategy to ensure sustainable long-term growth.
FIN
AN
CIA
L S
TAT
EM
EN
TS
GO
VE
RN
AN
CE
RE
PO
RT
ST
RA
TE
GIC
RE
PO
RT
N Brown Group plc Annual Report and Accounts 2022 21nbrown.co.uk
OUR VALUES UNDERPIN EVERYTHING WE DO
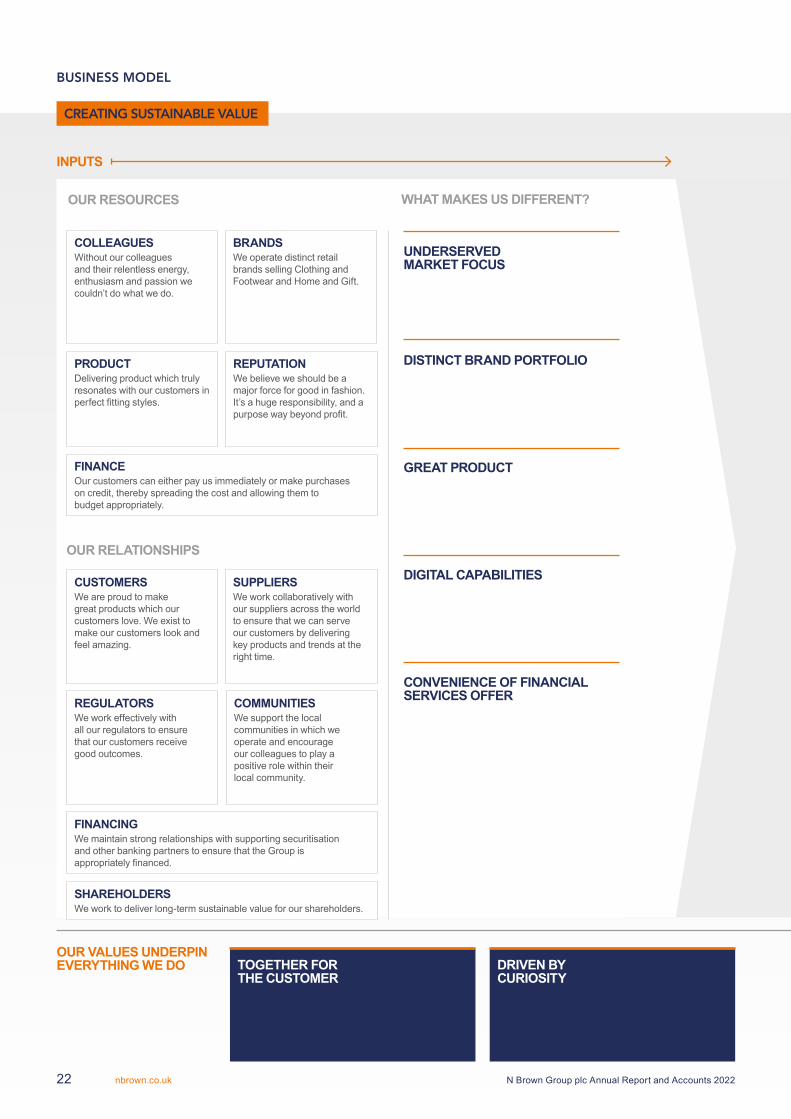
INPUTS
FINANCEOur customers can either pay us immediately or make purchases on credit, thereby spreading the cost and allowing them to budget appropriately.
COLLEAGUESWithout our colleagues and their relentless energy, enthusiasm and passion we couldn’t do what we do.
PRODUCTDelivering product which truly resonates with our customers in perfect fitting styles.
BRANDSWe operate distinct retail brands selling Clothing and Footwear and Home and Gift.
REPUTATIONWe believe we should be a major force for good in fashion. It’s a huge responsibility, and a purpose way beyond profit.
FINANCINGWe maintain strong relationships with supporting securitisation and other banking partners to ensure that the Group is appropriately financed.
SHAREHOLDERSWe work to deliver long-term sustainable value for our shareholders.
CUSTOMERSWe are proud to make great products which our customers love. We exist to make our customers look and feel amazing.
SUPPLIERSWe work collaboratively with our suppliers across the world to ensure that we can serve our customers by delivering key products and trends at the right time.
REGULATORS We work effectively with all our regulators to ensure that our customers receive good outcomes.
COMMUNITIESWe support the local communities in which we operate and encourage our colleagues to play a positive role within their local community.
OUR RELATIONSHIPS
UNDERSERVED MARKET FOCUS
CONVENIENCE OF FINANCIAL SERVICES OFFER
GREAT PRODUCT
DIGITAL CAPABILITIES
DISTINCT BRAND PORTFOLIO
OUR RESOURCES WHAT MAKES US DIFFERENT?
TOGETHER FOR THE CUSTOMER
DRIVEN BY CURIOSITY
CREATING SUSTAINABLE VALUE
BUSINESS MODEL
N Brown Group plc Annual Report and Accounts 202222 nbrown.co.uk
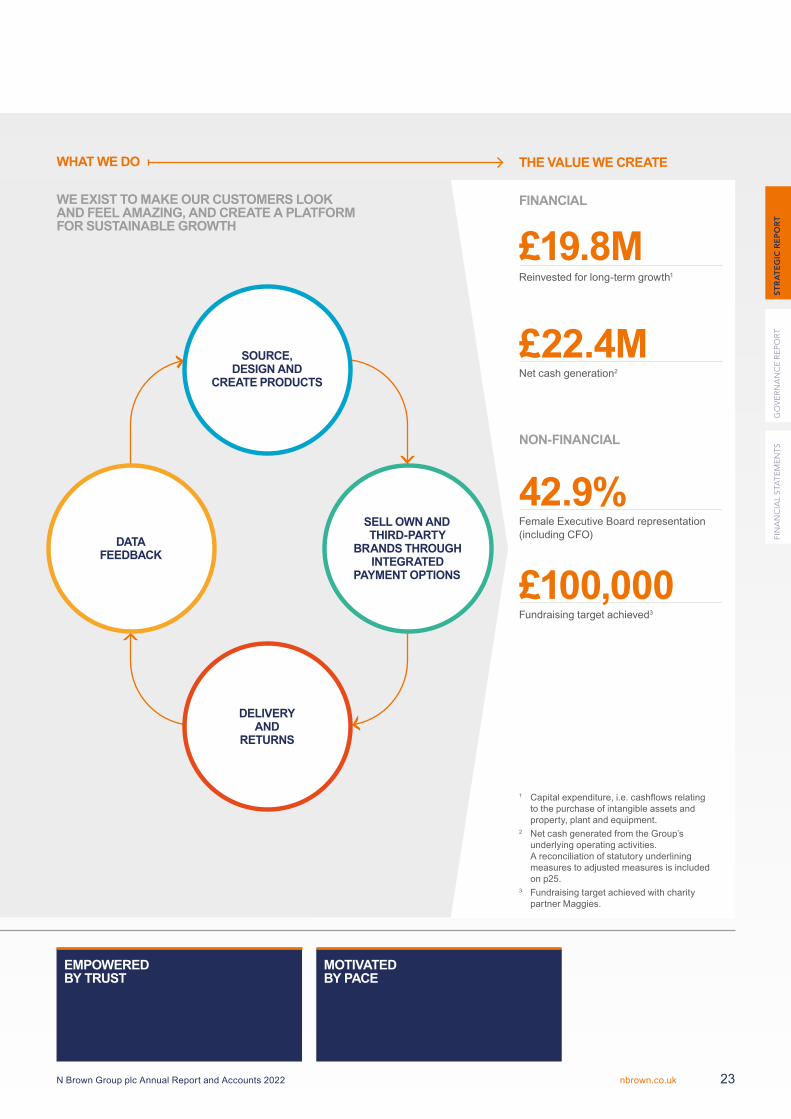
WHAT WE DO THE VALUE WE CREATE
1 Capital expenditure, i.e. cashflows relating to the purchase of intangible assets and property, plant and equipment.
2 Net cash generated from the Group’s underlying operating activities. A reconciliation of statutory underlining measures to adjusted measures is included on p25.
3 Fundraising target achieved with charity partner Maggies.
FINANCIALWE EXIST TO MAKE OUR CUSTOMERS LOOK AND FEEL AMAZING, AND CREATE A PLATFORM FOR SUSTAINABLE GROWTH
SOURCE, DESIGN AND
CREATE PRODUCTS
DATA FEEDBACK
SELL OWN AND THIRD-PARTY
BRANDS THROUGH INTEGRATED
PAYMENT OPTIONS
DELIVERY AND
RETURNS
NON-FINANCIAL
42.9%Female Executive Board representation (including CFO)
£100,000Fundraising target achieved3
£19.8MReinvested for long-term growth1
£22.4MNet cash generation2
EMPOWERED BY TRUST
MOTIVATED BY PACE
FIN
AN
CIA
L S
TAT
EM
EN
TS
GO
VE
RN
AN
CE
RE
PO
RT
ST
RA
TE
GIC
RE
PO
RT
N Brown Group plc Annual Report and Accounts 2022 23nbrown.co.uk
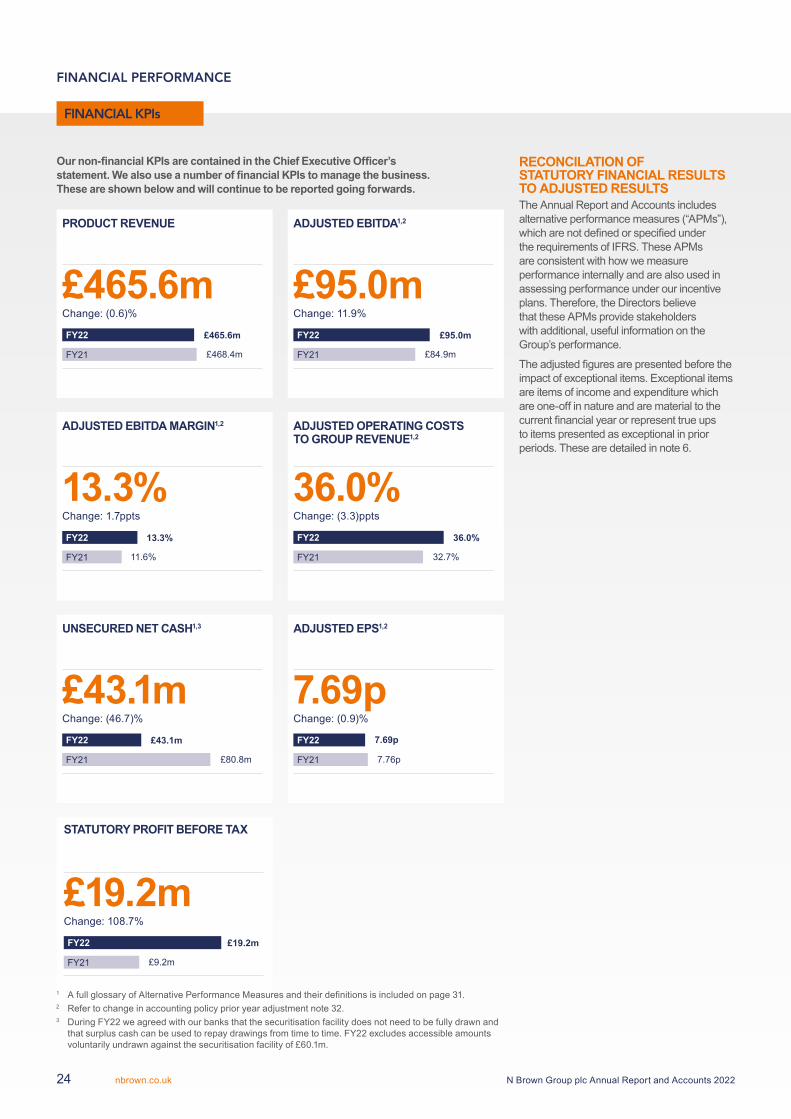
FINANCIAL KPIs
Our non-financial KPIs are contained in the Chief Executive Officer’s statement. We also use a number of financial KPIs to manage the business. These are shown below and will continue to be reported going forwards.
FINANCIAL PERFORMANCE
1 AfullglossaryofAlternativePerformanceMeasuresandtheirdefinitionsisincludedonpage31.2 Refertochangeinaccountingpolicyprioryearadjustmentnote32.3 During FY22 we agreed with our banks that the securitisation facility does not need to be fully drawn and
thatsurpluscashcanbeusedtorepaydrawingsfromtimetotime.FY22excludesaccessibleamountsvoluntarilyundrawnagainstthesecuritisationfacilityof£60.1m.
PRODUCT REVENUE
£465.6mFY22
FY21
£465.6m
£468.4m
Change: (0.6)%
ADJUSTED EBITDA MARGIN1,2
13.3%FY22
FY21
13.3%
11.6%
Change: 1.7ppts
UNSECURED NET CASH1,3
£43.1mFY22
FY21
£43.1m
£80.8m
Change: (46.7)%
ADJUSTED EBITDA1,2
£95.0mFY22
FY21
£95.0m
£84.9m
Change: 11.9%
ADJUSTED OPERATING COSTS
TO GROUP REVENUE1,2
36.0%FY22
FY21
36.0%
32.7%
Change: (3.3)ppts
ADJUSTED EPS1,2
7.69pFY22
FY21
7.69p
7.76p
Change: (0.9)%
RECONCILATION OF STATUTORY FINANCIAL RESULTS TO ADJUSTED RESULTSTheAnnualReportandAccountsincludesalternativeperformancemeasures(“APMs”),whicharenotdefinedorspecifiedundertherequirementsofIFRS.TheseAPMsare consistent with how we measure performanceinternallyandarealsousedinassessingperformanceunderourincentiveplans.Therefore,theDirectorsbelievethattheseAPMsprovidestakeholderswithadditional,usefulinformationontheGroup’sperformance.
Theadjustedfiguresarepresentedbeforetheimpactofexceptionalitems.Exceptionalitemsareitemsofincomeandexpenditurewhichare one-off in nature and are material to the currentfinancialyearorrepresenttrueupstoitemspresentedasexceptionalinpriorperiods.Thesearedetailedinnote6.
STATUTORY PROFIT BEFORE TAX
£19.2mFY22
FY21
£19.2m
£9.2m
Change: 108.7%
N Brown Group plc Annual Report and Accounts 202224 nbrown.co.uk
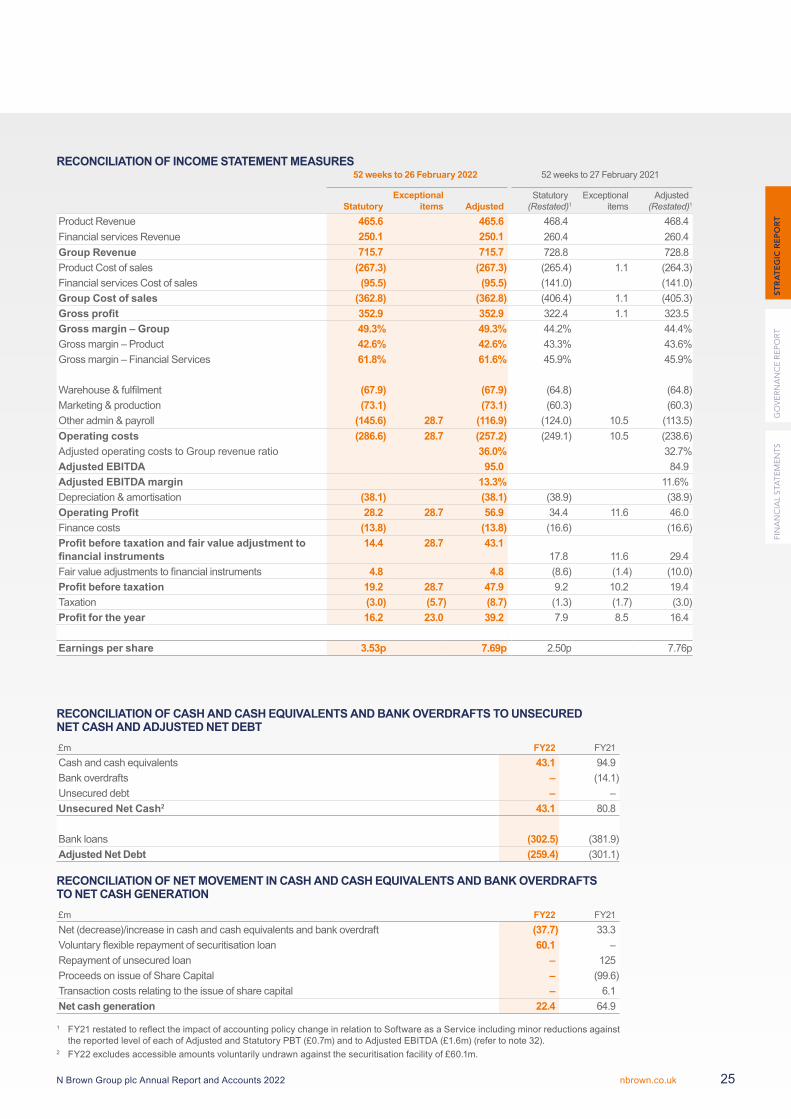
RECONCILIATION OF INCOME STATEMENT MEASURES 52 weeks to 26 February 2022 52 weeks to 27 February 2021
StatutoryExceptional
items AdjustedStatutory
(Restated)1 Exceptional
items Adjusted
(Restated)1
Product Revenue 465.6 465.6 468.4 468.4Financial services Revenue 250.1 250.1 260.4 260.4Group Revenue 715.7 715.7 728.8 728.8Product Cost of sales (267.3) (267.3) (265.4) 1.1 (264.3)Financial services Cost of sales (95.5) (95.5) (141.0) (141.0)Group Cost of sales (362.8) (362.8) (406.4) 1.1 (405.3)Gross profit 352.9 352.9 322.4 1.1 323.5Gross margin – Group 49.3% 49.3% 44.2% 44.4%Gross margin – Product 42.6% 42.6% 43.3% 43.6%Gross margin – Financial Services 61.8% 61.6% 45.9% 45.9%
Warehouse&fulfilment (67.9) (67.9) (64.8) (64.8)Marketing&production (73.1) (73.1) (60.3) (60.3)Otheradmin&payroll (145.6) 28.7 (116.9) (124.0) 10.5 (113.5)Operating costs (286.6) 28.7 (257.2) (249.1) 10.5 (238.6)AdjustedoperatingcoststoGrouprevenueratio 36.0% 32.7%Adjusted EBITDA 95.0 84.9Adjusted EBITDA margin 13.3% 11.6%Depreciation&amortisation (38.1) (38.1) (38.9) (38.9)Operating Profit 28.2 28.7 56.9 34.4 11.6 46.0Finance costs (13.8) (13.8) (16.6) (16.6)Profit before taxation and fair value adjustment to financial instruments
14.4 28.7 43.117.8 11.6 29.4
Fairvalueadjustmentstofinancialinstruments 4.8 4.8 (8.6) (1.4) (10.0)Profit before taxation 19.2 28.7 47.9 9.2 10.2 19.4Taxation (3.0) (5.7) (8.7) (1.3) (1.7) (3.0)Profit for the year 16.2 23.0 39.2 7.9 8.5 16.4
Earnings per share 3.53p 7.69p 2.50p 7.76p
1 FY21restatedtoreflecttheimpactofaccountingpolicychangeinrelationtoSoftwareasaServiceincludingminorreductionsagainstthereportedlevelofeachofAdjustedandStatutoryPBT(£0.7m)andtoAdjustedEBITDA(£1.6m)(refertonote32).
2 FY22excludesaccessibleamountsvoluntarilyundrawnagainstthesecuritisationfacilityof£60.1m.
RECONCILIATION OF CASH AND CASH EQUIVALENTS AND BANK OVERDRAFTS TO UNSECURED NET CASH AND ADJUSTED NET DEBT£m FY22 FY21Cash and cash equivalents 43.1 94.9Bankoverdrafts – (14.1)Unsecured debt – –Unsecured Net Cash2 43.1 80.8
Bankloans (302.5) (381.9)Adjusted Net Debt (259.4) (301.1)
RECONCILIATION OF NET MOVEMENT IN CASH AND CASH EQUIVALENTS AND BANK OVERDRAFTS TO NET CASH GENERATION£m FY22 FY21Net(decrease)/increaseincashandcashequivalentsandbankoverdraft (37.7) 33.3Voluntaryflexiblerepaymentofsecuritisationloan 60.1 – Repaymentofunsecuredloan – 125ProceedsonissueofShareCapital – (99.6)Transactioncostsrelatingtotheissueofsharecapital – 6.1Net cash generation 22.4 64.9
FIN
AN
CIA
L S
TAT
EM
EN
TS
GO
VE
RN
AN
CE
RE
PO
RT
ST
RA
TE
GIC
RE
PO
RT
N Brown Group plc Annual Report and Accounts 2022 25nbrown.co.uk
“This was in the context of a year of low levels of consumer credit default, as our customers transitioned through the pandemic.
Our continued cash generation and robust balance sheet means we are well positioned to execute on our strategy.”
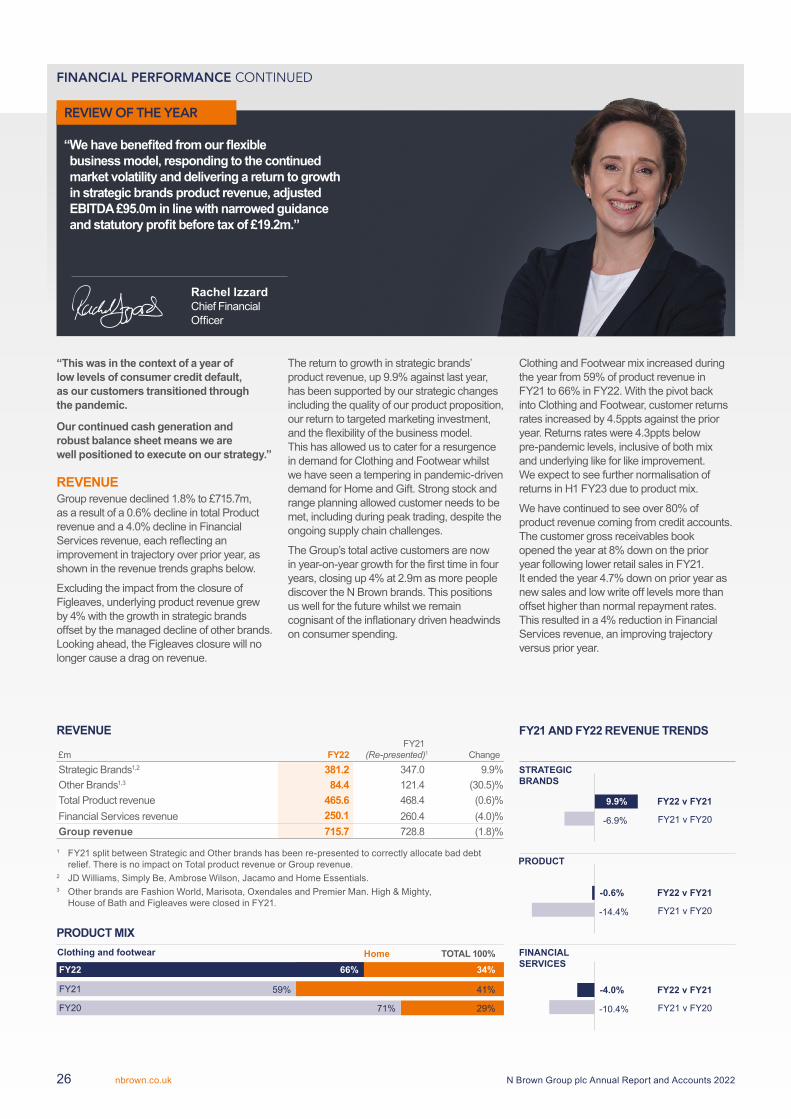
REVENUEGrouprevenuedeclined1.8%to£715.7m,asaresultofa0.6%declineintotalProductrevenueanda4.0%declineinFinancialServicesrevenue,eachreflectinganimprovementintrajectoryoverprioryear,asshownintherevenuetrendsgraphsbelow.
ExcludingtheimpactfromtheclosureofFigleaves,underlyingproductrevenuegrewby4%withthegrowthinstrategicbrandsoffsetbythemanageddeclineofotherbrands.Lookingahead,theFigleavesclosurewillnolongercauseadragonrevenue.
Thereturntogrowthinstrategicbrands’productrevenue,up9.9%againstlastyear,hasbeensupportedbyourstrategicchangesincludingthequalityofourproductproposition,ourreturntotargetedmarketinginvestment,andtheflexibilityofthebusinessmodel.This has allowed us to cater for a resurgence in demand for Clothing and Footwear whilst wehaveseenatemperinginpandemic-drivendemandforHomeandGift.Strongstockandrangeplanningallowedcustomerneedstobemet,includingduringpeaktrading,despitetheongoingsupplychainchallenges.
TheGroup’stotalactivecustomersarenowinyear-on-yeargrowthforthefirsttimeinfouryears,closingup4%at2.9masmorepeoplediscovertheNBrownbrands.Thispositionsus well for the future whilst we remain cognisantoftheinflationarydrivenheadwindsonconsumerspending.
ClothingandFootwearmixincreasedduringtheyearfrom59%ofproductrevenueinFY21to66%inFY22.WiththepivotbackintoClothingandFootwear,customerreturnsratesincreasedby4.5pptsagainsttheprioryear.Returnsrateswere4.3pptsbelowpre-pandemiclevels,inclusiveofbothmixandunderlyinglikeforlikeimprovement.WeexpecttoseefurthernormalisationofreturnsinH1FY23duetoproductmix.
Wehavecontinuedtoseeover80%ofproductrevenuecomingfromcreditaccounts.The customer gross receivables book openedtheyearat8%downontheprioryearfollowinglowerretailsalesinFY21.Itendedtheyear4.7%downonprioryearasnew sales and low write off levels more than offsethigherthannormalrepaymentrates.Thisresultedina4%reductioninFinancialServicesrevenue,animprovingtrajectoryversusprioryear.
REVENUE
£m FY22FY21
(Re-presented)1 ChangeStrategicBrands1,2 381.2 347.0 9.9%OtherBrands1,3 84.4 121.4 (30.5)%Total Product revenue 465.6 468.4 (0.6)%Financial Services revenue 250.1 260.4 (4.0)%Group revenue 715.7 728.8 (1.8)%
1 FY21splitbetweenStrategicandOtherbrandshasbeenre-presentedtocorrectlyallocatebaddebtrelief.ThereisnoimpactonTotalproductrevenueorGrouprevenue.
2 JDWilliams,SimplyBe,AmbroseWilson,JacamoandHomeEssentials.3 OtherbrandsareFashionWorld,Marisota,OxendalesandPremierMan.High&Mighty,
HouseofBathandFigleaveswereclosedinFY21.
“ We have benefited from our flexible business model, responding to the continued market volatility and delivering a return to growth in strategic brands product revenue, adjusted EBITDA £95.0m in line with narrowed guidance and statutory profit before tax of £19.2m.”
Rachel Izzard Chief Financial Officer
REVIEW OF THE YEAR
FY22 66% 34%
FY21
FY20 71%
59%
Home TOTAL 100%
41%
29%
Clothing and footwear
PRODUCT
-14.4%
-0.6% FY22 v FY21
FY21 v FY20
FINANCIAL SERVICES
-10.4%
-4.0% FY22 v FY21
FY21 v FY20
STRATEGICBRANDS
-6.9%
9.9% FY22 v FY21
FY21 v FY20
FY21 AND FY22 REVENUE TRENDS
PRODUCT MIX
FINANCIAL PERFORMANCE CONTINUED
N Brown Group plc Annual Report and Accounts 202226 nbrown.co.uk
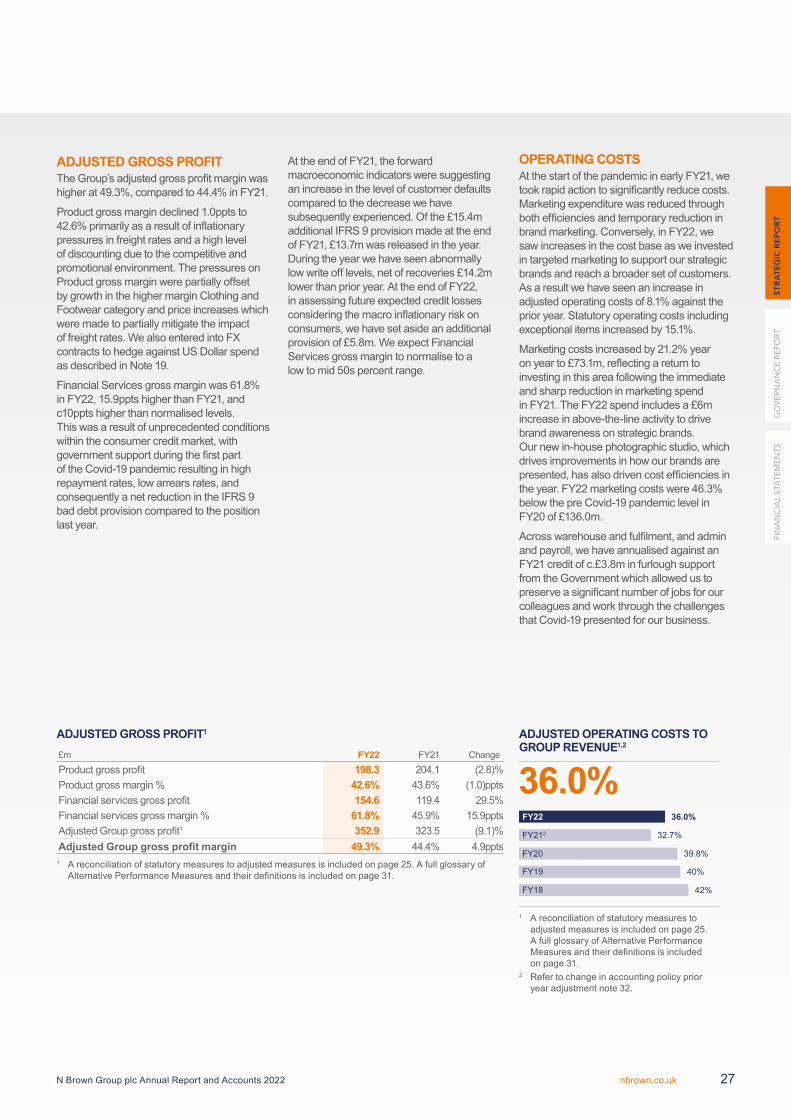
ADJUSTED GROSS PROFITTheGroup’sadjustedgrossprofitmarginwashigherat49.3%,comparedto44.4%inFY21.
Productgrossmargindeclined1.0pptsto42.6%primarilyasaresultofinflationarypressuresinfreightratesandahighlevelofdiscountingduetothecompetitiveandpromotionalenvironment.ThepressuresonProductgrossmarginwerepartiallyoffsetby growth in the higher margin Clothing and Footwearcategoryandpriceincreaseswhichweremadetopartiallymitigatetheimpactoffreightrates.WealsoenteredintoFXcontractstohedgeagainstUSDollarspendasdescribedinNote19.
FinancialServicesgrossmarginwas61.8%inFY22,15.9pptshigherthanFY21,andc10pptshigherthannormalisedlevels.Thiswasaresultofunprecedentedconditionswithintheconsumercreditmarket,withgovernmentsupportduringthefirstpartoftheCovid-19pandemicresultinginhighrepaymentrates,lowarrearsrates,andconsequentlyanetreductionintheIFRS9baddebtprovisioncomparedtothepositionlastyear.
AttheendofFY21,theforwardmacroeconomic indicators were suggesting an increase in the level of customer defaults comparedtothedecreasewehavesubsequentlyexperienced.Ofthe£15.4madditionalIFRS9provisionmadeattheendofFY21,£13.7mwasreleasedintheyear.During the year we have seen abnormally lowwriteofflevels,netofrecoveries£14.2mlowerthanprioryear.AttheendofFY22,inassessingfutureexpectedcreditlossesconsideringthemacroinflationaryriskonconsumers,wehavesetasideanadditionalprovisionof£5.8m.WeexpectFinancialServices gross margin to normalise to a lowtomid50spercentrange.
OPERATING COSTSAtthestartofthepandemicinearlyFY21,wetookrapidactiontosignificantlyreducecosts.Marketingexpenditurewasreducedthroughbothefficienciesandtemporaryreductioninbrandmarketing.Conversely,inFY22,wesaw increases in the cost base as we invested intargetedmarketingtosupportourstrategicbrandsandreachabroadersetofcustomers.As a result we have seen an increase in adjustedoperatingcostsof8.1%againsttheprioryear.Statutoryoperatingcostsincludingexceptionalitemsincreasedby15.1%.
Marketingcostsincreasedby21.2%yearonyearto£73.1m,reflectingareturntoinvesting in this area following the immediate andsharpreductioninmarketingspendinFY21.TheFY22spendincludesa£6mincrease in above-the-line activity to drive brandawarenessonstrategicbrands.Ournewin-housephotographicstudio,whichdrivesimprovementsinhowourbrandsarepresented,hasalsodrivencostefficienciesintheyear.FY22marketingcostswere46.3%belowthepreCovid-19pandemiclevelinFY20of£136.0m.
Acrosswarehouseandfulfilment,andadminandpayroll,wehaveannualisedagainstanFY21creditofc.£3.8minfurloughsupportfrom the Government which allowed us to preserveasignificantnumberofjobsforourcolleagues and work through the challenges thatCovid-19presentedforourbusiness.
ADJUSTED GROSS PROFIT1
£m FY22 FY21 ChangeProductgrossprofit 198.3 204.1 (2.8)%Productgrossmargin% 42.6% 43.6% (1.0)pptsFinancialservicesgrossprofit 154.6 119.4 29.5%Financialservicesgrossmargin% 61.8% 45.9% 15.9pptsAdjustedGroupgrossprofit1 352.9 323.5 (9.1)%Adjusted Group gross profit margin 49.3% 44.4% 4.9ppts
1 Areconciliationofstatutorymeasurestoadjustedmeasuresisincludedonpage25.AfullglossaryofAlternativePerformanceMeasuresandtheirdefinitionsisincludedonpage31.
ADJUSTED OPERATING COSTS TO GROUP REVENUE1,2
36.0%
32.7%
39.8%
40%
42%
FY22
FY212
36.0%FY20
FY19
FY18
1 A reconciliation of statutory measures to adjustedmeasuresisincludedonpage25.A full glossary of Alternative Performance Measuresandtheirdefinitionsisincludedonpage31.
2 Refertochangeinaccountingpolicyprioryearadjustmentnote32.
FIN
AN
CIA
L S
TAT
EM
EN
TS
GO
VE
RN
AN
CE
RE
PO
RT
ST
RA
TE
GIC
RE
PO
RT
N Brown Group plc Annual Report and Accounts 2022 27nbrown.co.uk
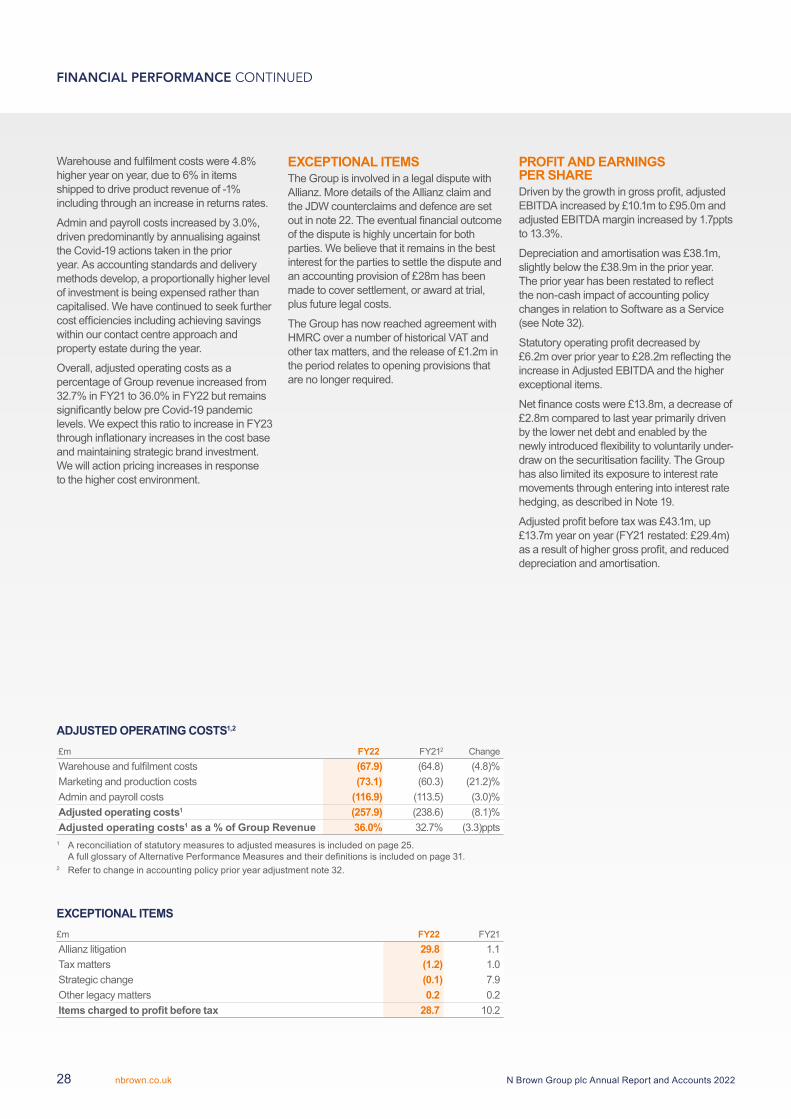
EXCEPTIONAL ITEMS£m FY22 FY21 Allianz litigation 29.8 1.1Taxmatters (1.2) 1.0Strategic change (0.1) 7.9Other legacy matters 0.2 0.2Items charged to profit before tax 28.7 10.2
Warehouseandfulfilmentcostswere4.8%higheryearonyear,dueto6%initemsshippedtodriveproductrevenueof-1%includingthroughanincreaseinreturnsrates.
Adminandpayrollcostsincreasedby3.0%,drivenpredominantlybyannualisingagainsttheCovid-19actionstakenintheprioryear.Asaccountingstandardsanddeliverymethodsdevelop,aproportionallyhigherlevelofinvestmentisbeingexpensedratherthancapitalised.Wehavecontinuedtoseekfurthercostefficienciesincludingachievingsavingswithinourcontactcentreapproachandpropertyestateduringtheyear.
Overall,adjustedoperatingcostsasapercentageofGrouprevenueincreasedfrom32.7%inFY21to36.0%inFY22butremainssignificantlybelowpreCovid-19pandemiclevels.WeexpectthisratiotoincreaseinFY23throughinflationaryincreasesinthecostbaseandmaintainingstrategicbrandinvestment.Wewillactionpricingincreasesinresponsetothehighercostenvironment.
EXCEPTIONAL ITEMS TheGroupisinvolvedinalegaldisputewithAllianz.MoredetailsoftheAllianzclaimandthe JDW counterclaims and defence are set outinnote22.Theeventualfinancialoutcomeofthedisputeishighlyuncertainforbothparties.Webelievethatitremainsinthebestinterestforthepartiestosettlethedisputeandanaccountingprovisionof£28mhasbeenmadetocoversettlement,orawardattrial,plusfuturelegalcosts.
TheGrouphasnowreachedagreementwithHMRC over a number of historical VAT and othertaxmatters,andthereleaseof£1.2mintheperiodrelatestoopeningprovisionsthatarenolongerrequired.
PROFIT AND EARNINGS PER SHARE Drivenbythegrowthingrossprofit,adjustedEBITDAincreasedby£10.1mto£95.0mandadjustedEBITDAmarginincreasedby1.7pptsto13.3%.
Depreciationandamortisationwas£38.1m,slightlybelowthe£38.9mintheprioryear.Theprioryearhasbeenrestatedtoreflectthenon-cashimpactofaccountingpolicychanges in relation to Software as a Service (seeNote32).
Statutoryoperatingprofitdecreasedby£6.2moverprioryearto£28.2mreflectingtheincreaseinAdjustedEBITDAandthehigherexceptionalitems.
Netfinancecostswere£13.8m,adecreaseof£2.8mcomparedtolastyearprimarilydrivenby the lower net debt and enabled by the newlyintroducedflexibilitytovoluntarilyunder-drawonthesecuritisationfacility.TheGrouphasalsolimiteditsexposuretointerestratemovements through entering into interest rate hedging,asdescribedinNote19.
Adjustedprofitbeforetaxwas£43.1m,up£13.7myearonyear(FY21restated:£29.4m)asaresultofhighergrossprofit,andreduceddepreciationandamortisation.
ADJUSTED OPERATING COSTS1,2
£m FY22 FY212 ChangeWarehouseandfulfilmentcosts (67.9) (64.8) (4.8)%Marketingandproductioncosts (73.1) (60.3) (21.2)%Adminandpayrollcosts (116.9) (113.5) (3.0)%Adjusted operating costs1 (257.9) (238.6) (8.1)%Adjusted operating costs1 as a % of Group Revenue 36.0% 32.7% (3.3)ppts
1 Areconciliationofstatutorymeasurestoadjustedmeasuresisincludedonpage25. AfullglossaryofAlternativePerformanceMeasuresandtheirdefinitionsisincludedonpage31.
2 Refertochangeinaccountingpolicyprioryearadjustmentnote32.
FINANCIAL PERFORMANCE CONTINUED
N Brown Group plc Annual Report and Accounts 202228 nbrown.co.uk
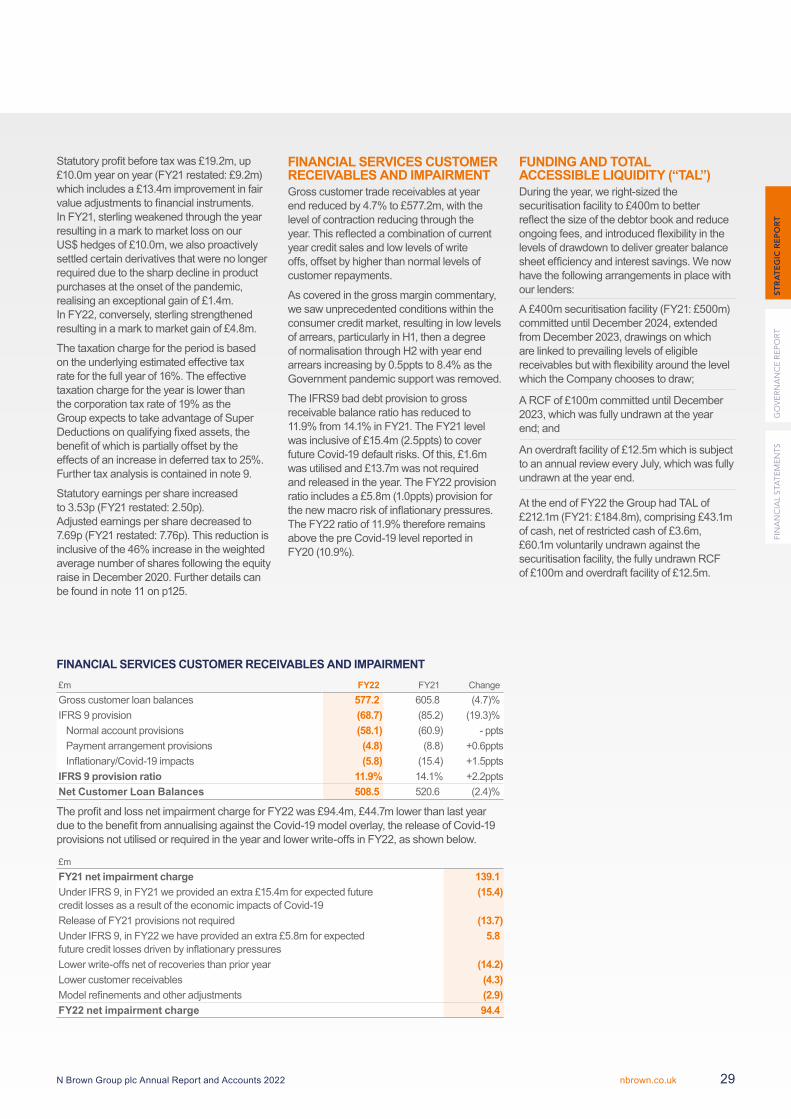
FINANCIAL SERVICES CUSTOMER RECEIVABLES AND IMPAIRMENT Gross customer trade receivables at year endreducedby4.7%to£577.2m,withthelevel of contraction reducing through the year.Thisreflectedacombinationofcurrentyear credit sales and low levels of write offs,offsetbyhigherthannormallevelsofcustomerrepayments.
Ascoveredinthegrossmargincommentary,wesawunprecedentedconditionswithintheconsumercreditmarket,resultinginlowlevelsofarrears,particularlyinH1,thenadegreeof normalisation through H2 with year end arrearsincreasingby0.5pptsto8.4%astheGovernmentpandemicsupportwasremoved.
TheIFRS9baddebtprovisiontogrossreceivable balance ratio has reduced to 11.9%from14.1%inFY21.TheFY21levelwasinclusiveof£15.4m(2.5ppts)tocoverfutureCovid-19defaultrisks.Ofthis,£1.6mwasutilisedand£13.7mwasnotrequiredandreleasedintheyear.TheFY22provisionratioincludesa£5.8m(1.0ppts)provisionforthenewmacroriskofinflationarypressures.TheFY22ratioof11.9%thereforeremainsabovethepreCovid-19levelreportedinFY20(10.9%).
FUNDING AND TOTAL ACCESSIBLE LIQUIDITY (“TAL”) Duringtheyear,weright-sizedthesecuritisation facility to £400m to better reflectthesizeofthedebtorbookandreduceongoingfees,andintroducedflexibilityinthelevels of drawdown to deliver greater balance sheetefficiencyandinterestsavings.Wenowhavethefollowingarrangementsinplacewithourlenders:
A£400msecuritisationfacility(FY21:£500m)committeduntilDecember2024,extendedfromDecember2023,drawingsonwhicharelinkedtoprevailinglevelsofeligiblereceivablesbutwithflexibilityaroundthelevelwhichtheCompanychoosestodraw;
A RCF of £100m committed until December 2023,whichwasfullyundrawnattheyearend;and
Anoverdraftfacilityof£12.5mwhichissubjecttoanannualrevieweveryJuly,whichwasfullyundrawnattheyearend.
AttheendofFY22theGrouphadTALof£212.1m(FY21:£184.8m),comprising£43.1mofcash,netofrestrictedcashof£3.6m,£60.1mvoluntarilyundrawnagainstthesecuritisationfacility,thefullyundrawnRCFof£100mandoverdraftfacilityof£12.5m.
Statutoryprofitbeforetaxwas£19.2m,up£10.0myearonyear(FY21restated:£9.2m)whichincludesa£13.4mimprovementinfairvalueadjustmentstofinancialinstruments.InFY21,sterlingweakenedthroughtheyearresulting in a mark to market loss on our US$hedgesof£10.0m,wealsoproactivelysettled certain derivatives that were no longer requiredduetothesharpdeclineinproductpurchasesattheonsetofthepandemic,realisinganexceptionalgainof£1.4m.InFY22,conversely,sterlingstrengthenedresultinginamarktomarketgainof£4.8m.
Thetaxationchargefortheperiodisbasedontheunderlyingestimatedeffectivetaxrateforthefullyearof16%.Theeffectivetaxationchargefortheyearislowerthanthecorporationtaxrateof19%astheGroupexpectstotakeadvantageofSuperDeductionsonqualifyingfixedassets,thebenefitofwhichispartiallyoffsetbytheeffectsofanincreaseindeferredtaxto25%.Furthertaxanalysisiscontainedinnote9.
Statutoryearningspershareincreasedto3.53p(FY21restated:2.50p).Adjustedearningspersharedecreasedto7.69p(FY21restated:7.76p).Thisreductionisinclusiveofthe46%increaseintheweightedaverage number of shares following the equity raiseinDecember2020.Furtherdetailscanbefoundinnote11onp125.
FINANCIAL SERVICES CUSTOMER RECEIVABLES AND IMPAIRMENT£m FY22 FY21 ChangeGross customer loan balances 577.2 605.8 (4.7)%IFRS9provision (68.7) (85.2) (19.3)%Normalaccountprovisions (58.1) (60.9) -pptsPaymentarrangementprovisions (4.8) (8.8) +0.6pptsInflationary/Covid-19impacts (5.8) (15.4) +1.5pptsIFRS 9 provision ratio 11.9% 14.1% +2.2pptsNet Customer Loan Balances 508.5 520.6 (2.4)%
TheprofitandlossnetimpairmentchargeforFY22was£94.4m,£44.7mlowerthanlastyearduetothebenefitfromannualisingagainsttheCovid-19modeloverlay,thereleaseofCovid-19provisionsnotutilisedorrequiredintheyearandlowerwrite-offsinFY22,asshownbelow.
£mFY21 net impairment charge 139.1UnderIFRS9,inFY21weprovidedanextra£15.4mforexpectedfuturecreditlossesasaresultoftheeconomicimpactsofCovid-19
(15.4)
ReleaseofFY21provisionsnotrequired (13.7)UnderIFRS9,inFY22wehaveprovidedanextra£5.8mforexpectedfuturecreditlossesdrivenbyinflationarypressures
5.8
Lowerwrite-offsnetofrecoveriesthanprioryear (14.2)Lower customer receivables (4.3)Modelrefinementsandotheradjustments (2.9)FY22 net impairment charge 94.4
FIN
AN
CIA
L S
TAT
EM
EN
TS
GO
VE
RN
AN
CE
RE
PO
RT
ST
RA
TE
GIC
RE
PO
RT
N Brown Group plc Annual Report and Accounts 2022 29nbrown.co.uk
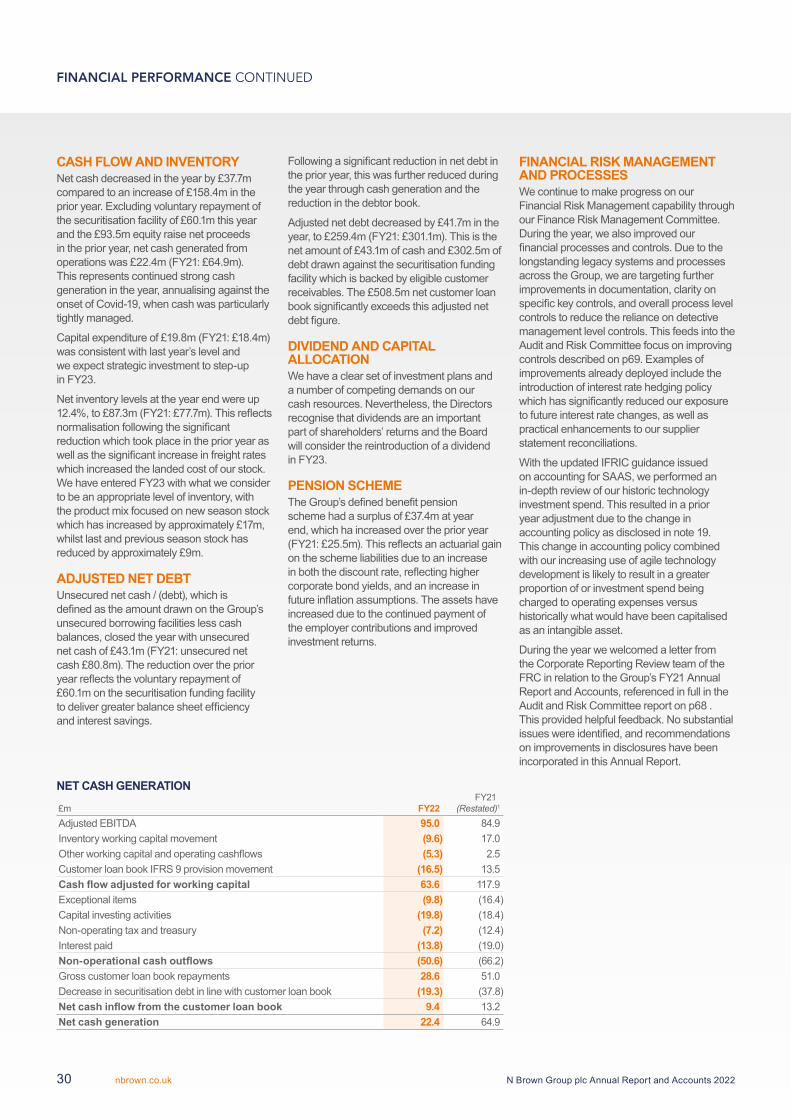
CASH FLOW AND INVENTORYNetcashdecreasedintheyearby£37.7mcomparedtoanincreaseof£158.4mintheprioryear.Excludingvoluntaryrepaymentofthesecuritisationfacilityof£60.1mthisyearandthe£93.5mequityraisenetproceedsintheprioryear,netcashgeneratedfromoperationswas£22.4m(FY21:£64.9m).Thisrepresentscontinuedstrongcashgenerationintheyear,annualisingagainsttheonsetofCovid-19,whencashwasparticularlytightlymanaged.
Capitalexpenditureof£19.8m(FY21:£18.4m)wasconsistentwithlastyear’slevelandweexpectstrategicinvestmenttostep-upinFY23.
Netinventorylevelsattheyearendwereup12.4%,to£87.3m(FY21:£77.7m).Thisreflectsnormalisationfollowingthesignificantreductionwhichtookplaceintheprioryearaswellasthesignificantincreaseinfreightrateswhichincreasedthelandedcostofourstock.WehaveenteredFY23withwhatweconsidertobeanappropriatelevelofinventory,withtheproductmixfocusedonnewseasonstockwhichhasincreasedbyapproximately£17m,whilstlastandpreviousseasonstockhasreducedbyapproximately£9m.
ADJUSTED NET DEBT Unsecurednetcash/(debt),whichisdefinedastheamountdrawnontheGroup’sunsecured borrowing facilities less cash balances,closedtheyearwithunsecurednetcashof£43.1m(FY21:unsecurednetcash£80.8m).Thereductionovertheprioryearreflectsthevoluntaryrepaymentof£60.1monthesecuritisationfundingfacilitytodelivergreaterbalancesheetefficiencyandinterestsavings.
Followingasignificantreductioninnetdebtintheprioryear,thiswasfurtherreducedduringthe year through cash generation and the reductioninthedebtorbook.
Adjustednetdebtdecreasedby£41.7mintheyear,to£259.4m(FY21:£301.1m).Thisisthenetamountof£43.1mofcashand£302.5mofdebt drawn against the securitisation funding facility which is backed by eligible customer receivables.The£508.5mnetcustomerloanbooksignificantlyexceedsthisadjustednetdebtfigure.
DIVIDEND AND CAPITAL ALLOCATIONWehaveaclearsetofinvestmentplansandanumberofcompetingdemandsonourcashresources.Nevertheless,theDirectorsrecognisethatdividendsareanimportantpartofshareholders’returnsandtheBoardwill consider the reintroduction of a dividend inFY23.
PENSION SCHEMETheGroup’sdefinedbenefitpensionschemehadasurplusof£37.4matyearend,whichhaincreasedovertheprioryear(FY21:£25.5m).Thisreflectsanactuarialgainon the scheme liabilities due to an increase inboththediscountrate,reflectinghighercorporatebondyields,andanincreaseinfutureinflationassumptions.Theassetshaveincreasedduetothecontinuedpaymentoftheemployercontributionsandimprovedinvestmentreturns.
FINANCIAL RISK MANAGEMENT AND PROCESSESWecontinuetomakeprogressonourFinancialRiskManagementcapabilitythroughourFinanceRiskManagementCommittee.Duringtheyear,wealsoimprovedourfinancialprocessesandcontrols.DuetothelongstandinglegacysystemsandprocessesacrosstheGroup,wearetargetingfurtherimprovementsindocumentation,clarityonspecifickeycontrols,andoverallprocesslevelcontrols to reduce the reliance on detective managementlevelcontrols.ThisfeedsintotheAuditandRiskCommitteefocusonimprovingcontrolsdescribedonp69.Examplesofimprovementsalreadydeployedincludetheintroductionofinterestratehedgingpolicywhichhassignificantlyreducedourexposuretofutureinterestratechanges,aswellaspracticalenhancementstooursupplierstatementreconciliations.
WiththeupdatedIFRICguidanceissuedonaccountingforSAAS,weperformedanin-depthreviewofourhistorictechnologyinvestmentspend.Thisresultedinaprioryearadjustmentduetothechangeinaccountingpolicyasdisclosedinnote19.Thischangeinaccountingpolicycombinedwith our increasing use of agile technology developmentislikelytoresultinagreaterproportionoforinvestmentspendbeingchargedtooperatingexpensesversushistoricallywhatwouldhavebeencapitalisedasanintangibleasset.
During the year we welcomed a letter from theCorporateReportingReviewteamoftheFRCinrelationtotheGroup’sFY21AnnualReportandAccounts,referencedinfullintheAuditandRiskCommitteereportonp68.Thisprovidedhelpfulfeedback.Nosubstantialissueswereidentified,andrecommendationsonimprovementsindisclosureshavebeenincorporatedinthisAnnualReport.
NET CASH GENERATION
£m FY22FY21
(Restated)1
AdjustedEBITDA 95.0 84.9Inventoryworkingcapitalmovement (9.6) 17.0Otherworkingcapitalandoperatingcashflows (5.3) 2.5CustomerloanbookIFRS9provisionmovement (16.5) 13.5Cash flow adjusted for working capital 63.6 117.9Exceptionalitems (9.8) (16.4)Capitalinvestingactivities (19.8) (18.4)Non-operatingtaxandtreasury (7.2) (12.4)Interestpaid (13.8) (19.0)Non-operational cash outflows (50.6) (66.2)Grosscustomerloanbookrepayments 28.6 51.0Decrease in securitisation debt in line with customer loan book (19.3) (37.8)Net cash inflow from the customer loan book 9.4 13.2Net cash generation 22.4 64.9
FINANCIAL PERFORMANCE CONTINUED
N Brown Group plc Annual Report and Accounts 202230 nbrown.co.uk
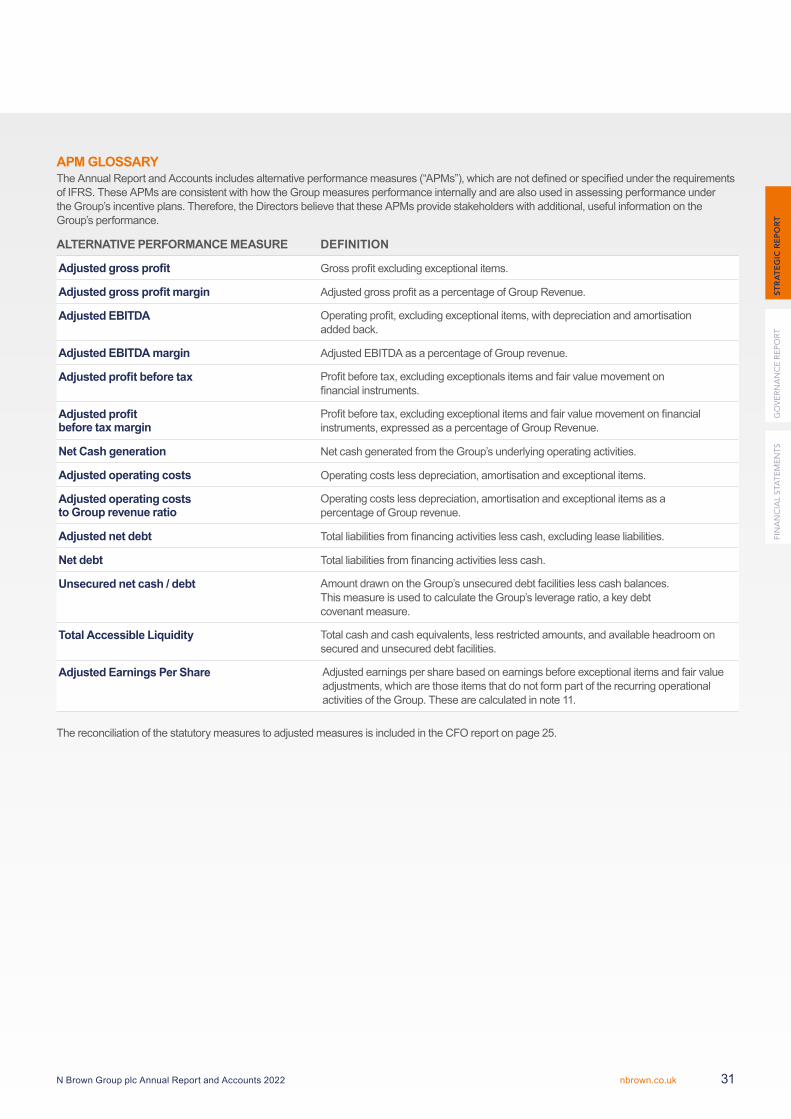
APM GLOSSARYTheAnnualReportandAccountsincludesalternativeperformancemeasures(“APMs”),whicharenotdefinedorspecifiedundertherequirementsofIFRS.TheseAPMsareconsistentwithhowtheGroupmeasuresperformanceinternallyandarealsousedinassessingperformanceundertheGroup’sincentiveplans.Therefore,theDirectorsbelievethattheseAPMsprovidestakeholderswithadditional,usefulinformationontheGroup’sperformance.
ALTERNATIVE PERFORMANCE MEASURE DEFINITION
Adjusted gross profit Grossprofitexcludingexceptionalitems.
Adjusted gross profit margin AdjustedgrossprofitasapercentageofGroupRevenue.
Adjusted EBITDA Operatingprofit,excludingexceptionalitems,withdepreciationandamortisationaddedback.
Adjusted EBITDA margin AdjustedEBITDAasapercentageofGrouprevenue.
Adjusted profit before tax Profitbeforetax,excludingexceptionalsitemsandfairvaluemovementonfinancialinstruments.
Adjusted profit before tax margin
Profitbeforetax,excludingexceptionalitemsandfairvaluemovementonfinancialinstruments,expressedasapercentageofGroupRevenue.
Net Cash generation NetcashgeneratedfromtheGroup’sunderlyingoperatingactivities.
Adjusted operating costs Operatingcostslessdepreciation,amortisationandexceptionalitems.
Adjusted operating costs to Group revenue ratio
Operatingcostslessdepreciation,amortisationandexceptionalitemsasapercentageofGrouprevenue.
Adjusted net debt Totalliabilitiesfromfinancingactivitieslesscash,excludingleaseliabilities.
Net debt Totalliabilitiesfromfinancingactivitieslesscash.
Unsecured net cash / debt AmountdrawnontheGroup’sunsecureddebtfacilitieslesscashbalances.ThismeasureisusedtocalculatetheGroup’sleverageratio,akeydebtcovenantmeasure.
Total Accessible Liquidity Totalcashandcashequivalents,lessrestrictedamounts,andavailableheadroomonsecuredandunsecureddebtfacilities.
Adjusted Earnings Per Share Adjustedearningspersharebasedonearningsbeforeexceptionalitemsandfairvalueadjustments,whicharethoseitemsthatdonotformpartoftherecurringoperationalactivitiesoftheGroup.Thesearecalculatedinnote11.
ThereconciliationofthestatutorymeasurestoadjustedmeasuresisincludedintheCFOreportonpage25.
FIN
AN
CIA
L S
TAT
EM
EN
TS
GO
VE
RN
AN
CE
RE
PO
RT
ST
RA
TE
GIC
RE
PO
RT
N Brown Group plc Annual Report and Accounts 2022 31nbrown.co.uk
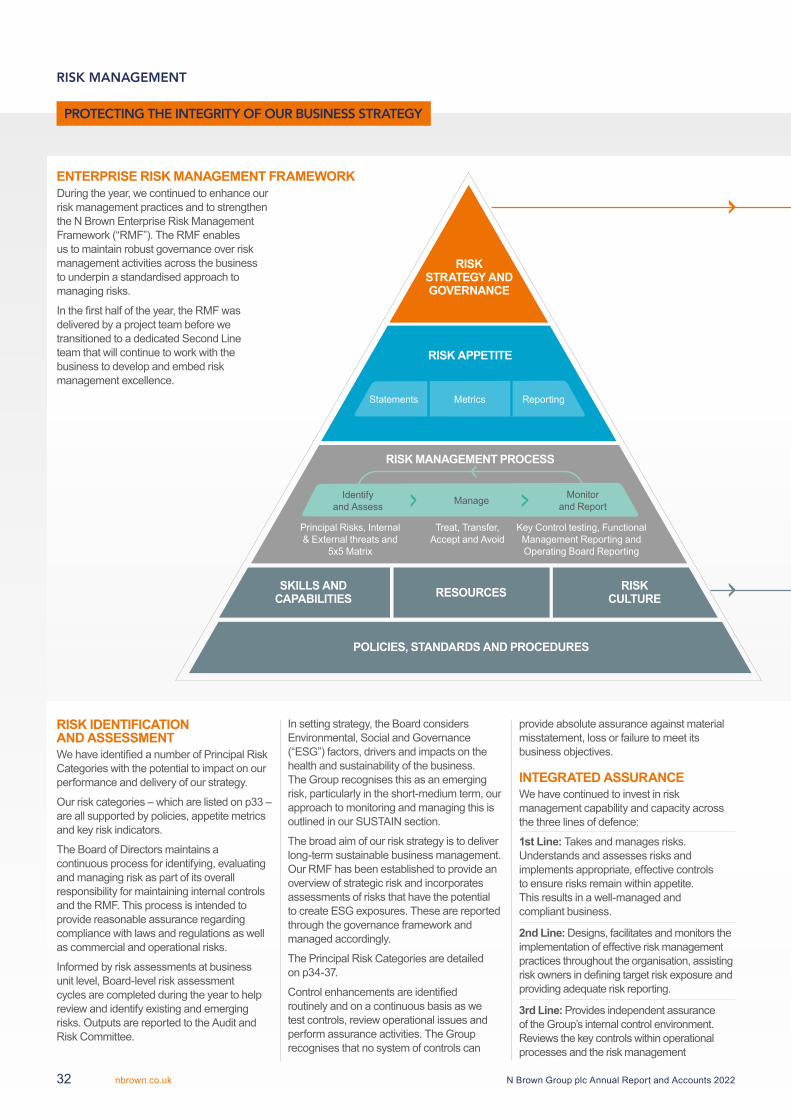
ENTERPRISE RISK MANAGEMENT FRAMEWORK During the year, we continued to enhance our risk management practices and to strengthen the N Brown Enterprise Risk Management Framework (“RMF”). The RMF enables us to maintain robust governance over risk management activities across the business to underpin a standardised approach to managing risks.
In the first half of the year, the RMF was delivered by a project team before we transitioned to a dedicated Second Line team that will continue to work with the business to develop and embed risk management excellence.
provide absolute assurance against material misstatement, loss or failure to meet its business objectives.
INTEGRATED ASSURANCE We have continued to invest in risk management capability and capacity across the three lines of defence:
1st Line: Takes and manages risks. Understands and assesses risks and implements appropriate, effective controls to ensure risks remain within appetite. This results in a well-managed and compliant business.
2nd Line: Designs, facilitates and monitors the implementation of effective risk management practices throughout the organisation, assisting risk owners in defining target risk exposure and providing adequate risk reporting.
3rd Line: Provides independent assurance of the Group’s internal control environment. Reviews the key controls within operational processes and the risk management
RISK IDENTIFICATION AND ASSESSMENTWe have identified a number of Principal Risk Categories with the potential to impact on our performance and delivery of our strategy.
Our risk categories – which are listed on p33 – are all supported by policies, appetite metrics and key risk indicators.
The Board of Directors maintains a continuous process for identifying, evaluating and managing risk as part of its overall responsibility for maintaining internal controls and the RMF. This process is intended to provide reasonable assurance regarding compliance with laws and regulations as well as commercial and operational risks.
Informed by risk assessments at business unit level, Board-level risk assessment cycles are completed during the year to help review and identify existing and emerging risks. Outputs are reported to the Audit and Risk Committee.
In setting strategy, the Board considers Environmental, Social and Governance (“ESG”) factors, drivers and impacts on the health and sustainability of the business. The Group recognises this as an emerging risk, particularly in the short-medium term, our approach to monitoring and managing this is outlined in our SUSTAIN section.
The broad aim of our risk strategy is to deliver long-term sustainable business management. Our RMF has been established to provide an overview of strategic risk and incorporates assessments of risks that have the potential to create ESG exposures. These are reported through the governance framework and managed accordingly.
The Principal Risk Categories are detailed on p34-37.
Control enhancements are identified routinely and on a continuous basis as we test controls, review operational issues and perform assurance activities. The Group recognises that no system of controls can
Principal Risks, Internal & External threats and
5x5 Matrix
Treat, Transfer, Accept and Avoid
Key Control testing, Functional Management Reporting and Operating Board Reporting
RISK STRATEGY AND GOVERNANCE
RISK APPETITE
SKILLS AND CAPABILITIES
POLICIES, STANDARDS AND PROCEDURES
RISK CULTURE
Statements ReportingMetrics
Identify and Assess Manage Monitor
and Report
RISK MANAGEMENT PROCESS
RESOURCES
PROTECTING THE INTEGRITY OF OUR BUSINESS STRATEGY
RISK MANAGEMENT
N Brown Group plc Annual Report and Accounts 202232 nbrown.co.uk
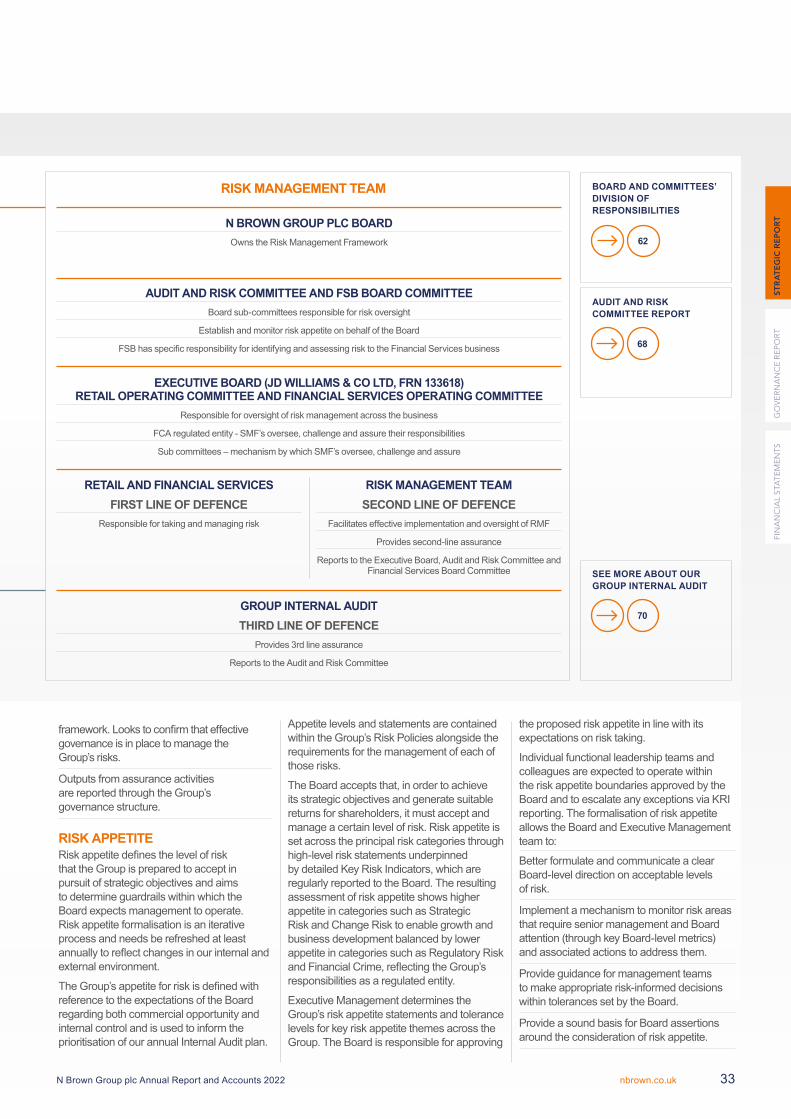
BOARD AND COMMITTEES’ DIVISION OF RESPONSIBILITIES
62
AUDIT AND RISK COMMITTEE REPORT
68
SEE MORE ABOUT OUR GROUP INTERNAL AUDIT
70
RISK MANAGEMENT TEAM
N BROWN GROUP PLC BOARDOwns the Risk Management Framework
AUDIT AND RISK COMMITTEE AND FSB BOARD COMMITTEE Board sub-committees responsible for risk oversight
Establish and monitor risk appetite on behalf of the Board
FSB has specific responsibility for identifying and assessing risk to the Financial Services business
EXECUTIVE BOARD (JD WILLIAMS & CO LTD, FRN 133618) RETAIL OPERATING COMMITTEE AND FINANCIAL SERVICES OPERATING COMMITTEE
Responsible for oversight of risk management across the business
FCA regulated entity - SMF’s oversee, challenge and assure their responsibilities
Sub committees – mechanism by which SMF’s oversee, challenge and assure
RETAIL AND FINANCIAL SERVICESFIRST LINE OF DEFENCE
Responsible for taking and managing risk
RISK MANAGEMENT TEAM SECOND LINE OF DEFENCE
Facilitates effective implementation and oversight of RMF
Provides second-line assurance
Reports to the Executive Board, Audit and Risk Committee and Financial Services Board Committee
GROUP INTERNAL AUDITTHIRD LINE OF DEFENCE
Provides 3rd line assurance
Reports to the Audit and Risk Committee
framework. Looks to confirm that effective governance is in place to manage the Group’s risks.
Outputs from assurance activities are reported through the Group’s governance structure.
RISK APPETITE Risk appetite defines the level of risk that the Group is prepared to accept in pursuit of strategic objectives and aims to determine guardrails within which the Board expects management to operate. Risk appetite formalisation is an iterative process and needs be refreshed at least annually to reflect changes in our internal and external environment.
The Group’s appetite for risk is defined with reference to the expectations of the Board regarding both commercial opportunity and internal control and is used to inform the prioritisation of our annual Internal Audit plan.
Appetite levels and statements are contained within the Group’s Risk Policies alongside the requirements for the management of each of those risks.
The Board accepts that, in order to achieve its strategic objectives and generate suitable returns for shareholders, it must accept and manage a certain level of risk. Risk appetite is set across the principal risk categories through high-level risk statements underpinned by detailed Key Risk Indicators, which are regularly reported to the Board. The resulting assessment of risk appetite shows higher appetite in categories such as Strategic Risk and Change Risk to enable growth and business development balanced by lower appetite in categories such as Regulatory Risk and Financial Crime, reflecting the Group’s responsibilities as a regulated entity.
Executive Management determines the Group’s risk appetite statements and tolerance levels for key risk appetite themes across the Group. The Board is responsible for approving
the proposed risk appetite in line with its expectations on risk taking.
Individual functional leadership teams and colleagues are expected to operate within the risk appetite boundaries approved by the Board and to escalate any exceptions via KRI reporting. The formalisation of risk appetite allows the Board and Executive Management team to:
Better formulate and communicate a clear Board-level direction on acceptable levels of risk.
Implement a mechanism to monitor risk areas that require senior management and Board attention (through key Board-level metrics) and associated actions to address them.
Provide guidance for management teams to make appropriate risk-informed decisions within tolerances set by the Board.
Provide a sound basis for Board assertions around the consideration of risk appetite.
FIN
AN
CIA
L S
TAT
EM
EN
TS
GO
VE
RN
AN
CE
RE
PO
RT
ST
RA
TE
GIC
RE
PO
RT
N Brown Group plc Annual Report and Accounts 2022 33nbrown.co.uk
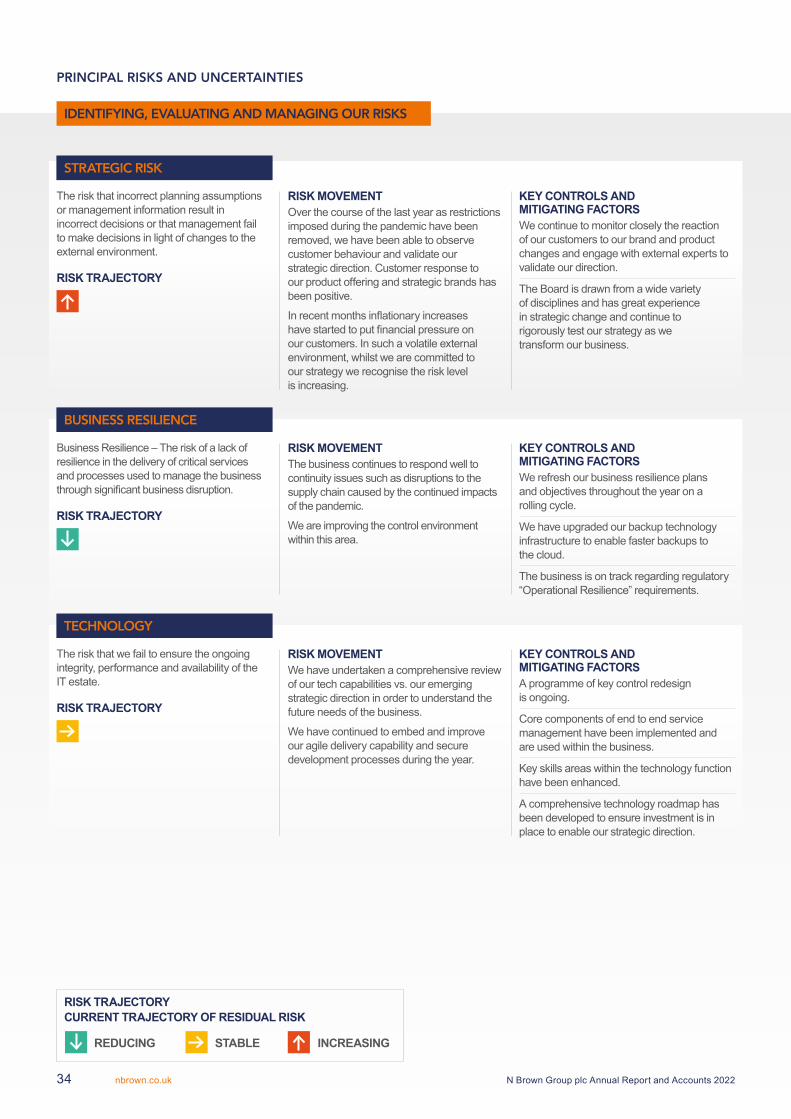
The risk that incorrect planning assumptions or management information result in incorrect decisions or that management fail to make decisions in light of changes to the external environment.
RISK TRAJECTORY
RISK MOVEMENTOver the course of the last year as restrictions imposed during the pandemic have been removed, we have been able to observe customer behaviour and validate our strategic direction. Customer response to our product offering and strategic brands has been positive.
In recent months inflationary increases have started to put financial pressure on our customers. In such a volatile external environment, whilst we are committed to our strategy we recognise the risk level is increasing.
KEY CONTROLS AND MITIGATING FACTORSWe continue to monitor closely the reaction of our customers to our brand and product changes and engage with external experts to validate our direction.
The Board is drawn from a wide variety of disciplines and has great experience in strategic change and continue to rigorously test our strategy as we transform our business.
Business Resilience – The risk of a lack of resilience in the delivery of critical services and processes used to manage the business through significant business disruption.
RISK TRAJECTORY
RISK MOVEMENTThe business continues to respond well to continuity issues such as disruptions to the supply chain caused by the continued impacts of the pandemic.
We are improving the control environment within this area.
KEY CONTROLS AND MITIGATING FACTORSWe refresh our business resilience plans and objectives throughout the year on a rolling cycle.
We have upgraded our backup technology infrastructure to enable faster backups to the cloud.
The business is on track regarding regulatory “Operational Resilience” requirements.
The risk that we fail to ensure the ongoing integrity, performance and availability of the IT estate.
RISK TRAJECTORY
RISK MOVEMENTWe have undertaken a comprehensive review of our tech capabilities vs. our emerging strategic direction in order to understand the future needs of the business.
We have continued to embed and improve our agile delivery capability and secure development processes during the year.
KEY CONTROLS AND MITIGATING FACTORSA programme of key control redesign is ongoing.
Core components of end to end service management have been implemented and are used within the business.
Key skills areas within the technology function have been enhanced.
A comprehensive technology roadmap has been developed to ensure investment is in place to enable our strategic direction.
RISK TRAJECTORY CURRENT TRAJECTORY OF RESIDUAL RISK
REDUCING STABLE INCREASING
IDENTIFYING, EVALUATING AND MANAGING OUR RISKS
PRINCIPAL RISKS AND UNCERTAINTIES
TECHNOLOGY
STRATEGIC RISK
BUSINESS RESILIENCE
N Brown Group plc Annual Report and Accounts 202234 nbrown.co.uk
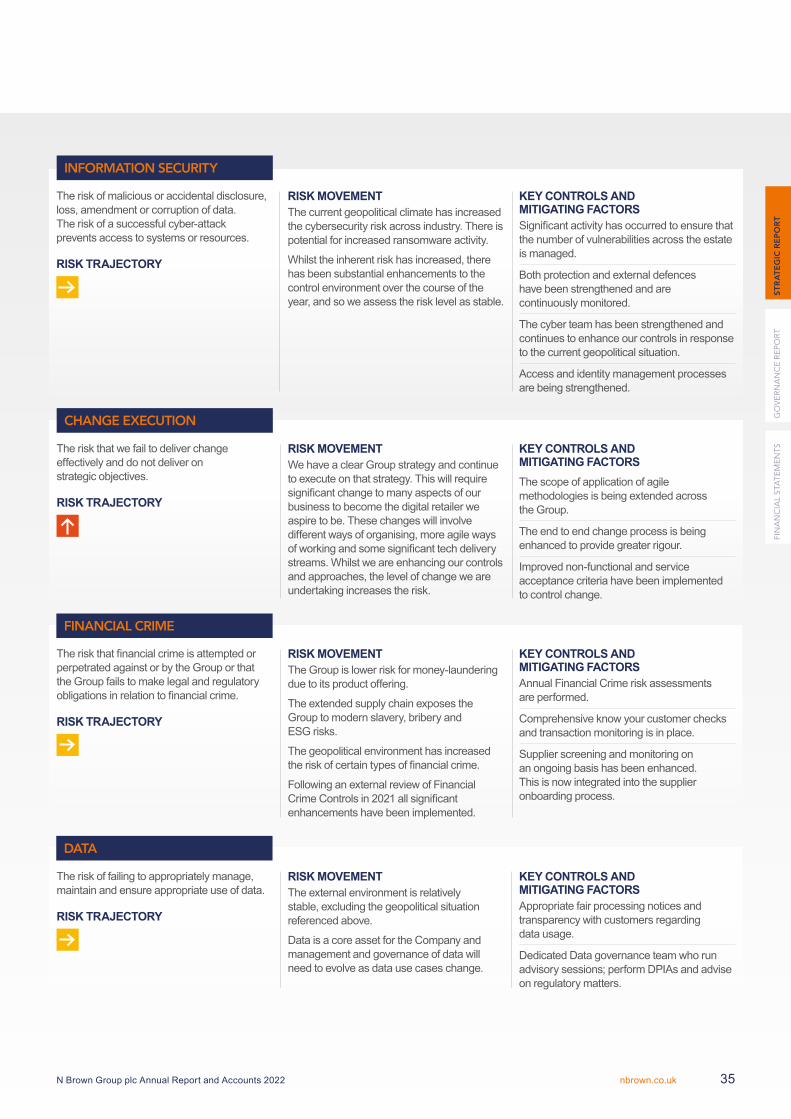
FINANCIAL CRIME
The risk that financial crime is attempted or perpetrated against or by the Group or that the Group fails to make legal and regulatory obligations in relation to financial crime.
RISK TRAJECTORY
RISK MOVEMENTThe Group is lower risk for money-laundering due to its product offering.
The extended supply chain exposes the Group to modern slavery, bribery and ESG risks.
The geopolitical environment has increased the risk of certain types of financial crime.
Following an external review of Financial Crime Controls in 2021 all significant enhancements have been implemented.
KEY CONTROLS AND MITIGATING FACTORSAnnual Financial Crime risk assessments are performed.
Comprehensive know your customer checks and transaction monitoring is in place.
Supplier screening and monitoring on an ongoing basis has been enhanced. This is now integrated into the supplier onboarding process.
The risk of failing to appropriately manage, maintain and ensure appropriate use of data.
RISK TRAJECTORY
RISK MOVEMENTThe external environment is relatively stable, excluding the geopolitical situation referenced above.
Data is a core asset for the Company and management and governance of data will need to evolve as data use cases change.
KEY CONTROLS AND MITIGATING FACTORSAppropriate fair processing notices and transparency with customers regarding data usage.
Dedicated Data governance team who run advisory sessions; perform DPIAs and advise on regulatory matters.
The risk that we fail to deliver change effectively and do not deliver on strategic objectives.
RISK TRAJECTORY
RISK MOVEMENTWe have a clear Group strategy and continue to execute on that strategy. This will require significant change to many aspects of our business to become the digital retailer we aspire to be. These changes will involve different ways of organising, more agile ways of working and some significant tech delivery streams. Whilst we are enhancing our controls and approaches, the level of change we are undertaking increases the risk.
KEY CONTROLS AND MITIGATING FACTORSThe scope of application of agile methodologies is being extended across the Group.
The end to end change process is being enhanced to provide greater rigour.
Improved non-functional and service acceptance criteria have been implemented to control change.
The risk of malicious or accidental disclosure, loss, amendment or corruption of data. The risk of a successful cyber-attack prevents access to systems or resources.
RISK TRAJECTORY
RISK MOVEMENTThe current geopolitical climate has increased the cybersecurity risk across industry. There is potential for increased ransomware activity.
Whilst the inherent risk has increased, there has been substantial enhancements to the control environment over the course of the year, and so we assess the risk level as stable.
KEY CONTROLS AND MITIGATING FACTORSSignificant activity has occurred to ensure that the number of vulnerabilities across the estate is managed.
Both protection and external defences have been strengthened and are continuously monitored.
The cyber team has been strengthened and continues to enhance our controls in response to the current geopolitical situation.
Access and identity management processes are being strengthened.
INFORMATION SECURITY
CHANGE EXECUTION
DATA
FIN
AN
CIA
L S
TAT
EM
EN
TS
GO
VE
RN
AN
CE
RE
PO
RT
ST
RA
TE
GIC
RE
PO
RT
N Brown Group plc Annual Report and Accounts 2022 35nbrown.co.uk
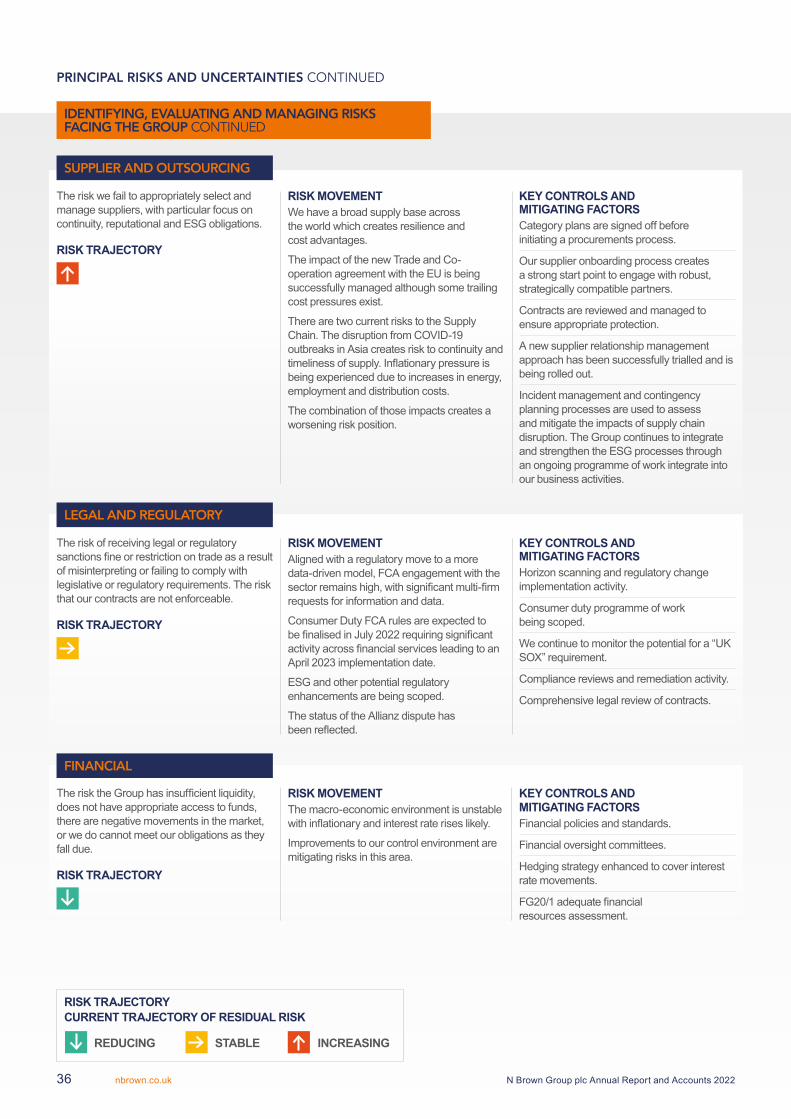
The risk the Group has insufficient liquidity, does not have appropriate access to funds, there are negative movements in the market, or we do cannot meet our obligations as they fall due.
RISK TRAJECTORY
RISK MOVEMENTThe macro-economic environment is unstable with inflationary and interest rate rises likely.
Improvements to our control environment are mitigating risks in this area.
KEY CONTROLS AND MITIGATING FACTORSFinancial policies and standards.
Financial oversight committees.
Hedging strategy enhanced to cover interest rate movements.
FG20/1 adequate financial resources assessment.
The risk we fail to appropriately select and manage suppliers, with particular focus on continuity, reputational and ESG obligations.
RISK TRAJECTORY
RISK MOVEMENTWe have a broad supply base across the world which creates resilience and cost advantages.
The impact of the new Trade and Co-operation agreement with the EU is being successfully managed although some trailing cost pressures exist.
There are two current risks to the Supply Chain. The disruption from COVID-19 outbreaks in Asia creates risk to continuity and timeliness of supply. Inflationary pressure is being experienced due to increases in energy, employment and distribution costs.
The combination of those impacts creates a worsening risk position.
KEY CONTROLS AND MITIGATING FACTORSCategory plans are signed off before initiating a procurements process.
Our supplier onboarding process creates a strong start point to engage with robust, strategically compatible partners.
Contracts are reviewed and managed to ensure appropriate protection.
A new supplier relationship management approach has been successfully trialled and is being rolled out.
Incident management and contingency planning processes are used to assess and mitigate the impacts of supply chain disruption. The Group continues to integrate and strengthen the ESG processes through an ongoing programme of work integrate into our business activities.
The risk of receiving legal or regulatory sanctions fine or restriction on trade as a result of misinterpreting or failing to comply with legislative or regulatory requirements. The risk that our contracts are not enforceable.
RISK TRAJECTORY
RISK MOVEMENTAligned with a regulatory move to a more data-driven model, FCA engagement with the sector remains high, with significant multi-firm requests for information and data.
Consumer Duty FCA rules are expected to be finalised in July 2022 requiring significant activity across financial services leading to an April 2023 implementation date.
ESG and other potential regulatory enhancements are being scoped.
The status of the Allianz dispute has been reflected.
KEY CONTROLS AND MITIGATING FACTORSHorizon scanning and regulatory change implementation activity.
Consumer duty programme of work being scoped.
We continue to monitor the potential for a “UK SOX” requirement.
Compliance reviews and remediation activity.
Comprehensive legal review of contracts.
RISK TRAJECTORY CURRENT TRAJECTORY OF RESIDUAL RISK
REDUCING STABLE INCREASING
IDENTIFYING, EVALUATING AND MANAGING RISKS FACING THE GROUP CONTINUED
PRINCIPAL RISKS AND UNCERTAINTIES CONTINUED
FINANCIAL
SUPPLIER AND OUTSOURCING
LEGAL AND REGULATORY
N Brown Group plc Annual Report and Accounts 202236 nbrown.co.uk
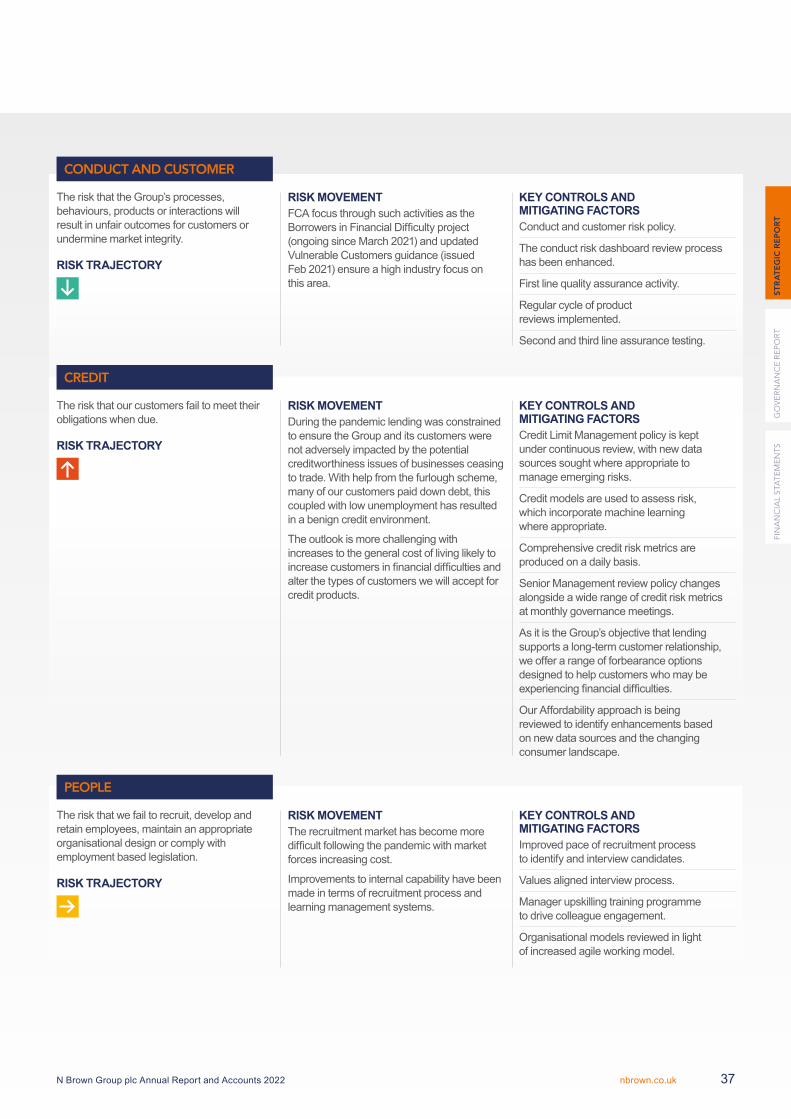
CONDUCT AND CUSTOMER
The risk that our customers fail to meet their obligations when due.
RISK TRAJECTORY
RISK MOVEMENTDuring the pandemic lending was constrained to ensure the Group and its customers were not adversely impacted by the potential creditworthiness issues of businesses ceasing to trade. With help from the furlough scheme, many of our customers paid down debt, this coupled with low unemployment has resulted in a benign credit environment.
The outlook is more challenging with increases to the general cost of living likely to increase customers in financial difficulties and alter the types of customers we will accept for credit products.
KEY CONTROLS AND MITIGATING FACTORSCredit Limit Management policy is kept under continuous review, with new data sources sought where appropriate to manage emerging risks.
Credit models are used to assess risk, which incorporate machine learning where appropriate.
Comprehensive credit risk metrics are produced on a daily basis.
Senior Management review policy changes alongside a wide range of credit risk metrics at monthly governance meetings.
As it is the Group’s objective that lending supports a long-term customer relationship, we offer a range of forbearance options designed to help customers who may be experiencing financial difficulties.
Our Affordability approach is being reviewed to identify enhancements based on new data sources and the changing consumer landscape.
The risk that we fail to recruit, develop and retain employees, maintain an appropriate organisational design or comply with employment based legislation.
RISK TRAJECTORY
RISK MOVEMENTThe recruitment market has become more difficult following the pandemic with market forces increasing cost.
Improvements to internal capability have been made in terms of recruitment process and learning management systems.
KEY CONTROLS AND MITIGATING FACTORSImproved pace of recruitment process to identify and interview candidates.
Values aligned interview process.
Manager upskilling training programme to drive colleague engagement.
Organisational models reviewed in light of increased agile working model.
The risk that the Group’s processes, behaviours, products or interactions will result in unfair outcomes for customers or undermine market integrity.
RISK TRAJECTORY
RISK MOVEMENTFCA focus through such activities as the Borrowers in Financial Difficulty project (ongoing since March 2021) and updated Vulnerable Customers guidance (issued Feb 2021) ensure a high industry focus on this area.
KEY CONTROLS AND MITIGATING FACTORSConduct and customer risk policy.
The conduct risk dashboard review process has been enhanced.
First line quality assurance activity.
Regular cycle of product reviews implemented.
Second and third line assurance testing.
CREDIT
PEOPLEFI
NA
NC
IAL
STA
TE
ME
NT
SG
OV
ER
NA
NC
E R
EP
OR
T S
TR
AT
EG
IC R
EP
OR
T
N Brown Group plc Annual Report and Accounts 2022 37nbrown.co.uk
DECISION-MAKING BY THE BOARD The Directors take all factors into account before making informed decisions. The fair treatment of relevant stakeholders is always considered, although the Board acknowledges that not every outcome will always benefit each stakeholder group.
Decision-making by the Board balances the need to generate sufficient profit in order to sustain the business commercially against the needs of our various stakeholders and, ultimately, the long-term sustainable success of the Company.
We are committed to maintaining the highest standards of business conduct; each and every decision of the Board is made on the basis of best ethical practice.
SHAREHOLDERS AND INVESTORS Investors play a major and vital role in the success of the Company; they are the providers of capital without whom we could not grow or invest for future development.
We engage with our shareholders and investors via:
The Company’s Annual General Meeting.
Meetings with shareholders and proxy advisors.
Presentations to Investors.
Publication of Stock Exchange announcements, press releases, trading results and statements and annual reports.
76Further information about our engagement with shareholders can be found on p76.
N Brown Group plc Annual Report and Accounts 2022
CUSTOMERS We continue to be obsessed with our customers and work hard to delight them with products, services and finance to fit their lives.
We regularly engage with our customers, both proactively and reactively, via:
Market research groups.
Net Promoter Scoring and customer services reports.
Engagement across social media and Customer Services channels.
Section 172(1) of the Companies Act 2006 states that the Directors of a company must act in the way they consider, in good faith, would most likely promote the success of the Company for the benefit of its members as a whole and in doing so have regard, in addition to other matters, to:
The likely long-term consequences of decisions.
The interests of the Company’s employees.
The need to foster the Company’s business relationships with suppliers, customers and others.
The impact of the Company’s operations on the community and the environment.
The desirability of the Company maintaining a reputation for high standards of business conduct.
The need to act fairly as between the Company’s owners.
The Board is mindful that our success relies on our ability to engage meaningfully with stakeholders, taking their views into account when making decisions on behalf of the Company. By understanding our stakeholders, we can ensure that an appropriately diverse range of needs and concerns is considered in both the day-to-day running of the business as well as in our longer-term strategy.
Methods and level of engagement vary according to the stakeholder group being addressed and involve the Group Board, Executive Board, senior leadership team and colleagues as required. The Company engages both proactively and reactively with stakeholders.
While the impact of Covid-19 remained challenging during FY22, the Board has engaged with stakeholders on a number of principal matters across a variety of forums and is proud to report on these activities in its Section 172 Statement.
ENGAGEMENT WITH STAKEHOLDERS
SECTION 172 STATEMENT
N Brown Group plc Annual Report and Accounts 202238 nbrown.co.uk
COLLEAGUES Our colleagues are our single most important asset – we simply could not succeed without their relentless energy, expertise and passion.
While communication with colleagues fundamentally shifted during the Covid-19 pandemic, regular engagement has taken place across a variety of platforms including:
The Colleague Forum – The Culture Club.
Colleague Voice – bi-annual engagement surveys and monthly pulse surveys.
EXEC Sessions – Coffee with colleagues.
Colleague recognition and long service awards.
Colleague conversations – performance and feedback sessions.
Division Huddles and Team meetings.
Daily emails from Internal Comms.
Weekly Company-wide newsletter.
Our Company-wide intranet.
N Brown Group plc Annual Report and Accounts 2022 nbrown.co.uk
SUPPLIERS Suppliers are the key links in the sourcing, development and delivery of products to our customers. They support us across every aspect of our operations and are crucial to the successful delivery of our business model.
We have continued to support our suppliers and the wider supply chain throughout the Covid-19 pandemic.
45Further information about our engagement with suppliers can be found on p45.
TRADE AND INDUSTRY BODIES Constructive engagement with trade and industry bodies is a primary channel which enables us to support the sustainable, ethical and responsible growth of the retail industry.
We engage directly with and are part of a number of bodies including:
The ASAS Transparency Pledge.
Action Collaboration and Transformation – Living Wage.
Ethical Trading Initiative.
2018 Transition ACCORD/RSC Bangladesh.
UN Global Compact.
Finance Leasing Association.
Cifas.
45Further information about our engagement with trade and industry bodies can be found on p45.
COMMUNITY AND THE ENVIRONMENT We have always strived to foster positive change across all aspects of our local and global communities, and continue to support and encourage sustainable practices throughout our business operations.
40Further information about our engagement with colleagues can be found on p40.
45Further information about our engagement with charities and our work on Environmental, Social Governance can be found on p45.
FIN
AN
CIA
L S
TAT
EM
EN
TS
GO
VE
RN
AN
CE
RE
PO
RT
ST
RA
TE
GIC
RE
PO
RT
N Brown Group plc Annual Report and Accounts 2022 39nbrown.co.uk
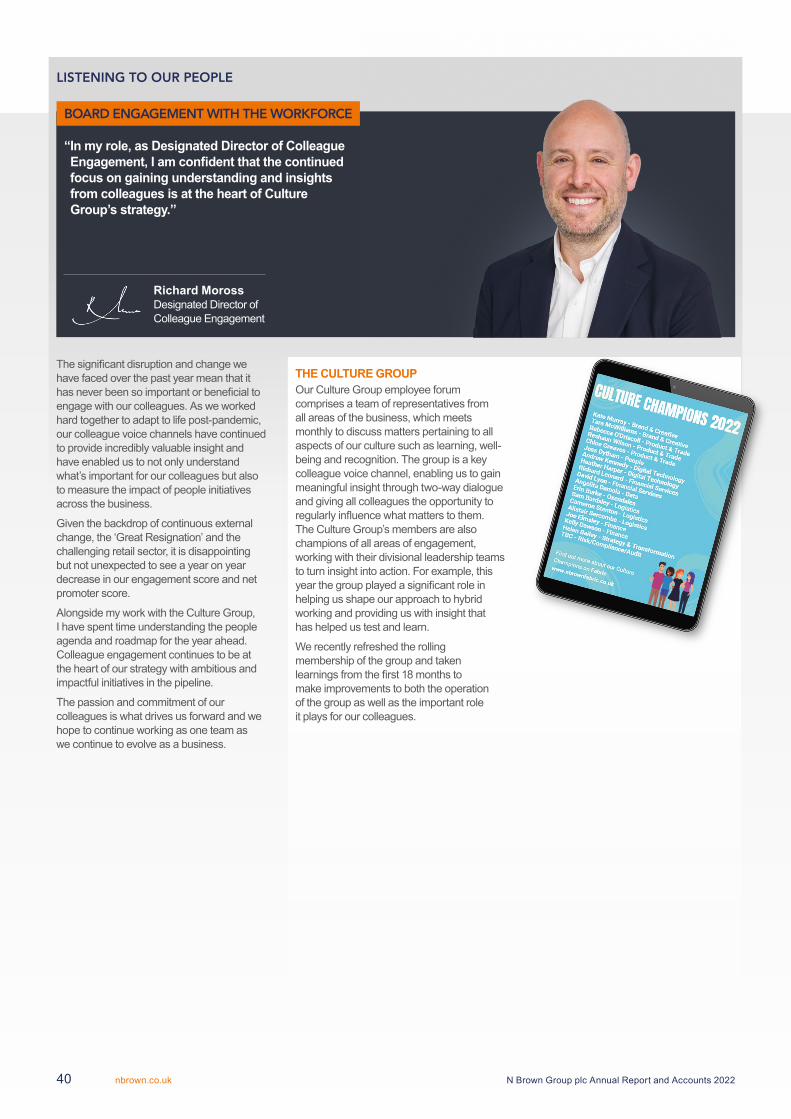
The significant disruption and change we have faced over the past year mean that it has never been so important or beneficial to engage with our colleagues. As we worked hard together to adapt to life post-pandemic, our colleague voice channels have continued to provide incredibly valuable insight and have enabled us to not only understand what’s important for our colleagues but also to measure the impact of people initiatives across the business.
Given the backdrop of continuous external change, the ‘Great Resignation’ and the challenging retail sector, it is disappointing but not unexpected to see a year on year decrease in our engagement score and net promoter score.
Alongside my work with the Culture Group, I have spent time understanding the people agenda and roadmap for the year ahead. Colleague engagement continues to be at the heart of our strategy with ambitious and impactful initiatives in the pipeline.
The passion and commitment of our colleagues is what drives us forward and we hope to continue working as one team as we continue to evolve as a business.
“ In my role, as Designated Director of Colleague Engagement, I am confident that the continued focus on gaining understanding and insights from colleagues is at the heart of Culture Group’s strategy.”
THE CULTURE GROUPOur Culture Group employee forum comprises a team of representatives from all areas of the business, which meets monthly to discuss matters pertaining to all aspects of our culture such as learning, well-being and recognition. The group is a key colleague voice channel, enabling us to gain meaningful insight through two-way dialogue and giving all colleagues the opportunity to regularly influence what matters to them. The Culture Group’s members are also champions of all areas of engagement, working with their divisional leadership teams to turn insight into action. For example, this year the group played a significant role in helping us shape our approach to hybrid working and providing us with insight that has helped us test and learn.
We recently refreshed the rolling membership of the group and taken learnings from the first 18 months to make improvements to both the operation of the group as well as the important role it plays for our colleagues.
Richard Moross Designated Director of Colleague Engagement
LISTENING TO OUR PEOPLE
BOARD ENGAGEMENT WITH THE WORKFORCE
N Brown Group plc Annual Report and Accounts 202240 nbrown.co.uk
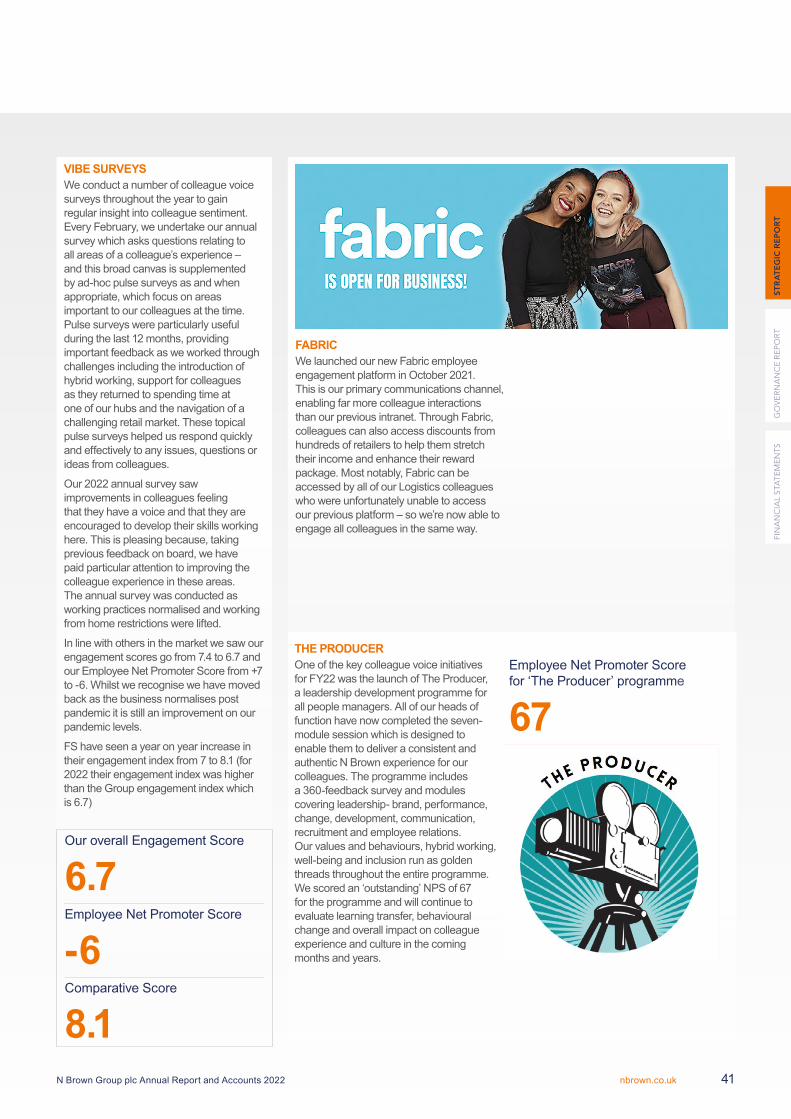
Employee Net Promoter Score for ‘The Producer’ programme
67
VIBE SURVEYSWe conduct a number of colleague voice surveys throughout the year to gain regular insight into colleague sentiment. Every February, we undertake our annual survey which asks questions relating to all areas of a colleague’s experience – and this broad canvas is supplemented by ad-hoc pulse surveys as and when appropriate, which focus on areas important to our colleagues at the time. Pulse surveys were particularly useful during the last 12 months, providing important feedback as we worked through challenges including the introduction of hybrid working, support for colleagues as they returned to spending time at one of our hubs and the navigation of a challenging retail market. These topical pulse surveys helped us respond quickly and effectively to any issues, questions or ideas from colleagues.
Our 2022 annual survey saw improvements in colleagues feeling that they have a voice and that they are encouraged to develop their skills working here. This is pleasing because, taking previous feedback on board, we have paid particular attention to improving the colleague experience in these areas. The annual survey was conducted as working practices normalised and working from home restrictions were lifted.
In line with others in the market we saw our engagement scores go from 7.4 to 6.7 and our Employee Net Promoter Score from +7 to -6. Whilst we recognise we have moved back as the business normalises post pandemic it is still an improvement on our pandemic levels.
FS have seen a year on year increase in their engagement index from 7 to 8.1 (for 2022 their engagement index was higher than the Group engagement index which is 6.7)
FABRICWe launched our new Fabric employee engagement platform in October 2021. This is our primary communications channel, enabling far more colleague interactions than our previous intranet. Through Fabric, colleagues can also access discounts from hundreds of retailers to help them stretch their income and enhance their reward package. Most notably, Fabric can be accessed by all of our Logistics colleagues who were unfortunately unable to access our previous platform – so we’re now able to engage all colleagues in the same way.
THE PRODUCEROne of the key colleague voice initiatives for FY22 was the launch of The Producer, a leadership development programme for all people managers. All of our heads of function have now completed the seven-module session which is designed to enable them to deliver a consistent and authentic N Brown experience for our colleagues. The programme includes a 360-feedback survey and modules covering leadership- brand, performance, change, development, communication, recruitment and employee relations. Our values and behaviours, hybrid working, well-being and inclusion run as golden threads throughout the entire programme. We scored an ‘outstanding’ NPS of 67 for the programme and will continue to evaluate learning transfer, behavioural change and overall impact on colleague experience and culture in the coming months and years.
Our overall Engagement Score
6.7Employee Net Promoter Score
-6Comparative Score
8.1
FIN
AN
CIA
L S
TAT
EM
EN
TS
GO
VE
RN
AN
CE
RE
PO
RT
ST
RA
TE
GIC
RE
PO
RT
N Brown Group plc Annual Report and Accounts 2022 41nbrown.co.uk
CHARITIES AND OUR COMMUNITIES
45
In FY22, N Brown continued to build momentum in its Environmental, Social and Governance strategy. SUSTAIN continues to fully align our ethical policies with our commercial activities across our sustainability pillars, Our People and Our Planet. We are pleased to have beaten both our sustainability and Green House Gas (“GHG”) emissions targets for FY22. Other key highlights throughout the year include the successful achievement of the 2030 Scope 2 Target for Net Zero emissions from purchased electricity of the British Retail Consortium (“BRC”) Climate Action Roadmap for the second year running. New EV charging points were added to all our sites and policy of zero waste to landfill been maintained from UK operations.
We have actively supported our communities throughout the year and have achieved our fundraising target with our charity partner, Maggies. Jacamo also successfully launched a partnership with the charity Campaign Against Living Miserably (“CALM”). Wellbeing for our colleagues has also been a key focus and we now have over 33 fully accredited mental health champions in the business. Strong ongoing support has been given for early-stage careers and there has been a focus on increasing social inclusion. We have supported the Kickstart scheme by recruiting 37 young people during the year with four entering permanent employment with us. Information on the activities carried out in the year can be found on page 46.
MESSAGE FROM MICHAEL ROSS
We value the close relationships we have with all our partners and industry bodies including the BRC, Textile 2030, Better Cotton Initiative, and our delivery partner Evri. Evri have made several ambitious commitments as part of their ESG strategy, and we are working with them to evaluate how these link to our Scope 3 savings in the future.
Looking forward to 2023, we will be focused on embedding our ESG strategy deeper into the business and delivering on our stretching ESG targets. We plan to develop a more integrated diversity, equity and inclusion programme and further strengthen our approach to charity and Our Community. Governance will also be a key focus as we get ready to implement Task Force on Climate Related Financial Disclosures (“TCFD”).
I am available to speak with shareholders at any time via the Company Secretary and shall be available at the Annual General Meeting on 7 July 2022 to answer any questions you may have on this report. I look forward to reporting on our progress in relation to the priorities outlined above in the next Annual Report.
“ N Brown continues to make a meaningful impact in driving sustainability and reducing emissions. FY23 will see increased focus on people and communities and further embedding of ESG into governance and strategy.”
MICHAEL ROSS Chair of the ESG Committee
SUSTAIN – FOR TODAY, FOR TOMORROW, FOREVER
N Brown Group plc Annual Report and Accounts 202242 nbrown.co.uk
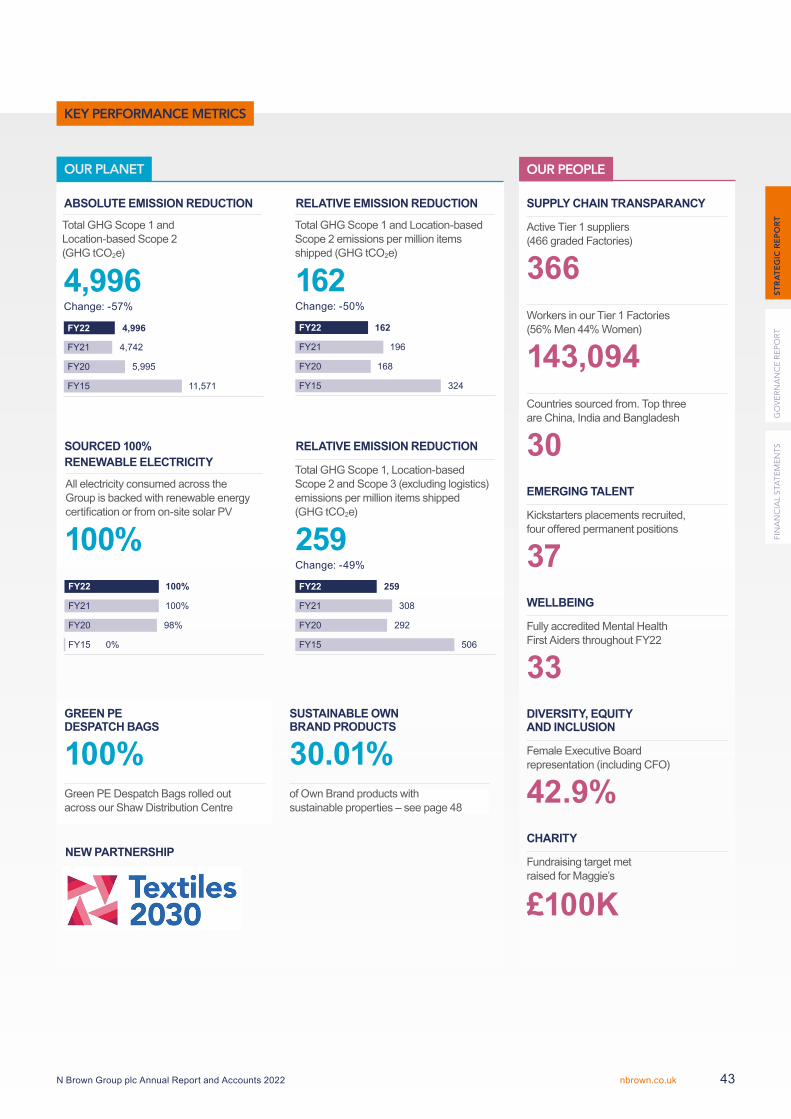
ABSOLUTE EMISSION REDUCTION
4,996
4,742
FY22
FY21
5,995
11,571
FY20
FY15
4,996Change: -57%
Total GHG Scope 1 and Location-based Scope 2 (GHG tCO2e)
SOURCED 100% RENEWABLE ELECTRICITY
100% 100%
100%
FY22
FY21
98%
0%
FY20
FY15
SUPPLY CHAIN TRANSPARANCY
Active Tier 1 suppliers (466 graded Factories)
366Workers in our Tier 1 Factories (56% Men 44% Women)
143,094Countries sourced from. Top three are China, India and Bangladesh
30EMERGING TALENT
Kickstarters placements recruited, four offered permanent positions
37WELLBEING
Fully accredited Mental Health First Aiders throughout FY22
33DIVERSITY, EQUITY AND INCLUSION
Female Executive Board representation (including CFO)
42.9%
CHARITY
Fundraising target met raised for Maggie’s
£100K
All electricity consumed across the Group is backed with renewable energy certification or from on-site solar PV
RELATIVE EMISSION REDUCTION
162
196
FY22
FY21
168
324
FY20
FY15
162Change: -50%
RELATIVE EMISSION REDUCTION
259
308
FY22
FY21
292
506
FY20
FY15
259 Change: -49%
Total GHG Scope 1, Location-based Scope 2 and Scope 3 (excluding logistics)emissions per million items shipped (GHG tCO2e)
GREEN PE DESPATCH BAGS
100%Green PE Despatch Bags rolled out across our Shaw Distribution Centre
SUSTAINABLE OWN BRAND PRODUCTS
30.01%of Own Brand products with sustainable properties – see page 48
NEW PARTNERSHIP
Total GHG Scope 1 and Location-based Scope 2 emissions per million items shipped (GHG tCO2e)
KEY PERFORMANCE METRICS
OUR PEOPLEOUR PLANET
FIN
AN
CIA
L S
TAT
EM
EN
TS
GO
VE
RN
AN
CE
RE
PO
RT
ST
RA
TE
GIC
RE
PO
RT
N Brown Group plc Annual Report and Accounts 2022 43nbrown.co.uk
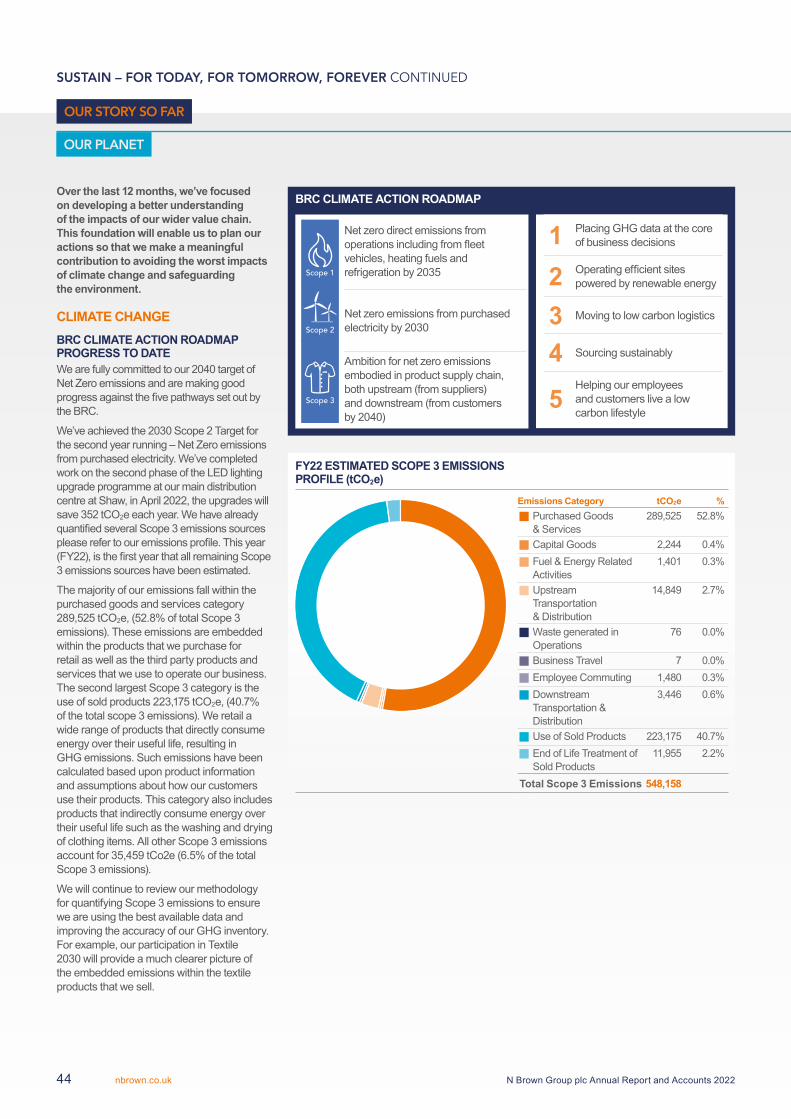
Over the last 12 months, we’ve focused on developing a better understanding of the impacts of our wider value chain. This foundation will enable us to plan our actions so that we make a meaningful contribution to avoiding the worst impacts of climate change and safeguarding the environment.
CLIMATE CHANGEBRC CLIMATE ACTION ROADMAP PROGRESS TO DATEWe are fully committed to our 2040 target of Net Zero emissions and are making good progress against the five pathways set out by the BRC.
We’ve achieved the 2030 Scope 2 Target for the second year running – Net Zero emissions from purchased electricity. We’ve completed work on the second phase of the LED lighting upgrade programme at our main distribution centre at Shaw, in April 2022, the upgrades will save 352 tCO2e each year. We have already quantified several Scope 3 emissions sources please refer to our emissions profile. This year (FY22), is the first year that all remaining Scope 3 emissions sources have been estimated.
The majority of our emissions fall within the purchased goods and services category 289,525 tCO2e, (52.8% of total Scope 3 emissions). These emissions are embedded within the products that we purchase for retail as well as the third party products and services that we use to operate our business. The second largest Scope 3 category is the use of sold products 223,175 tCO2e, (40.7% of the total scope 3 emissions). We retail a wide range of products that directly consume energy over their useful life, resulting in GHG emissions. Such emissions have been calculated based upon product information and assumptions about how our customers use their products. This category also includes products that indirectly consume energy over their useful life such as the washing and drying of clothing items. All other Scope 3 emissions account for 35,459 tCo2e (6.5% of the total Scope 3 emissions).
We will continue to review our methodology for quantifying Scope 3 emissions to ensure we are using the best available data and improving the accuracy of our GHG inventory. For example, our participation in Textile 2030 will provide a much clearer picture of the embedded emissions within the textile products that we sell.
OUR PLANET
BRC CLIMATE ACTION ROADMAP
Net zero direct emissions from operations including from fleet vehicles, heating fuels and refrigeration by 2035
Net zero emissions from purchased electricity by 2030
Ambition for net zero emissions embodied in product supply chain, both upstream (from suppliers) and downstream (from customers by 2040)
1 Placing GHG data at the core of business decisions
2 Operating efficient sites powered by renewable energy
3 Moving to low carbon logistics
4 Sourcing sustainably
5 Helping our employees and customers live a low carbon lifestyle
Emissions Category tCO2e %Purchased Goods & Services
289,525 52.8%
Capital Goods 2,244 0.4%Fuel & Energy Related Activities
1,401 0.3%
Upstream Transportation & Distribution
14,849 2.7%
Waste generated in Operations
76 0.0%
Business Travel 7 0.0%Employee Commuting 1,480 0.3%Downstream Transportation & Distribution
3,446 0.6%
Use of Sold Products 223,175 40.7%End of Life Treatment of Sold Products
11,955 2.2%
Total Scope 3 Emissions 548,158
FY22 ESTIMATED SCOPE 3 EMISSIONS PROFILE (tCO2e)
SUSTAIN – FOR TODAY, FOR TOMORROW, FOREVER CONTINUED
OUR STORY SO FAR
N Brown Group plc Annual Report and Accounts 202244 nbrown.co.uk
TEXTILE 2030 Textile 2030 is ‘WRAP’s’ award-winning, ground-breaking, expert-led initiative. It harnesses the knowledge and expertise of UK leaders in sustainability to accelerate the whole fashion and textiles industry’s move towards circularity and system change in the UK.
As a signatory, we’re committed to measuring the whole life impacts and circularity of our product portfolio across GHG emissions and water impacts to establish our baseline. We’ve set a target to reduce GHG emissions by 50% and reduce the aggregate water footprint of new products sold by 30% by 2030. To achieve this, we’re developing an action plan and will report annually on our progress to WRAP. Our baseline will be published in mid-2022.
BETTER COTTON INITIATIVE (BCI) We’re proud members of Better Cotton, which is sourced via a system of Mass Balance.
Our target from January to December 2022 is to source 50% of our cotton from more sustainable sources. More sustainable cotton includes BCI cotton, recycled cotton and organic cotton.
UN GLOBAL COMPACTWe continue to be signatories to the United Nations Global Compact which is the world’s largest corporate social responsibility initiative.
The Compact brings companies together to work jointly and align strategies on universal human rights, labour rights, environmental issues and anti-corruption. We submit our Communication on Progress report annually and our CSR working group meets regularly to drive activities against the Sustainable Development Goals. Our focus with this group this year will be collaboration on climate change.
CARBON DISCLOSURE PROJECTWe continue to report to the Carbon Disclosure Project (“CDP”) on both the Climate Change and Forests modules.
In FY21, we achieved a score of B for both the Climate Change response and the Forests module. We also achieved an A- on the supplier engagement rating for the work we do with our supply chain on climate change. During FY22, we began preparations to respond to the Water Security module of the CDP and will continue to provide an update on our actions to tackle climate change and deforestation.
OUR PEOPLE
As a people-centred and values driven business, we take our involvement in our communities and wider society seriously. Our dedication to creating social value is important to our people and our business – and we’re working hard to grow and foster that spirit as our social value strategy continues to become further embedded within the business.
During the year, we focused on increasing our social value in the following ways:
CHARITIES AND OUR COMMUNITIESOur colleague-led charity partnership with Maggie’s Manchester and Maggie’s Oldham continued to be a success throughout FY22. The pandemic changed the way in which our colleagues were able to fundraise and meant that large scale fundraising events weren’t possible for some time. Despite this, our partnership met its fundraising target of £100,000 thanks to the hard work and commitment of our colleagues. We supported Maggie’s by sponsoring key fundraising events – and this has helped them to raise funds at a time when they’re needed more than ever.
At the beginning of 2022, Jacamo launched a partnership with the charity Campaign Against Living Miserably (“CALM”) to support the work which CALM do to offer help and support to those in need. The launch is part of a longer-term partnership between Jacamo and CALM and one which we hope will empower men to have open conversations about their mental wellbeing, and to help raise mental health awareness.
MEMBERSHIPS We’re committed to playing an active role in our industry, bringing together colleagues, customers and stakeholders across our business and throughout our supply chain.
The last 12 months has seen us continue our long-term relationships with:
Accord & RSC Bangladesh; ACT (Action, Collaboration, Transformation) Living Wage; Ethical Trade Initiative (ETI); United Nations Global Compact (UNGC) and All-Party Parliamentary Corporate Responsibility Group (APCRG).
We also commenced new memberships with:
International Accord; Higg Index – Brand and Retail Module; Fast Forward; Better Cotton Initiative and Textile 2030.
FIN
AN
CIA
L S
TAT
EM
EN
TS
GO
VE
RN
AN
CE
RE
PO
RT
ST
RA
TE
GIC
RE
PO
RT
N Brown Group plc Annual Report and Accounts 2022 45nbrown.co.uk
WELLBEINGThe safety and wellbeing of our colleagues remained our priority as we moved out of the pandemic, and we have regularly reviewed and issued Covid-19 safety guidance.
We mobilised a team of 33 fully accredited Mental Health First Aiders across the business, with these trained individuals on hand to support all colleagues. This resource has been accessed by 16 colleagues under the broad themes of anxiety and stress.
A key theme of The Producer, our leadership development programme, is the role of the manager in promoting the wellbeing of their team. Leaders are equipped with skills and behaviours to understand their team members, look for changes in their wellbeing, facilitate conversations around wellbeing and support their team with strategies to thrive.
We have developed our wellbeing offering to include:
More easy-to-access resources to support key areas of wellbeing.
Discounts for wellbeing-related products and services.
Cycle 2 Work.
Financial planning tools.
Walking meetings.
Wellbeing hours.
The Menopause Cafe.
HUMAN RIGHTS AND TRANSPARENCY IN OUR SUPPLY BASEHuman rights remain a priority across the retail sector. Collaboration and transparency across the supply chain continues to be a key theme across all retail brands. We published our:
Fifth Modern Slavery statement in September 2021
Seventh Communication on Progress (COP) report for the UNCG in January 2022
Tier 1 factory list and definitions
COLLEAGUES OUTREACH AND EMERGING TALENT We’re supporting the Government’s Kickstart scheme which provides funding for employers to create job placements for 16-24 year olds on universal credit.
We recruited 37 Kickstarters during the year, and to date four of them have entered into permanent employment with us. As well as providing on-the-job experience, we’ve formed a partnership with The Prince’s Trust to give our Kickstarters access to developmental and employability workshops to help them secure future employment.
We joined the Good and Fair Employers Club, a coalition of UK employers who come together to collaborate around the shared objective of being good and fair employers for young people.
HYBRID WORKINGOur hybrid working approach is framed by six principles, empowering our colleagues to choose where and how they work while ensuring that business requirements and their team come first. All colleagues in hybrid-enabled roles are now working in this way, and we’ve provided them with the tools and support required to adapt to hybrid working in order to help them maintain their sense of purpose, productivity, performance and wellbeing.
DIVERSITY, EQUITY AND INCLUSION (DE&I)Following analysis, we can report that our colleague diversity statistics are broadly in line with external benchmarking for the retail sector.
Our 2021 gender pay gap report reveals that our mean pay gap has increased from 12.3% to 16.4% which can be attributed, in part, to the reorganisation in 2020. The upcoming implementation of an integrated DE&I programme will enable us to have greater influence on the gender pay gap.
With inclusivity identified as one of our core behaviours, we’ve deliberately curated a more inclusive culture since the launch of our new Employer Value Proposition in October 2019.
DE&I is a key consideration for our Culture Group, a group of colleague representatives from around the business who come together monthly to discuss and steer our culture.
While we’ll continue to work hard to evolve our culture, it was nevertheless pleasing to see that DE&I was the area that scored highest in our 2021 annual engagement survey.
SUSTAIN – FOR TODAY, FOR TOMORROW, FOREVER CONTINUED
OUR STORY SO FAR CONTINUED
OUR PEOPLE CONTINUED
N Brown Group plc Annual Report and Accounts 202246 nbrown.co.uk
SUSTAIN encompasses both the Our People and Our Planet pillars to address our key impacts. We’ve made a series of challenging commitments and are working across a range of different frameworks and external reporting obligations to ensure our approach is transparent and aligned with best practice.
ENVIRONMENT SOCIAL GOVERNANCE
ACHIEVE NET ZERO EMISSIONS BY 2040We are committed to reducing our environmental impact by becoming Net Zero by 2040. Through key partnerships, we will drive a greater long-term impact, which is why we are working in collaboration with the BRC.
ALL OWN BRAND PRODUCTS RESPONSIBLY SOURCED BY 2030We are aware that as a fashion retailer this is one of the biggest impacts on our environment. We have partnered with Textiles 2030 because it supports our goals to make all our own brand products sustainable by 2030.
BRINGING POSITIVE BENEFITS TO OUR PEOPLE AND OUR COMMUNITIESWe understand the impact we can have on our people and communities which is why we’re committed to ensuring it’s as positive as can be, as together we can support a brighter future.
SUSTAINAims to align our ethical policies with our commercial activities, achieving tangible results and benefits for our stakeholders.
Natural Resources Zero deforestation from major commodities by 2030. Water Reduction of aggregate water footprint of new products of 30% by 2030. Circularity Ensure that all waste is reduced throughout our operations, waste to landfill remains zero and recycling is the primary objective.Climate Change Introduce Science Based Targets to reduce our carbon footprint and achieve Net Zero.Responsibly Sourced Products All OB designed products to be sustainably sourced by 2030, supporting best practice from design through to end of life (waste).
Diversity & Inclusion Building a diverse workforce and creating an inclusive environment which values equality for all.Wellbeing Curating a culture centred on our colleague’s wellbeing.Emerging Talent Giving young people the best possible start to their careers by offering an inclusive programme with opportunities for allEthical Workplace Full visibility to Tier 2 OB Strategic and Significant suppliers by end 2023.Charity and Our Community Give back to our communities through working with collaborative Charity partners who align with our values, colleagues and customers.
Data Led Reporting suite to be optimised. Ethical Principles of Responsible AI Ensure that our approach to building models does not contain hidden biases and considers the impact of these models on the people who use them. Partnerships Collaborate with key partners to ensure that we validate all areas of strategy, performance and ensure we are ‘doing the right thing for our planet, people, customer & communities.
SUSTAIN
Impact areas
Key targets
Long-term commitments
LOOKING FORWARD TO FY23
FIN
AN
CIA
L S
TAT
EM
EN
TS
GO
VE
RN
AN
CE
RE
PO
RT
ST
RA
TE
GIC
RE
PO
RT
N Brown Group plc Annual Report and Accounts 2022 47nbrown.co.uk
OUR PLANET
LOOKING FORWARD TO FY23 CONTINUED
RESPONSIBLE PRODUCT SOURCING As part of our responsible sourcing commitments to Textile 2030 and BRC Climate Action roadmap we want to move away from the make-use-dispose culture of the fashion industry and embrace circularity, where products are made sustainably, used for a long time and then re-used or recycled. Our target this year is to increase the mix of sustainable own brand designed products to 50%.
From the assessment of our Scope 3 emissions, our largest emission source is associated with our products. It is crucial that we work with our designers, suppliers and buyers to specify more sustainable choices into the design and manufacture of our products to the benefit of both people and planet.
By 2030, all of our own brand products will have sustainable properties and we have an ambitious plan to deliver this commitment. To date, 30% of our own brand products have sustainable properties.
To help improve the sustainability of our products, we aim to use responsibly sourced materials from certified and traceable sources as much as possible. For a product to be considered to have sustainable properties, it must contain a minimum of:
30% recycled polyester (eg. REPREVE™)
30% sustainable viscose (LENZING™ ECOVERO™)
50% Organic Blend / BCI / Recycled Cotton
We are currently sourcing raw materials that are certified through the following schemes:
BCI Cotton – The world’s leading sustainability initiative for cotton. This mission is to help cotton communities survive and thrive, while protecting and restoring the environment.REPREVE™ – Recycling plastic bottles into a polyester fibre. Compared to virgin fibre, REPREVE™ offsets using new petroleum, emitting fewer greenhouse gases and conserving water and energy in the process. LENZING™ ECOVERO™ – Derived from certified renewable wood sources using an eco-responsible production process
that meets high environmental standards, LENZING™ ECOVERO™ fibres tailor to a sustainable lifestyle, contributing to a cleaner environment. Organic Cotton – Organic cotton is produced and certified to organic agricultural standards. Its production sustains the health of soils, ecosystems and people by using natural processes rather than artificial inputs.Importantly eliminating toxic chemicals or GMOs (genetically modified organisms). Recycled Cotton Standard – RCS like GRS are both are international, voluntary standards that set requirements for third-party certification of recycled material. The standards are set through the Textile exchange, which is a non-profit organisation.
CIRCULARITYWe understand the importance of starting in the right place when it comes to developing products and processes with our supply chains.
This year we are committed to reviewing our options for Product Takeback, Rental and Resale to enable customers to have the best routes to ensure that products can be recycled, reused and not sent to landfill when they no longer need the use of the items.
We also want to ensure that our new uniforms for our Logistic colleague are made with circularity at the forefront and the new uniforms will have sustainable attributes and options for recycling once the products have come to end of life.
CLIMATE CHANGEThis year we will continue to progress our current targets for GHG emissions 50-56% reduction, whilst working towards a Science Based Target for FY24 onwards. The primary focus will be to review our Scope 3 profile and assessment.
We recognise the impact that our operations and supply chain have on the natural world. ‘Our People & Planet’ strategy aims to minimize our impact by focusing on short term objectives to deliver meaningful change in line with our long-term commitments to ensure we are going far enough to limit our impacts.
NATURAL RESOURCESDuring FY23 we will be focusing on our packaging usage within our supply chain operations to understand the profile and opportunities to reduce, increase recycling options and review the strategy on recycled packaging. This will be supported through collaborative working with our Suppliers, packaging partners and our colleagues.
WATERAs part of our commitment to Textile 2030 and our CDP reporting we will perform a full water assessment across all N Brown operations and supply chains (End FY23). This will enable us to then review and assess next steps to ensure that we continue to understand the business impact and how we can deliver against the 2030 targets.
WORKING WITH OUR PARTNERSAcross our value chain, we’re aligning ourselves with partners who are like-minded and well on the road to Net Zero.
During FY22, we worked with EVRi, our main outbound logistics partner, to develop better ways of delivering and returning items to and from our customers in order to reduce GHG emissions.
One of our main plans for FY23 is to review recycling schemes for our customers through the EVRi network.
We also want to incentivise our customers to make more use of the ‘Out of Home’ network where customers can pick up their orders from a ParcelShop or lockers. Centralised delivery points such as these can help to reduce the GHG emissions associated with the last leg of the delivery journey.
SUSTAIN – FOR TODAY, FOR TOMORROW, FOREVER CONTINUED
N Brown Group plc Annual Report and Accounts 202248 nbrown.co.uk
OUR PEOPLE
WHERE WE’RE HEADEDWe’re just at the beginning of our People journey. Now is the time to build more structure around our activities so that we can deliver measurable Social Value under each of the above headings. Our future focus is on:
CHARITIES AND OUR COMMUNITIESWe’re recommending a refreshed charity strategy for FY23 which will see us support two new charities from Summer 2022. The two overarching objectives of our corporate charity strategy are:
To support a charity which is closely connected to our business in terms of alignment with our strategic vision and industry.
To continue to support a charity with a strong presence in Greater Manchester and which colleagues have chosen – allowing colleagues to have a voice and play a part in nominating the charity which they will be supporting.
We’ll work closely with both charities to develop a tangible fundraising target and programme of activities which will benefit all our colleagues and support our overall SUSTAIN strategy.
As we emerge from the pandemic, we’ll also begin to actively promote our Make A Difference Day volunteering scheme which gives all colleagues the opportunity to take one working day a year to give something back to charities and causes close to their hearts.
OUTREACH AND EMERGING TALENTWe’ll invest more in internal talent, bolstering our talent pipelines in all streams from apprentices and placement students to graduates. In addition, we’ll add more structure to our work experience opportunities by providing week-long placements for up to 10 students four times a year. This will enable us to offer more engaging experiences as well as making the application process fair and equitable.
To support our social mobility objectives, we’ll target schools, colleges and universities in the more deprived areas of the northwest and look for ways to make sustainable contributions to these institutions.
WELLBEINGWe’ll create strategic partnerships with organisations and charities that can enhance our wellbeing package for colleagues.
Given the external context and resulting economic challenges which are resulting in a significant increase in the cost of living for our colleagues, our focus for the next 12 months will be on financial wellbeing.
We’ll also provide additional training to our mental health first aiders, ensuring that we’re able to provide support and signposting in specific circumstances such as suicide, domestic abuse and bereavement.
DIVERSITY, EQUITY AND INCLUSION (DE&I)Our objective is for our DE&I approach to be more focused and proactive – so we’re launching an integrated programme, with the first 12 months targeted on building engagement, awareness and connection. Through the lens of our vision, values and behaviours we’ll embed this programme as part of our DNA.
We’ll also implement key tools and processes which will enable us to increase equity for all, including diverse shortlists and talent and succession mapping.
As our business serves the underserved, we’ve made the decision to place specific focus on increasing our socio-economic diversity.
HYBRID WORKINGWe’ll continue to optimise Hybrid Working, ensuring that it is delivering for our business, teams and colleagues.
Hybrid working will be further enabled and complemented by our move to become an agile enterprise.
FIN
AN
CIA
L S
TAT
EM
EN
TS
GO
VE
RN
AN
CE
RE
PO
RT
ST
RA
TE
GIC
RE
PO
RT
N Brown Group plc Annual Report and Accounts 2022 49nbrown.co.uk
The recommendations are structured around four core elements: Governance, Strategy, Risk Management and Metrics and Targets. We have taken advice from our external Sustainability advisors on how to implement the TCFD framework across our business and we will work towards aligning our approach to these recommendations throughout FY23.
GOVERNANCE SUSTAIN is sponsored by the Executive Board and led by Michael Mustard (Group General Counsel), Sarah Welsh (Retail CEO) and Aly Fadil (Chief People Officer). The ESG Committee meets at least twice a year and is chaired by Non- Executive Director Michael Ross. A SUSTAIN Steering group, comprised by the Exec Board representatives and other Senior Leadership team members, supports the ESG Committee and reviews the Sustainability roadmap and keeping the business on track with its Sustainability objectives. This forum also reviews any market trends, potential issues or risks across the Our People and Our Planet pillars of the strategy.
Reports are provided to the Executive board team and up through to the Group Board via the ESG Committee in line with the meeting schedule.
In line with the quarterly review, progress against our targets is measured monthly in our retail operating committee (ROC).
We will be reviewing our governance framework to ensure that ESG is embedded appropriately within the business, we are ready for the implementation of TCFD and there is greater general clarity on ESG responsibilities.
RISK MANAGEMENT The Group has continued to enhance and embed risk management practices in support of the N Brown Enterprise Risk Management Framework (“RMF”). The RMF enables the Group to maintain robust governance and oversight across the business and underpin a standardised approach to managing risks.
In FY23, the Group will undertake detailed assessments of climate-related risks and opportunities and conduct scenario analysis in line with the TCFD recommendations. Any specific risk identified will be assessed and considered alongside other risks using the established Group RMF.
STRATEGY The Group introduced a new ESG strategy in July 2020, replacing the previous CSR remit. During FY21 ESG was rebranded to SUSTAIN.
SUSTAIN aims to align our ethical policies with our commercial activities, achieving tangible results and benefits for our stakeholders. Fully embracing the values of our business, SUSTAIN is our overarching strategy across our sustainability pillars – Our People and Our Planet. To address our impacts, we have made a series of challenging public commitments and work across a range of different frameworks and external reporting obligations to ensure our approach is transparent and aligned with best practice.
METRICS AND TARGETS In FY22, we have achieved the 2030 target of the BRC Climate Action Roadmap for the second year running – Net Zero emissions from purchased electricity. We have continued to report to the Carbon Disclosure Project (“CDP”) on both the Climate Change and Forests modules and have begun preparations to respond to the Water Security module of the CDP and will continue to provide an update on our actions to tackle climate change and deforestation.
In addition to the targets we have set across ESG, we have set stretching targets on sustainability and GHG emission reductions as part of our FY23 Annual Bonus Plan. Please refer to page 77 for more details.
In FY23 The Group will review the metrics and methodology it uses to measure and manage climate related risks and opportunities, including how these are incorporated into remuneration policies. There will also be a review of scope 3 GHG emissions as we worked towards science based targets.
CLIMATE RELATED FINANCIAL DISCLOSURES Climate change is one of the greatest challenges facing our planet today. We support the TCFD and its recommendations, and are working towards aligning our strategy and implementing the recommendations across our business. We aim to provide full disclosure on the Group’s climate risks and opportunities under the TCFD framework in our FY24 Annual Report & Accounts.
ESG DISCLOSURE SCORE As part of SUSTAIN, we will use the ESG Disclosure Score outlined by the London Stock Exchange to provide stakeholders with a comprehensive assessment of our ESG progress. The ESG Disclosure Score is intended as a tool for companies to consider good practice in disclosure of key quantitative ESG metrics. The London Stock Exchange has commented that the “ESG disclosure score is calculated based upon the level of disclosure against the metrics considered by FTSE Russell to be the most material to investors for different industries. This is drawn from existing ESG standards including: the Global Reporting Initiative (“GRI”); Sustainability Accounting Standards Board (“SASB”); and the Carbon Disclosure Project and based upon expertise built over 18 years of commercial activity in ESG data and indexes, working with investors and other market participants.”
Based on our business being in the “Consumer Goods, Customer Services & Healthcare” sector, the ESG Disclosure Score assesses the following criteria and more information can be found on the pages indicated:
Carbon emissions page 51
Energy use page 52
Social and Community investment page 49
Share of temporary employees 124
Independent Directors page 56
Female Directors page 64
In addition, we also consider employee training hours, employee turnover rates, share of human rights, supply chain, sustainability clothing and waste and recycling to be central to our ESG strategy.
SUSTAIN – FOR TODAY, FOR TOMORROW, FOREVER CONTINUED
GOVERNANCE
LOOKING FORWARD TO FY23 CONTINUED
N Brown Group plc Annual Report and Accounts 202250 nbrown.co.uk
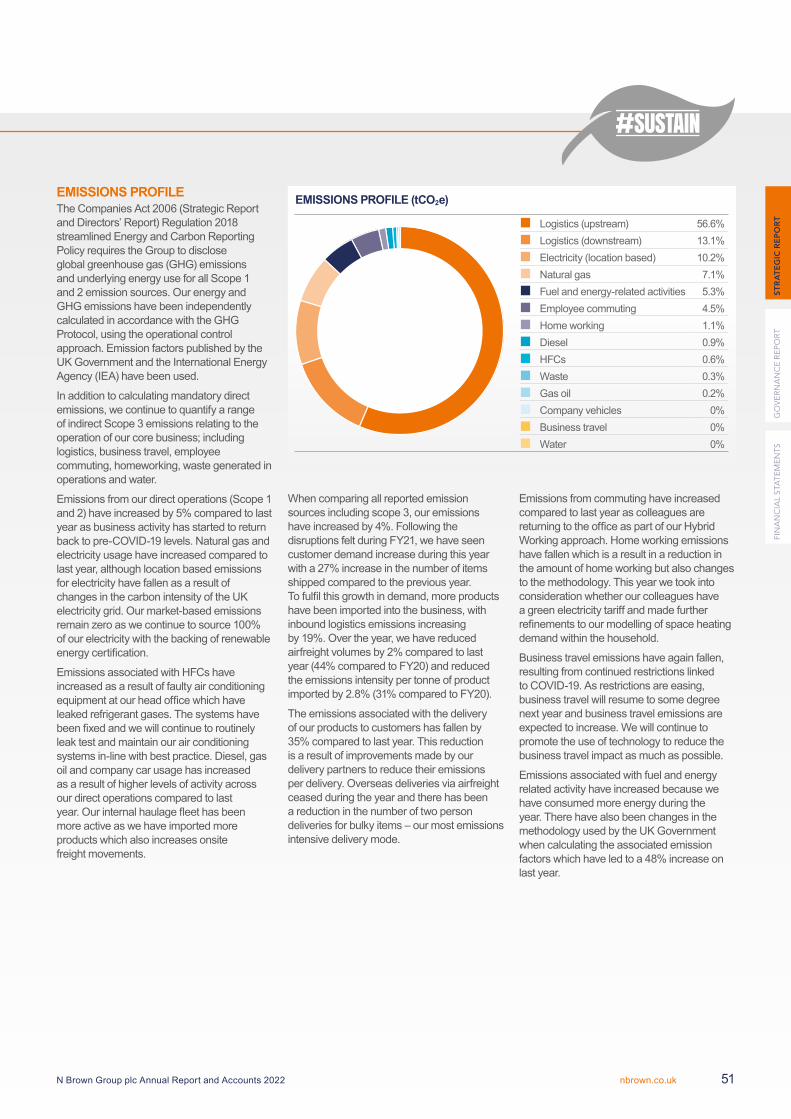
EMISSIONS PROFILE The Companies Act 2006 (Strategic Report and Directors’ Report) Regulation 2018 streamlined Energy and Carbon Reporting Policy requires the Group to disclose global greenhouse gas (GHG) emissions and underlying energy use for all Scope 1 and 2 emission sources. Our energy and GHG emissions have been independently calculated in accordance with the GHG Protocol, using the operational control approach. Emission factors published by the UK Government and the International Energy Agency (IEA) have been used.
In addition to calculating mandatory direct emissions, we continue to quantify a range of indirect Scope 3 emissions relating to the operation of our core business; including logistics, business travel, employee commuting, homeworking, waste generated in operations and water.
Emissions from our direct operations (Scope 1 and 2) have increased by 5% compared to last year as business activity has started to return back to pre-COVID-19 levels. Natural gas and electricity usage have increased compared to last year, although location based emissions for electricity have fallen as a result of changes in the carbon intensity of the UK electricity grid. Our market-based emissions remain zero as we continue to source 100% of our electricity with the backing of renewable energy certification.
Emissions associated with HFCs have increased as a result of faulty air conditioning equipment at our head office which have leaked refrigerant gases. The systems have been fixed and we will continue to routinely leak test and maintain our air conditioning systems in-line with best practice. Diesel, gas oil and company car usage has increased as a result of higher levels of activity across our direct operations compared to last year. Our internal haulage fleet has been more active as we have imported more products which also increases onsite freight movements.
Logistics (upstream) 56.6%Logistics (downstream) 13.1%Electricity (location based) 10.2%Natural gas 7.1%Fuel and energy-related activities 5.3%Employee commuting 4.5%Home working 1.1%Diesel 0.9%HFCs 0.6% Waste 0.3%Gas oil 0.2%Company vehicles 0%Business travel 0%Water 0%
EMISSIONS PROFILE (tCO2e)
When comparing all reported emission sources including scope 3, our emissions have increased by 4%. Following the disruptions felt during FY21, we have seen customer demand increase during this year with a 27% increase in the number of items shipped compared to the previous year. To fulfil this growth in demand, more products have been imported into the business, with inbound logistics emissions increasing by 19%. Over the year, we have reduced airfreight volumes by 2% compared to last year (44% compared to FY20) and reduced the emissions intensity per tonne of product imported by 2.8% (31% compared to FY20).
The emissions associated with the delivery of our products to customers has fallen by 35% compared to last year. This reduction is a result of improvements made by our delivery partners to reduce their emissions per delivery. Overseas deliveries via airfreight ceased during the year and there has been a reduction in the number of two person deliveries for bulky items – our most emissions intensive delivery mode.
Emissions from commuting have increased compared to last year as colleagues are returning to the office as part of our Hybrid Working approach. Home working emissions have fallen which is a result in a reduction in the amount of home working but also changes to the methodology. This year we took into consideration whether our colleagues have a green electricity tariff and made further refinements to our modelling of space heating demand within the household.
Business travel emissions have again fallen, resulting from continued restrictions linked to COVID-19. As restrictions are easing, business travel will resume to some degree next year and business travel emissions are expected to increase. We will continue to promote the use of technology to reduce the business travel impact as much as possible.
Emissions associated with fuel and energy related activity have increased because we have consumed more energy during the year. There have also been changes in the methodology used by the UK Government when calculating the associated emission factors which have led to a 48% increase on last year.
FIN
AN
CIA
L S
TAT
EM
EN
TS
GO
VE
RN
AN
CE
RE
PO
RT
ST
RA
TE
GIC
RE
PO
RT
N Brown Group plc Annual Report and Accounts 2022 51nbrown.co.uk
Scope
Total GHG tCO2e tCO2e change from
previous year% change from
previous yearFY22 FY21Scope 1Natural gas 1,876.2 1,579.6 296.6 19%Diesel 227.8 172.3 55.5 32%HFCs 152.2 9.5 142.7 1502%Gas oil 47.4 42.4 5.0 12%Company vehicles 12.8 12.1 0.7 5%Scope 2Electricity (location based) 2,680.3 2,925.8 -245.5 -8%Electricity (market based) 0.0 0.0 0.0 0%Total Scope 1 and 2 4,996.5 4,741.5 255.0 5%Scope 3 (estimated)Water 10.7 11.0 -0.3 -3%Employee commuting 1,181.8 714.1 467.7 66%Home working 298.3 814.9 -516.7 -63%Business travel 7.3 141.5 -134.2 -95%Waste 75.8 81.2 -5.4 -7%Fuel and energy-related activities 1,401.1 945.8 455.3 48%Logistics (upstream) 14,878.5 12,466.3 2,412.2 19%Logistics (downstream) 3,446.4 5,317.5 -1,871.1 -35%Total 26,296.4 25,233.9 -1,062.5 4%Outside Scopes – Biogenic element – Diesel
14.1 8.0 6.1 76%
EMISSIONS INTENSITYWe track the emissions intensity of our operations by tracking emissions per the number of items shipped against an FY15 baseline. Compared to last year, our emissions intensity has fallen by 17% compared to last year and by 50% against the FY15 baseline for scope 1 & 2.
SCOPE 1 AND 2 ONLYEmissions Intensity Ratio FY15 FY21 FY22tCO2e per mil. Items shipped 323.6 196.0 162.4% Change against FY15 baseline – -39% -50%
We have also tracked this measure inclusive of scope 3 emissions (excluding logistics) and compared to last year, our emissions intensity has fallen by 16% compared to last year and by 49% against the FY15 baseline.
SCOPE 1,2 AND 3 (EXCLUDING LOGISTICS)Emissions Intensity Ratio FY15 FY21 FY22tCO2e per mil. Items shipped 505.6 308.0 259.1% Change against FY15 baseline – -39% -49%
GLOBAL ENERGY USE AND EMISSIONS The tables below show the proportion of energy use and scope 1 and 2 GHG emissions that occurred within the UK and Non-UK countries. In FY22, 99.1% of the Group’s energy consumption arose from UK operations. Our overall energy usage has increased by 10% compared to last year. Energy FY22 kWh % FY21 kWh %UK 24,030,411 99.1% 21,848,505 99.2%Non-UK 230,176 0.9% 169,435 0.8%Total Energy Use 24,260,587 22,017,940
Emissions FY22 tCO2e % FY21 tCO2e %UK 4,951.7 99.1% 4,694.0 99.0%Non-UK 44.8 0.9% 47.0 1.0%Total Scope 1 +2 GHG Emissions 4,996.5 4,741.0
SUSTAIN – FOR TODAY, FOR TOMORROW, FOREVER CONTINUED
GOVERNANCE CONTINUED
LOOKING FORWARD TO FY23 CONTINUED
N Brown Group plc Annual Report and Accounts 202252 nbrown.co.uk
MANDATORY GHG REPORTING NOTESThe data disclosed is in conformance with the Companies Act 2006 (strategic report and directors’ report regulations). GHG emissions disclosed under the required reporting categories fall within the Group’s consolidated financial statement. Scope 1 and 2 emissions have been calculated using the operational control approach in accordance with the GHG Protocol Corporate Accounting and Reporting Standard. The quantified emissions are for the reporting period 1st March 2021 to 28th February 2022.
GHG emissions factors published by the UK Government and International Energy Agency for 2021 have been used to calculate GHG emissions. For activities outside the UK, emissions factors provided by the International Energy Agency (IEA) have been used to calculate GHG emissions.
DATA RECORDS
Natural gas and electricity: Emissions are primarily calculated based on actual or estimated metered consumption from invoices, meter readings or half hourly consumption data. Where actual metered data is not available, energy consumption has been estimated using floor areas and published benchmarks. Some data has been estimated from previous periods of consumption where quarterly bills have not yet been published.
Gas oil: Fuel is used in stand-by generators and onsite transport such as forklifts and shunter trucks. Data for onsite transport is calculated using actual fuel usage from invoices and internal records of gas oil deliveries. Generator fuel usage has been estimated using generator fuel demand per hour and activation information.
Diesel: Data is calculated based on actual fuel consumption taken from fuel card invoices.
Company cars/vans: There has been no company car business travel during the latest reporting period. Pool cars and pool vans (used to transport items between logistics sites) emissions are calculated based on the annual mileage recorded for the vehicles.
HFCs: Refrigeration emissions have been calculated from the F-Gas register or services records where the volume of refrigerant gas lost to the atmosphere during the reporting period is known. Where service records were
not available, emissions have been estimated using the screening methodology and an assumed average leakage rate. Where details are not available (i.e. for a few units in Bangladesh) it has not been possible to estimate emissions. It has not been possible to estimate the emissions associated with installation of new units at the Bangladesh site, due to limited information. The unaccounted for emissions are deemed to be insignificant.
Waste: Most of the Group’s waste (Head Office and logistics sites) is managed by Viridor. Viridor provide a breakdown of weight of waste disposed of by N Brown split by waste type and disposal method. For the sites which are not managed by Viridor, waste audits are completed over a week as a sample and figures are annualised. There are a few closed stores which are included within the scope of reporting due to them still being leased to N Brown. As the stores were closed for the duration of the reporting period, it has been assumed that there has been no waste from these stores.
Employee commuting: Employee commuting habits are captured using an annual staff survey. The results are taken as a sample of all employees and the results are uplifted by the total number of employees to approximate total emissions.
Home working: Some colleagues have continued to work from home during the reporting period as per our Hybrid Working model. The emissions associated with home working (e.g. as a result of lighting, heating and I.T. equipment) has been captured using an staff survey. For this year changes to the methodology were made to capture information relating to green electricity contracts at home as well as refinements to the modelling of space heating usage.
Supply chain logistics: Internal data and data provided by third party service providers has been used to calculate the supply chain emissions associated with the movement of goods from the factory door through to deliveries to our customers. High level estimates have been used where primary or secondary data was unavailable. UK Government emission factors and supplier specific emission factors, where available, have been utilised.
Business travel (air, rail): There are two types of air travel carried out by N Brown: traditional business travel and travel for photoshoots. There were no photoshoot or business journeys by air during the latest reporting period due to COVID-19 restrictions. Rail figures are provided by Clarity who provide a breakdown, by journey, including distance travelled and journey type (underground / national rail).
Business travel (private cars): Data is calculated for the Group using data logged in our internal Concur system which records distance travelled, and vehicle information for each business travel expense claimed.
Water: Emissions are primarily calculated based on invoiced water consumption and volume sent for treatment. Where invoices are not available, water consumption and treatment is estimated based on a standard benchmark against full time staff equivalent. There are a few closed stores which are included within the scope of reporting due to them still being leased to N Brown. As the stores were closed for the duration of the reporting period, it has been assumed that there has been no water usage on site.
FIN
AN
CIA
L S
TAT
EM
EN
TS
GO
VE
RN
AN
CE
RE
PO
RT
ST
RA
TE
GIC
RE
PO
RT
N Brown Group plc Annual Report and Accounts 2022 53nbrown.co.uk

GOVERNANCE REPORTChair’s introduction 55LEADERSHIP AND PURPOSEGroup Board Directors 56Executive Board Directors 58DIVISION OF RESPONSIBILITYGovernance structure 62COMPOSITION, SUCCESSION AND EVALUATIONBoard composition 64Nominations and Governance Committee report
67
AUDIT, RISK AND INTERNAL CONTROLAudit and Risk Committee report 68Financial Services Board Committee report 74REMUNERATIONRemuneration Committee report 75ADDITIONAL DISCLOSURES 94Viability statement 95
Setting a high standard of governance
GOVERNANCE REPORT
N Brown Group plc Annual Report and Accounts 2022nbrown.co.uk54
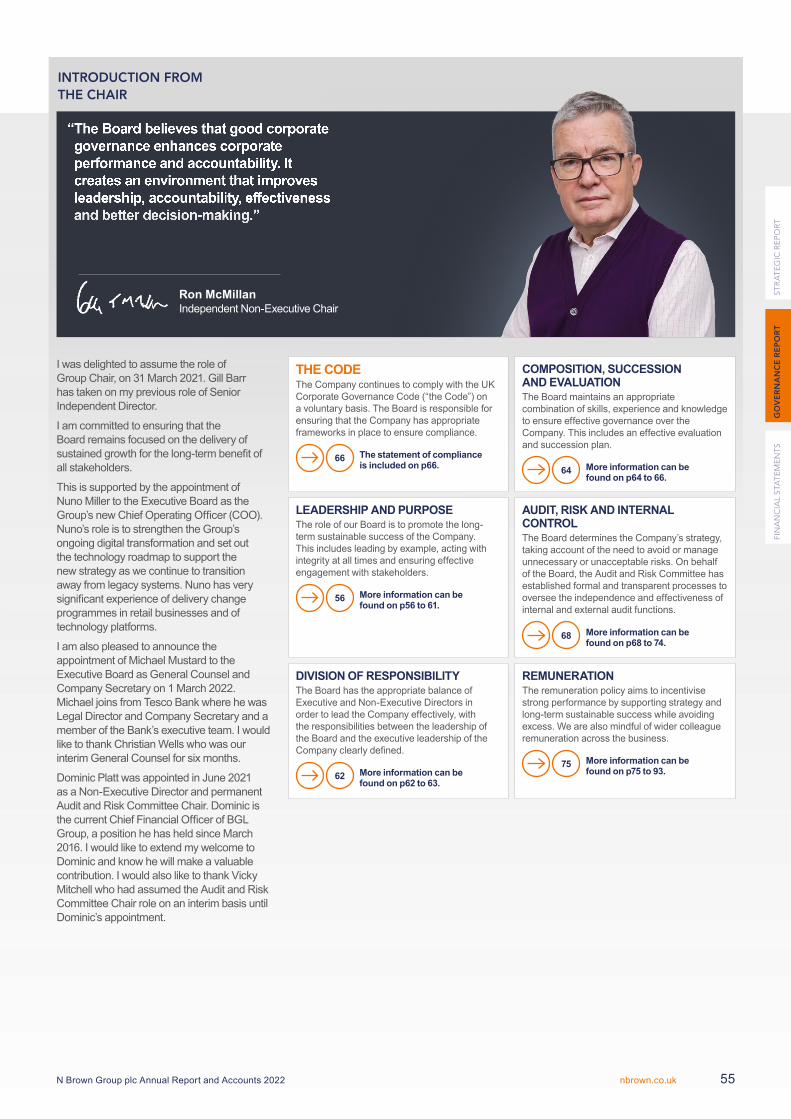
INTRODUCTION FROM THE CHAIR
I was delighted to assume the role of Group Chair, on 31 March 2021. Gill Barr has taken on my previous role of Senior Independent Director.
I am committed to ensuring that the Board remains focused on the delivery of sustained growth for the long-term benefit of all stakeholders.
This is supported by the appointment of Nuno Miller to the Executive Board as the Group’s new Chief Operating Officer (COO). Nuno’s role is to strengthen the Group’s ongoing digital transformation and set out the technology roadmap to support the new strategy as we continue to transition away from legacy systems. Nuno has very significant experience of delivery change programmes in retail businesses and of technology platforms.
I am also pleased to announce the appointment of Michael Mustard to the Executive Board as General Counsel and Company Secretary on 1 March 2022. Michael joins from Tesco Bank where he was Legal Director and Company Secretary and a member of the Bank’s executive team. I would like to thank Christian Wells who was our interim General Counsel for six months.
Dominic Platt was appointed in June 2021 as a Non-Executive Director and permanent Audit and Risk Committee Chair. Dominic is the current Chief Financial Officer of BGL Group, a position he has held since March 2016. I would like to extend my welcome to Dominic and know he will make a valuable contribution. I would also like to thank Vicky Mitchell who had assumed the Audit and Risk Committee Chair role on an interim basis until Dominic’s appointment.
LEADERSHIP AND PURPOSEThe role of our Board is to promote the long-term sustainable success of the Company. This includes leading by example, acting with integrity at all times and ensuring effective engagement with stakeholders.
More information can be found on p56 to 61.
56
THE CODE The Company continues to comply with the UK Corporate Governance Code (“the Code”) on a voluntary basis. The Board is responsible for ensuring that the Company has appropriate frameworks in place to ensure compliance.
The statement of compliance is included on p66.
66
DIVISION OF RESPONSIBILITYThe Board has the appropriate balance of Executive and Non-Executive Directors in order to lead the Company effectively, with the responsibilities between the leadership of the Board and the executive leadership of the Company clearly defined.
More information can be found on p62 to 63.
62
COMPOSITION, SUCCESSION AND EVALUATION The Board maintains an appropriate combination of skills, experience and knowledge to ensure effective governance over the Company. This includes an effective evaluation and succession plan.
More information can be found on p64 to 66.
64
AUDIT, RISK AND INTERNAL CONTROLThe Board determines the Company’s strategy, taking account of the need to avoid or manage unnecessary or unacceptable risks. On behalf of the Board, the Audit and Risk Committee has established formal and transparent processes to oversee the independence and effectiveness of internal and external audit functions.
More information can be found on p68 to 74.
68
REMUNERATIONThe remuneration policy aims to incentivise strong performance by supporting strategy and long-term sustainable success while avoiding excess. We are also mindful of wider colleague remuneration across the business.
More information can be found on p75 to 93.
75
“ The Board believes that good corporate governance enhances corporate performance and accountability. It creates an environment that improves leadership, accountability, effectiveness and better decision-making.”
Ron McMillan Independent Non-Executive Chair
FIN
AN
CIA
L S
TAT
EM
EN
TS
GO
VE
RN
AN
CE
RE
PO
RT
ST
RA
TE
GIC
RE
PO
RT
N Brown Group plc Annual Report and Accounts 2022 nbrown.co.uk 55

FORTHCOMING BOARD APPOINTMENTS
Ron McMillanIndependent Non-Executive ChairAppointed to the Board: April 2013Appointed Chair of the Board: March 2021Meetings attended 8/8First appointed to the Board in April 2013, Ron served as Senior Independent Director until his appointment as Board Chair in March 2021. Prior to joining the Board, he was the Deputy Chair of PricewaterhouseCoopers in the Middle East and Northern Regional Chairman of the UK firm. Key strengths• Retail and digital retail• Corporate finance• Governance• Risk management• RemunerationExternal appointmentsRon is the Senior Independent Director and Chair of the Audit Committee of B&M European Value Retail SA and SCS Group plc. He is also a Non-Executive Director and Chair of the Audit Committee of Homeserve Plc.
Steve JohnsonChief Executive OfficerAppointed to the Board: September 2018Meetings attended 8/8Steve was appointed CEO of N Brown in February 2019 having been appointed Interim CEO in September 2018. Having originally joined the Group as Financial Services Director in February 2016, he was appointed CEO of the Financial Services Operating Board in November 2017. Steve joined N Brown from Shop Direct Group Limited where he was Financial Services Marketing and Product Director for four years and prior to that held senior roles at Sainsbury’s and Halifax. Key strengths• Strategy and change management • Retail and digital retail• Financial Services• Governance• Risk management• Technology, data analytics and AI• MarketingExternal appointmentsNone.
Joshua AllianceNon-Executive DirectorAppointed: December 2020Meetings attended 7/8Joshua joined the Board in December 2020. After graduating from Manchester University in 2011, and following experience working in other developing hi-tech businesses, Joshua joined the Company in 2014. He was formerly Head of Business Innovation for J.D. Williams & Company Limited. Key strengths• Retail and digital retail• Strategy and change management• Technology, Data analytics and AIExternal appointmentsJoshua is a Non-Executive Director of a number of digitally based public and private companies in the UK and Israel including SimilarWeb, Moon Active, Sparkbeyond, EyeSpy360, Hexa, Woo.io, SeeTrue and Dropit Shopping.
Rachel IzzardChief Financial OfficerAppointed to the Board: June 2020Meetings attended 8/8Rachel was appointed as CFO in June 2020 after joining the Company in April 2020. Prior to this she was CFO at Aer Lingus, leading the Finance and Technology functions, successfully driving a step change in performance, and integrating the company into the IAG group. Over her career Rachel has held a range of CFO, technology, and senior finance roles in the Airline and Logistics sectors, based in locations in Asia, the US and Europe. Key strengths• Strategy and change management• Retail and digital retail• Corporate finance• Governance• Risk management• Technology, data analytics and AIExternal appointmentsRachel is a Non-Executive Director and Chair of the Audit and Risk Committee at Raspberry Pi.
Dominic PlattIndependent Non-Executive DirectorAppointed: June 2021Meetings attended 6/6Dominic was appointed to the Board on 10 June 2021. Dominic is the current Chief Financial Officer of BGL Group, a position he has held since March 2016. Prior to joining BGL he was Group Finance Director and MD of International Businesses at Darty plc from 2010-2015 and spent 18 years at Cable and Wireless plc where he held a number of financial roles. Dominic is the Chair of the N Brown Audit and Risk Committee. Key strengths• Financial Services • Retail and digital retail• Governance • Strategy and change management• Corporate finance• Risk management External appointmentsDominic is the Chief Financial Officer at BGL.
Gill BarrSenior Independent Non-Executive DirectorAppointed to the Board: January 2018Appointed Senior Independent Director: March 2021Meetings attended 7/7Gill joined the Board in January 2018 and was appointed Senior Independent Director in March 2021. She was previously a Non-Executive Director of Morgan Sindall Plc, Group Marketing Director of The Co- operative Group and Marketing Director of John Lewis. Gill also spent seven years at Kingfisher plc in a variety of senior strategy, marketing and business development roles. Gill is the Chair of the N Brown Remuneration Committee.Key strengths• Retail and digital retail• Strategy and change management• Financial Services• Governance• Remuneration• MarketingExternal appointmentsGill is a Non-Executive Director of PayPoint Plc and Wincanton Plc.
Michael Mustard General Counsel and Company SecretaryAppointed: March 2022 Michael joined the Group in March 2022. Prior to joining he was Legal Director and Company Secretary at Tesco Bank and a member of the Bank’s Executive, working closely with the retail leadership team. He brings with him considerable commercial, M&A and regulatory investigation experience. Prior to joining Tesco Bank he held senior positions in banking, law and private equity and is a qualified chartered accountant. Key strengths• Financial Services • GovernanceExternal appointmentsNone.
LEADERSHIP AND PURPOSE
GROUP BOARD DIRECTORS
N Brown Group plc Annual Report and Accounts 2022nbrown.co.uk56
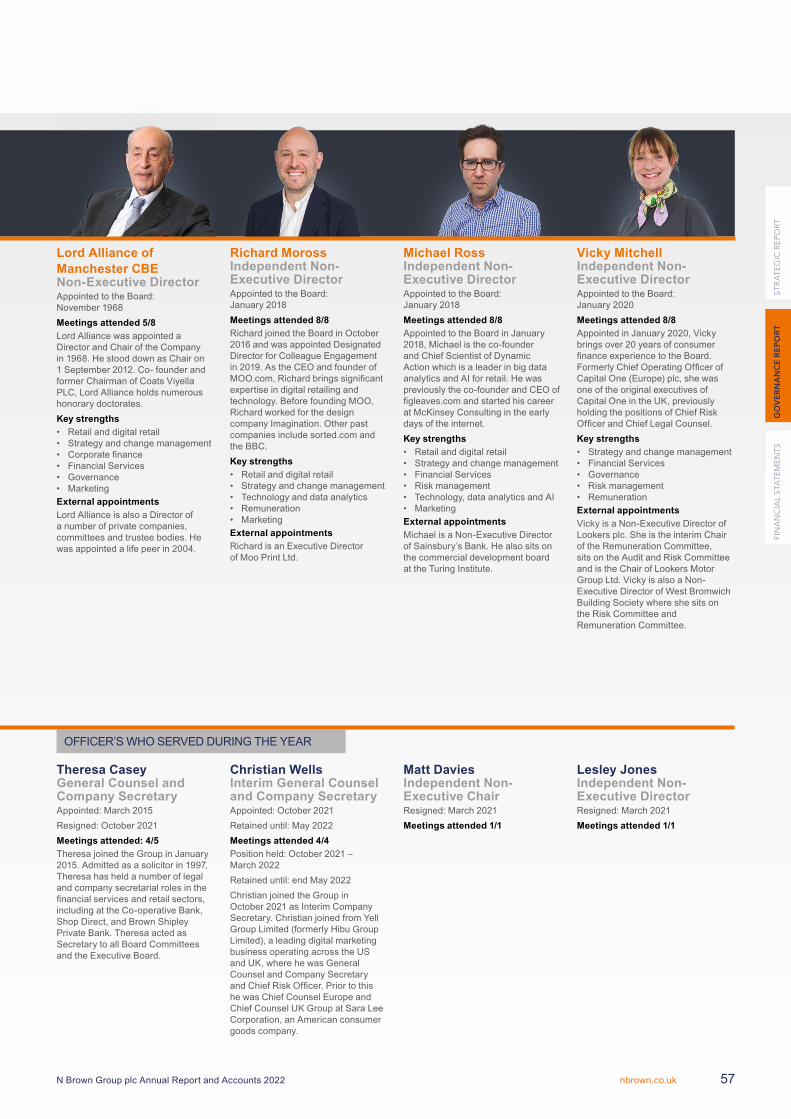
Michael RossIndependent Non-Executive DirectorAppointed to the Board: January 2018 Meetings attended 8/8Appointed to the Board in January 2018, Michael is the co-founder and Chief Scientist of Dynamic Action which is a leader in big data analytics and AI for retail. He was previously the co-founder and CEO of figleaves.com and started his career at McKinsey Consulting in the early days of the internet.Key strengths• Retail and digital retail• Strategy and change management• Financial Services• Risk management• Technology, data analytics and AI• MarketingExternal appointmentsMichael is a Non-Executive Director of Sainsbury’s Bank. He also sits on the commercial development board at the Turing Institute.
Lord Alliance of Manchester CBENon-Executive DirectorAppointed to the Board: November 1968Meetings attended 5/8 Lord Alliance was appointed a Director and Chair of the Company in 1968. He stood down as Chair on 1 September 2012. Co- founder and former Chairman of Coats Viyella PLC, Lord Alliance holds numerous honorary doctorates. Key strengths• Retail and digital retail• Strategy and change management• Corporate finance• Financial Services• Governance• MarketingExternal appointmentsLord Alliance is also a Director of a number of private companies, committees and trustee bodies. He was appointed a life peer in 2004.
Richard MorossIndependent Non-Executive DirectorAppointed to the Board: January 2018 Meetings attended 8/8Richard joined the Board in October 2016 and was appointed Designated Director for Colleague Engagement in 2019. As the CEO and founder of MOO.com, Richard brings significant expertise in digital retailing and technology. Before founding MOO, Richard worked for the design company Imagination. Other past companies include sorted.com and the BBC. Key strengths• Retail and digital retail• Strategy and change management• Technology and data analytics• Remuneration• MarketingExternal appointmentsRichard is an Executive Director of Moo Print Ltd.
Vicky MitchellIndependent Non-Executive DirectorAppointed to the Board: January 2020 Meetings attended 8/8Appointed in January 2020, Vicky brings over 20 years of consumer finance experience to the Board. Formerly Chief Operating Officer of Capital One (Europe) plc, she was one of the original executives of Capital One in the UK, previously holding the positions of Chief Risk Officer and Chief Legal Counsel.Key strengths• Strategy and change management• Financial Services• Governance• Risk management• RemunerationExternal appointmentsVicky is a Non-Executive Director of Lookers plc. She is the interim Chair of the Remuneration Committee, sits on the Audit and Risk Committee and is the Chair of Lookers Motor Group Ltd. Vicky is also a Non-Executive Director of West Bromwich Building Society where she sits on the Risk Committee and Remuneration Committee.
OFFICER’S WHO SERVED DURING THE YEAR
Theresa Casey General Counsel and Company SecretaryAppointed: March 2015Resigned: October 2021 Meetings attended: 4/5Theresa joined the Group in January 2015. Admitted as a solicitor in 1997, Theresa has held a number of legal and company secretarial roles in the financial services and retail sectors, including at the Co-operative Bank, Shop Direct, and Brown Shipley Private Bank. Theresa acted as Secretary to all Board Committees and the Executive Board.
Christian WellsInterim General Counsel and Company SecretaryAppointed: October 2021 Retained until: May 2022Meetings attended 4/4Position held: October 2021 – March 2022 Retained until: end May 2022Christian joined the Group in October 2021 as Interim Company Secretary. Christian joined from Yell Group Limited (formerly Hibu Group Limited), a leading digital marketing business operating across the US and UK, where he was General Counsel and Company Secretary and Chief Risk Officer. Prior to this he was Chief Counsel Europe and Chief Counsel UK Group at Sara Lee Corporation, an American consumer goods company.
Matt DaviesIndependent Non-Executive ChairResigned: March 2021Meetings attended 1/1
Lesley JonesIndependent Non-Executive DirectorResigned: March 2021Meetings attended 1/1
FIN
AN
CIA
L S
TAT
EM
EN
TS
GO
VE
RN
AN
CE
RE
PO
RT
ST
RA
TE
GIC
RE
PO
RT
N Brown Group plc Annual Report and Accounts 2022 nbrown.co.uk 57
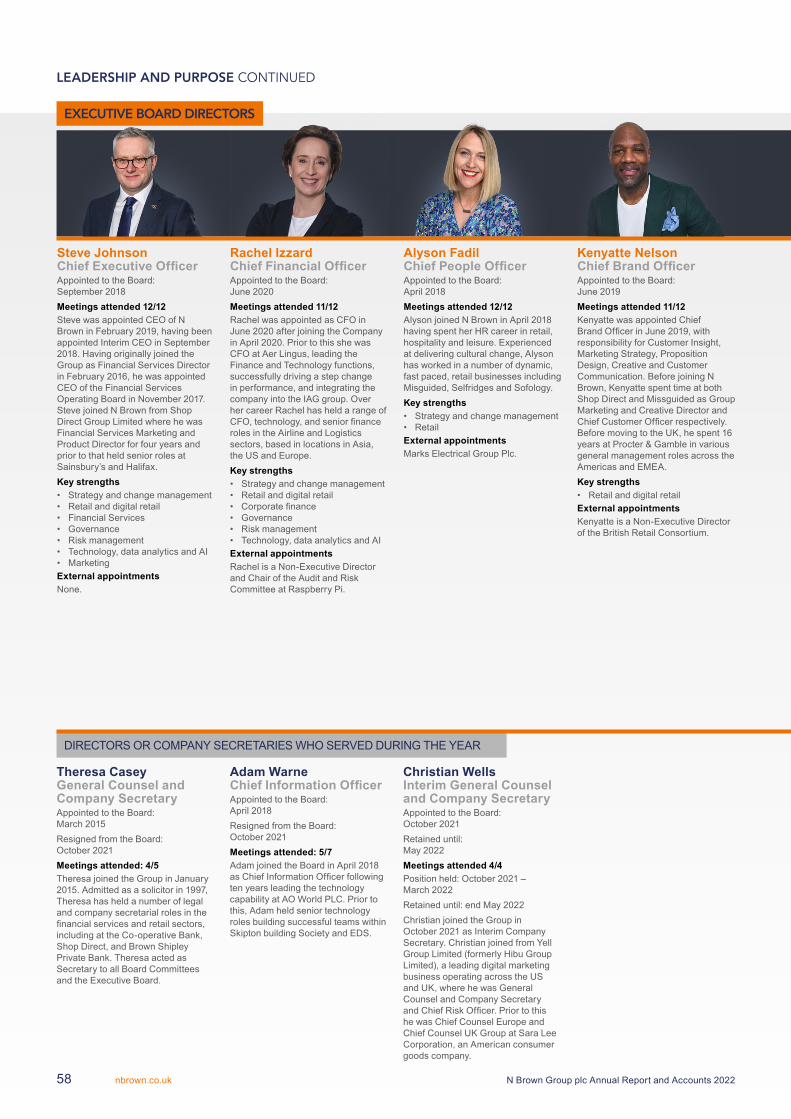
DIRECTORS OR COMPANY SECRETARIES WHO SERVED DURING THE YEAR
Theresa Casey General Counsel and Company SecretaryAppointed to the Board: March 2015Resigned from the Board: October 2021 Meetings attended: 4/5Theresa joined the Group in January 2015. Admitted as a solicitor in 1997, Theresa has held a number of legal and company secretarial roles in the financial services and retail sectors, including at the Co-operative Bank, Shop Direct, and Brown Shipley Private Bank. Theresa acted as Secretary to all Board Committees and the Executive Board.
Adam WarneChief Information OfficerAppointed to the Board: April 2018 Resigned from the Board: October 2021Meetings attended: 5/7Adam joined the Board in April 2018 as Chief Information Officer following ten years leading the technology capability at AO World PLC. Prior to this, Adam held senior technology roles building successful teams within Skipton building Society and EDS.
Christian WellsInterim General Counsel and Company SecretaryAppointed to the Board: October 2021 Retained until: May 2022Meetings attended 4/4Position held: October 2021 – March 2022 Retained until: end May 2022Christian joined the Group in October 2021 as Interim Company Secretary. Christian joined from Yell Group Limited (formerly Hibu Group Limited), a leading digital marketing business operating across the US and UK, where he was General Counsel and Company Secretary and Chief Risk Officer. Prior to this he was Chief Counsel Europe and Chief Counsel UK Group at Sara Lee Corporation, an American consumer goods company.
Kenyatte NelsonChief Brand OfficerAppointed to the Board: June 2019 Meetings attended 11/12Kenyatte was appointed Chief Brand Officer in June 2019, with responsibility for Customer Insight, Marketing Strategy, Proposition Design, Creative and Customer Communication. Before joining N Brown, Kenyatte spent time at both Shop Direct and Missguided as Group Marketing and Creative Director and Chief Customer Officer respectively. Before moving to the UK, he spent 16 years at Procter & Gamble in various general management roles across the Americas and EMEA. Key strengths• Retail and digital retailExternal appointmentsKenyatte is a Non-Executive Director of the British Retail Consortium.
Steve JohnsonChief Executive OfficerAppointed to the Board: September 2018Meetings attended 12/12 Steve was appointed CEO of N Brown in February 2019, having been appointed Interim CEO in September 2018. Having originally joined the Group as Financial Services Director in February 2016, he was appointed CEO of the Financial Services Operating Board in November 2017. Steve joined N Brown from Shop Direct Group Limited where he was Financial Services Marketing and Product Director for four years and prior to that held senior roles at Sainsbury’s and Halifax. Key strengths• Strategy and change management • Retail and digital retail • Financial Services • Governance • Risk management • Technology, data analytics and AI • Marketing External appointmentsNone.
Rachel IzzardChief Financial OfficerAppointed to the Board: June 2020Meetings attended 11/12Rachel was appointed as CFO in June 2020 after joining the Company in April 2020. Prior to this she was CFO at Aer Lingus, leading the Finance and Technology functions, successfully driving a step change in performance, and integrating the company into the IAG group. Over her career Rachel has held a range of CFO, technology, and senior finance roles in the Airline and Logistics sectors, based in locations in Asia, the US and Europe. Key strengths• Strategy and change management • Retail and digital retail • Corporate finance • Governance • Risk management • Technology, data analytics and AI External appointmentsRachel is a Non-Executive Director and Chair of the Audit and Risk Committee at Raspberry Pi.
Alyson Fadil Chief People OfficerAppointed to the Board: April 2018 Meetings attended 12/12 Alyson joined N Brown in April 2018 having spent her HR career in retail, hospitality and leisure. Experienced at delivering cultural change, Alyson has worked in a number of dynamic, fast paced, retail businesses including Misguided, Selfridges and Sofology.Key strengths• Strategy and change management • RetailExternal appointmentsMarks Electrical Group Plc.
LEADERSHIP AND PURPOSE CONTINUED
EXECUTIVE BOARD DIRECTORS
N Brown Group plc Annual Report and Accounts 2022nbrown.co.uk58
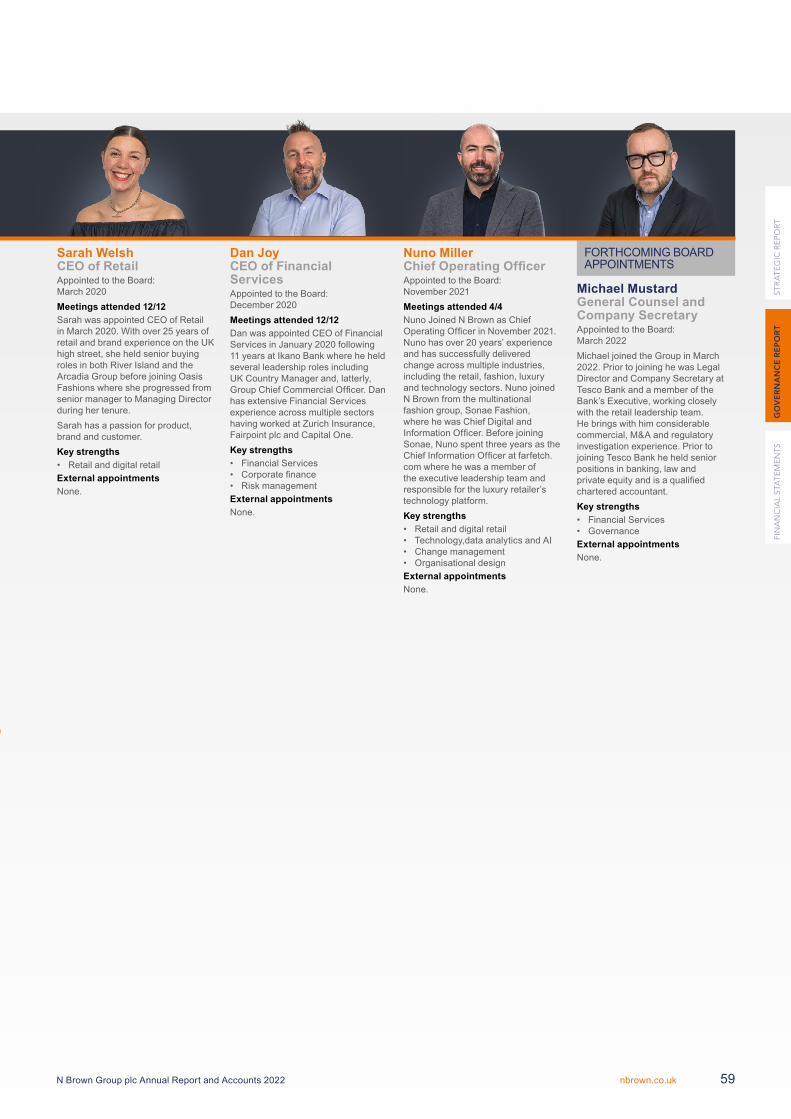
FORTHCOMING BOARD APPOINTMENTS
Michael Mustard General Counsel and Company SecretaryAppointed to the Board: March 2022 Michael joined the Group in March 2022. Prior to joining he was Legal Director and Company Secretary at Tesco Bank and a member of the Bank’s Executive, working closely with the retail leadership team. He brings with him considerable commercial, M&A and regulatory investigation experience. Prior to joining Tesco Bank he held senior positions in banking, law and private equity and is a qualified chartered accountant. Key strengths• Financial Services • GovernanceExternal appointmentsNone.
Dan JoyCEO of Financial ServicesAppointed to the Board: December 2020Meetings attended 12/12Dan was appointed CEO of Financial Services in January 2020 following 11 years at Ikano Bank where he held several leadership roles including UK Country Manager and, latterly, Group Chief Commercial Officer. Dan has extensive Financial Services experience across multiple sectors having worked at Zurich Insurance, Fairpoint plc and Capital One. Key strengths• Financial Services • Corporate finance• Risk managementExternal appointmentsNone.
Sarah WelshCEO of RetailAppointed to the Board: March 2020 Meetings attended 12/12Sarah was appointed CEO of Retail in March 2020. With over 25 years of retail and brand experience on the UK high street, she held senior buying roles in both River Island and the Arcadia Group before joining Oasis Fashions where she progressed from senior manager to Managing Director during her tenure. Sarah has a passion for product, brand and customer.Key strengths• Retail and digital retailExternal appointmentsNone.
Nuno Miller Chief Operating OfficerAppointed to the Board: November 2021Meetings attended 4/4 Nuno Joined N Brown as Chief Operating Officer in November 2021. Nuno has over 20 years’ experience and has successfully delivered change across multiple industries, including the retail, fashion, luxury and technology sectors. Nuno joined N Brown from the multinational fashion group, Sonae Fashion, where he was Chief Digital and Information Officer. Before joining Sonae, Nuno spent three years as the Chief Information Officer at farfetch.com where he was a member of the executive leadership team and responsible for the luxury retailer’s technology platform. Key strengths • Retail and digital retail• Technology,data analytics and AI• Change management • Organisational designExternal appointmentsNone.
FIN
AN
CIA
L S
TAT
EM
EN
TS
GO
VE
RN
AN
CE
RE
PO
RT
ST
RA
TE
GIC
RE
PO
RT
N Brown Group plc Annual Report and Accounts 2022 nbrown.co.uk 59
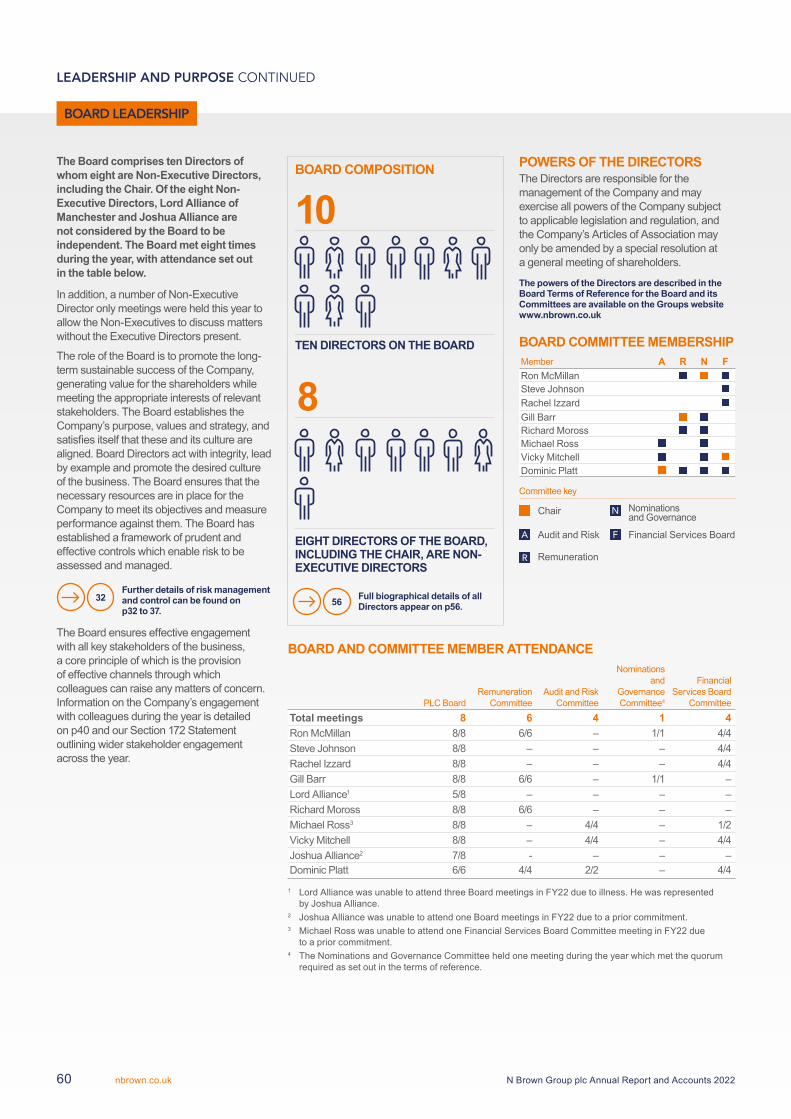
The Board comprises ten Directors of whom eight are Non-Executive Directors, including the Chair. Of the eight Non-Executive Directors, Lord Alliance of Manchester and Joshua Alliance are not considered by the Board to be independent. The Board met eight times during the year, with attendance set out in the table below.
In addition, a number of Non-Executive Director only meetings were held this year to allow the Non-Executives to discuss matters without the Executive Directors present.
The role of the Board is to promote the long-term sustainable success of the Company, generating value for the shareholders while meeting the appropriate interests of relevant stakeholders. The Board establishes the Company’s purpose, values and strategy, and satisfies itself that these and its culture are aligned. Board Directors act with integrity, lead by example and promote the desired culture of the business. The Board ensures that the necessary resources are in place for the Company to meet its objectives and measure performance against them. The Board has established a framework of prudent and effective controls which enable risk to be assessed and managed.
Further details of risk management and control can be found on p32 to 37.
32
The Board ensures effective engagement with all key stakeholders of the business, a core principle of which is the provision of effective channels through which colleagues can raise any matters of concern. Information on the Company’s engagement with colleagues during the year is detailed on p40 and our Section 172 Statement outlining wider stakeholder engagement across the year.
POWERS OF THE DIRECTORS The Directors are responsible for the management of the Company and may exercise all powers of the Company subject to applicable legislation and regulation, and the Company’s Articles of Association may only be amended by a special resolution at a general meeting of shareholders.
The powers of the Directors are described in the Board Terms of Reference for the Board and its Committees are available on the Groups website www.nbrown.co.uk
BOARD COMMITTEE MEMBERSHIP Member A R N FRon McMillanSteve Johnson Rachel Izzard Gill BarrRichard MorossMichael RossVicky MitchellDominic Platt
Committee key
Chair N Nominations and Governance
A Audit and Risk F Financial Services Board
R Remuneration
BOARD AND COMMITTEE MEMBER ATTENDANCE
PLC BoardRemuneration
CommitteeAudit and Risk
Committee
Nominations and
GovernanceCommittee4
Financial Services Board
CommitteeTotal meetings 8 6 4 1 4Ron McMillan 8/8 6/6 – 1/1 4/4Steve Johnson 8/8 – – – 4/4Rachel Izzard 8/8 – – – 4/4Gill Barr 8/8 6/6 – 1/1 –Lord Alliance1 5/8 – – – –Richard Moross 8/8 6/6 – – –Michael Ross3 8/8 – 4/4 – 1/2Vicky Mitchell 8/8 – 4/4 – 4/4Joshua Alliance2 7/8 - – – –Dominic Platt 6/6 4/4 2/2 – 4/4
1 Lord Alliance was unable to attend three Board meetings in FY22 due to illness. He was represented by Joshua Alliance.
2 Joshua Alliance was unable to attend one Board meetings in FY22 due to a prior commitment.3 Michael Ross was unable to attend one Financial Services Board Committee meeting in FY22 due
to a prior commitment. 4 The Nominations and Governance Committee held one meeting during the year which met the quorum
required as set out in the terms of reference.
LEADERSHIP AND PURPOSE CONTINUED
BOARD LEADERSHIP
N Brown Group plc Annual Report and Accounts 2022nbrown.co.uk60
Full biographical details of all Directors appear on p56.56
BOARD COMPOSITION
10
TEN DIRECTORS ON THE BOARD
8
EIGHT DIRECTORS OF THE BOARD, INCLUDING THE CHAIR, ARE NON-EXECUTIVE DIRECTORS
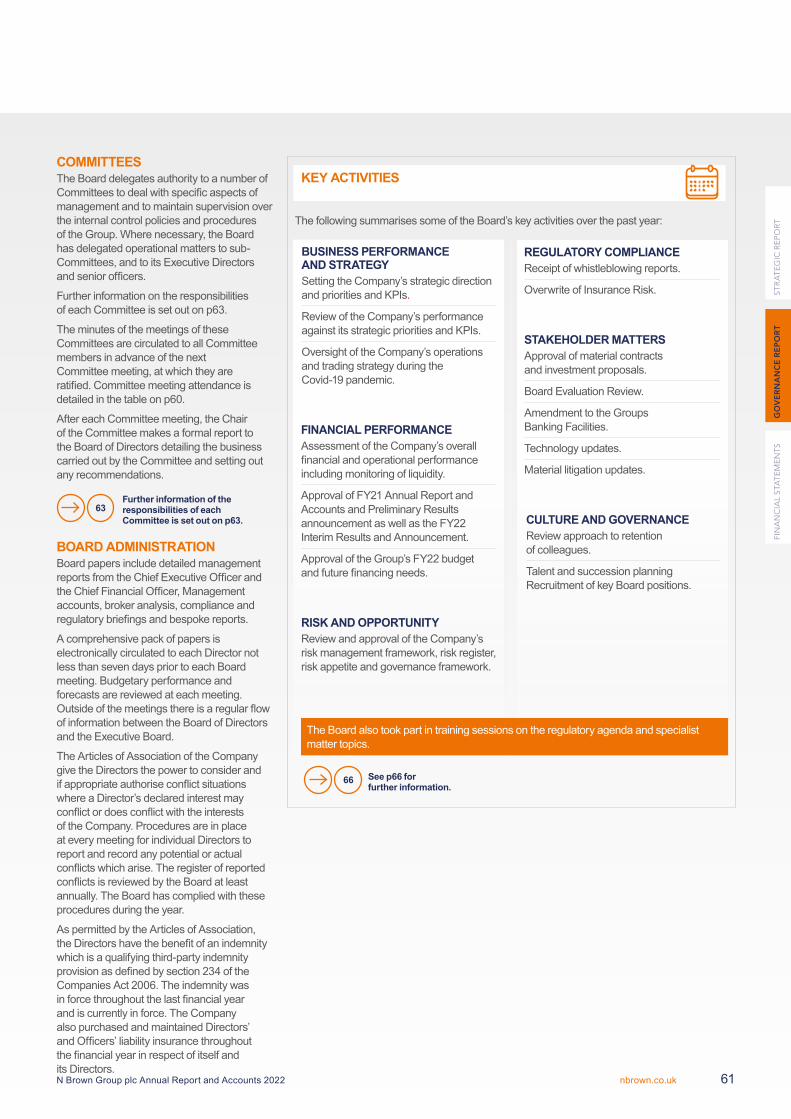
COMMITTEESThe Board delegates authority to a number of Committees to deal with specific aspects of management and to maintain supervision over the internal control policies and procedures of the Group. Where necessary, the Board has delegated operational matters to sub-Committees, and to its Executive Directors and senior officers.
Further information on the responsibilities of each Committee is set out on p63.
The minutes of the meetings of these Committees are circulated to all Committee members in advance of the next Committee meeting, at which they are ratified. Committee meeting attendance is detailed in the table on p60.
After each Committee meeting, the Chair of the Committee makes a formal report to the Board of Directors detailing the business carried out by the Committee and setting out any recommendations.
Further information of the responsibilities of each Committee is set out on p63.
63
BOARD ADMINISTRATION Board papers include detailed management reports from the Chief Executive Officer and the Chief Financial Officer, Management accounts, broker analysis, compliance and regulatory briefings and bespoke reports.
A comprehensive pack of papers is electronically circulated to each Director not less than seven days prior to each Board meeting. Budgetary performance and forecasts are reviewed at each meeting. Outside of the meetings there is a regular flow of information between the Board of Directors and the Executive Board.
The Articles of Association of the Company give the Directors the power to consider and if appropriate authorise conflict situations where a Director’s declared interest may conflict or does conflict with the interests of the Company. Procedures are in place at every meeting for individual Directors to report and record any potential or actual conflicts which arise. The register of reported conflicts is reviewed by the Board at least annually. The Board has complied with these procedures during the year.
As permitted by the Articles of Association, the Directors have the benefit of an indemnity which is a qualifying third-party indemnity provision as defined by section 234 of the Companies Act 2006. The indemnity was in force throughout the last financial year and is currently in force. The Company also purchased and maintained Directors’ and Officers’ liability insurance throughout the financial year in respect of itself and its Directors.
The following summarises some of the Board’s key activities over the past year:
The Board also took part in training sessions on the regulatory agenda and specialist matter topics.
KEY ACTIVITIES
BUSINESS PERFORMANCE AND STRATEGYSetting the Company’s strategic direction and priorities and KPIs.
Review of the Company’s performance against its strategic priorities and KPIs.
Oversight of the Company’s operations and trading strategy during the Covid-19 pandemic.
FINANCIAL PERFORMANCEAssessment of the Company’s overall financial and operational performance including monitoring of liquidity.
Approval of FY21 Annual Report and Accounts and Preliminary Results announcement as well as the FY22 Interim Results and Announcement.
Approval of the Group’s FY22 budget and future financing needs.
RISK AND OPPORTUNITYReview and approval of the Company’s risk management framework, risk register, risk appetite and governance framework.
REGULATORY COMPLIANCEReceipt of whistleblowing reports.
Overwrite of Insurance Risk.
STAKEHOLDER MATTERSApproval of material contracts and investment proposals.
Board Evaluation Review.
Amendment to the Groups Banking Facilities.
Technology updates.
Material litigation updates.
CULTURE AND GOVERNANCEReview approach to retention of colleagues.
Talent and succession planning Recruitment of key Board positions.
See p66 for further information.
66FI
NA
NC
IAL
STA
TE
ME
NT
SG
OV
ER
NA
NC
E R
EP
OR
T S
TR
AT
EG
IC R
EP
OR
T
N Brown Group plc Annual Report and Accounts 2022 nbrown.co.uk 61
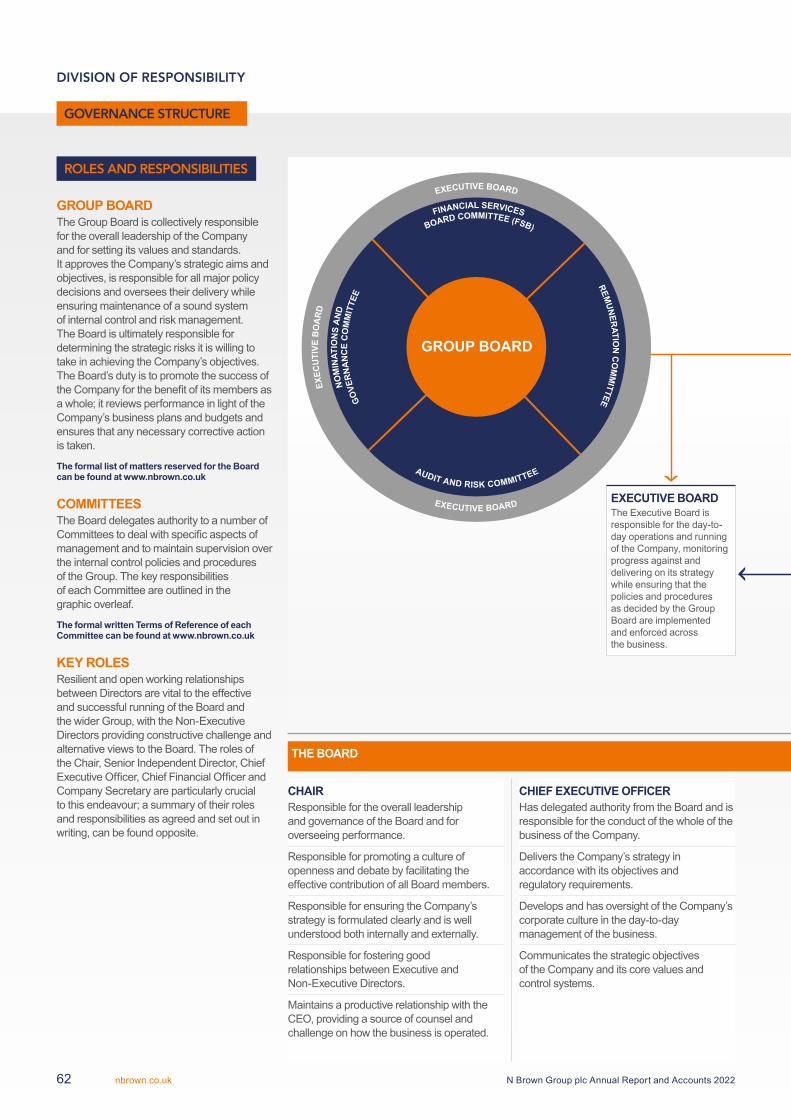
FINANCIAL SERVICESBOARD COMMITTEE (FSB)
NOM
INAT
ION
S A
ND
GO
VER
NA
NC
E C
OM
MIT
TEE
REMUNER
ATION
CO
MM
ITTEEEXECUTIVE BOARD
EXEC
UTI
VE B
OA
RD
EXECUTIVE BOARD
AUDIT AND RISK COMMITTEE
GROUP BOARD
EXECUTIVE BOARDThe Executive Board is responsible for the day-to-day operations and running of the Company, monitoring progress against and delivering on its strategy while ensuring that the policies and procedures as decided by the Group Board are implemented and enforced across the business.
GROUP BOARD The Group Board is collectively responsible for the overall leadership of the Company and for setting its values and standards. It approves the Company’s strategic aims and objectives, is responsible for all major policy decisions and oversees their delivery while ensuring maintenance of a sound system of internal control and risk management. The Board is ultimately responsible for determining the strategic risks it is willing to take in achieving the Company’s objectives. The Board’s duty is to promote the success of the Company for the benefit of its members as a whole; it reviews performance in light of the Company’s business plans and budgets and ensures that any necessary corrective action is taken.
The formal list of matters reserved for the Board can be found at www.nbrown.co.uk
COMMITTEES The Board delegates authority to a number of Committees to deal with specific aspects of management and to maintain supervision over the internal control policies and procedures of the Group. The key responsibilities of each Committee are outlined in the graphic overleaf.
The formal written Terms of Reference of each Committee can be found at www.nbrown.co.uk
KEY ROLES Resilient and open working relationships between Directors are vital to the effective and successful running of the Board and the wider Group, with the Non-Executive Directors providing constructive challenge and alternative views to the Board. The roles of the Chair, Senior Independent Director, Chief Executive Officer, Chief Financial Officer and Company Secretary are particularly crucial to this endeavour; a summary of their roles and responsibilities as agreed and set out in writing, can be found opposite.
CHAIRResponsible for the overall leadership and governance of the Board and for overseeing performance.
Responsible for promoting a culture of openness and debate by facilitating the effective contribution of all Board members.
Responsible for ensuring the Company’s strategy is formulated clearly and is well understood both internally and externally.
Responsible for fostering good relationships between Executive and Non-Executive Directors.
Maintains a productive relationship with the CEO, providing a source of counsel and challenge on how the business is operated.
CHIEF EXECUTIVE OFFICERHas delegated authority from the Board and is responsible for the conduct of the whole of the business of the Company.
Delivers the Company’s strategy in accordance with its objectives and regulatory requirements.
Develops and has oversight of the Company’s corporate culture in the day-to-day management of the business.
Communicates the strategic objectives of the Company and its core values and control systems.
THE BOARD
DIVISION OF RESPONSIBILITY
GOVERNANCE STRUCTURE
ROLES AND RESPONSIBILITIES
N Brown Group plc Annual Report and Accounts 2022nbrown.co.uk62
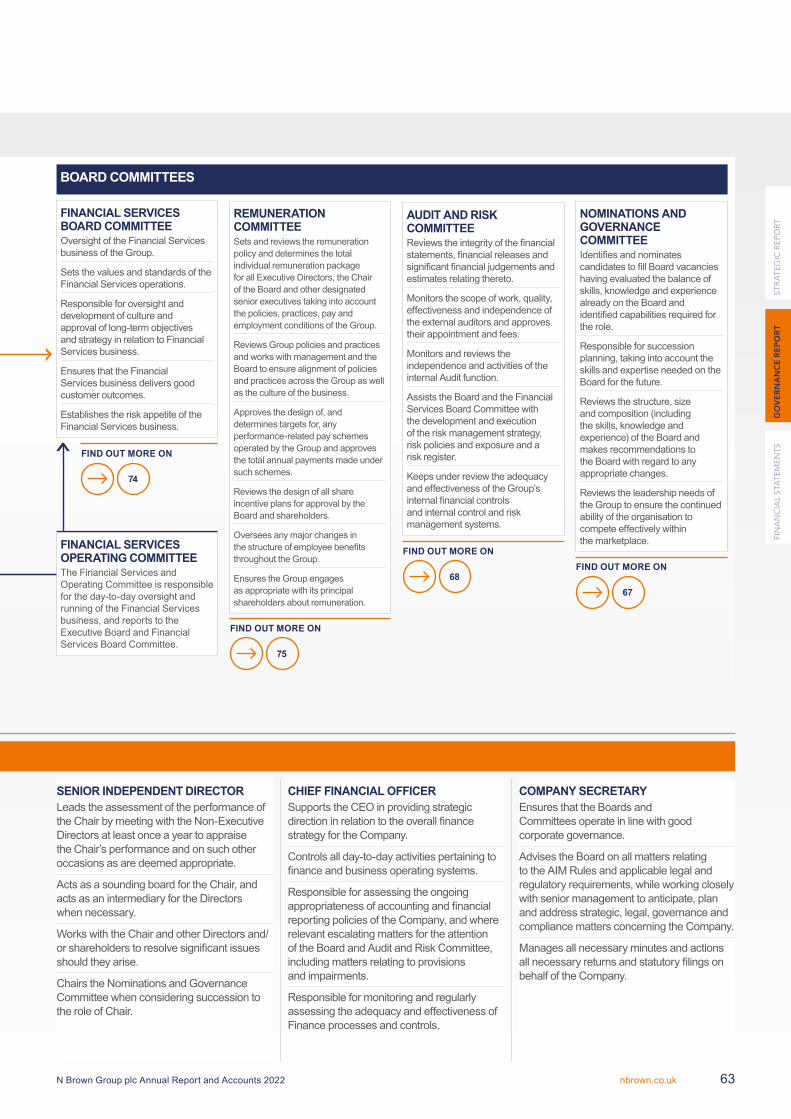
FINANCIAL SERVICES BOARD COMMITTEE Oversight of the Financial Services business of the Group.
Sets the values and standards of the Financial Services operations.
Responsible for oversight and development of culture and approval of long-term objectives and strategy in relation to Financial Services business.
Ensures that the Financial Services business delivers good customer outcomes.
Establishes the risk appetite of the Financial Services business.
AUDIT AND RISK COMMITTEEReviews the integrity of the financial statements, financial releases and significant financial judgements and estimates relating thereto.
Monitors the scope of work, quality, effectiveness and independence of the external auditors and approves their appointment and fees.
Monitors and reviews the independence and activities of the internal Audit function.
Assists the Board and the Financial Services Board Committee with the development and execution of the risk management strategy, risk policies and exposure and a risk register.
Keeps under review the adequacy and effectiveness of the Group’s internal financial controls and internal control and risk management systems.
REMUNERATION COMMITTEESets and reviews the remuneration policy and determines the total individual remuneration package for all Executive Directors, the Chair of the Board and other designated senior executives taking into account the policies, practices, pay and employment conditions of the Group.
Reviews Group policies and practices and works with management and the Board to ensure alignment of policies and practices across the Group as well as the culture of the business.
Approves the design of, and determines targets for, any performance-related pay schemes operated by the Group and approves the total annual payments made under such schemes.
Reviews the design of all share incentive plans for approval by the Board and shareholders.
Oversees any major changes in the structure of employee benefits throughout the Group.
Ensures the Group engages as appropriate with its principal shareholders about remuneration.
NOMINATIONS AND GOVERNANCE COMMITTEE Identifies and nominates candidates to fill Board vacancies having evaluated the balance of skills, knowledge and experience already on the Board and identified capabilities required for the role.
Responsible for succession planning, taking into account the skills and expertise needed on the Board for the future.
Reviews the structure, size and composition (including the skills, knowledge and experience) of the Board and makes recommendations to the Board with regard to any appropriate changes.
Reviews the leadership needs of the Group to ensure the continued ability of the organisation to compete effectively within the marketplace.
BOARD COMMITTEES
FINANCIAL SERVICES OPERATING COMMITTEEThe Financial Services and Operating Committee is responsible for the day-to-day oversight and running of the Financial Services business, and reports to the Executive Board and Financial Services Board Committee.
SENIOR INDEPENDENT DIRECTORLeads the assessment of the performance of the Chair by meeting with the Non-Executive Directors at least once a year to appraise the Chair’s performance and on such other occasions as are deemed appropriate.
Acts as a sounding board for the Chair, and acts as an intermediary for the Directors when necessary.
Works with the Chair and other Directors and/or shareholders to resolve significant issues should they arise.
Chairs the Nominations and Governance Committee when considering succession to the role of Chair.
THE BOARD
CHIEF FINANCIAL OFFICERSupports the CEO in providing strategic direction in relation to the overall finance strategy for the Company.
Controls all day-to-day activities pertaining to finance and business operating systems.
Responsible for assessing the ongoing appropriateness of accounting and financial reporting policies of the Company, and where relevant escalating matters for the attention of the Board and Audit and Risk Committee, including matters relating to provisions and impairments.
Responsible for monitoring and regularly assessing the adequacy and effectiveness of Finance processes and controls.
COMPANY SECRETARYEnsures that the Boards and Committees operate in line with good corporate governance.
Advises the Board on all matters relating to the AIM Rules and applicable legal and regulatory requirements, while working closely with senior management to anticipate, plan and address strategic, legal, governance and compliance matters concerning the Company.
Manages all necessary minutes and actions all necessary returns and statutory filings on behalf of the Company.
FIND OUT MORE ON
75
FIND OUT MORE ON
67
FIND OUT MORE ON
74
FIND OUT MORE ON
68
FIN
AN
CIA
L S
TAT
EM
EN
TS
GO
VE
RN
AN
CE
RE
PO
RT
ST
RA
TE
GIC
RE
PO
RT
N Brown Group plc Annual Report and Accounts 2022 nbrown.co.uk 63
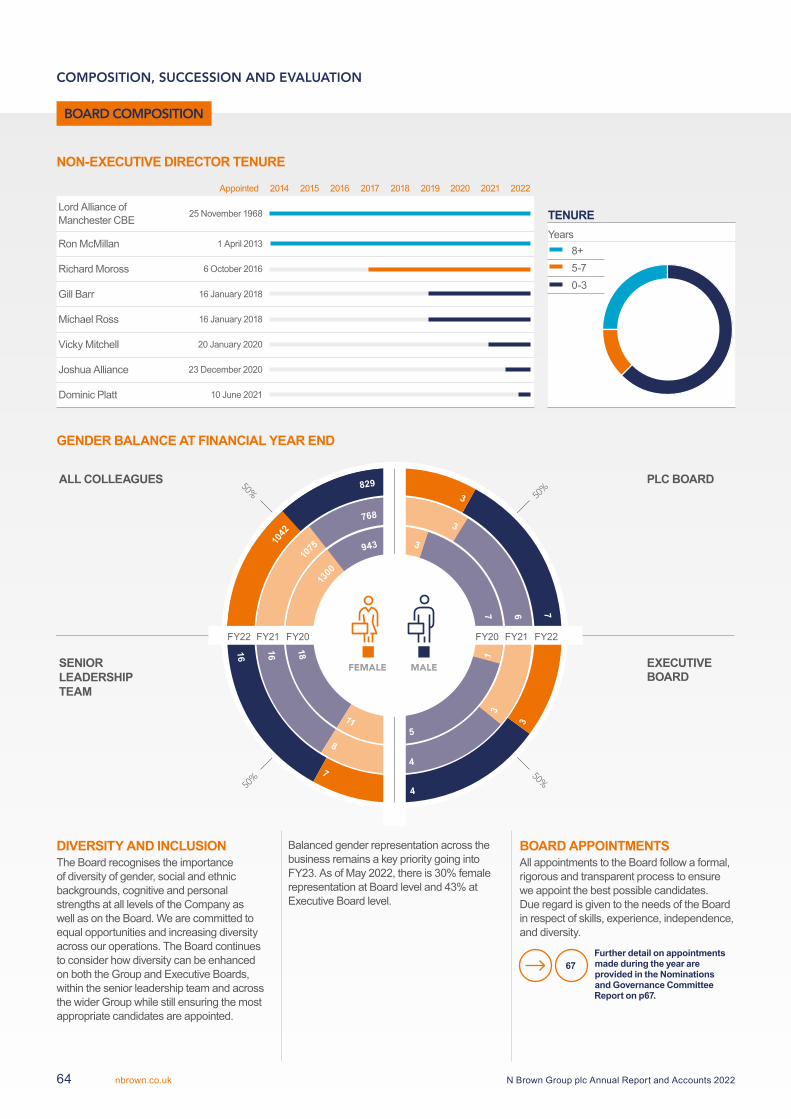
50%
50%
50%
50%
GENDER BALANCE AT FINANCIAL YEAR END
FEMALE MALE
ALL COLLEAGUES
SENIOR LEADERSHIP TEAM
PLC BOARD
EXECUTIVE BOARD
4
7
16
DIVERSITY AND INCLUSIONThe Board recognises the importance of diversity of gender, social and ethnic backgrounds, cognitive and personal strengths at all levels of the Company as well as on the Board. We are committed to equal opportunities and increasing diversity across our operations. The Board continues to consider how diversity can be enhanced on both the Group and Executive Boards, within the senior leadership team and across the wider Group while still ensuring the most appropriate candidates are appointed.
Balanced gender representation across the business remains a key priority going into FY23. As of May 2022, there is 30% female representation at Board level and 43% at Executive Board level.
BOARD APPOINTMENTSAll appointments to the Board follow a formal, rigorous and transparent process to ensure we appoint the best possible candidates. Due regard is given to the needs of the Board in respect of skills, experience, independence, and diversity.
67 Further detail on appointments made during the year are provided in the Nominations and Governance Committee Report on p67.
7
5
18
943
768
829
1042
7 6
3
3
8
3
3
3
1
11
10
75
1300
4
FY22FY20 FY21FY21 FY20FY22
16
Appointed 2014 2015 2016 2017 2018 2019 2020 2021 2022
Lord Alliance of Manchester CBE
25 November 1968
Ron McMillan 1 April 2013
Richard Moross 6 October 2016
Gill Barr 16 January 2018
Michael Ross 16 January 2018
Vicky Mitchell 20 January 2020
Joshua Alliance 23 December 2020
Dominic Platt 10 June 2021
TENUREYears
8+5-70-3
COMPOSITION, SUCCESSION AND EVALUATION
BOARD COMPOSITION
NON-EXECUTIVE DIRECTOR TENURE
N Brown Group plc Annual Report and Accounts 2022nbrown.co.uk64
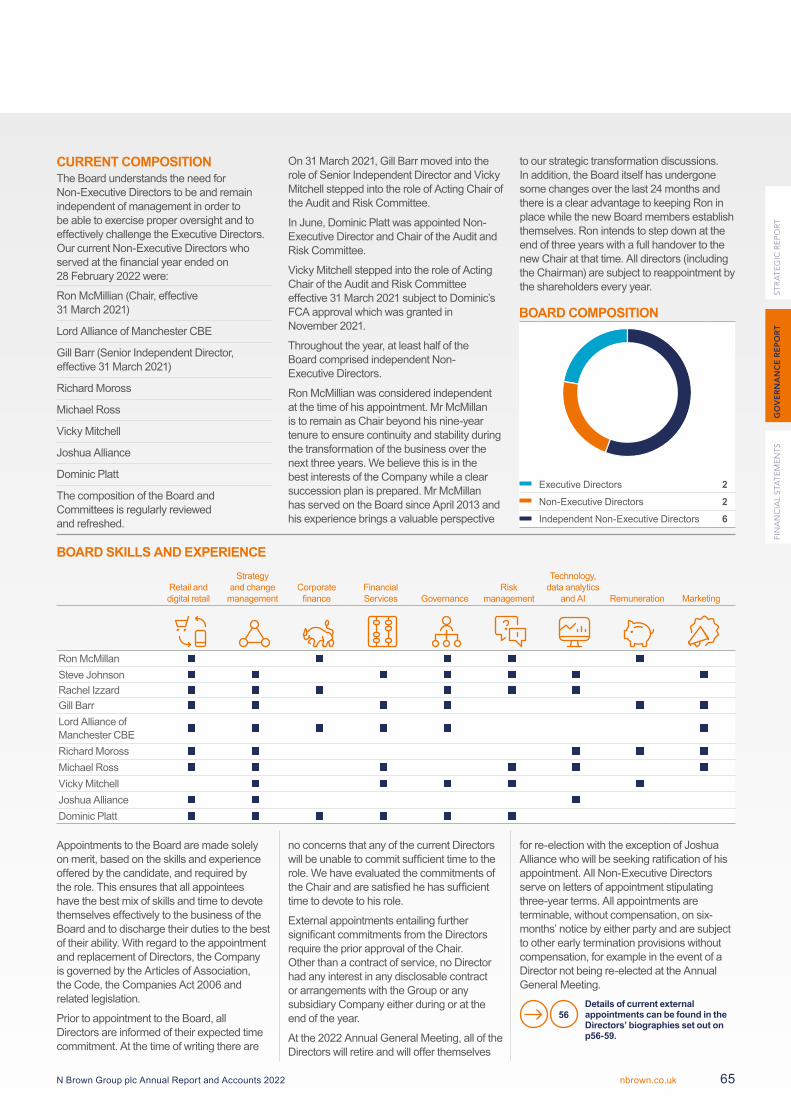
CURRENT COMPOSITION The Board understands the need for Non-Executive Directors to be and remain independent of management in order to be able to exercise proper oversight and to effectively challenge the Executive Directors. Our current Non-Executive Directors who served at the financial year ended on 28 February 2022 were:
Ron McMillian (Chair, effective 31 March 2021)
Lord Alliance of Manchester CBE
Gill Barr (Senior Independent Director, effective 31 March 2021)
Richard Moross
Michael Ross
Vicky Mitchell
Joshua Alliance
Dominic Platt
The composition of the Board and Committees is regularly reviewed and refreshed.
On 31 March 2021, Gill Barr moved into the role of Senior Independent Director and Vicky Mitchell stepped into the role of Acting Chair of the Audit and Risk Committee.
In June, Dominic Platt was appointed Non-Executive Director and Chair of the Audit and Risk Committee.
Vicky Mitchell stepped into the role of Acting Chair of the Audit and Risk Committee effective 31 March 2021 subject to Dominic’s FCA approval which was granted in November 2021.
Throughout the year, at least half of the Board comprised independent Non-Executive Directors.
Ron McMillian was considered independent at the time of his appointment. Mr McMillan is to remain as Chair beyond his nine-year tenure to ensure continuity and stability during the transformation of the business over the next three years. We believe this is in the best interests of the Company while a clear succession plan is prepared. Mr McMillan has served on the Board since April 2013 and his experience brings a valuable perspective
to our strategic transformation discussions. In addition, the Board itself has undergone some changes over the last 24 months and there is a clear advantage to keeping Ron in place while the new Board members establish themselves. Ron intends to step down at the end of three years with a full handover to the new Chair at that time. All directors (including the Chairman) are subject to reappointment by the shareholders every year.
BOARD COMPOSITION
Executive Directors 2Non-Executive Directors 2Independent Non-Executive Directors 6
BOARD SKILLS AND EXPERIENCE
Retail and digital retail
Strategy and change
managementCorporate
financeFinancial Services Governance
Risk management
Technology, data analytics
and AI Remuneration Marketing
Ron McMillanSteve JohnsonRachel IzzardGill BarrLord Alliance of Manchester CBERichard MorossMichael RossVicky MitchellJoshua AllianceDominic Platt
Appointments to the Board are made solely on merit, based on the skills and experience offered by the candidate, and required by the role. This ensures that all appointees have the best mix of skills and time to devote themselves effectively to the business of the Board and to discharge their duties to the best of their ability. With regard to the appointment and replacement of Directors, the Company is governed by the Articles of Association, the Code, the Companies Act 2006 and related legislation.
Prior to appointment to the Board, all Directors are informed of their expected time commitment. At the time of writing there are
no concerns that any of the current Directors will be unable to commit sufficient time to the role. We have evaluated the commitments of the Chair and are satisfied he has sufficient time to devote to his role.
External appointments entailing further significant commitments from the Directors require the prior approval of the Chair. Other than a contract of service, no Director had any interest in any disclosable contract or arrangements with the Group or any subsidiary Company either during or at the end of the year.
At the 2022 Annual General Meeting, all of the Directors will retire and will offer themselves
for re-election with the exception of Joshua Alliance who will be seeking ratification of his appointment. All Non-Executive Directors serve on letters of appointment stipulating three-year terms. All appointments are terminable, without compensation, on six-months’ notice by either party and are subject to other early termination provisions without compensation, for example in the event of a Director not being re-elected at the Annual General Meeting.
Details of current external appointments can be found in the Directors’ biographies set out on p56-59.
56
FIN
AN
CIA
L S
TAT
EM
EN
TS
GO
VE
RN
AN
CE
RE
PO
RT
ST
RA
TE
GIC
RE
PO
RT
N Brown Group plc Annual Report and Accounts 2022 nbrown.co.uk 65
BOARD DEVELOPMENT AND TRAINING The Company Secretary provides an ongoing programme of briefings for Directors covering legal and regulatory changes and developments relevant to the Group’s activities and Directors’ areas of responsibility. The Board has the opportunity for online and in-person training as part of the various Board and Committee meetings.
Board meeting agendas across the year included detailed discussions on the following topics:
Directors Duties
Tech roadmap (including new website front-end development)
Financial Services Platform
OKR Framework
Organisational Design
Product/Brand strategy
Risk Management
Directors also underwent external training and personal development relevant to their roles.
The Company Secretary is responsible for the induction of new Directors. New Directors are provided with a comprehensive pack of information (including Terms of Reference, information regarding the business and guidance on their roles and duties as Directors) and meetings with key colleagues are arranged as appropriate. Inductions to the business for new Directors are designed to expose them to all areas of the Group’s operations but with particular emphasis on each Director’s area of expertise.
Non-Executive Directors meet with the Executive Board members and operational teams and undertake site visits to ensure that they have the most up to date knowledge and understanding of the Company and its activities. This also allows colleagues from across the Company to benefit from the skills and experience of the Non-Executive Directors.
All Board members are permitted to obtain independent professional advice in respect of their own fiduciary duties and obligations and have full and direct access to the Company Secretary, who is a qualified solicitor and attends all Board and Committee meetings as Secretary. The Chair has regular contact with each Director and is able to address their training and development needs.
BOARD EVALUATION In 2022, the Board took part in an internal Board and Committee evaluation.
A comprehensive questionnaire was developed and completed by all Directors. Key focus topics were:
Business Strategy and Risk
Communication and remote working
Wider stakeholders
Shareholder value
Knowledge and skills
Board processes
Performance reviews of all Board and Committees and Chair. evaluation was completed.
The results of the evaluation were assessed by the full Board. Key areas of focus and development over the next 12 months were identified, including:
Board relationships and dynamics
ESG strategy
Risk Appetite review
Shareholder perspectives
Strategic discussions and decision making by the Board
Talent Strategy and Succession Planning
Overall the Board is satisfied with the outcome of the evaluation and believes the performance of the Chair, Committee Chairs and Directors, and their commitment to their respective roles, continues to be fully effective. The Board and its Committees continue to provide appropriate oversight of the Company and challenge to the Executive team. Overall, the Board remains effective, positive and cohesive and has the requisite skills, experience, challenge and judgement appropriate for the requirements of the business.
COMPLIANCE WITH THE UK CORPORATE GOVERNANCE CODEThroughout the 52 week period ended 26 February 2022, the Company was in compliance with the principles and provisions of the UK Corporate Governance Code 2018 (the Code) issued by the Financial Reporting Council (which is available at www.frc.org.uk).
The Board has complied with all the Code’s Provisions, with the exception of Provision 19. This is because Ron McMillan is to remain as Chair for 3 years after 1 April 2022 beyond his nine year tenure as explained more fully on p67.
COMPOSITION, SUCCESSION AND EVALUATION CONTINUED
BOARD COMPOSITION CONTINUED
N Brown Group plc Annual Report and Accounts 2022nbrown.co.uk66
DEAR SHAREHOLDERI am pleased to present the Nominations and Governance Committee report for FY22. The Committee has continued to review the structure, size and composition of the Board, with the view of making recommendations to the Board as appropriate.
As mentioned in last year’s report, Matt Davies stepped down from the Board on 31 March 2021 and I was honoured to be succeed him as Chairman.
Sam Allen Associates, which has no connection to the Group or any of its Directors, was appointed by the Committee to support the search for a new Non-Executive Director of the Board. Following a comprehensive external candidate search and selection process, a short list of first-class candidates was identified.
The Company subsequently appointed Dominic Platt as a Non-Executive Director on 10 June 2021 and also as a member of the Remuneration Committee. Mr Platt became Chair of the Audit and Risk Committee with effect from 22 November 2021, taking over from Vicky Mitchell, who was Acting Chair. I would like to thank Vicky for her tenure as Chair.
I was considered independent at the time of my appointment. I will remain as Chair beyond my nine-year tenure to ensure continuity and stability during the transformation of the business over the next three years. The Board believes this is in the best interests of the Company while a clear succession plan is prepared. I have served on the Board since April 2013 and the Board’s view is that my experience brings a valuable perspective to our strategic transformation discussions. In addition, the Board itself has undergone some changes over the last 24 months and there is a clear advantage to keeping me in place while the new Board members establish
themselves. I intend to step down at the end of three years with a full handover to the new Chair at that time.
In addition, the Committee oversaw the search and appointment of Executive Director Nuno Miller, Chief Operating Officer, who was appointed on 1 October 2021, and of General Counsel and Company Secretary, Michael Mustard, who was appointed on 1 March 2022.
In early 2022, the Board and its Committees underwent an internal Board evaluation. The results were discussed with the whole Board and an action plan is being developed for FY23, focusing on succession planning and talent development.
The Company is proud of its commitment to and focus on diversity, with details of our approach to appointments and the composition of our Board set out on p64.
I would like to thank my fellow Board members for their continued support. I am available to speak with shareholders at any time and shall be available at the Annual General Meeting on 6 July 2022 to answer any questions you may have on this report.
Ron McMillan Chair of the Nominations and Governance Committee
MEMBERRon McMillan April 2013 – Present
(Chair from 31 March 2021)
Gill Barr January 2018 – Present
Richard Moross October 2016 – Present
Michael Ross January 2018 – PresentVicky Mitchell January 2020 – Present
Dominic Platt June 2021 – Present
MEETINGSThe Nominations and Governance Committee held one meeting during the year which met the quorum required as set out in the terms of reference.
RESPONSIBILITIESIdentifying and nominating candidates to fill Board vacancies having evaluated the balance of skills, knowledge and experience already on the Board and identified the capabilities required for the role.
Succession planning, taking into account the skills and expertise needed on the Board for the future.
Reviewing the structure, size and composition (including the skills, knowledge and experience) of the Board and making recommendations to the Board with regard to appropriate changes.
Reviewing the leadership needs of the Group to ensure continued ability of the organisation to compete effectively within the marketplace.
Overseeing the Group’s Governance arrangements and Corporate Governance Framework.
FY23 PRIORITIESReappointing the Chairman for a further term.
Reviewing the talent pipeline and its effectiveness in developing diverse candidates.
Overseeing succession planning for the Executive and Non-Executive Directors to ensure it aligns to the Group’s long-term strategy.
Reviewing the composition of the Board and its Committees, engaging with external shareholders where appropriate.
Reviewing the Group’s governance arrangements.
The Committee’s Terms of Reference can be found at www.nbrown.co.uk
NOMINATIONS AND GOVERNANCE COMMITTEE REPORT
FIN
AN
CIA
L S
TAT
EM
EN
TS
GO
VE
RN
AN
CE
RE
PO
RT
ST
RA
TE
GIC
RE
PO
RT
N Brown Group plc Annual Report and Accounts 2022 nbrown.co.uk 67
DEAR SHAREHOLDERIn June 2021, I was appointed to the Board. I would like to thank Vicky Mitchell for taking on the responsibility as Acting Chair of the Audit and Risk Committee whilst we awaited for my FCA approval. This was granted in November 2021, following which I was appointed as Chair of this Committee.
During the year, the Audit and Risk Committee continued to carry out a key role within the Group’s governance framework, supporting the Board and Financial Services Board Committee in risk management, internal control and financial reporting. The Committee also acknowledges and embraces its role of protecting the interests of shareholders regarding the integrity of published financial information and the effectiveness of audit.
The Committee maintains oversight of the Group’s financial policies and reporting, monitors the integrity of the financial statements and reviews and considers significant financial and accounting estimates and judgements. The Committee satisfies itself that the disclosures in the financial statements about these estimates and judgements are appropriate and obtains an independent view of the key disclosure issues and risks from the Group’s external auditor. One of the Committee’s key responsibilities is to review the scope of work undertaken by the internal and external auditors and to consider their effectiveness.
While risk management is a Board responsibility, the Committee works closely with the Board, the Financial Services Board Committee and Group management to ensure that all significant risks are considered on an ongoing basis and that all communications with shareholders are properly considered.
The Committee has maintained oversight of the embedding of the RMF and key risk processes. It has reviewed key risks identified through the RMF and the associated plans to manage those risks.
In relation to risks and controls, the Committee ensures that these have been identified and that appropriate responsibilities and accountabilities have been set. The Committee also reviews reports from the Group’s Compliance function and assesses the means by which the Group seeks to comply with regulatory obligations.
During the year, the Committee oversaw the satisfactory response to a letter from the Financial Reporting Council, (“FRC”). The Committee also maintained oversight of the process used by the Board to assess the viability of the Group, the stress testing of key trading assumptions and the preparation of the Going Concern and Viability Statement which is set out on p95 of this Annual Report.
The Committee considered whether the 2022 Annual Report is fair, balanced and understandable and whether it provides the necessary information to shareholders to assess the Group’s performance, business model and strategy. In addition, the Committee considered management’s assessment of items included in the financial statements and the prominence given to them. The Committee, and subsequently the Board, were satisfied that, taken as a whole, the 2022 Annual Report and Accounts are fair, balanced and understandable.
Further information on the Committee’s responsibilities and the manner in which they have been discharged is set out in this report.
I am available to speak with shareholders at any time and shall be available at the Annual General Meeting on 7 July 2022 to answer any questions you may have on this report. I would like to thank my colleagues on the Committee for their help and support during the year.
Dominic PlattChair of the Audit and Risk Committee
MEMBERMeetings attended
Dominic Platt June 2021 – Present (Chairman)
2/2
Vicky Mitchell January 2020 – Present (Acting Chair from March 2021 to November 2021)
4/4
Michael Ross January 2018 – Present 4/4
RESPONSIBILITIESReviewing the integrity of the financial statements, price sensitive financial releases and significant financial judgements and estimates relating thereto.
Monitoring the scope of work, quality, effectiveness and independence of the external auditors and approving their appointment and fees.
Monitoring and reviewing the independence and activities of the Internal Audit function.
Assisting the Board and the Financial Services Board Committee with the development and execution of a risk management strategy, risk policies and exposures and a risk register.
Keeping under review the adequacy and effectiveness of the Group’s internal financial controls and internal control and risk management systems.
FY23 PRIORITIESContinuing to be responsive to the impact of Covid-19 and wider geopolitical and economic events on resources.
Ensuring that the Group’s risk management procedures continue to be responsive to the impact of Covid-19 on resources and ways of working.
Ensuring that the Group’s Internal Audit and Risk functions continue to be fully resourced.
In conjunction with the Financial Services Board Committee, ensuring that the Group complies with the requirements of the Senior Managers Certification Regime – the FCA’s enhanced regime for regulated firms.
Continued monitoring of key change programmes with particular focus on tech and strategic execution and their impact on internal controls.
Monitor key regulatory developments and impact on business and customer conduct.
The Committee’s Terms of Reference can be found at www.nbrown.co.uk
AUDIT RISK AND INTERNAL CONTROL
AUDIT AND RISK COMMITTEE REPORT
N Brown Group plc Annual Report and Accounts 2022nbrown.co.uk68
COMMITTEE COMPOSITION The Committee currently comprises three members, each of whom is an independent Non-Executive Director. Two members constitutes a quorum. The Committee requires the inclusion of at least one financially qualified member with recent and relevant financial experience, and the Committee Chair, Dominic Platt, fulfils that requirement. All members are expected to have an understanding of financial reporting, the Group’s internal control environment, relevant corporate legislation, the roles and function of internal and external audit and the regulatory framework of the business. As reflected in the biographical details on p56 the Committee members have significant experience of working in or with companies in the retail, financial services and consumer goods sectors.
The members of the Committee who served during the year were:
Dominic Platt (Committee Chair from November 2021)
Vicky Mitchell (Acting Committee Chair) from 31 March 2021 – November 2021)
Michael Ross
Ron McMillan (Resigned 31 March 2021)
Details of Committee meetings and attendances are set out on p60. The timing of Committee meetings is set to accommodate the dates of releases of financial information and the approval of the scope of and reviews of outputs from work programmes executed by the internal and external auditors.
In addition to scheduled meetings, the Chair of the Committee met with the CFO, Director of Risk, the Head of Internal Audit and the external auditors KMPG (including meetings without management present).
Although not members of the Committee, the Chair of the Board, CEO, CFO and representatives from the Group’s internal and external auditors attend all meetings. The Secretary of the Committee is the Group’s General Counsel and Company Secretary.
FINANCIAL SERVICES BOARD As more fully explained on p45, the Financial Services Board Committee (“FSB”) is responsible to the N Brown Board for oversight of the Financial Services business. While ultimate oversight of Group risk remains with the Group Board, the FSB is responsible for the development and oversight of the culture, the long-term objectives and the strategy of the Group’s Financial Services business.
In relation to internal controls and risk management within Financial Services, the FSB approves annual plans and performance targets and maintains oversight of regulatory compliance. The FSB makes whatever recommendations it deems appropriate on any area within its remit and escalates to the Group Board such matters as it deems appropriate.
COMMITTEE ACTIVITIES IN FY22 The table on p73 details the core activities of the Committee during the year. Key matters considered included the following:
IMPACT OF COVID-19 The impact of the pandemic continued to be accounted for during the year.
The Committee reviewed disclosures made by management in relation to the pandemic and the measures taken by management to support the business throughout. The Committee also reviewed the associated assumptions used to support forward estimates. In particular, it reviewed the reasonableness of the assumptions made in relation to trade receivables, bad debt impairment and Group impairment and inventories impairment.
Given the ongoing challenges posed by Covid and in line with the joint statement issued by the FCA and FRC in January 2021, which encourages Boards to use the measures granted to allow listed companies an additional two months to publish their audited annual financial reports, the Committee again approved an extended timeline for completion of the year end accounts.
The Committee remains satisfied that there continues to be reasonable assurance over key risk areas despite the challenges to timelines and resources.
RISK AND INTERNAL CONTROLS Managing risk is inherent in the way we do business.
The Board has overall responsibility for ensuring that the Group maintains a sound system of internal control and risk management. The Board recognises that there are inherent limitations in any system of internal control and no system can provide absolute assurance against material misstatements, loss or failure. Equally, no system can guarantee elimination of the risk of failure to meet the objectives of the business.
Oversight of risk and the Group’s risk management process are provided by a number of business committees, the Directors of Risk and Internal Audit, reporting in to the Financial Services Board Committee, the Audit and Risk Committee and, ultimately, the Group Board. The Directors of Risk and Internal Audit attend all Audit and Risk Committee meetings.
The Audit and Risk Committee has maintained oversight of the embedding of the RMF, the key risks to the business and their associated action plans. These have been largely focussed on the technology, Information Security and Financial Services areas of the business. The Committee also reviews summaries of second line compliance assurance reviews and associated remediation plans.
32Further information on the Group’s Enterprise Risk Management Framework is detailed on p32.
The Audit and Risk Committee reviews annually the overall risk strategy and Risk Policy, including risk appetite, exposure, measures and limits, and material amendments to the risk appetite and related policies. The Group is proactive in ensuring that risks are identified and managed.
Key risks are assessed and mitigation occurs based on the level of residual risk.
A description of the Level One risks is set out on p34 to p37.
The Board has carried out a robust assessment of the emerging and principal risks facing the Group, including those which threaten its business model, future performance, insolvency or liquidity.
FIN
AN
CIA
L S
TAT
EM
EN
TS
GO
VE
RN
AN
CE
RE
PO
RT
ST
RA
TE
GIC
RE
PO
RT
N Brown Group plc Annual Report and Accounts 2022 nbrown.co.uk 69
The Committee continues to focus on improving controls. The Committee continues to believe that appropriate controls are in place throughout the Group and that the Group has a well-defined organisational structure with clear lines of responsibility and a comprehensive financial reporting system. The Committee also believes that the Company complies with the Financial Reporting Council (“FRC”) guidance on risk management, internal control and related financial business reporting.
GOING CONCERN AND VIABILITY The Committee reviewed the appropriateness of adopting the going concern basis of accounting in preparing the full year financial statements and assessed whether the business was viable in accordance with the Code. The assessment included a review of the principal risks facing the Group, their financial impact, how they are managed, the availability of finance, and the appropriate period for assessment.
REVIEWING THE FY22 HALF YEAR RESULTS, FULL YEAR RESULTS AND ANNUAL REPORT The Committee considered in particular the following:
The accounting principles, policies and practices adopted and the adequacy of related disclosures in the reports.
The significant accounting issues, estimates and judgements of management in relation to financial reporting.
Whether any significant adjustments were required as a result of the review by the external auditors.
Compliance with statutory tax obligations and the Group’s Tax Policy.
Whether the information set out in the Annual Report was fair, balanced and understandable.
Whether the use of “alternative performance measures” was appropriate.
FINANCIAL REPORTING COUNCILDuring the year, the Committee monitored the Group’s engagement with external stakeholders relevant to the Committee’s areas of oversight, including the Financial Reporting Council (the “FRC”). In particular, in January 2022, the Group received a letter from the Corporate Reporting Review Team of the FRC in relation to the Group’s FY21 Annual Report and Accounts, as part of its regular review and assessment of the quality of corporate reporting in the UK. This letter did not raise any specific questions or queries but did note certain specific matters where they believed that users of the accounts would benefit from improvements to the existing disclosures. Specific enhancements to the disclosures, as identified and observed, through the review have been taken into account in the preparation of this Annual Report and Accounts.
This review considered compliance with reporting requirements and does not provide any assurance over the disclosures that were reviewed. The FRC (which includes the FRC’s officers, employees and agents) accepts no liability for reliance on them by the Company or any third party, including but not limited to investors and shareholders.
INTERNAL AUDITThe Head of Internal Audit has a direct reporting line to the Committee and attended all Committee meetings. During the year Group Internal Audit (“GIA”) undertook a risk-based programme of work which was discussed with, and approved by, both Executive Management and the Committee.
During the year GIA carried out reviews covering the following areas:
Stock Accuracy
Automated Returns
Ethical Supply Chain
Customer Payments
Financial Services Product Governance
Internal Financial Controls
Supplier Relationship Management
Identity & Access Management
Information Security Controls Improvement
Operational Resilience
Financial Crime
Risk Function
The outcomes of GIA’s work were reported regularly during the year to the Committee, the Executive Board and the Financial Services Board.
The reviews culminated in a series of recommendations against which management agreed a number of remedial actions. Progress against these actions is formally monitored and their status reported to the Committee.
There were no restrictions placed on the scope of work to be carried out by the GIA function or its ability to report to the Committee.
The Committee has evaluated the performance of GIA and has concluded that it continues to provide helpful and constructive challenge to management and demonstrates a commercial and constructive view of the business.
AUDIT RISK AND INTERNAL CONTROL CONTINUED
AUDIT AND RISK COMMITTEE REPORT CONTINUED
N Brown Group plc Annual Report and Accounts 2022nbrown.co.uk70
PERFORMANCE OF THE AUDIT AND RISK COMMITTEE The Audit and Risk Committee’s performance was assessed as part of the Board’s internal evaluation carried out in early 2022, as detailed on p66. The Board considers that the processes undertaken by the Committee are appropriately robust, effective and in compliance with the guidelines issued by the FRC. During the year, the Board was not advised by the Committee, nor did it identify itself, any failings, frauds or weaknesses in internal control determined to be material in the context of the financial statements.
EXTERNAL AUDITORS KPMG LLP were appointed as external auditors on 14 July 2015. The partner responsible for the audit is Anthony Sykes, a partner in the London office. Anthony has advised us that he will be leaving KPMG at the end of September 2022 and we are in the process of making alternative arrangements. The total fees paid to KPMG for the year ended 26 February 2022 were £1.3m. Further details are set out in note 5]to the financial statements on p122.
The Board’s policy in relation to the auditors undertaking non-audit services is that they are subject to tender processes, unless the nature of the work means the auditors are best placed to provide services. The allocation of work is done on the basis of competence, cost effectiveness, regulatory requirements, potential conflicts of interest and knowledge of the Group’s business. KPMG LLP did not provide any non-audit services in the course of the year. The Committee remains mindful of investors’ attitudes towards the auditors performing non-audit services.
The Committee will continue to ensure that fees for non-audit services do not exceed 70% of aggregate audit fees, as measured over a three-year period.
The Committee reviews the performance of KPMG LLP annually based on their understanding of key areas of judgement and the extent of challenge, the quality of reporting and the efficiency and conduct of the audit. Feedback is sought from management, the Group’s Finance and Internal Audit functions and the General Counsel.
The Committee considered in detail KPMG’s audit planning documentation and satisfied itself that the audit work to be carried out by KPMG covered all significant aspects of the Annual Report and Accounts. There were no areas which the Committee asked KPMG to look at specifically. KPMG’s report to the Committee at the conclusion of the audit confirmed that the audit had been carried out as set out in the planning documentation and the Committee considered the findings of KPMG as reflected in their audit opinion and their year end report to the Board. KPMG’s audit opinion sets out the key matters that, in their professional judgement, were of most significance in their audit. These are consistent with the key matters considered and agreed with the Committee when the audit was planned. KPMG’s opinion describes how these matters were addressed in the audit and the scope and nature of their work reflects the thoroughness of their approach and the degree of scepticism applied.
AUDITOR INDEPENDENCE The Committee sought and was provided with assurance from the Audit Engagement partners that they and all members of KPMG’s staff engaged on the audit had confirmed that they and their dependants were independent and that KPMG as a firm was independent.
AUDIT QUALITY ASSESSMENT The Committee assessed the quality of KPMG’s audit in a number of ways:
1) The Committee met with the senior members of the KPMG audit team on three occasions during the year and discussed the planning, execution and reporting of audit work and findings. All senior members of the KPMG team contributed to these meetings.
2) In conjunction with the CFO and senior members of the finance team, the Committee discussed and assessed KPMG’s approach to the execution of and reporting of their audit and related findings.
The overall conclusion of the process was that KPMG LLP’s work continues to be thorough and professional and it is, therefore, the Committee’s recommendation that the reappointment of KPMG LLP be put to shareholders at the Annual General Meeting on 7 July 2022.
WHISTLEBLOWING,ANTI-BRIBERY AND ANTI-CORRUPTION POLICIES The Group remains committed to conducting its business with honesty and integrity and expects all colleagues to maintain equally high standards, encouraging open communication from all those who work within the business or across its supply chain. In line with its whistleblowing policy, the Group is partnered with an independent, external whistleblowing reporting service which provides 24-hour international telephone lines, web portal and email reporting facilities. All concerns can be raised anonymously and are escalated to the Company Secretary who investigates them with due care and attention, reporting accordingly to the Committee. The Group is committed to ensuring that it offers good quality, transparently and fairly sourced products and services to its customers and operates with integrity and in an honest and ethical manner at all times. Comprehensive Anti-Bribery and Anti-Corruption and Gifts and Hospitality policies are in place and are applicable to all colleagues across the business, along with a dedicated central Register of Gifts and Hospitality which all colleagues are required to use. Compliance to the policy is monitored by the Internal Audit function which reports any findings of note to the Committee.
FAIR, BALANCED AND UNDERSTANDABLE At the request of the Group Board and as required by the UK Corporate Governance Code, the Committee assessed whether the content of the FY22 Annual Report and Accounts, preliminary results announcement and presentation, taken as a whole, were fair, balanced and understandable. Consideration was also given as to whether key messages, disclosures and information were included in a consistent manner throughout the report.
The Committee considered the prominence given to certain items included in the financial statements and the language used to describe performance. The Committee advised the Group Board that it was satisfied that, taken as a whole, the 2022 Annual Report was fair, balanced and understandable, and that it provided shareholders and other stakeholders with the necessary information to allow them to determine the Company’s performance, business model, risks and strategy.
FIN
AN
CIA
L S
TAT
EM
EN
TS
GO
VE
RN
AN
CE
RE
PO
RT
ST
RA
TE
GIC
RE
PO
RT
N Brown Group plc Annual Report and Accounts 2022 nbrown.co.uk 71
CRITICAL JUDGEMENTS AND KEY SOURCES OF ESTIMATION UNCERTAINTY The significant judgements made by management in applying the Group’s accounting policies and key sources of estimation uncertainty are set out in note 2 on p119.
These relate to the impact of Covid-19, impairment of customer receivables, software and development costs and the useful economic life assessment, the impairment of non-financial assets, the defined benefit pension plan and the Allianz claim and counterclaim.
The Committee discussed with the auditors how these matters impacted the financial statements and reviewed the sensitivities which were considered by management to be appropriate.
IMPAIRMENT OF CUSTOMER RECEIVABLES The Group’s methodology to determine provisions for expected credit losses in its credit ledgers is both complex and judgemental. A significant part of external audit is focused in this area and the Committee seeks assurance from the Finance function and the auditors that the approach to provisioning is consistent year on year or, if not, that changes are made to better reflect changing economic or commercial circumstances, and that disclosures are clear and adequate.
The Committee again reviewed the IFRS 9 model and the refinements that had been made to it in the year and the associated disclosures.
ALLIANZ LITIGATIONDuring the year, the Group has recorded a charge for legal costs of £1.8m and a provision of £28.0m, in relation to the ongoing legal dispute with Allianz Insurance plc, as an estimate for accounting purposes of the potential costs of settlement or award and future legal costs.
The Committee concurred with management’s assessment of the accounting estimate and associated disclosures in the Annual Report. Details on the background to the dispute and the basis of the provision established in the year are set out in note 22.
Further disclosure would prejudice the outcome of these negotiations and therefore, as permitted by IAS 37.92, we have not made any further disclosures in connection to the provision booked, and sensitivity analysis relating to the estimation uncertainty around timing or amount of these.
SOFTWARE AND DEVELOPMENT COSTSIncluded within intangible assets are significant software and development costs in respect of the Group’s technological development programme. The Committee continued to review the treatment of the significant software and project costs in order to satisfy itself that the Group’s approach to capitalisation of these costs remains appropriate. The Committee discussed with management whether the related projects will be completed successfully and whether the carrying value is supported by sufficient revenue and profitability going forward.
During the year, the Committee discussed management’s review of capitalisation of software as a service (“SAAS”) assets following the publication of the IFRS Interpretation Committee (“IFRIC”) agenda decision in April 2021, and the resulting prior year adjustment.
The Committee also considered management’s annual review of the useful economic lives of its legacy intangible assets in light of general advancements in technology and the Group’s strategy.
IMPAIRMENT OF NON-FINANCIAL ASSETS At the balance sheet date and following a significant drop in the Group’s share price, the market capitalisation of the Group was lower than the Group’s net assets. As this is an indicator of impairment, management is required to test for impairment based on value-in-use calculations reflecting expected cash flows, long-term growth rates and a pre-tax discount rate.
The Committee discussed these with management and reviewed the relevant disclosures in the Annual Report. The Committee discussed the sensitivities of key assumptions including Product Revenue, EBITDA growth, capital expenditure and the discount rate with management and reviewed the relevant disclosures in the Annual Report.
DEFINED BENEFIT PENSION PLAN The cost of the Group’s defined benefit pension plan and present value of the pension obligations are determined using actuarial valuations. The Committee continued to review the various assumptions that underpin the actuarial valuation and recognise that these may differ from actual developments in the future.
The Committee concurs with management’s assessment that the assumptions are appropriate for the expert to use in their actuarial valuation for the Group’s defined benefit pension plan. The Committee reviewed the disclosures in the Annual Report in relation to the pension plans and ensured that these are consistent with the advice received from the Group’s actuaries.
REGULATION AND COMPLIANCE While no longer considered a source of estimation uncertainty, the Group operates in a regulated marketplace. This creates risk for the business as non-compliance can lead to customer detriment, reputational damage, financial penalties and potential loss of licence to operate.
The Group is regulated in the UK by the FCA under a licence granted on 21 September 2016 and by the Central Bank of Ireland for its Oxendales business. Changes in laws and regulations impact the Group’s business, sector and market, and the Committee continues to review the outputs of work carried out by the Group’s Compliance function in order to satisfy itself that action is being taken to address the changes that are required to comply with the regulations.
AUDIT RISK AND INTERNAL CONTROL CONTINUED
AUDIT AND RISK COMMITTEE REPORT CONTINUED
N Brown Group plc Annual Report and Accounts 2022nbrown.co.uk72
ACTIVITIES OF THE AUDIT AND RISK COMMITTEE Meetings of the Committee are scheduled to coincide with key dates in the financial calendar and reporting cycle. Recurring agenda items of the meeting included matters relating to the review and approval of the Internal Audit Plan, risk mapping and appetite, financial reporting and tax matters. Additional matters covered at each of the meetings during FY22 were as follows:
JANUARY 2022
Review and approach of the external auditors’ plan for assessment of the FY22 full year results
Review and assessment of the Group’s Compliance and Risk activities
Approval of select level one risk policies
Review of progress against the FY22 Internal Audit Plan
Review of the Company’s Q3 Trading Statement
FEBRUARY 2022
Review of the Group’s response to the FRC letter
APRIL 2021
Approval of the Group’s taxation strategy
Approval of the Group’s non-audit services fees policy
Review of the full year Internal Audit Report, approval of FY22 Internal Audit Plan and the Internal Audit Charter
Review and approval of the Group’s Risk Management Framework and internal control update – including the securitisation audit
Review and assessment of the Group’s Compliance activities
Performance reviews of:
Internal Auditor
External Auditor
Audit and Risk Committee
OCTOBER 2021
Review of the Group’s half-year report financial reporting paper
Review of the Group’s half-year statement and investor presentation
Review of the half year Internal Audit and Risk Management reports
Assessments of Liquidity and Going Concern at the half-year
Approval of select level one risk policies
Approval of the Group’s exceptional items policy
MAY 2021
Approval of the full year results for FY21, including reviews of the Group’s Viability Statement
Liquidity and Going Concern Assessment
Review of the full year external audit report
Assessment of the Group’s impairment of customer receivables
Assessment of the Group’s FY21 preliminary results announcement and investor presentation
Review of the draft FY21 Annual Report and Accounts
FIN
AN
CIA
L S
TAT
EM
EN
TS
GO
VE
RN
AN
CE
RE
PO
RT
ST
RA
TE
GIC
RE
PO
RT
N Brown Group plc Annual Report and Accounts 2022 nbrown.co.uk 73
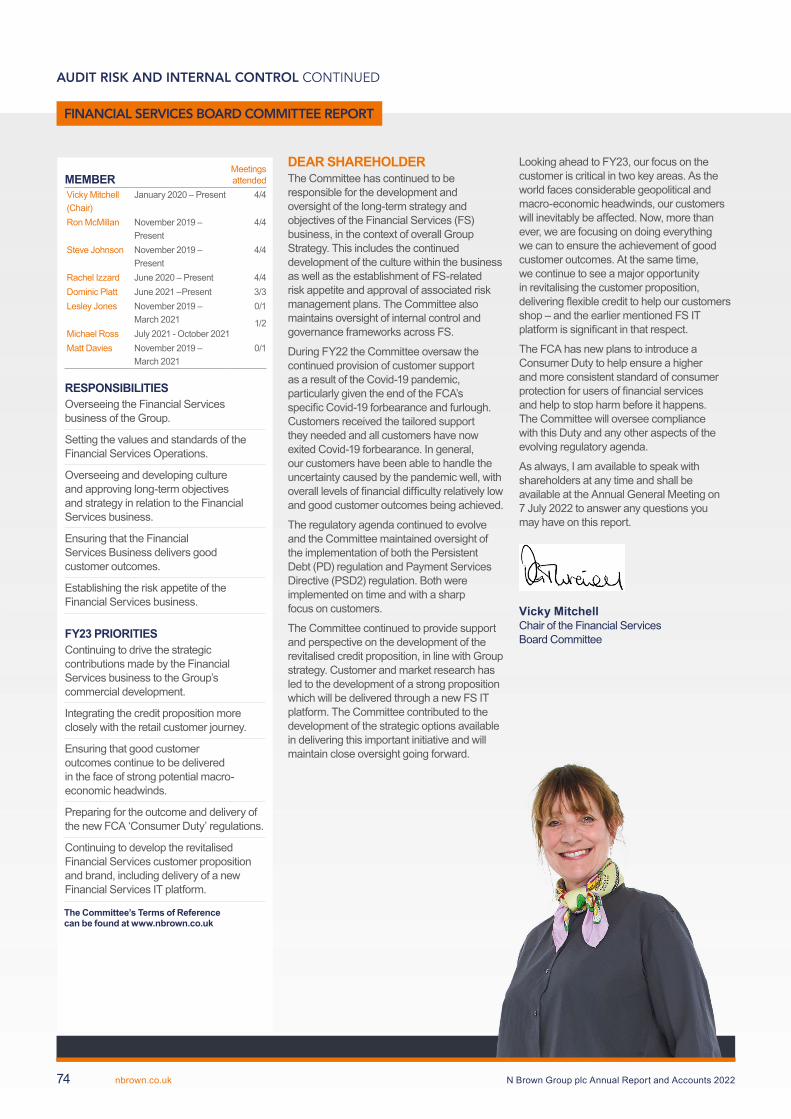
MEMBERMeetings attended
Vicky Mitchell (Chair)
January 2020 – Present 4/4
Ron McMillan November 2019 – Present
4/4
Steve Johnson November 2019 – Present
4/4
Rachel Izzard June 2020 – Present 4/4Dominic Platt June 2021 –Present 3/3Lesley Jones November 2019 –
March 20210/1
1/2Michael Ross July 2021 - October 2021Matt Davies November 2019 –
March 20210/1
RESPONSIBILITIESOverseeing the Financial Services business of the Group.
Setting the values and standards of the Financial Services Operations.
Overseeing and developing culture and approving long-term objectives and strategy in relation to the Financial Services business.
Ensuring that the Financial Services Business delivers good customer outcomes.
Establishing the risk appetite of the Financial Services business.
FY23 PRIORITIESContinuing to drive the strategic contributions made by the Financial Services business to the Group’s commercial development.
Integrating the credit proposition more closely with the retail customer journey.
Ensuring that good customer outcomes continue to be delivered in the face of strong potential macro-economic headwinds.
Preparing for the outcome and delivery of the new FCA ‘Consumer Duty’ regulations.
Continuing to develop the revitalised Financial Services customer proposition and brand, including delivery of a new Financial Services IT platform.
DEAR SHAREHOLDERThe Committee has continued to be responsible for the development and oversight of the long-term strategy and objectives of the Financial Services (FS) business, in the context of overall Group Strategy. This includes the continued development of the culture within the business as well as the establishment of FS-related risk appetite and approval of associated risk management plans. The Committee also maintains oversight of internal control and governance frameworks across FS.
During FY22 the Committee oversaw the continued provision of customer support as a result of the Covid-19 pandemic, particularly given the end of the FCA’s specific Covid-19 forbearance and furlough. Customers received the tailored support they needed and all customers have now exited Covid-19 forbearance. In general, our customers have been able to handle the uncertainty caused by the pandemic well, with overall levels of financial difficulty relatively low and good customer outcomes being achieved.
The regulatory agenda continued to evolve and the Committee maintained oversight of the implementation of both the Persistent Debt (PD) regulation and Payment Services Directive (PSD2) regulation. Both were implemented on time and with a sharp focus on customers.
The Committee continued to provide support and perspective on the development of the revitalised credit proposition, in line with Group strategy. Customer and market research has led to the development of a strong proposition which will be delivered through a new FS IT platform. The Committee contributed to the development of the strategic options available in delivering this important initiative and will maintain close oversight going forward.
Looking ahead to FY23, our focus on the customer is critical in two key areas. As the world faces considerable geopolitical and macro-economic headwinds, our customers will inevitably be affected. Now, more than ever, we are focusing on doing everything we can to ensure the achievement of good customer outcomes. At the same time, we continue to see a major opportunity in revitalising the customer proposition, delivering flexible credit to help our customers shop – and the earlier mentioned FS IT platform is significant in that respect.
The FCA has new plans to introduce a Consumer Duty to help ensure a higher and more consistent standard of consumer protection for users of financial services and help to stop harm before it happens. The Committee will oversee compliance with this Duty and any other aspects of the evolving regulatory agenda.
As always, I am available to speak with shareholders at any time and shall be available at the Annual General Meeting on 7 July 2022 to answer any questions you may have on this report.
Vicky MitchellChair of the Financial Services Board Committee
The Committee’s Terms of Reference can be found at www.nbrown.co.uk
AUDIT RISK AND INTERNAL CONTROL CONTINUED
FINANCIAL SERVICES BOARD COMMITTEE REPORT
N Brown Group plc Annual Report and Accounts 2022nbrown.co.uk74
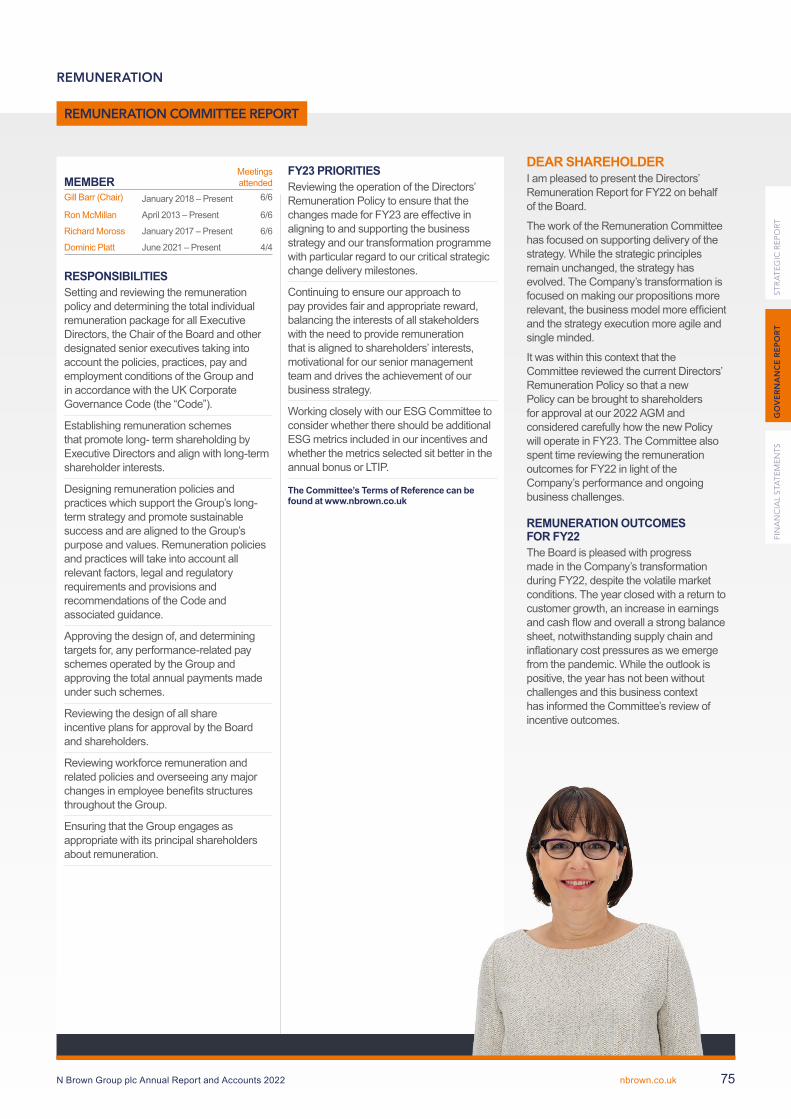
DEAR SHAREHOLDERI am pleased to present the Directors’ Remuneration Report for FY22 on behalf of the Board.
The work of the Remuneration Committee has focused on supporting delivery of the strategy. While the strategic principles remain unchanged, the strategy has evolved. The Company’s transformation is focused on making our propositions more relevant, the business model more efficient and the strategy execution more agile and single minded.
It was within this context that the Committee reviewed the current Directors’ Remuneration Policy so that a new Policy can be brought to shareholders for approval at our 2022 AGM and considered carefully how the new Policy will operate in FY23. The Committee also spent time reviewing the remuneration outcomes for FY22 in light of the Company’s performance and ongoing business challenges.
REMUNERATION OUTCOMES FOR FY22The Board is pleased with progress made in the Company’s transformation during FY22, despite the volatile market conditions. The year closed with a return to customer growth, an increase in earnings and cash flow and overall a strong balance sheet, notwithstanding supply chain and inflationary cost pressures as we emerge from the pandemic. While the outlook is positive, the year has not been without challenges and this business context has informed the Committee’s review of incentive outcomes.
MEMBERMeetings attended
Gill Barr (Chair) January 2018 – Present 6/6
Ron McMillan April 2013 – Present 6/6
Richard Moross January 2017 – Present 6/6
Dominic Platt June 2021 – Present 4/4
FY23 PRIORITIESReviewing the operation of the Directors’ Remuneration Policy to ensure that the changes made for FY23 are effective in aligning to and supporting the business strategy and our transformation programme with particular regard to our critical strategic change delivery milestones.
Continuing to ensure our approach to pay provides fair and appropriate reward, balancing the interests of all stakeholders with the need to provide remuneration that is aligned to shareholders’ interests, motivational for our senior management team and drives the achievement of our business strategy.
Working closely with our ESG Committee to consider whether there should be additional ESG metrics included in our incentives and whether the metrics selected sit better in the annual bonus or LTIP.
RESPONSIBILITIESSetting and reviewing the remuneration policy and determining the total individual remuneration package for all Executive Directors, the Chair of the Board and other designated senior executives taking into account the policies, practices, pay and employment conditions of the Group and in accordance with the UK Corporate Governance Code (the “Code”).
Establishing remuneration schemes that promote long- term shareholding by Executive Directors and align with long-term shareholder interests.
Designing remuneration policies and practices which support the Group’s long-term strategy and promote sustainable success and are aligned to the Group’s purpose and values. Remuneration policies and practices will take into account all relevant factors, legal and regulatory requirements and provisions and recommendations of the Code and associated guidance.
Approving the design of, and determining targets for, any performance-related pay schemes operated by the Group and approving the total annual payments made under such schemes.
Reviewing the design of all share incentive plans for approval by the Board and shareholders.
Reviewing workforce remuneration and related policies and overseeing any major changes in employee benefits structures throughout the Group.
Ensuring that the Group engages as appropriate with its principal shareholders about remuneration.
The Committee’s Terms of Reference can be found at www.nbrown.co.uk
REMUNERATION
REMUNERATION COMMITTEE REPORT
FIN
AN
CIA
L S
TAT
EM
EN
TS
GO
VE
RN
AN
CE
RE
PO
RT
ST
RA
TE
GIC
RE
PO
RT
N Brown Group plc Annual Report and Accounts 2022 nbrown.co.uk 75
SALARIESThe salaries of our CEO and CFO were increased in 2021 by 1.5% in line with those of the wider workforce, to £431,375 and £355,250 respectively.
ANNUAL BONUSDespite the difficulties relating to target-setting caused by the ongoing impact of the pandemic, the Committee was able to set FY22 annual bonus and LTIP targets at the normal time, based on our assessment of likely business performance and taking into account the impact of the pandemic as well as factoring in the ongoing transformation of the business.
The annual bonus was focused on metrics based on operational delivery, both financial and non- financial. These metrics were EBITDA 65%, Active Customer Accounts 15%, Customer NPS 10% and ESG 10% (split equally between GHG and sustainable products).
While there is a modest payment under the EBITDA element of the bonus, it was disappointing to see performance below the threshold targets for both Active Customer Accounts and Customer NPS. Customer NPS has been affected by Covid-driven supply chain disruption and a lack of delivery drivers, coupled with disappointing performance from one of our key delivery partners, issues which are being addressed.
Although new customer volumes performed well, Active Customer Accounts have also been affected by Covid and as a result, overall growth in Active Customer Accounts was just below the threshold target for the annual bonus.
Good progress was made against our ESG strategic targets. The maximum GHG target was achieved with an on target level of performance for the sustainable products element.
Therefore, as a result, in total the formulaic outcome of the annual bonus provides a payment for the CEO and CFO of 22.1% of maximum. The detail of targets and performance against them is set out in the Annual Report on Remuneration.
Each year, the Committee considers carefully whether the formulaic outcome of the bonus is appropriate in light of broader factors. The Committee noted overall business performance as set out above, that there has been no Government assistance in FY22 and that all eligible colleagues will receive an annual bonus for the year based on the same metrics as the Executive Directors. Taking these factors into account and noting there are no other extenuating factors, the Committee is comfortable that the formulaic outcome of 22.1% in a challenging retail environment is appropriate, and the exercise of discretion to adjust this outturn is not appropriate.
LONG-TERM INCENTIVE2019 LTIP AWARD WITH PERFORMANCE PERIOD ENDING IN FY22The adjusted EPS, free cash flow and relative TSR threshold targets for the 2019 LTIP awards, which were measured over the performance period ending in FY22, have not been met and these awards have lapsed.
2021 LTIP AWARD GRANTED IN FY22
The 2021 LTIP awards were made at normal grant levels of 150% of salary for the CEO and 125% of salary for the CFO.
The awards are subject to relative TSR for 50% of the award and stretching adjusted EPS growth targets of 5% CAGR to 15% CAGR for the remaining 50% of the award.
OUR NEW REMUNERATION POLICY The Remuneration Committee reviewed the current Remuneration Policy (Policy) and is comfortable that it has the right structure and flexibility in terms of how it is operated to support our business strategy and transformation over the next policy period. Therefore, no changes are proposed to the current Policy except for some small administrative amendments which are set out in the table of policy changes on page 79.
We consulted with our largest shareholders regarding our policy proposals and would like to thank them for their contribution.The shareholders who engaged with us are supportive.
As part of the policy review consultation shareholders also provided feedback on the operation of policy for FY23 to which I refer to below. The Committee has listened carefully to constructive feedback. We have consequently made adjustments to our proposed operation of policy for FY23 as shown below.
HOW THE POLICY WILL BE APPLIED IN FY23SALARIESThe salaries of our CEO and CFO will be increased by 3% which is aligned to increases for the wider workforce with the resulting salaries £444,316 and £365,908 respectively.
Non-Executive Directors would normally receive an increase in fees consistent with the increase for the wider workforce. Given the extremely challenging economic climate, all have asked for the money that they would have received to be used to support employees in difficult financial circumstances through a hardship fund.
ANNUAL BONUSFY23 is a critical year to achieve the transformation milestones on which the future success of the business depends. Our annual bonus therefore focuses on achievement of the strategic priorities that underpin our transformation as well as shorter-term profitability and operational excellence.
The annual bonus maximum opportunity remains at 150% of salary for the CEO and 125% of salary for the CFO. The performance metrics and weightings are as follows:
45% Group EBITDA
15% Growth in Statutory Product Revenue of the brands that underpin our differentiated brand portfolio strategy
20% Strategic change delivery
10% Customer NPS
10% ESG weighted equally between GHG and sustainable product
60% of the bonus is determined by key financial metrics with a particular focus on driving revenue from our key brands that underpin our growth strategy
The 20% strategic change delivery element is based on delivering the technology imperatives identified in our strategic plan as priorities for the year, including new websites and platforms which are critical to deliver long-term shareholder value. The technology development plan requires an agile approach to manage evolving priorities and as a result the Committee will retain some discretion on measurement
REMUNERATION CONTINUED
REMUNERATION COMMITTEE REPORT CONTINUED
N Brown Group plc Annual Report and Accounts 2022nbrown.co.uk76
The Group now has a well-developed ESG strategy and a very active ESG Committee, so targets have been set in consultation with the Chair of that Committee. As a result the Remuneration Committee is comfortable that the targets set are appropriately stretching and is pleased to note the GHG targets include Scope 3 (estimated) as well as Scope 1 and 2 emissions. Our sustainable product targets require all own brand designed products to achieve a minimum set of criteria based on independent Industry Certification standards.
Specific targets have been set in the usual way for Customer NPS.
Shareholder feedback received during the consultation encouraged us to increase the weighting to financial metrics, which we have done. Additionally, the Committee was asked by one investor to consider using EPS as the measure of profit in the annual bonus instead of EBITDA. We have considered this but feel that EBITDA should be retained in the annual bonus because i) over the short term, management focus on EBITDA is a better outcome of operational performance than EPS, which is likely to be affected by non operational items ii) EBITDA has been used as a measure of profit in the annual bonus since FY20 and is a well understood metric throughout the business enabling all colleagues to focus on the same profit metric, and iii) EPS is the measure used for the LTIP and we wish to avoid using the same measure for both plans.
While investors recognised the importance of strategic measures to provide a balanced overall incentive, they emphasised the importance of setting robust, measurable and stretching targets for non-financial metrics. The Committee shares this view and is comfortable that its current approach to target setting is robust.
It is important that our transformation strategy is delivered within a strong risk and compliance environment with focus on embedding risk management, governance and controls. Appropriate risk management, governance and controls will be one of the factors that the Committee will review when considering annual bonus outturn and the exercise of discretion.
Detail of our strategic change delivery objectives, all annual bonus targets, performance and the bonus payable will be included as part of the annual bonus disclosure in the FY23 Remuneration Report.
FY23 LONG-TERM INCENTIVE AWARDS LTIP award levels for our CEO will be 150% of salary and for our CFO 125% of salary. The Committee considered carefully whether any adjustments should be made to award levels to reflect the current share price. At this critical point in the Company’s transformation, normal LTIP award levels are being maintained to ensure that management has an incentive that is sufficiently leveraged to truly drive and reward performance and returns for our shareholders.
As in prior years, the Committee retains the discretion to scale back the vesting outcome if it has concerns that the level of vesting and overall quantum is not appropriate. Shareholders will note that the Committee has exercised its discretion to adjust both incentive opportunity and outturn in previous years and will continue to ensure that it takes a fair and balanced approach to remuneration ensuring alignment between pay and performance.
For 2022, the LTIP award will be based entirely on adjusted EPS growth targets. This is the first time for a number of years that the Committee has not included a TSR based measure. The Committee believes, it is right to focus management for this award on measurable improvements in long term profitability, which is a clear output measure of the strategy. Management will continue to be aligned to share price and shareholder interests through their shareholdings, annual bonus deferral into shares and the holding of LTIP incentives in shares.
The Committee recognises that some investors would prefer an LTIP award to be based on more than one financial metric and will review metrics again for the 2023 award.
One of our investors discussed with us the use of adjusted EPS in the LTIP as compared to basic EPS. The Committee considers that adjusted EPS provides better measurement of underlying business performance because it removes the effects of exceptional and other one-off items.
The Committee considered very carefully the adjusted EPS target range for the 2022 LTIP awards. We took into account expected progress against our transformation strategy as well as external factors such as inflation, increased corporation tax and freight costs. In respect of inflation the Committee has noted the likely impact on our customers’ discretionary spend and revenue growth as well as the risk of significant cost pressure.
EPS in FY22 has been impacted by a lower experience of bad debt as a result of the Covid pandemic. It is already clear that this has been a temporary effect and bad debt levels are normalising. The Committee does not want to penalise management with a starting point for the adjusted EPS range which is higher than it would otherwise be, as a result of the pandemic which is beyond their control.
In order to extract the impact of the Covid-related benefits seen in FY22 noted above, our adjusted EPS range uses a base point of FY21 adjusted EPS of 5.4 pence (which is adjusted for the post equity raise number of shares). We have then applied a growth rate of 5% to 15% CAGR over the four-year period to FY25. This provides an adjusted EPS range for the 2022 awards of 6.6 pence to 9.5 pence to be tested against adjusted EPS in FY25. The Committee is conscious that the threshold target of 6.6 pence falls below FY22 adjusted EPS of 7.0 pence. However, this includes the benefit of the Covid-related lower than normal level of write offs. Therefore, the Committee believes that 6.6 pence is an appropriately stretching threshold target.
There has not been any LTIP vesting since FY14 which is appropriate given Group performance. However, the purpose of the LTIP is to motivate incremental effort to deliver the transformation strategy and to therefore grow long-term profitability. The Committee believes the carefully considered target range provides an effective incentive for management to drive stretching performance.
ESG STRATEGY AND LINK TO INCENTIVE PLANSAs set out in our ESG and Governance Report on page 42 the Board supported by our ESG Committee, continued to develop our ESG strategy. Last year, we introduced metrics into the Executive Directors’ annual bonus focused on our ESG priorities of GHG and sustainable products, and we are pleased with the progress made against the targets set. GHG and sustainable products continue to be core areas of focus and have therefore been retained in the annual bonus of FY23.
As we move to SBTi and review progress against our ESG strategy, we will consider whether these metrics should continue to be used in the annual bonus or form part of the Company’s long-term incentive. We will also continue to review any additional areas of focus to be included in the incentives.
FIN
AN
CIA
L S
TAT
EM
EN
TS
GO
VE
RN
AN
CE
RE
PO
RT
ST
RA
TE
GIC
RE
PO
RT
N Brown Group plc Annual Report and Accounts 2022 nbrown.co.uk 77
CLOSING REMARKSThe Committee is satisfied with the remuneration outcomes for FY22 which provide a fair and appropriate level of reward for performance achieved in a challenging year. The Committee is comfortable that the policy operated as intended, and that there are no circumstances that require the exercise of discretion to adjust the formulaic remuneration outcomes.
Following extensive review, the Committee does not believe changes are required to the current Remuneration Policy for our next policy period. It continues to have the right structure and is sufficiently flexible to support the business strategy and transformation.
The Committee is also comfortable that the changes it is proposing to the operation of policy for FY23 are appropriate to incentivise management to drive the successful transformation of N Brown and deliver returns for our shareholders.
As we conclude our policy review and considerations on the operation of Policy for FY23, I would like to thank shareholders for their feedback; their thoughtful support is appreciated.
I very much hope you will support both our binding shareholder resolution to approve the new policy and the advisory shareholder resolution on our operation of the Policy, at our 2022 AGM. In the meantime, should you have any questions, I am contactable via the Company Secretary.
Gill BarrChair of the Remuneration Committee
DIRECTORS’ REMUNERATION POLICYAs we continue to report to the same standards as a Premium Listed company, this report sets out the information required by Schedule 5 and Schedule 8 to the Large and Medium-sized Companies and Groups (Accounts and Reports) Regulations 2008, as amended. The report also satisfies the relevant requirements of the Listing Rules of the Financial Conduct Authority and describes how the Board has applied the principles and complied with the provisions relating to Directors’ remuneration in the UK Corporate Governance Code.
This Remuneration Policy will be subject to a binding shareholder vote at the 2022 AGM and is expected to apply for three years from that date.
APPROACH AND CONSIDERATIONS IN REVIEWING THE DIRECTORS’ REMUNERATION POLICY The Remuneration Committee reviews the policy, in the absence of the Executive Directors, where necessary to manage potential conflicts of interest, and with support from its advisors. The Committee’s review process includes consideration of how the current policy aligns to and supports the business strategy, market, regulation and governance developments as well as wider pay context, such as pay ratios and group reward arrangements. The Committee also considers the guidelines of shareholder representative bodies and proxy agencies and investor expectations. As part of this process, the Committee will also consult with its largest shareholders and consider feedback received.
The policy ensures that the remuneration package is linked to our annual and long-term strategy and that it is capable of attracting, motivating and retaining our Executive Directors. The Policy aims to provide competitive remuneration packages which are fair and appropriately constructed, reward achievement of long-term growth, the profitability and sustainability of the business and which do not encourage excessive risk taking.
REMUNERATION CONTINUED
REMUNERATION COMMITTEE REPORT CONTINUED
N Brown Group plc Annual Report and Accounts 2022nbrown.co.uk78
In particular, the Committee strives to ensure that remuneration packages are:
Aligned with the Group’s strategic plan
Aligned with the shareholders’ interests and those of broader stakeholders, and the longer-term growth, performance and sustainability of the business
Measured against stretching targets, both in absolute and relative terms
Competitive and sufficiently flexible to support the recruitment needs of the business
Paid in a combination of cash and shares
Linked to performance measured over annual and three-year performance periods
FACTORS CONSIDERED WHEN DEVELOPING THE REMUNERATION POLICYThe Committee considered the following factors when reviewing the existing Remuneration Policy and developing the proposed Directors’ Remuneration Policy outlined below:
Clarity – All elements of the Remuneration Policy and its implementation are set out clearly in the Directors’ Remuneration Report. Changes are proposed to the current policy to clarify further how the Policy is administered.
Simplicity – The Policy is simple and straightforward with the intention of creating a consistent approach to executive remuneration year on year. The Committee proposes to retain the current policy and incentive structure which have been operated for a number of years and are simple, straightforward and already clearly understood by participants and shareholders.
Risk – The Policy has been developed so that incentive structures discourage inappropriate risk taking through use of long-term incentives, the balance of measures used to determine variable remuneration outcomes, and through features such as shareholding requirements and malus and clawback. Risk management, governance and controls will be one of the factors that the Committee will specifically review when considering annual bonus out turn and the exercise of discretion.
Predictability – The Policy has been constructed to have clear limits on the variable remuneration payable, with the scenario charts later in this report providing illustrative examples of how the Policy may operate in practice. Limits on variable pay awards have been reviewed as part of the policy review and no changes are proposed.
Proportionality – There is a sensible balance between fixed and variable pay, and variable remuneration is appropriately weighted to sustainable long-term performance. The balance between fixed and variable pay and short- and long-term incentives have been considered as part of the policy review and no changes are proposed.
Alignment to culture – Through the assessment of financial and non-financial performance, executives are incentivised through the annual bonus plan to align with N Brown’s values and culture. The ongoing incorporation of ESG and NPS metrics into our annual bonus further aligns our incentives to our business values and cultural priorities.
CHANGES TO THE DIRECTORS’ REMUNERATION POLICYAs explained in the Committee Chair’s Annual Statement on Remuneration, the Committee reviewed the Policy and agreed that no changes are required except for some small administrative amendments which are set out below. Element of policy Policy change Rationale Base Salary No change to policy except to say salary
changes “usually” effective 1 June.To ensure the Committee has flexibility if needed, for example to change the annual review date. This is not currently anticipated.
Leaver policy No proposed changes except to remove the section setting out the treatment of deferred bonus awards.Section being removed “Deferred bonus share awards will normally lapse on cessation, unless they are a good leaver in which case they will normally vest at the usual time.”
This section is no longer required as the deferred element of the bonus is paid in shares with a holding period and not a forfeitable share award (this change was effective with approval of our current policy at the 2019 AGM). There is therefore no bad leaver forfeiture as the shares are beneficially owned by the executive. Clawback still applies.
Pension Wording added to clarify that the pension of 8% is aligned to the contribution to the majority of the workforce.
To clarify the operation of the pension element of the policy is aligned to the workforce.
FIN
AN
CIA
L S
TAT
EM
EN
TS
GO
VE
RN
AN
CE
RE
PO
RT
ST
RA
TE
GIC
RE
PO
RT
N Brown Group plc Annual Report and Accounts 2022 nbrown.co.uk 79
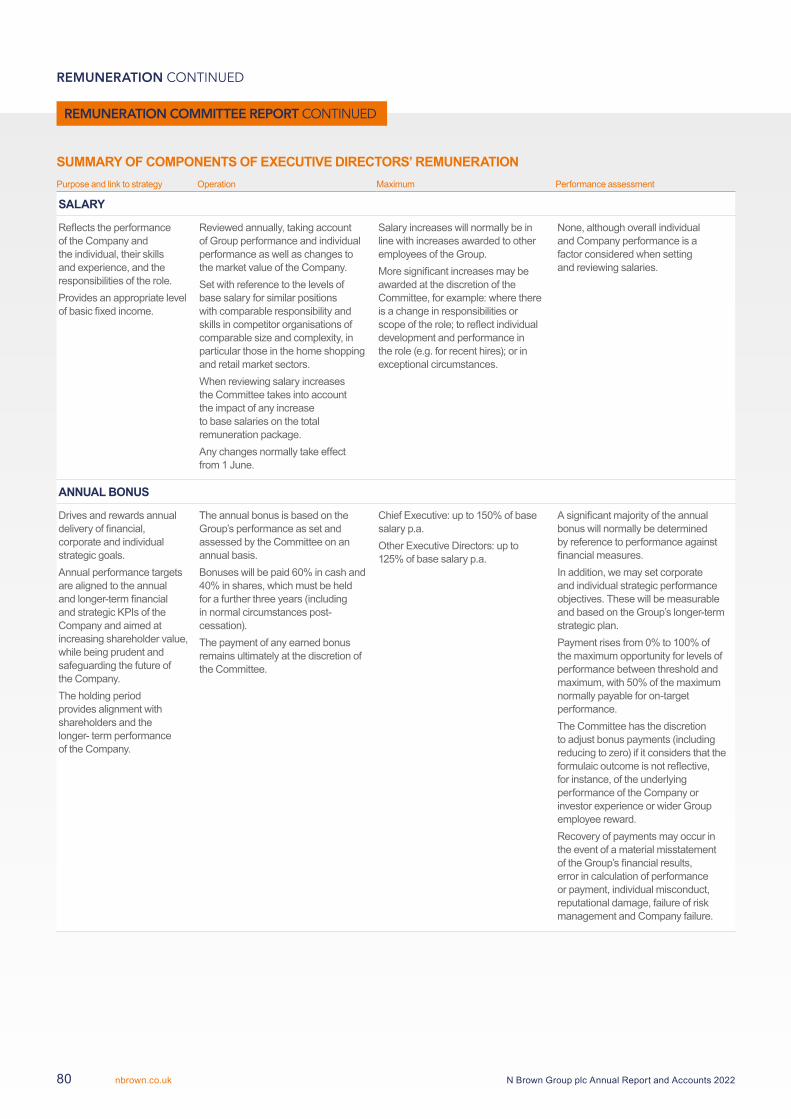
SUMMARY OF COMPONENTS OF EXECUTIVE DIRECTORS’ REMUNERATIONPurpose and link to strategy Operation Maximum Performance assessment
SALARY
Reflects the performance of the Company and the individual, their skills and experience, and the responsibilities of the role.Provides an appropriate level of basic fixed income.
Reviewed annually, taking account of Group performance and individual performance as well as changes to the market value of the Company.Set with reference to the levels of base salary for similar positions with comparable responsibility and skills in competitor organisations of comparable size and complexity, in particular those in the home shopping and retail market sectors.When reviewing salary increases the Committee takes into account the impact of any increase to base salaries on the total remuneration package.Any changes normally take effect from 1 June.
Salary increases will normally be in line with increases awarded to other employees of the Group.More significant increases may be awarded at the discretion of the Committee, for example: where there is a change in responsibilities or scope of the role; to reflect individual development and performance in the role (e.g. for recent hires); or in exceptional circumstances.
None, although overall individual and Company performance is a factor considered when setting and reviewing salaries.
ANNUAL BONUS
Drives and rewards annual delivery of financial, corporate and individual strategic goals.Annual performance targets are aligned to the annual and longer-term financial and strategic KPIs of the Company and aimed at increasing shareholder value, while being prudent and safeguarding the future of the Company.The holding period provides alignment with shareholders and the longer- term performance of the Company.
The annual bonus is based on the Group’s performance as set and assessed by the Committee on an annual basis.Bonuses will be paid 60% in cash and 40% in shares, which must be held for a further three years (including in normal circumstances post- cessation).The payment of any earned bonus remains ultimately at the discretion of the Committee.
Chief Executive: up to 150% of base salary p.a.Other Executive Directors: up to 125% of base salary p.a.
A significant majority of the annual bonus will normally be determined by reference to performance against financial measures.In addition, we may set corporate and individual strategic performance objectives. These will be measurable and based on the Group’s longer-term strategic plan.Payment rises from 0% to 100% of the maximum opportunity for levels of performance between threshold and maximum, with 50% of the maximum normally payable for on-target performance. The Committee has the discretion to adjust bonus payments (including reducing to zero) if it considers that the formulaic outcome is not reflective, for instance, of the underlying performance of the Company or investor experience or wider Group employee reward.Recovery of payments may occur in the event of a material misstatement of the Group’s financial results, error in calculation of performance or payment, individual misconduct, reputational damage, failure of risk management and Company failure.
REMUNERATION CONTINUED
REMUNERATION COMMITTEE REPORT CONTINUED
N Brown Group plc Annual Report and Accounts 2022nbrown.co.uk80
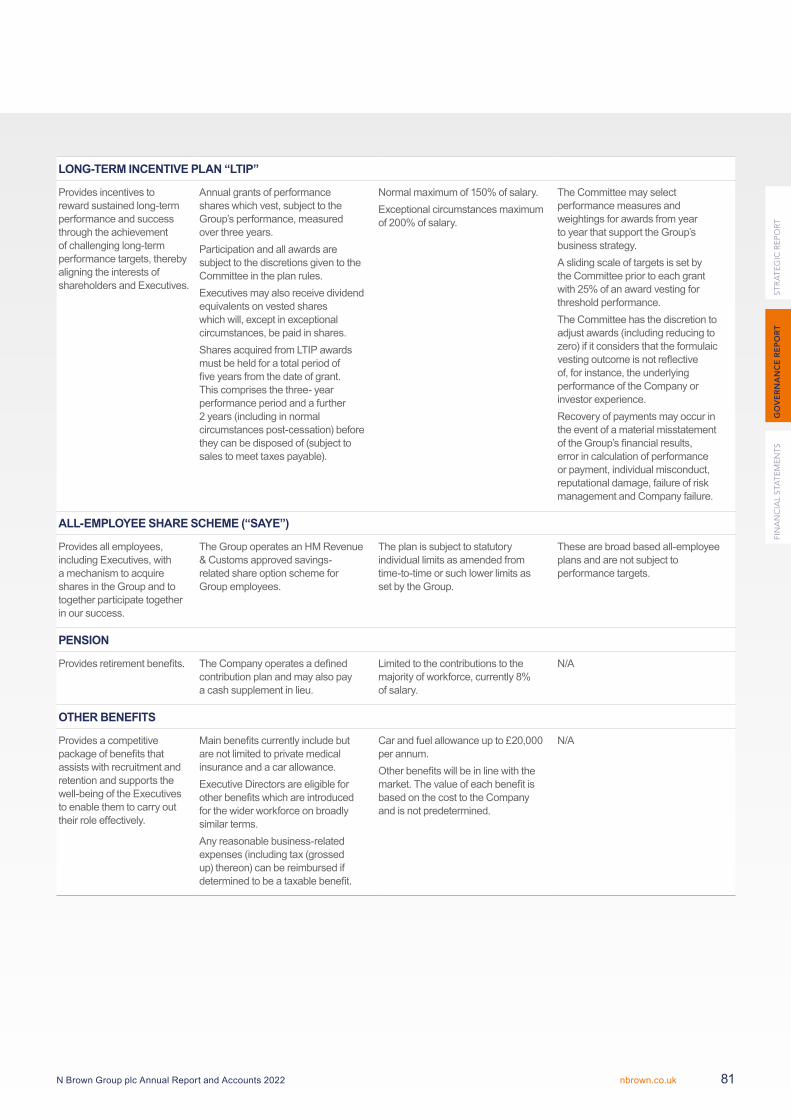
LONG-TERM INCENTIVE PLAN “LTIP”
Provides incentives to reward sustained long-term performance and success through the achievement of challenging long-term performance targets, thereby aligning the interests of shareholders and Executives.
Annual grants of performance shares which vest, subject to the Group’s performance, measured over three years.Participation and all awards are subject to the discretions given to the Committee in the plan rules.Executives may also receive dividend equivalents on vested shares which will, except in exceptional circumstances, be paid in shares.Shares acquired from LTIP awards must be held for a total period of five years from the date of grant. This comprises the three- year performance period and a further 2 years (including in normal circumstances post-cessation) before they can be disposed of (subject to sales to meet taxes payable).
Normal maximum of 150% of salary.Exceptional circumstances maximum of 200% of salary.
The Committee may select performance measures and weightings for awards from year to year that support the Group’s business strategy.A sliding scale of targets is set by the Committee prior to each grant with 25% of an award vesting for threshold performance.The Committee has the discretion to adjust awards (including reducing to zero) if it considers that the formulaic vesting outcome is not reflective of, for instance, the underlying performance of the Company or investor experience.Recovery of payments may occur in the event of a material misstatement of the Group’s financial results, error in calculation of performance or payment, individual misconduct, reputational damage, failure of risk management and Company failure.
ALL-EMPLOYEE SHARE SCHEME (“SAYE”)
Provides all employees, including Executives, with a mechanism to acquire shares in the Group and to together participate together in our success.
The Group operates an HM Revenue & Customs approved savings-related share option scheme for Group employees.
The plan is subject to statutory individual limits as amended from time-to-time or such lower limits as set by the Group.
These are broad based all-employee plans and are not subject to performance targets.
PENSION
Provides retirement benefits. The Company operates a defined contribution plan and may also pay a cash supplement in lieu.
Limited to the contributions to the majority of workforce, currently 8% of salary.
N/A
OTHER BENEFITS
Provides a competitive package of benefits that assists with recruitment and retention and supports the well-being of the Executives to enable them to carry out their role effectively.
Main benefits currently include but are not limited to private medical insurance and a car allowance.Executive Directors are eligible for other benefits which are introduced for the wider workforce on broadly similar terms.Any reasonable business-related expenses (including tax (grossed up) thereon) can be reimbursed if determined to be a taxable benefit.
Car and fuel allowance up to £20,000 per annum.Other benefits will be in line with the market. The value of each benefit is based on the cost to the Company and is not predetermined.
N/A
FIN
AN
CIA
L S
TAT
EM
EN
TS
GO
VE
RN
AN
CE
RE
PO
RT
ST
RA
TE
GIC
RE
PO
RT
N Brown Group plc Annual Report and Accounts 2022 nbrown.co.uk 81
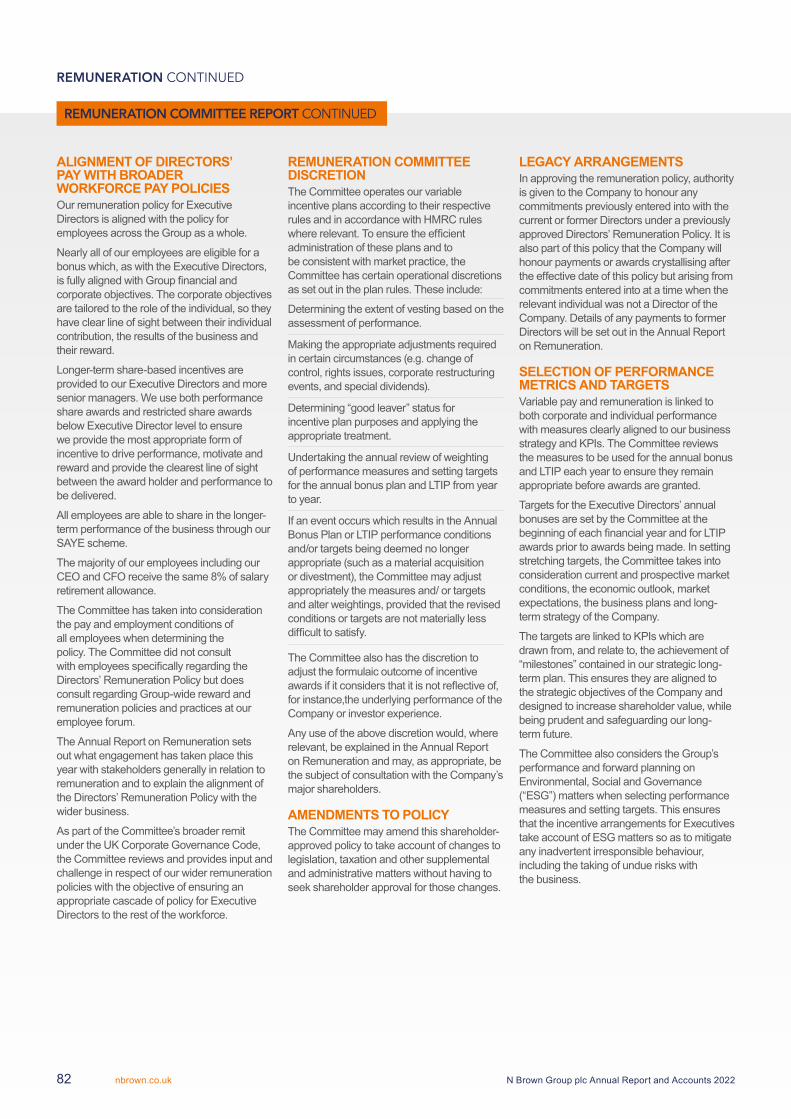
ALIGNMENT OF DIRECTORS’ PAY WITH BROADER WORKFORCE PAY POLICIESOur remuneration policy for Executive Directors is aligned with the policy for employees across the Group as a whole.
Nearly all of our employees are eligible for a bonus which, as with the Executive Directors, is fully aligned with Group financial and corporate objectives. The corporate objectives are tailored to the role of the individual, so they have clear line of sight between their individual contribution, the results of the business and their reward.
Longer-term share-based incentives are provided to our Executive Directors and more senior managers. We use both performance share awards and restricted share awards below Executive Director level to ensure we provide the most appropriate form of incentive to drive performance, motivate and reward and provide the clearest line of sight between the award holder and performance to be delivered.
All employees are able to share in the longer-term performance of the business through our SAYE scheme.
The majority of our employees including our CEO and CFO receive the same 8% of salary retirement allowance.
The Committee has taken into consideration the pay and employment conditions of all employees when determining the policy. The Committee did not consult with employees specifically regarding the Directors’ Remuneration Policy but does consult regarding Group-wide reward and remuneration policies and practices at our employee forum.
The Annual Report on Remuneration sets out what engagement has taken place this year with stakeholders generally in relation to remuneration and to explain the alignment of the Directors’ Remuneration Policy with the wider business.
As part of the Committee’s broader remit under the UK Corporate Governance Code, the Committee reviews and provides input and challenge in respect of our wider remuneration policies with the objective of ensuring an appropriate cascade of policy for Executive Directors to the rest of the workforce.
REMUNERATION COMMITTEE DISCRETIONThe Committee operates our variable incentive plans according to their respective rules and in accordance with HMRC rules where relevant. To ensure the efficient administration of these plans and to be consistent with market practice, the Committee has certain operational discretions as set out in the plan rules. These include:
Determining the extent of vesting based on the assessment of performance.
Making the appropriate adjustments required in certain circumstances (e.g. change of control, rights issues, corporate restructuring events, and special dividends).
Determining “good leaver” status for incentive plan purposes and applying the appropriate treatment.
Undertaking the annual review of weighting of performance measures and setting targets for the annual bonus plan and LTIP from year to year.
If an event occurs which results in the Annual Bonus Plan or LTIP performance conditions and/or targets being deemed no longer appropriate (such as a material acquisition or divestment), the Committee may adjust appropriately the measures and/ or targets and alter weightings, provided that the revised conditions or targets are not materially less difficult to satisfy.
The Committee also has the discretion to adjust the formulaic outcome of incentive awards if it considers that it is not reflective of, for instance,the underlying performance of the Company or investor experience.
Any use of the above discretion would, where relevant, be explained in the Annual Report on Remuneration and may, as appropriate, be the subject of consultation with the Company’s major shareholders.
AMENDMENTS TO POLICYThe Committee may amend this shareholder-approved policy to take account of changes to legislation, taxation and other supplemental and administrative matters without having to seek shareholder approval for those changes.
LEGACY ARRANGEMENTSIn approving the remuneration policy, authority is given to the Company to honour any commitments previously entered into with the current or former Directors under a previously approved Directors’ Remuneration Policy. It is also part of this policy that the Company will honour payments or awards crystallising after the effective date of this policy but arising from commitments entered into at a time when the relevant individual was not a Director of the Company. Details of any payments to former Directors will be set out in the Annual Report on Remuneration.
SELECTION OF PERFORMANCE METRICS AND TARGETSVariable pay and remuneration is linked to both corporate and individual performance with measures clearly aligned to our business strategy and KPIs. The Committee reviews the measures to be used for the annual bonus and LTIP each year to ensure they remain appropriate before awards are granted.
Targets for the Executive Directors’ annual bonuses are set by the Committee at the beginning of each financial year and for LTIP awards prior to awards being made. In setting stretching targets, the Committee takes into consideration current and prospective market conditions, the economic outlook, market expectations, the business plans and long-term strategy of the Company.
The targets are linked to KPIs which are drawn from, and relate to, the achievement of “milestones” contained in our strategic long-term plan. This ensures they are aligned to the strategic objectives of the Company and designed to increase shareholder value, while being prudent and safeguarding our long-term future.
The Committee also considers the Group’s performance and forward planning on Environmental, Social and Governance (“ESG”) matters when selecting performance measures and setting targets. This ensures that the incentive arrangements for Executives take account of ESG matters so as to mitigate any inadvertent irresponsible behaviour, including the taking of undue risks with the business.
REMUNERATION CONTINUED
REMUNERATION COMMITTEE REPORT CONTINUED
N Brown Group plc Annual Report and Accounts 2022nbrown.co.uk82
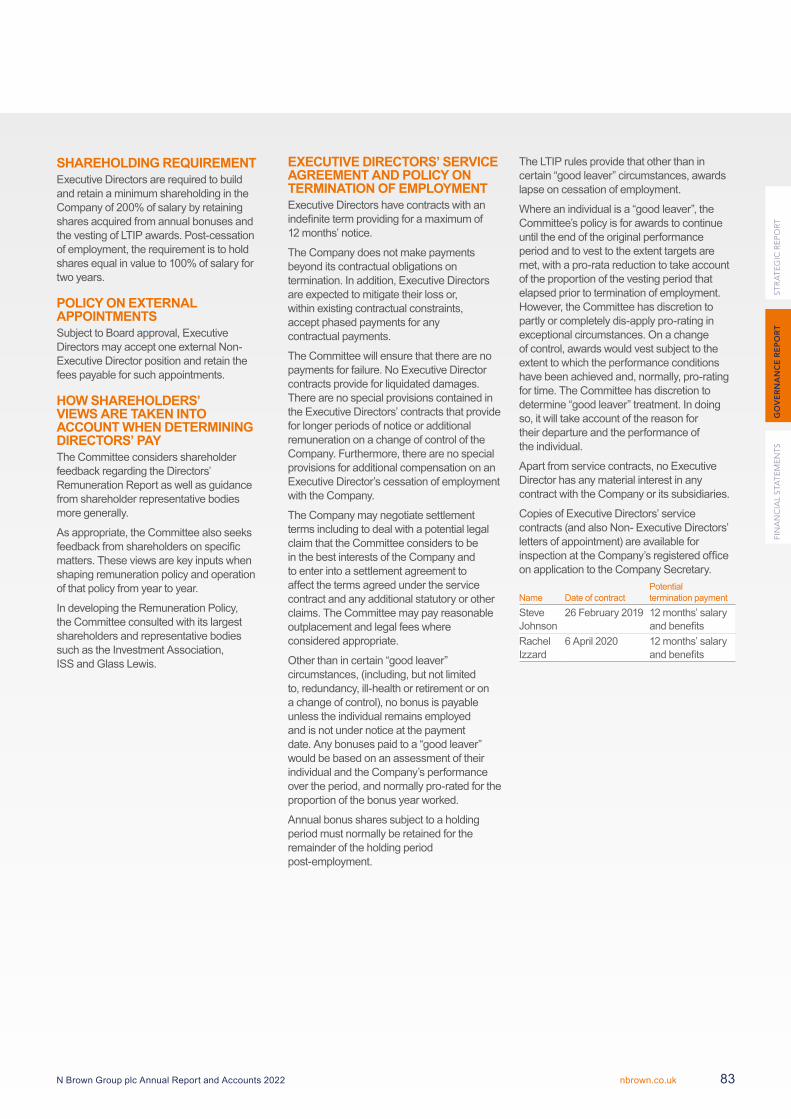
SHAREHOLDING REQUIREMENTExecutive Directors are required to build and retain a minimum shareholding in the Company of 200% of salary by retaining shares acquired from annual bonuses and the vesting of LTIP awards. Post-cessation of employment, the requirement is to hold shares equal in value to 100% of salary for two years.
POLICY ON EXTERNAL APPOINTMENTSSubject to Board approval, Executive Directors may accept one external Non-Executive Director position and retain the fees payable for such appointments.
HOW SHAREHOLDERS’ VIEWS ARE TAKEN INTO ACCOUNT WHEN DETERMINING DIRECTORS’ PAYThe Committee considers shareholder feedback regarding the Directors’ Remuneration Report as well as guidance from shareholder representative bodies more generally.
As appropriate, the Committee also seeks feedback from shareholders on specific matters. These views are key inputs when shaping remuneration policy and operation of that policy from year to year.
In developing the Remuneration Policy, the Committee consulted with its largest shareholders and representative bodies such as the Investment Association, ISS and Glass Lewis.
EXECUTIVE DIRECTORS’ SERVICE AGREEMENT AND POLICY ON TERMINATION OF EMPLOYMENTExecutive Directors have contracts with an indefinite term providing for a maximum of 12 months’ notice.
The Company does not make payments beyond its contractual obligations on termination. In addition, Executive Directors are expected to mitigate their loss or, within existing contractual constraints, accept phased payments for any contractual payments.
The Committee will ensure that there are no payments for failure. No Executive Director contracts provide for liquidated damages. There are no special provisions contained in the Executive Directors’ contracts that provide for longer periods of notice or additional remuneration on a change of control of the Company. Furthermore, there are no special provisions for additional compensation on an Executive Director’s cessation of employment with the Company.
The Company may negotiate settlement terms including to deal with a potential legal claim that the Committee considers to be in the best interests of the Company and to enter into a settlement agreement to affect the terms agreed under the service contract and any additional statutory or other claims. The Committee may pay reasonable outplacement and legal fees where considered appropriate.
Other than in certain “good leaver” circumstances, (including, but not limited to, redundancy, ill-health or retirement or on a change of control), no bonus is payable unless the individual remains employed and is not under notice at the payment date. Any bonuses paid to a “good leaver” would be based on an assessment of their individual and the Company’s performance over the period, and normally pro-rated for the proportion of the bonus year worked.
Annual bonus shares subject to a holding period must normally be retained for the remainder of the holding period post-employment.
The LTIP rules provide that other than in certain “good leaver” circumstances, awards lapse on cessation of employment.
Where an individual is a “good leaver”, the Committee’s policy is for awards to continue until the end of the original performance period and to vest to the extent targets are met, with a pro-rata reduction to take account of the proportion of the vesting period that elapsed prior to termination of employment. However, the Committee has discretion to partly or completely dis-apply pro-rating in exceptional circumstances. On a change of control, awards would vest subject to the extent to which the performance conditions have been achieved and, normally, pro-rating for time. The Committee has discretion to determine “good leaver” treatment. In doing so, it will take account of the reason for their departure and the performance of the individual.
Apart from service contracts, no Executive Director has any material interest in any contract with the Company or its subsidiaries.
Copies of Executive Directors’ service contracts (and also Non- Executive Directors’ letters of appointment) are available for inspection at the Company’s registered office on application to the Company Secretary.
Name Date of contractPotential termination payment
Steve Johnson
26 February 2019 12 months’ salary and benefits
Rachel Izzard
6 April 2020 12 months’ salary and benefits
FIN
AN
CIA
L S
TAT
EM
EN
TS
GO
VE
RN
AN
CE
RE
PO
RT
ST
RA
TE
GIC
RE
PO
RT
N Brown Group plc Annual Report and Accounts 2022 nbrown.co.uk 83
RECRUITMENT OF EXECUTIVE DIRECTORSBase salary levels will be set in accordance with the Company’s remuneration policy, taking account of the Executive’s skills, experience, current remuneration package and securing the best candidate for the role. Where it is appropriate to offer a lower salary initially, a series of above inflation increases to the desired salary positioning may be given over subsequent years subject to individual and Company performance.
Benefits and pension will be provided in accordance with the approved policy. Assistance with relocation may be provided where appropriate. Tax equalisation and an expatriate allowance may also be considered, as may payment of the Executive’s legal fees in connection with the appointment.
The variable pay opportunity will be in accordance with the Company’s approved policy as detailed above. However, different performance measures and targets may be set for the first year in the case of the annual bonus and long-term incentives, taking into account the responsibilities of the individual and the point in the financial year at which they joined. A new employee may be granted a normal annual share award in the first year of employment in addition to any awards made with respect to prior employment being forfeited.
If it is necessary to buy out incentive pay, which would be forfeited by reason of leaving the previous employer, in order to secure the appointment, this would be provided taking into account and replicating as far as possible the form (cash or shares), delivery mechanism, performance measures, timing and expected value (i.e. likelihood of meeting any existing performance criteria) of the remuneration being forfeited and such other specific matters as the Committee considers relevant.
Existing arrangements may be bought out on terms that, in the Committee’s judgement, are no more favourable than the remuneration being forfeited. Existing plans will be used to the extent possible (subject to the exceptional limits contained in the plan rules), however, the Committee retains discretion to agree bespoke arrangements and, if required, to make use of the flexibility provided by the Listing Rules to make awards without prior shareholder approval when buying out existing entitlements. Other benefits or remuneration may also need to be “bought out” and the Committee will use its judgement as to the most appropriate way to structure this.
The service contract for a new appointment would be in accordance with the policy for the current Executive Directors.
In the case of an internal hire, any outstanding variable pay awarded in relation to the previous role will be allowed to pay out according to its terms of grant.
The chart opposite sets out three scenarios for Executive Directors’ remuneration for FY23.
REMUNERATION CONTINUED
REMUNERATION COMMITTEE REPORT CONTINUED
N Brown Group plc Annual Report and Accounts 2022nbrown.co.uk84
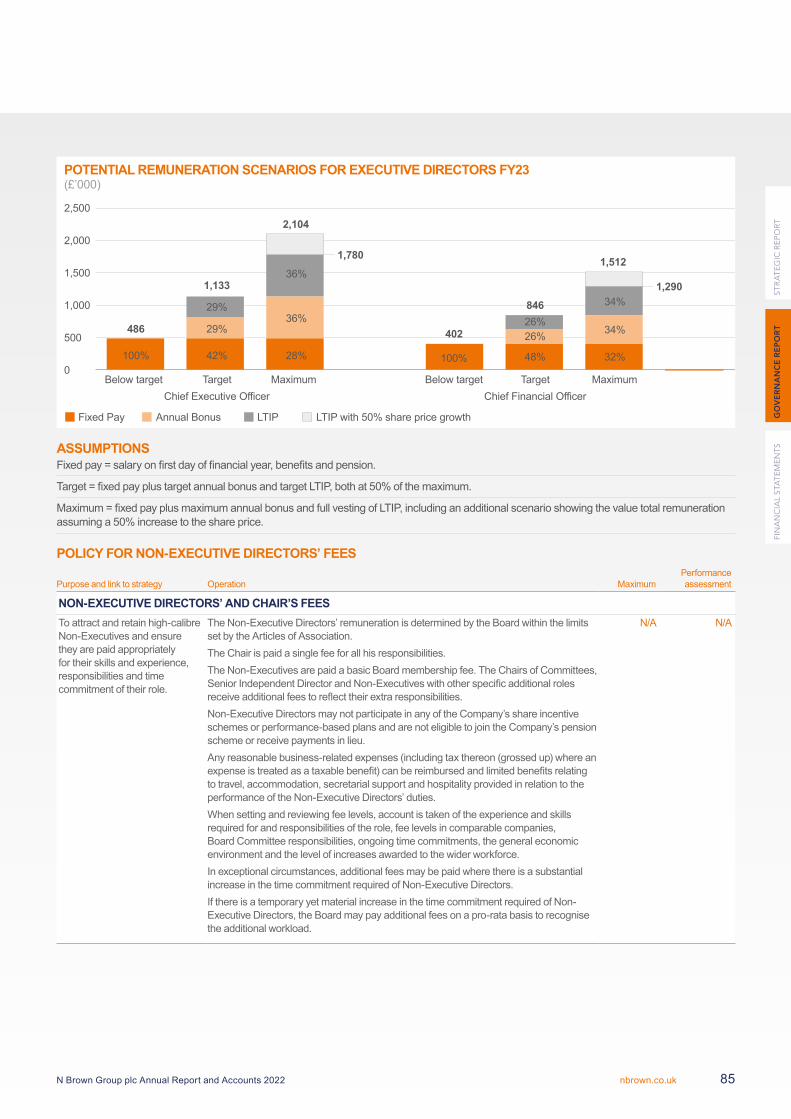
POTENTIAL REMUNERATION SCENARIOS FOR EXECUTIVE DIRECTORS FY23(£’000)
2,500
0
500
1,000
Fixed Pay Annual Bonus
1,500
2,000
Below target
100%
486 402
42% 28%
29%36%
29%
36%1,133
2,104
1,780
100% 48% 32%
26% 34%26%
34%846
Target MaximumChief Executive Officer
Below target Target MaximumChief Financial Officer
LTIP LTIP with 50% share price growth
1,512
1,290
ASSUMPTIONSFixed pay = salary on first day of financial year, benefits and pension.
Target = fixed pay plus target annual bonus and target LTIP, both at 50% of the maximum.
Maximum = fixed pay plus maximum annual bonus and full vesting of LTIP, including an additional scenario showing the value total remuneration assuming a 50% increase to the share price.
POLICY FOR NON-EXECUTIVE DIRECTORS’ FEES
Purpose and link to strategy Operation MaximumPerformance assessment
NON-EXECUTIVE DIRECTORS’ AND CHAIR’S FEESTo attract and retain high-calibre Non-Executives and ensure they are paid appropriately for their skills and experience, responsibilities and time commitment of their role.
The Non-Executive Directors’ remuneration is determined by the Board within the limits set by the Articles of Association.The Chair is paid a single fee for all his responsibilities.The Non-Executives are paid a basic Board membership fee. The Chairs of Committees, Senior Independent Director and Non-Executives with other specific additional roles receive additional fees to reflect their extra responsibilities.Non-Executive Directors may not participate in any of the Company’s share incentive schemes or performance-based plans and are not eligible to join the Company’s pension scheme or receive payments in lieu.Any reasonable business-related expenses (including tax thereon (grossed up) where an expense is treated as a taxable benefit) can be reimbursed and limited benefits relating to travel, accommodation, secretarial support and hospitality provided in relation to the performance of the Non-Executive Directors’ duties.When setting and reviewing fee levels, account is taken of the experience and skills required for and responsibilities of the role, fee levels in comparable companies, Board Committee responsibilities, ongoing time commitments, the general economic environment and the level of increases awarded to the wider workforce.In exceptional circumstances, additional fees may be paid where there is a substantial increase in the time commitment required of Non-Executive Directors.If there is a temporary yet material increase in the time commitment required of Non-Executive Directors, the Board may pay additional fees on a pro-rata basis to recognise the additional workload.
N/A N/A
FIN
AN
CIA
L S
TAT
EM
EN
TS
GO
VE
RN
AN
CE
RE
PO
RT
ST
RA
TE
GIC
RE
PO
RT
N Brown Group plc Annual Report and Accounts 2022 nbrown.co.uk 85
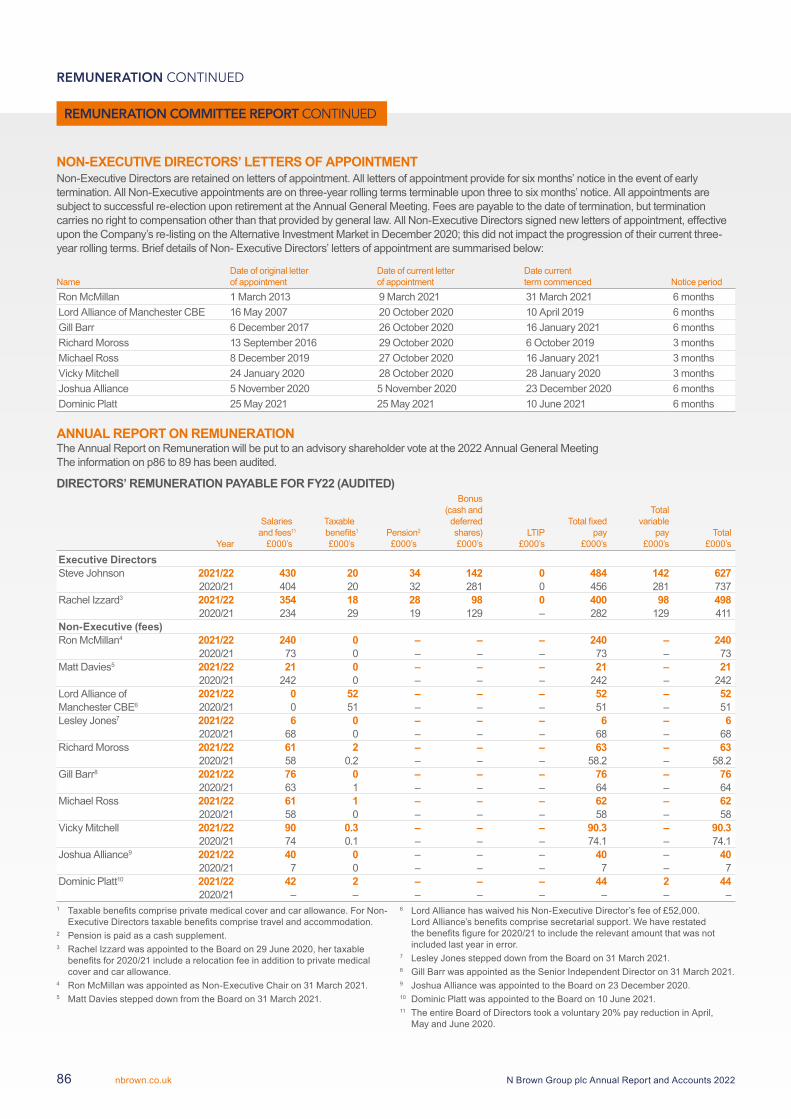
NON-EXECUTIVE DIRECTORS’ LETTERS OF APPOINTMENTNon-Executive Directors are retained on letters of appointment. All letters of appointment provide for six months’ notice in the event of early termination. All Non-Executive appointments are on three-year rolling terms terminable upon three to six months’ notice. All appointments are subject to successful re-election upon retirement at the Annual General Meeting. Fees are payable to the date of termination, but termination carries no right to compensation other than that provided by general law. All Non-Executive Directors signed new letters of appointment, effective upon the Company’s re-listing on the Alternative Investment Market in December 2020; this did not impact the progression of their current three-year rolling terms. Brief details of Non- Executive Directors’ letters of appointment are summarised below:
NameDate of original letter of appointment
Date of current letter of appointment
Date current term commenced Notice period
Ron McMillan 1 March 2013 9 March 2021 31 March 2021 6 monthsLord Alliance of Manchester CBE 16 May 2007 20 October 2020 10 April 2019 6 monthsGill Barr 6 December 2017 26 October 2020 16 January 2021 6 monthsRichard Moross 13 September 2016 29 October 2020 6 October 2019 3 monthsMichael Ross 8 December 2019 27 October 2020 16 January 2021 3 monthsVicky Mitchell 24 January 2020 28 October 2020 28 January 2020 3 monthsJoshua Alliance 5 November 2020 5 November 2020 23 December 2020 6 monthsDominic Platt 25 May 2021 25 May 2021 10 June 2021 6 months
ANNUAL REPORT ON REMUNERATION The Annual Report on Remuneration will be put to an advisory shareholder vote at the 2022 Annual General Meeting The information on p86 to 89 has been audited.
DIRECTORS’ REMUNERATION PAYABLE FOR FY22 (AUDITED)
Year
Salaries and fees11
£000’s
Taxable benefits1
£000’sPension2
£000’s
Bonus (cash and
deferred shares)£000’s
LTIP£000’s
Total fixed pay
£000’s
Total variable
pay£000’s
Total£000’s
Executive DirectorsSteve Johnson 2021/22 430 20 34 142 0 484 142 627
2020/21 404 20 32 281 0 456 281 737Rachel Izzard3 2021/22 354 18 28 98 0 400 98 498
2020/21 234 29 19 129 – 282 129 411Non-Executive (fees)Ron McMillan4 2021/22 240 0 – – – 240 – 240
2020/21 73 0 – – – 73 – 73Matt Davies5 2021/22 21 0 – – – 21 – 21
2020/21 242 0 – – – 242 – 242Lord Alliance of Manchester CBE6
2021/22 0 52 – – – 52 – 522020/21 0 51 – – – 51 – 51
Lesley Jones7 2021/22 6 0 – – – 6 – 62020/21 68 0 – – – 68 – 68
Richard Moross 2021/22 61 2 – – – 63 – 632020/21 58 0.2 – – – 58.2 – 58.2
Gill Barr8 2021/22 76 0 – – – 76 – 762020/21 63 1 – – – 64 – 64
Michael Ross 2021/22 61 1 – – – 62 – 622020/21 58 0 – – – 58 – 58
Vicky Mitchell 2021/22 90 0.3 – – – 90.3 – 90.32020/21 74 0.1 – – – 74.1 – 74.1
Joshua Alliance9 2021/22 40 0 – – – 40 – 402020/21 7 0 – – – 7 – 7
Dominic Platt10 2021/22 42 2 – – – 44 2 442020/21 – – – – – – – –
1 Taxable benefits comprise private medical cover and car allowance. For Non-Executive Directors taxable benefits comprise travel and accommodation.
2 Pension is paid as a cash supplement.3 Rachel Izzard was appointed to the Board on 29 June 2020, her taxable
benefits for 2020/21 include a relocation fee in addition to private medical cover and car allowance.
4 Ron McMillan was appointed as Non-Executive Chair on 31 March 2021.5 Matt Davies stepped down from the Board on 31 March 2021.
6 Lord Alliance has waived his Non-Executive Director’s fee of £52,000. Lord Alliance’s benefits comprise secretarial support. We have restated the benefits figure for 2020/21 to include the relevant amount that was not included last year in error.
7 Lesley Jones stepped down from the Board on 31 March 2021.8 Gill Barr was appointed as the Senior Independent Director on 31 March 2021. 9 Joshua Alliance was appointed to the Board on 23 December 2020.10 Dominic Platt was appointed to the Board on 10 June 2021.11 The entire Board of Directors took a voluntary 20% pay reduction in April,
May and June 2020.
REMUNERATION CONTINUED
REMUNERATION COMMITTEE REPORT CONTINUED
N Brown Group plc Annual Report and Accounts 2022nbrown.co.uk86
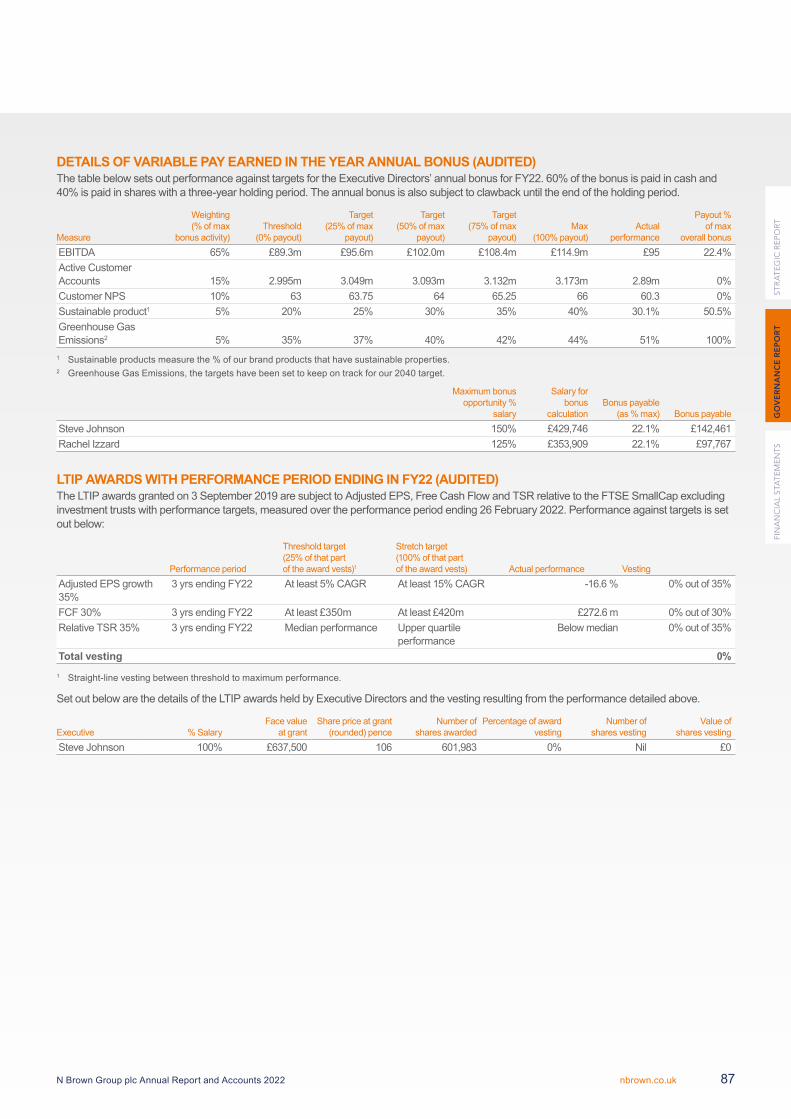
DETAILS OF VARIABLE PAY EARNED IN THE YEAR ANNUAL BONUS (AUDITED)The table below sets out performance against targets for the Executive Directors’ annual bonus for FY22. 60% of the bonus is paid in cash and 40% is paid in shares with a three-year holding period. The annual bonus is also subject to clawback until the end of the holding period.
Measure
Weighting (% of max
bonus activity)Threshold
(0% payout)
Target (25% of max
payout)
Target (50% of max
payout)
Target(75% of max
payout)Max
(100% payout)Actual
performance
Payout % of max
overall bonusEBITDA 65% £89.3m £95.6m £102.0m £108.4m £114.9m £95 22.4%Active Customer Accounts 15% 2.995m 3.049m 3.093m 3.132m 3.173m 2.89m 0%Customer NPS 10% 63 63.75 64 65.25 66 60.3 0%Sustainable product1 5% 20% 25% 30% 35% 40% 30.1% 50.5%Greenhouse Gas Emissions2 5% 35% 37% 40% 42% 44% 51% 100%
1 Sustainable products measure the % of our brand products that have sustainable properties.2 Greenhouse Gas Emissions, the targets have been set to keep on track for our 2040 target.
Maximum bonus opportunity %
salary
Salary for bonus
calculationBonus payable
(as % max) Bonus payable Steve Johnson 150% £429,746 22.1% £142,461Rachel Izzard 125% £353,909 22.1% £97,767
LTIP AWARDS WITH PERFORMANCE PERIOD ENDING IN FY22 (AUDITED)The LTIP awards granted on 3 September 2019 are subject to Adjusted EPS, Free Cash Flow and TSR relative to the FTSE SmallCap excluding investment trusts with performance targets, measured over the performance period ending 26 February 2022. Performance against targets is set out below:
Performance period
Threshold target (25% of that part of the award vests)1
Stretch target (100% of that part of the award vests) Actual performance Vesting
Adjusted EPS growth 35%
3 yrs ending FY22 At least 5% CAGR At least 15% CAGR -16.6 % 0% out of 35%
FCF 30% 3 yrs ending FY22 At least £350m At least £420m £272.6 m 0% out of 30%Relative TSR 35% 3 yrs ending FY22 Median performance Upper quartile
performanceBelow median 0% out of 35%
Total vesting 0%1 Straight-line vesting between threshold to maximum performance.
Set out below are the details of the LTIP awards held by Executive Directors and the vesting resulting from the performance detailed above.
Executive % SalaryFace value
at grant Share price at grant
(rounded) penceNumber of
shares awardedPercentage of award
vestingNumber of
shares vestingValue of
shares vestingSteve Johnson 100% £637,500 106 601,983 0% Nil £0
FIN
AN
CIA
L S
TAT
EM
EN
TS
GO
VE
RN
AN
CE
RE
PO
RT
ST
RA
TE
GIC
RE
PO
RT
N Brown Group plc Annual Report and Accounts 2022 nbrown.co.uk 87
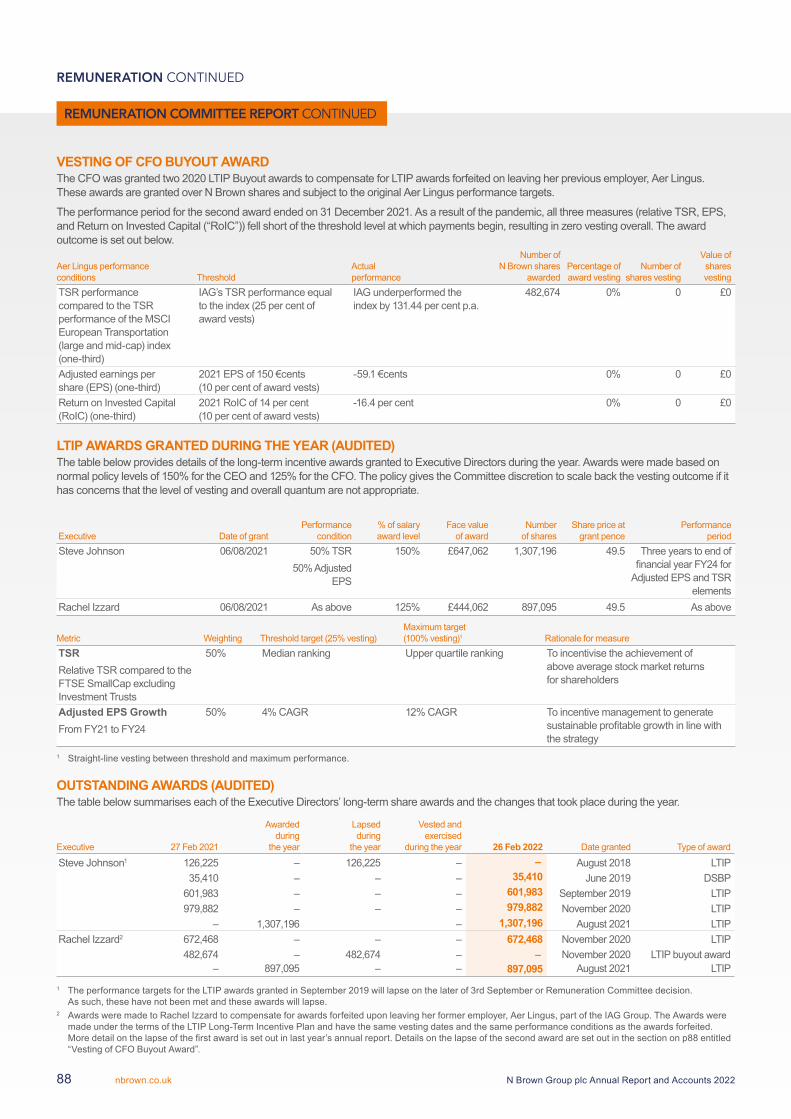
VESTING OF CFO BUYOUT AWARDThe CFO was granted two 2020 LTIP Buyout awards to compensate for LTIP awards forfeited on leaving her previous employer, Aer Lingus. These awards are granted over N Brown shares and subject to the original Aer Lingus performance targets.
The performance period for the second award ended on 31 December 2021. As a result of the pandemic, all three measures (relative TSR, EPS, and Return on Invested Capital (“RoIC”)) fell short of the threshold level at which payments begin, resulting in zero vesting overall. The award outcome is set out below.
Aer Lingus performance conditions Threshold
Actual performance
Number of N Brown shares
awardedPercentage of award vesting
Number of shares vesting
Value of shares vesting
TSR performance compared to the TSR performance of the MSCI European Transportation (large and mid-cap) index (one-third)
IAG’s TSR performance equal to the index (25 per cent of award vests)
IAG underperformed the index by 131.44 per cent p.a.
482,674 0% 0 £0
Adjusted earnings per share (EPS) (one-third)
2021 EPS of 150 €cents (10 per cent of award vests)
-59.1 €cents 0% 0 £0
Return on Invested Capital (RoIC) (one-third)
2021 RoIC of 14 per cent (10 per cent of award vests)
-16.4 per cent 0% 0 £0
LTIP AWARDS GRANTED DURING THE YEAR (AUDITED)The table below provides details of the long-term incentive awards granted to Executive Directors during the year. Awards were made based on normal policy levels of 150% for the CEO and 125% for the CFO. The policy gives the Committee discretion to scale back the vesting outcome if it has concerns that the level of vesting and overall quantum are not appropriate.
Executive Date of grantPerformance
condition% of salary award level
Face value of award
Number of shares
Share price at grant pence
Performance period
Steve Johnson 06/08/2021 50% TSR50% Adjusted
EPS
150% £647,062 1,307,196 49.5 Three years to end of financial year FY24 for
Adjusted EPS and TSR elements
Rachel Izzard 06/08/2021 As above 125% £444,062 897,095 49.5 As above
Metric Weighting Threshold target (25% vesting) Maximum target (100% vesting)1 Rationale for measure
TSRRelative TSR compared to the FTSE SmallCap excluding Investment Trusts
50% Median ranking Upper quartile ranking To incentivise the achievement of above average stock market returns for shareholders
Adjusted EPS GrowthFrom FY21 to FY24
50% 4% CAGR 12% CAGR To incentive management to generate sustainable profitable growth in line with the strategy
1 Straight-line vesting between threshold and maximum performance.
OUTSTANDING AWARDS (AUDITED)The table below summarises each of the Executive Directors’ long-term share awards and the changes that took place during the year.
Executive 27 Feb 2021
Awarded during
the year
Lapsed during
the year
Vested and exercised
during the year 26 Feb 2022 Date granted Type of award
Steve Johnson1 126,225 – 126,225 – – August 2018 LTIP35,410 – – – 35,410 June 2019 DSBP
601,983 – – – 601,983 September 2019 LTIP979,882 – – – 979,882 November 2020 LTIP
– 1,307,196 – 1,307,196 August 2021 LTIPRachel Izzard2 672,468 – – – 672,468 November 2020 LTIP
482,674 – 482,674 – – November 2020 LTIP buyout award– 897,095 – – 897,095 August 2021 LTIP
1 The performance targets for the LTIP awards granted in September 2019 will lapse on the later of 3rd September or Remuneration Committee decision. As such, these have not been met and these awards will lapse.
2 Awards were made to Rachel Izzard to compensate for awards forfeited upon leaving her former employer, Aer Lingus, part of the IAG Group. The Awards were made under the terms of the LTIP Long-Term Incentive Plan and have the same vesting dates and the same performance conditions as the awards forfeited. More detail on the lapse of the first award is set out in last year’s annual report. Details on the lapse of the second award are set out in the section on p88 entitled “Vesting of CFO Buyout Award”.
REMUNERATION CONTINUED
REMUNERATION COMMITTEE REPORT CONTINUED
N Brown Group plc Annual Report and Accounts 2022nbrown.co.uk88
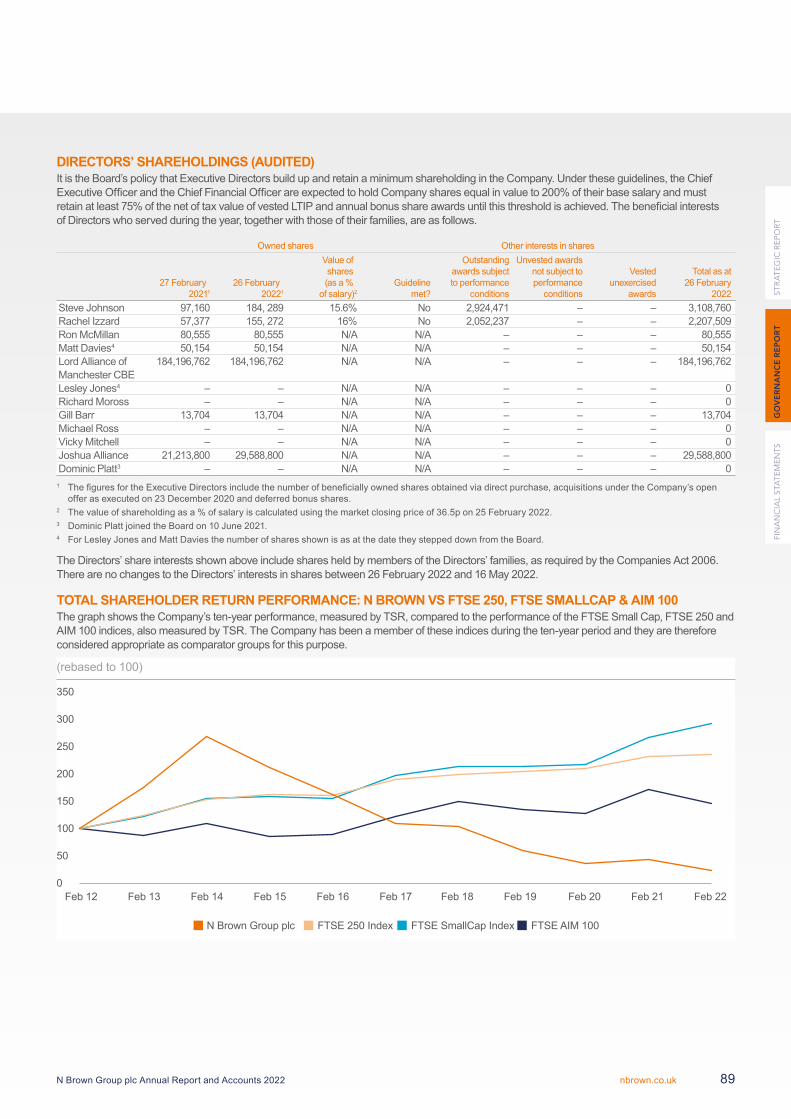
DIRECTORS’ SHAREHOLDINGS (AUDITED)It is the Board’s policy that Executive Directors build up and retain a minimum shareholding in the Company. Under these guidelines, the Chief Executive Officer and the Chief Financial Officer are expected to hold Company shares equal in value to 200% of their base salary and must retain at least 75% of the net of tax value of vested LTIP and annual bonus share awards until this threshold is achieved. The beneficial interests of Directors who served during the year, together with those of their families, are as follows.
Owned shares Other interests in shares
27 February 20211
26 February20221
Value of shares (as a %
of salary)2Guideline
met?
Outstanding awards subject to performance
conditions
Unvested awards not subject to performance
conditions
Vested unexercised
awards
Total as at 26 February
2022Steve Johnson 97,160 184, 289 15.6% No 2,924,471 – – 3,108,760Rachel Izzard 57,377 155, 272 16% No 2,052,237 – – 2,207,509Ron McMillan 80,555 80,555 N/A N/A – – – 80,555Matt Davies4 50,154 50,154 N/A N/A – – – 50,154Lord Alliance of 184,196,762 184,196,762 N/A N/A – – – 184,196,762Manchester CBELesley Jones4 – – N/A N/A – – – 0Richard Moross – – N/A N/A – – – 0Gill Barr 13,704 13,704 N/A N/A – – – 13,704Michael Ross – – N/A N/A – – – 0Vicky Mitchell – – N/A N/A – – – 0Joshua Alliance 21,213,800 29,588,800 N/A N/A – – – 29,588,800Dominic Platt3 – – N/A N/A – – – 0
1 The figures for the Executive Directors include the number of beneficially owned shares obtained via direct purchase, acquisitions under the Company’s open offer as executed on 23 December 2020 and deferred bonus shares.
2 The value of shareholding as a % of salary is calculated using the market closing price of 36.5p on 25 February 2022.3 Dominic Platt joined the Board on 10 June 2021.4 For Lesley Jones and Matt Davies the number of shares shown is as at the date they stepped down from the Board.
The Directors’ share interests shown above include shares held by members of the Directors’ families, as required by the Companies Act 2006. There are no changes to the Directors’ interests in shares between 26 February 2022 and 16 May 2022.
TOTAL SHAREHOLDER RETURN PERFORMANCE: N BROWN VS FTSE 250, FTSE SMALLCAP & AIM 100The graph shows the Company’s ten-year performance, measured by TSR, compared to the performance of the FTSE Small Cap, FTSE 250 and AIM 100 indices, also measured by TSR. The Company has been a member of these indices during the ten-year period and they are therefore considered appropriate as comparator groups for this purpose.
(rebased to 100)
350
0
50
100
150
200
N Brown Group plc FTSE 250 Index
250
300
Feb 12 Feb 13 Feb 14 Feb 15 Feb 16 Feb 17 Feb 18 Feb 19 Feb 20 Feb 21 Feb 22
FTSE SmallCap Index FTSE AIM 100
FIN
AN
CIA
L S
TAT
EM
EN
TS
GO
VE
RN
AN
CE
RE
PO
RT
ST
RA
TE
GIC
RE
PO
RT
N Brown Group plc Annual Report and Accounts 2022 nbrown.co.uk 89
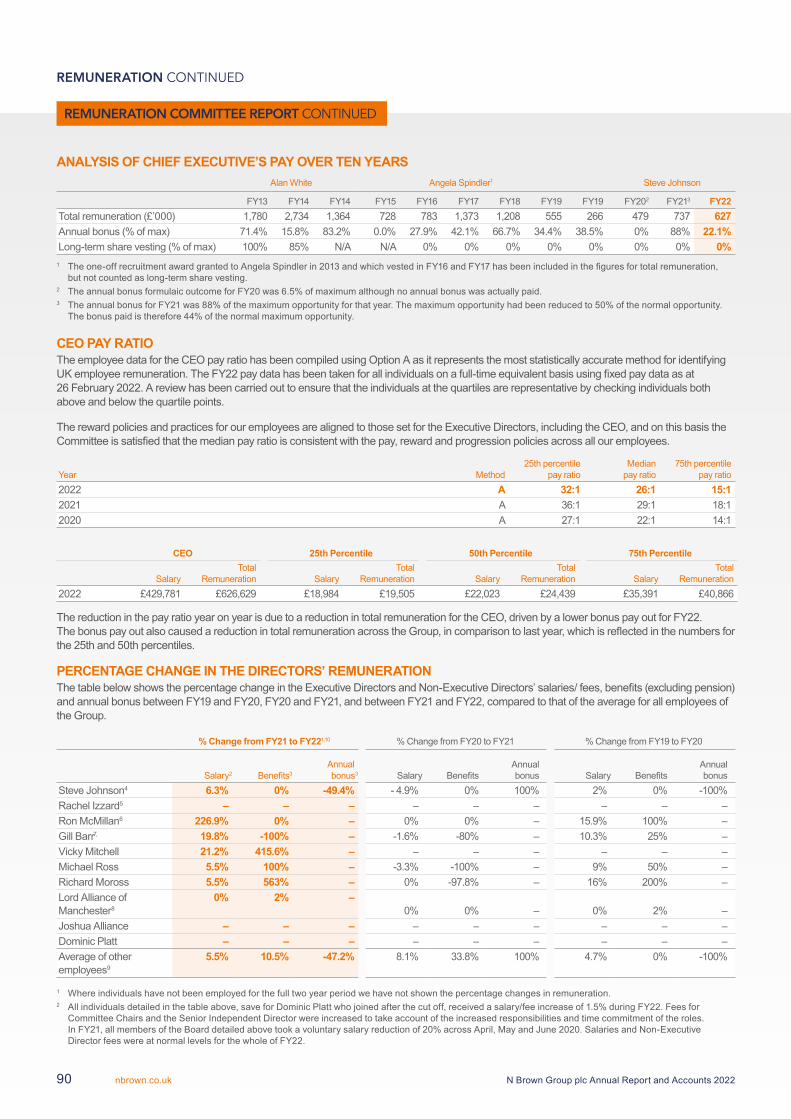
ANALYSIS OF CHIEF EXECUTIVE’S PAY OVER TEN YEARSAlan White Angela Spindler1 Steve Johnson
FY13 FY14 FY14 FY15 FY16 FY17 FY18 FY19 FY19 FY202 FY213 FY22Total remuneration (£’000) 1,780 2,734 1,364 728 783 1,373 1,208 555 266 479 737 627Annual bonus (% of max) 71.4% 15.8% 83.2% 0.0% 27.9% 42.1% 66.7% 34.4% 38.5% 0% 88% 22.1%Long-term share vesting (% of max) 100% 85% N/A N/A 0% 0% 0% 0% 0% 0% 0% 0%
1 The one-off recruitment award granted to Angela Spindler in 2013 and which vested in FY16 and FY17 has been included in the figures for total remuneration, but not counted as long-term share vesting.
2 The annual bonus formulaic outcome for FY20 was 6.5% of maximum although no annual bonus was actually paid.3 The annual bonus for FY21 was 88% of the maximum opportunity for that year. The maximum opportunity had been reduced to 50% of the normal opportunity.
The bonus paid is therefore 44% of the normal maximum opportunity.
CEO PAY RATIOThe employee data for the CEO pay ratio has been compiled using Option A as it represents the most statistically accurate method for identifying UK employee remuneration. The FY22 pay data has been taken for all individuals on a full-time equivalent basis using fixed pay data as at 26 February 2022. A review has been carried out to ensure that the individuals at the quartiles are representative by checking individuals both above and below the quartile points.
The reward policies and practices for our employees are aligned to those set for the Executive Directors, including the CEO, and on this basis the Committee is satisfied that the median pay ratio is consistent with the pay, reward and progression policies across all our employees.
Year Method25th percentile
pay ratioMedian
pay ratio75th percentile
pay ratio2022 A 32:1 26:1 15:12021 A 36:1 29:1 18:12020 A 27:1 22:1 14:1
CEO 25th Percentile 50th Percentile 75th Percentile
SalaryTotal
Remuneration SalaryTotal
Remuneration SalaryTotal
Remuneration SalaryTotal
Remuneration2022 £429,781 £626,629 £18,984 £19,505 £22,023 £24,439 £35,391 £40,866
The reduction in the pay ratio year on year is due to a reduction in total remuneration for the CEO, driven by a lower bonus pay out for FY22. The bonus pay out also caused a reduction in total remuneration across the Group, in comparison to last year, which is reflected in the numbers for the 25th and 50th percentiles.
PERCENTAGE CHANGE IN THE DIRECTORS’ REMUNERATIONThe table below shows the percentage change in the Executive Directors and Non-Executive Directors’ salaries/ fees, benefits (excluding pension) and annual bonus between FY19 and FY20, FY20 and FY21, and between FY21 and FY22, compared to that of the average for all employees of the Group.
% Change from FY21 to FY221,10 % Change from FY20 to FY21 % Change from FY19 to FY20
Salary2 Benefits3Annual bonus3 Salary Benefits
Annual bonus Salary Benefits
Annual bonus
Steve Johnson4 6.3% 0% -49.4% - 4.9% 0% 100% 2% 0% -100%Rachel Izzard5 – – – – – – – – –Ron McMillan6 226.9% 0% – 0% 0% – 15.9% 100% –Gill Barr7, 19.8% -100% – -1.6% -80% – 10.3% 25% –Vicky Mitchell 21.2% 415.6% – – – – – – –Michael Ross 5.5% 100% – -3.3% -100% – 9% 50% –Richard Moross 5.5% 563% – 0% -97.8% – 16% 200% –Lord Alliance of Manchester8
0% 2% –0% 0% – 0% 2% –
Joshua Alliance – – – – – – – – –Dominic Platt – – – – – – – – –Average of other employees9
5.5% 10.5% -47.2% 8.1% 33.8% 100% 4.7% 0% -100%
1 Where individuals have not been employed for the full two year period we have not shown the percentage changes in remuneration.2 All individuals detailed in the table above, save for Dominic Platt who joined after the cut off, received a salary/fee increase of 1.5% during FY22. Fees for
Committee Chairs and the Senior Independent Director were increased to take account of the increased responsibilities and time commitment of the roles. In FY21, all members of the Board detailed above took a voluntary salary reduction of 20% across April, May and June 2020. Salaries and Non-Executive Director fees were at normal levels for the whole of FY22.
REMUNERATION CONTINUED
REMUNERATION COMMITTEE REPORT CONTINUED
N Brown Group plc Annual Report and Accounts 2022nbrown.co.uk90
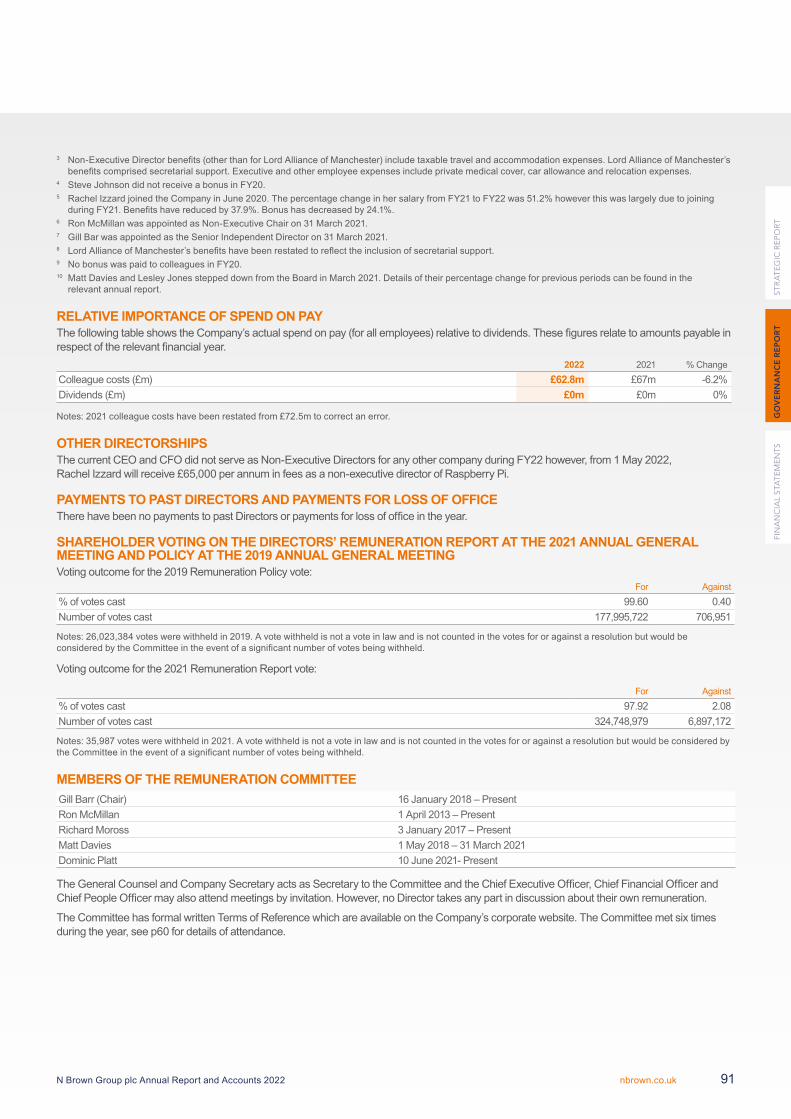
3 Non-Executive Director benefits (other than for Lord Alliance of Manchester) include taxable travel and accommodation expenses. Lord Alliance of Manchester’s benefits comprised secretarial support. Executive and other employee expenses include private medical cover, car allowance and relocation expenses.
4 Steve Johnson did not receive a bonus in FY20.5 Rachel Izzard joined the Company in June 2020. The percentage change in her salary from FY21 to FY22 was 51.2% however this was largely due to joining
during FY21. Benefits have reduced by 37.9%. Bonus has decreased by 24.1%.6 Ron McMillan was appointed as Non-Executive Chair on 31 March 2021.7 Gill Bar was appointed as the Senior Independent Director on 31 March 2021.8 Lord Alliance of Manchester’s benefits have been restated to reflect the inclusion of secretarial support.9 No bonus was paid to colleagues in FY20.10 Matt Davies and Lesley Jones stepped down from the Board in March 2021. Details of their percentage change for previous periods can be found in the
relevant annual report.
RELATIVE IMPORTANCE OF SPEND ON PAYThe following table shows the Company’s actual spend on pay (for all employees) relative to dividends. These figures relate to amounts payable in respect of the relevant financial year.
2022 2021 % ChangeColleague costs (£m) £62.8m £67m -6.2%Dividends (£m) £0m £0m 0%
Notes: 2021 colleague costs have been restated from £72.5m to correct an error.
OTHER DIRECTORSHIPSThe current CEO and CFO did not serve as Non-Executive Directors for any other company during FY22 however, from 1 May 2022, Rachel Izzard will receive £65,000 per annum in fees as a non-executive director of Raspberry Pi.
PAYMENTS TO PAST DIRECTORS AND PAYMENTS FOR LOSS OF OFFICEThere have been no payments to past Directors or payments for loss of office in the year.
SHAREHOLDER VOTING ON THE DIRECTORS’ REMUNERATION REPORT AT THE 2021 ANNUAL GENERAL MEETING AND POLICY AT THE 2019 ANNUAL GENERAL MEETINGVoting outcome for the 2019 Remuneration Policy vote:
For Against% of votes cast 99.60 0.40Number of votes cast 177,995,722 706,951
Notes: 26,023,384 votes were withheld in 2019. A vote withheld is not a vote in law and is not counted in the votes for or against a resolution but would be considered by the Committee in the event of a significant number of votes being withheld.
Voting outcome for the 2021 Remuneration Report vote:
For Against% of votes cast 97.92 2.08Number of votes cast 324,748,979 6,897,172
Notes: 35,987 votes were withheld in 2021. A vote withheld is not a vote in law and is not counted in the votes for or against a resolution but would be considered by the Committee in the event of a significant number of votes being withheld.
MEMBERS OF THE REMUNERATION COMMITTEEGill Barr (Chair) 16 January 2018 – PresentRon McMillan 1 April 2013 – PresentRichard Moross 3 January 2017 – PresentMatt Davies 1 May 2018 – 31 March 2021Dominic Platt 10 June 2021- Present
The General Counsel and Company Secretary acts as Secretary to the Committee and the Chief Executive Officer, Chief Financial Officer and Chief People Officer may also attend meetings by invitation. However, no Director takes any part in discussion about their own remuneration.
The Committee has formal written Terms of Reference which are available on the Company’s corporate website. The Committee met six times during the year, see p60 for details of attendance.
FIN
AN
CIA
L S
TAT
EM
EN
TS
GO
VE
RN
AN
CE
RE
PO
RT
ST
RA
TE
GIC
RE
PO
RT
N Brown Group plc Annual Report and Accounts 2022 nbrown.co.uk 91
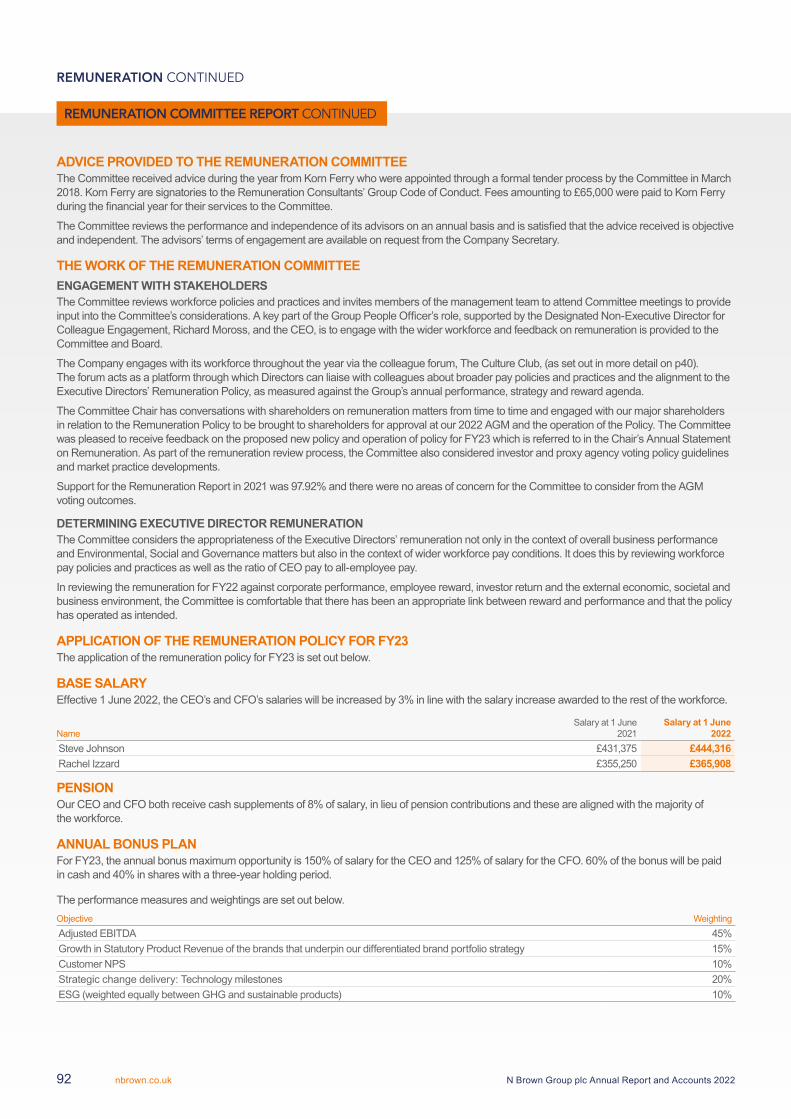
ADVICE PROVIDED TO THE REMUNERATION COMMITTEEThe Committee received advice during the year from Korn Ferry who were appointed through a formal tender process by the Committee in March 2018. Korn Ferry are signatories to the Remuneration Consultants’ Group Code of Conduct. Fees amounting to £65,000 were paid to Korn Ferry during the financial year for their services to the Committee.
The Committee reviews the performance and independence of its advisors on an annual basis and is satisfied that the advice received is objective and independent. The advisors’ terms of engagement are available on request from the Company Secretary.
THE WORK OF THE REMUNERATION COMMITTEEENGAGEMENT WITH STAKEHOLDERSThe Committee reviews workforce policies and practices and invites members of the management team to attend Committee meetings to provide input into the Committee’s considerations. A key part of the Group People Officer’s role, supported by the Designated Non-Executive Director for Colleague Engagement, Richard Moross, and the CEO, is to engage with the wider workforce and feedback on remuneration is provided to the Committee and Board.
The Company engages with its workforce throughout the year via the colleague forum, The Culture Club, (as set out in more detail on p40). The forum acts as a platform through which Directors can liaise with colleagues about broader pay policies and practices and the alignment to the Executive Directors’ Remuneration Policy, as measured against the Group’s annual performance, strategy and reward agenda.
The Committee Chair has conversations with shareholders on remuneration matters from time to time and engaged with our major shareholders in relation to the Remuneration Policy to be brought to shareholders for approval at our 2022 AGM and the operation of the Policy. The Committee was pleased to receive feedback on the proposed new policy and operation of policy for FY23 which is referred to in the Chair’s Annual Statement on Remuneration. As part of the remuneration review process, the Committee also considered investor and proxy agency voting policy guidelines and market practice developments.
Support for the Remuneration Report in 2021 was 97.92% and there were no areas of concern for the Committee to consider from the AGM voting outcomes.
DETERMINING EXECUTIVE DIRECTOR REMUNERATIONThe Committee considers the appropriateness of the Executive Directors’ remuneration not only in the context of overall business performance and Environmental, Social and Governance matters but also in the context of wider workforce pay conditions. It does this by reviewing workforce pay policies and practices as well as the ratio of CEO pay to all-employee pay.
In reviewing the remuneration for FY22 against corporate performance, employee reward, investor return and the external economic, societal and business environment, the Committee is comfortable that there has been an appropriate link between reward and performance and that the policy has operated as intended.
APPLICATION OF THE REMUNERATION POLICY FOR FY23The application of the remuneration policy for FY23 is set out below.
BASE SALARYEffective 1 June 2022, the CEO’s and CFO’s salaries will be increased by 3% in line with the salary increase awarded to the rest of the workforce.
NameSalary at 1 June
2021Salary at 1 June
2022Steve Johnson £431,375 £444,316Rachel Izzard £355,250 £365,908
PENSIONOur CEO and CFO both receive cash supplements of 8% of salary, in lieu of pension contributions and these are aligned with the majority of the workforce.
ANNUAL BONUS PLANFor FY23, the annual bonus maximum opportunity is 150% of salary for the CEO and 125% of salary for the CFO. 60% of the bonus will be paid in cash and 40% in shares with a three-year holding period.
The performance measures and weightings are set out below.Objective Weighting Adjusted EBITDA 45%Growth in Statutory Product Revenue of the brands that underpin our differentiated brand portfolio strategy 15%Customer NPS 10%Strategic change delivery: Technology milestones 20%ESG (weighted equally between GHG and sustainable products) 10%
REMUNERATION CONTINUED
REMUNERATION COMMITTEE REPORT CONTINUED
N Brown Group plc Annual Report and Accounts 2022nbrown.co.uk92
The Committee considers that the targets for the annual bonus are commercially sensitive and are not therefore disclosed in this report. The targets and performance against them will be disclosed retrospectively in the FY23 Remuneration Report.
LONG-TERM INCENTIVE AWARDSAwards will be made at the normal policy award level of 150% of salary for our CEO and 125% for our CFO.
As explained in the Annual Statement of the Remuneration Committee Chair the FY23 LTIP award will be based 100% on Adjusted EPS growth with the targets as set out below.
Metric Weighting Threshold target 25% vests1 Maximum target 100% vests Rationale for measureAdjusted EPS 100% 6.6 pence 9.5 pence To incentivise management
to achieve measurable improvements in long term profitability as an output of our transformation strategy.
FEES FOR THE CHAIR AND NON-EXECUTIVE DIRECTORSDetails of the Non-Executive Directors’ fees are set out below. From 1 June 2022, the fees will be increased by 3% aligned to salary increase for the workforce and the Executive Directors. The Non-Executive Directors have agreed that instead of taking their 3% fee increase for FY23 the Company will make a contribution to the N Brown hardship fund equivalent to the amount of the increase.
Fees at 1 June 2021
Fees at 1 June 2022
Chair of the Board fee 255,000 £262,650Other Independent Non-Executive Director base Board fee 51,765 £53,318Non-Executive Director base Board fee (Lord Alliance)
51,765 £53,318
Non-Executive Director base Board fee (Joshua Alliance)
40,600 £41,818
Additional Non-Executive Director fees:Senior Independent Director 10,150 £10,455Chair of Audit and Risk Committee 15,225 £15,682Chair of Remuneration Committee 15,225 £15,682Chair of Financial Services Board Committee 24,360 £25,091Designated Director for Colleague Engagement 10,150 £10,455
APPROVAL OF THE DIRECTORS’ REMUNERATION REPORTThe Directors’ Remuneration report was approved by the Board on 18 May 2022.
Signed on behalf of the Board on 18 May 2022.
Gill BarrChair of the Remuneration Committee
FIN
AN
CIA
L S
TAT
EM
EN
TS
GO
VE
RN
AN
CE
RE
PO
RT
ST
RA
TE
GIC
RE
PO
RT
N Brown Group plc Annual Report and Accounts 2022 nbrown.co.uk 93
The Directors have pleasure in presenting their Annual Report and audited Accounts for the 52 week period ended 26 February 2022. The Directors’ Report comprises p54 to 97, together with the sections on the Annual Report incorporated by reference. Some of the matters required to be included in the Directors’ Report have been included elsewhere in the Annual Report & Accounts, namely:
Disclosure Page
Financial and Risk Management 32Future Business Developments 18Disclosure of the Group’s greenhouse gas emissions in FY22 51
Additional information to be disclosed in the Directors’ Report is given in this section.
The Directors’ Report together with the Strategic Report set out on p1 to 97 form the Management report for the purposes of DTR4.1.5R.
Both the strategic Report and the Directors’ Report have been prepared and presented in accordance with English company law and the liabilities of the Directors in connection with those reports shall be subject to the limitations and restrictions provided by such law.
SHARE CAPITALDetails of the Group’s issued share capital are shown in note 23 on p140. The Group has one class of ordinary shares which carry no fixed income. Each share carries the right to one vote at general meetings of the Group.
There are no specific restrictions on the size of a holding nor on the transfer of shares which are both governed by the general provision of the Company’s Articles of Association and prevailing legislation (except as set out in the section entitled “Voting Rights and Restrictions on Transfers”). No person has any special rights over the Group’s share capital and all issued shares are fully paid.
At the 2021 Annual General Meeting, the Directors were given the power to issue new shares up to a nominal amount of £16,965,171. This power will expire on the earlier of the conclusion of the 2022 Annual General meeting or on 7 July 2022. Accordingly, a resolution will be proposed by Directors at the 2022 Annual General Meeting to renew the Company’s authority to issue new shares up to a further nominal amount of £16,965,171 in connection with an offer by way of a rights issue.
An approval will be sought at the 2022 general meeting for a certain number of shares up to a maximum nominal value – to be allotted pursuant to the authority granted to Directors set out above without being covered by statutory pre-emption rights regime. Further information regarding this will be included in the Notice of the Meeting for the AGM.
As in previous years, authorisation for the Directors to buy back the Company’s shares will not be sought at the 2022 Annual General Meeting. The Directors have no current plans to issue shares other than in connection with employee share options.
MAJOR SHAREHOLDERSInformation provided to the Company by major shareholders pursuant to the FCA’s Disclosure Guidance and Transparency Rules (DTR) are published via a Regulatory Information Service and are available on the Company’s website. As at 26 February 2022 and the date of this report, other than the Directors’ shareholdings included in the Remuneration Report on p89, the Company had received no notifications of the interests in voting rights pursuant to Chapter 5 of the DTR.
VOTING RIGHTS AND RESTRICTIONSNone of the ordinary shares in the Group carry any special rights with regard to control of the Group. There are no restrictions on transfers of shares other than:
Certain restrictions which may from time to time be imposed by laws or regulations such as those relating to insider dealing;
Pursuant to the Company’s code for securities transactions whereby the Directors and designated employees require approval to deal with the Company’s shares;
Where a person with an interest in the Company’s shares has been served with a disclosure notice and has failed to provide the Company with information concerning interests in those shares and
The Directors are not aware of any arrangements between shareholders that may result in restrictions on the transfer of securities or voting rights. The rights and obligations attaching to the Company’s ordinary shares are set out in the Articles of Association.
ADDITIONAL DISCLOSURES
N Brown Group plc Annual Report and Accounts 2022nbrown.co.uk94
EMPLOYEE SHARE SCHEMES – RIGHTS OF CONTROLThe trustees of the N Brown Group plc Employee Benefit Trust hold shares on trust for the benefit of the Executive Directors and employees of the Group. The shares held by the trust are used in connection with the Group’s various share incentive plans. The trustees currently abstain from voting but have the power to vote for or against, or not at all, at their discretion in respect of any shares in the Company held in the trust. The trustees may, upon the recommendation of the Company, accept or reject any offering relating to the shares in any way they see fit, without incurring any liability and without being required to give reasons for any decision. In exercising their trustee powers, the trustees may take all the following matters into account:
The long-term interests of beneficiaries;
The interests of beneficiaries other than financial interests;
The interests of beneficiaries in their capacity as employees or former employees of their dependents;
The interests of persons (whether or not identified) who may become beneficiaries in the future; and
Considerations of a local, moral, ethical, environmental, or social nature.
CHANGE OF CONTROLThere are a number of agreements that take effect, alter or terminate upon a change of control of the Company such as commercial contracts, bank loan agreements, property lease arrangements and employees share plans. None of these are considered to be significant in terms of their likely impact on the business of the Group as a whole. Executive Directors’ service contracts are terminable by the Group on giving 12 months’ notice. There are no agreements between the Group and its Directors or employees.
SIGNIFICANT CONTRACTSThe Group has a number of contractual arrangements with suppliers (both of goods and services) and occupies leasehold premises for the purpose of conducting business. While these arrangements are important to the business of the Group, individually none of them are essential to the business of the Group and do not require disclosure under section 417(5) (c) of the Companies Act.
2022 ANNUAL GENERAL MEETINGThe Annual General Meeting will be held at 12:30 on 7 July 2022. The notice convening the Annual General Meeting will be sent to members by way of a separate circular. Explanatory notes on each resolution to be proposed at the meeting will be available online and accessible to all shareholders unless they have specifically requested to receive hard copies.
GOING CONCERNAs explained fully in note 2 on p118, the Directors have adopted the going concern basis in preparing the financial statements.
VIABILITY STATEMENTAs required by the UK Corporate Governance Code, the Directors have assessed the prospects of the Group. The Board has decided it is appropriate to use the three-year plan and the longer term cash flow models and strategic plans beyond this, to cover a period of three years from the date of approval of this Annual Report and Accounts. The period used for this assessment is consistent with the prior year. Three years has been chosen as this is the period that is reasonably possible to forecast with a degree of accuracy.
Following the commencement of implementing our strategy during the course of FY20, we conducted a further review of our strategy in Autumn FY22, supported by management consultancy firm Boston Consulting Group, in order to reaffirm and where necessary pivot our focus as the UK emerges from the pandemic and the resulting market, consumer and economic shifts. The result of the review confirmed much of the direction of the FY20 process, including the desire to build profitability through the retail business, an ongoing emphasis on digital, and commitment to serving the underserved.
Whilst confirming our strategy to deliver long term sustainable growth, the review also enabled a sharpening of our strategic focus, with 4 key evolutions to the previous strategy:
Focus: Accelerate growth through three strategic brands, which will allow us to boost simplicity and rigour of execution and deliver strong customer propositions and efficiency in our marketing
Consistency: Stand up a dedicated team for all remaining “heritage” brands focused on stabilisation and value protection rather than growth
Integration: Fully embed our flexible credit offer into the core of the customer value proposition
Data driven: Establish data as an asset at the core of the strategy, driving daily decision making and activating our unique data pool.
Making these refinements will enable the Group to focus capital, resources and marketing efforts on a more refined area of brands, whilst protecting the legacy core of the business, and the management team are confident this is the most expedient way to create growth.
In FY22, the Group again generated cash from its operations and for the second year finished FY22 with no unsecured debt, a stable financial services business and a strong Balance Sheet that facilitates investing and the acceleration of our strategy. The strategic progress made in FY22 is set out in more detail on p7 to 18.
FIN
AN
CIA
L S
TAT
EM
EN
TS
GO
VE
RN
AN
CE
RE
PO
RT
ST
RA
TE
GIC
RE
PO
RT
N Brown Group plc Annual Report and Accounts 2022 nbrown.co.uk 95
Taking into account the continued challenges facing the retail market following the Covid-19 outbreak, the Group’s current position, its principal risks and uncertainties as described on p40 to 45 and how these are managed, as well as its FY23 base and downside planning scenarios as described in note 2 to the Group accounts on p118, the Directors have assessed the Group’s prospects and viability.
Although the base strategic plan reflects the Directors’ best estimate of the future prospects of the business, they have also tested the potential impact on the Group of a number of scenarios over and above those included in the plan by quantifying their financial impact and overlaying them on detailed financial forecasts in the plan. The scenarios assessed the group profitability, liquidity and covenant testing impact from business interruption, supply chain & inflationary risks, significant delay or underachievement of intangible projects and additional exceptional items.
Under the base and downside scenarios the financing arrangements provide the Group with a strong basis from which to continue to service its customers and to manage appropriately the challenges faced by the Group. The above considerations form the basis of the Board’s reasonable expectations that the Group will be able to continue in operation and meet its liabilities as they fall due. The Directors will maintain oversight of and frequently assess the performance of the Group against the strategy. This will improve regular reporting by the Group’s Operating Board and the discussion of any pivots to strategies undertaken by the Board in its normal course of business. These reviews will consider both the market opportunity and any associated or emerging risks to managing its working capital performance and the level of financial resources available to the Group. The Group is introducing Enterprise level and brand level OKRs to help embed clear objectives and targets aligned to the strategy. These OKRs will be monitored by the newly established Value Delivery Office (VDO).
The 3-year plan assumes that all financing facilities that mature in the review period will be renewed or replaced with facilities of similar size on commercially acceptable terms. This is considered to be a reasonable planning assumption given actual and planned business performance.
Based on this assessment, the Directors have formed a judgement, at the time of approving this report, that there is a reasonable expectation that the Group has adequate resources to continue in operation and meet its liabilities as they fall due over the three-year period of the assessment.
RESPONSIBILITY STATEMENTThe Directors are responsible for preparing the Annual Report and the Group and parent Company financial statements for each financial year. The Group financial statements are prepared in accordance with international accounting standards in conformity with the requirements of the Companies Act 2006. The Directors have elected to prepare the parent Company financial statements in accordance with UK standards, including financial Reporting Standard 101 Reduced Disclosure framework (“FRS 101”).
Under Company law, the Directors must not approve the financial statements unless they are satisfied that they give a true and fair view of the state of affairs of the Group and parent Company and of their profit or loss for that period. In preparing each of the Group and parent Company financial statements, the Directors are required to:
Select suitable accounting policies and then apply them consistently;
Make judgements and estimates that are reasonable, relevant, reliable and prudent;
For the Group financial statements, state whether they have been prepared in accordance with international accounting standards in conformity with the requirements of the Companies Act 2006;
For the parent Company financial statements, state whether applicable UK Accounting Standards have been followed subject to any material departures disclosed and explained in the parent Company financial statements;
Assess the Group and parent Company’s ability to continue as a going concern, disclosing, as applicable, matters relating to a going concern; and
Use the going concern basis of accounting unless they either intend to liquidate the Group or the parent or to cease operations or have no realistic alternative but to do so.
The Directors are responsible for keeping adequate accounting records that are sufficient to show and explain the parent Company’s transactions and disclose reasonable accuracy at any time the financial of the parent Company and enable them to ensure that its financial statements comply with the Companies Act 2006. They are responsible for such internal control as they determine is necessary to enable the preparation of financial statements that are free from material misstatement, whether due to fraud or error and have general responsibility for taking such steps as are reasonably open to them to safeguard the assets of the Group and to prevent and detect fraud and other irregularities.
Under applicable law and regulations, the Directors are also responsible for preparing the Strategic Report, Directors’ Report, Directors’ Remuneration Report and Corporate Governance Statement that complies with the law and those regulations.
The Directors are responsible for the maintenance and integrity of the corporate and financial information included on the Company’s website. Legislation in the UK governing the preparation and dissemination of financial statements may differ from legislation in other jurisdictions.
The Directors of the Group at the date of approval of these financial statements confirm, as far as they are aware, that there is no relevant audit information of which the auditor is unaware. The Directors have individually confirmed that they have taken all reasonable steps that they ought to have taken as Directors in order to make themselves aware of any relevant audit information and to establish that it has been communicated to the auditor.
ADDITIONAL DISCLOSURES CONTINUED
N Brown Group plc Annual Report and Accounts 2022nbrown.co.uk96
We confirm to the best of our knowledge:
The financial statements, prepared in accordance with the applicable set of accounting standards, give a true and fair view of the assets, liabilities, financial position and profit or loss of the Company and the undertakings included in the consolidation taken as a whole; and
The Strategic Report includes a fair review of the development and performance of the business and the position of the issuer and undertakings included in the consolidation taken as a whole, together with a description of the principal risks and uncertainties that they face.
We consider the Annual Report taken as a whole, is fair, balanced and understandable and provides the information necessary for shareholders to assess the Group’s position and performance, business model and strategy.
The strategic Report on p1 to 53 and the Directors’ Report on p54 to 97 are hereby approved by the Board and signed on behalf of the Board.
Michael Mustard (LLB Hons ACA)Company Secretary
18 May 2022
FIN
AN
CIA
L S
TAT
EM
EN
TS
GO
VE
RN
AN
CE
RE
PO
RT
ST
RA
TE
GIC
RE
PO
RT
N Brown Group plc Annual Report and Accounts 2022 nbrown.co.uk 97
Building on a strong financial performance
FINANCIAL STATEMENTSINDEPENDENT AUDITOR’S REPORT TO THE MEMBERS OF N BROWN GROUP PLC
99
GROUP ACCOUNTSConsolidated Income Statement 107Consolidated Statement of Comprehensive Income
107
Consolidated Balance Sheet 108Consolidated Cash Flow Statement 109Consolidated Statement of Changes in Equity 110Notes to the Group accounts 111COMPANY ACCOUNTSCompany Balance Sheet 149Company Statement of Changes in Equity 149Notes to the Company accounts 150SHAREHOLDER INFORMATION 157
FINANCIAL STATEMENTS
N Brown Group plc Annual Report and Accounts 2022nbrown.co.uk98
1 OUR OPINION IS UNMODIFIED We have audited the financial statements of N Brown Group plc (“the Company”) for the 52-week period ended 26 February 2022 which comprise the consolidated income statement, consolidated statement of comprehensive income, consolidated balance sheet, consolidated cash flow statement, consolidated statement of changes in equity, the Company balance sheet, the Company statement of changes in equity, and the related notes, including the accounting policies in note 2 and 33.
In our opinion:
the financial statements give a true and fair view of the state of the Group’s and of the parent Company’s affairs as at 26 February 2022 and of the Group’s profit for the year then ended;
the Group financial statements have been properly prepared in accordance with UK-adopted international accounting standards;
the parent Company financial statements have been properly prepared in accordance with UK accounting standards, including FRS 101 Reduced Disclosure Framework; and
the financial statements have been prepared in accordance with the requirements of the Companies Act 2006.
BASIS FOR OPINION We conducted our audit in accordance with International Standards on Auditing (UK) (“ISAs (UK)”) and applicable law. Our responsibilities are described below. We have fulfilled our ethical responsibilities under, and are independent of the Group in accordance with, UK ethical requirements including the FRC Ethical Standard as applied to listed entities. We believe that the audit evidence we have obtained is a sufficient and appropriate basis for our opinion. OverviewMateriality: group financial statements as a whole
£2.0m (2021: £2.4m)4.6% (2021: 4.4%) of group profit before tax, normalised to exclude exceptional items and by averaging over the last three years due to fluctuations in the business cycle
Coverage 86% (2021: 91%) of group profit before tax
Key audit matters vs 2021
Recurring risks Impairment of customer receivablesAllianz Insurance plc (“Allianz”) legal claimImpairment of the carrying value of non-current assets in the Group cash generating unit (‘CGU’) and the carrying amount of the parent Company’s investment in subsidiaries
INDEPENDENT AUDITOR’S REPORT TO THE MEMBERS OF N BROWN GROUP PLC
FIN
AN
CIA
L S
TAT
EM
EN
TS
GO
VE
RN
AN
CE
RE
PO
RT
ST
RA
TE
GIC
RE
PO
RT
N Brown Group plc Annual Report and Accounts 2022 nbrown.co.uk 99
2 KEY AUDIT MATTERS: OUR ASSESSMENT OF RISKS OF MATERIAL MISSTATEMENT Key audit matters are those matters that, in our professional judgement, were of most significance in the audit of the financial statements and include the most significant assessed risks of material misstatement (whether or not due to fraud) identified by us, including those which had the greatest effect on: the overall audit strategy; the allocation of resources in the audit; and directing the efforts of the engagement team. These matters were addressed in the context of our audit of the financial statements as a whole, and in forming our opinion thereon, and we do not provide a separate opinion on these matters. In arriving at our audit opinion above, the key audit matters, in decreasing order of audit significance, were as follows:
The risk Our response
IMPAIRMENT OF CUSTOMER RECEIVABLES£68.7m (2021: £85.2m)Refer to p72 (Audit and Risk Committee Report), p115 to 116 and p119 (accounting policy), and p129, p132 to137 (financial disclosures)
SUBJECTIVE ESTIMATE:The calculation of the impairment losses provision is based on an expected credit loss (“ECL”) model which includes a number of subjective judgements and estimates, including the determination of Significant Increases in Credit Risk (“SICR”), Lifetime and 12-month Probability of Default (“PD”), as well as Post-Model Adjustments (“PMAs”).There is a risk that the impairment losses provision on trade receivables could be materially misstated as a result of inappropriate judgements or estimates made by management, as explained above. The risk continues to be impacted by wider and continued economic uncertainty and ECLs may be inappropriate if model or PMA assumptions do not accurately predict defaults over time, become out of line with wider industry experience, or fail to reflect the credit risk of financial assets.We determined that the impairment losses provision on trade receivables has a high degree of estimation uncertainty, with a potential range of reasonable outcomes greater than our materiality for the financial statements as a whole, and possibly many times that amount. The financial statements (note 19) disclose the sensitivities estimated by the Group.
OUR PROCEDURES INCLUDED:Our credit risk modelling expertise: We involved our own credit risk modellers who assisted in our procedures. Together with our credit risk modelling specialists we evaluated the Group’s impairment methodology for compliance with IFRS 9. We inspected model code to assess its consistency with the Group’s model methodology and we evaluated the PD and SICR model output by independently implementing the models through rebuilding of the model code and comparing our independent output with management’s output. Additionally, we assessed the reasonableness of the model predictions by comparing them against actual results and evaluating resulting differences.Our economics expertise: We involved our own economic specialists who assisted us in assessing key economic variables which included comparing the Group’s economic variables to external sources. Our procedures also included assessing the overall reasonableness of the economic forecasts and weighting of scenarios by comparing the Group’s forecasts to our own modelled forecasts. Our sector experience: We assessed completeness of the PMAs and critically assessed the assumptions underpinning the most significant PMAs applied due to model limitations identified. We reperformed the calculation of certain qualitative adjustments to assess consistency with the qualitative adjustment methodologies. Assess transparency: We assessed whether the disclosures appropriately disclose and address the uncertainty which exists when determining the ECL. As part of this, we assessed the sensitivity analysis disclosures. In addition, we assessed whether the disclosure of the key judgements in respect of impairment of customer receivables reflect the judgements taken by management, and the degree of estimation uncertainty involved in arriving at the provision.
INDEPENDENT AUDITOR’S REPORT TO THE MEMBERS OF N BROWN GROUP PLC CONTINUED
N Brown Group plc Annual Report and Accounts 2022nbrown.co.uk100
The risk Our response
ALLIANZ INSURANCE PLC (“ALLIANZ”) LEGAL CLAIM Provision of £28.0m (2021: Provision of £nil, contingent liability disclosed)Refer to p72 (Audit and Risk Committee Report), p117 and p120 (accounting policy), and p139 (financial disclosures)
SUBJECTIVE ESTIMATE:In January 2020, a legal claim was received from Allianz in respect of payments of redress Allianz had made to certain of the Group’s customers, together with all associated costs. In June 2021, Allianz revised the amount of its original claim and sought to increase the scope of its claim in relation to a further customer redress exercise. The claims from Allianz represent a combined total amount of £66m. The Group has issued its defence, which refutes the claims made by Allianz, and has also issued counterclaims related to these matters. The Group’s counterclaims total £80m plus a further equitable set-off defence of £40m.The Group is of the view that, should the matter proceed to trial, the Court will determine the outcome on a net basis taking into account the merits of the parties’ claims and counterclaims, and the liabilities already borne by them. The Group is also of the view that the net basis would apply in any negotiated settlement. Accordingly, the Group’s assessment of the present obligation has been determined on a net basis.The legal analysis is extremely complex and the assessment of an appropriate provision involves a high degree of estimation uncertainty reflecting the highly unusual nature of this litigation and the considerable discretion available to the Courts, if that is how the matter is settled. As a result of this complexity and estimation uncertainty, there is a very significant range of potential outcomes.In the prior year, whilst an outflow of economic resources was considered probable, no provision was recognised as it was not considered possible at that time to estimate the liability reliably as the legal proceedings and related disclosures were at an early stage. As a result, a contingent liability was disclosed.During the current year, sufficient progress has been made in assessing the evidential bases of the claims and in analysing their legal merits to calculate a reliable estimate of the liability, in line with the requirements of IAS 37 Provisions, Contingent Liabilities and Contingent Assets, and has recognised a provision accordingly. We determined that the provision in respect of the Allianz legal claim has a high degree of estimation uncertainty, with a potential range of reasonable outcomes greater than our materiality for the financial statements as a whole, and possibly many times that amount. The inherent uncertainty and range of potential outcomes is such that we have indicated an increase in the risk year on year. The financial statements (note 22) disclose the range of potential outcomes estimated by the Group.
OUR PROCEDURES INCLUDED:Inspecting correspondence: Together with our own legal specialists, we inspected relevant correspondence in relation to the claim, including the legal analyses prepared by the Group’s external legal advisors and other views expressed by external legal experts including Queen’s Counsel (QC). Involvement of specialists: With the assistance of our own legal specialists, we assessed the facts, complexities and uncertainties of the claim, and the basis upon which management’s estimate has been formed. Our expertise: Using our expertise, we assessed the judgements made and accounting treatment adopted against the requirements of IAS 37, including the judgement that the Group’s assessment of the present obligation will be determined on a net basis. Assessment of experts: We assessed the competence, capabilities and objectivity of the Group’s external legal advisors and QC experts. Enquiry of legal experts: With the help of our own legal specialists, we held direct discussions with management’s external legal experts to inform our understanding of the complexities and judgements involved in respect of the claim. During our discussions with the Group’s external legal counsel, we challenged the current status, legal analyses and related uncertainties and complexities of the claim. We also held discussions with the Group’s in-house legal counsel and senior management teams. Test of detail: We assessed the completeness, existence and accuracy of the claim and counterclaim populations with reference to claim documentation from Allianz and substantive vouching on a sample basis of the underlying claims data which informs the basis of the Group’s counterclaims against Allianz. Assessing transparency: We assessed the adequacy of the Group’s related disclosures in respect of the claim, the judgements taken by management, and the degree of estimation uncertainty involved in arriving at the provision.
FIN
AN
CIA
L S
TAT
EM
EN
TS
GO
VE
RN
AN
CE
RE
PO
RT
ST
RA
TE
GIC
RE
PO
RT
N Brown Group plc Annual Report and Accounts 2022 nbrown.co.uk 101
The risk Our response
IMPAIRMENT OF THE CARRYING VALUE OF NON-CURRENT ASSETS IN THE GROUP CASH GENERATING UNIT (‘CGU’) AND THE CARRYING AMOUNT OF THE PARENT COMPANY’S INVESTMENT IN SUBSIDIARIESRefer to p72 (Audit and Risk Committee Report), p113, p120 and p151 (accounting policy), and p120, p126, p127 and p154 (financial disclosures)
FORECAST-BASED ASSESSMENT:The carrying value of non-current assets in the Group CGU and the carrying amount of the parent Company’s investments in subsidiaries are significant and there are indicators of impairment due to the Group’s market capitalisation being lower than the carrying value of net assets of the Group and the parent Company.The estimated recoverable amount of these balances is subjective due to the inherent uncertainty involved in forecasting and discounting future cash flows, which forms the basis of the Group’s value in use calculation and assessment of the carrying amount of the parent Company’s investments in subsidiaries. The estimation uncertainty associated with these cash flow forecasts is heightened currently in the context of inflationary pressures on the business’ cost base and on the disposable income of its target customers, which may affect revenues and margins adversely in a manner not envisaged currently. These heightened macro-economic risks are such that we have indicated an increase in the overall risk year on year.We determined that the value in use of the Group CGU has a high degree of estimation uncertainty with a potential range of outcomes greater than our materiality for the financial statements as a whole, and possibly many times that amount.The financial statements (note 12) disclose the sensitivity estimated by the Group.
OUR PROCEDURES INCLUDED:Benchmarking assumptions: We challenged, with the support of our own valuation specialists, the key assumptions used in the value in use calculations of the Group CGU by comparing them to externally derived data in relation to key inputs such as projected growth rates and discount rates. This included consideration of relevant comparator entities, industry and analyst forecasts. Historical comparisons: We considered the Group’s historical forecasting accuracy by comparing actual performance against budget. Sensitivity analysis: We performed breakeven analysis on the key assumptions, including the discount rate and projected EBIDTA growth in the Board approved plan, to assess how sensitive the value in use calculation is to reasonably possible changes in key cashflow assumptions.Comparing valuations: We compared the total of the value in use calculation to the Group’s market capitalisation to assess the reasonableness of those cash flows and critically assessed the rationale for the difference from tha comparison.Challenge key judgements: We performed corroborative inquiries of key personnel outside of the core group finance team to challenge the status of the Group’s performance, and to corroborate the key assumptions underpinning the Group’s strategy and Board approved plan. Assessing transparency: We assessed whether the Group’s and parent Company’s disclosures about the sensitivity of the outcome of the impairment assessment to changes in key assumptions reflects the risks inherent in the valuation of the Group.
For each of the key audit matters reported above, we performed the tests above rather than seeking to rely on any of the Group’s controls because the nature of the balances is such that we would expect to obtain audit evidence primarily through the detailed procedures described above.
We continue to perform procedures over software and development costs capitalised as intangibles. However, there has been a continued focus by management on this area in the current year, whilst the estimation uncertainty relating to the appropriateness of intangible asset Useful Economic Lives (“UELs”) has also reduced following the Group’s detailed reassessment of UELs in the previous year. For these reasons, we have not assessed this as one of the most significant risks in our current year audit and therefore it is not separately identified in our report this year.
INDEPENDENT AUDITOR’S REPORT TO THE MEMBERS OF N BROWN GROUP PLC CONTINUED
N Brown Group plc Annual Report and Accounts 2022nbrown.co.uk102
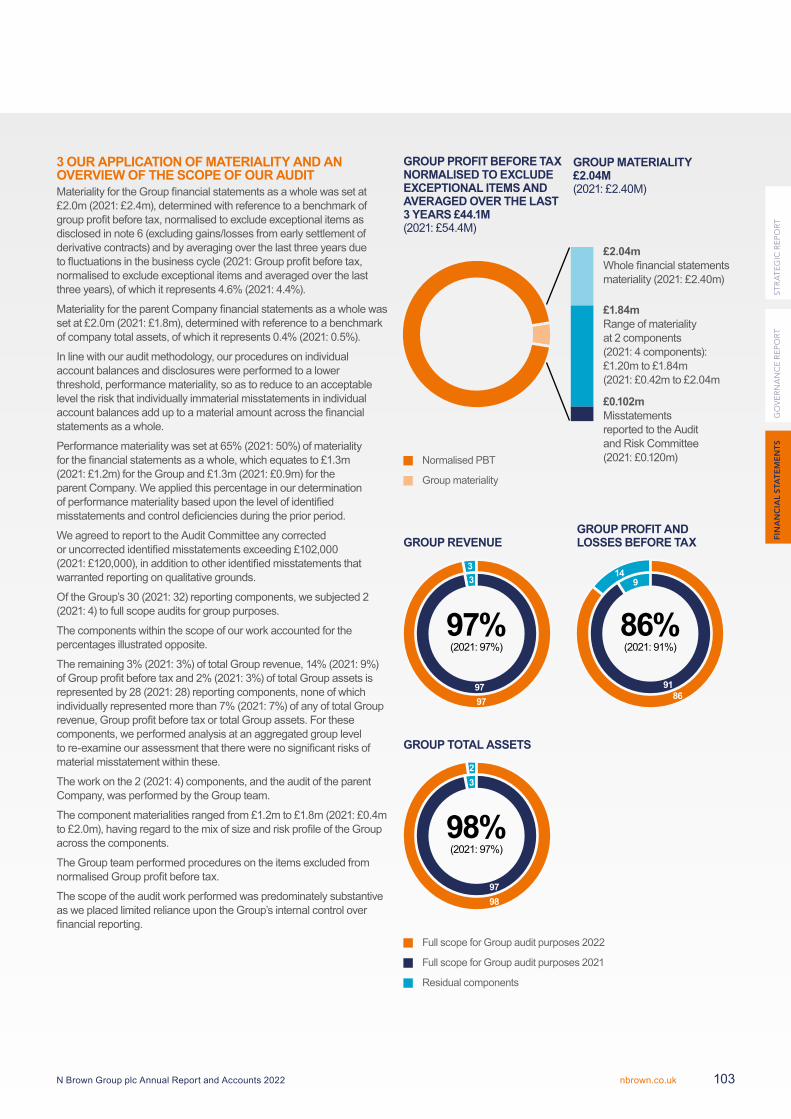
3 OUR APPLICATION OF MATERIALITY AND AN OVERVIEW OF THE SCOPE OF OUR AUDIT Materiality for the Group financial statements as a whole was set at £2.0m (2021: £2.4m), determined with reference to a benchmark of group profit before tax, normalised to exclude exceptional items as disclosed in note 6 (excluding gains/losses from early settlement of derivative contracts) and by averaging over the last three years due to fluctuations in the business cycle (2021: Group profit before tax, normalised to exclude exceptional items and averaged over the last three years), of which it represents 4.6% (2021: 4.4%).
Materiality for the parent Company financial statements as a whole was set at £2.0m (2021: £1.8m), determined with reference to a benchmark of company total assets, of which it represents 0.4% (2021: 0.5%).
In line with our audit methodology, our procedures on individual account balances and disclosures were performed to a lower threshold, performance materiality, so as to reduce to an acceptable level the risk that individually immaterial misstatements in individual account balances add up to a material amount across the financial statements as a whole.
Performance materiality was set at 65% (2021: 50%) of materiality for the financial statements as a whole, which equates to £1.3m (2021: £1.2m) for the Group and £1.3m (2021: £0.9m) for the parent Company. We applied this percentage in our determination of performance materiality based upon the level of identified misstatements and control deficiencies during the prior period.
We agreed to report to the Audit Committee any corrected or uncorrected identified misstatements exceeding £102,000 (2021: £120,000), in addition to other identified misstatements that warranted reporting on qualitative grounds.
Of the Group’s 30 (2021: 32) reporting components, we subjected 2 (2021: 4) to full scope audits for group purposes.
The components within the scope of our work accounted for the percentages illustrated opposite.
The remaining 3% (2021: 3%) of total Group revenue, 14% (2021: 9%) of Group profit before tax and 2% (2021: 3%) of total Group assets is represented by 28 (2021: 28) reporting components, none of which individually represented more than 7% (2021: 7%) of any of total Group revenue, Group profit before tax or total Group assets. For these components, we performed analysis at an aggregated group level to re-examine our assessment that there were no significant risks of material misstatement within these.
The work on the 2 (2021: 4) components, and the audit of the parent Company, was performed by the Group team.
The component materialities ranged from £1.2m to £1.8m (2021: £0.4m to £2.0m), having regard to the mix of size and risk profile of the Group across the components.
The Group team performed procedures on the items excluded from normalised Group profit before tax.
The scope of the audit work performed was predominately substantive as we placed limited reliance upon the Group’s internal control over financial reporting.
FIN
AN
CIA
L S
TAT
EM
EN
TS
GO
VE
RN
AN
CE
RE
PO
RT
ST
RA
TE
GIC
RE
PO
RT
N Brown Group plc Annual Report and Accounts 2022 nbrown.co.uk 103
97
33
97
97%(2021: 97%)
98
23
97
98%(2021: 97%)
86
149
91
86%(2021: 91%)
GROUP REVENUE
GROUP TOTAL ASSETS
GROUP PROFIT BEFORE TAX NORMALISED TO EXCLUDE EXCEPTIONAL ITEMS AND AVERAGED OVER THE LAST 3 YEARS £44.1M (2021: £54.4M)
GROUP MATERIALITY £2.04M (2021: £2.40M)
GROUP PROFIT AND LOSSES BEFORE TAX
Full scope for Group audit purposes 2022
Full scope for Group audit purposes 2021
Residual components
Normalised PBT
Group materiality
£2.04m Whole financial statements materiality (2021: £2.40m)
£1.84m Range of materiality at 2 components (2021: 4 components): £1.20m to £1.84m (2021: £0.42m to £2.04m
£0.102m Misstatements reported to the Audit and Risk Committee (2021: £0.120m)
4 GOING CONCERN The directors have prepared the financial statements on the going concern basis as they do not intend to liquidate the Group or the Company or to cease their operations, and as they have concluded that the Group’s and the Company’s financial position means that this is realistic. They have also concluded that there are no material uncertainties that could have cast significant doubt over their ability to continue as a going concern for at least a year from the date of approval of the financial statements (“the going concern period”).
We used our knowledge of the Group, its industry and the general economic environment to identify the inherent risks to its business model and analysed how those risks might affect the Group’s and Company’s financial resources or ability to continue operations over the going concern period. The risks that we considered most likely to adversely affect the Group’s and Company’s available financial resources and/or metrics relevant to debt covenants over this period are consumer confidence and the successful execution of the Group’s strategic plans.
We also considered less predictable but realistic second order impacts, such as the impacts of business interruption, supply chain cost inflation and the outcome of certain claims and litigations, including the Allianz claim Key Audit Matter, which could result in a rapid reduction of available financial resources.
We considered whether these risks could plausibly affect the liquidity or covenant compliance in the going concern period by comparing severe but plausible downside scenarios that could arise from these risks individually and collectively against the level of available financial resources and covenants indicated by the Group’s financial forecasts.
We considered whether the going concern disclosure in note 2 to the financial statements gives a full and accurate description of the Director’s assessment of going concern.
Our conclusions based on this work:
we consider that the directors’ use of the going concern basis of accounting in the preparation of the financial statements is appropriate;
we have not identified, and concur with the directors’ assessment that there is not, a material uncertainty related to events or conditions that, individually or collectively, may cast significant doubt on the Group’s or Company’s ability to continue as a going concern for the going concern period; and
we have nothing material to add or draw attention to in relation to the directors’ statement in note 2 to the financial statements on the use of the going concern basis of accounting with no material uncertainties that may cast significant doubt over the Group and Company’s use of that basis for the going concern period, and we found the going concern disclosure in note 2 to be acceptable.
However, as we cannot predict all future events or conditions and as subsequent events may result in outcomes that are inconsistent with judgements that were reasonable at the time they were made, the above conclusions are not a guarantee that the Group or the Company will continue in operation.
5 FRAUD AND BREACHES OF LAWS AND REGULATIONS – ABILITY TO DETECTIDENTIFYING AND RESPONDING TO RISKS OF MATERIAL MISSTATEMENT DUE TO FRAUDTo identify risks of material misstatement due to fraud (“fraud risks”) we assessed events or conditions that could indicate an incentive or pressure to commit fraud or provide an opportunity to commit fraud. Our risk assessment procedures included:
Enquiring of directors, the Audit and Risk Committee, internal audit and inspection of policy documentation as to the Group’s high-level policies and procedures to prevent and detect fraud, including the internal audit function, and the Group’s channel for “whistleblowing”, as well as whether they have knowledge of any actual, suspected or alleged fraud.
Reading Board, Audit and Risk Committee, Operational, Risk and Compliance Committee, Financial Services Operations Committee, and Remuneration Committee minutes.
Considering remuneration incentive schemes and performance targets for management and Directors including the EBITDA target for management remuneration.
Using analytical procedures to identify any unusual or unexpected relationships.
We communicated identified fraud risks throughout the audit team and remained alert to any indications of fraud throughout the audit.
As required by auditing standards, and taking into account possible pressures to meet profit targets and our overall knowledge of the control environment, we perform procedures to address the risk of management override of controls, in particular the risk that Group management may be in a position to make inappropriate accounting entries. On this audit we do not believe there is a fraud risk related to revenue recognition because of the nature of the Group’s revenue streams, and the high volume and low value nature of the Group’s revenue transactions. We consider that the fraud risk in relation to inappropriate accounting entries is limited to journals which is covered by our procedures in respect of management override of controls.
We also identified a fraud risk related to inappropriate impairment of customer receivables and inappropriate capitalisation of internal software and development costs in response to pressures to meet profit targets, management compensation arrangements, and historic internal control deficiencies identified.
Further detail in respect of the fraud risk related to inappropriate impairment of customer receivables is set out in the key audit matter disclosures in section 2 of this report.
We also performed procedures including:
Identifying journal entries and other adjustments to test based on risk criteria and comparing the identified entries to supporting documentation. These included those journals with unexpected account pairings or posted to unusual accounts.
Assessing significant management judgements in relation to capitalised internal software and development costs for bias; and
Assessing significant accounting estimates for bias.
INDEPENDENT AUDITOR’S REPORT TO THE MEMBERS OF N BROWN GROUP PLC CONTINUED
N Brown Group plc Annual Report and Accounts 2022nbrown.co.uk104
IDENTIFYING AND RESPONDING TO RISKS OF MATERIAL MISSTATEMENT RELATED TO COMPLIANCE WITH LAWS AND REGULATIONSWe identified areas of laws and regulations that could reasonably be expected to have a material effect on the financial statements from our general commercial and sector experience, through discussion with the directors and other management (as required by auditing standards), and from inspection of the Group’s regulatory and legal correspondence together with our legal specialists and discussed with the directors and other management the policies and procedures regarding compliance with laws and regulations.
As the Group is regulated, our assessment of risks involved gaining an understanding of the control environment including the entity’s procedures for complying with regulatory requirements.
We communicated identified laws and regulations throughout our team and remained alert to any indications of non-compliance throughout the audit.
The potential effect of these laws and regulations on the financial statements varies considerably.
Firstly, the Group is subject to laws and regulations that directly affect the financial statements including financial reporting legislation (including related companies legislation), distributable profits legislation, taxation legislation, and pension legislation and we assessed the extent of compliance with these laws and regulations as part of our procedures on the related financial statement items.
Secondly, the Group is subject to many other laws and regulations where the consequences of non-compliance could have a material effect on amounts or disclosures in the financial statements, for instance through the imposition of fines or litigation or the loss of the Group’s license to operate. We identified the following areas as those most likely to have such an effect: health and safety, anti-bribery and corruption and money laundering regulations, employment law, data protection regulations, environmental and climate legislation, trading and consumer standards, PCI compliance, Senior Manager Regime and FCA regulations, recognising the nature of the Group’s activities. Auditing standards limit the required audit procedures to identify non-compliance with these laws and regulations to enquiry of the directors and other management and inspection of regulatory and legal correspondence, if any. Therefore, if a breach of operational regulations is not disclosed to us or evident from relevant correspondence, an audit will not detect that breach. Further detail in respect of the Allianz legal claim is set out in the key audit matter disclosures in section 2 of this report.
CONTEXT OF THE ABILITY OF THE AUDIT TO DETECT FRAUD OR BREACHES OF LAW OR REGULATIONOwing to the inherent limitations of an audit, there is an unavoidable risk that we may not have detected some material misstatements in the financial statements, even though we have properly planned and performed our audit in accordance with auditing standards. For example, the further removed non-compliance with laws and regulations is from the events and transactions reflected in the financial statements, the less likely the inherently limited procedures required by auditing standards would identify it.
In addition, as with any audit, there remained a higher risk of non-detection of fraud, as these may involve collusion, forgery, intentional omissions, misrepresentations, or the override of internal controls. Our audit procedures are designed to detect material misstatement. We are not responsible for preventing non-compliance or fraud and cannot be expected to detect non-compliance with all laws and regulations.
6 WE HAVE NOTHING TO REPORT ON THE OTHER INFORMATION IN THE ANNUAL REPORT The directors are responsible for the other information presented in the Annual Report together with the financial statements. Our opinion on the financial statements does not cover the other information and, accordingly, we do not express an audit opinion or, except as explicitly stated below, any form of assurance conclusion thereon.
Our responsibility is to read the other information and, in doing so, consider whether, based on our financial statements audit work, the information therein is materially misstated or inconsistent with the financial statements or our audit knowledge. Based solely on that work we have not identified material misstatements in the other information.
STRATEGIC REPORT AND DIRECTORS’ REPORT Based solely on our work on the other information:
we have not identified material misstatements in the strategic report and the directors’ report;
in our opinion the information given in those reports for the financial year is consistent with the financial statements; and
in our opinion those reports have been prepared in accordance with the Companies Act 2006.
DIRECTORS’ REMUNERATION REPORT In addition to our audit of the financial statements, the directors have engaged us to audit the information in the Directors’ Remuneration Report that is described as having been audited, which the directors have decided to prepare as if the Company were required to comply with the requirements of Schedule 8 to The Large and Medium-sized Companies and Groups (Accounts and Reports) Regulations 2008 (SI 2008 No. 410) made under the Companies Act 2006.
In our opinion the part of the Directors’ Remuneration Report to be audited has been properly prepared in accordance with the Companies Act 2006, as if those requirements applied to the Company.
DISCLOSURES OF EMERGING AND PRINCIPAL RISKS AND LONGER-TERM VIABILITY We are required to perform procedures to identify whether there is a material inconsistency between the directors’ disclosures in respect of emerging and principal risks and the viability statement, and the financial statements and our audit knowledge.
Based on those procedures, we have nothing material to add or draw attention to in relation to:
the directors’ confirmation within the Viability Statement on pages 95 to 96 that they have carried out a robust assessment of the emerging and principal risks facing the Group, including those that would threaten its business model, future performance, solvency and liquidity;
the Principal Risks disclosures describing these risks and how emerging risks are identified, and explaining how they are being managed and mitigated; and
the directors’ explanation in the Viability Statement of how they have assessed the prospects of the Group, over what period they have done so and why they considered that period to be appropriate, and their statement as to whether they have a reasonable expectation that the Group will be able to continue in operation and meet its liabilities as they fall due over the period of their assessment, including any related disclosures drawing attention to any necessary qualifications or assumptions.
FIN
AN
CIA
L S
TAT
EM
EN
TS
GO
VE
RN
AN
CE
RE
PO
RT
ST
RA
TE
GIC
RE
PO
RT
N Brown Group plc Annual Report and Accounts 2022 nbrown.co.uk 105
Our work is limited to assessing these matters in the context of only the knowledge acquired during our financial statements audit. As we cannot predict all future events or conditions and as subsequent events may result in outcomes that are inconsistent with judgements that were reasonable at the time they were made, the absence of anything to report on these statements is not a guarantee as to the Group’s and Company’s longer-term viability.
CORPORATE GOVERNANCE DISCLOSURES We are required to perform procedures to identify whether there is a material inconsistency between the directors’ corporate governance disclosures and the financial statements and our audit knowledge.
Based on those procedures, we have concluded that each of the following is materially consistent with the financial statements and our audit knowledge:
the directors’ statement that they consider that the annual report and financial statements taken as a whole is fair, balanced and understandable, and provides the information necessary for shareholders to assess the Group’s position and performance, business model and strategy;
the section of the annual report describing the work of the Audit Committee, including the significant issues that the audit committee considered in relation to the financial statements, and how these issues were addressed; and
the section of the annual report that describes the review of the effectiveness of the Group’s risk management and internal control systems.
In addition to our audit of the financial statements, the directors have engaged us to review their Corporate Governance Statement as if the Company were required to comply with the Listing Rules and the Disclosure Guidance and Transparency Rules of the Financial Conduct Authority in relation to those matters. Under the terms of our engagement we are required to review the part of the Corporate Governance Statement relating to the Company’s compliance with the provisions of the UK Corporate Governance Code specified for our review. We have nothing to report in this respect.
7 WE HAVE NOTHING TO REPORT ON THE OTHER MATTERS ON WHICH WE ARE REQUIRED TO REPORT BY EXCEPTION Under the Companies Act 2006, we are required to report to you if, in our opinion:
adequate accounting records have not been kept by the parent Company, or returns adequate for our audit have not been received from branches not visited by us; or
the parent Company financial statements and the part of the Directors’ Remuneration Report which we were engaged to audit are not in agreement with the accounting records and returns; or
certain disclosures of directors’ remuneration specified by law are not made; or
we have not received all the information and explanations we require for our audit.
We have nothing to report in these respects.
8 RESPECTIVE RESPONSIBILITIES DIRECTORS’ RESPONSIBILITIES As explained more fully in their statement set out on page 96, the directors are responsible for: the preparation of the financial statements including being satisfied that they give a true and fair view; such internal control as they determine is necessary to enable the preparation of financial statements that are free from material misstatement, whether due to fraud or error; assessing the Group and parent Company’s ability to continue as a going concern, disclosing, as applicable, matters related to going concern; and using the going concern basis of accounting unless they either intend to liquidate the Group or the parent Company or to cease operations, or have no realistic alternative but to do so.
AUDITOR’S RESPONSIBILITIES Our objectives are to obtain reasonable assurance about whether the financial statements as a whole are free from material misstatement, whether due to fraud or error, and to issue our opinion in an auditor’s report. Reasonable assurance is a high level of assurance, but does not guarantee that an audit conducted in accordance with ISAs (UK) will always detect a material misstatement when it exists. Misstatements can arise from fraud or error and are considered material if, individually or in aggregate, they could reasonably be expected to influence the economic decisions of users taken on the basis of the financial statements.
A fuller description of our responsibilities is provided on the FRC’s website at www.frc.org.uk/auditorsresponsibilities.
9 THE PURPOSE OF OUR AUDIT WORK AND TO WHOM WE OWE OUR RESPONSIBILITIES This report is made solely to the Company’s members, as a body, in accordance with Chapter 3 of Part 16 of the Companies Act 2006 and the terms of our engagement by the Company. Our audit work has been undertaken so that we might state to the Company’s members those matters we are required to state to them in an auditor’s report, and the further matters we are required to state to them in accordance with the terms agreed with the Company, and for no other purpose. To the fullest extent permitted by law, we do not accept or assume responsibility to anyone other than the Company and the Company’s members, as a body, for our audit work, for this report, or for the opinions we have formed.
Anthony Sykes(Senior Statutory Auditor) for and on behalf of KPMG LLP, Statutory Auditor Chartered Accountants 15 Canada Square London E14 5GL
18 May 2022
INDEPENDENT AUDITOR’S REPORT TO THE MEMBERS OF N BROWN GROUP PLC CONTINUED
N Brown Group plc Annual Report and Accounts 2022nbrown.co.uk106
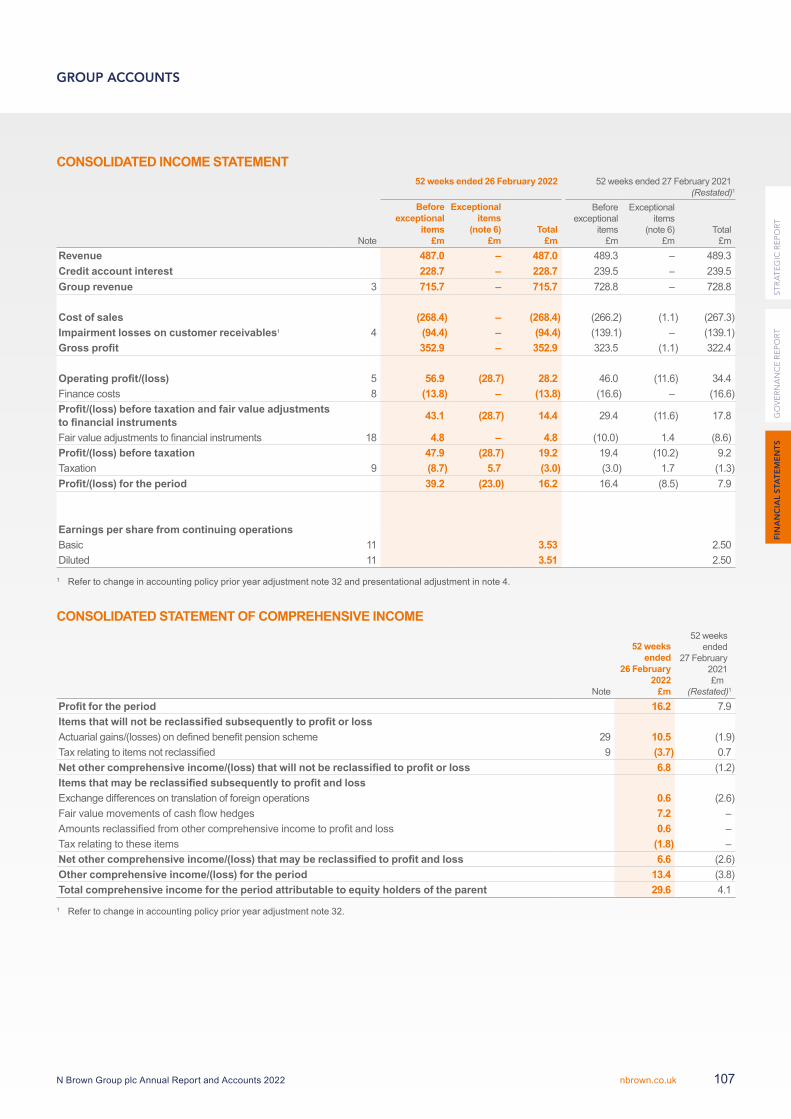
CONSOLIDATED INCOME STATEMENT52 weeks ended 26 February 2022 52 weeks ended 27 February 2021
(Restated)1
Note
Before exceptional
items £m
Exceptional items
(note 6) £m
Total £m
Before exceptional
items£m
Exceptional items
(note 6) £m
Total £m
Revenue 487.0 – 487.0 489.3 – 489.3Credit account interest 228.7 – 228.7 239.5 – 239.5Group revenue 3 715.7 – 715.7 728.8 – 728.8
Cost of sales (268.4) – (268.4) (266.2) (1.1) (267.3)Impairment losses on customer receivables1 4 (94.4) – (94.4) (139.1) – (139.1)Gross profit 352.9 – 352.9 323.5 (1.1) 322.4
Operating profit/(loss) 5 56.9 (28.7) 28.2 46.0 (11.6) 34.4Finance costs 8 (13.8) – (13.8) (16.6) – (16.6)Profit/(loss) before taxation and fair value adjustments to financial instruments 43.1 (28.7) 14.4 29.4 (11.6) 17.8
Fair value adjustments to financial instruments 18 4.8 – 4.8 (10.0) 1.4 (8.6)Profit/(loss) before taxation 47.9 (28.7) 19.2 19.4 (10.2) 9.2Taxation 9 (8.7) 5.7 (3.0) (3.0) 1.7 (1.3)Profit/(loss) for the period 39.2 (23.0) 16.2 16.4 (8.5) 7.9
Earnings per share from continuing operationsBasic 11 3.53 2.50Diluted 11 3.51 2.50
1 Refer to change in accounting policy prior year adjustment note 32 and presentational adjustment in note 4.
CONSOLIDATED STATEMENT OF COMPREHENSIVE INCOME
Note
52 weeks ended
26 February 2022
£m
52 weeks ended
27 February 2021
£m(Restated)1
Profit for the period 16.2 7.9Items that will not be reclassified subsequently to profit or lossActuarial gains/(losses) on defined benefit pension scheme 29 10.5 (1.9)Tax relating to items not reclassified 9 (3.7) 0.7Net other comprehensive income/(loss) that will not be reclassified to profit or loss 6.8 (1.2)Items that may be reclassified subsequently to profit and lossExchange differences on translation of foreign operations 0.6 (2.6)Fair value movements of cash flow hedges 7.2 –Amounts reclassified from other comprehensive income to profit and loss 0.6 –Tax relating to these items (1.8) –Net other comprehensive income/(loss) that may be reclassified to profit and loss 6.6 (2.6)Other comprehensive income/(loss) for the period 13.4 (3.8)Total comprehensive income for the period attributable to equity holders of the parent 29.6 4.1
1 Refer to change in accounting policy prior year adjustment note 32.
GROUP ACCOUNTS
FIN
AN
CIA
L S
TAT
EM
EN
TS
GO
VE
RN
AN
CE
RE
PO
RT
ST
RA
TE
GIC
RE
PO
RT
N Brown Group plc Annual Report and Accounts 2022 nbrown.co.uk 107
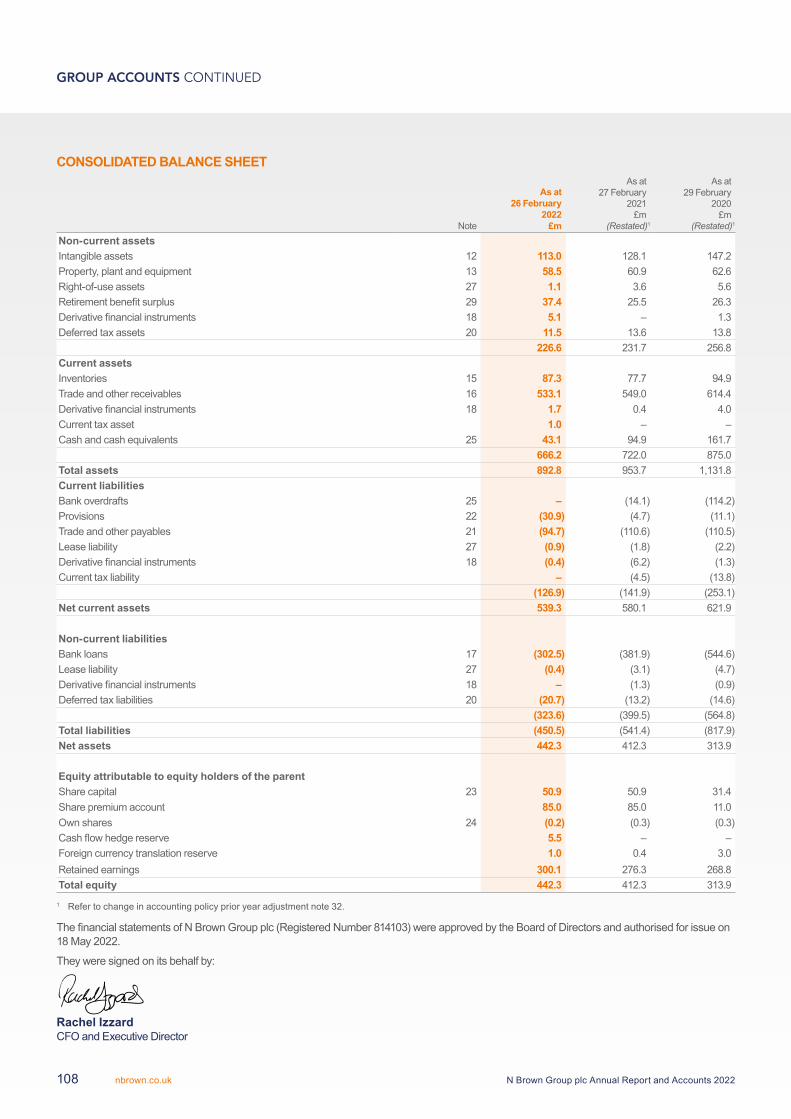
CONSOLIDATED BALANCE SHEET
Note
As at 26 February
2022£m
As at 27 February
2021 £m
(Restated)1
As at 29 February
2020 £m
(Restated)1
Non-current assetsIntangible assets 12 113.0 128.1 147.2Property, plant and equipment 13 58.5 60.9 62.6Right-of-use assets 27 1.1 3.6 5.6Retirement benefit surplus 29 37.4 25.5 26.3Derivative financial instruments 18 5.1 – 1.3Deferred tax assets 20 11.5 13.6 13.8
226.6 231.7 256.8Current assetsInventories 15 87.3 77.7 94.9Trade and other receivables 16 533.1 549.0 614.4Derivative financial instruments 18 1.7 0.4 4.0Current tax asset 1.0 – –Cash and cash equivalents 25 43.1 94.9 161.7
666.2 722.0 875.0Total assets 892.8 953.7 1,131.8Current liabilitiesBank overdrafts 25 – (14.1) (114.2)Provisions 22 (30.9) (4.7) (11.1)Trade and other payables 21 (94.7) (110.6) (110.5)Lease liability 27 (0.9) (1.8) (2.2)Derivative financial instruments 18 (0.4) (6.2) (1.3)Current tax liability – (4.5) (13.8)
(126.9) (141.9) (253.1)Net current assets 539.3 580.1 621.9
Non-current liabilitiesBank loans 17 (302.5) (381.9) (544.6)Lease liability 27 (0.4) (3.1) (4.7)Derivative financial instruments 18 – (1.3) (0.9)Deferred tax liabilities 20 (20.7) (13.2) (14.6)
(323.6) (399.5) (564.8)Total liabilities (450.5) (541.4) (817.9)Net assets 442.3 412.3 313.9
Equity attributable to equity holders of the parentShare capital 23 50.9 50.9 31.4Share premium account 85.0 85.0 11.0Own shares 24 (0.2) (0.3) (0.3)Cash flow hedge reserve 5.5 – –Foreign currency translation reserve 1.0 0.4 3.0Retained earnings 300.1 276.3 268.8Total equity 442.3 412.3 313.9
1 Refer to change in accounting policy prior year adjustment note 32.
The financial statements of N Brown Group plc (Registered Number 814103) were approved by the Board of Directors and authorised for issue on 18 May 2022.
They were signed on its behalf by:
Rachel Izzard CFO and Executive Director
GROUP ACCOUNTS CONTINUED
N Brown Group plc Annual Report and Accounts 2022nbrown.co.uk108
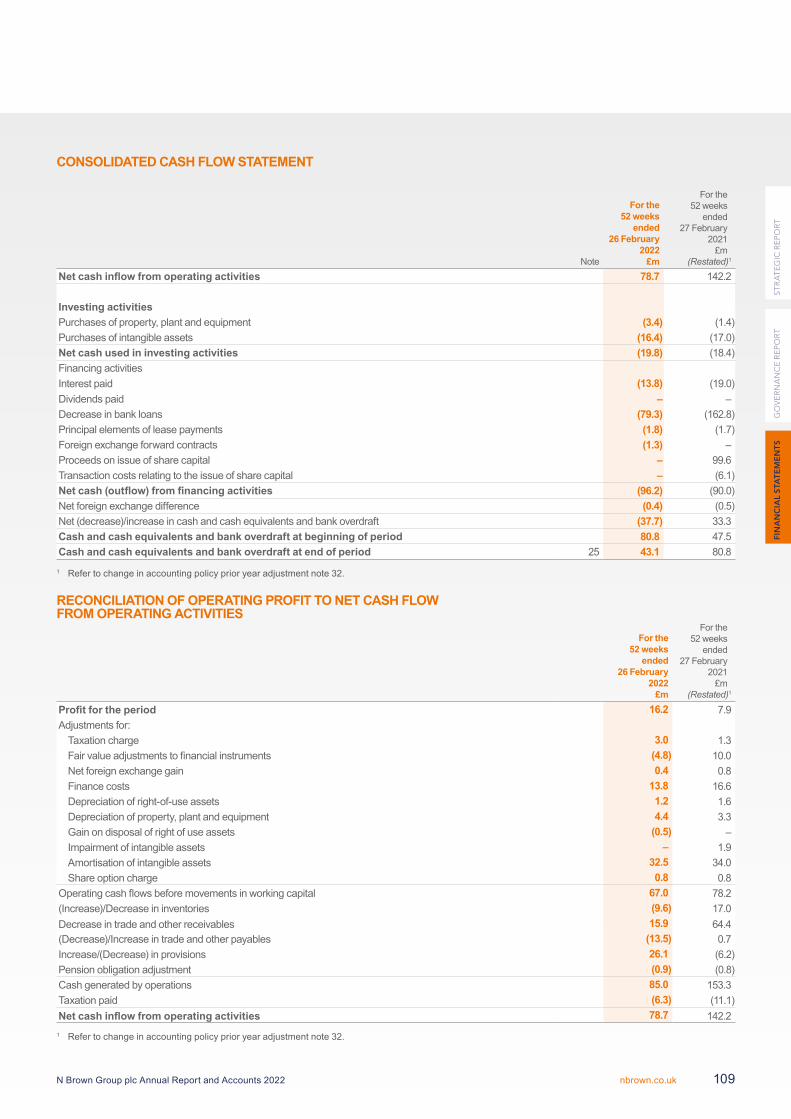
CONSOLIDATED CASH FLOW STATEMENT
Note
For the 52 weeks
ended 26 February
2022 £m
For the 52 weeks
ended 27 February
2021 £m
(Restated)1 Net cash inflow from operating activities 78.7 142.2
Investing activitiesPurchases of property, plant and equipment (3.4) (1.4)Purchases of intangible assets (16.4) (17.0)Net cash used in investing activities (19.8) (18.4)Financing activitiesInterest paid (13.8) (19.0)Dividends paid – –Decrease in bank loans (79.3) (162.8)Principal elements of lease payments (1.8) (1.7)Foreign exchange forward contracts (1.3) –Proceeds on issue of share capital – 99.6Transaction costs relating to the issue of share capital – (6.1)Net cash (outflow) from financing activities (96.2) (90.0)Net foreign exchange difference (0.4) (0.5)Net (decrease)/increase in cash and cash equivalents and bank overdraft (37.7) 33.3Cash and cash equivalents and bank overdraft at beginning of period 80.8 47.5Cash and cash equivalents and bank overdraft at end of period 25 43.1 80.8
1 Refer to change in accounting policy prior year adjustment note 32.
RECONCILIATION OF OPERATING PROFIT TO NET CASH FLOW FROM OPERATING ACTIVITIES
For the 52 weeks
ended 26 February
2022 £m
For the 52 weeks
ended 27 February
2021 £m
(Restated)1
Profit for the period 16.2 7.9Adjustments for:
Taxation charge 3.0 1.3Fair value adjustments to financial instruments (4.8) 10.0Net foreign exchange gain 0.4 0.8Finance costs 13.8 16.6Depreciation of right-of-use assets 1.2 1.6Depreciation of property, plant and equipment 4.4 3.3Gain on disposal of right of use assets (0.5) –Impairment of intangible assets – 1.9Amortisation of intangible assets 32.5 34.0Share option charge 0.8 0.8
Operating cash flows before movements in working capital 67.0 78.2(Increase)/Decrease in inventories (9.6) 17.0Decrease in trade and other receivables 15.9 64.4(Decrease)/Increase in trade and other payables (13.5) 0.7Increase/(Decrease) in provisions 26.1 (6.2)Pension obligation adjustment (0.9) (0.8)Cash generated by operations 85.0 153.3Taxation paid (6.3) (11.1)Net cash inflow from operating activities 78.7 142.2
1 Refer to change in accounting policy prior year adjustment note 32.
FIN
AN
CIA
L S
TAT
EM
EN
TS
GO
VE
RN
AN
CE
RE
PO
RT
ST
RA
TE
GIC
RE
PO
RT
N Brown Group plc Annual Report and Accounts 2022 nbrown.co.uk 109
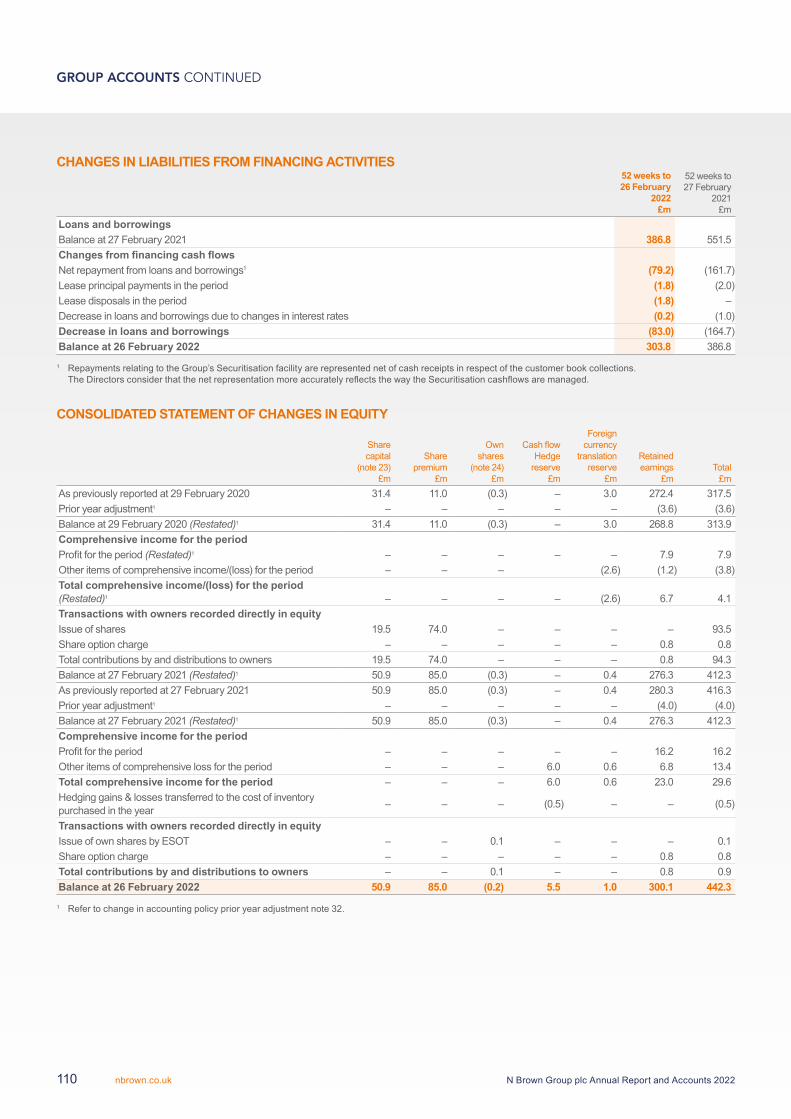
CHANGES IN LIABILITIES FROM FINANCING ACTIVITIES52 weeks to26 February
2022£m
52 weeks to27 February
2021£m
Loans and borrowingsBalance at 27 February 2021 386.8 551.5Changes from financing cash flowsNet repayment from loans and borrowings1 (79.2) (161.7)Lease principal payments in the period (1.8) (2.0)Lease disposals in the period (1.8) –Decrease in loans and borrowings due to changes in interest rates (0.2) (1.0)Decrease in loans and borrowings (83.0) (164.7)Balance at 26 February 2022 303.8 386.8
1 Repayments relating to the Group’s Securitisation facility are represented net of cash receipts in respect of the customer book collections. The Directors consider that the net representation more accurately reflects the way the Securitisation cashflows are managed.
CONSOLIDATED STATEMENT OF CHANGES IN EQUITY
Share capital
(note 23) £m
Share premium
£m
Own shares
(note 24) £m
Cash flowHedge
reserve£m
Foreign currency
translation reserve
£m
Retained earnings
£mTotal
£mAs previously reported at 29 February 2020 31.4 11.0 (0.3) – 3.0 272.4 317.5Prior year adjustment1 – – – – – (3.6) (3.6)Balance at 29 February 2020 (Restated)1 31.4 11.0 (0.3) – 3.0 268.8 313.9Comprehensive income for the periodProfit for the period (Restated)1 – – – – – 7.9 7.9Other items of comprehensive income/(loss) for the period – – – (2.6) (1.2) (3.8)Total comprehensive income/(loss) for the period (Restated)1 – – – – (2.6) 6.7 4.1Transactions with owners recorded directly in equityIssue of shares 19.5 74.0 – – – – 93.5Share option charge – – – – – 0.8 0.8Total contributions by and distributions to owners 19.5 74.0 – – – 0.8 94.3Balance at 27 February 2021 (Restated)1 50.9 85.0 (0.3) – 0.4 276.3 412.3As previously reported at 27 February 2021 50.9 85.0 (0.3) – 0.4 280.3 416.3Prior year adjustment1 – – – – – (4.0) (4.0)Balance at 27 February 2021 (Restated)1 50.9 85.0 (0.3) – 0.4 276.3 412.3Comprehensive income for the periodProfit for the period – – – – – 16.2 16.2Other items of comprehensive loss for the period – – – 6.0 0.6 6.8 13.4Total comprehensive income for the period – – – 6.0 0.6 23.0 29.6Hedging gains & losses transferred to the cost of inventory purchased in the year – – – (0.5) – – (0.5)
Transactions with owners recorded directly in equityIssue of own shares by ESOT – – 0.1 – – – 0.1Share option charge – – – – – 0.8 0.8Total contributions by and distributions to owners – – 0.1 – – 0.8 0.9Balance at 26 February 2022 50.9 85.0 (0.2) 5.5 1.0 300.1 442.3
1 Refer to change in accounting policy prior year adjustment note 32.
GROUP ACCOUNTS CONTINUED
N Brown Group plc Annual Report and Accounts 2022nbrown.co.uk110
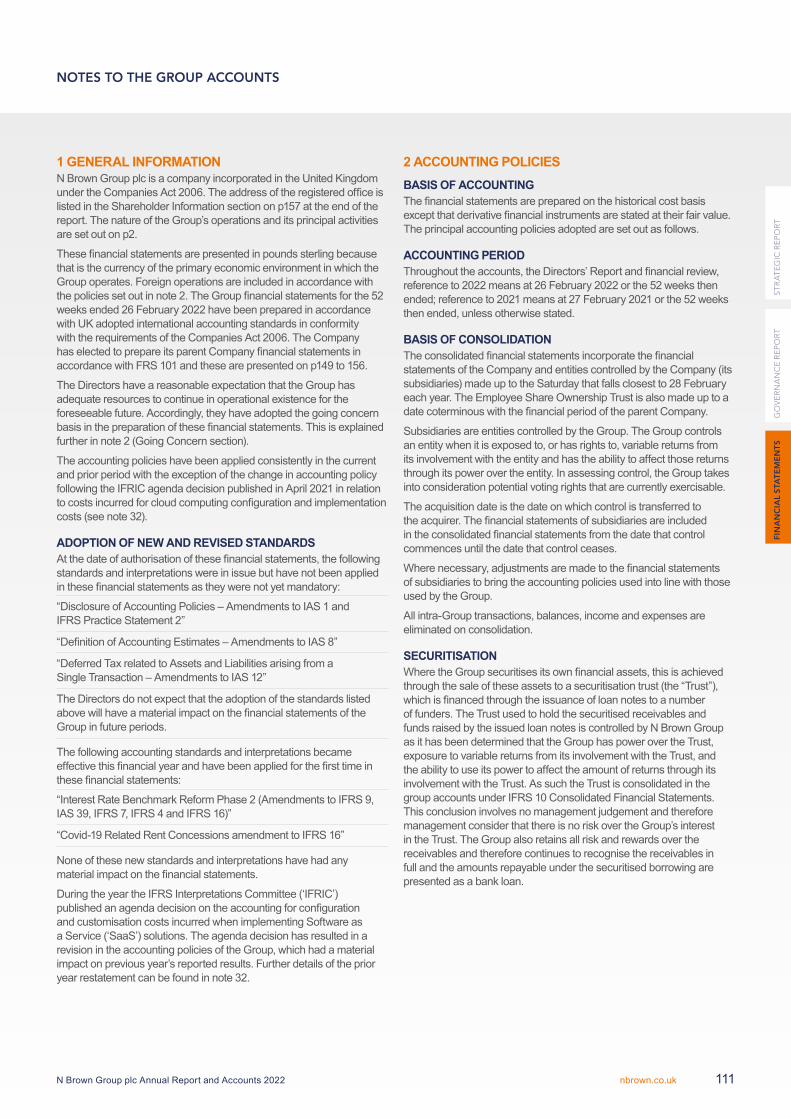
1 GENERAL INFORMATIONN Brown Group plc is a company incorporated in the United Kingdom under the Companies Act 2006. The address of the registered office is listed in the Shareholder Information section on p157 at the end of the report. The nature of the Group’s operations and its principal activities are set out on p2.
These financial statements are presented in pounds sterling because that is the currency of the primary economic environment in which the Group operates. Foreign operations are included in accordance with the policies set out in note 2. The Group financial statements for the 52 weeks ended 26 February 2022 have been prepared in accordance with UK adopted international accounting standards in conformity with the requirements of the Companies Act 2006. The Company has elected to prepare its parent Company financial statements in accordance with FRS 101 and these are presented on p149 to 156.
The Directors have a reasonable expectation that the Group has adequate resources to continue in operational existence for the foreseeable future. Accordingly, they have adopted the going concern basis in the preparation of these financial statements. This is explained further in note 2 (Going Concern section).
The accounting policies have been applied consistently in the current and prior period with the exception of the change in accounting policy following the IFRIC agenda decision published in April 2021 in relation to costs incurred for cloud computing configuration and implementation costs (see note 32).
ADOPTION OF NEW AND REVISED STANDARDSAt the date of authorisation of these financial statements, the following standards and interpretations were in issue but have not been applied in these financial statements as they were not yet mandatory:
“Disclosure of Accounting Policies – Amendments to IAS 1 and IFRS Practice Statement 2”
“Definition of Accounting Estimates – Amendments to IAS 8”
“Deferred Tax related to Assets and Liabilities arising from a Single Transaction – Amendments to IAS 12”
The Directors do not expect that the adoption of the standards listed above will have a material impact on the financial statements of the Group in future periods.
The following accounting standards and interpretations became effective this financial year and have been applied for the first time in these financial statements:
“Interest Rate Benchmark Reform Phase 2 (Amendments to IFRS 9, IAS 39, IFRS 7, IFRS 4 and IFRS 16)”
“Covid-19 Related Rent Concessions amendment to IFRS 16”
None of these new standards and interpretations have had any material impact on the financial statements.
During the year the IFRS Interpretations Committee (‘IFRIC’) published an agenda decision on the accounting for configuration and customisation costs incurred when implementing Software as a Service (‘SaaS’) solutions. The agenda decision has resulted in a revision in the accounting policies of the Group, which had a material impact on previous year’s reported results. Further details of the prior year restatement can be found in note 32.
2 ACCOUNTING POLICIESBASIS OF ACCOUNTINGThe financial statements are prepared on the historical cost basis except that derivative financial instruments are stated at their fair value. The principal accounting policies adopted are set out as follows.
ACCOUNTING PERIODThroughout the accounts, the Directors’ Report and financial review, reference to 2022 means at 26 February 2022 or the 52 weeks then ended; reference to 2021 means at 27 February 2021 or the 52 weeks then ended, unless otherwise stated.
BASIS OF CONSOLIDATIONThe consolidated financial statements incorporate the financial statements of the Company and entities controlled by the Company (its subsidiaries) made up to the Saturday that falls closest to 28 February each year. The Employee Share Ownership Trust is also made up to a date coterminous with the financial period of the parent Company.
Subsidiaries are entities controlled by the Group. The Group controls an entity when it is exposed to, or has rights to, variable returns from its involvement with the entity and has the ability to affect those returns through its power over the entity. In assessing control, the Group takes into consideration potential voting rights that are currently exercisable.
The acquisition date is the date on which control is transferred to the acquirer. The financial statements of subsidiaries are included in the consolidated financial statements from the date that control commences until the date that control ceases.
Where necessary, adjustments are made to the financial statements of subsidiaries to bring the accounting policies used into line with those used by the Group.
All intra-Group transactions, balances, income and expenses are eliminated on consolidation.
SECURITISATIONWhere the Group securitises its own financial assets, this is achieved through the sale of these assets to a securitisation trust (the “Trust”), which is financed through the issuance of loan notes to a number of funders. The Trust used to hold the securitised receivables and funds raised by the issued loan notes is controlled by N Brown Group as it has been determined that the Group has power over the Trust, exposure to variable returns from its involvement with the Trust, and the ability to use its power to affect the amount of returns through its involvement with the Trust. As such the Trust is consolidated in the group accounts under IFRS 10 Consolidated Financial Statements. This conclusion involves no management judgement and therefore management consider that there is no risk over the Group’s interest in the Trust. The Group also retains all risk and rewards over the receivables and therefore continues to recognise the receivables in full and the amounts repayable under the securitised borrowing are presented as a bank loan.
NOTES TO THE GROUP ACCOUNTS
FIN
AN
CIA
L S
TAT
EM
EN
TS
GO
VE
RN
AN
CE
RE
PO
RT
ST
RA
TE
GIC
RE
PO
RT
N Brown Group plc Annual Report and Accounts 2022 nbrown.co.uk 111
2 ACCOUNTING POLICIES CONTINUED REVENUE RECOGNITIONProduct revenue consists of sales of goods as well as postage and packaging receipts, and is measured at the fair value of the consideration received or receivable and represents amounts receivable for goods and services provided in the normal course of business, net of discounts and sales-related taxes. Product revenue for all goods, including the ones delivered to the customers directly from suppliers and goods delivered to partners, is recognised in accordance with IFRS 15, when goods are delivered to the customer or partner and therefore control is transferred.
Payment of the transaction price is due immediately when the customer purchases the product on the Group’s websites, or in instalments where goods are purchased on credit. In the case of business to business transactions, payment is made in accordance with the applicable credit terms. In regards to goods directly despatched to the customer from suppliers, the Group has the ability to direct the use of, and obtain substantially all of the benefits from the specified goods. More specifically, the Group is responsible for providing the specified goods to the customer, has inventory risk prior to these being transferred to the customer and has significant influence over the pricing of the goods, therefore it is acting as the principal in these arrangements. Revenue from direct despatch sales is therefore recognised gross.
Sales returns in the period are recognised as a deduction to revenue based on expected levels of returns. Provision is made for outstanding returns not yet made at the period end. Accumulated experience (including historical returns rates) is used to estimate and provide for such returns. The provision is recorded as a reduction in revenue with a corresponding entry against trade receivables. Inventory expected to come back as a result of returns is recorded as a reduction in cost of sales with a corresponding entry to increase the closing stocks. Postage and packaging subscription revenue is recognised over the length of the subscription and deferred where this relates to future periods.
Financial services revenue includes interest and administrative charges. Interest income is accrued on a time basis, by reference to the principal outstanding and the applicable effective interest rate. Effective interest rate is the rate that exactly discounts estimated future cash receipts through the expected life of the financial assets to that asset’s gross carrying amount, being its amortised cost excluding expected credit losses. Interest income from stage 1 and 2 trade receivables is recognised by applying the effective interest rate to the gross carrying amount of the asset; for stage 3 trade receivables, the effective interest rate is applied to the net carrying amount after deducting the allowance for expected credit losses.
Revenue from non-interest-related Financial Services income primarily comprises administration fees arising from missed payments by customers and is recognised when the associated arrears management activity has been performed.
PROPERTY, PLANT AND EQUIPMENTProperty, plant and equipment is stated at cost, less accumulated depreciation and any provision for impairment in value.
Depreciation is charged so as to write off the cost of assets to their estimated residual values, based on current prices at the balance sheet date, over their remaining useful lives, using the straight-line method. No depreciation is charged on freehold land. Assets under construction are not depreciated but instead tested for impairment annually.
In this respect the following annual depreciation rates apply:Land and BuildingsFreehold buildings 2%Leasehold property and improvements over the period of the lease
Fixtures & EquipmentPlant and machinery between 2% and 20%Fixtures and fittings 10%
The gain or loss arising on the disposal of an asset is determined as the difference between the sales proceeds and the carrying amount of the asset, or as the assets residual net book value in the case of asset retirements, and is recognised in the income statement.
RIGHT-OF-USE ASSETSThe Group recognises right-of-use assets at the commencement date of the lease (i.e. the date the underlying asset is available for use).
Right-of-use assets are measured at the amount of the initial measurement of the lease liability, plus any lease payments made prior to commencement date, initial direct costs, and estimated costs of restoring the underlying asset to the condition required by the lease, less any lease incentives received.
Unless the Group is reasonably certain to obtain ownership of the leased asset at the end of the lease term, the recognised right-of-use assets are depreciated on a straight-line basis over the shorter of its estimated useful life and the lease term.
NOTES TO THE GROUP ACCOUNTS CONTINUED
N Brown Group plc Annual Report and Accounts 2022nbrown.co.uk112
INTANGIBLE ASSETSComputer software development costs that generate economic benefits beyond one year are capitalised as intangible assets and amortised on a straight-line basis over a period of up to five years, or by exception over a longer period where it is expected that economic benefits are attributable over a longer period. The remaining useful life of assets is reviewed on an annual basis, or where a change in the business or other circumstances would trigger a revision. Assets under development are not amortised but instead tested for impairment annually. The amortisation expense on intangible assets is recognised in the income statement within Depreciation and Amortisation.
Expenditure on research activities is recognised as an expense in the period in which it is incurred. An internally generated intangible asset arising from development activities is recognised if, and only if, all of the following conditions have been met:
It is technically feasible to complete the intangible asset so that it will be available for use or sale;
The Group intends to complete the intangible asset and use or sell it;
The Group has the ability to use or sell the intangible asset;
The asset will generate future economic benefits;
Adequate technical, financial and other resource is available to complete the development of the asset; and
The Group can reliably measure the expenditure attributable to the intangible asset during its development.
The cost of an internally generated intangible asset comprises all directly attributable costs necessary to develop and prepare the asset to be capable of operating in the manner intended by the Group.
Software as a service (“SAAS”) contract costs are expensed to the Income Statement over the life of the contract. For SAAS and cloud based technology, assessment is made as to whether the Group controls the software or whether the software is controlled by the third party provider. Where the Group does not control the software, any configuration and customisation costs are expensed. Costs incurred on the Group’s existing assets and infrastructure are capitalised only when they are determined to give rise to separable assets or substantially improved processes or systems to which the Group controls.
Capitalised development expenditure is stated at cost less accumulated amortisation and less accumulated impairment losses.
Legally protected or otherwise separable trade names acquired as part of a business combination are capitalised at fair value on acquisition and are assumed to have an indefinite useful life. Intangible assets with indefinite lives are not amortised, but are subject to annual impairment tests. The indefinite life assessment is also reviewed annually to determine whether this continues to be supportable.
IMPAIRMENT OF TANGIBLE AND INTANGIBLE ASSETSAt each balance sheet date, the Group reviews the carrying value of its tangible and intangible assets (including right-of-use assets) to determine whether there is any indication that those assets have suffered an impairment loss. If any such indication exists, the recoverable amount of the asset is estimated in order to determine the extent of the impairment loss (if any). Where the asset does not generate cash flows that are independent from other assets, the Group estimates the recoverable amount of the cash-generating unit to which the asset belongs. For intangible assets that have indefinite useful lives or that are not yet available for use, the recoverable amount is estimated each year at the same time.
Recoverable amount is the higher of fair value less costs to sell and value in use. In assessing value in use, the estimated future cash flows are discounted to their present value using a discount rate that reflects current market assessments of the time value of money and the risks specific to the asset (or cash-generating unit) for which the estimates of future cash flows have not been adjusted. If the recoverable amount of an asset (or cash-generating unit) is estimated to be less than its carrying amount, the carrying amount of the asset (cash-generating unit) is reduced to its recoverable amount.
An impairment loss is recognised as an expense immediately.
INVENTORIESInventories have been valued at the lower of cost and net realisable value. Cost of inventories comprises of direct materials calculated on a first-in-first-out basis and those overheads that have been incurred in bringing inventories to their present location and condition. Where materials are purchased in a foreign currency and the purchase of such materials has been designated in a hedge relationship as a highly probable transaction, the cost of inventories includes the transfer of the gains and losses on the hedging instruments since the date of designation in a hedge relationship, through the application of a basis adjustment to the cost of inventory.
Provision is made based on management’s estimates of future disposal strategies.
Net realisable value means estimated selling price less all costs to be incurred in marketing, selling and distribution.
Stock in transit is recognised where control of the goods has transferred to the Group, following the transfer of the risks and rewards associated with the goods.
TAXATIONThe tax expense represents the sum of the tax currently payable and deferred tax.
The tax currently payable is based on taxable profit for the year. Taxable profit differs from net profit as reported in the income statement because it excludes items of income or expense that are taxable or deductible in other years and it further excludes items that are never taxable or deductible. The Group’s liability for current tax is calculated using tax rates that have been enacted or substantively enacted by the balance sheet date.
FIN
AN
CIA
L S
TAT
EM
EN
TS
GO
VE
RN
AN
CE
RE
PO
RT
ST
RA
TE
GIC
RE
PO
RT
N Brown Group plc Annual Report and Accounts 2022 nbrown.co.uk 113
2 ACCOUNTING POLICIES CONTINUED Deferred tax is the tax expected to be payable or recoverable on differences between the carrying amounts of assets and liabilities in the financial statements and the corresponding tax bases used in the computation of taxable profit, and is accounted for using the balance sheet liability method.
Deferred tax liabilities are generally recognised for all taxable temporary differences and deferred tax assets are recognised to the extent that it is probable that taxable profits will be available against which deductible temporary differences can be utilised. Such assets and liabilities are not recognised if the temporary difference arises from goodwill or from the initial recognition (other than in a business combination) of other assets and liabilities in a transaction that affects neither the tax profit nor the accounting profit.
Deferred tax is calculated at the tax rates that are expected to apply in the period when the liability is settled or the asset is realised.
FOREIGN CURRENCIESThe individual financial statements of each Group company are presented in the currency of the primary economic environment in which it operates (its functional currency). For the purpose of the consolidated financial statements, the results and financial position of each Group company are expressed in pounds sterling, the presentation currency for the consolidated financial statements.
In preparing the financial statements of the individual companies, transactions in currencies other than the entity’s functional currency (foreign currencies) are recorded at the rates of exchange prevailing on the dates of the transactions. At each balance sheet date, monetary assets and liabilities that are denominated in foreign currencies are retranslated at the rates prevailing on the balance sheet date. Non-monetary items carried at fair value that are denominated in foreign currencies are translated at the rates prevailing at the date when the fair value was determined. Non-monetary items that are measured in terms of historical cost in a foreign currency are not retranslated.
Exchange differences arising on the settlement of monetary items, and on the retranslation of monetary items, are included in profit or loss for the period. Exchange differences arising on the retranslation of non-monetary items carried at fair value are included in profit or loss for the period except for differences arising on the retranslation of non-monetary items in respect of which gains and losses are recognised directly in equity. For such non-monetary items, any exchange component of that gain or loss is also recognised directly in equity.
In order to hedge its exposure to certain foreign exchange risks, the Group may enter into forward contracts and options (see below for details of the Group’s accounting policies in respect of such derivative financial instruments).
For the purpose of presenting consolidated financial statements, the assets and liabilities of the Group’s foreign operations are translated at exchange rates prevailing on the balance sheet date. Income and expense items are translated at the average exchange rates for the period, unless exchange rates fluctuate significantly during that period, in which case the exchange rates at the date of transactions are used. Exchange differences arising, if any, are classified as equity and transferred to the Group’s translation reserve. Such translation differences are recognised as income or as expenses in the period in which the operation is disposed of.
FINANCIAL INSTRUMENTSFinancial assets and financial liabilities are recognised on the Group’s balance sheet when the Group becomes a party to the contractual provisions of the instrument.
FINANCIAL INSTRUMENTS – CLASSIFICATION – FINANCIAL ASSETSIFRS 9 contains a classification and measurement approach for financial assets that reflects the business model in which assets are managed and their cash flow characteristics.
IFRS 9 contains three principal classification categories for financial assets: measured at amortised cost; fair value through other comprehensive income (“FVOCI”); and fair value through profit and loss (“FVTPL”). The Group has determined that all of the trade and other receivables are classified as amortised cost, as a financial asset is measured at amortised cost if both the following conditions are met and it has not been designated as at FVTPL:
All such assets are held within a business model whose objective is to hold the asset to collect its contractual cash flows; and
The contractual terms of all such assets give rise to cash flows on specified dates that represent payments of solely principal and interest on the outstanding principal amount.
The Group makes an assessment of the objective of the business model in which a financial asset is held at a portfolio level because this best reflects the way the business is managed and information is provided to management.
The information considered includes:
The stated policies and objectives for the portfolio and the operation of those policies in practice. These include whether management’s strategy focuses on earning contractual interest income or realising cash flows from the sale of assets;
How the performance of the portfolio is evaluated and reported to the Group’s management;
The risks that affect the performance of the business model and how those risks are managed;
How managers of the business are compensated; and
The frequency, volume and timing of sales of financial assets in prior periods, the reasons for such sales and expectations about future sales activity.
For the purpose of this assessment “principal” is defined as the fair value of the financial asset on initial recognition. Interest is defined as the consideration for the time value of money and for the credit risk associated with the principal amount outstanding during a particular period of time and for other basic lending risks and costs (e.g. liquidity risk and administration costs), as well as a profit margin.
NOTES TO THE GROUP ACCOUNTS CONTINUED
N Brown Group plc Annual Report and Accounts 2022nbrown.co.uk114
In assessing whether the contractual cash flows are solely payments of principal and interest the Group considers the contractual terms of the instrument. This includes assessing whether the financial asset contains a contractual term that could change the timing or amount of contractual cash flows such that it would not meet this condition. In making this assessment the Group considers:
Contingent events that would change the amount or timing of cash flows; and
Terms that may adjust the contractual coupon rate.
IFRS 9 contains two classification categories for financial liabilities: measured at amortised cost or FVTPL. All of the Group’s financial liabilities other than derivative liabilities are measured at amortised cost.
FINANCIAL INSTRUMENTS – RECOGNITION AND MEASUREMENTFinancial assets and financial liabilities are recognised on the Group’s balance sheet when the Group becomes a party to the contractual provisions of the instrument.
All financial assets are recognised and derecognised on a trade date where the purchase or sale of a financial asset is under a contract whose terms require delivery of the financial asset within the timeframe established by the market concerned.
A financial asset is derecognised primarily when:
The rights to receive cash flows from the asset have expired;
The Group has transferred its rights to receive cash flows from the asset and has transferred substantially all the risks and rewards of ownership, including through debt sales; and
The Group has taken actions not to pursue collection, for example in instances of bankruptcy or individual voluntary arrangement.
The Group derecognises financial liabilities when, and only when, the Group’s obligations are discharged, cancelled or they expire.
Financial assets and financial liabilities are initially measured at fair value. Transaction costs that are directly attributable to the acquisition or issue of financial assets and financial liabilities are added to or deducted from the fair value of the financial assets or financial liabilities as appropriate on initial recognition.
Financial assets classified as amortised cost are subsequently measured using the effective interest method, less any impairment. Financial liabilities classified as amortised cost are subsequently measured using the effective interest method, with interest expense recognised on an effective yield basis. The effective interest rate method is a method of calculating amortised cost and of allocating interest expense over the relevant period. The effective interest rate is the rate that exactly discounts estimated future cash flows through the expected life of the financial instrument, or, where appropriate, a shorter period, to the net carrying amount on initial recognition.
Financial instruments held at fair value through profit or loss relate entirely to derivative contracts. As noted below, these instruments are carried in the balance sheet at their fair value with changes in the fair value recognised in the income statement as they arise, or in equity where designated in a hedging relationship.
IMPAIRMENT – FINANCIAL SERVICES AND CONTRACT ASSETSThe Group recognises an allowance for expected credit losses (“ECLs”) for customer and other receivables. IFRS 9 requires an impairment provision to be recognised on origination of a customer advance, based on its ECL. Customer receivables relate to trade receivables included in the Group balance sheet.
Additional ECL provisions that are recognised in the Consolidated Income Statement are presented as “Impairment losses on customer receivables”. The Group recognises proceeds related to the sale of defaulted accounts as a remeasurement in the ECLs of these receivables.
As the Group has determined there is a significant financing component, the ECL model introduces the concept of staging.
Stage 1 – includes new originated assets, and assets which do not demonstrate any significant increase in credit risk (SICR).
Stage 2 – assets which have demonstrated a significant increase in credit risk since origination.
Stage 3 – assets which are credit impaired (e.g. defaulted or accounts in forbearance).
Under IFRS 9, loss allowances are measured on either of the following bases:
12-month ECLs: these are ECLs that result from possible default events within the 12 months after the reporting date; and
Lifetime ECLs: these are ECLs that result from all possible default events over the expected life of a financial instrument.
12-month ECLs are calculated for assets in Stage 1 and lifetime ECLs are calculated for assets in Stages 2 and 3.
ECL is the product of the Probability of Default (“PD”), exposure at default (“EAD”) and Loss Given Default (“LGD”), discounted at the current effective interest rate (“EIR”). In accordance with IFRS 9, the current EIR is used as the discount rate because all trade receivables have a variable interest rate. The PD is an estimate of the likelihood of default over 12 months (stage 1) or the expected lifetime of the debt (stage 2). It is 100% for balances within stage 3. The calculation of PDs is based on statistical models that utilise internal data, adjusted to take into account estimates of future conditions.
The EAD is set as the balance outstanding at the reporting date because receivables arising from future sales are not incorporated into the ECL calculation as explained below.
The LGD is an estimate of the loss arising on default, including an estimation of recoveries based on the Group’s history of recovery rates from debt sales and expectations of how these are expected to change in the future. Recoveries exclude estimated future proceeds from VAT Bad Debt Relief. Instead VAT Bad Debt relief is recognised within the net VAT creditor in Other creditors at the point at which the receivable balance meets the agreed criteria with HMRC for VAT Bad Debt Relief to apply, generally being that a debt is over 180 days past due.
IFRS 9 ordinarily requires an entity to not only consider a loan, but also the undrawn commitment when calculating the ECL, where the exposure to credit risk cannot be limited by the ability to cancel or demand repayment. However, the guidance in IFRS 9 excludes from its scope a sales commitment, being the rights and obligations from the delivery of goods as a result of a contract with a customer within the scope of IFRS 15. Thus, a sales commitment is not considered to be a financial instrument, and therefore the impairment requirements are not applied by the Group until delivery has occurred and a receivable has been recognised, at which point the 12-month ECL will be recognised in line with the above.
FIN
AN
CIA
L S
TAT
EM
EN
TS
GO
VE
RN
AN
CE
RE
PO
RT
ST
RA
TE
GIC
RE
PO
RT
N Brown Group plc Annual Report and Accounts 2022 nbrown.co.uk 115
2 ACCOUNTING POLICIES CONTINUED SIGNIFICANT INCREASE IN CREDIT RISKA financial asset will be considered to have experienced a SICR since origination where there has been a significant increase in the lifetime PD of the asset.
Changes in behavioural risk scores (which comprise both internal data and credit bureau data) are used to assess whether there has been a significant increase in lifetime PD.
The change in behavioural risk score for which the SICR threshold is set is based on applicable back tested data that reflects the current risk to our credit customers.
Where the change in risk score since origination exceeds the threshold, the asset will be deemed to have experienced a significant increase in credit risk. The credit risk of a financial asset may improve such that when this threshold is no longer exceeded, it is no longer considered to have experienced SICR and would move back to stage 1.
IFRS 9 requires a backstop to be applied whereby a receivable that is over a certain number of days past due (30 days or more) is automatically considered to have experienced SICR. Days past due are determined by counting the number of days since the earliest elapsed payment due date in respect of which the minimum payment has not been received.
DEFINITION OF DEFAULTAt each reporting date, the Group assesses whether financial assets carried at amortised cost are in default (stage 3).
Evidence that a financial asset is in default includes the following observable data:
The account has been placed on a payment arrangement (as part of forbearance measures);
Notification of bereavement has been received; or
The receivable is 56 days or more days past due for new customers and 84 days past due for established customers.
DEFINITION OF WRITE OFFFinancial assets are written off when; there is no reasonable expectation of recovery, where enforcement activity is uneconomical, where the customer is deceased, or where it is not aligned to the Group’s recovery strategy. Any recoveries received following the sale of debts to third parties accrue to the third party purchaser, as the risk and rewards of ownership have been transferred. Where debt has not been sold but has been written off, recoveries received are recognised in the income statement.
INCORPORATION OF FORWARD-LOOKING DATAThe Group incorporates forward looking information into its measurement of expected credit loss. Separate macro-economic provisions are recognised to reflect the expected impact of future economic events on a customer’s ability to make repayments and the losses incurred given default, in addition to the core impairment provisions already recognised. This is achieved through engagement of external expert advisors to devise a central, downside and upside of potential economic scenarios and modelling expected credit losses for each scenario. Management uses the outputs from each scenario to apply a weighting of 40% central, 30% upside and 30% downside, to estimate the likelihood of each scenario occurring to derive a probability weighted estimate of expected credit loss.
The macro-economic measures used are changes in unemployment and real wage earnings and are disclosed in more detail in note 19. A significant portion of the Group’s customers are not currently in employment and therefore this segment of customers do not have a significant correlation to these or any other readily determinable economic indicators.
The future macro-economic scenario assumptions are reviewed at each reporting date and updated accordingly.
CASH AND CASH EQUIVALENTSCash and cash equivalents comprise cash on hand and demand deposits, less bank overdrafts where a right to offset exists.
FINANCIAL LIABILITIESFinancial liabilities are classified according to the substance of the contractual arrangements entered into.
TRADE AND OTHER PAYABLESTrade and other payables are recognised initially at fair value, are not interest bearing and are subsequently measured at amortised cost.
EQUITY INSTRUMENTSEquity instruments issued by the Company are recorded at the proceeds received, net of direct issue costs.
DERIVATIVE FINANCIAL INSTRUMENTSThe Group’s activities expose it to market risks of changes in foreign currency exchange rates relating to the purchase of overseas sourced products, and interest rates relating to the Group’s floating rate debt. The Group uses foreign exchange derivatives (forward contracts and options) and interest rate derivatives (swaps and caps) where appropriate to hedge these exposures. In accordance with its Treasury Policy, the Group does not use derivative financial instruments for speculative purposes.
The use of financial derivatives is governed by the Group’s policies approved by the Board of Directors, which provide written principles on the use of financial derivatives.
Derivatives are initially recognised at fair value on the date a derivative contract is entered into, and they are subsequently remeasured to their fair value at each reporting period. The accounting for subsequent changes in the fair value depends on whether the derivative is designated as a hedging instrument. The Group hedges the risk associated with highly probable forecast transactions for the purchase of inventory, and the risk associated with its finance costs linked to variable reference rates.
At inception of the hedge relationship, the Group documents the economic relationship between hedging instruments and hedged items, its risk management objective and strategy for undertaking hedge transactions. The fair value of derivative financial instruments designated in hedge relationships are disclosed in note 18.
NOTES TO THE GROUP ACCOUNTS CONTINUED
N Brown Group plc Annual Report and Accounts 2022nbrown.co.uk116
The effective portion of changes in the fair value of derivatives that are designated and qualify as cash flow hedges is recognised in the cash flow hedge reserve within equity. Any gain or loss relating to hedge ineffectiveness is recognised immediately in profit and loss. Amounts accumulated in equity are reclassified in the periods when the hedged item affects profit or loss, as follows:
Where the hedged item results in the recognition of a non-financial asset, such as the purchase of inventory, the hedging gains and losses are included within the initial cost of the asset. The deferred amounts are ultimately recognised in profit or loss as the hedged item affects profit or loss, through the cost of sales.
The gain or loss relating to the effective portion of the interest rate swaps hedging variable rate borrowings is recognised in profit or loss within the finance cost at the same time as the interest expense on the hedged borrowings.
Changes in the fair value of any derivative instrument which is not designated in a hedge accounting relationship are recognised immediately in profit or loss. Foreign currency and interest rate derivative fair values represent the estimated amount that the Group would receive or pay to terminate the derivative at the balance sheet date based on prevailing foreign currency and interest rates.
PROVISIONSThe Group recognises a provision for a present obligation (legal or constructive) resulting from a past event when it is more likely than not that it will be required to transfer economic benefits to settle the obligation and the amount of the obligation can be estimated reliably. In the cases where the amount of the obligation cannot be estimated reliably, no provision is made. Provisions are recognised at the value of management’s best estimate of the expenditure required to settle the obligation at the reporting date. Where a single obligation is being measured management determines the most likely outcome when estimating the provision.
A provision is made for customer remediation when the Group has established that a present obligation exists in respect of Financial Services products sold in the past. A provision is made for restructuring costs, including the costs of redundancy, when the Group has a constructive obligation. A constructive obligation exists when the Group has approved a detailed formal restructuring plan, and the restructuring has either commenced or has been announced publicly.
If the Group has a contract that is onerous, it recognises the present obligation under the contract as a provision, other than rental costs offset against the right-of-use asset under IFRS 16. An onerous contract is one where the unavoidable costs of meeting the Group’s contractual obligations exceed the expected economic benefits.
CONTINGENT LIABILITIES AND ASSETSContingent liabilities are possible obligations arising from past events, whose existence will be confirmed only by uncertain future events, or present obligations arising from past events that are not recognised because either an outflow of economic benefits is not probable or the amount of the obligation cannot be reliably measured. Contingent liabilities are not recognised but information about them is disclosed unless the possibility of any outflow of economic benefits in settlement is remote.
Contingent assets are possible assets that arise from past events and whose existence will be confirmed only by the occurrence or non-occurrence of one or more uncertain future events not wholly within the control of the entity. Contingent assets are not recognised but information about them is disclosed where an inflow of economic benefits is probable.
LEASE LIABILITIESAt inception of a contract, the Group assesses whether a contract is, or contains a lease. A contract is, or contains a lease if the contract conveys the right to control the use of an identified asset for a period of time in exchange for consideration. Lease terms are negotiated on an individual basis and contain a wide range of different terms and conditions. The lease agreements do not impose any covenants other than the security interests in the leased assets that are held by the lessor.
Where the Group is a lessee, it recognises a right-of-use asset and a corresponding lease liability, measured at the present value of remaining cash flows on the lease. Lease liabilities include the net present value of fixed payments less any lease incentives receivable. There are no residual value guarantees or purchase options present in any contracts entered by the Group. The lease payments are discounted using the Group’s incremental borrowing rate at transition or at the lease start date for leases entered into after transition, calculated by applying a weighting to all recent third-party financing.
Lease payments are allocated between principal and finance cost. The finance cost is charged to profit or loss over the lease period so as to produce a constant periodic rate of interest on the remaining balance of the liability for each period. The lease liability is subsequently measured at the amortised cost using the effective interest rate method. When the lease liability is remeasured, a corresponding adjustment is made to the carrying amount of the right-of-use asset, or is recorded in the income statement if the carrying amount of the right-of-use asset has been reduced to nil.
Extension and termination options are not currently included in measurement of any of the leases across the Group, as all options present in the contracts have been exercised in the past. Any new leases or renegotiated leases which the Group enters into in future containing an extension or termination option will be considered when determining the lease length with reference to management intention and historic action.
The Group applies the recognition exemption in IFRS 16 for leases with a term not exceeding 12 months and low value leases. For these leases the lease payments are recognised as an expense on a straight-line basis over the lease term.
SHARE-BASED PAYMENTSThe Group issues equity-settled share-based payments to certain employees. Equity-settled share-based payments are measured at fair value at the date of grant. The fair value determined at the grant date of the equity-settled share-based payments is expensed on a straight-line basis over the vesting period, based on the Group’s estimate of shares that will eventually vest. This is recognised as an employee expense with a corresponding increase in equity. Fair value is measured using the Monte Carlo method for incentive awards subject to a market-based performance condition and by use of a Black–Scholes model for all others. For share-based payment awards with non-vesting conditions, the grant date fair value of the share-based payment is measured to reflect such conditions and there is no true-up for differences between expected and actual outcomes.
FIN
AN
CIA
L S
TAT
EM
EN
TS
GO
VE
RN
AN
CE
RE
PO
RT
ST
RA
TE
GIC
RE
PO
RT
N Brown Group plc Annual Report and Accounts 2022 nbrown.co.uk 117
2 ACCOUNTING POLICIES CONTINUED OWN SHARES HELD BY ESOTTransactions of the Group sponsored Employee Share Ownership Trust (“ESOT”) are included in the Group financial statements. The trust’s purchases and sales of shares in the Company are debited and credited directly to equity.
RETIREMENT BENEFIT COSTSPayments to defined contribution retirement benefit schemes are charged as an expense as they fall due.
For defined benefit retirement benefit schemes, the cost of providing benefits is determined using the Projected Unit Credit Method, with actuarial valuations being carried out at the end of each reporting period. Remeasurement comprising actuarial gains and losses, the effect of the asset ceiling (if applicable) and the return on scheme assets (excluding interest) are recognised immediately in the balance sheet with a charge or credit to the statement of comprehensive income in the period in which they occur. Remeasurement recorded in the statement of comprehensive income is not recycled. Past service cost is recognised in profit or loss in the period of scheme amendment. Net interest is calculated by applying a discount rate to the net defined benefit liability or asset.
Defined benefit costs are split into three categories:
Current service cost, past service cost and gains and losses on curtailments and settlements;
Net interest expense or income; and
Remeasurement.
The Group presents the first two components of defined benefit costs within operating expenses. Curtailment gains and losses are also accounted for as a past service cost within operating expenses. Net interest expense or income is recognised within finance costs.
The retirement benefit asset recognised in the balance sheet represents the fair value of scheme assets as reduced by the present value of the defined benefit obligation. Any asset resulting from this calculation is recognised in full as the Group considers it has unconditional right to any surplus after all members’ benefits have been settled.
SUPPLIER REBATESThe Group enters into rebate arrangements with suppliers. Rebates are calculated annually based on agreements in place, which stipulate an agreed percentage of purchase be granted as a rebate. Rebates are recorded in the Income statement once agreed with suppliers, with amounts receivable recorded in accrued income on the balance sheet.
EXCEPTIONAL ITEMSExceptional items are items of income and expenditure which are one off in nature and material to the current financial year or represent true ups to items presented as exceptional in prior periods. These are presented separately in the Consolidated Income Statement, as the Directors believe that this presentation helps to avoid distortion of underlying performance.
SUPPLIER FINANCING ARRANGEMENTSThe Group has a supplier financing scheme as part of its normal course of business. This scheme is based around the principle of reverse factoring whereby the banks purchase from the suppliers approved trade debts owed by the Group, with the principal purpose being to provide the supplier with earlier access to liquidity. Access to the supplier finance scheme is by mutual agreement between the bank and supplier, where the supplier wishes to be paid faster than standard Group payment terms, the Group is not party to this contract. The scheme has no cost to the Group as the fees are paid by the supplier directly to the banks. The banks have no special seniority of claim to the Group upon liquidation and would be treated the same as any other trade payable. From the Group’s perspective, the invoice payment due date remains unchanged and the payment terms of suppliers participating in the supplier financing arrangement are similar to those suppliers that are not participating. As the scheme does not change the characteristics of the trade payable, and the Group’s obligation is not legally extinguished until the bank is repaid, the Group continues to recognise these liabilities as trade payables.
GOVERNMENT GRANTSGrants from the government are recognised at their fair value where there is a reasonable assurance that the grant will be received and the Group will comply with all attached conditions. Government grants relating to costs are recognised in profit and loss when they become receivable to match them with the already incurred staff costs with which they are intended to compensate.
GOING CONCERNAfter reviewing the Group’s forecasts and risk assessments, the Directors have formed a judgement at the time of approving the financial statements, that there is a reasonable expectation that the Group and the Company have adequate resources to continue in operational existence for the 12 months from the date of signing this Annual Report & Accounts. For this reason, the Directors continue to adopt the going concern basis in preparing the financial statements.
In arriving at their conclusion, the Directors considered the following:
a) the Group’s cash flow forecasts and revenue projections for the 12 months from the date of signing these results (the “Base Case”), reflecting, amongst other things the following assumptions:
The business continues to be fully operational in the event of any potential further developments associated with the Covid-19 pandemic, as has been the case since the outset;
Product gross margin growth is expected year on year and will be achieved through changes to product mix and, planned price increases. It is recognised that we will continue to face a highly promotional retail market, inflationary pressures and industry wide increases in freight rates and supply chain challenges;
Financial Services revenue reduces marginally as the average size of the loan book is smaller as a function of lower product sales during the pandemic;
FS gross margin reduces as the abnormally low levels of arrears and write offs stabilise following the end of Covid-19 government support and the customer expected credit loss behaviour experiences a level of stress from the inflationary pressures on our customers; and
Increases to operating costs reflecting inflationary cost base pressures and the continuation of strategic above the line brand investment, net of mitigating actions.
NOTES TO THE GROUP ACCOUNTS CONTINUED
N Brown Group plc Annual Report and Accounts 2022nbrown.co.uk118
b) the impact on trading performance of severe but plausible downside scenarios (the “Downside Case”), including:
Adverse macroeconomic conditions impacting customer behaviour;
Current inflationary pressures, supply chain pressures and unusually high freight rates having a more material impact on gross margin than the base case;
Covid-19 related absences requiring the use of contractors to fill staff shortages;
Business interruptions reducing product revenue, for example from a denial of service caused by a cyber-attack, or, delivery delays caused by driver shortages;
Exceptional cash outflow higher than the accounting provisions with regards to the ongoing legal claim with Allianz.
The Downside case also includes additional sensitivities to product revenue, customer bad debt write off, customer account payment collection rates and the cost base.
The Downside case represents the compounded impact of all the scenarios with the sensitivities layered on top. Material total accessible liquidity headroom exists of greater than £100m throughout the Downside assessment.
c) the committed facilities available to the Group and the covenants thereon. Details of the Group’s committed facilities are set out in note 17, the main components of which are:
A £400m securitisation facility committed until December 2024, drawings on which are linked to prevailing levels of eligible receivables (£305.5m drawn against an accessible £365.6m based on the maximum of eligible customer receivables at 26 February 2022);
An RCF of £100m committed until December 2023, which is fully undrawn; and
An overdraft facility of £12.5m which is subject to an annual review every July (undrawn as at date of signing of these accounts).
d) that there are no forecast breaches of any covenants in either the Base Case or Downside Case. Material headroom exists within the banking covenants and EBITDA within the base case and the downside. EBITDA would have to more than halve against the downside in FY23 to breach conditions.
e) the Group’s robust policy towards liquidity and cash flow management. As at 30 April 2022, the Group had cash of £31.8m, net of restricted cash of £3.6m and undrawn secured facilities of £69.3m. In addition, the Group had £112.5m of unsecured facilities that were not drawn. This gives rise to total accessible liquidity (“TAL”) of £210.0m (FY22: £212.1m).
f) the Group’s clear capital allocation policy that prioritises meeting its’ liabilities for day to day operations of the business over investment in delivering the strategy or distributions to shareholders.
g) the Group management’s ability to successfully manage the principal risks and uncertainties outlined on p32 to 37 during periods of uncertain economic outlook and challenging macro-economic conditions.
CRITICAL JUDGEMENTS AND KEY SOURCES OF ESTIMATION UNCERTAINTYThe significant judgements made by management in applying the Group’s accounting policies and the key sources of estimation uncertainty in these financial statements, which together are deemed critical to the Group’s results and financial position, are as follows:
IMPAIRMENT OF CUSTOMER RECEIVABLESCRITICAL JUDGEMENT AND ESTIMATION UNCERTAINTYThe allowance for expected credit losses for trade receivables involves several areas of judgement, including estimating forward-looking modelled parameters (Probability of Default (“PD”), Loss of Given Default (“LGD”) and Exposure At Default (“EAD”)), developing a range of unbiased future economic scenarios, estimating expected lives and assessing significant increases in credit risk, based on the Group’s experience of managing credit risk. Key assumptions within the IFRS9 model are covered in pages 115 to 116.
Key judgements involved in the determination of expected credit loss are:
Determining which receivables have suffered from a significant increase in credit risk;
Determining the appropriate PD to apply to the receivables;
Determining the recovery price of any receivables sold to third parties; and
Determining the impact of forward looking macroeconomic uncertainties on ECL including cost of living increases.
Where these key judgements result in a post model adjustment, these are disclosed in note 19.
The change in behavioural risk score for which the SICR threshold is set is based on applicable back tested data that reflects the current risk to our credit customers.
Where the change in risk score since origination exceeds the threshold, the asset will be deemed to have experienced a significant increase in credit risk.
Due to the Financial Services debtor book starting FY22 at artificially high-performance levels, in management’s judgement, the most appropriate time period to evaluate probability of default is to reflect observed default rates as at the end of FY22, omitting pandemic impacted performance. This is considered to provide a more representative view of defaults.
Once collection strategies are no longer appropriate or effective, management typically sell customer receivables to third parties. Therefore the estimated sales price for these balances is a key judgement. The expected recovery through debt sales built into the year end ECL reflects an average of prices achieved over the previous 2 years.
Significant uncertainty exists over the forward looking view on inflation (CPI) and subsequent impacts on real wages. In managements view, the full impact of these have yet to materialise. A post model adjustment has been applied to reflect a deterioration in customer defaults as inflationary pressures build.
FIN
AN
CIA
L S
TAT
EM
EN
TS
GO
VE
RN
AN
CE
RE
PO
RT
ST
RA
TE
GIC
RE
PO
RT
N Brown Group plc Annual Report and Accounts 2022 nbrown.co.uk 119
2 ACCOUNTING POLICIES CONTINUED SENSITIVITIES OF ESTIMATION UNCERTAINTIESTo indicate the level of estimation uncertainty, the impact on the ECL of applying different model parameters are shown below:
A 10% increase or decrease in PDs would lead to a £2.2m (2021: £1.5m) increase or decrease in the ECL;
An increase or decrease in peak CPI of 1 percentage point would lead to a £1.3m increase or £1m decrease to the ECL respectively, which reflects the non-linear impacts of economic forecasts to ECL.
SOFTWARE AND DEVELOPMENT COSTSCRITICAL JUDGEMENTIncluded within intangible assets are significant software and development project costs in respect of the Group’s technological development programme. Included in the year are development costs for the production of new or substantially improved processes or systems; development of the new website and other internal development of software and technology infrastructure. Initial capitalisation of costs is based on management’s judgement that technological feasibility is confirmed, the project will be successfully completed and that future economic benefits are expected to be generated by the project. If these criteria are not subsequently met, the asset would be subject to a future impairment charge which would impact the Group’s results.
During the year the Group has reviewed its accounting policies in line with the IFRIC guidance in regards to the treatment of configuration, customisation and implementation costs associated with Software as a Service (“SaaS”) contracts. As a result the Group has revisited spend incurred in previous financial years to align with IFRIC guidance, resulting in a change in accounting policy prior year adjustment as detailed in note 32. Significant judgement is required in determining whether the Group has control over the software, and if not whether any spend incurred in the implementation of the software results in the creation of an asset in its own right which the Group controls and satisfies the criteria of IAS 38.
ESTIMATION UNCERTAINTYThe estimated useful lives and residual values are based on management’s best estimate of the period the asset will be able to generate economic benefits for the Group and are reviewed at the end of each reporting period, with the effect of any changes in estimate accounted for on a prospective basis from the date at which a change in life is determined to be triggered. Sensitivity of the estimation uncertainty is disclosed in note 12.
IMPAIRMENT OF NON-FINANCIAL ASSETSCRITICAL JUDGEMENT AND ESTIMATION UNCERTAINTY Impairment exists when the carrying value of an asset or cash-generating unit exceeds its recoverable amount, which is the higher of its fair value less costs of disposal and its value in use. The value in use calculation is based on a discounted cash flow model. The cash flows are derived from the Group’s three-year forecasts, taken into perpetuity, and are adjusted to exclude restructuring activities that the Group is not yet committed to or significant future investments that will enhance the performance of the assets of the CGU being tested.
The recoverable amount is sensitive to the discount rate used as well as the expected future cash flows. The key assumptions used to determine the recoverable amount for the Group’s non-financial assets, including a sensitivity analysis, are disclosed and further explained in note 12.
ALLIANZ LITIGATIONCRITICAL JUDGEMENT AND ESTIMATION UNCERTAINTYDuring the current year, the group has recorded a charge in the year for legal costs of £1.8m and a provision of £28.0m, in relation to the ongoing legal dispute with Allianz Insurance plc, as an estimate for accounting purposes of the potential costs of settlement or award and future legal costs.
The Group is of the view that, should the matter proceed to trial, which is currently listed to commence in June 2023, the Court will determine the outcome on a net basis taking into account the merits of the parties’ claims and counterclaims, and the liabilities already borne by them. The Group is also of the view that the net basis would apply in any negotiated settlement. Accordingly, the Group’s assessment of the present obligation has been determined on a net basis.
Given the nature of the issues in dispute, the Court will have considerable discretion in reaching its conclusions relating to, amongst other things, which sums should be brought into account and what proportions of the liabilities each party should have to bear. Accordingly, the range of potential outcomes, in either direction, could be many times materiality and involves a significant level of estimation.
Our accounting estimate is based upon the assumption that the parties reach a settlement within FY23, however if the matter progresses to trial any cashflows resulting from the claim and/or counterclaim may not arise until FY24.
Details on the background to the dispute and the basis of the provision established in the year are set out in note 22.
DEFINED BENEFIT PLANESTIMATION UNCERTAINTYThe cost of the defined benefit pension plan and the present value of the pension obligation are determined using actuarial valuations. An actuarial valuation involves making various assumptions that may differ from actual developments in the future. These include the determination of the discount rate, future salary increases, mortality rates and future pension increases. Due to the complexities involved in the valuation and its long-term nature, a defined benefit obligation is highly sensitive to changes in these assumptions. Sensitivities performed on key assumptions are discussed in note 29. All assumptions are reviewed at each reporting date.
NOTES TO THE GROUP ACCOUNTS CONTINUED
N Brown Group plc Annual Report and Accounts 2022nbrown.co.uk120
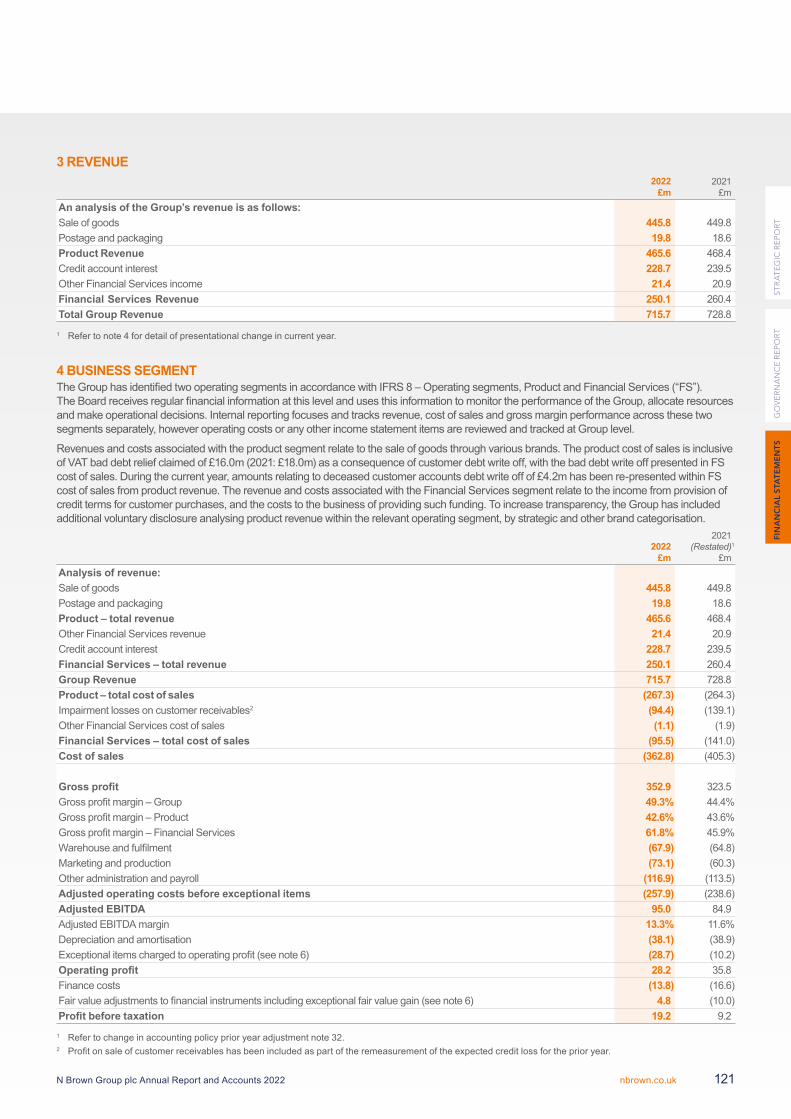
3 REVENUE2022
£m2021
£mAn analysis of the Group’s revenue is as follows:Sale of goods 445.8 449.8Postage and packaging 19.8 18.6Product Revenue 465.6 468.4Credit account interest 228.7 239.5Other Financial Services income 21.4 20.9Financial Services Revenue 250.1 260.4Total Group Revenue 715.7 728.8
1 Refer to note 4 for detail of presentational change in current year.
4 BUSINESS SEGMENTThe Group has identified two operating segments in accordance with IFRS 8 – Operating segments, Product and Financial Services (“FS”). The Board receives regular financial information at this level and uses this information to monitor the performance of the Group, allocate resources and make operational decisions. Internal reporting focuses and tracks revenue, cost of sales and gross margin performance across these two segments separately, however operating costs or any other income statement items are reviewed and tracked at Group level.
Revenues and costs associated with the product segment relate to the sale of goods through various brands. The product cost of sales is inclusive of VAT bad debt relief claimed of £16.0m (2021: £18.0m) as a consequence of customer debt write off, with the bad debt write off presented in FS cost of sales. During the current year, amounts relating to deceased customer accounts debt write off of £4.2m has been re-presented within FS cost of sales from product revenue. The revenue and costs associated with the Financial Services segment relate to the income from provision of credit terms for customer purchases, and the costs to the business of providing such funding. To increase transparency, the Group has included additional voluntary disclosure analysing product revenue within the relevant operating segment, by strategic and other brand categorisation.
2022£m
2021(Restated)1
£mAnalysis of revenue:Sale of goods 445.8 449.8Postage and packaging 19.8 18.6Product – total revenue 465.6 468.4Other Financial Services revenue 21.4 20.9Credit account interest 228.7 239.5Financial Services – total revenue 250.1 260.4Group Revenue 715.7 728.8Product – total cost of sales (267.3) (264.3)Impairment losses on customer receivables2 (94.4) (139.1)Other Financial Services cost of sales (1.1) (1.9)Financial Services – total cost of sales (95.5) (141.0)Cost of sales (362.8) (405.3)
Gross profit 352.9 323.5Gross profit margin – Group 49.3% 44.4%Gross profit margin – Product 42.6% 43.6%Gross profit margin – Financial Services 61.8% 45.9%Warehouse and fulfilment (67.9) (64.8)Marketing and production (73.1) (60.3)Other administration and payroll (116.9) (113.5)Adjusted operating costs before exceptional items (257.9) (238.6)Adjusted EBITDA 95.0 84.9Adjusted EBITDA margin 13.3% 11.6%Depreciation and amortisation (38.1) (38.9)Exceptional items charged to operating profit (see note 6) (28.7) (10.2)Operating profit 28.2 35.8Finance costs (13.8) (16.6)Fair value adjustments to financial instruments including exceptional fair value gain (see note 6) 4.8 (10.0)Profit before taxation 19.2 9.2
1 Refer to change in accounting policy prior year adjustment note 32.2 Profit on sale of customer receivables has been included as part of the remeasurement of the expected credit loss for the prior year.
FIN
AN
CIA
L S
TAT
EM
EN
TS
GO
VE
RN
AN
CE
RE
PO
RT
ST
RA
TE
GIC
RE
PO
RT
N Brown Group plc Annual Report and Accounts 2022 nbrown.co.uk 121
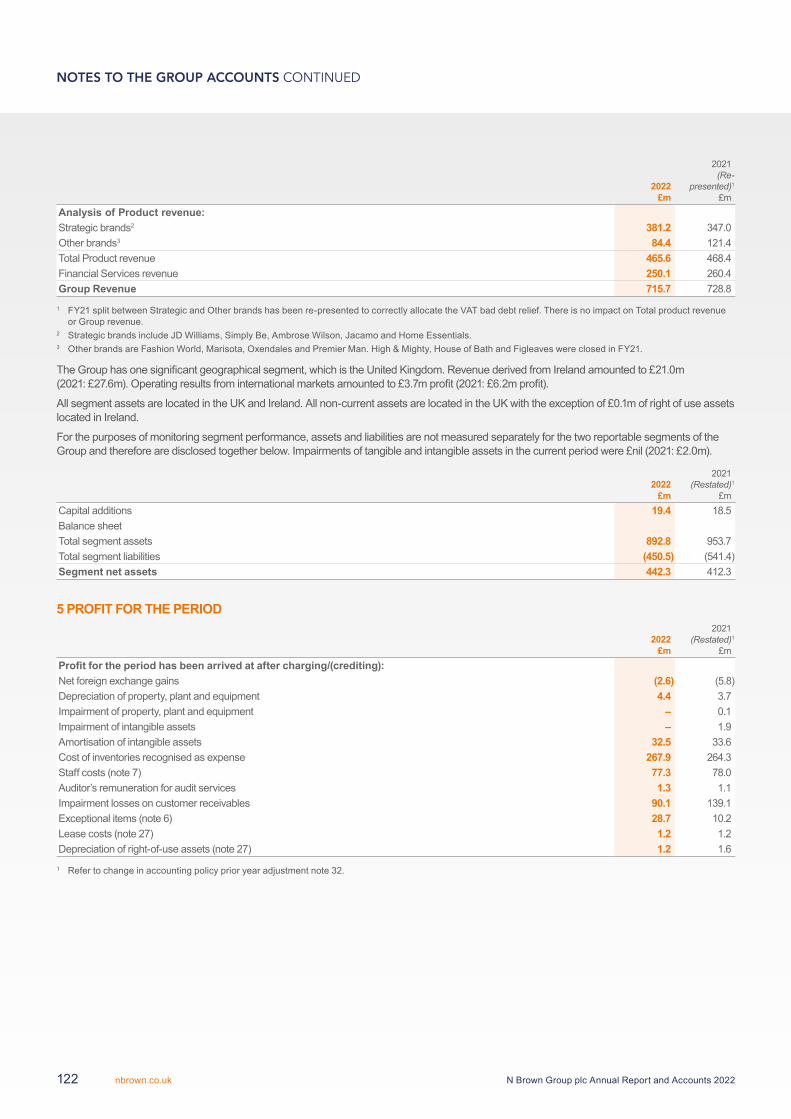
2022 £m
2021(Re-
presented)1
£mAnalysis of Product revenue:Strategic brands2 381.2 347.0Other brands3 84.4 121.4Total Product revenue 465.6 468.4Financial Services revenue 250.1 260.4Group Revenue 715.7 728.8
1 FY21 split between Strategic and Other brands has been re-presented to correctly allocate the VAT bad debt relief. There is no impact on Total product revenue or Group revenue.
2 Strategic brands include JD Williams, Simply Be, Ambrose Wilson, Jacamo and Home Essentials.3 Other brands are Fashion World, Marisota, Oxendales and Premier Man. High & Mighty, House of Bath and Figleaves were closed in FY21.
The Group has one significant geographical segment, which is the United Kingdom. Revenue derived from Ireland amounted to £21.0m (2021: £27.6m). Operating results from international markets amounted to £3.7m profit (2021: £6.2m profit).
All segment assets are located in the UK and Ireland. All non-current assets are located in the UK with the exception of £0.1m of right of use assets located in Ireland.
For the purposes of monitoring segment performance, assets and liabilities are not measured separately for the two reportable segments of the Group and therefore are disclosed together below. Impairments of tangible and intangible assets in the current period were £nil (2021: £2.0m).
2022£m
2021(Restated)1
£mCapital additions 19.4 18.5Balance sheetTotal segment assets 892.8 953.7Total segment liabilities (450.5) (541.4)Segment net assets 442.3 412.3
5 PROFIT FOR THE PERIOD
2022£m
2021(Restated)1
£mProfit for the period has been arrived at after charging/(crediting):Net foreign exchange gains (2.6) (5.8)Depreciation of property, plant and equipment 4.4 3.7Impairment of property, plant and equipment – 0.1Impairment of intangible assets – 1.9Amortisation of intangible assets 32.5 33.6Cost of inventories recognised as expense 267.9 264.3Staff costs (note 7) 77.3 78.0Auditor’s remuneration for audit services 1.3 1.1Impairment losses on customer receivables 90.1 139.1Exceptional items (note 6) 28.7 10.2Lease costs (note 27) 1.2 1.2Depreciation of right-of-use assets (note 27) 1.2 1.6
1 Refer to change in accounting policy prior year adjustment note 32.
NOTES TO THE GROUP ACCOUNTS CONTINUED
N Brown Group plc Annual Report and Accounts 2022nbrown.co.uk122
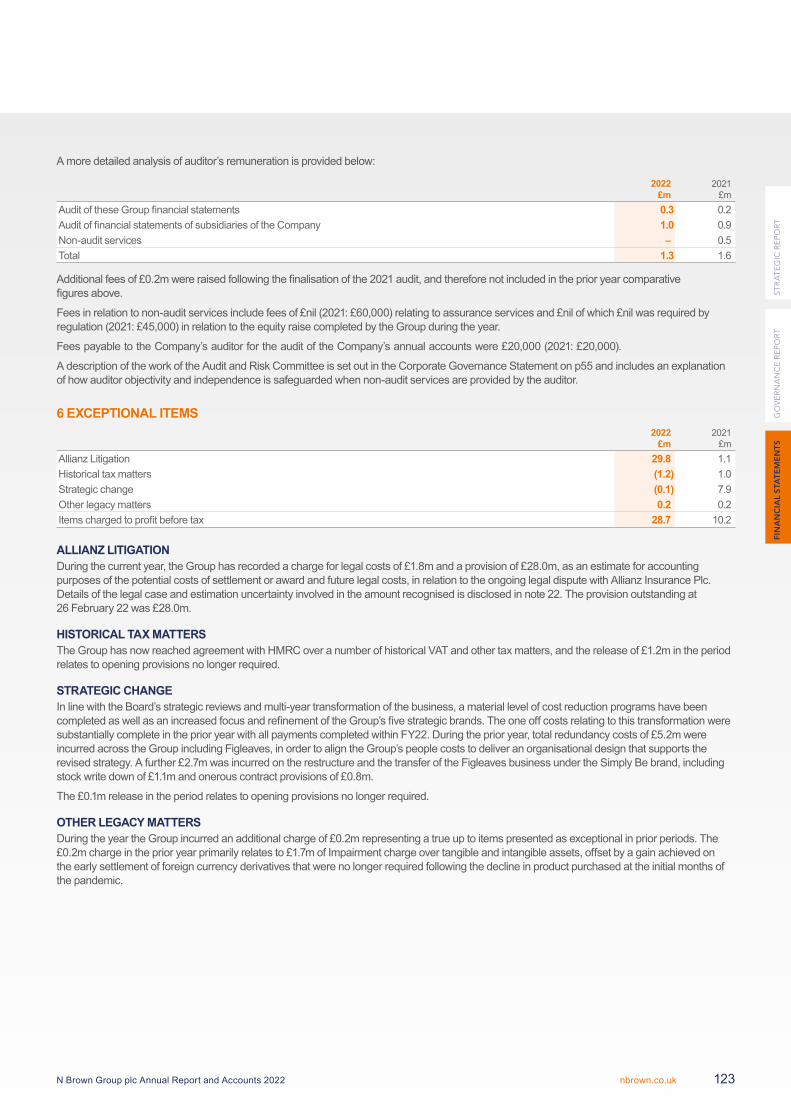
A more detailed analysis of auditor’s remuneration is provided below:
2022£m
2021£m
Audit of these Group financial statements 0.3 0.2Audit of financial statements of subsidiaries of the Company 1.0 0.9Non-audit services – 0.5Total 1.3 1.6
Additional fees of £0.2m were raised following the finalisation of the 2021 audit, and therefore not included in the prior year comparative figures above.
Fees in relation to non-audit services include fees of £nil (2021: £60,000) relating to assurance services and £nil of which £nil was required by regulation (2021: £45,000) in relation to the equity raise completed by the Group during the year.
Fees payable to the Company’s auditor for the audit of the Company’s annual accounts were £20,000 (2021: £20,000).
A description of the work of the Audit and Risk Committee is set out in the Corporate Governance Statement on p55 and includes an explanation of how auditor objectivity and independence is safeguarded when non-audit services are provided by the auditor.
6 EXCEPTIONAL ITEMS2022
£m2021
£mAllianz Litigation 29.8 1.1Historical tax matters (1.2) 1.0Strategic change (0.1) 7.9Other legacy matters 0.2 0.2Items charged to profit before tax 28.7 10.2
ALLIANZ LITIGATIONDuring the current year, the Group has recorded a charge for legal costs of £1.8m and a provision of £28.0m, as an estimate for accounting purposes of the potential costs of settlement or award and future legal costs, in relation to the ongoing legal dispute with Allianz Insurance Plc. Details of the legal case and estimation uncertainty involved in the amount recognised is disclosed in note 22. The provision outstanding at 26 February 22 was £28.0m.
HISTORICAL TAX MATTERSThe Group has now reached agreement with HMRC over a number of historical VAT and other tax matters, and the release of £1.2m in the period relates to opening provisions no longer required.
STRATEGIC CHANGEIn line with the Board’s strategic reviews and multi-year transformation of the business, a material level of cost reduction programs have been completed as well as an increased focus and refinement of the Group’s five strategic brands. The one off costs relating to this transformation were substantially complete in the prior year with all payments completed within FY22. During the prior year, total redundancy costs of £5.2m were incurred across the Group including Figleaves, in order to align the Group’s people costs to deliver an organisational design that supports the revised strategy. A further £2.7m was incurred on the restructure and the transfer of the Figleaves business under the Simply Be brand, including stock write down of £1.1m and onerous contract provisions of £0.8m.
The £0.1m release in the period relates to opening provisions no longer required.
OTHER LEGACY MATTERSDuring the year the Group incurred an additional charge of £0.2m representing a true up to items presented as exceptional in prior periods. The £0.2m charge in the prior year primarily relates to £1.7m of Impairment charge over tangible and intangible assets, offset by a gain achieved on the early settlement of foreign currency derivatives that were no longer required following the decline in product purchased at the initial months of the pandemic.
FIN
AN
CIA
L S
TAT
EM
EN
TS
GO
VE
RN
AN
CE
RE
PO
RT
ST
RA
TE
GIC
RE
PO
RT
N Brown Group plc Annual Report and Accounts 2022 nbrown.co.uk 123
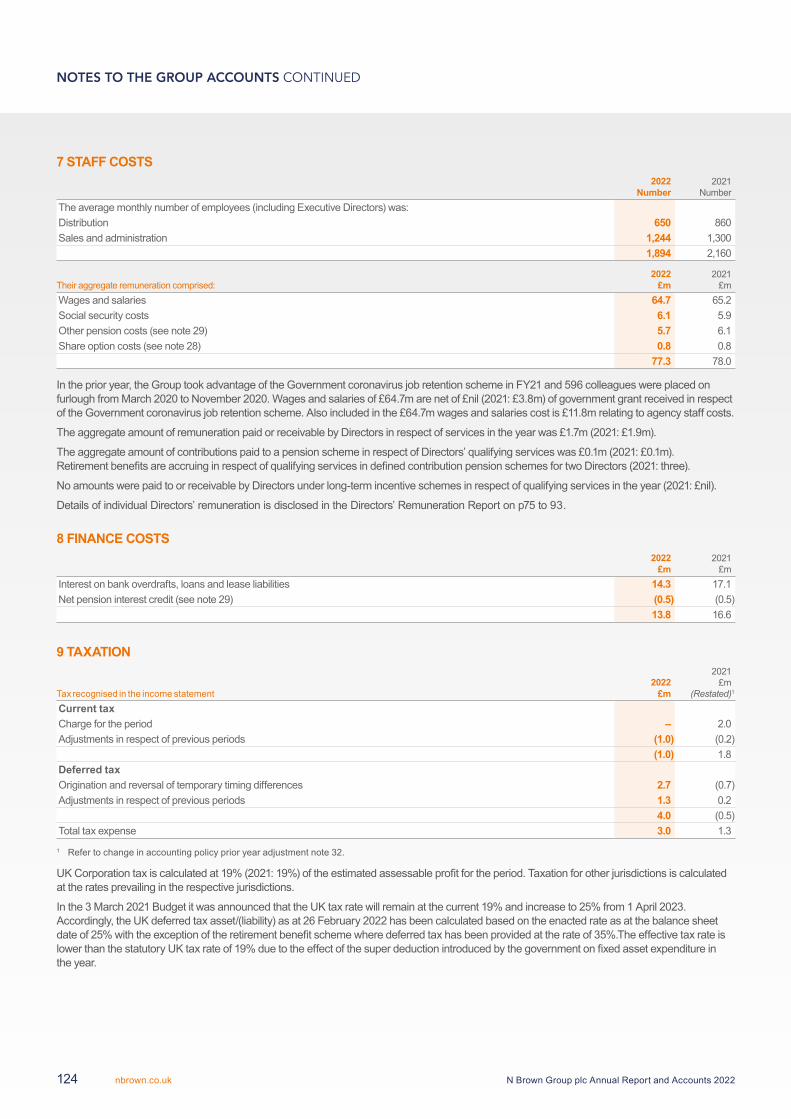
7 STAFF COSTS2022
Number2021
NumberThe average monthly number of employees (including Executive Directors) was:Distribution 650 860Sales and administration 1,244 1,300
1,894 2,160
Their aggregate remuneration comprised:2022
£m2021
£mWages and salaries 64.7 65.2Social security costs 6.1 5.9Other pension costs (see note 29) 5.7 6.1Share option costs (see note 28) 0.8 0.8
77.3 78.0
In the prior year, the Group took advantage of the Government coronavirus job retention scheme in FY21 and 596 colleagues were placed on furlough from March 2020 to November 2020. Wages and salaries of £64.7m are net of £nil (2021: £3.8m) of government grant received in respect of the Government coronavirus job retention scheme. Also included in the £64.7m wages and salaries cost is £11.8m relating to agency staff costs.
The aggregate amount of remuneration paid or receivable by Directors in respect of services in the year was £1.7m (2021: £1.9m).
The aggregate amount of contributions paid to a pension scheme in respect of Directors’ qualifying services was £0.1m (2021: £0.1m). Retirement benefits are accruing in respect of qualifying services in defined contribution pension schemes for two Directors (2021: three).
No amounts were paid to or receivable by Directors under long-term incentive schemes in respect of qualifying services in the year (2021: £nil).
Details of individual Directors’ remuneration is disclosed in the Directors’ Remuneration Report on p75 to 93.
8 FINANCE COSTS2022
£m2021
£mInterest on bank overdrafts, loans and lease liabilities 14.3 17.1Net pension interest credit (see note 29) (0.5) (0.5)
13.8 16.6
9 TAXATION
Tax recognised in the income statement2022
£m
2021£m
(Restated)1
Current taxCharge for the period – 2.0Adjustments in respect of previous periods (1.0) (0.2)
(1.0) 1.8Deferred taxOrigination and reversal of temporary timing differences 2.7 (0.7)Adjustments in respect of previous periods 1.3 0.2
4.0 (0.5)Total tax expense 3.0 1.3
1 Refer to change in accounting policy prior year adjustment note 32.
UK Corporation tax is calculated at 19% (2021: 19%) of the estimated assessable profit for the period. Taxation for other jurisdictions is calculated at the rates prevailing in the respective jurisdictions.
In the 3 March 2021 Budget it was announced that the UK tax rate will remain at the current 19% and increase to 25% from 1 April 2023. Accordingly, the UK deferred tax asset/(liability) as at 26 February 2022 has been calculated based on the enacted rate as at the balance sheet date of 25% with the exception of the retirement benefit scheme where deferred tax has been provided at the rate of 35%.The effective tax rate is lower than the statutory UK tax rate of 19% due to the effect of the super deduction introduced by the government on fixed asset expenditure in the year.
NOTES TO THE GROUP ACCOUNTS CONTINUED
N Brown Group plc Annual Report and Accounts 2022nbrown.co.uk124
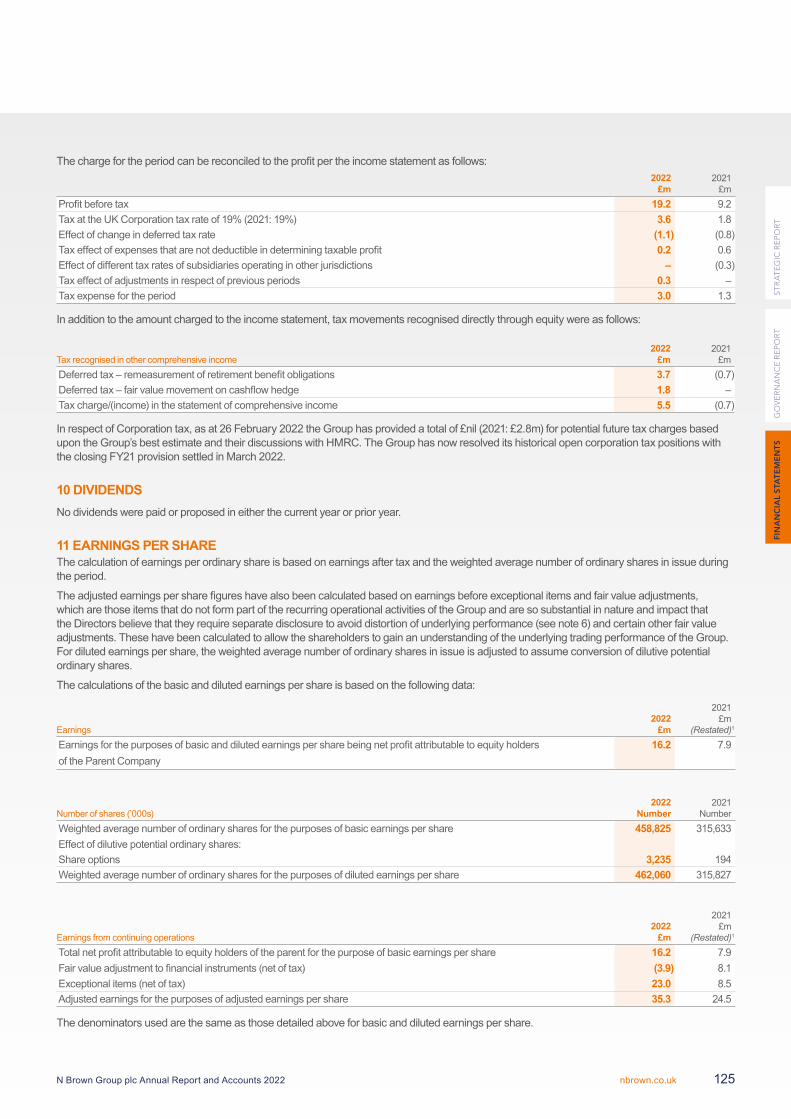
The charge for the period can be reconciled to the profit per the income statement as follows:2022
£m2021
£mProfit before tax 19.2 9.2Tax at the UK Corporation tax rate of 19% (2021: 19%) 3.6 1.8Effect of change in deferred tax rate (1.1) (0.8)Tax effect of expenses that are not deductible in determining taxable profit 0.2 0.6Effect of different tax rates of subsidiaries operating in other jurisdictions – (0.3)Tax effect of adjustments in respect of previous periods 0.3 –Tax expense for the period 3.0 1.3
In addition to the amount charged to the income statement, tax movements recognised directly through equity were as follows:
Tax recognised in other comprehensive income2022
£m2021
£mDeferred tax – remeasurement of retirement benefit obligations 3.7 (0.7)Deferred tax – fair value movement on cashflow hedge 1.8 –Tax charge/(income) in the statement of comprehensive income 5.5 (0.7)
In respect of Corporation tax, as at 26 February 2022 the Group has provided a total of £nil (2021: £2.8m) for potential future tax charges based upon the Group’s best estimate and their discussions with HMRC. The Group has now resolved its historical open corporation tax positions with the closing FY21 provision settled in March 2022.
10 DIVIDENDSNo dividends were paid or proposed in either the current year or prior year.
11 EARNINGS PER SHAREThe calculation of earnings per ordinary share is based on earnings after tax and the weighted average number of ordinary shares in issue during the period.
The adjusted earnings per share figures have also been calculated based on earnings before exceptional items and fair value adjustments, which are those items that do not form part of the recurring operational activities of the Group and are so substantial in nature and impact that the Directors believe that they require separate disclosure to avoid distortion of underlying performance (see note 6) and certain other fair value adjustments. These have been calculated to allow the shareholders to gain an understanding of the underlying trading performance of the Group. For diluted earnings per share, the weighted average number of ordinary shares in issue is adjusted to assume conversion of dilutive potential ordinary shares.
The calculations of the basic and diluted earnings per share is based on the following data:
Earnings2022
£m
2021£m
(Restated)1
Earnings for the purposes of basic and diluted earnings per share being net profit attributable to equity holders 16.2 7.9of the Parent Company
Number of shares (’000s)2022
Number2021
NumberWeighted average number of ordinary shares for the purposes of basic earnings per share 458,825 315,633Effect of dilutive potential ordinary shares:Share options 3,235 194Weighted average number of ordinary shares for the purposes of diluted earnings per share 462,060 315,827
Earnings from continuing operations2022
£m
2021£m
(Restated)1
Total net profit attributable to equity holders of the parent for the purpose of basic earnings per share 16.2 7.9Fair value adjustment to financial instruments (net of tax) (3.9) 8.1Exceptional items (net of tax) 23.0 8.5Adjusted earnings for the purposes of adjusted earnings per share 35.3 24.5
The denominators used are the same as those detailed above for basic and diluted earnings per share.
FIN
AN
CIA
L S
TAT
EM
EN
TS
GO
VE
RN
AN
CE
RE
PO
RT
ST
RA
TE
GIC
RE
PO
RT
N Brown Group plc Annual Report and Accounts 2022 nbrown.co.uk 125
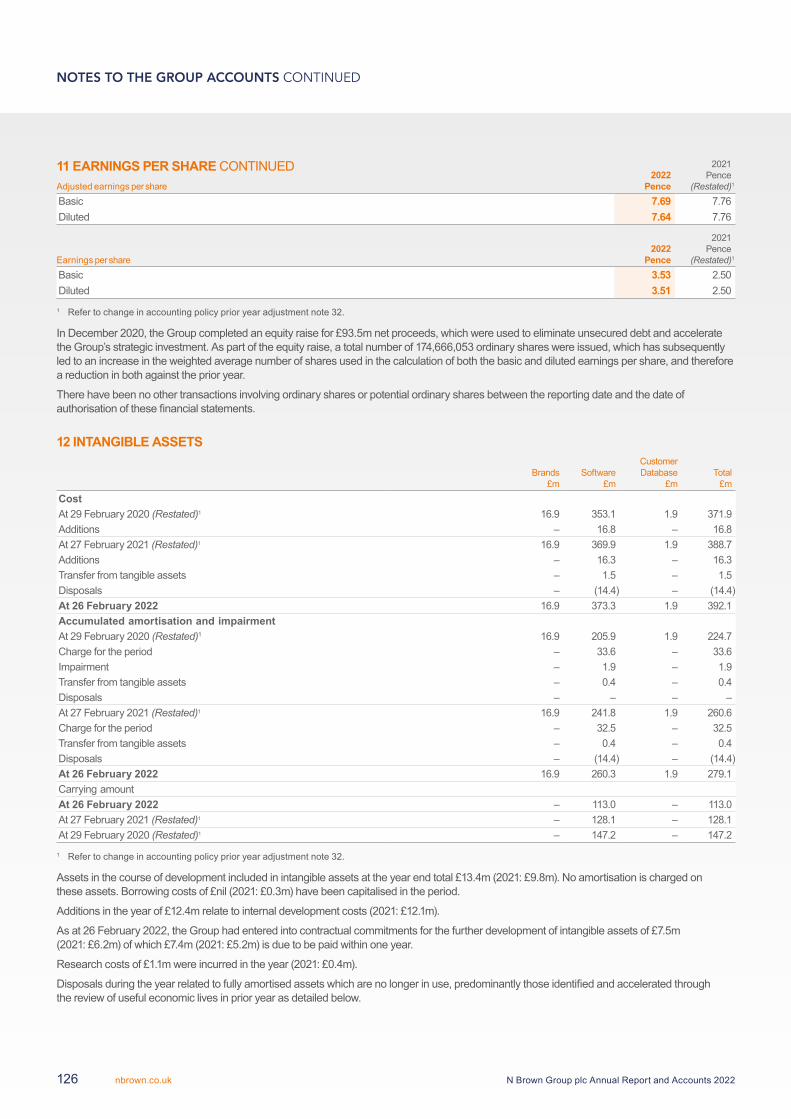
11 EARNINGS PER SHARE CONTINUEDAdjusted earnings per share
2022Pence
2021Pence
(Restated)1
Basic 7.69 7.76Diluted 7.64 7.76
Earnings per share2022
Pence
2021Pence
(Restated)1
Basic 3.53 2.50Diluted 3.51 2.50
1 Refer to change in accounting policy prior year adjustment note 32.
In December 2020, the Group completed an equity raise for £93.5m net proceeds, which were used to eliminate unsecured debt and accelerate the Group’s strategic investment. As part of the equity raise, a total number of 174,666,053 ordinary shares were issued, which has subsequently led to an increase in the weighted average number of shares used in the calculation of both the basic and diluted earnings per share, and therefore a reduction in both against the prior year.
There have been no other transactions involving ordinary shares or potential ordinary shares between the reporting date and the date of authorisation of these financial statements.
12 INTANGIBLE ASSETS
Brands£m
Software£m
Customer Database
£mTotal
£mCostAt 29 February 2020 (Restated)1 16.9 353.1 1.9 371.9Additions – 16.8 – 16.8At 27 February 2021 (Restated)1 16.9 369.9 1.9 388.7Additions – 16.3 – 16.3Transfer from tangible assets – 1.5 – 1.5Disposals – (14.4) – (14.4)At 26 February 2022 16.9 373.3 1.9 392.1Accumulated amortisation and impairmentAt 29 February 2020 (Restated)1 16.9 205.9 1.9 224.7Charge for the period – 33.6 – 33.6Impairment – 1.9 – 1.9Transfer from tangible assets – 0.4 – 0.4Disposals – – – –At 27 February 2021 (Restated)1 16.9 241.8 1.9 260.6Charge for the period – 32.5 – 32.5Transfer from tangible assets – 0.4 – 0.4Disposals – (14.4) – (14.4)At 26 February 2022 16.9 260.3 1.9 279.1Carrying amountAt 26 February 2022 – 113.0 – 113.0At 27 February 2021 (Restated)1 – 128.1 – 128.1At 29 February 2020 (Restated)1 – 147.2 – 147.2
1 Refer to change in accounting policy prior year adjustment note 32.
Assets in the course of development included in intangible assets at the year end total £13.4m (2021: £9.8m). No amortisation is charged on these assets. Borrowing costs of £nil (2021: £0.3m) have been capitalised in the period.
Additions in the year of £12.4m relate to internal development costs (2021: £12.1m).
As at 26 February 2022, the Group had entered into contractual commitments for the further development of intangible assets of £7.5m (2021: £6.2m) of which £7.4m (2021: £5.2m) is due to be paid within one year.
Research costs of £1.1m were incurred in the year (2021: £0.4m).
Disposals during the year related to fully amortised assets which are no longer in use, predominantly those identified and accelerated through the review of useful economic lives in prior year as detailed below.
NOTES TO THE GROUP ACCOUNTS CONTINUED
N Brown Group plc Annual Report and Accounts 2022nbrown.co.uk126
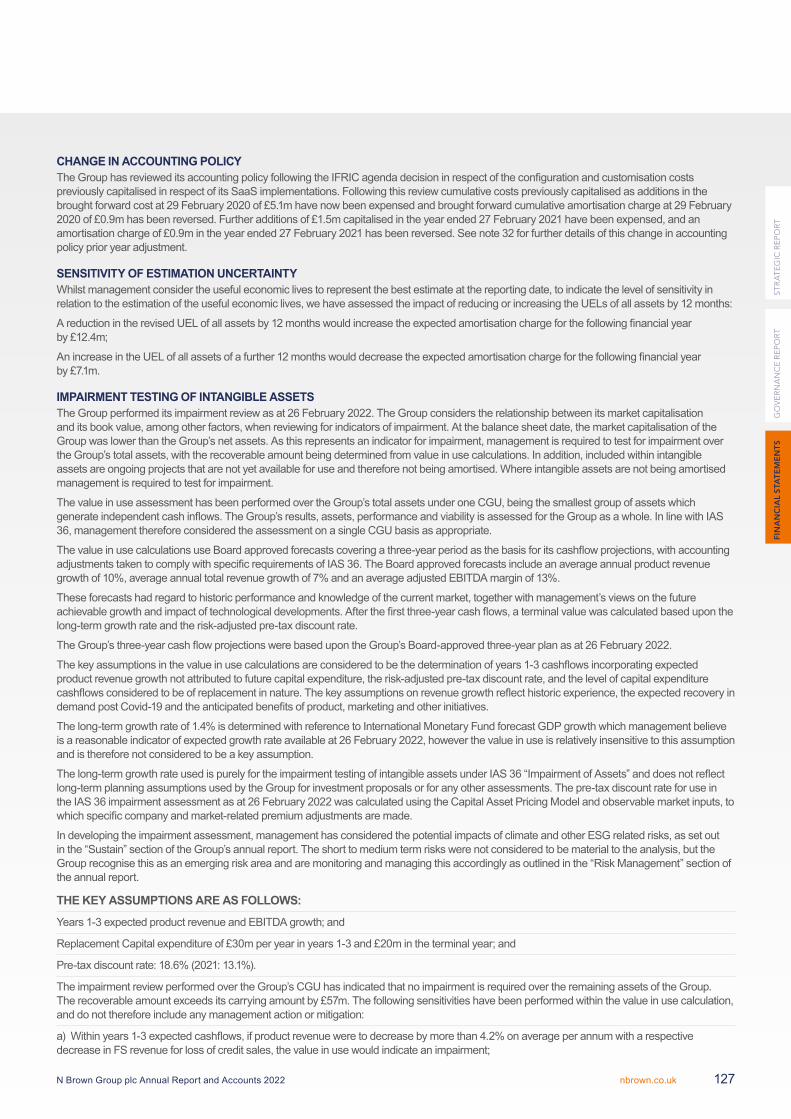
CHANGE IN ACCOUNTING POLICYThe Group has reviewed its accounting policy following the IFRIC agenda decision in respect of the configuration and customisation costs previously capitalised in respect of its SaaS implementations. Following this review cumulative costs previously capitalised as additions in the brought forward cost at 29 February 2020 of £5.1m have now been expensed and brought forward cumulative amortisation charge at 29 February 2020 of £0.9m has been reversed. Further additions of £1.5m capitalised in the year ended 27 February 2021 have been expensed, and an amortisation charge of £0.9m in the year ended 27 February 2021 has been reversed. See note 32 for further details of this change in accounting policy prior year adjustment.
SENSITIVITY OF ESTIMATION UNCERTAINTYWhilst management consider the useful economic lives to represent the best estimate at the reporting date, to indicate the level of sensitivity in relation to the estimation of the useful economic lives, we have assessed the impact of reducing or increasing the UELs of all assets by 12 months:
A reduction in the revised UEL of all assets by 12 months would increase the expected amortisation charge for the following financial year by £12.4m;
An increase in the UEL of all assets of a further 12 months would decrease the expected amortisation charge for the following financial year by £7.1m.
IMPAIRMENT TESTING OF INTANGIBLE ASSETSThe Group performed its impairment review as at 26 February 2022. The Group considers the relationship between its market capitalisation and its book value, among other factors, when reviewing for indicators of impairment. At the balance sheet date, the market capitalisation of the Group was lower than the Group’s net assets. As this represents an indicator for impairment, management is required to test for impairment over the Group’s total assets, with the recoverable amount being determined from value in use calculations. In addition, included within intangible assets are ongoing projects that are not yet available for use and therefore not being amortised. Where intangible assets are not being amortised management is required to test for impairment.
The value in use assessment has been performed over the Group’s total assets under one CGU, being the smallest group of assets which generate independent cash inflows. The Group’s results, assets, performance and viability is assessed for the Group as a whole. In line with IAS 36, management therefore considered the assessment on a single CGU basis as appropriate.
The value in use calculations use Board approved forecasts covering a three-year period as the basis for its cashflow projections, with accounting adjustments taken to comply with specific requirements of IAS 36. The Board approved forecasts include an average annual product revenue growth of 10%, average annual total revenue growth of 7% and an average adjusted EBITDA margin of 13%.
These forecasts had regard to historic performance and knowledge of the current market, together with management’s views on the future achievable growth and impact of technological developments. After the first three-year cash flows, a terminal value was calculated based upon the long-term growth rate and the risk-adjusted pre-tax discount rate.
The Group’s three-year cash flow projections were based upon the Group’s Board-approved three-year plan as at 26 February 2022.
The key assumptions in the value in use calculations are considered to be the determination of years 1-3 cashflows incorporating expected product revenue growth not attributed to future capital expenditure, the risk-adjusted pre-tax discount rate, and the level of capital expenditure cashflows considered to be of replacement in nature. The key assumptions on revenue growth reflect historic experience, the expected recovery in demand post Covid-19 and the anticipated benefits of product, marketing and other initiatives.
The long-term growth rate of 1.4% is determined with reference to International Monetary Fund forecast GDP growth which management believe is a reasonable indicator of expected growth rate available at 26 February 2022, however the value in use is relatively insensitive to this assumption and is therefore not considered to be a key assumption.
The long-term growth rate used is purely for the impairment testing of intangible assets under IAS 36 “Impairment of Assets” and does not reflect long-term planning assumptions used by the Group for investment proposals or for any other assessments. The pre-tax discount rate for use in the IAS 36 impairment assessment as at 26 February 2022 was calculated using the Capital Asset Pricing Model and observable market inputs, to which specific company and market-related premium adjustments are made.
In developing the impairment assessment, management has considered the potential impacts of climate and other ESG related risks, as set out in the “Sustain” section of the Group’s annual report. The short to medium term risks were not considered to be material to the analysis, but the Group recognise this as an emerging risk area and are monitoring and managing this accordingly as outlined in the “Risk Management” section of the annual report.
THE KEY ASSUMPTIONS ARE AS FOLLOWS:
Years 1-3 expected product revenue and EBITDA growth; and
Replacement Capital expenditure of £30m per year in years 1-3 and £20m in the terminal year; and
Pre-tax discount rate: 18.6% (2021: 13.1%).
The impairment review performed over the Group’s CGU has indicated that no impairment is required over the remaining assets of the Group. The recoverable amount exceeds its carrying amount by £57m. The following sensitivities have been performed within the value in use calculation, and do not therefore include any management action or mitigation:
a) Within years 1-3 expected cashflows, if product revenue were to decrease by more than 4.2% on average per annum with a respective decrease in FS revenue for loss of credit sales, the value in use would indicate an impairment;
FIN
AN
CIA
L S
TAT
EM
EN
TS
GO
VE
RN
AN
CE
RE
PO
RT
ST
RA
TE
GIC
RE
PO
RT
N Brown Group plc Annual Report and Accounts 2022 nbrown.co.uk 127
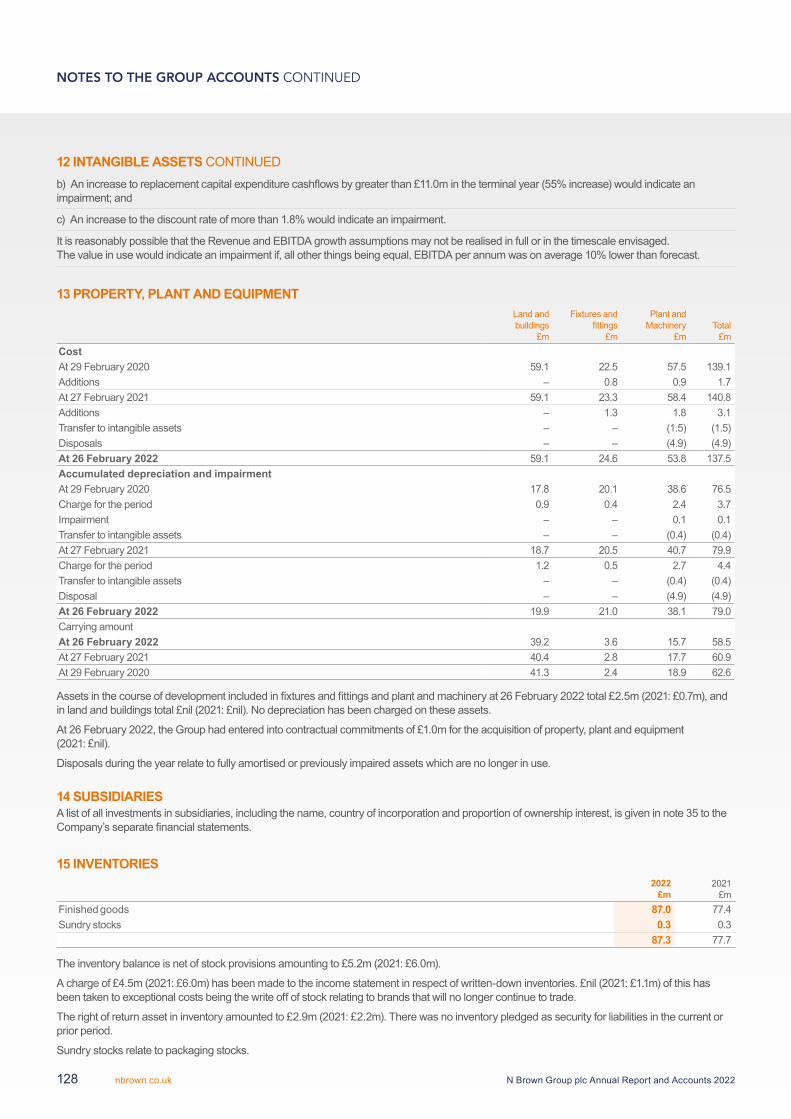
12 INTANGIBLE ASSETS CONTINUEDb) An increase to replacement capital expenditure cashflows by greater than £11.0m in the terminal year (55% increase) would indicate an impairment; and
c) An increase to the discount rate of more than 1.8% would indicate an impairment.
It is reasonably possible that the Revenue and EBITDA growth assumptions may not be realised in full or in the timescale envisaged. The value in use would indicate an impairment if, all other things being equal, EBITDA per annum was on average 10% lower than forecast.
13 PROPERTY, PLANT AND EQUIPMENTLand and buildings
£m
Fixtures and fittings
£m
Plant and Machinery
£mTotal
£mCostAt 29 February 2020 59.1 22.5 57.5 139.1Additions – 0.8 0.9 1.7At 27 February 2021 59.1 23.3 58.4 140.8Additions – 1.3 1.8 3.1Transfer to intangible assets – – (1.5) (1.5)Disposals – – (4.9) (4.9)At 26 February 2022 59.1 24.6 53.8 137.5Accumulated depreciation and impairmentAt 29 February 2020 17.8 20.1 38.6 76.5Charge for the period 0.9 0.4 2.4 3.7Impairment – – 0.1 0.1Transfer to intangible assets – – (0.4) (0.4)At 27 February 2021 18.7 20.5 40.7 79.9Charge for the period 1.2 0.5 2.7 4.4Transfer to intangible assets – – (0.4) (0.4)Disposal – – (4.9) (4.9)At 26 February 2022 19.9 21.0 38.1 79.0Carrying amountAt 26 February 2022 39.2 3.6 15.7 58.5At 27 February 2021 40.4 2.8 17.7 60.9At 29 February 2020 41.3 2.4 18.9 62.6
Assets in the course of development included in fixtures and fittings and plant and machinery at 26 February 2022 total £2.5m (2021: £0.7m), and in land and buildings total £nil (2021: £nil). No depreciation has been charged on these assets.
At 26 February 2022, the Group had entered into contractual commitments of £1.0m for the acquisition of property, plant and equipment (2021: £nil).
Disposals during the year relate to fully amortised or previously impaired assets which are no longer in use.
14 SUBSIDIARIESA list of all investments in subsidiaries, including the name, country of incorporation and proportion of ownership interest, is given in note 35 to the Company’s separate financial statements.
15 INVENTORIES2022
£m2021
£mFinished goods 87.0 77.4Sundry stocks 0.3 0.3
87.3 77.7
The inventory balance is net of stock provisions amounting to £5.2m (2021: £6.0m).
A charge of £4.5m (2021: £6.0m) has been made to the income statement in respect of written-down inventories. £nil (2021: £1.1m) of this has been taken to exceptional costs being the write off of stock relating to brands that will no longer continue to trade.
The right of return asset in inventory amounted to £2.9m (2021: £2.2m). There was no inventory pledged as security for liabilities in the current or prior period.
Sundry stocks relate to packaging stocks.
NOTES TO THE GROUP ACCOUNTS CONTINUED
N Brown Group plc Annual Report and Accounts 2022nbrown.co.uk128
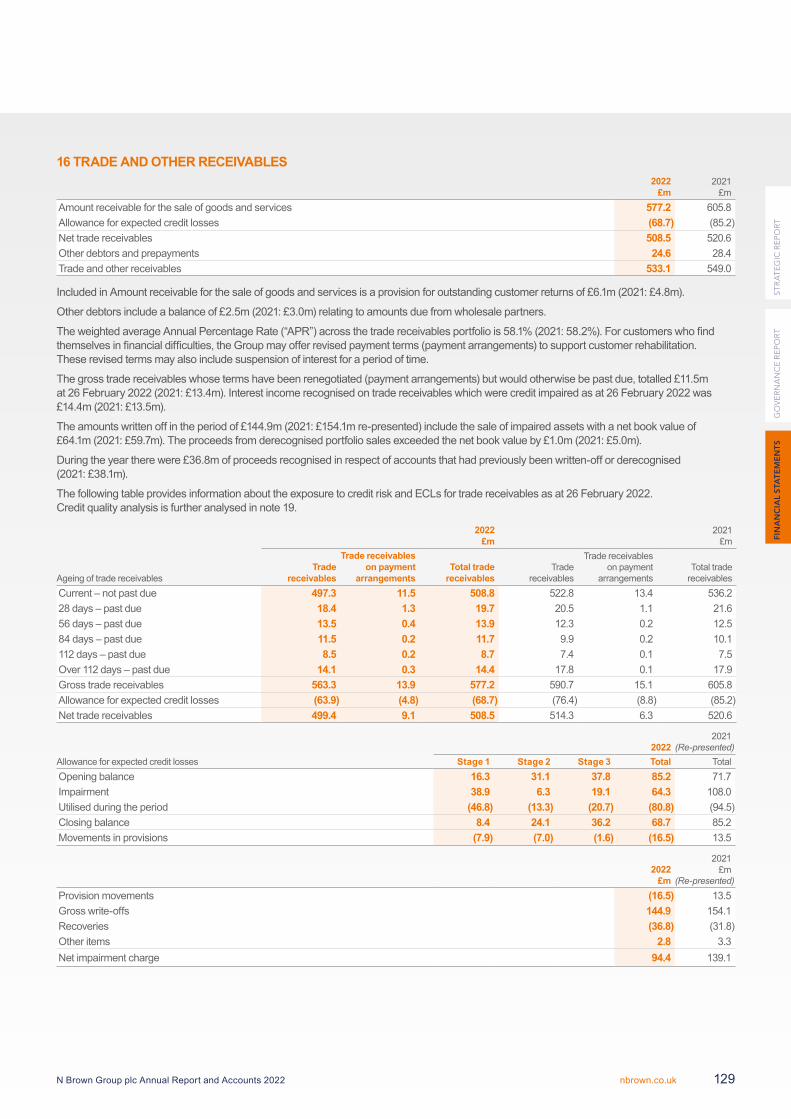
16 TRADE AND OTHER RECEIVABLES2022
£m2021
£mAmount receivable for the sale of goods and services 577.2 605.8Allowance for expected credit losses (68.7) (85.2)Net trade receivables 508.5 520.6Other debtors and prepayments 24.6 28.4Trade and other receivables 533.1 549.0
Included in Amount receivable for the sale of goods and services is a provision for outstanding customer returns of £6.1m (2021: £4.8m).
Other debtors include a balance of £2.5m (2021: £3.0m) relating to amounts due from wholesale partners.
The weighted average Annual Percentage Rate (“APR”) across the trade receivables portfolio is 58.1% (2021: 58.2%). For customers who find themselves in financial difficulties, the Group may offer revised payment terms (payment arrangements) to support customer rehabilitation. These revised terms may also include suspension of interest for a period of time.
The gross trade receivables whose terms have been renegotiated (payment arrangements) but would otherwise be past due, totalled £11.5m at 26 February 2022 (2021: £13.4m). Interest income recognised on trade receivables which were credit impaired as at 26 February 2022 was £14.4m (2021: £13.5m).
The amounts written off in the period of £144.9m (2021: £154.1m re-presented) include the sale of impaired assets with a net book value of £64.1m (2021: £59.7m). The proceeds from derecognised portfolio sales exceeded the net book value by £1.0m (2021: £5.0m).
During the year there were £36.8m of proceeds recognised in respect of accounts that had previously been written-off or derecognised (2021: £38.1m).
The following table provides information about the exposure to credit risk and ECLs for trade receivables as at 26 February 2022. Credit quality analysis is further analysed in note 19.
2022£m
2021£m
Ageing of trade receivablesTrade
receivables
Trade receivables on payment
arrangementsTotal trade
receivablesTrade
receivables
Trade receivables on payment
arrangementsTotal trade
receivablesCurrent – not past due 497.3 11.5 508.8 522.8 13.4 536.228 days – past due 18.4 1.3 19.7 20.5 1.1 21.656 days – past due 13.5 0.4 13.9 12.3 0.2 12.584 days – past due 11.5 0.2 11.7 9.9 0.2 10.1112 days – past due 8.5 0.2 8.7 7.4 0.1 7.5Over 112 days – past due 14.1 0.3 14.4 17.8 0.1 17.9Gross trade receivables 563.3 13.9 577.2 590.7 15.1 605.8Allowance for expected credit losses (63.9) (4.8) (68.7) (76.4) (8.8) (85.2)Net trade receivables 499.4 9.1 508.5 514.3 6.3 520.6
Allowance for expected credit losses2022
2021(Re-presented)
Stage 1 Stage 2 Stage 3 Total TotalOpening balance 16.3 31.1 37.8 85.2 71.7Impairment 38.9 6.3 19.1 64.3 108.0Utilised during the period (46.8) (13.3) (20.7) (80.8) (94.5)Closing balance 8.4 24.1 36.2 68.7 85.2Movements in provisions (7.9) (7.0) (1.6) (16.5) 13.5
2022£m
2021£m
(Re-presented)Provision movements (16.5) 13.5Gross write-offs 144.9 154.1Recoveries (36.8) (31.8)Other items 2.8 3.3Net impairment charge 94.4 139.1
FIN
AN
CIA
L S
TAT
EM
EN
TS
GO
VE
RN
AN
CE
RE
PO
RT
ST
RA
TE
GIC
RE
PO
RT
N Brown Group plc Annual Report and Accounts 2022 nbrown.co.uk 129
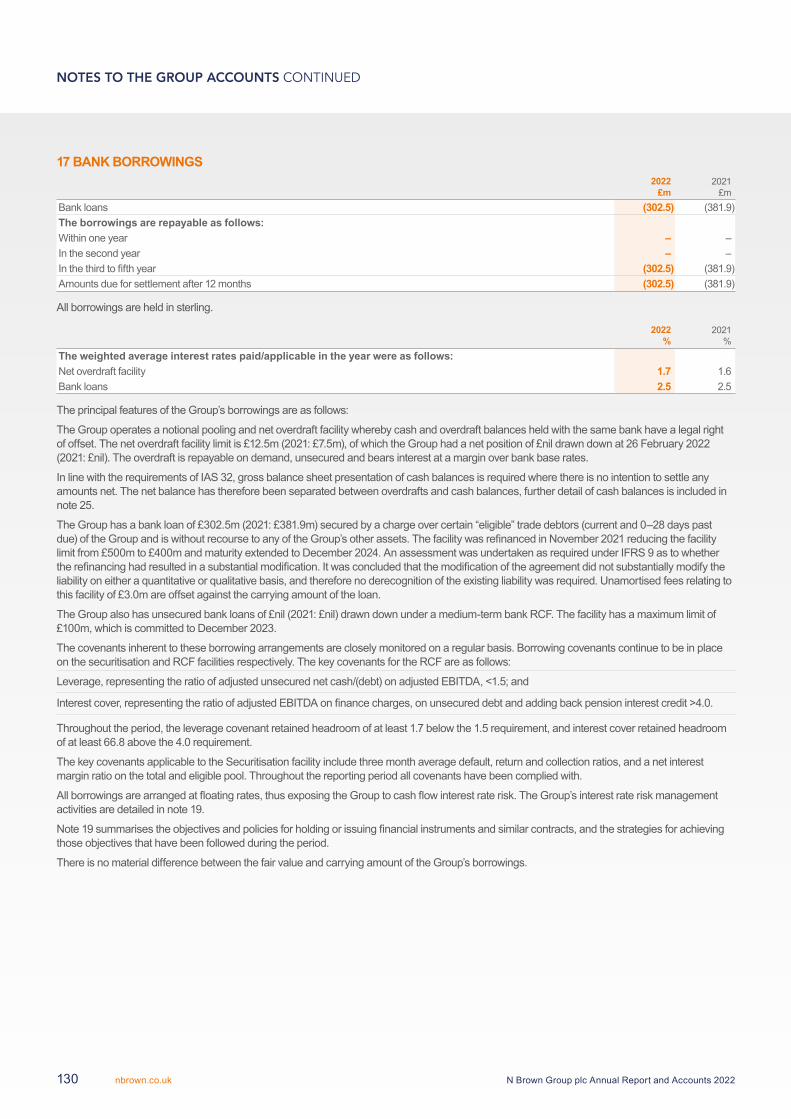
17 BANK BORROWINGS2022
£m2021
£mBank loans (302.5) (381.9)The borrowings are repayable as follows:Within one year – –In the second year – –In the third to fifth year (302.5) (381.9)Amounts due for settlement after 12 months (302.5) (381.9)
All borrowings are held in sterling.
2022%
2021%
The weighted average interest rates paid/applicable in the year were as follows:Net overdraft facility 1.7 1.6Bank loans 2.5 2.5
The principal features of the Group’s borrowings are as follows:
The Group operates a notional pooling and net overdraft facility whereby cash and overdraft balances held with the same bank have a legal right of offset. The net overdraft facility limit is £12.5m (2021: £7.5m), of which the Group had a net position of £nil drawn down at 26 February 2022 (2021: £nil). The overdraft is repayable on demand, unsecured and bears interest at a margin over bank base rates.
In line with the requirements of IAS 32, gross balance sheet presentation of cash balances is required where there is no intention to settle any amounts net. The net balance has therefore been separated between overdrafts and cash balances, further detail of cash balances is included in note 25.
The Group has a bank loan of £302.5m (2021: £381.9m) secured by a charge over certain “eligible” trade debtors (current and 0–28 days past due) of the Group and is without recourse to any of the Group’s other assets. The facility was refinanced in November 2021 reducing the facility limit from £500m to £400m and maturity extended to December 2024. An assessment was undertaken as required under IFRS 9 as to whether the refinancing had resulted in a substantial modification. It was concluded that the modification of the agreement did not substantially modify the liability on either a quantitative or qualitative basis, and therefore no derecognition of the existing liability was required. Unamortised fees relating to this facility of £3.0m are offset against the carrying amount of the loan.
The Group also has unsecured bank loans of £nil (2021: £nil) drawn down under a medium-term bank RCF. The facility has a maximum limit of £100m, which is committed to December 2023.
The covenants inherent to these borrowing arrangements are closely monitored on a regular basis. Borrowing covenants continue to be in place on the securitisation and RCF facilities respectively. The key covenants for the RCF are as follows:
Leverage, representing the ratio of adjusted unsecured net cash/(debt) on adjusted EBITDA, <1.5; and
Interest cover, representing the ratio of adjusted EBITDA on finance charges, on unsecured debt and adding back pension interest credit >4.0.
Throughout the period, the leverage covenant retained headroom of at least 1.7 below the 1.5 requirement, and interest cover retained headroom of at least 66.8 above the 4.0 requirement.
The key covenants applicable to the Securitisation facility include three month average default, return and collection ratios, and a net interest margin ratio on the total and eligible pool. Throughout the reporting period all covenants have been complied with.
All borrowings are arranged at floating rates, thus exposing the Group to cash flow interest rate risk. The Group’s interest rate risk management activities are detailed in note 19.
Note 19 summarises the objectives and policies for holding or issuing financial instruments and similar contracts, and the strategies for achieving those objectives that have been followed during the period.
There is no material difference between the fair value and carrying amount of the Group’s borrowings.
NOTES TO THE GROUP ACCOUNTS CONTINUED
N Brown Group plc Annual Report and Accounts 2022nbrown.co.uk130
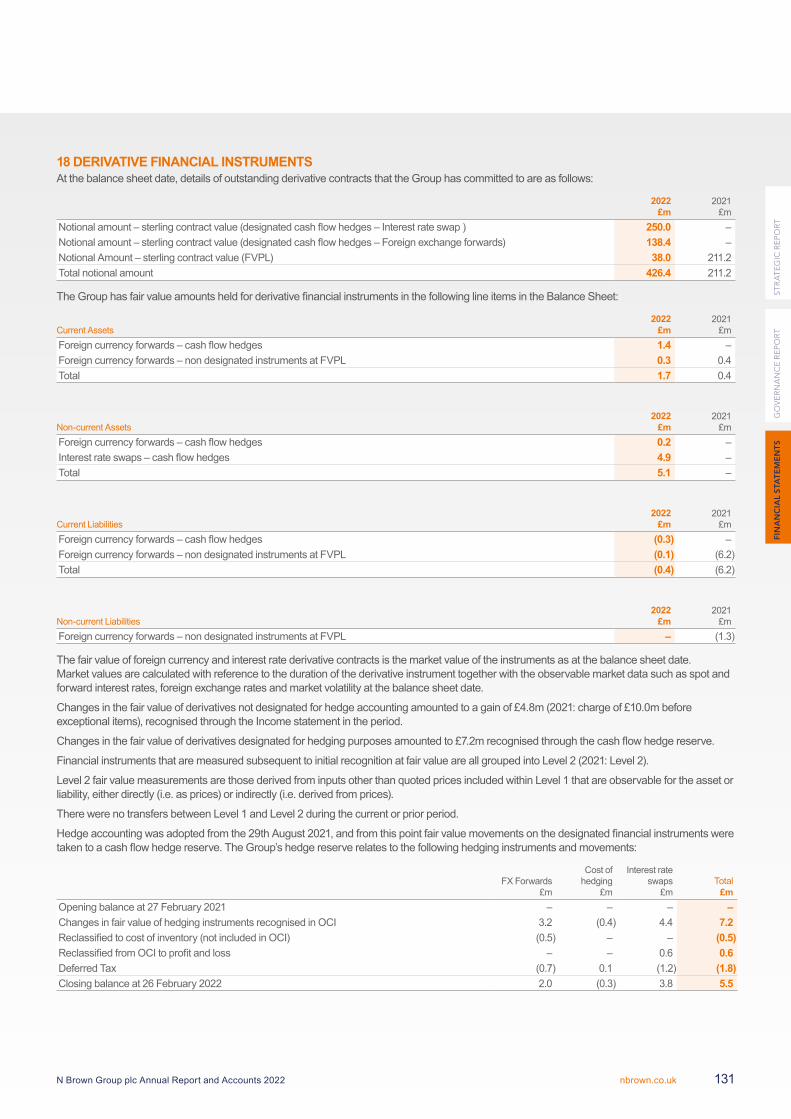
18 DERIVATIVE FINANCIAL INSTRUMENTSAt the balance sheet date, details of outstanding derivative contracts that the Group has committed to are as follows:
2022£m
2021£m
Notional amount – sterling contract value (designated cash flow hedges – Interest rate swap ) 250.0 –Notional amount – sterling contract value (designated cash flow hedges – Foreign exchange forwards) 138.4 –Notional Amount – sterling contract value (FVPL) 38.0 211.2Total notional amount 426.4 211.2
The Group has fair value amounts held for derivative financial instruments in the following line items in the Balance Sheet:
Current Assets2022
£m2021
£mForeign currency forwards – cash flow hedges 1.4 –Foreign currency forwards – non designated instruments at FVPL 0.3 0.4Total 1.7 0.4
Non-current Assets2022
£m2021
£mForeign currency forwards – cash flow hedges 0.2 –Interest rate swaps – cash flow hedges 4.9 –Total 5.1 –
Current Liabilities2022
£m2021
£mForeign currency forwards – cash flow hedges (0.3) –Foreign currency forwards – non designated instruments at FVPL (0.1) (6.2)Total (0.4) (6.2)
Non-current Liabilities2022
£m2021
£mForeign currency forwards – non designated instruments at FVPL – (1.3)
The fair value of foreign currency and interest rate derivative contracts is the market value of the instruments as at the balance sheet date. Market values are calculated with reference to the duration of the derivative instrument together with the observable market data such as spot and forward interest rates, foreign exchange rates and market volatility at the balance sheet date.
Changes in the fair value of derivatives not designated for hedge accounting amounted to a gain of £4.8m (2021: charge of £10.0m before exceptional items), recognised through the Income statement in the period.
Changes in the fair value of derivatives designated for hedging purposes amounted to £7.2m recognised through the cash flow hedge reserve.
Financial instruments that are measured subsequent to initial recognition at fair value are all grouped into Level 2 (2021: Level 2).
Level 2 fair value measurements are those derived from inputs other than quoted prices included within Level 1 that are observable for the asset or liability, either directly (i.e. as prices) or indirectly (i.e. derived from prices).
There were no transfers between Level 1 and Level 2 during the current or prior period.
Hedge accounting was adopted from the 29th August 2021, and from this point fair value movements on the designated financial instruments were taken to a cash flow hedge reserve. The Group’s hedge reserve relates to the following hedging instruments and movements:
FX Forwards £m
Cost of hedging
£m
Interest rate swaps
£mTotal
£mOpening balance at 27 February 2021 – – – –Changes in fair value of hedging instruments recognised in OCI 3.2 (0.4) 4.4 7.2Reclassified to cost of inventory (not included in OCI) (0.5) – – (0.5)Reclassified from OCI to profit and loss – – 0.6 0.6Deferred Tax (0.7) 0.1 (1.2) (1.8)Closing balance at 26 February 2022 2.0 (0.3) 3.8 5.5
FIN
AN
CIA
L S
TAT
EM
EN
TS
GO
VE
RN
AN
CE
RE
PO
RT
ST
RA
TE
GIC
RE
PO
RT
N Brown Group plc Annual Report and Accounts 2022 nbrown.co.uk 131
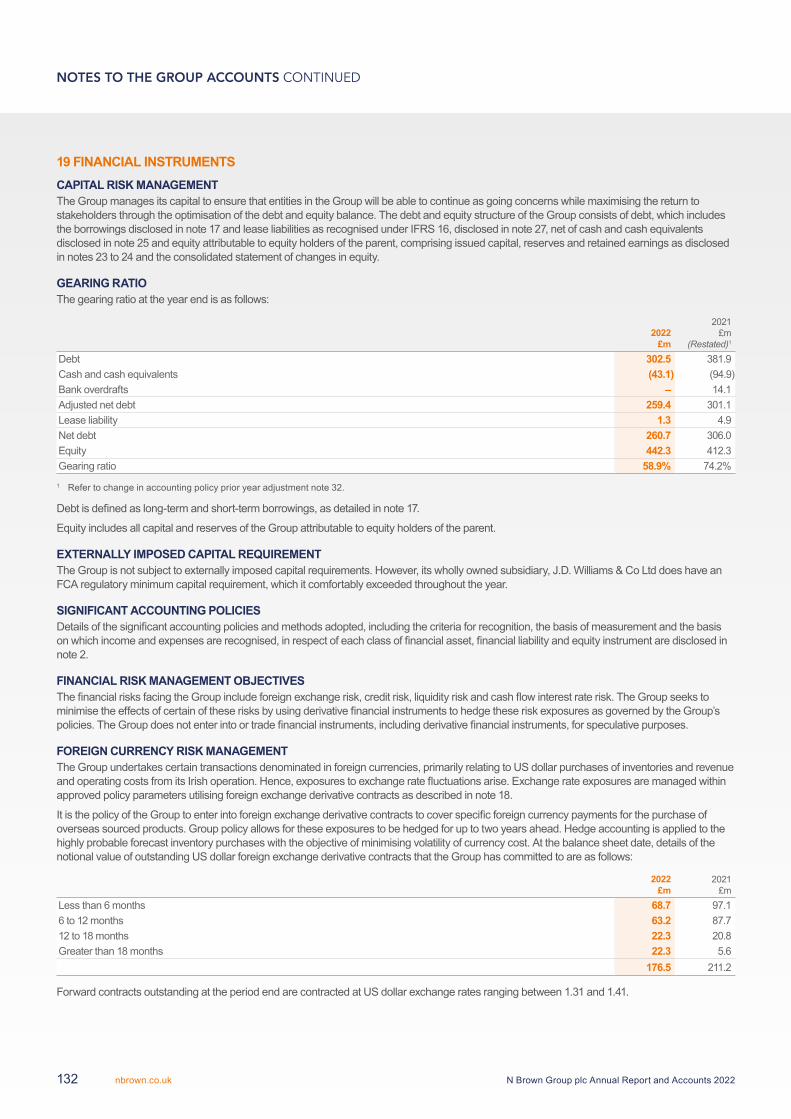
19 FINANCIAL INSTRUMENTSCAPITAL RISK MANAGEMENTThe Group manages its capital to ensure that entities in the Group will be able to continue as going concerns while maximising the return to stakeholders through the optimisation of the debt and equity balance. The debt and equity structure of the Group consists of debt, which includes the borrowings disclosed in note 17 and lease liabilities as recognised under IFRS 16, disclosed in note 27, net of cash and cash equivalents disclosed in note 25 and equity attributable to equity holders of the parent, comprising issued capital, reserves and retained earnings as disclosed in notes 23 to 24 and the consolidated statement of changes in equity.
GEARING RATIOThe gearing ratio at the year end is as follows:
2022£m
2021£m
(Restated)1 Debt 302.5 381.9Cash and cash equivalents (43.1) (94.9)Bank overdrafts – 14.1Adjusted net debt 259.4 301.1Lease liability 1.3 4.9Net debt 260.7 306.0Equity 442.3 412.3Gearing ratio 58.9% 74.2%
1 Refer to change in accounting policy prior year adjustment note 32.
Debt is defined as long-term and short-term borrowings, as detailed in note 17.
Equity includes all capital and reserves of the Group attributable to equity holders of the parent.
EXTERNALLY IMPOSED CAPITAL REQUIREMENTThe Group is not subject to externally imposed capital requirements. However, its wholly owned subsidiary, J.D. Williams & Co Ltd does have an FCA regulatory minimum capital requirement, which it comfortably exceeded throughout the year.
SIGNIFICANT ACCOUNTING POLICIESDetails of the significant accounting policies and methods adopted, including the criteria for recognition, the basis of measurement and the basis on which income and expenses are recognised, in respect of each class of financial asset, financial liability and equity instrument are disclosed in note 2.
FINANCIAL RISK MANAGEMENT OBJECTIVESThe financial risks facing the Group include foreign exchange risk, credit risk, liquidity risk and cash flow interest rate risk. The Group seeks to minimise the effects of certain of these risks by using derivative financial instruments to hedge these risk exposures as governed by the Group’s policies. The Group does not enter into or trade financial instruments, including derivative financial instruments, for speculative purposes.
FOREIGN CURRENCY RISK MANAGEMENTThe Group undertakes certain transactions denominated in foreign currencies, primarily relating to US dollar purchases of inventories and revenue and operating costs from its Irish operation. Hence, exposures to exchange rate fluctuations arise. Exchange rate exposures are managed within approved policy parameters utilising foreign exchange derivative contracts as described in note 18.
It is the policy of the Group to enter into foreign exchange derivative contracts to cover specific foreign currency payments for the purchase of overseas sourced products. Group policy allows for these exposures to be hedged for up to two years ahead. Hedge accounting is applied to the highly probable forecast inventory purchases with the objective of minimising volatility of currency cost. At the balance sheet date, details of the notional value of outstanding US dollar foreign exchange derivative contracts that the Group has committed to are as follows:
2022£m
2021£m
Less than 6 months 68.7 97.16 to 12 months 63.2 87.712 to 18 months 22.3 20.8Greater than 18 months 22.3 5.6
176.5 211.2
Forward contracts outstanding at the period end are contracted at US dollar exchange rates ranging between 1.31 and 1.41.
NOTES TO THE GROUP ACCOUNTS CONTINUED
N Brown Group plc Annual Report and Accounts 2022nbrown.co.uk132
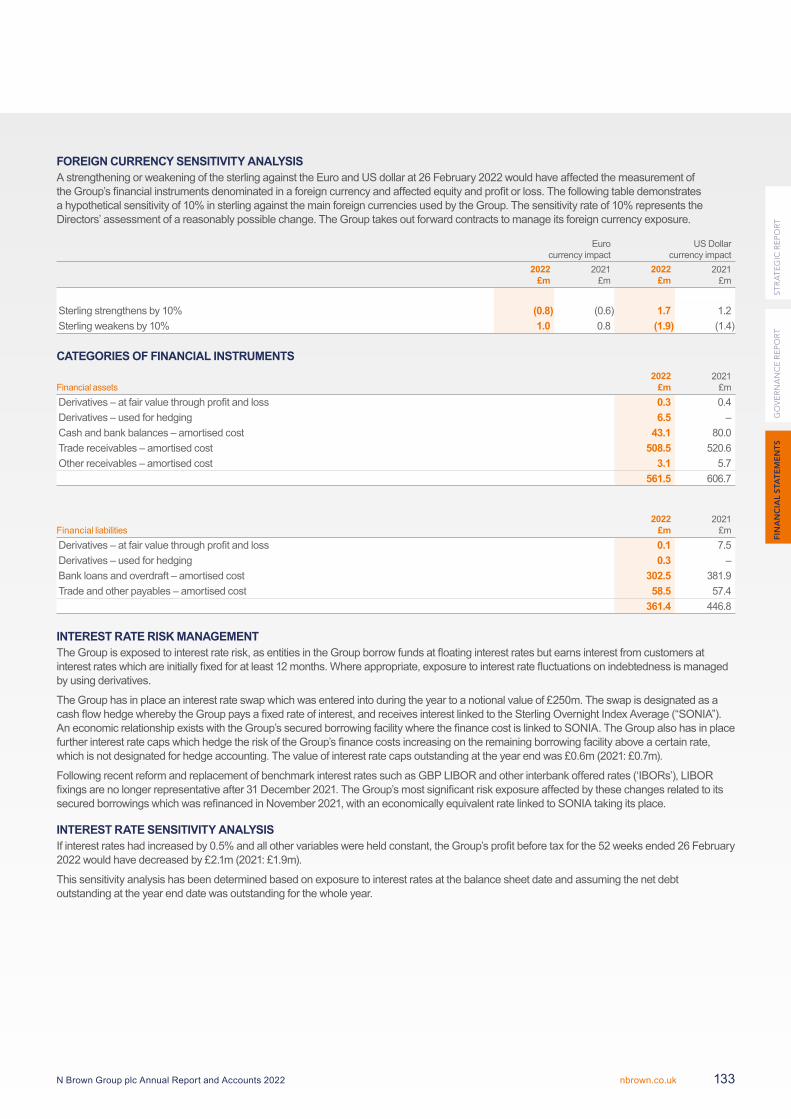
FOREIGN CURRENCY SENSITIVITY ANALYSISA strengthening or weakening of the sterling against the Euro and US dollar at 26 February 2022 would have affected the measurement of the Group’s financial instruments denominated in a foreign currency and affected equity and profit or loss. The following table demonstrates a hypothetical sensitivity of 10% in sterling against the main foreign currencies used by the Group. The sensitivity rate of 10% represents the Directors’ assessment of a reasonably possible change. The Group takes out forward contracts to manage its foreign currency exposure.
Euro currency impact
US Dollarcurrency impact
2022£m
2021£m
2022£m
2021£m
Sterling strengthens by 10% (0.8) (0.6) 1.7 1.2Sterling weakens by 10% 1.0 0.8 (1.9) (1.4)
CATEGORIES OF FINANCIAL INSTRUMENTS
Financial assets2022
£m2021
£mDerivatives – at fair value through profit and loss 0.3 0.4Derivatives – used for hedging 6.5 –Cash and bank balances – amortised cost 43.1 80.0Trade receivables – amortised cost 508.5 520.6Other receivables – amortised cost 3.1 5.7
561.5 606.7
Financial liabilities2022
£m2021
£mDerivatives – at fair value through profit and loss 0.1 7.5Derivatives – used for hedging 0.3 –Bank loans and overdraft – amortised cost 302.5 381.9Trade and other payables – amortised cost 58.5 57.4
361.4 446.8
INTEREST RATE RISK MANAGEMENTThe Group is exposed to interest rate risk, as entities in the Group borrow funds at floating interest rates but earns interest from customers at interest rates which are initially fixed for at least 12 months. Where appropriate, exposure to interest rate fluctuations on indebtedness is managed by using derivatives.
The Group has in place an interest rate swap which was entered into during the year to a notional value of £250m. The swap is designated as a cash flow hedge whereby the Group pays a fixed rate of interest, and receives interest linked to the Sterling Overnight Index Average (“SONIA”). An economic relationship exists with the Group’s secured borrowing facility where the finance cost is linked to SONIA. The Group also has in place further interest rate caps which hedge the risk of the Group’s finance costs increasing on the remaining borrowing facility above a certain rate, which is not designated for hedge accounting. The value of interest rate caps outstanding at the year end was £0.6m (2021: £0.7m).
Following recent reform and replacement of benchmark interest rates such as GBP LIBOR and other interbank offered rates (‘IBORs’), LIBOR fixings are no longer representative after 31 December 2021. The Group’s most significant risk exposure affected by these changes related to its secured borrowings which was refinanced in November 2021, with an economically equivalent rate linked to SONIA taking its place.
INTEREST RATE SENSITIVITY ANALYSISIf interest rates had increased by 0.5% and all other variables were held constant, the Group’s profit before tax for the 52 weeks ended 26 February 2022 would have decreased by £2.1m (2021: £1.9m).
This sensitivity analysis has been determined based on exposure to interest rates at the balance sheet date and assuming the net debt outstanding at the year end date was outstanding for the whole year.
FIN
AN
CIA
L S
TAT
EM
EN
TS
GO
VE
RN
AN
CE
RE
PO
RT
ST
RA
TE
GIC
RE
PO
RT
N Brown Group plc Annual Report and Accounts 2022 nbrown.co.uk 133
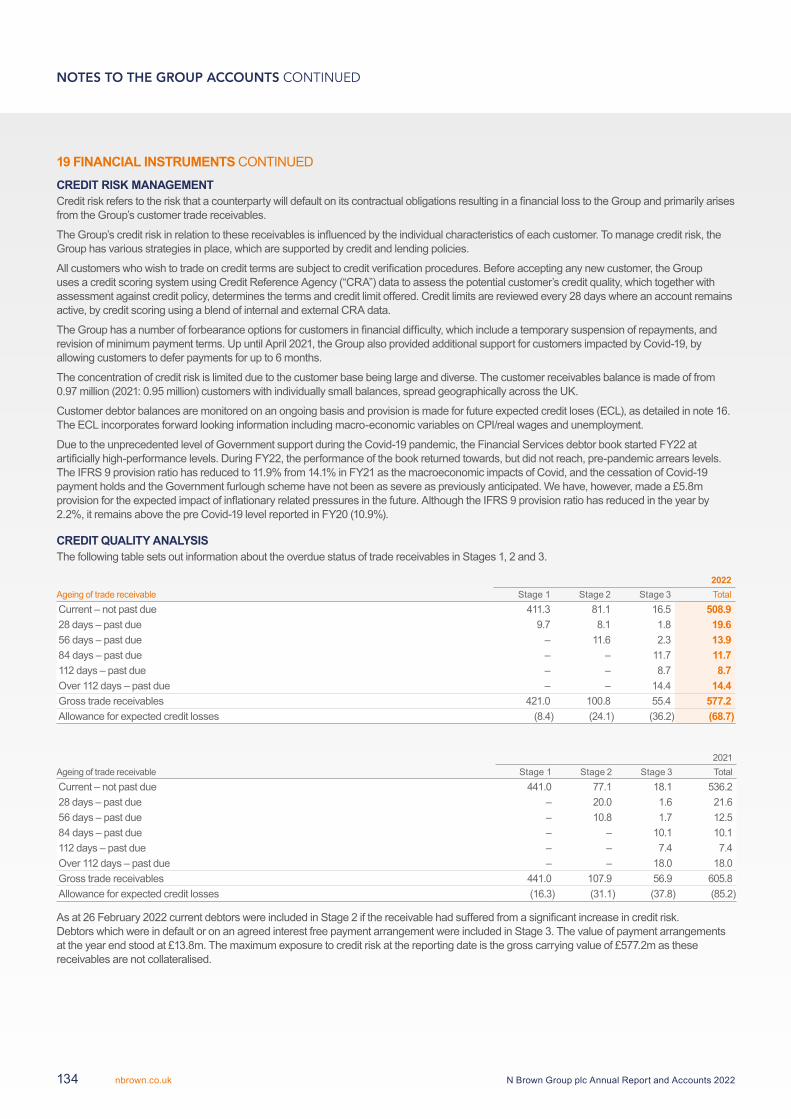
19 FINANCIAL INSTRUMENTS CONTINUED
CREDIT RISK MANAGEMENTCredit risk refers to the risk that a counterparty will default on its contractual obligations resulting in a financial loss to the Group and primarily arises from the Group’s customer trade receivables.
The Group’s credit risk in relation to these receivables is influenced by the individual characteristics of each customer. To manage credit risk, the Group has various strategies in place, which are supported by credit and lending policies.
All customers who wish to trade on credit terms are subject to credit verification procedures. Before accepting any new customer, the Group uses a credit scoring system using Credit Reference Agency (“CRA”) data to assess the potential customer’s credit quality, which together with assessment against credit policy, determines the terms and credit limit offered. Credit limits are reviewed every 28 days where an account remains active, by credit scoring using a blend of internal and external CRA data.
The Group has a number of forbearance options for customers in financial difficulty, which include a temporary suspension of repayments, and revision of minimum payment terms. Up until April 2021, the Group also provided additional support for customers impacted by Covid-19, by allowing customers to defer payments for up to 6 months.
The concentration of credit risk is limited due to the customer base being large and diverse. The customer receivables balance is made of from 0.97 million (2021: 0.95 million) customers with individually small balances, spread geographically across the UK.
Customer debtor balances are monitored on an ongoing basis and provision is made for future expected credit loses (ECL), as detailed in note 16. The ECL incorporates forward looking information including macro-economic variables on CPI/real wages and unemployment.
Due to the unprecedented level of Government support during the Covid-19 pandemic, the Financial Services debtor book started FY22 at artificially high-performance levels. During FY22, the performance of the book returned towards, but did not reach, pre-pandemic arrears levels. The IFRS 9 provision ratio has reduced to 11.9% from 14.1% in FY21 as the macroeconomic impacts of Covid, and the cessation of Covid-19 payment holds and the Government furlough scheme have not been as severe as previously anticipated. We have, however, made a £5.8m provision for the expected impact of inflationary related pressures in the future. Although the IFRS 9 provision ratio has reduced in the year by 2.2%, it remains above the pre Covid-19 level reported in FY20 (10.9%).
CREDIT QUALITY ANALYSISThe following table sets out information about the overdue status of trade receivables in Stages 1, 2 and 3.
2022Ageing of trade receivable Stage 1 Stage 2 Stage 3 TotalCurrent – not past due 411.3 81.1 16.5 508.928 days – past due 9.7 8.1 1.8 19.656 days – past due – 11.6 2.3 13.984 days – past due – – 11.7 11.7112 days – past due – – 8.7 8.7Over 112 days – past due – – 14.4 14.4Gross trade receivables 421.0 100.8 55.4 577.2Allowance for expected credit losses (8.4) (24.1) (36.2) (68.7)
2021Ageing of trade receivable Stage 1 Stage 2 Stage 3 TotalCurrent – not past due 441.0 77.1 18.1 536.228 days – past due – 20.0 1.6 21.656 days – past due – 10.8 1.7 12.584 days – past due – – 10.1 10.1112 days – past due – – 7.4 7.4Over 112 days – past due – – 18.0 18.0Gross trade receivables 441.0 107.9 56.9 605.8Allowance for expected credit losses (16.3) (31.1) (37.8) (85.2)
As at 26 February 2022 current debtors were included in Stage 2 if the receivable had suffered from a significant increase in credit risk. Debtors which were in default or on an agreed interest free payment arrangement were included in Stage 3. The value of payment arrangements at the year end stood at £13.8m. The maximum exposure to credit risk at the reporting date is the gross carrying value of £577.2m as these receivables are not collateralised.
NOTES TO THE GROUP ACCOUNTS CONTINUED
N Brown Group plc Annual Report and Accounts 2022nbrown.co.uk134
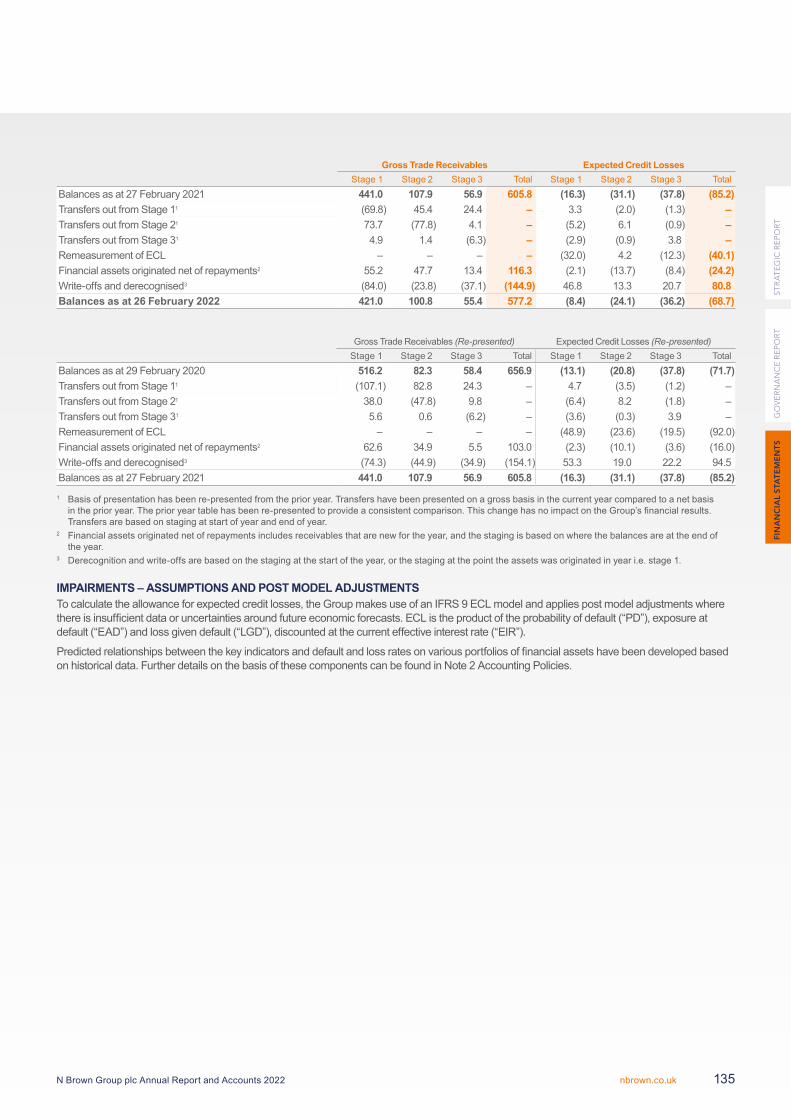
Gross Trade Receivables Expected Credit LossesStage 1 Stage 2 Stage 3 Total Stage 1 Stage 2 Stage 3 Total
Balances as at 27 February 2021 441.0 107.9 56.9 605.8 (16.3) (31.1) (37.8) (85.2)Transfers out from Stage 11 (69.8) 45.4 24.4 – 3.3 (2.0) (1.3) –Transfers out from Stage 21 73.7 (77.8) 4.1 – (5.2) 6.1 (0.9) –Transfers out from Stage 31 4.9 1.4 (6.3) – (2.9) (0.9) 3.8 –Remeasurement of ECL – – – – (32.0) 4.2 (12.3) (40.1)Financial assets originated net of repayments2 55.2 47.7 13.4 116.3 (2.1) (13.7) (8.4) (24.2)Write-offs and derecognised3 (84.0) (23.8) (37.1) (144.9) 46.8 13.3 20.7 80.8Balances as at 26 February 2022 421.0 100.8 55.4 577.2 (8.4) (24.1) (36.2) (68.7)
Gross Trade Receivables (Re-presented) Expected Credit Losses (Re-presented)Stage 1 Stage 2 Stage 3 Total Stage 1 Stage 2 Stage 3 Total
Balances as at 29 February 2020 516.2 82.3 58.4 656.9 (13.1) (20.8) (37.8) (71.7)Transfers out from Stage 11 (107.1) 82.8 24.3 – 4.7 (3.5) (1.2) –Transfers out from Stage 21 38.0 (47.8) 9.8 – (6.4) 8.2 (1.8) –Transfers out from Stage 31 5.6 0.6 (6.2) – (3.6) (0.3) 3.9 –Remeasurement of ECL – – – – (48.9) (23.6) (19.5) (92.0)Financial assets originated net of repayments2 62.6 34.9 5.5 103.0 (2.3) (10.1) (3.6) (16.0)Write-offs and derecognised3 (74.3) (44.9) (34.9) (154.1) 53.3 19.0 22.2 94.5Balances as at 27 February 2021 441.0 107.9 56.9 605.8 (16.3) (31.1) (37.8) (85.2)
1 Basis of presentation has been re-presented from the prior year. Transfers have been presented on a gross basis in the current year compared to a net basis in the prior year. The prior year table has been re-presented to provide a consistent comparison. This change has no impact on the Group’s financial results. Transfers are based on staging at start of year and end of year.
2 Financial assets originated net of repayments includes receivables that are new for the year, and the staging is based on where the balances are at the end of the year.
3 Derecognition and write-offs are based on the staging at the start of the year, or the staging at the point the assets was originated in year i.e. stage 1.
IMPAIRMENTS – ASSUMPTIONS AND POST MODEL ADJUSTMENTSTo calculate the allowance for expected credit losses, the Group makes use of an IFRS 9 ECL model and applies post model adjustments where there is insufficient data or uncertainties around future economic forecasts. ECL is the product of the probability of default (“PD”), exposure at default (“EAD”) and loss given default (“LGD”), discounted at the current effective interest rate (“EIR”).
Predicted relationships between the key indicators and default and loss rates on various portfolios of financial assets have been developed based on historical data. Further details on the basis of these components can be found in Note 2 Accounting Policies.
FIN
AN
CIA
L S
TAT
EM
EN
TS
GO
VE
RN
AN
CE
RE
PO
RT
ST
RA
TE
GIC
RE
PO
RT
N Brown Group plc Annual Report and Accounts 2022 nbrown.co.uk 135
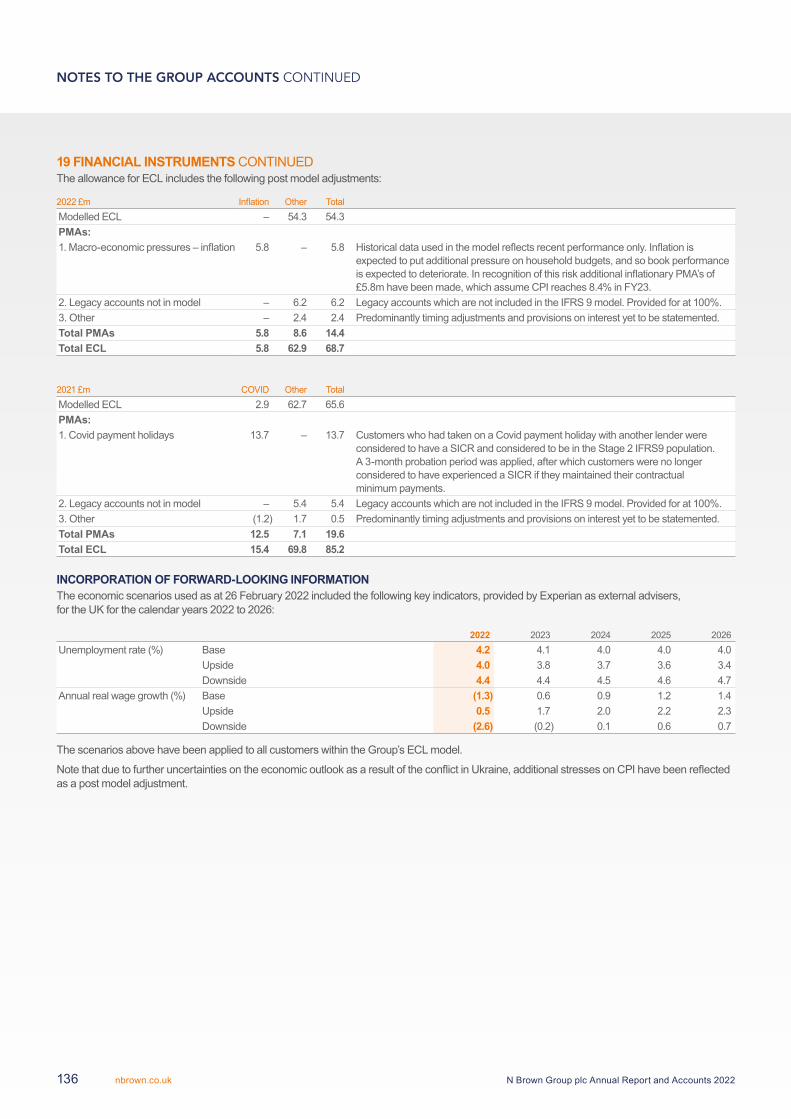
19 FINANCIAL INSTRUMENTS CONTINUEDThe allowance for ECL includes the following post model adjustments:
2022 £m Inflation Other TotalModelled ECL – 54.3 54.3PMAs:1. Macro-economic pressures – inflation 5.8 – 5.8 Historical data used in the model reflects recent performance only. Inflation is
expected to put additional pressure on household budgets, and so book performance is expected to deteriorate. In recognition of this risk additional inflationary PMA’s of £5.8m have been made, which assume CPI reaches 8.4% in FY23.
2. Legacy accounts not in model – 6.2 6.2 Legacy accounts which are not included in the IFRS 9 model. Provided for at 100%. 3. Other – 2.4 2.4 Predominantly timing adjustments and provisions on interest yet to be statemented. Total PMAs 5.8 8.6 14.4Total ECL 5.8 62.9 68.7
2021 £m COVID Other TotalModelled ECL 2.9 62.7 65.6PMAs:1. Covid payment holidays 13.7 – 13.7 Customers who had taken on a Covid payment holiday with another lender were
considered to have a SICR and considered to be in the Stage 2 IFRS9 population. A 3-month probation period was applied, after which customers were no longer considered to have experienced a SICR if they maintained their contractual minimum payments.
2. Legacy accounts not in model – 5.4 5.4 Legacy accounts which are not included in the IFRS 9 model. Provided for at 100%. 3. Other (1.2) 1.7 0.5 Predominantly timing adjustments and provisions on interest yet to be statemented. Total PMAs 12.5 7.1 19.6Total ECL 15.4 69.8 85.2
INCORPORATION OF FORWARD-LOOKING INFORMATIONThe economic scenarios used as at 26 February 2022 included the following key indicators, provided by Experian as external advisers, for the UK for the calendar years 2022 to 2026:
2022 2023 2024 2025 2026Unemployment rate (%) Base 4.2 4.1 4.0 4.0 4.0 Upside 4.0 3.8 3.7 3.6 3.4 Downside 4.4 4.4 4.5 4.6 4.7Annual real wage growth (%) Base (1.3) 0.6 0.9 1.2 1.4 Upside 0.5 1.7 2.0 2.2 2.3 Downside (2.6) (0.2) 0.1 0.6 0.7
The scenarios above have been applied to all customers within the Group’s ECL model.
Note that due to further uncertainties on the economic outlook as a result of the conflict in Ukraine, additional stresses on CPI have been reflected as a post model adjustment.
NOTES TO THE GROUP ACCOUNTS CONTINUED
N Brown Group plc Annual Report and Accounts 2022nbrown.co.uk136
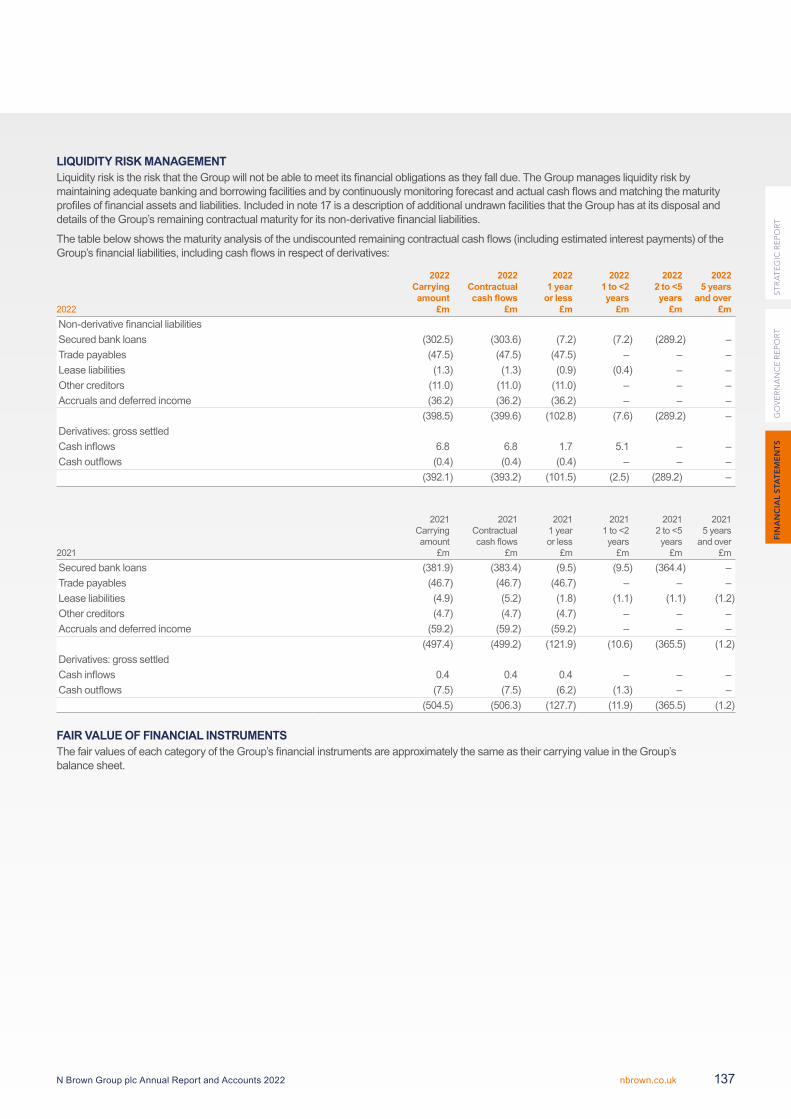
LIQUIDITY RISK MANAGEMENTLiquidity risk is the risk that the Group will not be able to meet its financial obligations as they fall due. The Group manages liquidity risk by maintaining adequate banking and borrowing facilities and by continuously monitoring forecast and actual cash flows and matching the maturity profiles of financial assets and liabilities. Included in note 17 is a description of additional undrawn facilities that the Group has at its disposal and details of the Group’s remaining contractual maturity for its non-derivative financial liabilities.
The table below shows the maturity analysis of the undiscounted remaining contractual cash flows (including estimated interest payments) of the Group’s financial liabilities, including cash flows in respect of derivatives:
2022
2022Carryingamount
£m
2022Contractualcash flows
£m
20221 year
or less£m
20221 to <2years
£m
20222 to <5years
£m
20225 years
and over£m
Non-derivative financial liabilitiesSecured bank loans (302.5) (303.6) (7.2) (7.2) (289.2) –Trade payables (47.5) (47.5) (47.5) – – –Lease liabilities (1.3) (1.3) (0.9) (0.4) – –Other creditors (11.0) (11.0) (11.0) – – –Accruals and deferred income (36.2) (36.2) (36.2) – – –
(398.5) (399.6) (102.8) (7.6) (289.2) –Derivatives: gross settledCash inflows 6.8 6.8 1.7 5.1 – –Cash outflows (0.4) (0.4) (0.4) – – –
(392.1) (393.2) (101.5) (2.5) (289.2) –
2021
2021Carryingamount
£m
2021Contractualcash flows
£m
20211 yearor less
£m
20211 to <2years
£m
20212 to <5years
£m
20215 years
and over£m
Secured bank loans (381.9) (383.4) (9.5) (9.5) (364.4) –Trade payables (46.7) (46.7) (46.7) – – –Lease liabilities (4.9) (5.2) (1.8) (1.1) (1.1) (1.2)Other creditors (4.7) (4.7) (4.7) – – –Accruals and deferred income (59.2) (59.2) (59.2) – – –
(497.4) (499.2) (121.9) (10.6) (365.5) (1.2)Derivatives: gross settledCash inflows 0.4 0.4 0.4 – – –Cash outflows (7.5) (7.5) (6.2) (1.3) – –
(504.5) (506.3) (127.7) (11.9) (365.5) (1.2)
FAIR VALUE OF FINANCIAL INSTRUMENTSThe fair values of each category of the Group’s financial instruments are approximately the same as their carrying value in the Group’s balance sheet.
FIN
AN
CIA
L S
TAT
EM
EN
TS
GO
VE
RN
AN
CE
RE
PO
RT
ST
RA
TE
GIC
RE
PO
RT
N Brown Group plc Annual Report and Accounts 2022 nbrown.co.uk 137
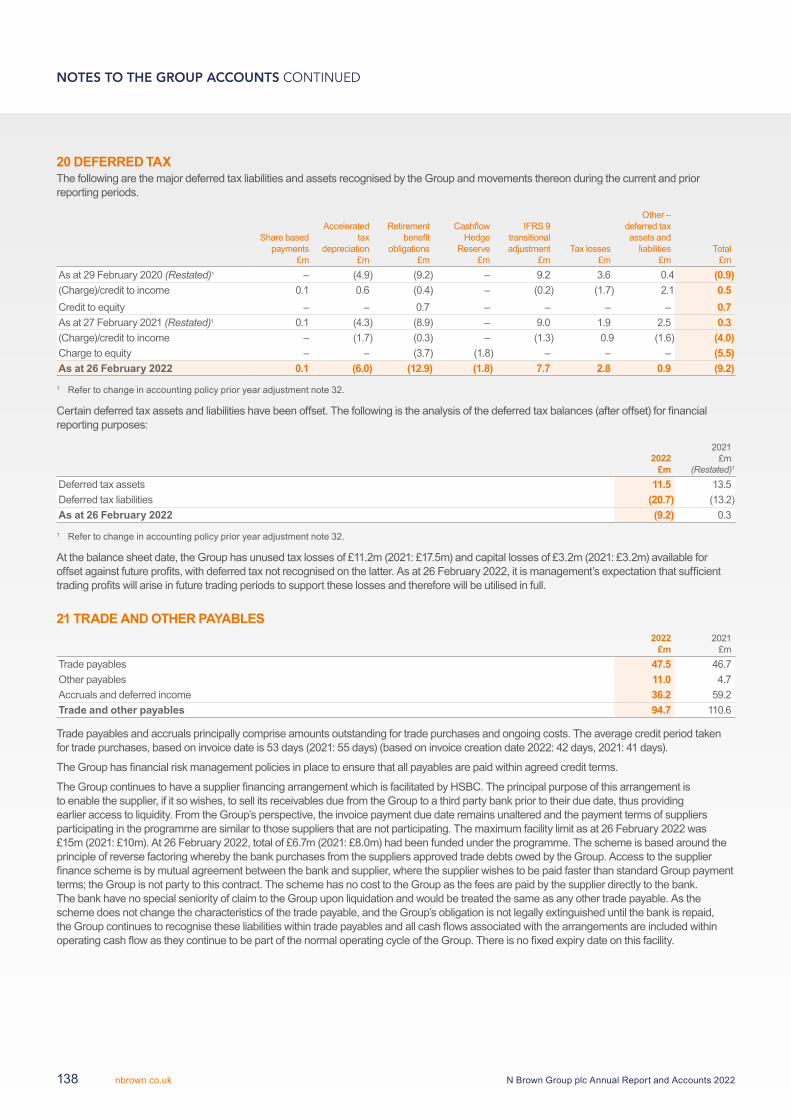
20 DEFERRED TAXThe following are the major deferred tax liabilities and assets recognised by the Group and movements thereon during the current and prior reporting periods.
Share based payments
£m
Accelerated tax
depreciation £m
Retirement benefit
obligations £m
Cashflow Hedge
Reserve £m
IFRS 9 transitional adjustment
£mTax losses
£m
Other – deferred tax assets and
liabilities £m
Total £m
As at 29 February 2020 (Restated)1 – (4.9) (9.2) – 9.2 3.6 0.4 (0.9)(Charge)/credit to income 0.1 0.6 (0.4) – (0.2) (1.7) 2.1 0.5Credit to equity – – 0.7 – – – – 0.7As at 27 February 2021 (Restated)1 0.1 (4.3) (8.9) – 9.0 1.9 2.5 0.3(Charge)/credit to income – (1.7) (0.3) – (1.3) 0.9 (1.6) (4.0)Charge to equity – – (3.7) (1.8) – – – (5.5)As at 26 February 2022 0.1 (6.0) (12.9) (1.8) 7.7 2.8 0.9 (9.2)
1 Refer to change in accounting policy prior year adjustment note 32.
Certain deferred tax assets and liabilities have been offset. The following is the analysis of the deferred tax balances (after offset) for financial reporting purposes:
2022£m
2021£m
(Restated)1
Deferred tax assets 11.5 13.5Deferred tax liabilities (20.7) (13.2)As at 26 February 2022 (9.2) 0.3
1 Refer to change in accounting policy prior year adjustment note 32.
At the balance sheet date, the Group has unused tax losses of £11.2m (2021: £17.5m) and capital losses of £3.2m (2021: £3.2m) available for offset against future profits, with deferred tax not recognised on the latter. As at 26 February 2022, it is management’s expectation that sufficient trading profits will arise in future trading periods to support these losses and therefore will be utilised in full.
21 TRADE AND OTHER PAYABLES2022
£m2021
£mTrade payables 47.5 46.7Other payables 11.0 4.7Accruals and deferred income 36.2 59.2Trade and other payables 94.7 110.6
Trade payables and accruals principally comprise amounts outstanding for trade purchases and ongoing costs. The average credit period taken for trade purchases, based on invoice date is 53 days (2021: 55 days) (based on invoice creation date 2022: 42 days, 2021: 41 days).
The Group has financial risk management policies in place to ensure that all payables are paid within agreed credit terms.
The Group continues to have a supplier financing arrangement which is facilitated by HSBC. The principal purpose of this arrangement is to enable the supplier, if it so wishes, to sell its receivables due from the Group to a third party bank prior to their due date, thus providing earlier access to liquidity. From the Group’s perspective, the invoice payment due date remains unaltered and the payment terms of suppliers participating in the programme are similar to those suppliers that are not participating. The maximum facility limit as at 26 February 2022 was £15m (2021: £10m). At 26 February 2022, total of £6.7m (2021: £8.0m) had been funded under the programme. The scheme is based around the principle of reverse factoring whereby the bank purchases from the suppliers approved trade debts owed by the Group. Access to the supplier finance scheme is by mutual agreement between the bank and supplier, where the supplier wishes to be paid faster than standard Group payment terms; the Group is not party to this contract. The scheme has no cost to the Group as the fees are paid by the supplier directly to the bank. The bank have no special seniority of claim to the Group upon liquidation and would be treated the same as any other trade payable. As the scheme does not change the characteristics of the trade payable, and the Group’s obligation is not legally extinguished until the bank is repaid, the Group continues to recognise these liabilities within trade payables and all cash flows associated with the arrangements are included within operating cash flow as they continue to be part of the normal operating cycle of the Group. There is no fixed expiry date on this facility.
NOTES TO THE GROUP ACCOUNTS CONTINUED
N Brown Group plc Annual Report and Accounts 2022nbrown.co.uk138
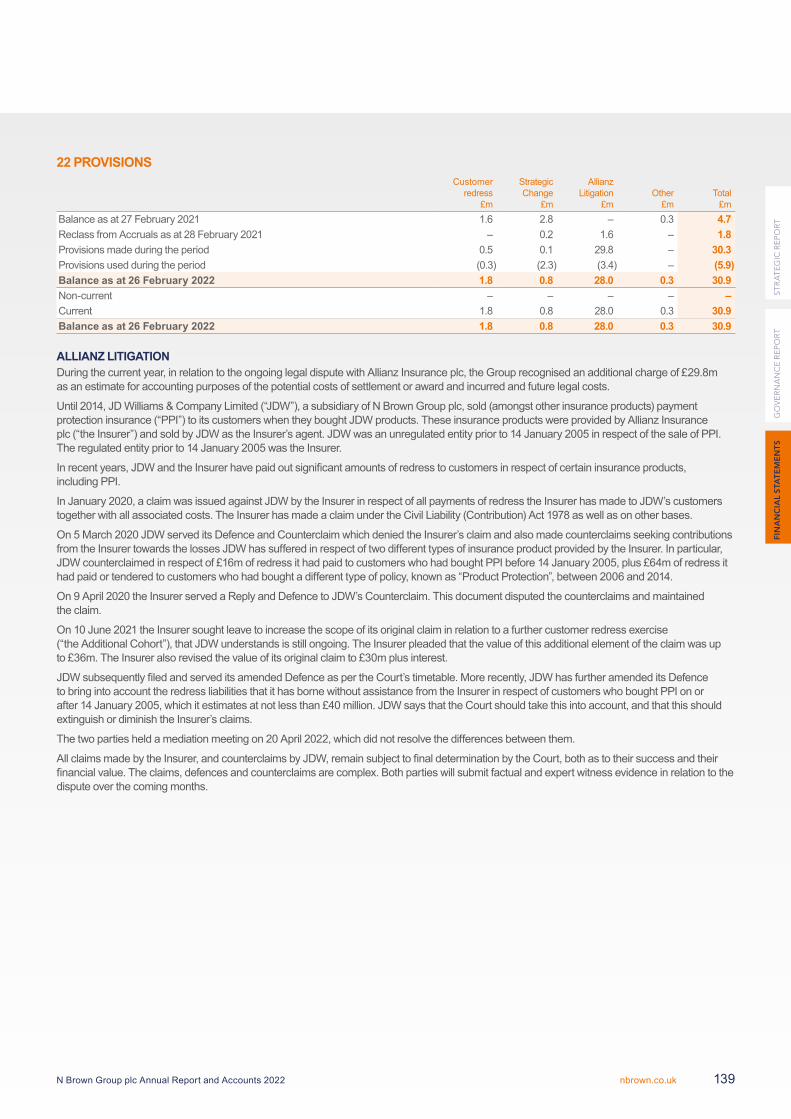
22 PROVISIONSCustomer
redress£m
Strategic Change
£m
Allianz Litigation
£mOther
£mTotal
£mBalance as at 27 February 2021 1.6 2.8 – 0.3 4.7Reclass from Accruals as at 28 February 2021 – 0.2 1.6 – 1.8Provisions made during the period 0.5 0.1 29.8 – 30.3Provisions used during the period (0.3) (2.3) (3.4) – (5.9)Balance as at 26 February 2022 1.8 0.8 28.0 0.3 30.9Non-current – – – – –Current 1.8 0.8 28.0 0.3 30.9Balance as at 26 February 2022 1.8 0.8 28.0 0.3 30.9
ALLIANZ LITIGATIONDuring the current year, in relation to the ongoing legal dispute with Allianz Insurance plc, the Group recognised an additional charge of £29.8m as an estimate for accounting purposes of the potential costs of settlement or award and incurred and future legal costs.
Until 2014, JD Williams & Company Limited (“JDW”), a subsidiary of N Brown Group plc, sold (amongst other insurance products) payment protection insurance (“PPI”) to its customers when they bought JDW products. These insurance products were provided by Allianz Insurance plc (“the Insurer”) and sold by JDW as the Insurer’s agent. JDW was an unregulated entity prior to 14 January 2005 in respect of the sale of PPI. The regulated entity prior to 14 January 2005 was the Insurer.
In recent years, JDW and the Insurer have paid out significant amounts of redress to customers in respect of certain insurance products, including PPI.
In January 2020, a claim was issued against JDW by the Insurer in respect of all payments of redress the Insurer has made to JDW’s customers together with all associated costs. The Insurer has made a claim under the Civil Liability (Contribution) Act 1978 as well as on other bases.
On 5 March 2020 JDW served its Defence and Counterclaim which denied the Insurer’s claim and also made counterclaims seeking contributions from the Insurer towards the losses JDW has suffered in respect of two different types of insurance product provided by the Insurer. In particular, JDW counterclaimed in respect of £16m of redress it had paid to customers who had bought PPI before 14 January 2005, plus £64m of redress it had paid or tendered to customers who had bought a different type of policy, known as “Product Protection”, between 2006 and 2014.
On 9 April 2020 the Insurer served a Reply and Defence to JDW’s Counterclaim. This document disputed the counterclaims and maintained the claim.
On 10 June 2021 the Insurer sought leave to increase the scope of its original claim in relation to a further customer redress exercise (“the Additional Cohort”), that JDW understands is still ongoing. The Insurer pleaded that the value of this additional element of the claim was up to £36m. The Insurer also revised the value of its original claim to £30m plus interest.
JDW subsequently filed and served its amended Defence as per the Court’s timetable. More recently, JDW has further amended its Defence to bring into account the redress liabilities that it has borne without assistance from the Insurer in respect of customers who bought PPI on or after 14 January 2005, which it estimates at not less than £40 million. JDW says that the Court should take this into account, and that this should extinguish or diminish the Insurer’s claims.
The two parties held a mediation meeting on 20 April 2022, which did not resolve the differences between them.
All claims made by the Insurer, and counterclaims by JDW, remain subject to final determination by the Court, both as to their success and their financial value. The claims, defences and counterclaims are complex. Both parties will submit factual and expert witness evidence in relation to the dispute over the coming months.
FIN
AN
CIA
L S
TAT
EM
EN
TS
GO
VE
RN
AN
CE
RE
PO
RT
ST
RA
TE
GIC
RE
PO
RT
N Brown Group plc Annual Report and Accounts 2022 nbrown.co.uk 139
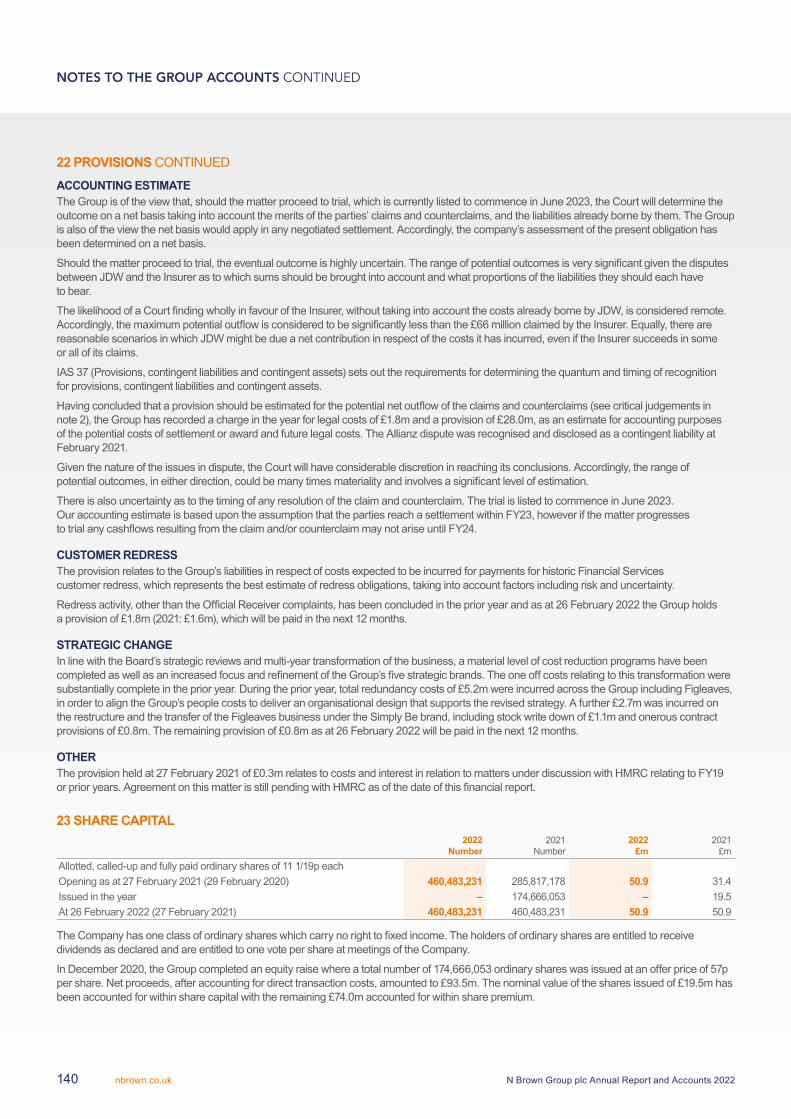
22 PROVISIONS CONTINUED
ACCOUNTING ESTIMATEThe Group is of the view that, should the matter proceed to trial, which is currently listed to commence in June 2023, the Court will determine the outcome on a net basis taking into account the merits of the parties’ claims and counterclaims, and the liabilities already borne by them. The Group is also of the view the net basis would apply in any negotiated settlement. Accordingly, the company’s assessment of the present obligation has been determined on a net basis.
Should the matter proceed to trial, the eventual outcome is highly uncertain. The range of potential outcomes is very significant given the disputes between JDW and the Insurer as to which sums should be brought into account and what proportions of the liabilities they should each have to bear.
The likelihood of a Court finding wholly in favour of the Insurer, without taking into account the costs already borne by JDW, is considered remote. Accordingly, the maximum potential outflow is considered to be significantly less than the £66 million claimed by the Insurer. Equally, there are reasonable scenarios in which JDW might be due a net contribution in respect of the costs it has incurred, even if the Insurer succeeds in some or all of its claims.
IAS 37 (Provisions, contingent liabilities and contingent assets) sets out the requirements for determining the quantum and timing of recognition for provisions, contingent liabilities and contingent assets.
Having concluded that a provision should be estimated for the potential net outflow of the claims and counterclaims (see critical judgements in note 2), the Group has recorded a charge in the year for legal costs of £1.8m and a provision of £28.0m, as an estimate for accounting purposes of the potential costs of settlement or award and future legal costs. The Allianz dispute was recognised and disclosed as a contingent liability at February 2021.
Given the nature of the issues in dispute, the Court will have considerable discretion in reaching its conclusions. Accordingly, the range of potential outcomes, in either direction, could be many times materiality and involves a significant level of estimation.
There is also uncertainty as to the timing of any resolution of the claim and counterclaim. The trial is listed to commence in June 2023. Our accounting estimate is based upon the assumption that the parties reach a settlement within FY23, however if the matter progresses to trial any cashflows resulting from the claim and/or counterclaim may not arise until FY24.
CUSTOMER REDRESSThe provision relates to the Group’s liabilities in respect of costs expected to be incurred for payments for historic Financial Services customer redress, which represents the best estimate of redress obligations, taking into account factors including risk and uncertainty.
Redress activity, other than the Official Receiver complaints, has been concluded in the prior year and as at 26 February 2022 the Group holds a provision of £1.8m (2021: £1.6m), which will be paid in the next 12 months.
STRATEGIC CHANGEIn line with the Board’s strategic reviews and multi-year transformation of the business, a material level of cost reduction programs have been completed as well as an increased focus and refinement of the Group’s five strategic brands. The one off costs relating to this transformation were substantially complete in the prior year. During the prior year, total redundancy costs of £5.2m were incurred across the Group including Figleaves, in order to align the Group’s people costs to deliver an organisational design that supports the revised strategy. A further £2.7m was incurred on the restructure and the transfer of the Figleaves business under the Simply Be brand, including stock write down of £1.1m and onerous contract provisions of £0.8m. The remaining provision of £0.8m as at 26 February 2022 will be paid in the next 12 months.
OTHERThe provision held at 27 February 2021 of £0.3m relates to costs and interest in relation to matters under discussion with HMRC relating to FY19 or prior years. Agreement on this matter is still pending with HMRC as of the date of this financial report.
23 SHARE CAPITAL2022
Number2021
Number2022
£m2021
£mAllotted, called-up and fully paid ordinary shares of 11 1/19p eachOpening as at 27 February 2021 (29 February 2020) 460,483,231 285,817,178 50.9 31.4Issued in the year – 174,666,053 – 19.5At 26 February 2022 (27 February 2021) 460,483,231 460,483,231 50.9 50.9
The Company has one class of ordinary shares which carry no right to fixed income. The holders of ordinary shares are entitled to receive dividends as declared and are entitled to one vote per share at meetings of the Company.
In December 2020, the Group completed an equity raise where a total number of 174,666,053 ordinary shares was issued at an offer price of 57p per share. Net proceeds, after accounting for direct transaction costs, amounted to £93.5m. The nominal value of the shares issued of £19.5m has been accounted for within share capital with the remaining £74.0m accounted for within share premium.
NOTES TO THE GROUP ACCOUNTS CONTINUED
N Brown Group plc Annual Report and Accounts 2022nbrown.co.uk140
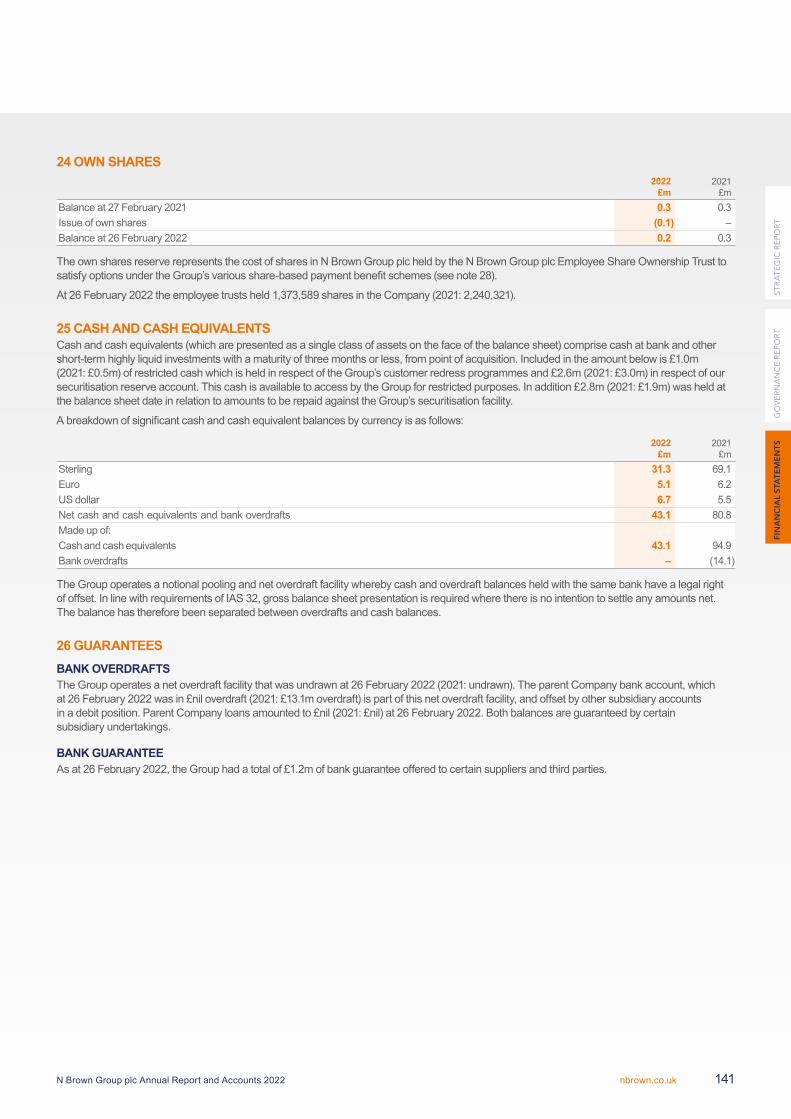
24 OWN SHARES2022
£m2021
£mBalance at 27 February 2021 0.3 0.3Issue of own shares (0.1) –Balance at 26 February 2022 0.2 0.3
The own shares reserve represents the cost of shares in N Brown Group plc held by the N Brown Group plc Employee Share Ownership Trust to satisfy options under the Group’s various share-based payment benefit schemes (see note 28).
At 26 February 2022 the employee trusts held 1,373,589 shares in the Company (2021: 2,240,321).
25 CASH AND CASH EQUIVALENTSCash and cash equivalents (which are presented as a single class of assets on the face of the balance sheet) comprise cash at bank and other short-term highly liquid investments with a maturity of three months or less, from point of acquisition. Included in the amount below is £1.0m (2021: £0.5m) of restricted cash which is held in respect of the Group’s customer redress programmes and £2.6m (2021: £3.0m) in respect of our securitisation reserve account. This cash is available to access by the Group for restricted purposes. In addition £2.8m (2021: £1.9m) was held at the balance sheet date in relation to amounts to be repaid against the Group’s securitisation facility.
A breakdown of significant cash and cash equivalent balances by currency is as follows:
2022£m
2021£m
Sterling 31.3 69.1Euro 5.1 6.2US dollar 6.7 5.5Net cash and cash equivalents and bank overdrafts 43.1 80.8Made up of:Cash and cash equivalents 43.1 94.9Bank overdrafts – (14.1)
The Group operates a notional pooling and net overdraft facility whereby cash and overdraft balances held with the same bank have a legal right of offset. In line with requirements of IAS 32, gross balance sheet presentation is required where there is no intention to settle any amounts net. The balance has therefore been separated between overdrafts and cash balances.
26 GUARANTEESBANK OVERDRAFTSThe Group operates a net overdraft facility that was undrawn at 26 February 2022 (2021: undrawn). The parent Company bank account, which at 26 February 2022 was in £nil overdraft (2021: £13.1m overdraft) is part of this net overdraft facility, and offset by other subsidiary accounts in a debit position. Parent Company loans amounted to £nil (2021: £nil) at 26 February 2022. Both balances are guaranteed by certain subsidiary undertakings.
BANK GUARANTEEAs at 26 February 2022, the Group had a total of £1.2m of bank guarantee offered to certain suppliers and third parties.
FIN
AN
CIA
L S
TAT
EM
EN
TS
GO
VE
RN
AN
CE
RE
PO
RT
ST
RA
TE
GIC
RE
PO
RT
N Brown Group plc Annual Report and Accounts 2022 nbrown.co.uk 141
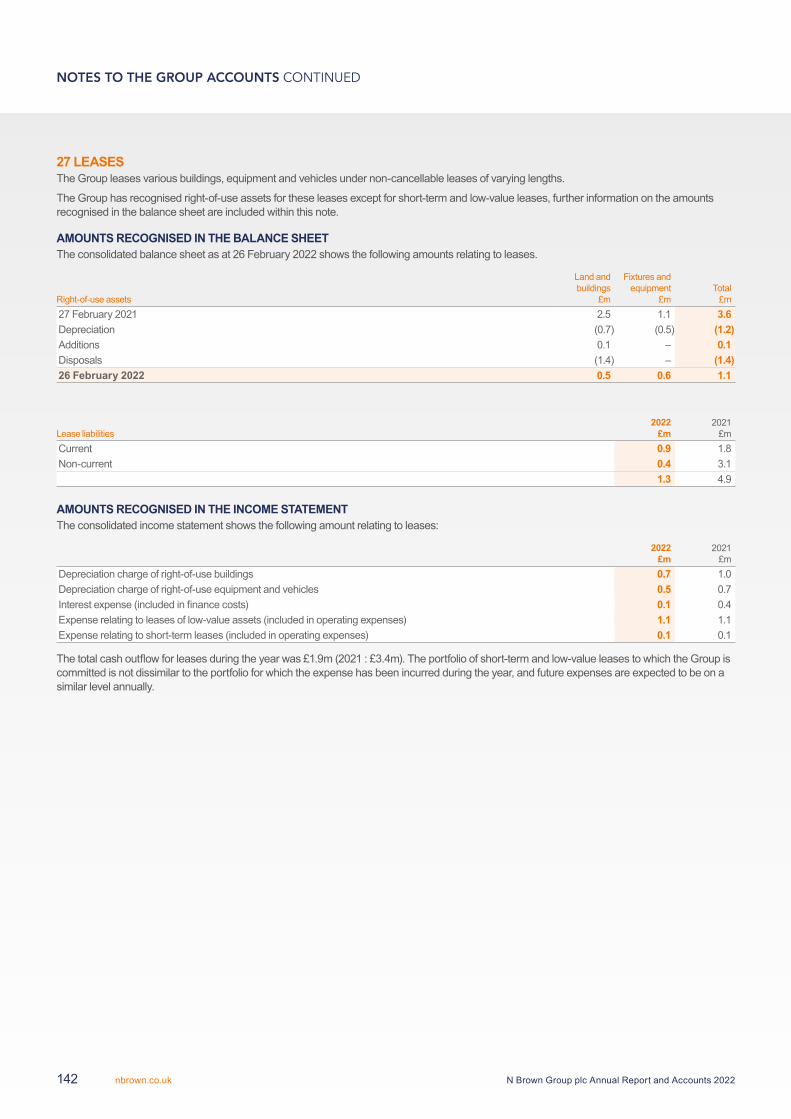
27 LEASESThe Group leases various buildings, equipment and vehicles under non-cancellable leases of varying lengths.
The Group has recognised right-of-use assets for these leases except for short-term and low-value leases, further information on the amounts recognised in the balance sheet are included within this note.
AMOUNTS RECOGNISED IN THE BALANCE SHEETThe consolidated balance sheet as at 26 February 2022 shows the following amounts relating to leases.
Right-of-use assets
Land and buildings
£m
Fixtures and equipment
£mTotal
£m27 February 2021 2.5 1.1 3.6Depreciation (0.7) (0.5) (1.2)Additions 0.1 – 0.1Disposals (1.4) – (1.4)26 February 2022 0.5 0.6 1.1
Lease liabilities2022
£m2021
£mCurrent 0.9 1.8Non-current 0.4 3.1
1.3 4.9
AMOUNTS RECOGNISED IN THE INCOME STATEMENTThe consolidated income statement shows the following amount relating to leases:
2022£m
2021£m
Depreciation charge of right-of-use buildings 0.7 1.0Depreciation charge of right-of-use equipment and vehicles 0.5 0.7Interest expense (included in finance costs) 0.1 0.4Expense relating to leases of low-value assets (included in operating expenses) 1.1 1.1Expense relating to short-term leases (included in operating expenses) 0.1 0.1
The total cash outflow for leases during the year was £1.9m (2021 : £3.4m). The portfolio of short-term and low-value leases to which the Group is committed is not dissimilar to the portfolio for which the expense has been incurred during the year, and future expenses are expected to be on a similar level annually.
NOTES TO THE GROUP ACCOUNTS CONTINUED
N Brown Group plc Annual Report and Accounts 2022nbrown.co.uk142
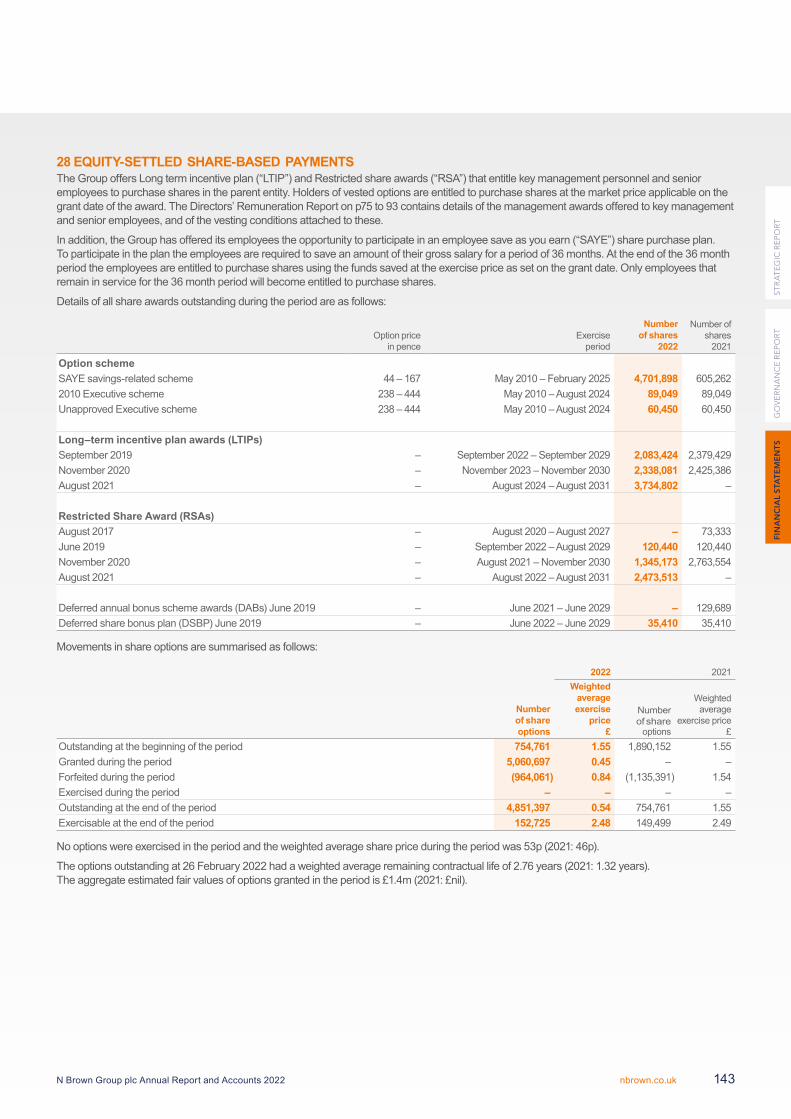
28 EQUITY-SETTLED SHARE-BASED PAYMENTSThe Group offers Long term incentive plan (“LTIP”) and Restricted share awards (“RSA”) that entitle key management personnel and senior employees to purchase shares in the parent entity. Holders of vested options are entitled to purchase shares at the market price applicable on the grant date of the award. The Directors’ Remuneration Report on p75 to 93 contains details of the management awards offered to key management and senior employees, and of the vesting conditions attached to these.
In addition, the Group has offered its employees the opportunity to participate in an employee save as you earn (“SAYE”) share purchase plan. To participate in the plan the employees are required to save an amount of their gross salary for a period of 36 months. At the end of the 36 month period the employees are entitled to purchase shares using the funds saved at the exercise price as set on the grant date. Only employees that remain in service for the 36 month period will become entitled to purchase shares.
Details of all share awards outstanding during the period are as follows:
Option pricein pence
Exerciseperiod
Number of shares
2022
Number of shares
2021
Option schemeSAYE savings-related scheme 44 – 167 May 2010 – February 2025 4,701,898 605,2622010 Executive scheme 238 – 444 May 2010 – August 2024 89,049 89,049Unapproved Executive scheme 238 – 444 May 2010 – August 2024 60,450 60,450
Long–term incentive plan awards (LTIPs)September 2019 – September 2022 – September 2029 2,083,424 2,379,429November 2020 – November 2023 – November 2030 2,338,081 2,425,386August 2021 – August 2024 – August 2031 3,734,802 –
Restricted Share Award (RSAs)August 2017 – August 2020 – August 2027 – 73,333June 2019 – September 2022 – August 2029 120,440 120,440November 2020 – August 2021 – November 2030 1,345,173 2,763,554August 2021 – August 2022 – August 2031 2,473,513 –
Deferred annual bonus scheme awards (DABs) June 2019 – June 2021 – June 2029 – 129,689Deferred share bonus plan (DSBP) June 2019 – June 2022 – June 2029 35,410 35,410
Movements in share options are summarised as follows:
2022 2021
Number of shareoptions
Weighted average exercise
price£
Number of share
options
Weighted average
exercise price£
Outstanding at the beginning of the period 754,761 1.55 1,890,152 1.55Granted during the period 5,060,697 0.45 – –Forfeited during the period (964,061) 0.84 (1,135,391) 1.54Exercised during the period – – – –Outstanding at the end of the period 4,851,397 0.54 754,761 1.55Exercisable at the end of the period 152,725 2.48 149,499 2.49
No options were exercised in the period and the weighted average share price during the period was 53p (2021: 46p).
The options outstanding at 26 February 2022 had a weighted average remaining contractual life of 2.76 years (2021: 1.32 years). The aggregate estimated fair values of options granted in the period is £1.4m (2021: £nil).
FIN
AN
CIA
L S
TAT
EM
EN
TS
GO
VE
RN
AN
CE
RE
PO
RT
ST
RA
TE
GIC
RE
PO
RT
N Brown Group plc Annual Report and Accounts 2022 nbrown.co.uk 143
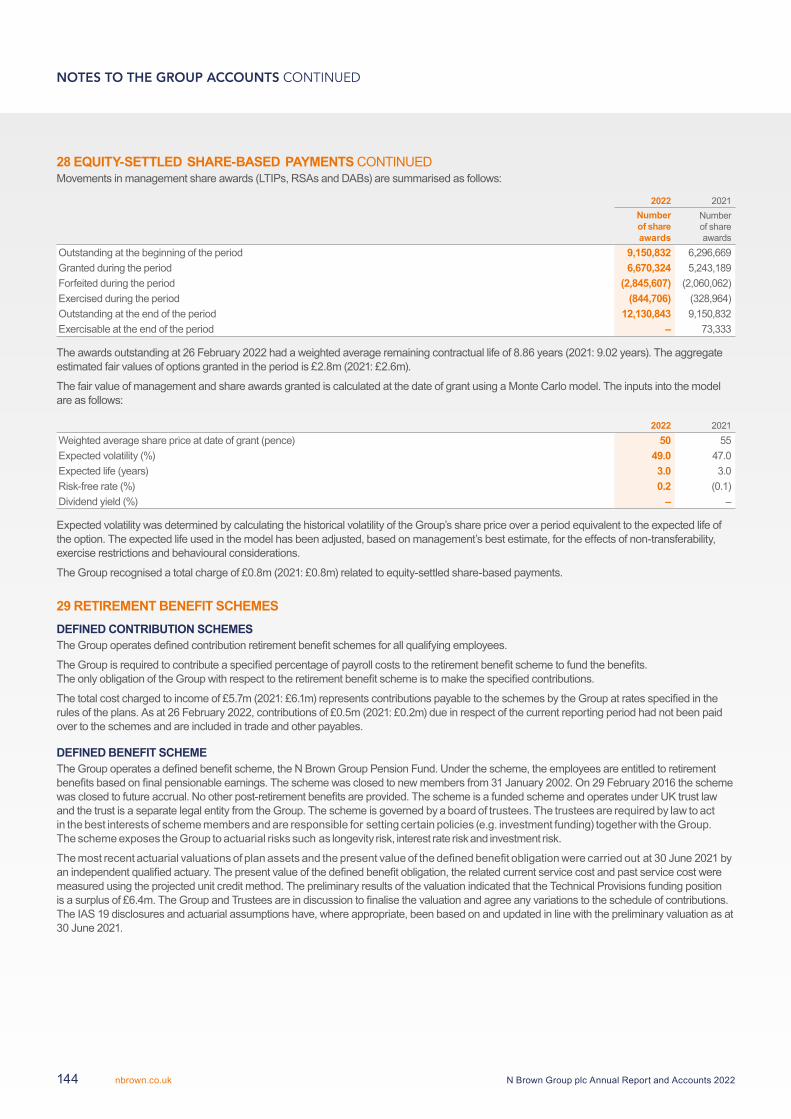
28 EQUITY-SETTLED SHARE-BASED PAYMENTS CONTINUEDMovements in management share awards (LTIPs, RSAs and DABs) are summarised as follows:
2022 2021Number of share awards
Number of shareawards
Outstanding at the beginning of the period 9,150,832 6,296,669Granted during the period 6,670,324 5,243,189Forfeited during the period (2,845,607) (2,060,062)Exercised during the period (844,706) (328,964)Outstanding at the end of the period 12,130,843 9,150,832Exercisable at the end of the period – 73,333
The awards outstanding at 26 February 2022 had a weighted average remaining contractual life of 8.86 years (2021: 9.02 years). The aggregate estimated fair values of options granted in the period is £2.8m (2021: £2.6m).
The fair value of management and share awards granted is calculated at the date of grant using a Monte Carlo model. The inputs into the model are as follows:
2022 2021Weighted average share price at date of grant (pence) 50 55Expected volatility (%) 49.0 47.0Expected life (years) 3.0 3.0Risk-free rate (%) 0.2 (0.1)Dividend yield (%) – –
Expected volatility was determined by calculating the historical volatility of the Group’s share price over a period equivalent to the expected life of the option. The expected life used in the model has been adjusted, based on management’s best estimate, for the effects of non-transferability, exercise restrictions and behavioural considerations.
The Group recognised a total charge of £0.8m (2021: £0.8m) related to equity-settled share-based payments.
29 RETIREMENT BENEFIT SCHEMESDEFINED CONTRIBUTION SCHEMESThe Group operates defined contribution retirement benefit schemes for all qualifying employees.
The Group is required to contribute a specified percentage of payroll costs to the retirement benefit scheme to fund the benefits. The only obligation of the Group with respect to the retirement benefit scheme is to make the specified contributions.
The total cost charged to income of £5.7m (2021: £6.1m) represents contributions payable to the schemes by the Group at rates specified in the rules of the plans. As at 26 February 2022, contributions of £0.5m (2021: £0.2m) due in respect of the current reporting period had not been paid over to the schemes and are included in trade and other payables.
DEFINED BENEFIT SCHEMEThe Group operates a defined benefit scheme, the N Brown Group Pension Fund. Under the scheme, the employees are entitled to retirement benefits based on final pensionable earnings. The scheme was closed to new members from 31 January 2002. On 29 February 2016 the scheme was closed to future accrual. No other post-retirement benefits are provided. The scheme is a funded scheme and operates under UK trust law and the trust is a separate legal entity from the Group. The scheme is governed by a board of trustees. The trustees are required by law to act in the best interests of scheme members and are responsible for setting certain policies (e.g. investment funding) together with the Group. The scheme exposes the Group to actuarial risks such as longevity risk, interest rate risk and investment risk.
The most recent actuarial valuations of plan assets and the present value of the defined benefit obligation were carried out at 30 June 2021 by an independent qualified actuary. The present value of the defined benefit obligation, the related current service cost and past service cost were measured using the projected unit credit method. The preliminary results of the valuation indicated that the Technical Provisions funding position is a surplus of £6.4m. The Group and Trustees are in discussion to finalise the valuation and agree any variations to the schedule of contributions. The IAS 19 disclosures and actuarial assumptions have, where appropriate, been based on and updated in line with the preliminary valuation as at 30 June 2021.
NOTES TO THE GROUP ACCOUNTS CONTINUED
N Brown Group plc Annual Report and Accounts 2022nbrown.co.uk144
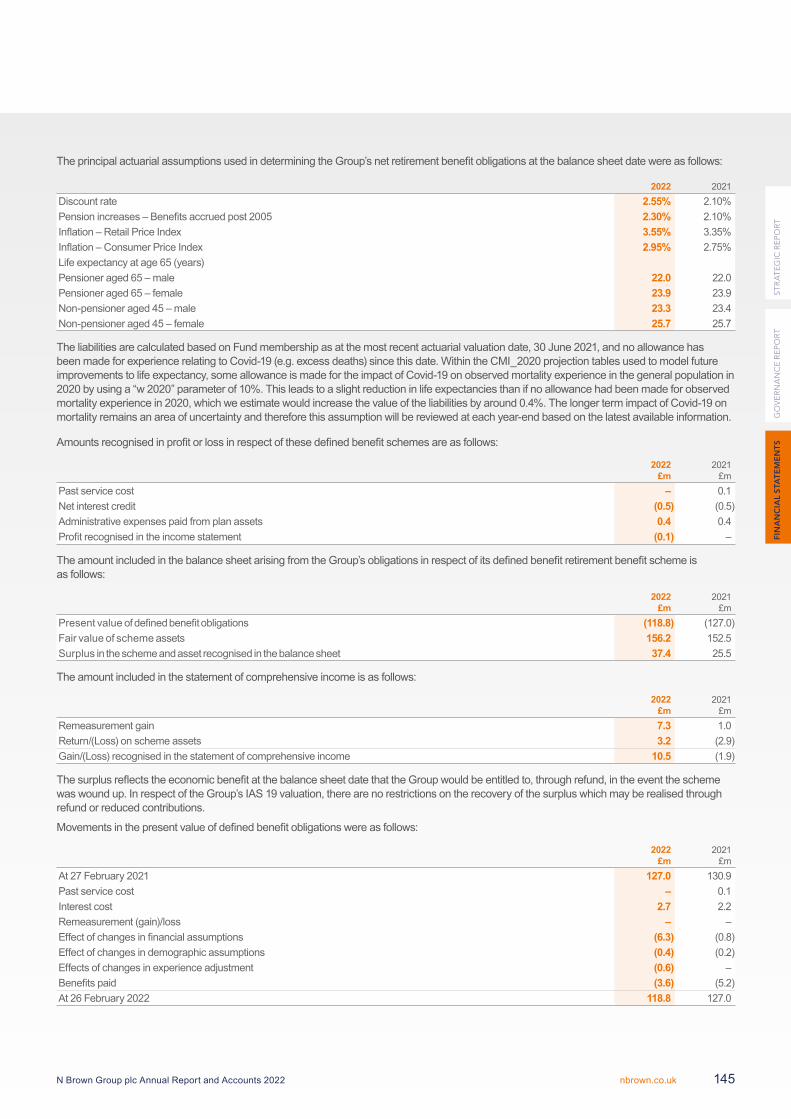
The principal actuarial assumptions used in determining the Group’s net retirement benefit obligations at the balance sheet date were as follows:
2022 2021Discount rate 2.55% 2.10%Pension increases – Benefits accrued post 2005 2.30% 2.10%Inflation – Retail Price Index 3.55% 3.35%Inflation – Consumer Price Index 2.95% 2.75%Life expectancy at age 65 (years)Pensioner aged 65 – male 22.0 22.0Pensioner aged 65 – female 23.9 23.9Non-pensioner aged 45 – male 23.3 23.4Non-pensioner aged 45 – female 25.7 25.7
The liabilities are calculated based on Fund membership as at the most recent actuarial valuation date, 30 June 2021, and no allowance has been made for experience relating to Covid-19 (e.g. excess deaths) since this date. Within the CMI_2020 projection tables used to model future improvements to life expectancy, some allowance is made for the impact of Covid-19 on observed mortality experience in the general population in 2020 by using a “w 2020” parameter of 10%. This leads to a slight reduction in life expectancies than if no allowance had been made for observed mortality experience in 2020, which we estimate would increase the value of the liabilities by around 0.4%. The longer term impact of Covid-19 on mortality remains an area of uncertainty and therefore this assumption will be reviewed at each year-end based on the latest available information.
Amounts recognised in profit or loss in respect of these defined benefit schemes are as follows:
2022£m
2021£m
Past service cost – 0.1Net interest credit (0.5) (0.5)Administrative expenses paid from plan assets 0.4 0.4Profit recognised in the income statement (0.1) –
The amount included in the balance sheet arising from the Group’s obligations in respect of its defined benefit retirement benefit scheme is as follows:
2022£m
2021£m
Present value of defined benefit obligations (118.8) (127.0)Fair value of scheme assets 156.2 152.5Surplus in the scheme and asset recognised in the balance sheet 37.4 25.5
The amount included in the statement of comprehensive income is as follows:
2022£m
2021£m
Remeasurement gain 7.3 1.0Return/(Loss) on scheme assets 3.2 (2.9)Gain/(Loss) recognised in the statement of comprehensive income 10.5 (1.9)
The surplus reflects the economic benefit at the balance sheet date that the Group would be entitled to, through refund, in the event the scheme was wound up. In respect of the Group’s IAS 19 valuation, there are no restrictions on the recovery of the surplus which may be realised through refund or reduced contributions.
Movements in the present value of defined benefit obligations were as follows:
2022£m
2021£m
At 27 February 2021 127.0 130.9Past service cost – 0.1Interest cost 2.7 2.2Remeasurement (gain)/loss – –Effect of changes in financial assumptions (6.3) (0.8)Effect of changes in demographic assumptions (0.4) (0.2)Effects of changes in experience adjustment (0.6) –Benefits paid (3.6) (5.2)At 26 February 2022 118.8 127.0
FIN
AN
CIA
L S
TAT
EM
EN
TS
GO
VE
RN
AN
CE
RE
PO
RT
ST
RA
TE
GIC
RE
PO
RT
N Brown Group plc Annual Report and Accounts 2022 nbrown.co.uk 145
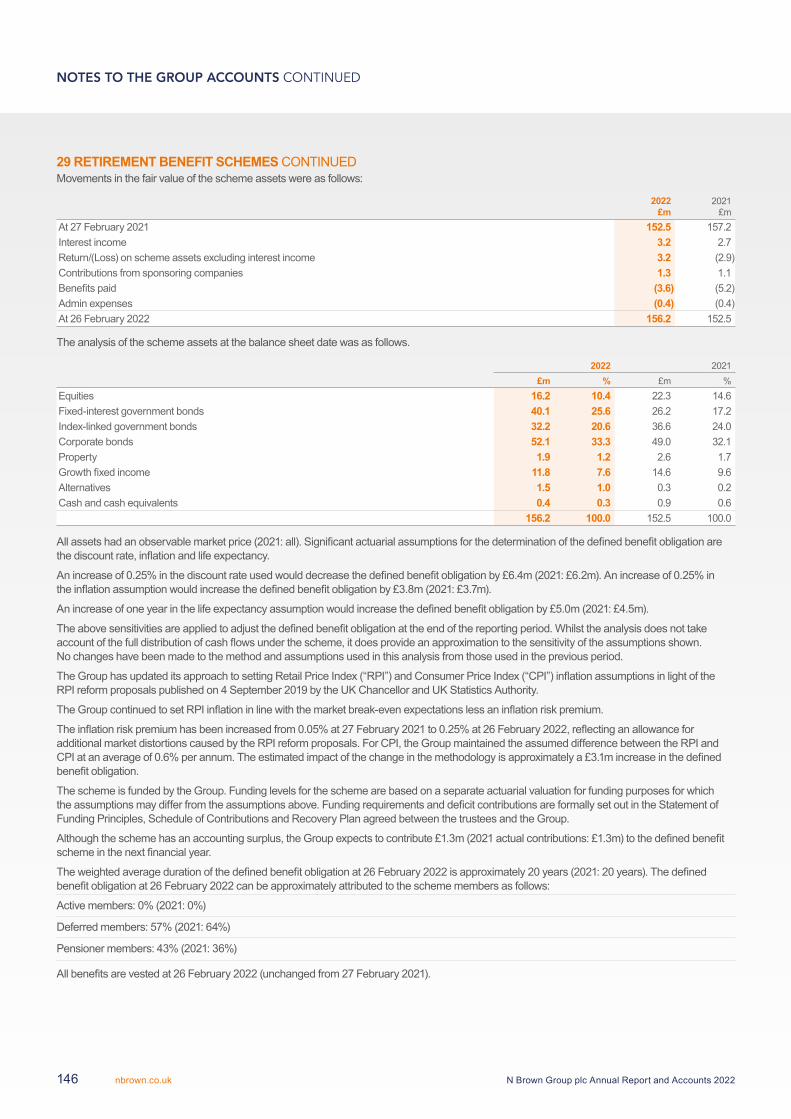
29 RETIREMENT BENEFIT SCHEMES CONTINUEDMovements in the fair value of the scheme assets were as follows:
2022£m
2021£m
At 27 February 2021 152.5 157.2Interest income 3.2 2.7Return/(Loss) on scheme assets excluding interest income 3.2 (2.9)Contributions from sponsoring companies 1.3 1.1Benefits paid (3.6) (5.2)Admin expenses (0.4) (0.4)At 26 February 2022 156.2 152.5
The analysis of the scheme assets at the balance sheet date was as follows.
2022 2021£m % £m %
Equities 16.2 10.4 22.3 14.6Fixed-interest government bonds 40.1 25.6 26.2 17.2Index-linked government bonds 32.2 20.6 36.6 24.0Corporate bonds 52.1 33.3 49.0 32.1Property 1.9 1.2 2.6 1.7Growth fixed income 11.8 7.6 14.6 9.6Alternatives 1.5 1.0 0.3 0.2Cash and cash equivalents 0.4 0.3 0.9 0.6
156.2 100.0 152.5 100.0
All assets had an observable market price (2021: all). Significant actuarial assumptions for the determination of the defined benefit obligation are the discount rate, inflation and life expectancy.
An increase of 0.25% in the discount rate used would decrease the defined benefit obligation by £6.4m (2021: £6.2m). An increase of 0.25% in the inflation assumption would increase the defined benefit obligation by £3.8m (2021: £3.7m).
An increase of one year in the life expectancy assumption would increase the defined benefit obligation by £5.0m (2021: £4.5m).
The above sensitivities are applied to adjust the defined benefit obligation at the end of the reporting period. Whilst the analysis does not take account of the full distribution of cash flows under the scheme, it does provide an approximation to the sensitivity of the assumptions shown. No changes have been made to the method and assumptions used in this analysis from those used in the previous period.
The Group has updated its approach to setting Retail Price Index (“RPI”) and Consumer Price Index (“CPI”) inflation assumptions in light of the RPI reform proposals published on 4 September 2019 by the UK Chancellor and UK Statistics Authority.
The Group continued to set RPI inflation in line with the market break-even expectations less an inflation risk premium.
The inflation risk premium has been increased from 0.05% at 27 February 2021 to 0.25% at 26 February 2022, reflecting an allowance for additional market distortions caused by the RPI reform proposals. For CPI, the Group maintained the assumed difference between the RPI and CPI at an average of 0.6% per annum. The estimated impact of the change in the methodology is approximately a £3.1m increase in the defined benefit obligation.
The scheme is funded by the Group. Funding levels for the scheme are based on a separate actuarial valuation for funding purposes for which the assumptions may differ from the assumptions above. Funding requirements and deficit contributions are formally set out in the Statement of Funding Principles, Schedule of Contributions and Recovery Plan agreed between the trustees and the Group.
Although the scheme has an accounting surplus, the Group expects to contribute £1.3m (2021 actual contributions: £1.3m) to the defined benefit scheme in the next financial year.
The weighted average duration of the defined benefit obligation at 26 February 2022 is approximately 20 years (2021: 20 years). The defined benefit obligation at 26 February 2022 can be approximately attributed to the scheme members as follows:
Active members: 0% (2021: 0%)
Deferred members: 57% (2021: 64%)
Pensioner members: 43% (2021: 36%)
All benefits are vested at 26 February 2022 (unchanged from 27 February 2021).
NOTES TO THE GROUP ACCOUNTS CONTINUED
N Brown Group plc Annual Report and Accounts 2022nbrown.co.uk146
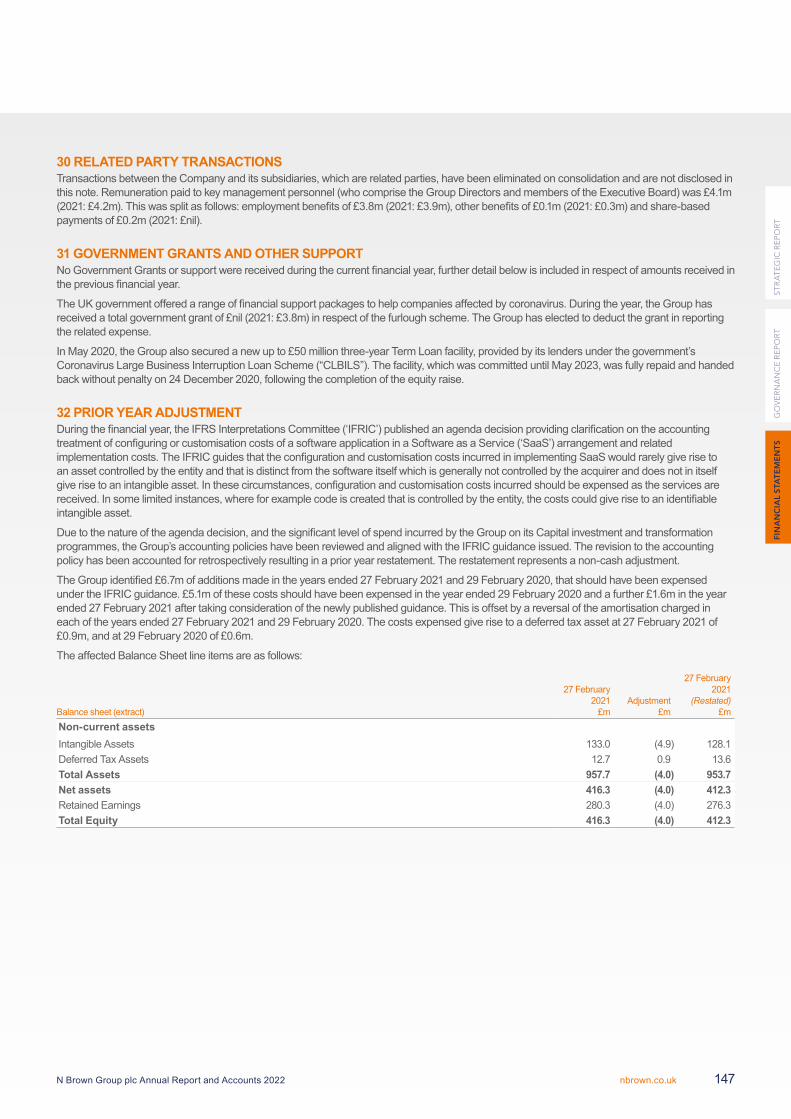
30 RELATED PARTY TRANSACTIONSTransactions between the Company and its subsidiaries, which are related parties, have been eliminated on consolidation and are not disclosed in this note. Remuneration paid to key management personnel (who comprise the Group Directors and members of the Executive Board) was £4.1m (2021: £4.2m). This was split as follows: employment benefits of £3.8m (2021: £3.9m), other benefits of £0.1m (2021: £0.3m) and share-based payments of £0.2m (2021: £nil).
31 GOVERNMENT GRANTS AND OTHER SUPPORTNo Government Grants or support were received during the current financial year, further detail below is included in respect of amounts received in the previous financial year.
The UK government offered a range of financial support packages to help companies affected by coronavirus. During the year, the Group has received a total government grant of £nil (2021: £3.8m) in respect of the furlough scheme. The Group has elected to deduct the grant in reporting the related expense.
In May 2020, the Group also secured a new up to £50 million three-year Term Loan facility, provided by its lenders under the government’s Coronavirus Large Business Interruption Loan Scheme (“CLBILS”). The facility, which was committed until May 2023, was fully repaid and handed back without penalty on 24 December 2020, following the completion of the equity raise.
32 PRIOR YEAR ADJUSTMENTDuring the financial year, the IFRS Interpretations Committee (‘IFRIC’) published an agenda decision providing clarification on the accounting treatment of configuring or customisation costs of a software application in a Software as a Service (‘SaaS’) arrangement and related implementation costs. The IFRIC guides that the configuration and customisation costs incurred in implementing SaaS would rarely give rise to an asset controlled by the entity and that is distinct from the software itself which is generally not controlled by the acquirer and does not in itself give rise to an intangible asset. In these circumstances, configuration and customisation costs incurred should be expensed as the services are received. In some limited instances, where for example code is created that is controlled by the entity, the costs could give rise to an identifiable intangible asset.
Due to the nature of the agenda decision, and the significant level of spend incurred by the Group on its Capital investment and transformation programmes, the Group’s accounting policies have been reviewed and aligned with the IFRIC guidance issued. The revision to the accounting policy has been accounted for retrospectively resulting in a prior year restatement. The restatement represents a non-cash adjustment.
The Group identified £6.7m of additions made in the years ended 27 February 2021 and 29 February 2020, that should have been expensed under the IFRIC guidance. £5.1m of these costs should have been expensed in the year ended 29 February 2020 and a further £1.6m in the year ended 27 February 2021 after taking consideration of the newly published guidance. This is offset by a reversal of the amortisation charged in each of the years ended 27 February 2021 and 29 February 2020. The costs expensed give rise to a deferred tax asset at 27 February 2021 of £0.9m, and at 29 February 2020 of £0.6m.
The affected Balance Sheet line items are as follows:
Balance sheet (extract)
27 February 2021
£mAdjustment
£m
27 February 2021
(Restated)£m
Non-current assetsIntangible Assets 133.0 (4.9) 128.1Deferred Tax Assets 12.7 0.9 13.6Total Assets 957.7 (4.0) 953.7Net assets 416.3 (4.0) 412.3Retained Earnings 280.3 (4.0) 276.3Total Equity 416.3 (4.0) 412.3
FIN
AN
CIA
L S
TAT
EM
EN
TS
GO
VE
RN
AN
CE
RE
PO
RT
ST
RA
TE
GIC
RE
PO
RT
N Brown Group plc Annual Report and Accounts 2022 nbrown.co.uk 147
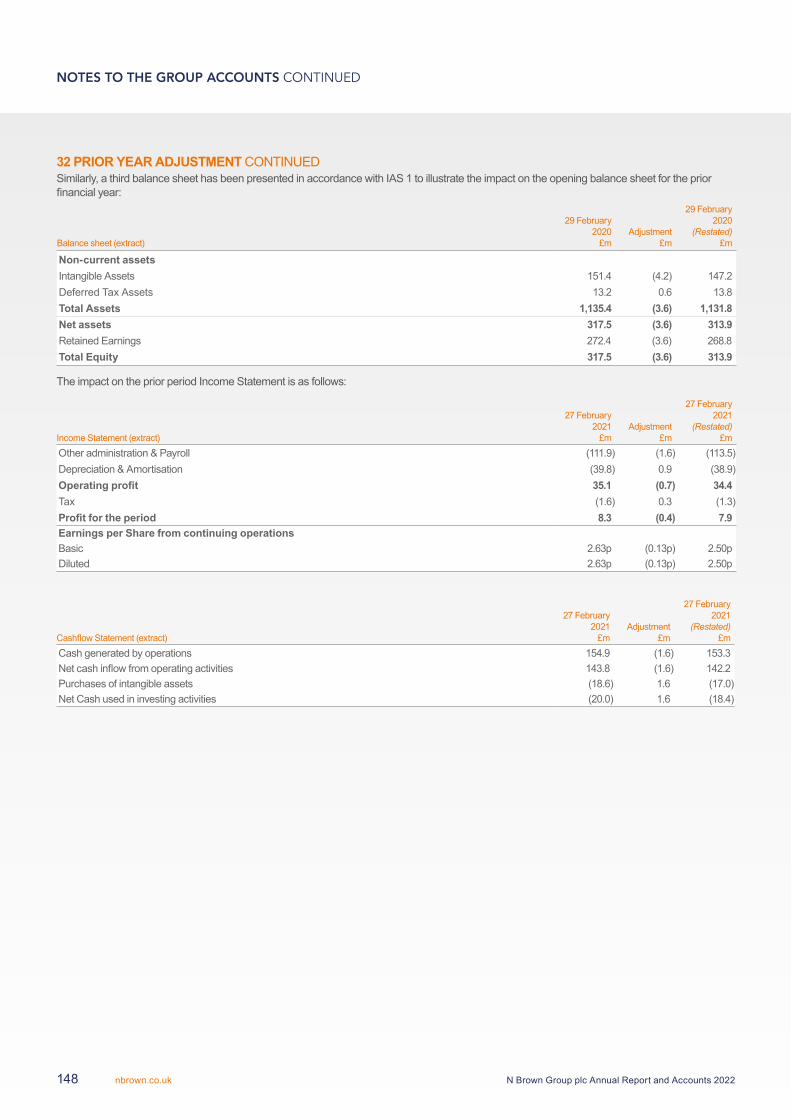
32 PRIOR YEAR ADJUSTMENT CONTINUEDSimilarly, a third balance sheet has been presented in accordance with IAS 1 to illustrate the impact on the opening balance sheet for the prior financial year:
Balance sheet (extract)
29 February 2020
£mAdjustment
£m
29 February 2020
(Restated)£m
Non-current assetsIntangible Assets 151.4 (4.2) 147.2Deferred Tax Assets 13.2 0.6 13.8Total Assets 1,135.4 (3.6) 1,131.8Net assets 317.5 (3.6) 313.9Retained Earnings 272.4 (3.6) 268.8Total Equity 317.5 (3.6) 313.9
The impact on the prior period Income Statement is as follows:
Income Statement (extract)
27 February 2021
£mAdjustment
£m
27 February 2021
(Restated)£m
Other administration & Payroll (111.9) (1.6) (113.5)Depreciation & Amortisation (39.8) 0.9 (38.9)Operating profit 35.1 (0.7) 34.4Tax (1.6) 0.3 (1.3)Profit for the period 8.3 (0.4) 7.9Earnings per Share from continuing operationsBasic 2.63p (0.13p) 2.50pDiluted 2.63p (0.13p) 2.50p
Cashflow Statement (extract)
27 February 2021
£mAdjustment
£m
27 February 2021
(Restated)£m
Cash generated by operations 154.9 (1.6) 153.3Net cash inflow from operating activities 143.8 (1.6) 142.2Purchases of intangible assets (18.6) 1.6 (17.0)Net Cash used in investing activities (20.0) 1.6 (18.4)
NOTES TO THE GROUP ACCOUNTS CONTINUED
N Brown Group plc Annual Report and Accounts 2022nbrown.co.uk148
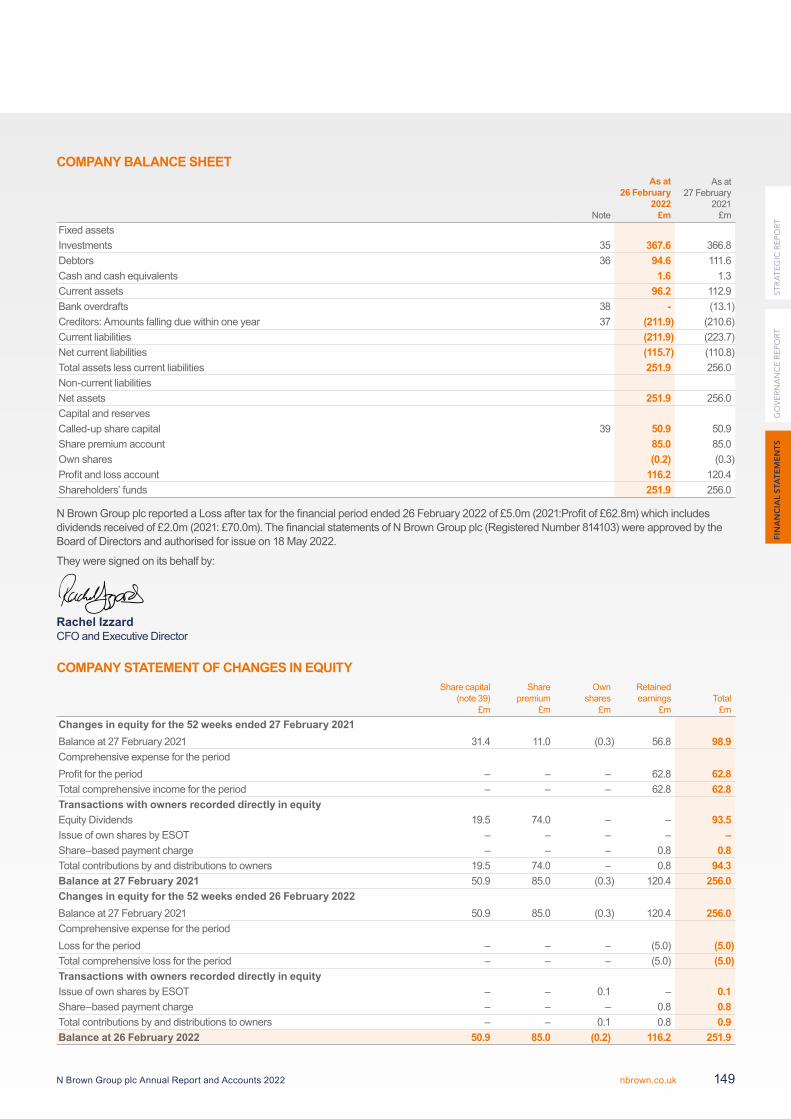
COMPANY BALANCE SHEET
Note
As at 26 February
2022£m
As at 27 February
2021£m
Fixed assetsInvestments 35 367.6 366.8Debtors 36 94.6 111.6Cash and cash equivalents 1.6 1.3Current assets 96.2 112.9Bank overdrafts 38 - (13.1)Creditors: Amounts falling due within one year 37 (211.9) (210.6)Current liabilities (211.9) (223.7)Net current liabilities (115.7) (110.8)Total assets less current liabilities 251.9 256.0Non-current liabilitiesNet assets 251.9 256.0Capital and reservesCalled-up share capital 39 50.9 50.9Share premium account 85.0 85.0Own shares (0.2) (0.3)Profit and loss account 116.2 120.4Shareholders’ funds 251.9 256.0
N Brown Group plc reported a Loss after tax for the financial period ended 26 February 2022 of £5.0m (2021:Profit of £62.8m) which includes dividends received of £2.0m (2021: £70.0m). The financial statements of N Brown Group plc (Registered Number 814103) were approved by the Board of Directors and authorised for issue on 18 May 2022.
They were signed on its behalf by:
Rachel IzzardCFO and Executive Director
COMPANY STATEMENT OF CHANGES IN EQUITYShare capital
(note 39)£m
Share premium
£m
Own shares
£m
Retained earnings
£mTotal
£mChanges in equity for the 52 weeks ended 27 February 2021Balance at 27 February 2021 31.4 11.0 (0.3) 56.8 98.9Comprehensive expense for the periodProfit for the period – – – 62.8 62.8Total comprehensive income for the period – – – 62.8 62.8Transactions with owners recorded directly in equityEquity Dividends 19.5 74.0 – – 93.5Issue of own shares by ESOT – – – – –Share–based payment charge – – – 0.8 0.8Total contributions by and distributions to owners 19.5 74.0 – 0.8 94.3Balance at 27 February 2021 50.9 85.0 (0.3) 120.4 256.0Changes in equity for the 52 weeks ended 26 February 2022Balance at 27 February 2021 50.9 85.0 (0.3) 120.4 256.0Comprehensive expense for the periodLoss for the period – – – (5.0) (5.0)Total comprehensive loss for the period – – – (5.0) (5.0)Transactions with owners recorded directly in equityIssue of own shares by ESOT – – 0.1 – 0.1Share–based payment charge – – – 0.8 0.8Total contributions by and distributions to owners – – 0.1 0.8 0.9Balance at 26 February 2022 50.9 85.0 (0.2) 116.2 251.9
FIN
AN
CIA
L S
TAT
EM
EN
TS
GO
VE
RN
AN
CE
RE
PO
RT
ST
RA
TE
GIC
RE
PO
RT
N Brown Group plc Annual Report and Accounts 2022 nbrown.co.uk 149
33 SIGNIFICANT ACCOUNTING POLICIESBASIS OF ACCOUNTINGN Brown Group plc (“the Company”) is a company incorporated and domiciled in the UK. These financial statements present information about the Company as an individual undertaking and not about its Group. These financial statements were prepared in accordance with Financial Reporting Standard 101 Reduced Disclosure Framework (“FRS 101”).
In preparing these financial statements, the Company applies the recognition, measurement and disclosure requirements of international accounting standards in conformity with the requirements of the Companies Act 2006 and has set out below where advantage of the FRS 101 disclosure exemptions has been taken.
The Company is the ultimate parent undertaking of the Group and also prepares consolidated financial statements.
The consolidated financial statements of N Brown Group plc are prepared in accordance with international accounting standards in conformity with the requirements of the Companies Act 2006 and are available to the public and may be obtained from its registered office address.
In these financial statements, the Company has applied the exemptions available under FRS 101 in respect of the following disclosures:
Company cash flow statement and related notes;
Disclosures in respect of transactions with wholly owned subsidiaries;
Disclosures in respect of capital management;
The effects of new but not yet effective IFRSs; and
Disclosures in respect of the compensation of key management personnel.
As the consolidated financial statements of N Brown Group plc include equivalent disclosures the Company has also taken exemptions under FRS 101 available in respect of the following disclosures:
Certain disclosures required by IFRS 13 Fair Value Measurement;
Disclosures required by IFRS 7 Financial Instrument Disclosures; and
Disclosures required by IFRS 2 Share-based payment.
GOING CONCERNFor the reasons set out below, the Directors of the Company believe that it remains appropriate to prepare the financial statements on a going concern basis. The Company is relying on the Going Concern assessment performed for the purposes of the Group.
After reviewing the Group’s forecasts and risk assessments, the Directors have formed a judgement at the time of approving the financial statements, that there is a reasonable expectation that the Group and the Company have adequate resources to continue in operational existence for the 12 months from the date of signing this Annual Report & Accounts. For this reason, the Directors continue to adopt the going concern basis in preparing the financial statements.
In arriving at their opinion, the Directors considered the following:
a) the Group’s cash flow forecasts and revenue projections for the 12 months from the date of signing these results (the “Base Case”), reflecting, amongst other things the following assumptions:
The business continues to be fully operational in the event of any potential further developments associated with the Covid-19 pandemic, as has been the case since the outset;
Product gross margin growth is expected year on year and will be achieved through changes to product mix, planned price increases. It is recognised that we will continue to face a highly promotional retail market, inflationary pressures and industry wide increases in freight rates and supply chain challenges;
Financial Services revenue reduces marginally as the average size of the loan book is smaller as a function of lower product sales during the pandemic;
FS gross margin reduces as the abnormally low levels of arrears and write offs stabilise following the end of Covid-19 government support and the customer expected credit loss behaviour experiences a level of stress from the inflationary pressures on our customers; and
Increases to operating costs reflecting inflationary cost base pressures and the continuation of strategic above the line brand investment, net of mitigating actions.
b) the impact on trading performance of severe but plausible downside scenarios (the “Downside Case”), including:
Adverse macroeconomic conditions impacting customer behaviour;
Current inflationary pressures, supply chain pressures and unusually high freight rates have more material impact on gross margins that the base case;
Covid-19 related absences requiring the use of contractors to fill staff shortages;
NOTES TO THE COMPANY ACCOUNTS
N Brown Group plc Annual Report and Accounts 2022nbrown.co.uk150
Business interruptions reducing product revenue, for example from a denial of service caused by a cyber attack or delivery delays caused by driver shortages;
Exceptional cash outflow higher than the accounting provisions with regards to the ongoing legal claim with Allianz.
The Downside Case also includes additional sensitivities to product revenue, customer bad debt write off, customer account payment collection rates and the cost base.
The Downside Case represents the compounded impact of all the scenarios with the sensitivities layered on top. Material total accessible liquidity headroom exists of greater than £100m throughout the Downside assessment.
c) the committed facilities available to the Group and the covenants thereon. Details of the Group’s committed facilities are set out in note 17, the main components of which are:
A £400m securitisation facility committed until December 2024, drawings on which are linked to prevailing levels of eligible receivables (£305.5m drawn against an accessible £365.6m based on the maximum of eligible customer receivables at 26 February 2022);
An RCF of £100m committed until December 2023, which is fully undrawn; and
An overdraft facility of £12.5m which is subject to an annual review every July (undrawn as at date of signing of these accounts).
d) that there are no forecast breaches of any covenants in either the Base Case or Downside Case. Material headroom exists within the banking covenants and EBITDA within the base case and the downside, EBITDA would have to more than halve against the downside in FY23 to breach conditions.
e) the Group’s robust policy towards liquidity and cash flow management. As at 30 April 2022, the Group had cash of £31.8m, net of restricted cash of £3.6m and undrawn secured facilities of £69.3m. In addition, the Group had £112.5m of unsecured facilities that were not drawn. This gives rise to total accessible liquidity (“TAL”) of £210.0m (FY22: £212.1m).
f) The Group’s clear capital allocation policy that prioritises meeting its’ liabilities for day to day operations of the business over investment in the delivering the strategy or distributions to shareholders.
g) the Group management’s ability to successfully manage the principal risks and uncertainties outlined on p32 to 37 during periods of uncertain economic outlook and challenging macro-economic conditions.
INVESTMENTSFixed asset investments in subsidiaries are shown at cost less provision for impairment.
IMPAIRMENTAt each balance sheet date, the Company reviews the carrying value of its investments to determine whether there is any indication that those investments have suffered an impairment loss. If any such indication exists, the recoverable amount of the investment is estimated in order to determine the extent of the impairment loss (if any). Recoverable amount is the higher of fair value less costs to sell and value in use. In assessing value in use, the estimated future cash flows are discounted to their present value using a discount rate that reflects current market assessments of the time value of money and the risks specific to the asset for which the estimates of future cash flows have not been adjusted.
If the recoverable amount of an investment is estimated to be less than its carrying amount, the carrying amount of the asset (cash-generating unit) is reduced to its recoverable amount. An impairment loss is recognised as an expense immediately. Impairment losses recognised in prior periods are assessed at each reporting date for any indications that the loss has decreased or no longer exists. An impairment loss is reversed if there has been a change in the estimates used to determine the recoverable amount. An impairment loss is reversed only to the extent that the asset’s carrying amount does not exceed the carrying amount that would have been determined, if no impairment loss had been recognised. A reversal of an impairment loss is recognised in the income statement immediately.
TAXATIONTax on the profit or loss for the year comprises current and deferred tax. Tax is recognised in the profit and loss account except to the extent that it relates to items recognised directly in equity or other comprehensive income, in which case it is recognised directly in equity or other comprehensive income.
Current tax is the expected tax payable or receivable on the taxable income or loss for the year, using tax rates enacted or substantively enacted at the balance sheet date, and any adjustment to tax payable in respect of previous years.
Deferred tax is provided on temporary differences between the carrying amounts of assets and liabilities for financial reporting purposes and the amounts used for taxation purposes. The following temporary differences are not provided for: the initial recognition of goodwill; the initial recognition of assets or liabilities that affect neither accounting nor taxable profit other than in a business combination; and differences relating to investments in subsidiaries to the extent that they will probably not reverse in the foreseeable future. The amount of deferred tax provided is based on the expected manner of realisation or settlement of the carrying amount of assets and liabilities, using tax rates enacted or substantively enacted at the balance sheet date. A deferred tax asset is recognised only to the extent that it is probable that future taxable profits will be available against which the temporary difference can be utilised.
FIN
AN
CIA
L S
TAT
EM
EN
TS
GO
VE
RN
AN
CE
RE
PO
RT
ST
RA
TE
GIC
RE
PO
RT
N Brown Group plc Annual Report and Accounts 2022 nbrown.co.uk 151
33 SIGNIFICANT ACCOUNTING POLICIES CONTINUED
DIVIDENDSDividends receivable are recognised when the Company’s right to receive payment is established. Dividends payable to the Company’s shareholders are recognised as a liability and deducted from shareholders’ equity in the period in which the shareholders’ right to receive payment is established.
CASH AND CASH EQUIVALENTSCash and cash equivalents comprise cash on hand and demand deposits, less bank overdrafts where a right to offset exists.
OWN SHARES HELD BY ESOTTransactions of the Company-sponsored Employee Share Ownership Trust (ESOT) are treated as being those of the Company and are therefore reflected in the Company financial statements. In particular, the trust’s purchases and sales of shares in the Company are debited and credited directly to equity.
SHARE-BASED PAYMENTSThe Company issues equity-settled share-based payments to certain employees. Equity-settled share-based payments are measured as the Company issues equity-settled share-based payments to certain employees. Equity-settled share-based payments are measured at fair value at the date of grant.
The fair value determined at the grant date of the equity-settled share-based payments is expensed on a straight-line basis over the vesting period, based on the Company’s estimate of shares that will eventually vest. This is recognised as an employee expense with a corresponding increase in equity. Fair value is measured by the Monte Carlo method for options subject to a market-based performance condition.
For share-based payment awards with non-vesting conditions, the grant date fair value of the share-based payment is measured to reflect such conditions and there is no true-up for differences between expected and actual outcomes.
Whilst the Company has no own employees of its own, it settles all share incentive schemes granted to employees of its subsidiaries. As subsidiaries are not recharged for the share-based payment charge, the amount is debited to cost of investment.
FINANCIAL ASSETS – CLASSIFICATIONIFRS 9 contains a classification and measurement approach for financial assets that reflects the business model in which assets are managed and their cash flow characteristics.
IFRS 9 contains three principal classification categories for financial assets: measured at amortised cost; fair value through other comprehensive income (“FVOCI”); and fair value through profit and loss (“FVTPL”). A financial asset is measured at amortised cost if both the conditions detailed below are met and it has not been designated as FVTPL.
All of the Company’s receivables are due from subsidiary companies, and are classified as amortised cost because:
all such assets are held within a business model whose objective is to hold the asset to collect its contractual cash flows; and
the contractual terms of all such assets give rise to cash flows on specified dates that represent payments of solely principal and interest on the outstanding principal amount.
FINANCIAL INSTRUMENTS – RECOGNITION AND MEASUREMENTFinancial assets and financial liabilities are recognised on the Company’s balance sheet when the Company becomes a party to the contractual provisions of the instrument.
All financial assets are recognised and derecognised on a trade date where the purchase or sale of a financial asset is under a contract whose terms require delivery of the financial asset within the timeframe established by the market concerned. The Company derecognises financial liabilities when, and only when, the Company’s obligations are discharged, cancelled or they expire.
Financial assets and financial liabilities are initially measured at fair value. Transaction costs that are directly attributable to the acquisition or issue of financial assets and financial liabilities are added to or deducted from the fair value of the financial assets or financial liabilities as appropriate on initial recognition.
Financial assets classified as amortised cost are subsequently measured using the effective interest method, less any impairment. Financial liabilities classified as amortised cost are subsequently measured using the effective interest method, with interest expense recognised on an effective yield basis. The effective interest rate method is a method of calculating amortised cost and of allocating interest expense over the relevant period. The effective interest rate is the rate that exactly discounts estimated future cash flows through the expected life of the financial instrument, or, where appropriate, a shorter period, to the net carrying amount on initial recognition.
NOTES TO THE COMPANY ACCOUNTS CONTINUED
N Brown Group plc Annual Report and Accounts 2022nbrown.co.uk152
BANK BORROWINGSInterest bearing bank loans and overdrafts are recorded at proceeds received, net of direct issue costs. Finance charges, including premiums payable on settlement or redemption and direct issue costs, are accounted for on an accrual basis in the income statement using the effective interest method.
IMPAIRMENT OF FINANCIAL ASSETSThe Company recognises an allowance for ECLs on its receivables from subsidiaries.
Receivables from subsidiaries are determined to have a significant financing component, and therefore the ECL model applies the concept of staging.
Stage 1 – assets which have not demonstrated any significant increase in credit risk since origination
Stage 2 – assets which have demonstrated a significant increase in credit risk since origination
Stage 3 – assets which are credit impaired (i.e. defaulted)
Under IFRS 9, loss allowances are measured on either of the following bases:
12-month ECLs: these are ECLs that result from possible default events within the 12 months after the reporting date; and
Lifetime ECLs: these are ECLs that result from all possible default events over the expected life of a financial instrument.
12-month ECLs are calculated for assets in Stage 1 and lifetime ECLs are calculated for assets in Stages 2 and 3.
All receivables are considered to be repayable on demand, and therefore expected credit losses have been measured over the expected period to transfer cash once demanded. Receivables are considered on an entity-by-entity basis to assess the expected credit loss based on the assets of the counterparty and their ability to repay. In the case of these receivables the PD is considered to either be close to nil which would result in an immaterial loss, or 100% for those entities without sufficient assets to repay, and therefore be considered to be Stage 3 credit impaired. The LGD has been determined based on the expected ability to realise cash from the assets of the counterparty entity to calculate the expected credit loss.
CRITICAL JUDGEMENTS AND KEY SOURCES OF ESTIMATION UNCERTAINTYThe significant judgements made by management in applying the Company’s accounting policies and the key sources of estimation uncertainty in these financial statements, which together are deemed critical to the Company’s results and financial position, are as follows:
CARRYING VALUE OF INVESTMENTSCRITICAL JUDGEMENTImpairment exists when the carrying value of an asset or cash-generating unit exceeds its recoverable amount, which is the higher of its fair value less costs of disposal and its value in use. An impairment indicator exists at the year end as the market capitalisation of the Company is exceeded by the value of its investments, and an impairment review was therefore carried out at the year end date as outlined in note 12. The value in use calculation used for the purposes of the Group impairment review provides an assessment of the trading prospects and future cashflows of the Group and the Company, and therefore supports the carrying value of the investment asset held by the Company. The value in use calculation provides material headroom and therefore no impairment of the Company investments is required.
34 PROFIT FOR THE PERIODAs permitted by section 408 of the Companies Act 2006 the Company has elected not to present its own profit and loss account for the period.
N Brown Group plc reported a Loss after tax for the financial period ended 26 February 2022 of £5.0m (2021: profit of £62.8m) which includes dividends received of £2.0m (2021: £70.0m).
The Non-Executive Directors’ remuneration was £0.7m (2021: £0.6m) and ten Non-Executive Directors were remunerated (2020: nine). The Executive Directors were remunerated by a subsidiary company in both years; the total was £1.1m (2021: £1.3m). Further details are provided on p86 of the Directors’ Remuneration Report.
Fees in relation to non-audit related services include fees of £nil (2021: £60,000) relating to assurance services and £nil, of which £nil was required by regulation (2021: £45,000), in relation to the equity raise completed by the Group during the year.
Fees payable to the Company’s auditor for the audit of the Company’s annual accounts were £20,000 (2021: £20,000).
FIN
AN
CIA
L S
TAT
EM
EN
TS
GO
VE
RN
AN
CE
RE
PO
RT
ST
RA
TE
GIC
RE
PO
RT
N Brown Group plc Annual Report and Accounts 2022 nbrown.co.uk 153
35 FIXED ASSET INVESTMENT2022
£m2021
£mOpening cost and net book value 366.8 366.0Movement in period 0.8 0.8Closing cost and net book value 367.6 366.8
The Company has investments in the following subsidiaries and joint ventures.
Company Registered Office Address Status
Proportion held by the Group (%)
Aldrex Ltd Griffin House, 40 Lever Street, Manchester M60 6ES Dormant 100Alexander Ross (Financial Services) Ltd Griffin House, 40 Lever Street, Manchester M60 6ES Dormant 100Ambrose Wilson Ltd Griffin House, 40 Lever Street, Manchester M60 6ES Dormant 100Better Living Ltd Griffin House, 40 Lever Street, Manchester M60 6ES Dormant 100Classic Combination Ltd Griffin House, 40 Lever Street, Manchester M60 6ES Dormant 100Comfortably Yours Ltd Griffin House, 40 Lever Street, Manchester M60 6ES Dormant 100Crescent Direct Ltd Griffin House, 40 Lever Street, Manchester M60 6ES Dormant 100Cuss Contractors Ltd Griffin House, 40 Lever Street, Manchester M60 6ES Dormant 100Dale House (Mail Order) Ltd Griffin House, 40 Lever Street, Manchester M60 6ES Dormant 100Daly Harvey Morfitt Ltd Griffin House, 40 Lever Street, Manchester M60 6ES Dormant 100DHM (Management Services) Ltd Griffin House, 40 Lever Street, Manchester M60 6ES Dormant 100E Langfield & Co. Ltd Griffin House, 40 Lever Street, Manchester M60 6ES Dormant 100Eunite Limited Griffin House, 40 Lever Street, Manchester M60 6ES Dormant 100Figleaves Global Trading Limited Griffin House, 40 Lever Street, Manchester M60 6ES Dormant 100Financial Services (Edinburgh) Ltd Griffin House, 40 Lever Street, Manchester M60 6ES Dormant 100First Financial Ltd Griffin House, 40 Lever Street, Manchester M60 6ES Dormant 100Gray & Osbourn Ltd Griffin House, 40 Lever Street, Manchester M60 6ES Dormant 100Halwins Ltd Griffin House, 40 Lever Street, Manchester M60 6ES Dormant 100Hammond House Investments Griffin House, 40 Lever Street, Manchester M60 6ES Dormant 100International Ltd Griffin House, 40 Lever Street, Manchester M60 6ES Dormant 100Hammond House Investments Ltd Griffin House, 40 Lever Street, Manchester M60 6ES Dormant 100Hartingdon House Ltd Griffin House, 40 Lever Street, Manchester M60 6ES Dormant 100HB Wainwright (Financial Services) Ltd Griffin House, 40 Lever Street, Manchester M60 6ES Dormant 100Heather Valley (Woollens) Ltd Griffin House, 40 Lever Street, Manchester M60 6ES Dormant 100Hilton Mailing Ltd Griffin House, 40 Lever Street, Manchester M60 6ES Dormant 100Holland & Heeley Ltd Griffin House, 40 Lever Street, Manchester M60 6ES Dormant 100House of Stirling (Direct Mail) Ltd Griffin House, 40 Lever Street, Manchester M60 6ES Dormant 100J.D. Williams & Co Ltd Griffin House, 40 Lever Street, Manchester M60 6ES Trading Company 100J.D. Williams Group Ltd Griffin House, 40 Lever Street, Manchester M60 6ES Intermediate
Holding company100
J.D. Williams Merchandise Co Ltd Griffin House, 40 Lever Street, Manchester M60 6ES Dormant 100JDW Finance Ltd* Griffin House, 40 Lever Street, Manchester M60 6ES Active 100JDW Malta Limited* Griffin House, 40 Lever Street, Manchester M60 6ES Active 100JDW Pension Trustees Ltd Griffin House, 40 Lever Street, Manchester M60 6ES Active 100Langley House Ltd Griffin House, 40 Lever Street, Manchester M60 6ES Dormant 100Mature Wisdom Ltd Griffin House, 40 Lever Street, Manchester M60 6ES Dormant 100Melgold Ltd Griffin House, 40 Lever Street, Manchester M60 6ES Dormant 100NB Finance (Eire Reg) 29 Earlsfort Terrace, Dublin 2, Ireland Intermediate
Holding Company100
N Brown Pension Trustees Ltd Griffin House, 40 Lever Street, Manchester M60 6ES Active 100N Brown Funding Ltd* Griffin House, 40 Lever Street, Manchester M60 6ES Intermediate
Holding Company100
N Brown Holdings Ltd Griffin House, 40 Lever Street, Manchester M60 6ES Intermediate Holding Company
100
N Brown Property One Ltd Griffin House, 40 Lever Street, Manchester M60 6ES Dormant 100N Brown Property Three Ltd Griffin House, 40 Lever Street, Manchester M60 6ES Dormant 100N Brown Property Two Ltd Griffin House, 40 Lever Street, Manchester M60 6ES Dormant 100NB Funding Guernsey Ltd (Guernsey Reg) St Martin’s House, Le Bordage, St Peter Port,
Guernsey, GY1 4AUIntermediate Holding Company
100
NOTES TO THE COMPANY ACCOUNTS CONTINUED
N Brown Group plc Annual Report and Accounts 2022nbrown.co.uk154
NB Holdings Guernsey Ltd (Guernsey Reg) St Martin’s House, Le Bordage, St Peter Port, Guernsey, GY1 4AU
Intermediate Holding Company
100
NB Insurance Guernsey Ltd (Guernsey Reg) St Martin’s House, Le Bordage, St Peter Port, Guernsey, GY1 4AU
Trading Company 100
NB Malta No1 Ltd (Malta Reg) The Hedge Business Centre, Level 3, Triq ir-Rampa ta’ San Giljan, St Julians STJ 1062, Malta
In the course of being dissolved
100
NB Malta No2 Ltd (Malta Reg) The Hedge Business Centre, Level 3, Triq ir-Rampa ta’ San Giljan, St Julians STJ 1062, Malta
In the course of being dissolved
100
Nochester Holdings (Eire Reg) 29 Earlsfort Terrace, Dublin 2, Ireland Intermediate Holding Company
100
Odhams Leisure Group Ltd Griffin House, 40 Lever Street, Manchester M60 6ES Dormant 100Oxendale & Company Ltd Griffin House, 40 Lever Street, Manchester M60 6ES Doormant 100Oxendale & Co. Ltd (Eire Reg) Woodford Business Park, Santry, Dublin 17, Ireland Trading Company 100Reliable Collections Ltd Griffin House, 40 Lever Street, Manchester M60 6ES Dormant 100Sander & Kay Limited Griffin House, 40 Lever Street, Manchester M60 6ES Dormant 100Speciality Home Shopping (US) Ltd* Griffin House, 40 Lever Street, Manchester M60 6ES Dormant 100Speciality Home Shopping (US Marketing) LLC (incorporated 5 January 2018)
1209 Orange Street, Wilmington, Delaware 19801 Dormant 100
Tagma Ltd Griffin House, 40 Lever Street, Manchester M60 6ES Dormant 100T-Bra Limited Griffin House, 40 Lever Street, Manchester M60 6ES Dormant 100The Bury Boot & Shoe Co (1953) Ltd Griffin House, 40 Lever Street, Manchester M60 6ES Dormant 100The Value Catalogue Limited Griffin House, 40 Lever Street, Manchester M60 6ES Dormant 100Vote It Ltd Griffin House, 40 Lever Street, Manchester M60 6ES Dormant 100Whitfords (Bury) Ltd Griffin House, 40 Lever Street, Manchester M60 6ES Dormant 100Whitfords (Cosytred) Ltd Griffin House, 40 Lever Street, Manchester M60 6ES Dormant 100Whitfords (Textiles) Ltd Griffin House, 40 Lever Street, Manchester M60 6ES Dormant 100Wingmark Ltd Griffin House, 40 Lever Street, Manchester M60 6ES Dormant 100
* Entities exempt from preparing audited statutory financial statements by virtue of s479A of Companies Act 2006.
36 DEBTORS2022
£m2021
£mAmounts falling due within one year:Amounts owed by Group undertakings 94.5 111.5Prepayments and accrued income 0.1 0.1
94.6 111.6
The amounts owed by Group undertakings, whilst there is no fixed term of expiry, are expected to be repaid within the next 12 months.
37 CREDITORS2022
£m2021
£mAmounts falling due within one year:Amounts owed to Group undertakings 211.9 210.6
211.9 210.6
FIN
AN
CIA
L S
TAT
EM
EN
TS
GO
VE
RN
AN
CE
RE
PO
RT
ST
RA
TE
GIC
RE
PO
RT
N Brown Group plc Annual Report and Accounts 2022 nbrown.co.uk 155
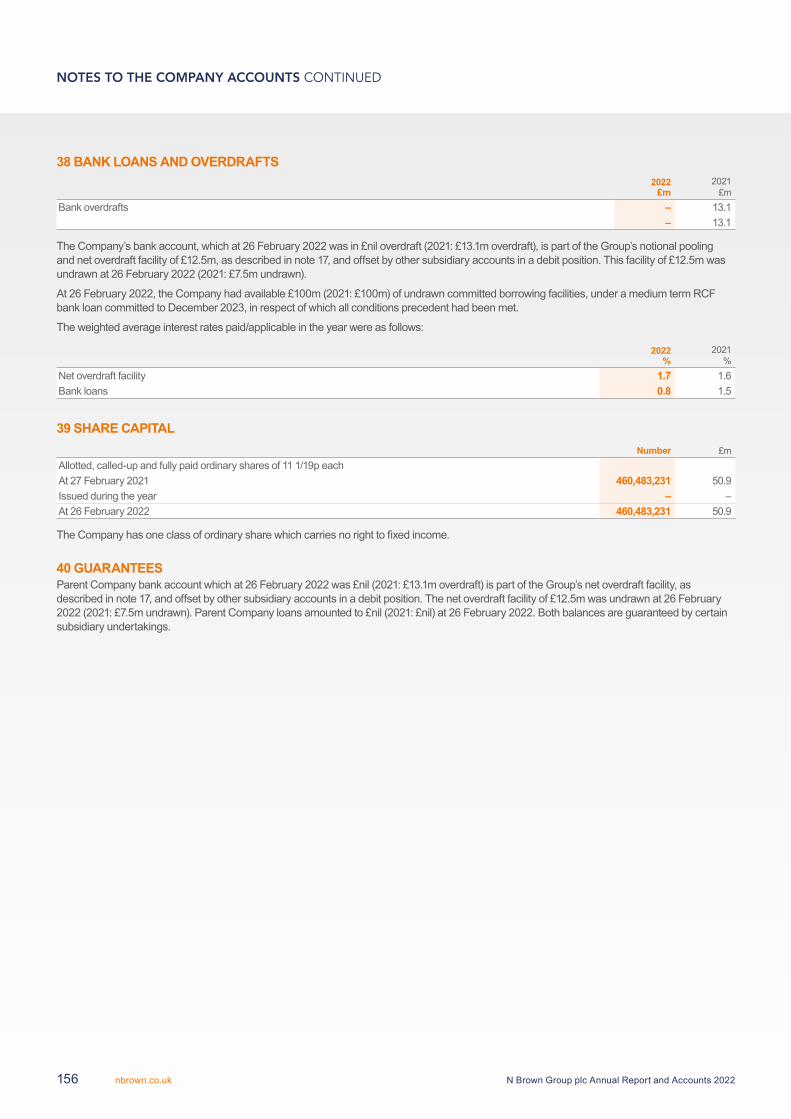
38 BANK LOANS AND OVERDRAFTS2022
£m2021
£mBank overdrafts – 13.1
– 13.1
The Company’s bank account, which at 26 February 2022 was in £nil overdraft (2021: £13.1m overdraft), is part of the Group’s notional pooling and net overdraft facility of £12.5m, as described in note 17, and offset by other subsidiary accounts in a debit position. This facility of £12.5m was undrawn at 26 February 2022 (2021: £7.5m undrawn).
At 26 February 2022, the Company had available £100m (2021: £100m) of undrawn committed borrowing facilities, under a medium term RCF bank loan committed to December 2023, in respect of which all conditions precedent had been met.
The weighted average interest rates paid/applicable in the year were as follows:
2022%
2021%
Net overdraft facility 1.7 1.6Bank loans 0.8 1.5
39 SHARE CAPITALNumber £m
Allotted, called-up and fully paid ordinary shares of 11 1/19p eachAt 27 February 2021 460,483,231 50.9Issued during the year – –At 26 February 2022 460,483,231 50.9
The Company has one class of ordinary share which carries no right to fixed income.
40 GUARANTEESParent Company bank account which at 26 February 2022 was £nil (2021: £13.1m overdraft) is part of the Group’s net overdraft facility, as described in note 17, and offset by other subsidiary accounts in a debit position. The net overdraft facility of £12.5m was undrawn at 26 February 2022 (2021: £7.5m undrawn). Parent Company loans amounted to £nil (2021: £nil) at 26 February 2022. Both balances are guaranteed by certain subsidiary undertakings.
NOTES TO THE COMPANY ACCOUNTS CONTINUED
N Brown Group plc Annual Report and Accounts 2022nbrown.co.uk156
SHAREHOLDER INFORMATION
FINANCIAL CALENDAR2022 February Financial year end
May Preliminary announcement of annual resultsJune Publication of 2022 Annual Report and AccountsJuly Annual General MeetingOctober Interim results
2023 January Christmas Trading Statement
An updated version of the financial calendar is available at www.nbrown.co.uk
REGISTERED OFFICEGriffin House 40 Lever Street Manchester M60 6ES Registered No. 814103 Telephone 0161 236 8256
REGISTRARSLink Asset Services PXS 134 Beckenham Road Beckenham, Kent BR3 4ZF Telephone 0871 664 0300 (Calls cost 10p per minute plus network extras)
AUDITORKPMG LLP 1 St Peter’s Square Manchester M2 3AE
NOMINATED ADVISERShore Capital and Corporate Limited
BANKERS HSBC Bank plc The Royal Bank of Scotland plc
SOLICITORS Pinsent Masons LLP Eversheds LLP Addleshaw Goddard LLP Herbert Smith Freehills LLP
CORPORATE BROKERSJefferies Hoare Govett Shore Capital Stockbrokers Limited
SHAREHOLDER BENEFITSSubject to certain conditions, shareholders are entitled to a 20% privilege discount off the selling price of consumer merchandise in any of the Group websites. Shareholders interested in these facilities should write for further information to the Company Secretary, N Brown Group plc, Griffin House, 40 Lever Street, Manchester M60 6ES stating the number of shares held and the brand or product of interest.
CAPITAL GAINS TAXFor the purpose of capital gains tax, the value of the Company’s ordinary shares of 10p each was 6.40625p per share on 31 March 1982 and 1.328125p on 6 April 1965.
For more information and latest news on the Group, visit www.nbrown.co.uk
FIN
AN
CIA
L S
TAT
EM
EN
TS
GO
VE
RN
AN
CE
RE
PO
RT
ST
RA
TE
GIC
RE
PO
RT
N Brown Group plc Annual Report and Accounts 2022 nbrown.co.uk 157
Printed by Pureprint Group, a leading environmental printer whose pioneering work developing sustainable printing from a niche environmental product into a mainstream business choice, has been recognised with the Queen’s Award for Enterprise: Sustainable Development. As well as being the first ISO 14001 and FSC® certified printer in the UK, Pureprint has been a CarbonNeutral® Company since 2002, and is a member of Sedex, the ethical supplier register.
This report has been printed on Arena Smooth, an environmentally friendly paper made from 100% Elemental Chlorine Free (ECF) virgin fibre sourced from well-managed, responsible FSC® certified forests and other controlled sources, and using digital print technology without the use of film separations, plates and associated processing chemicals, minimises the negative environmental impacts of the printing process ensuring 100% of the dry waste associated with the production is diverted from landfill.
The paper used in this report has been Carbon Balanced with The World Land Trust, an international conservation charity who offset carbon emissions through the purchase and preservation of high conservation value land. Through protecting standing forests under threat of clearance, carbon is locked in that would otherwise be released. These protected forests are then able to continue absorbing carbon from the atmosphere, referred to as REDD (Reduced Emissions from Deforestation and forest Degradation). This is now recognised as one of the most cost-effective and swiftest ways to arrest the rise in atmospheric CO2 and global warming effects. Additional to the carbon benefits is the flora and fauna this land preserves, including a number of species identified at risk of extinction on the IUCN Red List of Threatened Species.
Forest Stewardship Council® ensures that there is an audited chain of custody from the tree in a well-managed forest, through to the finished document in the printing factory.
Aaron Yates
Alex Grime
Alex Humphries
Alison Peet
Amy Linehan
Andrea Archer
Andrew Moseley
Angela Gaskell
Bruce Smith
Carolyn McNulty
Camilla Duncan
Chris Hylton
Chris Kevill
Christopher Pugh
Craig French
David Fletcher
David Hulme
Debbie Orrell
Emily Marriott
Gareth Littlewood
Gary Marsden
Harriet Bowyer
Hayley Jones
Helena Pastore
Holly Cummins
Ian Williams
Jack Stenson
James Wheeler
Jin Lee
Jo Clarke
Joanne Roberts
Jody Scott
Joe Barnfather
Kate Samba
Keith Nelson
Ken Mellis
Kar Ken Cheung
Lauren Wilde
Maria Yiannakou
Mark Curran
Mark Hampson
Matt Dawson
Mushtaq Laher
Paul Rostron
Paul Sweeney
Richard Rolls
Rik Evans
Ryan Gallear
Sarah Nichol
Shaun Temple-Brown
Sian Scriven
Tim Price
Tom Askey
Tony Renzulli
THANK YOUWe would like to thank everyone who has helped to produce this report:
This report is fully recyclable so please place into your paper recycling after use so that the fibres can be recycled and reused.
Designed and produced by Radley Yeldar
www.ry.com
N Brown Group plc Annual Report and Accounts 2022nbrown.co.uk158


N BROWN GROUP PLCN Brown Group plc
Griffin House
40 Lever Street
Manchester M60 6ES
www.nbrown.co.uk