a tool to improve transfusion safety - archive ouverte hal
TRANSCRIPT

HAL Id: hal-02311415https://hal.archives-ouvertes.fr/hal-02311415
Submitted on 25 Oct 2021
HAL is a multi-disciplinary open accessarchive for the deposit and dissemination of sci-entific research documents, whether they are pub-lished or not. The documents may come fromteaching and research institutions in France orabroad, or from public or private research centers.
L’archive ouverte pluridisciplinaire HAL, estdestinée au dépôt et à la diffusion de documentsscientifiques de niveau recherche, publiés ou non,émanant des établissements d’enseignement et derecherche français ou étrangers, des laboratoirespublics ou privés.
Distributed under a Creative Commons Attribution - NonCommercial| 4.0 InternationalLicense
NanoBioAnalytical characterization of extracellularvesicles in 75-nm nanofiltered human plasma fortransfusion: A tool to improve transfusion safety
Sameh Obeid, Pei-Shan Sung, Benoit Le Roy, Ming-Li Chou, Shie-LiangHsieh, Celine Elie-Caille, Thierry Burnouf, Wilfrid Boireau
To cite this version:Sameh Obeid, Pei-Shan Sung, Benoit Le Roy, Ming-Li Chou, Shie-Liang Hsieh, et al.. NanoBioAna-lytical characterization of extracellular vesicles in 75-nm nanofiltered human plasma for transfusion:A tool to improve transfusion safety. Nanomedicine: Nanotechnology, Biology and Medicine, Elsevier,2019, 20, pp.101977. �10.1016/j.nano.2019.02.026�. �hal-02311415�

1
NanoBioAnalytical characterization of extracellular vesicles
in 75-nm nanofiltered human plasma for transfusion:
a tool to improve transfusion safety
Sameh Obeid1,2
, Pei-Shan Sung4, , Benoit Le Roy
1, Ming-Li Chou
3, Shie-Lang Shieh
4, Celine
Elie-Caille1, Thierry Burnouf
3,5, Wilfrid Boireau
1
1FEMTO-ST Institute, UBFC, CNRS, ENSMM, UTBM, 15B Avenue des Montboucons, 25030 Besançon, France
2 STLO, UMR1253, INRA, Agrocampus Ouest, 35000 Rennes, France
3 Graduate Institute of Biomedical Materials and Tissue Engineering, College of Biomedical Engineering,
Taipei Medical University, Taipei, Taiwan
4 Academia Sinica, Genomic Research Center, Taipei, Taiwan
5 International PhD Program in Biomedical Engineering, College of Biomedical Engineering, Taipei Medical
University, Taipei, Taiwan
Correspondence:
Funding: Asahi Kasei Medical provided the leukoreduction and nanofiltration filters and partially
financed the study through a research agreement with Taipei Medical University.
Conflict of interest: the authors state that they have no conflict of interest
Word count for Abstract: 145
Word count for manuscript: 5220 (without figure legends) and 6170 (with figure legends)
Number of References: 65
Number of figures: 8
Number of tables: 1
Number of Supplementary online-only files, if any: 6
© 2019 published by Elsevier. This manuscript is made available under the CC BY NC user licensehttps://creativecommons.org/licenses/by-nc/4.0/
Version of Record: https://www.sciencedirect.com/science/article/pii/S1549963419300619Manuscript_49054ae809f007b6458556dda4058e51

2
Abstract
Plasma transfusion induces some transfusion related acute lung injury (TRALI)
mediated through neutrophil extracellular traps (NETs). We investigated whether extracellular
vesicles (EVs) present in plasma or obtained from resting (N-PEVs) or thrombin activated
platelets (T-PEVs) can trigger NETs, and whether 75 nm-nanofiltration, to partially remove
EVs, prohibits NETs formation. EVs size and concentration were determined by conventional
biophysical approaches and by an original NanoBioAnalytical (NBA) platform based on EV
immunocapture biochip, combining Surface Plasmon Resonance Imaging (SPRi) and Atomic
Force Microscopy (AFM) exploration. EVs effective diameter was in the 25-1000 nm range,
with a majority (≈ 90 %) ≤ 100 nm. Both T-PEVs in buffer (but not N-PEVs) and non-
nanofiltered plasma containing T-PEVs triggered NETs formation. Nanofiltration depleted
large EVs (> 70 nm) and decreased NETs formation. The NBA platform was found to be a
suitable tool to investigate the safety of plasma for transfusion.
Key words: Extra-cellular vesicles (EV); NanoBioAnalytical platform; SPRi; AFM; plasma;
platelets; nanofiltration; NETs
3
Background
Extra-cellular vesicles (EVs) are a superfamily of lipid bilayer membrane vesicular
subsets that comprise exosome, microvesicles (MVs) and apoptotic bodies (1). These
naturally occurring EVs are found in all body fluids (blood, urine, tears, CSF, sperm, milk,
etc.). Their size range from ca. 30 to 1000 nm, but recent data suggest a major, less
characterized, population at 30-200 nm (2). Cells release EVs upon activation by agonists,
immune cells or other EVs, or when they undergo apoptosis or are exposed to shear forces in
the micro-circulation as well as during ex vivo processing as occurs during blood collection
(3). EVs are increasingly recognized to exert definite functions in many physiological events
by playing an important role as cell-cell communication messengers that can influence
homeostasis and the delicate physiological balance existing between health and pathological
trends (4,5). EVs act as a cargo of functional molecules that encompass signalling mediators,
growth factors, lipids, proteins and miRNA (1). EVs lipid bilayer membrane is decorated by
receptors or other biochemical components originating from their parent cells that confer
targeting and modulating properties to EVs (6). The impact of these nanovesicles is
strengthened by the surrounding membrane, which protects this biological cargo from rapid
catabolism and processing by macrophages (7).
EVs circulate at a particularly high concentration (> 1010
/ml) in blood and plasma
(8,9). Platelet-derived EVs (PEVs) represent a major part of blood-EVs, as these anucleated
cells are prone to undergo activation, form pseudopods, degranulate, and release multiple EVs,
as a result of these morphological and functional changes (10). Emerging evidence suggests
links between some pathological situations, including prothrombotic states, inflammatory
disorders, and cancer progression and metastasis, and increased circulating levels of EVs, and
particularly PEVs, in blood (3,4,11–15). The functional role of PEVs is, in part, associated to
various platelet integrin membranes that can bind coagulation factors (3,16,17) and to the
exposure, upon platelet activation, of phosphatidylserine (PS), a pro-coagulant phospholipid

4
that induces thrombin generation and, eventually, a conversion of fibrinogen into fibrin
(16,18–20).
The presence and function of EVs in cellular blood components and plasma for
transfusion is becoming a major concern in transfusion medicine as these specific EVs are
increasingly recognized as not being “innocent by-standers” in the clinical effect of blood
components (14,21–24). Shear stresses, contact with surfaces, leucoreduction, pathogen
inactivation, and storage during blood collection may all affect, and typically increase, the
presence of PEVs in transfused blood products. Processing of blood and storage have
therefore the potential to lead to a PEV accumulation. Such accumulation has understandably
been claimed to support a beneficial functional haemostatic effect (25) but is also increasingly
believed, when reaching high levels, to trigger thromboembolitic events or inflammation
when transfused to critically ill patients (22,26–28).
There is yet no licensed technology to remove EVs from cellular blood components or
plasma for transfusion. Recently, we have provided evidence that a 75-nm nanofiltration
process on dedicated hollow fiber filtration device, typically used to remove viruses, could
partially remove at least the largest EVs (>75nm) from plasma for transfusion (29). This
process was shown to preserve the haemostatic effect of plasma coagulation factors (which
are clinically important to treat patients with bleeding disorders), while concomitantly
removing a detrimental EVs-associated thrombin generation that can be a cause for supra-
normal thrombin generation and thrombotic episodes in transfused patients. Further evidence
of the negative role of EVs in triggering cell-mediated thrombogenic events was identified, as
subsets of PEVs were found to induce monocyte aggregation in vitro and the release of pro-
coagulant monocyte-derived EVs. Therefore, excess of EVs in transfused plasma may cause
thrombo-embolism either through direct thrombin generation or through pro-coagulant cell
activation. Quite importantly, some populations of blood cell-derived EVs are suspected to

5
trigger at least one class of non-immune transfusion-related acute lung injury (TRALI)
(21,30–32), and have recently been found to induce neutrophil extracellular trap (NETs)
formation, a landmark of TRALI pathology (32,33). However, little is known on the type of
blood EVs responsible for TRALI occurrence. Refined analytical technologies are much
needed since the policies in place in several countries aiming at using only plasma from male
donors, to avoid the risk of immunological TRALI due to allogenic leukocyte antigens or of
neutrophil antigens (34) have not eliminated the occurrence of TRALIs (35).
So far, many studies to characterize and identify blood-borne EVs have used
conventional flow-cytometry that lacks the sensibility needed to detect EVs of a size less than
approximately 400 nm (8,36,37). To better understand the functional impact of blood EVs,
smart sample processing methods and technologies to detect multiple subset in the 20 nm-
1µm size range are needed (38). A global analytical approach would make it feasible to size,
identify and characterize which type of EVs triggers thrombotic events, thereby providing a
new “vision” of these complex biological materials. This could provide better understanding
of the impact of blood and plasma collection process on EV formation, and serve the
establishment of EVs depletion procedures.
In this study, we operate a recently validated nano-bio-analytical (NBA) platform,
combining EV immunocapture biochip, surface plasmon resonance imaging (SPRi) and
atomic force microscopy (AFM), to better characterize the different samples of EVs. In a first
step, EVs released from resting (N-PEVs) and thrombin-activated platelets (T-PEVs) were
investigated, then the NBA platform was used to characterize EVs contained in plasma
subjected to a 75nm-nanofiltration process (NF-plasma) (39). We further establish a link
between the presence of some PEVs and the generation of pro-thrombotic NETs in vitro,
which in vivo are known to trigger lethal transfusion reactions like TRALI and thrombotic
events.

6
Methods
Ethical approval
The supply of platelet concentrates (PC) from volunteer, non-remunerated blood
donors (Taiwan Blood Service Foundation, Taipei Blood Center, Guandu, Taiwan) was
approved by Taipei Medical University Hospital Institutional Review Board (TMUH-IRB
N°201305054).
Reagents
Glutaraldehyde, sodium citrate and Bicinchoninic-acid (BCA) protein assay kit were
purchased from Sigma-Aldrich. The SPR running buffer was 10 mM HEPES buffered, at pH
7.4, with 5 mM CaCl2 and 150 mM NaCl, all purchased from Sigma-Aldrich and prepared
using ultrapure water (18 MΩ/cm resistance; Purelab prima from ELGA labWater, Antony,
France). Irrelevant control IgG were provided by Immutep (Châtenay Malabry, France). Anti-
CD41a monoclonal rabbit antibody was purchased from Diaclone SAS (Besançon, France).
Anti-CD61, Anti-CD62-P, Anti-CD9 and Anti-TF monoclonal antibodies were purchased
from Abcam (Paris, France). Annexin-V was purchased from Biovision (France).
Instrumentation
Physical characterization of EVs in suspension was done by Nanoparticle Tracking
Analysis (NTA), using Nanosight NS300 system (Malvern Instrument) and by Tunable
Resistive Pulse Sensing (TRPS) using qNano (Izon, Christchurch, New Zealand). For
multiplex, label-free detection and phenotyping of EVs, we used SPR experiments that were
carried out using SPRiplex-II (Horiba Scientific) instrument at a temperature of 25°C. On-
chip physical characterization (size and shape) of EVs was done by atomic force microscopy
(AFM) using a Nanowizard III AFM (JPK Instruments, Germany) mounted on a Leica
microscope (Z16 APOA).

7
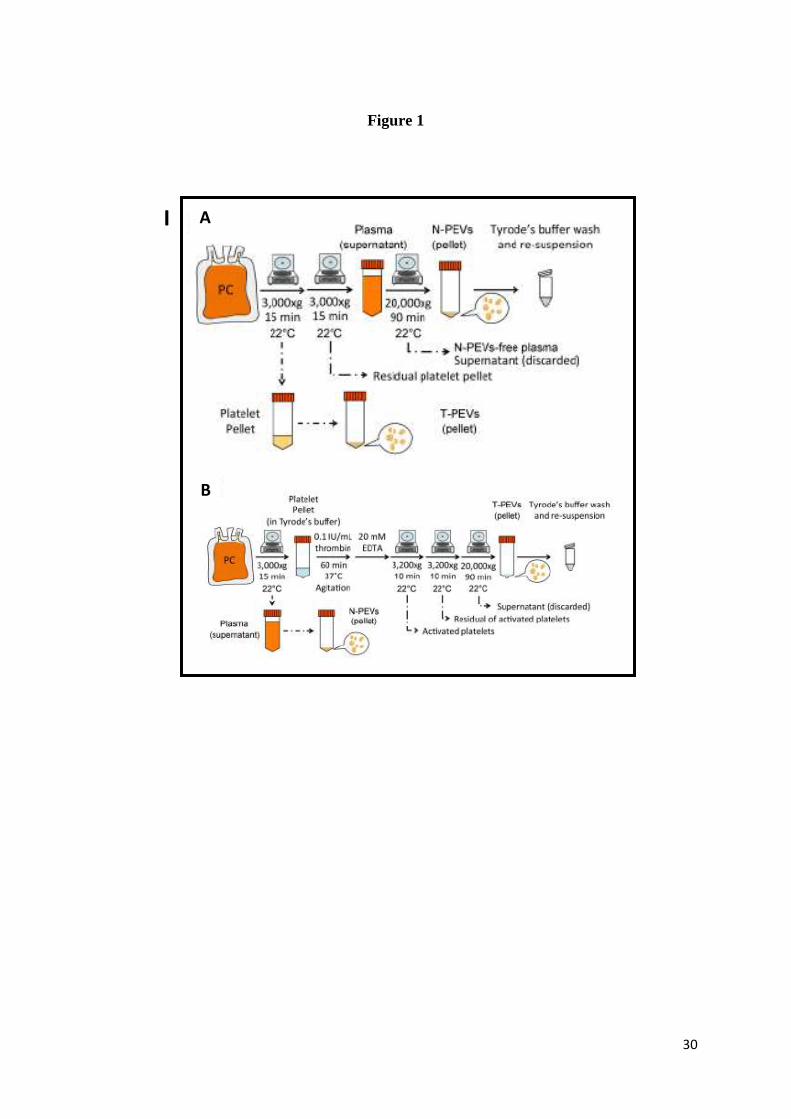
Preparation and generation of Platelet derived EVs
Two types of PEVs were prepared as described before (40,41) and present in Figure 1/I and
in supplementary data–S1. “N-PEVs” designate the PEVs naturally present in the plasma
supernatant of PC, and “T-PEVs” those generated by thrombin activation of isolated platelets.
Isolated PEVs were resuspended in 1 mL of Tyrode’s buffer and immediately frozen at -80°C
until use for further experiments.
Nanofiltration of plasma
Plasma nanofiltration was performed as previously described (29). In brief, fresh
plasma supernatant was immediately subjected to leucoreduction prior to nanofiltration on a
Planova 75-nm nanofilter (Asahi Kasei Medical). Samples of plasma before and after 75-nm
nanofiltration were taken, aliquoted and frozen at -80°C until analyses.
Characterization by NTA and TRPS
The size distribution and concentration of EVs were determined by video-recording by
NTA. Samples were thawed at 35°C and diluted in a commercial, particle-free saline solution
and immediately analyzed as before (29). Quantification of EVs by TRPS used qNano,
elastomeric membranes with nanoscale pores of 100, 200, 400, or 800 nm, and standard
particle sets (CPC100, CPC400, CPC200 or CPC800, Izon) for calibration.
Selection of markers
Exosome express CD9 abundantly on their surface (42). CD9 antigen is also present
on platelets surface and monoclonal antibodies against CD9 can activate platelets (43).
Integrin alpha-IIb (CD41) and beta-III (CD61) form the fibrinogen receptor (integrin alpha-
IIb/beta-III) expressed on platelet membrane and is essential for coagulation. CD41 and CD61
are considered as markers of PEVs (10,44). P-selectin (CD62P) is normally stored in alpha-
granules in non-activated platelets and is expressed on platelet membranes upon activation

8
(45). Annexin V (Annex-V) interacts with phosphatidylserine (PS), a component of EV
membrane (46). Tissue factor (TF) is expressed by monocytes and is known as an initiator of
coagulation (47). An irrelevant IgG was used as negative control in immunocapture
experiments.
Neutrophils extra-cellular trap (NET) formation
Blood was collected from the forearm vein of healthy donors using a scalp vein set
(21G x 3/4) mounted on a 50 mL syringe. The ACD anticoagulant (C3821, SIGMA) was used
at a 1/6 ACD/blood ratio. After centrifugation (230xg, 15 min, room temperature RT) the
platelet rich plasma supernatant was discarded and the sedimented cells put in Ficoll and
centrifuged (2000 rpm, 15 min, RT, without break). The upper layer above the buffy coat was
discarded, and the red blood cells lysed using a lysis buffer. The neutrophils were suspended
in RPMI medium containing 10% autologous heat inactivated serum and heparin (20 g/ml).
To stimulate NETs formation, neutrophils (8 x 10⁵) were seeded on poly-L-lysine pre-coated
coverslip and let to rest at 37°C for 2 hours. EVs samples, obtained by spiking PEVs in buffer
or in 75-nm nanofiltered plasma, were diluted in Tyrode’s buffer based on initial EVs content.
EVs samples were then subjected or not to 75-nm nanofiltration prior to incubation with
neutrophils, for 1 hour at 37°C, at neutrophil to EVs ratios of 1:10, 1:30, and 1:100. Bright
field images were captured by inverted microscopy (Ti-U, Nikon). For confocal microscopy
observations, the coverslips were pre-coated with 10 μg/ml poly-L-lysine at 4°C overnight.
The neutrophils (8x10⁵) were seeded on the coverslip and let to rest. After the treatment with
the EVs samples, the neutrophils were fixed (4% paraformaldehyde, 400 nM sucrose, 2mM
EDTA in PBS) for 1 hour at RT. Samples were washed using PBS, and cells permeabilized by
0.5% Triton-X100 for 15 min at RT. After blocking with 3% BSA in PBS, the anti-MPO

9
(myeloperoxidase) antibody (Santa Cruz) and anti-histone H1 antibody (Santa Cruz) were
incubated with the samples at 4°C overnight. Samples were washed by PBS, then stained with
goat anti-mouse IgG (H+L) conjugated Alexa 488 (109-035-003, Jackson ImmunoResearch)
and goat anti-rabbit IgG conjugated TRITC (111-025-045, Jackson ImmunoResearch) for 1
hour at RT. DNA was stained by Hoechst33342 for 20 min at RT. The samples were mounted
in mounting solution for confocal microscopy (TCS SP5, Leica).
SPR biochip preparation
Home-made gold-biochips, provided by the “Mimento” technology center (Besançon,
France), were used to immobilize different ligands into an array format (16 spots: 4x4) as
described previously (39,48). Each ligand was deposited (≈ 2500 pg/mm2/spot) in duplicate or
triplicate on the biochip. The capture level of EVs by each ligand was determined as the mean
value from at least 2 spots per immunocapture experiment.
Injection of the different analytes
SPR experiments were carried out in HEPES buffer (running buffer). The analytes
were diluted in the running buffer and injected, at different concentrations, over the biochip
surface presenting specific ligands. The capture levels of analytes were determined from the
SPRi signal converted into mass per surface unit (1% of reflectivity variation = 125 pg/mm2).
AFM imaging
Following EV capture on the gold biochip, glutaraldehyde (0.5%) was injected for 10
min to fix the captured materials for further AFM experiments operating in air. An injection
of water was applied to remove buffer salts from the biochip surface; the biochip was then
dried under gentle airflow. AFM imaging was obtained in contact-mode and in air using V-
shaped silicon nitride cantilevers (Digital instruments, NP-S10) with a spring constant of 0.32
N/m. Nanoscale investigations of the biochip by AFM were engaged by rigorously imaging

10
different areas (from 100 µm2 down to 2 µm
2 zones) of each spot to ensure representative
sampling. EV size distribution was measured mainly using AFM images of 5 x 5 and 10 x 10
µm2. The typical scan rate was 0.5 Hz for 512 x 512-pixel images. Using Gwyddion software,
a height threshold of 3 nm was applied to AFM images, in respect to the ligand-modified
biochip surface roughness, to identify/mark the captured EVs prior to their size measurement
(see Supplementary data – S2). At least 1000 individual EVs were measured on each spot.
The results were statistically analysed using the Wilcoxon rank sum test, and a P value less
than 0.001 was considered to be statistically significant.
11
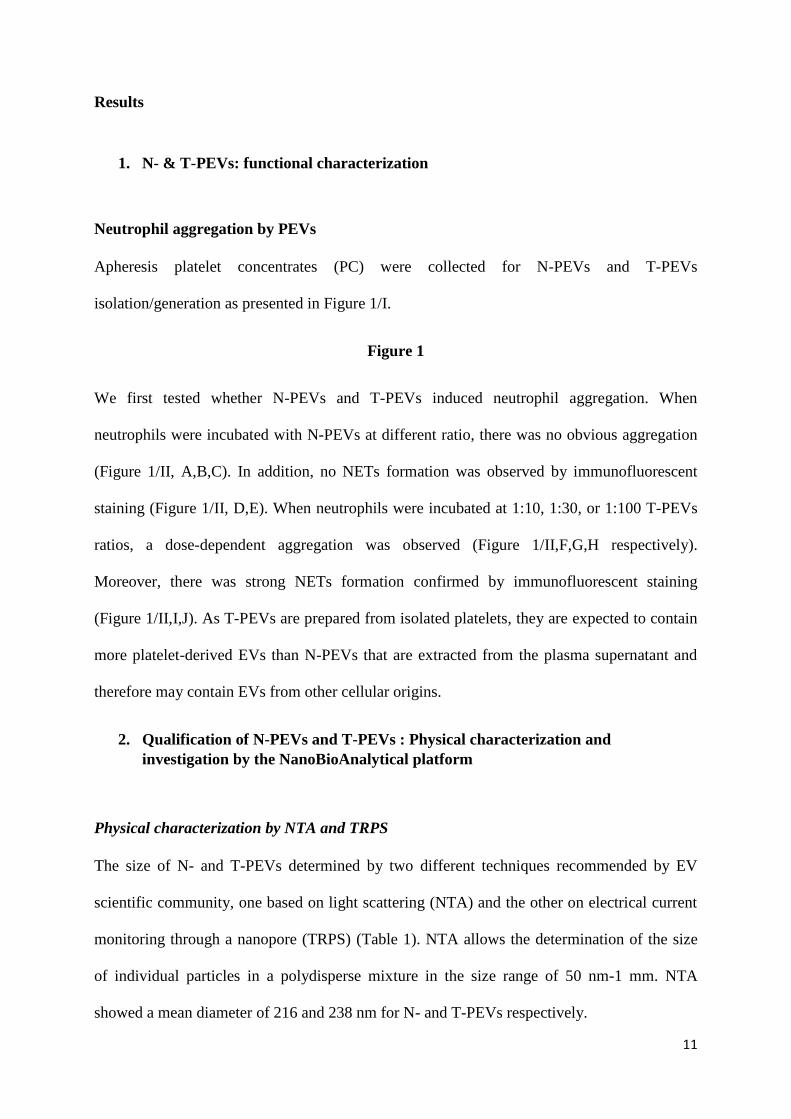
Results
1. N- & T-PEVs: functional characterization
Neutrophil aggregation by PEVs
Apheresis platelet concentrates (PC) were collected for N-PEVs and T-PEVs
isolation/generation as presented in Figure 1/I.
Figure 1
We first tested whether N-PEVs and T-PEVs induced neutrophil aggregation. When
neutrophils were incubated with N-PEVs at different ratio, there was no obvious aggregation
(Figure 1/II, A,B,C). In addition, no NETs formation was observed by immunofluorescent
staining (Figure 1/II, D,E). When neutrophils were incubated at 1:10, 1:30, or 1:100 T-PEVs
ratios, a dose-dependent aggregation was observed (Figure 1/II,F,G,H respectively).
Moreover, there was strong NETs formation confirmed by immunofluorescent staining
(Figure 1/II,I,J). As T-PEVs are prepared from isolated platelets, they are expected to contain
more platelet-derived EVs than N-PEVs that are extracted from the plasma supernatant and
therefore may contain EVs from other cellular origins.
2. Qualification of N-PEVs and T-PEVs : Physical characterization and
investigation by the NanoBioAnalytical platform
Physical characterization by NTA and TRPS
The size of N- and T-PEVs determined by two different techniques recommended by EV
scientific community, one based on light scattering (NTA) and the other on electrical current
monitoring through a nanopore (TRPS) (Table 1). NTA allows the determination of the size
of individual particles in a polydisperse mixture in the size range of 50 nm-1 mm. NTA
showed a mean diameter of 216 and 238 nm for N- and T-PEVs respectively.

12
TRPS size measurement depends on the pore size that is used. With a pore size of 800 nm
(NP800), allowing detection of particles in the size range of 400-1600 nm, the mean diameter
measured for N- and T-PEVs was of 670 and 633 nm respectively. When a pore size of 400
nm (NP400) was used, allowing detection of particles in the size range of 200-800 nm, the
mean diameter of PEVs was of 384 and 378 for N- and T-PEVs respectively. Moreover, the
size measurement using smaller pore size of 100 nm (NP100), with analysis range of 50-300
nm, was impossible due to the repetitive clogging of the pore by large EVs. NTA and TRPS,
in their window of relevancy, do not reveal major differences in mean size between the two
EVs sample populations.
EVs concentration was also determined by TRPS and NTA. The concentrations of EVs in N-
and T-PEVs with NP400 were 5.10 x 10⁹ and 8.65 x10
8 EVs/ml respectively; EVs
concentration determined by NTA for both samples were ≈400 times greater than the values
determined by TRPS (NP400); this is due to the lower detection limit of NTA (≈ 50 nm),
compared to TRPS (≈ 200 nm with NP400), and its wider range of detection allowing
detection of smaller EVs (< 200 nm) which seems to be more abundant than large EVs (> 200
nm). Interestingly, both NTA and TRPS showed that N-PEVs are ≈ 6 fold more concentrated
than T-PEVs.
Biochemical characterization
The protein concentration of N- and T-PEVs samples was measured using BCA protein assay
kit. Protein concentration in N-PEVs sample was higher than in T-PEVs with mean values of
6.62 and 2.42 mg/mL respectively. This result is in agreement with the NTA and TRPS
analysis that showed a higher EVs concentration in N-PEVs sample compared to T-PEVs.
Investigation by the NanoBioAnalytical Platform

13
To characterize exhaustively micro- and nanovesicles in solution at the biochemical and
physical levels, we have developed a NanoBioAnalytical (NBA) platform consisting of an on-
chip immunocapture and of combination of Surface Plasmon Resonance Imaging (SPRi) with
Atomic Force Microscopy (AFM) for a real-time, label-free, direct detection, phenotyping
and size characterization of particles. This platform was successfully applied to study EVs
isolated from platelet concentrates (39). Figure 2-A shows an image of a gold biochip
presenting 16 spots (4x4) of different ligands with at least 2 spots per ligands. Figure 2-B
shows a SPRi contrast image of the gold biochip when inserted inside the SPRi instrument.
The grafted amount of each ligand was calculated based on the shift of plasmon curves
generated by each spot compared to the plasmon curve of the surface (outside the spots)
(Figure 2-C). We noted that plasmon curves from the different spots were shifted slightly to
the left compared to the surface, which confirmed the grafting of ligands. We obtained a good
interspot homogeneity of the grafting for ligand-antibodies comprised between 13.6 and 18.5
fmoles/mm2 (Figure 2-D). Due to its low molecular weight (35 kDa vs 150 kDa), we grafted
Annex-V with a higher density reaching 92.2 fmoles/mm2.
Figure 2
i) Capture of N- and T-PEVs
N- and T-PEVs were injected on the biochip surface presenting Annex-V, α-CD41, α-
CD62P, α-CD9 and an irrelevant antibody as negative control (IgG ctrl). Each sample was
diluted in the running buffer to 1/100 and injected onto the biochip surface for 10 minutes.
Three successive injections were applied. Figure 3-A, C shows the sensorgrams recorded
during the injections of the samples. The immunocapture tests were applied in duplicate for
each sample, and the capture level was reproducible on each ligand (Figure 3-E). Results
showed a variation in the capture level with regards to different spots but also between the

14
two samples. This can be explained by the presence of different subpopulations of EVs in
both samples and at different levels. Also, the weak non-specific signals on the control IgG
spots and on the ligands-free surface reflected a high specific capture of vesicles onto the
surface. On the other hand, we can note that the SPRi signal recorded for the different spots
remained stable at the end of the injection which confirmed the stability of the capture of EVs
with their ligands on the surface. The capture level of T-PEVs was higher than N-PEVs on the
two receptors specific of platelet, i.e. α-CD41 (5.8 ± 0.7 against 1.8 ± 0.3%), α-CD62P (5.8 ±
0.7 against 0.97 ± 0.2%) and comparable on α-CD9 (2.2 ± 1.2 against 1.1 ± 0.3%), and
Annex-V (≈ 4%) (Figure 3-C). This may reflect either a high level of EVs expressing these
markers (CD41, CD62P) and/or an abundance of the expression level of these markers at the
surface of vesicles in the T-PEVs sample which promoted their capture on the surface by their
ligands.
Figure 3
ii) AFM analysis of captured N- and T-PEVs
Following the injection of N- and T-PEVs, separately, each on the surface of a biochip
presenting different specific ligands, a nanoscale investigation of the different spots was
engaged afterwards with AFM.
The analysis of different AFM images of each spot showed that the majority of EVs
were appearing as individual and disc-shaped objects (Figure 4-A, B; supplementary data-S4),
taking into account the deformability of EVs and the recalculation of effective diameter
(Supplementary data–S3).
The effective diameter of the subpopulations of EVs, captured on the different ligands,
in both N- and T-PEVs samples, was in the range 25-1000 nm, with a majority (≈ 90 %) of
vesicles ≤ 100 nm (Figure 4-D). Moreover, some large objects, such as aggregates or clusters

15
of small vesicles and large individual objects of different shapes were detected especially in
the case of T-PEVs (supplementary data–S4, S6). Statistical analysis showed that CD41+ and
PS+ subpopulations in N-PEVs were significantly (p < 0.001) larger in size than their
counterparts in the T-PEVs sample. CD62P+ and CD9
+ PEVs were significantly (p < 0.001)
smaller in N-PEVs samples compared to those in T-PEVs samples. Moreover, PEVs-CD9+
were the smallest in size distribution compared to other PEVs subpopulations in both N- and
T-PEVs, with median sizes of 30.7 and 36.6 nm respectively.
Figure 4
Furthermore, a positive correlation was found between the capture level of EVs on the
different spots, given as SPRi signals (reflectivity %), and the number of vesicles captured
onto the surface of these spots (EVs/μm²), which was obtained through AFM analysis (Figure
4-E).
3. Qualification of EVs in plasma
The presence of numerous EVs subpopulations in plasma was already reported in various
studies (49–52). For plasma EVs qualification, we have chosen a set of ligands or antibodies
that targets all blood-borne EVs (Annex-V), EVs derived from platelet (α-CD41, α-CD61, α-
CD62P), EVs wearing tissue factor (α-TF) and exosomes (α-CD9).
We engaged TRPS measurements and NBA analysis on crude and NF-plasma, as a mean to
appreciate the efficiency of EV depletion through a 75-nm plasma nanofiltration process and
to characterize EVs subpopulations in terms of concentration, size and cell origin.
TRPS measurements were realized using two different nanopore membranes, a NP200 (limit
of detection= 80 nm) and a NP100 (limit of detection= 50 nm) for crude and NF-plasma

16
respectively, since the use of NP100 was impossible in crude plasma, due to membrane
clogging.
TRPS results showed that crude plasma contained EVs with a size spreading from 80 to 500
nm, with a mean diameter of 110 nm (Figure 5-A), while 75-nm NF-plasma presents smaller
EVs, with a diameter spreading from 50 to 300 nm, with a mean diameter of 60 nm (Figure 5-
D).
The EVs concentration, evaluated using these two different NP200 and NP100 nanopores,
reached 4.4 x 10¹¹
and 2.0 x 10¹²
EVs/ml in crude and NF-plasma respectively, but with an
underestimation of small EV content in crude plasma due to the use of NP200 membrane.
i) Capture of EVs from plasma
For immunocapture experiments, each plasma sample was injected, at a dilution of 1/50 in
HEPES buffer, during 10 minutes on the surface of a gold biochip presenting Annex-V, α-
CD41, α-CD61, α-CD62P, α-TF, α-CD9 and an IgG control. Figure 5-B and E shows the SPR
sensorgrams recorded during the injection of the crude and NF-plasma samples, and the SPRi
contrast images (Figure 5-C and F, respectively) taken after stability of the SPRi signal at the
end of the injection. The immunocapture experiments were done in triplicate for each sample.
Results firstly showed that EVs subpopulations remained in the NF-plasma since significant
biodetection is observed on the different spots (Figure 5-E, F). Secondly, results in respect of
ligands show that the relative EVs capture levels in the two plasma samples were comparable
(Figure 5-B, E). The capture levels were higher on α-CD9 and Annex-V spots, followed by
that on α-CD61, α-CD41, α-TF and α-CD62P (Figure 5-G). Also, systematically, the capture
levels on the different spots were lower for NF-plasma than for crude plasma.
Figure 5

17
ii) AFM analysis of captured EVs from plasma
A nano-characterization of the multiplexed biochips that have been exposed to either
crude plasma or NF-plasma showed that the subpopulations of vesicles, captured on the
different spots of the biochips, appeared essentially as individual disc-shaped objects with an
effective diameter between 25–1000 nm in plasma, with a majority (≈90%) showing a size ≤
100 nm, similar to PEVs. As an example of differential analysis of a specific CD61+ EVs
subset, the figure 6-A & B shows a significant difference in EVs surface density and size,
before and after nanofiltration, with median sizes of 44.9 versus 24.2 respectively (additional
images are shown in supplementary data-S5).
In 75-nm NF-plasma, and whatever the spot, most of the vesicles (≈ 99%) present a
diameter ≤ 75 nm, and never exceeded roughly 100 nm, while EVs size in crude plasma could
reach 500 or even 1000 nm (Figure 6-C).
Figure 6
4. A biological prospect: neutrophil aggregation by plasma EVs
To unveil whether T-PEVs induced neutrophil aggregation and whether NETs formation can
be decreased by 75-nm nanofiltration, T-PEVs were spiked into tyrode’s buffer or into NF-
plasma and then subjected or not to nanofiltration before incubation with neutrophils.
T-PEVs, spiked to buffer or plasma, induced a dose-dependent aggregation of neutrophils and
NETs formation (NETosis). The strong formation of clusters of neutrophils was occurring
when incubating them at a 1:100 ratio with T-PEVs spiked to buffer (Figure 7-A right) or
plasma (Figure 8-A right). Moreover, the NETosis was found by immunofluorescent staining
when neutrophils were incubated at 1:100 ratio with T-PEVs in buffer (Figure 7-B) and
plasma (Figure 8-B,C). On the other hand, when the T-PEVs were spiked in buffer or in

18
plasma and were then subjected to 75-nm filtration, there was no cell aggregation in both
conditions (Figure 7-C and 8-D). There was no NETosis when neutrophils were incubated
with T-PEVs spiked-buffer subjected to nanofiltration (Figure 7-D) whereas only mild
NETosis was observed in the presence of T-PEVs spiked plasma following nanofiltration
(Figure 8-E, F), while strong NETosis occurred with these samples prior to nanofiltration
(Fig. 7-B and 8-B, C).
Figure 7
Figure 8
Discussion
Red blood cell concentrates, platelet concentrates, and plasma for transfusion are listed
by the World Health Organisation as essential medicinal products. This listing emphasizes the
critical life-saving role of these blood products in all countries at global level, and illustrates
the need to ensure optimal production and safety of these products (53–55). Although the
quality and safety of blood products has dramatically increased over the last decades, their
clinical use remains associated with sometimes letal side-effects. For instance, plasma
transfusion can lead to the occurrence of thromboembolic events, TRALI, and inflammatory
events (56,57). Attempts have been made to identify the possible cause of these adverse
events but have not all been successful (26). In particular, how blood-borne EVs could play a
role in the occurrence of thromboembolic events after plasma transfusion could not be
assessed due to a lack of sensitive methods capable to discriminate among EV
subpopulations. Recently we have been able to provide indirect evidence of the detrimental
role of at least some plasma-borne EVs (>75 nm) by showing that plasma nanofiltered on 75-
nm membrane maintained its hemostatic activity but evidenced lower pro-thrombotic activity
in vitro (29). In further studies we also found that some of the PEVs, in particular the T-PEVs,

19
may be capable to induce thrombogenic events through an activation of THP-1 monocytes
(40). Here we show that these T-PEVs may also be responsible for the generation of NETs in
vitro. However, a main issue in transfusion medicine today is that, due to their nanosize, no
analytical system has been made available to validate or control neither the impact of
production procedures of plasma for transfusion on EVs generation, nor the content of end-
products in EVs (22). There is a rationale need to better realize the link between
subpopulations of EVs in blood products and the trigger of transfusion reactions.
Complementary to conventional technics and methods, the NBA platform allowed real
time, label-free and semi-quantitative detection of different EVs subpopulations, in PEVs
samples but also in plasma, via their specific capture onto a multiplexed biochip surface,
presenting spots of different specific ligands, using the SPR technique. Moreover, the AFM
analysis of the captured vesicles presented the advantage to provide dimensional and
morphological information of the relevant captured particles and information about their
morphology and size distributions over their wide size-range (30-1000 nm); also, it allowed to
discriminate between EVs aggregates and individual vesicles. The NBA platform showed
high capture specificity of EVs in buffer and in plasma, which was confirmed by the low level
of SPR signals recorded on control IgG spots in the different experiments. In addition, the
AFM analysis showed very low number of adsorbed vesicles on control IgG spots in
correlation with SPR results. In all this study, the size distribution of EVs in the different
samples was essentially located in the range of 30-300 nm, which is in agreement with
previous studies that used different techniques (AFM, NTA and electron microscopy) to
measure the size of EVs (8,58–60). The efficiency of the NBA platform to discriminate
subpopulations of EVs is illustrated through the EVs-CD9+ species: their smallest size
distributions reflect the biogenesis. Indeed, CD9 is mainly expressed by exosomes which are
characterized by their small size compared to other EVs subpopulations (1,61,62).

20
Moreover, our results showed that the higher capture level observed for T-PEVs
especially on α-CD41 and α-CD62P spots is not induced by a higher EVs concentration in N-
PEVs sample, but is probably more likely due to a higher protein expression level (especially
CD41 and CD62P) on the surface of T-PEVs which was validated by a semi-quantitative
proteomic analysis of N- and T-PEVs through mass spectrometry (unpublished results).
However, EVs characterization in crude and nanofiltered plasma gave low capture levels on
α-TF and α-CD62P spots, a finding that is in agreement with the low presence of TF+ and
CD62P+ EVs in normal plasma samples (50–52). Nevertheless, CD62P is known to be a
platelet activation marker, and its abundance in the T-PEVs sample confirms the activation of
platelets, used to generate T-PEVs, by thrombin. In addition, in the literature, CD62P protein
(also known as P-selectin) present on activated platelet membranes appears to be also implied
in cell adhesion and cell aggregation, and in particular to bind to P-selectin glycoprotein
ligand 1 (PSGL-1) that is expressed by neutrophils, monocytes and THP-1 cells (55). Our data
are also consistent with previous finding that CD62P expressed by PEVs is more avidly
involved in activation and aggregation of neutrophils in vitro than activated platelets
themselves (56). These in vitro observation of the importance of the removal of T-PEVs to
decrease TRALI incidence should be confirmed in in vitro models (63) but are outside the
scope of the current analytical study.
Therefore in this study we have assessed whether our instrumental combination based
NBA platform could be used to discriminate EV subpopulations (a) in plasma prior to and
after 75-nm nanofiltration and in (b) isolated EVs capable to induce differential actions on
monocytes and neutrophils. Our results provide a proof-of-concept of the capacity of the
developed NBA platform to perform discrete and fine phenotypical, dimensional and
morphological analysis of platelet-derived EVs present in plasma or platelet concentrate
samples. In addition, our data could relate the presence of specific PEVs to the possible

21
occurrence of thrombotic or inflammatory transfusion side effects due to NETosis.
Among perspectives of our work, and since our analytical solution lies on combining
different techniques with their own sensitivity and reproducibility performances, we plan to
engage a strict/rigorous dimensional study of EVs subpopulations pertaining to a fine
analytical and metrological characterization of these biological nanoobjects. Such a physical
investigation, based on deep instruments calibrations and focusing on accuracy, sensitivity,
and traceability of EVs measurements, is crucial to achieve standardization of EVs subsets
measurements (64).
At last, our biochips developments take place in the aim to limit pre-analytical
operations by developing new sensitive tools for EVs characterization even in crude sample.
These works allowed us to claim the usefulness of our NBA platform for EVs characterization
in the latest MISEV guidelines (65).
Acknowledgements
We thank other members of our laboratory for help and fruitful discussions and the members
of FEMTO-Engineering for providing the home-made biochips.

22
References
1. Raposo G, Stoorvogel W. Extracellular vesicles: Exosomes, microvesicles, and friends. J Cell Biol. 2013 Feb 18;200(4):373–83.
2. Boilard E, Duchez A-C, Brisson A. The diversity of platelet microparticles. Curr Opin Hematol. 2015 Sep;22(5):437–44.
3. Burnouf T, Goubran HA, Chou M-L, Devos D, Radosevic M. Platelet microparticles: Detection and assessment of their paradoxical functional roles in disease and regenerative medicine. Blood Rev. 2014 Jul;28(4):155–66.
4. Pol E van der, Böing AN, Harrison P, Sturk A, Nieuwland R. Classification, Functions, and Clinical Relevance of Extracellular Vesicles. Pharmacol Rev. 2012 Jan 7;64(3):676–705.
5. Tkach M, Théry C. Communication by Extracellular Vesicles: Where We Are and Where We Need to Go. Cell. 2016 Mar 10;164(6):1226–32.
6. Abels ER, Breakefield XO. Introduction to Extracellular Vesicles: Biogenesis, RNA Cargo Selection, Content, Release, and Uptake. Cell Mol Neurobiol. 2016 Apr;36(3):301–12.
7. Kalra H, Drummen GPC, Mathivanan S. Focus on Extracellular Vesicles: Introducing the Next Small Big Thing. Int J Mol Sci. 2016 Feb 6;17(2):170.
8. Dragovic RA, Gardiner C, Brooks AS, Tannetta DS, Ferguson DJP, Hole P, et al. Sizing and phenotyping of cellular vesicles using Nanoparticle Tracking Analysis. Nanomedicine Nanotechnol Biol Med. 2011 Dec;7(6):780–8.
9. Gardiner C, Ferreira YJ, Dragovic RA, Redman CWG, Sargent IL. Extracellular vesicle sizing and enumeration by nanoparticle tracking analysis. J Extracell Vesicles [Internet]. 2013 Feb 15 [cited 2016 Mar 24];2(0). Available from: http://www.journalofextracellularvesicles.net/index.php/jev/article/view/19671
10. Lynch SF, Ludlam CA. Plasma microparticles and vascular disorders. Br J Haematol. 2007 Apr 1;137(1):36–48.
11. Simak J, Gelderman MP, Yu H, Wright V, Baird AE. Circulating endothelial microparticles in acute ischemic stroke: a link to severity, lesion volume and outcome. J Thromb Haemost JTH. 2006 Jun;4(6):1296–302.
12. O’Driscoll L, Stoorvogel W, Théry C, Buzas E, Nazarenko I, Siljander P, et al. European Network on Microvesicles and Exosomes in Health and Disease (ME-HaD). Eur J Pharm Sci. 2017 Feb;98:1–3.
13. Ridger VC, Boulanger CM, Angelillo-Scherrer A, Badimon L, Blanc-Brude O, Bochaton-Piallat M-L, et al. Microvesicles in vascular homeostasis and diseases. Position Paper of the European Society of Cardiology (ESC) Working Group on Atherosclerosis and Vascular Biology. Thromb Haemost. 2017 Jun 28;117(7):1296–316.
14. Melki I, Tessandier N, Zufferey A, Boilard E. Platelet microvesicles in health and disease. Platelets. 2017 May;28(3):214–21.

23
15. Goubran H, Sabry W, Kotb R, Seghatchian J, Burnouf T. Platelet microparticles and cancer: An intimate cross-talk. Transfus Apher Sci. 2015 Oct;53(2):168–72.
16. Heemskerk JWM, Bevers EM, Lindhout T. Platelet activation and blood coagulation. Thromb Haemost. 2002 Aug;88(2):186–93.
17. Heemskerk JWM, Mattheij NJA, Cosemans JMEM. Platelet-based coagulation: different populations, different functions. J Thromb Haemost JTH. 2013 Jan;11(1):2–16.
18. Sinauridze EI, Kireev DA, Popenko NY, Pichugin AV, Panteleev MA, Krymskaya OV, et al. Platelet microparticle membranes have 50- to 100-fold higher specific procoagulant activity than activated platelets. Thromb Haemost. 2007 Mar;97(3):425–34.
19. Tripisciano C, Weiss R, Eichhorn T, Spittler A, Heuser T, Fischer MB, et al. Different Potential of Extracellular Vesicles to Support Thrombin Generation: Contributions of Phosphatidylserine, Tissue Factor, and Cellular Origin. Sci Rep. 2017 Jul 26;7(1):6522.
20. Zwaal RF, Comfurius P, Bevers EM. Platelet procoagulant activity and microvesicle formation. Its putative role in hemostasis and thrombosis. Biochim Biophys Acta. 1992 Oct 13;1180(1):1–8.
21. Kriebardis A, Antonelou M, Stamoulis K, Papassideri I. Cell-derived microparticles in stored blood products: innocent-bystanders or effective mediators of post-transfusion reactions? Blood Transfus Trasfus Sangue. 2012 May;10 Suppl 2:s25-38.
22. Burnouf T, Chou M-L, Goubran H, Cognasse F, Garraud O, Seghatchian J. An overview of the role of microparticles/microvesicles in blood components: Are they clinically beneficial or harmful? Transfus Apher Sci Off J World Apher Assoc Off J Eur Soc Haemapheresis. 2015 Oct;53(2):137–45.
23. Almizraq RJ, Seghatchian J, Acker JP. Extracellular vesicles in transfusion-related immunomodulation and the role of blood component manufacturing. Transfus Apher Sci Off J World Apher Assoc Off J Eur Soc Haemapheresis. 2016 Dec;55(3):281–91.
24. Dubovoy T, Engoren M. Thrombotic Risks in Red Blood Cell Transfusions. Semin Thromb Hemost. 2016 Mar;42(2):102–11.
25. Lawrie AS, Harrison P, Cardigan RA, Mackie IJ. The characterization and impact of microparticles on haemostasis within fresh-frozen plasma. Vox Sang. 2008 Oct;95(3):197–204.
26. Cognasse F, Hamzeh-Cognasse H, Laradi S, Chou M-L, Seghatchian J, Burnouf T, et al. The role of microparticles in inflammation and transfusion: A concise review. Transfus Apher Sci Off J World Apher Assoc Off J Eur Soc Haemapheresis. 2015 Oct;53(2):159–67.
27. Aung HH, Tung J-P, Dean MM, Flower RL, Pecheniuk NM. Procoagulant role of microparticles in routine storage of packed red blood cells: potential risk for prothrombotic post-transfusion complications. Pathology (Phila). 2017 Jan;49(1):62–9.
28. Chang AL, Kim Y, Seitz AP, Schuster RM, Lentsch AB, Pritts TA. ERYTHROCYTE DERIVED MICROPARTICLES ACTIVATE PULMONARY ENDOTHELIAL CELLS IN A MURINE MODEL OF TRANSFUSION. Shock Augusta Ga. 2017 May;47(5):632–7.
24
29. Chou M-L, Lin L-T, Devos D, Burnouf T. Nanofiltration to remove microparticles and decrease the thrombogenicity of plasma: in vitro feasibility assessment. Transfusion (Paris). 2015 Oct;55(10):2433–44.
30. Simak J, Gelderman MP. Cell Membrane Microparticles in Blood and Blood Products: Potentially Pathogenic Agents and Diagnostic Markers. Transfus Med Rev. 2006 Jan;20(1):1–26.
31. Jy W, Ricci M, Shariatmadar S, Gomez-Marin O, Horstman LH, Ahn YS. Microparticles in stored red blood cells as potential mediators of transfusion complications. Transfusion (Paris). 2011 Apr;51(4):886–93.
32. Xie R, Yang Y, Zhu Y, Gao L, Jiang X, Sun J, et al. Microparticles in red cell concentrates prime polymorphonuclear neutrophils and cause acute lung injury in a two-event mouse model. Int Immunopharmacol. 2018 Feb;55:98–104.
33. Thomas GM, Carbo C, Curtis BR, Martinod K, Mazo IB, Schatzberg D, et al. Extracellular DNA traps are associated with the pathogenesis of TRALI in humans and mice. Blood. 2012 Jun 28;119(26):6335–43.
34. Toy P, Gajic O, Bacchetti P, Looney MR, Gropper MA, Hubmayr R, et al. Transfusion-related acute lung injury: incidence and risk factors. Blood. 2012 Feb 16;119(7):1757–67.
35. Popovsky MA. Transfusion-related acute lung injury: three decades of progress but miles to go before we sleep. Transfusion (Paris). 2015;55(5):930–4.
36. Coumans FAW, Pol E van der, Böing AN, Hajji N, Sturk G, Leeuwen TG van, et al. Reproducible extracellular vesicle size and concentration determination with tunable resistive pulse sensing. J Extracell Vesicles [Internet]. 2014 Dec 10 [cited 2016 May 10];3(0). Available from: http://www.journalofextracellularvesicles.net/index.php/jev/article/view/25922
37. Erdbrügger U, Lannigan J. Analytical challenges of extracellular vesicle detection: A comparison of different techniques. Cytom Part J Int Soc Anal Cytol. 2016 Feb;89(2):123–34.
38. Kailashiya J. Platelet-derived microparticles analysis: Techniques, challenges and recommendations. Anal Biochem. 2018 Apr 1;546:78–85.
39. Obeid S, Ceroi A, Mourey G, Saas P, Elie-Caille C, Boireau W. Development of a NanoBioAnalytical platform for «on-chip» qualification and quantification of platelet-derived microparticles. Biosens Bioelectron [Internet]. [cited 2016 Sep 1]; Available from: http://www.sciencedirect.com/science/article/pii/S0956566316308569
40. Lin H-C, Chang H-W, Hsiao S-H, Chou M-L, Seghatchian J, Burnouf T. Platelet-derived microparticles trigger THP-1 monocytic cell aggregation and release of pro-coagulant tissue factor-expressing microparticles in vitro. Transfus Apher Sci Off J World Apher Assoc Off J Eur Soc Haemapheresis. 2015 Oct;53(2):246–52.
41. Burnouf T, Chou M-L, Wu Y-W, Su C-Y, Lee L-W. Antimicrobial activity of platelet (PLT)-poor plasma, PLT-rich plasma, PLT gel, and solvent/detergent-treated PLT lysate biomaterials against wound bacteria. Transfusion (Paris). 2013 Jan;53(1):138–46.
42. Caballero JN, Frenette G, Belleannée C, Sullivan R. CD9-Positive Microvesicles Mediate the Transfer of Molecules to Bovine Spermatozoa during Epididymal Maturation. PLOS ONE. 2013 Jun 13;8(6):e65364.

25
43. Worthington RE, Carroll RC, Boucheix C. Platelet activation by CD9 monoclonal antibodies is mediated by the Fc gamma II receptor. Br J Haematol. 1990 Feb;74(2):216–22.
44. Italiano JE, Mairuhu ATA, Flaumenhaft R. Clinical relevance of microparticles from platelets and megakaryocytes. Curr Opin Hematol. 2010 Nov;17(6):578–84.
45. Blann AD, Lip GY. Hypothesis: is soluble P-selectin a new marker of platelet activation? Atherosclerosis. 1997 Feb 10;128(2):135–8.
46. Jy W, Horstman LL, Jimenez JJ, Ahn Y s. Measuring circulating cell-derived microparticles. J Thromb Haemost. 2004;2(10):1842–1843.
47. Bona R, Lee E, Rickles F. Tissue factor apoprotein: intracellular transport and expression in shed membrane vesicles. Thromb Res. 1987 Nov 15;48(4):487–500.
48. Remy-Martin F, Osta ME, Lucchi G, Zeggari R, Leblois T, Bellon S, et al. Surface plasmon resonance imaging in arrays coupled with mass spectrometry (SUPRA–MS): proof of concept of on-chip characterization of a potential breast cancer marker in human plasma. Anal Bioanal Chem. 2012 Jun 15;404(2):423–32.
49. Arraud N, Linares R, Tan S, Gounou C, Pasquet J-M, Mornet S, et al. Extracellular vesicles from blood plasma: determination of their morphology, size, phenotype and concentration. J Thromb Haemost. 2014 May 1;12(5):614–27.
50. Trappenburg MC, van Schilfgaarde M, Marchetti M, Spronk HM, ten Cate H, Leyte A, et al. Elevated procoagulant microparticles expressing endothelial and platelet markers in essential thrombocythemia. Haematologica. 2009 Jul;94(7):911–8.
51. Del Conde I, Shrimpton CN, Thiagarajan P, López JA. Tissue-factor-bearing microvesicles arise from lipid rafts and fuse with activated platelets to initiate coagulation. Blood. 2005 Sep 1;106(5):1604–11.
52. Khan E, Ambrose NL, Ahnström J, Kiprianos AP, Stanford MR, Eleftheriou D, et al. A low balance between microparticles expressing tissue factor pathway inhibitor and tissue factor is associated with thrombosis in Behçet’s Syndrome. Sci Rep. 2016 Dec 7;6:38104.
53. 19th WHO Model List of Essential Medicines (April 2015).pdf [Internet]. Scribd. [cited 2018 Jul 24]. Available from: https://www.scribd.com/document/356832183/19th-WHO-Model-List-of-Essential-Medicines-April-2015-pdf
54. WHO | Quality Assurance and Safety: Blood Products and related Biologicals [Internet]. WHO. [cited 2018 Jul 24]. Available from: http://www.who.int/bloodproducts/en/
55. Guidelines on Management of Blood and Blood Components as Essential Medicines. Who Expert Committee on Biological Standardization, Sixty-seventh Report; Who Technical Report Series No. 1004, 2017, Annex 3 [Internet]. [cited 2018 Jul 24]. Available from: http://apps.who.int/medicinedocs/en/d/Js23322en/
56. Pandey S, Vyas GN. Adverse Effects of Plasma Transfusion. Transfusion (Paris). 2012 May;52(Suppl 1):65S–79S.

26
57. Puetz J, Witmer C, Huang Y-SV, Raffini L. Widespread use of fresh frozen plasma in US children’s hospitals despite limited evidence demonstrating a beneficial effect. J Pediatr. 2012 Feb;160(2):210–215.e1.
58. Ashcroft BA, de Sonneville J, Yuana Y, Osanto S, Bertina R, Kuil ME, et al. Determination of the size distribution of blood microparticles directly in plasma using atomic force microscopy and microfluidics. Biomed Microdevices. 2012 Aug;14(4):641–9.
59. Aatonen MT, Ohman T, Nyman TA, Laitinen S, Gronholm M, Siljander PR-M. Isolation and characterization of platelet-derived extracellular vesicles. J Extracell Vesicles [Internet]. 2014 Aug 6 [cited 2014 Sep 24];3. Available from: http://www.ncbi.nlm.nih.gov/pmc/articles/PMC4125723/
60. Sebaihi N, Boeck BD, Yuana Y, Nieuwland R, Pétry J. Dimensional characterization of extracellular vesicles using atomic force microscopy. Meas Sci Technol. 2017;28(3):034006.
61. Colombo M, Raposo G, Théry C. Biogenesis, Secretion, and Intercellular Interactions of Exosomes and Other Extracellular Vesicles. Annu Rev Cell Dev Biol. 2014 Oct 11;30(1):255–89.
62. György B, Szabó TG, Pásztói M, Pál Z, Misják P, Aradi B, et al. Membrane vesicles, current state-of-the-art: emerging role of extracellular vesicles. Cell Mol Life Sci. 2011 Aug;68(16):2667–88.
63. Fung YL, Tung JP. How different animal models help us understand TRALI. ISBT Sci Ser. 2018;13(3):197–205.
64. Sebaihi N, Boeck BD, Yuana Y, Nieuwland R, Pétry J. Dimensional characterization of extracellular vesicles using atomic force microscopy. Meas Sci Technol. 2017;28(3):034006.
65. Théry C, Witwer KW, Aikawa E, Alcaraz MJ, Anderson JD, Andriantsitohaina R, et al. Minimal information for studies of extracellular vesicles 2018 (MISEV2018): a position statement of the International Society for Extracellular Vesicles and update of the MISEV2014 guidelines. J Extracell Vesicles. 2018 Dec 1;7(1):1535750.

27
Figure legends
Figure 1: (I) Preparation of N-PEVs (A) and T-PEVs (B), and (II) effect on neutrophils.
Neutrophils were incubated with N-PEVs or T-PEVs at a ratio of 1:10 (A for N-PEVs – F for
T-PEVs), 1:30 (B for N-PEVs – G for T-PEVs), and 1:100 (C for N-PEVs – H for T-PEVs).
The images were obtained under bright field with an inverted microscopy. The scale bar is
100 µm. NETosis was determined by immunofluorescent staining using antibodies targeted to
DNA (blue), histone H1 (green), and MPO (red). The superimposed images were obtained
under confocal microscopy. Neutrophils were incubated at 1:100 ratio with N-PEVs (D) and
larger magnification of the area from the white square (E), or with T-PEVs (I) and larger
magnification of the area from the white square (J). The scale bar is 50 µm (D,I) and 10 µm
(E,J).
Figure 2 : (A) Photo of a mutilplexed gold-biochip presenting 16 spots of different ligands
deposited using a manual arrayer. Dimensions of the biochip are 12.5 x 28 mm. (B) SPRi
contrast image of the biochip with the different spots. Scale bar of 1 mm. (C) Plasmon curves
measured on the different spots of ligands and on the ligands-free surface (surface). (D) Table
showing the mean grafted amount (fmol/mm2) of each ligand onto the biochip surface through
n=10 immunocapture experiments applied for platelet-EVs and EVs from plasma. α-CD61
and α-TF was only used for immunocapture of EVs from plasma.
Figure 3 : SPRi capture levels recorded during the injection of N-PEVs (A) and T-PEVs (C)
on the surface of multiplexed biochips. Three successive injections were applied for each
sample at a dilution of 1/100 in HEPES buffer. Each injection was performed during 10
minutes with a flow rate of 20 μl/min. (B) & (D) show, respectively, two SPRi phase-contrast
images of different spots on the surface of biochips after the injection of N- and T-PEVs
(scale bar is 500 μm). (E) Histogram showing the mean capture level of EVs on the different
spots from two independent immunocapture experiments for each sample.
Figure 4 : AFM analysis: (A) & (B) shows AFM images of N & T-PEVs, respectively,
captured on the biochip surface via α-CD41. “D” for effective diameter. (C) Shows an AFM
image of an IgG ctrl spot after the injection of T-PEVs. (D) Boxplots showing the size
distribution, represented as log of the effective diameters, of the different subpopulations of
EVs (CD41+/CD62P+/PS+/CD9+), in N- & T-PEVs, captured onto the surface via different
specific ligands (n ≥ 1000 vesicles for each subpopulation). The median is marked with bold
line. The p values were calculated by a Wilcoxon test, *** p <0.001. (E) Histogram showing
the correlation between the capture level of EVs on each spot (Reflectivity %) and the surface
density of captured vesicles (number of EVs/μm2), measured by AFM.
Figure 5 : TRPS characterization and on chip capture of EVs from crude plasma (A to C) and
NF-Plasma (D to F) on the surface of multiplexed biochips with SPRi phase-contrast images

28
of the different spots after the injections (scale bar is 500 μm). TRPS results obtained on
NP200 (A) or NP100 (D) nanopore membranes respectively for crude and NF-plasma. For
SPRi experiments, each sample was injected at a dilution of 1/50 in HEPES buffer during 10
minutes with a flow rate of 20 μl/min: sensorgrams (B,E) and contrast images (C,F). (G)
Histogram showing the mean capture level of EVs on the different spots through three
immunocapture experiments for each sample.
Figure 6 : AFM characterization of EVs captured on the biochip surfaces, via α-CD61,
through the injection of either crude plasma (A) or NF-Plasma (B). “D” for effective
diameter. (C) Boxplots showing the size distribution, represented as log of the effective
diameters, of the different EVs subpopulations, in Plasma and NF-Plasma, captured onto the
surface via their specific ligands (n≥ 1000 vesicles for each subpopulation). The median is
marked with bold line.
Figure 7 : T-PEVs spiked in tyrode’s buffer at neutrophils/EVs ratios of 1:10 (A, left), 1:30
(A, middle) or 1:100 (A, right and B). The scale bar is (A) 100 µm and (B) 50 µm. T-PEVs
were spiked to tyrode’s buffer then subjected to a 75-nm nanofiltration, and incubated with
neutrophils at ratios of 1:10 (C, left), 1:30 (C, middle) or 1:100 (C, right and D). The scale bar
is (C) 100 µm and (D) 50 µm. Pictures (A) and (C) are bright field images captured by
inverted microscopy, and (B) and (D) by fluorescence confocal microscopy. NETosis was
determined by immunofluorescent staining using antibodies targeted to DNA (blue), histone
H1 (green), and MPO (red) shown from left to right in (B) and (D); the 1st image from the
right in (B) and (D) is a merge of the three other pictures.
Figure 8 : T-PEVs spiked in plasma and incubated with neutrophils at ratios of 1:10 (A, B, C,
left), 1:30 (A, B, C, middle), or 1:100 (A, B, C, right). The scale bar is (A) 100 µm, (B) 50
µm, and (C) 10 µm. T-PEVs were spiked in plasma then subjected to 75-nm nanofiltration,
and incubated with neutrophils at ratios of 1:10 (D, E, F, left), 1:30 (D, E, F, middle) or 1:100
(D, E, F, right). The scale bar is (D) 100 µm, (E) 50 µm and (F) 10 µm. Pictures (A) and (D)
are bright field images captured by inverted microscopy, and (B), (C) and E) by fluorescence
confocal microscopy. NETosis was determined by immunofluorescent staining using
antibodies targeted to DNA (blue), histone H1 (green), and MPO (red) and only the merged
pictures are shown (left, middle, and right in B, C, and E).
Tables
Table 1 : PEVs characterization by TRPS and NTA

29
Table 1
N-PEVs T-PEVs
TRPS Average Average
Membrane:
400nm
Mean (nm) 384 ± 13.4 378 ± 29.3
Conc. (particles/mL) 5.10 x 10⁹ 8.65 x 10
8
TRPS Average Average
Membrane:
800nm
Mean (nm) 670 ± 47.5 633 ± 26.0
Conc. (particles/mL) 6.95 x 10⁷ 1.66 x 10⁷
NTA Average Average
Mean (nm) 216 ± 17.7 238 ± 29.0
Conc. (particles/mL) 2.02 x 10¹²
3.56 x 10¹¹
30
Figure 1
I A
B

31
N-PEVs on neutrophils
T-PEVs on neutrophils
A B C
D E
F G H
I J
II

32
Figure 2
LIGANDS Annex-V α-CD41 α-CD62P α-CD61 α-CD9 α-TF IgG ctrl
AMOUNT (fmol/mm
2)
92.2±10.8 18.5±3.6 17.2±3.6 16.3±4.3 14.0±2.0 13.6±1.7 19.9±2.8
A) B) C)
D)

33
Figure 3
E)
A) B)
C) D)

34
Figure 4
IgG ctrl
0 nm
10 nm 10 nm
0 nm 0 nm
C)
D=128 nm
D=65 nm
D=31 nm
B) A) N-PEVs T-PEVs
10 nm
2 µm 2 µm 2 µm
E)
D)

35
Figure 5
CRUDE PLASMA
NANOFILTERED PLASMA
A)
B) C)
D)
E) F)

36
G)

37
Figure 6
D= 114 nm
D= 87 nm
D= 74 nm
D= 52 nm
D= 48 nm
D= 36 nm
Plasma (CD61+ EVs) NF-Plasma (CD61+ EVs) B) A)
C)
0 nm
10 nm
0 nm
10 nm

38
Figure 7
Buffer spiked experiments
A)
B)
C)
D)

39
Figure 8
Plasma spiked experiments
A)
B)
C)
D)
E)
F)
