a tool to automate student uml diagram evaluation
TRANSCRIPT
Academic Journal of Nawroz University (AJNU), Vol.10, No.2, 2021
This is an open access article distributed under the Creative Commons Attribution License
Copyright ©2017. e-ISSN: 2520-789X
https://doi.org/10.25007/ajnu.v10n2a1035
189
A Tool to Automate Student UML diagram Evaluation
Salisu Modi 1, Hanan A. Taher2, Hoger Mahmud3
1Department of Computer Science, Sokoto State University, Sokoto, Nigeria 2Department of Information Technology Management, Duhok Polytechnic University, Duhok, Iraq
3Department of Computer Science, University of Human Development, Sulaymaniyah, Kurdistan Region of Iraq
ABSTRACT Unified modelling language (UML) is the accepted standard and modelling language for modeling in software development
process. UML is widely used by most course tutors in teaching modules of software engineering and system analysis and
design. Students taking such courses do submit assignments with UML diagrams such as use case, class, sequence, activity
and so on. Different versions of such diagrams produced by the students for a given problem have to be assessed by the
course tutor which is a challenging and time-consuming task. This paper presents a java-based tool which is developed based
on a simple yet effective algorithm developed by the authors that will read student and tutors solution diagrams as inputs
and evaluate and grade the diagrams automatically. The output of the tool is the score of the student diagram in respect of
lecturer’s final solution. The output is presented in two feedback files, one containing students’ score for the lecturers and the
other to be send to the student to note the areas that were incorrect. The tool has been tested and evaluated using a simple
and assumed UML class diagram. The result shows that the tool functions effectively and can produce detail feedbacks for
both students and tutors. The outcome of this paper contributes towards automating UML diagram evaluations.
KEYWORDS: Unified Modeling Language (UML), Use case Diagram, Extensible Markup Language (XML), UML Auto-
grading, UML diagram evaluation.
1. Introduction
UML stands for Unified Modeling Language. UML is
a general-purpose modeling language in the field of
software engineering, which is designed to provide a
standard way to visualize the design of a software
system. UML has become the standard for modeling
object-oriented system design, ever since it was
published by the object management group (OMG)
[1]. UML diagrams are used to depict the
architectural, dynamic, and static structures of a
software system [1]. Diagrams such as class and
object show the skeletal structure of classes, their
interfaces, and how their objects relate to each other.
On the other hand, diagrams such as activity,
sequence and state machine can be used to represent
the changing structure and behavior of a system [2].
Software engineers and system modelers use UML to
design and develop mission critical systems in many
sectors such aviation and healthcare. For examples,
the authors of [3] have used UML diagrams to model
and optimize hospital processes and the authors of [4]
use UML to model cancer registration process. To
model the dynamic nature of systems, the authors of
[2] have used UML activity diagram to model service
orchestration in the field of business
Teaching UML diagrams is still popular in university
courses relating to software development [5].
Researchers in [6] have analyzed students’ acceptance
perception regarding the ease of use and usefulness
of UML as a modelling tool and the outcome was
positive. Positive attitude of students to use UML as
modelling tool has been one of the driving factors for
its wide use in software engineering courses. It is a
known fact that in student-centered education
environments learning by doing is essential which
meaning more and more practical exercises should be
given to students. Software design and development,
as one of the subjects taught in higher and further
education institutions, requires a lot of learning by
doing exercises. In student context, diagrams usually
consist of various names, nodes and connections that
need to be read, compared and assessed with the
solution version of the course tutor.
Academic Journal of Nawroz University (AJNU), Vol.10, No.2, 2021
190
Students taking such courses do submit assignment
with various UML diagrams such as use cases, class,
sequence, activity. Different UML model solutions
can be developed by for the same problem, this has
led to an issue known as “model consistency issue”
[7]. Therefore, it is highly likely that diagrams
developed by students in a course for a given
problem are different from the diagram developed by
the tutor. Because multiple solution diagrams can be
created for the same problem it presents a grading
challenge to instructors of these courses[8]. Grading
diagrams is a time-consuming process which may
take 10 to 15 minutes per student as claimed by [9].
Thus, finding a way to reduce the grading time makes
a real contribution to the process of teaching UML in
software design and development. To deal with the
grading challenge, the authors of [8] present an
approach which they call UMLGrade to streamline
marking process through considering the sematic and
syntactic aspects of a diagram. Following their
direction, this paper presents a Java-based tool to
automate the evaluation and grading of student UML
diagrams. For the purpose of evaluating the tool, we
use Case Study technique similar to others such as
[10] [11].
The main objectives of the paper are outlined below:
• To identify a preferred UML design tool that
supports all standard UML diagrams, to at least
the version UML 2.2, and exports these in the
XMI data format. The technique to convert
models into XMI format for model evaluation
purpose have been considered in other
publications such as [12].
• To develop a model comparison algorithm that is
able to perform strict and more relaxed
comparisons between a student model and the
instructor’s reference model.
• To develop an assessment algorithm for students’
UML diagrams that gives credit for their attempt
in a way that mimics the instructor’s own
assessment.
• To develop a tool that can unzip a zipped file
containing student diagrams and compare and
assess these against the instructor’s reference
diagram.
• To develop a tool that can output feedbacks into
readable files for both students and tutors.
The rest of this paper is organized as follows; section
2 provides some literature review on similar works,
section 3 provides information on the research
method, section 4 presents a brief discussion on the
result and a compassion of the tool with other tools
proposed in literature. Finally, in section 5 we
conclude and provide some feature work directions.
2. LITERATURE REVIEW
The challenge of comparing and grading UML
diagrams has been recognized by many researchers
and there are a number of proposals in literature to
deal with the challenge and automate the assessment
process. The authors of [13] claim that assessment
automation provides fast and consistent feedback
which can be relied on by both students and teachers.
To evaluate UML class diagrams, the authors of [11]
use software metrics to compare the individual
elements of UML class diagrams in order to identify
similarities and differences between two or more
diagrams. In their work, they have worked on
empirically validating different software metrics with
the aim to identify the most effective metrics for
model comparison. The relationships between the
components of class diagrams have been used by [12]
to develop a method to measure similarities between
two diagrams. The authors of [14] have considered
the type of relations between classes to develop a
calculation method for comparing student class
diagrams with that of the teacher. The authors of [15]
have proposed a similarity calculation method for
UML class diagram based on diagram structure and
semantics.
Academic Journal of Nawroz University (AJNU), Vol.10, No.2, 2021
191
In a similar work to what we present in this paper,
the authors of [16] have presented a metamodel plus
a grading algorithm to automate UML class diagram
grading which maps students class diagrams to that
of the instructor’s in order to identify similarities and
differences between them. However, they have
implemented the grading algorithm in the TouchCore
tool (http://touchcore.cs.mcgill.ca) but we have gone
a step further to develop a tool in Java to implement
our algorithm. The authors of [9] have carried out an
exploratory study on the possible use of machine
learning for developing automatic grading methods
for UML class diagram and as a result they have
concluded that machine learning is not reliable for
such tasks. A UML class diagram test application
have been proposed in [17] which aims to evaluate
student diagrams developed for documenting an
existing software. An e-assessment tool which makes
use of design patterns is proposed by [18] for
assessing UML class diagram.
The authors in [10] used “dynamic programming
approach” to develop a mechanism to find
similarities between a number of sequences diagrams
with the aim to improve the efficiency of matching
process. Others have used syntactic and sematic
matching to evaluate Use Case diagrams [19] and the
authors of [20] have proposed an architecture for
assessing Use Case diagram. With improving the
efficiency in software projects in mind, class property
and message sequence parameters have been utilized
in [21] to devise a method for comparing two
sequence diagrams. The structure and semantics of
sequence diagram have been considered in [15] to
measure diagram similarities. The majority of these
researches consider the grading or finding similarities
of one type of UML diagram (e.g. class diagram), the
contribution of our approach is far-reaching since our
method can be applied on all types of UML diagrams.
Due to the complexity of software development
process and teaching the steps, automating
assessments of other tasks of the development such as
the programming task have also been considered by
researchers. For instances, the authors of [22] have
empirically investigated the automation of
programming task assessment and the authors of [23]
have compared two auto-assessment tools; one of the
tool assess the code and the other assess the program
output. This indicates that automating assessments in
all areas of software development are being
considered by researchers. The outcome of this paper
contributes towards the effort of finding an efficient
UML diagram evaluation and grading mechanism.
3. RESEARCH METHOD
The research method followed in this paper is
comprised of four steps, step one involves identifying
a UML drawing tool to be used by students and
instructors to develop model solutions for a given
problem which will be compatible with the Java-
based tool that was developed. In step 2 the algorithm
for comparing and grading student UML diagrams is
developed to be implemented in the tool. In step 3 the
comparison and grading tool was designed and
implemented. Finally, in step 4 the tool was tested
and the results were evaluated. More details about
each of the steps are provided in the following sub-
sections.
3.1 UML Drawing Tool
An UML drawing tool is required to be used in
designing both the student version and Lecturer’s
solution version of a given diagram. Diagrams are
designed using some standard tools, there are
numerous of these tools available [13]. Different tools
from different vendors comes with different
specifications based on how they can handle a UML
diagram. The aim of this step is to research the
available UML tools, choose the most efficient for the
job among them, which can be used to develop
compatible models with the Java-based tool. Below
are number of criteria adapted from [24] and used for
selecting the best UML tool.
Academic Journal of Nawroz University (AJNU), Vol.10, No.2, 2021
192
• Support various diagrams: the selected tool
should support the drawing of all standard UML
diagrams such as class, sequence, use case, state
machine and activity.
• Export/import diagram in XMI file format: the
tool should be able to export diagrams in an XMI
file format to be read as XML.
• Open source: the tool should allow extending
and customization by intended users.
• Java code generator: the tool should generate
java code equivalent of the diagram.
• Reverse engineering: the tool should be able to
convert code into diagram and verse vasa.
Based on the above criteria, in table 1 four (4) UML
tools (Agro UML, Modelio, Star UML, and Rational
Rose) are considered and assessed (1 indicate the
feature is present and 0 otherwise). Based on the
assessment results both the Modelio and Star UML
tools seem to have fulfilled all the criteria. Since one
of is required the Moledio has been chosen to be used
for designing both the student and tutor’s solution
version of a given diagram, which will later be read
by the developed Java tool.
Table 1: Assessment of available UML drawing tools
No.
To
ols
Su
pp
ort
wid
e ra
ng
e o
f U
ML
dia
gra
m
Ex
po
rt/i
mp
ort
X
MI
file
fo
rma
t
Op
en S
ou
rce
Jav
a co
de
G
en
era
tor
Re
ve
rse
En
gin
eeri
ng
1 Agro UML
1 0 1 1 0
2 Modelio 1 1 1 1 1
3 Star UML
1 1 1 1 1
4 Rational Rose
1 0 0 1 0
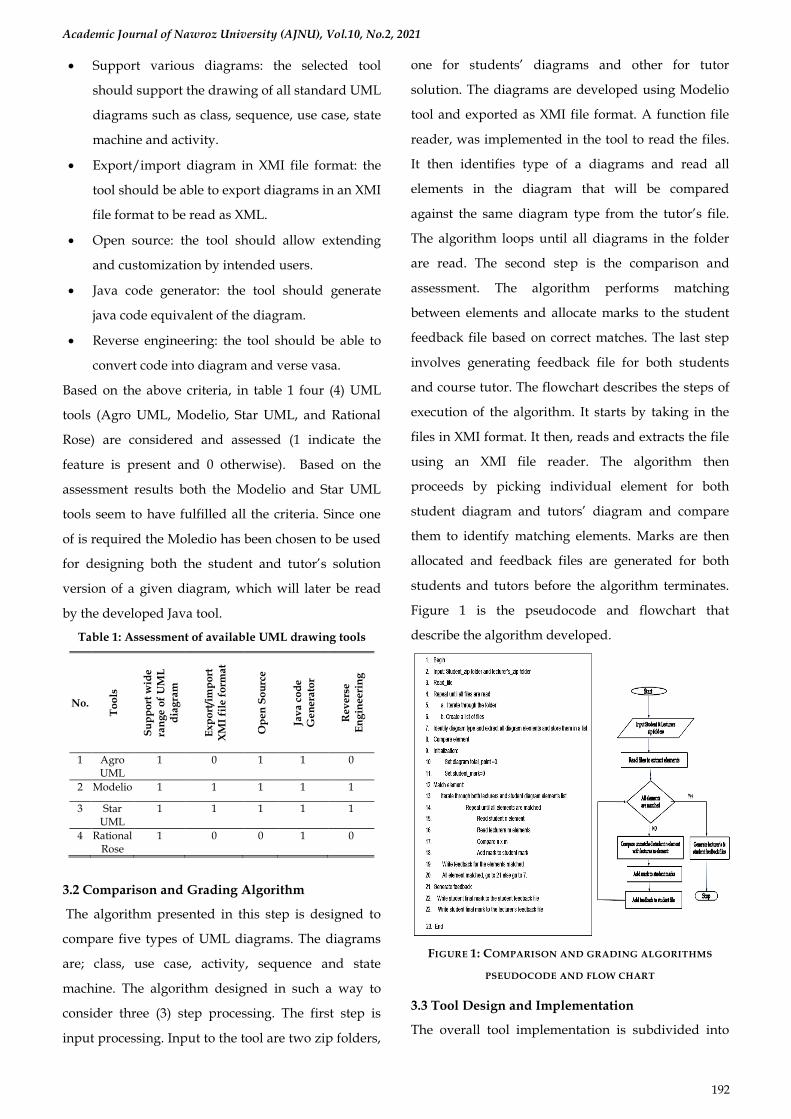
3.2 Comparison and Grading Algorithm
The algorithm presented in this step is designed to
compare five types of UML diagrams. The diagrams
are; class, use case, activity, sequence and state
machine. The algorithm designed in such a way to
consider three (3) step processing. The first step is
input processing. Input to the tool are two zip folders,
one for students’ diagrams and other for tutor
solution. The diagrams are developed using Modelio
tool and exported as XMI file format. A function file
reader, was implemented in the tool to read the files.
It then identifies type of a diagrams and read all
elements in the diagram that will be compared
against the same diagram type from the tutor’s file.
The algorithm loops until all diagrams in the folder
are read. The second step is the comparison and
assessment. The algorithm performs matching
between elements and allocate marks to the student
feedback file based on correct matches. The last step
involves generating feedback file for both students
and course tutor. The flowchart describes the steps of
execution of the algorithm. It starts by taking in the
files in XMI format. It then, reads and extracts the file
using an XMI file reader. The algorithm then
proceeds by picking individual element for both
student diagram and tutors’ diagram and compare
them to identify matching elements. Marks are then
allocated and feedback files are generated for both
students and tutors before the algorithm terminates.
Figure 1 is the pseudocode and flowchart that
describe the algorithm developed.
FIGURE 1: COMPARISON AND GRADING ALGORITHMS
PSEUDOCODE AND FLOW CHART
3.3 Tool Design and Implementation
The overall tool implementation is subdivided into
Academic Journal of Nawroz University (AJNU), Vol.10, No.2, 2021
193
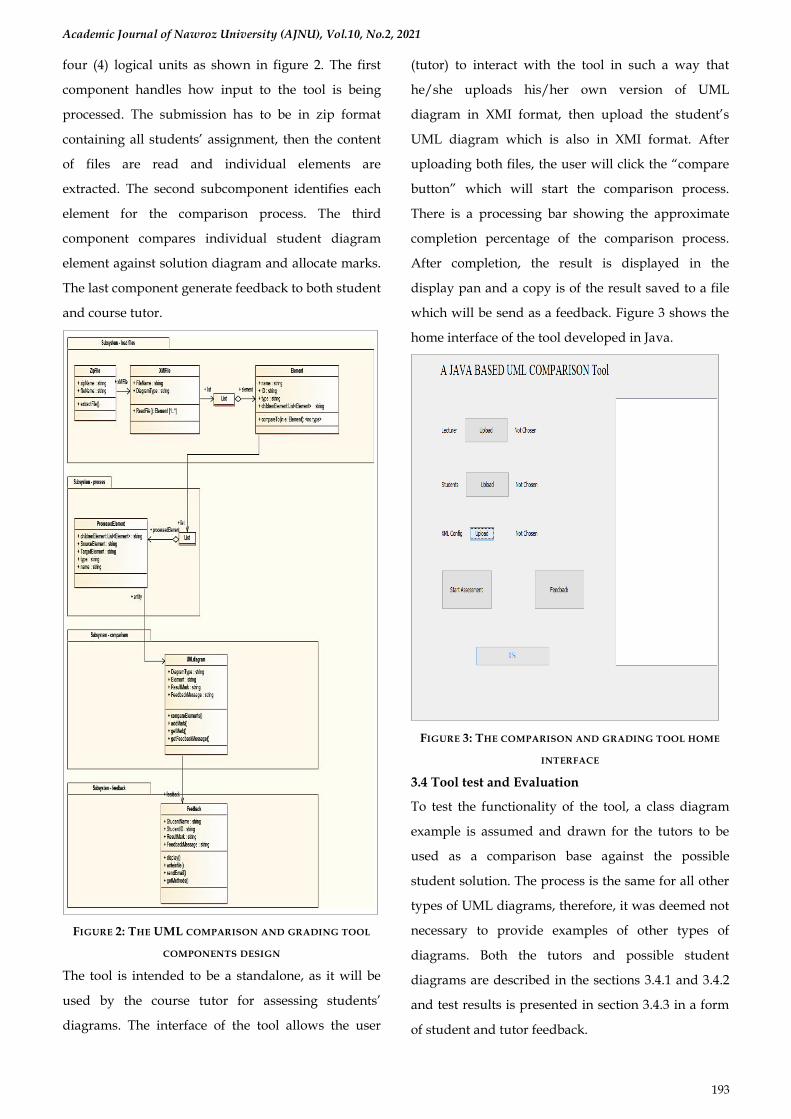
four (4) logical units as shown in figure 2. The first
component handles how input to the tool is being
processed. The submission has to be in zip format
containing all students’ assignment, then the content
of files are read and individual elements are
extracted. The second subcomponent identifies each
element for the comparison process. The third
component compares individual student diagram
element against solution diagram and allocate marks.
The last component generate feedback to both student
and course tutor.
FIGURE 2: THE UML COMPARISON AND GRADING TOOL
COMPONENTS DESIGN
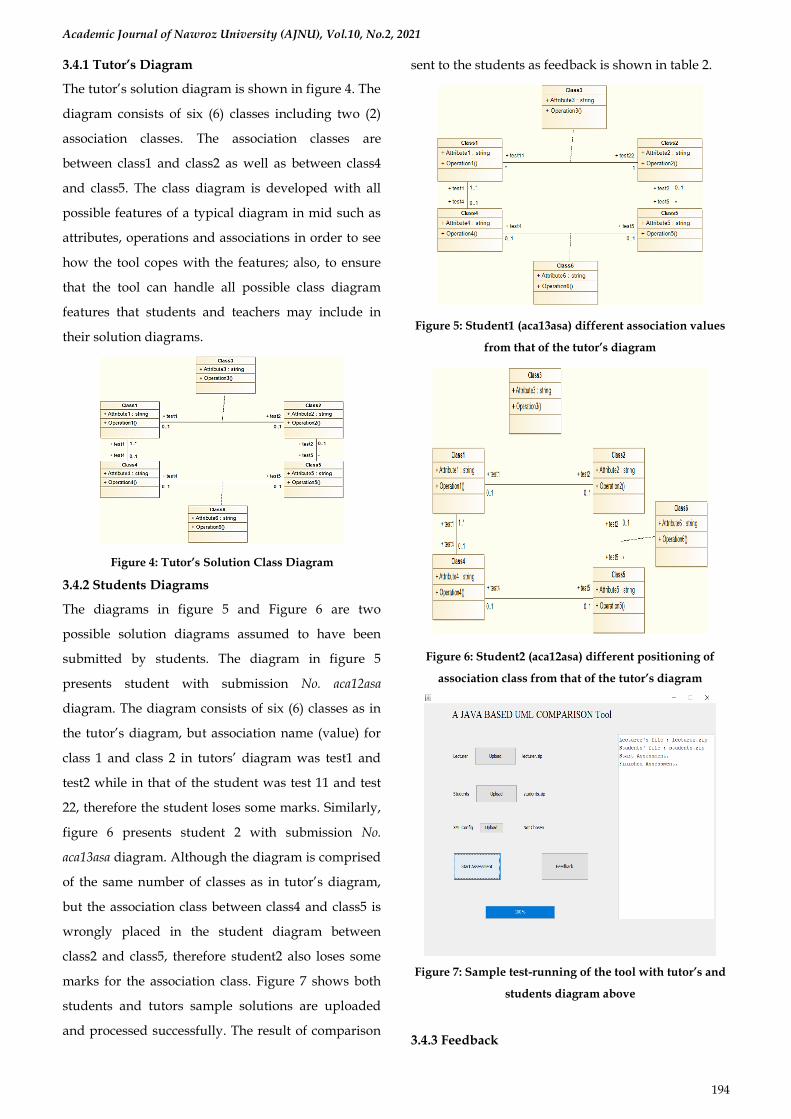
The tool is intended to be a standalone, as it will be
used by the course tutor for assessing students’
diagrams. The interface of the tool allows the user
(tutor) to interact with the tool in such a way that
he/she uploads his/her own version of UML
diagram in XMI format, then upload the student’s
UML diagram which is also in XMI format. After
uploading both files, the user will click the “compare
button” which will start the comparison process.
There is a processing bar showing the approximate
completion percentage of the comparison process.
After completion, the result is displayed in the
display pan and a copy is of the result saved to a file
which will be send as a feedback. Figure 3 shows the
home interface of the tool developed in Java.
FIGURE 3: THE COMPARISON AND GRADING TOOL HOME
INTERFACE
3.4 Tool test and Evaluation
To test the functionality of the tool, a class diagram
example is assumed and drawn for the tutors to be
used as a comparison base against the possible
student solution. The process is the same for all other
types of UML diagrams, therefore, it was deemed not
necessary to provide examples of other types of
diagrams. Both the tutors and possible student
diagrams are described in the sections 3.4.1 and 3.4.2
and test results is presented in section 3.4.3 in a form
of student and tutor feedback.
Academic Journal of Nawroz University (AJNU), Vol.10, No.2, 2021
194
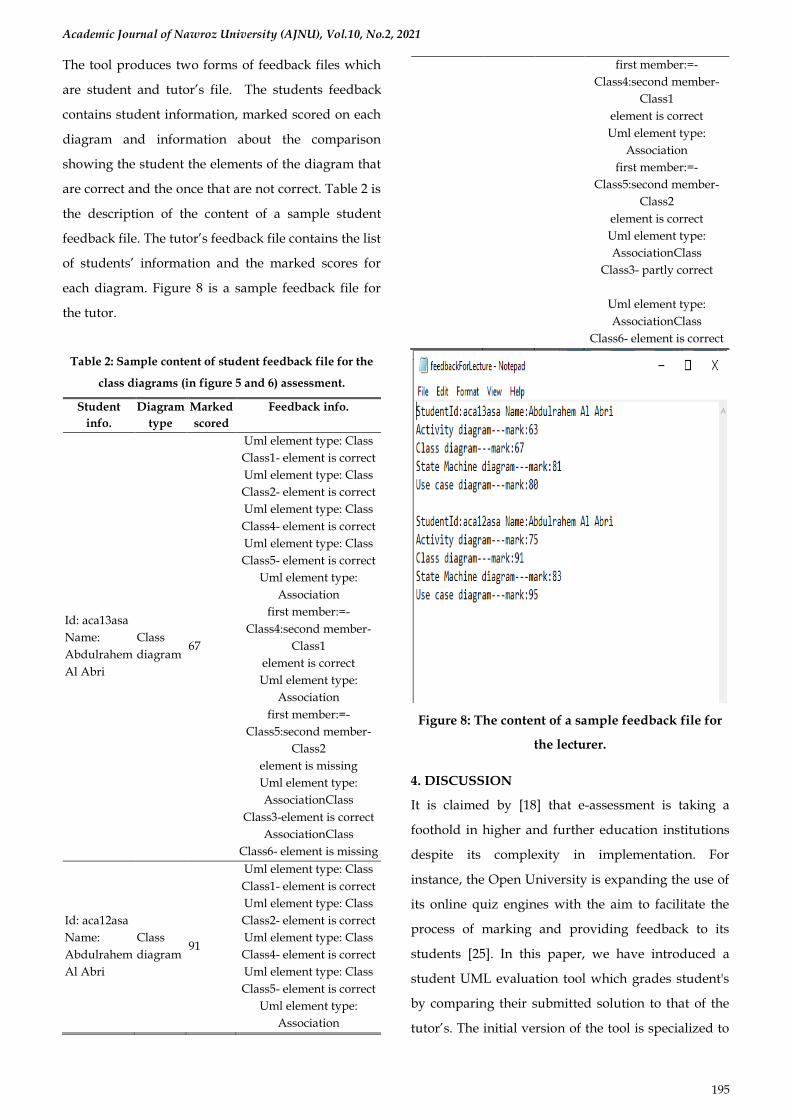
3.4.1 Tutor’s Diagram
The tutor’s solution diagram is shown in figure 4. The
diagram consists of six (6) classes including two (2)
association classes. The association classes are
between class1 and class2 as well as between class4
and class5. The class diagram is developed with all
possible features of a typical diagram in mid such as
attributes, operations and associations in order to see
how the tool copes with the features; also, to ensure
that the tool can handle all possible class diagram
features that students and teachers may include in
their solution diagrams.
Figure 4: Tutor’s Solution Class Diagram
3.4.2 Students Diagrams
The diagrams in figure 5 and Figure 6 are two
possible solution diagrams assumed to have been
submitted by students. The diagram in figure 5
presents student with submission No. aca12asa
diagram. The diagram consists of six (6) classes as in
the tutor’s diagram, but association name (value) for
class 1 and class 2 in tutors’ diagram was test1 and
test2 while in that of the student was test 11 and test
22, therefore the student loses some marks. Similarly,
figure 6 presents student 2 with submission No.
aca13asa diagram. Although the diagram is comprised
of the same number of classes as in tutor’s diagram,
but the association class between class4 and class5 is
wrongly placed in the student diagram between
class2 and class5, therefore student2 also loses some
marks for the association class. Figure 7 shows both
students and tutors sample solutions are uploaded
and processed successfully. The result of comparison
sent to the students as feedback is shown in table 2.
Figure 5: Student1 (aca13asa) different association values
from that of the tutor’s diagram
Figure 6: Student2 (aca12asa) different positioning of
association class from that of the tutor’s diagram
Figure 7: Sample test-running of the tool with tutor’s and
students diagram above
3.4.3 Feedback
Academic Journal of Nawroz University (AJNU), Vol.10, No.2, 2021
195
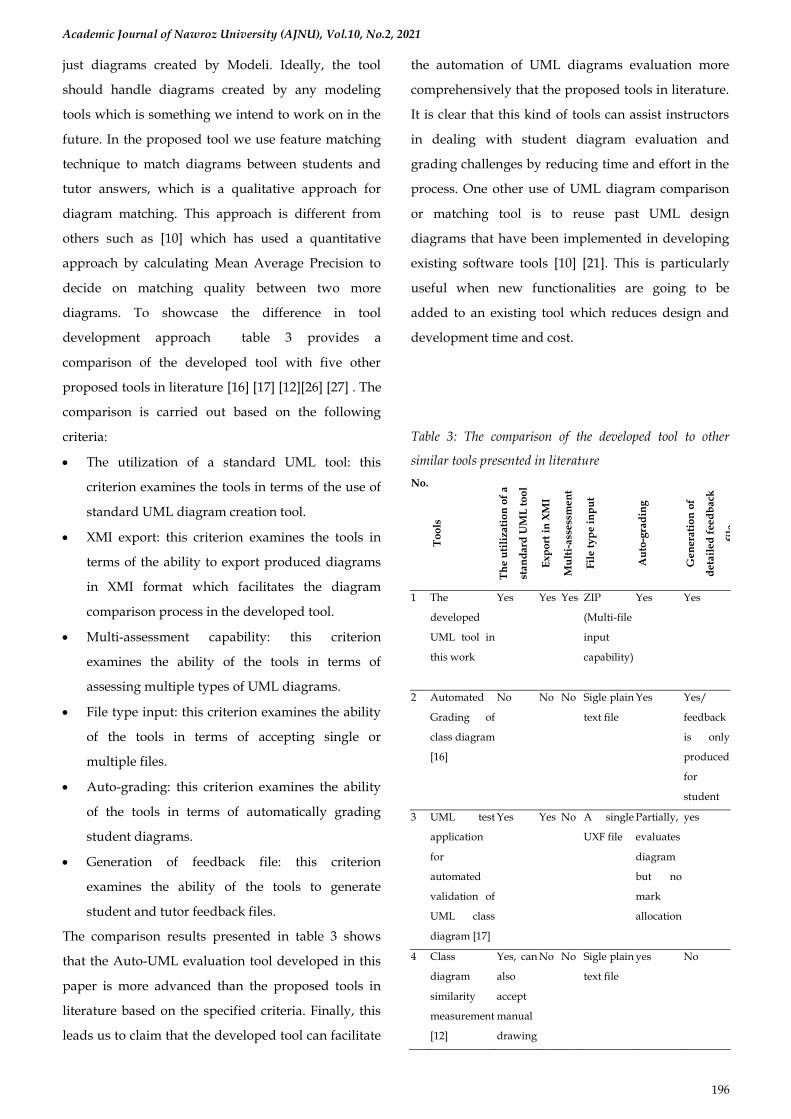
The tool produces two forms of feedback files which
are student and tutor’s file. The students feedback
contains student information, marked scored on each
diagram and information about the comparison
showing the student the elements of the diagram that
are correct and the once that are not correct. Table 2 is
the description of the content of a sample student
feedback file. The tutor’s feedback file contains the list
of students’ information and the marked scores for
each diagram. Figure 8 is a sample feedback file for
the tutor.
Table 2: Sample content of student feedback file for the
class diagrams (in figure 5 and 6) assessment.
Student
info.
Diagram
type
Marked
scored
Feedback info.
Id: aca13asa
Name:
Abdulrahem
Al Abri
Class
diagram 67
Uml element type: Class
Class1- element is correct
Uml element type: Class
Class2- element is correct
Uml element type: Class
Class4- element is correct
Uml element type: Class
Class5- element is correct
Uml element type:
Association
first member:=-
Class4:second member-
Class1
element is correct
Uml element type:
Association
first member:=-
Class5:second member-
Class2
element is missing
Uml element type:
AssociationClass
Class3-element is correct
AssociationClass
Class6- element is missing
Id: aca12asa
Name:
Abdulrahem
Al Abri
Class
diagram 91
Uml element type: Class
Class1- element is correct
Uml element type: Class
Class2- element is correct
Uml element type: Class
Class4- element is correct
Uml element type: Class
Class5- element is correct
Uml element type:
Association
first member:=-
Class4:second member-
Class1
element is correct
Uml element type:
Association
first member:=-
Class5:second member-
Class2
element is correct
Uml element type:
AssociationClass
Class3- partly correct
Uml element type:
AssociationClass
Class6- element is correct
Figure 8: The content of a sample feedback file for
the lecturer.
4. DISCUSSION
It is claimed by [18] that e-assessment is taking a
foothold in higher and further education institutions
despite its complexity in implementation. For
instance, the Open University is expanding the use of
its online quiz engines with the aim to facilitate the
process of marking and providing feedback to its
students [25]. In this paper, we have introduced a
student UML evaluation tool which grades student's
by comparing their submitted solution to that of the
tutor’s. The initial version of the tool is specialized to
Academic Journal of Nawroz University (AJNU), Vol.10, No.2, 2021
196
just diagrams created by Modeli. Ideally, the tool
should handle diagrams created by any modeling
tools which is something we intend to work on in the
future. In the proposed tool we use feature matching
technique to match diagrams between students and
tutor answers, which is a qualitative approach for
diagram matching. This approach is different from
others such as [10] which has used a quantitative
approach by calculating Mean Average Precision to
decide on matching quality between two more
diagrams. To showcase the difference in tool
development approach table 3 provides a
comparison of the developed tool with five other
proposed tools in literature [16] [17] [12][26] [27] . The
comparison is carried out based on the following
criteria:
• The utilization of a standard UML tool: this
criterion examines the tools in terms of the use of
standard UML diagram creation tool.
• XMI export: this criterion examines the tools in
terms of the ability to export produced diagrams
in XMI format which facilitates the diagram
comparison process in the developed tool.
• Multi-assessment capability: this criterion
examines the ability of the tools in terms of
assessing multiple types of UML diagrams.
• File type input: this criterion examines the ability
of the tools in terms of accepting single or
multiple files.
• Auto-grading: this criterion examines the ability
of the tools in terms of automatically grading
student diagrams.
• Generation of feedback file: this criterion
examines the ability of the tools to generate
student and tutor feedback files.
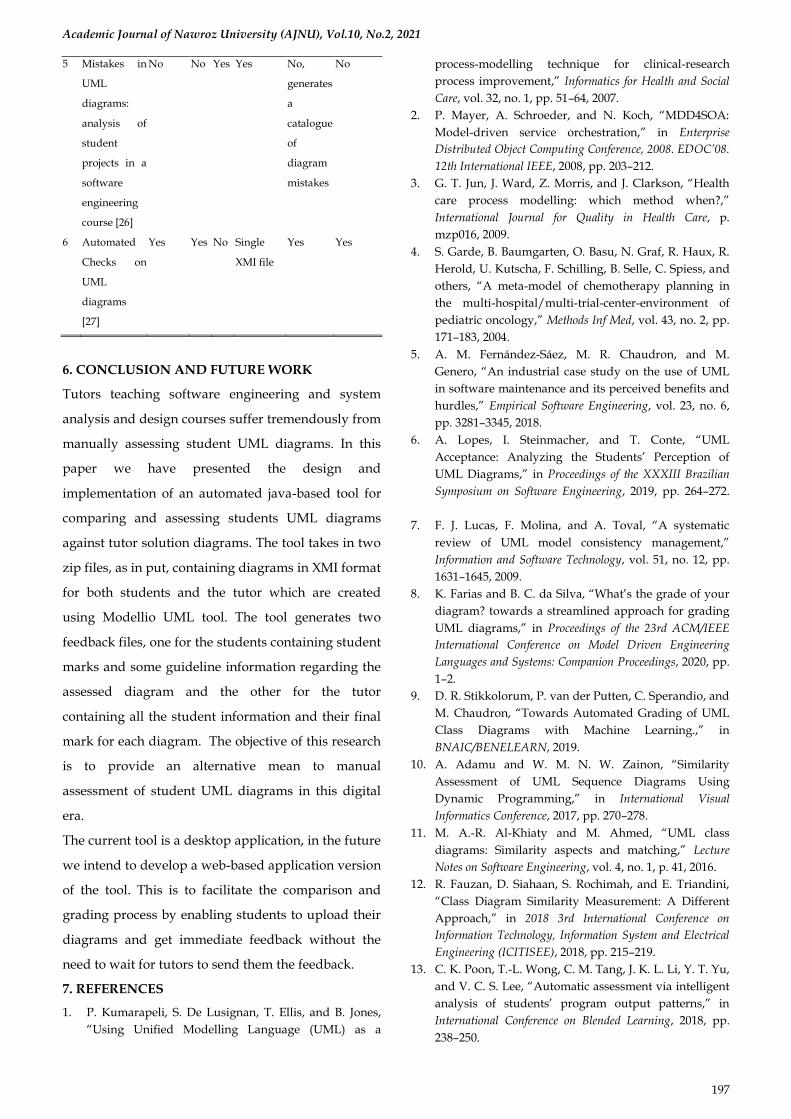
The comparison results presented in table 3 shows
that the Auto-UML evaluation tool developed in this
paper is more advanced than the proposed tools in
literature based on the specified criteria. Finally, this
leads us to claim that the developed tool can facilitate
the automation of UML diagrams evaluation more
comprehensively that the proposed tools in literature.
It is clear that this kind of tools can assist instructors
in dealing with student diagram evaluation and
grading challenges by reducing time and effort in the
process. One other use of UML diagram comparison
or matching tool is to reuse past UML design
diagrams that have been implemented in developing
existing software tools [10] [21]. This is particularly
useful when new functionalities are going to be
added to an existing tool which reduces design and
development time and cost.
Table 3: The comparison of the developed tool to other
similar tools presented in literature
No.
To
ols
Th
e u
tili
zati
on
of
a
sta
nd
ard
UM
L t
oo
l
Ex
po
rt i
n X
MI
form
at
Mu
lti-
ass
ess
me
nt
cap
ab
ilit
y
Fil
e t
yp
e in
pu
t
Au
to-g
rad
ing
Ge
ne
rati
on
of
de
tail
ed
fee
db
ack
file
1 The
developed
UML tool in
this work
Yes Yes Yes ZIP
(Multi-file
input
capability)
Yes Yes
2 Automated
Grading of
class diagram
[16]
No No No Sigle plain
text file
Yes Yes/
feedback
is only
produced
for
student
3 UML test
application
for
automated
validation of
UML class
diagram [17]
Yes Yes No A single
UXF file
Partially,
evaluates
diagram
but no
mark
allocation
yes
4 Class
diagram
similarity
measurement
[12]
Yes, can
also
accept
manual
drawing
No No Sigle plain
text file
yes No
Academic Journal of Nawroz University (AJNU), Vol.10, No.2, 2021
197
5 Mistakes in
UML
diagrams:
analysis of
student
projects in a
software
engineering
course [26]
No No Yes Yes No,
generates
a
catalogue
of
diagram
mistakes
No
6 Automated
Checks on
UML
diagrams
[27]
Yes Yes No Single
XMI file
Yes Yes
6. CONCLUSION AND FUTURE WORK
Tutors teaching software engineering and system
analysis and design courses suffer tremendously from
manually assessing student UML diagrams. In this
paper we have presented the design and
implementation of an automated java-based tool for
comparing and assessing students UML diagrams
against tutor solution diagrams. The tool takes in two
zip files, as in put, containing diagrams in XMI format
for both students and the tutor which are created
using Modellio UML tool. The tool generates two
feedback files, one for the students containing student
marks and some guideline information regarding the
assessed diagram and the other for the tutor
containing all the student information and their final
mark for each diagram. The objective of this research
is to provide an alternative mean to manual
assessment of student UML diagrams in this digital
era.
The current tool is a desktop application, in the future
we intend to develop a web-based application version
of the tool. This is to facilitate the comparison and
grading process by enabling students to upload their
diagrams and get immediate feedback without the
need to wait for tutors to send them the feedback.
7. REFERENCES
1. P. Kumarapeli, S. De Lusignan, T. Ellis, and B. Jones,
“Using Unified Modelling Language (UML) as a
process-modelling technique for clinical-research
process improvement,” Informatics for Health and Social
Care, vol. 32, no. 1, pp. 51–64, 2007.
2. P. Mayer, A. Schroeder, and N. Koch, “MDD4SOA:
Model-driven service orchestration,” in Enterprise
Distributed Object Computing Conference, 2008. EDOC’08.
12th International IEEE, 2008, pp. 203–212.
3. G. T. Jun, J. Ward, Z. Morris, and J. Clarkson, “Health
care process modelling: which method when?,”
International Journal for Quality in Health Care, p.
mzp016, 2009.
4. S. Garde, B. Baumgarten, O. Basu, N. Graf, R. Haux, R.
Herold, U. Kutscha, F. Schilling, B. Selle, C. Spiess, and
others, “A meta-model of chemotherapy planning in
the multi-hospital/multi-trial-center-environment of
pediatric oncology,” Methods Inf Med, vol. 43, no. 2, pp.
171–183, 2004.
5. A. M. Fernández-Sáez, M. R. Chaudron, and M.
Genero, “An industrial case study on the use of UML
in software maintenance and its perceived benefits and
hurdles,” Empirical Software Engineering, vol. 23, no. 6,
pp. 3281–3345, 2018.
6. A. Lopes, I. Steinmacher, and T. Conte, “UML
Acceptance: Analyzing the Students’ Perception of
UML Diagrams,” in Proceedings of the XXXIII Brazilian
Symposium on Software Engineering, 2019, pp. 264–272.
7. F. J. Lucas, F. Molina, and A. Toval, “A systematic
review of UML model consistency management,”
Information and Software Technology, vol. 51, no. 12, pp.
1631–1645, 2009.
8. K. Farias and B. C. da Silva, “What’s the grade of your
diagram? towards a streamlined approach for grading
UML diagrams,” in Proceedings of the 23rd ACM/IEEE
International Conference on Model Driven Engineering
Languages and Systems: Companion Proceedings, 2020, pp.
1–2.
9. D. R. Stikkolorum, P. van der Putten, C. Sperandio, and
M. Chaudron, “Towards Automated Grading of UML
Class Diagrams with Machine Learning.,” in
BNAIC/BENELEARN, 2019.
10. A. Adamu and W. M. N. W. Zainon, “Similarity
Assessment of UML Sequence Diagrams Using
Dynamic Programming,” in International Visual
Informatics Conference, 2017, pp. 270–278.
11. M. A.-R. Al-Khiaty and M. Ahmed, “UML class
diagrams: Similarity aspects and matching,” Lecture
Notes on Software Engineering, vol. 4, no. 1, p. 41, 2016.
12. R. Fauzan, D. Siahaan, S. Rochimah, and E. Triandini,
“Class Diagram Similarity Measurement: A Different
Approach,” in 2018 3rd International Conference on
Information Technology, Information System and Electrical
Engineering (ICITISEE), 2018, pp. 215–219.
13. C. K. Poon, T.-L. Wong, C. M. Tang, J. K. L. Li, Y. T. Yu,
and V. C. S. Lee, “Automatic assessment via intelligent
analysis of students’ program output patterns,” in
International Conference on Blended Learning, 2018, pp.
238–250.
Academic Journal of Nawroz University (AJNU), Vol.10, No.2, 2021
198
14. M. A.-R. Al-Khiaty and M. Ahmed, “Matching UML
class diagrams using a Hybridized Greedy-Genetic
algorithm,” in 2017 12th International Scientific and
Technical Conference on Computer Sciences and Information
Technologies (CSIT), 2017, vol. 1, pp. 161–166.
15. D. Siahaan, Y. Desnelita, and others, “Structural and
semantic similarity measurement of UML sequence
diagrams,” in 2017 11th International Conference on
Information \& Communication Technology and System
(ICTS), 2017, pp. 227–234.
16. W. Bian, O. Alam, and J. Kienzle, “Automated grading
of class diagrams,” in 2019 ACM/IEEE 22nd
International Conference on Model Driven Engineering
Languages and Systems Companion (MODELS-C), 2019,
pp. 700–709.
17. P. Herout and P. Brada, “UML-Test Application for
Automated Validation of Students’ UML Class
Diagram,” in 2016 IEEE 29th International Conference on
Software Engineering Education and Training (CSEET),
2016, pp. 222–226.
18. T. Reischmann and H. Kuchen, “Towards an E-
assessment tool for advanced software engineering
skills,” in Proceedings of the 16th Koli Calling International
Conference on Computing Education Research, 2016, pp.
81–90.
19. V. Vachharajani and J. Pareek, “Framework to
approximate label matching for automatic assessment
of use-case diagram,” International Journal of Distance
Education Technologies (IJDET), vol. 17, no. 3, pp. 75–95,
2019.
20. V. Vachharajani and J. Pareek, “A proposed
architecture for automated assessment of use case
diagrams,” International Journal of Computer
Applications, vol. 108, no. 4, 2014.
21. E. Triandini, R. Fauzan, D. O. Siahaan, and S.
Rochimah, “Sequence diagram similarity
measurement: a different approach,” in 2019 16th
International Joint Conference on Computer Science and
Software Engineering (JCSSE), 2019, pp. 348–351.
22. J. Liebenberg and V. Pieterse, “Investigating the
feasibility of automatic assessment of programming
tasks,” 2018.
23. A. Bey, P. Jermann, and P. Dillenbourg, “A comparison
between two automatic assessment approaches for
programming: An empirical study on MOOCs,” Journal
of Educational Technology \& Society, vol. 21, no. 2, pp.
259–272, 2018.
24. T. Rani and S. Garg, “Comparison of different UML
tool: Tool approach,” International Journal Of
Engineering And Computer Science, vol. 2, no. 6, pp.
1900–1908, 2013.
25. P. Thomas, “Online Automatic Marking of Diagram,”
Springer, vol. 26, no. 349–359, 2012.
26. S. Chren, B. Buhnova, M. Macak, L. Daubner, and B.
Rossi, “Mistakes in UML diagrams: analysis of student
projects in a software engineering course,” in 2019
IEEE/ACM 41st International Conference on Software
Engineering: Software Engineering Education and Training
(ICSE-SEET), 2019, pp. 100–109.
27. M. Striewe and M. Goedicke, “Automated checks on
UML diagrams,” in Proceedings of the 16th annual joint
conference on Innovation and technology in computer
science education, 2011, pp. 38–42.