a thesis submitted for the degree of doctor of ... - core
TRANSCRIPT

INVESTIGATING CONSUMER ADOPTION, USAGE AND IMPACT OF BROADBAND: UK
HOUSEHOLDS
A thesis submitted for the degree of Doctor of Philosophy
By Yogesh Kumar Dwivedi
School of Information Systems, Computing and Mathematics Brunel University September 2005

Dedicated To
Sudha Didi and Murly Jij*a
Niece Kirti
Nephews Shiva and Kishan
For all your love, support and constant encouragement, which has enabled me to reach this milestone. I could not have imagined achieving this without you all.
Abstract
ABSTRACT
i
Despite a large investment, the majority of countries especially the UK demonstrate
a slow adoption of broadband. In order to enhance the adoption and use of broadband this
research examines the factors influencing the decisions of household consumers. This
research aims to address the two main areas of concern: first, to investigate consumer-level factors affecting the adoption of broadband in UK households; and second, to understand the
usage of broadband and its impact upon household consumers in the UK. This research
adopted a quantitative approach that was executed in the following steps. First, it developed
a conceptual model by selecting and justifying relevant constructs from appropriate theories
and models related to technology adoption, usage and impact. Second, it operationalised the
constructs by developing and validating the research instrument by employing the content
validity, reliability and construct validity approach. Finally, it empirically validated and
refined the conceptual model by employing a survey research approach.
The findings suggested that all the constructs included in the conceptual model,
except knowledge, significantly influence the consumers when adopting broadband in a UK
household. The significant constructs include relative advantage, utilitarian outcomes, hedonic outcomes, primary influence, facilitating conditions resources and self-efficacy. The
rate and variety of Internet usage is significantly higher for broadband consumers than
narrowband ones. It was also found that significantly more numbers of broadband consumers
perceived changes in time allocation patterns on various daily life activities than narrowband
ones. This research contributes towards theory, practice and policy. The contribution of this
research towards theory is that it integrates and determines the appropriate inforination
systems (IS) literature in order to enhance knowledge of technology adoption from the
consumers' perspectives. An added contribution to theory is the development and validation
of a research instrument that future studies can utilise to examine broadband and other
similar technologies in household context. Considering the slow adoption of broadband, this
research also provides implications for policy makers and the providers of broadband in
order to encourage and promote homogenous adoption and usage.
Adoption, Usage and Impact of Broadband: UK Households Yogesh K. DNvivedi
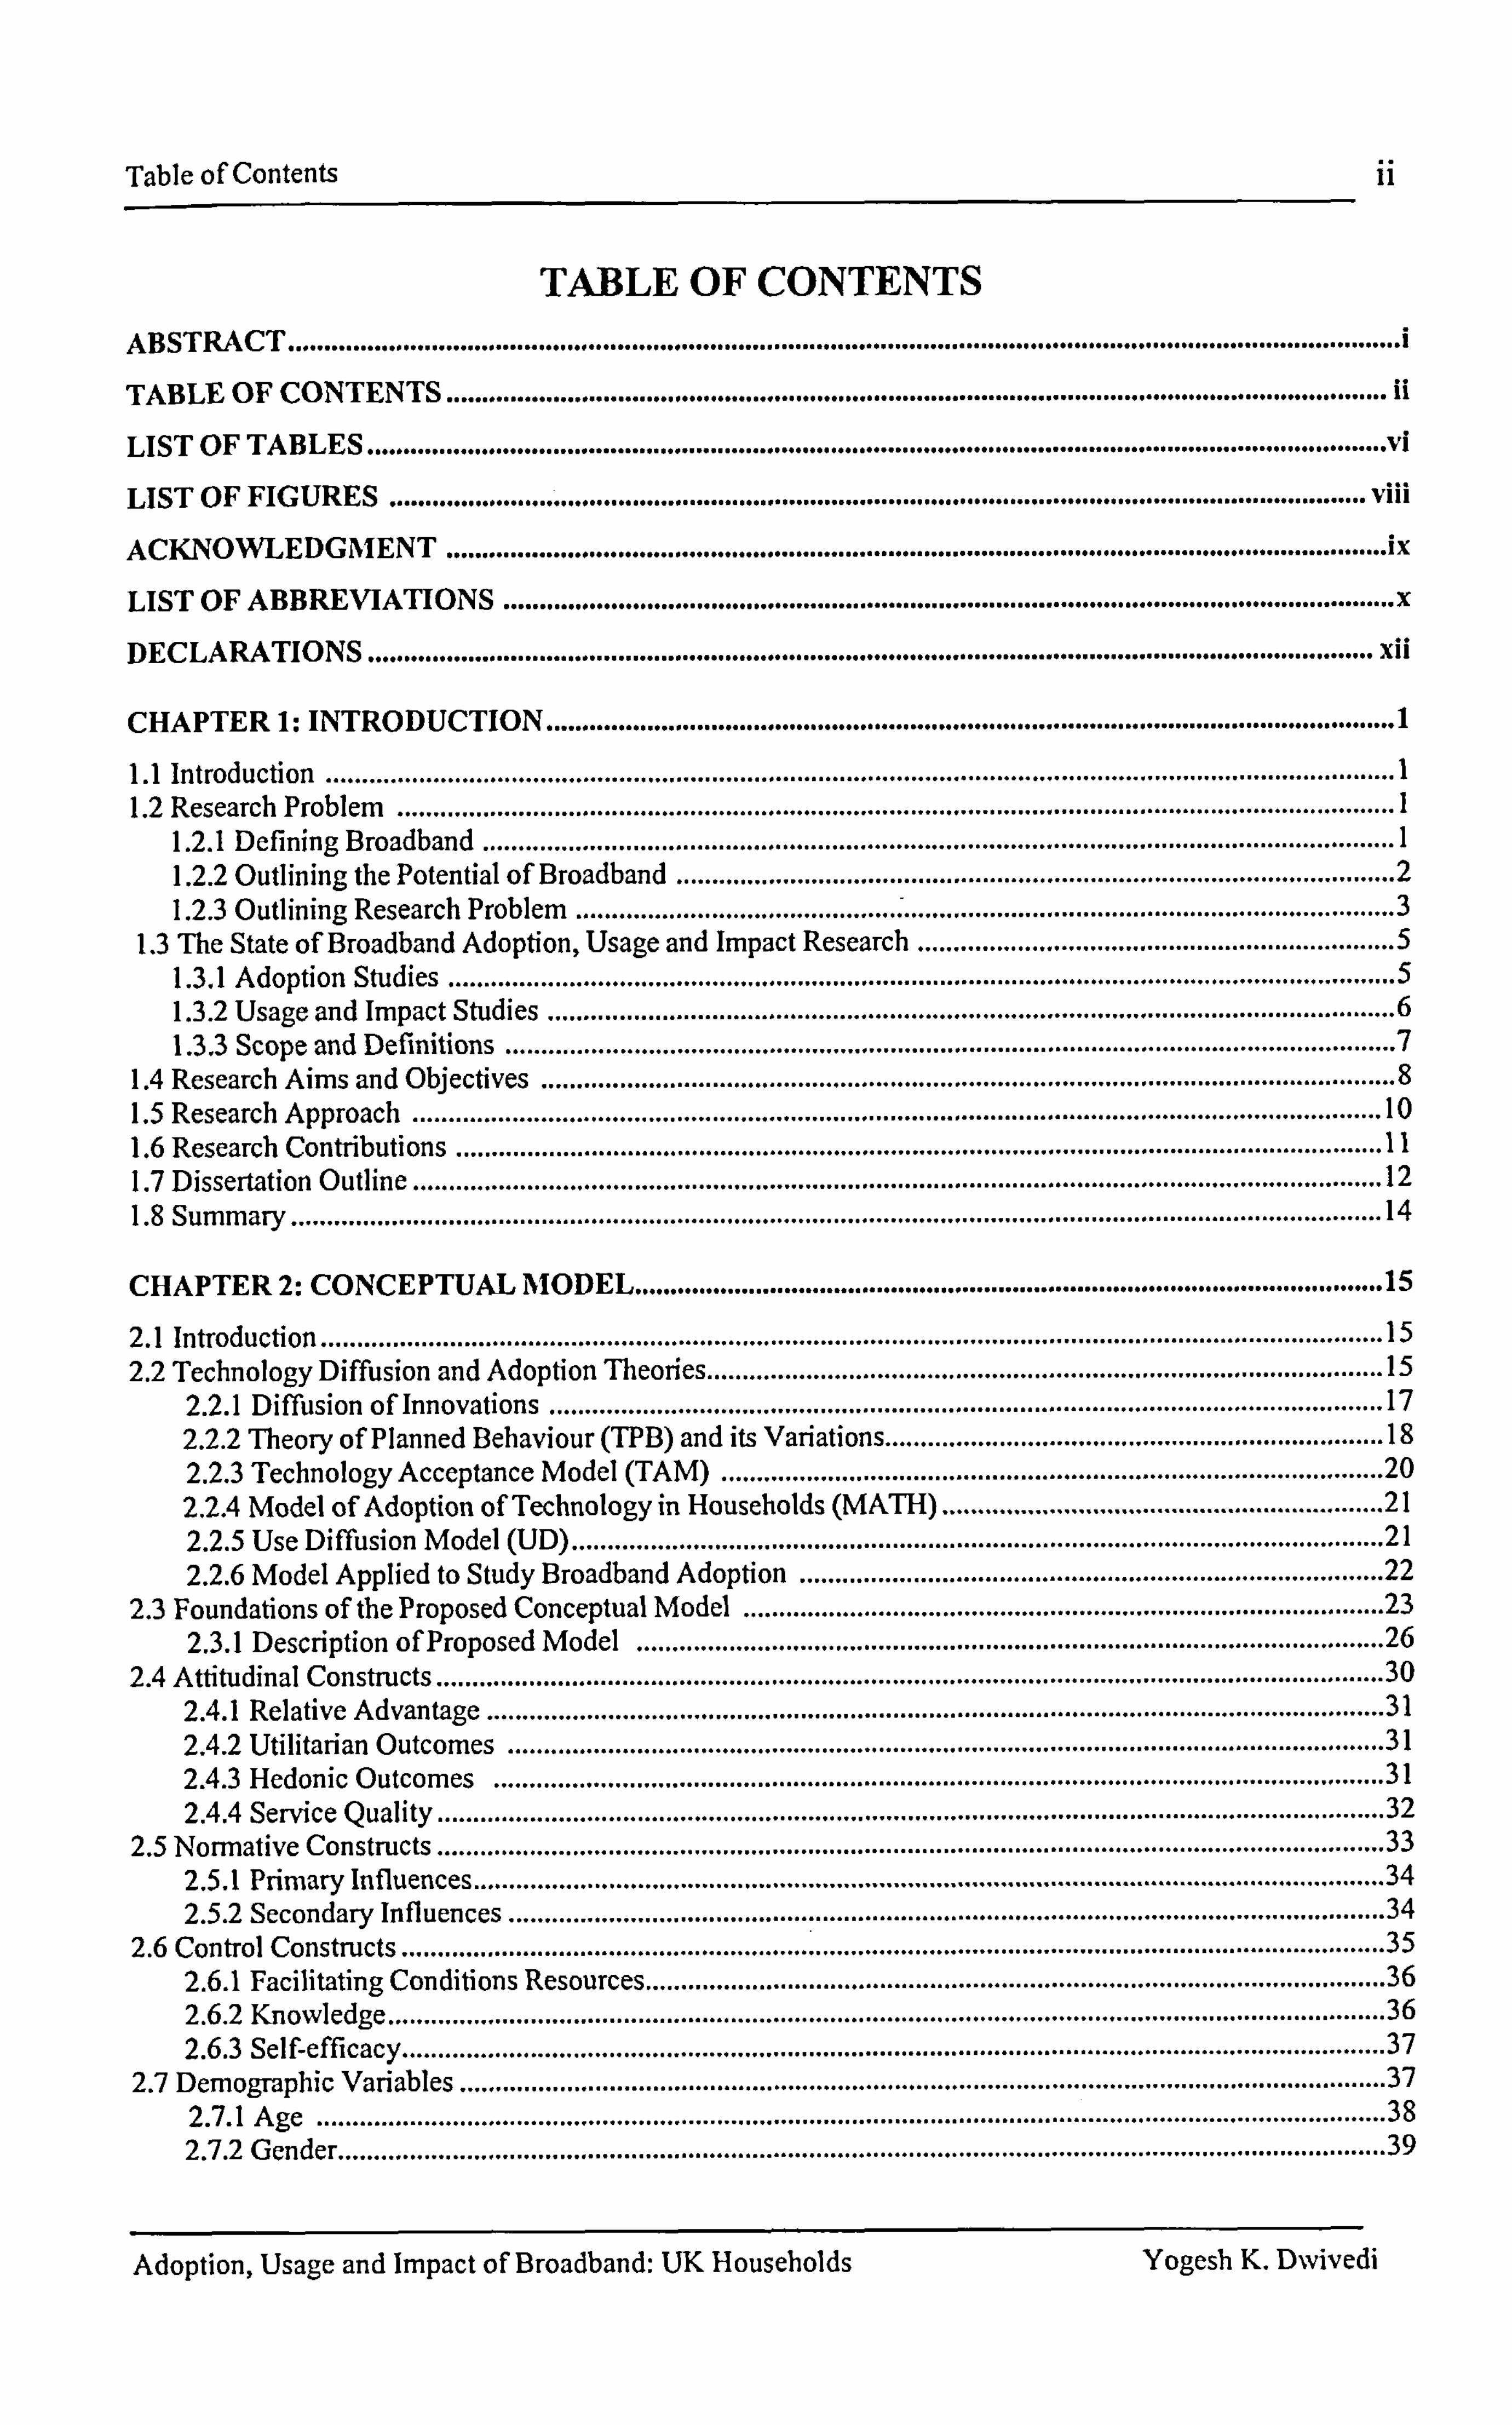
Table of Contents ii
TABLE OF CONTENTS ABSTRACT ............................................................................................................................................................
i
TABLE OF CONTENTS .................................................................................................................................... H
LIST OF TABLES ............................................................................................................................................... A
LIST OF FIGURES ..................................................... I ................................................................................... viii
ACKNOWLEDGMENT .................................................................................................................................... ix
LIST OF ABBREVIATIONS ............................................................................................................................. x
DECLARATIONS ............................................................................................................................................. xii
CHAPTER 1: INTRODUCTION ....................................................................................................................... 1.1 Introduction ......................................................................................................................................................
1 1.2 Research Problem ............................................................................................................................................
1 1.2.1 Defining Broadband ................................................................................................................................
1 1.2.2 Outlining the Potential of Broadband .....................................................................................................
2 1.2.3 Outlining Research Problem ...................................................................................................................
3 1.3 The State of Broadband Adoption, Usage and Impact Research ...................................................................
5 1.3.1 Adoption Studies .....................................................................................................................................
5 1.3.2 Usage and Impact Studies .......................................................................................................................
6 1.3.3 Scope and Definitions ........................................................................................................................... ..
7 1.4 Research Aims and Objectives ........................................................................................................................
8 1.5 Research Approach ........................................................................................................................................
10 1.6 Research Contributions ..................................................................................................................................
11 1.7 Dissertation Outline ........................................................................................................................................
12 1.8 Summary .........................................................................................................................................................
14
CHAPTER 2: CONCEPTUAL MODEL ......................................................................................................... 15
2.1 Introduction ..................................................................................................................................................... 15
2.2 Technology Diffusion and Adoption Theories ............................................................................................... 15
2.2.1 Diffusion of Innovations ..................................................................................................................... 17
2.2.2 Theory of Planned Behaviour (TPB) and its Variations ...................................................................... 18
2.2.3 Technology Acceptance Model (TAM) ............................................................................................. 20
2.2.4 Model of Adoption of Technology in Households (MATH) .............................................................. 21
2.2.5 Use Diffusion Model (UD) ..................................................................................................................
21 2.2.6 Model Applied to Study Broadband Adoption ..................................................................................
22 2.3 Foundations of the Proposed Conceptual Model ..........................................................................................
23 2.3.1 Description of Proposed Model .........................................................................................................
26 2.4 Attitudinal Constructs .....................................................................................................................................
30 2.4.1 Relative Advantage ..............................................................................................................................
31 2.4.2 Utilitarian Outcomes ...........................................................................................................................
31 2.4.3 Hedonic Outcomes .............................................................................................................................
31 2.4.4 Service Quality .....................................................................................................................................
32 2.5 Normative Constructs .....................................................................................................................................
33 2.5.1 Primary Influences ................................................................................................................................
34 2.5.2 Secondary Influences ...........................................................................................................................
34 2.6 Control Constructs ..........................................................................................................................................
35 2.6.1 Facilitating Conditions Resources ........................................................................................................
36 2.6.2 Knowledge ............................................................................................................................................
36 2.6.3 Self-efficacy ..........................................................................................................................................
37 2.7 Demographic Variables ..................................................................................................................................
37 2.7.1 Age ......................................................................................................................................................
38 2.7.2 Gender ...................................................................................................................................................
39
Adoption, Usage and Impact of Broadband: UK Housebolds Yogesh K. Dwivedi
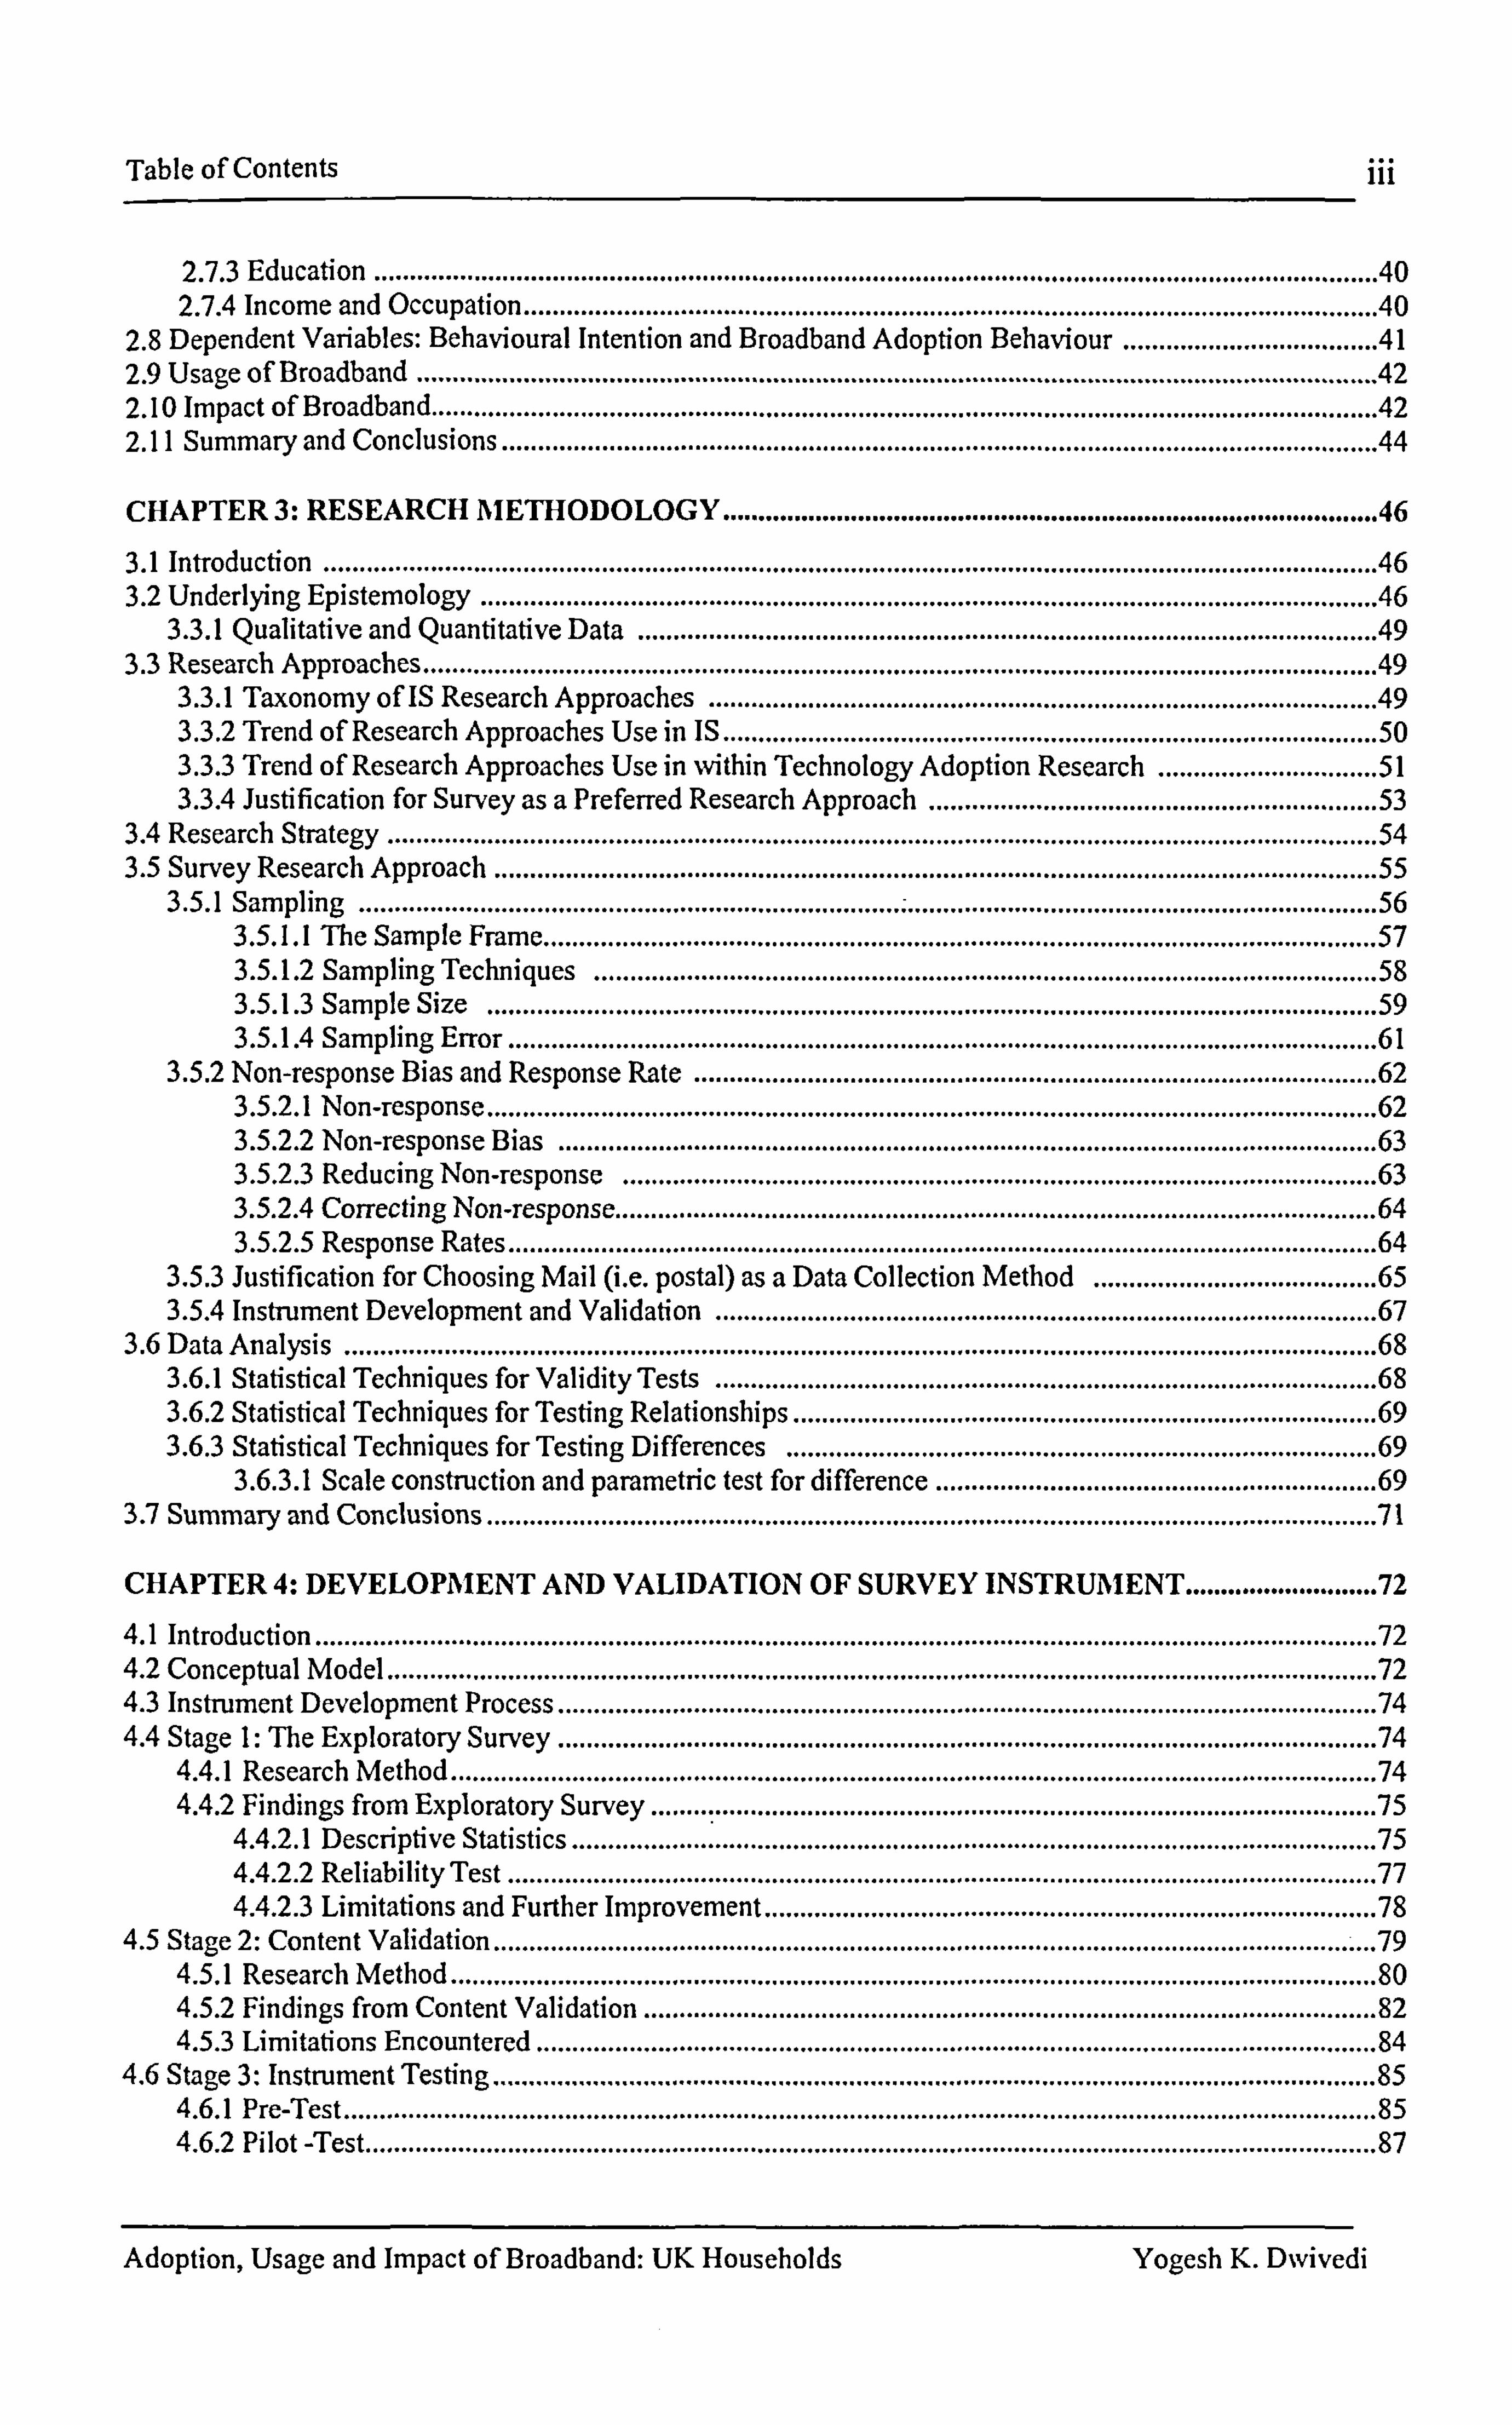
Table of Contents iii
2.7.3 Education ............................................................................................................................................. 40 2.7.4 Income and Occupation ........................................................................................................................ 40
2.8 Dependent Variables: Bebavioural Intention and Broadband Adoption Bebaviour .................................... 41 2.9 Usage of Broadband ....................................................................................................................................... 42 2.10 Impact of Broadband ..................................................................................................................................... 42 2.11 Summary and Conclusions ........................................................................................................................... 44
CHAPTER 3: RESEARCH METHODOLOGY ............................................................................................ 46
3.1 Introduction .................................................................................................................................................... 46 3.2 Underlying Epistemology
.............................................................................................................................. 46 3.3.1 Qualitative and Quantitative Data
........................................................................................................ 49 3.3 Research Approaches ...................................................................................................................................... 49
3.3.1 Taxonomy of IS Research Approaches .............................................................................................. 49 3.3.2 Trend of Research Approaches Use in IS ............................................................................................ 50 3.3.3 Trend of Research Approaches Use in within Technology Adoption Research
............................... 51 3.3.4 Justification for Survey as a Preferred Research Approach
............................................................... 53 3.4 Research Strategy
........................................................................................................................................... 54 3.5 Survey Research Approach ............................................................................................................................ 55
3.5.1 Sampling ............................................................................................................................................... 56 3.5.1.1 The Sample Frame
..................................................................................................................... 57 3.5.1.2 Sampling Techniques
.............................................................................................................. 58 3.5.1.3 Sample Size
............................................................................................................................. 59 3.5.1.4 Sampling Error
.......................................................................................................................... 61 3.5.2 Non-response Bias and Response Rate ................................................................................................ 62
3.5.2.1 Non-response ............................................................................................................................. 62 3.5.2.2 Non-response Bias ................................................................................................................... 63 3.5.2.3 Reducing Non-response
.......................................................................................................... 63 3.5.2.4 Correcting Non-response
........................................................................................................... 64 3.5.2.5 Response Rates
.......................................................................................................................... 64 3.5.3 Justification for Choosing Mail (i. e. postal) as a Data Collection Method
........................................ 65
3.5.4 Instrument Development and Validation ............................................................................................. 67 3.6 Data Analysis
................................................................................................................................................. 68
3.6.1 Statistical Techniques for Validity Tests ............................................................................................. 68 3.6.2 Statistical Techniques for Testing Relationships
.................................................................................. 69
3.6.3 Statistical Techniques for Testing Differences ................................................................................... 69 3.6.3.1 Scale construction and parametric test for difference
.............................................................. 69 3.7 Summary and Conclusions ............................................................................................................................. 71
CHAPTER 4: DEVELOPMENT AND VALIDATION OF SURVEY INSTRUMENT ........................... 72
4.1 Introduction ..................................................................................................................................................... 72 4.2 Conceptual Model ........................................................................................................................................... 72 4.3 Instrument Development Process ................................................................................................................... 74 4.4 Stage 1: The Exploratory Survey ................................................................................................................... 74
4.4.1 Research Method .................................................................................................................................. 74 4.4.2 Findings from Exploratory Survey ...................................................................................................... 75
4.4.2.1 Descriptive Statistics ................................................................................................................. 75
4.4.2.2 Reliability Test .......................................................................................................................... 77
4.4.2.3 Limitations and Further Improvement ...................................................................................... 78
4.5 Stage 2: Content Validation ............................................................................................................................ 79 4.5.1 Research Method .................................................................................................................................. 80 4.5.2 Findings from Content Validation ....................................................................................................... 82 4.5.3 Limitations Encountered ...................................................................................................................... 84
4.6 Stage 3: Instrument Testing ............................................................................................................................
85 4.6.1 Pre-Test ................................................................................................................................................. 85 4.6.2 Pilot -Test .............................................................................................................................................. 87
Adoption, Usage and Impact of Broadband: UK Households Yogesh K. Dwivedi
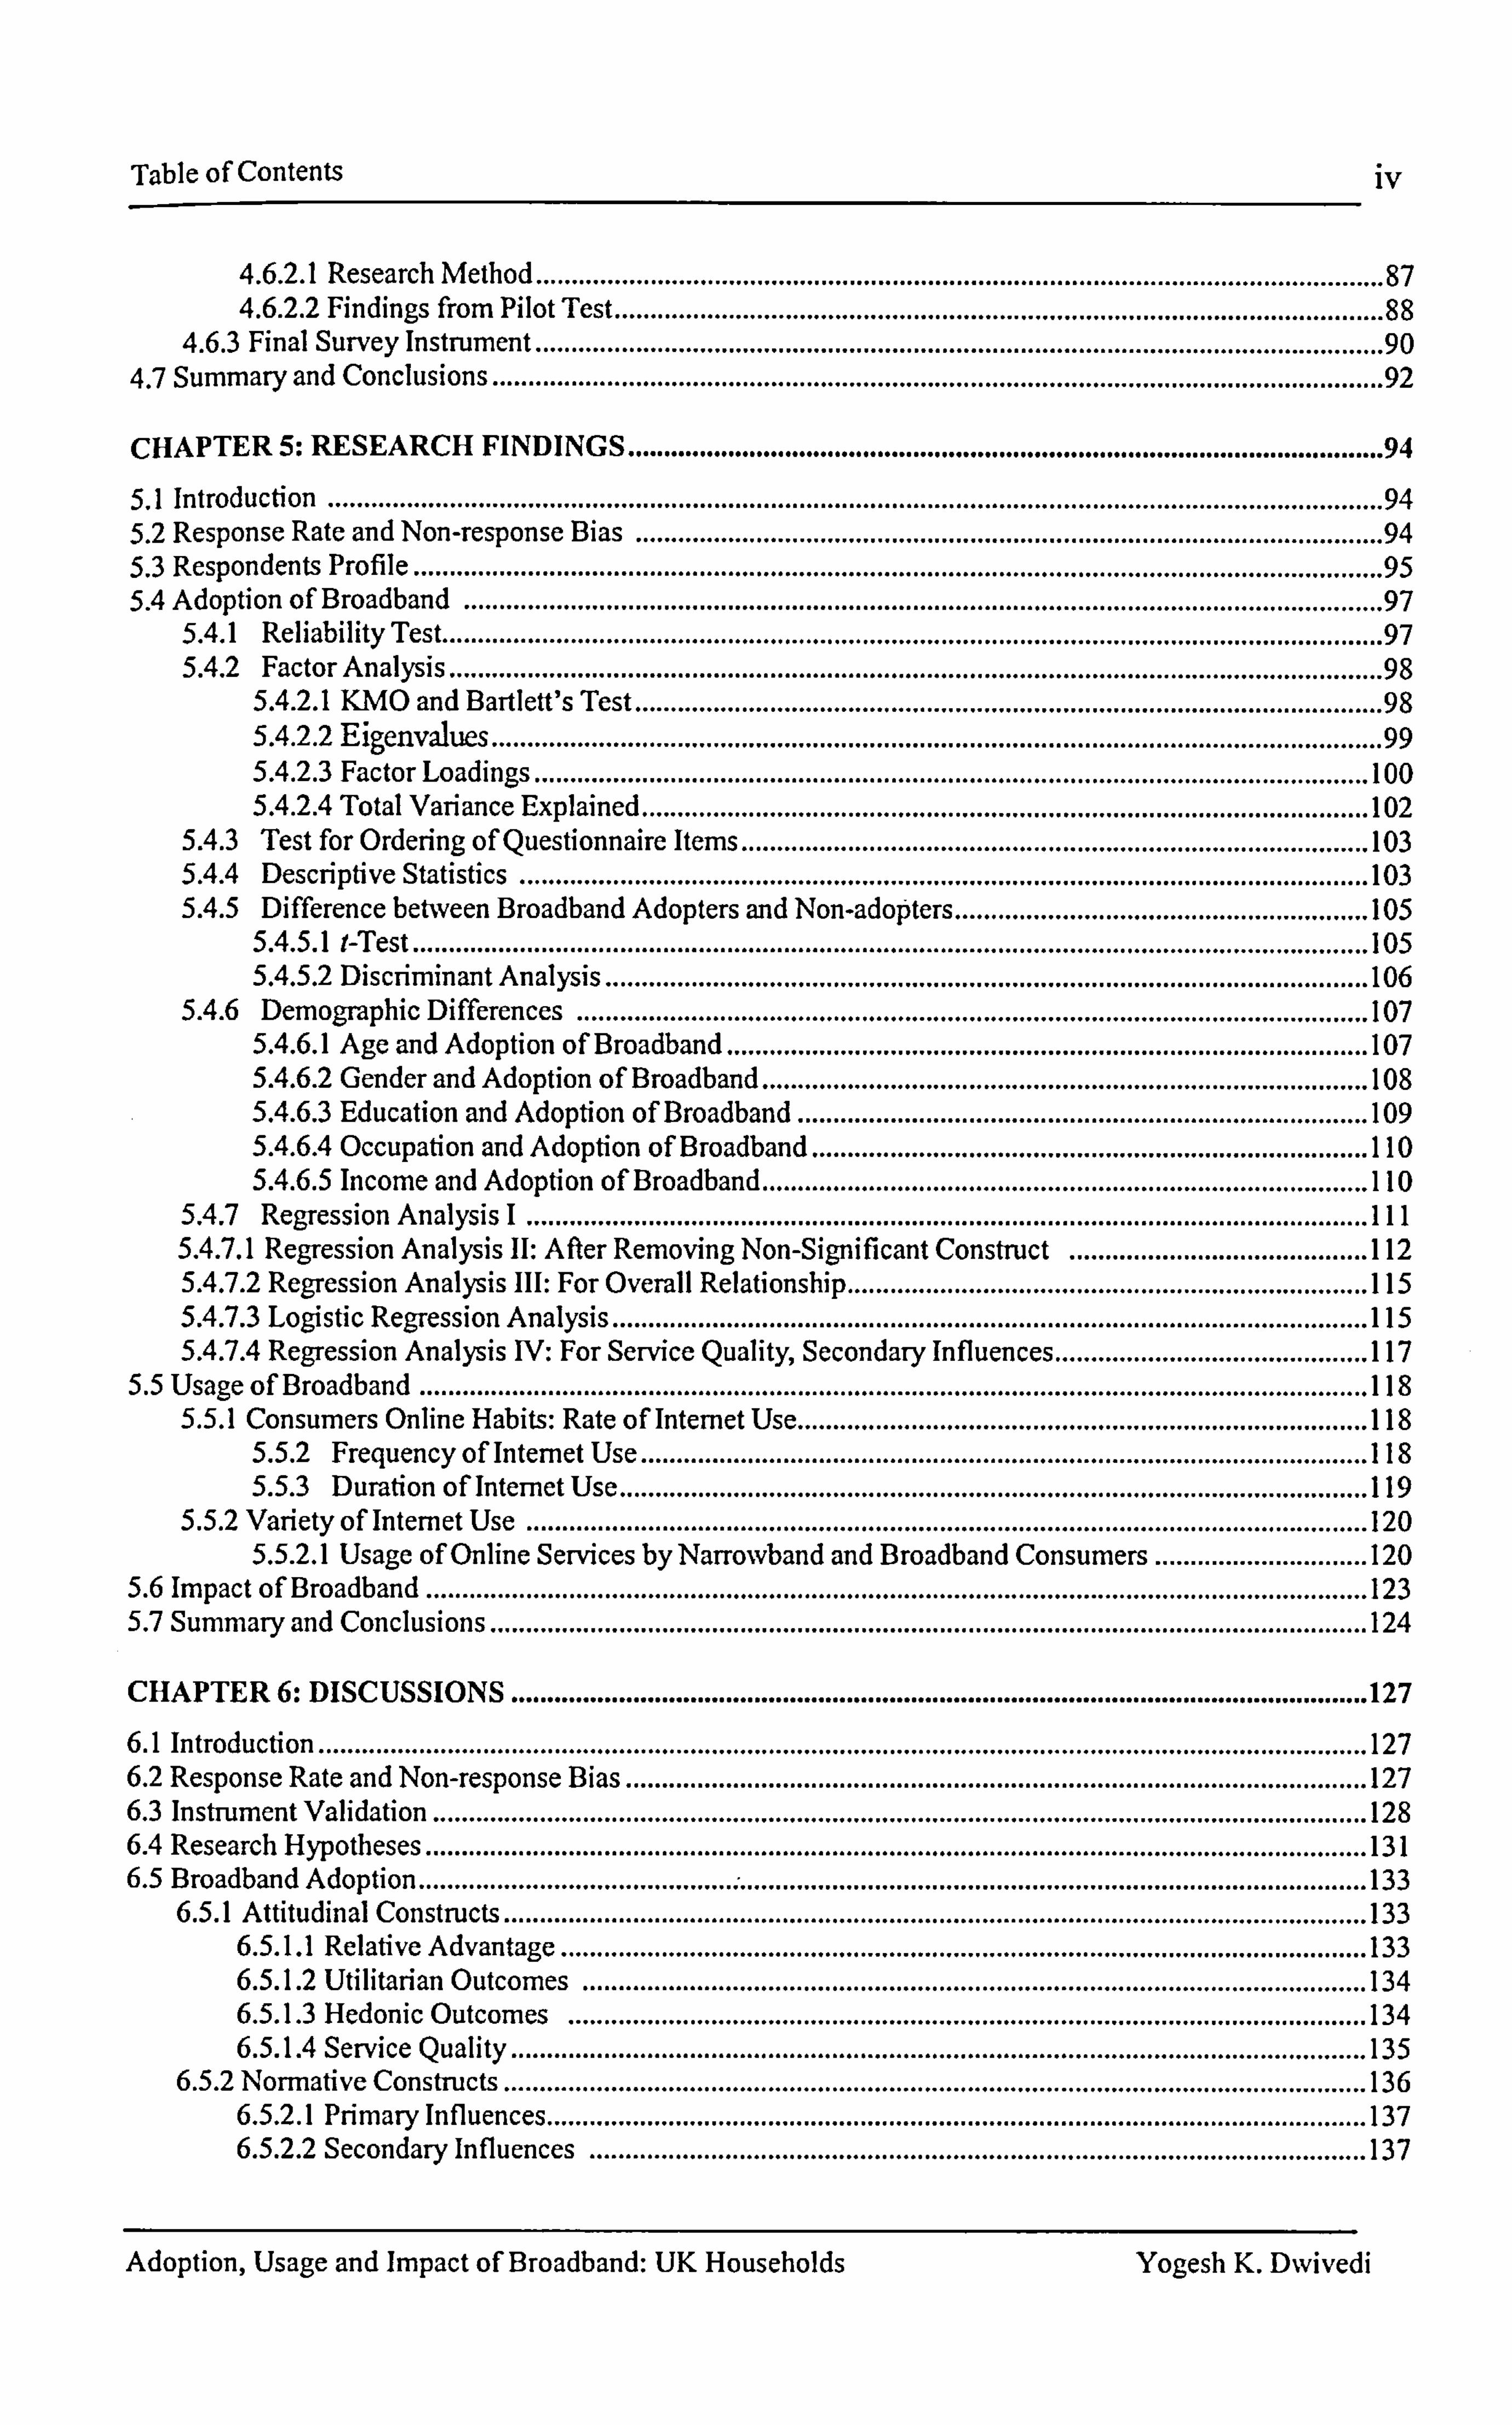
Table of Contents iv
4.6.2.1 Research Method ....................................................................................................................... 87 4.6.2.2 Findings from Pilot Test ............................................................................................................ 88
4.6.3 Final Survey Instrument ....................................................................................................................... 90
4.7 Summary and Conclusions ............................................................................................................................. 92
CHAPTER 5: RESEARCH FINDINGS .......................................................................................................... 94
5.1 Introduction .................................................................................................................................................... 94 5.2 Response Rate and Non-response Bias
....................................................................................................... .. 94 5.3 Respondents Profile ...................................................................................................................................... .. 95 5.4 Adoption of Broadband ............................................................................................................................... .. 97
5.4.1 ReliabilityTest .................................................................................................................................. .. 97 5.4.2 FactorAnalysis ................................................................................................................................. .. 98
5.4.2.1 KMO and Bartlett's Test ....................................................................................................... .. 98 5.4.2.2 Eigenvalues
........................................................................................................................... .. 99 5.4.2.3 Factor Loadings ..................................................................................................................... 100 5.4.2.4 Total Variance Explained ...................................................................................................... 102
5.4.3 Test for Ordering of Questionnaire Items ........................................................................................ 103 5.4.4 Descriptive Statistics ....................................................................................................................... 103 5.4.5 Difference between Broadband Adopters and Non-adopters .......................................................... 105
5.4.5.1 I-Test ...................................................................................................................................... 105 5.4.5.2 Discriminant Analysis ........................................................................................................... 106
5.4.6 Demographic Differences ............................................................................................................... 107 5.4.6.1 Age and Adoption of Broadband .......................................................................................... 107 5.4.6.2 Gender and Adoption of Broadband ..................................................................................... 108 5.4.6.3 Education and Adoption of Broadband ................................................................................ 109 5.4.6.4 Occupation and Adoption of Broadband .............................................................................. 110 5.4.6.5 Income and Adoption of Broadband ..................................................................................... 110
5.4.7 Regression Analysis I ...................................................................................................................... III 5.4.7.1 Regression Analysis 11: After Removing Non-Significant Construct .......................................... 112 5.4.7.2 Regression Analysis III: For Overall Relationship ......................................................................... 115 5.4.7.3 Logistic Regression Analysis .......................................................................................................... 115 5.4.7.4 Regression Analysis IV: For Service Quality, Secondary Influences ............................................ 117
5.5 Usage of Broadband ..................................................................................................................................... 118 5.5.1 Consumers Online Habits: Rate of Internet Use ................................................................................ 118
5.5.2 Frequency of Internet Use ...................................................................................................... 118 5.5.3 Duration of Internet Use ......................................................................................................... 119
5.5.2 Variety of Internet Use ...................................................................................................................... 120 5.5.2.1 Usage of Online Services by Narrowband and Broadband Consumers .............................. 120
5.6 Impact of Broadband .................................................................................................................................... 123 5.7 Summary and Conclusions ........................................................................................................................... 124
CHAPTER 6: DISCUSSIONS ........................................................................................................................ 127
6.1 Introduction ................................................................................................................................................... 127 6.2 Response Rate and Non-response Bias ........................................................................................................ 127 6.3 Instrument Validation ................................................................................................................................... 128 6.4 Research Hypotheses .................................................................................................................................... 131 6.5 Broadband Adoption ...................................................................................................................................... 133
6.5.1 Attitudinal Constructs ......................................................................................................................... 133 6.5.1.1 Relative Advantage ................................................................................................................. 133 6.5.1.2 Utilitarian Outcomes .............................................................................................................. 134 6.5.1.3 Hedonic Outcomes ................................................................................................................ 134 6.5.1.4 Service Quality ........................................................................................................................ 135
6.5.2 Normative Constructs ......................................................................................................................... 136
6.5.2.1 Primary Influences ................................................................................................................... 137
6.5.2.2 Secondary Influences ............................................................................................................. 137
Adoption, Usage and Impact of Broadband: UK Households Yogesh K. Dwivedi
Table of Contents v
6.5.3 Control Constructs .............................................................................................................................. 138 6.5.3.1 Facilitating Conditions Resources .......................................................................................... 138 6.5.3.2 Self-efficacy
............................................................................................................................. 139 6.5.3.3 Knowledge ............................................................................................................................... 140
6.5.4 Research Model of Broadband Adoption (MBA) .............................................................................. 140
6.5.5 Demographics and Adoption of Broadband ....................................................................................... 143 6.6 Usage and Impact of Broadband
.................................................................................................................. 146 6.6.1 Usage of Broadband
............................................................................................................................. 146 6,6.2 Impact of Broadband
........................................................................................................................... 148 6.7 Summary and Conclusions
........................................................................................................................... 151
CHAPTER 7: CONCLUSIONS AND FUTURE RESEARCH DIRECTIONS ....................................... 153
7.1 Introduction ................................................................................................................................................... 153 7.2 Research Overview ....................................................................................................................................... 153 7.3 Main Conclusions
......................................................................................................................................... 158 7.4 Research Offerings and Implications
........................................................................................................... 159 7.4.1 Offerings to Theory .............................................................................................................................. 160 7.4.2 Offerings to Industry and Policy .......................................................................................................... 163
7.5 Research Limitations ..................................................................................................................................... 166
7.6 Future Research Directions ........................................................................................................................... 167
7.7 Summary ...................................................................................................................................................... 169
REFERENCES .................................................................................................................................................. 170
APPENDICES ................................................................................................................................................... 187
Appendix 2.1 Summarising the Definitions for Each Constructs included in the Proposed Model ................. 187 Appendix 3.1 IS Research Approaches .............................................................................................................. 188 Appendix 3.2 Description of IS Research Approaches ...................................................................................... 189 Appendix 3.3 Research Approaches Employed in Technology Adoption Research ........................................ 190 Appendix 3.4 Research Approaches Employed in Technology Adoption Research in Household Context... 191 Appendix 4.1 Exploratory Survey Questionnaire .............................................................................................. 192 Appendix 4.2 Summary of Statistics Obtained from Exploratory Survey ........................................................ 196 Appendix 4.3 Content Validity Questionnaire ................................................................................................... 197 Appendix 4.4 Estimation of Content Validity Ratio for Adoption Items .......................................................... 207 Appendix 4.5 Estimation of Content Validity Ratio for Usage Items ............................................................... 208 Appendix 4.6 Pre-test Questionnaire: Part I ....................................................................................................... 209 Appendix 4.7 Pre-test Questionnaire: Part 11 ...................................................................................................... 216 Appendix 4.8 Pilot Questionnaire ....................................................................................................................... 221 Appendix 4.9 Final Survey Questionnaire ........................................................................................................ 228
Adoption, Usage and Impact of Broadband: UK Households Yogesh K. Dwivedi
List of Tables
LIST OF TABLES
vi
Table 2.1 Model of Adoption of Technology in Household (MATH) ............................................................... 21 Table 2.2 Summary of Research Hypotheses ....................................................................................................... 29 Table 3.1 Sampling Error ..................................................................................................................................... 61 Table 4.1 List of Constructs Included in the Various Stages of Instrument Development ................................. 73 Table 4.2 Summary of Content Validity Ratio (CVR) ....................................................................................... 83 Table 4.3 Summary of Constructs, Total Items, Significant Items, Average CVR and Average Mean .......... 84 Table 4.4 Sunu-nary of Statistics Obtained from Pilot Test ................................................................................ 89 Table 4.5 Respondents Perception About Questionnaire .................................................................................... 90 Table 4.6 List of Constructs and Items to Examine Broadband Adoption ......................................................... 91 Table 4.7 List of Online Activities for Examining Broadband Usage ............................................................... .. 92 Table 4.8 List of Daily Life Activities for Examining Broadband Impact ........................................................ .. 92 Table 5.1 t-Test to Examine Non-response Bias ............................................................................................... .. 95 Table 5.2 Profile of Survey Participants ............................................................................................................. .. 96 Table 5.3 Reliability of Measurement ............................................................................................................... .. 98 Table 5.4 KMO and Bartlett's Test ................................................................................................................... .. 99 Table 5.5 Total Variance Explained ................................................................................................................... .. 99 Table 5.6 Rotated Component Matrix .............................................................................................................. 101 Table 5.7 t-Test to Compare Means of Aggregated Measures to Examine Method Bias ................................. 103 Table 5.8 Descriptive Statistics .................................................... ..................................................................... 104
. Table 5.9 Summary of Descriptive Statistics .................................................................................................... 105 Table 5.10 t-Test to Examine Difference between Narrowband and Broadband Consumers ......................... 105 Table 5.11 Discriminant Analysis: Test of Equality of Group Means ............................................................ 106 Table 5.12 Discriminant Analysis: Eigenvalues .............................................................................................. 107 Table 5.13 Discriminant Analysis: Wilk's Lambda ......................................................................................... 107 Table 5.14 Discriminant Analysis: Structure Matrix ....................................................................................... 107 Table 5.15 Discriminant Analysis: Classification Results ............................................................................... 107 Table 5.16a Age and Broadband Adoption ........................................................................................................ 108 Table 5.16b Age and Broadband Adoption: Spearman's Correlations ............................................................. 108 Table 5.17 Gender and Broadband Adoption ..................................................................................................... 109 Table 5.18a Education and Broadband Adoption .............................................................................................. 109 Table 5.18b Education and Broadband Adoption: Spearman's Correlations .................................................... 110 Table 5.19 Occupation and Broadband Adoption .............................................................................................. 110 Table 5.20a Income and Broadband Adoption ................................................................................................... III Table 5.20b Income and Broadband Adoption: Spearman's Correlations ........................................................ III Table 5.21 Regression Analysis 1: Model Summary ........................................................................................ 112 Table 5.22 Regression Analysis 1: ANOVA .................................................................................................... 112 Table 5.23 Regression Analysis 1: Coefficients ............................................................................................... 112 Table 5.24 Regression Analysis II: Model Summary .................................................................................... 113 Table 5.25 Regression Analysis 11: ANOVA ................................................................................................... 113 Table 5.26 Regression Analysis II: Coefficients .............................................................................................. 113 Table 5.27 Regression Analysis III: Model Summary ...................................................................................... 115 Table 5.28 Regression Analysis III: ANOVA .................................................................................................... 115 Table 5.29 Regression Analysis III: Coefficients ............................................................................................. 115 Table 5.30 Logistic Regression Analysis: Onmibus Test of Model Coefficients ........................................... 116 Table 5.31 Logistic Regression Analysis: Model Summary ............................................................................. 116 Table 5.32 Logistic Regression Analysis: Classification Table ........................................................................ 116 Table 5.33 Logistic Regression Analysis: Variables in the Equation .............................................................. 117 Table 5.34 Regression Analysis IV: Model Summary ...................................................................................... 117 Table 5.35 Regression Analysis IV: ANOVA ................................................................................................... 117 Table 5.36 Regression Analysis IV: Coefficients ............................................................................................ 117 Table 5.37a Frequency of Internet Access ....................................................................................................... 118 Table 5.37b Frequency of Internet Access: Spearman's Correlations ............................................................. 119 Table 5.38a Duration of Internet Access on a Daily Basis ............................................................................... 119 Table 5.38b Duration of Internet Access on a Daily Basis: Spearman's Correlations .................................... 120 Table 5.39a Variety of Internet Use ................................................................................................................... 120 Table 5.39b Variety of Internet Use: Spearman's Correlations ....................................................................... 120 Table 5.40 Access of Online Services by Broadband and Narrowband Consumers ........................................ 122 Table 5.41 The Impact of Broadband on Various Daily Life Activities ........................................................... 124
Adoption, Usage and Impact of Broadband: UK Households Yogesh K. Dwivedi
List of Tables vii
Table 6.1 Summary of Instrument Validation Process ...................................................................................... 130 Table 6.2 Summary of Research Hypotheses .................................................................................................... 132 Table 6.3 Comparison of Intention and Behaviour in Terms of Adjusted R2 .................................................... 141
Adoption, Usage and Impact of Broadband: UK Households Yogesh K. D%vivedi
List of Figures
LIST OF FIGURES
viii
Figure 1.1 Percentage Growth in Broadband Subscriber Numbers ...................................................................... 4 Figure 1.2 Outline of Dissertation ..................................................................................................................... .. 13 Figure 2.1 Theory of Planned Behaviour (TPB) ................................................................................................ .. 18 Figure 2.2 Decomposed Theory of Planned Behaviour (DTPB) ....................................................................... .. 19 Figure 2.3 Theory of Reasoned Action (TRA) .................................................................................................. .. 20 Figure 2.4 Technology Acceptance Model (TAM) ........................................................................................... .. 20 Figure 2.5 Research Model Utilised to Study Broadband Adoption ................................................................. .. 22 Figure 2.6 Proposed Conceptual Model of Broadband Adoption (MBA) ...................................................... .. 27 Figure 2.7 Effect of Demographic Variables on Broadband Adoption ........................................................... .. 28 Figure 2.8 Constructs to Examine Usage of Broadband ................................................................................... .. 28 Figure 3.1 Epistemological Assumptions for Qualitative and Quantitative Research .................................... .. 47 Figure 3.2 Research Strategy .............................................................................................................................. .. 54 Figure 6.1 Development and Validation Process of Research Instrument ....................................................... 129 Figure 6.2a Model of Broadband Adoption (MBA) .......................................................................................... 142 Figure 6.2b MBA Illustrating Overall Impact of Attitudinal, Normative and Control Constructs ................... 143 Figure 6.3 Effects of Socio-economic Variables on Broadband Adoption ..................................................... 145 Figure 6.4 Usage of Internet by Broadband Adopters and Non-adopters ......................................................... 147 Figure 6.5 Broadband Impact in the Household ................................................................................................. 150
Adoption, Usage and Impact of Broadband: UK Households Yogesh K. Dwivedi

Acknowledgement
ACKNOWLEDGEMENTS
Guru Brahma Gurur Vishnu, Gunt Devo Maheshivaraha Gunt Saakshat Para Brahma, Tasmai Sree Gurave Namaha
I offer my salutations to such a Guru who creates and sustains knowledge and destroys the weeds of ignorance. ]
ix
It is by the grace of God and the Nvill of the Almighty that I take this opportunity to
convey my regards and thanks to those Nvho have helped and supported me at different stages in
completion of my dissertation.
I would like to thank my supervisor Dr Jyoti Choudrie for her able guidance, constant
encouragement and constructive criticism during the investigation and preparation of this
manuscript and above all her friendly treatment. I would also like to thank my second
supervisors Prof. Guy Fitzgerald and Prof Ray Paul for their positive criticism and suggestions during the different stages of investigation.
I take this opportunity to acknowledge the help and support of all academic staff
members whose contributions have given me an insight into this emerging field of study.
I also extend my thanks to Ms Julie Whittaker, Ms Shirley Hatch and Miss Jenny
Barker for providing administrative support during the course of this study.
I am highly grateful to all those Nvho spent their valuable time completing the
questionnaire and provided their precious comments.
I would like to thank ftiends and colleagues from Pink Palace and from the Brunel
Indian Society especially Aditi and Sneha. I also heartedly acknowledge the continuous inspiration and encouragement rendered to me by Ravi, Vandana, Rajeev, Manqj and Dipti.
Last but not least, I bestow my unbounded gratitude and deepest sense of respect to
my parents, brothers, sisters and all other relatives whose blessing, concerted efforts,
constant encouragement and, %vholehearted co-operation enabled me to reach this milestone.
Adoption, Usage and Impact of Broadband: UK Households Yogesh K. D%vivedi
List of Abbreviations
List of Abbreviations
ADSL Asymmetric Digital Subscriber Line
ANOVA Analysis of Variance
B-2-C E-Commerce Business-2-Consumer Electronic Commerce
BAG Broadband Advisory Group
BBC British Broadcasting Corporation
BI Bebavioural Intentions
BISP Bebavioural Intentions to Change Service Providers
BSG Broadband Stakeholder Group
BT British Telecommunication
BAB Broadband Adoption Behaviour
C-2-C E-Commerce Consumer-2-Consumer Electronic Commerce
CVR Content Validity Ratio
DI Diffusion of Innovations
DSL Digital Subscriber Lines
DTI Department of Trade and Industry
DTPB Decomposed Theory of Planned Behavior
E-government Electronic Government
FCR Facilitating Conditions Resources
GCSE General Certificate of Secondary Education
GNVQ General National Vocational Qualification
HO Hedonic Outcomes
ICTs Information and Communications Technologies
is Information Systems
IT Information Technology
ISPS Internet Service Providers
ITU International Telecommunication Union
KMO Kaiser-Meyer-Olkin
MATH Model of Adoption of Technology in Households
MBA Model of Broadband Adoption
MSA Measure of Sampling Adequacy
OECD Organization for Economic Co-operation and Development
OfCom Office of Communications
Oftel Office of Telecommunications
Non-QPR Non-quantitative positivist research
x
Adoption, Usage and Impact of Broadband: UK Households Yogesh K. Divivedi
List of Abbreviations xi
PBC Perceived Behavioural Control
PC Personal Computer
PCA Principal Component Analysis
PI Primary Influence
QPR Quantitative Positivist Research
RA Relative Advantage
SD Standard Deviation
SE Self-efficacy
SI Secondary Influence
SQ Service Quality
SMEs Small and Medium Enterprises
TAM Technology Acceptance Model
TP13 Theory of Planned Behavior
TRA Theory of Reasoned Action
TV Television
UD Use Diffusion
UK The United Kingdom
U0 Utilitarian Outcomes
UTAUT Unified Theory of Acceptance and Use of Technology
USA The United States of America
VIF Variance Inflation Factor
volp Voice Over Internet Protocol
Wi-Fi Networks Wireless Fixed Networks
X2 test Chi-Square test
Adoption, Usage and Impact of Broadband: UK Households Yogesh K. Dwivedi
Declaration xii
DECLARATION
Some of the material contained in this dissertation has been presented in the following publications. These include various aspects of the theoretical and practical findings that are described in this dissertation.
Refereed Journal Papers: Published
Choudrie, J. and Dwivedi, Y. K. (2005). The demographics of broadband residential consumers of a British local community: The London Borough of Hillingdon. Journalo CoitiputerltiforiiiatioiiSysteitis, 45(4), 93-101. ýf
Choudrie, J. and Dwivedi, Y. K. (2005). Investigating the research approaches for examining the technology adoption in the household. Jounial ofResearch Practice, 1 (1).
Choudrie, J. and Dwivedi, Y. K. (2004). Towards a conceptual model of broadband diffusion. Journal of Coniputing andInfonization. Technology, 12 (4), 323-338.
Refereed Journal Papers: Accepted/Forthcoming
Choudrie, J. and Dwivedi, Y. K. (2006). Investigating factors influencing adoption of broadband in the household. Forthcoming in the Jounial of Computer Infonnation Systems (Sunimer 2006 Issue).
Choudrie, J. and Dwivedi, Y. K. (2005). Broadband diffusion: usage and impact on the consumer-user behaviour. Forthcoming in the Journal ofIntelligent Systems.
Refereed Journal Papers: Under Review
Choudrie J. and Dwivedi Y. K. (2005). Examining the socio-economic detenninants of adoption of an e-government initiative 'Government Gateway'. Under review for publication in the Inforination Systenis Frontiers.
Choudrie, J. and Dwivedi, Y. K. (2005). Towards content validity and pre-test of the survey instrument to examine broadband diffusion in the UK household. Under review for publication in the Journal ofEnterprise Information Managenzent.
Refereed Conference Papers: Published
Choudrie, J. and Dwivedi, Y. K. (2005). Investigating Broadband Diffusion in the Household: Towards Content Validity and Pre-Test of the Survey Instrument, Proceeding of the 13"4 European Conference on Information Systenis, Regensberg, Germany, 26h - 28'h May 2005.
Choudrie, J. and Dwivedi, Y. K. (2005). A survey of citizens' awareness and adoption of e- Government initiatives, the 'Government Gateway': A United Kingdom perspective. Proceedings of the E-Gov. 2005 workshop, DISC, Brunel University, London, UK.
Adoption, Usage and Impact of Broadband: UK Households Yogesh K. D%vivedi
Declaration xiii
Choudrie, J. and Dwivedi, Y. K. (2004). Analysing the Factors of Broadband Adoption in the Household. Proceedings of the 12'ý European Conference oil Inforillatioll Systeitis (ECIS-2004), Turku Finland, June 14-16,2004.
Choudrie, J. and Dwivedi, Y. K. (2004). Broadband adoption: A UK residential consumers perspective. Proceedings of the 4inerican Conference oil Inforination Systenis (AMCIS-2004), pp 2622-2627, New York City, USA, August 5-8,2004.
Choudrie, J. and Dwivedi, Y. K. (2004). Investigating the socio-economic characteristics of residential consumers of broadband in the UK. Proceedings of the Anierican Conference ofInfonization Systeins, pp 1558- 1567, New York City, USA, August 5-8,2004.
Choudrie, J. and Dwivedi, Y. K. (2004). Investigating the research approaches for examining the technology adoption in the household. Proceeding of the 3rd European Conference oil Research Methodology for Business and Manageinent Studies (ECRM-2004), Reading UK, April 29-30,2004.
Choudrie, J. and Dwivedi, Y. K. (2004). Developing a model of broadband adoption in the household. Proceeding of the ETHICOMP -2004 conference, Syros, Greece, April 14-16,2004.
Refereed Conference Papers: Accepted/Forthcoming
Choudrie, J. and Dwivedi, Y. K. (2005). Examining the Socio-economic determinants of broadband Adopters and Non-adopters in the United Kingdom. Forthcoming in the Proceedings of the HICSS-2006.
PhD Consortium Paper
Dwivedi, Y. K. (2003). Evaluating the impact of broadband on various Internet users. Proceedings of 12'h PhD Consortium of United Kingdom Academyfor Infonnation Systems (UKAIS), page 19-27, April 8"' 4h, The University of Warwick, Wanvick, UK
Adoption, Usage and Impact of Broadband: UK Households Yogesh K. DNvivedi

Chapter 1. Introduction
1.1 INTRODUCTION
I
This chapter provides an introduction to the proposed research. The following
section provides a definition of broadband, outlines broadband's potential and then provides
a discussion of the research problem. Section 1.3 will provide a discussion on the state of broadband adoption, usage and impact. Section 1.4 will define the research aim and
objectives. A discussion of the research approach that will be used to achieve the proposed
aims and objectives are offered in Section 1.5. The research contributions of this study are then offered in Section 1.6. To familiarise the readers with the remaining dissertation, an
overview is offered in Section 1.7. Finally, Section 1.8 provides a summary of this chapter.
1.2 RESEARCH PROBLEM
1.2.1 Deflning Broadband
Before proceeding further, a term frequented within this dissertation is 'broadband'
and a short explanation of it is warranted. The umbrella term of 'broadband technology'
embraces a variety of high-speed access technologies, including ADSL (Asyrrimetric Digital
Subscriber Line), cable modems, satellite, and Wi-Fi (Wireless Fixed) Networks (Sawyer et
al, 2003). The term 'broadband' has no established definition. It varies amongst countries (Firth and Kelly, 2001) and evolves over time, as the underlying transmission and routing technologies continuously advance; yesterday's broadband is today's 'narrowband' (Sawyer
et al, 2003).
Given the variations in defining 'broadband', for the purpose of this research we follow the technology neutral definition suggested by the Broadband Stakeholder Group
(BSG) that defines broadband as "always on access, at work, at honze or on the 111ove
provided by a range offixed line, wireless and satellite technologies to progressively higher
bandividths capable of supporting genuinely neiv and innovative interactive content,
applications and services and the delivery of enhanced public services' (BSG, 200 1). This
definition was chosen, as it is technology neutral. That is, it has less to do with the technical
speed and instead focuses on functionality, which is more to do with what a user can do with broadband (Sawyer et al, 2003). According to Ofcom (2005), the term 'broadband' refers to higher bandwidths and always on services offering data rates of 128 kbps and above. Dial-up
or narrowband refers to internet access that offers speed equal to or below 128 kbps (Ofcom,
2005).
Adoption, Usage and Impact of Broadband: UK Households Yogesh K. Dwivedi
Chapter I. Introduction
1.2.2 Ontlining the Potential of Broadband
2
Since the emergence of the Internet, broadband is being considered as the most significant evolutionary step. It is considered to be a technology that Nvill offer end users with fast and always-on access to new services, applications and content with real lifestyle
and productivity benefits (Sawyer et al, 2003). International organisations such as the International Telecommunication Union (ITU) and the Organisation for Economic Co- operation and Development (OECD) foresighted broadband to be a vital nleans of enhancing competitiveness in an economy and also of sustaining economic growth (BSG, 2004; ITU, 2001; OECD, 2001; Oh et al, 2003). According to a report from the United Kingdom Broadband Stakeholder Group, broadband provides a number of ways of enhancing a national economy and quality of a citizen's life, as it stated that:
"... Full exploitation of broadband-enabled ICT, content, aPPlicatiolis and services can help the UK to become a truly competitive knowledge-based ecoilomy and can be leveraged to help the UK's citizens become healthier, better educated and Inore engaged in their communities and society. ... Societies that adopt, adapt, and absorb the benefits ofbroadband enabled ICT, services and applicatiolls qUiCk1Y and deeply will achieve significant benefits in terms of productivity' ilillova"O", grovth and quality of life as ivell as significant competitive advalitage over societies that don't ... (BSG, 2004)".
The focus group BSG had the forethought that broadband Will benefit a national economy in the following four ways: by delivering economic value, delivering public value, delivering efficiencies in the public sector and improving people's lives (BSG, 2004). Examples of delivering economic values include the potential of improving the productivity and competitiveness of SMEs by employing broadband as a communication channel for capturing emerging business opportunities (BSG, 2004). Broadband also 'Dffers potential benefits to larger companies as it provides an efficient supply chain and economical ways to do business with customers, such as online retailing (BSG, 2004)- Furthermore, since broadband facilitates horneworking it can also save costs in office space for both large and small organisations (BSG, 2004).
Similar to commercial organisations, broadband also offers the potential to
governments in creating electronic services and delivering them to citizens in a cost effective
and transparent manner. By exploiting the potential of broadband, direct benefits can be
obtained that include improvements in education delivery, empowering patients, effective
utilisation of patient records and employing cost effective broadband for enabling tele-
monitoring health applications in order to reduce the number of patients in hospitals (BsG, 2004). Such electronic services in the public sector will specifically help to reduce the cost of delivery, increase the quality of healthcare, thereby increasing the citizens' trust and confidence in public services and generally in the government (BSG, 2004). be Gershon
Adoption, Usage and Impact of Broadband: UK Households ---------- - Yogesh K. Dxvivedi
Chapter 1. Introduction 3
spending review 2004 suggested a direct link between ICT investment made by the
government and the ability of ICTs in delivering efficient savings in the government (BSG,
2004).
Broadband can also improve citizens' lives in several ways. It can help equip
children with ICTs skills for employment purposes and improve the way they obtain
education. Similarly, since broadband facilitates working at home, it can help people to
obtain a better work/life balance that is characterised by more empowennent, more
productivity and less stress. Broadband also offers direct benefits to elderly people, as it can be utilised to provide personalised care at home; hence, removing the need to live in
hospitals or care homes (BSG, 2004).
The aforementioned discussion on the potential of broadband clearly suggests that
accessibility, adoption and use of broadband are likely to transform and affect almost every
aspect of everyday life (Oh et al, 2003). Therefore, in order to harvest its full potential, it is
appropriate to understand the deployment and adoption of such emerging technologies.
1.2.3 Outlining Research Problem
Although broadband offers several advantages to the public and private sectors in
terms of cost savings, efficiency and competitiveness, the shift to broadband requires
massive investments in terms of new networks and infrastructures, along with the
development of new content, services, applications and business models. As discussed above (Section 1.2.2), since broadband diffusion is regarded as a measure of international
competitiveness (BSG, 2004; Langdale, 1997; Oh et al, 2003; Sawyer et al, 2003), many
governments around the world have set ambitious targets for the deployment of broadband
services (BAG, 2003; National Broadband Task Force, 2001; Office of Technology Policy,
2002; Office of the e-Envoy, 2001). This is because the high penetration rate of broadband is
perceived to have a positive impact on the growth and development of the Internet,
electronic commerce and the infori-nation economy (Lee et al, 2003; Sawyer et al, 2003).
The United Kingdom (UK) government believes that the rapid rollout and adoption of broadband across the nation is important to both its social and economic objectives (Oftel,
2003); hence it has made a commitment to making the UK the most competitive and
extensive broadband market in the G7 (Office of the e-Envoy, 2001). Therefore,
governments of a number of countries including South Korea, Japan, Hong Kong, Sweden,
Canada and also the UK have made large investments for developing a broadband
infrastructure that will deliver high speed internet access to end users, including the
household consumers and SMEs (BSG, 2004; OECD, 2001; Oh el al, 2003; Sawyer et al, 2003).
Adoption, Usage and Impact of Broadband: UK Households Yogesh K. Dwivedi
Chapter 1. Introduction 4
Despite a large investment for developing the infrastructure, the majority of
countries have had slow adoption rates of broadband (OECD, 2001; Oftel, 2003). Although
the UK initiated an early rollout of infrastructure competition, the rate of broadband adoption has been relatively slow since the start (OECD, 2001). According to an Oftel (2003) report
until the year 2003 the growth rate of broadband was slower than other similar European and
North American countries, such as Sweden, France, Germany and USA (Oftel, 2003).
Furthermore, Oftel's (the UK's communication regulator until 2003) international
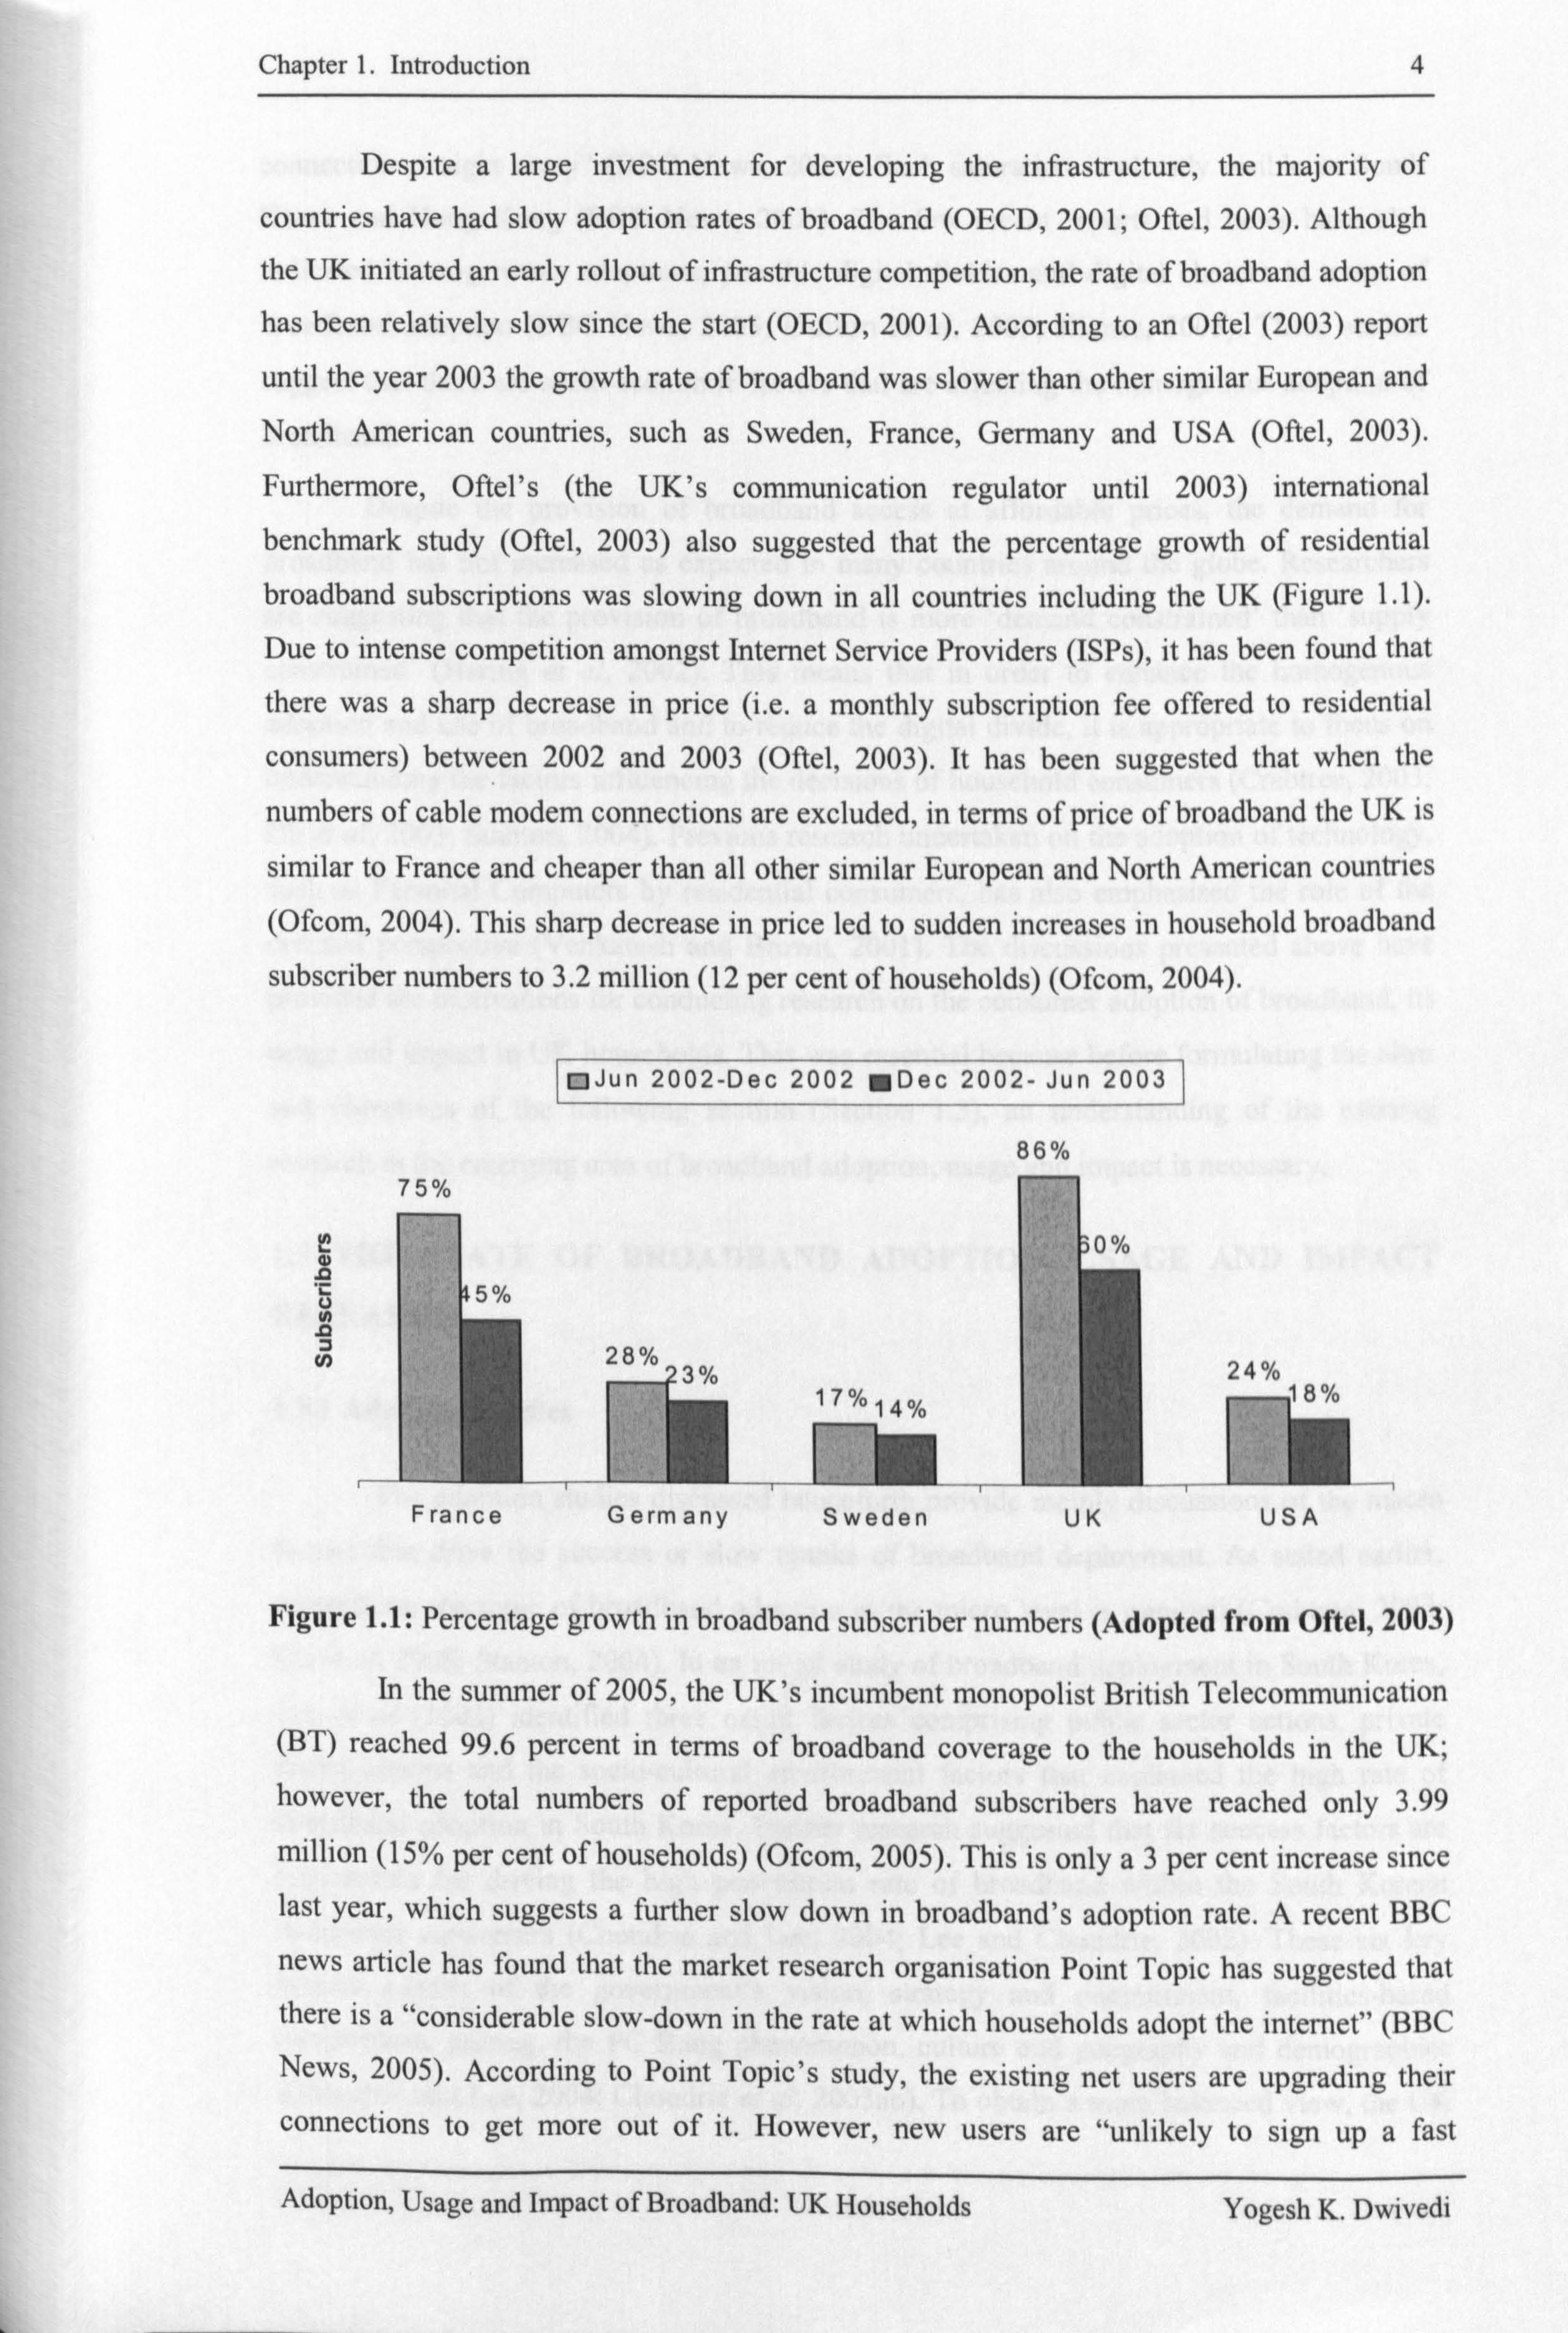
benchmark study (Oftel, 2003) also suggested that the percentage growth of residential broadband subscriptions was slowing down in all countries including the UK (Figure 1.1).
Due to intense competition amongst Internet Service Providers (ISPs), it has been found that
there was a sharp decrease in price (i. e. a monthly subscription fee offered to residential
consumers) between 2002 and 2003 (Oftel, 2003). It has been suggested that when the
numbers of cable modem connections are excluded, in terms of price of broadband the UK is
similar to France and cheaper than all other similar European and North American countries
(Ofcom, 2004). This sharp decrease in price led to sudden increases in household broadband
subscriber numbers to 3.2 million (12 per cent of households) (Ofcom, 2004).
mJun 2002-Dec 2002 MDec 2002- Jun 2003
86% 75%
12 (D
5 ly, 0 U)
U) 2 8%
T
14
France Ge rm any
24% 18%
USA
Figure 1.1: Percentage growth in broadband subscriber numbers (Adopted from Oftel, 2003)
In the summer of 2005, the UK's incumbent monopolist British Telecommunication (BT) reached 99.6 percent in terms of broadband coverage to the households in the UK; however, the total numbers of reported broadband subscribers have reached only 3.99
million (15% per cent of households) (Ofcom, 2005). This is only a3 per cent increase since last year, which suggests a further slow down in broadband's adoption rate. A recent BBC
news article has found that the market research organisation Point Topic has suggested that there is a "considerable slow-down in the rate at which households adopt the internet" (BBC News, 2005), According to Point Topic's study, the existing net users are upgrading their connections to get more out of it. However, new users are "unlikely to sign up a fast
Adoption, Usage and Impact of Broadband: UK Households Yogesh K. Dwivedi
Sweden UK
Chapter 1. Introduction
connection straight away" (BBC News, 2005). Such saturation is already visible in South
Korea and Hong Kong (BBC News, 2005). The few recent reports and news have also indicated heterogeneous adoptions, possible digital divides and digital choices in terms of broadband adoption (BBC News, 2005; Dutton et al, 2005; Kinnes, 2005). These studies
suggest that there are socio-economic factors that are affecting the homogenous adoption of broadband.
Despite the provision of broadband access at affordable prices, the demand for
broadband has not increased as expected in many countries around the globe. Researchers
are suggesting that the provision of broadband is more 'demand constrained' than 'supply
constrained' (Haring et al, 2002). This means that in order to enhance the homogenous
adoption and use of broadband and to reduce the digital divide, it is appropriate to focus on
understanding the factors influencing the decisions of household consumers (Crabtree, 2003;
Oh el al, 2003; Stanton, 2004). Previous research undertaken on the adoption of technology,
such as Personal Computers by residential consumers, has also emphasised the role of the
demand perspective (Venkatesh and Brown, 2001). The discussions presented above have
provided the motivations for conducting research on the consumer adoption of broadband, its
usage and impact in UK households. This was essential because before formulating the aims
and objectives of the following section (Section 1.3), an understanding of the existing
research in the emerging area of broadband adoption, usage and impact is necessary.
1.3 THE STATE OF BROADBAND ADOPTION, USAGE AND IMPACT
RESEARCH
1.3.1 Adoption Studies
The adoption studies discussed henceforth provide mainly discussions of the macro factors that drive the success or slow uptake of broadband deployment. As stated earlier,
research on the topic of broadband adoption at the micro level is minimal (Crabtree, 2003;
Oh et al, 2003; Stanton, 2004). In an initial study of broadband deployment in South Korea,
Lee el al (2003) identified three major factors comprising public sector actions, private
sector actions and the socio-cultural environment factors that explained the high rate of broadband adoption in South Korea. Further research suggested that six success factors are
responsible for driving the high penetration rate of broadband within the South Korean
residential consumers (Choudrie and Lee, 2004; Lee and Choudrie, 2002). These six key
factors consist of the government's vision, strategy and commitment, facilities-based
competition, pricing, the PC Bang phenomenon, culture and geography and demographics
(Choudrie and Lee, 2004; Choudrie et al, 2003ab). To obtain a more balanced view, the UK
Adoption, Usage and Impact of Broadband: UK Households Yogesh K. D%vivedi
Chapter 1. Introduction 6
perspective was also investigated. Dwivedi et al (2003) examined the ISPs views on factors
affecting broadband adoption in the UK. This exploratory study suggested that a high price, lack of content and awareness are the factors that are severely affecting the adoption of broadband amongst the residential consumers (Dwivedi et al, 2003).
However, now adoption studies on consumers have begun to emerge. Amongst the initial studies is one by Oh et al (2003). This study examined the individual level factors
affecting the adoption of broadband access in South Korea by combining factors taken from
Rogers' diffusion theory and the technology acceptance model (Oh et al, 2003). The findings
of this study suggest that congruent experiences and opportunities in adopting a new technology affect user attitudes through the three extended technology acceptance model
constructs; namely perceived usefulness, perceived ease of use and perceived resources (Oh
et al, 2003). Stanton (2004) has also analysed the secondary data of the USA consumers in
order to study the digital divide and suggested an urgent need to understand the demography
and other factors of broadband adopters and non-adopters in order to increase the growth rate
of broadband and also to bridge the digital divide (Stanton, 2004).
1.3.2 Usage and Impact Studies
Usage is the other topic of interest in the IS area and is pertinent to this research. Studies in this area have been in the form of user surveys that have examined broadband
users' behaviour in comparison to that of narrowband users (Anderson el al, 2002; Bouvard
and Kurtzman, 2001; Carriere et al, 2000; Dwivedi and Choudric, 2003ab; Horrigan el al, 2001). Results from these surveys suggest that internet users behave differently when they have broadband access (Carriere et al, 2000; Dwivedi and Choudrie, 2003a). Broadband
users use the online facilities on a longer basis, utilise more services or applications and
apply them more often (Carriere et al, 2000; Dwivedi and Choudrie, 2003a; Horrigan et al, 200 1). The majority of broadband users rate their online experience as compelling (Anderson
et al, 2002; Carriere et al, 2000; Dwivedi and Choudrie, 2003a; Horrigan et al, 2001). In
comparison to dial-up users, broadband users spend more total time on electronic media
applications such as online music (Bouvard and Kurtzman, 2001). Surveys conducted on broadband users also suggest that these users make more online purchases and procure more
varied categories of products in comparison to narrowband users (Carriere et al, 2000;
Dwivedi and Choudrie, 2003b). Although the aforementioned studies examined the usage of broadband, they lack theoretical underpinnings, as they are led by data and are exploratory in
nature (Oh et al, 2003). Understanding the impact of broadband usage on the consumers' daily life is still untouched by previous studies.
Adoption, Usage and Impact of Broadband: UK Households Yogesh K. D%vivedi
Chapter 1. Introduction 7
The aforementioned discussion on broadband adoption and usage suggests that there
were few efforts made to examine broadband diffusion from the household consumer
perspective. Furthermore, the aforementioned studies were not statistically tested to determine the differences between broadband consumers and narrowband consumers; hence,
these studies lack statistical conclusion validity in their findings (Straub et al, 2004). Another
observation from previous literature analysis suggests that existing studies examined
exploratory issues related to either the adoption or usage of broadband. None of them
provides a thorough understanding of all three components of broadband diffusion (i. e.
adoption, usage and impact) from the household consumer's perspective. Therefore, both
discussions on the aforementioned research problem (Section 1.2.3) and the lack of studies
on broadband adoption, usage and impact provide the motivation to under-take this study. Before outlining the aims and objectives in Section 1.4, the following subsection defines the
scope of the current study.
1.3.3 Scope and Definitions
Whilst studying the diffusion of broadband, there are many stakeholders to consider, including the government, ISPs, business consumers, public organisations and residential
consumers (Choudrie el al, 2003ab). The previous discussions clearly suggest broadband
adoption is demand constrained and existing studies have not yet addressed the issue of
consumer adoption, usage and the impact of broadband in UK households. The focus of this
study is, therefore, the UK household consumer of broadband. Hence the proposed
conceptual model (Chapter 2) will only consider factors and studies that are relevant to the household consumers. As mentioned above, a focus upon the UK household consumers is
considered to be imperative for this study, and the two main reasons for this are as follows.
First, as existing studies have mainly considered only the supply side stakeholders, there has
been little attention paid to the examination of consumers. Second, at this stage of broadband
implementation, the supply side factors are not considered to be problems; however, growth is constrained by the demand side as consumers are reluctant to subscribe to the technology in question.
Since the focus of this research is the consumers, at this point the differentiating
factor between the terms of consumers and users is provided. According to Rice (1997),
cconsumers' are those who pay for services and goods, whilst 'users' are individuals who are
affected by or who affect the products or services. In other words, users are those who use the products and services but do not pay for them (Rice, 1997). For example, a child can be
categorised as a user since he/she uses broadband for online gaming and to under-take
Adoption, Usage and Impact of Broadband: UK Households Yogesh K. D%vivedi
Chapter 1. Introduction 8
homework; however, the child does not pay for the service. Contrastingly, the parent can be
identified as a consumer as well as a user since he/she pays and uses the service.
For the purpose of this research, the term 'diffusion' is defined as "the process by
which an innovation is communicated through certain channels over time among the
members of a social system" (Rogers, 1995, pp. 5). The term 'innovation' refers to "an idea,
practice or object that is perceived as new by an individual or other unit of adoption" (Rogers, 1995, pp. 11). The meaning of 'newness of an idea' or 'innovation' is likely to
differ from consumer to consumer. If the idea seems new to an individual, it is an innovation
(Rogers, 1995). For example, broadband may not be an innovation for someone who has
already subscribed to it. However, if someone does not know about broadband or has not
subscribed to it then, for such a consumer, broadband would be considered as an innovation.
Since a large number of UK household consumers have not yet subscribed to broadband, for
the purpose of this research it is considered as an innovation. The study of diffusion involves
three components: the adoption of a new innovation, its usage and the subsequent impact of its usage (Rogers, 1995). Therefore, this study will examine the constructs relevant to
broadband adoption, usage and its impact on household consumers in the UK.
1.4 RESEARCH AIMS AND OBJECTIVES
Researchers in the Information Systems (IS) field have been studying the adoption
of Information and Communication Technologies (ICTs) at the organisational level
(Venkatesh and Brown, 2001). However, until recently IS research less frequently conducted
studies related to household adoption and the impacts of ICT. Due to the advent of the
Internet within daily life, ICTs have become an essential part of everyday life (Oh et al, 2003). This has led researchers to conduct studies within the household context or, in other
words, moving beyond the organisational level. Mingers and Stowell (1997) argued that
"Information Systems is much more than simply the development of computer-based business systems- electronic and information technology is now so fundamental within
society that IS as a discipline must concern itself with the general evolution of human
communication".
In line with this, one of the first studies within the IS field to examine the adoption
of Personal Computers (PC) in the household was recently undertaken (Venkatesh and
Brown, 2001). To continue the aforementioned research, but within a different context, Anckar (2003) offered an understanding of the drivers and inhibitors to e-commerce
adoption within Finnish households. Although such studies are becoming prevalent, they
have not yet been extended to examine the adoption of emerging ICTs such as broadband.
This is due to the technology in question, broadband, still taking off in the market. It can be
Adoption, Usage and Impact of Broadband: UK Households Yogesh K. Divivedi
Chapter 1. Introduction 9
found that the majority of the research associated with the topic of broadband is still
exploratory in nature, mainly focusing on the usage of the technology, and provides little
insight into consumer adoption or rejection determinants. Sawyer et al (2003) argued that
"The differential rates of use and growth, suggest that understanding broadband connectivity is a complex milieu". Hence, investigating adoption, usage and impact of broadband in the
context of household consumers is expected to make an incremental contribution to
information Systems research.
Bearing the aforementioned discussion in mind, the main aim of this study is to
investigate consunzer-levelfactors affecting the adoption of broadband in UK households.
This study also aims to understand the usage of broadband and its inipact upon household
consuniers in the UK. To achieve the overall aim, the following research objectives shall be undertaken:
1. To develop a conceptual model for examining consumer adoption, usage and impact
of broadband. This will be achieved by first reviewing the theories and models that
focus upon individual and/or consumer adoption, usage and impact of technology.
The next step is to select relevant constructs from appropriate theories and models
and fon-nulate a research hypothesis in order to examine broadband adoption, usage
and impact from the UK household consumer's perspective.
2. To operationalise the constructs included in the conceptual model by developing a
research instrument and demonstrating their reliability and validity. The research instrument will be developed and validated utilising content validity, reliability and
construct validity approaches.
3. To empirically validate and refine the proposed conceptual model in order to
examine broadband adoption, usage and impact in UK households. This will be
achieved by collecting and analysing data from the UK household consumers.
4. To provide implications for practice and policy that may encourage consumer
adoption and use of broadband. Furthermore, there will be a reflection of the impact
of consumer use of broadband.
Based on the aforementioned aims and objectives, Chapter 2 delineates the research
questions and hypotheses in order to understand the factors influencing consumer adoption
of broadband, its usage and impact in the UK households.
Adoption, Usage and Impact of Broadband: UK Households Yogesh K. DNvivedi
Chapter 1. Introduction
1.5 RESEARCH APPROACH
10
Since the research object in this study is the household consumer, it can be argued that the survey approach is the most suitable research approach for this study. This is due to issues such as convenience, cost, time and accessibility (Gilbert, 2001). The extent to which
a researcher can be a part of the context being studied is an important factor in determining
the research approach. Within the household context, it is difficult for a researcher to be a
part of the context; therefore the survey approach was more feasible than others such as case
study, ethnography and observations. Selection of the approach in this case is also influenced
by the type of theory and models employed to examine research related to broadband
adoption and diffusion (Chapter 2). A conceptual model proposed in Chapter 2 includes a
number of research hypotheses that need to be tested before concluding this study. This
requires collecting quantitative data and statistical analysis in order to test research hypotheses. Although there are a number of research approaches available within the
category of quantitative positivist research (Straub et al, 2005), a survey is the only
appropriate research approach that can be employed to conduct such research (i. e. that which
requires hypotheses testing and validation of conceptual model) in a social setting, in this instance the household.
Furthermore, the aim of this research is to examine broadband adoption and diffusion across the UK, which is a nationwide perspective. Hence, in order to get an overall
picture of the research issue, the collection of data from large numbers of participants from
across the UK is essential. It means that employing any other approach, such as ethnography, that utilises an interview or observation as data collection tools, demands huge amounts of financial resources, manpower and time (Comford and Smithson, 1996). As this is a student
research project, all three factors are limited, and this restricted the ability of the researcher in employing them for the investigation of this research. One of the planned contributions of this study is to provide insights to ISPs about the factors that are salient to consumer
adoption and non-adoption of broadband, and to establish relationships between factors such
as behavioural intention and actual adoption. In order to achieve this, it is vital to collect
quantitative data on a number of variables including demographics and to perform a
regression analysis that illustrates this relationship. This is another logical reason for
adopting the quantitative approach via a survey and collating data that may assist ISPs in
understanding the behaviour of household consumers and their demographic characteristics in order to encourage and promote broadband adoption.
The quantitative data was collected from the UK household consumers. In order to
collect empirical data from the target population, a self-administered questionnaire via mail
Adoption, Usage and Impact of Broadband: UK Households Yogesh K. D%vivcdi
Chapter 1. Introduction
was considered to be the most appropriate data collection method. The reasons for using the
self administered questionnaire are: it addresses the issue of reliability of information by
reducing and eliminating differences in the way in which the questions are asked (Comford
and Smithson, 1996); it involves relatively low costs of administration; it can be
accomplished with minimal facilities; it provides access to widely dispersed samples;
respondents have time to provide thoughtful answers; it assists with asking long questions or
complex response categories; it allows asking of similar repeated questions; and also the
respondents do not have to share answers with interviewers (Fowler, 2002).
The collated data was analysed using SPSS version 11.5. In order to collate the data,
it was appropriate to employ the UK-Info Disk VII database as a sampling frame, stratified
random sampling as a basis of sample selection, and a postal (i. e. mail) questionnaire as a data collection tool. Reasons for the aforementioned selection are provided in Chapter 3.
Issues relating to data analysis are also discussed in detail. in Chapter 3 which suggests that a
number of statistical techniques such as factor analysis, Mest, ANOVA, X2 test, discriminant
analysis, linear and logistics regression analysis are appropriate for utilisation in data
analyses.
1.6 RESEARCH CONTRIBUTIONS
This research is expected to contribute towards theory, practice and policy. The
theoretical contribution of this research is that it integrates the appropriate IS literature in
order to enhance knowledge of technology adoption from the consumer perspective. It also
contributes towards theory by empirically confirming the appropriateness of various
constructs and validating a conceptual model in the context of household consumers. This
study also contributes towards theory as it develops and validates a research instrument for
data collection. The instrument examines broadband adoption, usage and impact. According
to Straub et al (2004) it is essential to create and validate new measures or instruments in a
situation where theory is advanced; however, prior instrumentation is not developed and
validated. Such efforts are considered to be a major contribution to scientific practice in the
IS field (Straub et al, 2004).
Considering the slow adoption of broadband, it can be learnt that the policy makers
and the providers of the innovation - in this case the telecommunications industry - holds a
particular interest in the findings of this study. Policy makers are currently investigating how
to increase the diffusion of broadband within their own country, and so information on other
countries' experiences will be useful. The telecommunications industry is interested in
determining how to improve their current strategies. Therefore, for both policy and practice, this study offers an understanding of the broadband diffusion strategies at a household
Adoption, Usage and Impact of Broadband: UK Households Yogesh K. DNvivedi
Chapter 1. Introduction 12
consumer level. This is particularly useful as there is little research published in the area of
consumer adoption, usage and impact of broadband.
1.7 DISSERTATION OUTLINE
This dissertation comprises seven chapters. A brief description of each chapter is
provided below and for clarity of illustrations, the structure of this dissertation is summarised in Figure 1.2. Chapter 1 provides an overview for this dissertation. The chapter first
describes the research problem and delineates the scope of this study. Then it analyses the
state of research in the area of broadband adoption, usage and impact from a household
consumer perspective. This leads to outlining the research aims and objectives that this
research will address, followed by a brief description of the research methodology that will be utilised to conduct this research. The chapter then outlines the contributions that this
research will make. Finally, a brief description of all seven chapters is provided.
Chapter 2 first reviews and assesses the appropriateness of previous technology
adoption models and constructs used to study broadband diffusion. It then provides further
theoretical justification for selecting the constructs that are used to study broadband
diffusion, formulate the research hypotheses and finally draw a conceptual model of broadband adoption. The chapter also discusses the usage and impact aspect of broadband
diffusion and identifies constructs for empirical investigations. Completion of Chapter 2
accomplishes the first objective of this research.
Chapter 3 aims to discuss research approaches in general and also those specific to
this research. It will also provide the justification for the chosen research methodology, as
well as detailed discussions on the specific methodological approach.
Chapter 4 aims to describe the development of a research instrument that is
designed to investigate broadband adoption, usage and impact within the UK household. The
chapter describes the following three stages of developing a reliable research instrument: (1)
identification of the factors from the literature that are expected to explain the broadband
adoption behaviour and determining them by employing an exploratory survey; (2) content
validation on items that result from the exploratory survey. The purpose of this step is to
confirm the representativeness of items to a particular construct domain; (3) description of a
pre-test and a pilot test in order to confirm the reliability of measures. Completion of
chapters 3 and 4 will accomplish the second objective of this research.
Chapter 5 presents findings obtained from a nationwide survey that was conducted
to examine the adoption, usage and impact of broadband in the UK households. An
illustration of these findings comprises of an estimation of response rates, nonresponse bias,
Adoption, Usage and Impact of Broadband: UK Households Yogesh K. DNvivedi
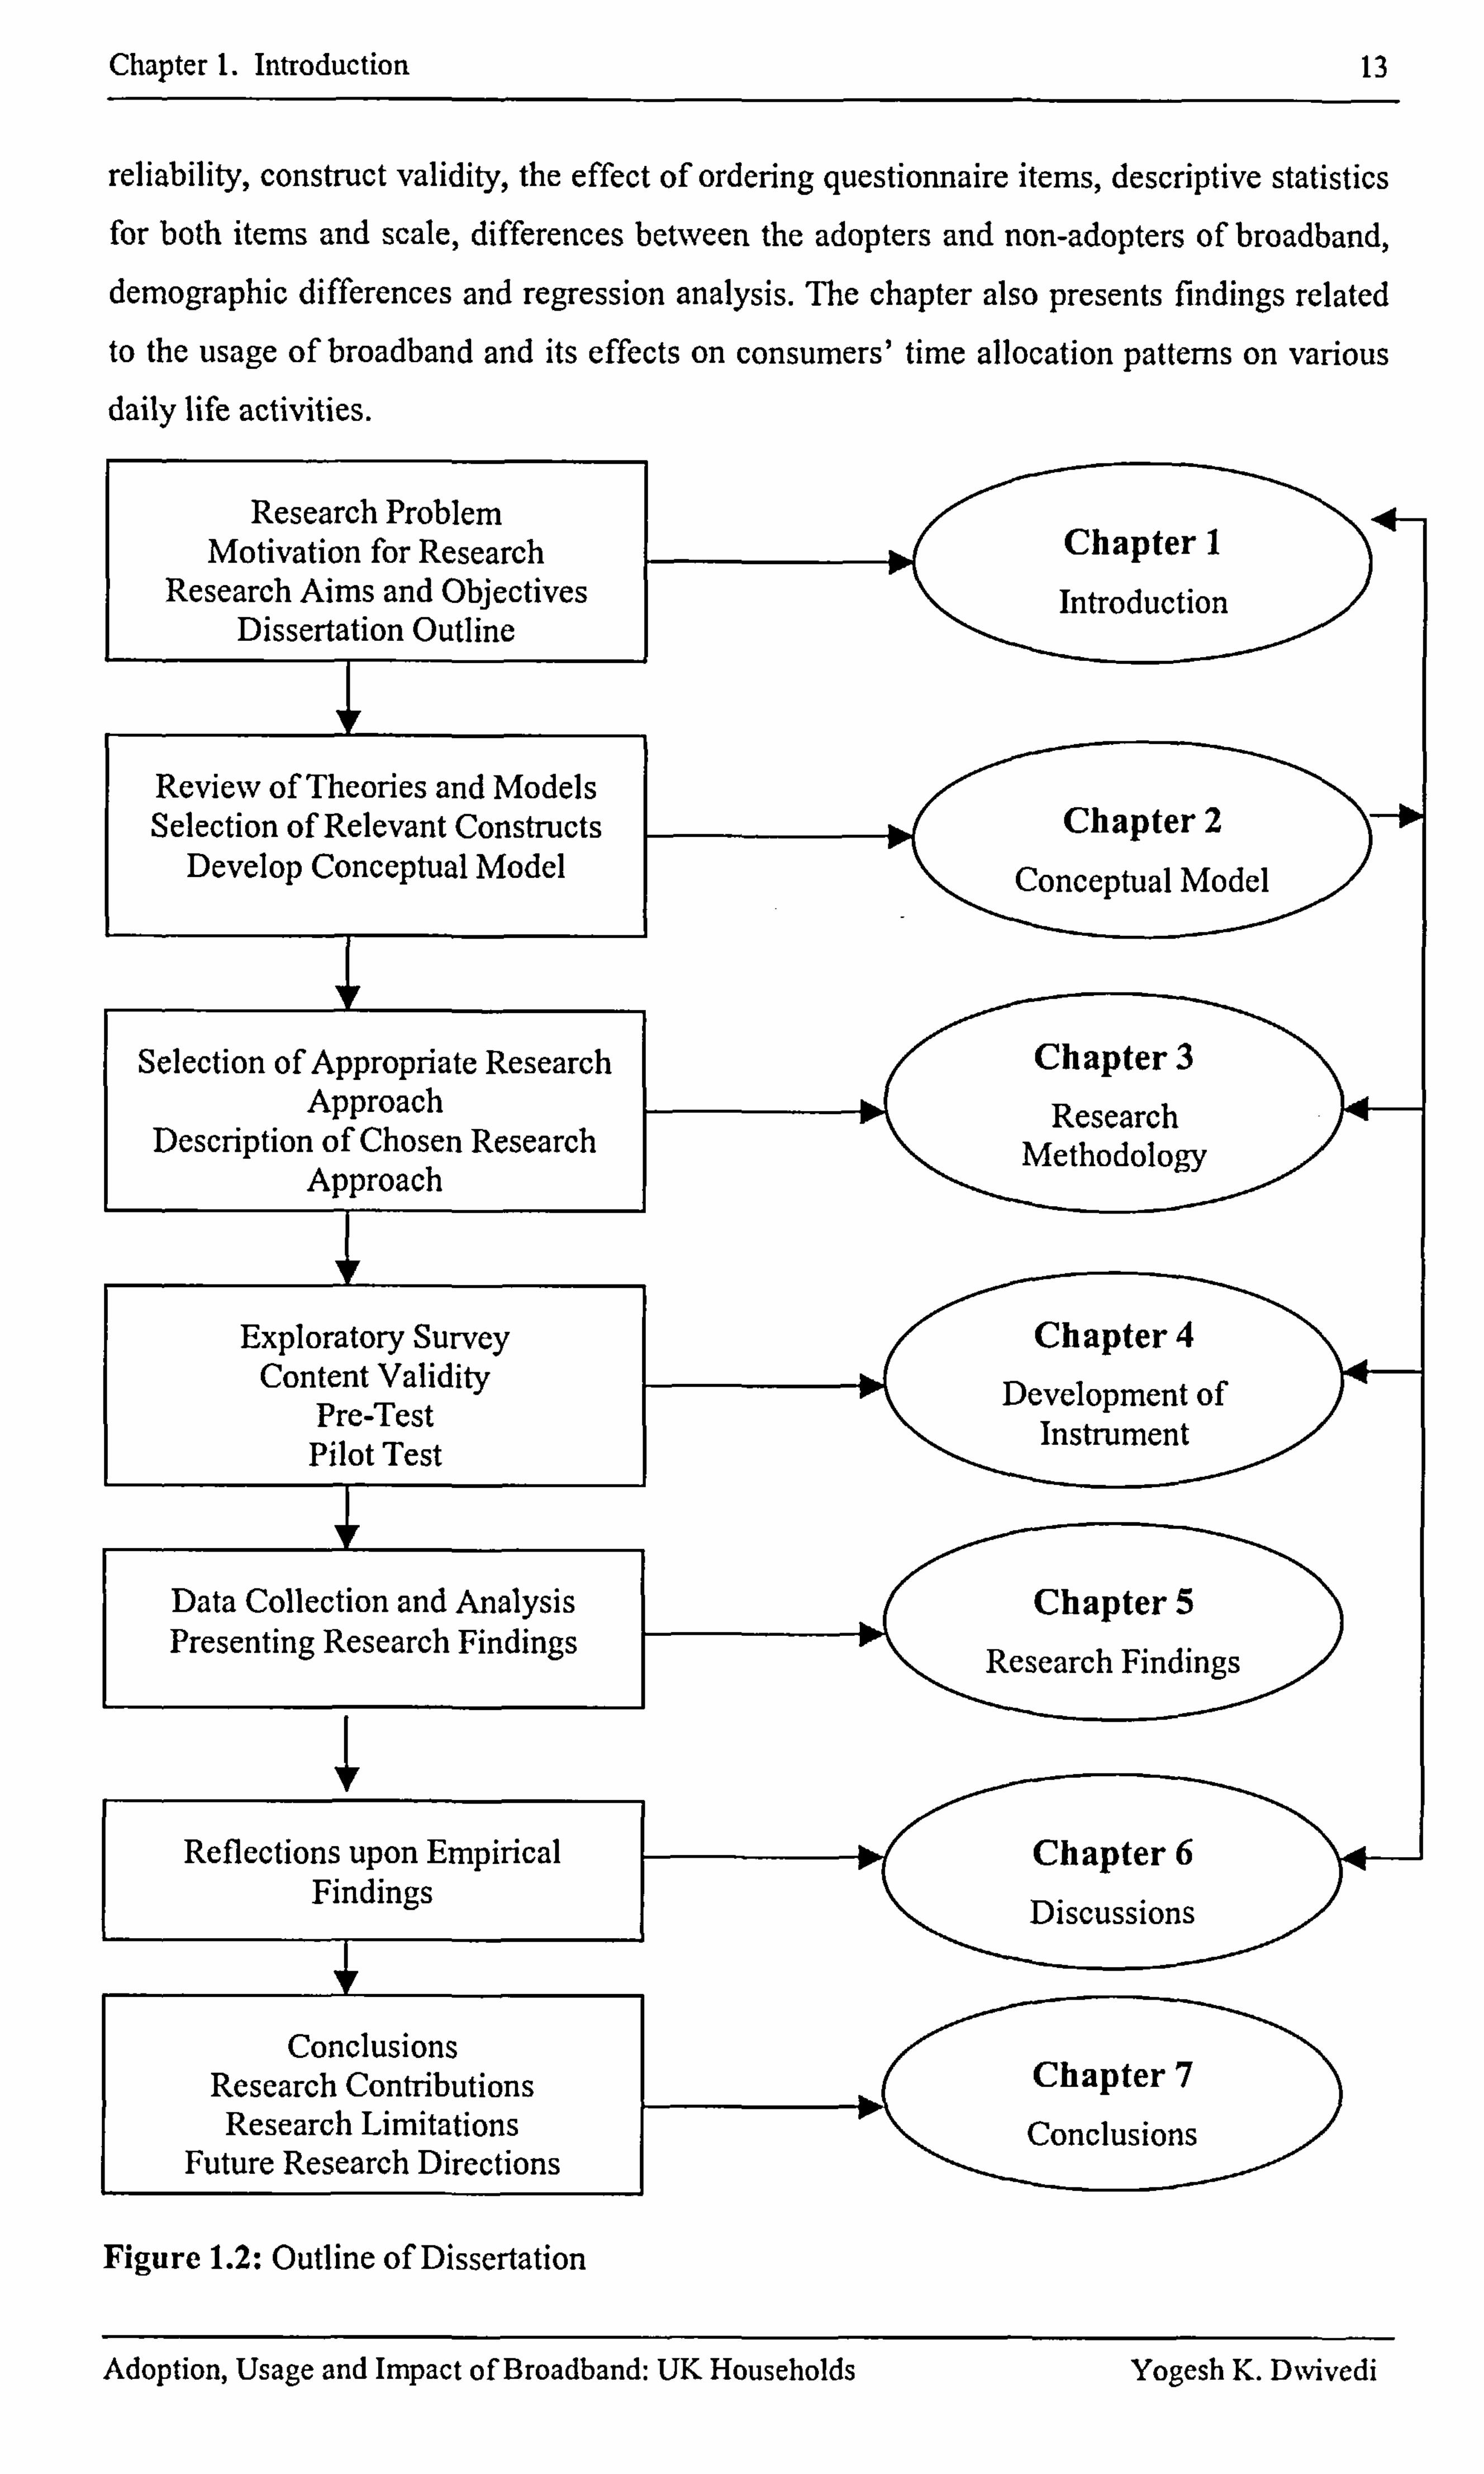
Chapter 1. Introduction 13
reliability, construct validity, the effect of ordering questionnaire items, descriptive statistics for both items and scale, differences between the adopters and non-adopters of broadband,
demographic differences and regression analysis. The chapter also presents findings related to the usage of broadband and its effects on consumers' time allocation patterns on various daily life activities.
Research Problem Motivation for Research Chapter I
Research Aims and Objectives Introduction Dissertation Outline
Review of Theories and Models Selection of Relevant Constructs Chapter 2
Develop Conceptual Model Conceptual Model
Selection of Appropriate Research Chapter 3 Approach Research
Description of Chosen Research Methodology Approach
Exploratory Survey Chapter 4 Content Validity Development of Pre-Test Instrument Pilot Test
Data Collection and Analysis Chapter 5 Presenting Research Findings
Reflections upon Empirical Chapter 6 Findings
i
Discussions
Conclusions Research Contributions Chapter 7 Research Limitations Conclusions
Future Research Directions
Figure 1.2: Outline of Dissertation
Adoption, Usage and Impact of Broadband: UK Households Yogesh K. D%vivedi
Chapter 1. Introduction 14
Chapter 6 discusses and reflects upon the findings obtained in Chapter 5 from the
theoretical perspectives presented in Chapter 2. It also discusses the empirical issues that
have been reported from the survey findings. This chapter first discusses the appropriateness
of response rates and issues of the nonresponse bias of this survey, in the light of existing
work. Then it discusses the instrument validation process by reflecting upon issues such as
content validity, reliability and construct validity. After this, the refined and validated model
of broadband adoption is discussed. Finally, the chapter provides a discussion on usage of broadband and how it affects consumers' time allocation patterns on various daily life
activities. Completion of chapters 5 and 6 will accomplish the third objective of this
research.
Chapter 7 surnmarises the research findings and provides a discussion of the
research contributions and implications of this research in terms of the theory, policy and
practice. This chapter also delineates the research limitations and presents future research directions in the area of broadband diffusion and adoption. Completion of Chapter 7 will
accomplish the fourth and final objective achieved within this research.
1.8 SUMMARY
This chapter provided an introduction to the research problem that this research
encompasses, and established the scope of this study. It discussed the existing research in the
area of broadband adoption, usage and impact from a household consumer perspective, and
went on to define the research aims and objectives that this research later addresses. A brief
description of the research methodology and the contributions that this research will make
were then presented. Finally, a brief description of all seven chapters was provided.
A lack of studies on consumer level broadband adoption and diffusion has resulted in a lack of appropriate conceptual models specific to broadband. Therefore, the next chapter
will develop a model to understand household diffusion by identifying appropriate constructs from previous theories models on technology adoption; the chapter will also formulate the
research hypotheses.
Adoption, Usage and Impact of Broadband: UK Households Yogesh K. DNvivedi

Chapter 2. Conceptual Model 15
2.1 INTRODUCTION
Examination of previous literature in the Infon-nation Systems (IS) area illustrates
that researchers have not yet undertaken research on broadband in the areas of consumer diffusion including the adoption, usage and impact in the household (Crabtree, 2003; Oh el
al, 2003; Stanton, 2004). Instead, most of the research associated with broadband has mainly focused on examining the macro level factors leading to adoption in a country (Crabtree,
2003; Oh et al, 2003; Stanton, 2004). Recently conducted studies highlight the need to
understand adoption and diffusion of broadband from the household consumer perspective (Crabtree, 2003; Oh et al, 2003; Stanton, 2004). The limitation to studying adoption at a
micro level has resulted in a lack of appropriate conceptual model specific to broadband. As
pursued in previous adoption studies (Davis, 1989; Oh et al, 2003; Venkatesh and Brown,
2001), constructing a conceptual model specific to broadband diffusion at the household
consumer level necessitates the review, identification and integration of the relevant factors
related with adoption, usage and impact of technology that were examined in previous IS
studies. Therefore, this chapter first reviews and assesses the appropriateness of previous technology adoption models and constructs to study broadband diffusion. Then this chapter
provides further theoretical justification for selecting the constructs that are used to study broadband diffusion, formulate the hypotheses and finally draw a conceptual model of broadband diffusion.
The chapter is structured as follows. Section 2.2 provides a review of the theoretical
models of technology diffusion and adoption. Then this section also provides a brief
discussion of the models applied to investigate broadband related issues from the consumer
perspective. Section 2.3 briefly discusses the foundations of the proposed model and also
provides an overall description of the proposed conceptual model. Sections 2.4-2.10
elaborate the broadband diffusion model and respectively justifies the inclusion of the
attitudinal, normative, control, behavioural. intention, adoption behaviour, usage behaviour
and impact constructs, and formulates the hypotheses by presenting theoretical explanations,
past empirical findings, and practical examples. Finally, to conclude the chapter, Section
2.11 is provided.
2.2 TECHNOLOGY DIFFUSION AND ADOPTION THEORIES
The study of adoption/acceptance, adaptations and usage of information technology (IT) is considered to be one of the most mature areas of research within the IS discipline
(Benbasat and Zmud, 1999; Hu et al, 1999; Venkatesh et al, 2003). Consequently, over time
Adoption, Usage and Impact of Broadband: UK Households Yogesh K. Divivedi
Chapter 2. Conceptual Model 16
a number of theories and models have been adopted from diverse disciplines such as social
psychology, sociology and marketing, and have been modified, developed and validated by
IS researchers in order to understand and predict technology adoption and usage (Benbasat
and Zmud, 1999; Venkatesh el al, 2003). Theories and models that have been taken from
other disciplines and developed by IS researchers include the Theory of Reasoned Action
(TRA) (Fishbein and Ajzen, 1975); the Theory of Planned Behaviour (TPB) (Ajzen, 1991;
1988; 1985; Ajzen and Fishbein, 1980; Ajzen and Madden, 1986); the Technology
Acceptance Model (TAM) (Davis, 1989; Davis el al, 1989); and the Diffusion of Innovation
(DI) Theory (Rogers, 1995). According to the needs of IS research, these theories were further modified, extended and integrated. For instance, in order to understand various factors in detail, Taylor and Todd (1995) proposed the decomposed TPB by modifying TP13
and integrating the diffusion of innovation constructs within it. Similarly, in order to
understand the role of gender and social influence in technology adoption, Venkatesh and Morris (2000) extended TAM by integrating gender and subjective norm constructs with the
original TAM model.
For the purpose of understanding technology adoption within the household context, Venkatesh and Brown (2001) modified the TPB to examine drivers and barriers of PC
adoption. Due to the large numbers of choices of theories and models (e. g. TRA, TPB, DTP,
TAM, DI, MATH), a selection of an appropriate model or various constructs from different
models posed to be a problem for the upcoming technology adoption researchers. Venkatesh
et al (2003) argued that researchers are confronted with a choice amongst a multitude of
models and find that they must "pick and choose" constructs across the models, or choose a "favoured model" and largely ignore the contributions from alternative models. This led
Venkatesh et al (2003) to review, discuss and integrate elements across eight prominent user
acceptance models (TRA, TAM, the Motivational Model, TPB, a model combining the
Technology Acceptance Model and the Theory of Planned Behaviour, MATH, DI, and the
Social Cognitive Theory) that resulted in proposing the Unified Theory of Acceptance and Use of Technology (UTAUT). UTAUT is composed of four core determinants (performance
expectancy, effort expectancy, social influence, and facilitating conditions) of intention and
usage. This model also consists of four variables such as gender, age, voluntariness and
experience that moderate key relationships between the aforementioned four core determinants and intention and usage.
Although aforementioned models and theories are widely tested and validated to
explain the usage and adoption of technology from the 'users' perspective, their application is limited to studying the 'consumers'. Realising the potential of emerging infort-nation and
Adoption, Usage and Impact of Broadband: UK Households Yogesh K. D%vivcdi
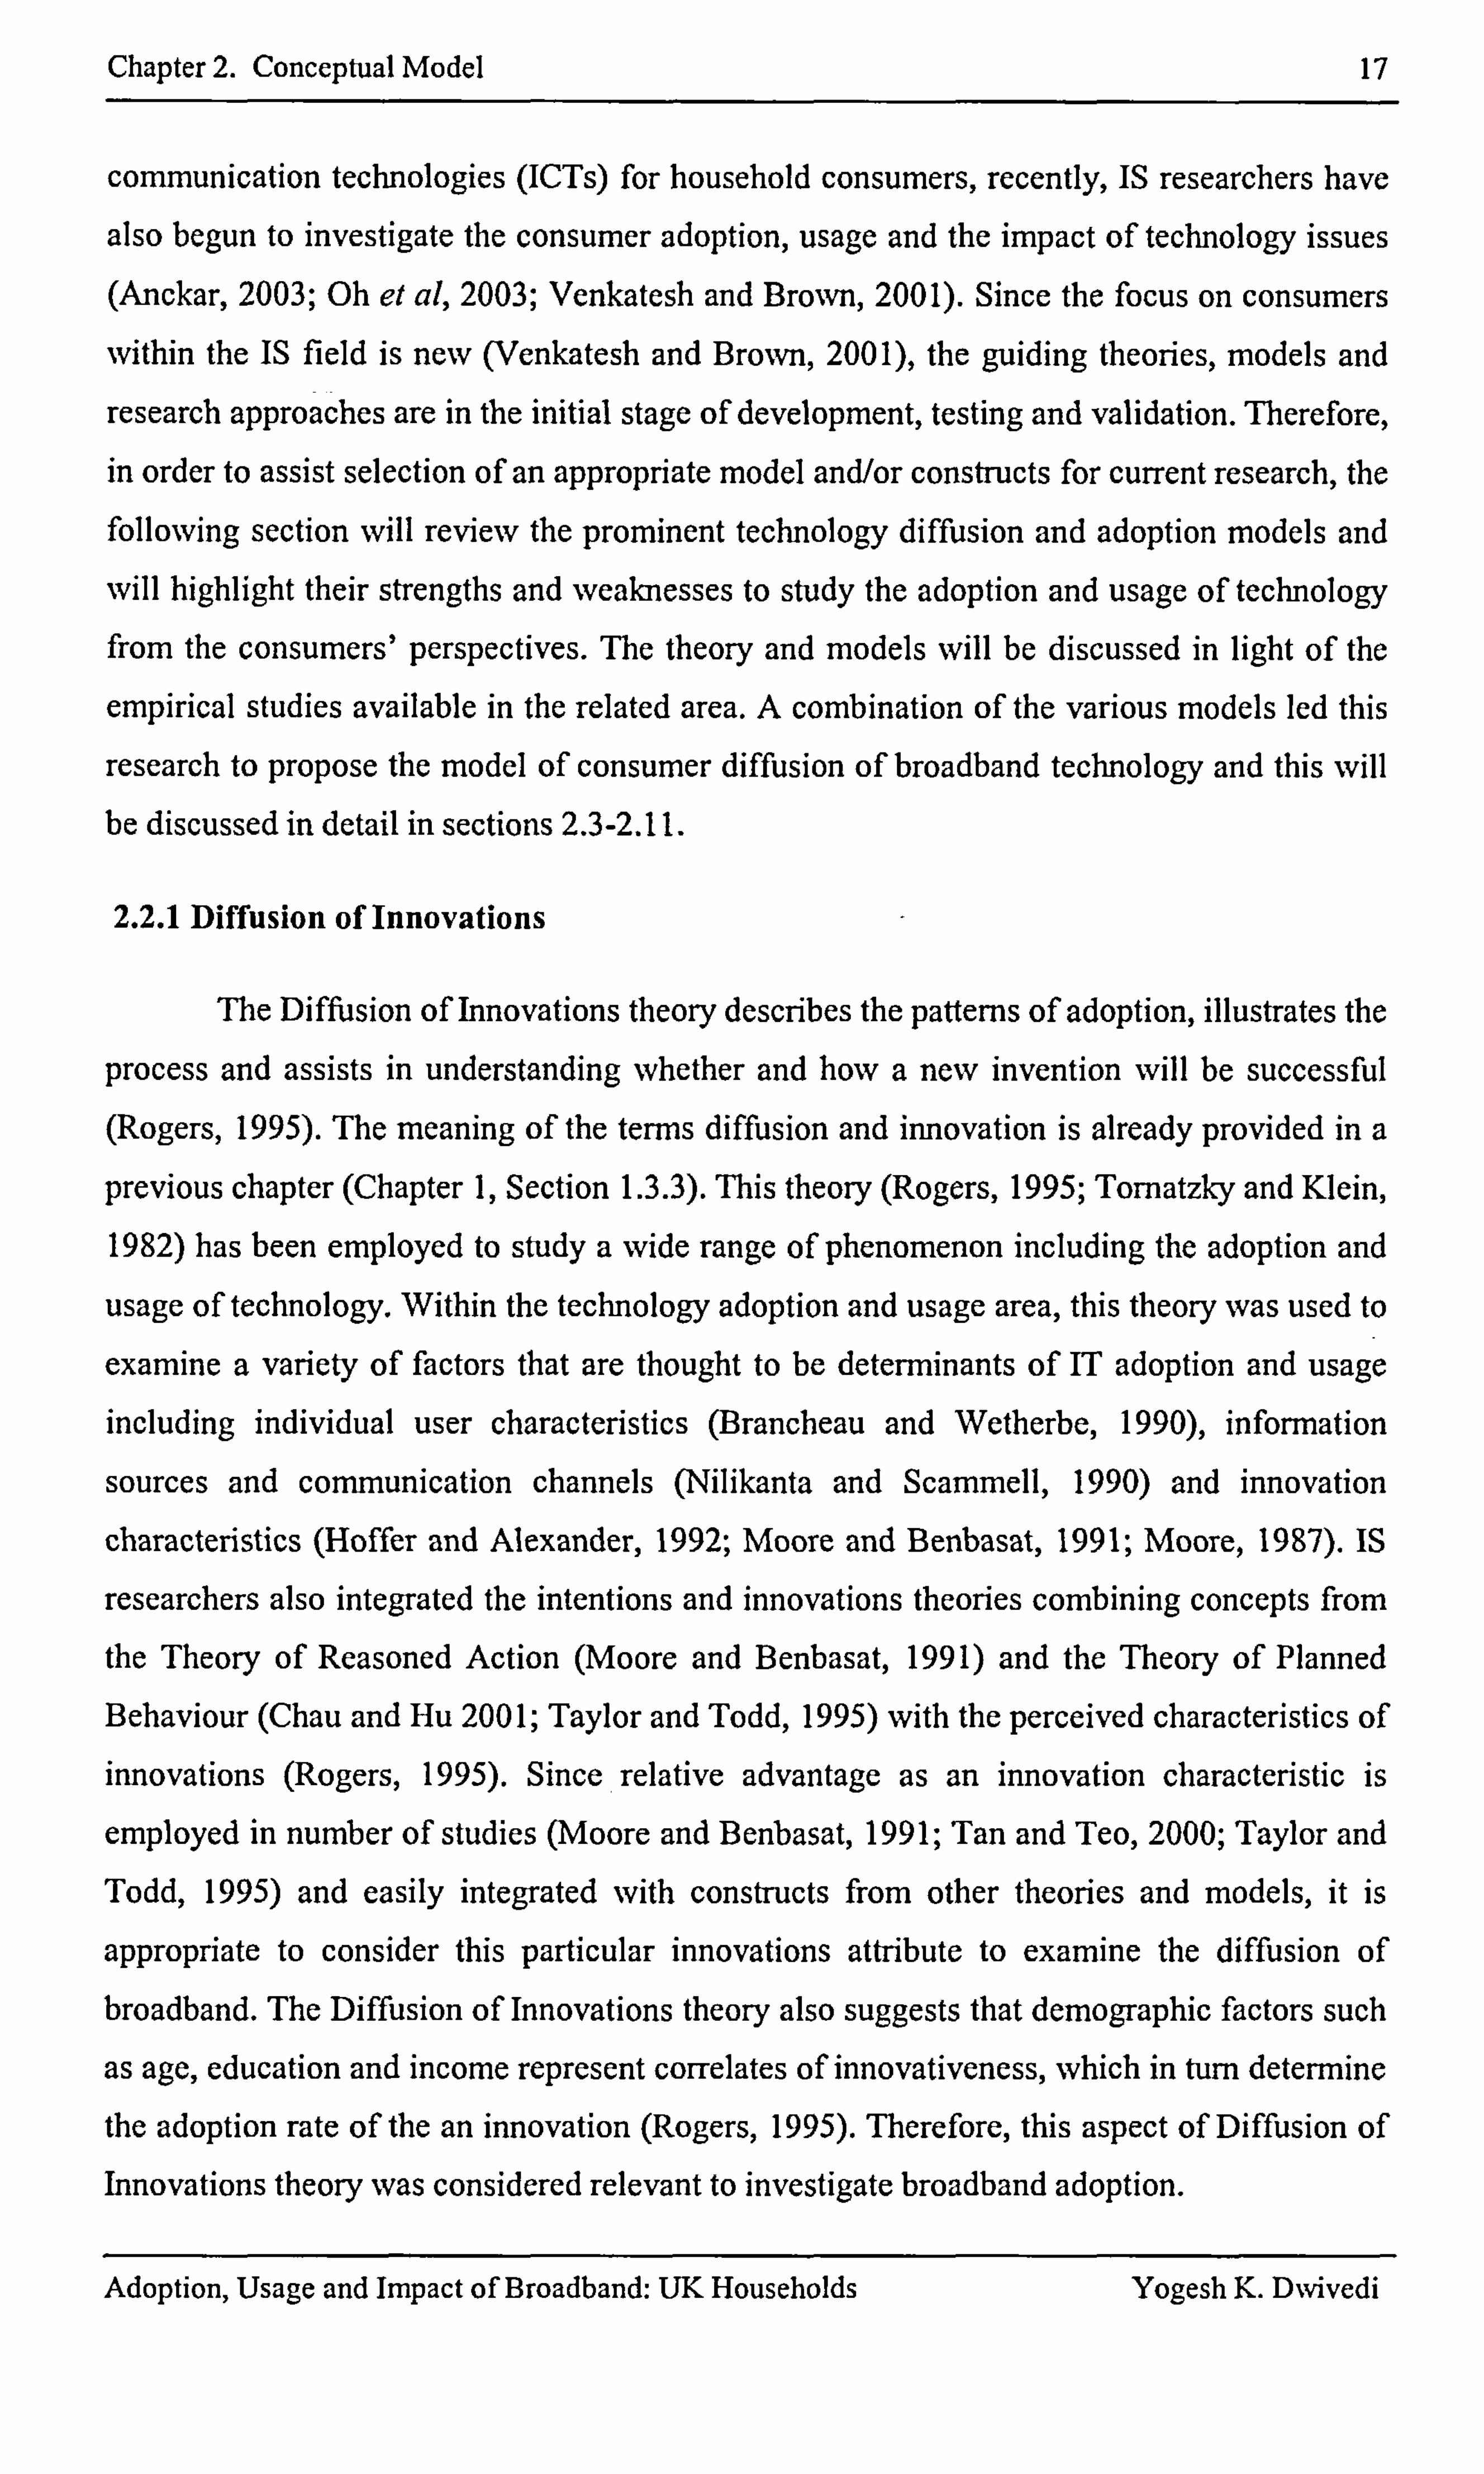
Chapter 2. Conceptual Model 17
communication technologies (ICTs) for household consumers, recently, IS researchers have
also begun to investigate the consumer adoption, usage and the impact of technology issues
(Anckar, 2003; Oh et al, 2003; Venkatesh and Brown, 2001). Since the focus on consumers
within the IS field is new (Venkatesh and Brown, 2001), the guiding theories, models and
research approaches are in the initial stage of development, testing and validation. Therefore,
in order to assist selection of an appropriate model and/or constructs for current research, the following section will review the prominent technology diffusion and adoption models and
will highlight their strengths and weaknesses to study the adoption and usage of technology from the consumers' perspectives. The theory and models will be discussed in light of the
empirical studies available in the related area. A combination of the various models led this
research to propose the model of consumer diffusion of broadband technology and this will be discussed in detail in sections 2.3-2.11.
2.2.1 Diffusion of Innovations
The Diffusion of Innovations theory describes the patterns of adoption, illustrates the
process and assists in understanding whether and how a new invention will be successful (Rogers, 1995). The meaning of the terms diffusion and innovation is already provided in a
previous chapter (Chapter 1, Section 1.3.3). This theory (Rogers, 1995; Tornatzky and Klein,
1982) has been employed to study a wide range of phenomenon including the adoption and
usage of technology. Within the technology adoption and usage area, this theory was used to
examine a variety of factors that are thought to be determinants of IT adoption and usage including individual user characteristics (Brancheau and Wetherbe, 1990), information
sources and communication channels (Nilikanta and Scammell, 1990) and innovation
characteristics (Hoffer and Alexander, 1992; Moore and Benbasat, 1991; Moore, 1987). IS
researchers also integrated the intentions and innovations theories combining concepts from
the Theory of Reasoned Action (Moore and Benbasat, 1991) and the Theory of Planned
Behaviour (Chau and Hu 200 1; Taylor and Todd, 1995) with the perceived characteristics of innovations (Rogers, 1995). Since relative advantage as an innovation characteristic is
employed in number of studies (Moore and Benbasat, 1991; Tan and Teo, 2000; Taylor and Todd, 1995) and easily integrated with constructs from other theories and models, it is
appropriate to consider this particular innovations attribute to examine the diffusion of broadband. The Diffusion of Innovations theory also suggests that demographic factors such
as age, education and income represent correlates of innovativeness, which in turn determine
the adoption rate of the an innovation (Rogers, 1995). Therefore, this aspect of Diffusion of Innovations theory was considered relevant to investigate broadband adoption.
Adoption, Usage and Impact of Broadband: UK Households Yogesh K. D%vivedi
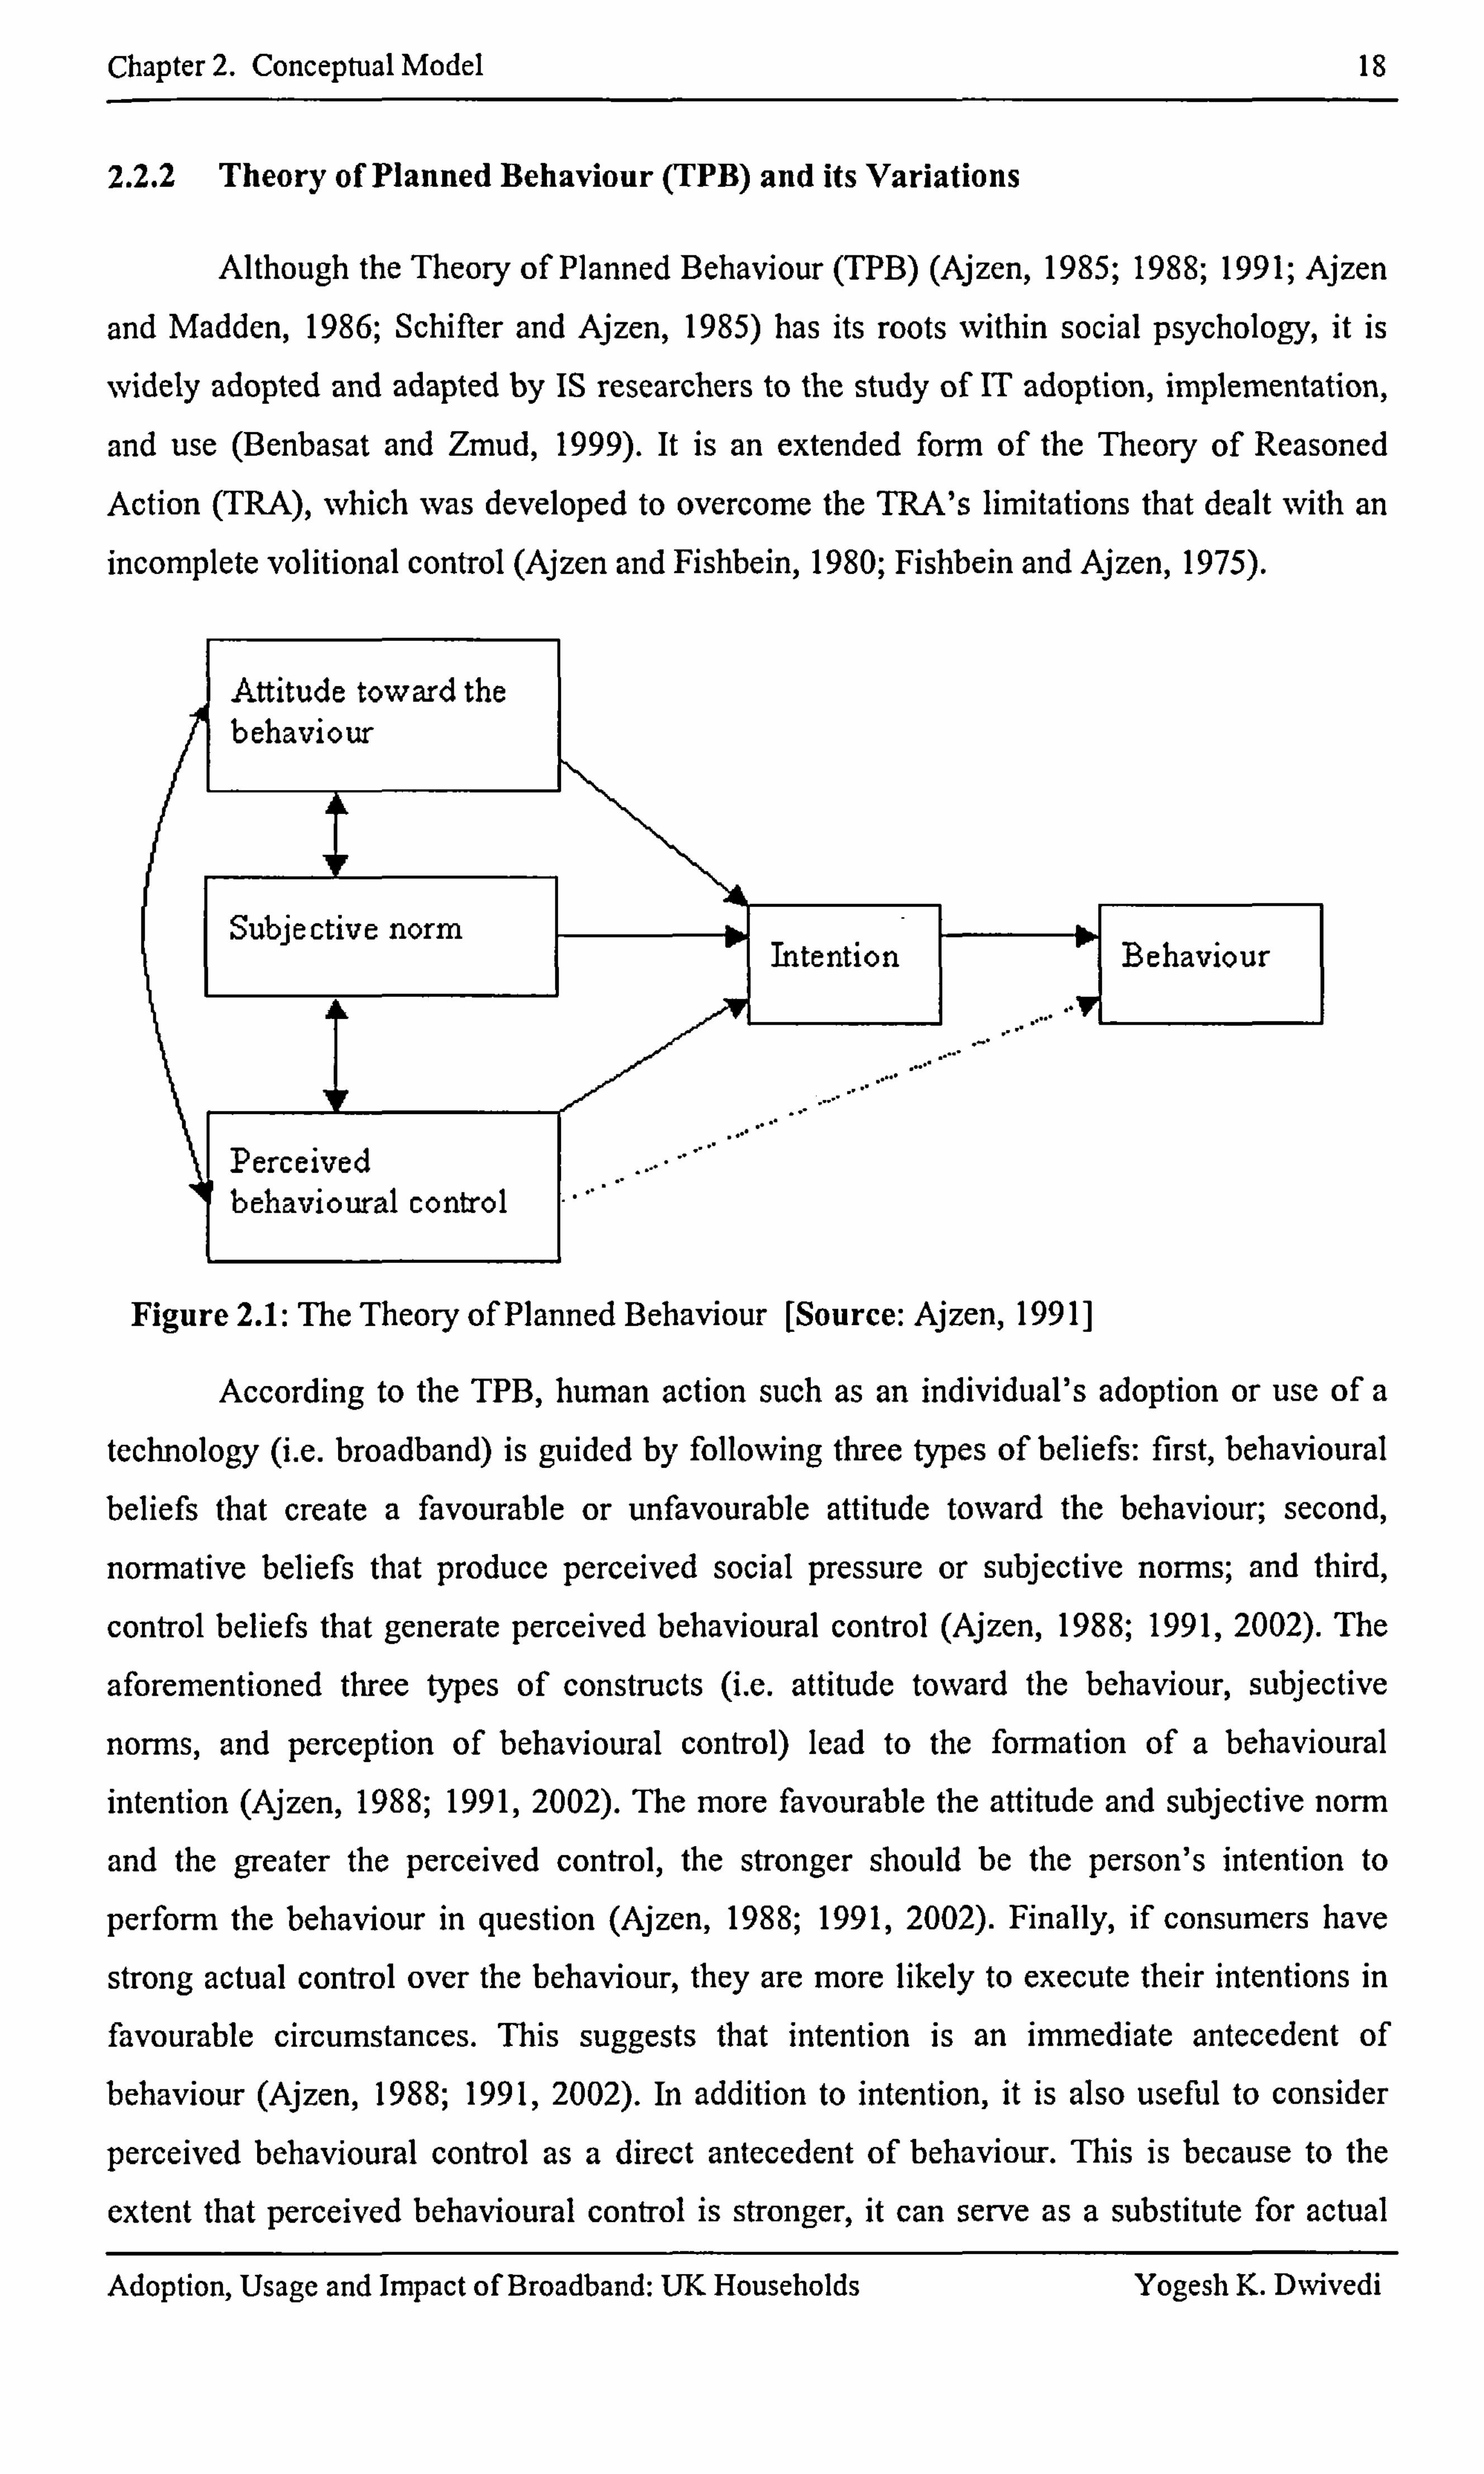
Chapter 2. Conceptual Model is
2.2.2 Theory of Planned Behaviour (TPB) and its Variations
Although the Theory of Planned Behaviour (TP13) (Ajzen, 1985; 1988; 1991; Ajzen
and Madden, 1986; Schifter and Ajzen, 1985) has its roots within social psychology, it is
widely adopted and adapted by IS researchers to the study of IT adoption, implementation,
and use (Benbasat and Zmud, 1999). It is an extended form of the Theory of Reasoned
Action (TRA), which was developed to overcome the TRA's limitations that dealt with an incomplete volitional control (Ajzen and Fishbein, 1980; Fishbein and Ajzen, 1975).
Attitude toward the behaviour
Subjective norm Intention
Perceived behavioural control
Figure 2.1: The Theory of Planned Behaviour [Source: Ajzen, 1991]
According to the TPB, human action such as an individual's adoption or use of a
technology (i. e. broadband) is guided by following three types of beliefs: first, behavioural
beliefs that create a favourable or unfavourable attitude toward the behaviour; second,
normative beliefs that produce perceived social pressure or subjective norms; and third,
control beliefs that generate perceived behavioural control (AJzen, 1988; 1991,2002). The
aforementioned three types of constructs (i. e. attitude toward the behaviour, subjective
norms, and perception of behavioural control) lead to the formation of a behavioural
intention (AJzen, 1988; 1991,2002). The more favourable the attitude and subjective norm
and the greater the perceived control, the stronger should be the person's intention to
perform the behaviour in question (AJzen, 1988; 1991,2002). Finally, if consumers have
strong actual control over the behaviour, they are more likely to execute their intentions in
favourable circumstances. This suggests that intention is an immediate antecedent of behaviour (AJzen, 1988; 1991,2002). In addition to intention, it is also useful to consider
perceived behavioural control as a direct antecedent of behaviour. This is because to the
extent that perceived behavioural control is stronger, it can serve as a substitute for actual
Adoption, Usage and Impact of Broadband: UK Households Yogesh K. D%vivedi
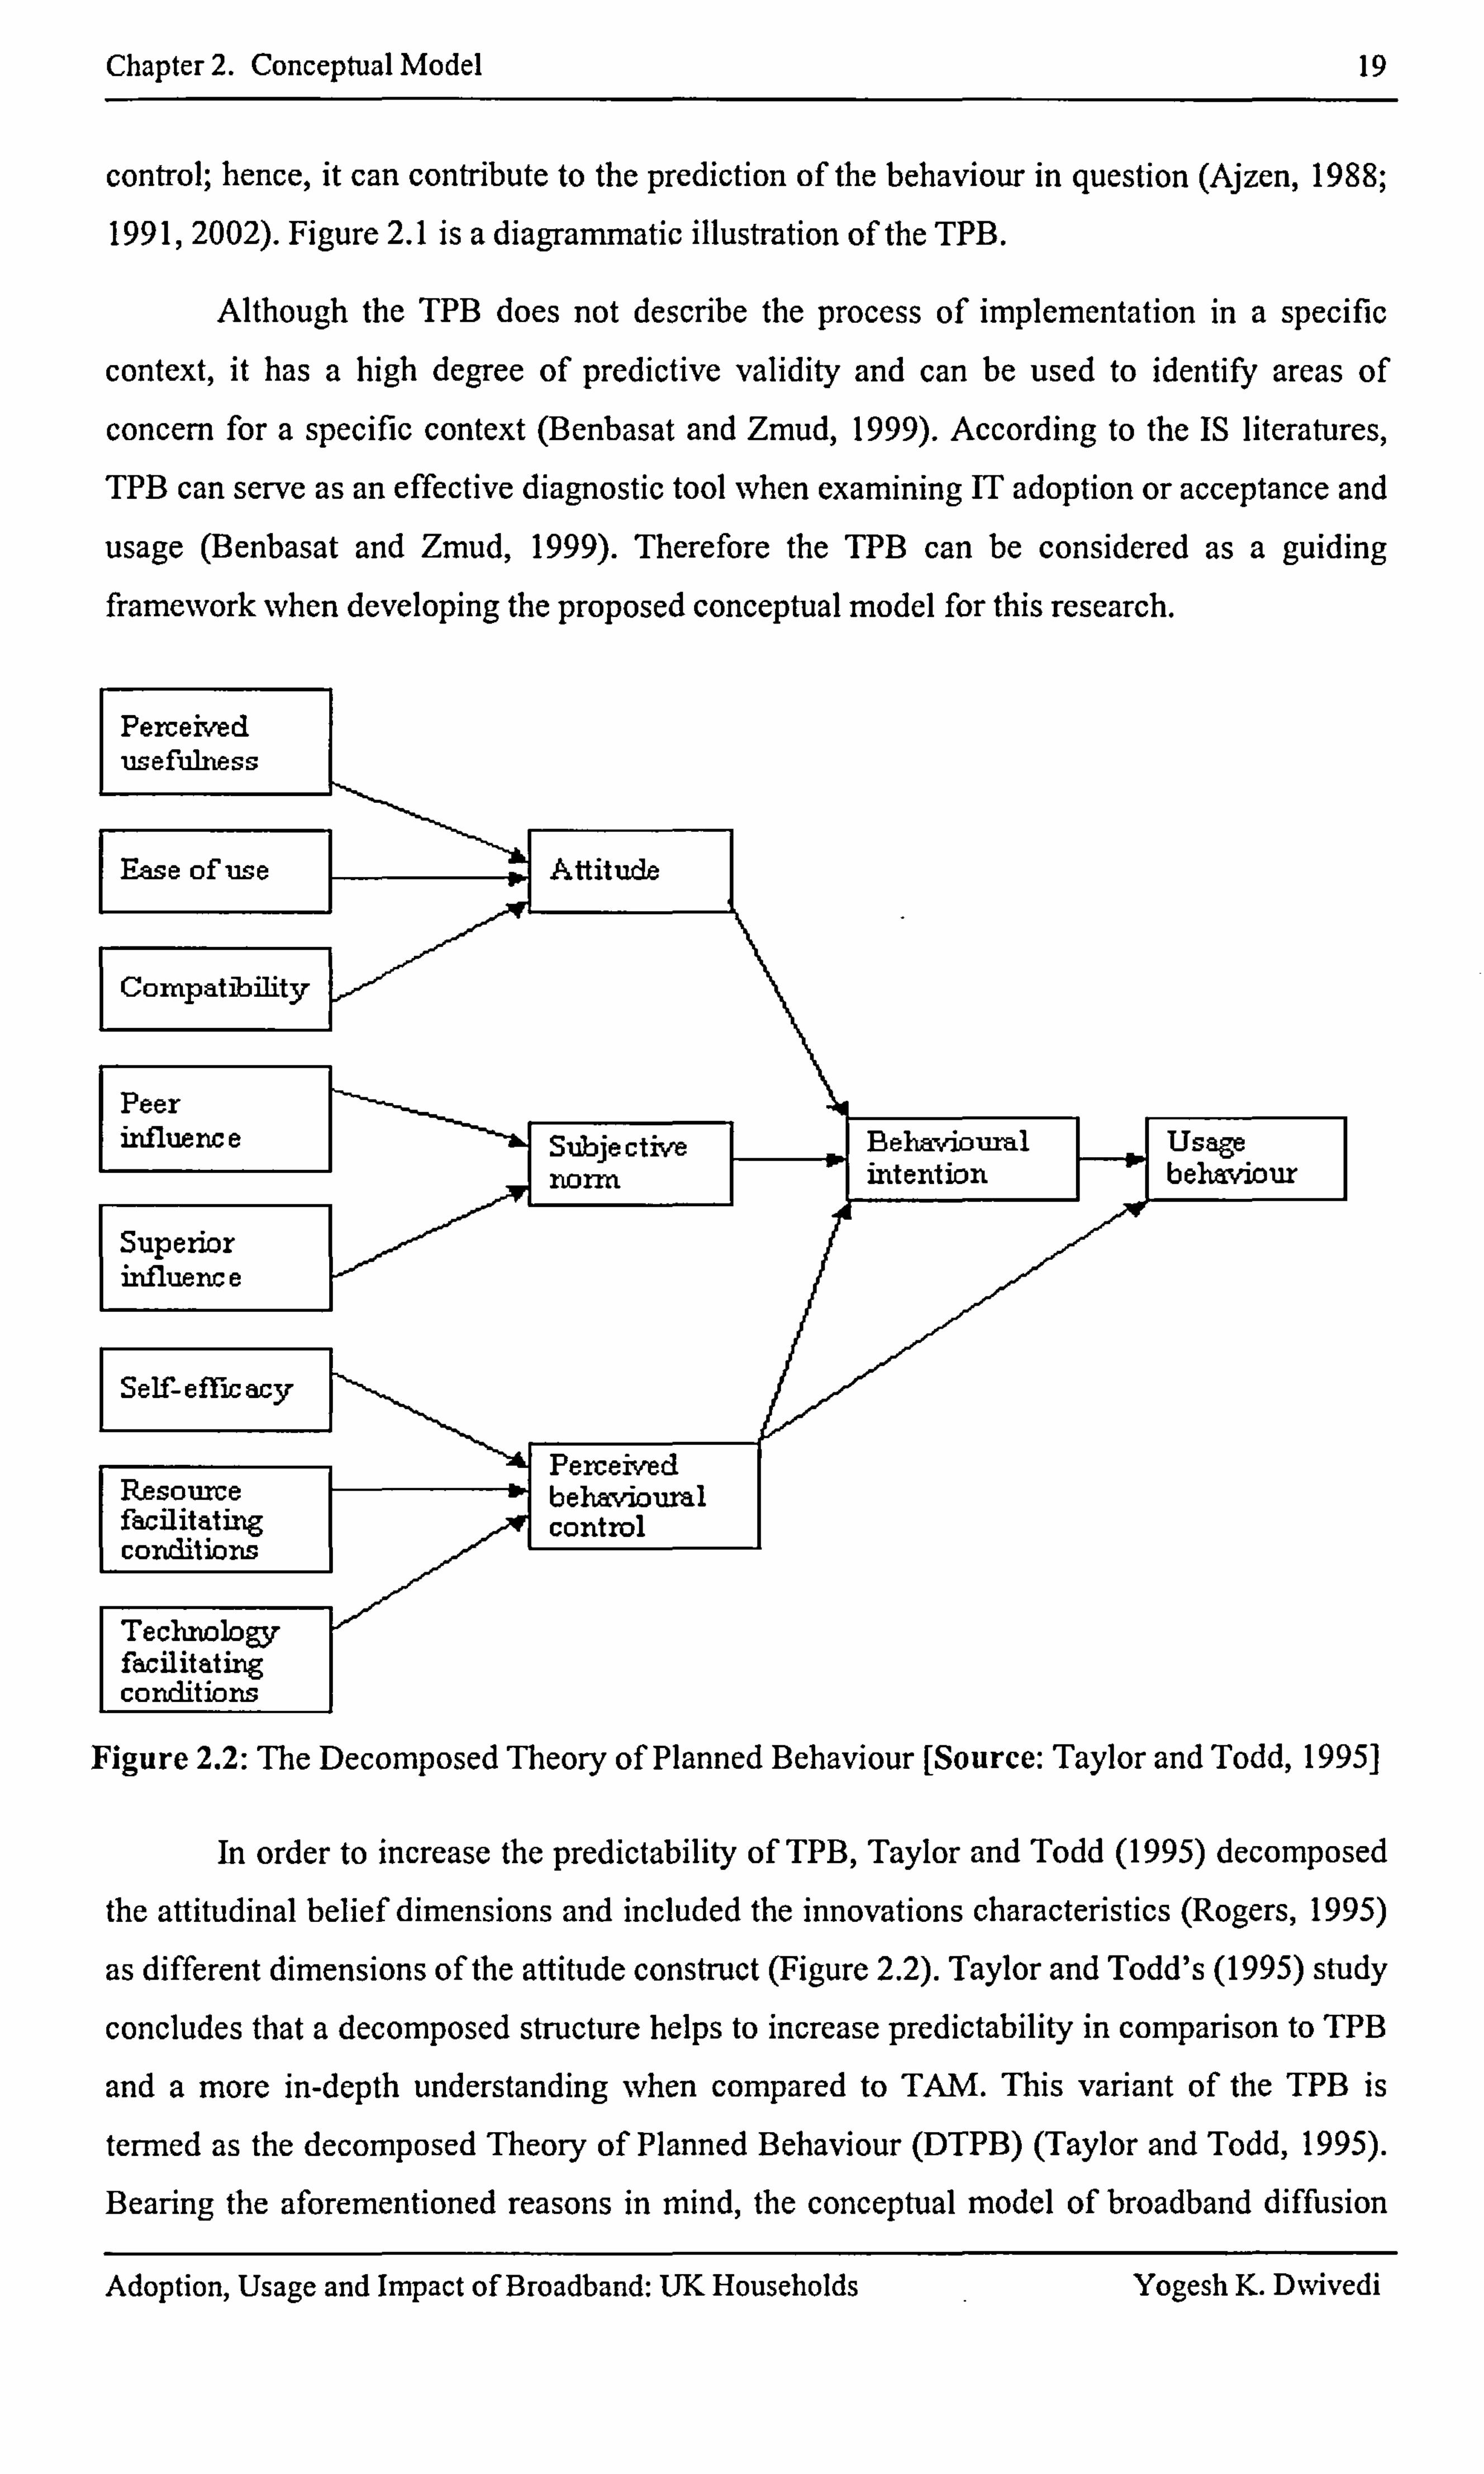
Chapter 2. Conceptual Model 19
control; hence, it can contribute to the prediction of the behaviour in question (Ajzen, 1988;
1991,2002). Figure 2.1 is a diagrammatic illustration of the TPB.
Although the TPB does not describe the process of implementation in a specific
context, it has a high degree of predictive validity and can be used to identify areas of
concern for a specific context (Benbasat and Zmud, 1999). According to the IS literatures,
TPB can serve as an effective diagnostic tool when examining IT adoption or acceptance and
usage (Benbasat and Zmud, 1999). Therefore the TPB can be considered as a guiding framework when developing the proposed conceptual model for this research.
Perceived usefuhiess
Fase of use I ZI Aftitude
Compatibility
Peer influence
r==je ctive
Superior influenc e
Self- effic acy
-ý&I inerceive Resource ehavioural facilitating control conditions
Tecl=logy facRitating conffitions
I
Behavioural Usage intention
ýý behaviour
Figure 2.2: The Decomposed Theory of Planned Behaviour [Source: Taylor and Todd, 1995]
In order to increase the predictability of TPB, Taylor and Todd (1995) decomposed
the attitudinal belief dimensions and included the innovations characteristics (Rogers, 1995)
as different dimensions of the attitude construct (Figure 2.2). Taylor and Todd's (1995) study
concludes that a decomposed structure helps to increase predictability in comparison to TPB
and a more in-depth understanding when compared to TAM. This variant of the TPB is
termed as the decomposed Theory of Planned Behaviour (DTPB) (Taylor and Todd, 1995).
Bearing the aforementioned reasons in mind, the conceptual model of broadband diffusion
Adoption, Usage and Impact of Broadband: UK Households Yogesh K. D%vivedi
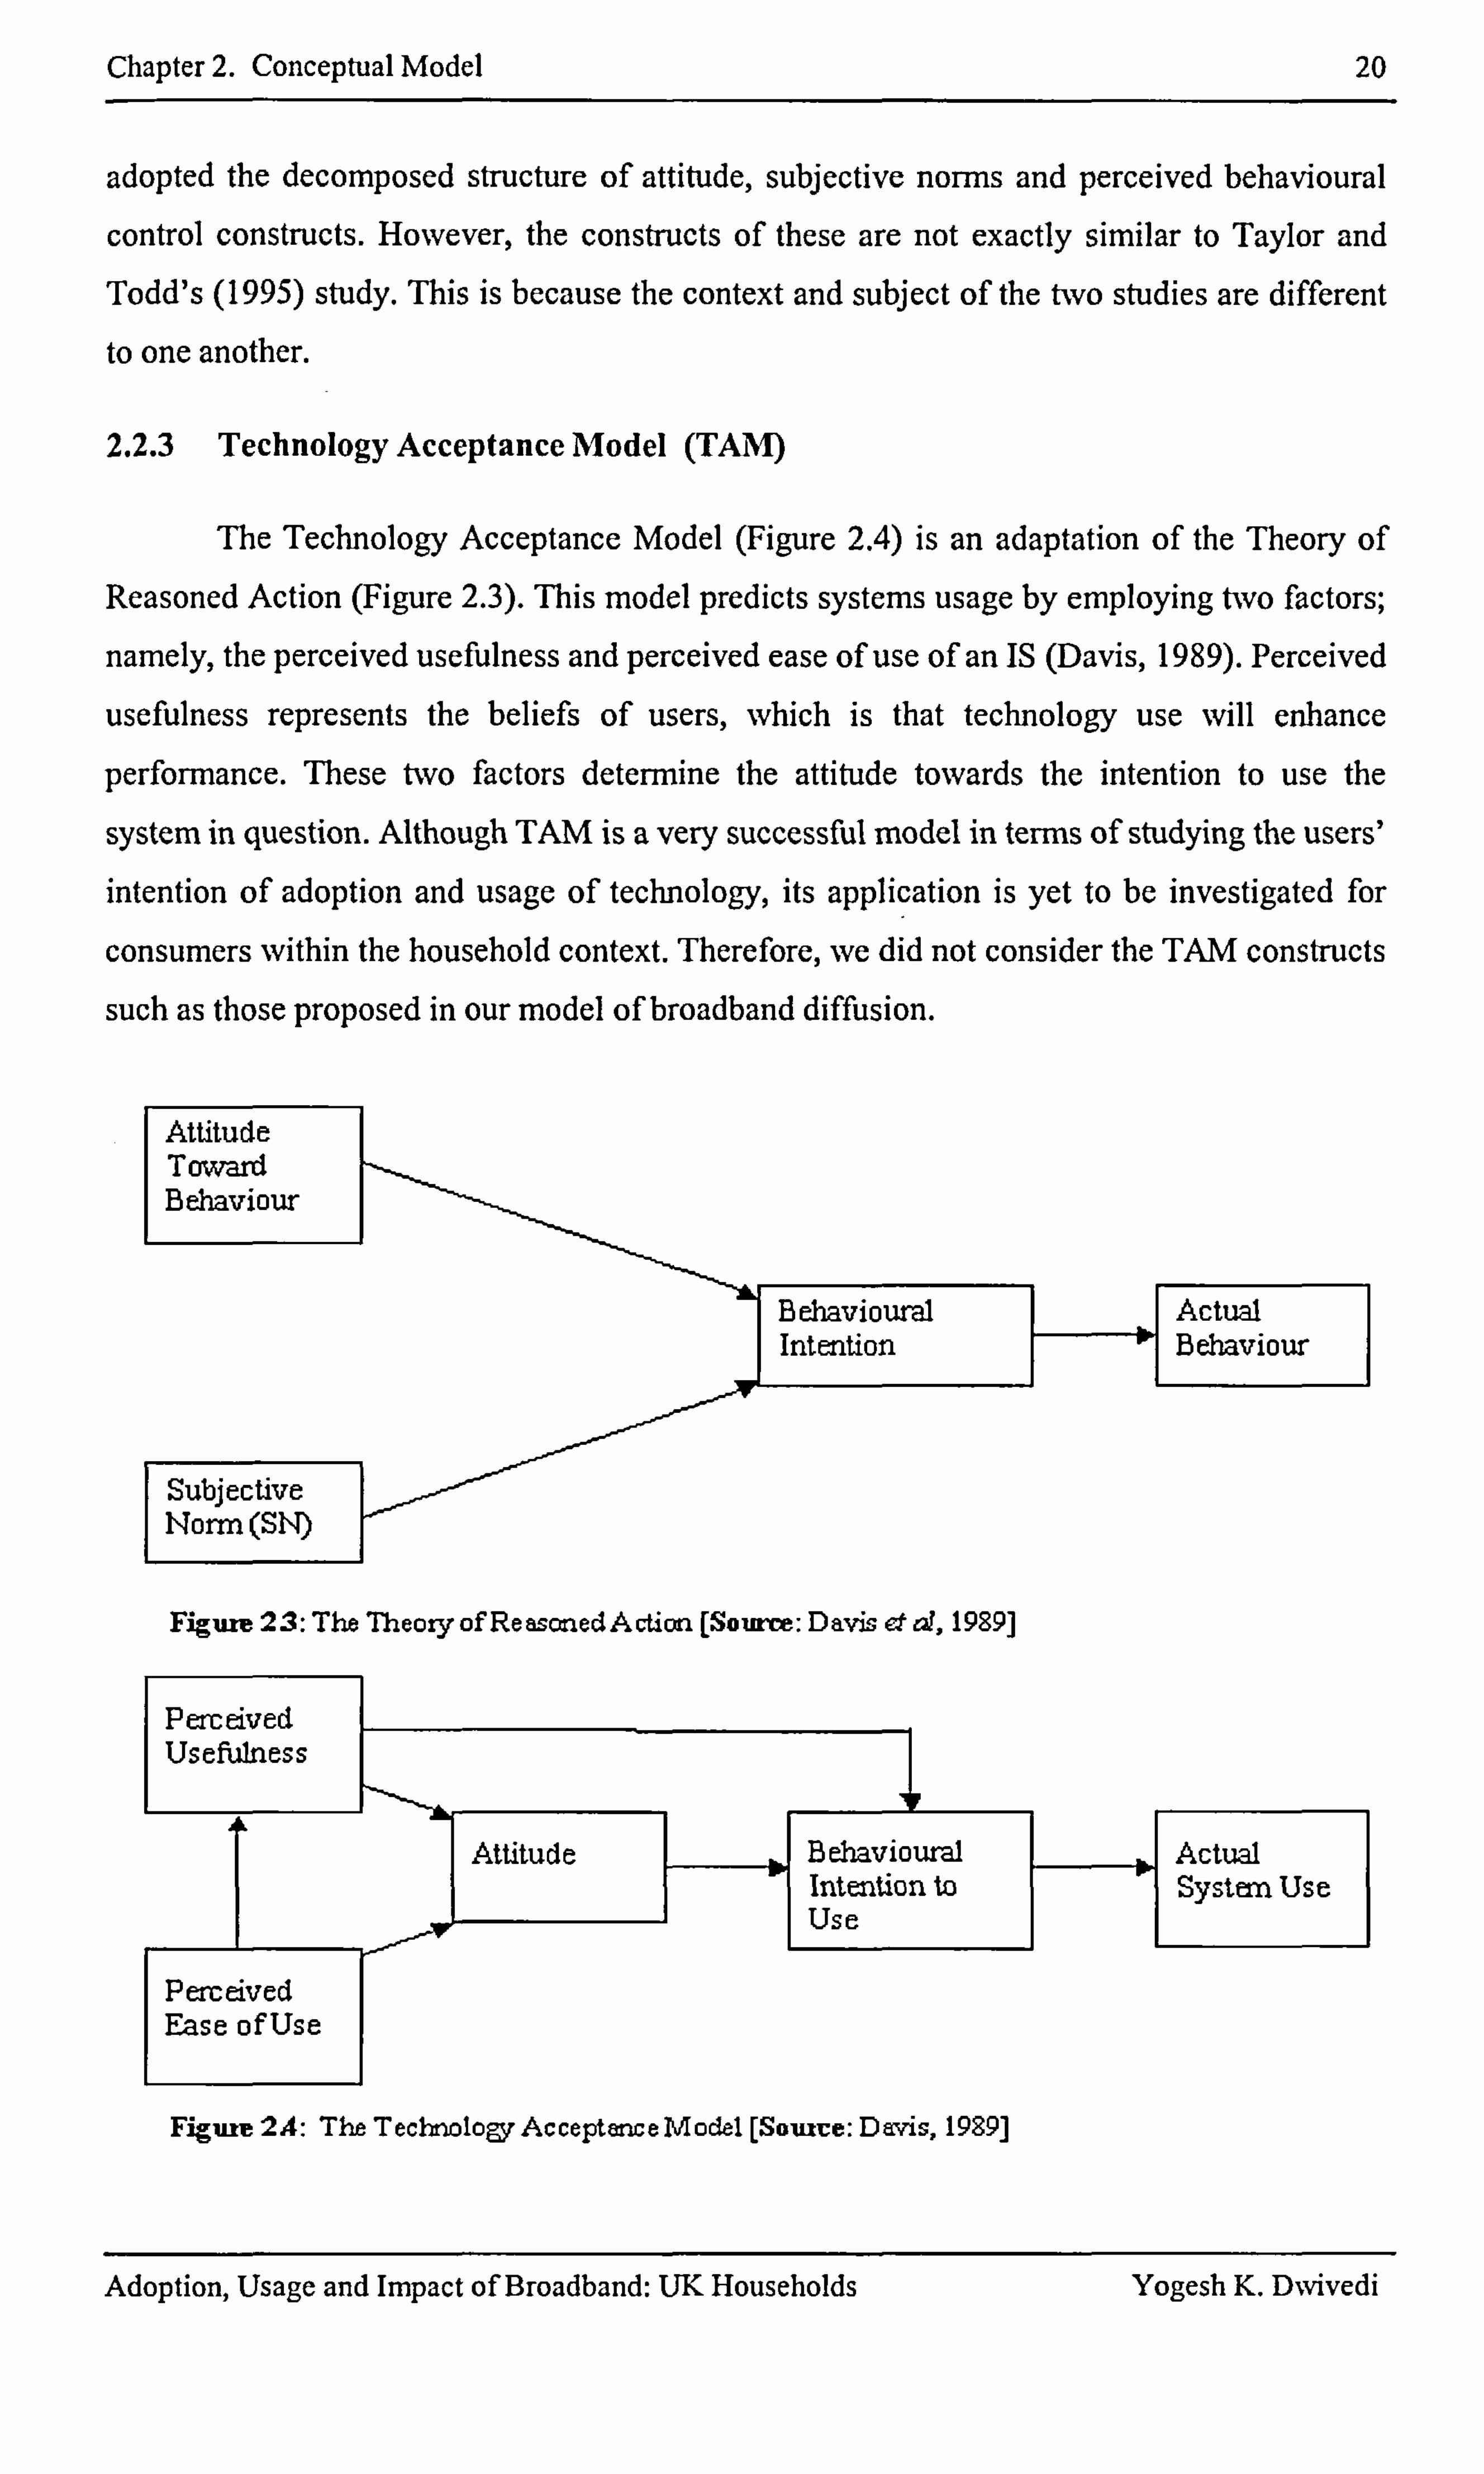
Chapter 2. Conceptual Model 20
adopted the decomposed structure of attitude, subjective norms and perceived behavioural
control constructs. However, the constructs of these are not exactly similar to Taylor and Todd's (1995) study. This is because the context and subject of the two studies are different
to one another.
2.2.3 Technology Acceptance Model (TAM)
The Technology Acceptance Model (Figure 2.4) is an adaptation of the Theory of Reasoned Action (Figure 2.3). This model predicts systems usage by employing two factors;
namely, the perceived usefulness and perceived ease of use of an IS (Davis, 1989). Perceived
usefulness represents the beliefs of users, which is that technology use will enhance
performance. These two factors determine the attitude towards the intention to use the
system in question. Although TAM is a very successful model in terms of studying the users' intention of adoption and usage of technology, its application is yet to be investigated for
consumers within the household context. Therefore, we did not consider the TAM constructs
such as those proposed in our model of broadband diffusion.
Attitude Toward Behaviour
Behavioural Actual Intention Behaviour,
Subjective I-Tonn (SH)
Figure 23: The Theory of ReasonedAction [Source: Davis eted, 1989]
Pemeived Usefulness
Attitude Behavioural Actual Intention to System Use Use
Perreived Ease of Use
Figute 2 A: The T ecbnology Ac ceptenc eM odel [Sowtue: D avis, 1989]
Adoption, Usage and Impact of Broadband: UK Households Yogesh K. DNvivedi
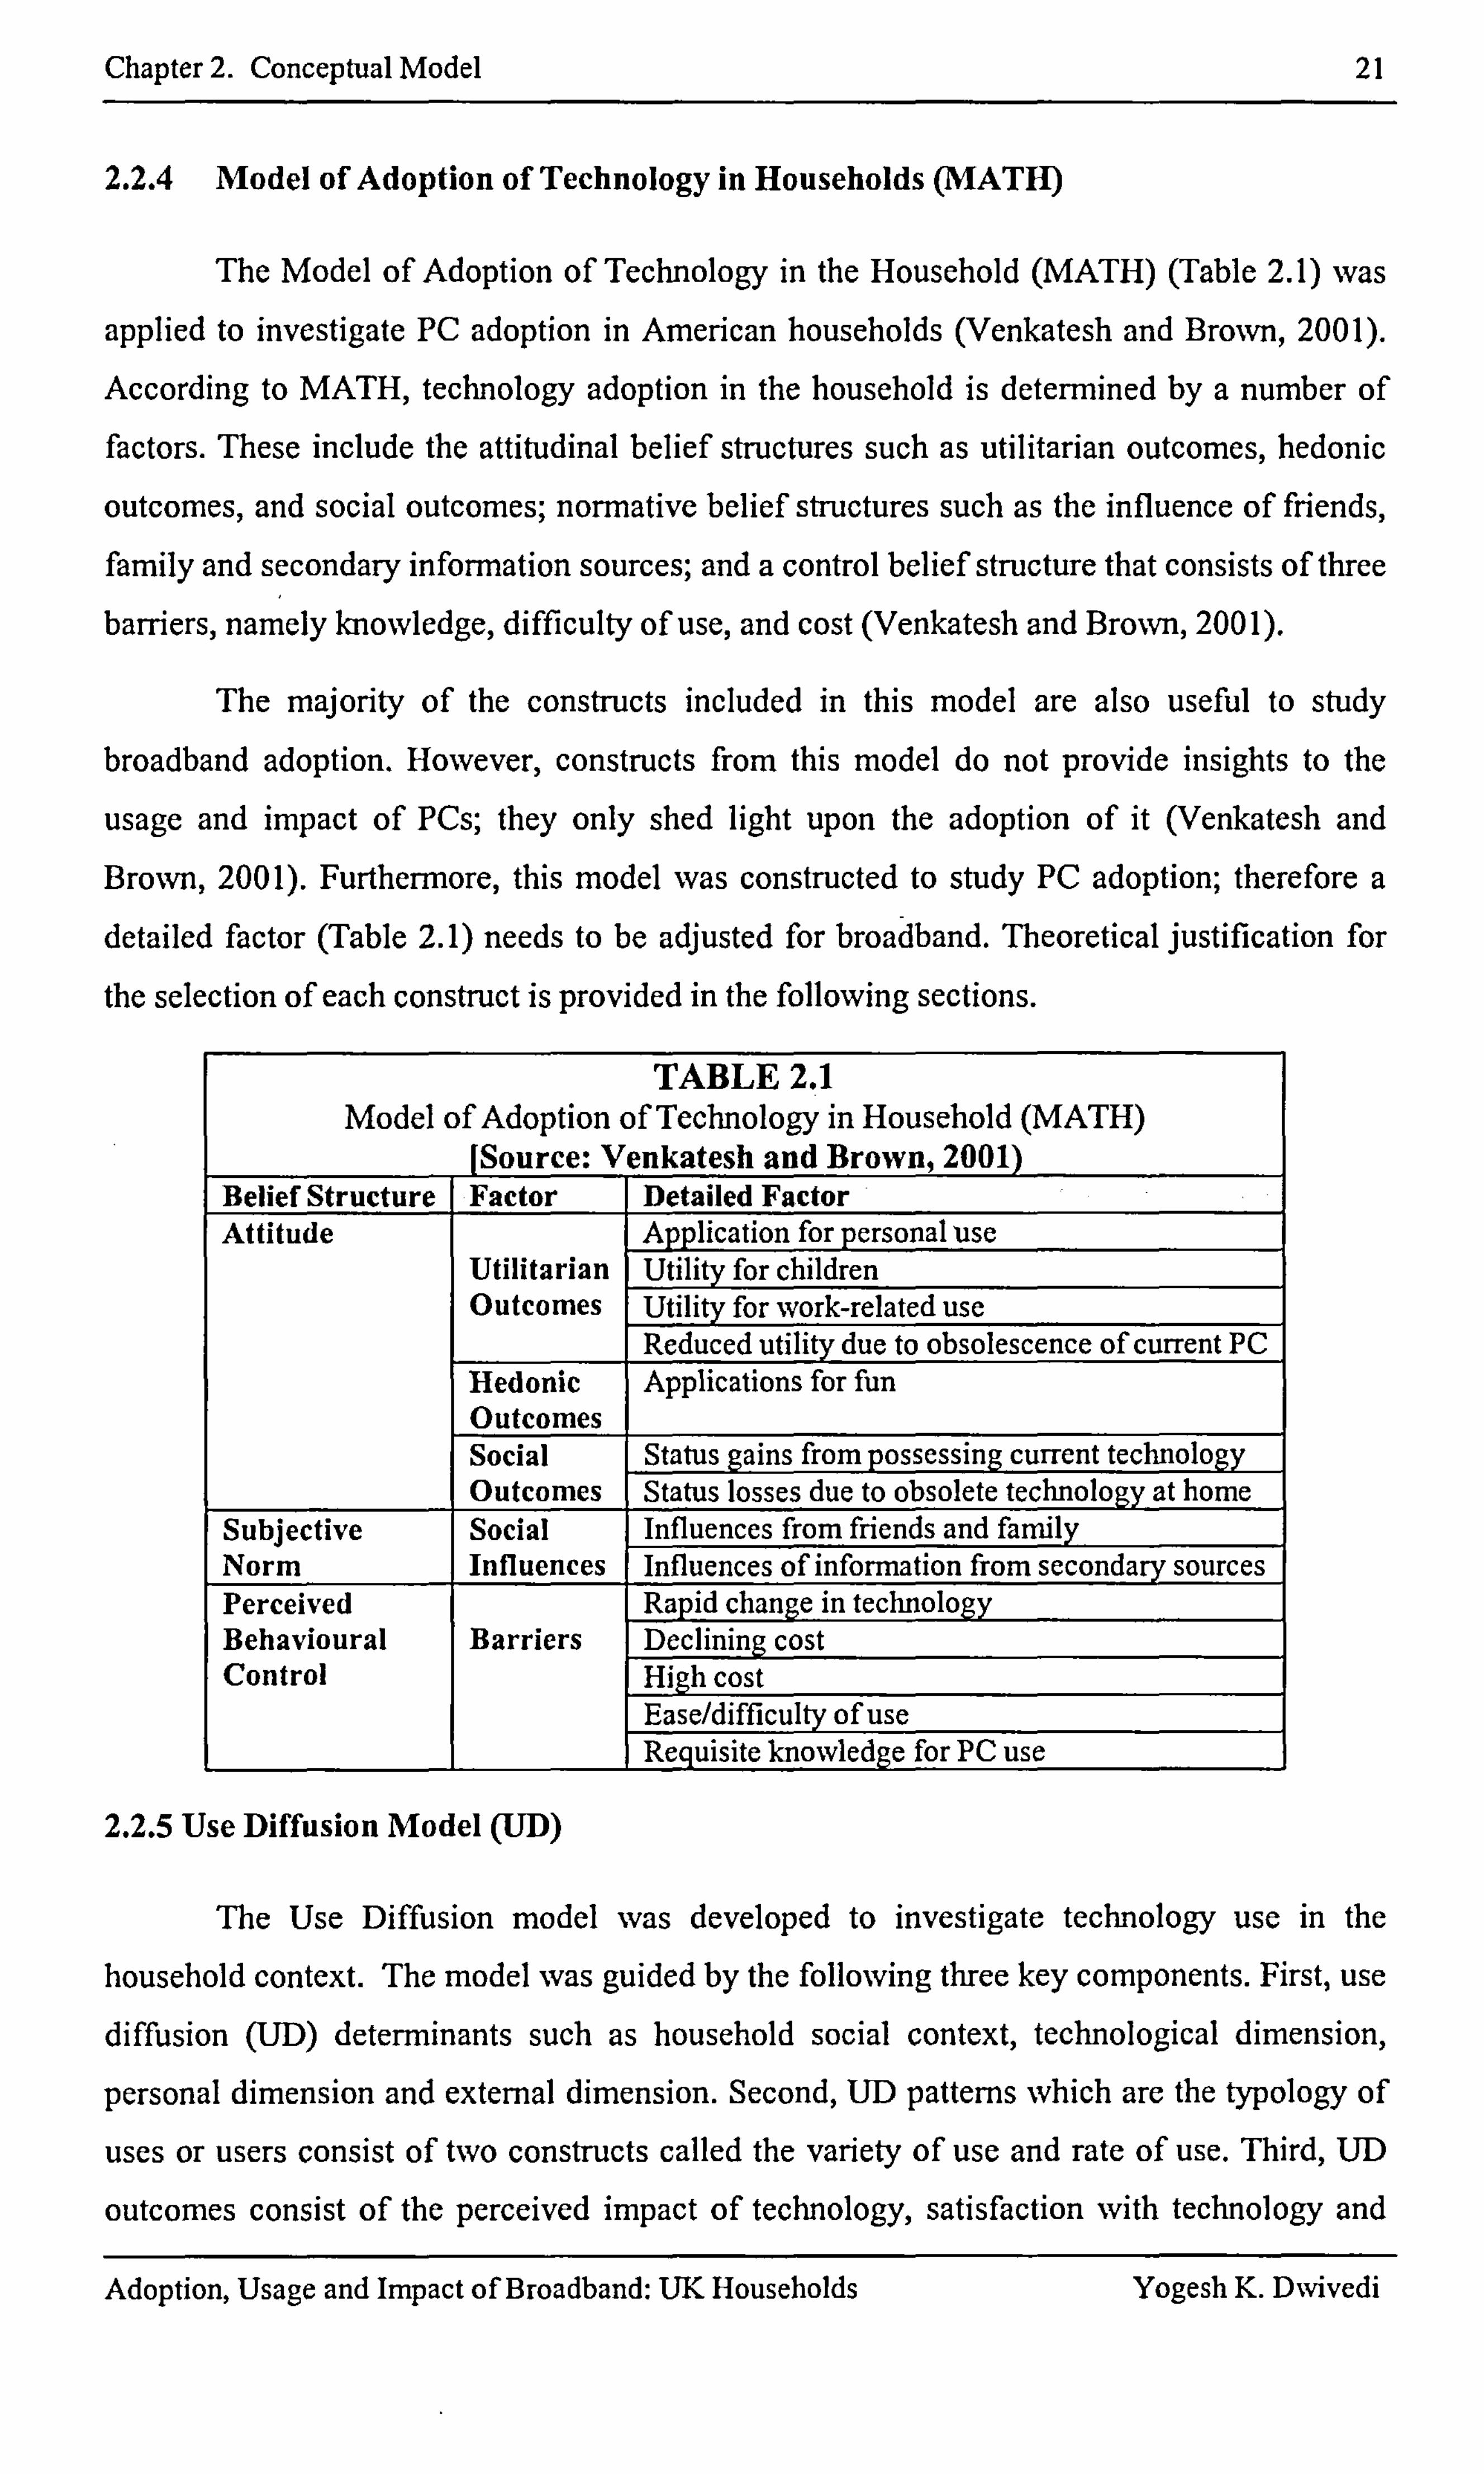
Chapter 2. Conceptual Model
2.2.4 Model of Adoption of Technology in Households (MATH)
21
The Model of Adoption of Technology in the Household (MATH) (Table 2.1) was
applied to investigate PC adoption in American households (Venkatesh and Brown, 2001).
According to MATH, technology adoption in the household is deten-nined by a number of factors. These include the attitudinal belief structures such as utilitarian outcomes, hedonic
outcomes, and social outcomes; normative belief structures such as the influence of friends,
family and secondary information sources; and a control belief structure that consists of three
barriers, namely knowledge, difficulty of use, and cost (Venkatesh and Brown, 2001).
The majority of the constructs included in this model are also useful to study broadband adoption. However, constructs from this model do not provide insights to the
usage and impact of PCs; they only shed light upon the adoption of it (Venkatesh and Brown, 2001). Furthermore, this model was constructed to study PC adoption; therefore a detailed factor (Table 2.1) needs to be adjusted for broadband. Theoretical justification for
the selection of each construct is provided in the following sections.
TABLE 2.1 Model of Adoption of Technology in Household (MATH)
[Source: Venkatesh and Brown, 2001) Belief Structure Factor Detailed Factor Attitude Application for personal use
Utilitarian Utility for children Outcomes Utility for work-related use
Reduced utility due to obsolescence of current PC Hedonic Outcomes
Applications for fun
Social Status gains from possessing current technology Outcomes Status losses due to obsolete technology at home
Subjective Social Influences from ffiends and family Norm Influences Influences of information from secondary sources Perceived Rapid change in technology Behavioural Barriers Declining cost Control High cost
Ease/difficulty of use Requisite knowledge for PC use
2.2.5 Use Diffusion Model (UD)
The Use Diffusion model was developed to investigate technology use in the
household context. The model was guided by the following three key components. First, use diffusion (UD) determinants such as household social context, technological dimension,
personal dimension and external dimension. Second, UD patterns which are the typology of
uses or users consist of two constructs called the variety of use and rate of use. Third, UD
outcomes consist of the perceived impact of technology, satisfaction with technology and
Adoption, Usage and Impact of Broadband: UK Households Yogesh K. DNvivedi
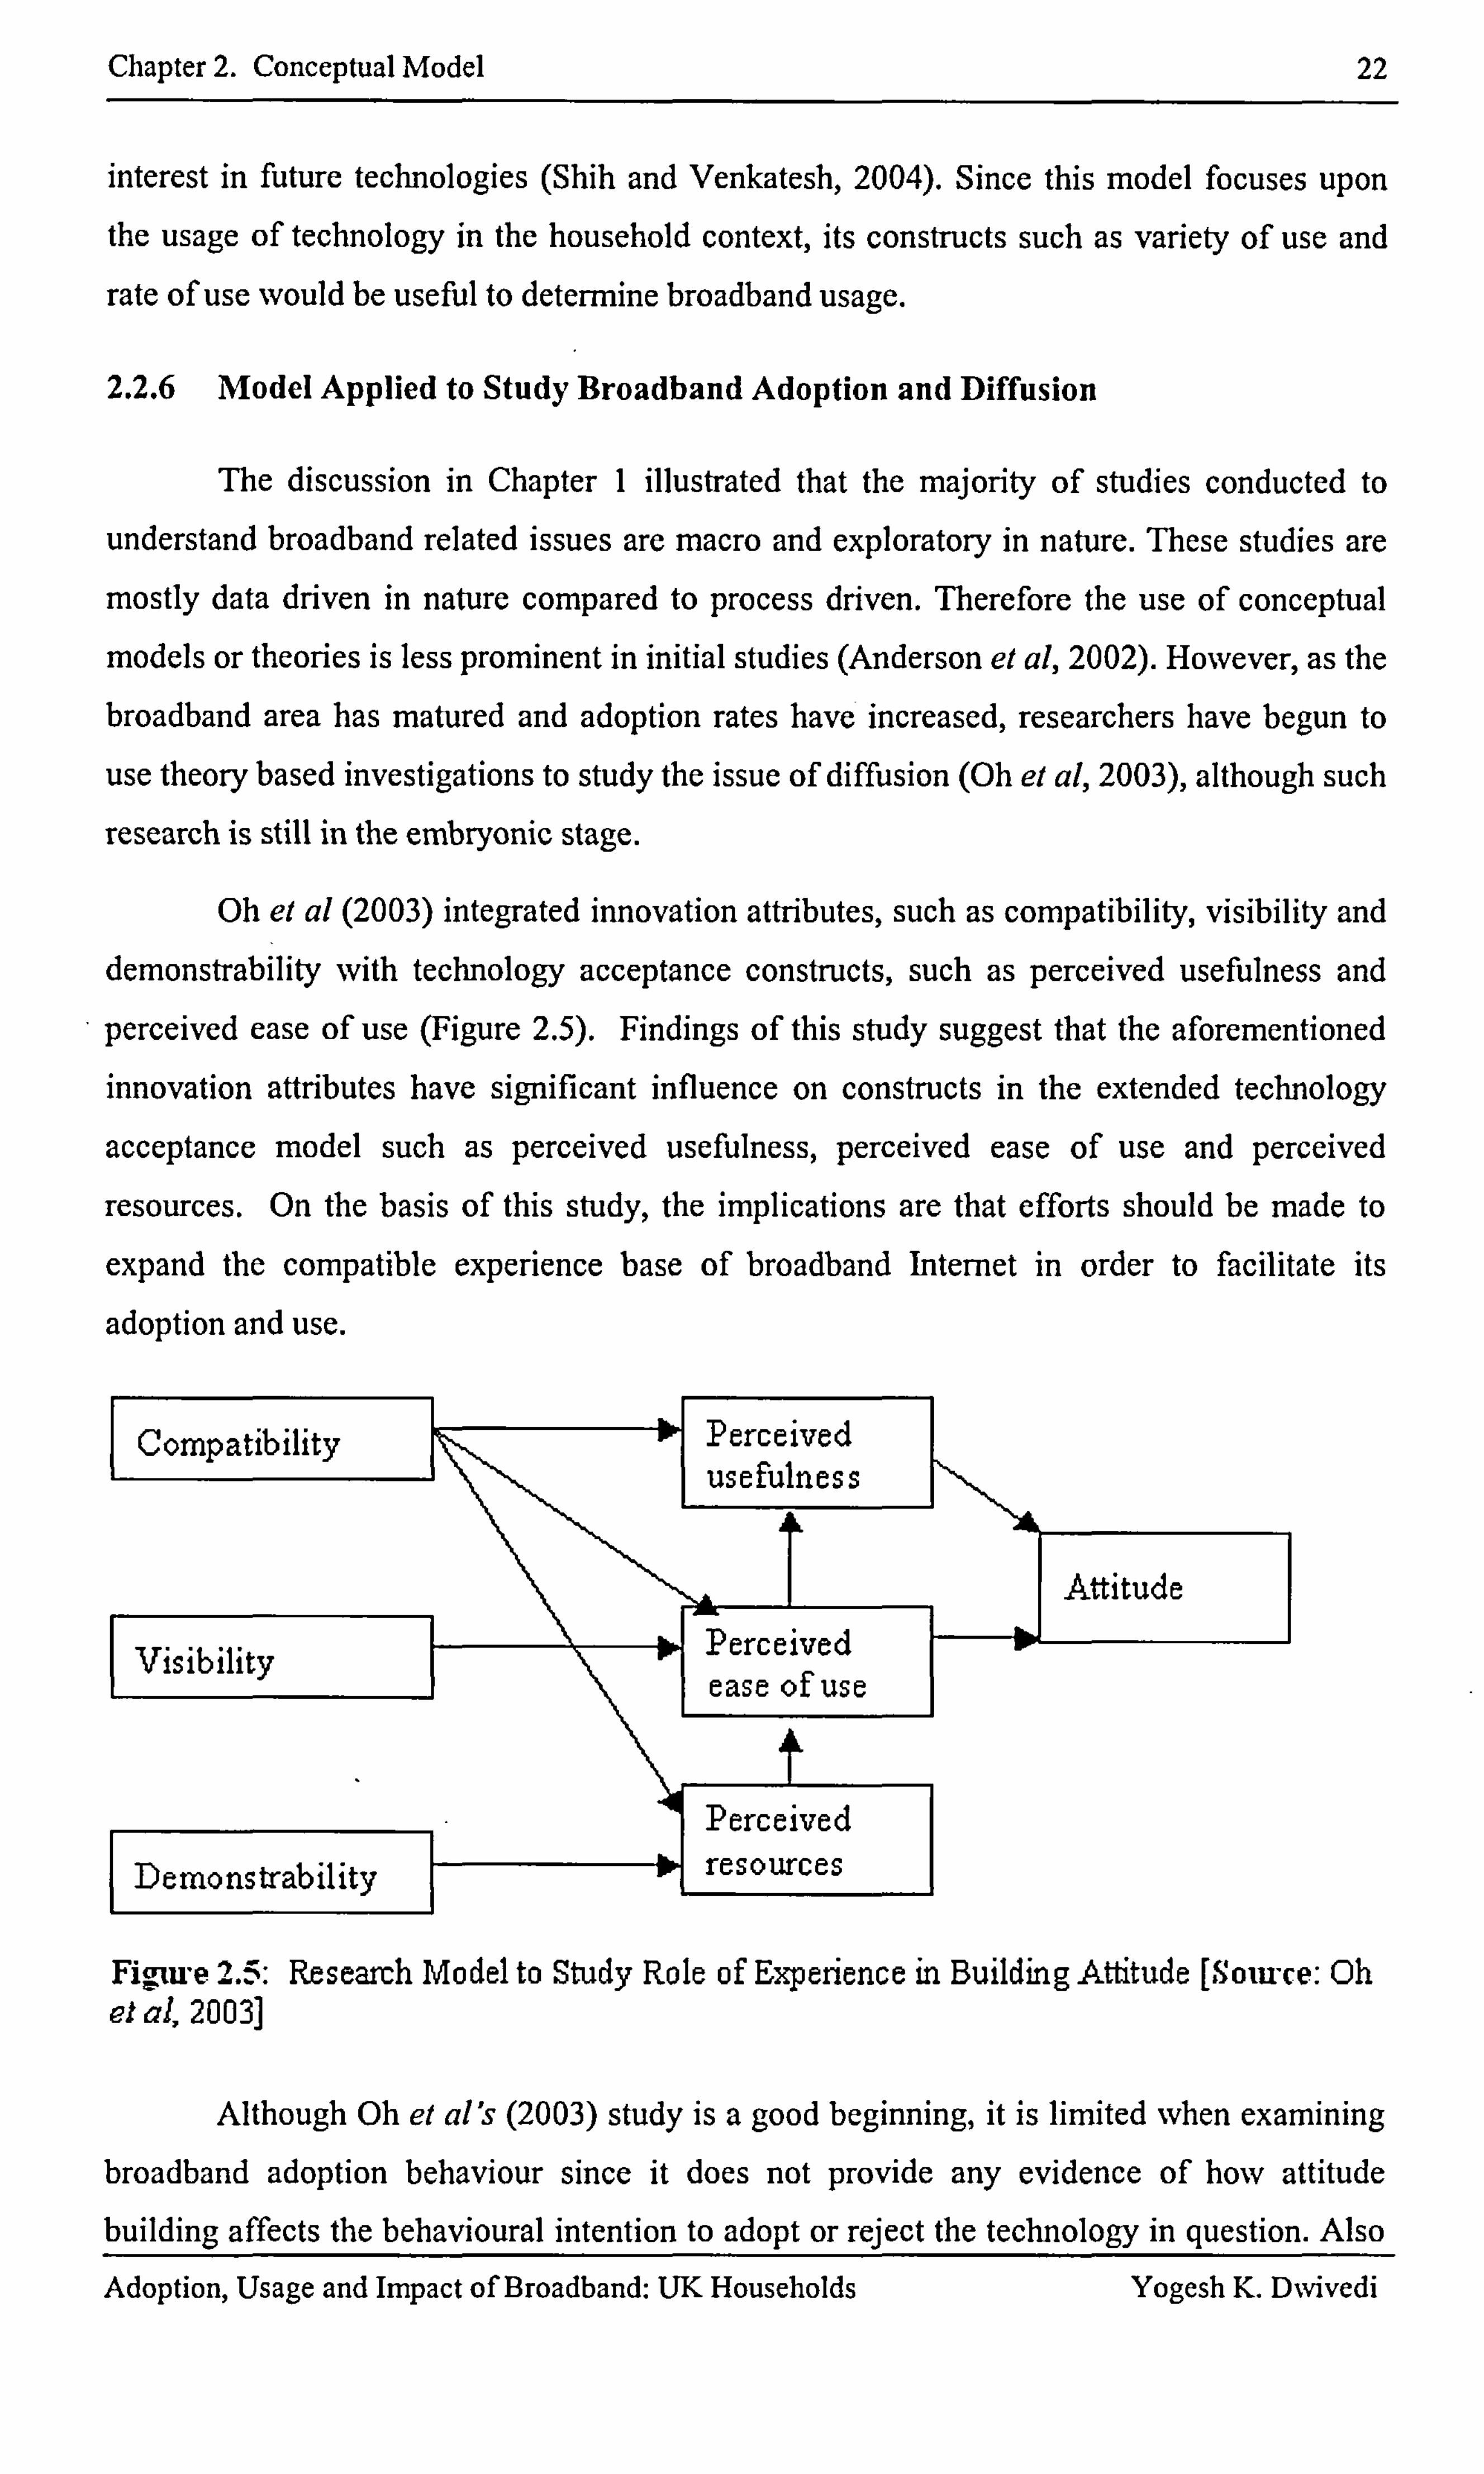
Chapter 2. Conceptual Model 22
interest in future technologies (Shih and Venkatesh, 2004). Since this model focuses upon the usage of technology in the household context, its constructs such as variety of use and
rate of use would be useful to determine broadband usage.
2.2.6 Model Applied to Study Broadband Adoption and Diffusion
The discussion in Chapter I illustrated that the majority of studies conducted to
understand broadband related issues are macro and exploratory in nature. These studies are
mostly data driven in nature compared to process driven. Therefore the use of conceptual
models or theories is less prominent in initial studies (Anderson et al, 2002). However, as the broadband area has matured and adoption rates have increased, researchers have begun to
use theory based investigations to study the issue of diffusion (Oh el al, 2003), although such
research is still in the embryonic stage.
Oh el al (2003) integrated innovation attributes, such as compatibility, visibility and demonstrability with technology acceptance constructs, such as perceived usefulness and
perceived ease of use (Figure 2.5). Findings of this study suggest that the aforementioned innovation attributes have significant influence on constructs in the extended technology
acceptance model such as perceived usefulness, perceived ease of use and perceived
resources. On the basis of this study, the implications are that efforts should be made to
expand the compatible experience base of broadband Internet in order to facilitate its
adoption and use.
Compatibility *j Perceived I usefulness
Attitude
Visibility Perceived ease of use
Perceived Demons trability resources
-
Figure 2. -. -,: Research Model to Study Role of Experience in Building Attitude [Smirce: Oh et al, 2003]
Although Oh et al's (2003) study is a good beginning, it is limited Nvhen examining broadband adoption behaviour since it does not provide any evidence of how attitude building affects the bebavioural intention to adopt or reject the technology in question. Also
Adoption, Usage and Impact of Broadband: UY, Households Yogesh K. D%vivedi
Chapter 2. Conceptual Model 23
the study examined the users of broadband rather than the consumers; therefore the findings
are weak as they are only limited to the drivers and inhibitors of broadband adoption. This
study identified the following two important limitations: first, the research model did not
consider behaviour or behavioural intention constructs; second, the selection and use of
statistical tools of data collection (Oh et al, 2003). Consequently, a study that will be a
refinement of the research model and use of rigorous statistical tools and hypothesis testing
were recommended (Oh et al, 2003).
Review of the aforementioned technology adoption, diffusion theories and models
suggest that MATH is the most appropriate and closest model to the context (i. e. technology
adoption in the household consumer) of this current study. MATH itself is based on the
principle of TPB and DTPB, and is composed of constructs particularly suited to evaluate the
usefulness of technology for household purposes. Therefore, MATH, TPB and DT? B will be
utilised as a guiding framework for developing a conceptual model that examines the
behavioural intention to adopt broadband and actual broadband adoption and non-adoption. The Diffusion of Innovations theory suggests that socio-economic determinants such as age,
gender, income, education and occupation should be included within a study such as this.
This allows a distinction to be drawn between the broadband adopters and non-adopters. The
aforementioned review also suggests the appropriateness of the use of the diffusion model to
study usage and the impact of the broadband within the household context. Considering the
limitations of the previously examined constructs for broadband adoption (Oh et al, 2003),
the current study proposes to include the constructs, which are important to understand, not
only towards building attitudes towards adoption, but also the behavioural intention to adopt broadband, its relationship with the actual adoption, sustained adoption, usage and impact. In
other words, the conceptual model proposed in the following sections provides a holistic
view of broadband diffusion in the household context.
2.3 FOUNDATIONS OF THE PROPOSED CONCEPTUAL MODEL
Before describing the development of the proposed conceptual model for broadband
adoption, usage and impact, this section briefly discusses the underlying reasons for
considering a guiding theory and model as a foundation for the proposed conceptual model.
Taylor and Todd (1995) identified two main criteria Nvhen selecting an appropriate
model. First, a model that provides good predictions while using the fewest predictors is
preferable; in other words, it is more parsimonious (Bagozzi, 1992; Taylor and Todd, 1995).
Second, the model should provide reasonable predictive ability and should also contribute
enough in providing an understanding of the phenomenon under investigation (Taylor and Adoption, Usage and Impact of Broadband: UK Households Yogesh K. D%vivedi
Chapter 2. Conceptual Model 24
Todd, 1995). Since a broadband diffusion study requires both predictive ability (in the case of adoption) and a contribution to understanding (in the case of usage and impact), the
second criteria was adopted when developing the conceptual model. At a conceptual level,
the constructs from the various models were included, which may in the future provide insights to an understanding of all the three stages of diffusion. However, after validation of these constructs, to maintain parsimony of the explanatory model the less significant
constructs will be eliminated.
Section 2.2 described a number of related theories and models (such as TRA, TPB,
DTPB, Diffusion of Innovations and TAM) that are widely applied to study technology
adoption from the individual or user's perspectives. However, it was also leamt that their
application is limited to study technology adoption from the household perspective (Venkatesh and Brown, 2001). As was already discussed (section 2.2.4), only the MATH
model was successfully applied in the household context in order to examine PC adoption in
the United States (Venkatesh and Brown, 2001). Therefore, as the household consumer is
also the context of this research, MATH was utilised.
The above discussion suggests the appropriateness of TPB, DTPB and MATH to
study technology adoption issues from the perspective of the household context. Therefore
the conceptual model of broadband adoption (MBA) is an adaptation of MATH (Venkatesh
and Brown, 2001) and is based on DTPB (Taylor and Todd, 1995) and TPB (Ajzen, 1985;
1991).
Consistent with TPB, the proposed model of broadband adoption consists of three
predictor types, namely attitudinal, normative and control and dependent variables that include behavioural intention (BI) and adoption behaviour. Also the relationship between the dependent and independent variables is hypothesised according to TPB. This is because TPB
is a generalised theory and can be applied to a wide variety of contexts for predicting the
adoption of different types of IT. Its major constructs reflect the key variables that have been
identified as influential in previous implementation research and are flexible enough to
subsume situation-specific factors (Benbasat and Zmud, 1999). Therefore, it is considered to be a basic guiding theory for this research. However, TPB does not suggest breaking each of the predictor categories in more than one factor (Taylor and Todd, 1995); therefore it limits
the researcher's ability to differentiate between the smaller factors within each category.
DTPB,, which is a variance of TPB, allows researchers to decompose the attitudinal,
normative and control categories to better understand the reasons of adoption and non-
Adoption, Usage and Impact of Broadband: UK Households Yogesh K. DNvivedi
Chapter 2. Conceptual Model 25
adoption (Taylor and Todd, 1995). Therefore, the decomposed belief structure for household
broadband adoption model is consistent with the DTPB.
Since MATH is directly focused upon investigating technology adoption from the
household perspective, the majority of the detailed constructs for attitudinal, normative and
control categories are adapted from it (Venkatesh and Browns, 2001). At this point, this
research will state why MATH in the original form is not employed to study broadband
adoption. An adaptation of MATH was essential because the research objects of the two
studies are dissimilar in nature. The research object of MATH was a PC, but for this study it
is broadband. These two technologies are not similar in characteristics. Therefore MATH
was subjected to the following modifications before it was applied for the examination of I broadband adoption.
First, broadband has clear advantages over its predecessor narrowband. Therefore it
was felt important to examine the influences that are -triggered by the advantages that
broadband offers (such as faster access, always-on access, faster download, un-metered
access and free home phone line) over narrowband. Roger (1995) suggested the 'relative
advantage' ten-n for the perceived advantage of having a new technology over its'
predecessor. Taylor and Todd (1995) included the relative advantage attribute of Rogers'
Diffusion of Innovation theory as an attitudinal construct to study the adoption of
technology. Consistent with Taylor and Todd's (1995) model, this research also included
relative advantage as an attitudinal construct.
Second, this research's model also included service quality as an attitudinal
construct to evaluate a consumer's favourable or unfavourable perception of service quality. That is, a consumer could determine the quality of service being received from his/her
current service provider and how that issue influences him/her to stay with the same provider in the long term or to switch to a new provider. This construct was not included in MATH.
A PC (i. e. hardware) is a product that either does not require a seller to provide a consistent
service after a product is sold off or it does so to a minimal degree, and this could be a
possible reason for not including 'service quality' in MATH.
Third, MATH considered only one construct 'Social Influence' within the nonnative
category. But in the proposed model, social influence is differentiated by two types of influences, which are 'primary social influence' and 'secondary social influence'. This is
consistent with Taylor and Todd's approach. The reason for the differentiation is due to the
type of influence exerted by the two being different in nature; hence, the triggered influence
is different and expected to have an impact on the various stages of adoption. Primary social
Adoption, Usage and Impact of Broadband: UK Households Yogesh K. DNvivedi
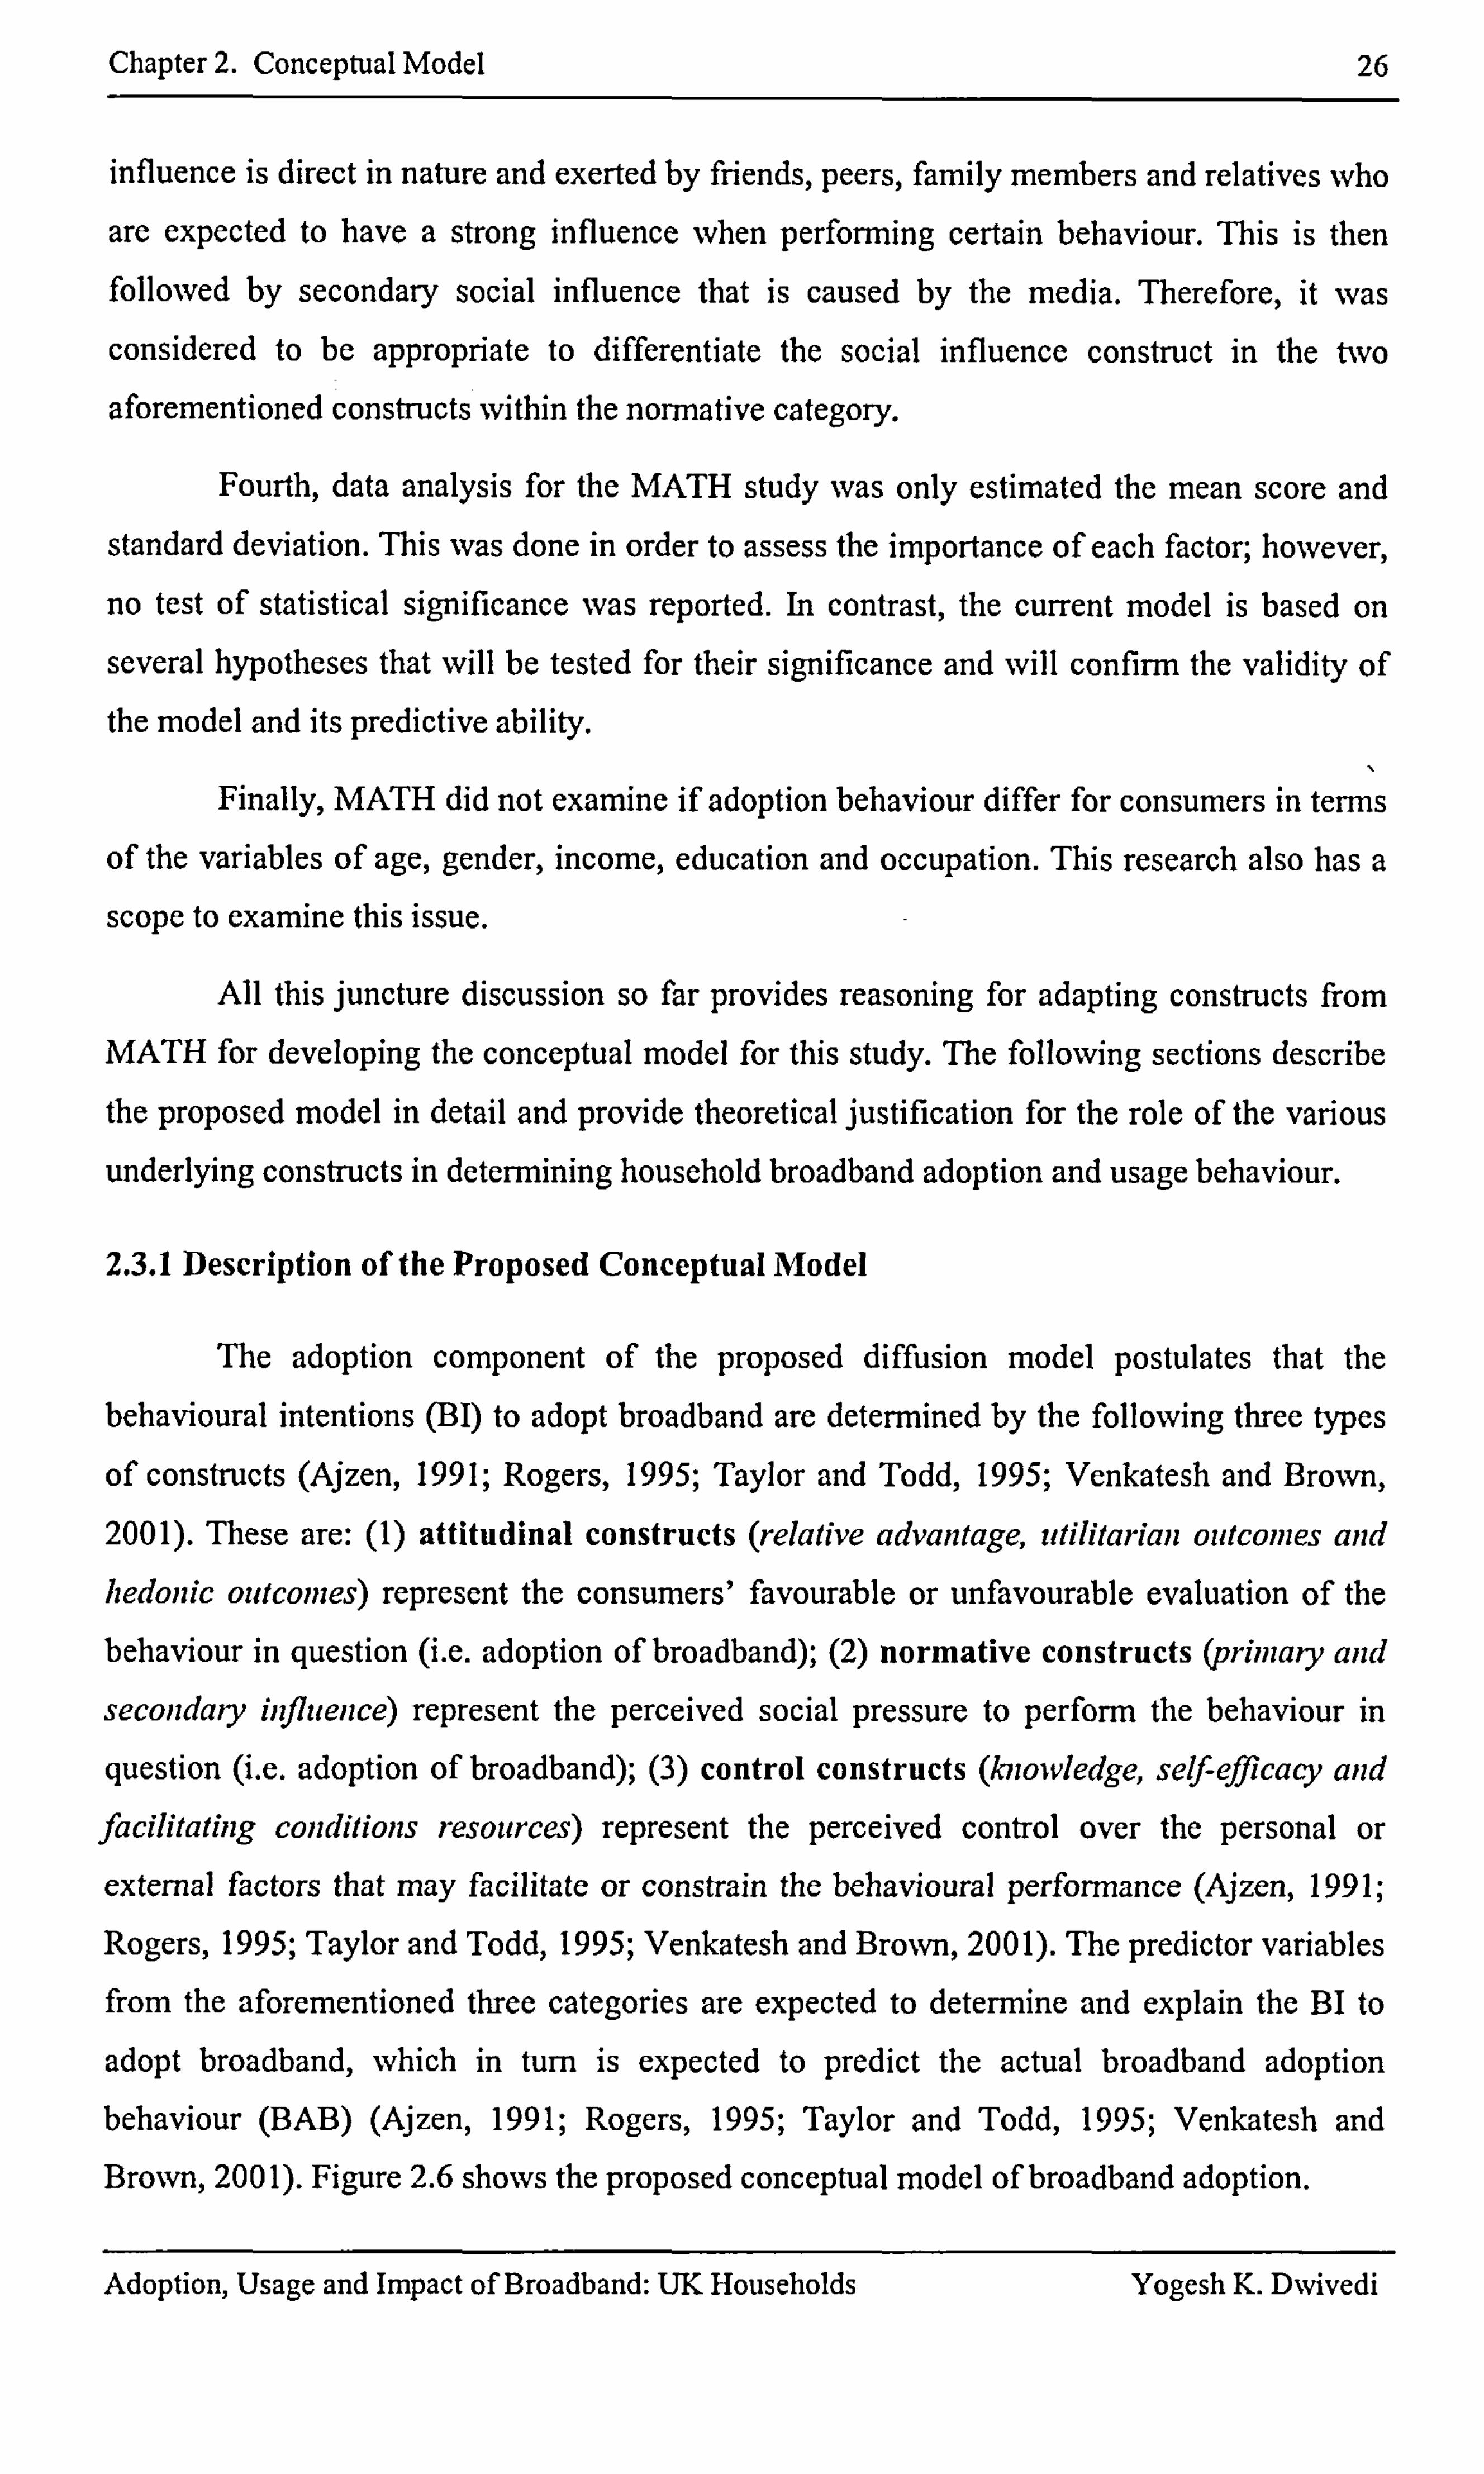
Chapter 2. Conceptual Model 26
influence is direct in nature and exerted by friends, peers, family members and relatives who
are expected to have a strong influence when performing certain behaviour. This is then followed by secondary social influence that is caused by the media. Therefore, it was
considered to be appropriate to differentiate the social influence construct in the two
aforementioned constructs within the normative category.
Fourth, data analysis for the MATH study was only estimated the mean score and
standard deviation. This was done in order to assess the importance of each factor; however,
no test of statistical significance was reported. In contrast, the current model is based on
several hypotheses that will be tested for their significance and will confirm the validity of the model and its predictive ability.
Finally, MATH did not examine if adoption behaviour differ for consumers in terms
of the variables of age, gender, income, education and occupation. This research also has a
scope to examine this issue.
All this juncture discussion so far provides reasoning for adapting constructs from
MATH for developing the conceptual model for this study. The following sections describe
the proposed model in detail and provide theoretical justification for the role of the various
underlying constructs in determining household broadband adoption and usage behaviour.
2.3.1 Description of the Proposed Conceptual Model
The adoption component of the proposed diffusion model postulates that the behavioural intentions (BI) to adopt broadband are determined by the following three types
of constructs (Ajzen, 1991; Rogers, 1995; Taylor and Todd, 1995; Venkatesh and Brown,
2001). These are: (1) attitudinal constructs (relative advantage, utilitarian outcomes and hedonic outconzes) represent the consumers' favourable or unfavourable evaluation of the behaviour in question (i. e. adoption of broadband); (2) normative constructs (primary and
secondary influence) represent the perceived social pressure to perform the behaviour in
question (i. e. adoption of broadband); (3) control constructs (knowledge, setf-effilcacy and facilitating conditions resources) represent the perceived control over the personal or
external factors that may facilitate or constrain the behavioural performance (Ajzen, 1991;
Rogers, 1995; Taylor and Todd, 1995; Venkatesh and Brown, 2001). The predictor variables from the aforementioned three categories are expected to determine and explain the BI to
adopt broadband, which in turn is expected to predict the actual broadband adoption behaviour (BAB) (Ajzen, 1991; Rogers, 1995; Taylor and Todd, 1995; Venkatesh and Brown, 200 1). Figure 2.6 shows the proposed conceptual model of broadband adoption.
Adoption, Usage and Impact of Broadband: UK Households Yogesh K. DNvivedi
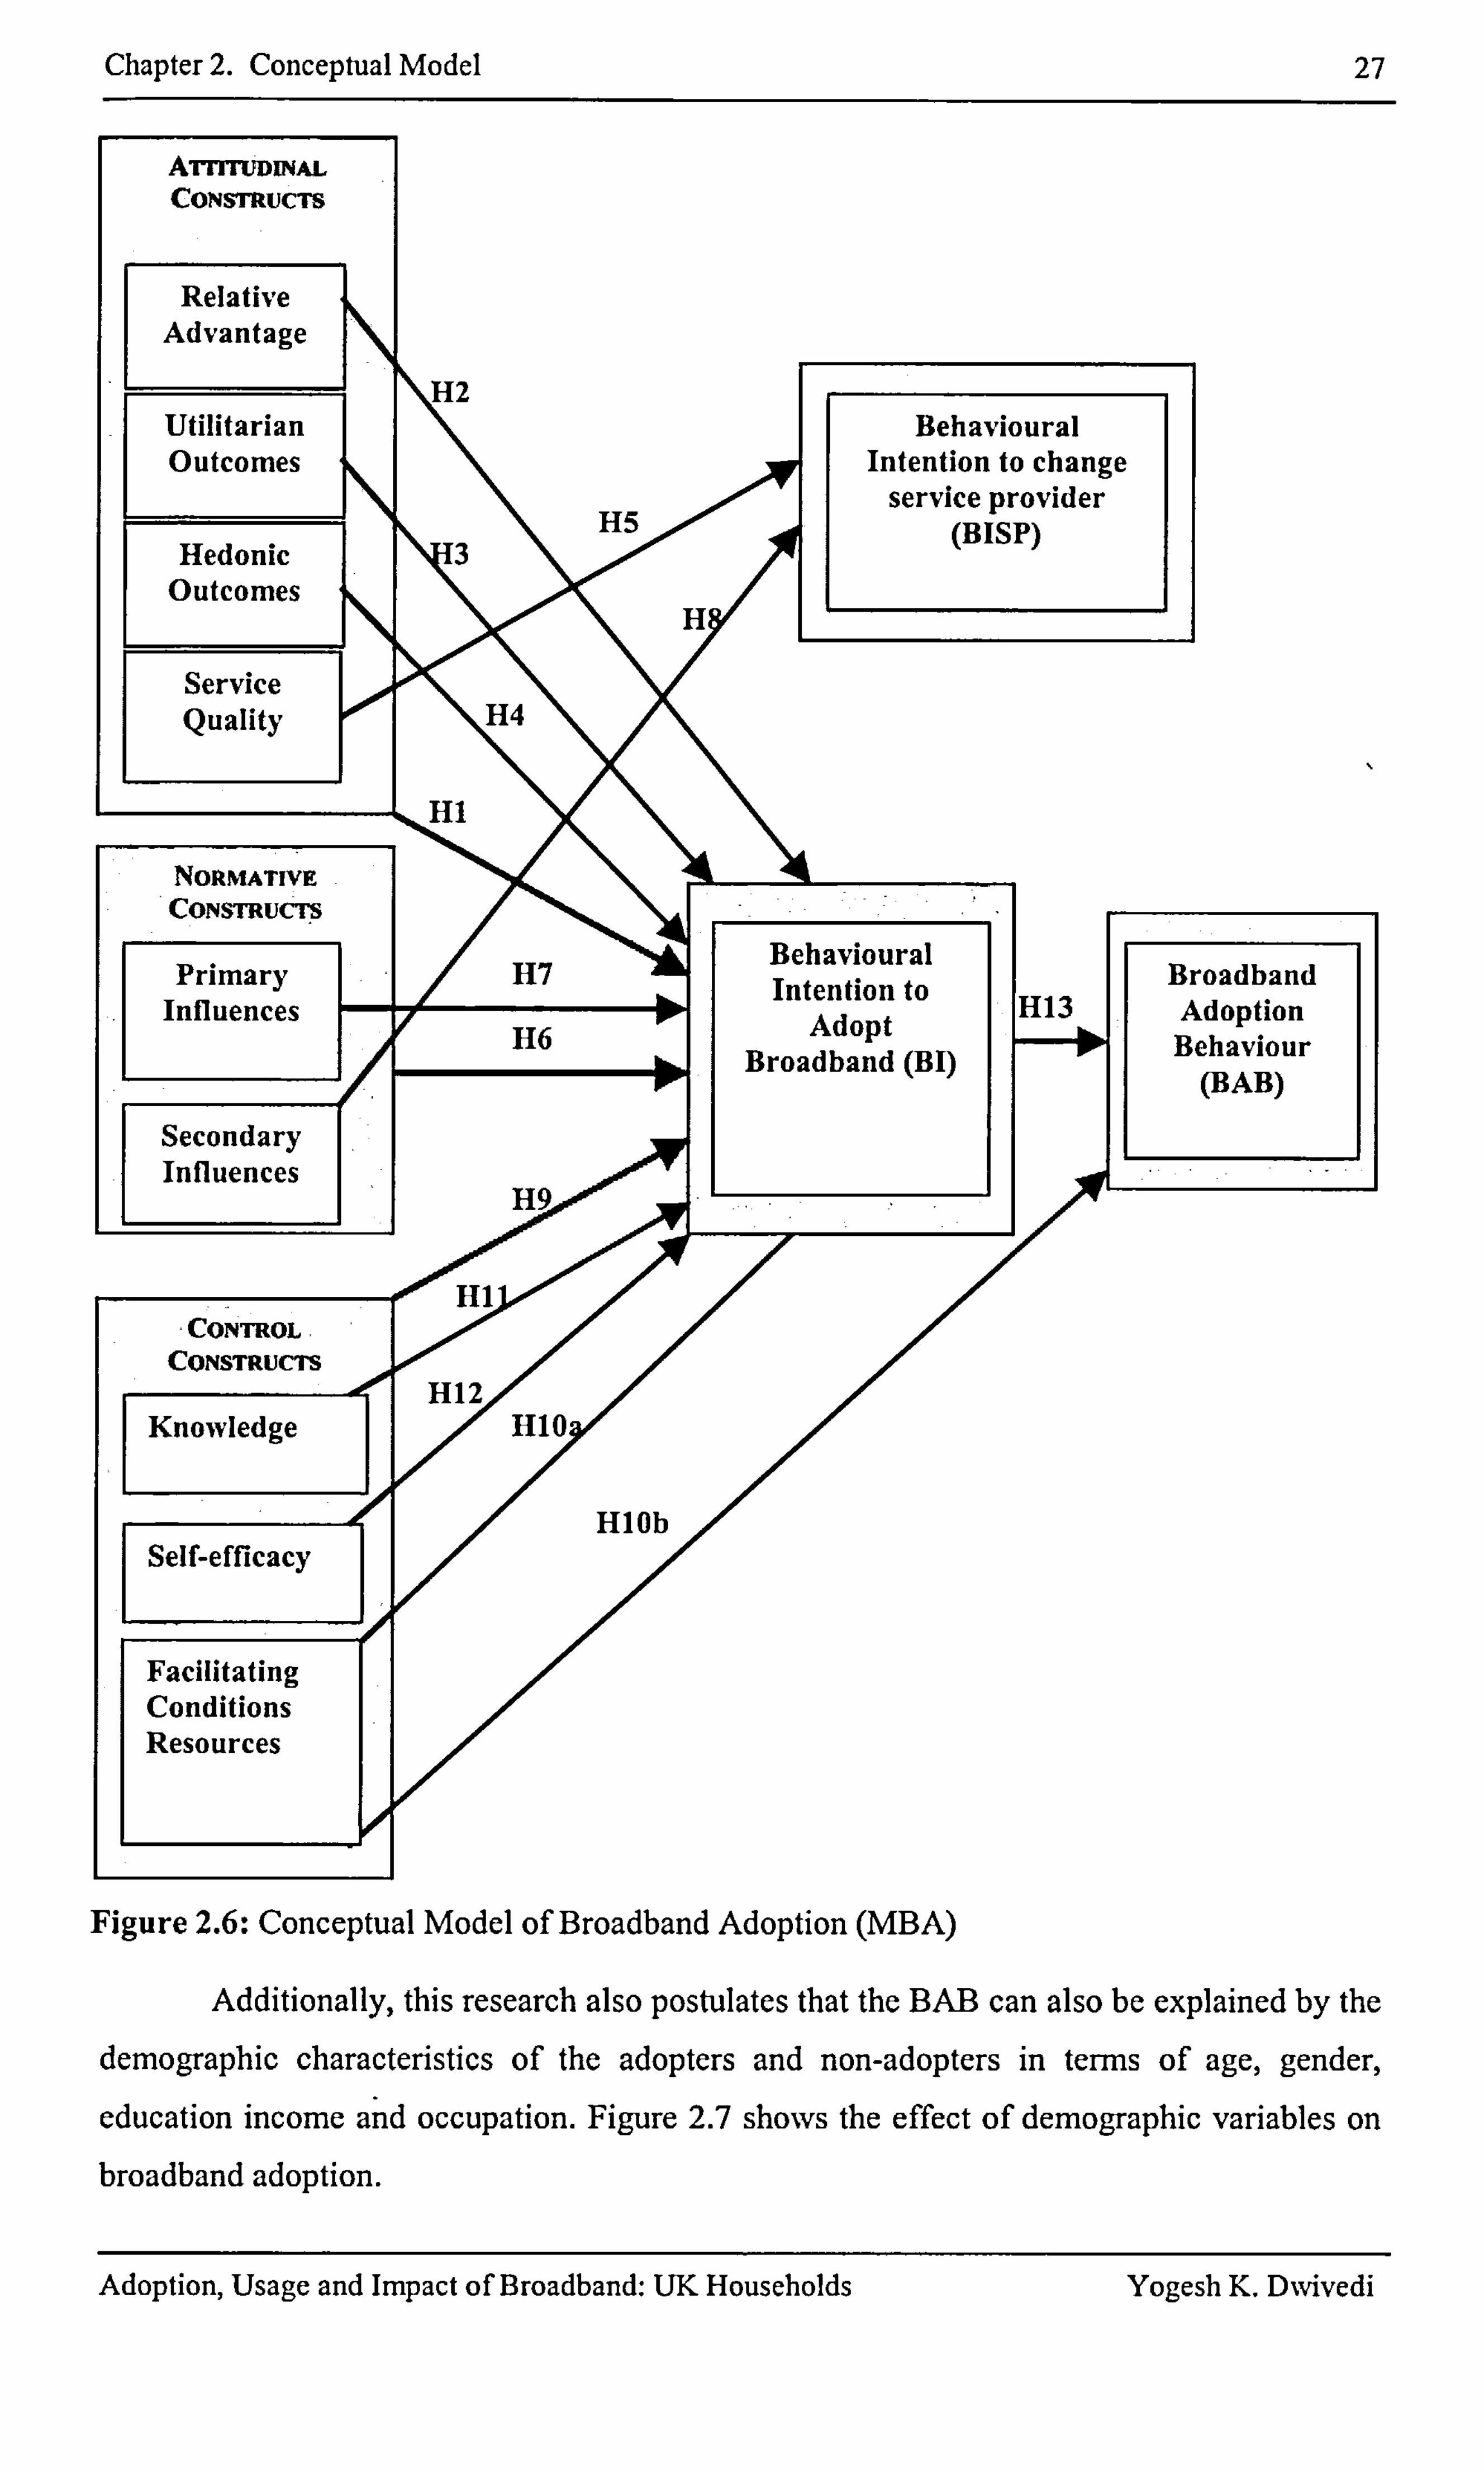
Chapter 2. Conceptual Model
ATTTruDiNAL CONSTRUCTS
Relative Advantage
Utilitarian Outcomes
Hedonic Outcomes
Service Quality
NORMATIVE CONSTRUCT. S
Primary H7
H6
Secondary Influences
'CONTROL CONSTRUCTS
Knowledge
Self-efficacy
Facilitating Conditions Resources
H5
HlOb
Behavioural Intention to change
service provider (BISP)
Behavioural Intention to
Adopt Broadband (BI)
Figure 2.6: Conceptual Model of Broadband Adoption (MBA)
27
Broadband Adoption Behaviour
(BAB)
Additionally, this research also postulates that the BAB can also be explained by the demographic characteristics of the adopters and non-adopters in terms of age, gender,
education income and occupation. Figure 2.7 shows the effect of demographic variables on broadband adoption.
llxi_li
Adoption, Usage and Impact of Broadband: UK Households Yogesh K. Divivedi
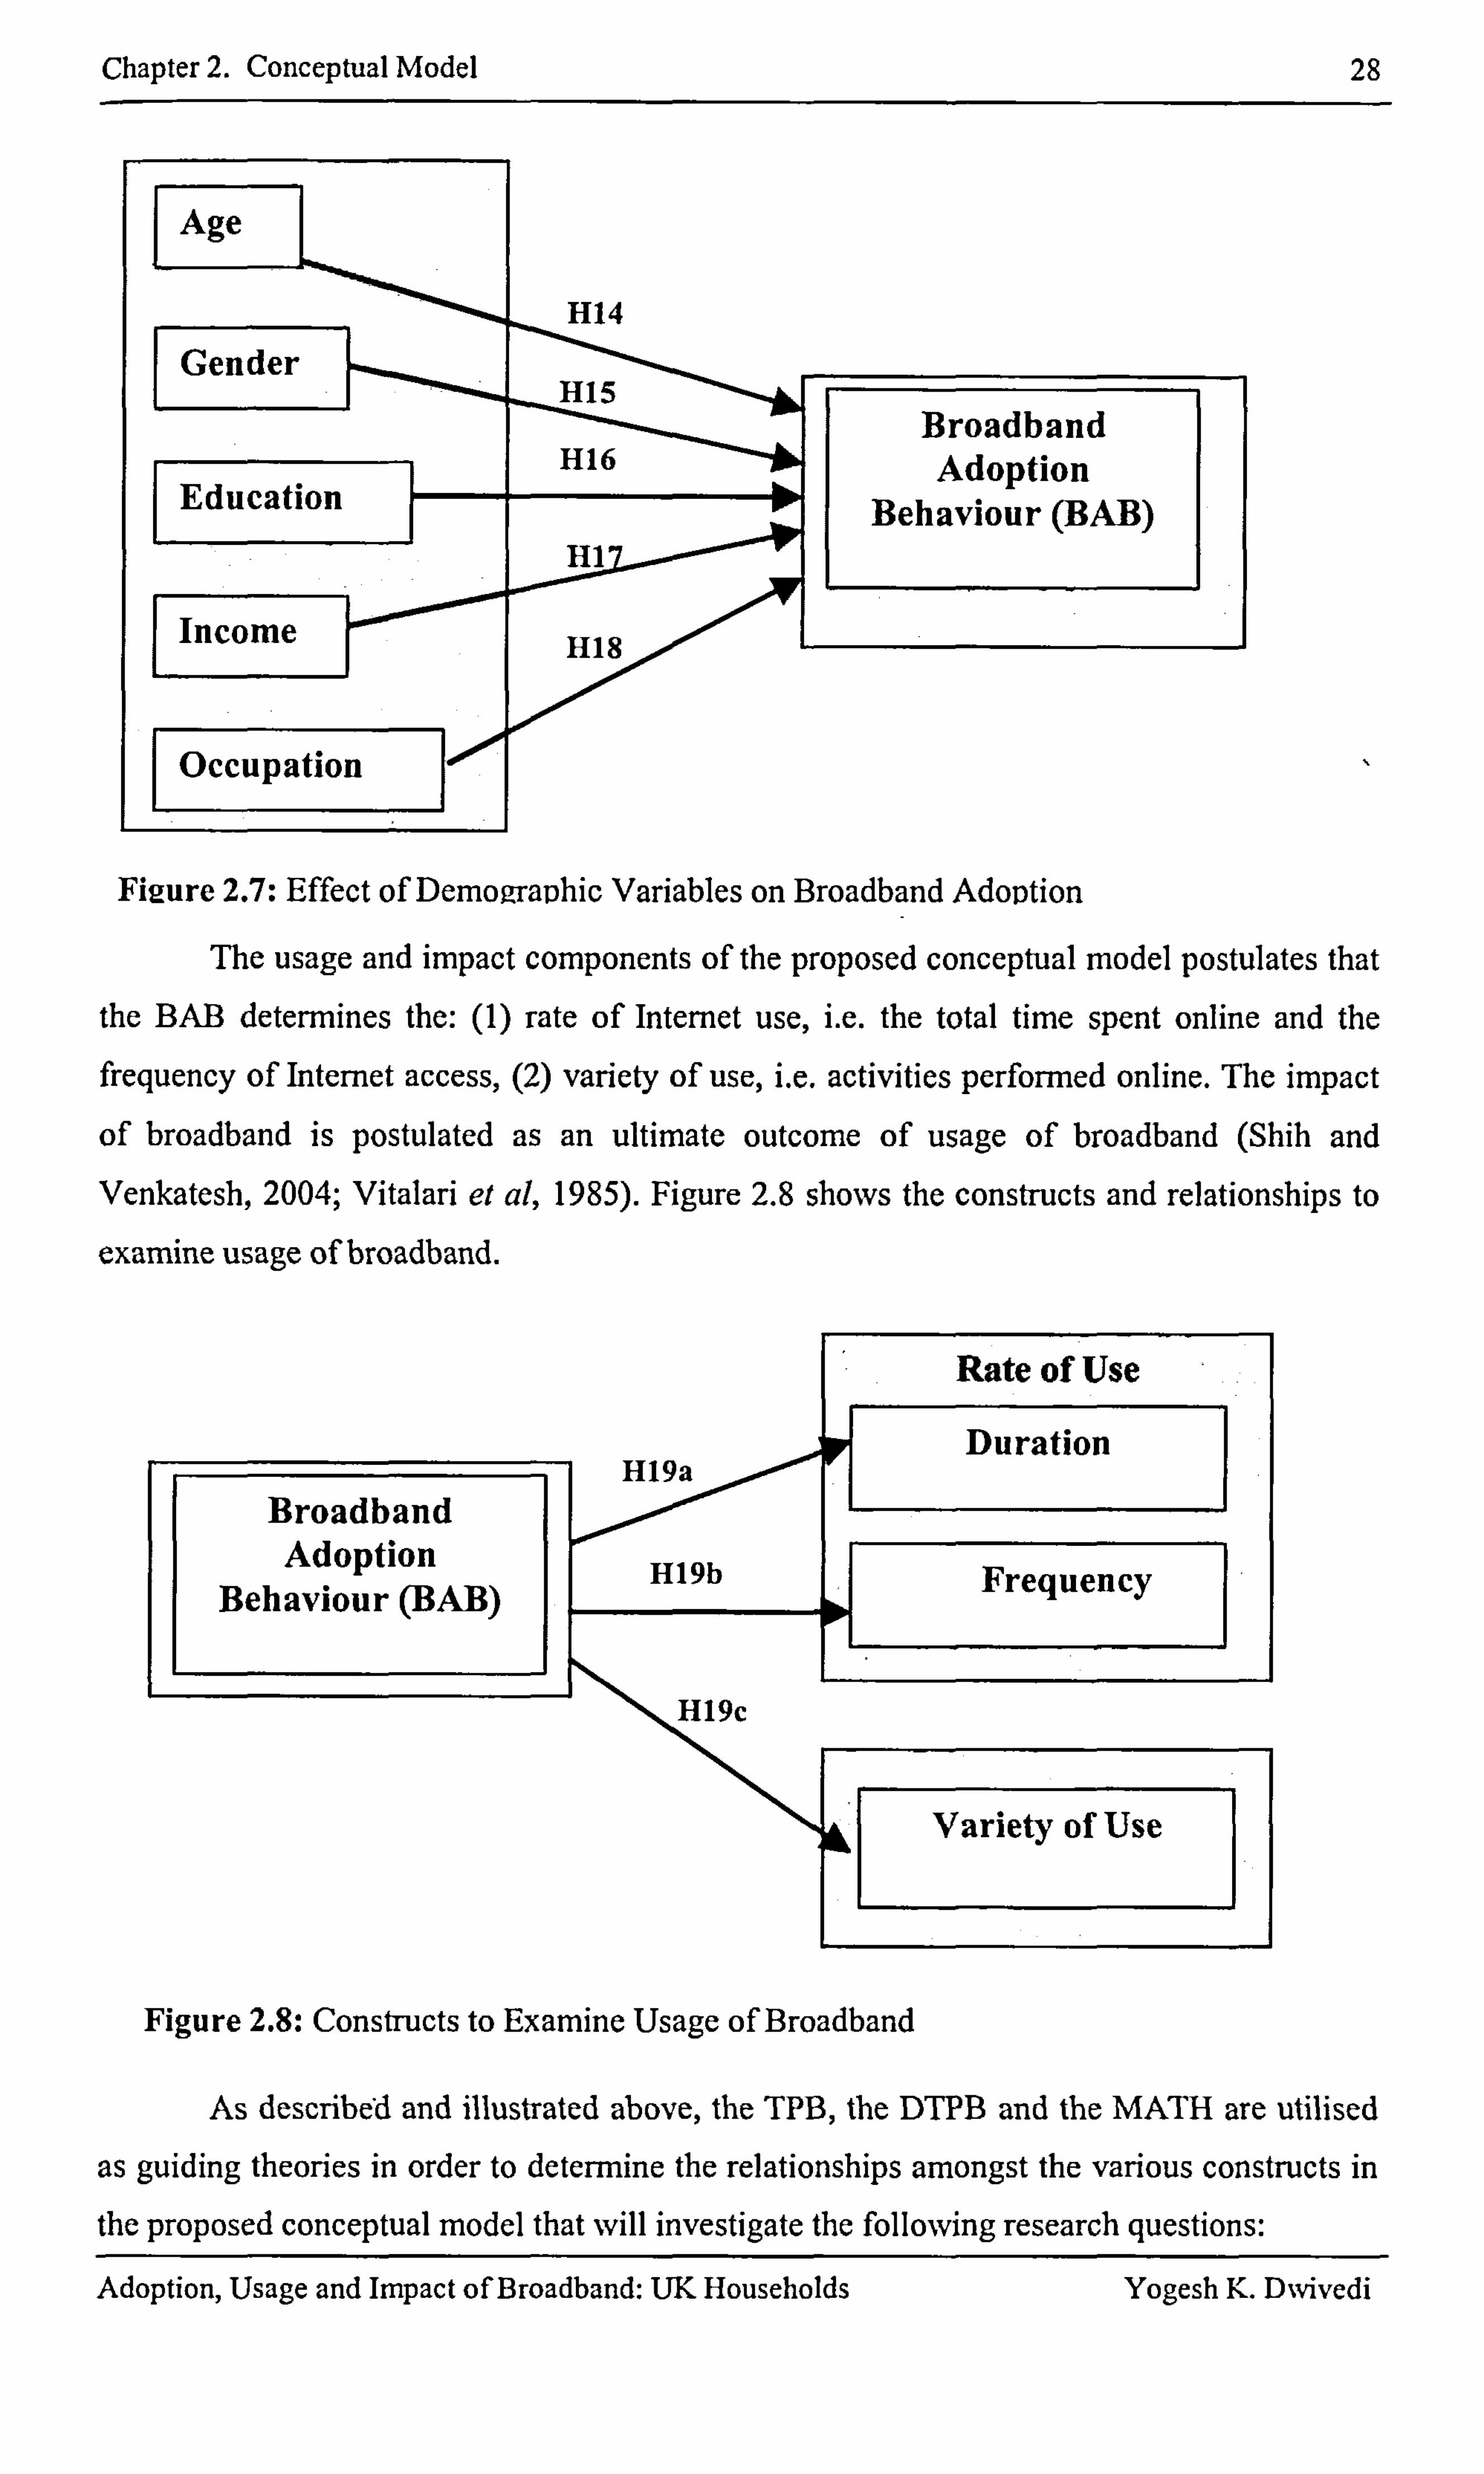
Chapter 2. Conceptual Model 28
Ffiaure 2.7: Effect of Dernop-raphic Variables on Broadband Adootion
The usage and impact components of the proposed conceptual model postulates that
the BAB determines the: (1) rate of Internet use, i. e. the total time spent online and the frequency of Internet access, (2) variety of use, i. e. activities performed online. The impact
of broadband is postulated as an ultimate outcome of usage of broadband (Shih and Venkatesh, 2004; Vitalari et al, 1985). Figure 2.8 shows the constructs and relationships to
examine usage of broadband.
Rate of Use
H19a Duration
Broadband "'ý> Adoption
H19b Frequency Behaviour (BAB)
H19c
Variety of Use
Figure 2.8: Constructs to Examine Usage of Broadband
As described and illustrated above, the TPB, the DTPB and the MATH are utilised
as guiding theories in order to determine the relationships amongst the various constructs in
the proposed conceptual model that will investigate the following research questions: Adoption, Usage and Impact of Broadband: UK Households Yogesh K. DNvivedi
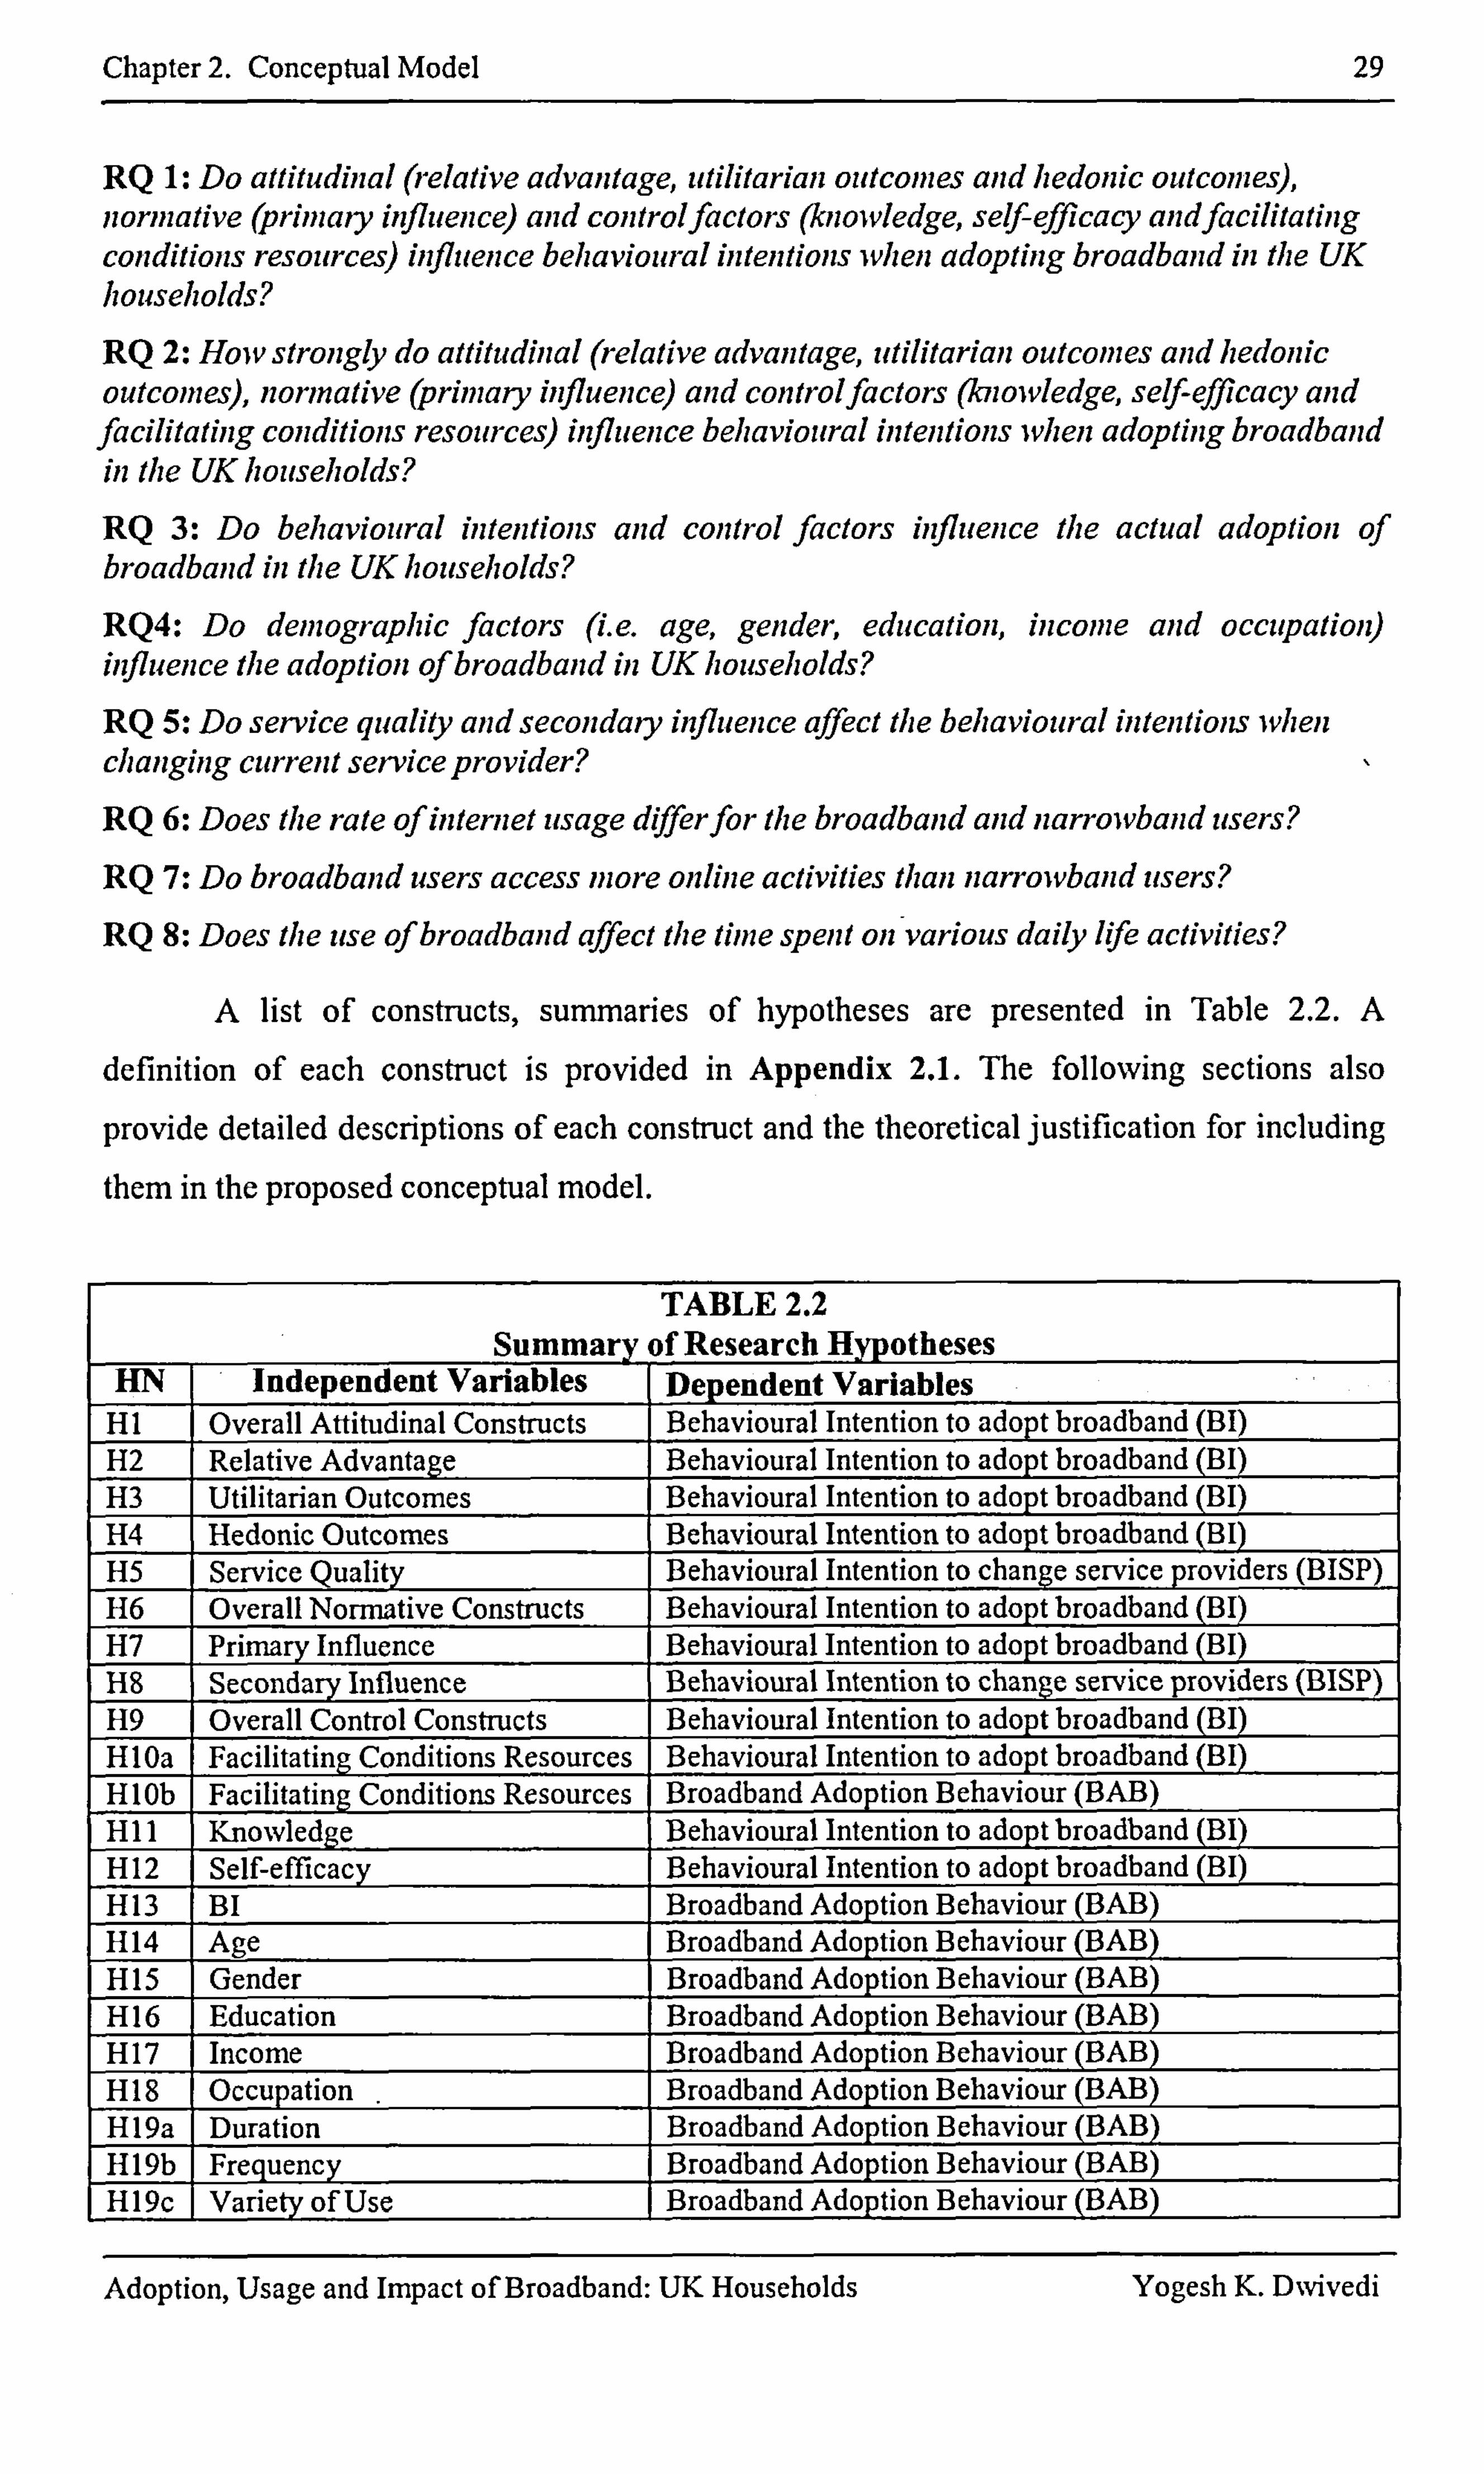
Chapter 2. Conceptual Model 29
RQ 1: Do attitudinal (relative advantage, utilitarian outcomes and hedonic outcomes), nonizative (primary influence) and controlfactors (knowledge, sel(lefficacy andfacilitating conditions resources) influence behavioural intentions when adopting broadband in the UK households?
RQ 2: How strongly do attitudinal (relative advantage, utilitarian outcomes and hedollic outcomes), nonnative (primary influence) and controlfactors (knowledge, setrIefficacy and facilitating conditions resources) influence behavioural intentions when adopting broadband in the UK households?
RQ 3: Do behavioural intentions and control factors influence the actual adoption of broadband in the UK households?
RQ4: Do demographic factors (i. e. age, gender, education, income and occupation) influence the adoption ofbroadband in UK households?
RQ 5: Do service quality and secondary influence affect the hehavioural intentions IvIlell changing current service provider? I RQ 6: Does the rate of internet usage differfor the broadband and narrowband users? RQ 7: Do broadband users access more online activities than narrowband users? RQ 8: Does the use of broadband affect the lime spent on various daily life activities?
A list of constructs, summaries of hypotheses are presented in Table 2.2. A
definition of each construct is provided in Appendix 2.1. The following sections also
provide detailed descriptions of each construct and the theoretical justification for including
them in the proposed conceptual model.
TABLE 2.2 Summary f Research Hypotheses
HN Independent Variables Dependent Variables HI Overall Attitudinal Constructs Behavioural Intention to adopt broadband (BI) H2 Relative Advantage Behavioural Intention to adopt broadband (BI) H3 Utilitarian Outcomes Behavioural Intention to adopt broadband (BI) H4 Hedonic Outcomes Behavioural Intention to adopt broadband (BI) H5 Service Quality Behavioural Intention to change service providers (BISP) H6 Overall Non-native Constructs Behavioural Intention to adopt broadband (BI) H7 Primary Influence Behavioural Intention to adopt broadband (BI) H8 Secondary Influence Behavioural Intention to change service providers (BISP) H9 Overall Control Constructs Behavioural Intention to adopt broadband (BI) HlOa Facilitating Conditions Resources Behavioural Intention to adopt broadband (BI) HlOb Facilitating Conditions Resources Broadband Adoption Behaviour (BAB) H11 Knowledge Behavioural Intention to adopt broadband (BI) H12 Self-eff icacy Behavioural Intention to adopt broadband (BI) H13 BI Broadband Adoption Behaviour (BAB) H14 Age Broadband Adoption Behaviour (BAB) H15 Gender Broadband Adoption Behaviour (BAB) H16 Education Broadband Adoption Behaviour (BAB) H17 Income Broadband Adoption Behaviour (BAB) H18 Occupation Broadband Adoption Behaviour (BAB) H19a Duration Broadband Adoption Behaviour (BAB) 1119b Frequency Broadband Adoption Behaviour (BAB) H19c Variety of Use Broadband Adoption Behaviour (BAB)
Adoption, Usage and Impact of Broadband: UK Households Yogesh K. DNvivedi
Chapter 2. Conceptual Model
2.4 ATTITUDINAL CONSTRUCTS
30
Attitude is defined as an individual's positive or negative feelings when performing target behaviour such as adoption of broadband (Ajzen, 1985; 1991; Fishbein and Ajzen,
1975; Taylor and Todd, 1995). Overall, the technology adoption/acceptance theories and
models including TRA, TAM, TPB, and DTPB illustrate relationships between the attitude
or attitudinal factors and bebavioural intentions. If the attitude of individuals towards the
technology in question is positive then they are likely to form an intention to perform the
behaviour (Tan and Teo, 2000). Following TPB it can be assumed that if the perception of the respondents regarding the attitudinal factor is positive, then it is more likely that it will have a positive influence on the behavioural intention. Thus, this leads to the formulation of
the hypothesis:
HI: Overall attitudinal factors will have a positive influence on the behavioural intention to adopt broadband.
In order to gain an in-depth and better understanding, attitude construct has been
decomposed in several studies (Tan and Teo, 2000; Taylor and Todd, 1995; Venkatesh and Brown, 200 1). For example, in order to gain an in-depth and better understanding Taylor and Todd (1995) decomposed attitude into five constructs represented by the five perceived innovation attributes (i. e. relative advantage, compatibility, visibility, risk and complexity) from Rogers' Diffusion of Innovation theory. Following Taylor and Todd, Venkatesh and Brown (2001) also decomposed the attitudinal belief to study the adoption of PC into three
types of constructs; namely, utilitarian outcomes, hedonic outcomes, and social outcomes.
Following the aforementioned discussion (Taylor and Todd, 1995; Venkatesh and Brown, 2001) this research decomposed attitude into four constructs, namely hedonic
outcomes, utilitarian outcomes (Venkatesh and Brown, 2001), relative advantage (Rogers,
1995) and service quality (DeLone and McLean, 2003; Parasuraman et al, 1991).
Three constructs, namely relative advantage, utilitarian outcomes, and hedonic
outcomes, are expected to provide measures of attitude towards the behaviour of broadband
adoption in the household. Apart from the aforementioned constructs, this study also included service quality as one construct of attitude for those consumers who already had
broadband. This construct of service quality will be helpful to predict if the adopters are
contracted or obligated to the same broadband provider. Alternatively, it will help predict
whether the adopters switch to another provider if they are not satisfied with the obtained
service. The aforementioned attitudinal factors relevant to this study are discussed below in
detail. Thereafter the related hypotheses are fon-nulated.
Adoption, Usage and Impact of Broadband: UK Households Yogesh K. DNvivedi
Chapter 2. Conceptual Model
2.4.1 Relative Advantage
31
Rogers' (1995) Diffusion of Innovations theory suggests that the perceived relative
advantage of an innovation is positively related to its rate of adoption. Several previous
empirical studies have found that perceived relative advantage is an important factor for
determining the adoption of an innovation (Tan and Teo, 2000; Taylor and Todd, 1995;
Tomatzky and Klein, 1982). Similarly, when compared to narrowband, broadband offers faster, un-metered, always-on access to the Internet, and provides a number of advantages,
conveniences and satisfaction to its users. Considering the advantages that broadband offers, it would be expected that individuals who perceive broadband as advantageous would also be more likely to adopt the technology. Therefore, the above theoretical argument leads to
the following hypothesis:
H2: Relative advantage will have a positive influence on behavioural intention.
2.4.2 Utilitarian Outcomes
The perceived usefulness construct (Davis, 1989) is one of the strongest predictors
used to examine the adoption and usage of workplace technology. Venkatesh and Brown
(2001) proposed and validated the utilitarian outcomes factor that can be used to examine the
adoption and usage of technology in a household setting. Utilitarian outcomes are the extent
to which using a PC enhances the effectiveness of routine, household activities, such as budgeting, homework and work (Venkatesh and Brown, 2001). It has been suggested that
broadband can offer a more flexible lifestyle (BSG, 2004). For instance, many people
subscribe to broadband in order to work at home instead of travelling to the office; broadband can assist children with their homework, and many more household activities can be performed conveniently using the faster access of the Internet offered via broadband.
Therefore, it is expected that the greater the perception of broadband's usefulness for work
or household related activities, the more likely that broadband technology will be adopted in
the home. Thus, the hypothesis is:
H3: Utilitarian outcomes will have a positive influence on behavioural intention.
2.4.3 Hedonic Outcomes
The Venkatesh and Brown (2001) study found that hedonic outcomes is one of the
factors that influences PC adoption in the home. Venkatesh and Brown (2001) defined
hedonic outcomes as pleasure derived from PC use; for example, games, fun and
entertainment. Heijden (2004) described hedonic information systems as self-fulfilling and
strongly connected to the home and leisure activities, focused on the fun aspect of using
Adoption, Usage and Impact of Broadband: UK Households Yogesh K. DNvivedi
Chapter 2. Conceptual Model 32
information systems, and encouraged prolonged rather than productive use (Heijden, 2004). Empirical findings from the Venkatesh and Brown (2001) study established that, when adopting a technology, the role of entertainment (PC games, Video games) was important as a factor for consideration on the consumer decision-making process (Venkatesh and Brown, 2001). Previous studies suggest that the entertainment potential of a PC offers a possibility to
escape reality and become immersed in a new environment. Such characteristics are consistent with a hedonic perspective (Foxall, 1992; Venkatesh and Brown, 2001). Hence,
the entertainment potential of a PC is much more enhanced by the advent of the Internet. It
offers the opportunity of playing online games, downloading music and video, chat and sending online messages. However, this potential was severely hampered by the slow speed
of dial-up Internet. I
The barrier of slow speed was overcome by broadband technology, which offered benefits in terms of data, faster download speeds and streaming capabilities to Internet users; hence more convenient and compelling environments. Recent studies (Lee et al, 2003, Lee
and Choudrie, 2002) suggest that one of the most important factors that was responsible for broadband adoption in South Korea is the PC bang phenomenon. Similarly, a study by
Anderson et al (2002) suggests that broadband users are more likely to use the Internet for fun and entertainment in comparison to narrowband users. Considering the entertainment
potential that broadband offers, it is expected that individuals who perceive broadband as a good entertainment medium will also be likely to adopt the technology. Therefore, the
underlying hypothesis is:
H4: Redonic outcomes will have a positive influence on behavioural intention.
2.4.4 Service Quality
Marketing research developed the construct service quality 'SERVQUAL' in order to measure a consumer's perception of service quality (Parasuraman el al, 1991;
Parasuraman el al, 1988). However, only a limited number of studies have recently included
it to measure the successful adoption of technology. DeLone and McLean (2003) extended a decade old IS success model (DeLone and McLean, 1992) by integrating a new construct
called service quality. Service quality was included to evaluate the fact that an IS department
also plays a role in facilitating end-user computing via the services it offers to business
personnel wishing to develop their own systems (Rosemann and Vessey, 2005). McCalla and Ezingeard (2005) have progressed to develop a data collection protocol that measures the
relationship between technology use, emotional expression and service quality perception. Yang el al (2005) developed and validated an instrument that measured a user's perceived
Adoption, Usage and Impact of Broadband: UK Households Yogcsh K. D%vivedi
Chapter 2. Conceptual Model 33
service quality of information presented on web portals. Parasuraman el al (2005) have
recently developed a multiple-item scale for assessing electronic service quality. Therefore,
it can be deduced from the aforementioned studies that there is a growing need and importance of the service quality construct within IS research.
However, this construct was not employed in the case of PC adoption studies. This is
because when purchasing PCs (i. e. hardware) consumers have only one opportunity to make
a choice; that is, to purchase or not to purchase. And once a PC is sold to consumer, the
seller is least expected to provide any further after purchase service and/or customer support. However, the case of broadband subscription is different to PC purchase. That is, the
consumers sign an annual contract and during this period if the provided service is not
satisfactory, then they can/will discontinue the broadband subscription. Alternatively, if
consumers have a choice of providers then they might transfer to the competitors. Therefore,
it is important to understand whether consumers are satisfied with their current providers and
provided services. Hence, the underlying hypothesis is:
H5: Service quality will have a negative influence onthe behavioural intention when changingfrom a current service provider.
2.5 NORMATIVE CONSTRUCTS
Subjective norms are defined as a consumer's perception that most people who are important to him/her think that s/he 'should or should not perform the behaviour in question' (Ajzen, 1985; 1991; Fishbein and Ajzen, 1975, Tan and Teo, 2000; Taylor and Todd, 1995;
Venkatesh and Brown, 2001). A subjective norm in its original forrn in the TRA and TPB is
employed as a single construct and is considered directly related to the behavioural intention.
This is because a consumer's behaviour is based on their perception of what others think of
what they should be doing (Tan and Teo, 2000). Following the guidelines of the TPB, it can be assumed that the stronger the perceived social influence more likely that consumer develops a stronger intent to subscribe to broadband. Thus, this led to the hypothesis:
H6: Overall the normative factors will have a positive influence oil the behavioural intention when adopting broadband.
Following the suggestion from various studies (Burnkrant and Page, 1988; Oliver
and Bearden, 1985; Shimp and Kavas, 1984), Taylor and Todd (1995) decomposed the
normative belief structure into two groups; namely, the peer and superior influences. In
terms of consumer-briented service, relevant references such as the adopter's friends, family
and colleagues/peers may influence the adoption decision (Tan and Teo, 2000). Rice et al (1990) defined such influence as social influences where members of a social network Adoption, Usage and Impact of Broadband: UK Households Yogesh K. D%vivedi
Chapter 2. Conceptual Model 34
influence others' behaviour. Venkatesh and Brown (2001) have considered the social influence of family, friends, TV and newspapers as one construct that can be used to measure the subjective norms. The findings of Venkatesh and Brown (2001) suggest that social influences are significant determinants of the purchasing behaviour of PCs. Similarly, it is
expected that households with broadband connections are likely to influence their relatives
and friends by telling and demonstrating to them the benefits and convenience offered by
broadband. Therefore, it is appropriate to consider social influences as a measure of the
subjective norm for broadband adoption in the household. By using previous studies (Fulk
and Boyd, 199 1; Fulk et al, 1987; Salancik and Pfeffer, 1978), Venkatesh and Brown (200 1)
suggested that 'Social influence is exerted through messages and signals that help to form
perceptions of a product or activity'. Measures that influence adopters can appear in two
forms that are ten-ned as primary and secondary influences. Consistent with the DTPB and MATH, this study considered two constructs in the normative category. These two
constructs are separated and defined below. Subsequently, the underlying hypotheses are
proposed.
2.5.1 Primary Influences
For the purposes of this research, a social influence from friends, colleagues/peers
and family members that takes the form of a conversation, messages and assists in forming
perceptions of broadband adoption is considered to be a primary influence (Venkatesh and Brown, 200 1). Considering the findings from previous studies (Venkatesh and Brown, 200 1;
Taylor and Todd, 1995), this research assumes that if broadband adopters are influenced by
their social networks with positive messages, they are more likely to have a strong behavioural intention to adopt broadband. Thus, the hypothesis proposed from this
discussion is:
H7: Priniary influences ivill have a positive influence on the perceived behavioural intention to adopt broadband.
2.5.2 Secondary Influences
Previous studies suggest that messages disseminated using mass media, such as the
television (TV) and newspaper advertisements (secondary sources of information) are likely
to influence an adopter's intentions (Rogers, 1995; Venkatesh and Brown 2001). For the
purposes of this research, it is expected that secondary sources of information will affect
those consumer who have already adopted broadband but are not satisfied with service
quality; hence, if advertisements viewed on TV or read in a newspaper advertisement about
Adoption, Usage and Impact of Broadband: UK Households Yogesh K. DNvivedi
Chapter 2. Conceptual Model 35
broadband packages that are economical and offer a better quality service, then they are
more likely to cause adopters to contract with the new provider. Therefore, the hypothesis is:
H8: Secondary influences will have positive influence on perceived behavioural intention to change current service providers.
2.6 CONTROL CONSTRUCTS
The TPB suggests that presences of constraints can inhibit both the behavioural
intention to perform behaviour and the behaviour in question itself (Ajzen, 1991; 1985),
which is referred to as the perceived behavioural control (PBC). Support for this theoretical
argument is obtained from the empirical findings in several studies that illustrate that the higher the perception of an individual's control over their internal and external constraint, '
the more likely that s/he will adopt the technology in question (Ajzen, 1991; Tan and Teo,
2000). However, if the individual's control over the external and internal constraints is low,
then besides having a strong behavioural. intention, s/he is less likely to adopt the technology (Ajzen, 1991; 1985). Consistent with TPB, this research therefore formulates the following
hypothesis:
H9: 77ie overall control factors will have a positive influence on the behavioural intention to adopt broadband.
To develop a better understanding, subsequent studies have decomposed PBC into
three constructs: knowledge, facilitating conditions resources/technology (Taylor and Todd
1995; Mathieson, 1991) and self-efficacy (Taylor and Todd 1995). To study PC adoption in
the household, Venkatesh and Brown (2001) split PBC into five specific barriers that can inhibit the adoption of PC, including a rapid change in technology, declining costs, the high
cost of PCs, ease/difficulty of use and a requisite knowledge of the use of PCs.
Since the subscription cost of broadband access is stable and technology is not
changing rapidly, the declining cost and rapid changes in technology were considered irrelevant factors for the adoption of broadband technologies, and are hence not included in
this research. Consistent with DTPB and MATH, the current study considered the constructs that are barriers to the adoption of broadband as measuring high costs (i. e. facilitating
conditions resources), the ease/difficulty of PCs and Internet use (i. e. self-efficacy) and the
lack of knowledge of broadband's benefits. In the next section, the justification for including
the aforementioned three constructs as a decomposed control constructs and the hypotheses
are provided.
Adoption, Usage and Impact of Broadband: UK Households Yogesh K. DNvivedi
Chapter 2. Conceptual Model 36
2.6.1 Facilitating Conditions Resources
The South Korean government's vision recognised an affordable monthly cost of broadband for middle-income households as one of the most important factor that led to the high rates of adoption (Choudrie and Lee, 2004; Lee and Choudrie, 2002). An exploratory
study on broadband adoption in the UK also suggests that a high monthly cost is a major barrier that is inhibiting the adoption of broadband in the household (Dwivedi et al, 2003).
Therefore, it is expected that if the perceived cost of obtaining broadband is high, then
adoption will be slow. Broadband technology is not compatible to the specifications of old PCs and necessitates either an upgrade or purchase of a new PC. However, PCs are not
easily replaceable devices for the medium and lower income households. Therefore, an
economic barrier in the form of costs that are incurred when upgrading or purchasing new personal computers inhibits the adoption of broadband in the household. Therefore, the hypotheses are:
HIOa: Facilitating conditions resources will have a positive influence oil the behavioural intention to adopt broadband.
H10b: Facilitating conditions resources will have a positive influence oil the adoption ofbroadband.
2.6.2 Knowledge
The level of knowledge regarding an innovation, its risks and benefits affect the
adoption rate (Rogers, 1995). The greater the awareness of the benefits of the innovation
amongst the consumers and users, the more likely it is that the innovation will get adopted. Lee and Choudrie's (2002) research suggested that, in South Korea, consumers knew what the potential of broadband were. The consumers were aware of the benefits of faster Internet
access, which was essential to satisfy their needs. It is assumed that the adoption of broadband requires a clear message of its usage and benefits amongst overall population. Also, if consumers are not aware of the benefits of adopting a particular innovation, then it is
expected that they are more likely to reject the decision to make a purchase due to the lack of the perceived needs. Therefore, the underlying hypothesis is:
Hll: Knowledge will have a positive influence on the behavioural intention to adopt hroadband.
Adoption, Usage and Impact of Broadband: UK Households Yogesh K. DNvivedi
Chapter 2. Conceptual Model
2.6.3 Self-efficacy
37
Since the use of broadband also requires using a PC and the Internet, the ease or difficulty of use and requisite knowledge of a PC and Internet use are expected to have an impact upon broadband adoption. The South Korean government deployed a variety of
promotion policies (Choudrie and Lee, 2004; Lee and Choudrie, 2002). "The Ten Million
Program" was designed to boost Internet use amongst housewives, the elderly, military
personnel, farmers and excluded social sectors such as low-income families, the disabled and
even prisoners. This promotion of providing PC and Internet skills in the year 2000
contributed towards the adoption of the Internet. A total of 4.1 million new online users, including one million housewives, occurred as a result of such initiatives (Choudrie and Lee,
2004; Lee and Choudrie, 2002). Therefore, it is expected that household users with basic PC
and Internet skills are more likely to adopt broadband. Hence, the hypothesis is:
H12: Seýflqfiflcacy will have a positive influence on the behavioural intention to adopt broadband.
2.7 DEMOGRAPHIC VARIABLES
Key socio-economic variables such as age, gender, education, income and
occupation (Burgess, 1986) provide important information regarding the characteristics of the population under investigation. These socio-economic variables have been widely
applied to investigate a number of devices and issues within the IS discipline including the
computer, telephone, intemet, software and e-leaming technologies. For example, these
variables have been included in previous studies that examined the adoption of ICTs, such as
the computer (Al-Jabri, 1996; Carveth and Kretchmer, 2002; Venkatesh et al, 2000; Vitalari
et al, 1985), the telephone (Anderson el al, 1999), the Internet (Anderson and Tracey, 2001;
Carveth and Kretchmer, 2002) and broadband (Anderson el al, 2002) in households, and its
subsequent impact on users. Further, the aforementioned social variables have also been
applied to investigate soft-ware piracy (Solomon and Brien, 1990; Wood and Glass, 1995),
technology adoption (Chen et al, 2001; Harris et al, 1996; Morris and Venkatesh, 2000;
Venkatesh et al, 2003; Venkatesh and Morris, 2000), e-government adoption (Huang et al, 2002) and demographic differences amongst IS professional (Holmes, 1997). Additionally,
the previous studies also emphasised the role of several external variables such as, demographic characteristics on the decomposed belief structure and, ultimately, adoption
and usage (Venkatesh and Brown, 2001). The moderating effects of the demographic
variables have been successfully applied to previous studies that examined gender
Adoption, Usage and Impact of Broadband: UK Households Yogesh K. DNvivedi
Chapter 2. Conceptual Model 38
differences in the perception and use of the email (Gefen and Straub, 1997), and
relationships between organisational culture and computer efficacy (Pearson el al, 2002).
Since home computers, the telephone, and access to the Internet (both dial-up and broadband) can be placed in the same technology cluster (Rogers, 1995), the socio-economic
variables that have been employed to study one technology can also be used to study others (Rogers, 1995). Therefore, the socio-economic variables such as age, gender, education,
occupation, and income that were utilised to examine home computer adoption in the households can also be employed to study broadband adoption.
The aforementioned socio-economic variables (i. e. age, gender, income, education,
occupation) have also been widely studied within the marketing discipline. There are other demographic and geographic variables such as disability, ethnicity, marital status and
geographic locations that may provide useful information (Rice, 1997) on adoption. However, due to feasibility reasons (face-to-face interviews would have been required, but
this is beyond the scope of this research) these variables were not included in this study. The
study of the aforementioned variables was ten-ned as segmentation, which involves the breakdown of the total broad and varied markets into homogenous, distinct, accessible,
stable and large groups (Gilligan and Wilson, 2003; Rice, 1997). Segmentation serves the following two important functions in marketing. First, to target marketing messages to
appropriate segments, and second, to develop modified products that fit specific segments of the market (Gilligan and Wilson, 2003; Rice, 1997). Therefore, a study of the demographics
of broadband consumers may assist the policy makers and ISPs providers by identifying the
various segments' specific needs and constraints.
2.7.1 Age
Finch (1986) argued that age can be employed as a factor or independent variable to
explain a particular social grouping, social process, or piece of individual or collective behaviour. Within the IS area a number of studies have found evidence that explains the
significant, direct and moderating effect of age on the behavioural intention, adoption and
usage behaviours (Harris et al, 1996; Morris and Venkatesh, 2000; Pearson et al, 2002;
Venkatesh et al, 2003). A study by Venkatesh et al (2000) suggests that the majority age
group adopting computers in the USA is 15-17 years, which is then followed by the 26-35
years. Similarly, Lee and Choudrie (Lee et al, 2003; Lee and Choudrie, 2002; Choudrie and Lee, 2004) found that in South Korea, the group that increased the adoption of broadband via the PC Bangs, was the younger aged one (i. e. school attending age). In turn, the younger
generation's usage of broadband exerted a substantial influence on the parents' decisions for
Adoption, Usage and Impact of Broadband: UK Households Yogesh K. Dwivedi
Chapter 2. Conceptual Model 39
subscribing to broadband as parents considered broadband to be imperative for educational
and entertainment purposes. Carveth and Kretchmer (2002) found that in many West
European countries, the older demographic groups are less likely to use the Internet
compared to the younger ones. According to this study, in the UK, 85 per cent of those aged 16-24 have Internet access compared to just 15 per cent in the 65-74 age range, and 6 per
cent over the age of 75 (Carveth and Kretchmer, 2002). A study by Anderson el al (2002)
also suggests that the demography of dial-up users is different to the broadband one. Therefore, significant age differences are expected in terms of the broadband adopters and
non-adopters. The younger and middle age groups are expected to be more apathetic to
adoption, whilst the older age group is expected to be more relevant to the non-adopters. Hence, this forms the following hypothesis: I
H14: 77zere will be a difference between the adopters and noll-adopters of the various age groups.
2.7.2 Gender
According to Morgan (1986), gender, as a key variable, is one of the most common
variables in social investigations. Jackson and Scott (2001) defined gender as a hierarchical
division between women and men embedded in both social institution and social practices. Gender is therefore a social structural phenomenon but is also produced, negotiated and
sustained at the level of everyday interaction (Jackson and Scott, 2001). Morgan (1986)
argued that gender can be employed as a descriptive variable as well as an explanatory
variable (Morgan, 1986). A number of studies have investigated the role of gender in the
adoption and usage of ICTs (Al-Jabri, 1996; Anderson et al, 1999; Choudrie and Lee, 2004;
Gefen and Straub, 1997; Holmes, 1997; Harris et al, 1996; Lacohee and Anderson, 2001;
Morris and Venkatesh, 2000; Pearson et al, 2002; Venkatesh et al, 2003; Venkatesh and Morris, 2000; Venkatesh et al, 2000; Wood and Glass, 1995). The findings of the previous
studies revealed that gender has an important role when considering technology adoption and
usage in both the organisational and household contexts. A study by Venkatesh et al (2000)
illustrated that male users use a computer more than females and suggested gender as one of the most important variables when examining PC adoption in the household. Anderson et al (1999) also suggest that there exist clear gender differences in the usage of computers and telephone calls. Lacohee and Anderson (2001) also emphasised the differences between the
men and women in terms of the usage of a telephone. Hence, the hypothesis is:
H15: 7be adopters ofbroadbandivillbe morefrom nzale thanfemalegender.
Adoption, Usage and Impact of Broadband: UK Households Yogesh K. D%vivedi
Chapter 2. Conceptual Model 40
2.7.3 Education
Previous studies suggest that individuals with educational qualifications are more likely to adopt new innovations (Burgess, 1986; Rogers, 1995). Past research on technology (PC) adoption suggests a positive correlation between the level of education, technology
ownership and usage (Venkatesh et al, 2000; Vitalari et al, 1985). Venkatesh et al (2000)
found that people with higher educational qualifications use computers more than the less
educated ones. Education has also been identified as an important driver of broadband
adoption in South Korea (Choudrie and Lee, 2004; Lee et al, 2003). Anderson et al (2002)
suggest that household consumers with secondary or tertiary education are more likely to have Internet access. From the previous research undertaken both in theory and empirica
'I research, it is suggested that education can be considered as an independent variable that
explains the differences between broadband adopters and non-adopters. This is because
broadband is considered to be useful for educational purposes and perforining job related tasks. Therefore, it is expected that household consumers with higher educational attainment
or working towards higher educational attainment, i. e. degrees or postgraduate degrees, are
more likely to adopt broadband. Hence, the derived hypothesis is:
H16: 77tere ivill be a difference between the adopters and non-adopters of broadband in different levels of education.
2.7.4 Income and Occupation
As in the case of education, Rogers (1995) described socio-economic status (income
and occupation) as a correlate or antecedent of innovativeness. The Diffusion of Innovation
theory suggests that new technologies are initially adopted by those with more resources (Rogers, 1995). The adaptive structuration theory found that IT has the potential to increase
the resources of both those who had them prior to its adoption and those who possessed fewer resources prior to its adoption (DeSanctis and Poole, 1994; Mason and Hacker, 1998).
The findings of a longitudinal study using the USA census data found a positive correlation between income and computer ownership (Venkatesh el al, 2000). This study further
suggests that a considerable gap persists between the lower and higher income groups (Venkatesh el al, 2000). A study by Anderson et al (1999) also confirmed that income and
occupation drive the general pattern of ICT ownership and usage. Anderson et al's study found a strong correlation between social class and ownership of PCs, telephones and television (Anderson et al, 1999). Similarly, Carveth and Kretchmer (2002) suggested that in
the USA, the higher income families and households are more likely to own a computer and
use the Internet. A similar pattern was suggested for West European countries including the
Adoption, Usage and Impact of Broadband: UK Households Yogesh K. DNvivedi
Chapter 2. Conceptual Model 41
UK. Carveth and Kretchmer's study suggested that only 23 per cent of lower income groups in comparison to 68 per cent of the higher income groups in the UK use the Internet (Carveth
and Kretchmer, 2002). A recent study focused upon the determinants of the global digital
divide, also confirmed the importance of per capita income in explaining the gap between
computer and Internet use (Chinn and Fairlie, 2004).
The aforementioned theoretical arguments and empirical evidence support the inclusion of both income and occupation as an independent variable that explains the difference between broadband adopters and non-adopters in the household. Thus, the hypothesis is:
HI 7. Yhere will be a difference between the adopters and non-adopters of different levels ofhousehold annual income. I
Similar to income, occupation is also likely to differentiate between the adopters and
non-adopters of broadband. This is because broadband is useful for perfon-ning job related tasks; therefore, respondents with higher skilled occupation categories such as 'A', '13' and 'Cl' are more likely to adopt broadband, which is not expected for the lower occupation
categories such as 'C2' and 'D', but not including category 'E'. The aforementioned
occupation categories were derived from the marketing literature where mainstream
professionals, such as doctors, lawyers, and judges with the responsibility of more then 25
staff are classified as occupational category 'A' (Gilligan and Wilson, 2003; Rice 1997). The
aforementioned occupations with a responsibility of less then 25 staff and academics are
grouped as social grade '13'. Skilled-non-manual workers fall within the occupational
category 'Cl' and 'C2'. Unskilled manual workers belong to the occupational category 'D'.
Finally, housewives, retired individuals, students and unemployed citizens were placed in
category 'E' (Gilligan and Wilson, 2003; Rice 1997). As broadband provides a function to
students and unemployed people who are engaged in job hunting, these groups are more likely to adopt broadband although they belong to the lower occupation category 'E'. This
led to the formulation of the following hypothesis:
H18: There will be a difference between the adopters and non-adopters of different types of occupation.
2.8 DEPENDENT VARIABLES: BEHAVIOURAL INTENTION (BI) AND
BROADBAND ADOPTION BEHAVIOUR (BAB)
The TPB (Ajzen, 1991) considered two independent variables, namely BI and behaviour in question. The majority of technology adoption and usage research has utilised
Adoption, Usage and Impact of Broadband: UK Households Yogesh K. D%vivedi
Chapter 2. Conceptual Model 42
the aforementioned two dependent variables to predict technology adoption and usage (Ajzen, 1991; Davis, 1989; Venkatesh and Brown, 2001). The TPB and findings from
previous empirical studies suggest BI is a mediating variable between the predictors and
actual behaviour. Therefore, BI is considered to have a direct influence on adoption or usage (Ajzen 1991). Apart from BI, previous studies have also employed a control factor (i. e.
available resources) as a direct predictor of behaviour (Ajzen, 1991; Venkatesh and Brown,
2001). Previous studies have reported a strong correlation between control factor and behaviour (Ajzen, 1991). Findings from a number of technology adoption and usage studies
within the IS field suggest BI (Morris and Venkatesb, 2000; Venkatesh et al, 2003;
Venkatesh and Brown, 2001; Venkatesh and Morris, 2000; Venkatesh et al, 2000) and
control (Taylor and Todd, 1995) as being good predictors of actual adoption or usage behaviour. Consistent with previous studies and the guiding theory, the current study
considered BI as a mediating dependent variable and adoption behaviour as an ultimate dependent variable. The following hypothesis illustrates the relationship between BI and BAB.
H13: Behavioural intention and facilitating conditions resources will have an influence on the adoption of broadband.
2.9 USAGE AND IMPACT OF BROADBAND
The proposed conceptual model of this research considered a variety of broadband
use and rate of use as dependent variables. It is expected that the independent variable broadband adoption behaviour will differentiate between the variety and rate (Shih and Venkatesh, 2004) of Internet use between broadband and narrowband users. Following the
previous study on technology usage (Shih and Venkatesb, 2004), we postulate the following
hypotheses on broadband use:
H19u: Yhe adopters of broadband will spend more time online than non-adopters. H19b: Yhe adopters of broadband will access the Internet inorefrequently than non- adopters H19c: The adopters of broadband will access a higher number of online activities than the non-adopters.
2.10 IMPACT OF BROADBAND
Time allocation patterns are considered to be an important variable for
understanding the role'of computing and the impact of ICTs in households (Vitalari et al, 1985). This is due to the total available time being finite and the time spent upon using a technology being likely to influence the distribution of time upon other activities. Therefore,
Adoption, Usage and Impact of Broadband: UK Households Yogesh K. Dxvivedi
Chapter 2. Conceptual Model 43
the use of new technology does indirectly rearrange the social actions and user behaviour
(Vitalari el al, 1985). Vitalari et al (1985) have demonstrated the impact of personal
computers upon the time allocation of various routine activities and have also considered the
implications of this action. Although broadband is expected to affect several aspects of daily
life in the household (BSG, 2004; Carriere et al, 2000), research that understands the impact
of broadband on time allocation patterns has not been undertaken. This was a motivating factor for including this construct.
According to the diffusion literature, new innovations such as broadband are likely
to change the associated behaviours of users, which are termed as the perceived
consequences or impact of new innovations (Rogers, 1995; Shih and Venkatesh, 2004). As
described above, previously researchers have demonstrated the impact of various
technologies (e. g. automobiles, telephone, computers and Internet) on a user's daily life
(Anderson et al, 2001; Vitalari et al, 1985). Since broadband offers an alternative way of
work and entertainment, and consumes time that traditionally has been spent on other
activities, it is likely that broadband will alter the time allocation pattern of a user's daily
activities.
The homeostasis relationship between technology and time change (Robinson, 1977) was
considered most appropriate for examining the impact of broadband on household
consumers. This was because this relationship was proposed for the context of household
technology and time change, and was successfully applied to investigate the impact of
computer use in the household (Vitalari et al, 1985). Two underlying principles were
adopted from Robinson (1977) which state that: (1) a natural system like a household tends
to be at an equilibrium; and (2) any new change due to equilibrium disturbance caused by
triggers such as the use of new technology is adjusted by similar but already existing factors
in the system, thereby restoring the equilibrium condition (Robinson, 1977; Vitalari et al, 1985). The aforementioned two principles were utilised to propose the homeostatic model of
the effect of computer use on household time allocation patterns (Vitalari et al, 1985). This
model suggests three possibilities that may occur after introducing new technology in the
household. These three possibilities are: absence of change in the existing patterns of household behaviour due to the non-use of the computer; short-term perturbations in
household behaviour, and changes that signal long-term impacts (Vitalari el al, 1985). This
model also suggests that consumer activities that are affected the most are internal. Examples
of internal activities include watching television and hobbies, as opposed to external
activities such as sports, eating, socialising with friends (Vitalari et al. 1985). This is a brief
Adoption, Usage and Impact of Broadband: UK Households Yogesh K. Divivedi
Chapter 2. Conceptual Model 44
account of the homeostatic model; however, for a detailed discussion the reader may refer to
the original source published by Vitalari el al (1985).
The model of homeostasis discussed above was utilised to conceptualise the impact
of broadband on the time allocation patterns of households. Similar to the previous study (Vitalari et al, 1985), the model begins with an equilibrium state, where households do not have an Internet connection at home. Subscribing to the Internet at home, may affect a
consumer in one of the following three possible ways. First, there is a lack of change in the
existing pattern of behaviour. This is because the characteristics of household users such as
age are such that they elicit a low level of interest in the Internet. Second, there are short- term changes in the behaviour of household. Third, there are long-term changes in the
household's behaviour. Both short-term and long-term changes can affect time allocatioý
patterns on both cognate activities such as television watching and reading, and differentiated activities such as sports and outdoor recreation (Vitalari et al, 1985). This
research postulates that the magnitude of both short-term and long-term changes are dependent upon the type of Internet connection, i. e. narrowband or broadband, rate of use
and length of Internet subscription in the household.
It is also assumed that the decrease in online shopping or the decrease in telephone
conversations require time to develop trust and become habitual; therefore, the length of Internet subscription is likely to affect this for the long- term. Activities such as working at home, working in the office and commuting in traffic are interconnected and are more likely
to be affected by the type of internet connection. Households with broadband connections
are more likely to contain individuals who work at home in comparison to narrowband
consumers. It can be argued that short-term changes may become long-term if internet use is
continued over time. For example, online shopping may be an initial instance of a short-term
change in consumer behaviour; however, if there is continuous use of the Internet and a
consumer develops trust and routine, then it may become a long-term change in household
behaviour. Therefore, this research will answer the following research question:
RQ8: Does the use of broadband affect the time spent on various daily life activities?
With this question, the discussion on the theoretical aspects surrounding this
research is drawn to a close. The next section surnmarises and concludes this chapter.
Adoption, Usage and Impact of Broadband: UK Households Yogesh K. DNvivedi
Chapter 2. Conceptual Model
2.11 SUMMARY AND CONCLUSIONS
45
Firstly, this chapter reviewed the various technology adoption and diffusion related
theories and models including the DI, TRA, TPB, DTPB, TAM, MATH and LTD. The
analysis suggests that although none of the aforementioned theories and models could be as
such applied to examine the broadband adoption, usage and impact, integrating the
constructs across the models will be more appropriate and will assist in providing a coherent
understanding of the research problem. Therefore, the most appropriate theories and models
such as MATH, TPB, DTPB and DI have been considered to be guiding frameworks for
current research.
Second, this chapter has identified the factors that are expected to predict the BI to
adopt broadband, which ultimately explains the broadband adoption behaviour. Also the
broadband adoption behaviour is expected to differentiate between the rate and variety of Internet use between the broadband and narrowband users. Using these factors a conceptual
model of broadband diffusion was developed. The proposed conceptual model is based on the assumption that the attitudinal, normative and control factors listed in Table 2.2 are
responsible for influencing the BI to adopt broadband, which in turn is expected to predict broadband adoption behaviour. The proposed model also includes constructs to investigate
whether broadband users differ from narrowband users when determining the usage and impact of the Internet. Whilst discussing the aforementioned factors, the underlying hypotheses (Table 2.2) were also proposed that need to be tested in order to verify the model. In order to test the underlying hypotheses that can verify the proposed conceptual model, the
next step was to determine the relevant research method. Following that, it was essential to
develop a reliable data collection instrument that could be utilised to collect empirical data
from the household consumers. Completion of the aforementioned work led the research to
refinement and validation of the proposed conceptual model of broadband diffusion.
In the following chapters, the proposed conceptual model will be utilised as a basis
for empirical investigation. Chapter 3 begins with a discussion of the chosen research
method. Following that, Chapter 4 will provide a detailed discussion on the instrument
development.
Adoption, Usage and Impact of Broadband: UK Households Yogesh K. D%vivedi

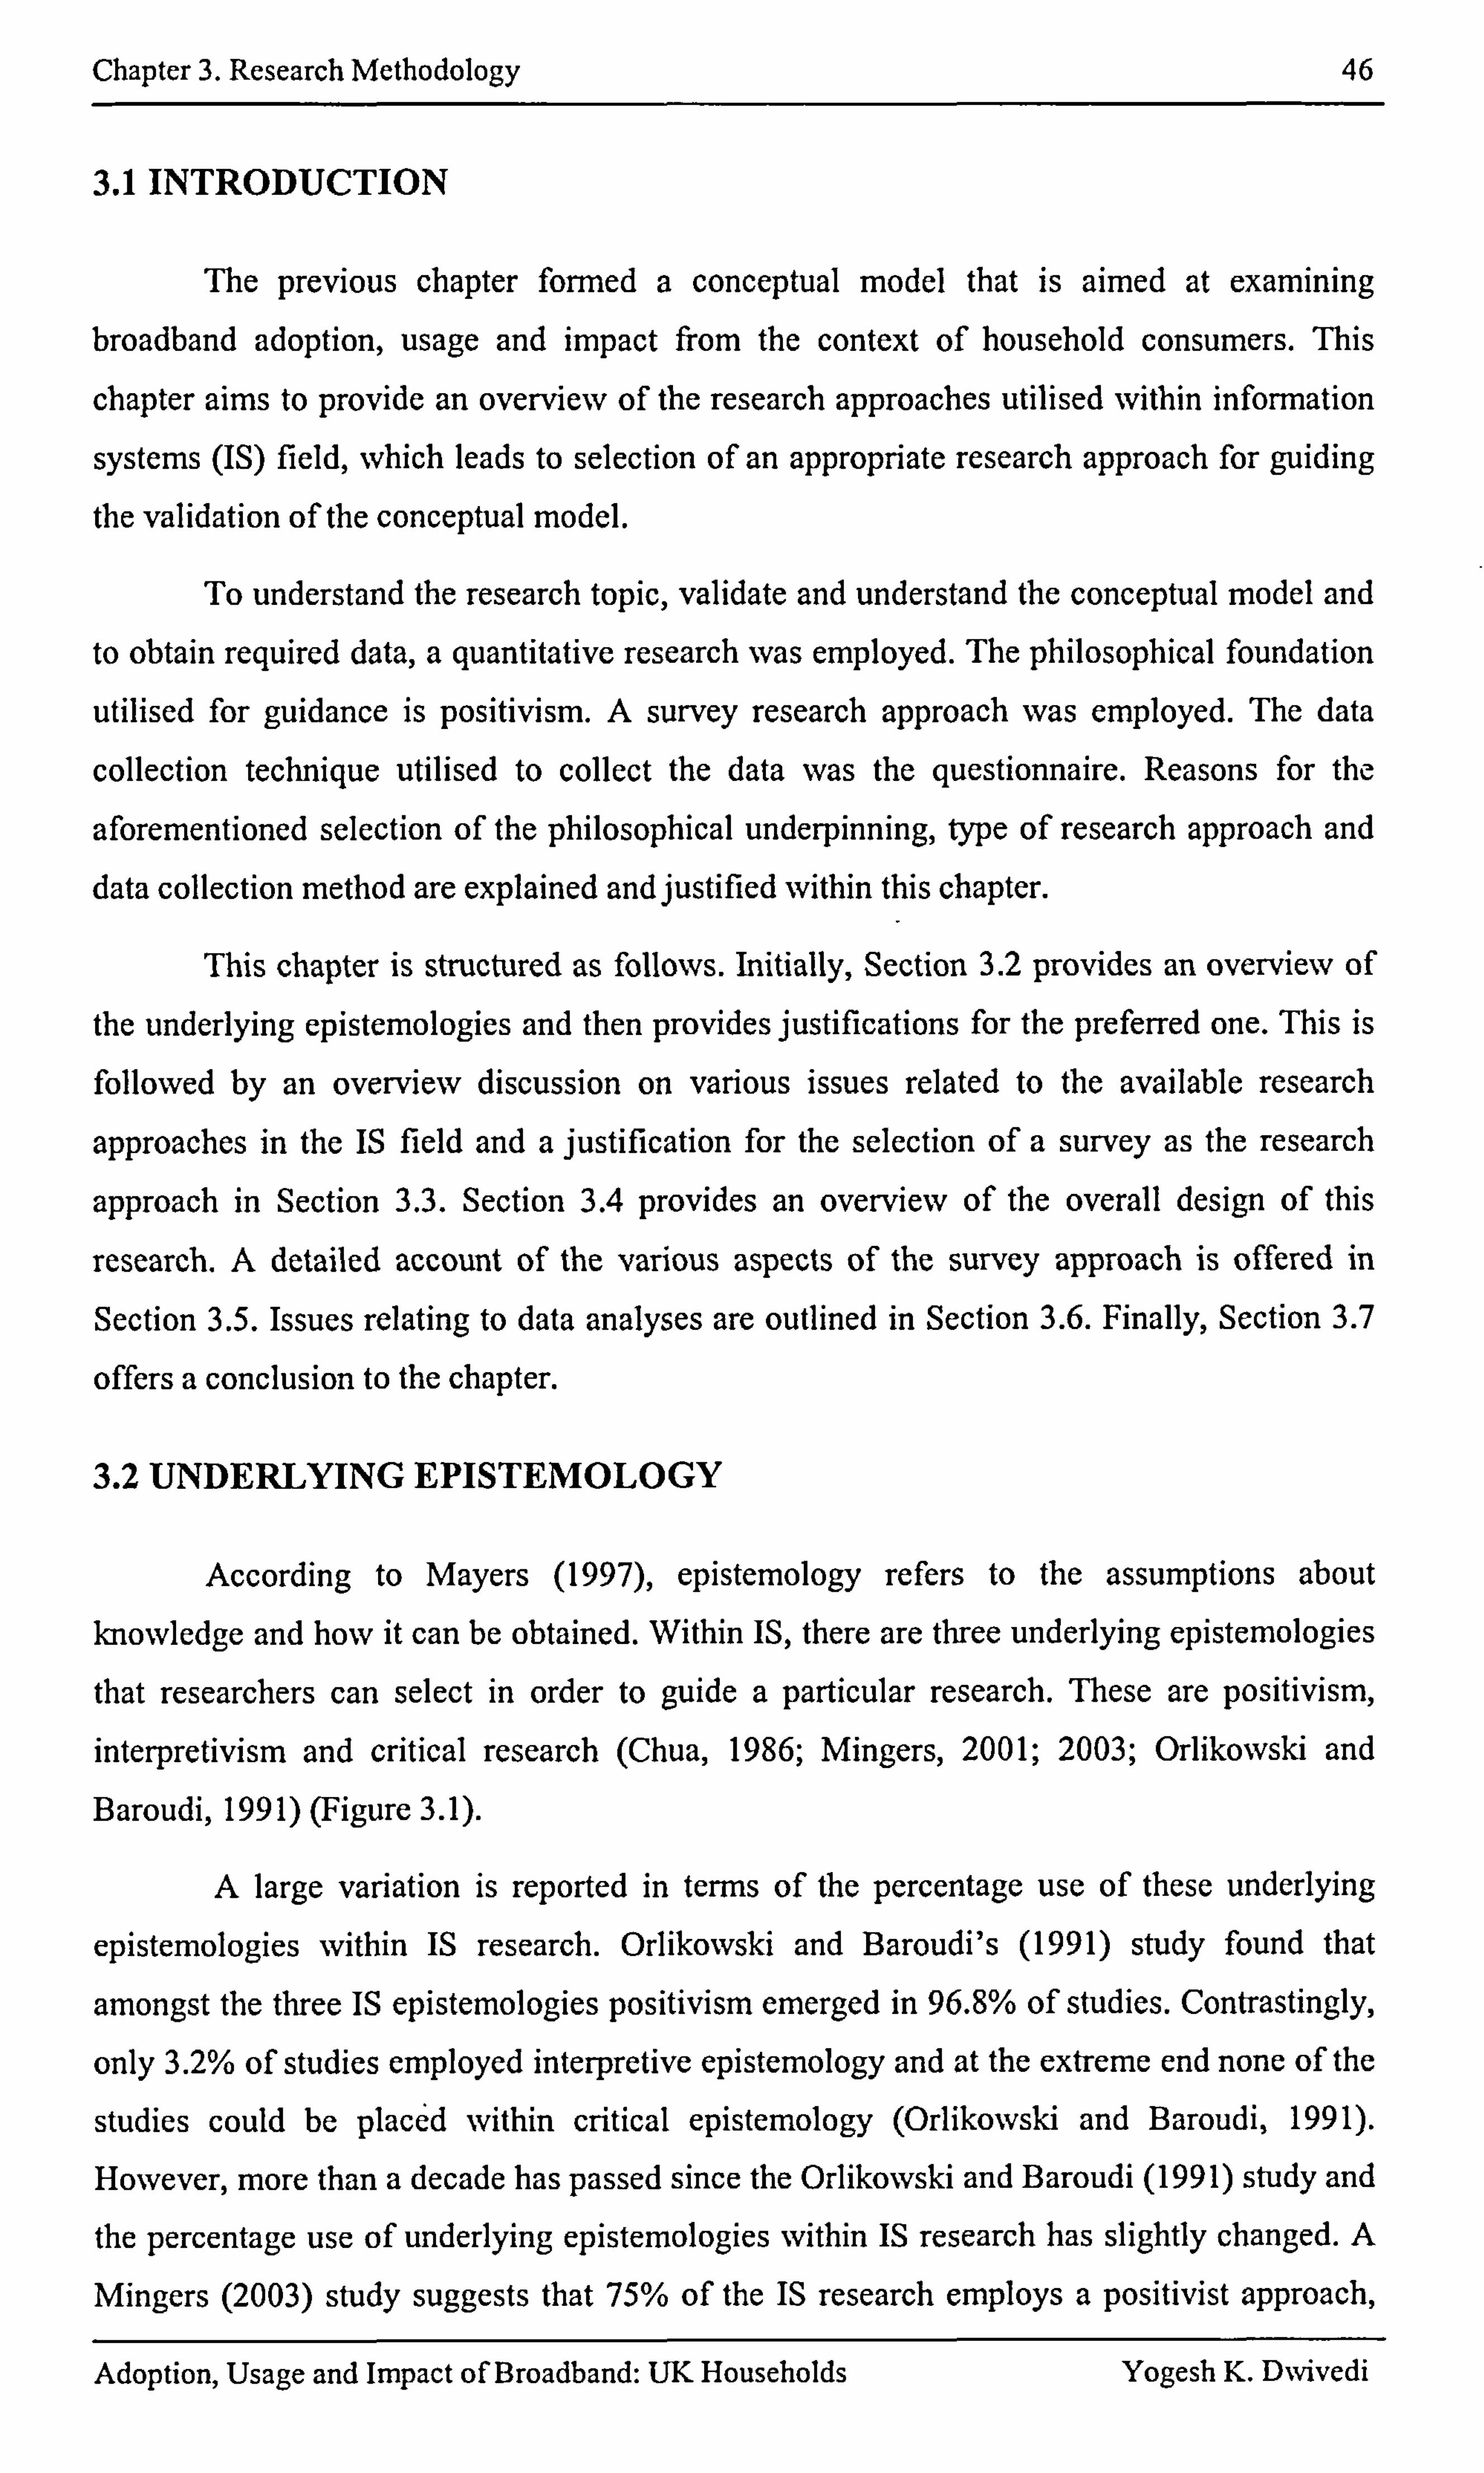
Chapter 3. Research Methodology 46
3.1 INTRODUCTION
The previous chapter fon-ned a conceptual model that is aimed at examining broadband adoption, usage and impact from the context of household consumers. This
chapter aims to provide an overview of the research approaches utilised within information
systems (IS) field, which leads to selection of an appropriate research approach for guiding
the validation of the conceptual model.
To understand the research topic, validate and understand the conceptual model and
to obtain required data, a quantitative research was employed. The philosophical foundation
utilised for guidance is positivism. A survey research approach was employed. The data
collection technique utilised to collect the data was the questionnaire. Reasons for the
aforementioned selection of the philosophical underpinning, type of research approach and data collection method are explained and justified within this chapter.
This chapter is structured as follows. Initially, Section 3.2 provides an overview of
the underlying epistemologies and then provides justifications for the preferred one. This is
followed by an overview discussion on various issues related to the available research
approaches in the IS field and a justification for the selection of a survey as the research
approach in Section 3.3. Section 3.4 provides an overview of the overall design of this
research. A detailed account of the various aspects of the survey approach is offered in
Section 3.5. Issues relating to data analyses are outlined in Section 3.6. Finally, Section 3.7
offers a conclusion to the chapter.
3.2 UNDERLYING EPISTEMOLOGY
According to Mayers (1997), epistemology refers to the assumptions about knowledge and how it can be obtained. Within IS, there are three underlying epistemologies
that researchers can select in order to guide a particular research. These are positivism, interpretivism and critical research (Chua, 1986; Mingers, 2001; 2003; Orlikowski and Baroudi, 199 1) (Figure 3.1).
A large variation is reported in tenns of the percentage use of these underlying
epistemologies within IS research. Orlikowski and Baroudi's (1991) study found that
amongst the three IS epistemologies positivism emerged in 96.8% of studies. Contrastingly,
only 3.2% of studies employed interpretive epistemology and at the extreme end none of the
studies could be placed within critical epistemology (Orlikowski and Baroudi, 1991).
However, more than a decade has passed since the Orlikowski and Baroudi (1991) study and
the percentage use of underlying epistemologies within IS research has slightly changed. A
Mingers (2003) study suggests that 75% of the IS research employs a positivist approach,
Adoption, Usage and Impact of Broadband: UK Households Yogesh K. DNvivedi
Chapter 3. Research Methodology 47
17% interpretivist and only 5% critical research (Mingers, 2003). The statistics suggest that
positivism is a most favoured underlying epistemology within IS research.
Orlikowski and Baroudi (1991) defined research as positivist if there was evidence
of formal propositions, quantifiable measures of variables, hypothesis testing, and the
drawing of inferences about a phenomenon from the sample to a stated population (Orlikowski and Baroudi, 1991). Straub et al (2005) described positivism from the statistical
point of view to suggest that the objective of statistics (mainly T, F, and Chi-square
statistics) employed by the Quantitative Positivist Research (QPR) is to falsify the null hypothesis, which is the assumption that the data in the dependent variable are not affected by the data in the independent variable(s). Since each theoretical hypothesis (the hypothesis
as stated in the theory) should be the exact opposite of its null hypothesis by predicting ý
difference in the dependent variable, it follows logically that if the null hypothesis is
rejected, then presumably the theoretical hypothesis is supported (Straub et al, 2005).
Since this research provides evidence of propositions (Chapter 2), quantifiable
measures of variables (Chapter 4), hypothesis testing and the drawing of inferences about a
phenomenon from the sample to a stated population (chapters 5 and 6), the positivist
epistemology was considered to be appropriate for this research. A further discussion on this
issue is provided in last paragraph of this section. However, the next two paragraphs briefly
discuss the relevance of the other two epistemologies for this research.
QUANTITATIVE RESEARCH II QUALITATIVE RESEARCH
Positivist II Interpretive II Critical
Figure 3.1 Epistemological Assumptions for Qualitative and Quantitative Research (Source: Adopted from Straub et al, 2005)
Mayers (1997) suggested that interpretive researchers start out with the assumption
that access to reality (given or socially constructed) is only through social constructions such
as language, consciousness and shared meanings. Boland (1985) suggested that hermeneutics
and phenomenology are the philosophical basis of interpretive research. According to
Walsharn (1993), the aim of interpretive studies is to "understand the context of the IS, and
the process whereby the information system influences and is influenced by the context". In
contrast to positivist research, the focus of interpretivist research is on the full complexity of
Adoption, Usage and Impact of Broadband: UK Households Yogesh K. DNvivedi
Chapter 3. Research Methodology 48
human sense making as the situation emerges (Kaplan and Maxwell, 1994). Since
interpretivist epistemology focuses upon the complexity of human sense making, it was
necessary to pursue research employing qualitative data collection (Mayers, 1997; Straub el
al, 2005) with very limited respondents. The purpose of this research was to gather evidence in a quantitative manner; hence interpretivist epistemology was considered to be less
relevant for this research.
According to Mayers (1997), "critical researchers assume that social reality is
historically constituted and that it is produced and reproduced by people. Although people
can consciously act to change their social and economic circumstances, critical researchers
recognize that their ability to do so is constrained by various forms of social, cultural and
political domination". The main task of critical research is seen as being one of social I
critique, whereby the restrictive and alienating conditions of the status quo are brought to light (Mayers, 1997). Critical research focuses on the oppositions, conflicts and
contradictions in contemporary society, and seeks to be emancipatory, i. e. it should help to
eliminate the causes of alienation and domination (Mayers, 1997). The critical epistemology
was considered to be less appropriate for undertaking this research. This is because the
purpose of the current research is not to focus upon the oppositions, conflicts and
contradictions, instead it investigates factors that at this particular point of time are affecting
the adoption of broadband. An additional reason is that the purpose of this research was to
gather evidence in a quantitative manner, which critical epistemology does not facilitate.
After considering all the three underlying epistemologies, this research that
examines broadband adoption within UK households adopted positivist epistemology. This
is because technology adoption and diffusion is considered to be one of most mature areas
within IS research. Due to its long tradition of research, a number of theories and models have been developed and validated for examining a variety of technological objects. Consequently, a variety of constructs (dependent and independent variables) suitable for
diverse situations are available which can rationally be adapted to examine the adoption and diffusion of new technologies (Venkatesh et al, 2003). This was the basis for developing a
conceptual model of broadband adoption and fonnulating the research hypotheses presented in Chapter 2. Following Straub et al's (2005) description of positivism, this research will
employ statistics, such as the T, F, and Chi-square test, to determine if this data supports the
research hypotheses (Straub et al, 2005). This research does not suggest that the other two
episternologies cannot be applied to this research. It is argued that for this research context,
positivism is much more appropriate and feasible.
Adoption, Usage and Impact of Broadband: UK Households Yogesh K. Divivedi
Chapter 3. Research Methodology 49
3.2.1 Quantitative and Qualitative Data
According to Myers (1997) qualitative data is derived from various sources that include observation and participant observation (fieldwork), interviews and questionnaires, documents and texts, and the researcher's impressions and reactions. Qualitative data are
useful means to understand people and the social and cultural contexts within which they live (Myers, 1997). Comford and Smithson (1996) described quantitative data as metrics (numbers) that can be used to describe the phenomenon (objects and relationships) under
study. Straub el al (2005) argued that the numbers come to represent values and levels of theoretical constructs and concepts and the interpretation of the numbers is viewed as strong
scientific evidence of how a phenomenon works (Straub et al, 2005). Sources of quantitative data in the social sciences include survey methods, laboratory experiments, fon-nal methods (e. g. econometrics) and numerical methods such as mathematical modeling (Myers, 1997;
Straub el al, 2005). Since data utilised in this research -were collected employing survey
methods (Myers, 1997) and represent values and levels of theoretical constructs (Myers,
1997; Straub et al, 2005) such as relative advantage, utilitarian outcomes, hedonic outcomes,
service quality, primary influence, secondary influence, self-efficacy, knowledge, facilitating
conditions resources and behavioural intentions, the data collected in this research belongs to
the quantitative category than qualitative.
3.3 RESEARCH APPROACHES
3.3.1 Taxonomy of IS Research Approaches
When conducting any research, selecting an appropriate method is a critical issue. In
the IS area, several attempts have been made to review and classify research approaches (Galliers, 1992; Galliers and Land, 1987; Mingers, 2001; 2003; Nandhakumar and Jones,
1997; Orlikowski and Baroudi, 1991; Walsham, 1995a; 1995b). Early work was under-taken by Galliers (1992), who provided a taxonomy of prevalent IS research approaches. This
taxonomy considered a range of positivist and interpretive research approaches including
experiments, surveys, case studies, theorem proof, forecasting, simulation, reviews, action
research, futures research, and role/game playing (as shown in Appendix 3.1). The other
early research was by Orlikowski and Baroudi (1991), who offered a philosophically
reflective paper with a North American perspective. In this work, the emphasis was on
categorising published IS. research according to the used cpistemologies, and it was found
that although positivism was prevalent, critical epistemology (Orlikowski and Baroudi,
1991) was also beginning to emerge. Similar to Orlikowski and Baroudi (1991), a recent
classification by Minger (2003) also categorised IS research approaches into three
Adoption, Usage and Impact of Broadband: UK Households Yogesh K. DNvivedi
Chapter 3. Research Methodology 50
categories, including critical research. Straub el al (2005) have divided positivist research in
two categories, namely quantitative positivist research (QPR) such as lab and field
experiment and field study, and non-quantitative positivist research (Non-QPR), for example
case study and participative research. A list of the IS research approaches is offered in
Appendix 3.1.
The extant IS literature suggests that different terms are used for the same research
methods (Mingers, 2003). For instance, the terms 'survey' and 'questionnaire' are used indistinguishably (Mingers, 2003). Contrastingly, the terrns 'case study' and 'interviews' are
used synonymously, although they are distinct from each other (Mingers, 2003). Bearing this
in mind, it was felt that it was necessary to clarify the various terms that are used for
different types of research approaches. For this purpose, we adopted Mingers' classificatioý
and description of research approaches (Mingers, 2003). This classification was followed for
two reasons: first, Mingers' research is the most recently published work; second, it
encompasses a variety of research approaches associated with all three epistemological
standpoints, namely positivist, inte? pretivist and critical. As a reminder, positivist research
methods include observations, measurements, surveys, questionnaires, instruments,
laboratory and field experiments, statistical analysis, simulations, and case studies. Interpretivist research methods consist of interviews, qualitative content analysis,
ethnography, grounded theory, and participant observation. Finally, the critical standpoint involves intervention and change, employing the methods of action research, critical theory,
and consultancy (Mingers, 2003). The detailed descriptions of the aforementioned research
approaches are provided in Appendix 3.2.
3.3.2 Trend of Research Approaches Use in Information Systems
Mingers (2001; 2003) conducted a review of all the papers published during 1993-
1998, in two leading American journals (MIS Quarterly (MISQ) and Inforination Systellis
Research (ISR)) and four European ones (European Journal of Information Systeins (EWS),
Inforniation Systenis Journal (ISJ), Jounial of Accounting, Managenient and IT (JAMIT),
and Jounial of Infonnation Technology (JII)). The findings of this study suggest that about 80% of the evaluated papers contain some form of empirical research, where surveys, interviews, experiments and case studies are the dominant approaches. Alternatively,
approaches like participant observation, grounded theory and soft systems methodology are
rarely used.
The aforementioned studies provide evidence that although several research methods
are suggested (Galliers, 1992; Orlikowski and Baroudi, 1991; Minger, 2003), only surveys,
experiments, interviews, and case studies are predominantly used within the IS area.
Adoption, Usage and Impact of Broadband: UK Households Yogesh K. Divivedi
Chapter 3. Research Methodology 51
3.3.3 Trend of Research Approaches Use within Technology Adoption Research
Previous studies have been focused upon examining the trends of IS research
approaches in general. However, little information is available for the trends of the research
approaches used for the specific research domain, such as technology adoption and diffusion.
Therefore, an examination of the literature was conducted to ascertain the research
approaches employed in the area of technology adoption and diffusion. This was pursued by
examining the following:
(i) Since focus of this research is broadband adoption and use, prevalence of different research approaches in the area of technology adoption were examined. Since the context of this research is the household, the prevalence of different
research approaches in the area of technology adoption and use within the
household context were examined. In order to determine an appropriate research approach for examining household
consumers, the relationship between the research approaches used and the types
of unit of analysis (i. e. users, consumers, organisations) was examined.
To explore the above, a review of articles was undertaken, selecting from those
published within peer-reviewed and highly rated journals including MISQ, ERS, M, ISR,
and other relevant publications. Since Mingers' (2003) method was used, the sample
selection used in this research was very close to this study. Since aforementioned journals
were examined in Mingers' (2003) study, they were also selected for this study. To avoid
any bias and to obtain a common perspective, two American and two European IS Journals
were examined to review trends of research approaches in the technology adoption and usage
area.
A total of 633 published articles appearing during the 1992-2003 period in four IS
journals were examined to select the empirical papers addressing the issue of technology
adoption and usage. This research followed Mingers' definition of an empirical paper, which
states that a paper is empirical if it reports on new data (of any kind) that has been generated by the underlying research and the resultant analysis is a substantive part of the paper's
contribution (Mingers, 2003). Empirical papers focusing on the aforementioned area were
then studied and their research approach was recorded (Appendix 3.3). Since IS research on
technology adoption focuses on users as research artefacts, another wider search of the
relevant literature was conducted. This was done in order to examine the approaches used to
study adoption and usage of technology in the household context (Appendix 3.4).
Adoption, Usage and Impact of Broadband: UK Households Yogesh K. Dwivedi
Chapter 3. Research Methodology 52
From the 633 examined articles, 31 articles (4.9%) addressed issues related to
technology adoption. This proportion in specific IS journals were as follows: MISQ (6%),
ISR (5.15 %), EJIS (5%) and ISJ (2.63%).
The analysis of the articles suggests that the researchers investigating technology
adoption used two main research approaches, namely the survey and case study. 74% of the
articles employed the survey approach, which suggests that it is the most widely used
approach in technology adoption research. This then led this research to consider the survey
approach.
Further support was obtained from previous findings and evidence that the survey
approach is more dominant in the IS area (Farhoomand, 1992; Mingers, 2001; 2003;
Orlikowski and Baroudi, 1991). The remaining 26% of the research employed the case study
method. No other approaches were employed to investigate the use or adoption of technology. Another interesting observation is that the case study approach was exclusively
employed to study the organisational adoption of technology, while surveys were used to
study a range of contexts. For example, surveys were used to study technology adoption
within the context of technology users, household and online consumers, senior executives
and small firms. Although technology adoption is a common topic within the IS area (Venkatesh et al, 2003), the research approaches used are of very limited diversity.
The review of the previous articles also suggests that research on technology
adoption in the context of the household has just begun to emerge. IS researchers have
mainly focused on organisational issues. Therefore, another attempt was made to identify
publications, which addressed technology adoption issues in the household context. For this
purpose, articles were extracted from both the IS and non-IS journals including Advances ill
Consinner Research, Ainerican Behavioral Scientist, Jouriial of Marketing, Management
Science, and Jounial ofEcononzic Psycholqy.
Analysis of the selected articles indicated that the survey approach is once again dominant in the study of consumer adoption of technology in the household context. The
survey approach was employed in 63% of the articles. The range of tools employed to
conduct a survey include the postal service, telephone, face-to-face interviews and web
questionnaires. 25% of the research reported was conducted using a multi-method approach,
whereby a combination of the survey with either an interview or time-use diary was
employed. Other methods used were the ethnographic study and analysis of secondary data
obtained from census figures. For the purpose of investigating the adoption of technology
(especially ICTs) within the household, the survey approach seemed to be the most
predominant. Other approaches including the multi-method, ethnographic study, and
Adoption, Usage and Impact of Broadband: UK Households Yogesh K. DNvivedi
Chapter 3. Research Methodology 53
secondary data analysis were employed mostly for investigating the usage of technology in
the household.
The findings suggest that the survey was the most widely used approach to examine the technology adoption issues both in the context of the organisations and households. The
case study approach was employed only for investigating technology adoption issues in the
organisational context, particularly when the unit of analysis was the organisation rather than
the individual users. This approach was not employed in the household context. Other
approaches such as the ethnographic study and time-use diaries were employed in the
household context, but not in the organisational context. The justification for this is provided below.
3.3.4 Justification for Survey as a Preferred Research Approach
From the findings of the above section it can be concluded that although a range of
research approach is available to IS researchers, the survey as a research approach is most
widely employed for examining technology adoption related issues. The choice of approach
seems to correspond with the unit of analysis. When the researchers considered the
organisation as a unit of analysis, the case study approach was favoured. In studies related to
individual users or consumers, the survey approach was favoured. This can be attributed to
issues such as convenience, cost, time and accessibility (Gilbert, 2001). The extent to which
a researcher can be a part of the context being studied is also a factor that plays an important
role for determining a research approach. Within the household context, it is difficult for a
researcher to be a part of the context; therefore the survey approach would be more feasible
than others, such as ethnography and observations. Furthermore, the aim of this research was to examine broadband adoption and diffusion across the UK or using a nationwide
perspective. Hence, in order to get an overall picture of the research issue, collecting data
from a large number of participants from across the UK is required. This means employing
any other approach such as ethnography that utilises an interview or observation, as data
collection tools demand huge amounts of financial resources, manpower and time. As this is
a student research project, all three factors limited the ability of the researcher when investigating this research issue.
Selection of the approach in this case was also influenced by the type of theory and
models employed to examine broadband adoption and diffusion research (Chapter 2). The
conceptual model proposed in Chapter 2 includes a number of research hypotheses that need to be tested before concluding this study. This requires collecting quantitative data and
statistical analysis in order to test research hypotheses. Although a number of research
approaches are available within the category of quantitative positivist research (Straub el al,
Adoption, Usage and Impact of Broadband: UK Households Yogesh K. DNvivedi
Chapter 3. Research Methodology 54
2005, Appendix 3.1), a survey is the only appropriate research approach that can be
employed to conduct such research (i. e. that require hypotheses testing and validation of the
conceptual model) in a social setting, in this instance the household. One of the planned
contributions of this study is to provide insights to the Internet service providers (ISPs) about the factors that are salient to consumer adoption and non-adoption of broadband and to
establish a relationship Nvith behavioural intention and actual adoption. In order to achieve this, it was essential to collect quantitative data on a number of variables including
demographics and thereafter perform a regression analysis to identify a relationship. This
was again a logical reason for adopting the survey as a research approach and collect
quantitative data that may help ISPs to understand the behaviour of household consumers
and their demographic characteristics, in order to encourage and promote broadband
adoption.
On the basis of the aforementioned reasoning, it was decided that the survey is one
of the most appropriate and feasible research approaches to conduct this research. The next
section provides details on the strategy that was used to execute this research, followed by a detailed discussion on various aspects of the survey approach in the context of broadband
adoption, usage and impact related issues.
3.4 RESEARCH STRATEGY
Figure 3.2 illustrates the research strategy followed to conduct a survey research
approach for examining broadband adoption, usage and impact in the UK households. The
research strategy of this research (Figure 3.2) is similar to previous survey research
conducted in the IS field (Davis, 1989; Moore and Benbasat, 1991; Taylor and Todd, 1995).
Developing a conceptual model and formulating hypotheses (Chapter 2) guided the selection
of the survey research approach. Since the context of this study was different to previous
studies from which constructs were adopted, it was essential to validate the survey instruments before data collection. Therefore, development of an instrument was considered
as the next step in this research, which was performed in three stages, namely exploratory
survey, content validity and pre and pilot test. Gradual development and validation in these
stages aimed to overcome the limitations and improve the content and reliability of the
survey instrument (Davis, 1989; Moore and Benbasat, 1991). Other critical issues are sample
selection, instrument administration and data analysis. These issues are discussed and detailed justifications are provided in the remaining sections of this chapter. After
determining the sample, the development and validation of the survey instrument occurred (Chapter 4). This was followed by the data collection and analysis (Chapter 5) and the
Adoption, Usage and Impact of Broadband: UK Households Yogesh K. DNvivedi
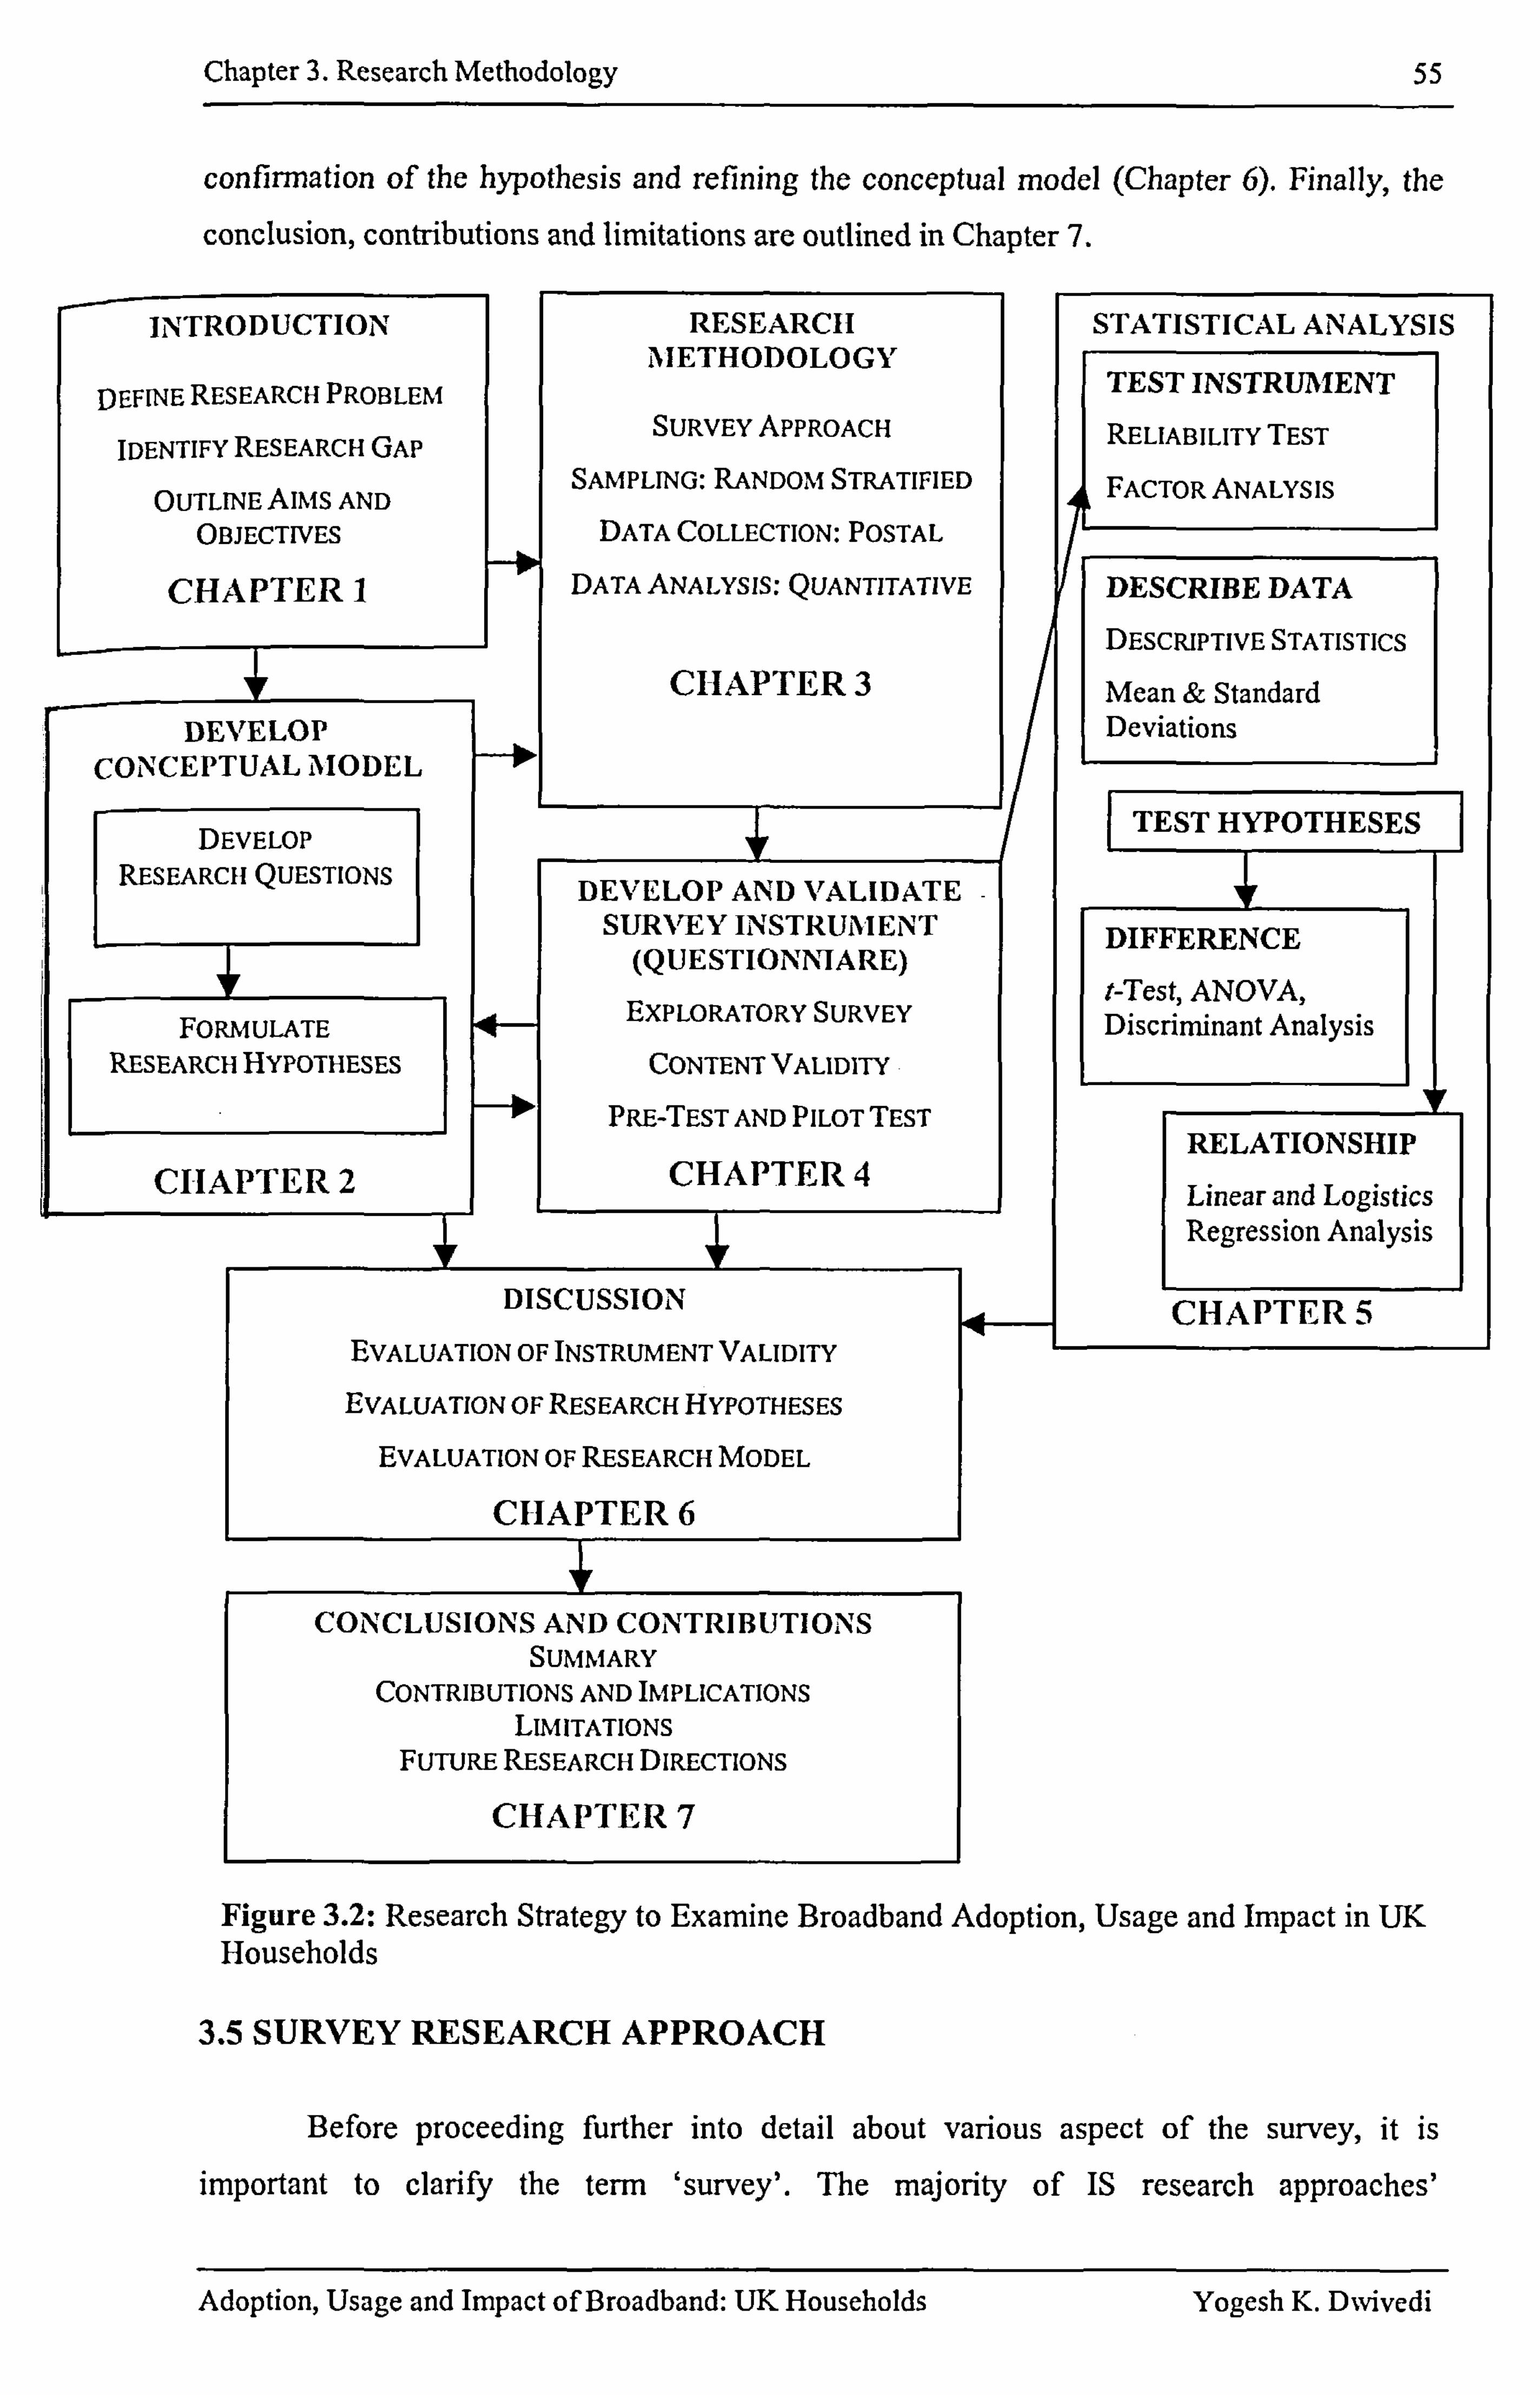
Chapter 3. Research Methodology 55
confirmation of the hypothesis and refining the conceptual model (Chapter 6). Finally, the
conclusion, contributions and limitations are outlined in Chap ter 7.
INTRODUCTION RESEARCH STATISTICAL ANALYSIS METHODOLOGY
DEFINE RESEARCH PROBLEM TEST INSTRUMENT
IDENTIFY RESEARCH GAP SURVEY APPROACH RELIABILITY TEST
OUTLINE AIMS AND SAMPLING: RANDOM STRATIFIED FACTORANALYSIS
OBJECTIVES DATA COLLECTION: POSTAL
CHAPTER I DATA ANALYSIS: QUANTITATIVE r
DESCRIBE DATA
_ DESCRIPTIVE STATISTICS CHAPTER 3 Mean & Standard
DEVELOP I Deviations
CONCEPTUAL MODEL
DEVELOP I TEST HYPOTHESES RESEARCH QUESTIONS
DEVELOP AND VALIDATE SIJRVýEY INSTRUMENT DIFFERENCE
(QUESTIONNIARE) t-Test ANOVA
FORMULATE EXPLORATORY SURVEY , Discnnunant Analysis
RESEARCH HYPOTHESES CONTENT VALIDITY
PRE-TEST AND PILOT TEST RELATIONSHIP
CHAPTER 2 CHAPTER4 Linear and Logistics
i Regression Analysis
DISCUSSION CHAPTER 5 EVALUATION OF INSTRUMENT VALIDITY
EVALUATION OF RESEARcH HYPOTHESES
EVALUATION OF RESEARCH MODEL
CHAPTER 6
CONCLUSIONS AND CONTRIBUTIONS SUMMARY
CONTRIBUTIONS AND IMPLICATIONS LIMITATIONS
FUTURE RESEARCH DIRECTIONS
CHAPTER 7
Figure 3.2: Research Strategy to Examine Broadband Adoption, Usage and Impact in UK Households
3.5 SURVEY RESEARCH APPROACH
Before proceeding further into detail about various aspect of the survey, it is
important to clarify the term 'survey'. The majority of IS research approaches'
Adoption, Usage and Impact of Broadband: UK Households Yogesh K. Divivedi
Chapter 3. Research Methodology 56
classifications (Galliers, 1992; Galliers and Land, 1987; Mingers, 2001; 2003; Nandhakumar
and Jones, 1997; Orlikowski and Baroudi, 1991) have employed the term 'survey' as an
approach within which a number of data collection techniques, such as mail, telephone and interviews are available and can be utilised for data collection purposes. However, Straub et
al (2005) have denoted the term 'survey' as a data collection technique along with others
such as interviews within the field study as a research approach. This study adopts the first
view that denotes the survey as a research approach (Galliers, 1992; Galliers and Land,
1987; Mingers, 2001; 2003; Nandhakumar and Jones, 1997; Orlikowski and Baroudi, 1991).
This is because the survey as a research approach is the most widely accepted view and is
older in its acceptance within the research community. Therefore, hereafter, within this study the term 'survey' represents a research approach that is utilised to conduct this study. The
data collection technique in this research is also referred to as a questionnaire or research instrument. To provide more information on the survey, the following subsections discuss
various aspects of the survey research approach.
There are three essential components of the survey research approach, which are
sampling, data collection and instrument development (Fowler, 2002). Fowler (2002)
suggested that it is obligatory for a good survey design to combine all the three
aforementioned components. The first component, sampling, involves the selection of a
small subset of a population that is representative of the whole population. The most important thing to consider in a good sample is applying a technique that gives all or nearly
all the population members the same chance of being selected (Fowler, 2002). The data
collection can be conducted employing techniques such as in-person, telephone, mail and the
Internet; however, the selection should be made after evaluating the advantages and disadvantages from the perspective of a particular research context (Fowler, 2002).
Therefore, in order to evaluate the advantages and disadvantages from the perspective of this
research, various aspects of sampling and data collection are discussed below. The third
component, 'instrument development', is briefly introduced below and a detailed description
is provided in the next chapter (Chapter 4).
3.5.1 Sampling
Fowler (2002) has suggested following five critical issues with regards to sampling. These issues consist of. (1) the choice of whether or not to use a probability sample; (2) the
sample frame (those people who actually have the opportunity to be sampled); (3) the size of the sample; (4) the sample design (the particular strategy used for sampling a household
consumer); and (5) the rate of response (the percentage of those sampled from whom the
Adoption, Usage and Impact of Broadband: UK Households Yogesh K. D%vivedi
Chapter 3. Research Methodology 57
data are actually collected). The first four issues are discussed within this section and the last
one, 'response rate', will be discussed in the Section 3.5.2.
3.5.1.1 The Sample Frame
According to Fowler (2002), in a sample selection procedure, people who have a
chance of being included among those being selected constitute the sample frame, and that is
considered to be primary step towards evaluating the quality of a sample. Three ways a
sample selection can be made are as follows (Fowler, 2002): (1) from a more or less
complete list of individuals in the studied population; (2) from a set of people who go
somewhere or do something that enables them to be sampled; and (3) in this method,
sampling is done in two or more stages: the first stage involves creating a list of individual's
and the second sample selection step is made from created list.
Three characteristics comprising comprehensiveness, probability of selection and
efficiency of the sample frame need to be evaluated in order to select an appropriate sample frame (Fowler, 2002). If any sample frame excludes some proportion of the selected
population then it is considered to be less comprehensive. Such a sample frame is less
preferred when considering the selection of sample frame (Fowler, 2002). Probability of
selection is referred to in that each individual should appear once and only once in a good
sample frame in order to provide an equal chance for every entry in the selection process. It
means that the sample frame should be checked for repetitions of entries. If some entries are
repeated more than once in a sample frame then they have more chances to be selected than
others. Therefore, such sample frames should be avoided or less preferred. When a sample frame does not include units that are not among those that the researcher wants to sample,
then it considered as an efficient sampling frame (Fowler, 2002).
Similar to the above, Rice (1997) suggested six criteria of a good sampling frame
comprising completeness, accuracy, adequacy, being up-to-date, convenience and non- duplication. Completeness refers to all the members of the population included in a list who have reliable addresses and information (i. e. accuracy). Adequacy is similar to completeness
and refers to a sampling frame covering the entire population. Up-to-date simply refers to
information included in sampling frame that is regularly updated. Convenience refers to a
sampling frame that is readily accessible. Finally, non-duplication refers to each member of
the population appearing on a list only once (Rice, 1997). A recommended sample frame that
satisfies all but one aforementioned criterion for the UK population is the Electoral Register
(a list of individuals) (Rice, 1997). 'Mis sample frame is readily available but, due to recent
changes in the Data Privacy Act, the LJK government prohibits access and use of the
electoral role for research and marketing purposes.
Adoption, Usage and Impact of Broadband: UK Households Yogesh K. D%vivedi
Chapter 3. Research Methodology 58
In an email communication with the British library it was suggested that an
alternative to the Electoral Register is a commercially available CD Rom called 'UK-Info
Disk V1 F that consisted of a degree of similar comprehensiveness, accuracy, adequacy, and
up-to-date and non-duplicated infon-nation. The added advantages of this sample frame are
that it is legally accessible/available for purchase and its mailing list can be prepared faster
as there is no need to type addresses; instead this can be achieved just by copying and
pasting relevant records. Therefore, due to the inaccessibility of the Electoral Register, it was decided that it is appropriate to utilise an alternative sample frame such as the 'UK-Info Disk
V1 I' for the UK population. The UK-Info Disk VI I contained 31 Million Electoral Register
records, i. e. addresses of UK citizens (www. 192. com).
3.5.1.2 Sampling Techniques
After determining that the UK-Info Disk VI I was a cost-effective, comprehensive
and efficient sample frame, the next step was to decide upon a selection technique for
respondents to be included in the final study. Fowler (2002) suggests a number of techniques
that can be utilised for selecting respondents from a sample frame. Amongst them the
probability sampling techniques include simple random, systematic and stratified sampling.
This research has utilised stratified random sampling as a sampling technique. A brief
account on simple random, systematic and stratified sampling is provided and then the
reasons for its selection of stratified sampling are discussed below.
Conducting a simple random sampling required a numbered list of the target
population with each entry appearing once and only once. Then the required amount of
random numbers needed to be generated within a specified range of numbers. This could be
done utilising a computer program, a table of random numbers or some other generator of
random numbers. Entries corresponding to the total amount of random numbers selected then
constitute a sample random sample of the target population (Fowler, 2002).
Since ordering and numbering a large target population can be cumbersome, laborious and time consuming, an alternative to replace this technique is systematic
sampling. Systematic sampling is not only mechanically easier to create but it also allows
obtaining the benefits of stratification more easily without compromising the precision of
sampling. Creating a systematic sample involves determining the total number of entries in a
sample frame and then selecting a number of entries from the list. A division of latter values by the former one will produce a fraction. This estimated fraction is utilised as an interval
every time a number is drawn and the composite of which makes the systematic sample (Fowler, 2002).
Adoption, Usage and Impact of Broadband: UK Households Yogesh K. DNvivedi
Chapter 3. Research Methodology 59
When a sample frame is divided by a number of subgroups on the basis of the
characteristics of the target population and the total number of entries differing in the
subgroups, then it is not considered appropriate to apply either simple random sampling or
systematic sampling. For example, the UK population is divided into various boroughs that differ in terms of their total population; therefore, it is not appropriate to apply both simple
random and systematic sampling. This is due to the difference in the size of subgroups and the fact that entries from the larger subgroups would have more chances to be selected than
the smaller ones. In this situation it is appropriate to apply the stratified random sampling techniques. The initial step of this sampling technique involves estimating how many entries
need to be selected from each subgroup according to its total size. This can be achieved by
dividing the total number of entries in a subgroup from the total sample size. Once the
numbers of entries for all the estimated subgroups are obtained, the selection can be made from each subgroup according to the sample random or systematic sampling process. Thereafter, combining all the entries selected from the various subgroups offers a stratified
random sample (Fowler, 2002).
Of the three sampling techniques discussed above, the structure of the sample frame
(i. e. UK-Info Disk VI I) of this research necessitated the adoption of the third approach 'stratified random sampling'. This is because within the UK-Info Disk V1 I database, the
entire UK population was alphabetically listed by family name. The number of entries varied
according to the alphabet. Therefore to obtain a sample in equal proportion from the entire
alphabet, it was most suitable to adopt the stratified sampling approach. Initially, in order to draw a stratified random sample a respondent address from each letter of the alphabet was
extracted. Then the sample size for each alphabet was determined according to the total
sample size. Thereafter, a unique random number for each alphabetical letter was generated
using the research randomiser software. Respondents to the corresponding random numbers
were then selected for data collection from the sample frame (i. e. UK-Info Disk V1 1).
3.5.1.3 Sample Size
This is a most commonly encountered issue in a survey research where researchers look for a basis to determine the sample size. There are three commonly used approaches to determine the sample size, but Fowler (2002) suggested that they are not an appropriate way to determine the sample size. These three commonly used approaches include determining
the sample size based on the total size of the target population, deciding it on the basis of a
recommended standard size, and determining it based on how large a margin of error can be
tolerated in a research.
Adoption, Usage and Impact of Broadband: UK Households Yogesh K. DNvivedi
Chapter 3. Research Methodology 60
The first approach of determining a sample is based on an inappropriate reasoning that the adequacy of a sample depends heavily on the fraction of the population included in
that sample; in other words, a large fraction will make a sample more credible (Fowler,
2002). However, since the fraction of the population included in the sample is not a
component of sampling error estimation (i. e. a measure of the precision of the sample), this
approach is not an appropriate basis to determine the sample size (Fowler, 2002).
The second frequently used approach for determining a sample size is to derive it on the basis of the sample size in existing studies; which is inappropriately termed as a standard
survey study (Fowler, 2002). As Fowler (2002) suggests, although it is alright to consider the
sample sizes of a particular population that competent studies have considered appropriate, the sample size decision must be determined on a case-by-case basis. The consideration'
should be based on the variety of goals to be achieved by a particular study and other related
aspects of research design (Fowler, 2002).
The third approach of inappropriate detennination of the sample size is based on the
consideration to the margin of error that is acceptable in a particular research, or the amount
of precision expected from estimates (Fowler, 2002). Fowler (2002) argued that in theory
there is nothing wrong with this approach; however, practically this approach provides little
help to researchers in sample determination due to the following reasons. The majority of
survey studies involve several estimations and the desired precision for these estimates is
likely to vary; therefore, it is not appropriate to make a sample size decision on the need for
precision of a single estimate (Fowler, 2002). Furthermore, it is a less possible situation to
specify an acceptable margin of error in advance.
This approach also assumes that errors only emerge from sampling and ignores the
fact that there are several other sources of error such as response bias. Therefore, Fowler
(2002) suggested that the calculation of precision based solely on the sampling error is an
unrealistic oversimplification, hence forming decisions based on the sample size is
inappropriate (Fowler, 2002).
According to Fowler (2002) the prerequisite for determining a sample size is a data
analysis plan. Data analysis of the current study required utilising a number of statistical techniques such as the principal component analysis (PCA), regression analysis, t-test and
chi-square test. The following section (3.6) provides a detailed discussion for using the
statistical techniques in this research.
It has been suggested that in order to perform rigorous statistical analysis such as the
principal component analysis, the sample size should be above 300 (Stevens, 1996).
Therefore, keeping the statistical analysis plan in mind, it was decided that the total sample
Adoption, Usage and Impact of Broadband: UK Households Yogesh K. D%vivedi
Chapter 3. Research Methodology 61
size should be large enough to obtain a minimum of 300 responses. A rough estimate of the
total sample size was determined by using the pilot response rate as a basis of the final
survey.
Total sample size = [Total responses required X 100] / Pilot response rate
= 300 X 100 / 20 = 1500
As illustrated above, a sample size of 1500 was required to achieve 300 responses. To compensate for any shortfalls in the 300 responses that may occur due to any undelivered
and partially completed responses, the sample size was further increased from 1500 to 1600.
Therefore, a total sample size of 1600 was considered for this study.
3.5.1.4 Sampling Error
Two major categories of errors, the sampling error and nonresponse bias error, are
possible sources of unreliability in survey estimates -(Fowler 2002). This subsection describes the sampling errors found in this research and the next section (Section 3.5.2) will discuss the errors achieved as a result of the nonresponse bias.
Fowler (2002) defined sampling errors as chance variations that occur due to
collecting data based upon a sample of a population. Hence the sampling error is considered to be a random result of sampling in contrast to other bias that are systematically introduced
in survey estimates. The size of sampling errors is determined by the size and design of a
probability sample along with a distribution of what is being estimated (Fowler, 2002).
The statistic that is frequently utilised and recommended for the purposes of
estimating the sampling error is termed to be a standard error of a mean. This is the
standard deviation of the distribution of sample estimates of means for an infinite number of
samples of a given size (Fowler, 2002). The standard error of a mean is calculated from the
variance and size of the sample from which it was estimated.
The value of standard error for 95% of samples of a given size should fall within a
range of plus (+) and minus (-) 1.96 standard errors that are reported as the confidence intervals around a sample estimates. However, only 67% of the mean of samples of a given
size is expected to fall within the range of ±1 standard error of the true population mean. The
estimates of standard error of means vary according to the variable and sample size (Fowler,
2002). This means that different variables included in a study are likely to be characterised by different values of standard errors. This suggests that the values for sampling errors for
the various demographic and key variables of this study are likely to differ from each other.
Table 3.1 illustrates the standard error of the mean of variables included in this
study. The standard error estimates obtained for the various variables suggest that, at a 95%
Adoption, Usage and Impact of Broadband: UK Households Yogesh K. DNvivedi
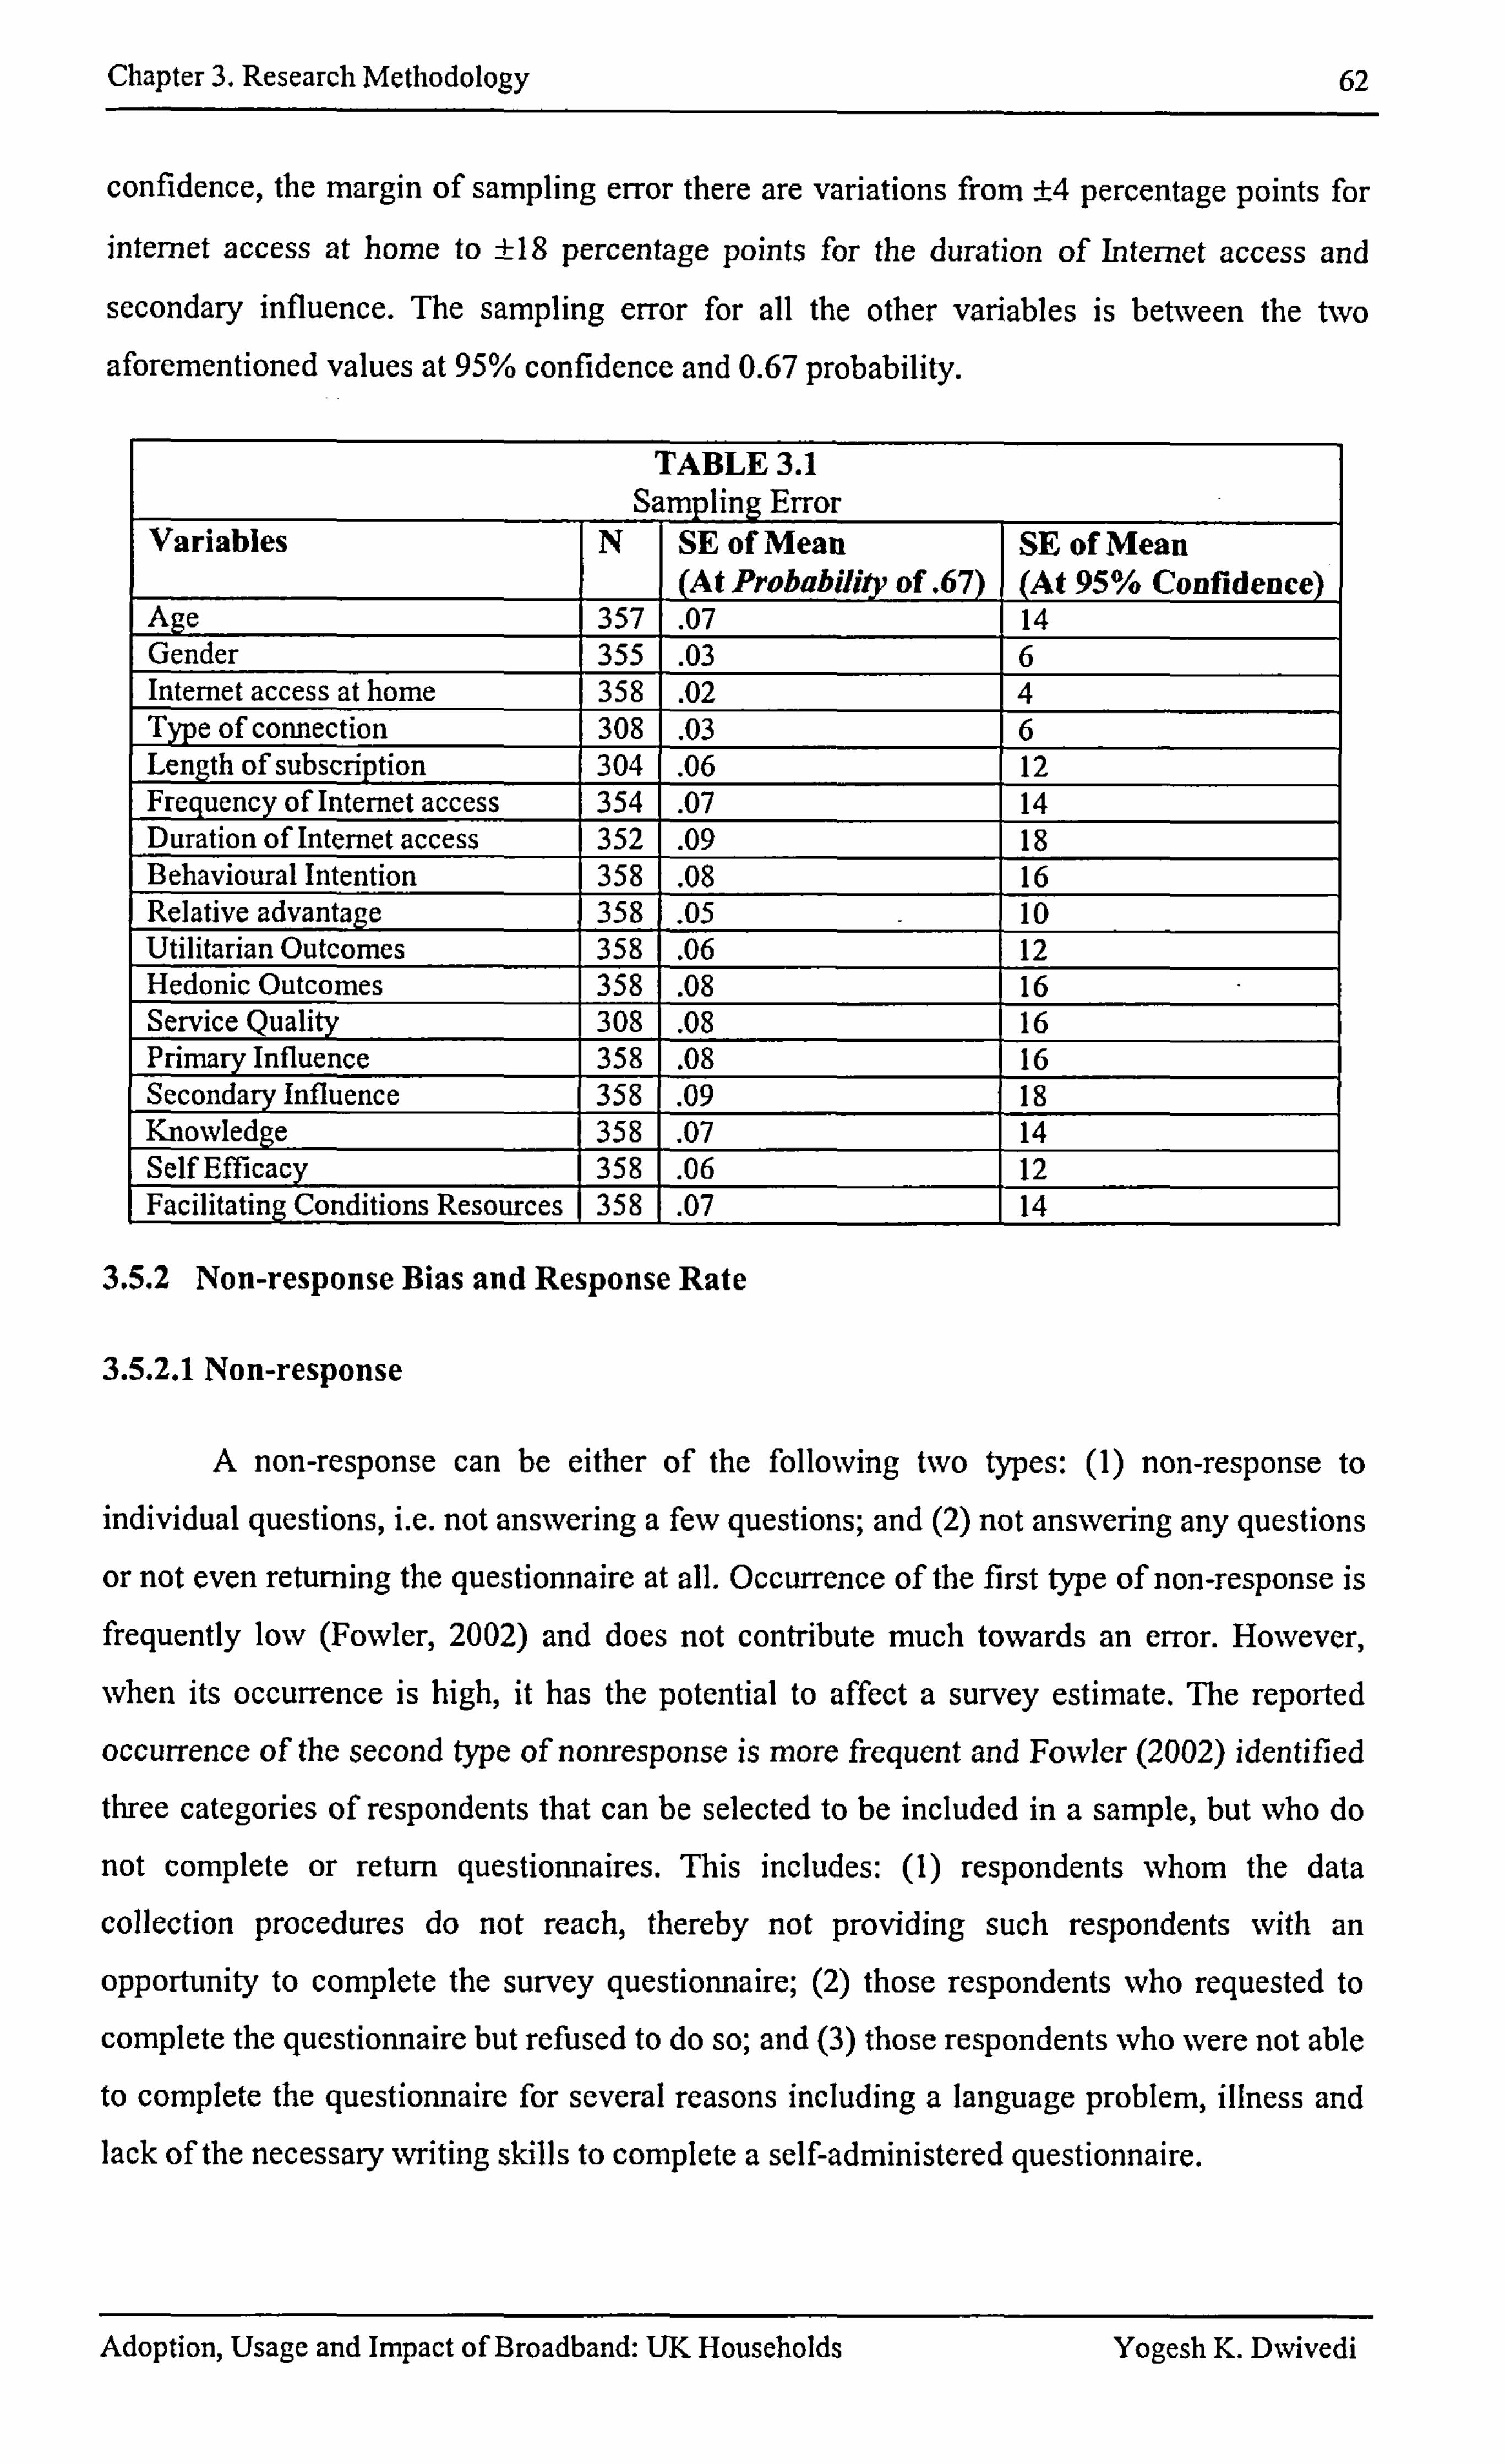
Chapter 3. Research Methodology 62
confidence, the margin of sampling error there are variations from ±4 percentage points for
internet access at home to ±18 percentage points for the duration of Internet access and
secondary influence. The sampling error for all the other variables is between the two
aforementioned values at 95% confidence and 0.67 probability.
TABLE 3.1 Sampling Error
Variables N ISE of Mean (At Prokahfflý y of . 67)
SE of Mean (At 95% Confldence)
Age 357 . 07 14 Gender 355 . 03 6 Intemet access at home 358 . 02 4 Type of connection 308 . 03 6 Length of subscription 304 . 06 12 Frequency of Internet access 354 . 07 14 Duration of Intemet access 352 . 09 18 Behavioural Intention 358 . 08 16 Relative advantage 358 . 05 10 Utilitarian Outcomes 358 . 06 12 Hedonic Outcomes 358 . 08 16 Service Quality 308 . 08 16 Primary Influence 358 . 08 16 Secondary Influence 358 . 09 18 Knowledge 358 . 07 14 Self Efficacy 358 . 06 12 Facilitating Conditions Resources 358 . 07 14
3.5.2 Non-response Bias and Response Rate
3.5.2.1 Non-response
A non-response can be either of the following two types: (1) non-response to individual questions, i. e. not answering a few questions; and (2) not answering any questions
or not even returning the questionnaire at all. Occurrence of the first type of non-response is
frequently low (Fowler, 2002) and does not contribute much towards an error. However,
Nvhen its occurrence is high, it has the potential to affect a survey estimate, The reported
occurrence of the second type of nonresponse is more frequent and Fowler (2002) identified
three categories of respondents that can be selected to be included in a sample, but who do
not complete or return questionnaires. This includes: (1) respondents whom the data
collection procedures do not reach, thereby not providing such respondents with an
opportunity to complete the survey questionnaire; (2) those respondents who requested to
complete the questionnaire but refused to do so; and (3) those respondents who were not able to complete the questionnaire for several reasons including a language problem, illness and lack of the necessary writing skills to complete a self-administered questionnaire.
Adoption, Usage and Impact of Broadband: UK Households Yogesh K. D%vivedi
Chapter 3. Research Methodology
3.5.2.2 Non-response Bias
63
Regardless of the mode that contributed to the non-response, the likely effect of it is
that it will produce a bias sample. A bias sample can be defined as a sample that is
systematically different to the population from which it was drawn (Fowler, 2002). The
following subsections first estimates the response rates of this research and then discusses
the non-response bias in detail.
According to Fowler (2002), the nature of bias associated with a non-response depends upon the data collection method (i. e. mail, interview or telephone). Since the data
collection method of this research is postal survey, further discussion on the non-response bias is specific to postal surveys.
There are arguments that suggest that, in the instance of postal surveys, people who have particular interests in the subject matter or the research itself are more likely to return
the mail questionnaire than those who are less interested (Fowler, 2002). The other
consistent bias in mail surveys is that better-educated people often return completed
questionnaires at a faster rate than respondents with less education. Fowler (2002) suggests
that there is lack of information to reliably predict when and how much non-response will
affect the survey estimates. Therefore, efforts to ensure that the response rates reach a
reasonable level, and to avoid procedures that systematically produce differences between
respondents and nonrespondents, are important ways to build confidence in the accuracy of
survey estimates (Fowler, 2002). The following subsection explains the measures that were
undertaken to reduce non-response in this research.
3.5.2.3 Reducing Non-response
Fowler (2002) suggested the following three important measures to reduce a non-
response in mail surveys: (1) the layout should be clear, so it is easy to see how to proceed;
(2) the questions should be attractively spaced, easy to read and uncluttered; and (3) the
response tasks should be easy to undertake. There should not be open-ended questions. The
response tasks should be a check, a box or circling of a number. The aforementioned three
measures were followed whilst developing and validating the instrument through the
exploratory survey, content validity, pre-test and pilot test. In order to evaluate above three
criteria, questionnaires of the pilot study (Chapter 4) were included four explicit questions.
The majority of respondents from the pilot study were satisfied with the length, layout and
easiness to read (Table 4.5), which means that there were minimal chances of non-response due to the nature of the data collection tool (i. e. postal survey) employed in this research.
Adoption, Usage and Impact of Broadband: UK Households Yogesh K. D%vivedi
Chapter 3. Research Methodology 64
3.5.2.4 Correcting Non-response
Since non-response is inevitable, Fowler (2002) has suggested three approaches including proxy respondents and resurveying a sample of non-respondents in order to
minimise the resulting error contributed due to the non-response. First, an approach that
collected data from proxy respondents was considered inappropriate for this research. This is
because such an approach is suitable for the interview and telephone data collection methods
where any other member of a household can replace designated respondents. Therefore, the
second approach, which is 'resurveying a sample of non-respondents' was considered
appropriate for this research.
In the resurveying approach, a sample of nonrespondents should be re-contacted,
either employing the same data collection method (i. e. mail) or, if the research budget
allows, replacing the postal approach with a telephone survey (Fowler, 2002). Due to the following three reasons, it was decided to contact the non-respondents utilising the same data
collection method, i. e. mail. The first and foremost reason for re-contacting the non-
respondents via mail was the length of the survey instrument. The length of the survey instrument was six pages, which consisted of 41 likert scale type questions, 41 usage related
questions, 20 impact related questions, and a number of demographic questions. Such a
questionnaire was not appropriate for data collection via the telephone method. This is
because respondents prefer not to answer a long questionnaire on the telephone (Fowler,
2002). The second reason was that the sample frame utilised to select the respondents only
consisted of the postal addresses of the respondents and not their telephone numbers or email
addresses. The third and final reason was that this research is a student project constrained by resources that did not allow replacing a mail survey with a telephone survey in order to
re-contact the sample of non-respondents. More details of resurveying the non-respondents
are provided in the next section 'response rate estimation', and the Mest results to examine if
the responses of non-respondents differ from those of the respondents, are provided in
Chapter 5 (Section 5.2).
3.5.2.5 Response Rates
The response rate is a way of determining the success of a data collection effort and
also obtaining an initial idea about the quality of the collected data. Fowler (2004) defined
the response rate as the number of obtained responses divided by the number of sampled
respondents, including all respondents in the study population who were sent the survey, but
who did not respond (Fowler, 2002). The response rate of this study calculated below
followed the aforementioned definition.
Adoption, Usage and Impact of Broadband: UK Households Yogesh K. Dwivedi
Chapter 3. Research Methodology 65
Of the overall 1600 sent questionnaires, 300 questionnaires replies were received
within the specified periods, which was from Jan 2005 to March 2005. Of these, 280
questionnaires were usable and 20 were both undeliverable and incomplete questionnaires. This implies that a response rate of 17.5 percent was obtained. To test the response bias, 200
questionnaires were sent to randomly selected non-respondents from the original sample in
mid-March 2005. Of this, 40 questionnaire replies were received that included 38 usable and
two partially completed questionnaires. The findings obtained from the response bias test are
presented in Chapter 5 (Table 5.1 & Section 5.2.1), which illustrates that there were no
significant differences in the number of variables between the original respondents and a
sample of non-respondents. The responses received from non-respondents were added to the
original responses. The reasoning for this is that, as Fowler (2002) suggests, 'if the new
round of data collection (i. e. data collected for the non-response bias test) replicates
questions in the initial survey, the results can be added to the initial sample data set'. After
combining the original response of 280 and responses from the non-response bias, that is 38,
an adjusted response rate was calculated employing the following formula (Fowler, 2002, pp 52). The obtained adjusted response rate was 33.2%.
Adjusted Response Rate= [OR (280) +W (6.6) * RNRS (38)] / OTES (1600)= 33.2 [Legend: OR=Original Responses, W= this weighted factor suggest that only 200 of the 1320 non-respondents followed up, RNRS=Responses from the non- response sample, OTES= Original Total Eligible Sample]
As Fowler (2002) suggests, the pilot responses can also be included in the final
analysis if the final questionnaire is similar to the pilot and substantial changes were not
made to it. Following this suggestion, since no substantial changes were made in the final
questionnaire after the pilot, it was decided to include the pilot responses in the main study. The pilot questionnaires were sent to an overall total of 200 respondents. A total of 42 replies
were received within the specified periods of time. The total usable responses were 40 and
the remaining two were not fully completed; therefore, they were excluded from the analysis. This led to a response rate of 20% being obtained. Therefore, the total responses including
the pilot were 358. Thus, the final response rate is = 33.2 + 20/2 = 26.6 %
3.5.3 Justification for Choosing Mail (i. e. Postal) as a Data Collection Method
The recommended data collection methods for a survey research approach include
postal mail, telephone, personal interview, group administration and the Internet (Comford
and Smithson, 1996; Fowler, 2002; Straub et al, 2005). According to Fowler (2002), the
selection of a data collection method is a matter of complex decisions as it is based on a
number of issues such as sampling, question form, question content, response rate, costs,
available facilities and length of data collection. In turn, these factors are unique to the
Adoption, Usage and Impact of Broadband: UK Households Yogesh K. Dwivedi
Chapter 3. Research Methodology 66
context of a particular study (Fowler, 2002). For example, if collected data requires asking
open questions, then it is more appropriate to employ face-to-face interviews than other
methods. However, if questions are closed ended in nature and available resources is limited,
then postal questionnaire would be a better choice than other methods.
In terms of sampling, it has been suggested that the choice of data collection method
should be based on reliability and the comprehensiveness of information that a sample frame
offers. If the mailing addresses in a sample frame are not complete and updated, then it is not
appropriate to employ postal mail as a data collection method. Such guidelines also apply to
other data collection methods such as telephone (Fowler, 2002). Since the sample frame of 'UK-Info Disk V 11' provided this research with a comprehensive and reliable mailing list
that is updated annually, it was considered appropriate to employ mail as a data collection
method. With regards to the population characteristics, it is suggested that if the reading and
writing skills of the target population are low then other methods of data collection, such as the telephone or face-to-face interview are more appropriate than a self-administered
questionnaire (Fowler, 2002). Since the adult literacy rate in the UK is 99%
(economywatch. com), the reading and writing skills were not considered to be a barrier for
selecting a self-administered questionnaire as a data collection method.
The self-administered method of data collection (i. e. mail) was also preferred over
the interview and telephone due to ease of contact. This is because many people are busy in
their daily lives and work schedules and due to this, the researcher would have encounter
problems when arranging a suitable time for face-to-face or telephone inter-views (Fowler,
2002). Contrastingly, if the contact information is correct, questionnaires can reach
respondents who can then respond at a time that is convenient for them. In terms of the
question format, Fowler (2002) suggests that self-administered procedures can have an
advantage if the instruments comprise only closed ended questions that can be answered by
simply ticking a box. When a researcher wants to ask many questions that are similar in
form, then having an interviewer face-to-face or over the phone reading a long list can be
awkward and tedious (Fowler, 2002). This was most relevant to this research as there were
many similar types of closed ended questions that required answers; therefore, it was
considered more appropriate to employ the self-administered mail method rather than the
telephone or face-to-face interview.
The nature of the questionnaire's contents can also influence the answers obtained from respondents. Respondents do not want to provide answers to sensitive questions over
the telephone or in an interview. For this reason also, the self-administered method was found to be most suitable data collection method (Fowler, 2002) for this research. In
addition to the above, other important factors that affect data collection method are the costs
Adoption, Usage and Impact of Broadband: UK Households Yogesh K. DNvivedi
Chapter 3. Research Methodology 67
and available facilities for data collection. Self-administered mail is considered to be less
expensive than telephone or face-to-face interviews and requires minor involvement of
additional people and other resources (Fowler, 2002). Since this research was a student
project, the available resources and faculties were highly limited. Therefore, a self-
administered questionnaire via mail was considered to be the most appropriate method to
collect large amounts of data with the available resources and facilities.
After careful consideration of all the aforementioned factors and in order to collect
random data from the target population, a self-administered questionnaire via mail was
considered to be the most appropriate data collection method. To summarise aforementioned discussion, the reasoning for using the self administered questionnaire was that: it addresses the issue of reliability of information by reducing and eliminating differences in the way by
which the questions are asked (Comford and Smithson, 1996); it requires relatively low costs
of administration; they could be accomplished with minimal facilities; it provides access to
widely dispersed samples; respondents have time to provide thoughtful answers; it helps in
asking questions with long or complex response categories; it allows the asking of similar
repeated questions; and also the respondents do not have to share answers with interviewers
(Fowler, 2002). Therefore, the final questionnaires were sent using the postal service as a larger sample population was obtained in a cost-effective manner (Fowler, 2002). A covering letter and a self-addressed prepaid return envelope were also administered to a total of 1600
heads of households in the UK. This activity was undertaken in the period between January
and March 2005. In the middle of March 2005, questionnaires were also sent to 200
nonrespondents in order to assess the nonresponse bias.
3.5.4 Instrument Development and Validation
According to Fowler (2002), 'a defining property of social survey is that answers to
questions are used as a measure which is a critical dimension of the quality of survey
estimates'. This critical dimension depends upon reliability (i. e. providing consistent
measures in comparable situations) and validity (i. e. answers correspond to what they intend
to measure) of questions asked to survey respondents. Therefore, both the issue of reliability
and the validity of the research instrument are of utmost importance for this survey-based
research (Fowler, 2002; Straub et al, 2004). Due to the criticality of the instrument in the
precision of survey estimates, Straub et al (2004) recommended that if a previously validated instrument is available for efficiency reasons, researchers should prefer utilising it rather
than developing a new one. However, at the same time researchers should not avoid previous
validation controversies and, if significant changes are made in the existing instrument, it is
Adoption, Usage and Impact of Broadband: UK Households Yogesh K. Dxvivedi
Chapter 3. Research Methodology 68
most important to revalidate the content, construct and reliability of the modified instrument
(Straub et al, 2004).
In a situation where no existing instrument is available, and if the development of a
new instrument for established theoretical constructs and testing of the robustness is
required, then all validities must be applied in greater detail (Straub et al, 2004). According
to Straub et al (2004), this step is the 'heart of the demonstration of the usefulness of the new instrument' and represents 'a major contribution to scientific practice in the field' (Straub et
al, 2004). Although the constructs utilised in this research belong to established theories and
models, they require the development of new measures for this research. This is because the
unit of analysis for this research, broadband, is different to previous technologies such the
PC, for which there is an existing instrument. Therefore, examining broadband in household
contexts demands creating new items or making significant changes in the existing items and
employing subsequent validating measures. Given the emphasis of the impact of a survey instrument on the reliability and validity of survey estimates or findings, it was decided to
develop and validate the survey instrument for this research before proceeding to data
collection. Since developing and validating an instrument is a long and stepwise process that
includes exploratory survey, content validity, pre-test and pilot test, a complete chapter (Chapter 4) is devoted to providing a description of its development and validation. To avoid
any repetition, no further details on this issue are provided within this section.
3.6 DATA ANALYSIS
The collated data was analysed using SPSS version 11.5. The reason for selecting the SPSS statistical package is that it facilitates the calculation of all essential statistics, such
as descriptive statistics, reliability test, factor analysis, West, discriminant analysis, ANOVA
and linear and logistic regression analysis, required for data analysis and present findings.
Furthermore, SPSS is easily available and user friendly so it can be learnt within a short
period of time. An added reason is that a number of books are available to familiarise oneself
with the SPSS application to present and interpret the data.
3.6.1 Statistical Techniques for Validity Test
Straub el al (2004) recommended that a new survey instrument should be validated
employing statistical techniques such as a reliability test in order to confirm the internal
consistency of measures and factor analysis in order to confirm the construct validity, including both convergent and discriminant validity (Straub et al, 2004). According to the
recommended guidelines, a survey instrument possesses a high internal consistency (i. e. it is
reliable) if the estimated Cronbach's alpha is above 0.70. Construct validity (both
Adoption, Usage and Impact of Broadband: UK Households Yogesh K. Dwivedi
Chapter 3. Research Methodology 69
discriminant and convergent) exists if the latent root criterion (i. e. eigenvalue) is equal to or
above 1, with a loading of at least 0.40; and no cross loading of items above 0.40. (Straub el
al, 2004). Following the above guidelines, the aforementioned statistical techniques are
employed to validate the survey instrument of this research (chapters 4 and 5).
3.6.2 Statistical Techniques for Testing Relationship
In order to explain the relationship between the independent and dependent variables to test the conceptual model of broadband adoption, linear and logistic regression analysis
will be utilised. The purpose of performing linear regression analysis is to examine whether
significant relationships exist between the independent variables (i. e. attitudinal, normative
and control constructs) and dependent variable (behavioural intention). Multiple linear
regression is a commonly used technique to explain the relationship if the nature of both the
independent and dependent variables is ordinal or scale (Brace el al, 2003; Davis et al, 1989;
Oh et al, 2003; Stevens, 1996; Taylor and Todd, 1995). However, linear regression cannot be
applied if the dependent variable is nominal or categorical in nature (Brace et al, 2003). The
suggested alternative for this situation is logistic regression analysis, which allows testing the
relationship even if the dependent variable is nominal in nature (Brace et al, 2003). Logistic
regression analysis is utilised in this research to explain the relationship between aggregate
measure of independent variables (i. e. behavioural intention and facilitating conditions
resources) and the categorical dependent variable (i. e. broadband adoption).
3.6.3 Statistical Techniques for Testing Differences
In order to analyse nominal variables such as demographics, usage rate and impact
of broadband, calculation of the response frequencies and percentages was undertaken. The
reasoning for using the aforementioned statistics is due to previous Information Systems (IS)
researchers employing such tools for analysis and to present the research findings using
response frequencies and percentages (Webster, 1998; Venkatesh and Brown, 2001). To test
the statistical significance of nominal variables such'as demographic differences of the
adopters and non-adopters of broadband, the chi-square (, X2) test was considered to be the
most appropriate method (Brace el al, 2003).
3.6.3.1 Overall Scale Construction and Parametric Test for Difference
If all items for a construct are internally consistent (i. e. illustrate high reliability) and load on one factor in the factor analysis (i. e. demonstrate construct validity) then they can be
utilised to construct a scale (i. e. aggregate measure) in the following two ways (Moore and Benbasat, 1991). The first is to construct a scale that involves summing or averaging the
Adoption, Usage and Impact of Broadband: UK Households Yogesh K. DNvivedi
Chapter 3. Research Methodology 70
mean of the items that load highly on a factor (Gorsuch, 1988; Moore and Benbasat, 1991).
The second is to construct a scale (i. e. aggregate measure) that necessitates considering the
score of factors (Moore and Benbasat, 1991). Moore and Benbasat (1991) argued that since the relative weight of an item in a scale is based on its loading on the factor, its scores may be considered more exact than averaging means.
However, employing factor scores for constructing scales (i. e. aggregate measures)
is the less preferred method (Moore and Benbasat, 1991). This is because factor scores are
often less interpretable and generalisable than using the first approach that involves summing
or averaging the mean of items (Moore and Benbasat, 1991). Since a number of studies
(Brown et al, 2002; Karahanna et al, 1999; Koufaris, 2002; Moore and Benbasat, 1991; Oh
el al, 2003; Olson and Boyer, 2003; Taylor and Todd, 1995) have employed averaging the
mean of items as a means of constructing aggregate measures, and its application is reported
to be entirely adequate (Moore and Benbasat, 1991; Tabachnik and Fidell, 1989), therefore
averaging responses to the individual items will be utilised to develop aggregate measures
for each of the constructs in this research. Once the scale is created, it will be in a ratio
instead of being ordinal and then it will be appropriate to apply a parametric test Q-test and
ANOVA) to examine the differences. Such an approach was followed by Karahanna et al, (1999) who applied a parametric test Q-test and ANOVA) on the constructed aggregate
measures by averaging the mean of individual items.
It is appropriate to apply an independent 1-test to this research in order to determine
whether two means can be obtained from two independent respondent groups that are
significantly different from each other (Brace et al, 2003; Hinton et al, 2004). In this
research, groups may constitute a broadband and narrowband respondent group in order to
examine the mean differences with regards to a connection type, or a male group and a female group when examining the mean differences with regards to gender. A Mest will also be utilised to test the response bias and the effect of ordering the questionnaire items. When
more than two conditions or groups of an independent variable are compared, ANOVA is
more appropriate to apply than a Mest (Brace et al, 2003; Hinton et al, 2004). It is relevant to
apply ANOVA to determine whether means that are obtained from more than two
independent respondent groups are significantly different from each other (Brace et al, 2003;
Hinton et al, 2004). In this research, ANOVA will be applied to test the scale mean differences when test variables possess more than two independent groups.
Adoption, Usage and Impact of Broadband: UK Households Yogesh K. DNvivedi
Chapter 3. Research Methodology 71
3.7 SUMMARY AND CONCLUSIONS
This chapter provided an overview of the research approaches that have been utilised
within the IS field and then selected an appropriate research approach for guiding this
particular research. To validate and understand the conceptual framework, it was found that a
quantitative research would be more appropriate than a qualitative one. An overview of the
underlying epistemology was provided in order to decide that positivism should be the
philosophical foundation for this research. Following this, an overview discussion on the
various issues on the available research approaches in the IS field and a justification for the
selection of the survey as a research approach is provided. Once it was decided that a survey is an appropriate approach to conduct this research, a detailed account of the various aspects
of the survey approach was offered. It was found that for the purpose of this research, it is
appropriate to employ the UK-Info Disk V 11 as a sampling frame, and stratified random
sampling as a basis of sample selection.
The data collection tool used in this research was the postal method (i. e. mail). The
reasons for the aforementioned selection were also provided in a detailed manner. Issues
relating to data analysis were then discussed in detail. It was concluded that a number of
, X2 statistical techniques such as factor analysis, Mest, ANOVA, , test, discriminant analysis,
linear and logistics regression analysis are appropriate to be utilised for data analysis
purposes. This chapter thoroughly covered two of the three essential components of survey
research approach. However, the third 'instrument development' was briefly introduced. The
following chapter (Chapter 4) will describe the development and validation of the survey instrument that is considered essential for a reliable data collection.
Adoption, Usage and Impact of Broadband: UK Households Yogesh K. DNvivedi

Chapter 4. Development and Validation of a Survey Instrument 72
4.1 INTRODUCTION
Chapter 2 described the proposed conceptual model that is used to understand the
adoption, usage and impact of broadband from the household consumer perspective. Chapter
3 described the appropriate research approach for testing the hypotheses and to validate the
proposed conceptual model. From Chapter 3 it was concluded that the survey research
approach is most appropriate to investigate the issue of broadband diffusion. Further
suggestions that were provided in Chapter 3 are that before conducting the final data
collection a reliable survey instrument should be developed and validated. Validating an instrument is a critical step before testing a conceptual model (Boudreau et al, 2001; Straub
et al, 2004). This is due to the rigour of findings and interpretations in positivist research that
are based on the solid validation of the instruments used to gather data (Boudreau et al, 2001; Straub et al, 2004).
Therefore, this chapter aims to describe the development of a survey instrument that
was designed to investigate broadband adoption, usage and impact within the UK household.
The following three stages led to the development of a reliable instrument: (1) To explain broadband adoption behaviour some initial factors were identified from the literature and then a decision upon how to determine them in an exploratory survey approach needed to be
made; (2) content validation was performed on the iterned pools that resulted from the
exploratory survey. The purpose of this step was to confirm the representativeness of items
to a particular construct domain; and finally, (3) a pre-test and a pilot test were conducted
utilising the obtained instrument after content validation was undertaken in order to confirm the reliability of measures.
The next section briefly re-introduces the conceptual model and provides a list of the
constructs included in the various stages of the validation process. Following that, an
overview of the instrument development process is provided in Section 4.3. Then the first
stage of the validation process (i. e. the exploratory survey) is presented and discussed in
Section 4.4. This is followed by the content validation process in Section 4.5. The instrument
testing process that includes the pre and pilot test is described in Section 4.6. Finally, the
summary and conclusions are presented in Section 5.7.
4.2 CONCEPTUAL MODEL
Although the conceptual model was already described in Chapter 2, a brief account
of the constructs is provided in this section. The constructs included in this study were
adapted from the Model of the Adoption of Technology in Households (MATH) (utilitarian
outcomes, hedonic outcomes and knowledge) (Venkatesh and Browns, 2001), diffusion of
Adoption, Usage and Impact of Broadband: UK Households Yogesh K. DNvivedi
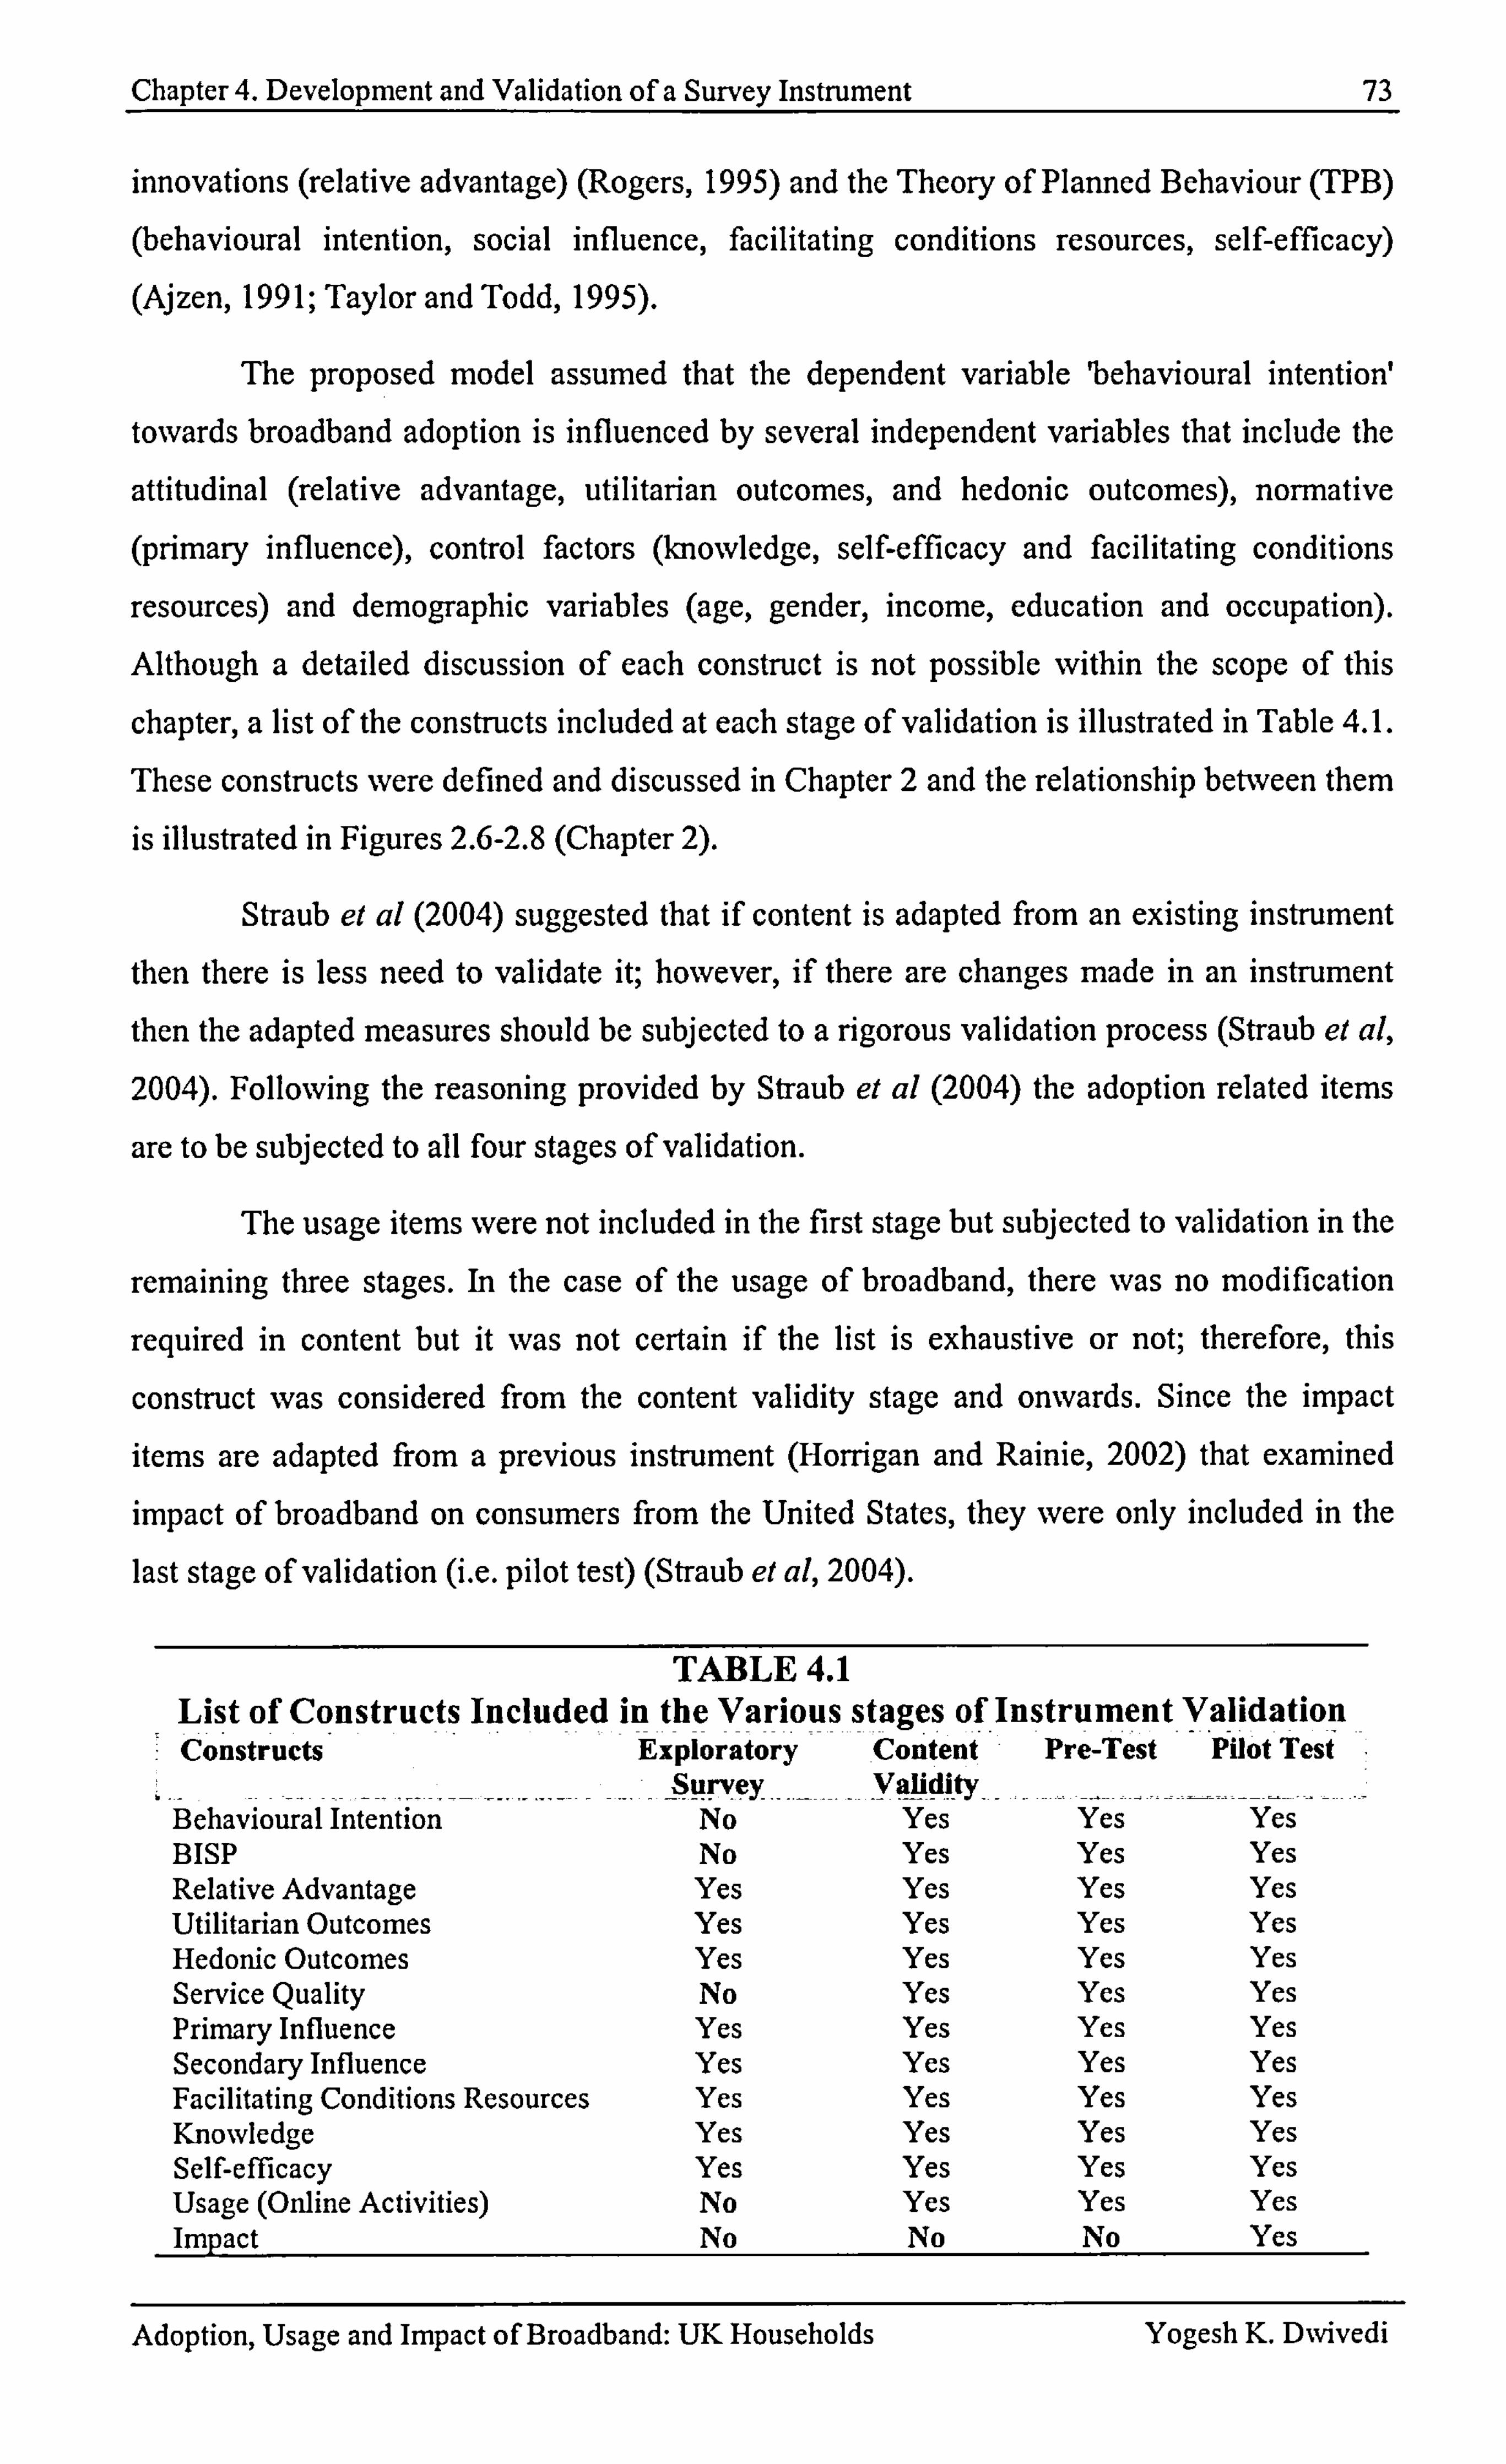
Chapter 4. Development and Validation of a Survey Instrument 73
innovations (relative advantage) (Rogers, 1995) and the Theory of Planned Behaviour (TPB)
(behavioural intention, social influence, facilitating conditions resources, self-efficacy) (Aj zen, 199 1; Taylor and Todd, 1995).
The proposed model assumed that the dependent variable 'behavioural intention'
towards broadband adoption is influenced by several independent variables that include the
attitudinal (relative advantage, utilitarian outcomes, and hedonic outcomes), normative (primary influence), control factors (knowledge, self-efficacy and facilitating conditions
resources) and demographic variables (age, gender, income, education and occupation). Although a detailed discussion of each construct is not possible within the scope of this
chapter, a list of the constructs included at each stage of validation is illustrated in Table 4.1.
These constructs were defined and discussed in Chapter 2 and the relationship between them
is illustrated in Figures 2.6-2.8 (Chapter 2).
Straub et al (2004) suggested that if content is adapted from an existing instrument
then there is less need to validate it; however, if there are changes made in an instrument
then the adapted measures should be subjected to a rigorous validation process (Straub et al, 2004). Following the reasoning provided by Straub et al (2004) the adoption related items
are to be subjected to all four stages of validation.
The usage items were not included in the first stage but subjected to validation in the
remaining three stages. In the case of the usage of broadband, there was no modification
required in content but it was not certain if the list is exhaustive or not; therefore, this
construct was considered from the content validity stage and onwards. Since the impact
items are adapted from a previous instrument (Horrigan and Rainie, 2002) that examined impact of broadband on consumers from the United States, they were only included in the
last stage of validation (i. e. pilot test) (Straub et al, 2004).
TABLE 4.1 List of Constructs Included in the Various stages of I nstrument Validation Constructs Exploratory Content Pre-Test Pilot Test
sprvey Validity- Behavioural intention No Yes Yes Yes BISP No Yes Yes Yes Relative Advantage Yes Yes Yes Yes Utilitarian Outcomes Yes Yes Yes Yes Hedonic Outcomes Yes Yes Yes Yes Service Quality No Yes Yes Yes Primary Influence Yes Yes Yes Yes Secondary Influence Yes Yes Yes Yes Facilitating Conditions Resources Yes Yes Yes Yes Knowledge Yes Yes Yes Yes Self-efticacy Yes Yes Yes Yes Usage (Online Activities) No Yes Yes Yes Imi)act No No No Yes
Adoption, Usage and Impact of Broadband: UK Households Yogesh K. Divivedi
Chapter 4. Development and Validation of a Survey Instrument 74
4.3 INSTRUMENT DEVELOPMENT PROCESS
Since the instrument for the broadband adoption study is developed from the basics,
a number of stages were followed that included the selection and creation of items, an
exploratory survey, content validity, a pre-test and a pilot test. Straub el al (2004) argued that
there is a lack of a standard validation approach. Various studies have employed different
methods and techniques of validation (Straub et al, 2004). Therefore, keeping this in mind this study adapted a validation approach similar to the IS studies (For example, Davis, 1989;
Moore and Benbasat, 1991) that were focused upon the instrument development process and
widely cited by researchers. Since the aforementioned studies developed an instrument in a
stepwise manner, this research also followed an approach of developing and validating the instrument in several stages, including an exploratory survey, content validity, pre-test and
pilot test. A detailed discussion on each stage is provided henceforth.
4.4 STAGE 1: THE EXPLORATORY SURVEY
4.4.1 Research Method
The purpose of the exploratory survey was to determine the items or factors that are
affecting the adoption and non-adoption behaviours. Then, in subsequent stages, the important factors that can be modified to measure perceptions were identified. This was
undertaken bearing in mind that the broadband adopters were asked to answer only the
attitudinal and normative related questions (Appendix 4.1). Contrastingly, the broadband
non-adopters were asked to complete questions related to only the control constructs (Appendix 4.1). A number of appropriate items were collated, created and modified to suit the definition of the related attitudinal, normative and control constructs. However, it is
important to mention here that one attitudinal construct, namely 'Service Quality' and its
related items, were not included at this stage. Further explanations on this issue are provided
at the end of this section. A definition for all the constructs is provided in Appendix 2.1. A
list of constructs included in the exploratory survey and related items are provided in Table
4.1 and Appendix 4.2 respectively.
The data for the exploratory survey were collected from the household consumers living in the local vicinity of the London Borough of Hillingdon. The selection of the target
population was made according to the availability of the sample frame. Since a reliable
sample frame - that is the electoral register - was not easily available for the whole of London or the UK population, it was decided to conduct a survey within the London
Borough of Hillingdon. The structure of the sample frame (the electoral register) necessitated the adoption of a stratified random sampling approach that collected the representative data
Adoption, Usage and Impact of Broadband: UK Households Yogesh K. D-, vivedi
Chapter 4. Development and Validation of a Survey Instrument 75
from the target population. The whole locality was divided into various wards and sub wards in the electoral register. The sample size for each sub ward was determined according to the
total population. Thereafter, unique random numbers for each sub ward were generated using
software titled 'research randomiser'. The respondents' corresponding random numbers were then selected for data collection from the sample frame (the electoral register).
In order to collect random data for the target population and within a limited time
frame and resources, a self-administered questionnaire was considered to be an appropriate
primary survey instrument. This is because it addresses the issue of reliability of information
by reducing and eliminating the differences the way that the questions are asked (Comford
and Smithson, 1996).
The questionnaire used in the exploratory survey contained a total of 13 questions (Appendix 4.1). These questions were divided into three broad categories: (1) multiple
choice questions addressing the social attributes (demographic variables) including age,
gender, education, and income; (2) Likert scale (1-5) questions that were designed to address the issues related to the factors of broadband adoption; and (3) an open-ended question that
asked respondents if they would like to mention any other factor that was not included in the
questionnaire regarding their decision of subscribing to broadband or not.
The final questionnaire was sent using the postal service. A covering letter and a
prepaid return envelope were administered to a total of 700 household heads in the London
Borough of Hillingdon during August and September 2003. The collected data was analysed
using SPSS version 11.5. The analysis was focused upon calculating the importance of the
attitudinal, normative and control factors utilising the means and standard deviations. In
order to measure the internal consistency of the items, the reliability of scale (Cronbach's cc)
was also calculated.
4.4.2 Findings
Of the overall 700 questionnaires, 200 replies were received within the specified
periods. Of these, 172 questionnaires were usable for the analysis, whilst 28 were both
undelivered and uncompleted questionnaires. This yielded a response rate of 25.6%.
4.4.2.1 Descriptive Statistics
Attitudinal Constructs
Amongst the attitudinal constructs, relative advantage was rated most strongly,
followed by utilitarian outcomes (Appendix 4.2). The hedonic outcome construct was
considered least important with a mean score of 2.34 and a standard deviation of 1.85.
Adoption, Usage and Impact of Broadband: UK Households Yogesh K. Dwivedi
Chapter 4. Development and Validation of a Survey Instrument 76
Of the four relative advantage items, faster access was rated most strongly (M=4.88,
SD= 0.33), followed by un-metered access (M=4.49, SD= 0.83). The provision of a free
home phone line was considered least important (M=3.22, SD=1.7)]. The remaining two
items, which were always-on access (M=4.13, SD=1.0) and faster file downloads (M=4.12,
SD=1.25) were rated as almost equally important (Appendix 4.2).
The second strongest construct was utilitarian outcome that had a rating of M=2.89,
SD=0.87 amongst the attitudinal category that consisted of six items. Amongst the six items,
obtaining educational material (M=3.31, SD=1.22) was considered to be the most important
reason for subscribing to broadband. This was followed by performing job related tasks
(M=3.05, SD=1.55) and communication with family and friends (M=3.04, SD=1.46). The
factor of helping children with homework (M=2.33, SD=1.49)] was considered least
important within this category. The other two items of utilitarian outcomes, performing home business (M=2.62, SD=1.45) and perfon-ning personal and household activities (M=2.96, SD=1.35) were rated as moderate (Appendix 4.2).
The third construct from the attitudinal category 'hedonic outcomes' was rated below average (M=2.34, SD=1.850) on a 1-5 point Likert scale. This construct consisted of
only two items, of which one item was for entertainment, such as downloading, viewing and listening to music and movies, which scored an above average score (M=2.90, SD=1.45),
and the second was for playing online games and was rated below average (M=1.78,
SD=1.15) (Appendix 4.2).
Normative Constructs
The normative dimension consisted of only two constructs: primary and secondary influences. Three items represented the first construct 'primary influence' (M=2.47, SD=1.7)
and the second 'secondary influence' consisted of only one item that was rated slightly
above average (M=2.60, SD=1.78). Amongst the items of the primary influence construct, 'influence from family members and relatives' was considered most important (M=2.56,
SD=1.88), followed by the influence from friends (M=2.38, SD=1.77). The least rated item
was 'influence from kids' (M=2.28, SD= 1.94) (Appendix 4.2).
Control Constructs
The control category was composed of mainly three constructs: facilitating
conditions, knowledge and skill. However, there were two items placed in the category of 'other items'. The other items did not fit in with the definition of the above three constructs;
therefore, it was decided to examine them separately.
The construct 'facilitating condition' was represented by two items. The findings
illustrated in Appendix 4.2 suggest that high monthly cost was a key barrier preventing the
Adoption, Usage and Impact of Broadband: UK Households Yogesh K. DNvivedi
Chapter 4. Development and Validation of a Survey Instrument 77
consumers from subscribing to broadband (Mean= 4.25 on a five point scale and SD= 1.18).
The second item of this construct related to the cost of purchasing a new computer or
upgrading the existing one (M=2.94, SD=1.64), which was also considered to be an important factor for not adopting broadband.
The second construct in the control category, 'knowledge', consisted of two items
and was considered overall as less important (M=2.35, SD=1.37). A lack of knowledge
about the usage and benefits of broadband were considered more important (M=2.33,
SD=141) than the second item that referred to the lack of knowledge on broadband (M=2.28,
SD=1.37) (Appendix 4.2).
A single item represented the third construct of 'self-efficacy', which was the lack of
skills when using the computer and the Internet (M=1.95, SD=1.41). Self-efficacy was
considered less influential in terms of preventing respondents from subscribing to broadband
(Appendix 4.2).
The first item that was placed in the 'other' category was the lack of needs when
subscribing to broadband. This was considered quite important when inhibiting the adoption
of broadband (M=3.83, SD=1.25). The second item within the 'other' category was the lack
of content and applications with the existing broadband packages (M=2.55, SD=1.25), which
was rated less influential than the first one (Appendix 4.2).
4.4.2.2 Reliability Test
To test the internal consistency of measures, a reliability test was performed. The
Cronbach's cc values for all but two constructs are listed in Appendix 4.2. The value of
reliability (alpha) varies for the different constructs. Since two constructs' secondary influence and self-efficacy were represented only by one item each, it was not possible to
calculate their reliability. Of the remaining seven constructs, only three constructs attained
an alpha above 0.60 (Appendix 4.2), which is the minimum acceptable level for the
exploratory study (Straub et al, 2004, pp 411).
Amongst the attitudinal constructs, the minimum value of reliability (0.24) was
associated with the relative advantage construct. This was followed by the hedonic outcomes
measure (0.54). The maximum value of reliability within this category was 0.66, which was for the utilitarian outcomes construct. This suggests that only one attitudinal construct
satisfied the criteria of internal consistency.
For the two normative constructs, only one construct, namely primary influence,
allowed the Cronbach's (x value to be calculated. The construct attained a reliability of 0.84,
which is considered acceptable (Straub et al, 2004, pp 411).
Adoption, Usage and Impact of Broadband: UK Households Yogesh K. DNvivedi
Chapter 4. Development and Validation of a Survey Instrument 78
Amongst the four control constructs, knowledge attained the highest value (cc=0.94)
for reliability. This was followed by facilitating conditions with (x=0.50. The third construct
of 'self-efficacy' did not satisfy the criteria for calculating the cc value. The fourth construct
achieved a cc value of 0.34. As for the attitudinal and non-native constructs, only one
construct of the control category 'knowledge' satisfied the criteria of internal consistency.
4.4.2.3 Limitations and Further Improvement
For stage 1, the major limitation was the lack of previous studies that had developed
and utilised the scale to measure broadband adoption for the aforementioned attitudinal,
non-native and control constructs. Such unavailability compelled the researchers to develop
an instrument from the initial stages, which instigated several issues. The following are the
issues that emerged from the exploratory survey and were dealt with in two stages: content
validity and instrument testing.
1. Need of New Construct
A number of respondents with narrowband connections commented that they were
not satisfied with their quality of service, which included the required speed, security and
customer or technical support. If these issues were not dealt with in a narrowband context,
consumers stated that they would switch to a broadband connection. However, a majority of
the respondents with narrowband connections also commented that they were satisfied with
the quality of service that they were receiving from their current service providers, hence
they would not switch to a broadband connection. Some of the respondents with a broadband
connection provided similar comments to the narrowband ones and declared that they were
also not receiving the quality of speed and support that was affirmed before subscribing to
the services; therefore, they had considered transferring to other Internet Service Providers
(ISPs). Considering the aforementioned comments from the survey respondents, it was felt
appropriate to include a new construct for the purpose of measuring the attitudes towards the
service of quality being received from the current ISPs. Therefore, a new construct named 'Service Quality' was included in the content validity stage. A definition of this construct is
provided in Appendix 2.1 and the related items are listed in Table 4.6.
The other limitation to the exploratory survey was the lack of a dependent variable
that could be utilised to measure the intentions of respondents when subscribing to
broadband. This variable is also important when examining how independent variables (attitudinal, normative and control constructs) affect a respondent's intention to adopting broadband in the home. This necessitated the researchers to include an additional construct
called 'Behavioural Intention' from the Theory of Planned Behaviour (Ajzen, 1991).
Adoption, Usage and Impact of Broadband: UK Households Yogesh K. D%vivedi
Chapter 4. Development and Validation of a Survey Instrument 79
2. Need for New Items
The two constructs, 'secondary influence' and 'self-efficacy' were composed of only
one item each (Appendix 4.2). This caused problems when calculating the reliability of the
construct. Therefore, this limitation was also considered during the content validity test and
one more additional item was added to each construct (Table 4.7).
3. Problem of Low Reliability
From the exploratory study findings and the aforementioned discussion it was found
that although the estimated mean value of many constructs (e. g. relative advantage) was high, the reliability (alpha) was low (Appendix 4.2). Contrastingly, the estimated mean
value of the social influence construct was low, but its reliability value was higher than any
other construct. These variations in estimated values necessitated a further validation of the
instrument content. In order to further validate the survey instrument and to determine how
representative the items for a particular construct are (Straub et al, 2004), it was decided to
adopt the content validity approach. The IS literature suggests that it is an important and highly recommended practice to conduct content validity in instances of new instrument
development and also even if existing scales have to be applied for the establishment of any
new object (Straub et al, 2004). Since this condition applies to this research as well, this was
an added reason for conducting content validity. Content validity followed the exploratory
study and its application in this research is described in the next section.
4.5 STAGE 2: CONTENT VALIDATION
Content validity is defined as the 'degree to which items in an instrument reflect the
content universe to which the instrument will be generalised' (Straub et al, 2004). Generally,
content validity involves the evaluation of a new survey instrument. This is to ensure that the
survey instrument that aims to measure broadband adoption, usage and impact includes all the essential items and eliminates undesirable items within a particular construct's domain
(Boudreau et al, 2001; Kitchenham and Pfleeger, 2002; Lewis, 1995; Straub et al, 2004).
Although only two approaches that comprise judgements and statistics are available
when determining content validity, their application is unique to each study (Emory and Cooper, 1991; Torkzadeh and Dhillon, 2002). The application of content validity differs in
terms of when it is utilised, how it is conducted and how many experts evaluated the content. The judgement approach to establish content validity involves literature reviews and then follow-ups with evaluation by expert judges or panels. The validation of the items is based
on a high degree of consensus amongst expert panels or judges on the items in question; therefore, it is judgemental in nature (Boudreau et al, 2001; Davis, 1989; Kitchenham and
Adoption, Usage and Impact of Broadband: UK Households Yogesh K. D%vivedi
Chapter 4. Development and Validation of a Survey Instrument 80
Pfleeger, 2002; Moore and Benbasat, 1991; Smith, 1996; Storey et al, 2000; Straub et al, 2004; Torkzadeh and Dhillon, 2002). Lawshe (1975) introduced an empirical or quantitative
approach of content validity. This approach involves estimating the statistical validity ratio (Lawshe, 1975; Lewis, 1995).
The procedure ofjudgemental approach of content validity requires researchers to be
present with experts in order to facilitate validation. Therefore it is also sometimes known as 'face validity' (Wacker, 2004). However, it is not always possible to have many experts of a
particular research topic at one location, which was the case in this research. Contrastingly, a
quantitative approach allows researchers to send content validity questionnaires to experts
working in different locations; therefore, distance is not a problem faced by research. In
order to perform content validity for broadband diffusion research, a quantitative approach
was considered to be more suitable in comparison to a judgemental approach (Lawshe, 1975;
Lewis 1995). Since broadband diffusion studies are still emerging in nature, there are still few academic experts. Furthermore, the experts are located in different places. Therefore,
bearing these issues in mind, the quantitative approach pursued in this research is described
in the next section.
4.5.1 Research Method
The content validity of the broadband diffusion instruments was performed
employing a quantitative approach (Lawshe, 1975). In terms of IS research, such an
approach has been successfully applied when validating information resource management instruments (Lewis et al, 1995). In order to validate the content of the constructs, the
quantitative approach (Lawshe, 1975; Lewis et al, 1995) was undertaken in the following
manner.
0 First, relevant items from the existing literature on technology adoption and diffusion were identified. This led to the construction of the questions and the
content validity questionnaire.
Second, a content evaluation panel, consisting of experts from academia and/or industry who were related to the desired research area, was selected.
Third, each member of the panel was then provided with the questionnaire fon-ned in
step 1. The panel members were requested to respond independently to each item in
relation to a particular construct on a three-point scale where: "1= not necessary", "2= useful but not essential" and "3=essential".
Fourth, the responses from the overall panelists were then pooled. This step also included counting responses that indicated 'essential' for each item.
Adoption, Usage and Impact of Broadband: UK Households Yogesh K. D%vivedi
Chapter 4. Development and Validation of a Survey Instrument 81
Fifth, the content validity ratio (CVR) for each item was estimated utilising the formula CVR=(n-N/2)/(N/2) (Lawshe 1975), where N is the total number of
respondents and n is the frequency count of the number of panelists rating the item
as "3=essential".
0 Finally, the CVR values obtained for each item were examined for their significance
employing the standard table provided by Lawshe (1975). If the estimated CVR
value was equal to or above the standard value, then the item was accepted;
other-wise it was eliminated. The significance level (standard value) depended upon the number of experts rating the item. The minimum number of exper-ts required to
rate each item should be five. The value of CVR ranged from 0 to I (Lawshe, 1975;
Lewis et al, 1995).
The aforementioned steps were followed to evaluate the content of broadband
diffusion survey instruments. A sample of items for each construct was identified employing
an exhaustive review of literature on generic technology adoption topics, broadband
adoption and diffusion. The literature review led to the identification of 75 adoption entries
and 35 entries for the usage related constructs. A content validity questionnaire (Appendix
4.3) was then generated that comprised the definition of the constructs and associated items
on a 1-3 scale.
The'expcrts identified earlier who engaged in broadband diffusion related research
were then approached. A total of 12 academic experts were identified on the basis of
publications in peer-reviewed journal and leading conferences (ten experts) or their
engagement to the research area related to broadband diffusion (two experts). The
questionnaire was then sent to the experts via email attachments so as to expedite the
process. The purpose of the study and instructions to complete the questionnaire were detailed in the covering email. The experts were asked to rate each item in relation to the
different constructs of broadband diffusion on a three-point scale: "1= not necessary"; "2=
useful but not essential"; "3=essential". They were also requested to provide comments if the
items were not understandable, required rewording or if new entries needed to be added. Responses from all the experts were then collated by counting the numbers of ratings that
indicated "essential" for each item.
Following that, the CVR was estimated and evaluated for a statistical significance level of 0.05 by employing Lawshe's (1975) method that was mentioned in the above
paragraph. This process was undertaken for each item. For entries where the 0.05
significance level was not achieved, elimination occurred. The list of constructs, along with
Adoption, Usage and Impact of Broadband: UK Households Yogesh K. DNvivedi
Chapter 4. Development and Validation of a Survey Instrument 82
their associated CVR values, are presented in Appendix 4.4 and 4.5, and are discussed
below.
4.5.2 Findings from Content Validation
The final content validity questionnaire with the complete list of items is provided in
Appendix 4.3. The estimated values for the content validity ratio of all the items are
presented in Appendix 4.4 for the adoption constructs and Appendix 4.5 for the usage
constructs. A summary of the CVR that is derived from Appendix 4.4 and 4.5 is provided in
Tables 4.2 and 4.3. The CVR questionnaire comprised a total of I 10 items. Of the I 10 items,
75 belonged to adoption and 35 to usage related constructs. The findings presented in Table
4.2 illustrate that, of the 75 items from the adoption domain, the majority of respondents
considered 41 items important for inclusion, as the CVR value was significant at the 0.05
level. All 35 usage related items were considered essential. Additionally, the respondents
suggested six new online activities to include. Therefore, a total of 41 online activities were included in the next step (Table 4.7).
Table 4.3 illustrates the overall items, average CVR and average mean for each
construct. The average CVR value for the 12 constructs was between the maximum value of 0.98 and minimum value of 0.57 at the 0.05 level of statistical significance. This illustrates
that the constructs possess a high level of content validity, which means that the items are
representative of a construct universe (Table 4.3).
The experts also provided a number of suggestions regarding the rewording and decomposition of some of the items and the addition of a few new items. It was suggested that the B13 (Appendix 4.3) items should be reworded when measuring the behavioural
intention that is used to determine the extent of the use of broadband. Furthermore, the
experts also commented that it would be useful to include a new item that measured the behavioural intention for determining whether a consumer continues with the current ISPs or
switches to a new one. With regards to the utilitarian outcomes construct, it was suggested that item U05 (Appendix 4.3) should be divided into two. This was required because
infort-nation searches and online shopping are two different activities and measuring both of them with the same item could create ambiguities in the findings. Similarly, the experts
suggested that item HOI should be decomposed into two items by separating music and
movies into two different items. Item H04 was also eliminated (Appendix 4.3). This was because e-greetings are utilised more as a communication rather than an entertainment tool. For the service quality items SQ11 and SQ13 (Appendix 4.3), the same issue was being
determined, but in opposite directions; therefore, the experts advised that it would be better
to drop item SQ13. The content validity experts suggested that although the two items FC1
Adoption, Usage and Impact of Broadband: UK Households Yogesh K. D%vivedi
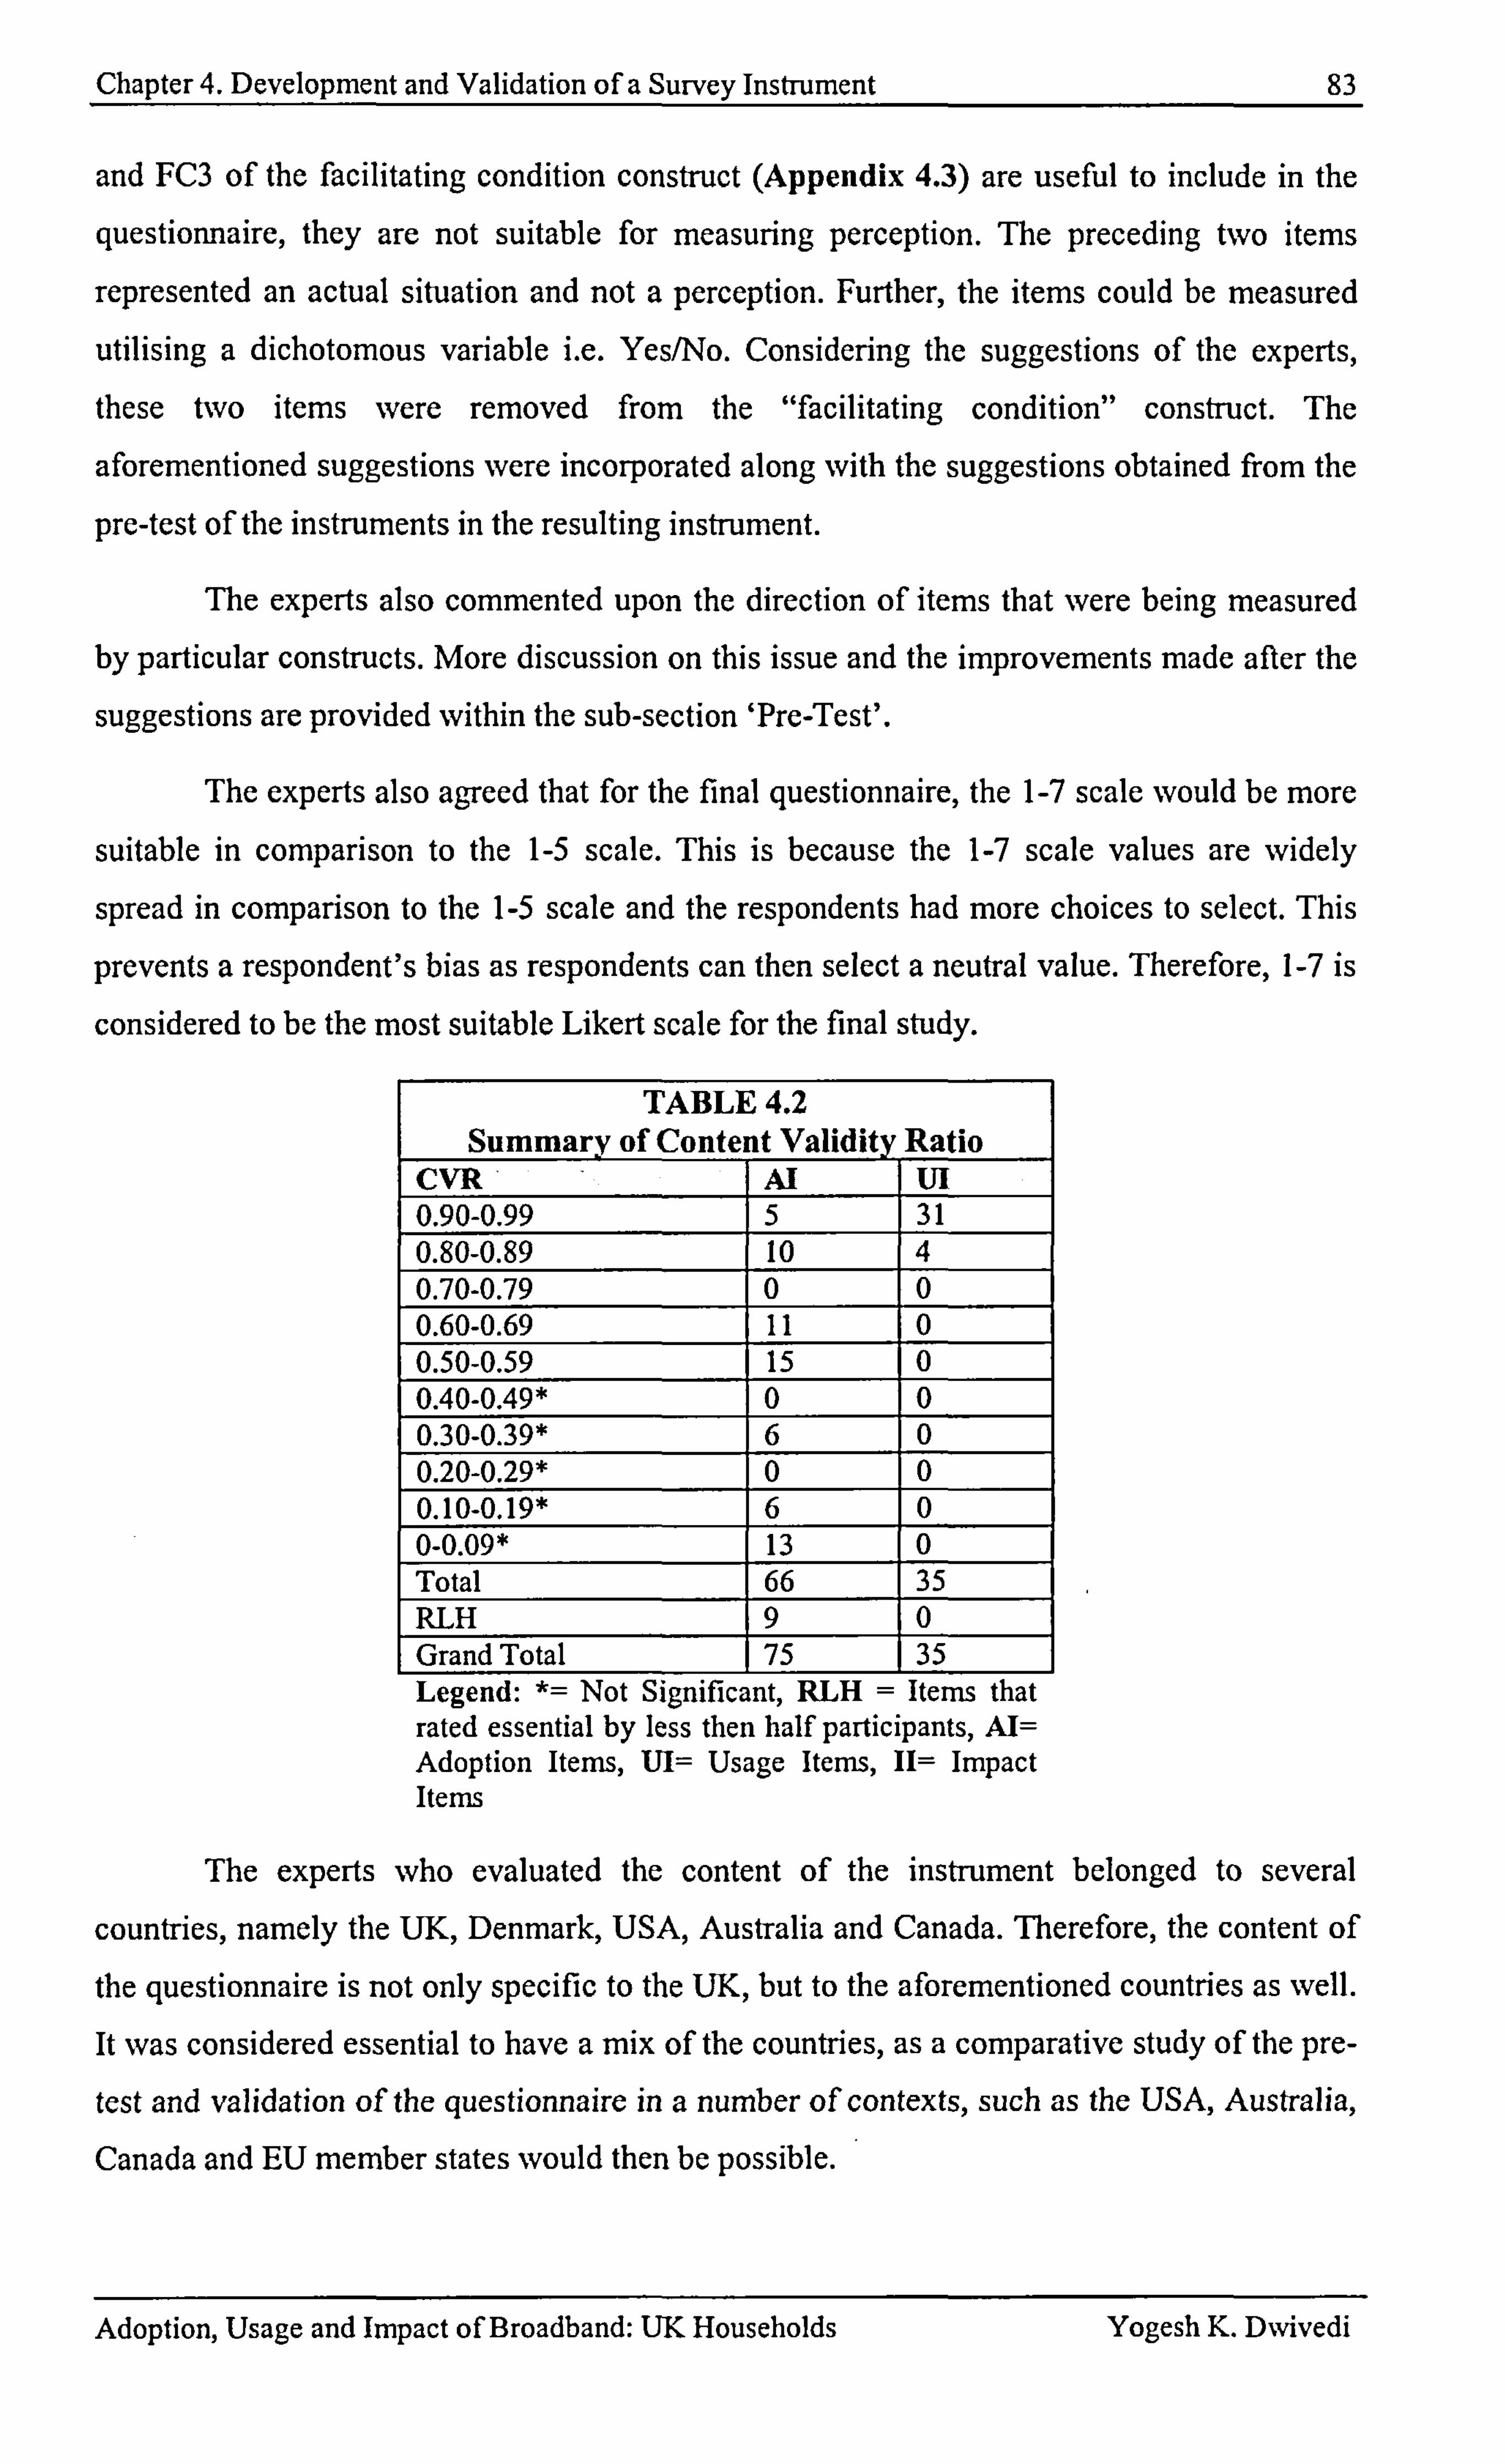
Chapter 4. Development and Validation of a Survey Instrument 83
and FC3 of the facilitating condition construct (Appendix 4.3) are useful to include in the
questionnaire, they are not suitable for measuring perception. The preceding two items
represented an actual situation and not a perception. Further, the items could be measured
utilising a dichotomous variable i. e. Yes/No. Considering the suggestions of the experts, these two items were removed from the "facilitating condition" construct. The
aforementioned suggestions were incorporated along with the suggestions obtained from the
pre-test of the instruments in the resulting instrument.
The experts also commented upon the direction of items that were being measured by particular constructs. More discussion on this issue and the improvements made after the
suggestions are provided within the sub-section 'Pre-Test'.
The experts also agreed that for the final questionnaire, the 1-7 scale would be more
suitable in comparison to the 1-5 scale. This is because the 1-7 scale values are widely
spread in comparison to the 1-5 scale and the respondents had more choices to select. This
prevents a respondent's bias as respondents can then select a neutral value. Therefore, 1-7 is
considered to be the most suitable Likert scale for the final study.
TABLE 4.2 Summary of Conte t Validity Ratio
CVR Al ul 0.90-0.99 5 31 0.80-0.89 10 4_ 0.70-0.79 0 0 0.60-0.69 11 0 0.50-0.59 15 0 0.40-0.49* 0 0 0.30-0.39* 6 0 0.20-0.29* 0 0 0.10-0.19* 6 0 0-0.09* 13 0 Total 66 35 RLH 9 0 Grand Total 75 35 Legend: *= Not Significant, RLH = Items that rated essential by less then half participants, AI= Adoption Items, UI= Usage Items, II= Impact Items
The experts who evaluated the content of the instrument belonged to several
countries, namely the UK, Denmark, USA, Australia and Canada. Therefore, the content of
the questionnaire is not only specific to the UK, but to the aforementioned countries as well. It was considered essential to have a mix of the countries, as a comparative study of the pre-
test and validation of the questionnaire in a number of contexts, such as the USA, Australia,
Canada and EU member states would then be possible.
Adoption, Usage and Impact of Broadband: UK Households Yogesh K. DNvivedi
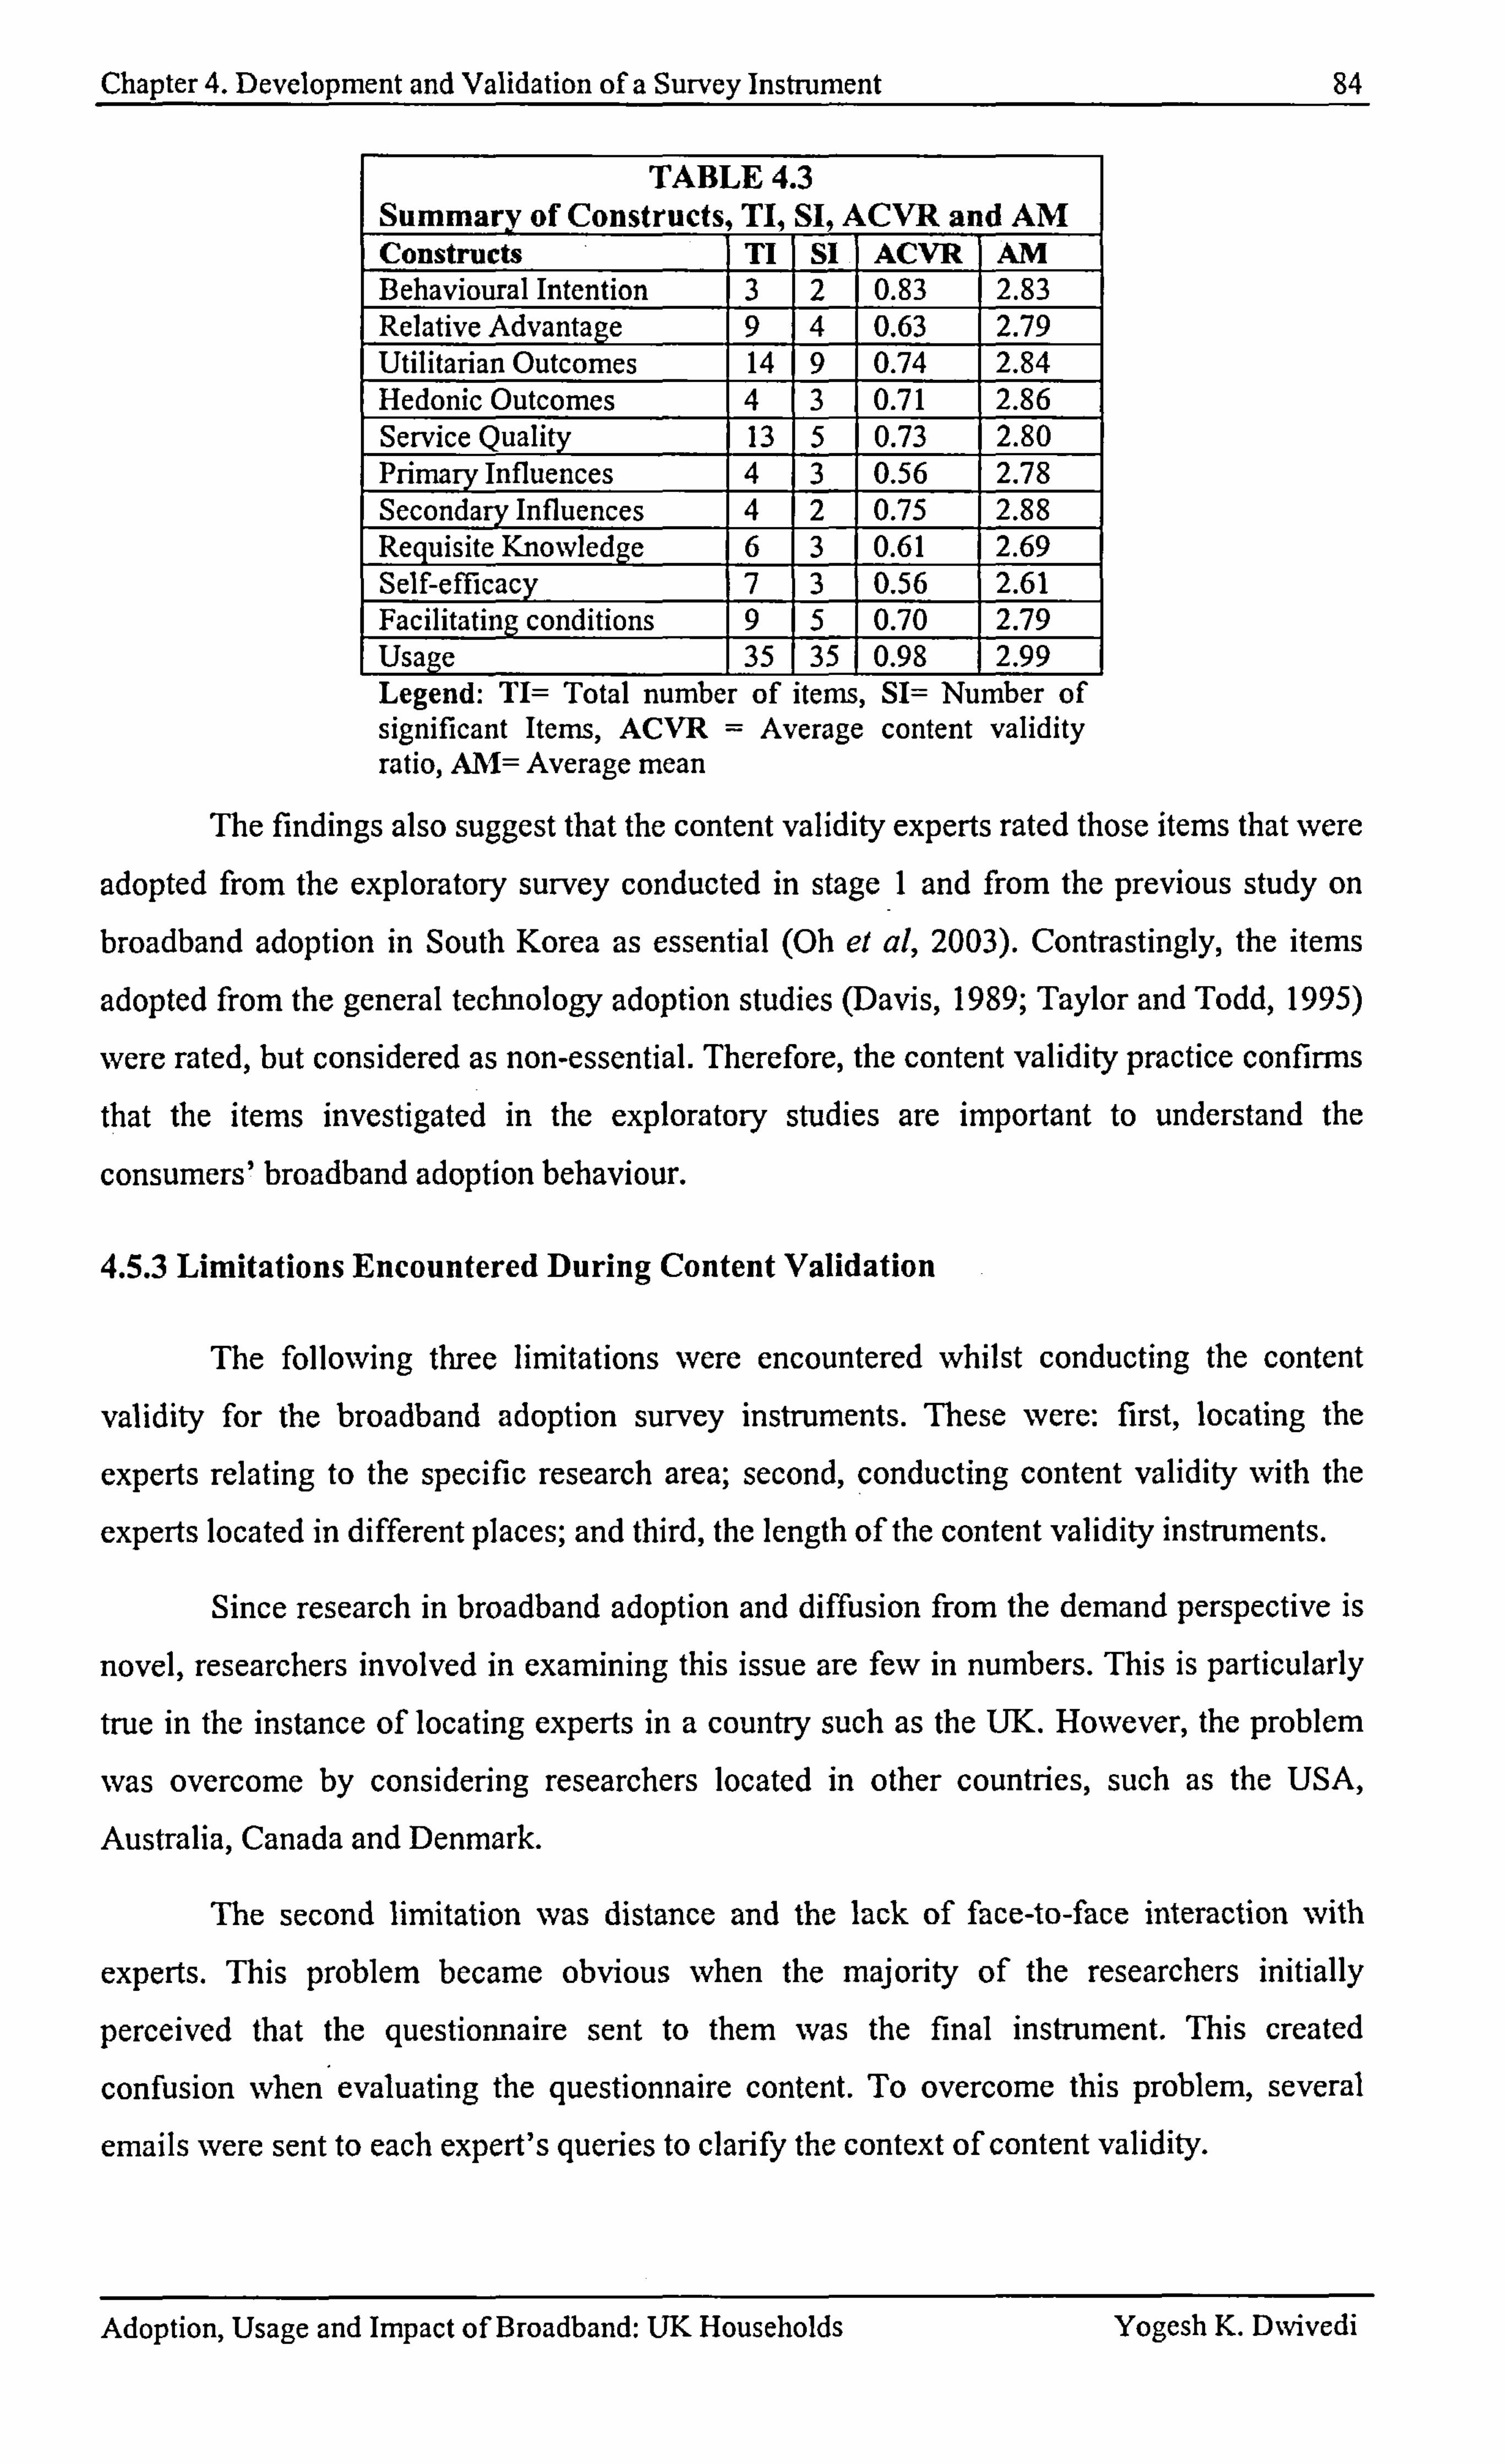
Chapter 4. Development and Validation of a Survey Instrument 84
TABLE 4.3 Summary of Constructs, TI, SI, ACVR and AM Constructs TI Sl I ACVR AM B ehavioural Intention 3 2 0.83 2.83 Relative Advantage 9 4 0.63 2.79 Utilitarian Outcomes 14 9 0.74 2.84
_ Hedonic Outcomes 4 3 0.71 2.86 Service Quality 13 5 0.73 2.80 Primary Influences 4 3 0.56 2.78 Secondary InflUences 4 2 0.75 2.88 Requisite Knowledge 6 3 0.61 2.69 Self-efficac 7 3 0.56 2.61 Facilitating conditions 9 5 0.70 2.79
_ Usage 35 1 35 1 0.98 2.99 Legend: TI= Total number of items, SI= Number of significant Items, ACVR = Average content validity ratio, AM= Average mean
The findings also suggest that the content validity experts rated those items that were
adopted from the exploratory survey conducted in stage I and from the previous study on broadband adoption in South Korea as essential (Oh et al, 2003). Contrastingly, the items
adopted from the general technology adoption studies (Davis, 1989; Taylor and Todd, 1995)
were rated, but considered as non-essential. Therefore, the content validity practice confinns
that the items investigated in the exploratory studies are important to understand the
consumers' broadband adoption bebaviour.
4.5.3 Limitations Encountered During Content Validation
The following three limitations were encountered whilst conducting the content
validity for the broadband adoption survey instruments. These were: first, locating the
experts relating to the specific research area; second, conducting content validity with the
experts located in different places; and third, the length of the content validity instruments.
Since research in broadband adoption and diffusion from the demand perspective is
novel, researchers involved in examining this issue are few in numbers. This is particularly
true in the instance of locating experts in a country such as the UK. However, the problem
was overcome by considering researchers located in other countries, such as the USA,
Australia, Canada and Denmark.
The second limitation was distance and the lack of face-to-face interaction with
experts. This problem became obvious -when the majority of the researchers initially
perceived that the questionnaire sent to them was the final instrument. This created
confusion when evaluating the questionnaire content. To overcome this problem, several
emails were sent to each expert's queries to clarify the context of content validity.
Adoption, Usage and Impact of Broadband: UK Households Yogesh K. Divivedi
Chapter 4. Development and Validation of a Survey Instrument 85
The length of the instrument extended as the content validity questionnaire
comprised a definition of each construct and related items. For example, the content validity instruments in this study were ten pages long. Initially, the length of the questionnaire discouraged many experts from participating in the content evaluation exercise. However,
after repeated contacts and requests, the researchers agreed to assist with this exercise.
To complete the instrument development process that will be utilised to investigate
broadband diffusion, the next step was to conduct a pre-test and pilot test of the
questionnaire using respondents from a target population.
4.6 STAGE 3: INSTRUMENT TESTING
4.6.1 Pre-Test
A pre-test of the resulting instrument (Appendix-4.6 and 4.7) was conducted with 20 respondents ranging from the broadband industry (3), an IT manager of a county council (1), academics and researchers (10) and household consumers (6). In addition to providing
responses, the respondents were asked to determine whether the questions were
grammatically correct and understandable and to suggest further improvements. The pre-test
participants suggested that all the items for one construct should be measured in the same direction. The content validity experts also repeated this suggestion. Therefore, this
particular issue was considered carefully and such changes were made wherever required. The following is an example of such a change:
The items for the facilitating condition construct 'before pre-test' were: 1.1 cannot subscribe to broadband at home because it is too costly to purchase a new computer or to upgrade my old computer. 2. My annual household income level is enough to afford subscribing to broadband. 3. It is too costly for me to subscribe to broadband at its current subscription fee. 4.1 would be able to subscribe to broadband if I wanted to.
The items for the facilitating condition construct 'after pre-test' were: 1. It is not too costly to purchase a new computer or to upgrade my old computer. 2. My annual household income level is enough to afford subscribing to broadband. 3. It is not too costly for me to subscribe to broadband at its current subscription fee. 4.1 would be able to subscribe to broadband if I wanted to.
The suggestions that were provided by the content validity experts regarding the
rewording and modifying of items were all implemented at this stage and that is reflected in
the pilot questionnaire (Appendix 4.8). Another issue that the respondents commented upon
at the pre-test stage was the length of the questionnaire. Prior to the questionnaire being sent to the pre-test participants, the questionnaire was II pages long. The respondents expressed
concern about the length of the questionnaire. They suggested that in the current forrn, the
Adoption, Usage and Impact of Broadband: UK Households Yogesh K. DNvivedi

Chapter 4. Development and Validation of a Survey Instrument 86
questionnaire length was extensive and could lead to a low response rate. Their suggestion
was that the length of the questionnaire should be reduced but without losing the
measurement content. Bearing in mind the comments of the participants, the total length of the questionnaire was reduced to six pages. This was achieved by making two changes that
consisted of the structure and format of the questions. For example:
(1) In the pre-test questionnaire the options for the Likert scale questions were arranged in
two rows. However, after the comments for each item, the Likert scale options were
managed within one row. This assisted in reducing the length of the questionnaire, e. g.
The arrangement of the Likert Scale items in the pre-test questionnaire: Broadband has an advantage over dial-up/narrowband because it offers faster access to Internet
F1 7=Extremely agree Ej 5= Slightly agree Ej 3= Slightly disagree El 6= Quite agree El 4= Neutral [I 2= Quite disagree El I=Extremely disagree
Arrangement of the Likert Scale items in the final questionnaire: Broadband has an advantage over dial-up/narroNvband because it offers faster access to the Internet Extremely disagree [: 11 [] 2 [: 13 [: 14 Ej 5 [: 16 F] 7 Extremely agree
(2) The second change was made to the usage part of the questionnaire. Both the content
validity experts and pre-test participants suggested this change. In the pre-test questionnaire,
usage of each online activity was a separate question that required a lot of space, which
meant a longer questionnaire. However, following the suggestions, the final questionnaire
consisted of these online activities being arranged in a tabular form. An example is provided below:
The arrangement of the online activities in the pre-test questionnaire:
How often do you access the following online services from home? (1) Email
F1 Several times a day El 3-5 days a week F1 Once every few weeks El About once a day El 1-2 days a week El Less often El Never
(2) Instant messaging F-1 Several times a day 3-5 days a week El Once every few weeks F1 About once a day 1-2 days a week El Less often [: ] Never
The arrangement of the online activities in the final questionnaire:
Online services From Home From Work Place.
Email E]Yes Instant messaging E]Yes
Internet Caf6, Library E]No []Yes FlNo E]No [: ]Yes nNo
Would you like to use it in the future? E3Yes FINo EjYes E]No
Besides the aforementioned changes and a few spelling and typographical errors, the
respondents from the pre-test studies supported the content of the questionnaire. After
Adoption, Usage and Impact of Broadband: UK Households Yogesh K. DNvivedi
Chapter 4. Development and Validation of a Survey Instrument 87
incorporating all the suggested changes by the content validity experts and pre-test
participants, the length of the resultant questionnaire was reduced to six pages (Appendix
4.8). More details regarding the contents of the final questionnaire are provided in the
following sub-section titled 'pilot-test'.
4.6.2 Pilot-Test
4.6.2.1 Research Method
The final stage of the instrument development process was a pilot test of the
questionnaire using respondents whose backgrounds were similar to the final study's target
population. The respondents were selected utilising the 'UK-Info Disk VI F database. The
database comprised the nationwide addresses of households in the UK. The primary aim of
the test was to ensure that the various scales demonstrated the appropriate levels of
reliability. The pilot also indicated to the researchers an estimate of the actual response rates. Furthen-nore, the pilot identified difficulties that respondents could face when completing the
questionnaire. For example, some of the difficulties included determining whether the
diction of questionnaire and the accompanying instructions were comprehensive enough for
completion of the questionnaire (Moore and Benbasat, 1991).
From the pre-test, a survey instrument resulted that was six pages long and consisted
of an overall total of 17 questions (Appendix 4.8). The questions were divided into four
categories: (1) multiple type questions examining the demographics of the respondents (questions 1-6), Internet connection types, frequency and duration of Internet access on a daily basis (question 8-12); (2) YesNo questions that determined the location of the Internet
at home or elsewhere (question 7), accessibility to various (total of 41) online activities (question 16); (3) Likert scale questions to assess the perception of the adopters and non-
adopters of broadband (Question 13); and (4) to assess the impact of broadband upon individuals time allocation patterns, respondents were questioned about their use of the
Internet. That is, whether usage of broadband had increased, decreased or had no impact,
upon the amount of time spent on the 20 various daily life activities (Question 17).
Appendix 4.8 illustrates the questionnaire that was utilised for the pilot study.
Four other questions were also asked in order to determine a respondent's
understanding of the questionnaire (Appendix 4.8). The four questions were: (1) Is the
length of the questionnaire appropriate? (2) Are the questions understandable? (3) Is the
layout of the questionnaire acceptable? (4) How long did it take the respondent to complete
the questionnaire? The responses of the respondents on these four questions are surnmarised in Table 4.5.
Adoption, Usage and Impact of Broadband: UK Households Yogesh K. DNvivedi
Chapter 4. Development and Validation of a Survey Instrument 88
The pilot questionnaires were sent to an overall total of 200 respondents via the
postal service in the month of December 2004. A covering letter that included the definitions
of broadband, narrowband, metered and un-metered, and a self-addressed prepaid return
envelope were also included with the questionnaire. A total of 42 replies were received
within the specified time limit. Of the replies, there were 40 usable responses and the
remaining two replies were incomplete; therefore they offered no relevance and were
excluded from the analysis. Hence, a response rate of 20 per cent was obtained.
4.6.2.2 Findings from Pilot Test
Of the overall 40 responses, 21 (52.5%) respondents had narrowband (dialup)
connections. Further, seven (17.5%) of them had metered narrowband, whilst 14 (35%) had
un-metered narrowband. There were 13 (32.5%) respondents who had broadband. The
broadband replies also had categories and the resulting replies are as follows. Eight (20%)
respondents had DSL, four (10%) had a cable modem and one (2.5%) had a wireless
connection. The remaining six (15%) respondents did not access the Internet from home
using either narrowband or broadband. Considering the diversity of the connection types,
this sample of 40 respondents was considered to be a good sample for the purposes of pilot testing the instrument, since it consisted of various types of adopters and non-adopters of
narrowband and broadband.
The mean, standard deviation (SD) and reliability (alpha) obtained from the pilot- test are presented in Table 4.4. The descriptive statistics (Mean and Standard Deviation)
illustrated in Table 4.4 suggest that amongst the attitudinal constructs, the relative advantage
construct is highly rated, with the lowest standard deviations at a7 point Likert scale and the
hedonic outcome being poorly rated. Amongst the normative constructs, primary influence
was considered to be more important than secondary influence. The descriptive statistics for
the control constructs suggest that the skill construct is highly rated. This means that the
majority of respondents including the adopters and non-adopters possess skills required for
broadband adoption and use. Although a brief summary of the descriptive statistics is
provided here, an in-depth analysis of the significance of factors is not provided, as this does
not fit within the scope of this chapter. The following sub-sections discuss the test of instrument reliability.
The statistics obtained from the reliability analysis confirm the internal consistency
of the measure. Cronbach's a for this test varies between 0.95 for three constructs, namely behavioural intention, secondary influence and self-efficacy and 0.72 for facilitating
conditions resources. All the constructs included in the survey possess Cronbach's alpha
above 0.70. The IS literature offers advice that in order to satisfy the internal consistency
Adoption, Usage and Impact of Broadband: UK Households Yogesh K. D%vivedi
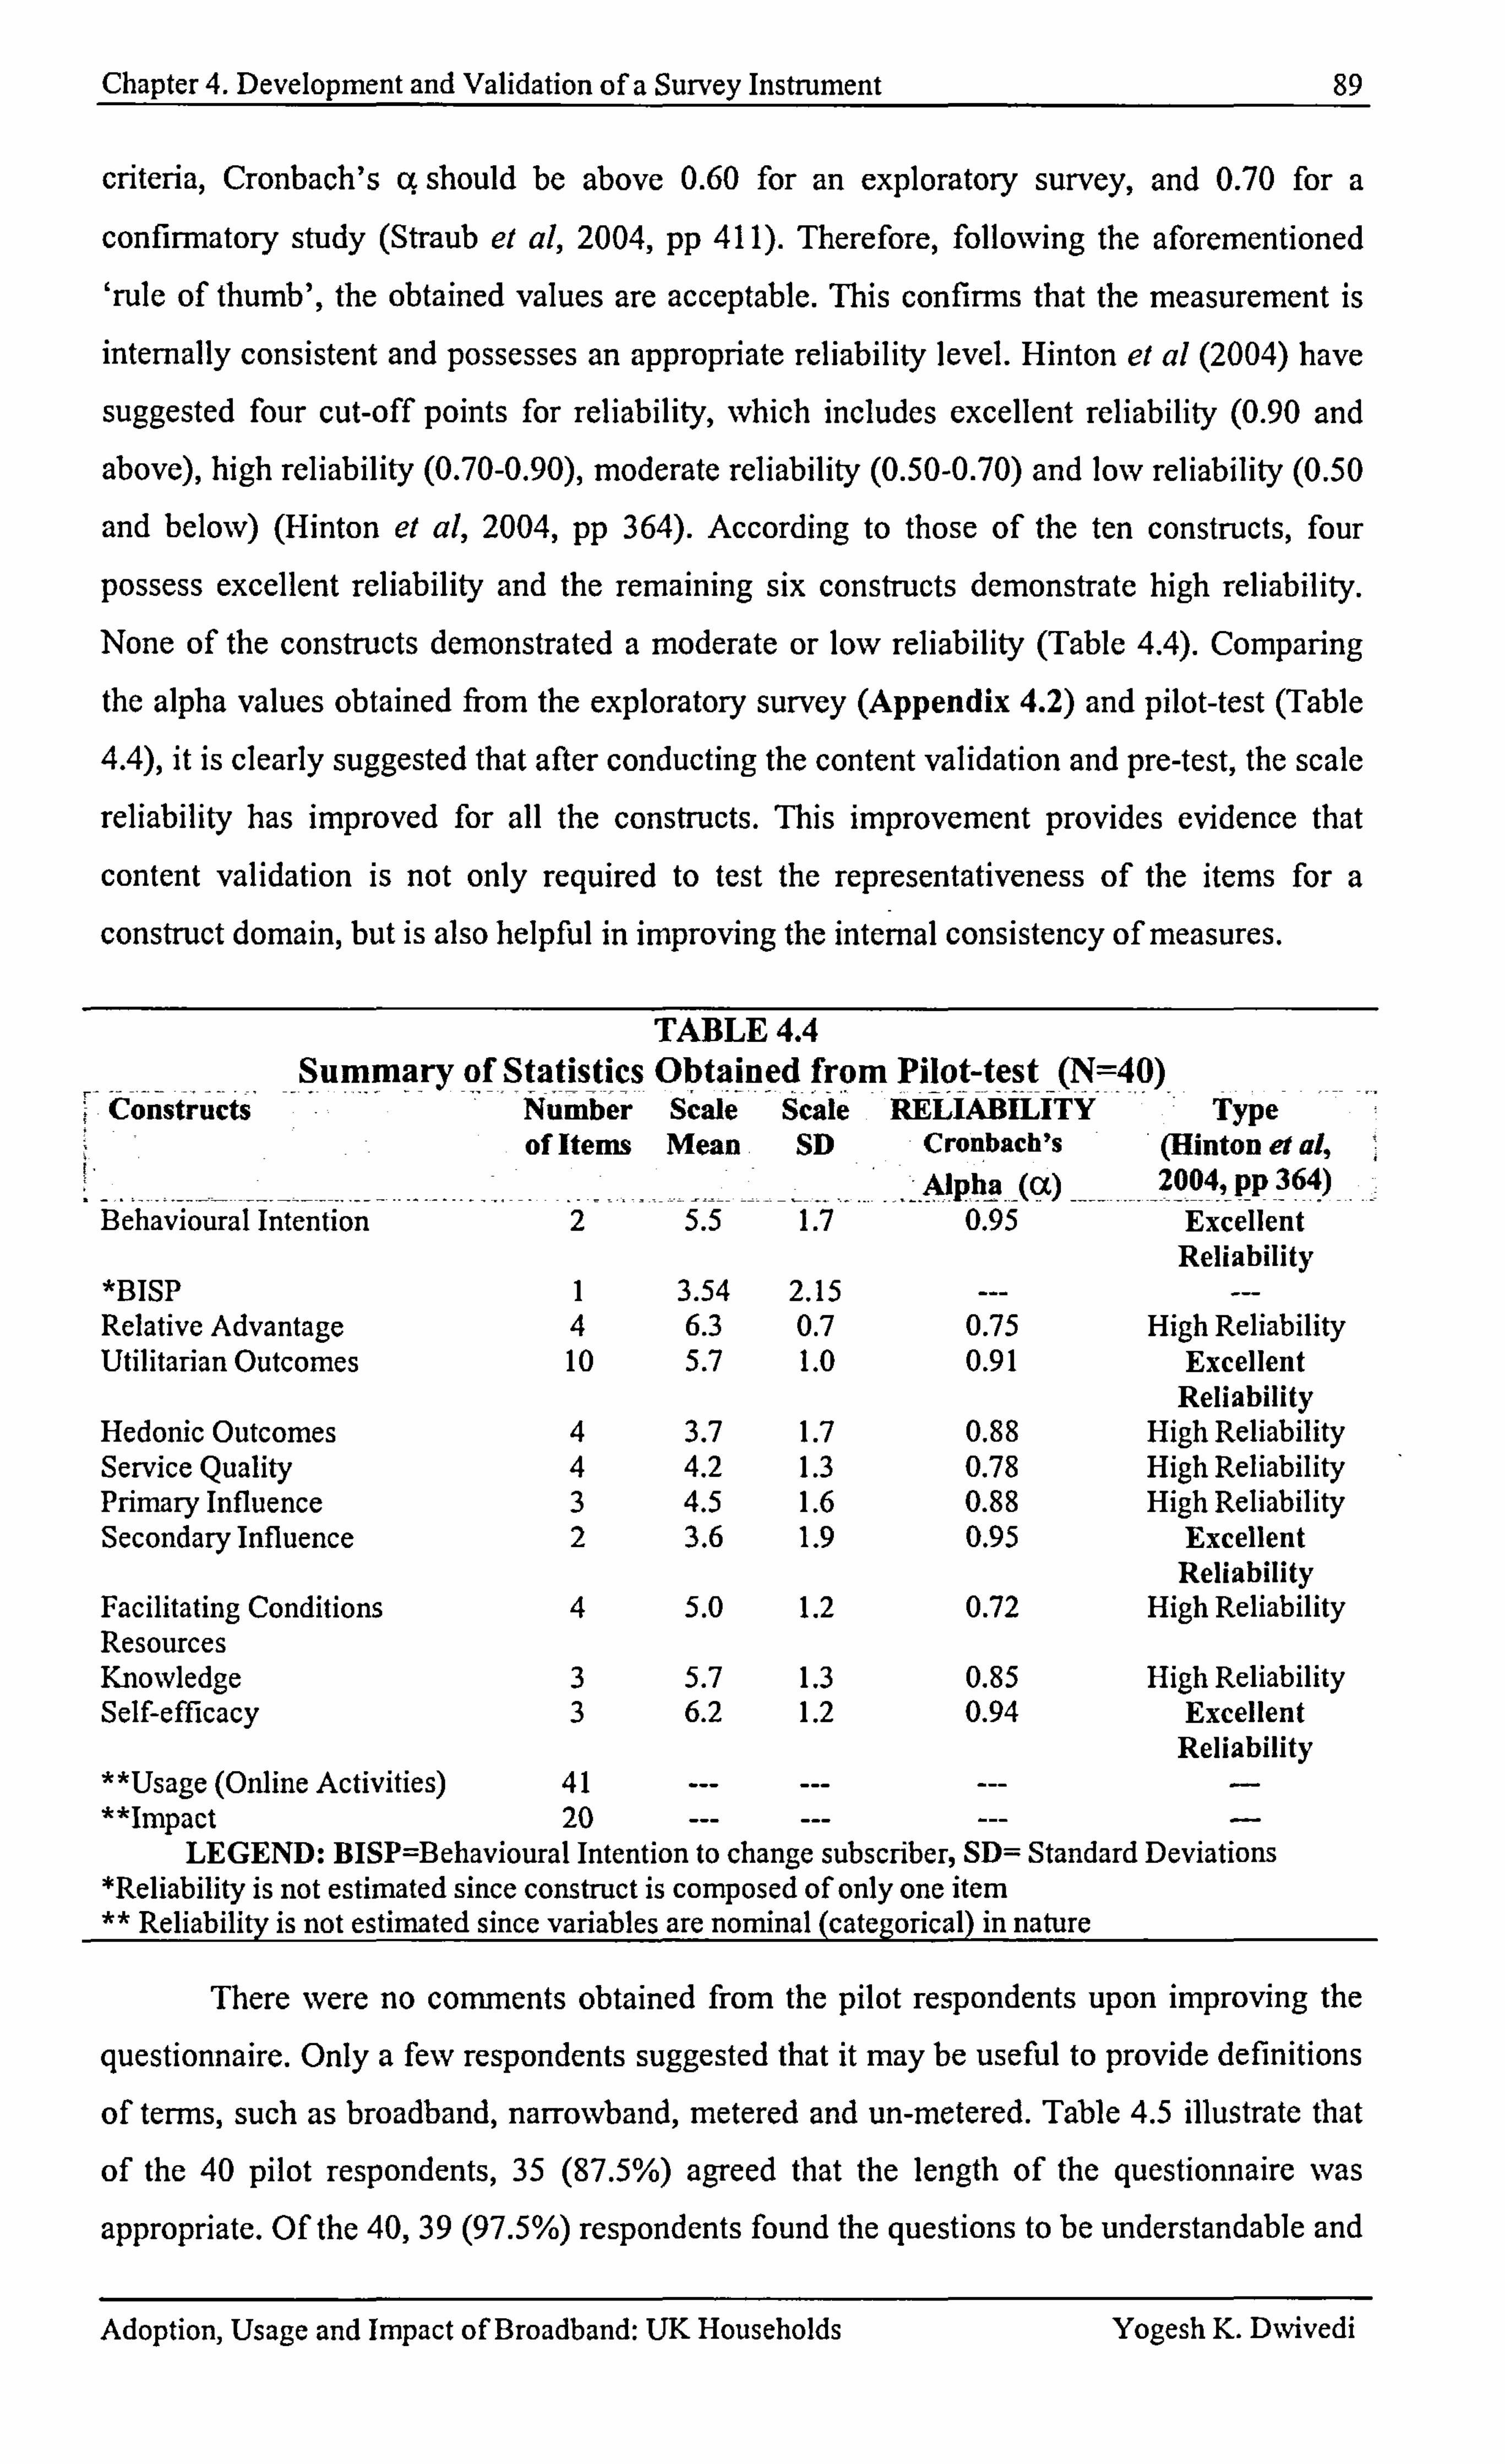
Chapter 4. Development and Validation of a Survey Instrument 89
criteria, Cronbach's q should be above 0.60 for an exploratory survey, and 0.70 for a
confirmatory study (Straub et al, 2004, pp 411). Therefore, following the aforementioned 'rule of thumb', the obtained values are acceptable. This confirms that the measurement is
internally consistent and possesses an appropriate reliability level. Hinton el al (2004) have
suggested four cut-off points for reliability, which includes excellent reliability (0.90 and
above), high reliability (0.70-0.90), moderate reliability (0.50-0.70) and low reliability (0.50
and below) (Hinton et al, 2004, pp 364). According to those of the ten constructs, four
possess excellent reliability and the remaining six constructs demonstrate high reliability. None of the constructs demonstrated a moderate or low reliability (Table 4.4). Comparing
the alpha values obtained from the exploratory survey (Appendix 4.2) and pilot-test (Table
4.4), it is clearly suggested that after conducting the content validation and pre-test, the scale
reliability has improved for all the constructs. This improvement provides evidence that
content validation is not only required to test the repr esentativeness of the items for a
construct domain, but is also helpful in improving the internal consistency of measures.
TABLE 4.4 Summa7 of Statistics Obtained from Pilot-test (N=40)
6ns tructs Number Scale Scale RELIABELITY Type of Items Mean SD Cronbach's (Hinton et al,
a 2004, pp 364) Behavioural Intention 2 5.5 1.7 0.95 Excellent
Reliability *BISP 1 3.54 2.15 Relative Advantage 4 6.3 0.7 0.75 High Reliability Utilitarian Outcomes 10 5.7 1.0 0.91 Excellent
Reliability Hedonic Outcomes 4 3.7 1.7 0.88 High Reliability Service Quality 4 4.2 1.3 0.78 High Reliability Primary Influence 3 4.5 1.6 0.88 High Reliability Secondary Influence 2 3.6 1.9 0.95 Excellent
Reliability Facilitating Conditions 4 5.0 1.2 0.72 High Reliability Resources Knowledge 3 5.7 1.3 0.85 High Reliability Self-efficacy 3 6.2 1.2 0.94 Excellent
Reliability **Usage (Online Activities) 41 --- --- --- "Impact 20 --- --- ---
LEGEND: BISP=Behavioural Intention to change subscriber, SD= Standard Deviations *Reliability is not estimated sinc e construct is composed of onl y one item ** Reliability is not estimated since variables are nominal (categorical) in nature
There were no comments obtained from the pilot respondents upon improving the
questionnaire. Only a few respondents suggested that it may be useful to provide definitions
of terms, such as broadband, narrowband, metered and un-metered. Table 4.5 illustrate that
of the 40 pilot respondents, 35 (87.5%) agreed that the length of the questionnaire was
appropriate. Of the 40,39 (97.5%) respondents found the questions to be understandable and
Adoption, Usage and Impact of Broadband: UK Households Yogesh K. DNvivedi
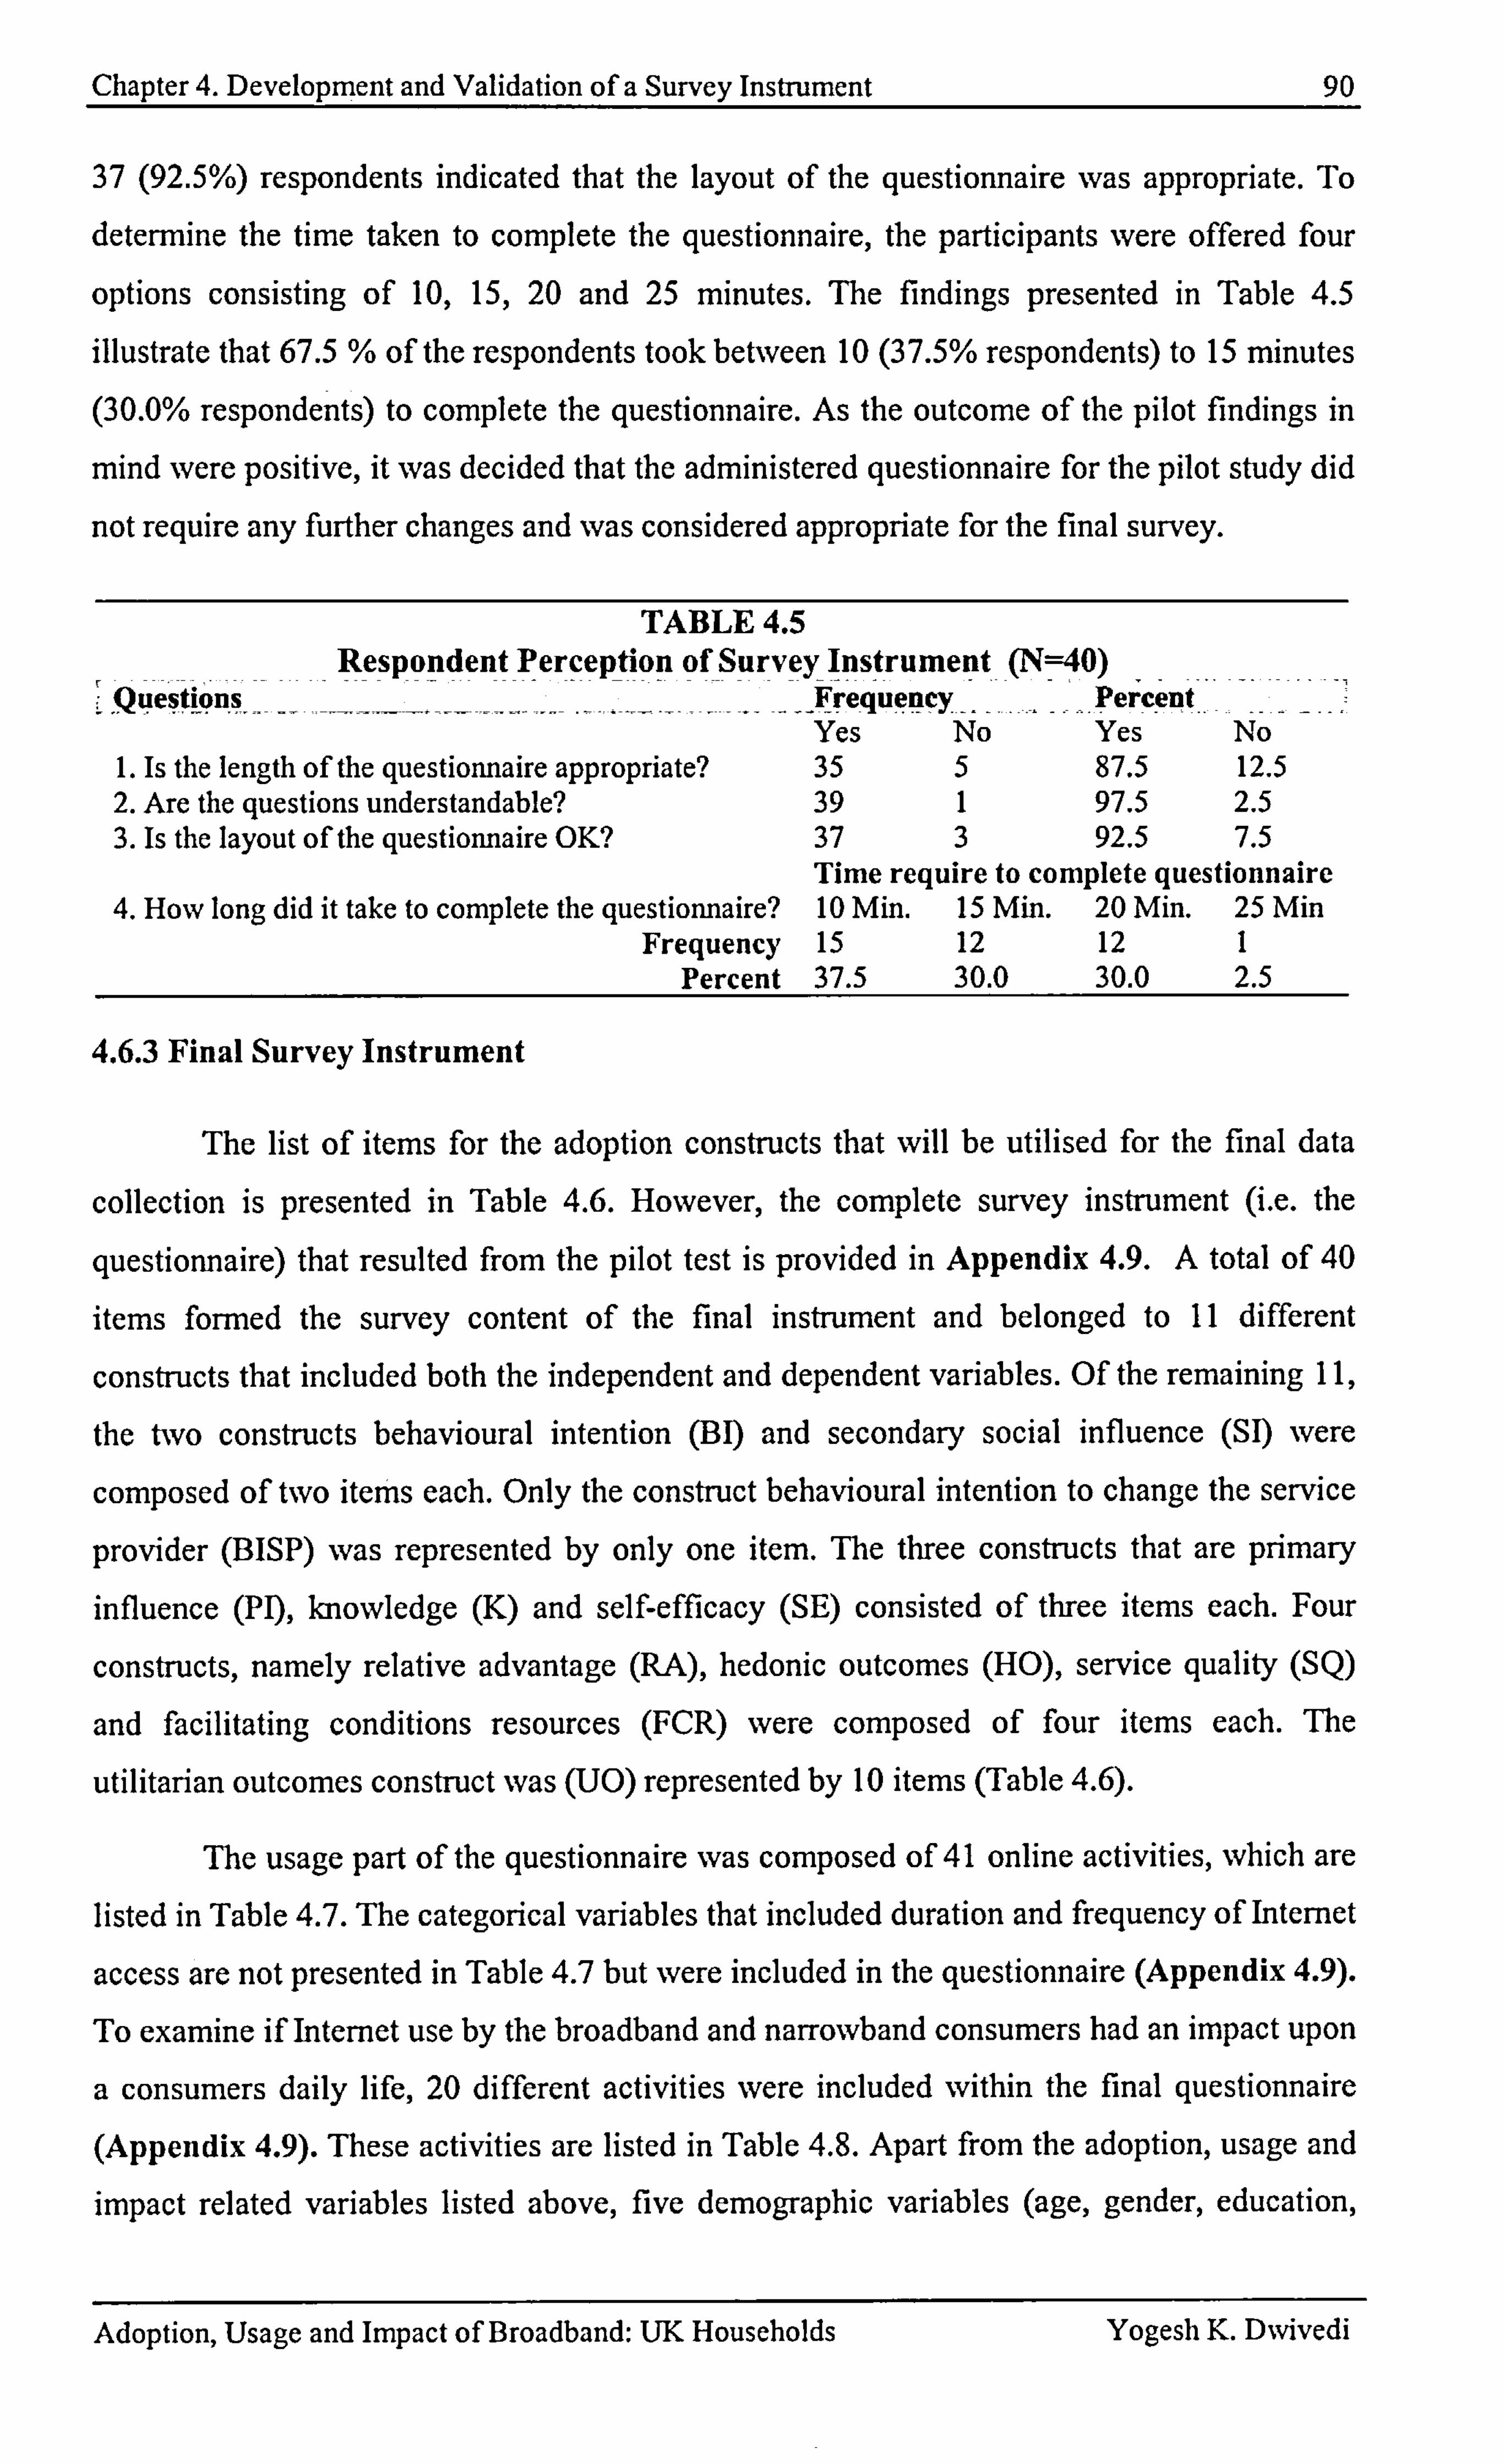
Chapter 4. Development and Validation of a Survey Instrument 90
37 (92.5%) respondents indicated that the layout of the questionnaire was appropriate. To
determine the time taken to complete the questionnaire, the participants were offered four
options consisting of 10,15,20 and 25 minutes. The findings presented in Table 4.5
illustrate that 67.5 % of the respondents took between 10 (37.5% respondents) to 15 minutes (30.0% respondents) to complete the questionnaire. As the outcome of the pilot findings in
mind were positive, it was decided that the administered questionnaire for the pilot study did
not require any further changes and was considered appropriate for the final survey.
TABLE 4.5 Respondent Perception of Survey Instrument (N=40)
Questions Frequenc . --y-. - ý-ý ent .
Pero Yes No Yes No
1. Is the length of the questionnaire appropriate? 35 5 87.5 12.5 2. Are the questions understandable? 39 1 97.5 2.5 3. Is the layout of the questionnaire OK? 37 3 92.5 7.5
Time require to complete ques tionnaire 4. How long did it take to complete the questionnaire? 10 Min. 15 Min. 20 Min. 25 Min
Frequency 15 12 12 1 Percent 37.5 30.0 30.0 2.5
4.6.3 Final Survey Instrument
The list of items for the adoption constructs that will be utilised for the final data
collection is presented in Table 4.6. However, the complete survey instrument (i. e. the
questionnaire) that resulted from the pilot test is provided in Appendix 4.9. A total of 40
items formed the survey content of the final instrument and belonged to II different
constructs that included both the independent and dependent variables. Of the remaining 11,
the two constructs behavioural intention (BI) and secondary social influence (SI) were
composed of two items each. Only the construct behavioural intention to change the service
provider (BISP) was represented by only one item. The three constructs that are primary influence (PI), knowledge (K) and self-efficacy (SE) consisted of three items each. Four
constructs, namely relative advantage (RA), hedonic outcomes (HO), service quality (SQ)
and facilitating conditions resources (FCR) were composed of four items each. The
utilitarian outcomes construct was (UO) represented by 10 items (Table 4.6).
The usage part of the questionnaire was composed of 41 online activities, which are listed in Table 4.7. The categorical variables that included duration and frequency of Internet
access are not presented in Table 4.7 but were included in the questionnaire (Appendix 4.9).
To examine if Internet use by the broadband and narrowband consumers had an impact upon
a consumers daily life, 20 different activities were included within the final questionnaire (Appendix 4.9). These activities are listed in Table 4.8. Apart from the adoption, usage and impact related variables listed above, five demographic variables (age, gender, education,
Adoption, Usage and Impact of Broadband: UK Households Yogesh K. DNvivedi
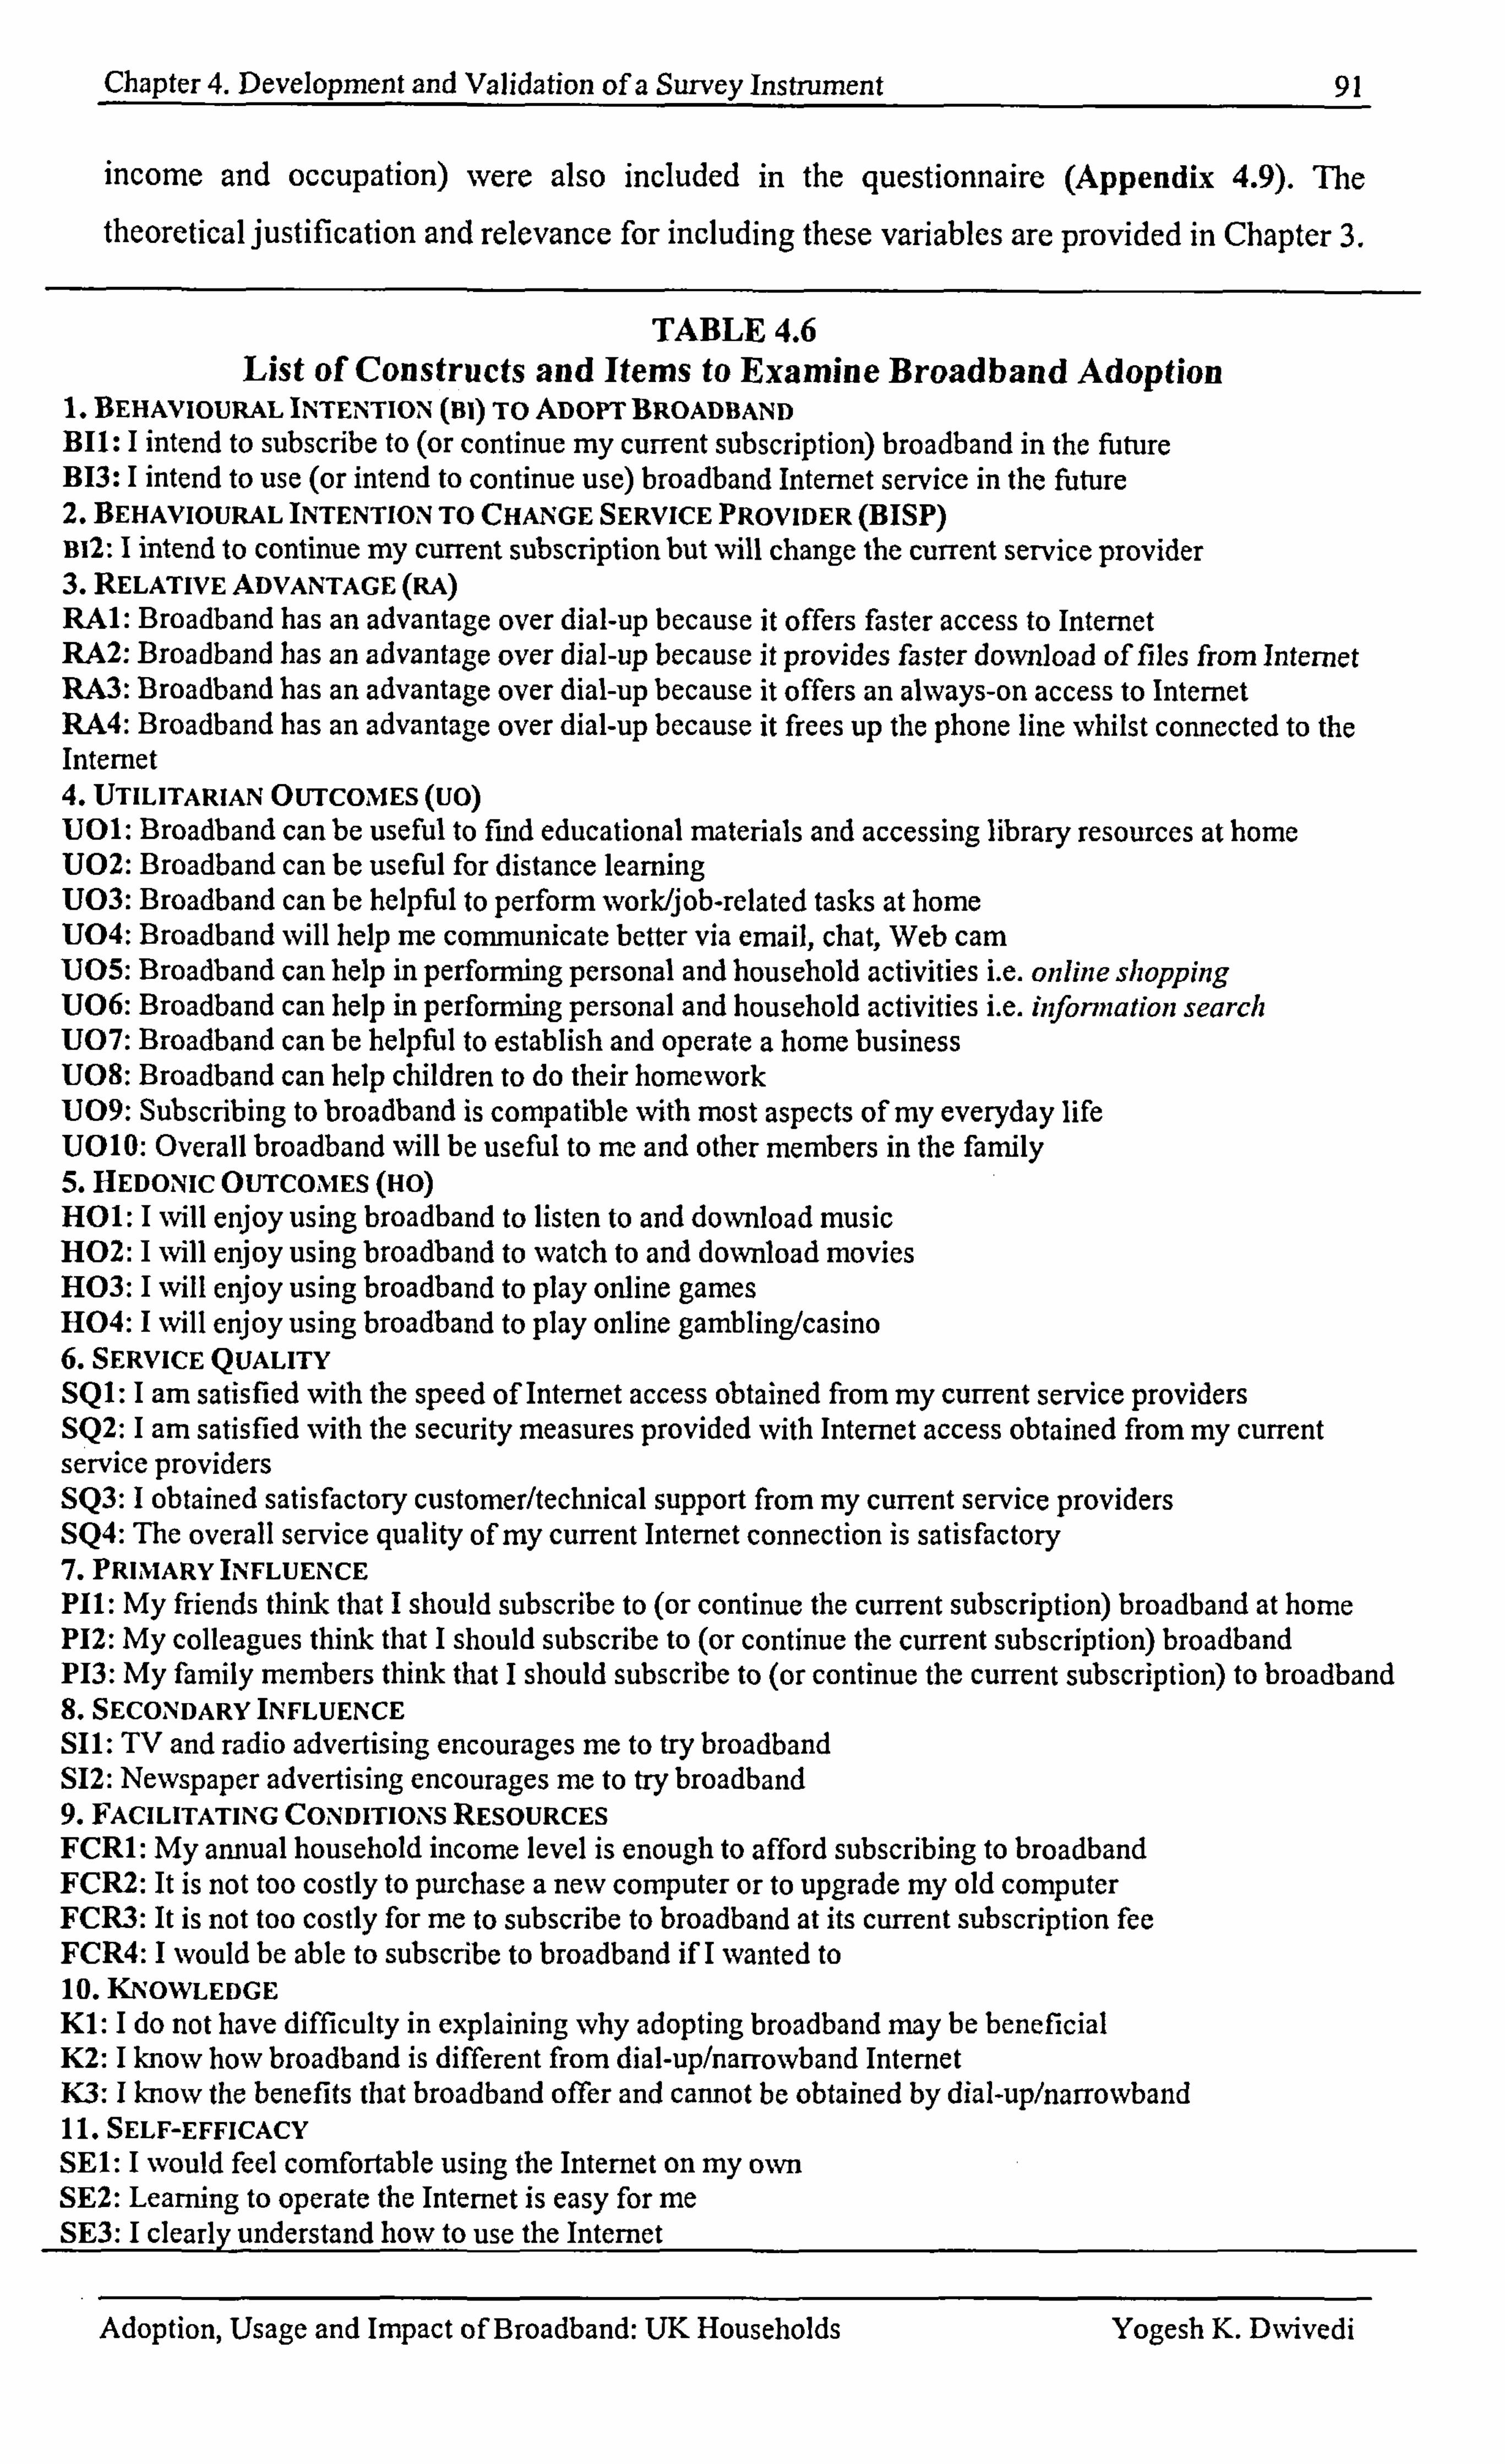
Chapter 4. Development and Validation of a Survey Instrument 91
income and occupation) were also included in the questionnaire (Appendix 4.9). The
theoretical justification and relevance for including these variables are provided in Chapter 3.
TABLE 4.6 List of Constructs and Items to Examine Broadband Adoption
1. BEHAVIOURAL INTENTION (BI) To ADOPT BROADBAND
1311: 1 intend to subscribe to (or continue my current subscription) broadband in the future B13: I intend to use (or intend to continue use) broadband Internet service in the future 2. BEHAVIOURAL INTENTION TO CHANGE SERVICE PROVIDER (BISP)
B12: I intend to continue my current subscription but will change the current service provider 3. RELATIVE ADVANTAGE (RA)
RAI: Broadband has an advantage over dial-up because it offers faster access to Internet RA2: Broadband has an advantage over dial-up because it provides faster download of files from Internet RA3: Broadband has an advantage over dial-up because it offers an always-on access to Internet RA4: Broadband has an advantage over dial-up because it frees up the phone line whilst connected to the Internet 4. UTILITARIAN OUTCOMES (UO)
U01: Broadband can be useful to find educational materials and accessing library resources at home U02: Broadband can be useful for distance learning U03: Broadband can be helpful to perform work/job-related tasks at home U04: Broadband will help me communicate better via email, chat, Web cam U05: Broadband can help in performing personal and household activities i. e. online shopping U06: Broadband can help in performing personal and household activities i. e. infonnation search U07: Broadband can be helpful to establish and operate a home business U08: Broadband can help children to do their homework U09: Subscribing to broadband is compatible with most aspects of my everyday life U010: Overall broadband will be useful to me and other members in the family 5. HEDONIC OUTCOMES (HO)
H01: I will enjoy using broadband to listen to and download music H02: I will enjoy using broadband to watch to and download movies H03: I will enjoy using broadband to play online games H04: I will enjoy using broadband to play online gambling/casino 6. SERVICE QUALITY
SQ1: I am satisfied with the speed of Internet access obtained from my current service providers SQ2: I am satisfied with the security measures provided with Internet access obtained from my current service providers SQ3: I obtained satisfactory customer/technical support from my cuff ent service providers SQ4: The overall service quality of my current Internet connection is satisfactory 7. PRIMARY INFLUENCE
PH: My friends think that I should subscribe to (or continue the current subscription) broadband at home P12: My colleagues think that I should subscribe to (or continue the current subscription) broadband P13: My family members think that I should subscribe to (or continue the current subscription) to broadband &SECONDARYINFLUENCE
SII: TV and radio advertising encourages me to try broadband S12: Newspaper advertising encourages me to try broadband 9. FACILITATING CONDITIONS RESOURCES FCRI: My annual household income level is enough to afford subscribing to broadband FCR2: It is not too costly to purchase a new computer or to upgrade my old computer FCR3: It is not too costly for me to subscribe to broadband at its current subscription fee FCR4: I would be able to subscribe to broadband if I wanted to 10. KNOWLEDGE
Kl: I do not have difficulty in explaining why adopting broadband may be beneficial K2: I know how broadband is different from dial-up/narrowband Internet K3: I know the benefits that broadband offer and cannot be obtained by dial-up/narrowband 11. SELF-EFFICACY
SEI: I would feel comfortable using the Internet on my own SE2: Leaming to operate the Internet is easy for me SE3: I clearlv understand how to use the Internet
Adoption, Usage and Impact of Broadband: UK Households Yogesh K. D%vivedi
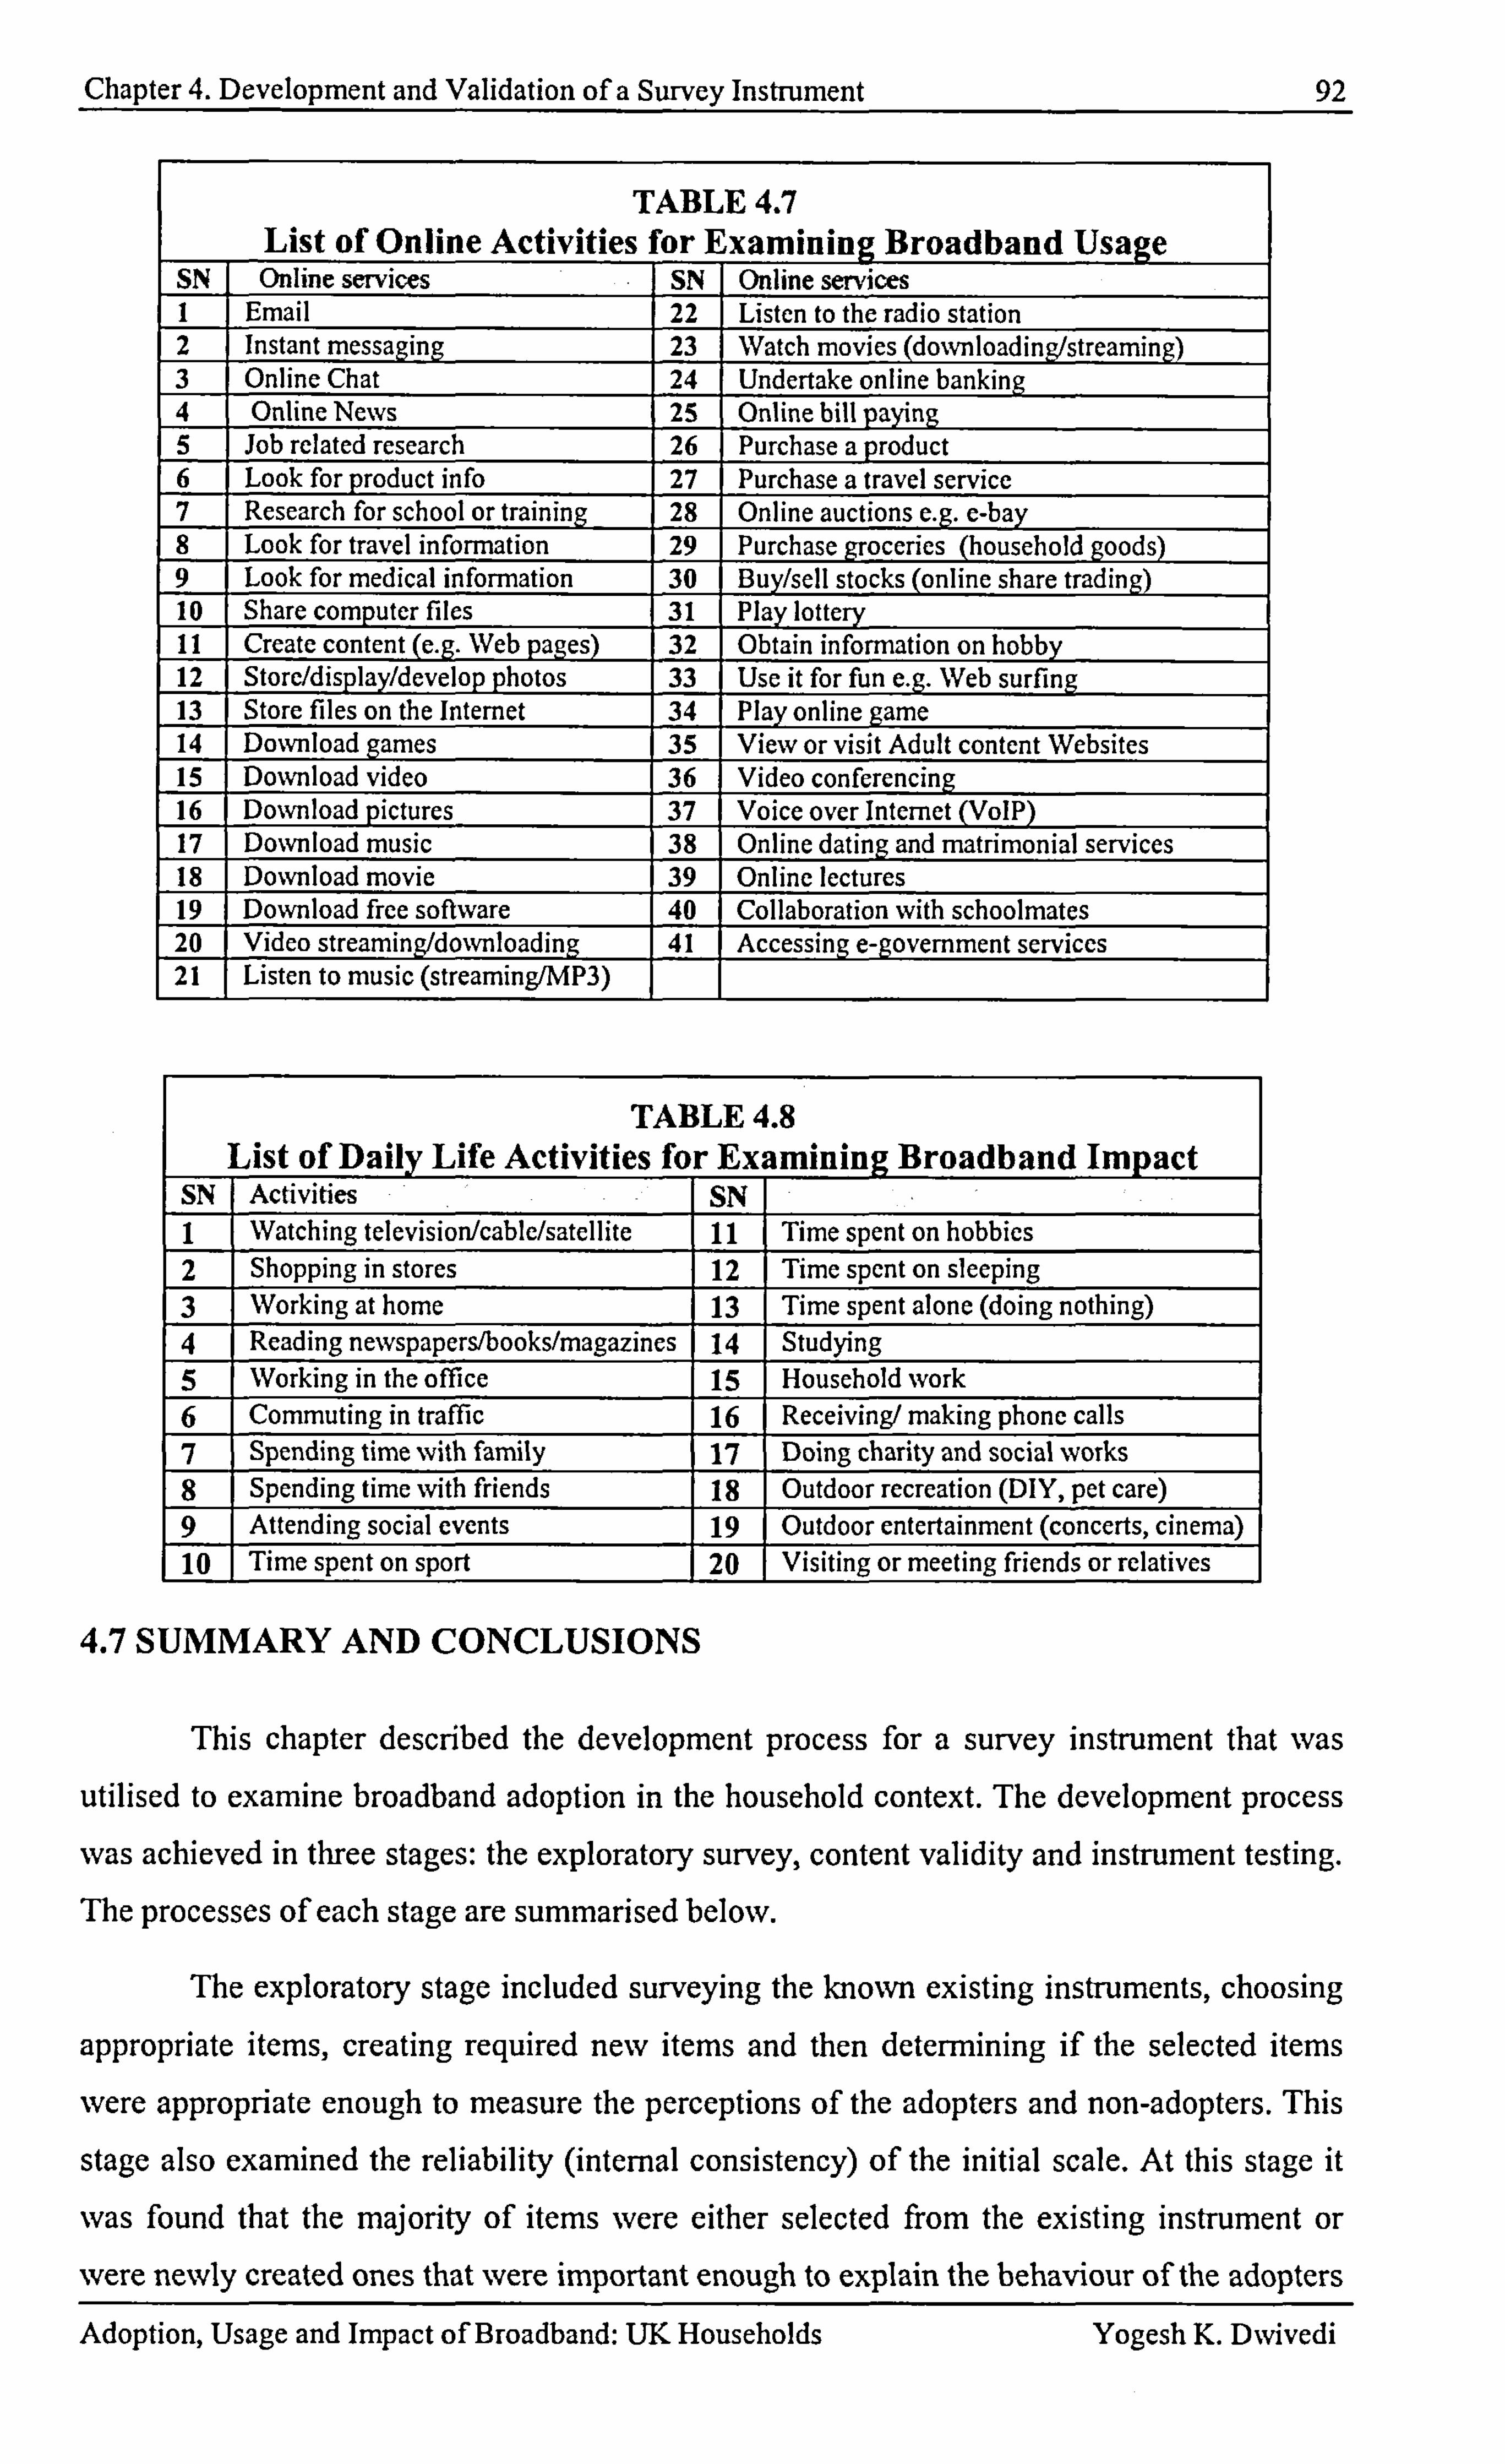
Chapter 4. Development and Validation of a Survey Instrument 92
TABLE 4.7 List of Online Activities for Examining Broadband Usage
SN Online services SN Online services I Email 22
_Listen to the radio station
2 Instant messaging 23 Watch movies (down load i ng/streaming) 3 Online Chat 24 Undertake online banking 4 Online News 25 Online bill paying 5 Job related research 26 Purchase a product 6 Look for product info 27 Purchase a travel service 7 Research for school or training 28 Online auctions e. g. e-bay 8 Look for travel information 29 Purchase groceries (household goods) 9 Look for medical information 30 Buy/sell stocks (online share trading) 10 Share computer files 31 Play lottery 11 Create content (e. g. Web pages) 32 1 Obtain information on hobby 12 Store/display/develop photos 33 1 Use it for fun e. g. Web surfing 13 Store files on the Internet 34 Play online game 14 Download games 35 View or visit Adult content Websites 15 Download video 36 Video conferencing 16 Download ýicturcs 37 Voice over Internet (VoIP) 17 Download music 38 Online dating and matrimonial services 18 Download movie 39 1 Online lectures 19 Download free software 40 ollaboration with schoolmates 20 Video streaming/downloading 41 Accessing e-government services 21 Listen to music (streaming/MP3)
TABLE 4.8 List of Daily Life Activities for Ex mining Broadband Impact
SN Activifies SN I Watching television/cabIc/satc1lite 11 Time spent on hobbies 2 Shopping in stores 12 Time spent on sleeping 3 Working at home 13 Time spent alone (doing nothing) 4 Reading newspapers/books/magazines 14 Studying 5 Working in the office 15 Household work 6 Commuting in traffic 16 Receiving/ making phone calls 7 Spending time with family 17 Doing charity and social works 8 Spending time with friends 18 Outdoor recreation (DlY, pet care) 9 Attending social events 19 Outdoor entertainment (concerts, cinerni]a)
110 Time spent on sport 20 Visiting or meeting friends or relatives
4.7 SUMMARY AND CONCLUSIONS
This chapter described the development process for a survey instrument that was
utilised to examine broadband adoption in the household context. The development process
was achieved in three stages: the exploratory survey, content validity and instrument testing. The processes of each stage are summarised below.
The exploratory stage included surveying the known existing instruments, choosing
appropriate items, creating required new items and then determining if the selected items
were appropriate enough to measure the perceptions of the adopters and non-adopters. This
stage also examined the reliability (internal consistency) of the initial scale. At this stage it
was found that the majority of items were either selected from the existing instrument or
were newly created ones that were important enough to explain the behaviour of the adopters Adoption, Usage and Impact of Broadband: UK Households Yogesh K. DNvivedi
Chapter 4. Development and Validation of a Survey Instrument 93
and non-adopters. However, the reliability of the scale was low in most cases. The
exploratory stage also led the researcher to identify the new construct that was referred to as 6service quality' and some new items as well. The output of this stage of research was
utilised as an input for the content validity stage.
The content validity stage included the creation of new items for each construct and then the validation of their representativeness utilising a quantitative approach. These new items were created utilising the items obtained from the exploratory stage and also by
resurveying the literature and selecting the relevant items. In order to achieve the
representativeness of items, several experts working on broadband related issues evaluated
the newly created items. This led the researchers to calculate a content validity ratio that was the basis of the exclusion or inclusion of the items. The outcome of this stage was the
inclusion of the representative items and the exclusion of non-related items. The reliability of
all the ten scales improved after conducting the content validity process. This demonstrated
the importance of performing content validation for the increased reliability of the scale and
also the representativeness of the items.
The instrument testing stage was sub-divided into two stages, which included the
pre-test and pilot test. The purpose of the pre-test was to obtain feedback on the instrument
from the respondents, and to improve the wording of items. The purpose of the pilot test was
to confirm the reliability of items. The findings obtained from the pilot test demonstrated an
acceptable level of reliability for all the constructs. The final output of the three-stage
instrument development process that culminated from the pilot test is a parsimonious 40-
item instrument, consisting of II scales, all with a high level of reliability. The final
instrument will be utilised to investigate the behavioural intentions of the household
consumers when adopting broadband and also its usage and impact.
The next chapter (Chapter 5) will analyse and present the findings obtained from the
final data collection that was conducted on a nationwide basis. Chapter 5 first estimates the
response rate and then conducts the response-bias test. This is then followed by a re-
examination of the reliability of the instrument and then construct validity is performed by
conducting Principal Component Analysis. A test was conducted to assess the biases that
may have been introduced due to the ordering of questions. Hereafter, the findings of this
study are presented.
Adoption, Usage and Impact of Broadband: UY, Households Yogesh K. D%vivedi

Chapter 5. Research Findings 94
5.1 INTRODUCTION
The previous chapter (Chapter 4) described the development and validation of a
survey instrument for the purpose of data collection in order to examine broadband adoption,
usage and impact. Chapter 3 provided a discussion and justification of the data collection and
analysis methods. This chapter presents the findings obtained from a nationwide survey that
was conducted to examine the adoption, usage and impact of broadband in the UK
households.
The chapter is structured as follows. Section 5.2 presents a response rate of the
survey and descriptions of how the non-response bias test was conducted. Section 5.3 then describes the demographic profile of the survey respondents. This is followed by a description of the findings relating to the adoption of broadband in section 5.4. The findings
relating to the usage of broadband are then presented in Section 5.5. The effects of broadband usage on a consumer's time allocation patterns in various daily life activities are illustrated in Section 5.6. Finally, the summary and conclusions of the chapter are provided in Section 5.7.
5.2 RESPONSE RATE AND NON-RESPONSE BIAS
A detailed discussion of the response rate estimation process is provided in Chapter
3 (Section 3.5.2.5). Therefore, in this chapter the estimation process is not described. The
total response rate obtained in this research is 26.6 %, which is considered as a good
response rate within the field of IS research.
To test whether the characteristics of the respondents from the original responses are
similar to the non-respondents, a Mest was conducted for the demographics (i. e. age and
gender), Internet access at home, type of Internet connection at home, and all constructs from
attitudinal, normative and control categories. The findings are illustrated in Table 5.1. The I-
test on demographics and all key constructs except the primary influence of the study
showed no significant differences between the respondents and non-respondents (Table 5.1).
There is a significant difference between the original responses and responses from the non-
respondents for the primary influence construct. The possible explanation could be that the
non-respondents were those who more influenced by primary influence.
As discussed above, the majority of variables produced non-significant results in
terms of non-response bias; this suggests that those non-respondents who returned the
completed questionnaire after reminders were similar to the respondents from the original
responses. Hence, this provides evidence that within the sample used for this research, it is
unlikely that the findings were affected due to non-response bias.
Adoption, Usage and Impact of Broadband: UK Households Yogesh K. Divivedi
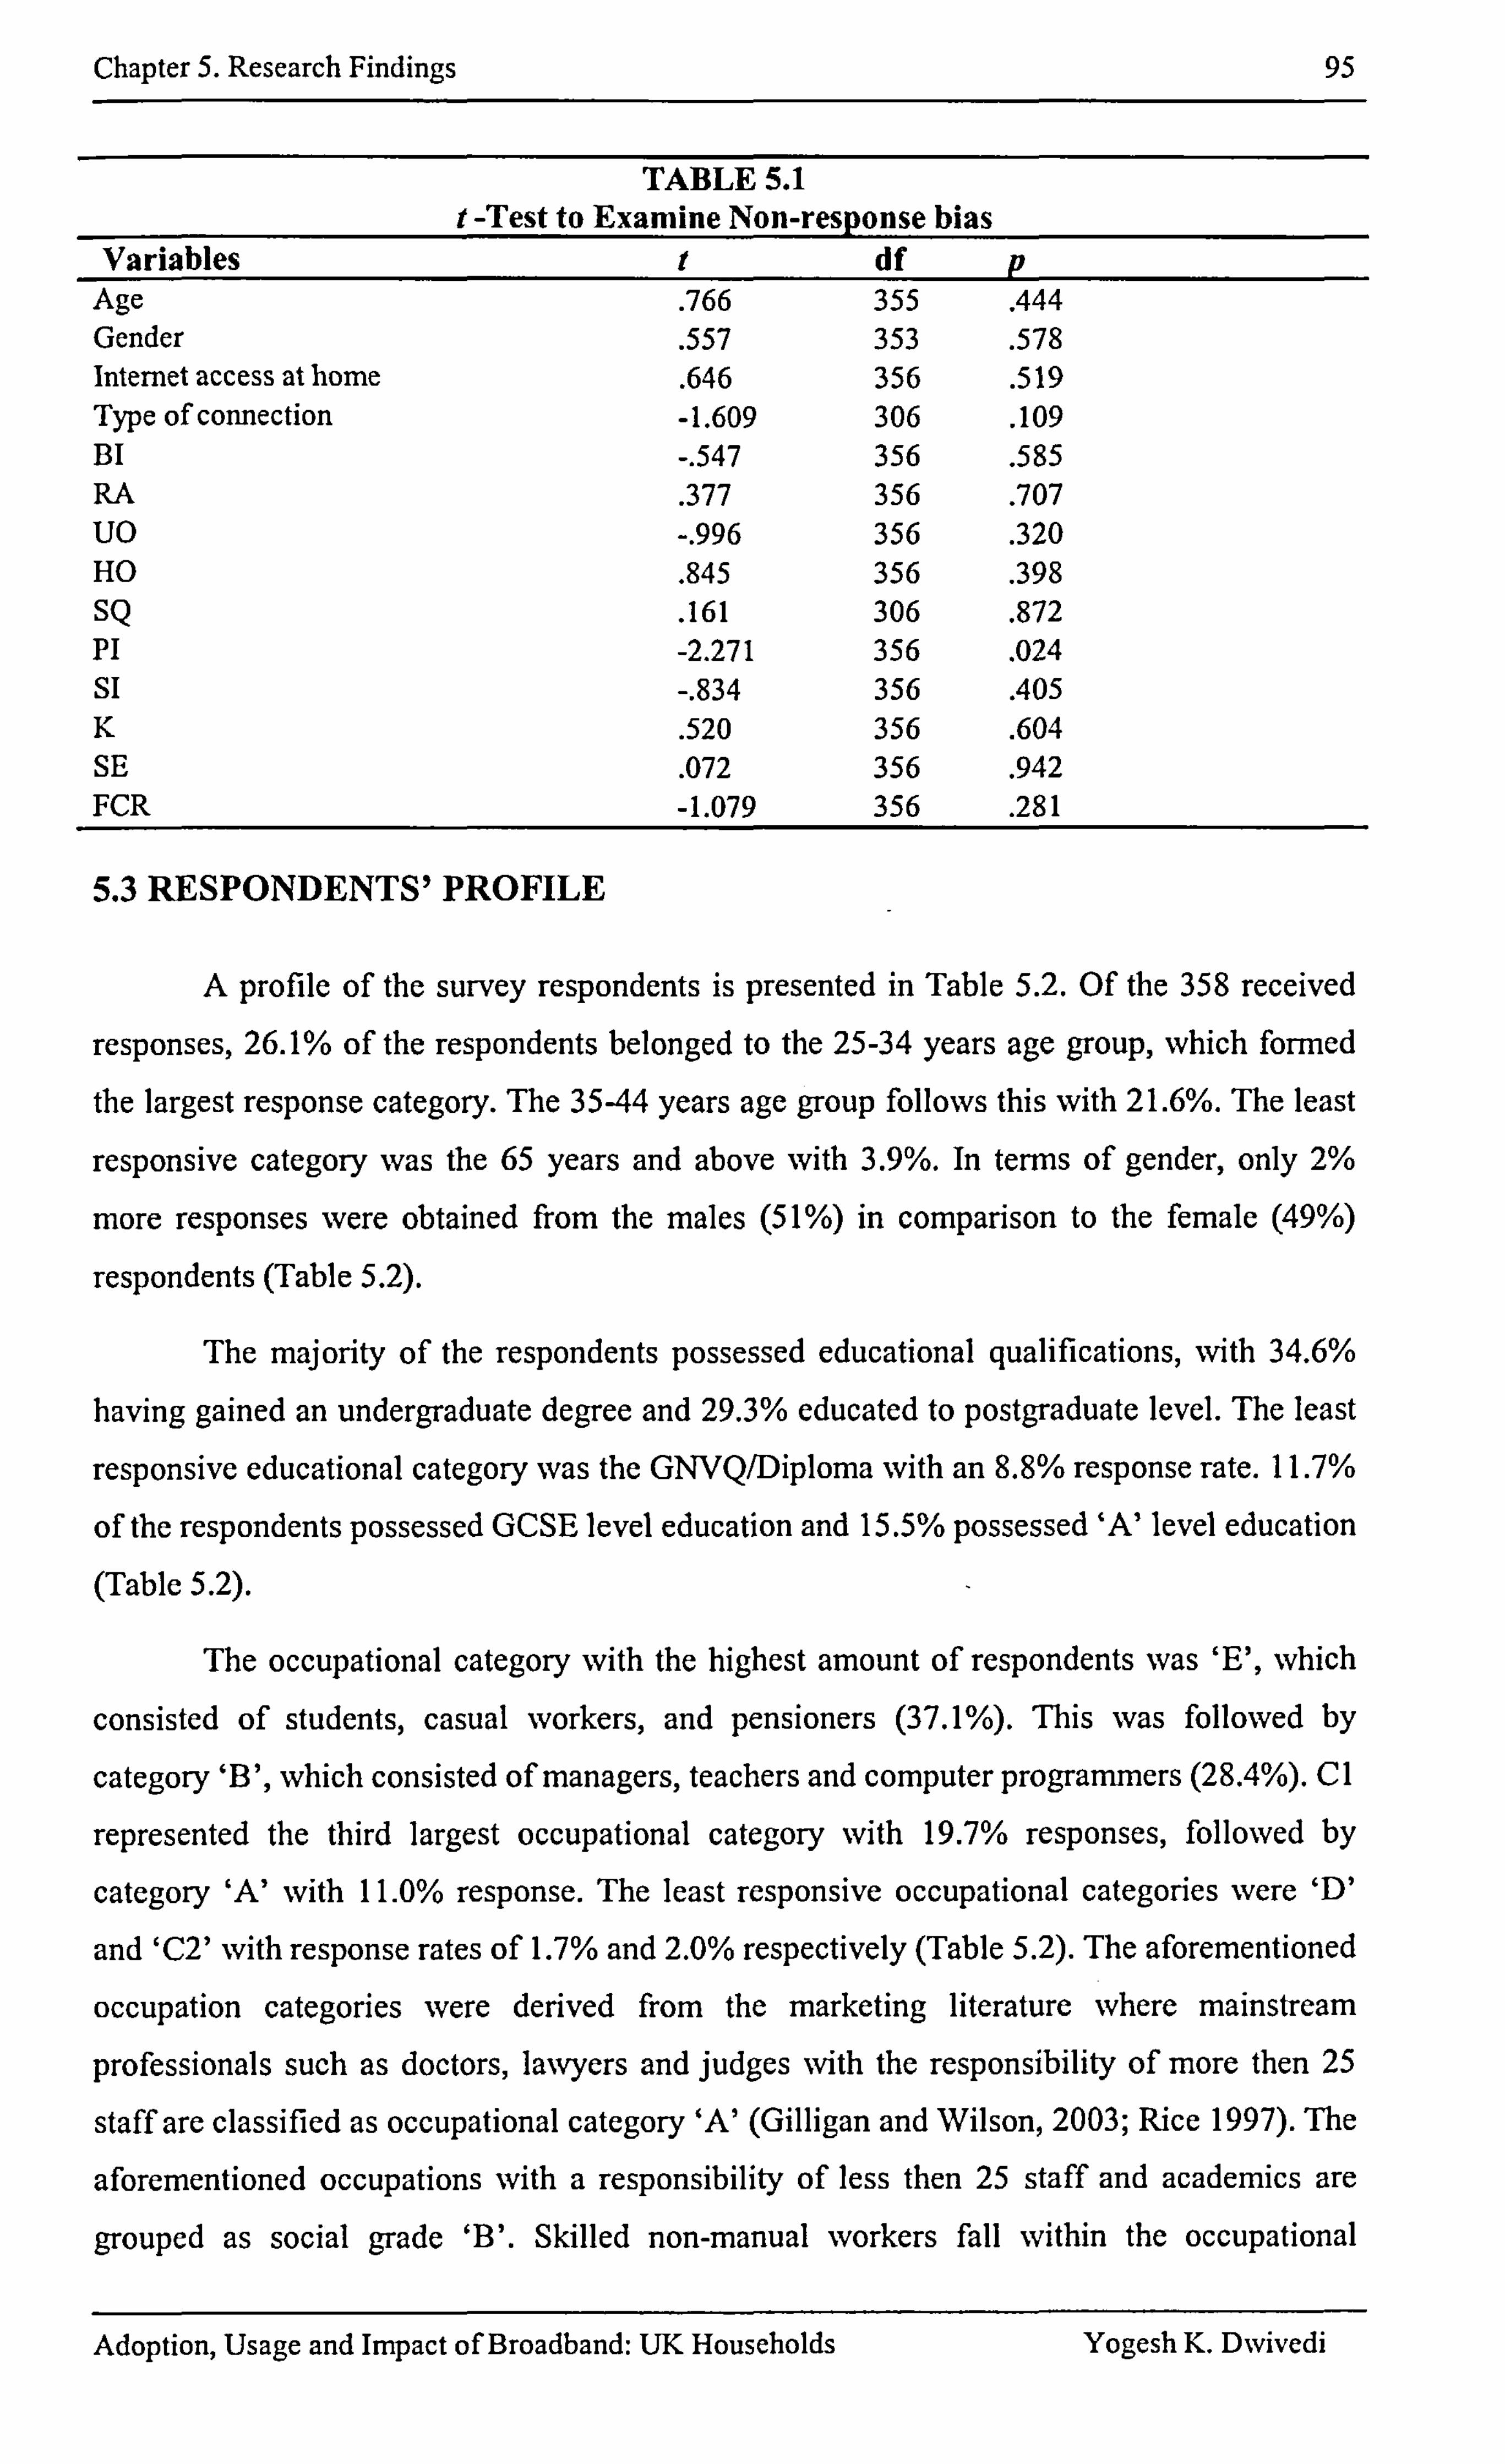
Chapter 5. Research Findings 95
TABLE 5.1 t -Test to Examine Non-resp onse bias
Variables I df p Age . 766 355 . 444 Gender . 557 353 . 578 Internet access at home
. 646 356 . 519 Type of connection -1.609 306 . 109 BI -. 547 356 . 585 RA . 377 356 . 707 UO -. 996 356 . 320 HO . 845 356 . 398 SQ . 161 306 . 872 PI -2.271 356 . 024 SI -. 834 356 . 405 K . 520 356 . 604 SE . 072 356 . 942 FCR -1.079 356 . 281
5.3 RESPONDENTS' PROFILE
A profile of the survey respondents is presented in Table 5.2. Of the 358 received
responses, 26.1% of the respondents belonged to the 25-34 years age group, which formed
the largest response category. The 35-44 years age group follows this with 21.6%. The least
responsive category was the 65 years and above with 3.9%. In terms of gender, only 2%
more responses were obtained from the males (51%) in comparison to the female (49%)
respondents (Table 5.2).
The majority of the respondents possessed educational qualifications, with 34.6%
having gained an undergraduate degree and 29.3% educated to postgraduate level. The least
responsive educational category was the GNVQ/Diploma with an 8.8% response rate. 11.7%
of the respondents possessed GCSE level education and 15.5% possessed 'A' level education (Table 5.2).
The occupational category with the highest amount of respondents was 'E', which
consisted of students, casual workers, and pensioners (37.1%). This was followed by
category '13', which consisted of managers, teachers and computer programmers (28.4%). CI
represented the third largest occupational category with 19.7% responses, followed by
category 'A' with 11.0% response. The least responsive occupational categories were 'D'
and 'C2' with response rates of 1.7% and 2.0% respectively (Table 5.2). The aforementioned
occupation categories were derived from the marketing literature where mainstream
professionals such as doctors, lawyers and judges with the responsibility of more then 25
staff are classified as occupational category 'A' (Gilligan and Wilson, 2003; Rice 1997). The
aforementioned occupations with a responsibility of less then 25 staff and academics are
grouped as social grade '13'. Skilled non-manual workers fall within the occupational
Adoption, Usage and Impact of Broadband: UK Households Yogesh K. Dwivedi
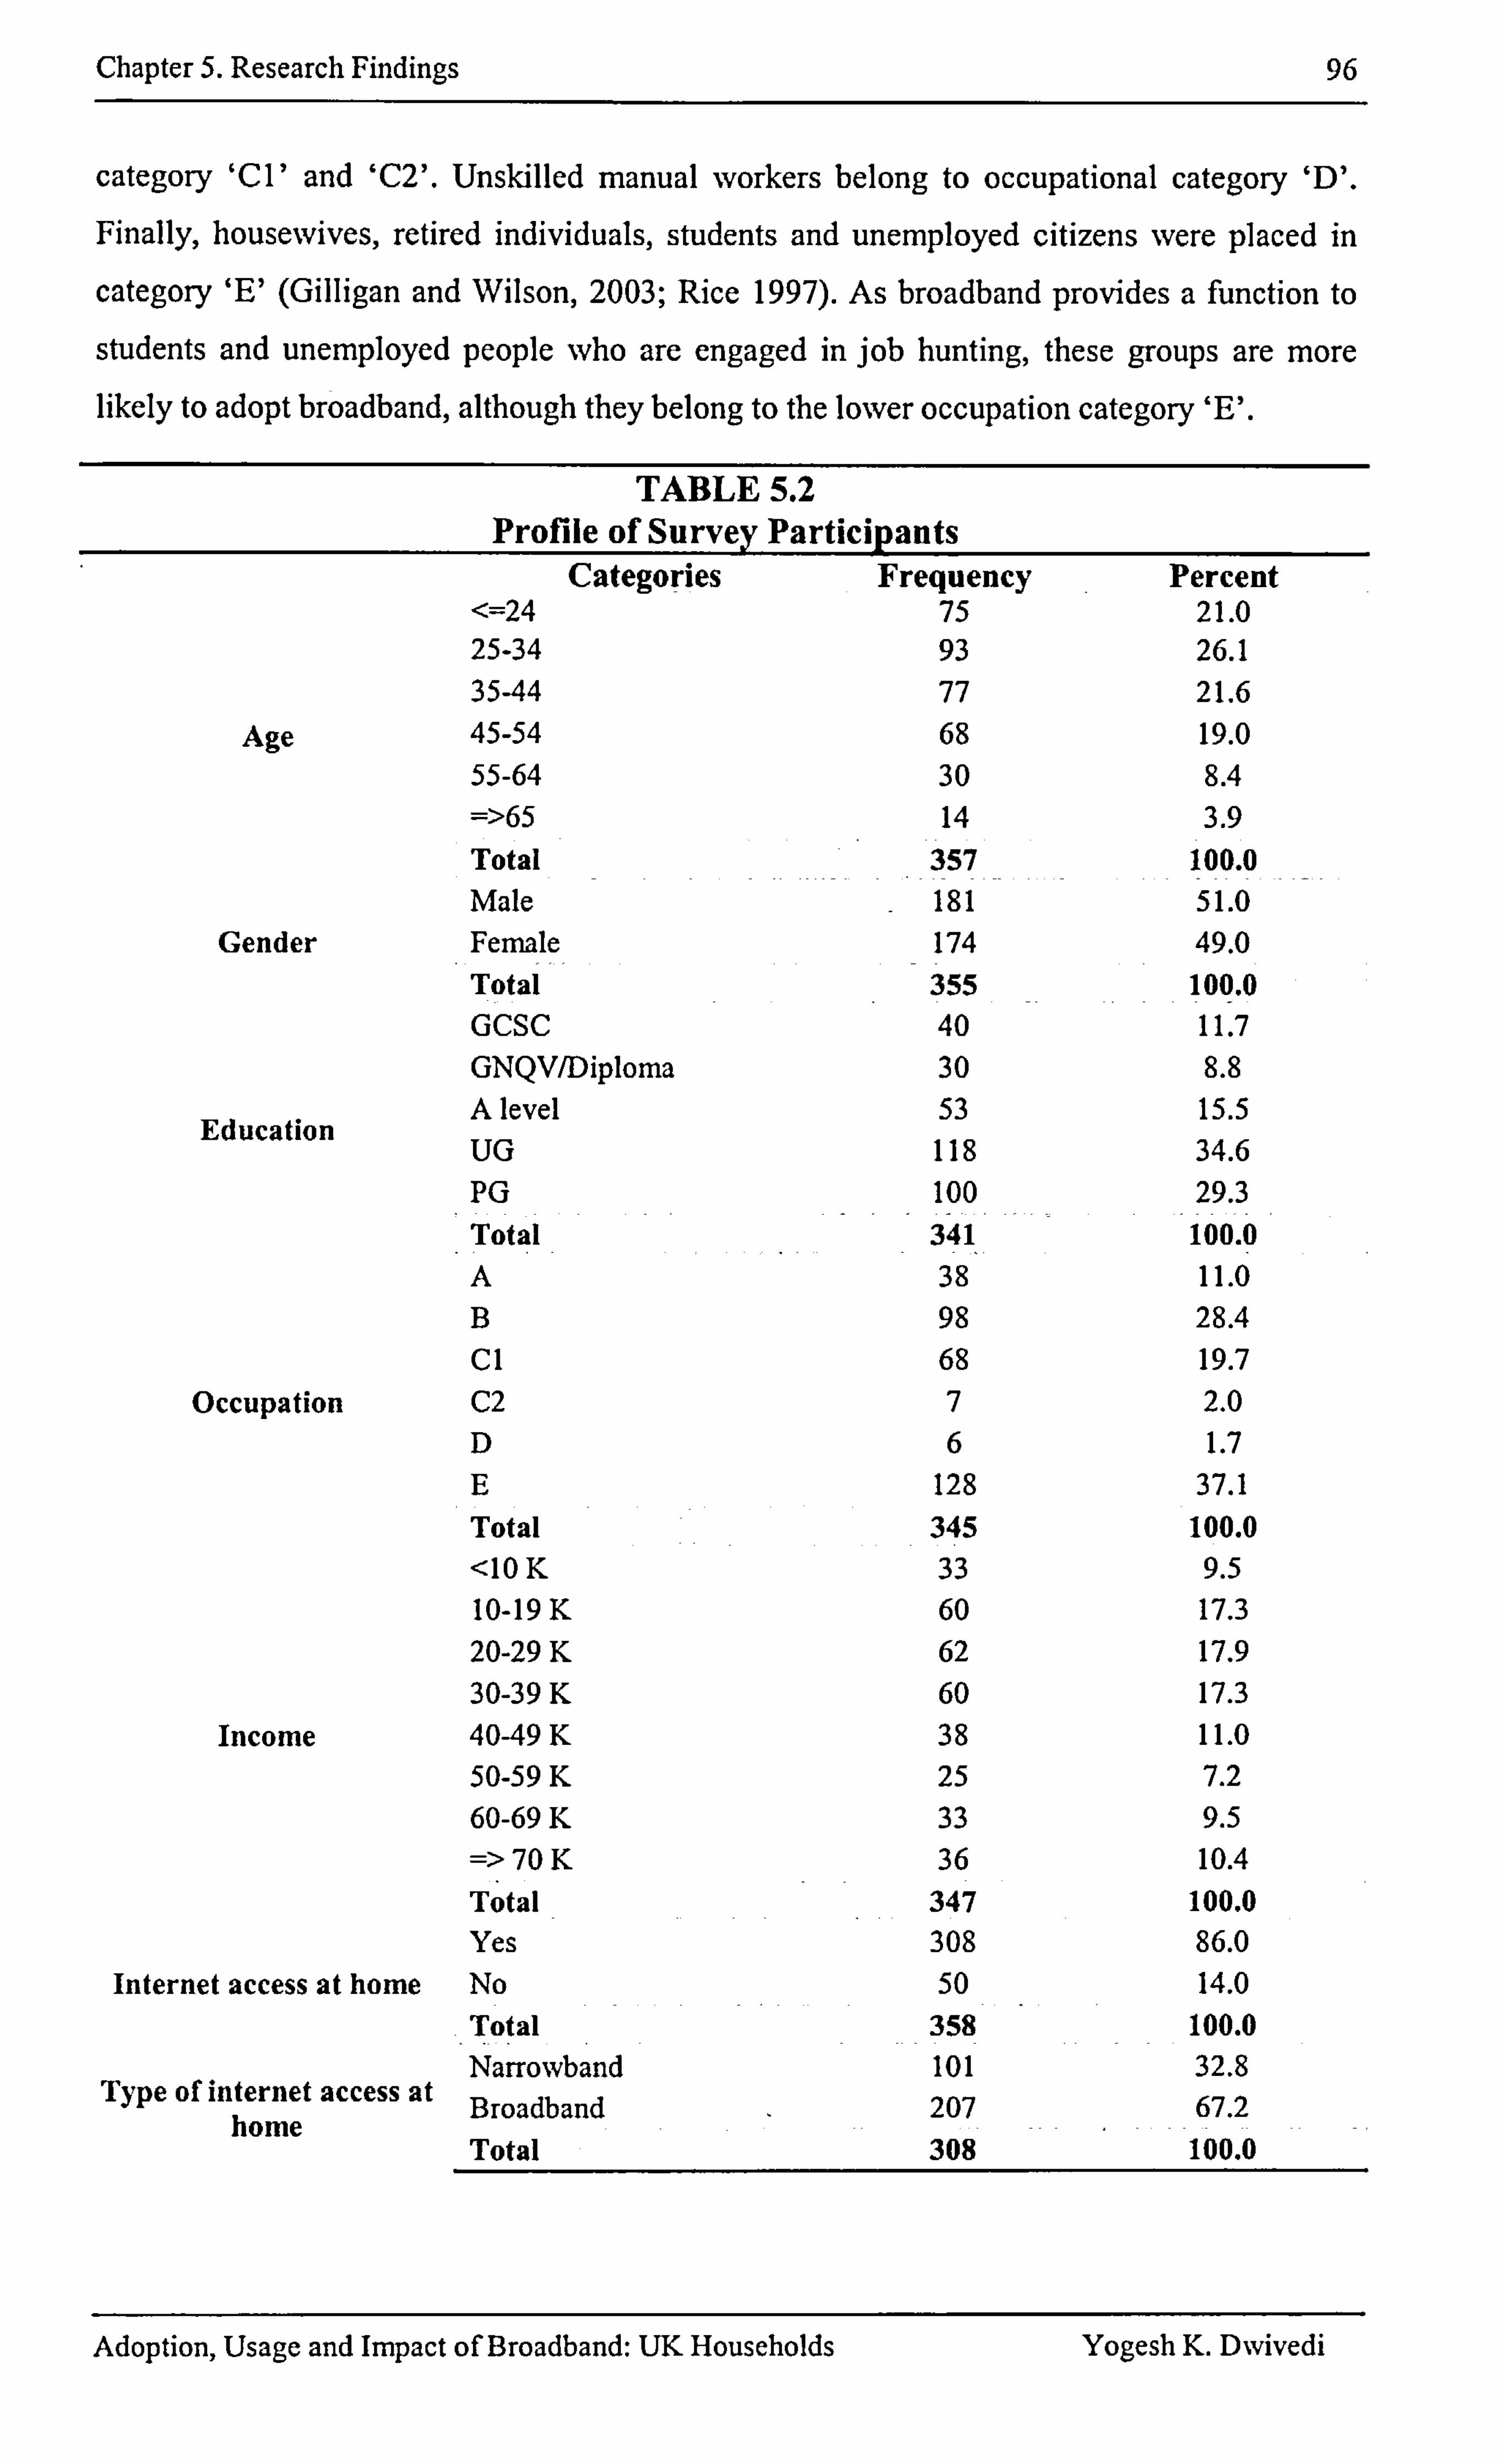
Chapter 5. Research Findings 96
category 'Cl' and 'C2'. Unskilled manual workers belong to occupational category 'D'.
Finally, housewives, retired individuals, students and unemployed citizens were placed in
category 'E' (Gilligan and Wilson, 2003; Rice 1997). As broadband provides a function to
students and unemployed people who are engaged in job hunting, these groups are more likely to adopt broadband, although they belong to the lower occupation category 'E'.
TABLE 5.2 Profile of Survey Partici pants
Categories Frequency Percent <=24 75 21.0 25-34 93 26.1 3544 77 21.6
Age 45-54 68 19.0 55-64 30 8.4 =>65 14 3.9 Total 357 100.0 Male 181 51.0
Gender Female 174 49.0 Total 355 100.0 GCSC 40 11.7 GNQV/Diploma 30 8.8 A level 53 15.5
Education UG 118 34.6 PG 100 29.3 Total 341 100.0 A 38 11.0 B 98 28.4 C1 68 19.7
Occupation C2 7 2.0 D 6 1.7 E 128 37.1 Total 345 100.0 <10 K 33 9.5 10-19 K 60 17.3 20-29 K 62 17.9 30-39 K 60 17.3
Income 40-49 K 38 11.0 50-59 K 25 7.2 60-69 K 33 9.5 => 70 K 36 10.4 Total 347 100.0 Yes 308 86.0
Internet access at home No 50 14.0 Total 358 100.0 Narrowband 101 32.8
Type of internet access at Broadband 207 67.2 home Total 308 100.0
Adoption, Usage and Impact of Broadband: UK Households Yogesh K. Dwivedi
Chapter 5. Research Findings 97
Responses for the household income categories varied between a response rate of 17.9% for the E20-29 K and 7.2% for f50-59K category. The least annual household income
group (<=EIOK) was represented by a 9.5% response, whilst the largest income group (=>E70K) was represented with a 10.4% response rate (Table 5.2).
Of the 358 respondents, 308 (86%) had Internet access at home and 50 (14%) did
not. Of the 308 (86%) respondents who possessed Internet access at home, 101 (32.8%) had
a narrowband connection and the remaining 207 (67.2%) respondents had a broadband
connection (Table 5.2).
5.4 ADOPTION OF BROADBAND
Before presenting the findings, the research instrument was tested for its reliability,
construct validity and method bias (i. e. effect of question ordering). The following section illustrates reliability, Section 5.4.2 shows the construct validity and Section 5.4.3 presents the computed values that demonstrate the absence of a method bias.
5.4.1 Reliability Test
Table 5.3 illustrates the Cronbach's coefficient alpha values that were estimated to
examine the internal consistency of the measure. Cronbach's cc varied between 0.91 for the
utilitarian construct and 0.79 for both hedonic outcomes and service quality constructs. Both
secondary influence and self-efficacy possessed a reliability value of 0.90. Cronbach's cc for
the remaining five constructs varied between 0.80 and 0.90. Two constructs, namely facilitating conditions resources and knowledge, had Cronbach's cc at 0.81 and for relative
advantage and primary influence there were values of alpha at 0.84. The dependent construct behavioural intention possessed an alpha of 0.87.
Hinton et al (2004) have suggested four cut-off points for reliability, which includes
excellent reliability (0.90 and above), high reliability (0.70-0.90), moderate reliability (0.50-
0.70) and low reliability (0.50 and below) (Hinton et al, 2004, pp 364). The aforementioned
values suggest that of the ten constructs, three possess excellent reliability and the remaining
seven illustrate high reliability. None of the constructs demonstrated a moderate or low
reliability (Table 5.3).
The high Cronbach's cc values for all constructs imply that they are internally
consistent. That means all items of each constructs are measuring the same content universe (i. e. construct). For example, both the items of BI are measuring the same content universe
of behavioural intention. Similarly, all ten items of UO are measuring the content universe of
Adoption, Usage and Impact of Broadband: UK Households Yogesh K. Dwivedi
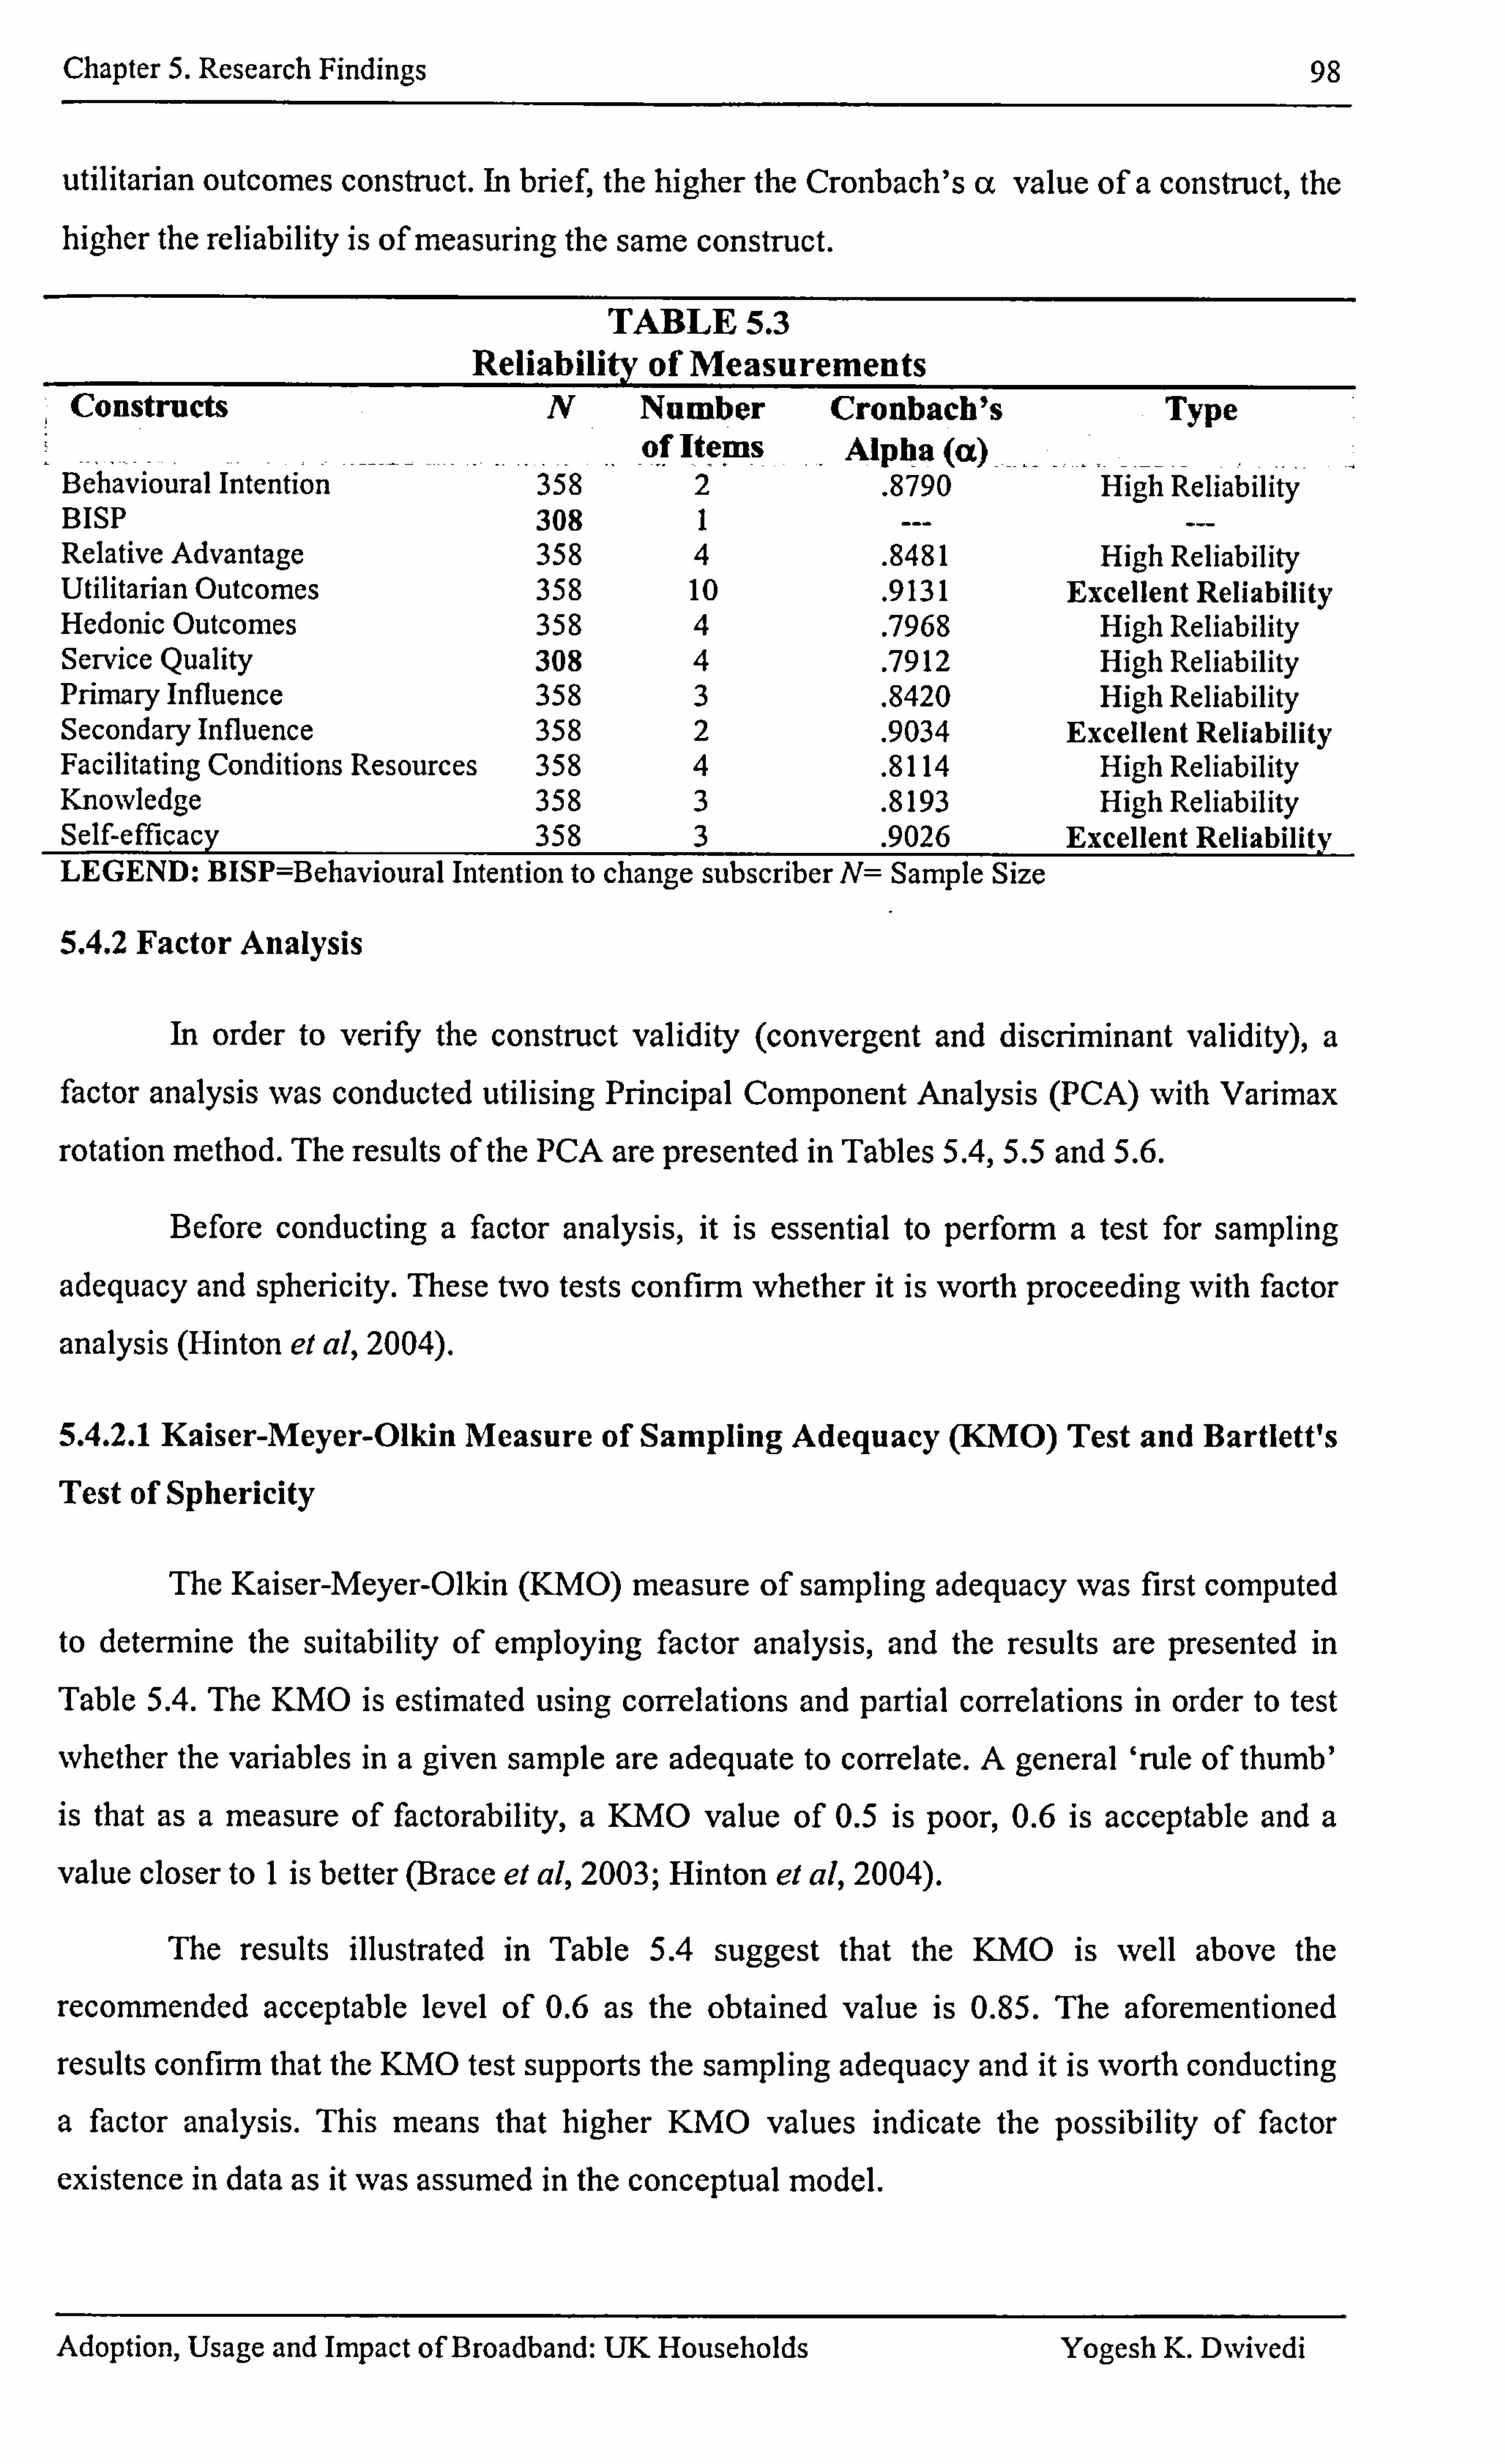
Chapter 5. Research Findings 98
utilitarian outcomes construct. In brief, the higher the Cronbach's cc value of a construct, the higher the reliability is of measuring the same construct.
Reliabili TABLE5.3 ty of Measurements
Constructs N Number Cronbach's Type of Items Alpha (4x)
Behavioural Intention 358 2 . 8790 High Reliability BISP 308 1 --- --- Relative Advantage 358 4 . 8481 High Reliability Utilitarian Outcomes 358 10 . 9131 Excellent Reliability Hedonic Outcomes 358 4 . 7968 High Reliability Service Quality 308 4 . 7912 High Reliability Primary Influence 358 3 . 8420 High Reliability Secondary Influence 358 2 . 9034 Excellent Reliability Facilitating Conditions Resources 358 4 . 8114 High Reliability Knowledge 358 3 . 8193 High Reliability Self-efficacy 358 3 . 9026 Excellent Reliabilitv LEGEND: BISP=Behavioural Intention to change subscriber N= Sample Size
5.4.2 Factor Analysis
In order to verify the construct validity (convergent and discriminant validity), a factor analysis was conducted utilising Principal Component Analysis (PCA) with Varimax
rotation method. The results of the PCA are presented in Tables 5.4,5.5 and 5.6.
Before conducting a factor analysis, it is essential to perform a test for sampling
adequacy and sphericity. These two tests confinn whether it is worth proceeding with factor
analysis (Hinton et al, 2004).
5.4.2.1 Kaiser-Meyer-Olkin Measure of Sampling Adequacy (KMO) Test and Bartlett's
Test of Sphericity
The Kaiser-Meyer-Olkin (KMO) measure of sampling adequacy was first computed to determine the suitability of employing factor analysis, and the results are presented in
Table 5.4. The KMO is estimated using correlations and partial correlations in order to test
whether the variables in a given sample are adequate to correlate. A general 'rule of thumb' is that as a measure of factorability, a KMO value of 0.5 is poor, 0.6 is acceptable and a
value closer to I is better (Brace et al, 2003; Hinton et al, 2004).
The results illustrated in Table 5.4 suggest that the KMO is well above the
recommended acceptable level of 0.6 as the obtained value is 0.85. The aforementioned
results confirm that the KMO test supports the sampling adequacy and it is worth conducting
a factor analysis. This means that higher KMO values indicate the possibility of factor
existence in data as it was assumed in the conceptual model.
Adoption, Usage and Impact of Broadband: UK Households Yogesh K. Dwivedi
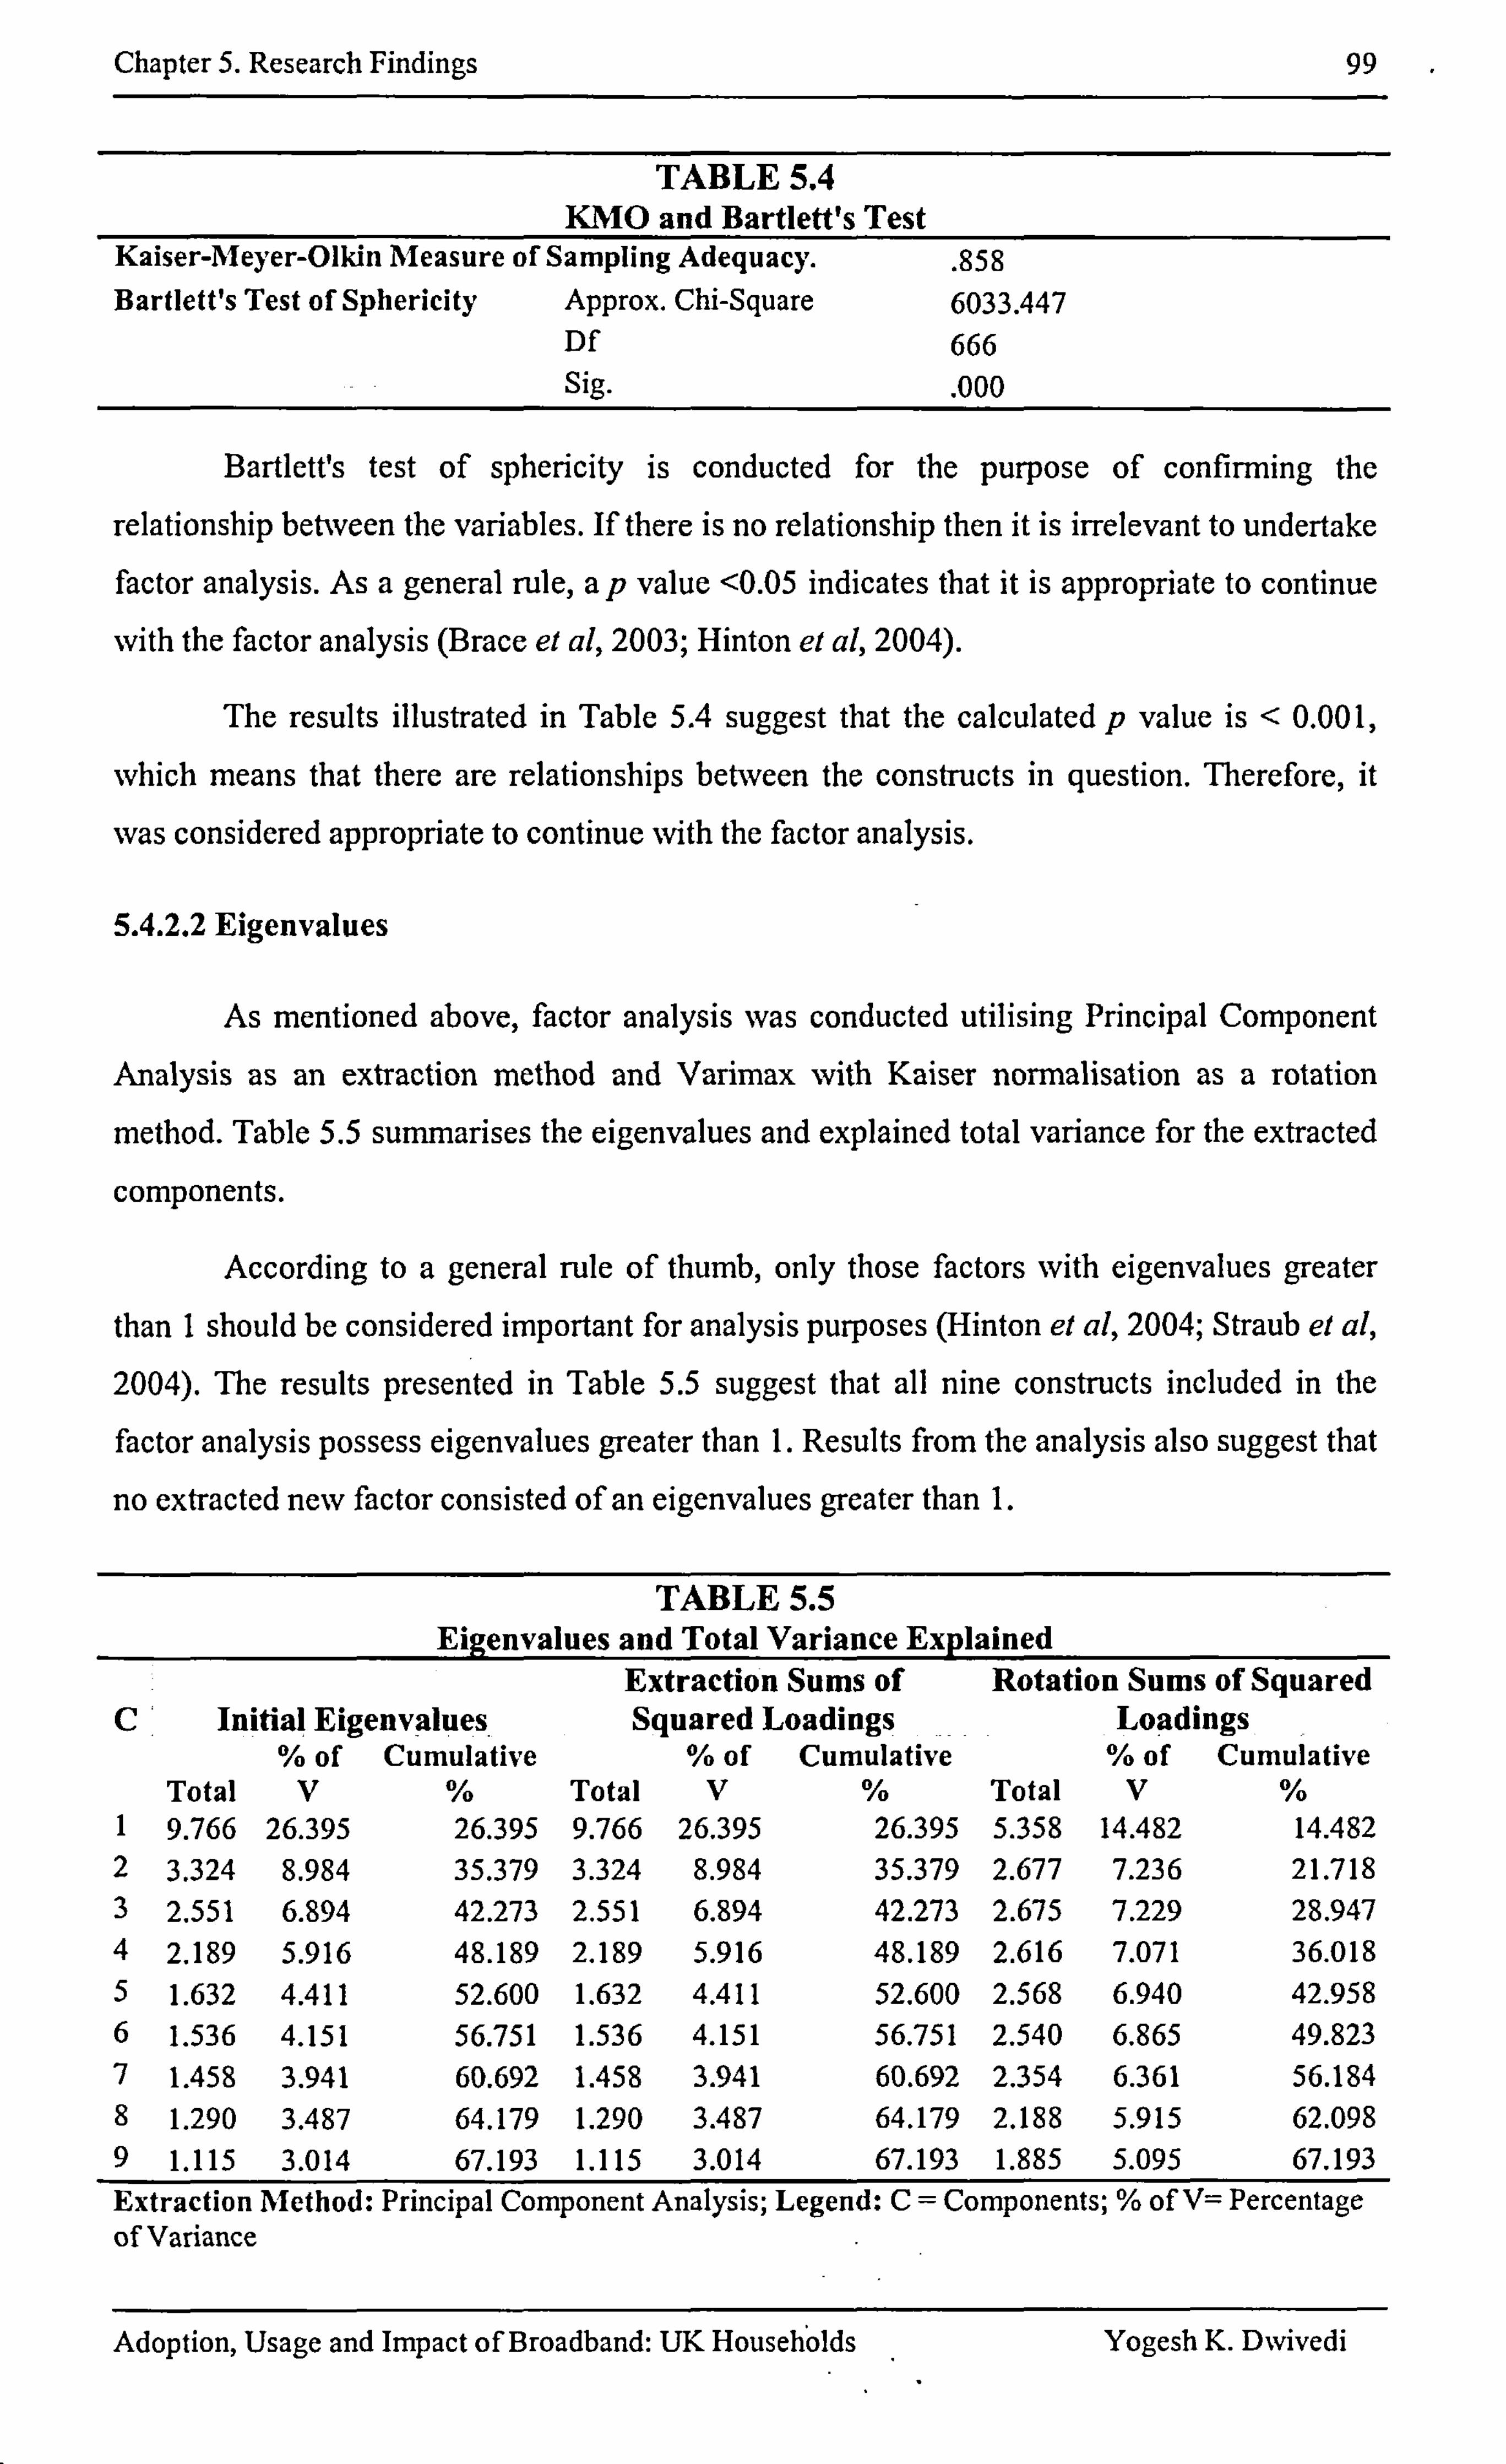
Chapter 5. Research Findings 99
TABLE 5.4 KMO and Bartlett's Test
Kaiser-Meyer-Olkin Measure of Sampling Adequacy. . 858
Bartlett's Test of Sphericity Approx. Chi-Square 6033.447 Df 666 Sig.
. 000
Bartlett's test of sphericity is conducted for the purpose of confirming the
relationship between the variables. If there is no relationship then it is irrelevant to undertake factor analysis. As a general rule, ap value <0.05 indicates that it is appropriate to continue
with the factor analysis (Brace el al, 2003; Hinton et al, 2004).
The results illustrated in Table 5.4 suggest that the calculated p value is < 0.00 1,
which means that there are relationships between the constructs in question. Therefore, it
was considered appropriate to continue with the factor analysis.
5.4.2.2 Eigenvalues
As mentioned above, factor analysis was conducted utilising Principal Component
Analysis as an extraction method and Varimax. with Kaiser normalisation as a rotation
method. Table 5.5 summarises the eigenvalues and explained total variance for the extracted
components.
According to a general rule of thumb, only those factors with eigenvalues greater
than I should be considered important for analysis purposes (Hinton et al, 2004; Straub et al, 2004). The results presented in Table 5.5 suggest that all nine constructs included in the
factor analysis possess eigenvalues greater than 1. Results from the analysis also suggest that
no extracted new factor consisted of an eigenvalues greater than 1.
TABLE 5.5 Eigenvalues and Total Variance Exp lained
Extraction Sums of Rotation Sums of Squared C Initial Eigenvalues Squared Loadings Loadings
% of Cumulative % of Cumulative % of Cu mulative Total V % Total V% Total V %
1 9.766 26.395 26.395 9.766 26.395 26.395 5.358 14.482 14.482 2 3.324 8.984 35.379 3.324 8.984 35.379 2.677 7.236 21.718 3 2.551 6.894 42.273 2.551 6.894 42.273 2.675 7.229 28.947 4 2.189 5.916 48.189 2.189 5.916 48.189 2.616 7.071 36.018 5 1.632 4.411 52.600 1.632 4.411 52.600 2.568 6.940 42.958 6 1.536 4.151 56.751 1.536 4.151 56.751 2.540 6.865 49.823 7 1.458 3.941 60.692 1.458 3.941 60.692 2.354 6.361 56.194 8 1.290 3.487 64.179 1.290 3.487 64.179 2.188 5.915 62.098 9 1.115 3.014 67.193 1.115 3.014 67.193 1.885 5.095 67.193 Extraction Method : Principal Component Analysis; Legend: C= Components; % of V= Percentage of Variance
Adoption, Usage and Impact of Broadband: UK Households .
Yogesh K. Dwivedi
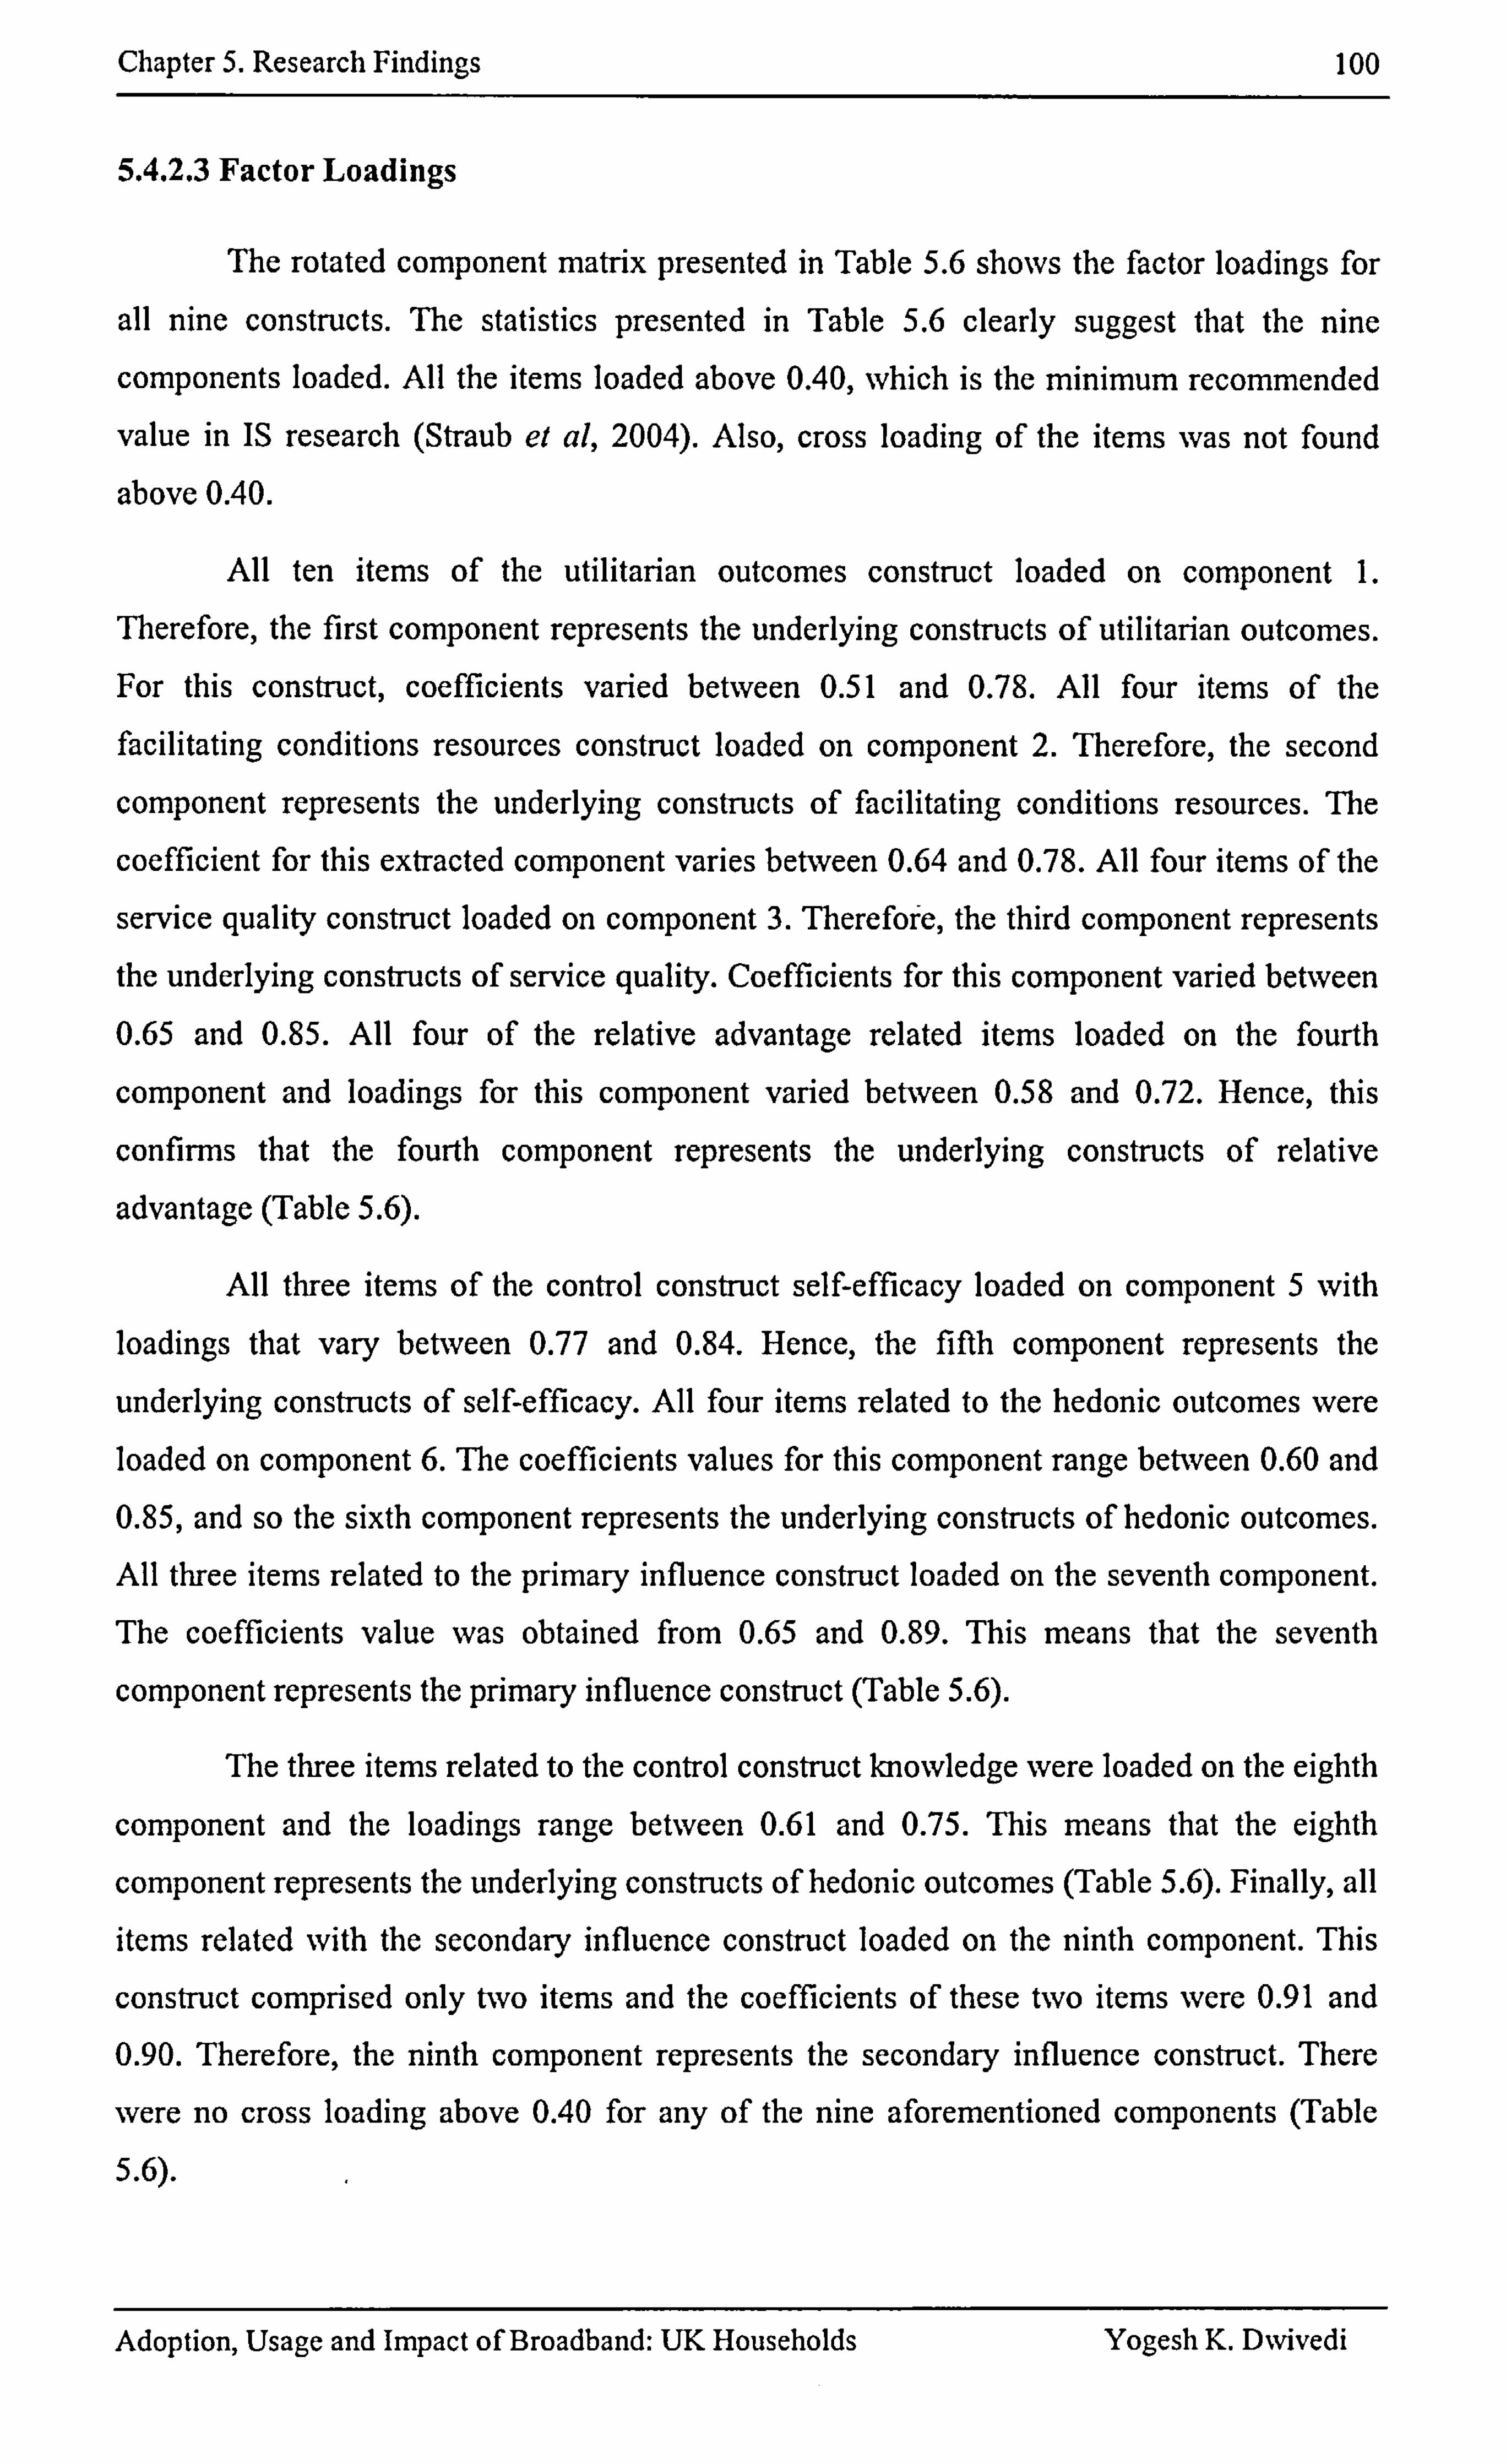
Chapter 5. Research Findings 100
5.4.2.3 Factor Loadings
The rotated component matrix presented in Table 5.6 shows the factor loadings for
all nine constructs. The statistics presented in Table 5.6 clearly suggest that the nine
components loaded. All the items loaded above 0.40, which is the minimum recommended
value in IS research (Straub et al, 2004). Also, cross loading of the items was not found
above 0.40.
All ten items of the utilitarian outcomes construct loaded on component 1.
Therefore, the first component represents the underlying constructs of utilitarian outcomes. For this construct, coefficients varied between 0.51 and 0.78. All four items of the facilitating conditions resources construct loaded on component 2. Therefore, the second
component represents the underlying constructs of facilitating conditions resources. The
coefficient for this extracted component varies between 0.64 and 0.78. All four items of the
service quality construct loaded on component 3. Therefore, the third component represents the underlying constructs of service quality. Coefficients for this component varied between
0.65 and 0.85. All four of the relative advantage related items loaded on the fourth
component and loadings for this component varied bet-ween 0.58 and 0.72. Hence, this
confirms that the fourth component represents the underlying constructs of relative
advantage (Table 5.6).
All three items of the control construct self-efficacy loaded on component 5 with loadings that vary between 0.77 and 0.84. Hence, the fifth component represents the
underlying constructs of self-efficacy. All four items related to the hedonic outcomes were loaded on component 6. The coefficients values for this component range between 0.60 and 0.85, and so the sixth component represents the underlying constructs of hedonic outcomes. All three items related to the primary influence construct loaded on the seventh component. The coefficients value was obtained from 0.65 and 0.89. This means that the seventh
component represents the primary influence construct (Table 5.6).
The three items related to the control construct knowledge were loaded on the eighth
component and the loadings range between 0.61 and 0.75. This means that the eighth
component represents the underlying constructs of hedonic outcomes (Table 5.6). Finally, all items related with the secondary influence construct loaded on the ninth component. This
construct comprised only two items and the coefficients of these two items were 0.91 and 0.90. Therefore, the ninth component represents the secondary influence construct. There
were no cross loading above 0.40 for any of the nine aforementioned components (Table
5.6).
Adoption, Usage and Impact of Broadband: UK Households Yogesh K. DNvivedi
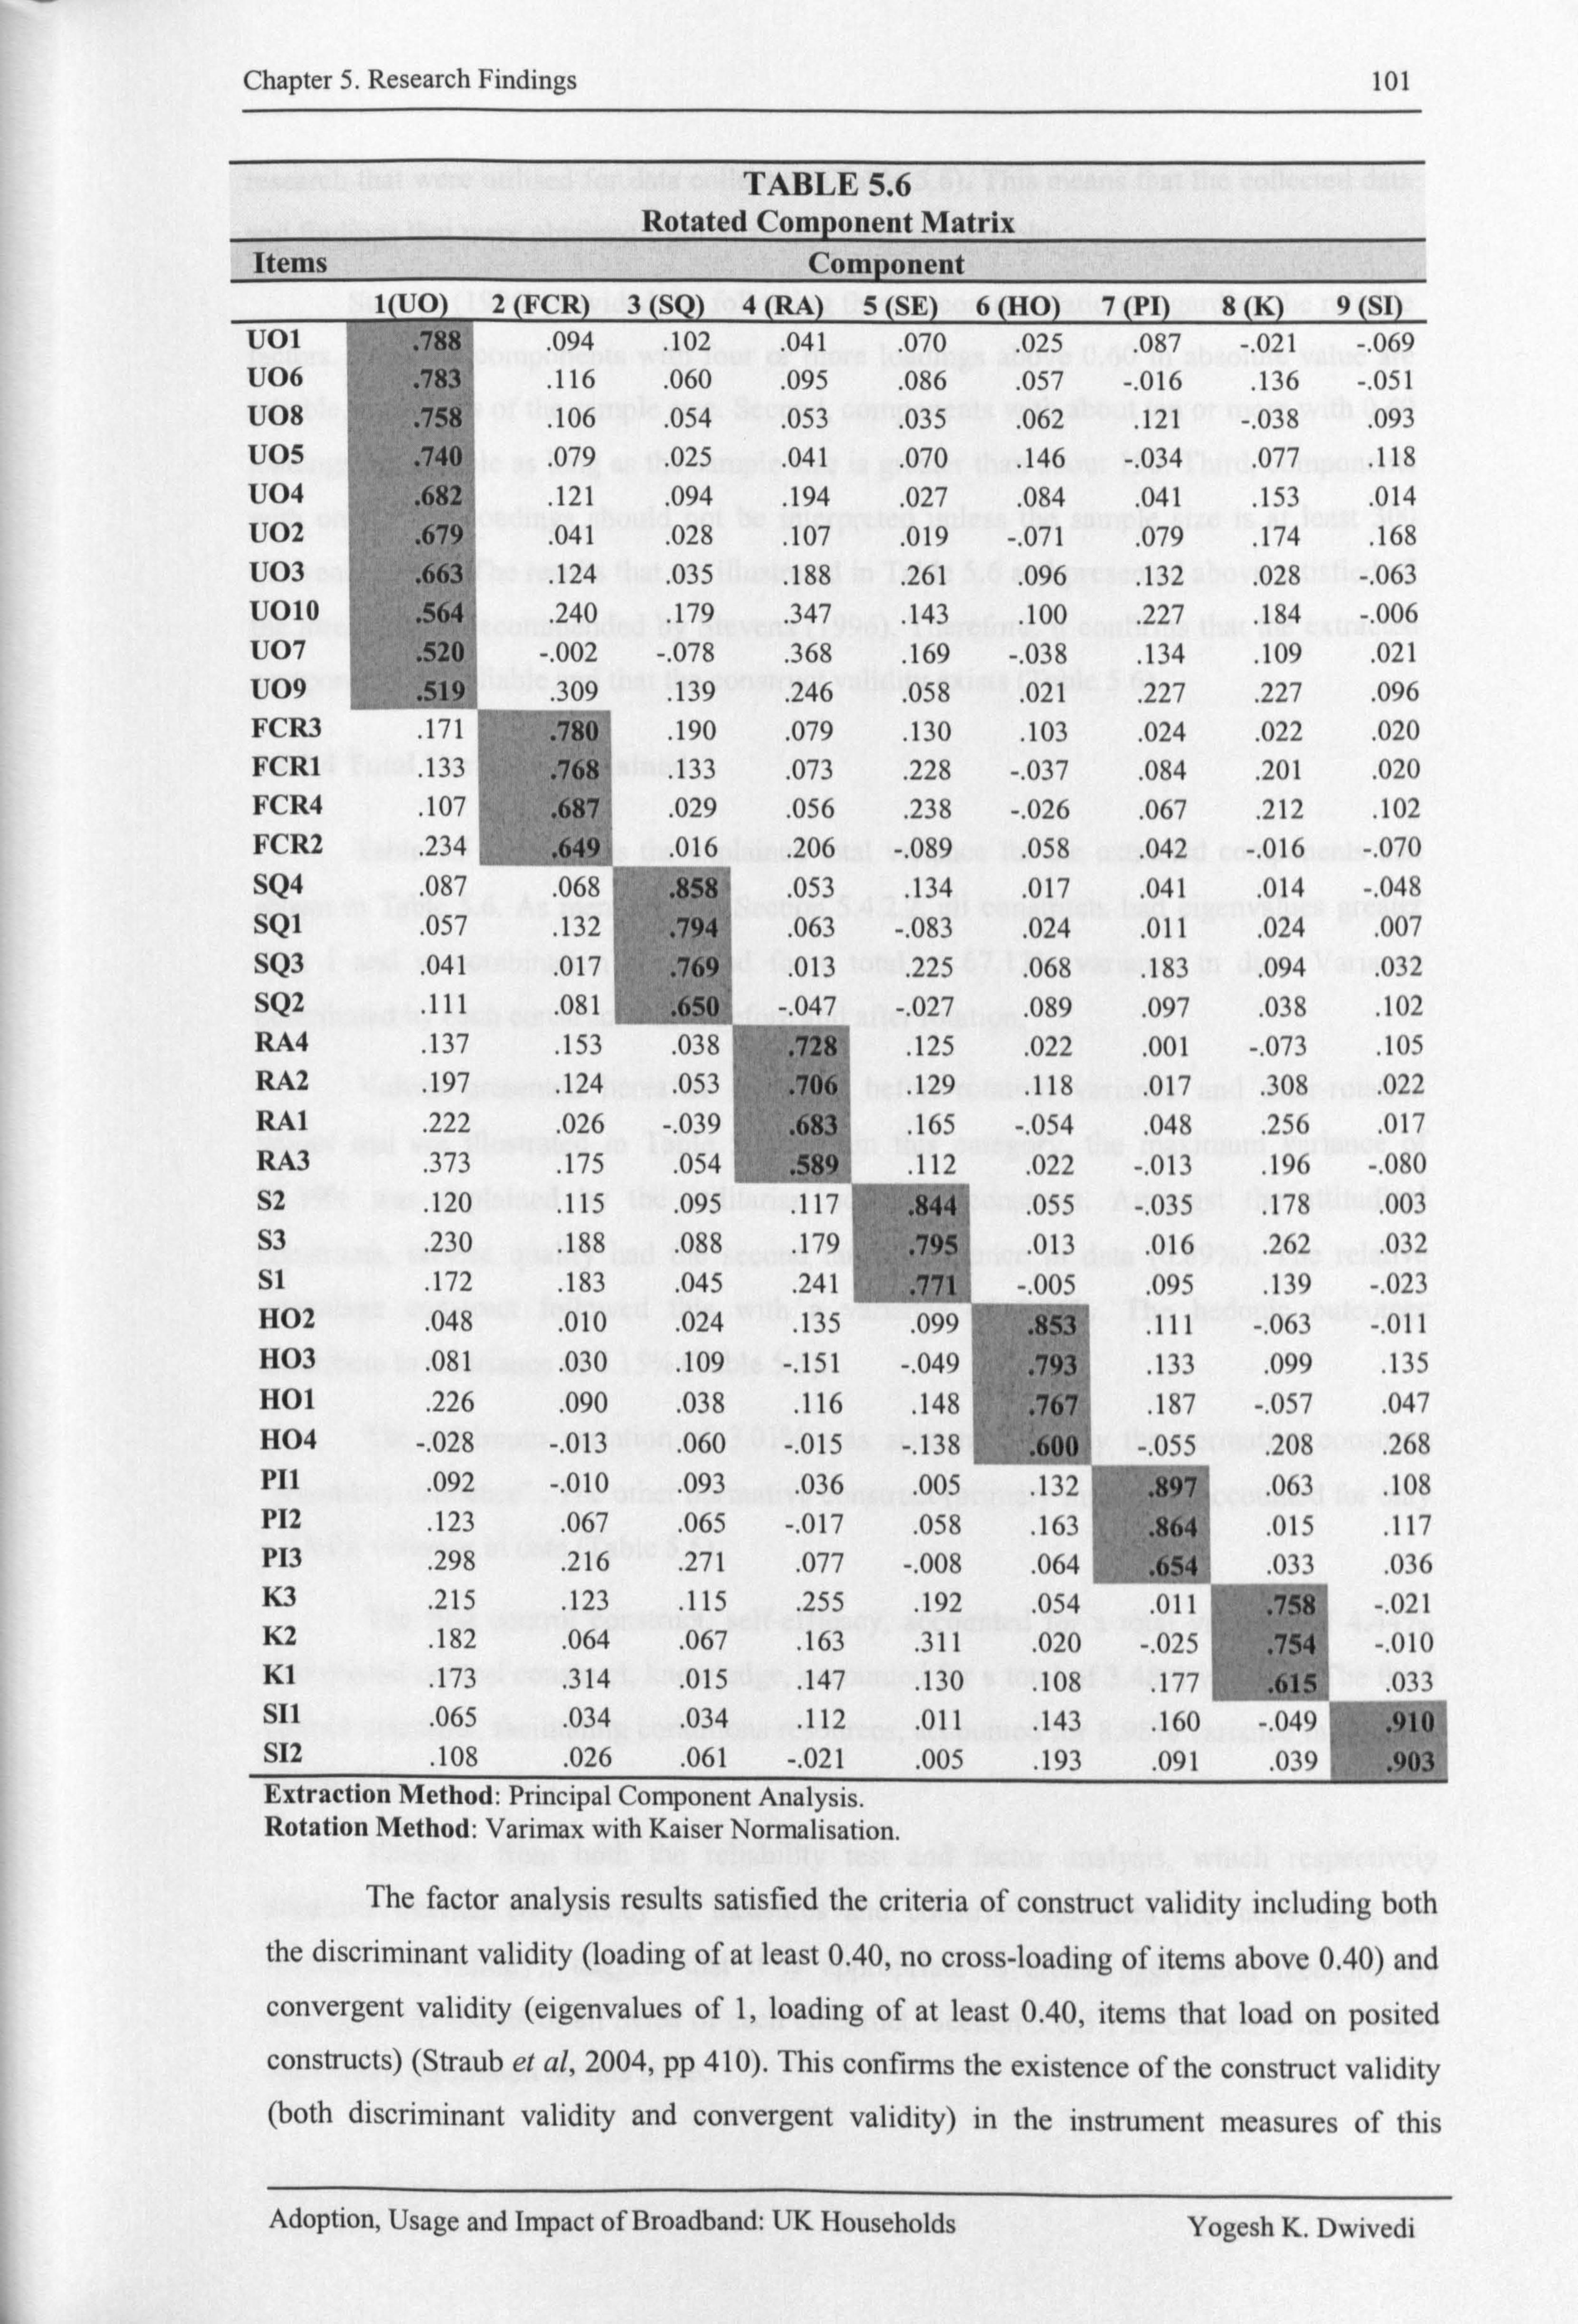
Chapter 5. Research Findings 101
TABLE 5.6 Rotated Compone nt Matri x
Items Comp onent I (t, 0) 2 (FCR) 3 (SQ) 4 (RA) 5 (SE) 6 (110) 7 (PI) 8 (K) 9(Sl)
U01 . 788 . 094 . 102 . 041 . 070 . 025 . 087 -. 021 -. 069 U06 . 783 . 116 . 060 . 095 . 086 . 057 -. 016 . 136 -. 051 U08 . 758 . 106 . 054 . 053 . 035 . 062 . 121 -. 038 . 093 U05 . 740 . 079 . 025 . 041 . 070 . 146 -. 034 . 077 . 118 U04 . 682 . 121 . 094 . 194 . 027 . 084 . 041 . 153 . 014 U02 . 679 . 041 . 028 . 107 . 019 -. 071 . 079 . 174 . 168 U03 . 663 . 124 . 035 . 188 . 261 . 096 . 132 . 028 -. 063 U010 . 564 . 240 . 179 . 347 . 143 . 100 . 227 . 184 -. 006 U07 . 520 -. 002 -. 078 . 368 . 169 -. 038 . 134 . 109 . 021 U09 . 519 . 309 . 139 . 246 . 058 . 021 . 227 . 227 . 096 FCR3 . 171 . 780 . 190 . 079 . 130 . 103 . 024 . 022 . 020 FCR1 . 131 . 768 . 133 . 073 . 228 -. 037 . 084 . 201 . 020 FCR4 . 107 . 687 . 029 . 056 . 238 -. 026 . 067 . 212 . 102 FCR2 . 234 . 649 . 016 . 206 -. 089 . 058 . 042 -. 016 -. 070 SQ4 . 087 . 068 . 858 . 053 . 134 . 017 . 041 . 014 -. 048 SQI . 057 . 132 . 794 . 063 -. 083 . 024 . 011 . 024 . 007 SQ3 . 041 . 017 . 769 . 013 . 225 . 068 . 183 . 094 . 032 SQ2 . 111 . 081 . 650 -. 047 -. 027 . 089 . 097 . 038 . 102 RM . 137 . 153 . 038 . 728 . 125 . 022 . 001 -. 073 . 105 RA2 . 197 . 124 . 053 . 706 . 129 . 118 . 017 . 308 . 022 RAI . 222 . 026 -. 039 . 683 . 165 -. 054 . 048 . 256 . 017 RA3 . 373 . 175 . 054 . 589 . 112 022 -. 013 . 196 -. 080 S2 . 120 . 115 . 095 . 11 / . 844 055 -. 035 . 178 . 003 S3 . 230 . 188 . 088 . 179 . 795 013 . 016 . 262 . 032 si . 172 . 183 . 045 . 241 . 771 . 005 . 095 . 139 -. 023 H02 . 048 . 010 . 024 . 135 jy)() . 853 111 -. 063 -. 011 H03 . 081 . 030 . 109 -. 151 -. 04, ) . 793 . 133 . 099 . 135 HOI . 226 . 090 . 038 . 116 . 14, s . 767 187 -. 057 . 047 H04 -. 028 -. 013 . 060 -. 015 -. 138 . 600 ()55 . 208 . 268 Pil . 092 -. 010 . 093 . 036 . 005 .I-,. ) . 897 . 063 . 108 P12 . 123 . 067 . 065 -. 017 . 058 . 10" . 864 ()15 117 P13 . 298 . 216 . 271 . 077 -. 008 . 004 . 654 ()33 . 036 K3 . 215 . 123 . 115 . 255 . 192 . 054 . ()11 . 758 -. 021 K2 . 182 . 064 . 067 . 163 . 311 . 020 -. 02., . 754 -. 010 KI . 173 . 314 . 015 . 147 . 130 . 108 . 17,1 . 615 Sil . 065 . 034 . 034 . 112 . 011 . 143 . 160 . 910 S12 . 108 . 026 . 061 -. 021 . 005 . 193 . 091 . 031) . 903 Extraction Method: Principal Component Analysis. Rotation Method: Varimax with Kaiser Normalisation
The factor analysis results satisfied the criteria of construct validity including both
the discriminant validity (loading of at least 0.40, no cross-loading of items above 0.40) and convergent validity (eigenvalues of 1, loading of at least 0.40, items that load on posited constructs) (Straub et al, 2004, pp 410). This confirms the existence of the construct validity (both discriminant validity and convergent validity) in the instrument measures of this
Adoption, Usage and Impact of Broadband: UK Households Yogesh K. Dwivedi
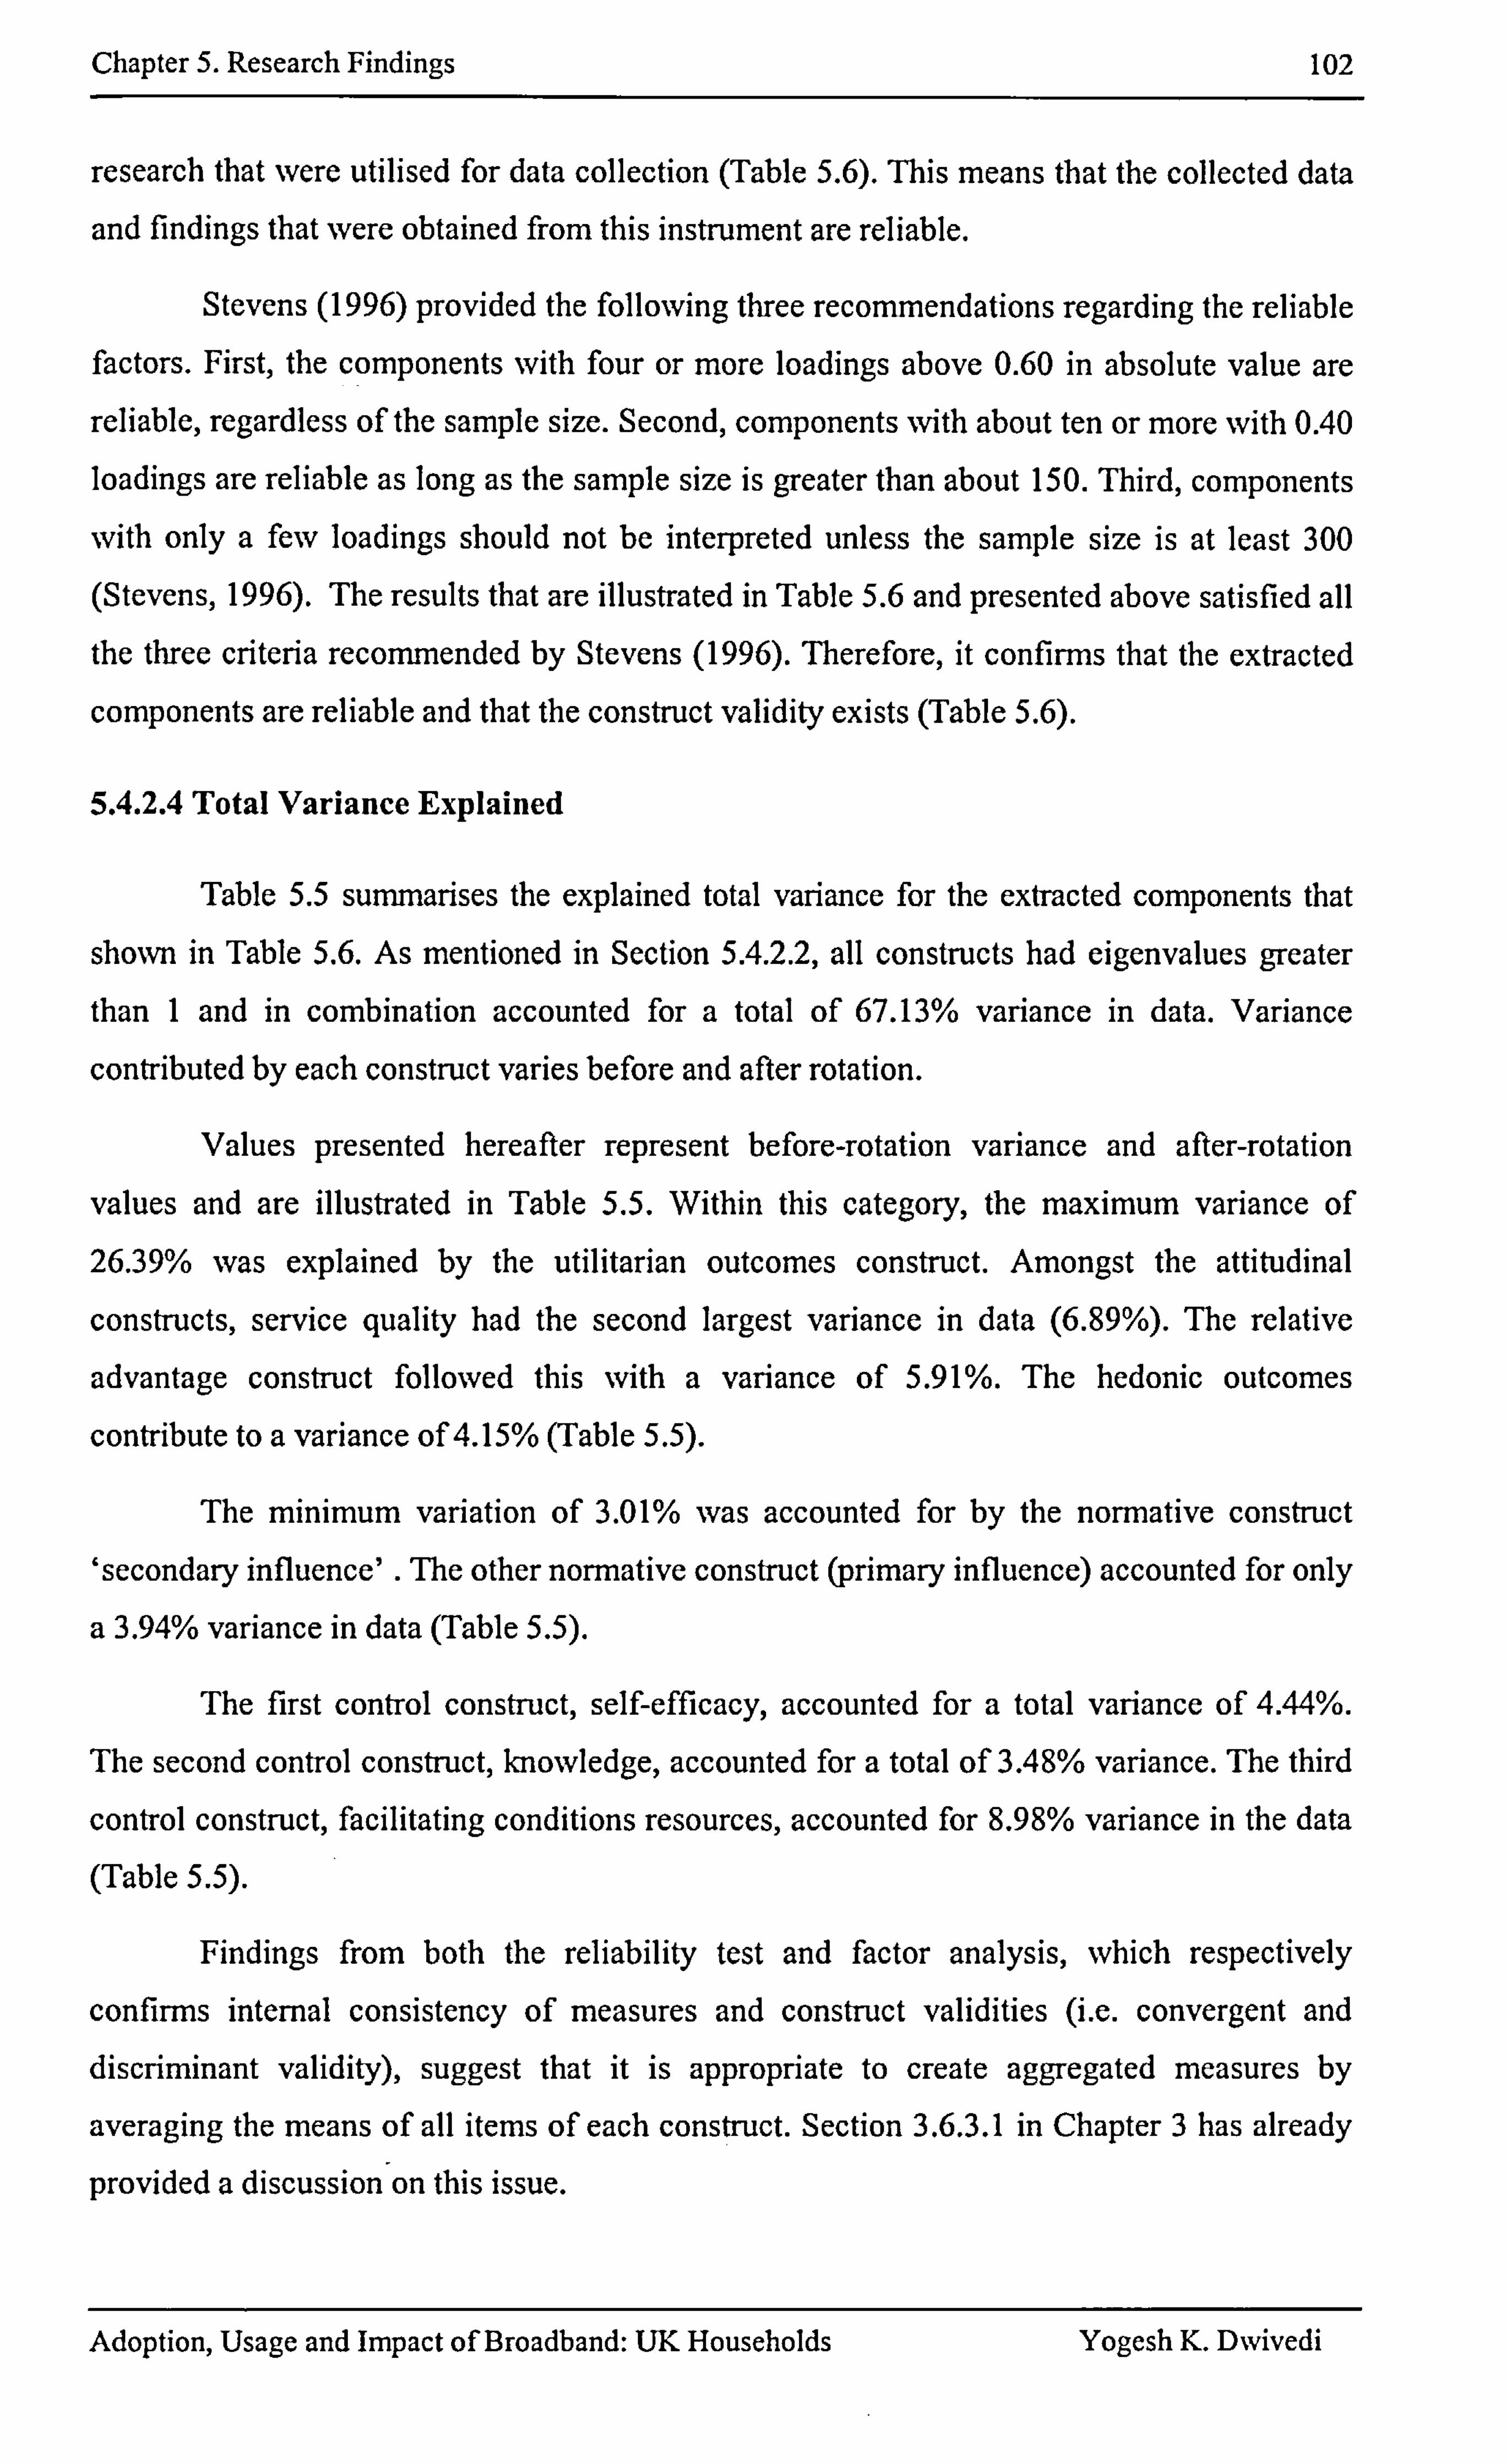
Chapter 5. Research Findings 102
research that were utilised for data collection (Table 5.6). This means that the collected data
and findings that were obtained from this instrument are reliable.
Stevens (1996) provided the following three recommendations regarding the reliable factors. First, the components with four or more loadings above 0.60 in absolute value are
reliable, regardless of the sample size. Second, components -svith about ten or more with 0.40
loadings are reliable as long as the sample size is greater than about 150. Third, components
with only a few loadings should not be interpreted unless the sample size is at least 300
(Stevens, 1996). The results that are illustrated in Table 5.6 and presented above satisfied all the three criteria recommended by Stevens (1996). Therefore, it confirms that the extracted
components are reliable and that the construct validity exists (Table 5.6).
5.4.2.4 Total Variance Explained
Table 5.5 summarises the explained total variance for the extracted components that
shown in Table 5.6. As mentioned in Section 5.4.2.2, all constructs had eigenvalues greater than I and in combination accounted for a total of 67.13% variance in data. Variance
contributed by each construct varies before and after rotation.
Values presented hereafter represent before-rotation variance and after-rotation
values and are illustrated in Table 5.5. Within this category, the maximum variance of 26.39% was explained by the utilitarian outcomes construct. Amongst the attitudinal
constructs, service quality had the second largest variance in data (6.89%). The relative
advantage construct followed this with a variance of 5.91%. The hedonic outcomes
contribute to a variance of 4.15% (Table 5.5).
The minimum variation of 3.01% was accounted for by the normative construct 'secondary influence' . The other normative construct (primary influence) accounted for only
a 3.94% variance in data (Table 5.5).
The first control construct, self-efficacy, accounted for a total variance of 4.44%.
The second control construct, knowledge, accounted for a total of 3.48% variance. The third
control construct, facilitating conditions resources, accounted for 8.98% variance in the data
(Table 5.5).
Findings from both the reliability test and factor analysis, which respectively
confirms internal consistency of measures and construct validities (i. e. convergent and discriminant validity), suggest that it is appropriate to create aggregated measures by
averaging the means of all items of each construct. Section 3.6.3.1 in Chapter 3 has already
provided a discussion on this issue.
Adoption, Usage and Impact of Broadband: UK Households Yogesh K. Dwivedi
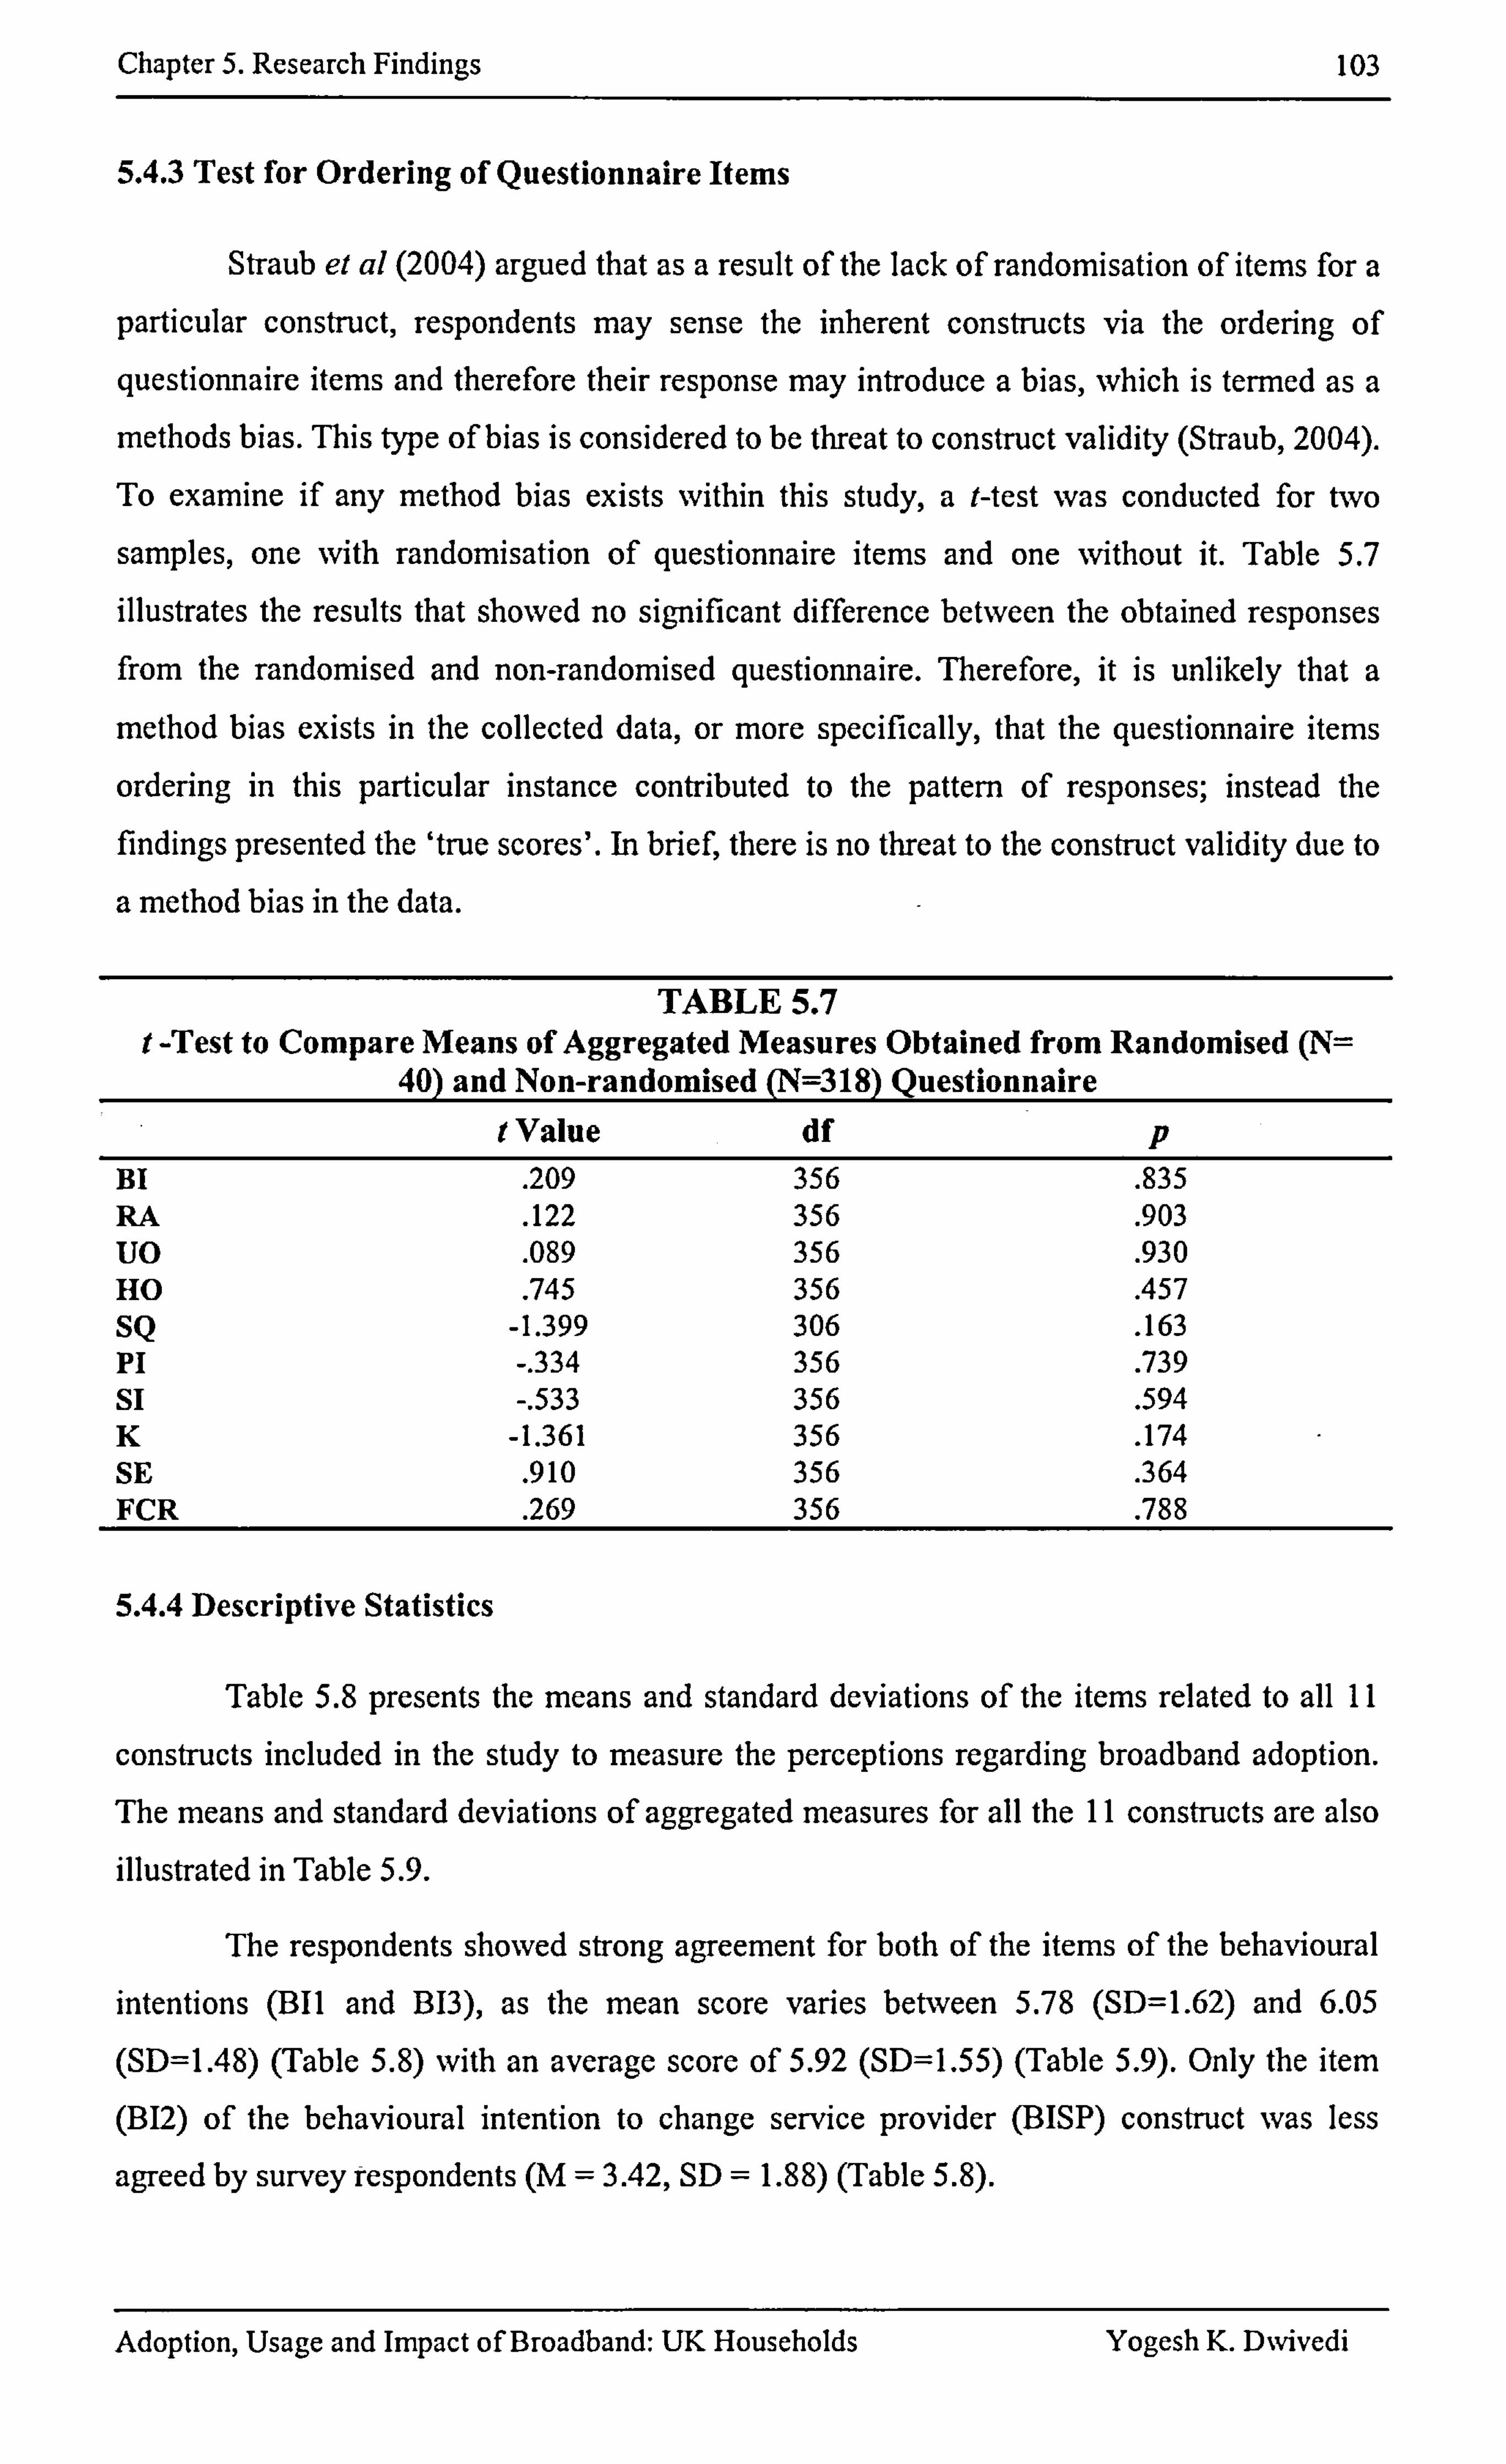
Chapter 5. Research Findings 103
5.4.3 Test for Ordering of Questionnaire Items
Straub et al (2004) argued that as a result of the lack of randomisation of items for a
particular construct, respondents may sense the inherent constructs via the ordering of
questionnaire items and therefore their response may introduce a bias, which is termed as a
methods bias. This type of bias is considered to be threat to construct validity (Straub, 2004).
To examine if any method bias exists within this study, a Mest was conducted for two
samples, one with randomisation of questionnaire items and one without it. Table 5.7
illustrates the results that showed no significant difference between the obtained responses from the randomised and non-randomised questionnaire. Therefore, it is unlikely that a
method bias exists in the collected data, or more specifically, that the questionnaire items
ordering in this particular instance contributed to the pattern of responses; instead the findings presented the 'true scores'. In brief, there is no threat to the construct validity due to
a method bias in the data.
TABLE 5.7 t -Test to Compare Means of Aggregated Measures Obtained from Randomised (N=
40) and Non-randomised (N=318) Questionnaire t Value df P
BI . 209 356 . 835 RA . 122 356 . 903 uo . 089 356 . 930 HO . 745 356 . 457 SQ -1.399 306 . 163 Pi -. 334 356 . 739 si -. 533 356 . 594 K -1.361 356 . 174 SE . 910 356 . 364 FCR . 269 356 . 788
5.4.4 Descriptive Statistics
Table 5.8 presents the means and standard deviations of the items related to all II
constructs included in the study to measure the perceptions regarding broadband adoption. The means and standard deviations of aggregated measures for all the II constructs are also illustrated in Table 5.9.
The respondents showed strong agreement for both of the items of the behavioural
intentions (1311 and B13), as the mean score varies between 5.78 (SD=1.62) and 6.05
(SD=1.48) (Table 5.8) with an average score of 5.92 (SD=1.55) (Table 5.9). Only the item
(1312) of the behavioural intention to change service provider (BISP) construct was less
agreed by survey respondents (M = 3.42, SID = 1.88) (Table 5.8).
Adoption, Usage and Impact of Broadband: UK Households Yogcsh K. D%vivcdi
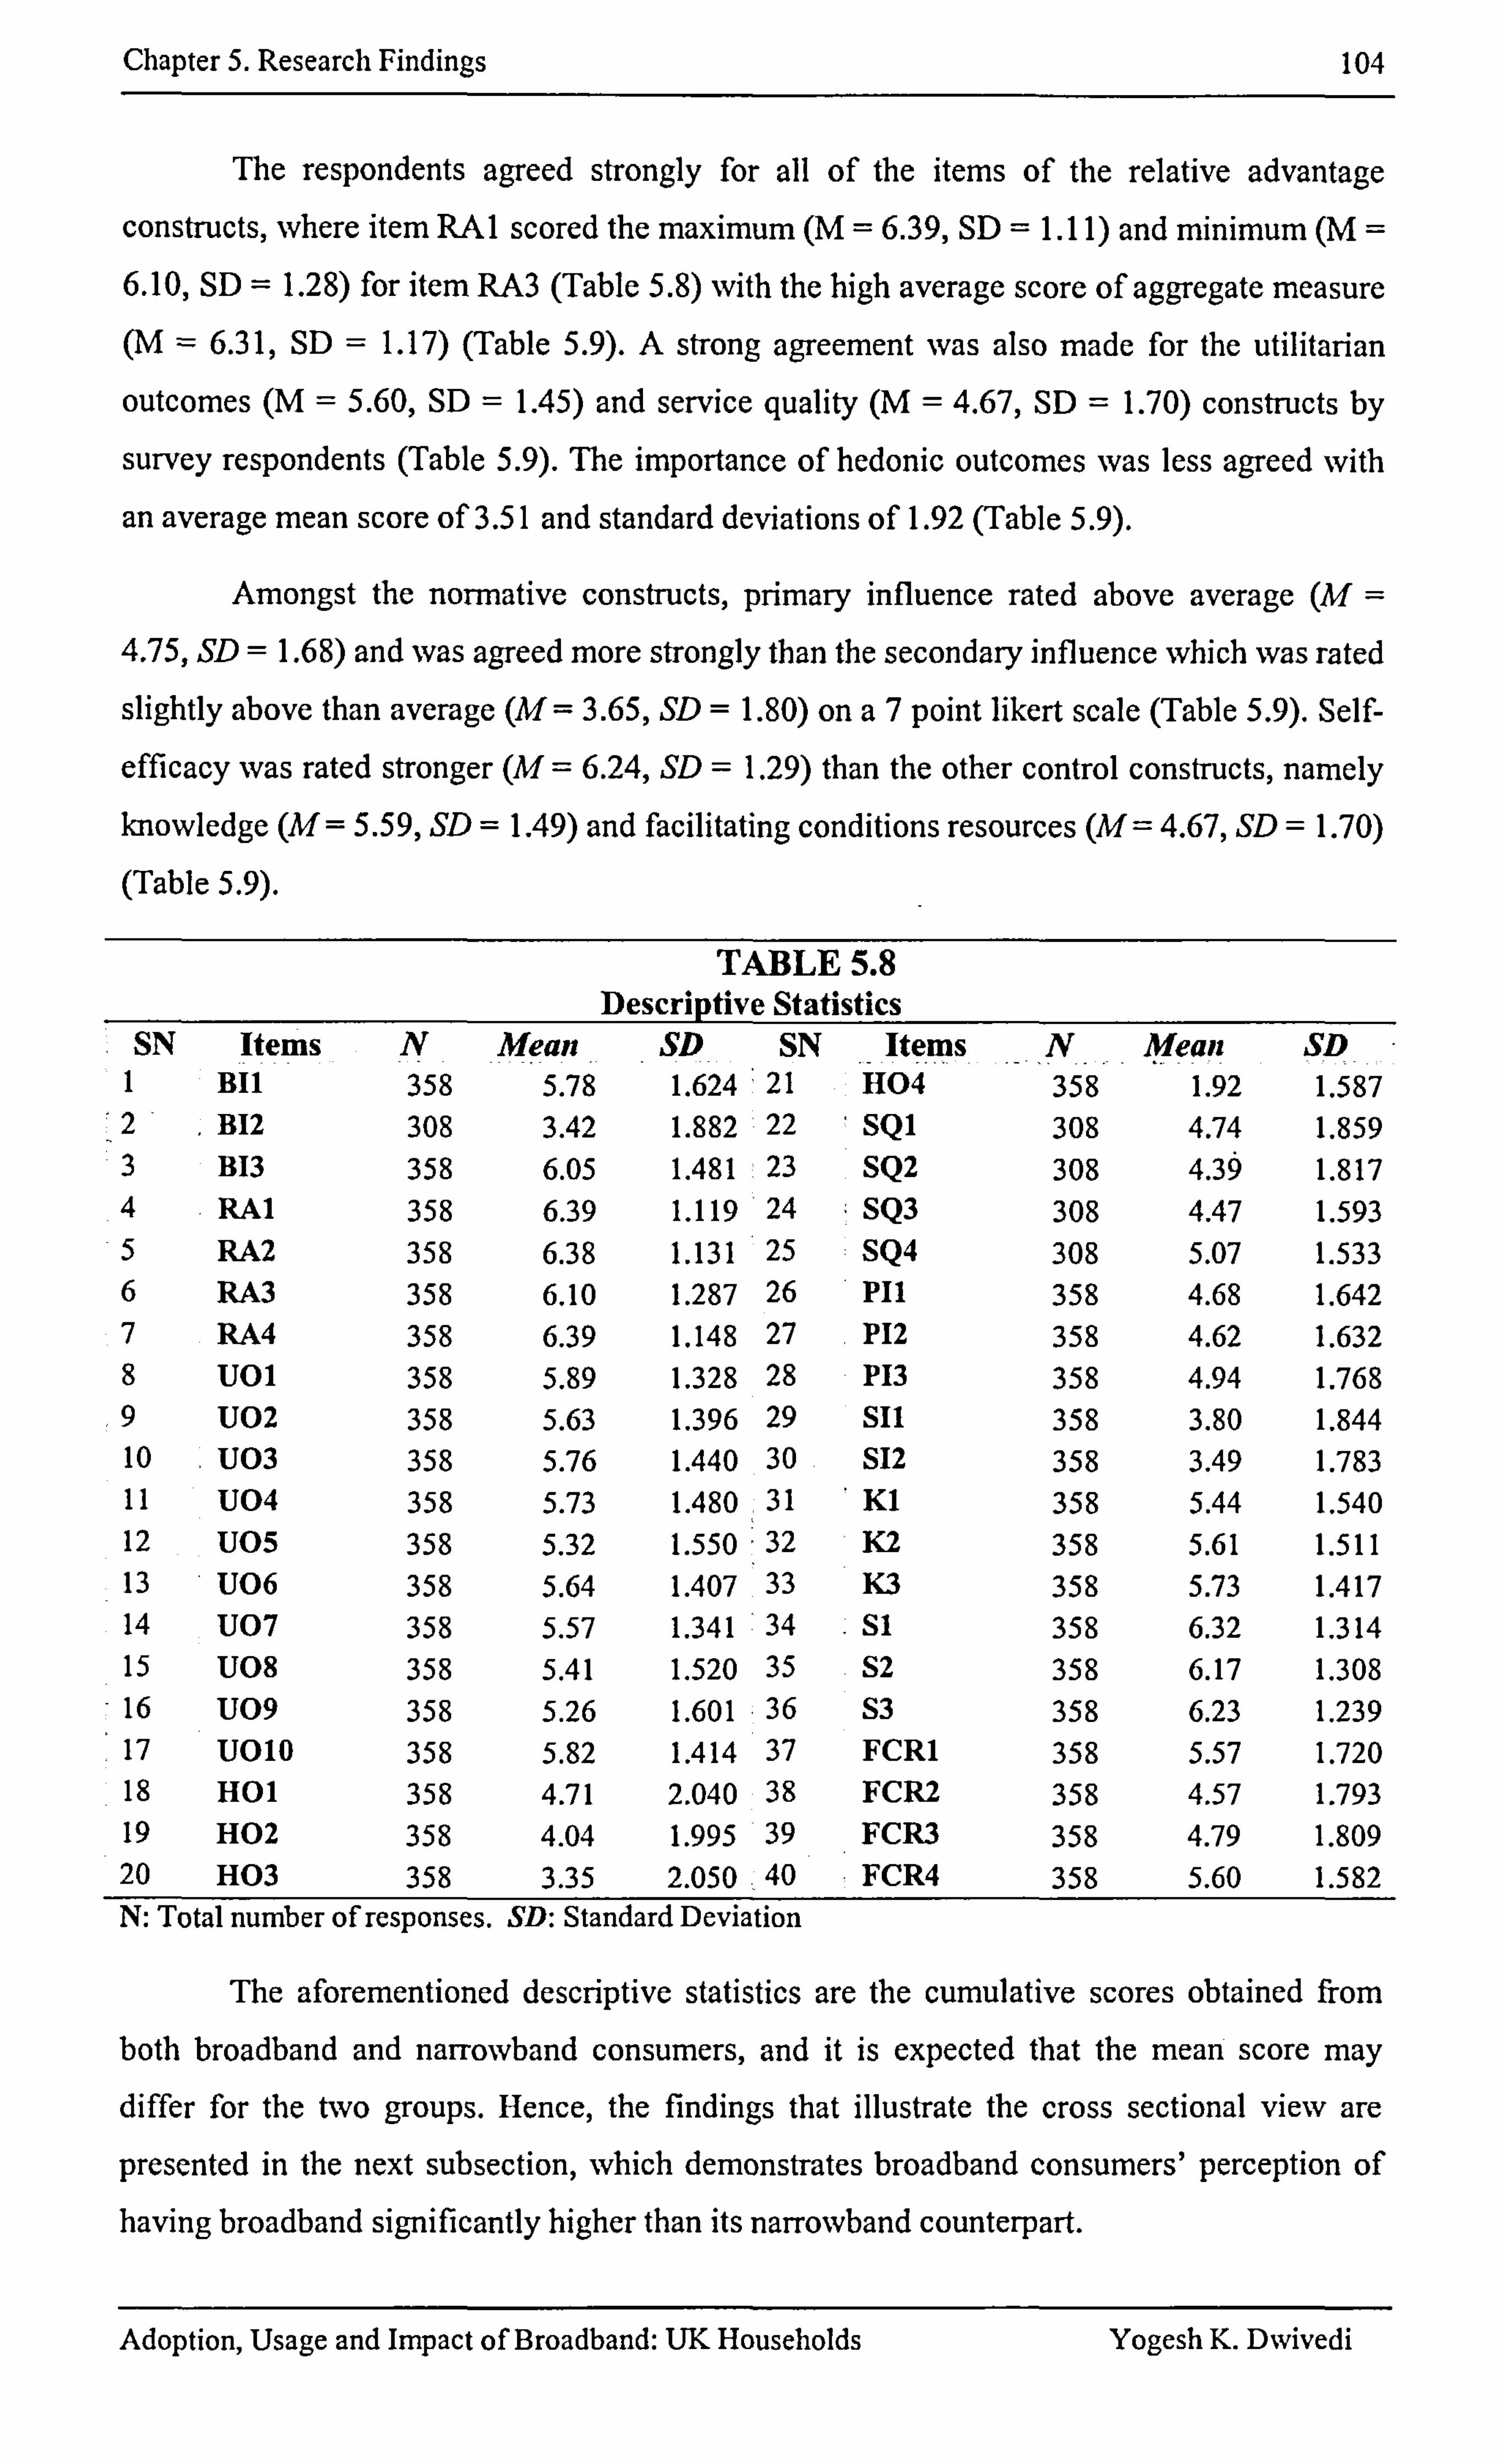
Chapter 5. Research Findings 104
The respondents agreed strongly for all of the items of the relative advantage
constructs, where itemRAI scoredthe maximum(M= 6.39, SD = 1.11) andminimum(M= 6.10, SD = 1.28) for item RA3 (Table 5.8) with the high average score of aggregate measure (M = 6.31, SD = 1.17) (Table 5.9). A strong agreement was also made for the utilitarian
outcomes (M = 5.60, SD = 1.45) and service quality (M = 4.67, SD = 1.70) constructs by
survey respondents (Table 5.9). The importance of hedonic outcomes was less agreed with
an average mean score of 3.51 and standard deviations of 1.92 (Table 5.9).
Amongst the normative constructs, primary influence rated above average (M = 4.75, SD = 1.68) and was agreed more strongly than the secondary influence which was rated
slightly above than average W=3.65, SD = 1.80) on a7 point likert scale (Table 5.9). Self-
efficacy was rated stronger W=6.24, SD = 1.29) than the other control constructs, namely knowledge W=5.59, SD = 1.49) and facilitating conditions resources W=4.67, SD = 1.70)
(Table 5.9).
TABLE 5.8 Descriptive Statistics
SN Items N Mean SD SN Items N Mean SD I Bll 358 5.78 1.624 21 H04 358 1.92 1.587
,2 B12 308 3.42 1.882 22 SQ1 308 4.74 1.859
3 B13 358 6.05 1.481 23 SQ2 308 4.3§ 1.817 4 RAl 358 6.39 1.119 24 SQ3 308 4.47 1.593 5 RA2 358 6.38 1.131 25 SQ4 308 5.07 1.533 6 RA3 358 6.10 1.287 26 PH 358 4.68 1.642 7 RM 358 6.39 1.148 27 P12 358 4.62 1.632 8 U01 358 5.89 1.328 28 P13 358 4.94 1.768 9 U02 358 5.63 1.396 29 Sil 358 3.80 1.844 10 U03 358 5.76 1.440 30 S12 358 3.49 1.783 11 U04 358 5.73 1.480 31 KI 358 5.44 1.540 12 U05 358 5.32 1.550 32 K2 358 5.61 1.511 13 U06 358 5.64 1.407 33 K3 358 5.73 1.417 14 U07 358 5.57 1.341 34 Sl 358 6.32 1.314 15 U08 358 5.41 1.520 35 S2 358 6.17 1.308 16 U09 358 5.26 1.601 36 S3 358 6.23 1.239 17 uolo 358 5.82 1.414 37 FCR1 358 5.57 1.720 18 H01 358 4.71 2.040 38 FCR2 358 4.57 1.793 19 H02 358 4.04 1.995 39 FCR3 358 4.79 1.809 20 H03 358 3.35 2.050 40 FCR4 358 5.60 1.582 N: Total number of responses. SA Standard Deviation
The aforementioned descriptive statistics are the cumulative scores obtained from
both broadband and narrowband consumers, and it is expected that the mean score may differ for the two groups. Hence, the findings that illustrate the cross sectional view are
presented in the next subsection, which demonstrates broadband consumers' perception of having broadband significantly higher than its narrowband counterpart.
Adoption, Usage and Impact of Broadband: UK Households Yogesh K. Dwivedi
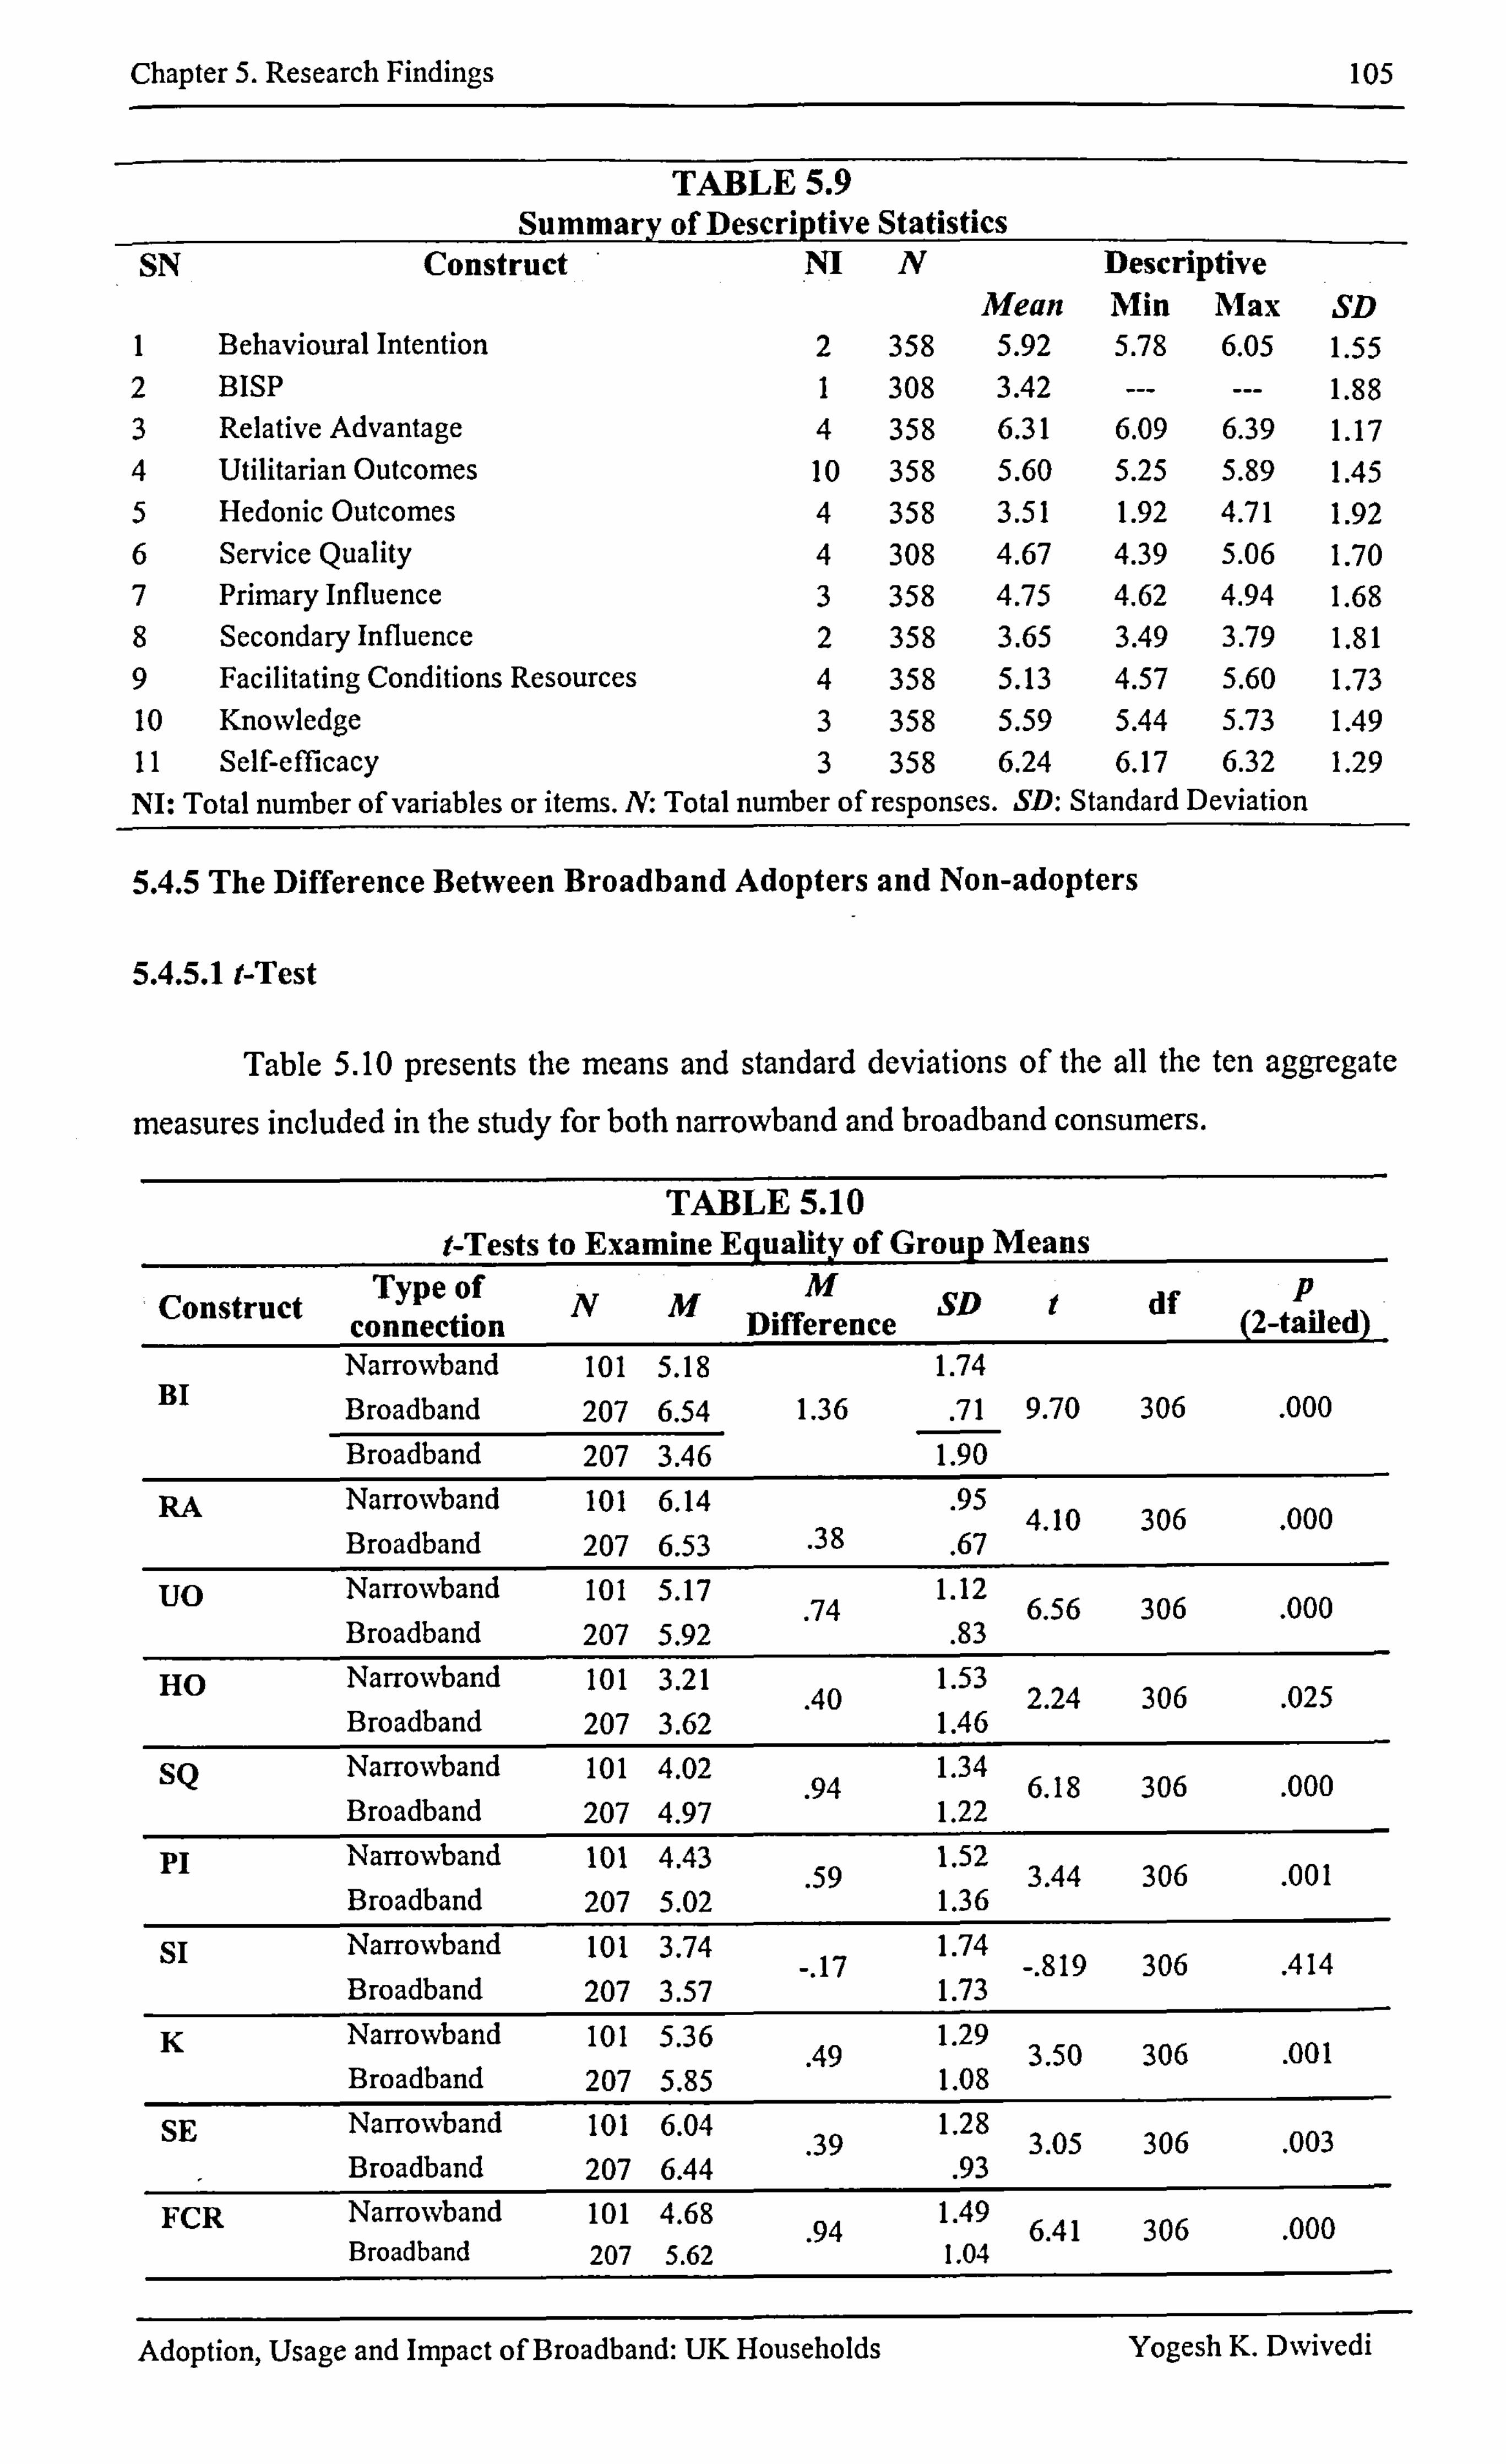
Chapter 5. Research Findings 105
Summary TABLE 5.9 of Descriptive Statistics
SN Construct NI N Descri ptive Mean Min Max SD
I Behavioural Intention 2 358 5.92 5.78 6.05 1.55 2 BISP 1 308 3.42 --- --- 1.88 3 Relative Advantage 4 358 6.31 6.09 6.39 1.17 4 Utilitarian Outcomes 10 358 5.60 5.25 5.89 1.45 5 Hedonic Outcomes 4 358 3.51 1.92 4.71 1.92 6 Service Quality 4 308 4.67 4.39 5.06 1.70 7 Primary Influence 3 358 4.75 4.62 4.94 1.68 8 Secondary Influence 2 358 3.65 3.49 3.79 1.81 9 Facilitating Conditions Resources 4 358 5.13 4.57 5.60 1.73 10 Knowledge 3 358 5.59 5.44 5.73 1.49 11 Self-efficacy 3 358 6.24 6.17 6.32 1.29 NI: Total number of variables or items. N. Total number of responses. SD: Standard Deviation
5.4.5 The Difference Between Broadband Adopters and Non-adopters
5.4.5.1 t-Test
Table 5.10 presents the means and standard deviations of the all the ten aggregate
measures included in the study for both narrowband and broadband consumers.
TABLE 5.10 I-Tests to Examine E guality of G roup Means
Construct Type of N M m SD i df P connection Difference (2-tailed) Narrowband 101 5.18 1.74
BI Broadband 207 6.54 1.36 . 71 9.70 306 . 000 Broadband 207 3.46 1.90
RA Narrowband 101 6.14 . 95 4.10 306 . 000 Broadband 207 6.53 . 38
. 67 UO Narrowband 101 5.17 1.12
. 74 6.56 306 . 000 Broadband 207 5.92 . 83
HO Narrowband 101 3.21 1.53 . 40 2.24 306 . 025
Broadband 207 3.62 1.46 SQ Narrowband 101 4.02 1.34
. 94 6.18 306 . 000 Broadband 207 4.97 1.22
Pi Narrowband 101 4.43 1.52 . 59 3.44 306 . 001
Broadband 207 5.02 1.36 Si Narrowband 101 3.74 1.74
. 17 819 306 . 414 Broadband 207 3.57 1.73
K Narrowband 101 5.36 1.29 . 49 3.50 306 . 001
Broadband 207 5.85 1.08 SE Narrowband 101 6.04 1.28
. 39 3.05 306 . 003 Broadband 207 6.44 . 93
FCR Narrowband 101 4.68 . 94 1.49 6.41 306 . 000
Broadband 207 5.62 1.04
Adoption, Usage and Impact of Broadband: UK Households Yogesh K. Dwivedi
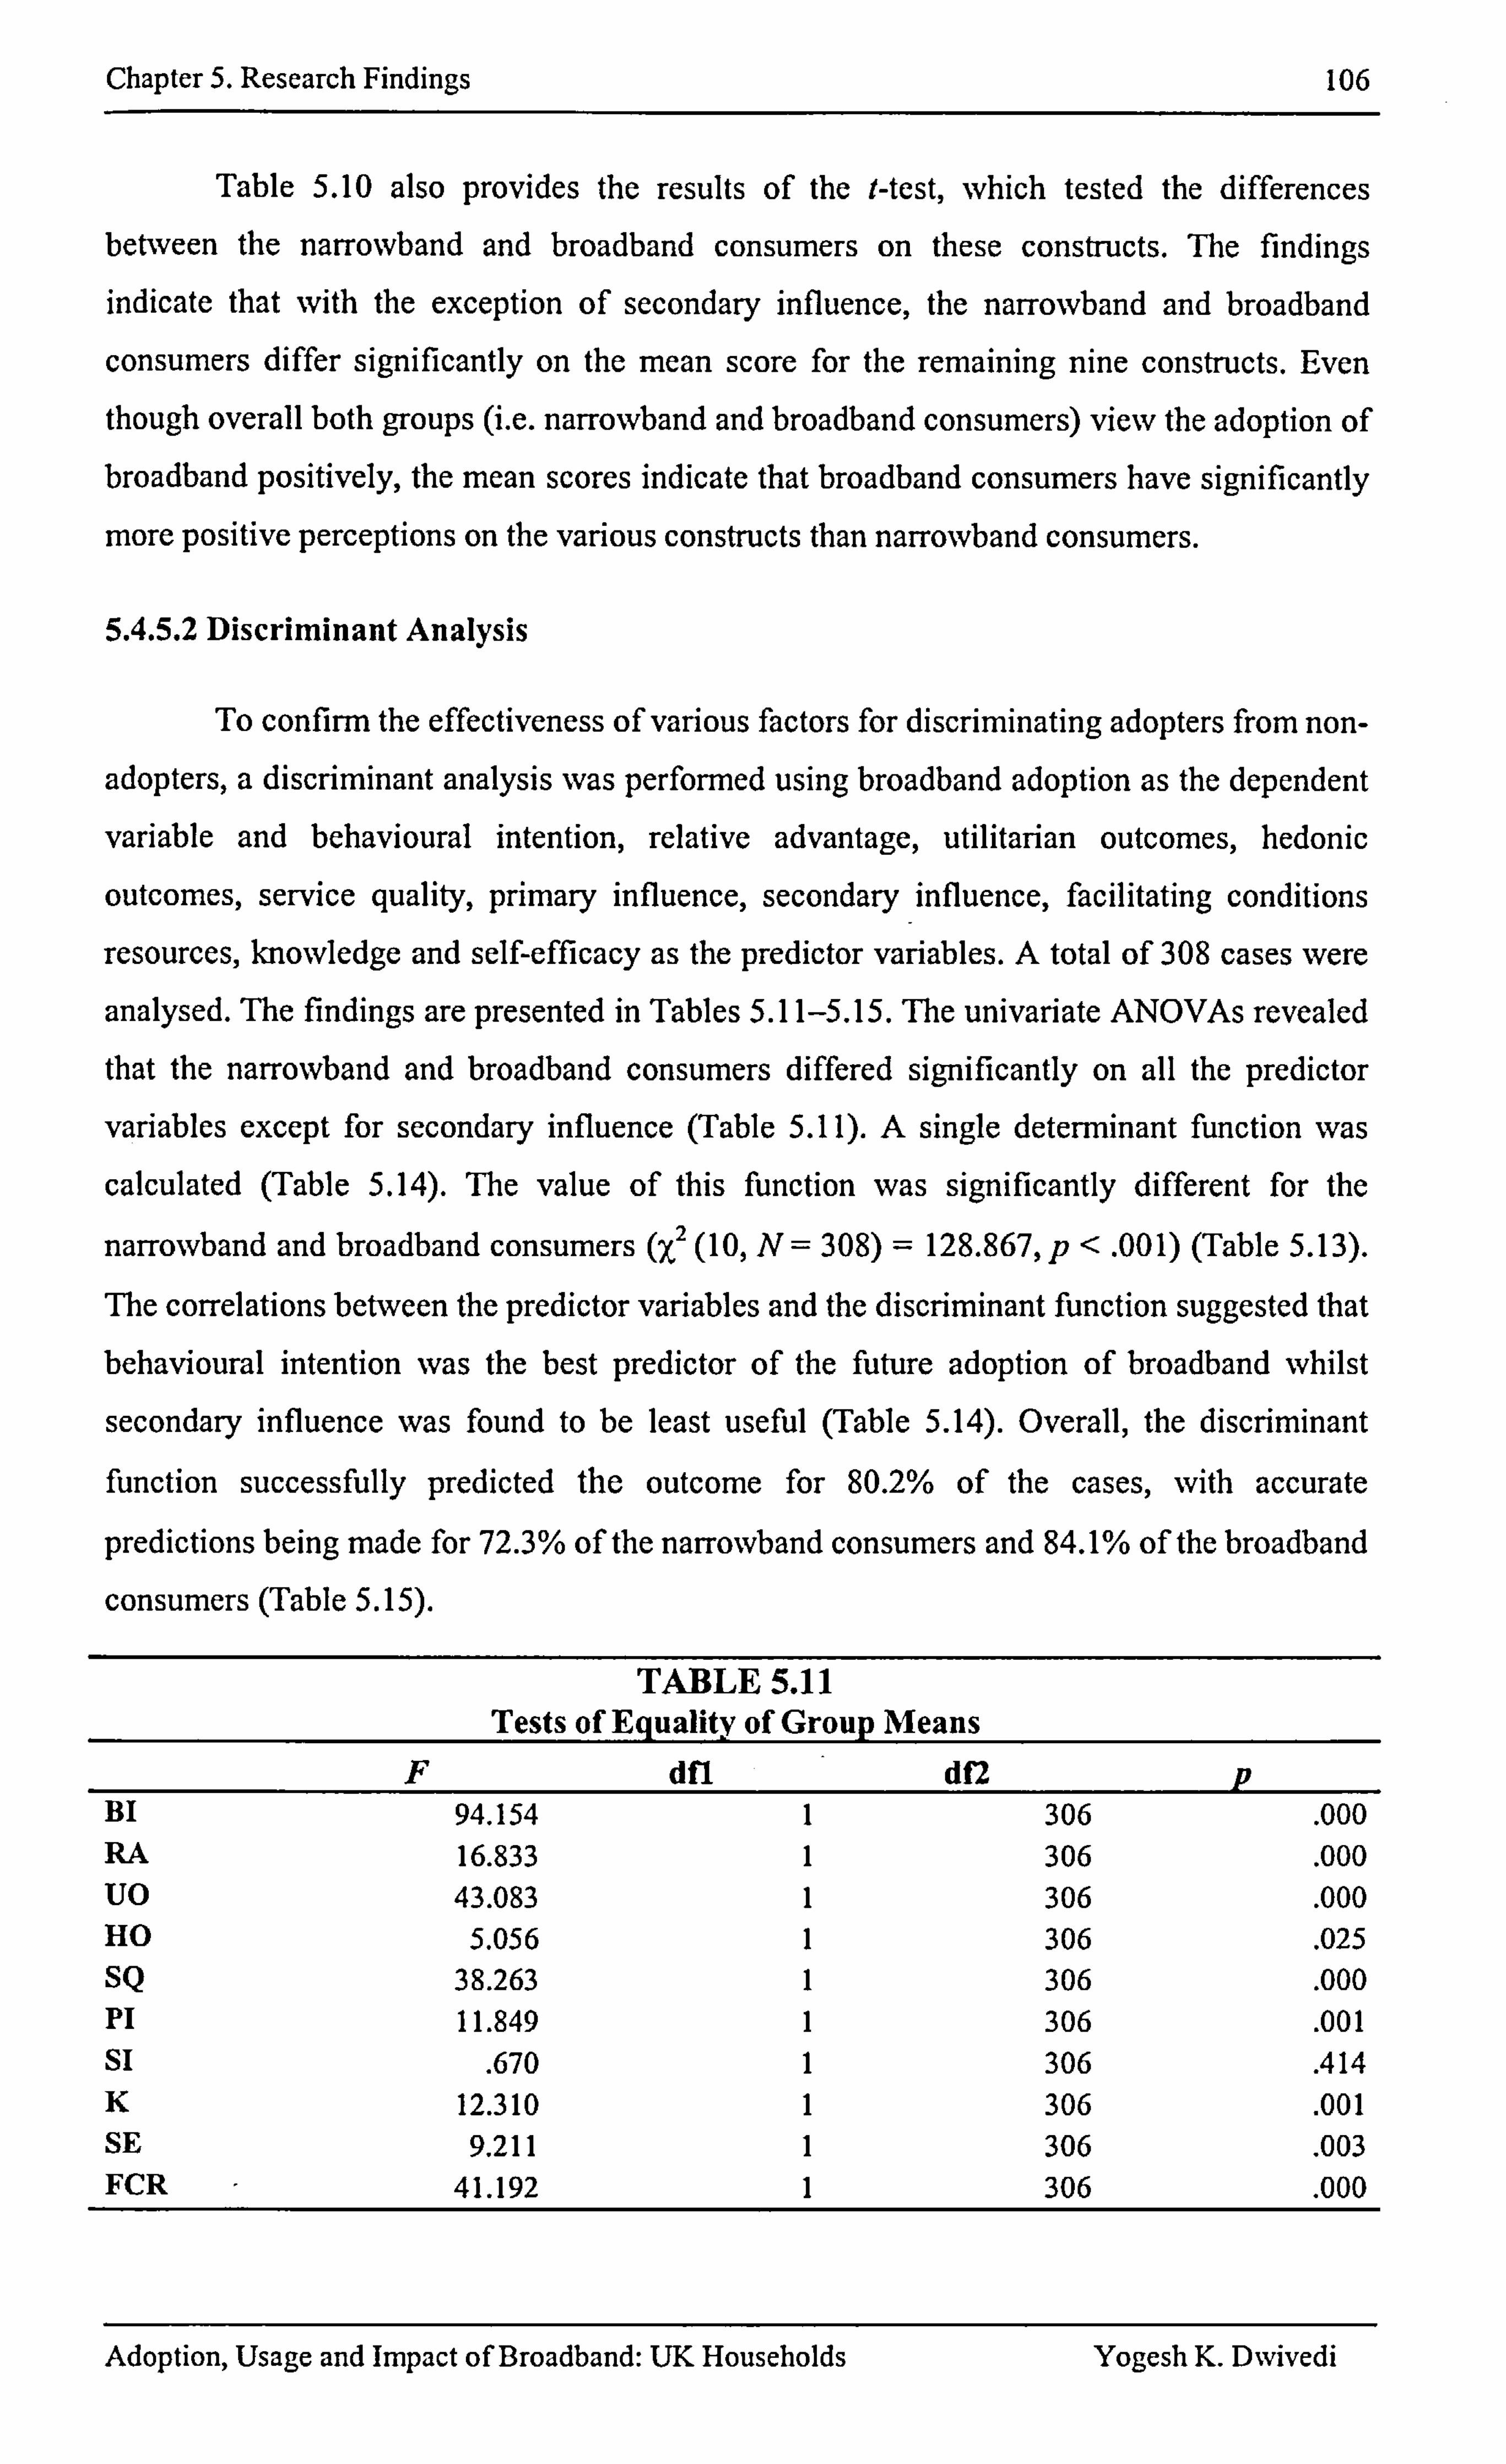
Chapter 5. Research Findings 106
Table 5.10 also provides the results of the Mest, which tested the differences
between the narrowband and broadband consumers on these constructs. The findings
indicate that with the exception of secondary influence, the narrowband and broadband
consumers differ significantly on the mean score for the remaining nine constructs. Even
though overall both groups (i. e. narrowband and broadband consumers) view the adoption of broadband positively, the mean scores indicate that broadband consumers have significantly
more positive perceptions on the various constructs than narrowband consumers.
5.4.5.2 Discriminant Analysis
To confirm the effectiveness of various factors for discriminating adopters from non-
adopters, a discriminant analysis was performed using broadband adoption as the dependent
variable and behavioural intention, relative advantage, utilitarian outcomes, hedonic
outcomes, service quality, primary influence, secondary influence, facilitating conditions
resources, knowledge and self-efficacy as the predictor variables. A total of 308 cases were
analysed. The findings are presented in Tables 5.11-5.15. The univariate ANOVAs revealed that the narrowband and broadband consumers differed significantly on all the predictor
variables except for secondary influence (Table 5.11). A single determinant function was
calculated (Table 5.14). The value of this function was significantly different for the
narrowband and broadband consumers (X 2 (10, N= 308) = 128.867, p< . 00 1) (Table 5.13).
The correlations between the predictor variables and the discriminant function suggested that
behavioural intention was the best predictor of the future adoption of broadband whilst
secondary influence was found to be least useful (Table 5.14). Overall, the discriminant
function successfully predicted the outcome for 80.2% of the cases, with accurate
predictions being made for 72.3% of the narrowband consumers and 84.1% of the broadband
consumers (Table 5.15).
TABLE 5.11 Tests of Equality of Group Means
F dfl d C2 P BI 94.154 1 306 . 000 RA 16.833 1 306 . 000 U0 43.083 1 306 . 000 HO 5.056 1 306 . 025 SQ 38.263 1 306 . 000 PI 11.849 1 306 . 001 SI . 670 1 306 . 414 K 12.310 1 306 . 001 SE 9.211 1 306 . 003 FCR 41.192 1 306 . 000
Adoption, Usage and Impact of Broadband: UK Households Yogesh K. Dwivedi
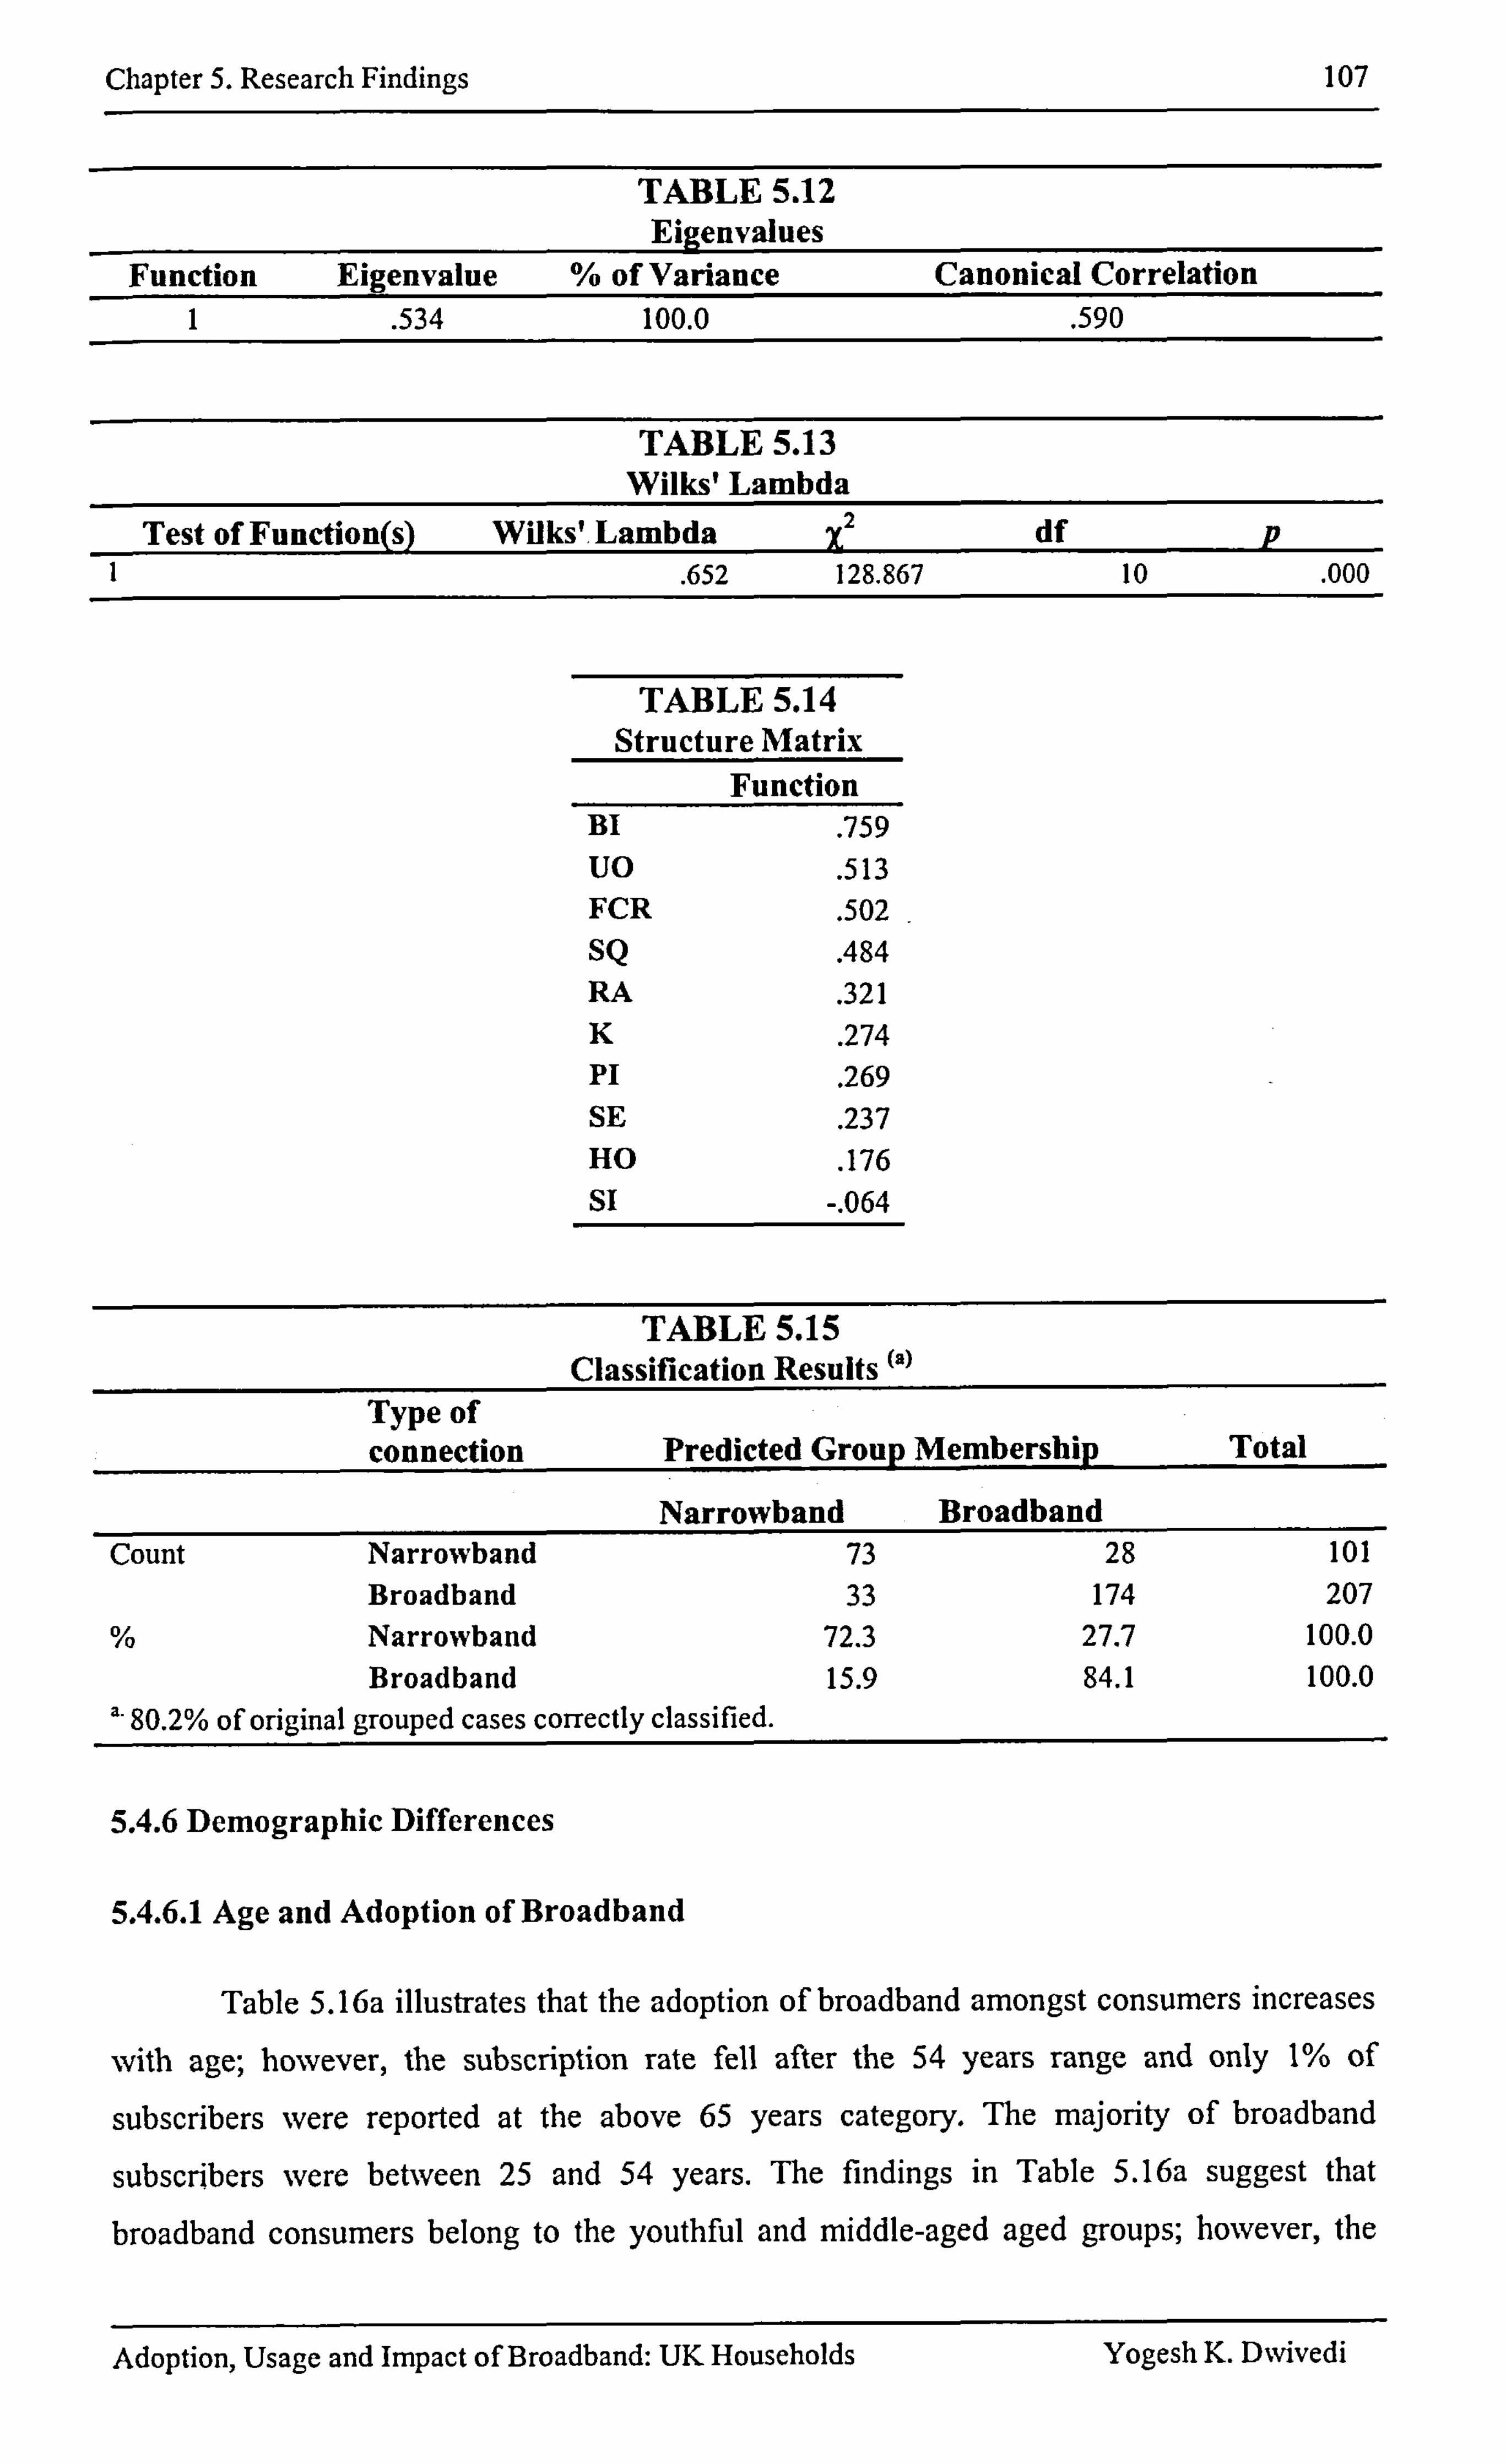
Chapter 5. Research Findings 107
TABLE5.12 Eigenvalues
Function Eigenvalue % of Variance Canonical Correlation 1 . 534 100.0 . 590
TABLE 5.13 Wilks'Lambda
Test of Function(s) Wilks', Lambda x2 df p . 652 128.867 10 . 000
TABLE 5.14 Structure Matrix
Function BI . 759 uo . 513 FCR . 502 SQ . 484 RA . 321 K . 274 Pi . 269 SE . 237 HO . 176 si -. 064
TABLE 5.15 Classification Results
Typeof connection Predicted Group Membership Total
Narrowband Broadband Count Narrowband 73 28 101
Broadband 33 174 207 % Narrowband 72.3 27.7 100.0
Broadband 15.9 84.1 100.0 a. 80.2% of original grouped cases correctly classified.
5.4.6 Demographic Differences
5.4.6.1 Age and Adoption of Broadband
Table 5.16a illustrates that the adoption of broadband amongst consumers increases
with age; however, the subscription rate fell after the 54 years range and only 1% of
subscribers were reported at the above 65 years category. The majority of broadband
subscribers were between 25 and 54 years. The findings in Table 5.16a suggest that
broadband consumers belong to the youthful and middle-aged aged groups; however, the
Adoption, Usage and Impact of Broadband: UK Households Yogesh K. DNvivedi
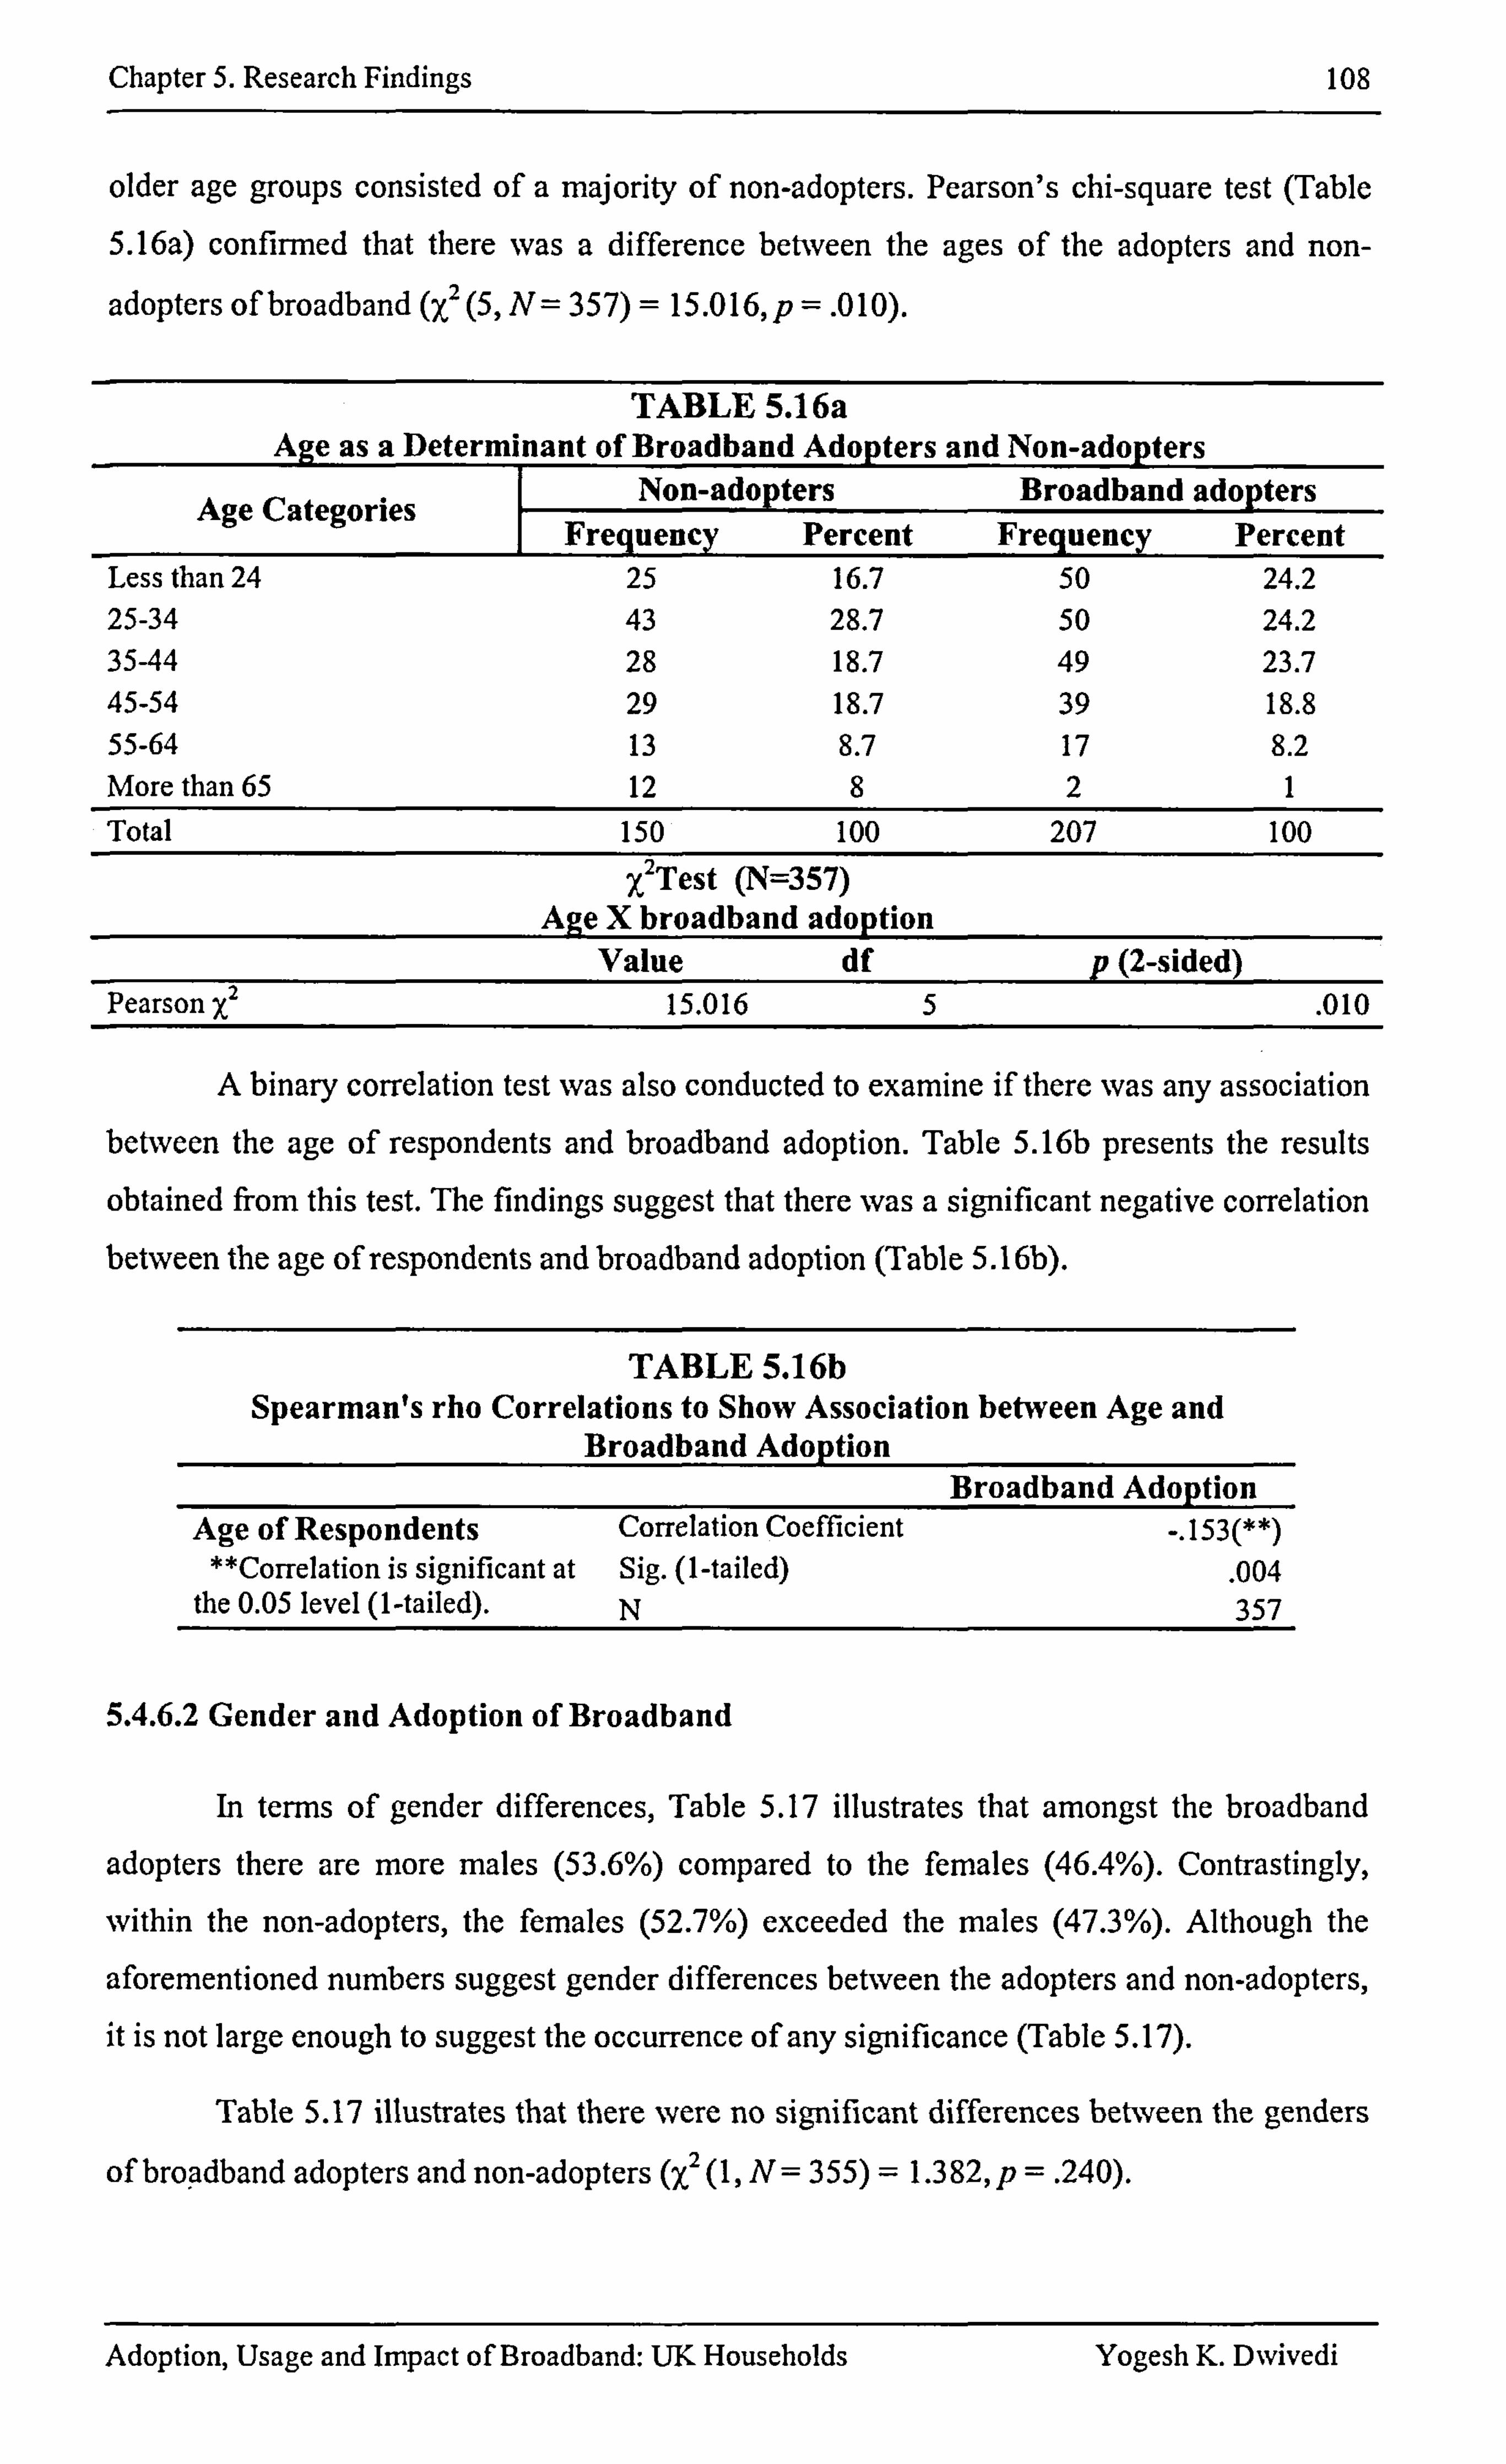
Chapter 5. Research Findings 108
older age groups consisted of a majority of non-adopters. Pearson's chi-square test (Table
5.16a) confirmed that there was a difference between the ages of the adopters and non-
adopters of broadband (y, 2 (5, N= 357) = 15.016, p =. 010).
TABLE 5.16a Age as a Determi nant of Broadband Adopters and Non-adopters
Non-adopters Broadband adop ters A C t i ý
ge a egor es Frequency Percent Frequency Percent Less than 24 25 16.7 50 24.2 25-34 43 28.7 50 24.2 35-44 28 18.7 49 23.7 45-54 29 18.7 39 18.8 55-64 13 8.7 17 8.2 More than 65 12 8 2 1 Total 150 100 207 100
x2 Test (N=357) Age X broadband adoption
Value df p (2-sided) Pearson X2 15.016 5 . 010
A binary correlation test was also conducted to examine if there was any association between the age of respondents and broadband adoption. Table 5.16b presents the results
obtained from this test. The findings suggest that there was a significant negative correlation between the age of respondents and broadband adoption (Table 5.16b).
TABLE 5.16b Spearman's rho Correlations to Show Association between Age and
Broadband Adoption Broadband Adoption
Age of Respondents Correlation Coefficient -. 153(**) "Correlation is significant at Sig. (1-tailed) . 004
the 0.05 level (1-tailed). N 357
5.4.6.2 Gender and Adoption of Broadband
In terms of gender differences, Table 5.17 illustrates that amongst the broadband
adopters there are more males (53.6%) compared to the females (46.4%). Contrastingly,
within the non-adopters, the females (52.7%) exceeded the males (47.3%). Although the
aforementioned numbers suggest gender differences between the adopters and non-adopters, it is not large enough to suggest the occurrence of any significance (Table 5.17).
Table 5.17 illustrates that there were no significant differences between the genders
of broadband adopters and non-adopters (X2 (1, N=3 55) = 1.3 82, p= . 240).
Adoption, Usage and Impact of Broadband: UK Households Yogesh K. Dwivedi
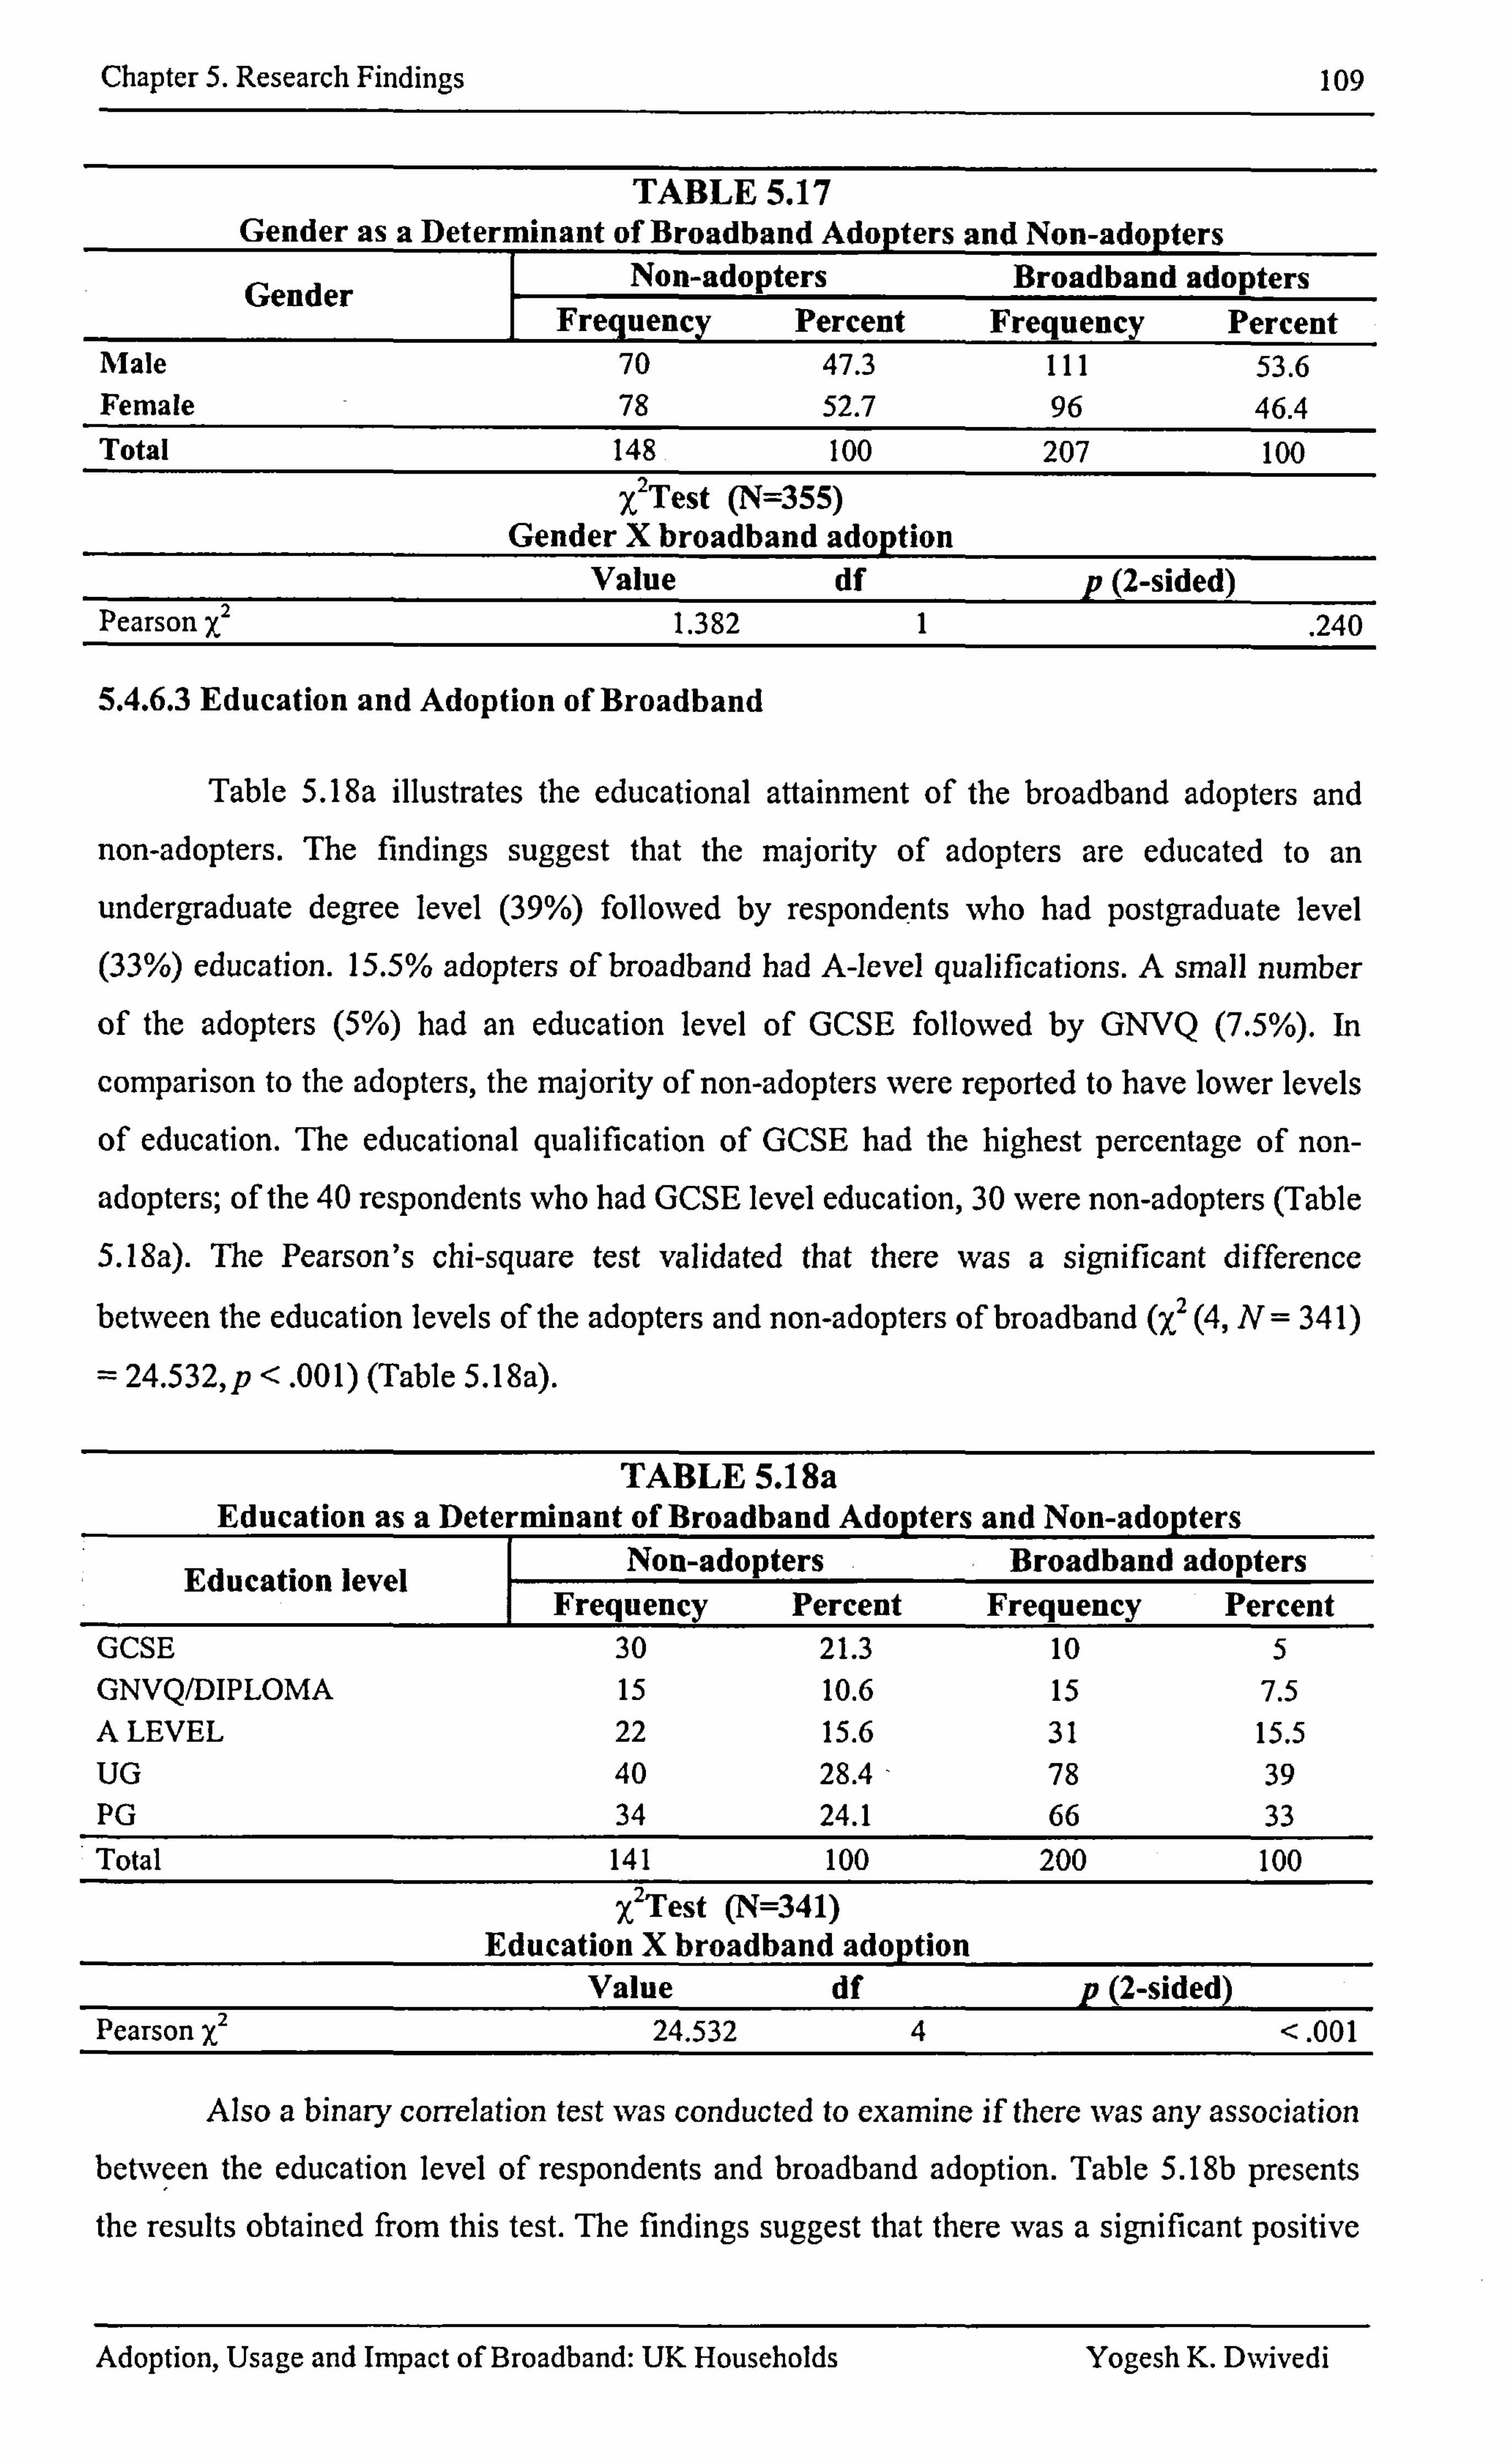
Chapter 5. Research Findings 109
TABLE 5.17 Gender as a Determinant of Broadband Adopters and Non-adopters
G nd Non-adopters Broadband adopters e er Frequency Percent Frequency Percent
Male Female
70 47.3 78 52.7
111 53.6 96 46.4
Total 148 100 207 100 x2 Test (N=355)
Gender X broadband adoption Value df p (2-sided)
X2 Pearson . 1.382 1 . 240
5.4.6.3 Education and Adoption of Broadband
Table 5.18a illustrates the educational attainment of the broadband adopters and
non-adopters. The findings suggest that the majority of adopters are educated to an
undergraduate degree level (39%) followed by respondents who had postgraduate level
(33%) education. 15.5% adopters of broadband had A-level qualifications. A small number
of the adopters (5%) had an education level of GCSE followed by GNVQ (7.5%). In
comparison to the adopters, the majority of non-adopters were reported to have lower levels
of education. The educational qualification of GCSE had the highest percentage of non-
adopters; of the 40 respondents who had GCSE level education, 30 were non-adopters (Table
5.18a). The Pearson's chi-square test validated that there was a significant difference
between the education levels of the adopters and non-adopters of broadband (7,2 (4, N= 341)
= 24.532, p <. 001) (Table 5.18a).
TABLE 5.18a Education as a Determinant of Broadband Ado pters and Non-adopters
Ed ti l l Non-adopters k Broadband adopters uca on eve -Frequency Percent Frequency Percent
GCSE 30 21.3 10 5 GNVQ/DIPLOMA 15 10.6 15 7.5 A LEVEL 22 15.6 31 15.5 UG 40 28.4 78 39 PG 34 24.1 66 33 Total 141 100 200 100
x2 Test (N=341) Education X broadband adop tion
Value df p (2-sided) X2 Pearson . 24.532 4 <. 001
Also a binary correlation test was conducted to examine if there was any association between the education level of respondents and broadband adoption. Table 5.18b presents the results obtained from this test. The findings suggest that there was a significant positive
Adoption, Usage and Impact of Broadband: UK Households Yogesh K. Dwivedi
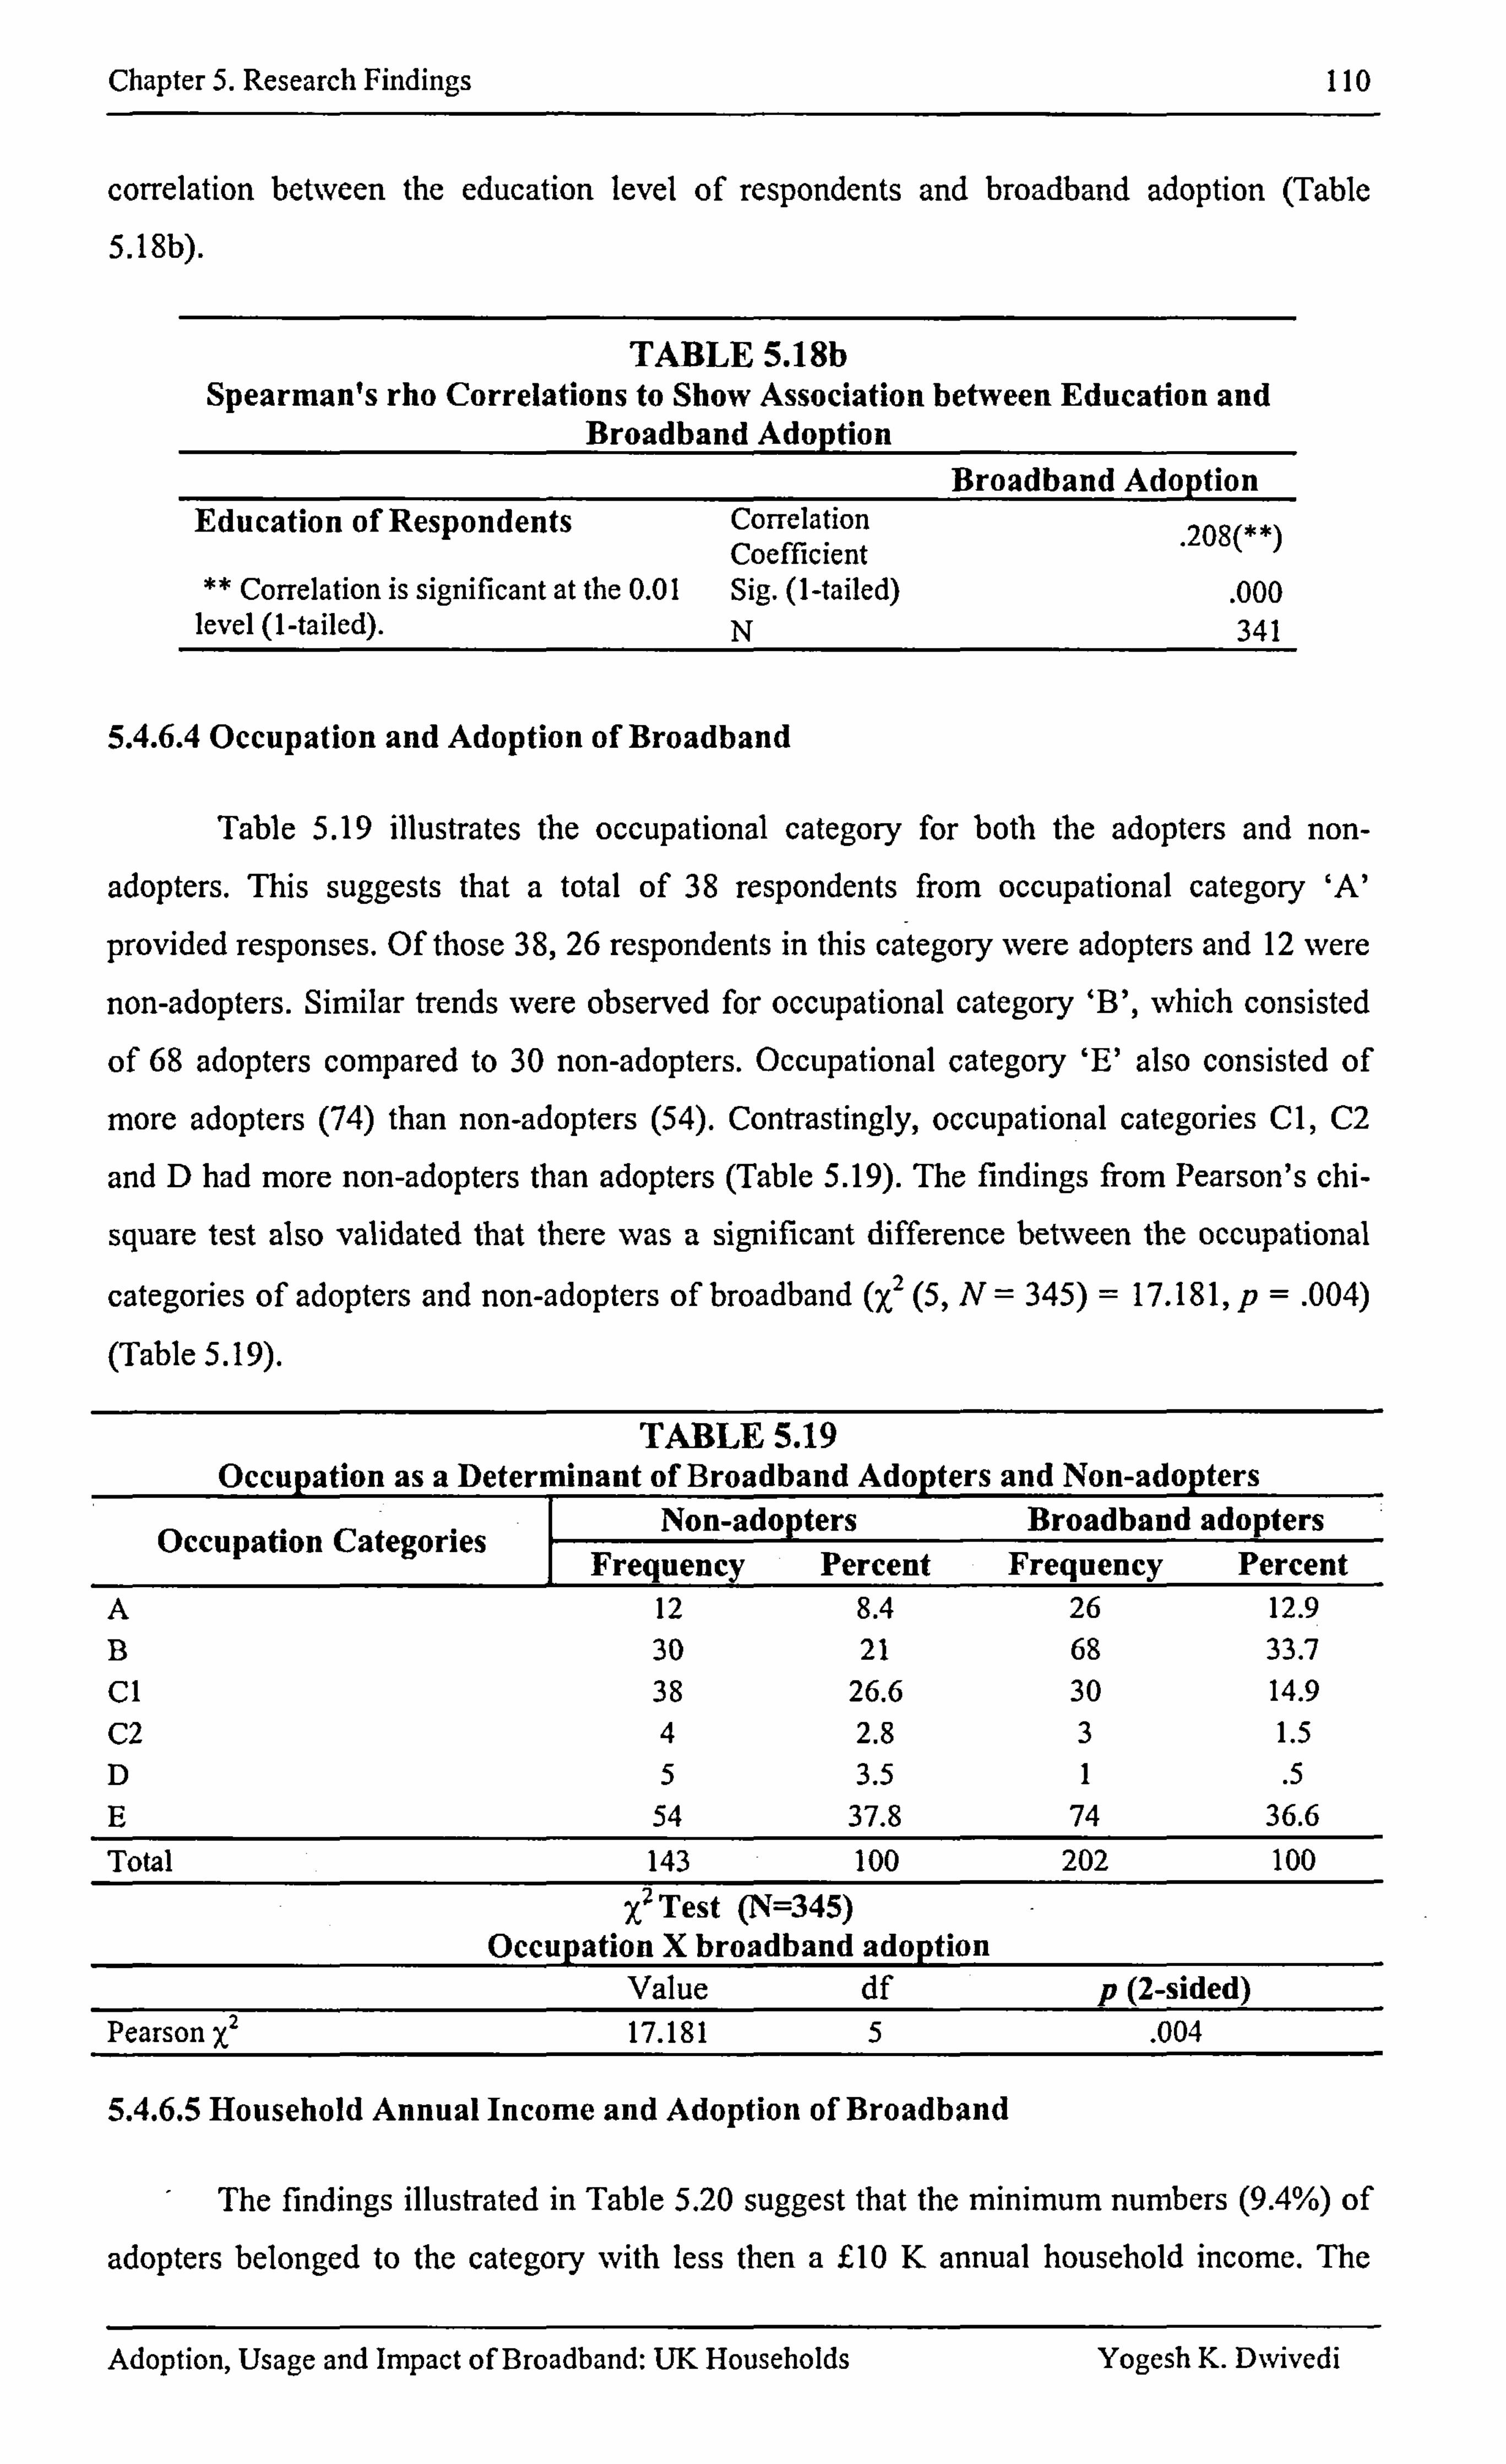
Chapter 5. Research Findings 110
correlation between the education level of respondents and broadband adoption (Table
S. l8b).
TABLE 5.18b Spearman's rho Correlations to Show Association between Education and
Broadband Adoption Broadband Adoption
Education of Respondents Correlation . 208(**) Coefficient
Correlation is significant at the 0.0 1 Sig. (1-tailed) . 000 level (I -tailed). N 341
5.4.6.4 Occupation and Adoption of Broadband
Table 5.19 illustrates the occupational category for both the adopters and non-
adopters. This suggests that a total of 38 respondents from occupational category 'A'
provided responses. Of those 38,26 respondents in this category were adopters and 12 were
non-adopters. Similar trends were observed for occupational category 'B', which consisted
of 68 adopters compared to 30 non-adopters. Occupational category 'E' also consisted of
more adopters (74) than non-adopters (54). Contrastingly, occupational categories Cl, C2
and D had more non-adopters than adopters (Table 5.19). The findings from Pearson's chi-
square test also validated that there was a significant difference between the occupational
categories of adopters and non-adopters of broadband (X 2 (5, N= 345) = 17.18 1, p= . 004)
(Table 5.19).
TABLE 5.19 Occupation as a Determinant of Broadband Adopters and Non-adopters
Occupation Categories Non-adopters Broadband adopters Frequency Percent Frequency Percent
A 12 8.4 26 12.9 B 30 21 68 33.7 CI 38 26.6 30 14.9 C2 4 2.8 3 1.5 D53.5 1 .5 E 54 37.8 74 36.6 Total 143 100 202 100
X7 Test (N=345) Occupation X broadband adoption
Value df p (2-sided) Pearson X2 17.181 5 . 004
5.4.6.5 Household Annual Income and Adoption of Broadband
The findings illustrated in Table 5.20 suggest that the minimum numbers (9.4%) of
adopters belonged to the category with less then a flO K annual household income. The
Adoption, Usage and Impact of Broadband: UK Households Yogesh K. Dwivedi
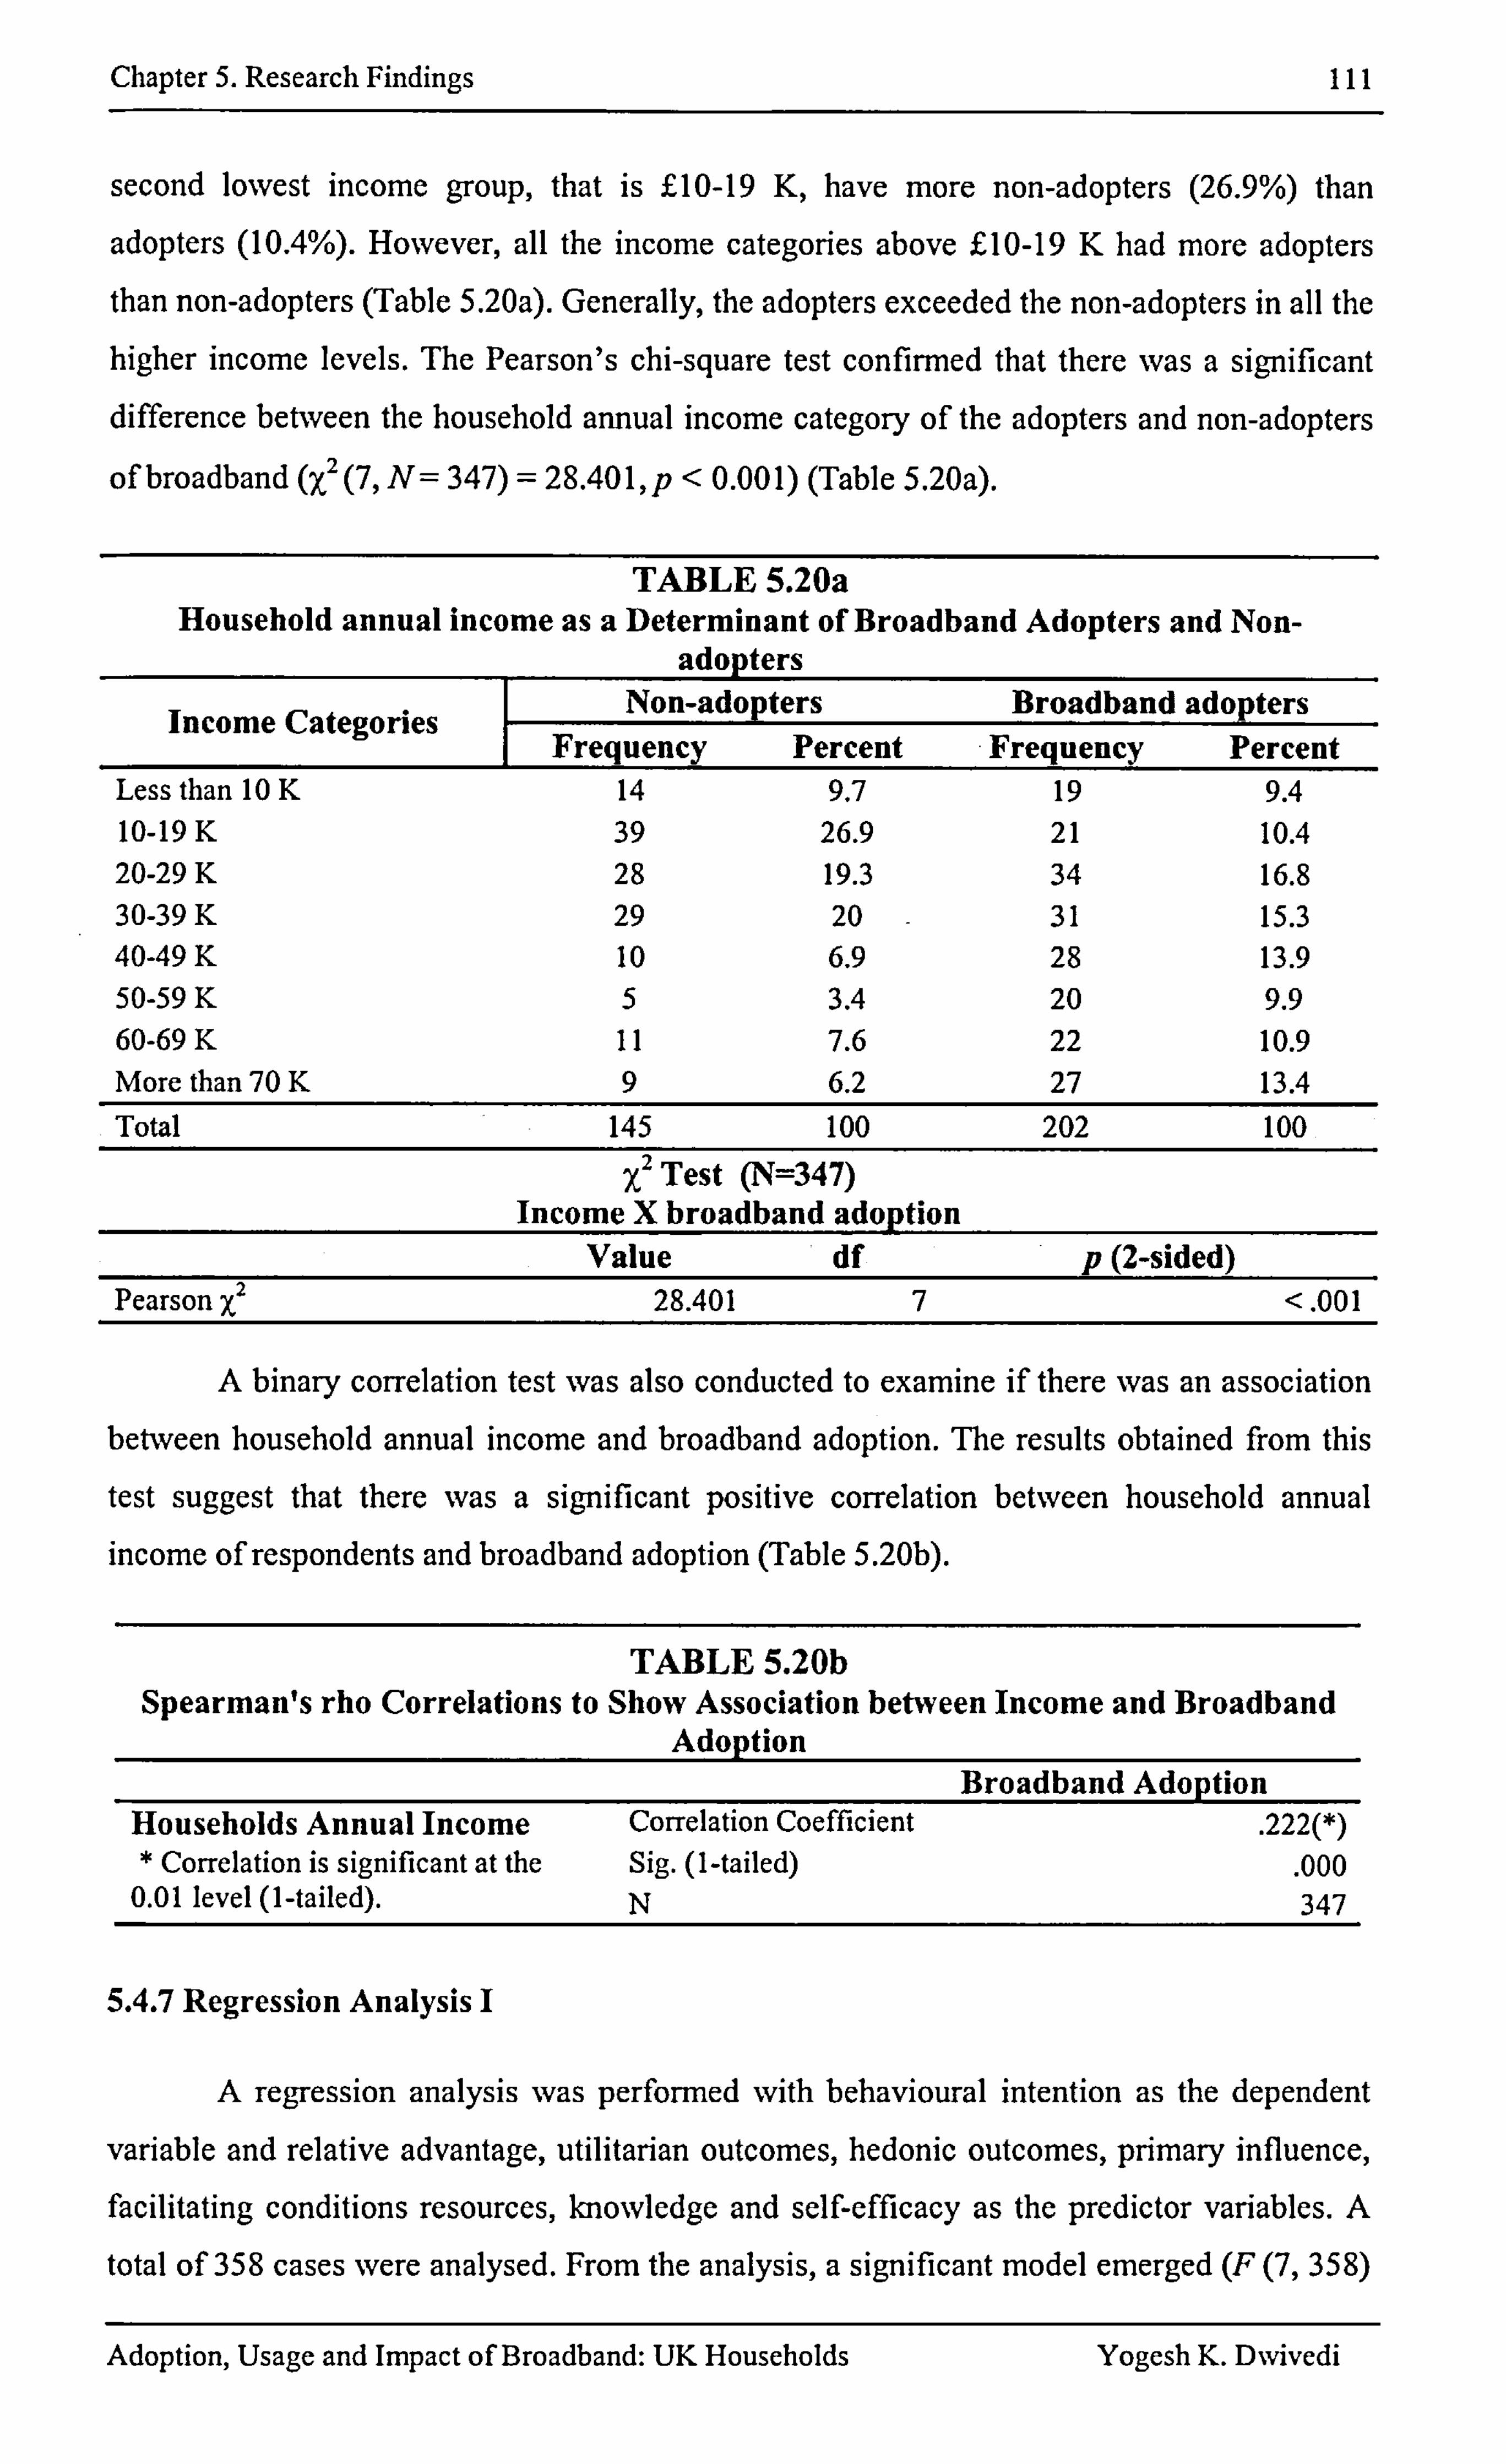
Chapter 5. Research Findings III
second lowest income group, that is EIO-19 K, have more non-adopters (26.9%) than
adopters (10.4%). However, all the income categories above LIO-19 K had more adopters than non-adopters (Table 5.20a). Generally, the adopters exceeded the non-adopters in all the
higher income levels. The Pearson's chi-square test confirmed that there was a significant difference between the household annual income category of the adopters and non-adopters
(, X 2 of broadband .
(7, N= 347) = 28.401, p < 0.001) (Table 5.20a).
TABLE 5.20a Household annual income as a Determinant of Broadband Adopters and Non-
adopters Non-adopters Broadband adopters I C t i
ý- ncome a egor es Frequency Percent Frequency Percent
Less than 10 K 14 9.7 19 9.4 10-19 K 39 26.9 21 10.4 20-29 K 28 19.3 34 16.8 30-39 K 29 20 31 15.3 40-49 K 10 6.9 28 13.9 50-59 K 5 3.4 20 9.9 60-69 K 11 7.6 22 10.9 More than 70 K 9 6.2 27 13.4 Total 145 100 202 100
x2 Test (N=347) Income X broadband adoption
Value df p (2-sided) Pearson X2 28.401 7 <. 001
A binary correlation test was also conducted to examine if there was an association between household annual income and broadband adoption. The results obtained from this
test suggest that there was a significant positive correlation between household annual income of respondents and broadband adoption (Table 5.20b).
TABLE 5.20b Spearman's rho Correlations to Show Association between Income and Broadband
Adoption Broadband Adoption
Households Annual Income Correlation Coefficient 222(*) * Correlation is significant at the Sig. (1-tailed) . 000
0.01 level (1-tailed). N 347
5.4.7 Regression Analysis I
A regression analysis was perfonned with behavioural intention as the dependent
variable and relative advantage, utilitarian outcomes, hedonic outcomes, primary influence,
facilitating conditions resources, knowledge and self-efficacy as the predictor variables. A
total of 358 cases were analysed. From the analysis, a significant model emerged (F (7,358)
Adoption, Usage and Impact of Broadband: UK Households Yogesh K. Dwivedi
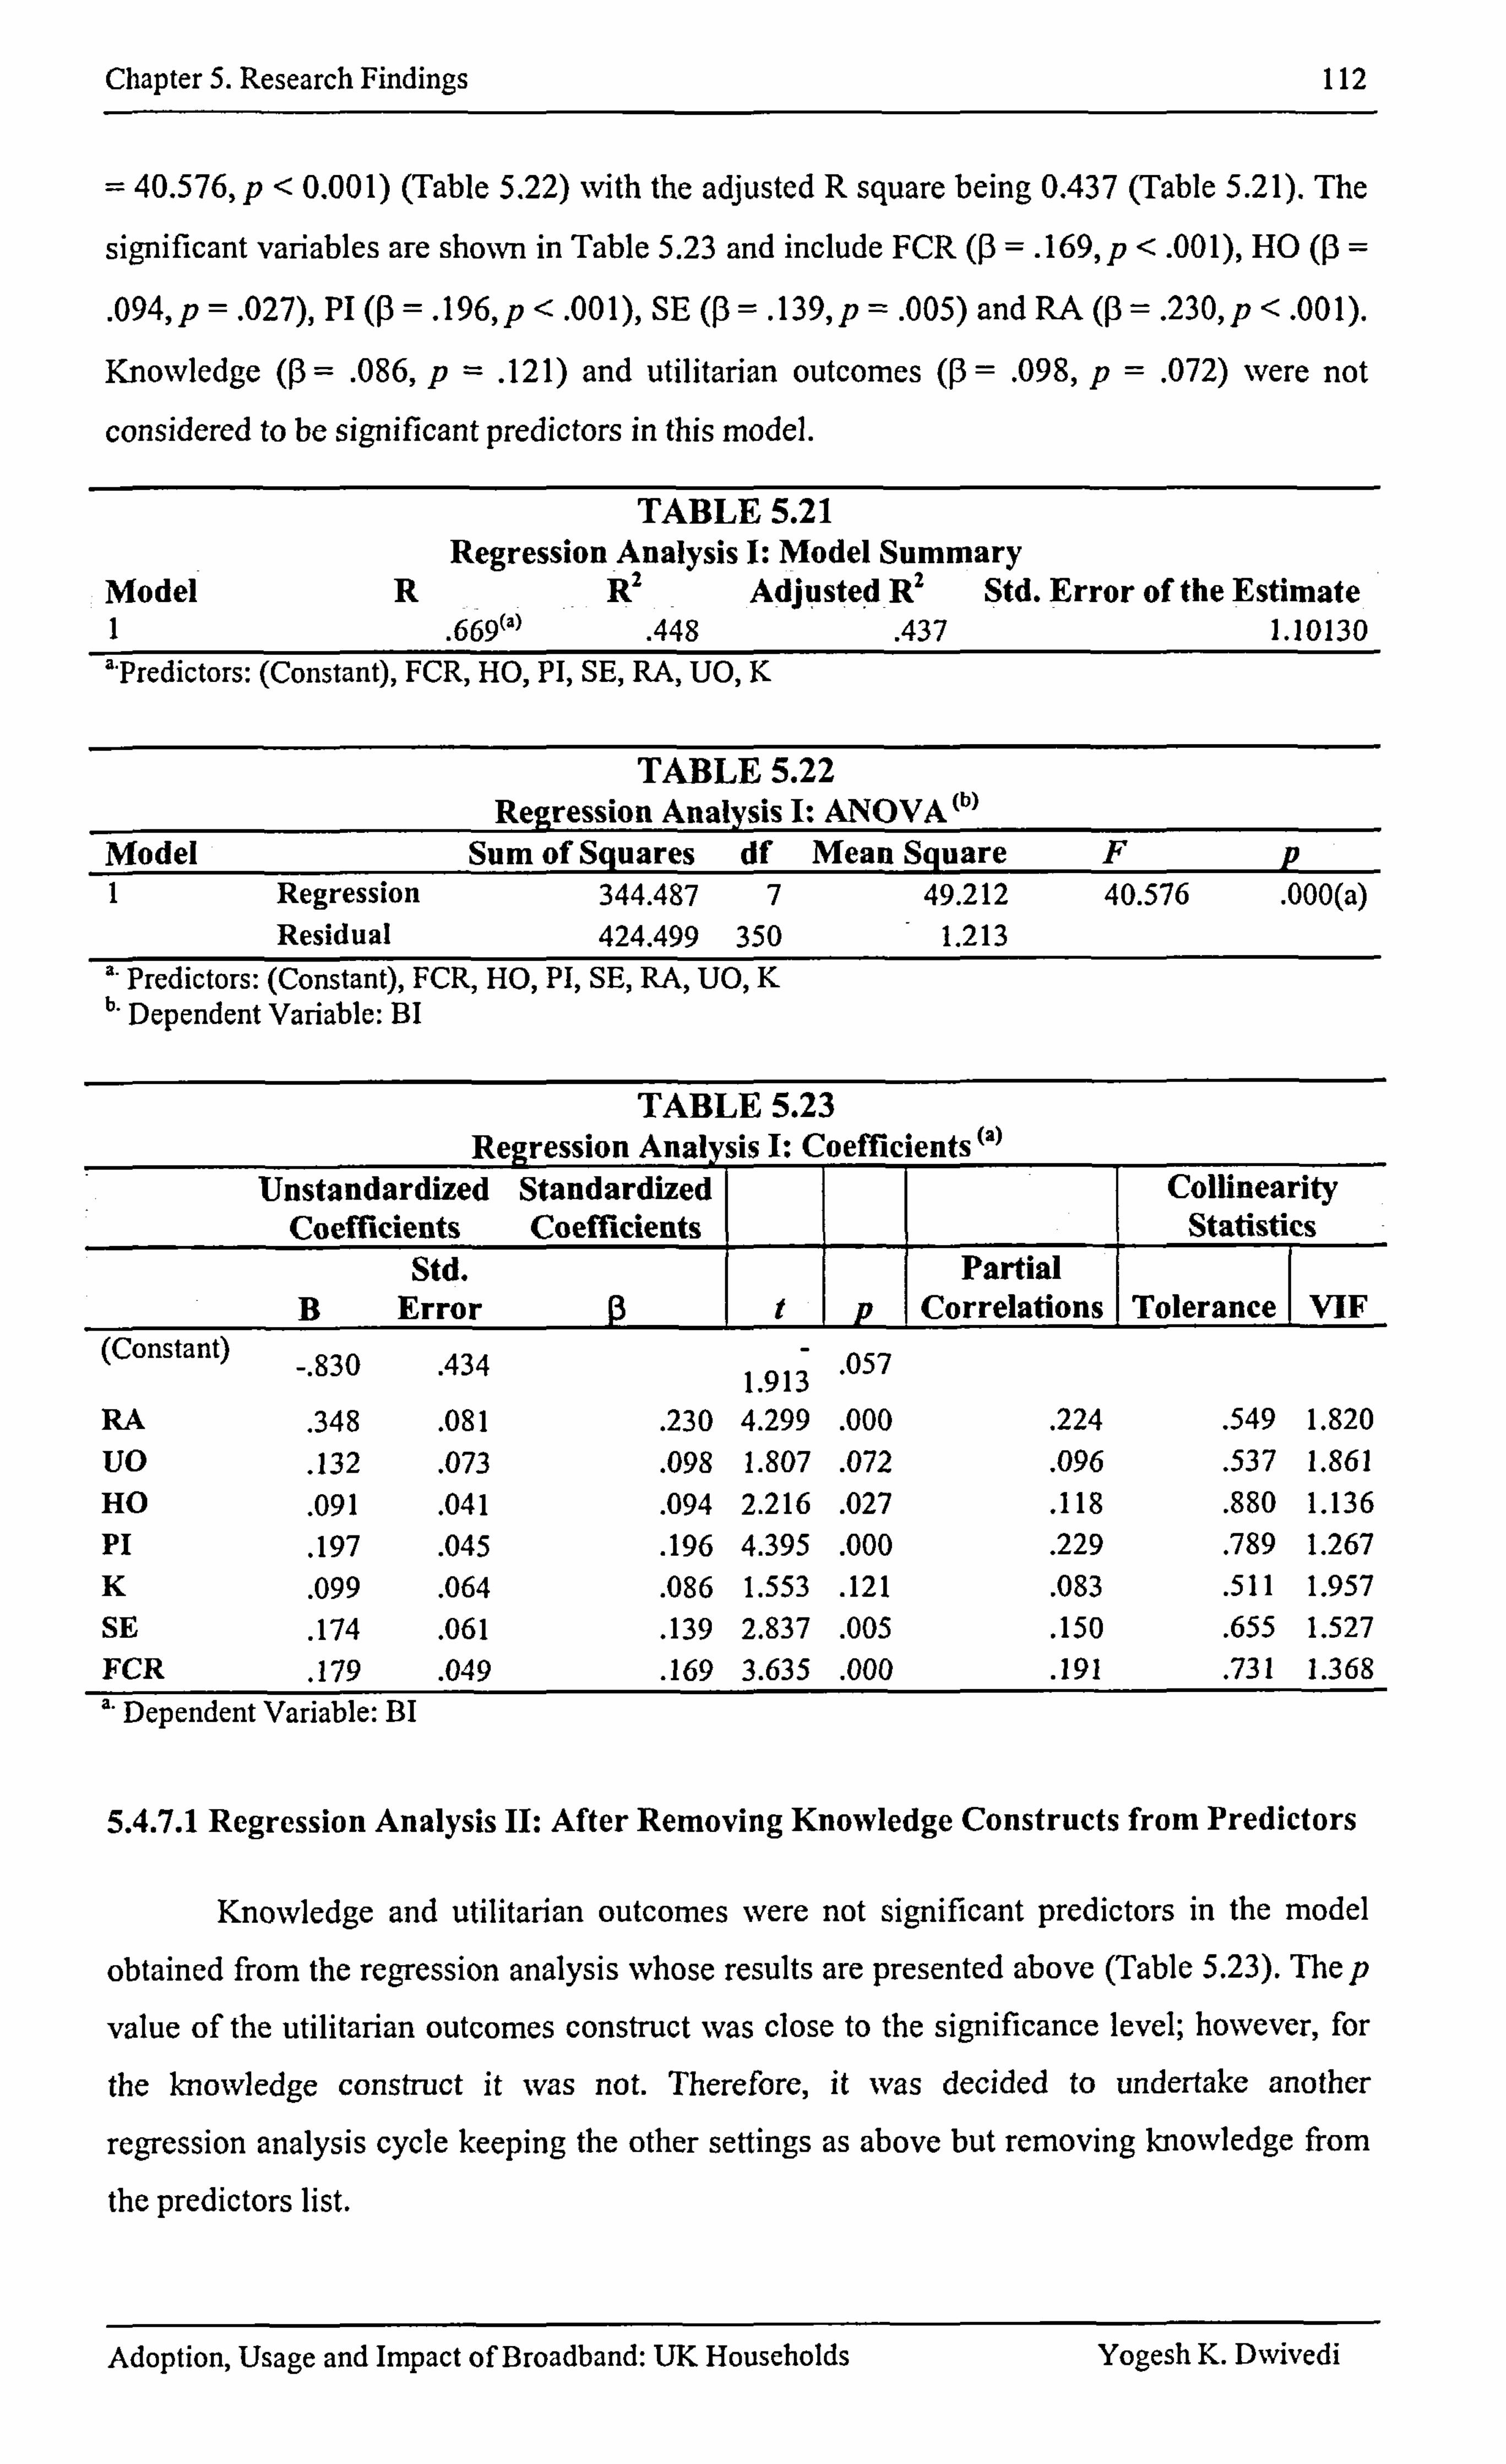
Chapter 5. Research Findings 112
= 40.576, p<0.00 1) (Table 5.22) with the adjusted R square being 0.43 7 (Table 5.2 1). The
significant variables are shown in Table 5.23 and include FCR (P =. 169, p< . 00 1), HO (P =
. 094, p= . 027), PI (P =. 196, p< . 00 1), SE (P = . 139, p= . 005) and RA (P . 230, p< . 00 1).
Knowledge (P = . 086, p= . 121) and utilitarian outcomes (P = . 098, p . 072) were not
considered to be significant predictors in this model.
TABLE 5.21 Regression Analysis 1: Model Summary
Model RR2 Adjusted R2 Std. Error of the Estimate I. 669(a) . 448 . 437 1.10130 '-Predictors: (Constant), FCR, HO, PI, SE, RA, UO, K
TABLE 5.22 Regression Analysis I- ANOVA (b)
Model Sum of Squares df Mean Square Fp I Regression 344.487 7 49.212 40.576 . 000(a)
Residual 424.499 350 1.213 '- Predictors: (Constant), FCR, HO, PI, SE, RA, UO, K b- Dependent Variable: BI
TABLE 5.23 Regression Analvsis I: Coefficients
Unstandardized Standardized Collinearity Coefficients Coefficients Statistics
Std. Partial I B Error p Correlations Tolerance VIF
(Constant) 830 . 434 . 057 . 1.
RA . 348 . 081 . 230 4.299 . 000 . 224 . 549 1.820
UO . 132 . 073 . 098 1.807 . 072 . 096 . 537 1.861
HO . 091 . 041 . 094 2.216 . 027 . 118 . 880 1.136 Pi . 197 . 045 . 196 4.395 . 000 . 229 . 789 1.267 K . 099 . 064 . 086 1.553 . 121 . 083 . 511 1.957 SE
. 174 . 061 . 139 2.837 . 005 . 150 . 655 1.527 FCR . 179 . 049 . 169 3.635 . 000 . 191 . 731 1.368 '- Dependent Variable: BI
5.4.7.1 Regression Analysis 11: After Removing Knowledge Constructs from Predictors
Knowledge and utilitarian outcomes were not significant predictors in the model
obtained from the regression analysis whose results are presented above (Table 5.23). Thep
value of the utilitarian outcomes construct was close to the significance level; however, for
the knowledge construct it was not. Therefore, it was decided to undertake another
regression analysis cycle keeping the other settings as above but removing knowledge from
the predictors list.
Adoption, Usage and Impact of Broadband: UK Households Yogesh K. Dwivedi
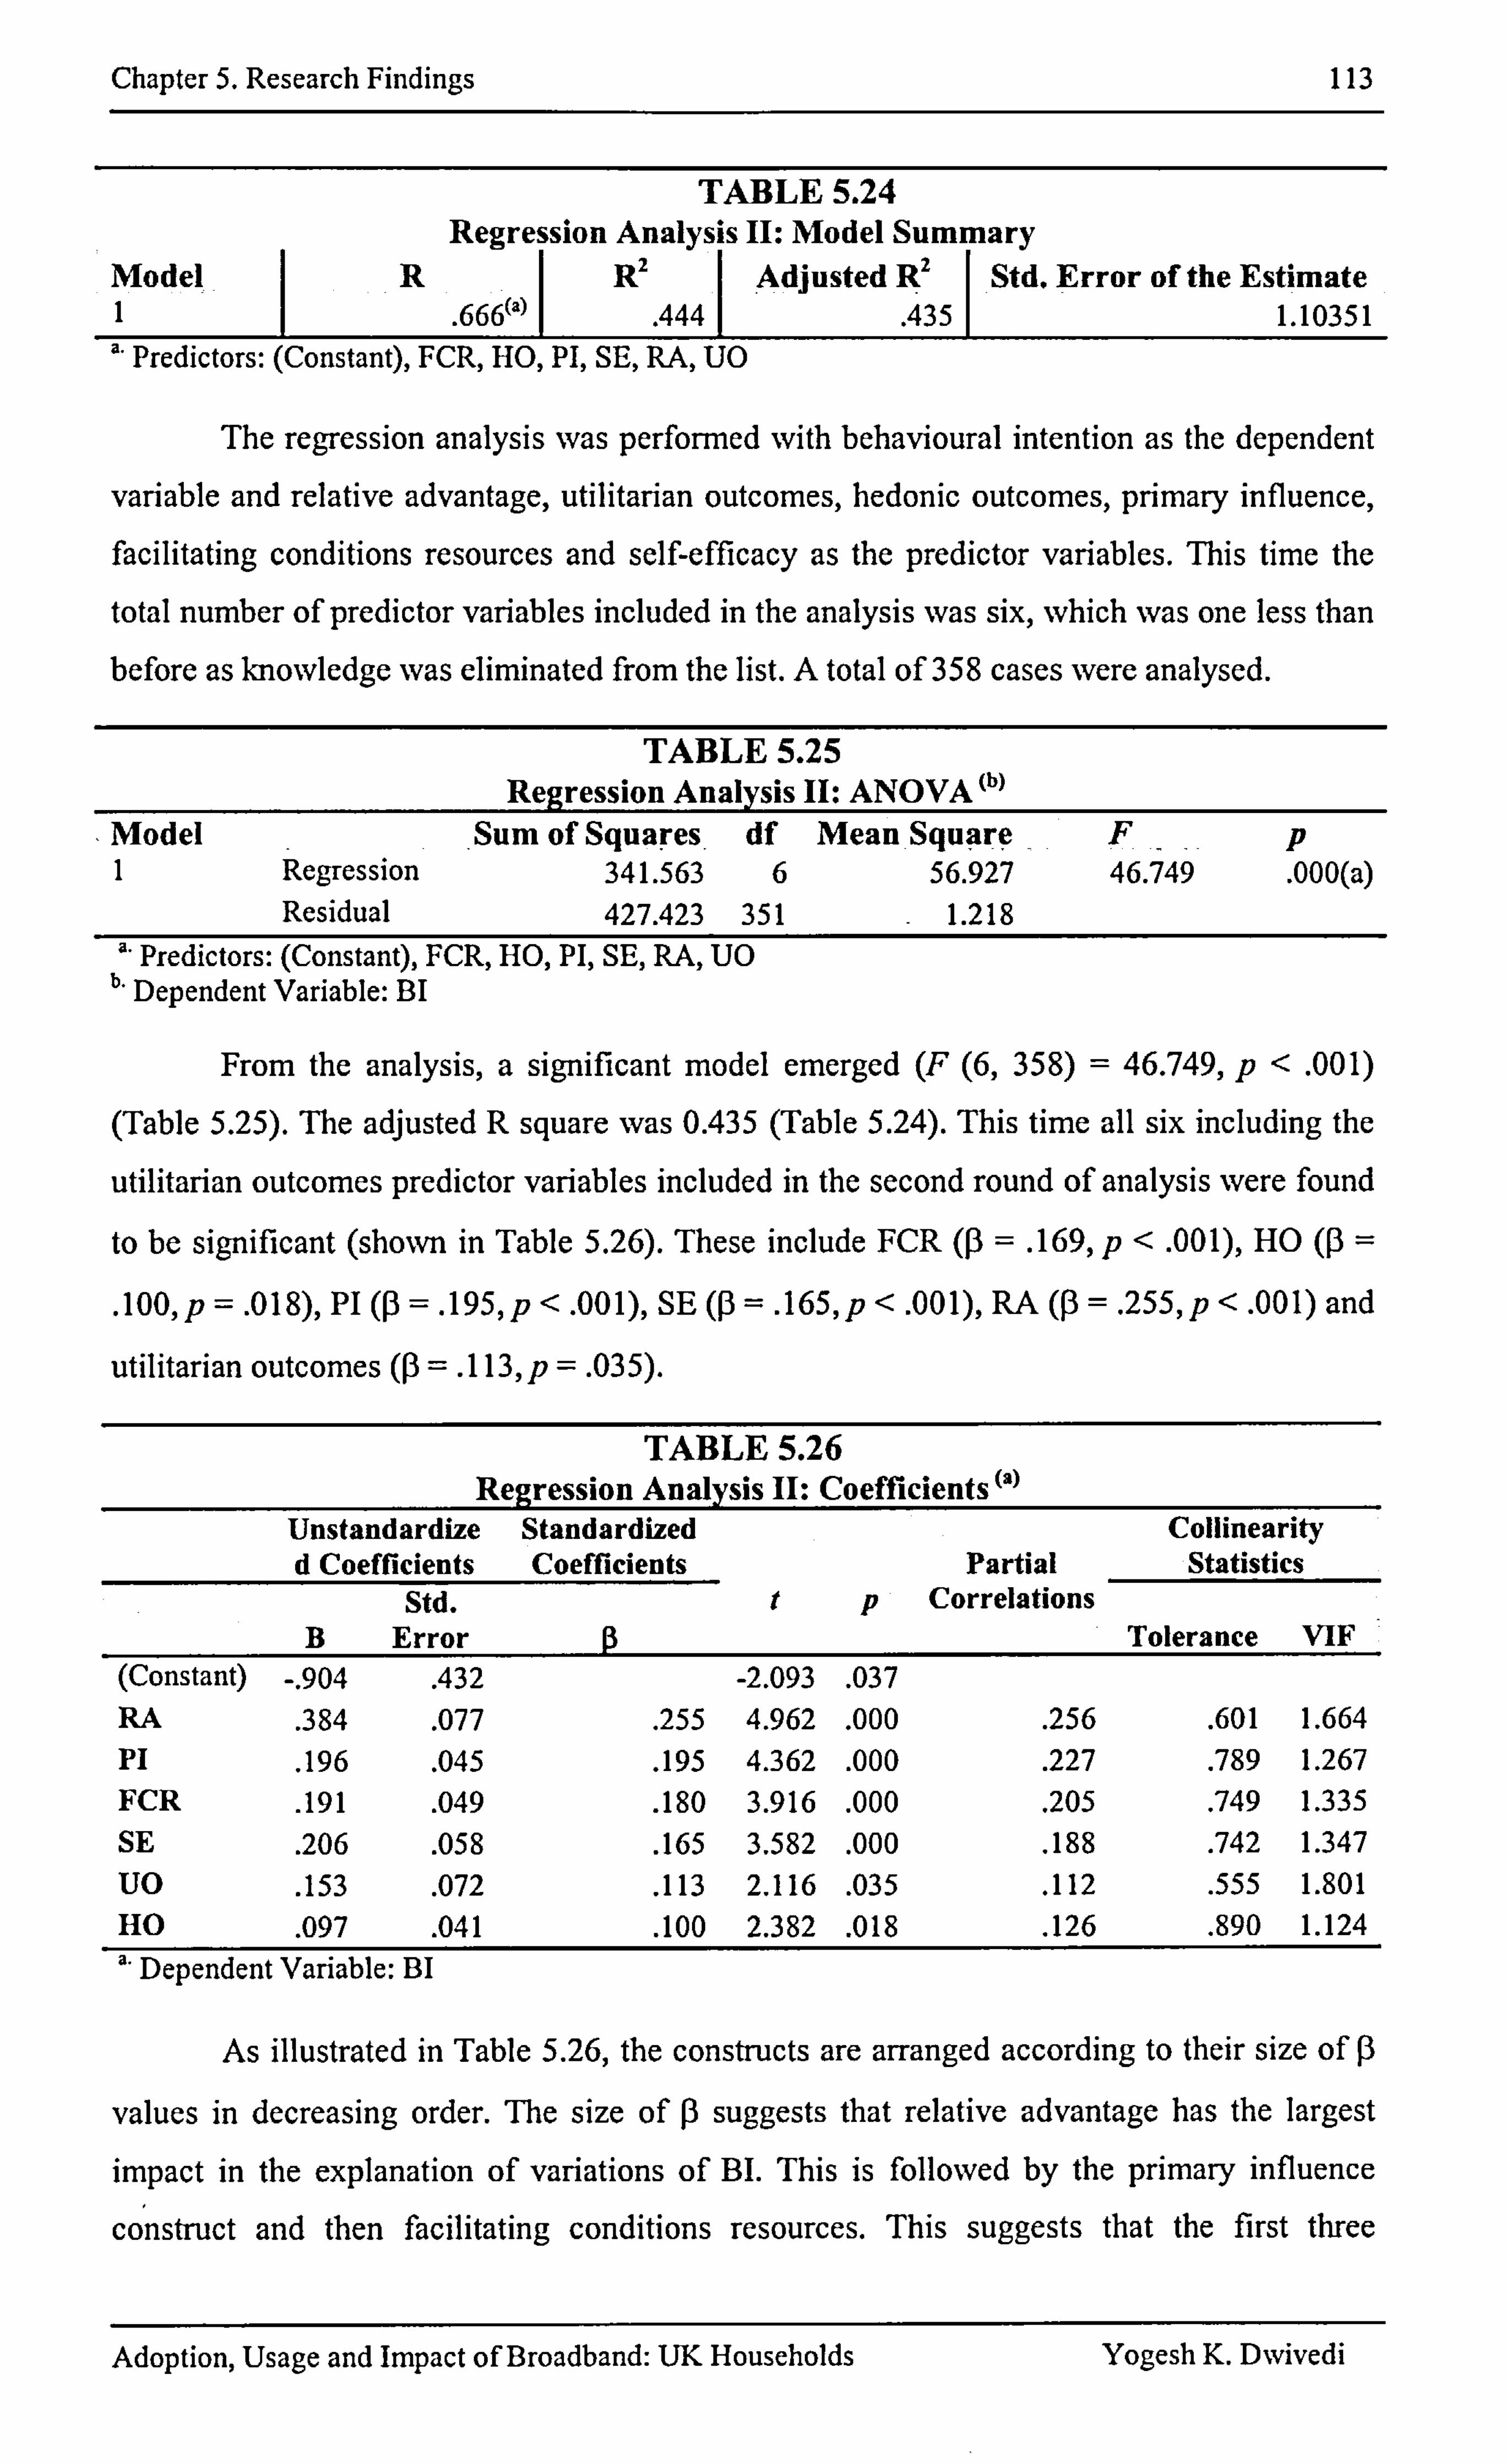
Chapter 5. Research Findings 113
TABLE 5.24 Regression Analysis 11: Model Sum ary
Model RR2.1 Adjusted 42 Std. Error of the Estimate 1 660)
1
444 . 435 1.10351 Predictors: (Constant), FCR, HO, PI, SE, RA, UO
The regression analysis was performed with behavioural intention as the dependent
variable and relative advantage, utilitarian outcomes, hedonic outcomes, primary influence,
facilitating conditions resources and self-efficacy as the predictor variables. This time the
total number of predictor variables included in the analysis was six, which was one less than
before as knowledge was eliminated from the list. A total of 358 cases were analysed.
TABLE 5.25 Regression Analysis 11: ANOVA (b)
Model Sum of Squares df Mean Square FP I Regression 341.563 6 56.927 46.749 . 000(a)
Residual 427.423 351 1.218 Predictors: (Constant), FCR, HO, PI, SE, RA, UO
b* Dependent Variable: BI
From the analysis, a significant model emerged (F (6,358) = 46.749, p< . 001)
(Fable 5.25). The adjusted R square was 0.435 (Table 5.24). This time all six including the
utilitarian outcomes predictor variables included in the second round of analysis were found
to be significant (shown in Table 5.26). These include FCR (P = . 169, p< . 001), HO (P =
. 100, p= . 018), PI (P =. 195, p< . 001), SE . 165, p < . 001), RA . 255, p< . 001) and
utilitarian outcomes (P = . 113, p= . 03 5).
Re TABLE 5.26
gression Analysis 11: Coefficients (a) Unstandardize Standardized Collinearity d Coefficients Coefficients Partial Statistics
Std. t p Correlations B Error Tolerance VIF
(Constant) -. 904 . 432 -2.093 . 037 RA . 384 . 077 . 255 4.962 . 000 . 256 . 601 1.664 Pi . 196 . 045 . 195 4.362 . 000 . 227 . 789 1.267 FCR . 191 . 049 . 180 3.916 . 000 . 205 . 749 1.335 SE . 206 . 058 . 165 3.582 . 000 . 188 . 742 1.347 UO . 153 . 072 . 113 2.116 . 035 . 112 . 555 1.801 HO . 097 . 041 . 100 2.382 . 018 . 126 . 890 1.124 " Dependent Variable: BI
As illustrated in Table 5.26, the constructs are arranged according to their size of P
values in decreasing order. The size of P suggests that relative advantage has the largest
impact in the explanation of variations of BI. This is followed by the primary influence
construct and then facilitating conditions resources. This suggests that the first three
Adoption, Usage and Impact of Broadband: UK Households Yogesh K. Dwivedi
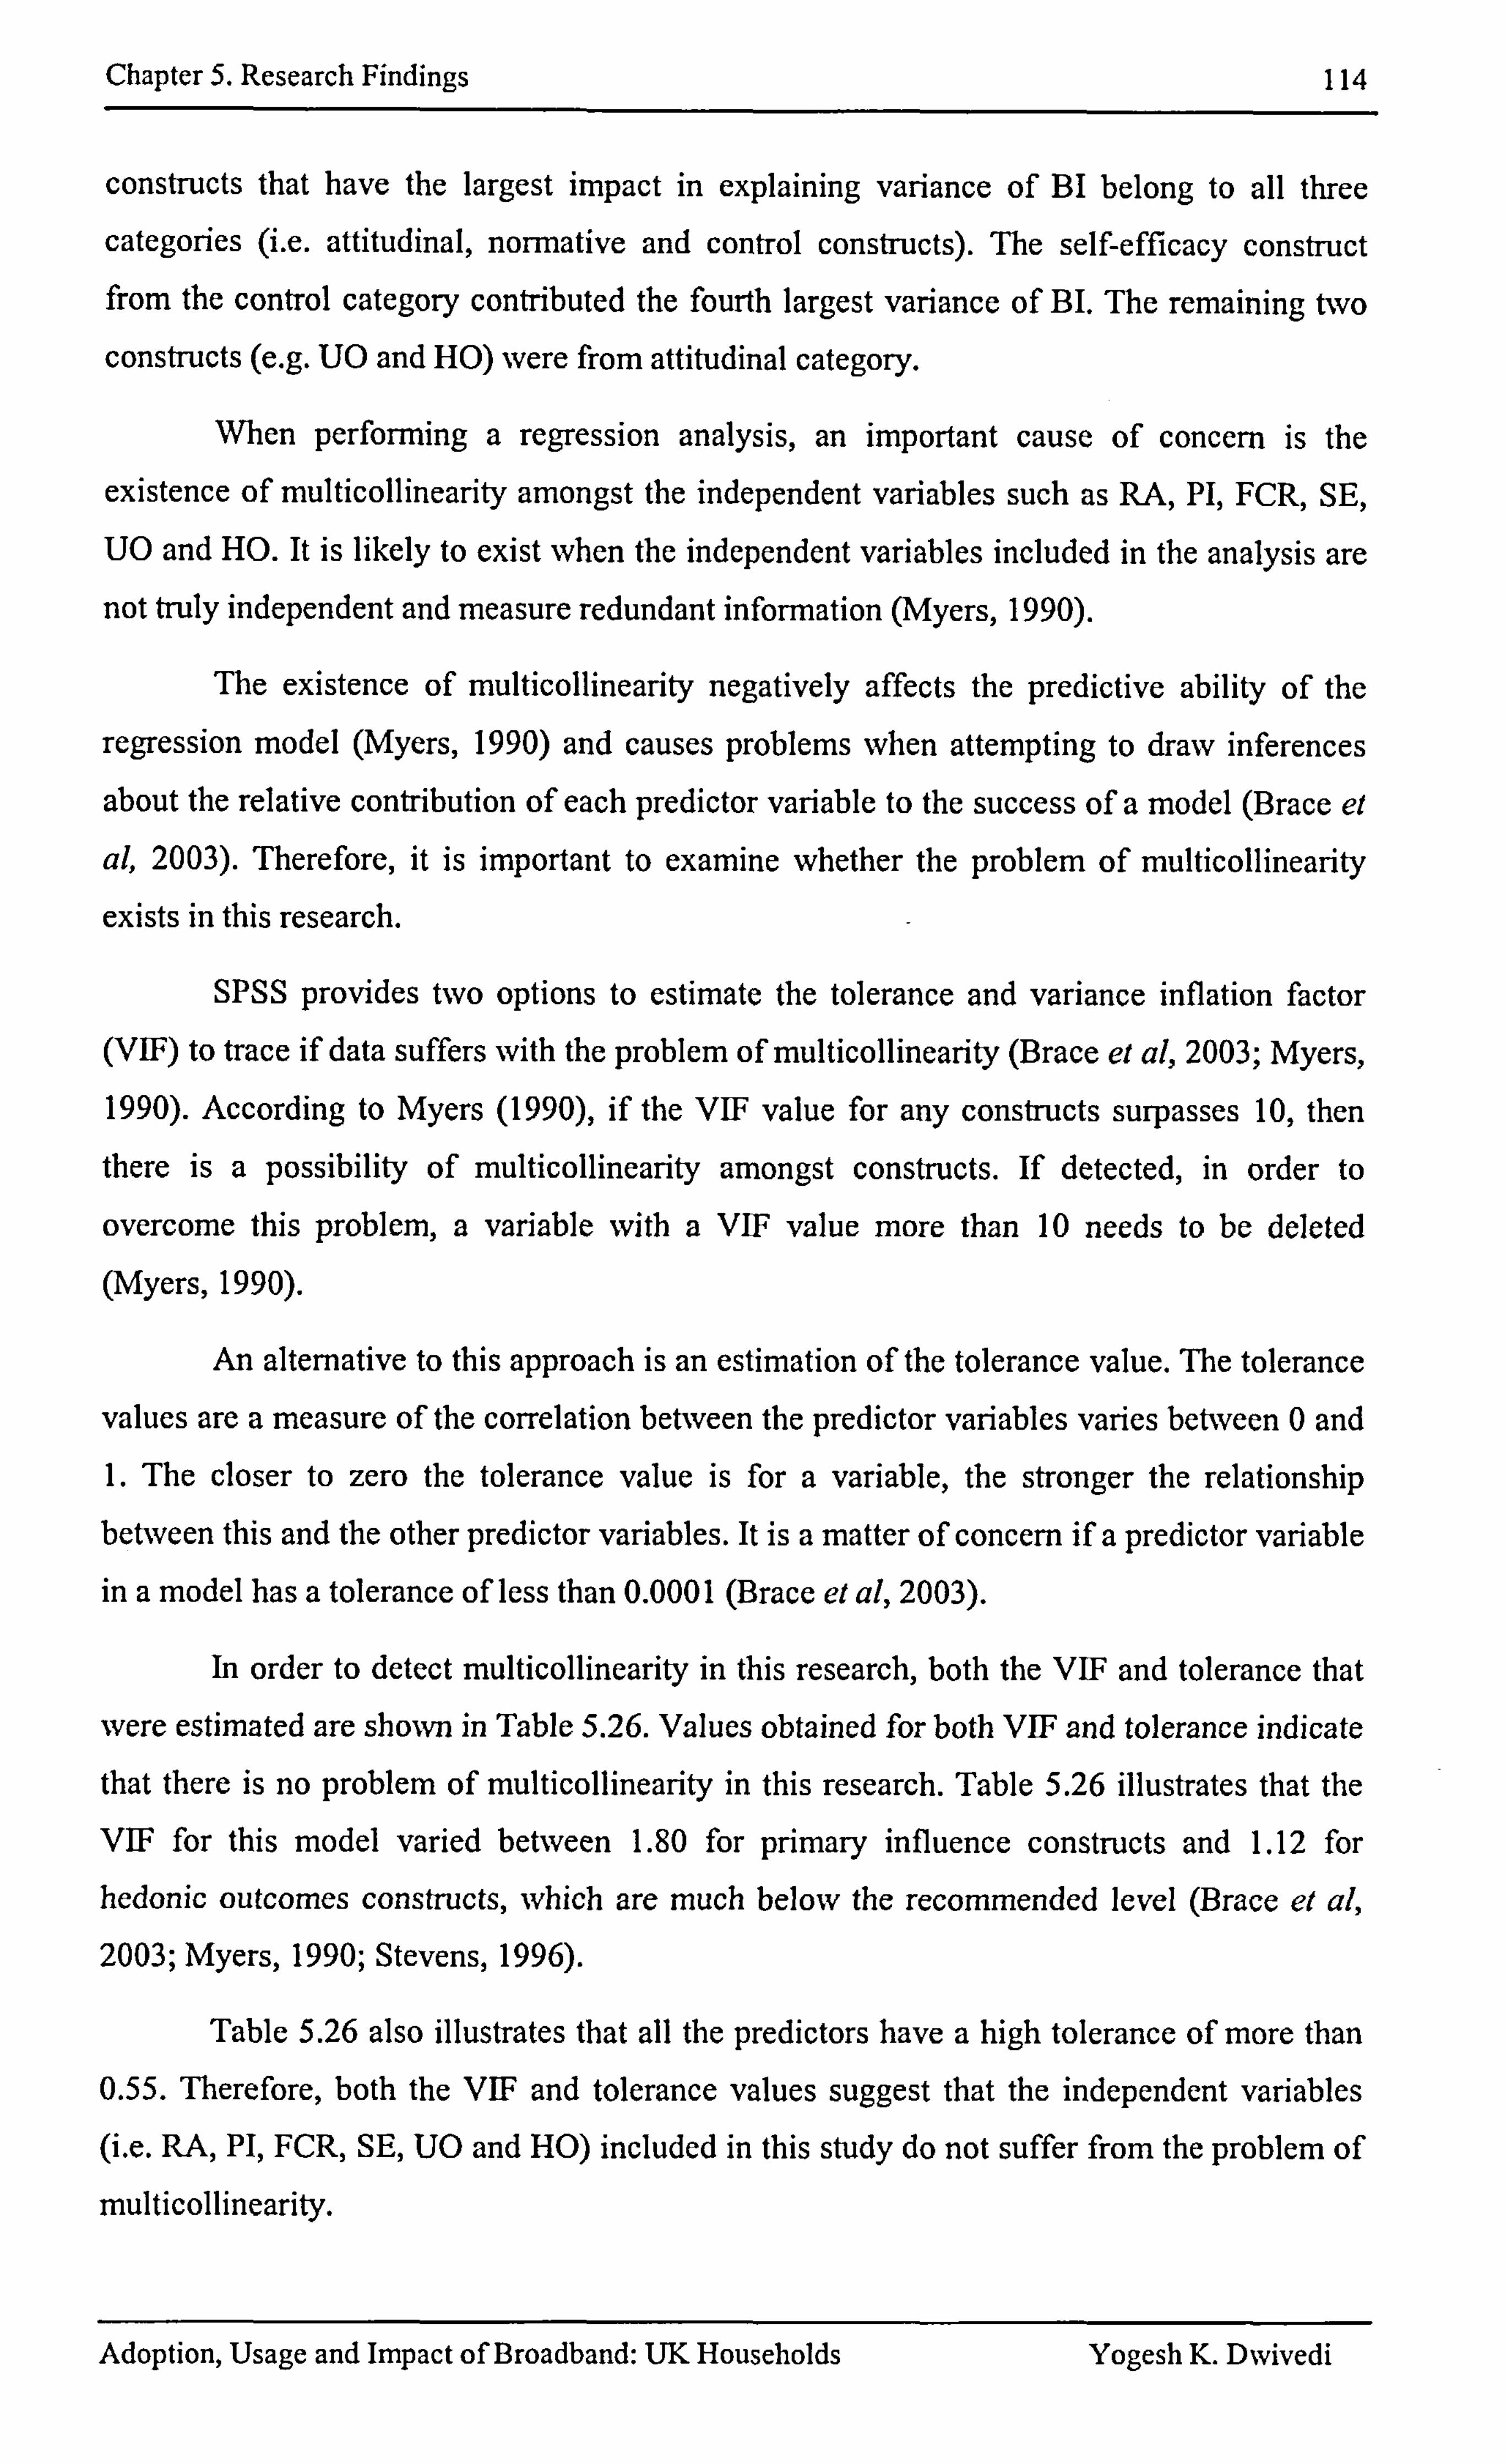
Chapter 5. Research Findings 114
constructs that have the largest impact in explaining variance of BI belong to all three
categories (i. e. attitudinal, normative and control constructs). The self-efficacy construct from the control category contributed the fourth largest variance of Bl. The remaining two
constructs (e. g. UO and HO) were from attitudinal category.
When performing a regression analysis, an important cause of concern is the
existence of multicollinearity amongst the independent variables such as RA, PI, FCR, SE, UO and HO. It is likely to exist when the independent variables included in the analysis are
not truly independent and measure redundant infon-nation (Myers, 1990).
The existence of multicollinearity negatively affects the predictive ability of the
regression model (Myers, 1990) and causes problems when attempting to draw inferences
about the relative contribution of each predictor variable to the success of a model (Brace el
al, 2003). Therefore, it is important to examine whether the problem of multicollinearity
exists in this research.
SPSS provides two options to estimate the tolerance and variance inflation factor
(VEF) to trace if data suffers with the problem of multicollinearity (Brace et al, 2003; Myers,
1990). According to Myers (1990), if the VIF value for any constructs surpasses 10, then
there is a possibility of multicollinearity amongst constructs. If detected, in order to
overcome this problem, a variable with a VIF value more than 10 needs to be deleted
(Myers, 1990).
An alternative to this approach is an estimation of the tolerance value. The tolerance
values are a measure of the correlation between the predictor variables varies between 0 and 1. The closer to zero the tolerance value is for a variable, the stronger the relationship between this and the other predictor variables. It is a matter of concern if a predictor variable in a model has a tolerance of less than 0.0001 (Brace et al, 2003).
In order to detect multicollinearity in this research, both the VEF and tolerance that
were estimated are shown in Table 5.26. Values obtained for both VEF and tolerance indicate
that there is no problem of multicollinearity in this research. Table 5.26 illustrates that the VEF for this model varied between 1.80 for primary influence constructs and 1.12 for
hedonic outcomes constructs, which are much below the recommended level (Brace et al, 2003; Myers, 1990; Stevens, 1996).
Table 5.26 also illustrates that all the predictors have a high tolerance of more than 0.55. Therefore, both the VIF and tolerance values suggest that the independent variables (i. e. RA, PI, FCR, SE, UO and HO) included in this study do not suffer from the problem of
multicollinearity.
Adoption, Usage and Impact of Broadband: UK Households Yogesh K. Dwivedi
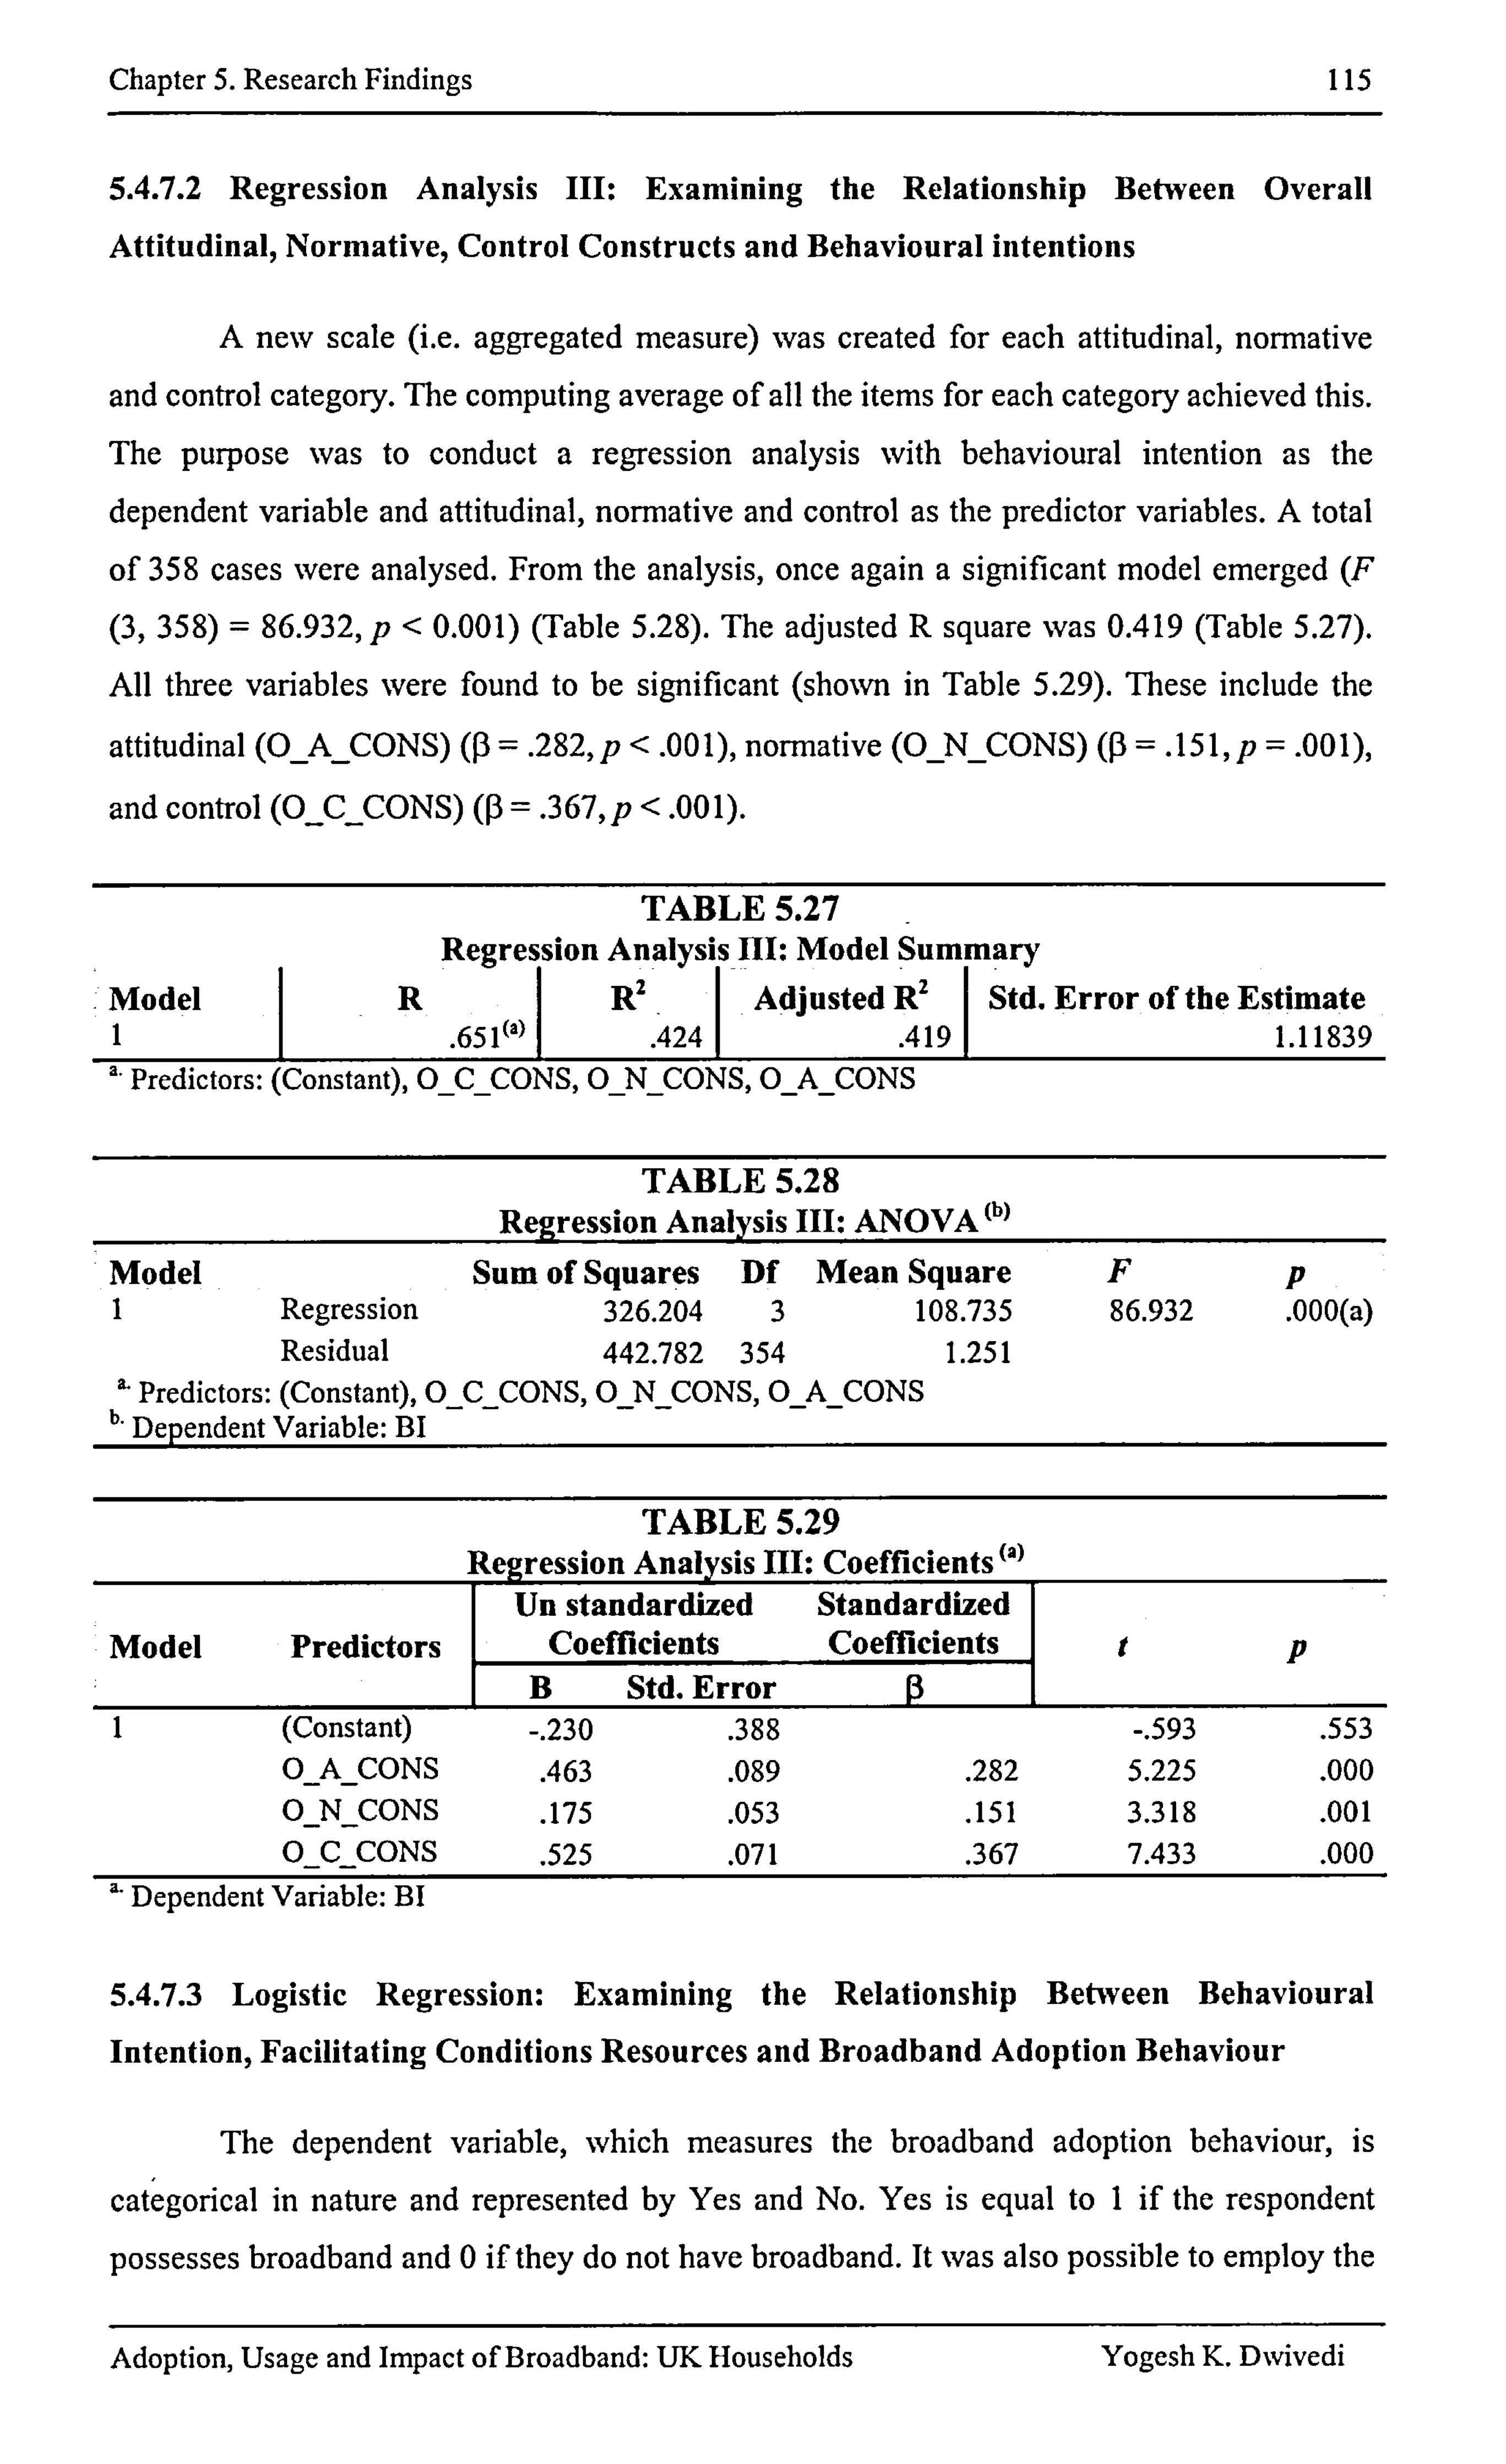
Chapter 5. Research Findings 115
5.4.7.2 Regression Analysis III: Examining the Relationship Between Overall
Attitudinal, Normative, Control Constructs and Behavioural intentions
A new scale (i. e. aggregated measure) was created for each attitudinal, non-native
and control category. The computing average of all the items for each category achieved this.
The purpose was to conduct a regression analysis with behavioural intention as the
dependent variable and attitudinal, normative and control as the predictor variables. A total
of 358 cases were analysed. From the analysis, once again a significant model emerged (F
(3,358) = 86.932, p<0.001) (Table 5.28). The adjusted R square was 0.419 (Table 5.27).
All three variables were found to be significant (shown in Table 5.29). These include the
attitudinal (Q_A, _CONS)
(P =. 282, p <. 001), normative (Q_ý_CONS) (P =. 15 1, p =. 001),
and control (O_Cý_CONS) (P = .3 67, p< . 00 1).
Model I
TABLE 5.27 Regression Analysis HI: Model Summary
RI R2 -I
Adjusted R21 Std. Error of the Estimate 1 . 65 1 "' 1 . 424 1 . 4191 1.11839
Predictors: (Constant), Q_Cý_CONS, O-N_CONS, O_A_CONS
TABLE 5.28 Regression Analysis III: ANOVA (b)
Model Sum of Squam Df Mean Square Fp I Regression 326.204 3 108.735 86.932 . 000(a)
Residual 442.782 354 1.251
b' Predictors: (Constant), Q_C_CONS, O-N_CONS, O_A_CONS
* Dependent Variable: BI
TABLE 5.29 egression Analysis III: Coefficients (a)
Un standardized Standardized Model Predictors Coefficients Coefficients p
B Std. Error I (Constant) -. 230 . 388 -. 593 . 553
O-A_CONS . 463 . 089 . 282 5.225 . 000 O-N_CONS . 175 . 053 . 151 3.318 . 001 0C CONS . 525 . 071 . 367 7.433 . 000
" Dependent Variable: BI
5.4.7.3 Logistic Regression: Examining the Relationship Between Behavioural
Intention, Facilitating Conditions Resources and Broadband Adoption Behaviour
The dependent variable, which measures the broadband adoption behaviour, is
categorical in nature and represented by Yes and No. Yes is equal to I if the respondent
possesses broadband and 0 if they do not have broadband. It was also possible to employ the
Adoption, Usage and Impact of Broadband: UK Households Yogcsh K. Dwivcdi
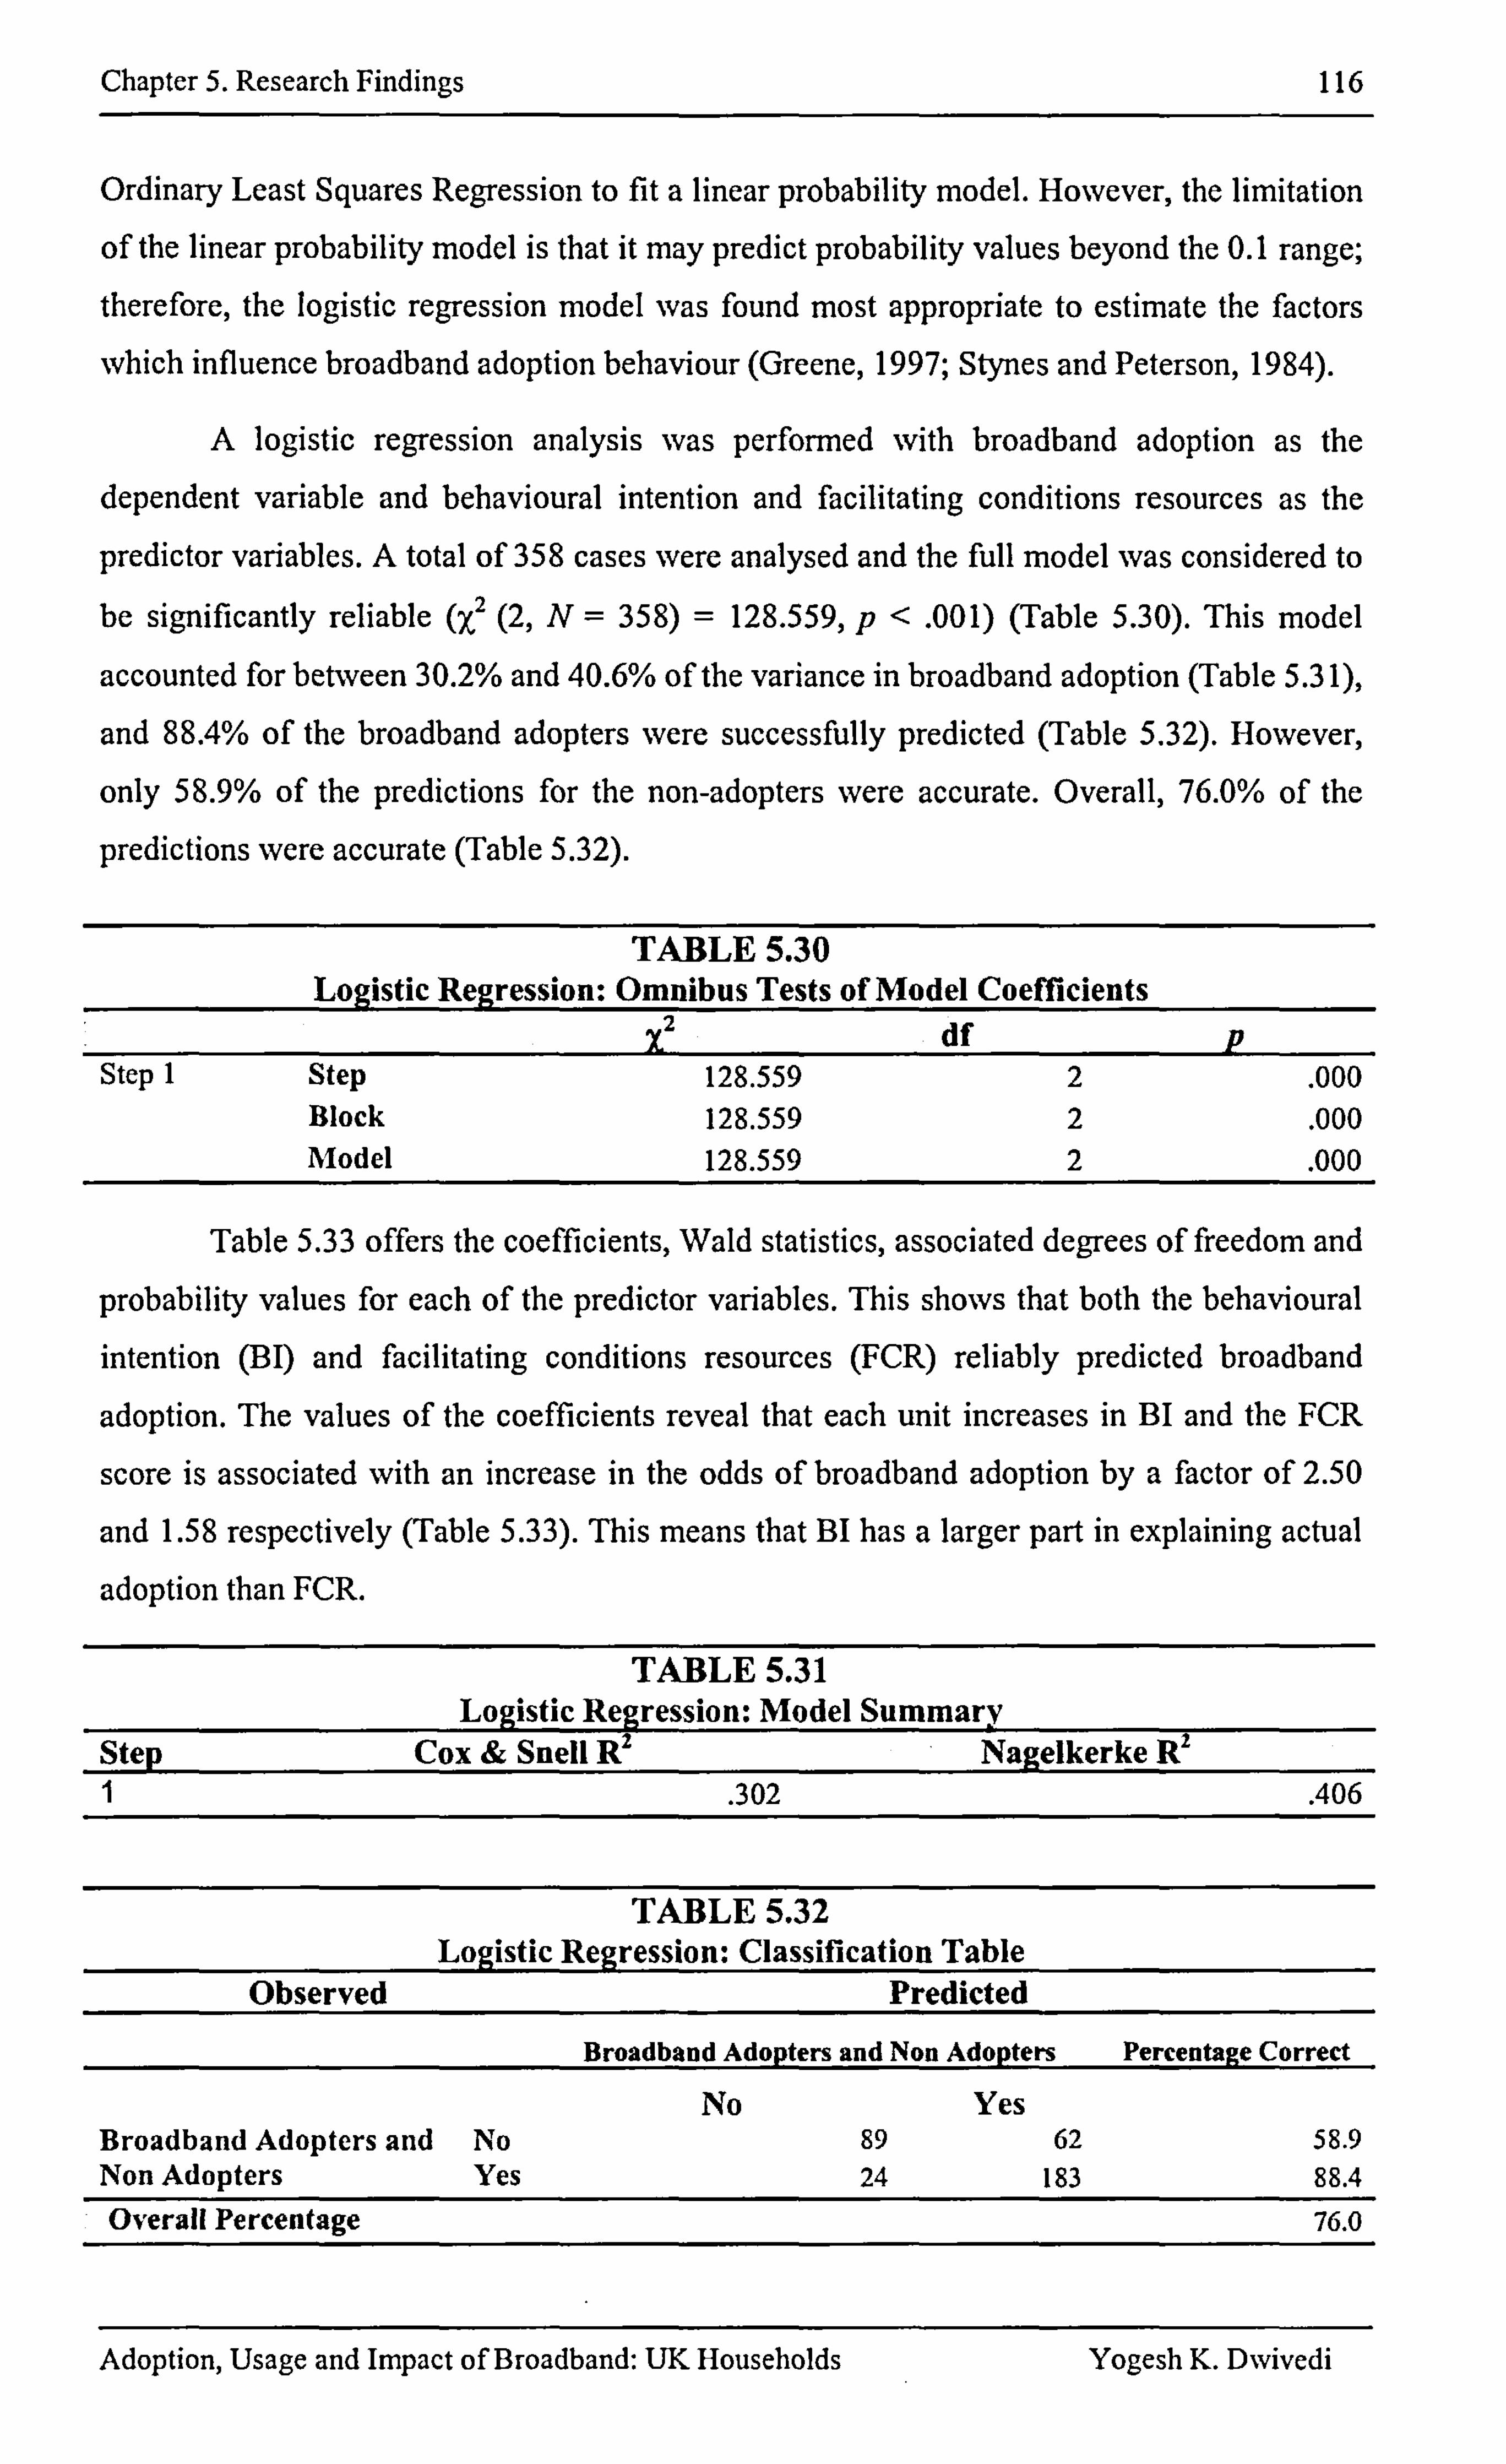
Chapter 5. Research Findings 116
Ordinary Least Squares Regression to fit a linear probability model. However, the limitation
of the linear probability model is that it may predict probability values beyond the 0.1 range; therefore, the logistic regression model was found most appropriate to estimate the factors
which influence broadband adoption behaviour (Greene, 1997; Stynes and Peterson, 1984).
A logistic regression analysis was performed with broadband adoption as the dependent variable and bebavioural intention and facilitating conditions resources as the
predictor variables. A total of 358 cases were analysed and the full model was considered to
be significantly reliable (X2 (2, N= 358) = 128.559, p< . 001) (Table 5.30). This model
accounted for between 30.2% and 40.6% of the variance in broadband adoption (Table 5.3 1),
and 88.4% of the broadband adopters were successfully predicted (Table 5.32). However,
only 58.9% of the predictions for the non-adopters were accurate. Overall, 76.0% of the
predictions were accurate (Table 5.32).
TABLE 5.30 Logistic Regression: Omnibus Tests of Model Coefficients
df Step I Step 128.559 2 . 000
Block 128.559 2 . 000 Model 128.559 2 . 000
Table 5.33 offers the coefficients, Wald statistics, associated degrees of freedom and
probability values for each of the predictor variables. This shows that both the bebavioural
intention (BI) and facilitating conditions resources (FCR) reliably predicted broadband
adoption. The values of the coefficients reveal that each unit increases in BI and the FCR
score is associated with an increase in the odds of broadband adoption by a factor of 2.50
and 1.58 respectively (Table 5.33). This means that BI has a larger part in explaining actual
adoption than FCR.
TABLE 5.31 Logistic Regression: Model Summary
Step Cox & Snell W Nagelkerke Rl 1 . 302 . 406
TABLE 5.32 Logistic Regression: Classiflcation Table
Observed Predicted
Broadband Adopters and Non Adopters Percentage Correct
No Yes Broadband Adopters and No 89 62 58.9 Non Adopters Yes 24 183 88.4 Overall Percentage 76.0
Adoption, Usage and Impact of Broadband: UK Households Yogesh K. Dwivedi
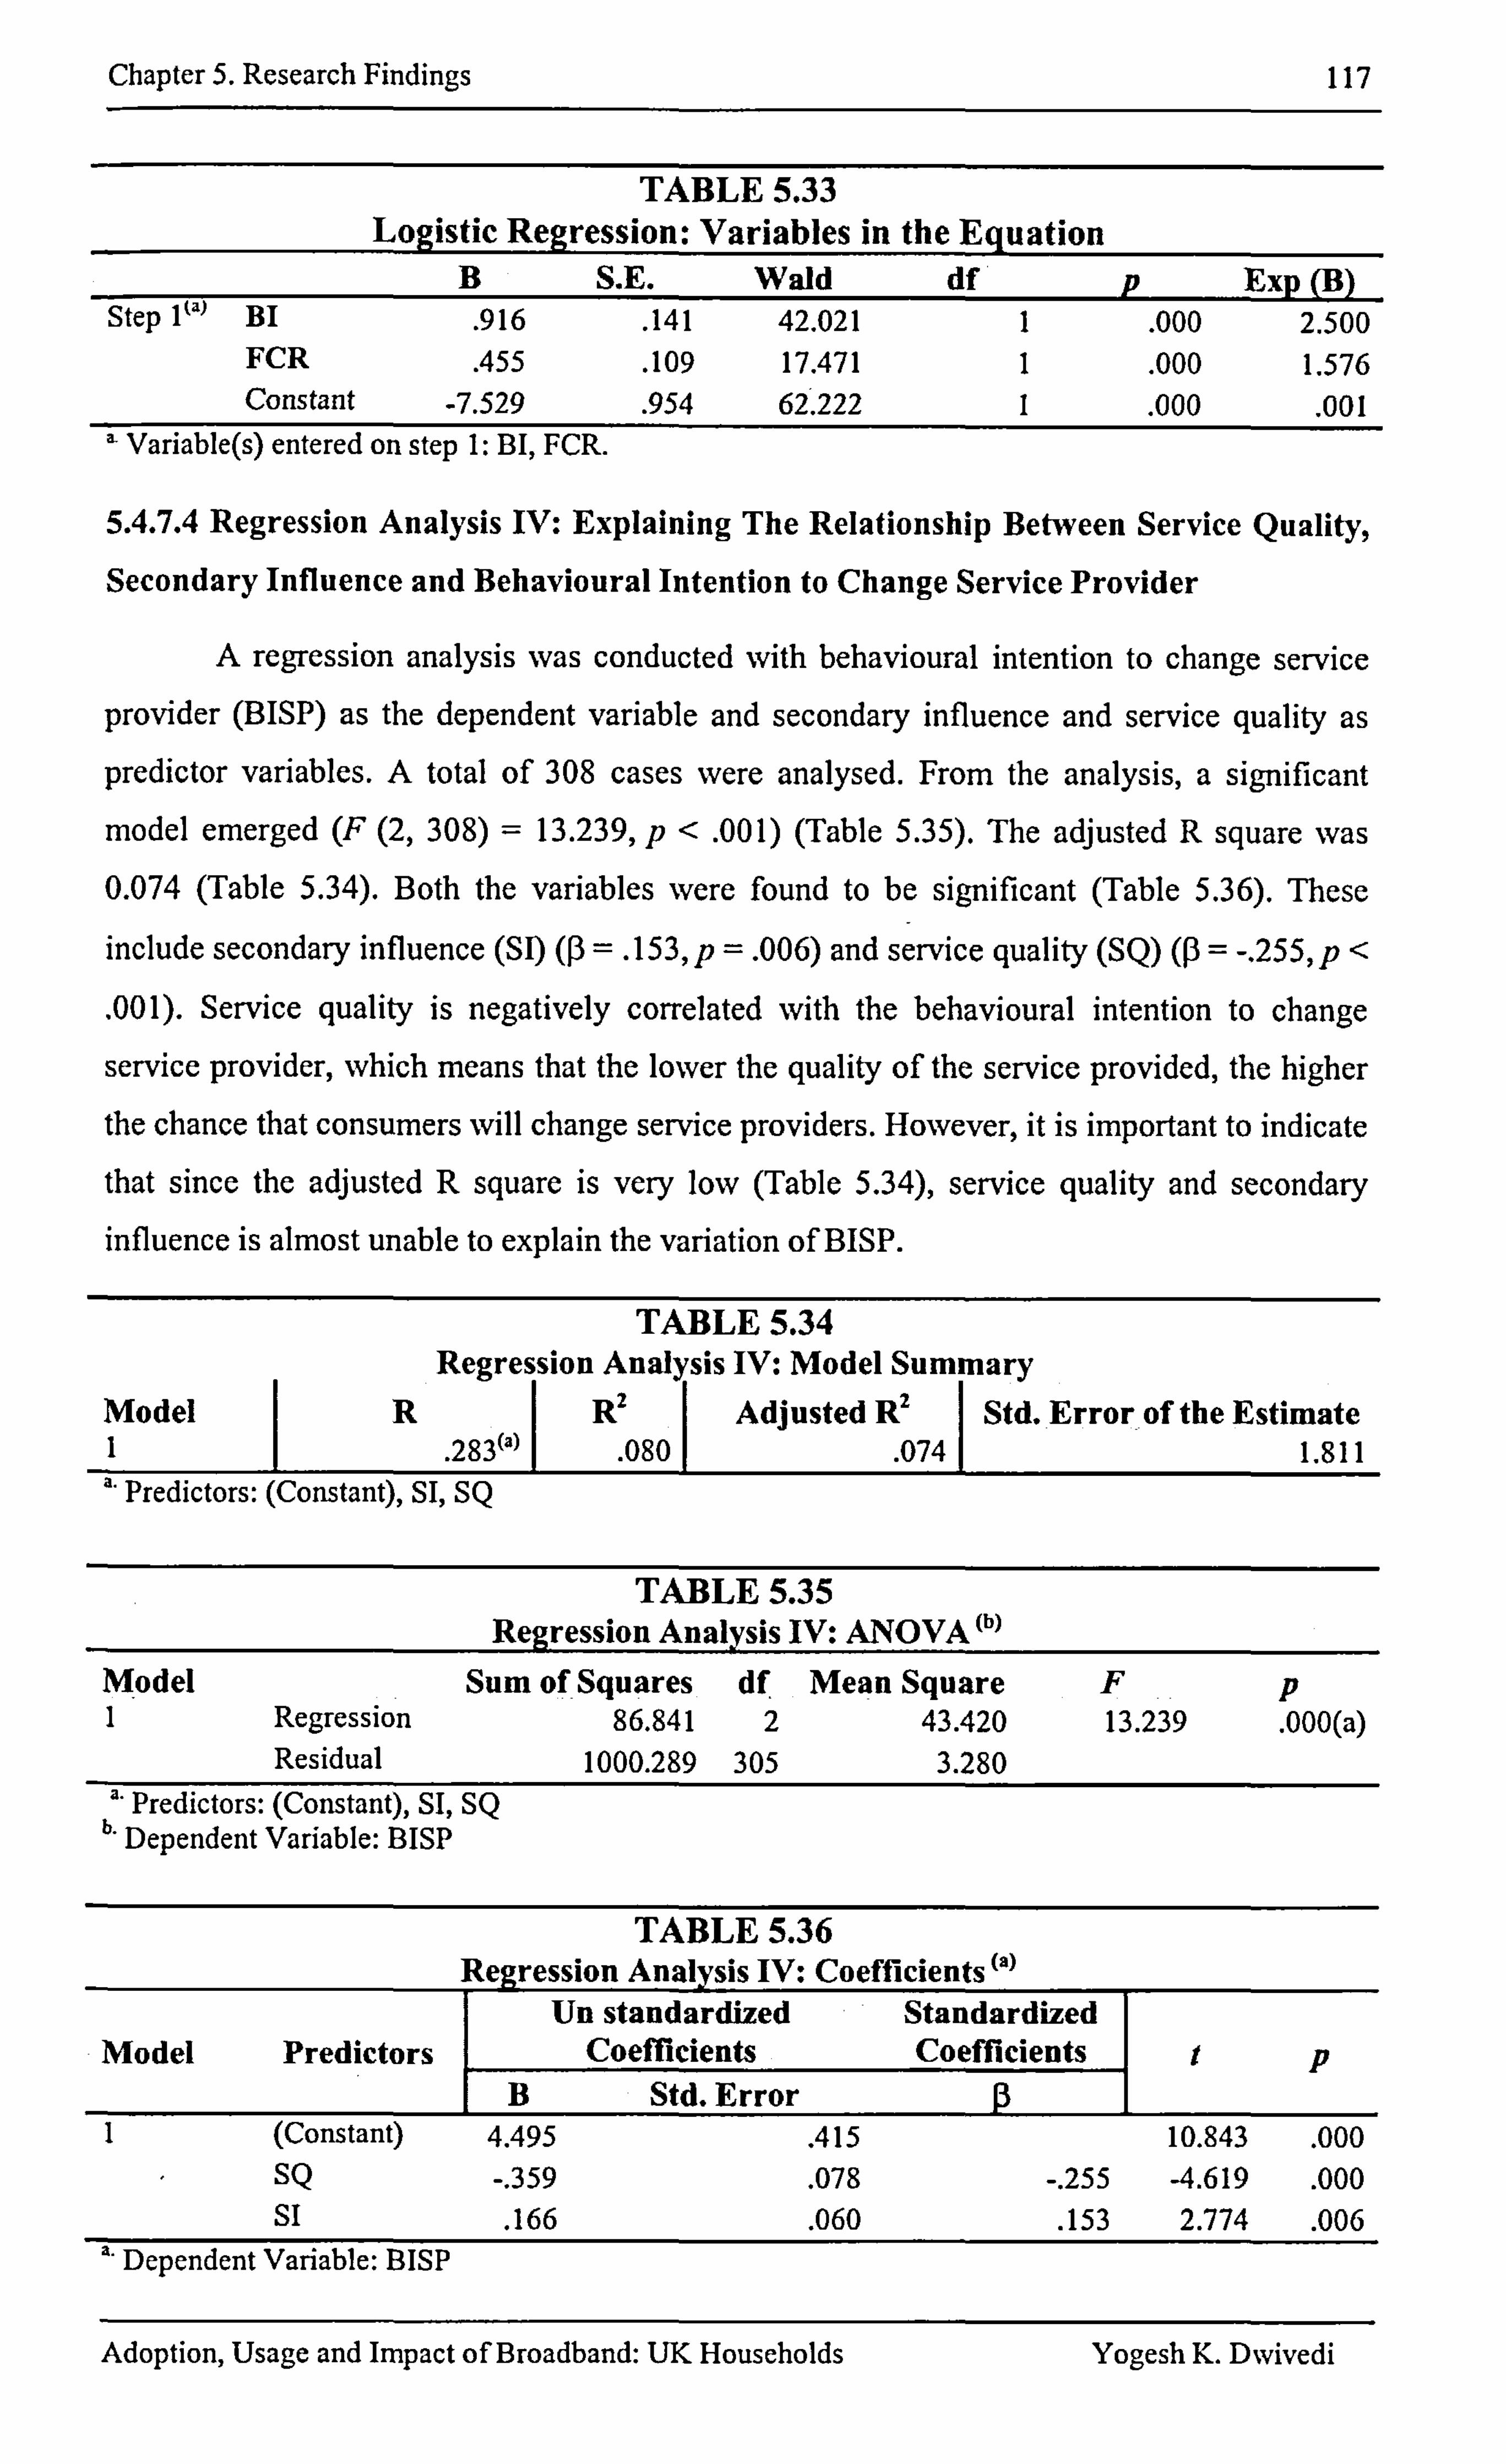
Chapter 5. Research Findings 117
TABLE 5.33 Logistic Regression: Variables in the Equation
B S. E. WEdd df P Exp (B) Step I (a) BI . 916 . 141 42.021 1 . 000 2.500
FCR . 455 . 109 17.471 1 . 000 1.576 Constant -7.529 . 954 62.222 1 . 000 . 001
' Variable(s) entered on step 1: BI, FCR.
5.4.7.4 Regression Analysis IV: Explaining The Relationship Between Service Quality,
Secondary Influence and Behavioural Intention to Change Service Provider
A regression analysis was conducted with behavioural intention to change service
provider (BISP) as the dependent variable and secondary influence and service quality as
predictor variables. A total of 308 cases were analysed. From the analysis, a significant
model emerged (F (2,308) = 13.239, p< . 001) (Table 5.35). The adjusted R square was 0.074 (Table 5.34). Both the variables were found to be significant (Table 5.36). These
include secondary influence (SI) (P =. 153, p =. 006) and service quality (SQ) (P = -. 255, p <
. 001). Service quality is negatively correlated with the behavioural intention to change
service provider, which means that the lower the quality of the service provided, the higher
the chance that consumers will change service providers. However, it is important to indicate
that since the adjusted R square is very low (Table 5.34), service quality and secondary influence is almost unable to explain the variation of BISP.
TABLE 5.34 Regression Analysis IV: Model Summary
Model R R2 Adjusted R2 Std. Error of the Estimate I. 283(a)
1
. 0801 . 0741 1.811 " Predictors: (Constant), SI, SQ
TABLE 5.35 Regression Analysis IV: ANOVA (b)
M- odel Sum of Squares df. Mean Square Fp I Regression 86.841 2 43.420 13.239 . 000(a)
Residual 1000.289 305 3.280
b" Predictors: (Constant), SI, SQ
* Dependent Variable: BISP
TABLE 5.36 egression Analysis IV: Coefficients
Un standardized Standardized Model Predictors Coefficients Coefficients p
B Std. Error 1 (Constant) 4.495 . 415 10.843 . 000
SQ -. 359 . 078 -. 255 4.619 . 000 SI
. 166 . 060 . 153 2.774 . 006 " Dependent Variable: BISP
Adoption, Usage and Impact of Broadband: UK Households Yogesh K. Dwivedi
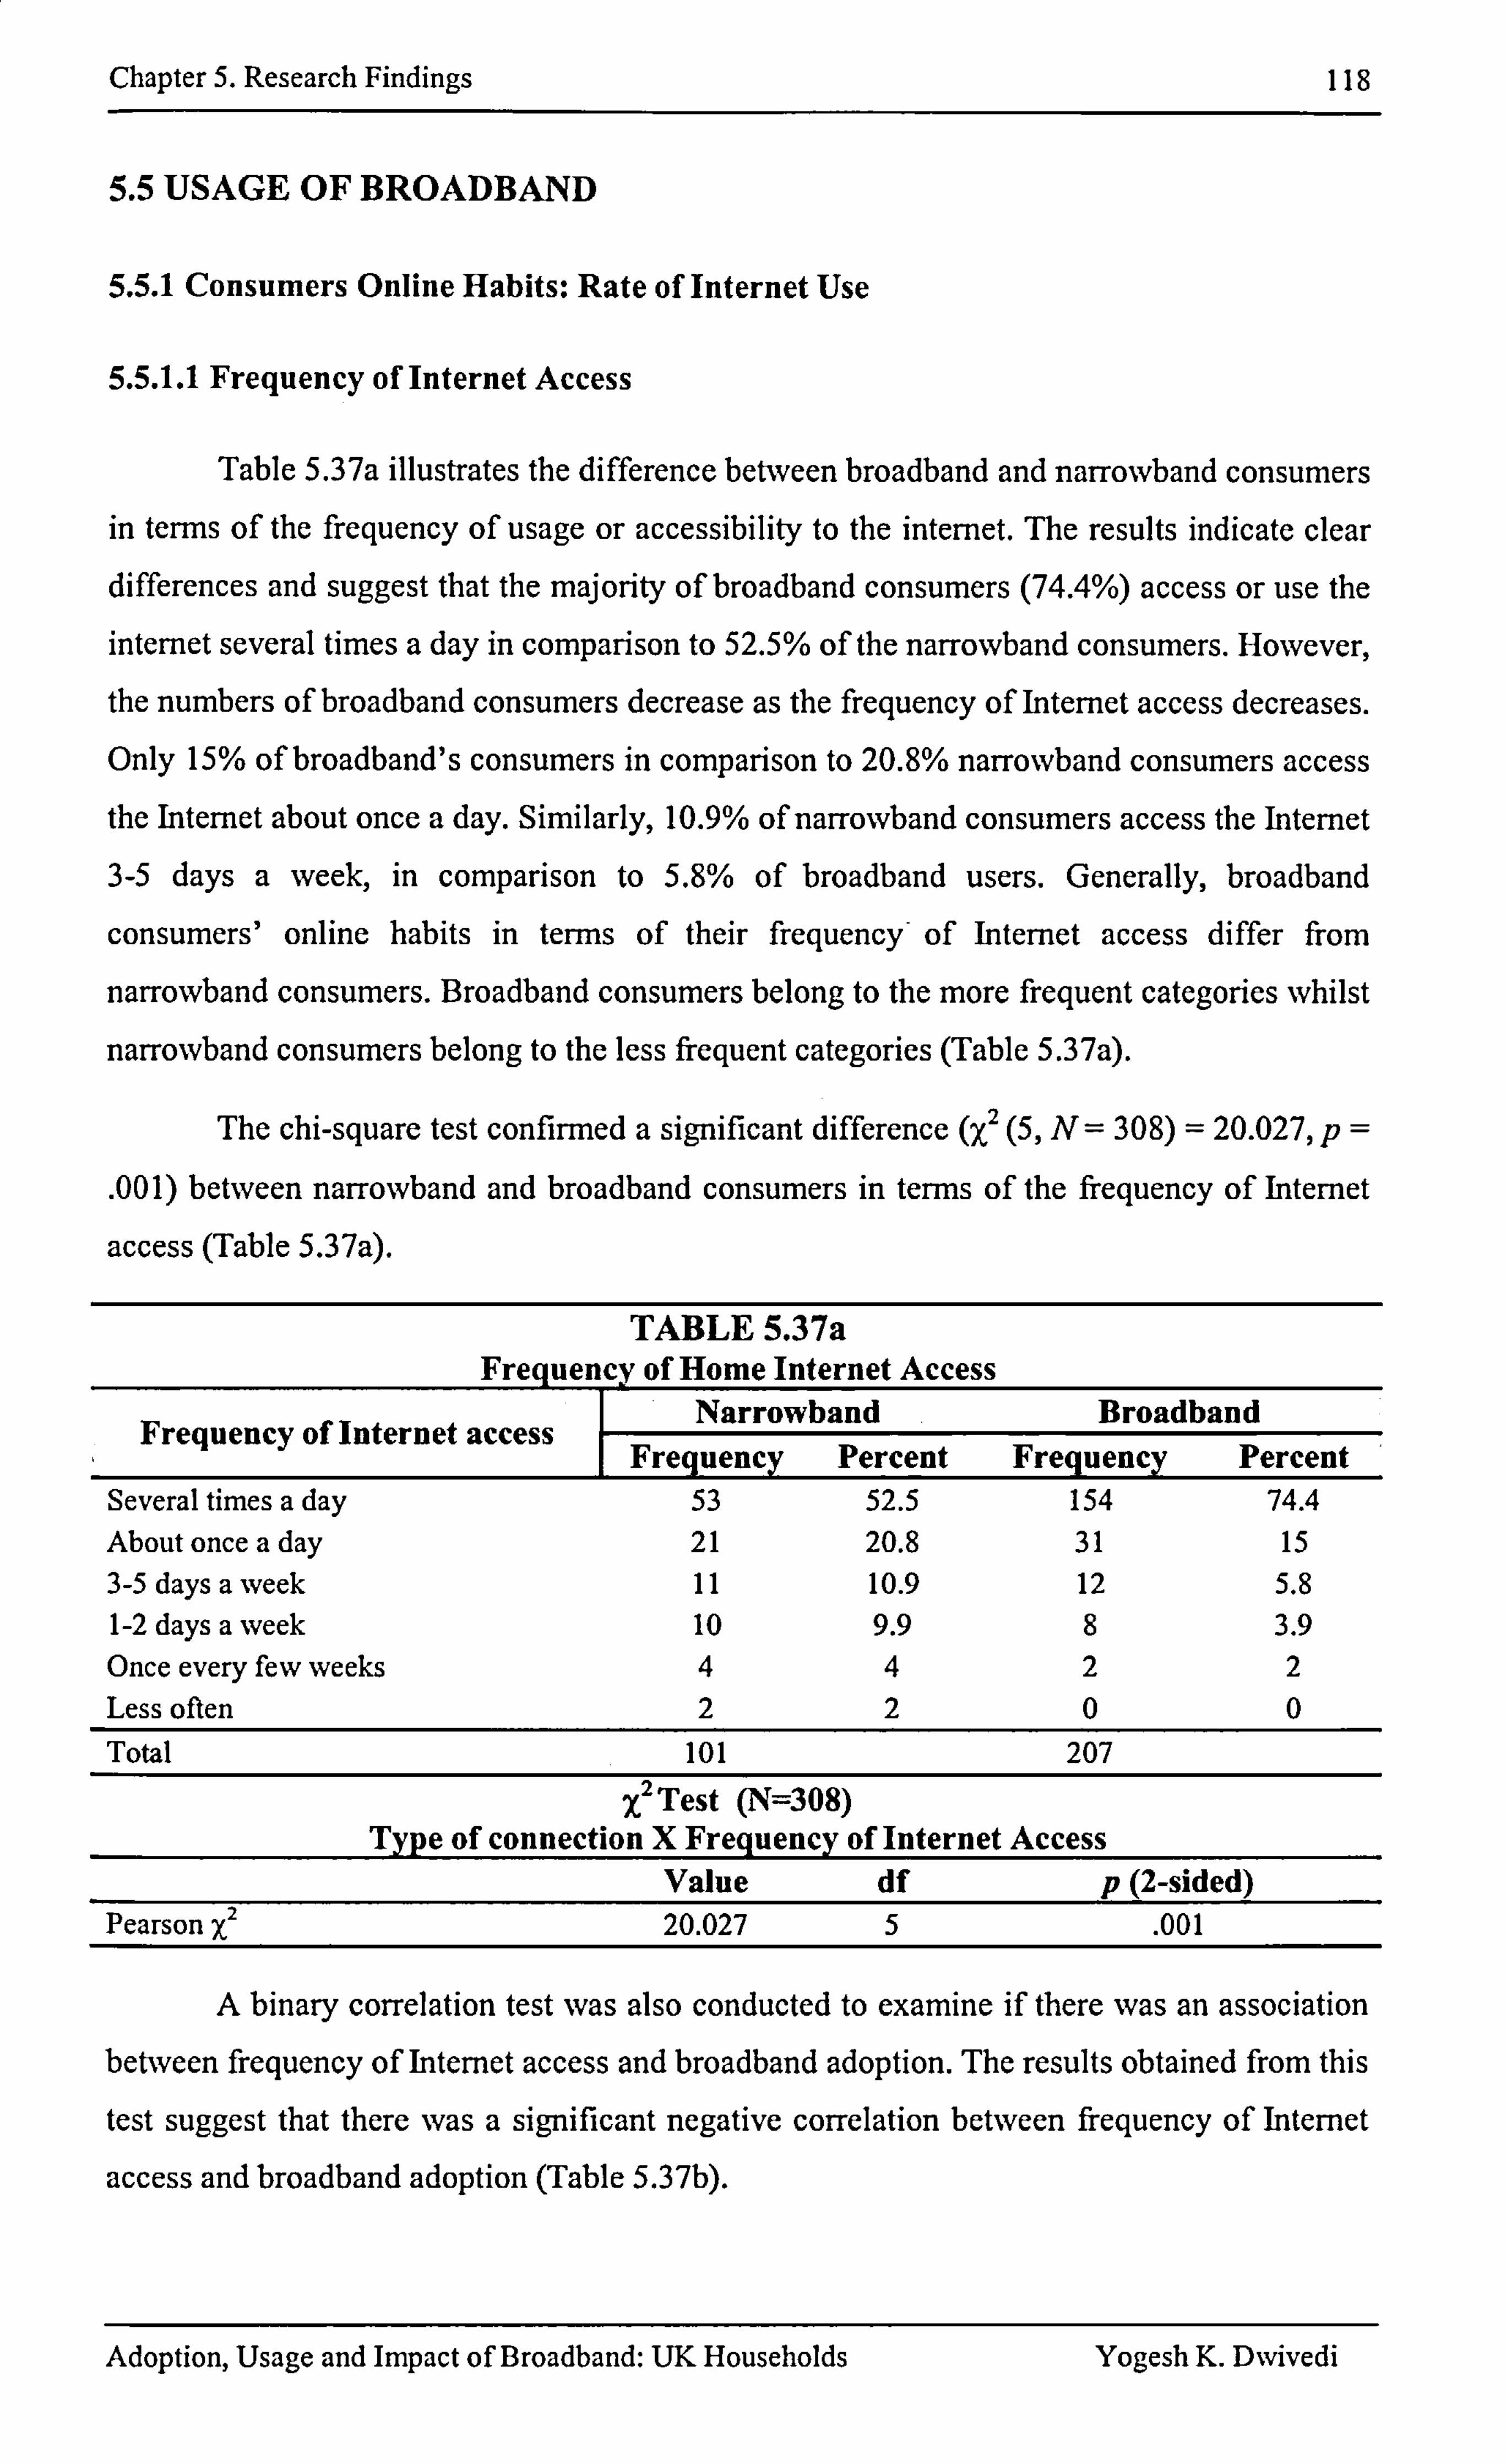
Chapter 5. Research Findings 118
5.5 USAGE OF BROADBAND
5.5.1 Consumers Online Habits: Rate of Internet Use
5.5.1.1 Frequency of Internet Access
Table 5.37a illustrates the difference between broadband and narrowband consumers in terms of the frequency of usage or accessibility to the internet. The results indicate clear differences and suggest that the majority of broadband consumers (74.4%) access or use the internet several times a day in comparison to 52.5% of the narrowband consumers. However,
the numbers of broadband consumers decrease as the frequency of Internet access decreases.
Only 15% of broadband's consumers in comparison to 20.8% narrowband consumers access the Internet about once a day. Similarly, 10.9% of narrowband consumers access the Internet
3-5 days a week, in comparison to 5.8% of broadband users. Generally, broadband
consumers' online habits in terms of their frequency of Internet access differ from
narrowband consumers. Broadband consumers belong to the more frequent categories whilst
narrowband consumers belong to the less frequent categories (Table 5.37a).
The chi-square test confinned a significant difference (X2 (5, N=30 8) = 20.027, p=
. 001) between narrowband and broadband consumers in terms of the frequency of Internet
access (Table 5.37a).
TABLE 5.37a Frequency of Home Internet Access
F fI Narrowband Broadband requency o nter net access Frequency Percent Frequency Percent
Several times a day 53 52.5 154 74.4 About once a day 21 20.8 31 15 3-5 days a week 11 10.9 12 5.8 1-2 days a week 10 9.9 8 3.9 Once every few weeks 44 2 2 Less often 22 0 0 Total 101 207
x2 Test (N=308) Ty pe of connection X Frequency of Internet Access
Value df p (2-sided) Pearson X2 20.027 5 . 001
A binary correlation test was also conducted to examine if there was an association between frequency of Internet access and broadband adoption. The results obtained from this
test suggest that there was a significant negative correlation between frequency of Internet
access and broadband adoption (Table 5.37b).
Adoption, Usage and Impact of Broadband: UK Households Yogesh K. Dwivedi
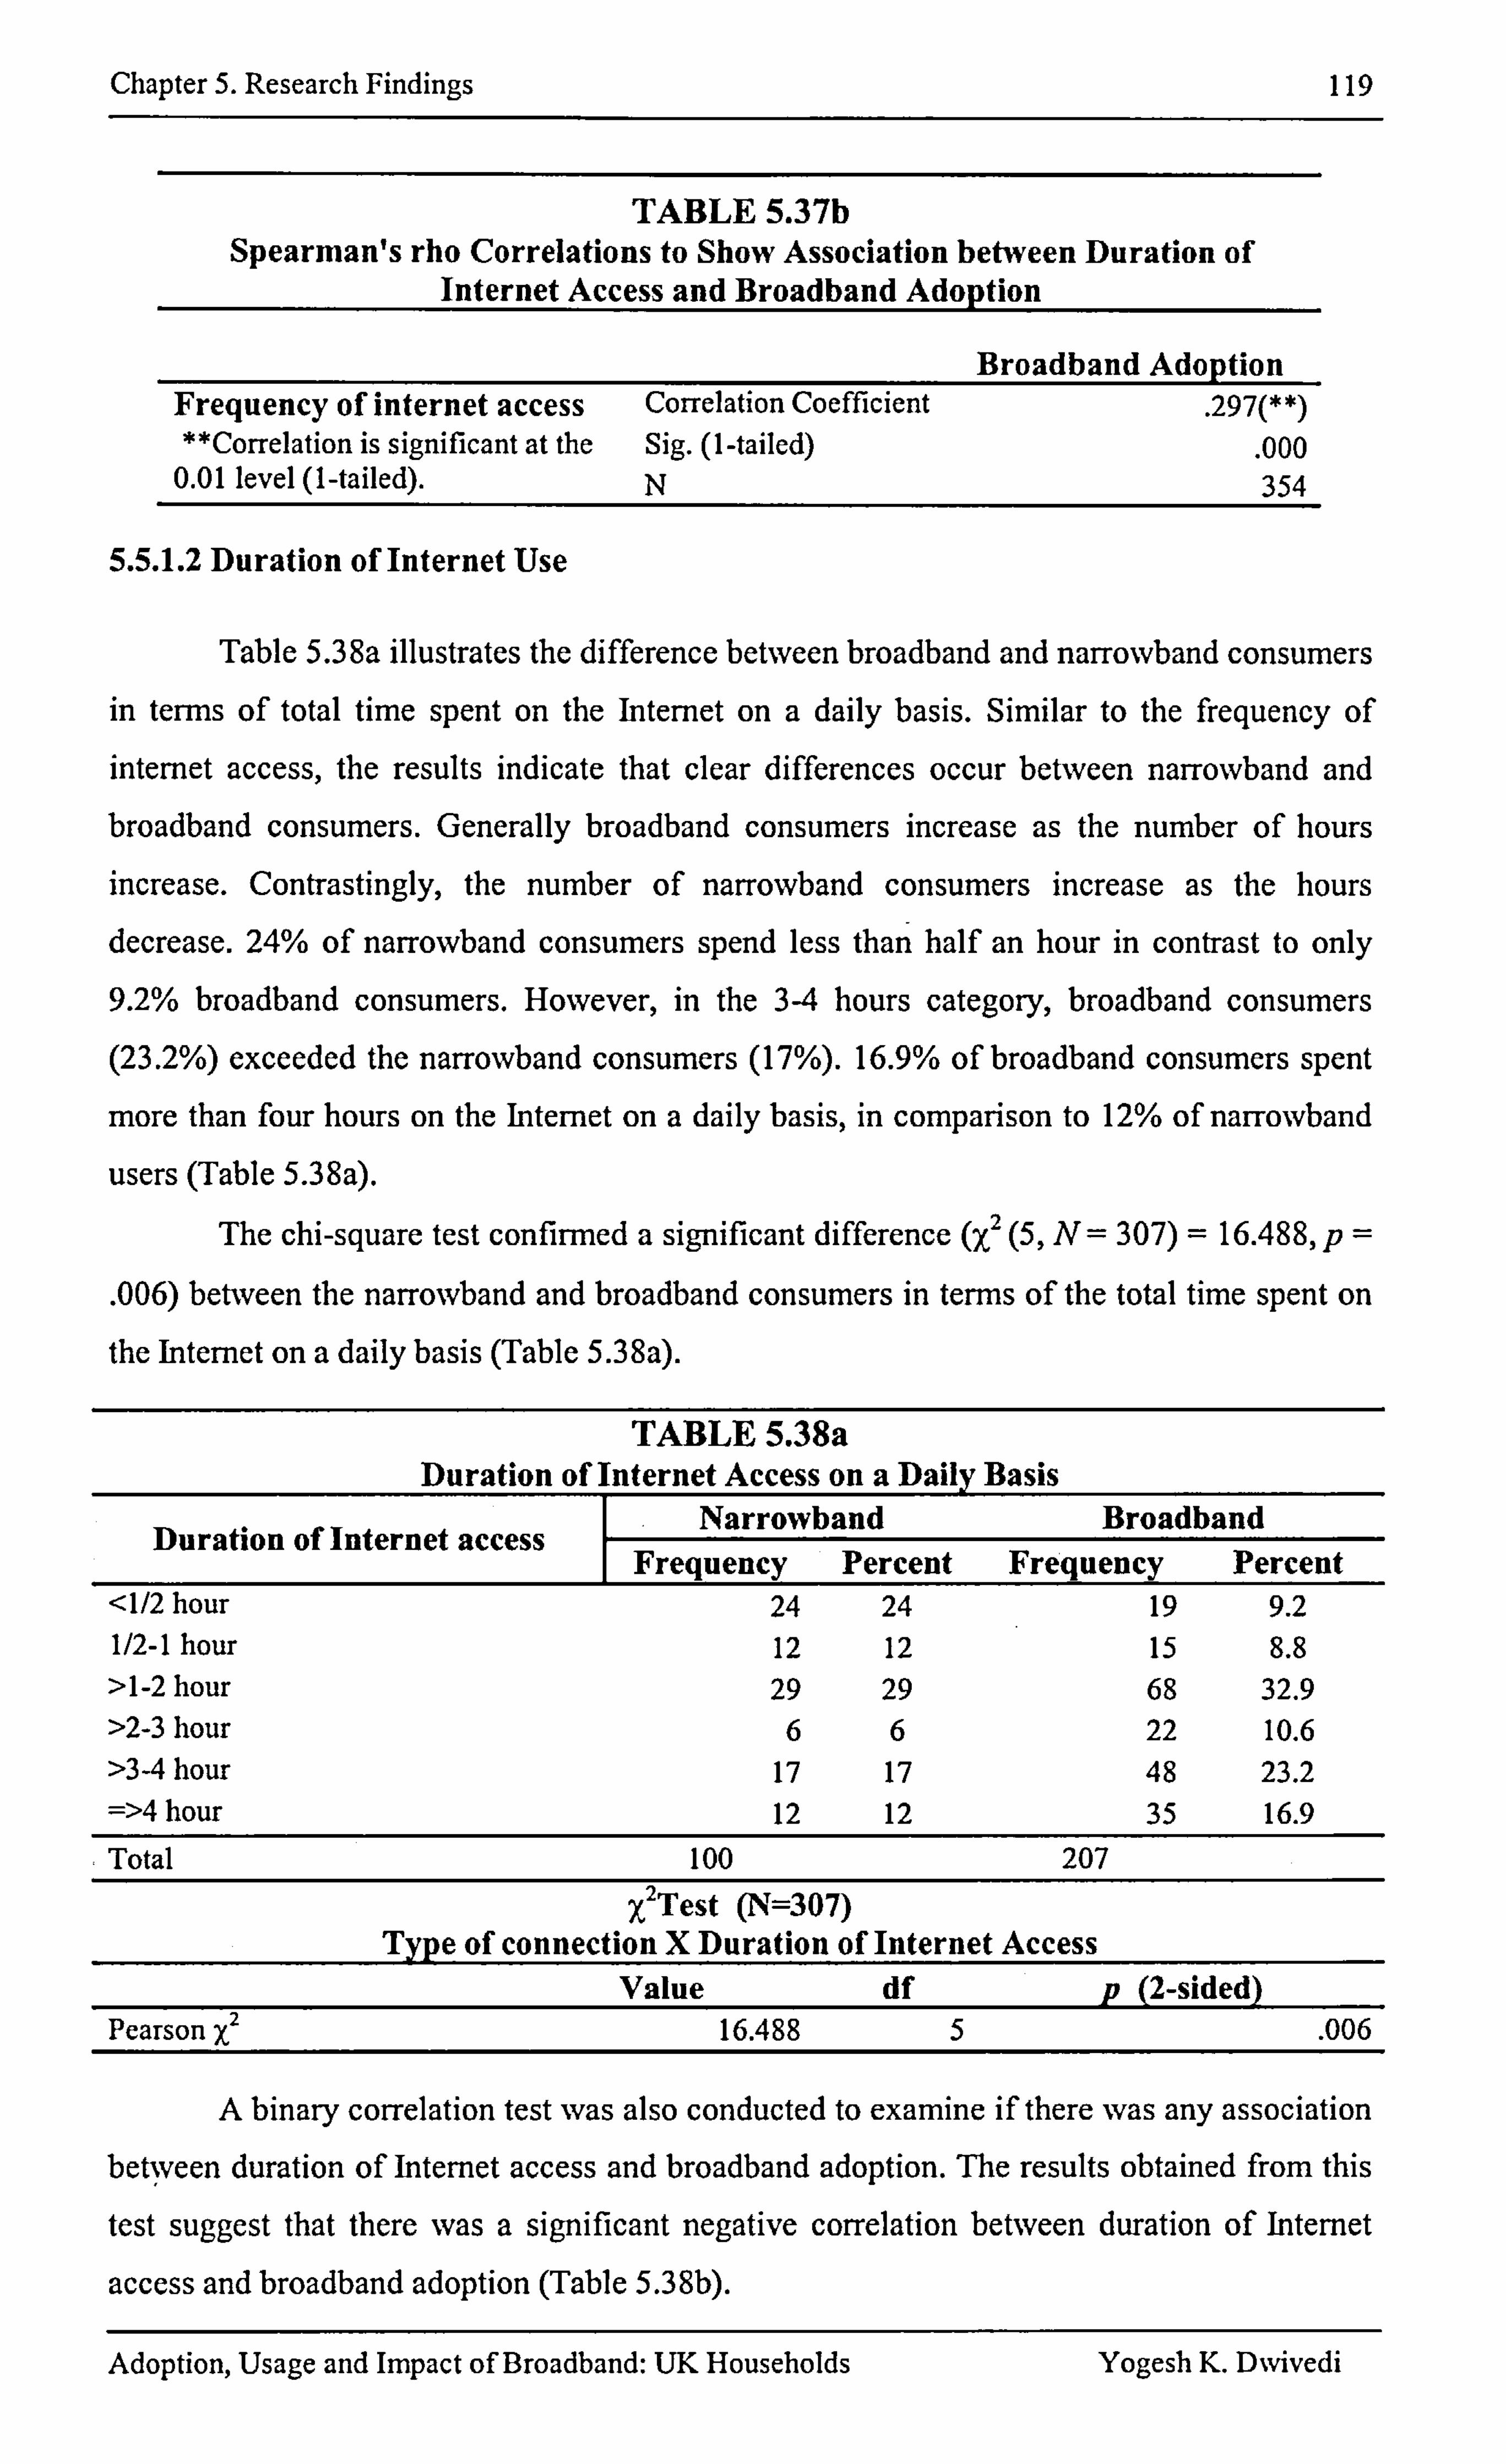
Chapter 5. Research Findings 119
TABLE 5.37b Spearman's rho Correlations to Show Association between Duration of
Internet Access and Broadband Adoption
Broadband Adoption Frequency of internet access Correlation Coefficient
. 297(**) "Correlation is significant at the Sig. (I -tailed) . 000
0.01 level (1-tailed). N 354
5.5.1.2 Duration of Internet Use
Table 5.38a illustrates the difference between broadband and narrowband consumers in terms of total time spent on the Internet on a daily basis. Similar to the frequency of internet access, the results indicate that clear differences occur between narrowband and broadband consumers. Generally broadband consumers increase as the number of hours
increase. Contrastingly, the number of narrowband consumers increase as the hours
decrease. 24% of narrowband consumers spend less than half an hour in contrast to only 9.2% broadband consumers. However, in the 3-4 hours category, broadband consumers (23.2%) exceeded the narrowband consumers (17%). 16.9% of broadband consumers spent
more than four hours on the Internet on a daily basis, in comparison to 12% of narrowband
users (Table 5.38a).
The chi-square test confirmed a significant difference (X 2 (5, N= 307) = 16.488, p=
. 006) between the narrowband and broadband consumers in terms of the total time spent on the Internet on a daily basis (Table 5.38a).
TABLE 5.38a Duration of Internet Access on a Daily Basis
i fI Narrowband Broadband Durat on o nternet access Frequency Percent Frequency Percent <1/2 hour 24 24 19 9.2 1/2-1 hour 12 12 15 8.8 >1-2 hour 29 29 68 32.9 >2-3 hour 66 22 10.6 >34 hour 17 17 48 23.2 =>4 hour 12 12 35 16.9 Total 100 207
x2 Test (N=307) Type of connection X Duration of Internet Access
Value df p (2-sided) Pearson X2 16.488 5 . 006
A binary correlation test was also conducted to examine if there was any association betýveen duration of Internet access and broadband adoption. The results obtained from this
test suggest that there was a significant negative correlation between duration of Internet
access and broadband adoption (Table 5.38b).
Adoption, Usage and Impact of Broadband: UK Households Yogesh K. D%vivedi
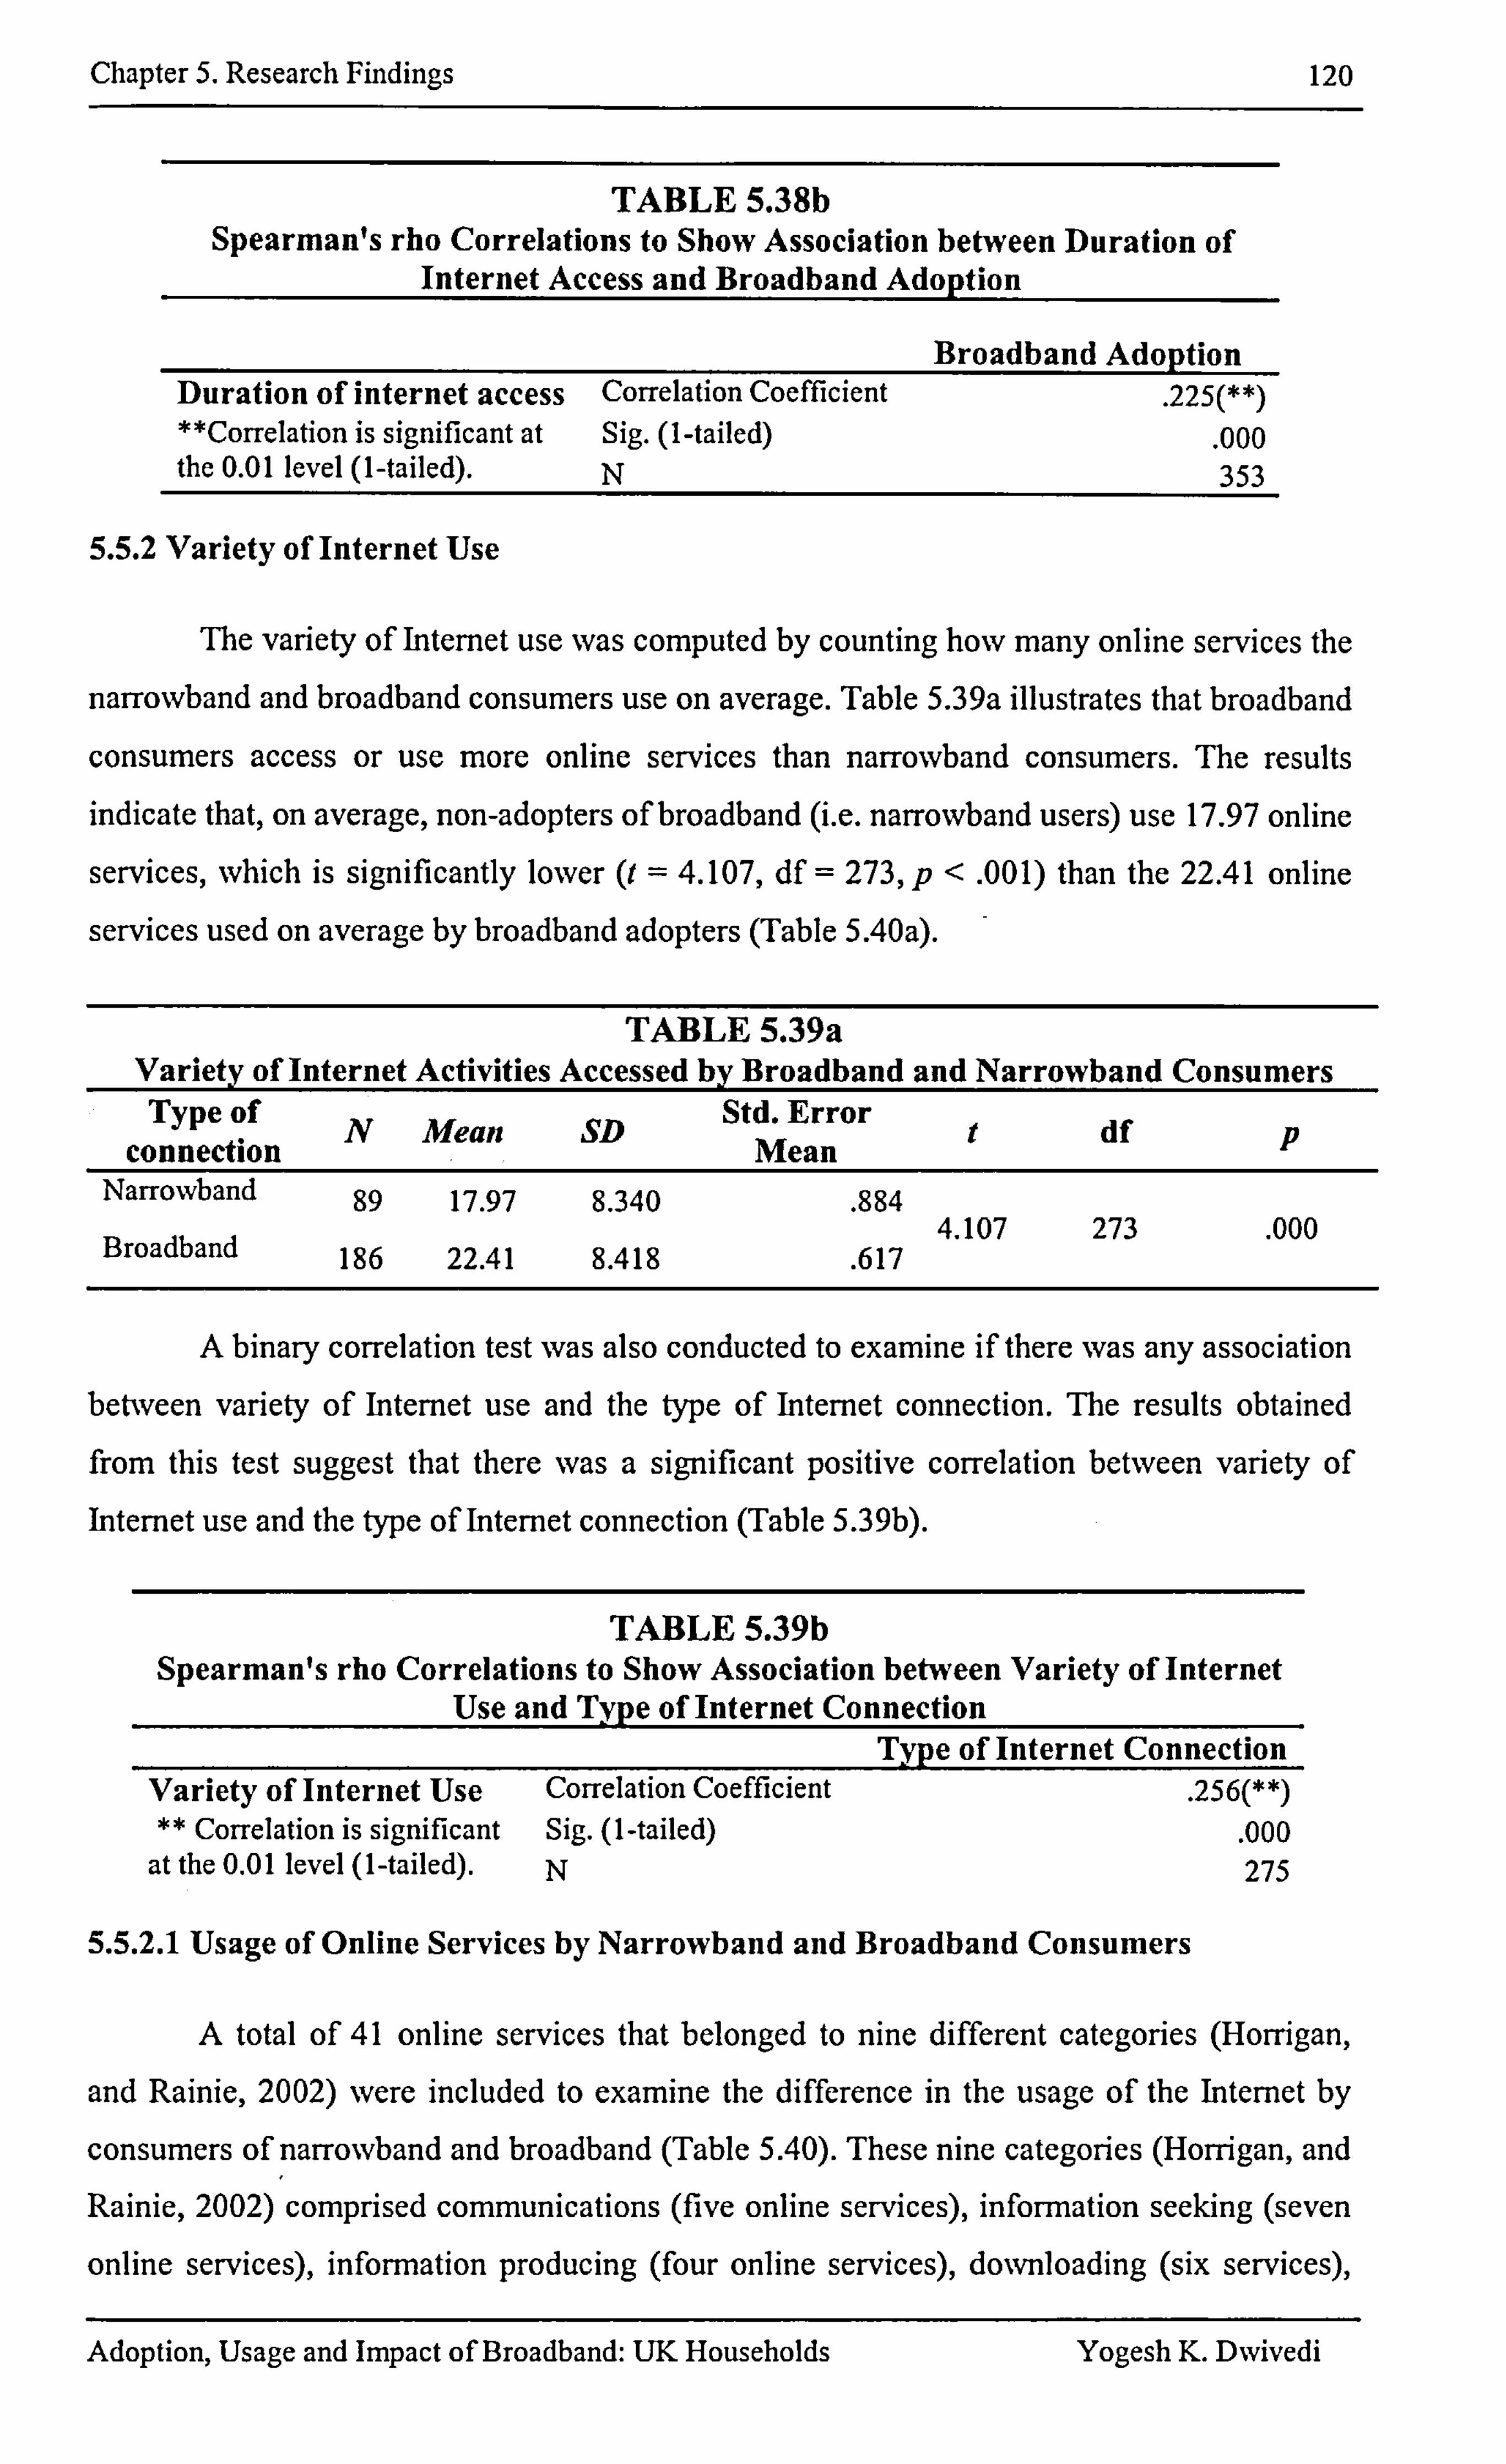
Chapter 5. Research Findings 120
TABLE 5.38b Spearman's rho Correlations to Show Association between Duration of
Internet Access and Broadband Adoption
Broadband Adoption Duration of internet access Correlation Coefficient . 225(**) "Correlation is significant at Sig. (1-tailed)
. 000 the 0.01 level (1-tailed). N 353
5.5.2 Variety of Internet Use
The variety of Internet use was computed by counting how many online services the
narrowband and broadband consumers use on average. Table 5.39a illustrates that broadband
consumers access or use more online services than narrowband consumers. The results indicate that, on average, non-adopters of broadband (i. e. narrowband users) use 17.97 online
services, which is significantly lower Q=4.107, df = 273, p< . 001) than the 22.41 online
services used on average by broadband adopters (Table 5.40a). -
TABLE 5.39a Variety of Internet Activities Accessed by Broadband and Narrowband Consumers Typeof N Mean SD Std. Error
t df p connection Mean Narrowband 89 17.97 8.340 . 884 Broadband 186 22.41 8.418 . 617
4.107 273 . 000
A binary correlation test was also conducted to examine if there was any association between variety of Internet use and the type of Internet connection. The results obtained from this test suggest that there was a significant positive correlation between variety of Internet use and the type of Internet connection (Table 5.39b).
TABLE 5.39b Spearman's rho Correlations to Show Association between Variety of Internet
Use and Type of Internet Connection Type of Internet Connection
Variety of Internet Use Correlation Coefficient . 256(**) ** Correlation is significant Sig. (I -tailed) . 000
at the 0.01 level (1-tailed). N 275
5.5.2.1 Usage of Online Services by Narrowband and Broadband Consumers
A total of 41 online services that belonged to nine different categories (Horrigan,
and Rainie, 2002) were included to examine the difference in the usage of the Internet by
consumers of narrowband and broadband (Table 5.40). These nine categories (Horrigan, and Rainie, 2002) comprised communications (five online services), information seeking (seven
online services), information producing (four online services), downloading (six services),
Adoption, Usage and Impact of Broadband: UK Households Yogesh K. Dwivedi
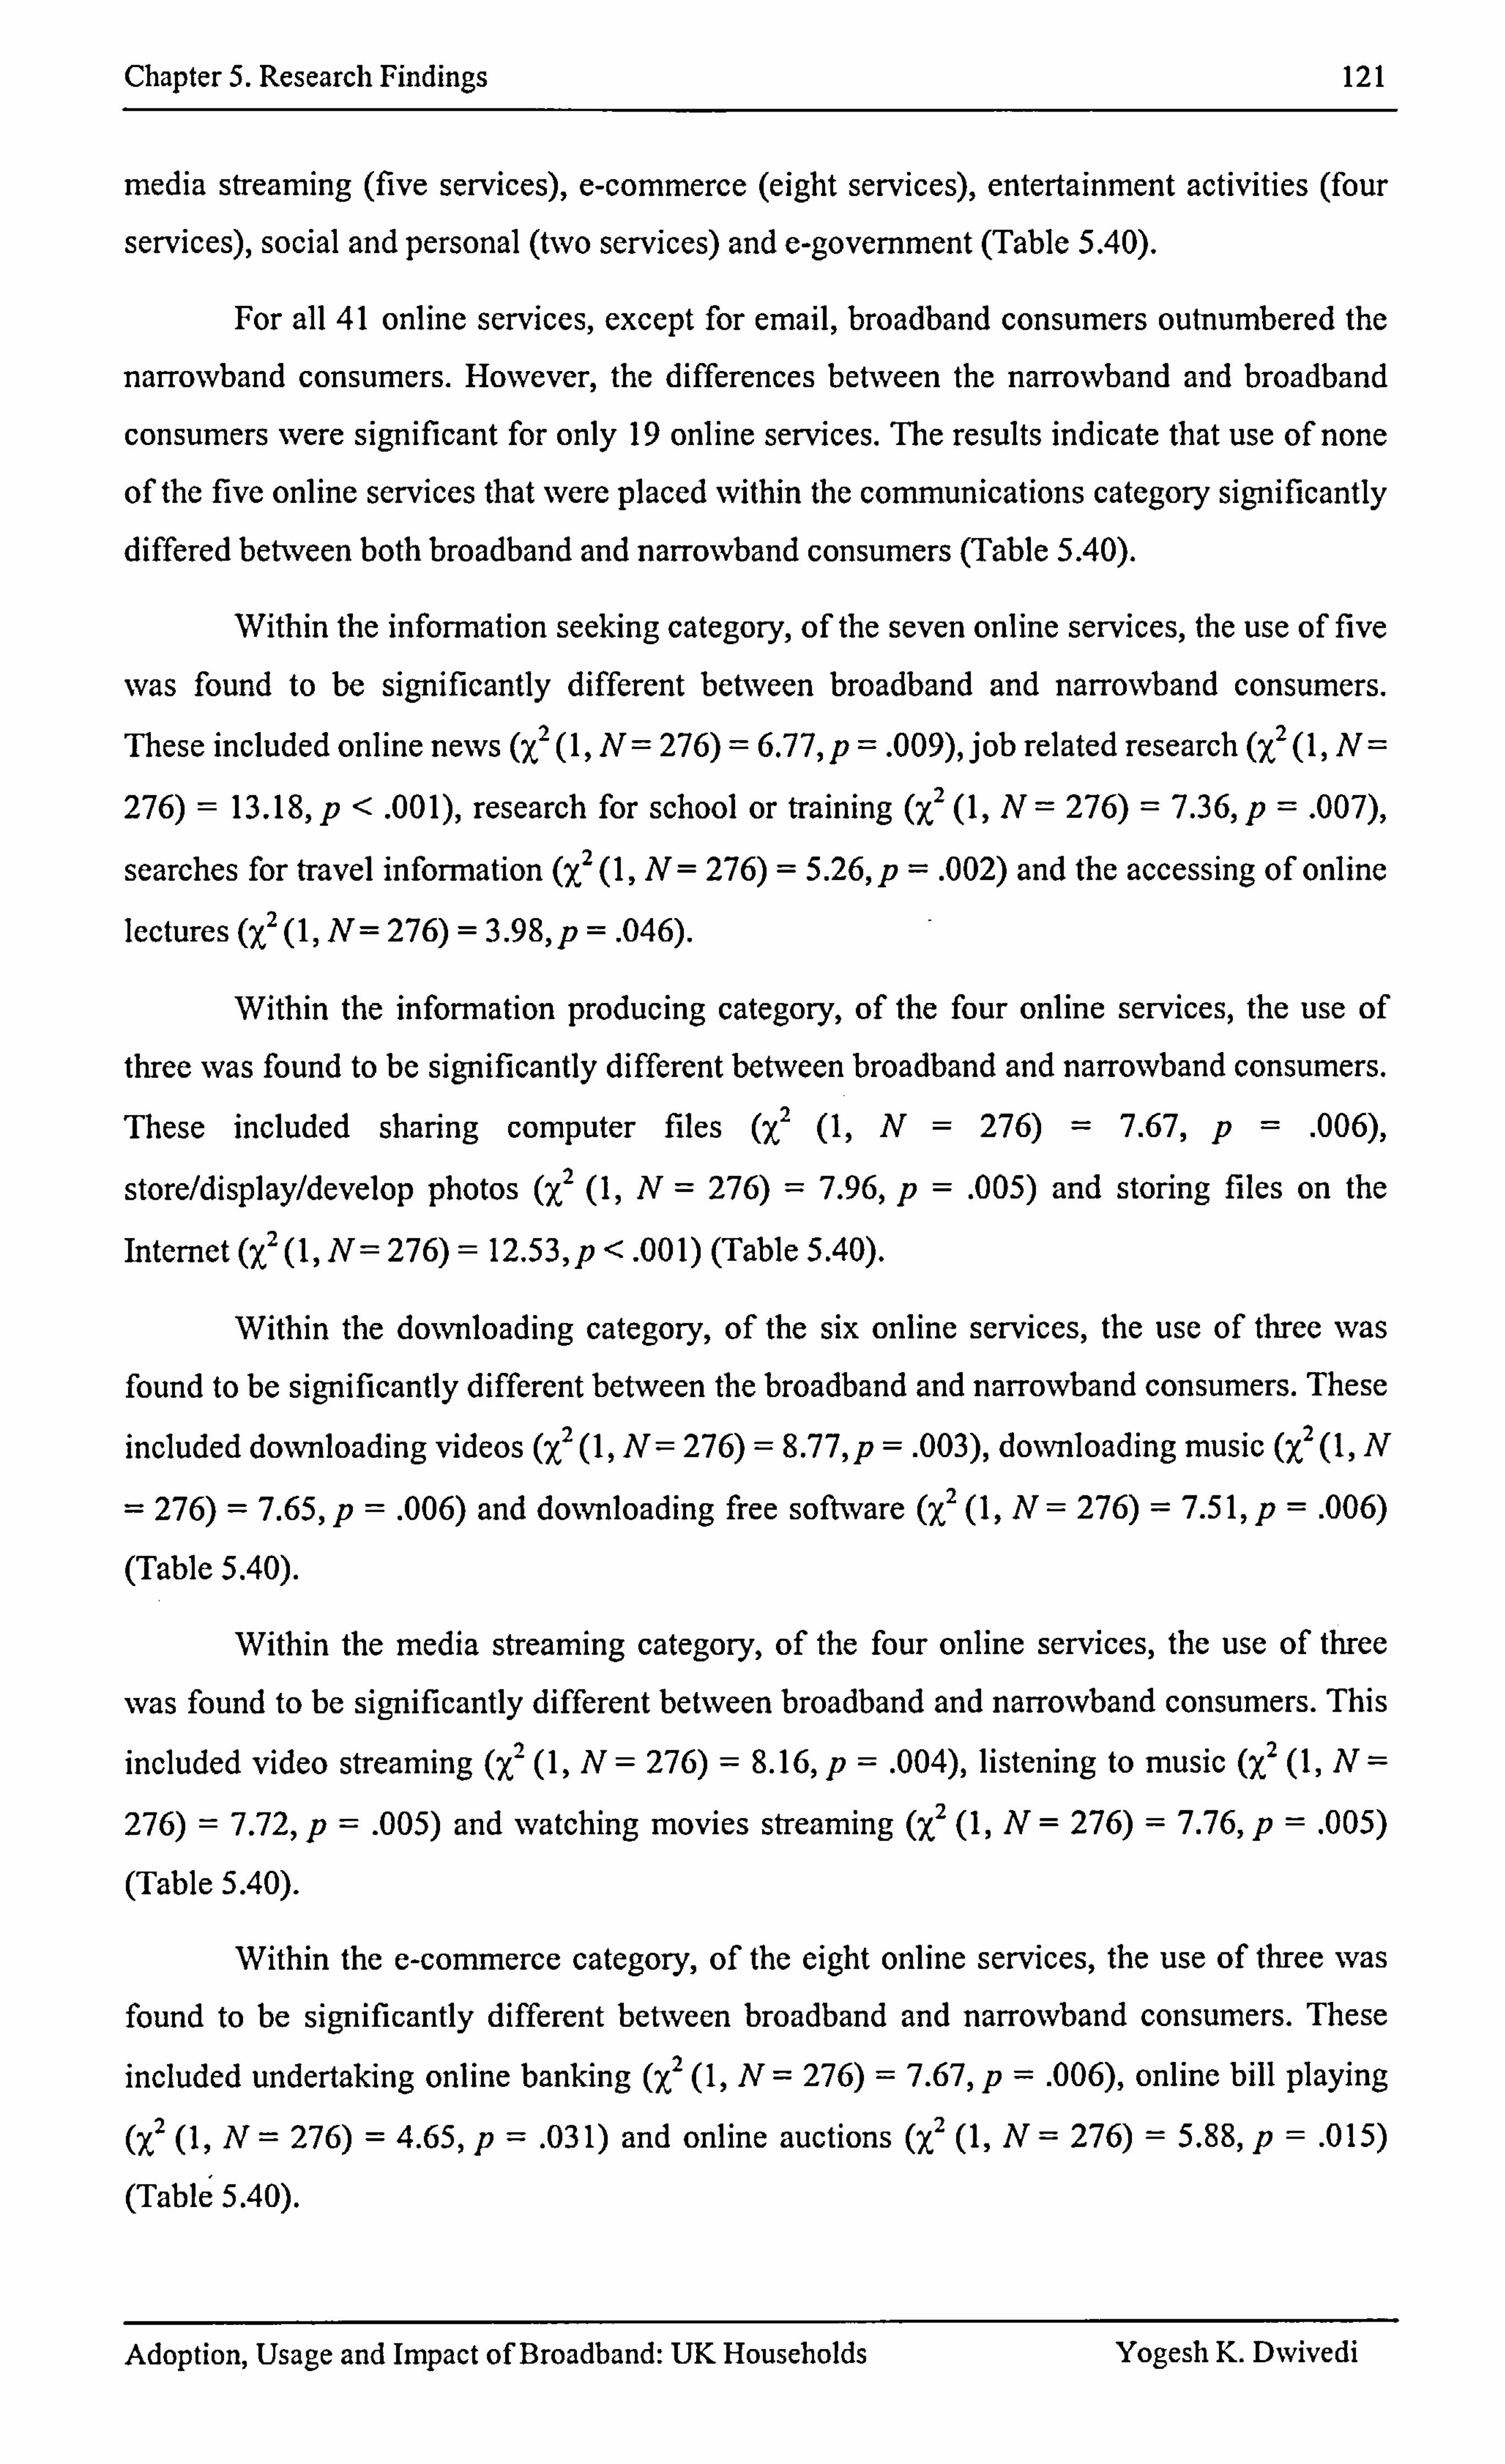
Chapter 5. Research Findings 121
media streaming (five services), e-commerce (eight services), entertainment activities (four
services), social and personal (two services) and e-government (Table 5.40).
For all 41 online services, except for email, broadband consumers outnumbered the
narrowband consumers. However, the differences between the narrowband and broadband
consumers were significant for only 19 online services. 'Me results indicate that use of none
of the five online services that were placed within the communications category significantly differed between both broadband and narrowband consumers (Table 5.40).
Within the infon-nation seeking category, of the seven online services, the use of five
was found to be significantly different between broadband and narrowband consumers. (X2 (1,2 These included online news ,
N= 276) = 6.77, p =. 009), job related research (y, (1, N=
276) = 13.18, p< . 001), research for school or training (X2 (1, N= 276) = 7.36, p= . 007), (, X
2 searches for travel information
. (1, N= 276) = 5.26, p= . 002) and the accessing of online
lectures ()C2 ( 1, N= 276) = 3.9 8, p= . 046).
Within the infon-nation producing category, of the four online services, the use of
three was found to be significantly different between broadband and narrowband consumers. (, X
2 These included sharing computer files (1, N= 276) = 7.67, p= . 006),
store/display/develop photos (X 2 (1, N= 276) 7.96, p= . 005) and storing files on the
Internet (X2 (1, N= 276) = 12.53, p< . 00 1) (Table 5.40).
Within the downloading category, of the six online services, the use of three was found to be significantly different between the broadband and narrowband consumers. These
included downloading videos (X 2 (1, N= 276) = 8.77, p =. 003), downloading music (X2 (1, N (X2 276) = 7.65, p= . 006) and downloading free soffivare ,
(1, N= 276) = 7.5 1, p= . 006)
(Table 5.40).
Within the media streaming category, of the four online services, the use of three
was found to be significantly different between broadband and narrowband consumers. This
included video streaming (X 2 (1, N= 276) = 8.16, p= . 004), listening to music (X2 (1, N= (, X
2 276) = 7.72, p= . 005) and watching movies streaming , (1, N= 276) = 7.76, p= . 005)
(Table 5.40).
Within the e-commerce category, of the eight online services, the use of three was found to be significantly different between broadband and narrowband consumers. These
included undertaking online banking (X 2(l, N= 276) = 7.67, p= . 006), online bill playing
(X2 (1, N= 276) = 4.65, p= . 03 1) and online auctions (X2 (1, N= 276) = 5.88, p= .0 15)
(Table 5.40).
Adoption, Usage and Impact of Broadband: UK Households Yogesh K. Dwivedi
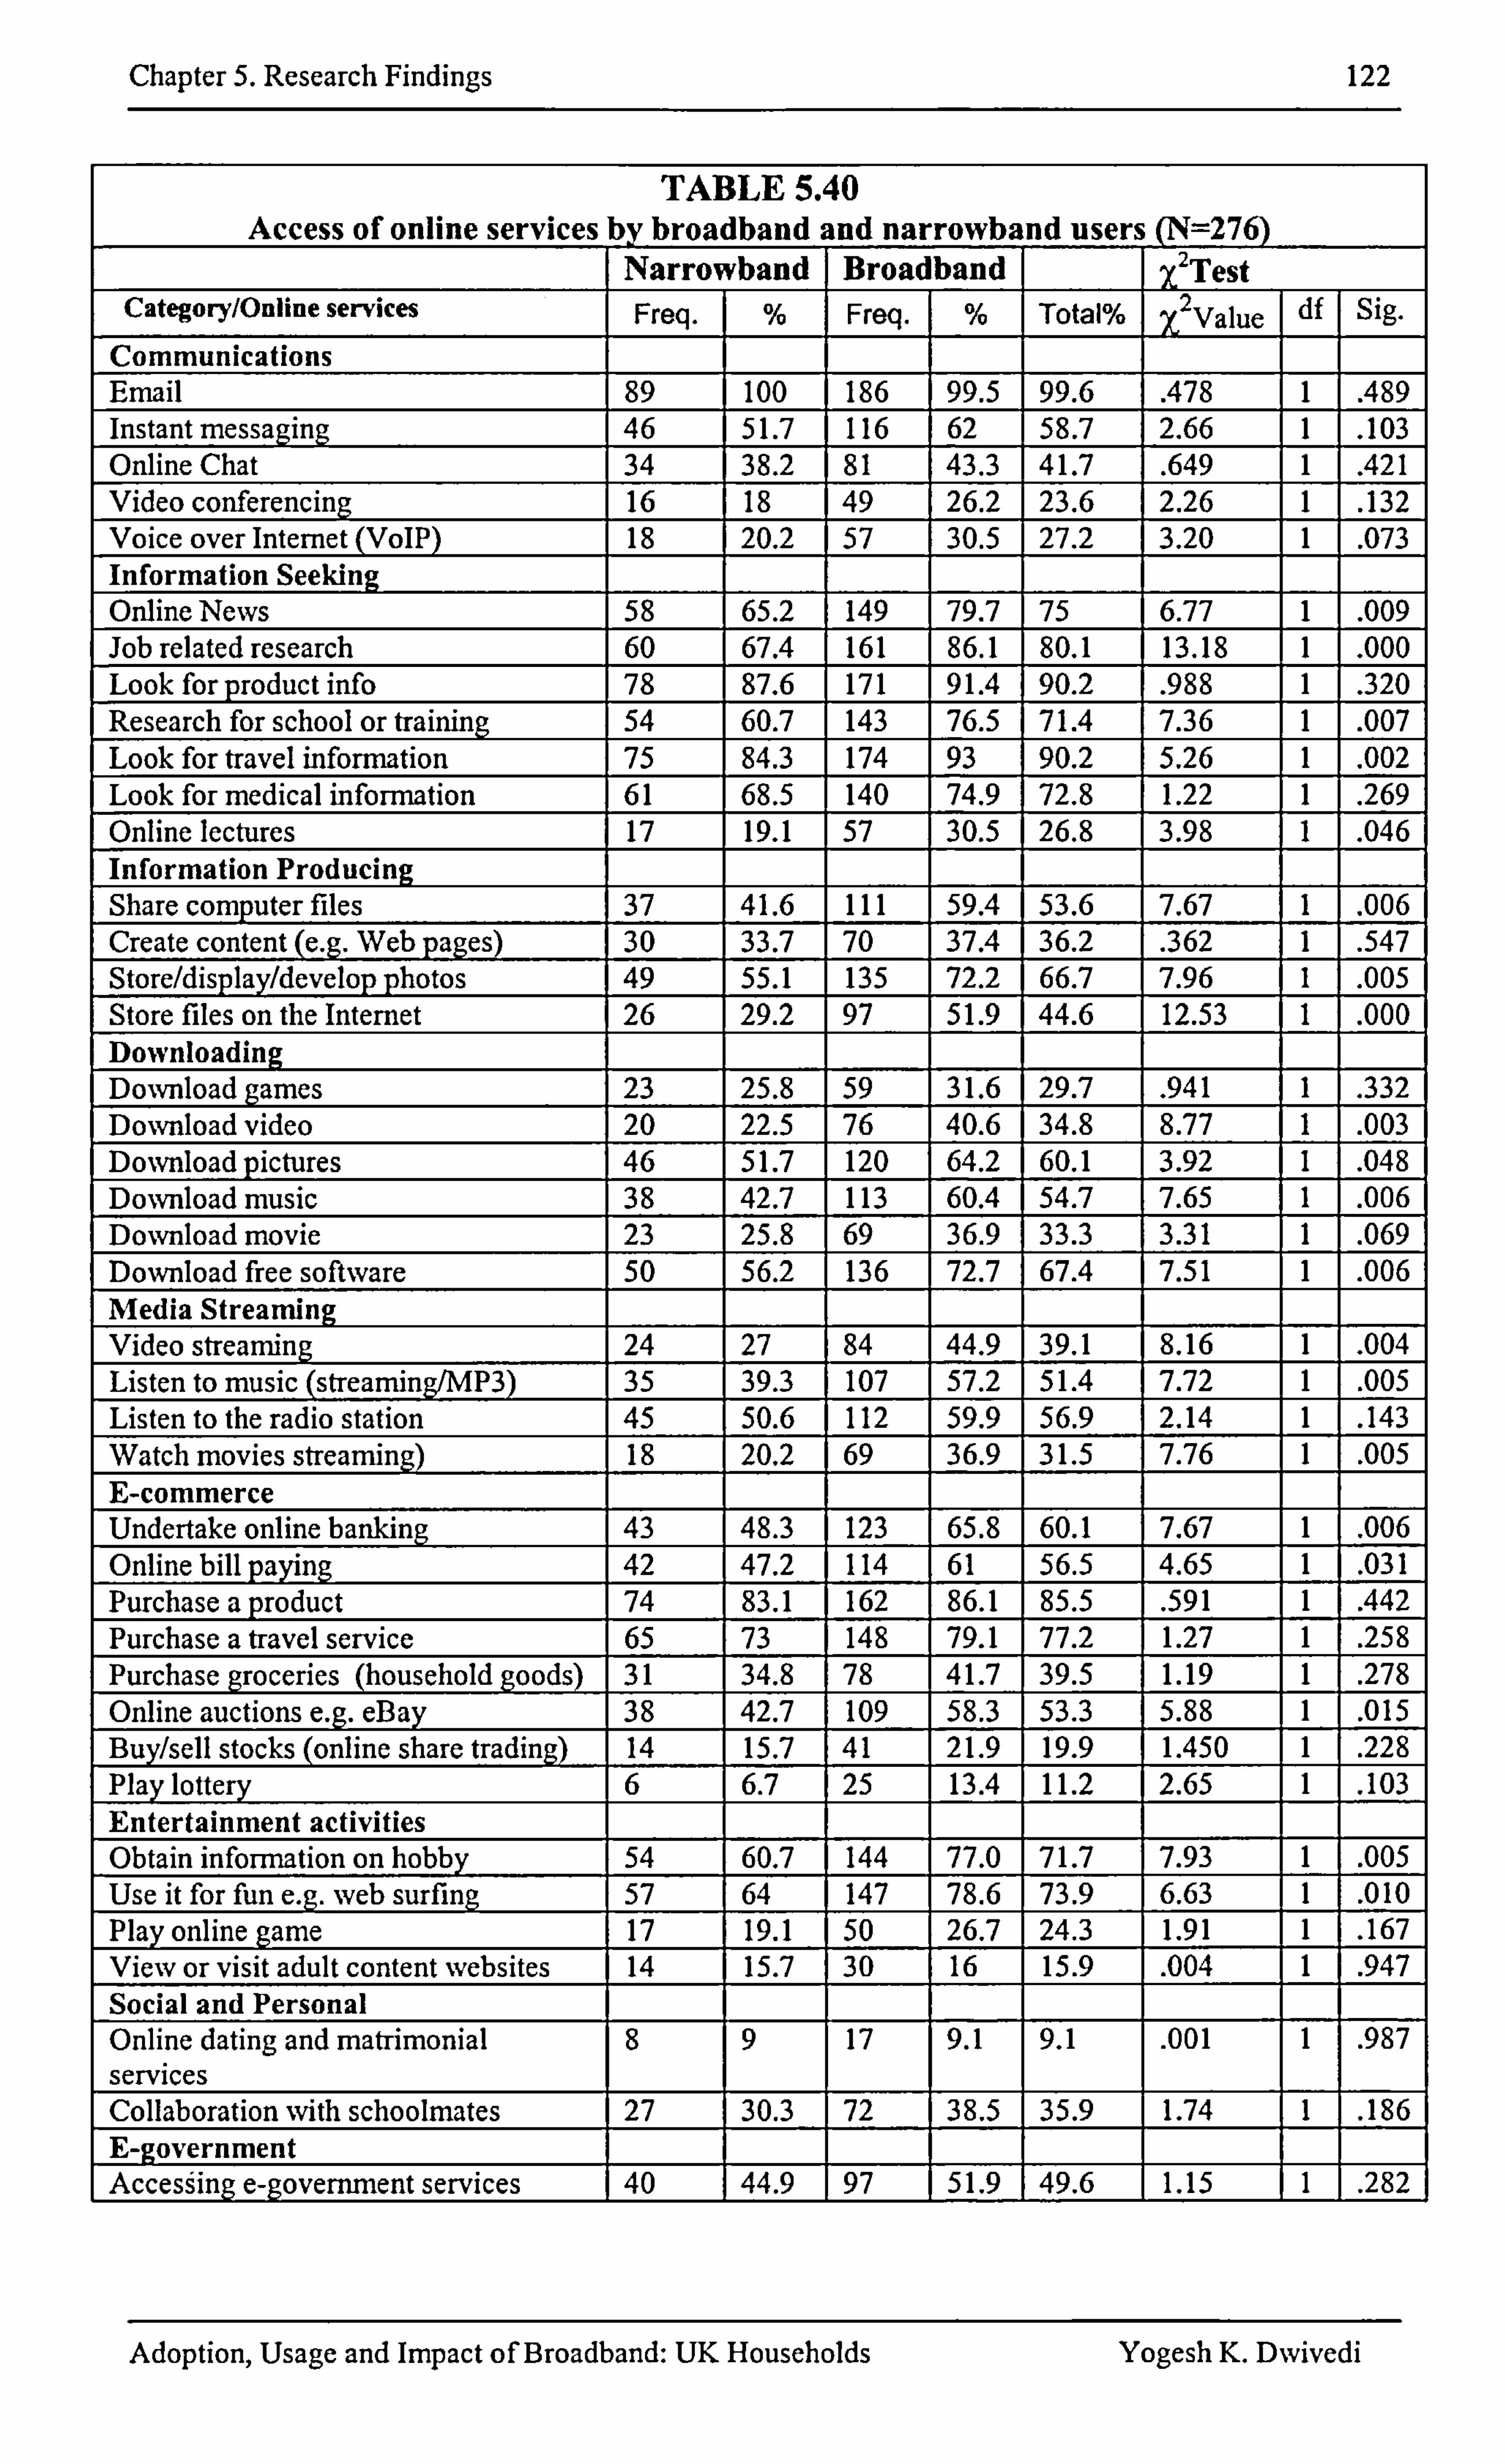
Chapter 5. Research Findings 122
TABLE 5.40 Access of online services y broadband and narrowband user (N=276)
Narrowband Broad band x2 Test Category/Online services Freq. % Freq. % Total% X2 Value df Sig.
Communications Email 89 100 186 99.5 99.6 . 478 1 . 489 Instant messaging 46 51.7 116 62 1 58.7 2.66 1 . 103 Online Chat 34 38.2 81 43.3 41.7 . 649 1 . 421 Video conferencing 16 18 49 26.2 23.6 2.26 1 . 132 Voice over Internet (VoIP) 18 20.2 57 30.5 27.2 3.20 1 . 073 Information Seeking Online News 58 65.2 149 79.7 75 6.77 1 . 009 Job related research 60 67.4 161 86.1 80.1 13.18 1 . 000 Look for product info 78 87.6 171 91.4 90.2 . 988 1 . 320 Research for school or training 54 60.7 143 76.5 71.4 7.36 1 . 007 Look for travel information 75 84.3 174 93 90.2 5.26 1 . 002 Look for medical information 61 68.5 140 74.9 72.8 1.22 1 . 269 Online lectures 17 19.1 57 30.5 26.8 3.98 1 . 046 Information Producing Share computer files 37 41.6 111 59.4 53.6 7.67 1 . 006 Create content (e. g. Web pages) 30 33.7 70 37.4 36.2 . 362 1 . 547 Store/display/develop photos 49 55.1 135 72.2 66.7 7.96 1 . 005 Store files on the Internet 26 29.2 97 51.9 44.6 12.53 1 . 000 Downloading Download games 23 25.8 59 31.6 29.7 . 941 1 . 332 Download video 20 22.5 76 40.6 34.8 8.77 1 . 003 Download pictures 46 51.7 120 64.2 60.1 3.92 1 . 048 Download music 38 42.7 113 60.4 54.7 7.65 1 . 006 Download movie 23 25.8 69 36.9 33.3 3.31 1 . 069 Download free software 50 56.2 136 72.7 67.4 7.51
-1 . 006 Media Streaming Video streaming 24 27 84 44.9 39.1 8.16 1 . 004 Listen to music (streaming/MP3) 35 39. 107 57.2 51.4 7.72 1 . 005 Listen to the radio station 45 50.6 112 59.9 56.9 2.14 1 . 143 Watch movies streaming) 18 20.2 69 36.9 31.5 7.76 1 . 005 E-cornmerce Undertake online banking 43 48.3 123 65.8 60.1 7.67 1 . 006 Online bill paying 42 47.2 114 61 56.5 4.65 1 . 031 Purchase a product 74 83.1 162 86.1 85.5 . 591 1 . 442 Purchase a travel service 65 73 148 79.1 77.2 1.27 1 . 258 Purchase groceries (household goods) 31 34.8 78 41.7 39.5 1.19 1 . 278 Online auctions e. g. eBay 38 42.7 109 58.3 53.3 5.88 1 . 015 Buy/sell stocks (online share trading) 14
. 15.7 41 21.9 19.9 1.450 1 . 228
Play lottery 6 6.7 25 13.4 11.2 2.65 1 . 103 Entertainment activities Obtain infon-nation on hobby 54 60.7 144 77.0 71.7 7.93 1 . 005 Use it for fun e. g. web surfing 57 64 147 78.6 73.9 6.63 1 . 010 Play online game 17 19.1 50 26.7 24.3 1.91 1 . 167 View or visit adult content websites 14 15.7 30 16 15.9 . 004 1 . 947 Social and Personal Online dating and matrimonial services
8 9 17 9.1 9.1 . 001 1 . 987
Collaboration Nvith schoolmates 27 30.3 72 38.5 35.9 1.74 1 . 186 E-government I Acces§ing e-government services 40 -44.9 1 -9-7--l 51.9 1 49.6 1.15 1 . 282
Adoption, Usage and Impact of Broadband: UK Households Yogesh K. Dwivedi
Chapter 5. Research Findings 123
Within the entertainment category, of the four online services, the use of two was
found to be significantly different between broadband and narrowband consumers. These
included obtaining information on hobbies (X 2(j, N= 276) = 7.93, p= . 005), and using it for
f (X2 un , (1, N= 276) = 6.63, p =. 010) (Table 5.40).
Similar to the communication category, none of the placed services within the
remaining two categories (the first being social and personal and the second being e-
government) significantly differed between both broadband and narrowband consumers (Table 5.40).
5.6 IMPACT OF BROADBAND
A cross-sectional analysis was applied to both the narrowband and broadband
consumers' usage of time upon various activities (Table 5.41). The results found a clear distinction between the narrowband and broadband consumers in terms of time spent on a total of twenty daily life activities examined within this research. The broadband consumers' behaviour in terms of time spent on various activities is dissimilar to dial-up consumers. For
example, the television-watching behaviour of 41% of the broadband consumers decreased
in comparison to 36% of the dial-up consumers. Similarly, reading
newspapers/books/magazines was more affected by broadband use. Compared to 18% of the
dial-up users, 28% of the broadband consumers read fewer newspapers/books/magazines in
comparison.
Other activities where consumers spent less time than before include in-store
shopping, working in the office and commuting in traffic (Table 5.41). Working in the office had decreased for 25% of the broadband consumers in comparison to 4% of the dial-up
consumers. 18% of the broadband consumers spent less time when commuting in traffic then
4% of the narrowband consumers.
There is a minor distinction between the narrowband and broadband consumers in
terms of time allocation pattern for activities such as spending time with family and friends,
time spent alone, receiving or making phone calls and outdoor entertainment (Table 5.4 1).
The only activity where the time spent had increased was 'working at home'. 'Me
working at home behaviour of 53% of the broadband consumers increased in comparison to
28% of the narrowband ones (Table 5.41).
As illustrated above, differences existed between the broadband and narrowband
consumers in terms of their time allocation pattern for all the 20 activities examined in this
research. However, the chi-square test confirmed that the narrowband consumers' time
allocation patterns differed significantly to the broadband ones only for five activities (Table
Adoption, Usage and Impact of Broadband: UK Households Yogesh K. Dwivedi
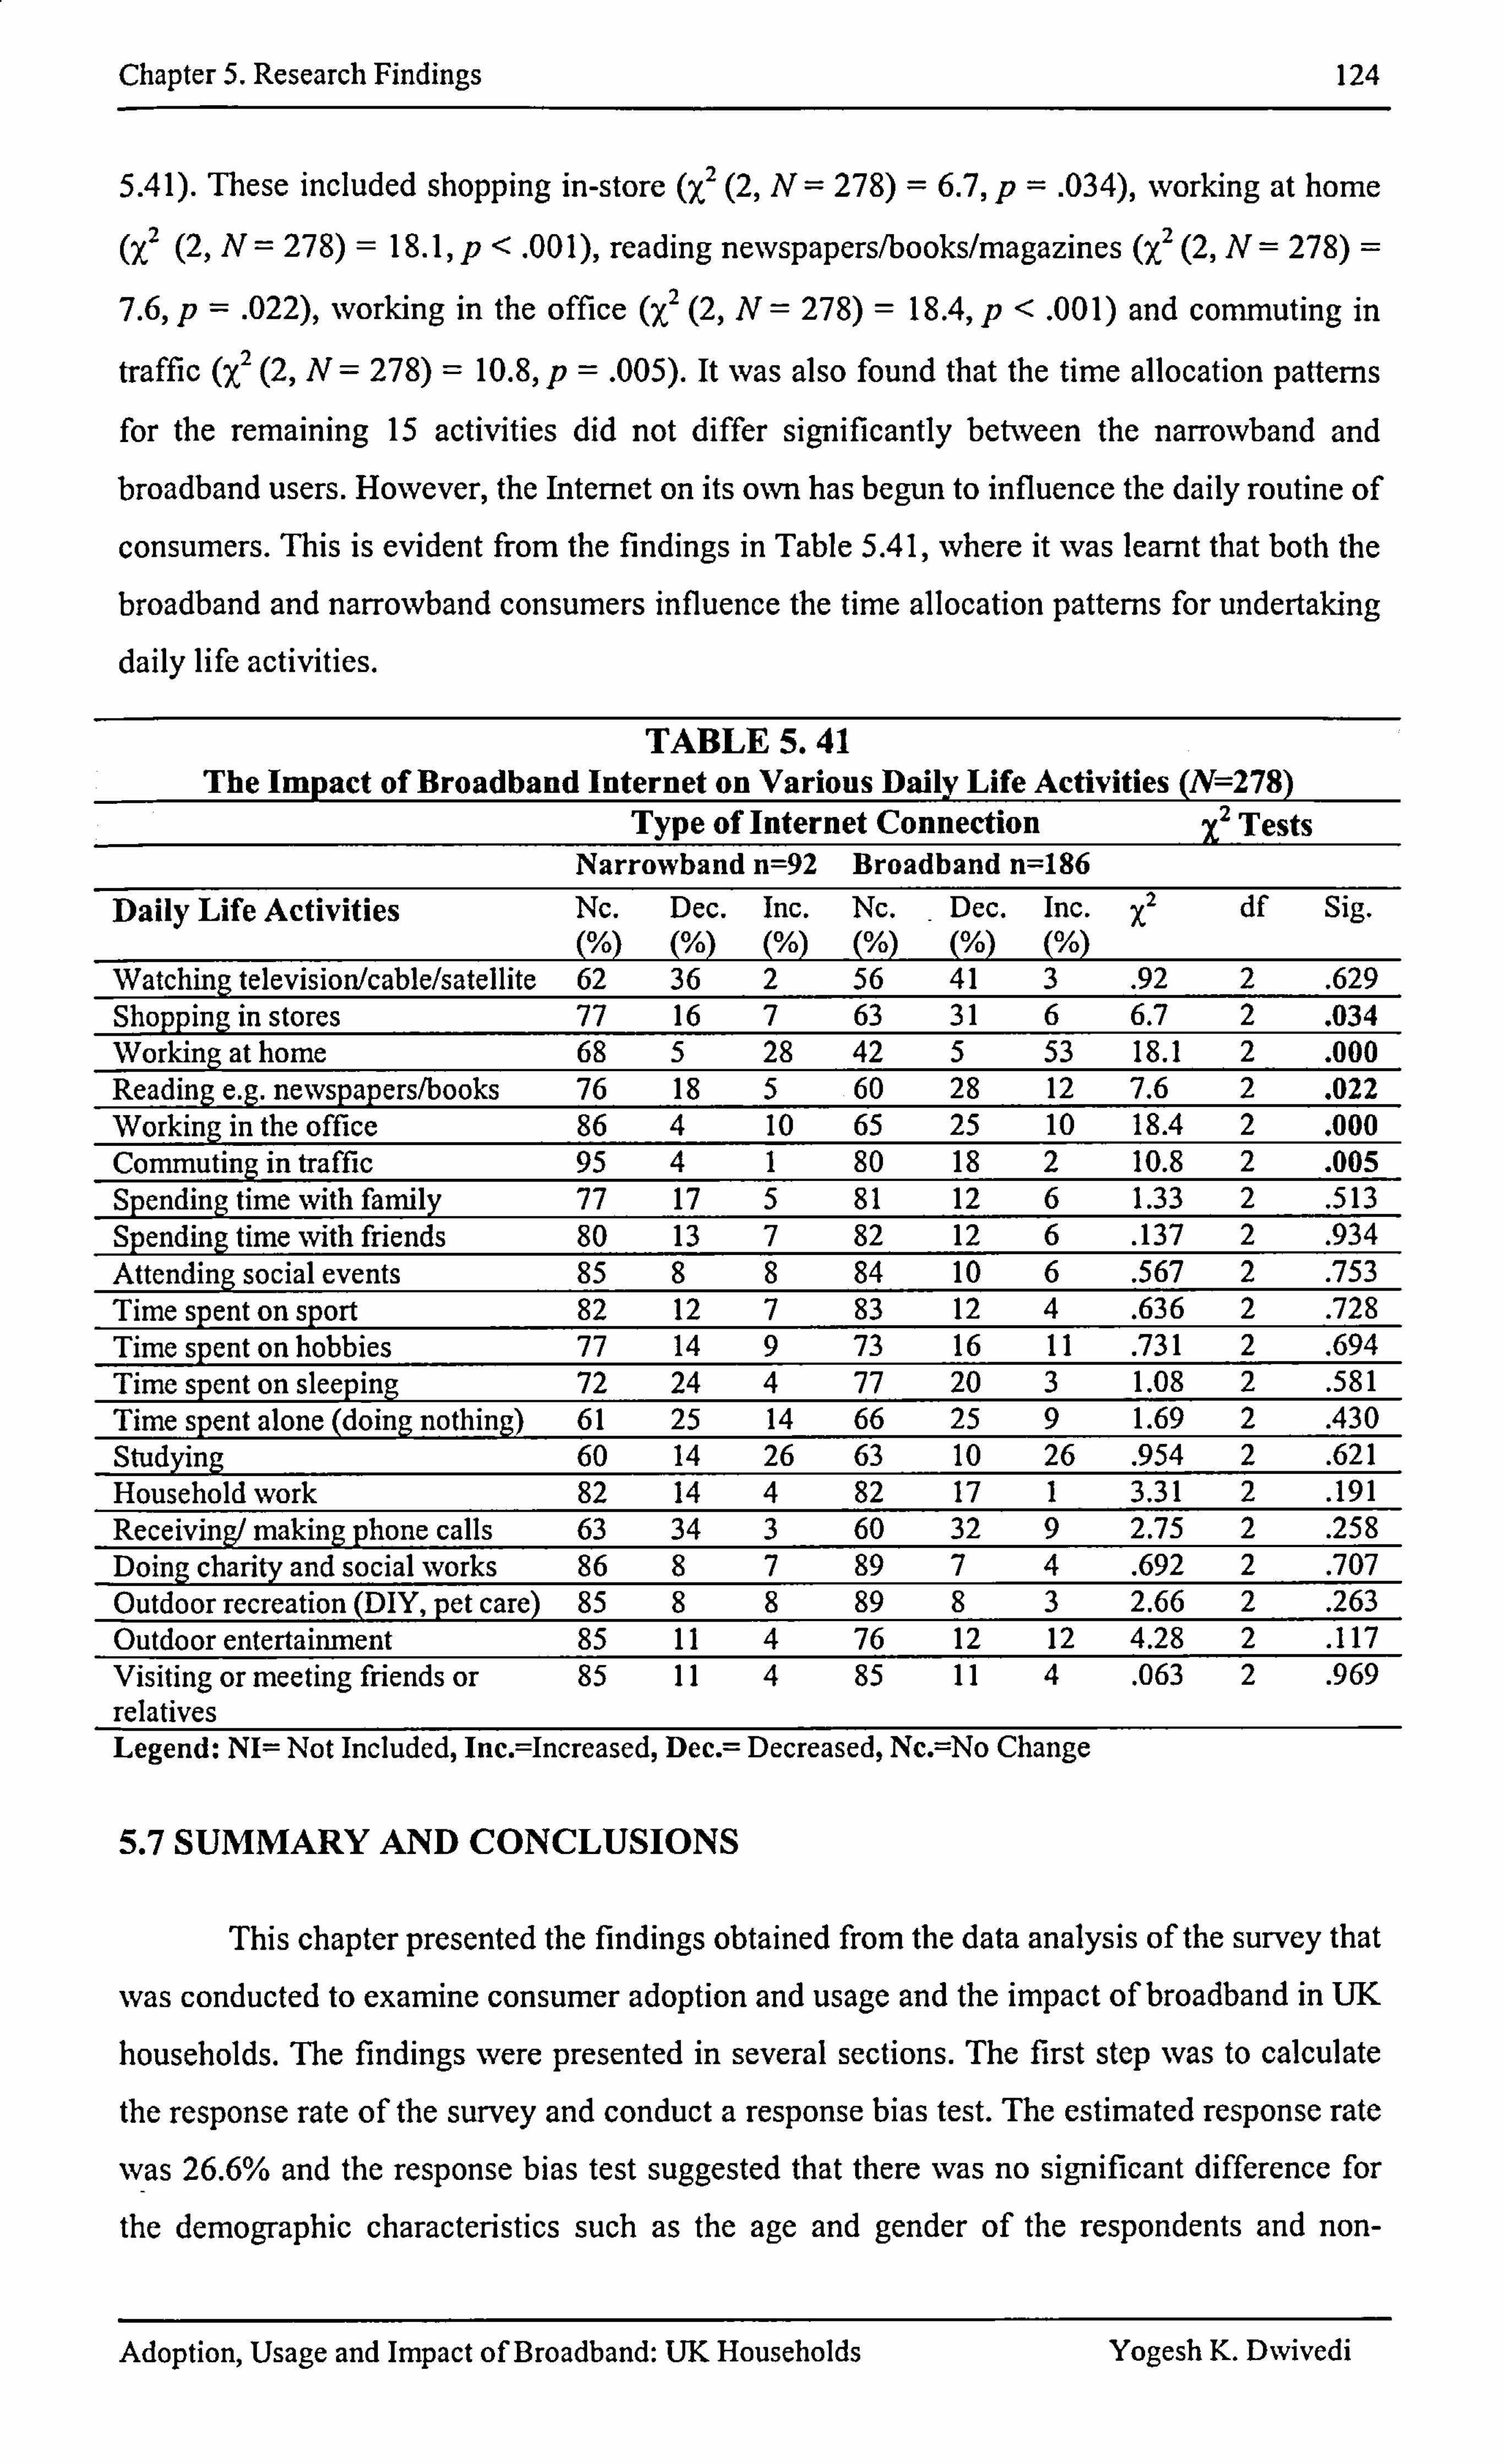
Chapter 5. Research Findings 124
5.41). These included shopping in-store (X2 (2, N= 278) = 6.7, p= . 034), working at home
(72 ,
(2, N= 278) = 18.1, p< . 001), reading newspapers/books/magazines (X 2 (2, N= 278)
7.6, p= . 022), working in the office (X 2 (2, N= 278) = 18.4, p< . 00 1) and commuting in
traffic (X2 (2, N= 278) = 10.8, p= . 005). It was also found that the time allocation patterns for the remaining 15 activities did not differ significantly between the narrowband and broadband users. However, the Internet on its own has begun to influence the daily routine of
consumers. This is evident from the findings in Table 5.41, where it was learnt that both the
broadband and narrowband consumers influence the time allocation patterns for undertaking daily life activities.
TABLE 5.41 The Impact of Broadband Internet on Various Dail y Life Activities ( N=278)
Type of Internet Connection x2 Tests Narrowband n=92 Broadband n=186
Daily Life Activities Nc. M
Dec. M
Inc. M
Nc. M
Dec. M
Inc. M
X2 df Sig.
Watching television/cable/satellite 62 36 2 56 41 3 . 92 2 . 629 Shopping in stores 77 16 7 63 31 6 6.7 2 . 034 Working at home 68 5 28 42 5 53 18.1 2 . 000 Reading e. g. newspapers/books 76 18 5 60 28 12 7.6 2 . 022 Working in the office 86 4 10 65 25 10 18.4 2 . 000 Commuting in traffic 95 4 1 80 18 2 10.8 2 . 005 Spending time with family 77 17 5 81 12 6 1.33 2 . 513 Spending time Nvith friends 80 13 7 82 12 6 . 137 2 . 934 Attending social events 85 8 8 84 10 6 . 567 2 . 753 Time spent on sport 82 12 7 83 12 4 . 636 2 . 728 Time spent on hobbies 77 14 9 73 16 11 . 731 2 . 694 Time spent on sleeping 72 24 4 77 20 3 1.08 2 . 581 Time spent alone (doing nothing) 61 25 14 66 25 9 1.69 2 . 430 Studying 60 14 26 63 10 26 . 954 2 . 621 Household Nvork 82 14 4 82 17 1 3.31 2 . 191 Receiving/ making phone calls 63 34 3 60 32 9 2.75 2 . 258 Doing cbarity and social works 86 8 7 89 7 4 . 692 2 . 707 Outdoor recreation (DIY, pet care) 85 8 8 89 8 3 2.66 2 . 263 Outdoor entertainment 85 11 4 76 12 12 4.28 2 . 117 Visiting or meeting friends or 85 11 4 85 11 4 . 063 2 . 969 relatives Legend: NI= Not Included, IncAncreased, Dec. = Decreased, Nc. =No Change
5.7 SUMMARY AND CONCLUSIONS
This chapter presented the findings obtained from the data analysis of the survey that
was conducted to examine consumer adoption and usage and the impact of broadband in UK
households. Ile findings were presented in several sections. The first step was to calculate
the response rate of the survey and conduct a response bias test. The estimated response rate
was 26.6% and the response bias test suggested that there was no significant difference for
the demographic characteristics such as the age and gender of the respondents and non-
Adoption, Usage and Impact of Broadband: UK Households Yogesh K. Dwivedi
Chapter 5. Research Findings 125
respondents. Also a response bias test showed no significant differences between the
responses of respondents and non-respondents with regards to key constructs such as relative
advantage, utilitarian outcome, hedonic outcome, service quality, secondary influence,
knowledge, self-efficacy and facilitating conditions resources.
Following the nonresponse bias test, there was a discussion of the validation and findings obtained on the adoption of broadband. The section initially presented findings that
illustrated the reliability test, construct validity and effect of the question ordering. The
reliability test confirmed that the measures are intemally consistent, as all the constructs
possessed a Cronbach's alpha above 0.70.
The construct validity was established utilising the PCA. The results of the PCA
provided evidence of higher KMO values (0.858), a significant probability of Bartlett's test
of sphericity (< . 001), extraction of components consistent with the number of independent
factors in the conceptual model (all the nine factors possessed eigenvalues above 1), factors
which all loaded above 0.40 and no cross loading above 0.40. This confirmed that both types
of the construct validity (i. e. convergent and discriminant) existed in the survey instrument.
A I-test was conducted to confirm if any difference occurred due to the ordering of
questionnaire items. The results indicated no significant differences between the responses
with or without the ordering of questionnaire items. This further strengthened the existence
of the construct validity in the survey instrument.
Findings from the descriptive statistics suggested that all the constructs except the
BISP rated strongly (mean above 3.5 at the 1-7 Likert scale). This suggested that the
respondents showed strong agreement in factors included in the study for examining the
adoption of broadband. There was then an examination of the differences between the
adopters and non-adopters of broadband, employing the Mest and discriminant analysis
techniques. The results from the I-test and discriminant analysis suggested that significant differences occur between the responses obtained from the narrowband and broadband
consumers with regards to attitudinal, normative and control constructs.
Examination of the demographic differences employing the chi-square test suggest
that broadband consumers differ significantly to narrowband consumers in terms of age,
education, occupation and income. Finally, the linear and logistic regression analysis
provided evidence that the attitudinal, non-native and control constructs (independent
variable) significantly explain bebavioural intentions which, along with the facilitating
conditions resources, significantly explain the broadband adoption behaviour.
The findings related to the usage of the Internet suggested that broadband consumers
significantly differ to narrowband users in terms of the online habits and variety of Internet
Adoption, Usage and Impact of Broadband: UK Households Yogesh K. Dwivedi
Chapter 5. Research Findings 126
use. When accessing or using 19 online services from an overall total of 41 services, the
numbers of broadband consumers were significantly higher than the narrowband ones.
The last section of this chapter examined the effects of broadband usage on a
consumer's time allocation pattern on twenty daily life activities. The findings suggest that for all twenty activities, broadband consumers' time allocation pattern differs to that of
narrowband consumers; however, the differences were found to be significant only for five
activities.
The next chapter (Chapter 6) will discuss the findings in light of the previous work. This chapter will provide a discussion on the validation of the instrument, model refinement,
and the usage and impact of broadband.
Adoption, Usage and Impact of Broadband: UK Households Yogesh K. Dwivedi

ChaPter 6. Discussion 127
6.1 INTRODUCTION
The previous chapter presented the findings obtained from a survey conducted to
examine adoption, usage and impact of broadband in UK households. The purpose of this
chapter is to discuss and reflect upon the findings from a theoretical perspective using those
provided in Chapter 2. It also discusses the empirical issues that have been reported from the
survey findings in the previous chapter.
This chapter is structured as follows. The next section (6.2) discusses the
appropriateness of the response rate of this survey in light of the existing work. Section 6.2
also discusses the non-response bias. Then Section 6.3 discusses the instrument validation
process by reflecting upon issues such as content validity, reliability and construct validity. After this, a summary of the hypotheses test is provided and discussed in Section 6.4.
Section 6.5 discusses and reflects upon the conceptual model of broadband adoption. The
usage of broadband and its effects on a consumer's time allocation pattern on various daily
life activities are illustrated in Section 6.6. Finally, the summary and conclusions of the
chapter are provided in Section 6.7.
6.2 RESPONSE RATE AND NON-RESPONSE BIAS
A 26.6% response rate was obtained in this research. Comford and Smithson (1996)
suggested that, within IS research, a response rate of 20% is considered to be acceptable and if the response rate is approximately 10% then that means the questionnaire design was poor (Comford and Smithson, 1996). According to Fowler (2002), the majority of surveys
produce response rates between two extreme values that are 5% at the lower end and 95% at the higher end, with response rates above 20% being considered as satisfactory (Fowler,
2002). Considering the above two reconunended levels (Comford and Smithson, 1996;
Fowler, 2002), the survey response of this research is considered to be satisfactory and
acceptable. However, despite the response rate, a non-response bias could arise in the findings.
Therefore it is essential to conduct a non-response bias test in order to demonstrate whether the non-respondents are similar to the respondents (Fowler, 2002; Karahanna et al, 1999).
Therefore, in this research a Mest was undertaken to deten-nine whether the characteristics of the respondents from the original responses are similar to the non-respondents. The Mest
was conducted for demographics (i. e. age and gender), Internet access at home, the type of internet connection at home, and all constructs from the attitudinal, normative and control
categories. The findings are illustrated in Table 5.1, which suggests that the demographics
and all key constructs except the primary influence of the study showed no significant
Adoption, Usage and Impact of Broadband: UK Households Yogesh K. Divivedi
Chapter 6. Discussion 128
differences between the respondents and non-respondents. There is a significant difference between the original responses and responses from the non-respondents for the primary influence construct. Since primary influence is the only construct of the 14 variables that was tested for the response bias and was found to be significant, it is possible that the no,, _ respondents were those who more influenced by primary influence. This suggests that those
non-respondents who returned the completed questionnaire after reminders were similar to the respondents from the original responses. Hence this provides evidence that within the
sample used for this research there are minimal chances that it is likely that data has a not, - response bias.
Recent studies have demonstrated that a low response rate in survey research does
not necessarily produce a non-response bias (Keeter et al, 2000; Karahanna el al, 1999).
Keeter et al's (2000) study compared two telephone surveys, in which the first one obtained
a 36% response and the second had a 60% response rate. This study reported that both the
surveys with a different response rate provided similar results with minor statistically
significant differences (Fowler, 2002; Keeter et al, 2000). In a study that employed the postal
questionnaire as a data collection tool, it was found that there were no significant differences
between the responses of respondents and non-respondents for both the demographic
variables and key constructs (Karahanna et al, 1999). Since this research reported similar findings as the previous two studies, it can be said that it is less likely that these findings are
affected by a non-response bias.
6.3 INSTRUMENT VALIDATION
To establish and demonstrate rigour in the findings of positivist research, validity
should be undertaken both prior to and afler final data collection (Straub et al, 2004). The
validation process suggested for application to the cases is one where research either utilises
previously validated instruments or creates new instruments (Straub el al, 2004, pp 412).
Although application of validation is recommended in both the aforementioned situations, it
is essential in the latter case where a study employs newly created instruments for data
collection (Straub et al, 2004, pp 414). Since this study created a new research instrument for
examining broadband adoption, usage and impact, the utmost care was taken to validate a
newly created instrument. The process of development and validation of the instrument is
already described in chapters 3,4 and 5. This section provides an overall picture of the
validation process and also briefly discusses if the undertaken validity measures and their
outcomes are on a par with the recommendations made in IS research.
The recommended validities include content validity, construct validity, reliability,
manipulation validity and the common method bias (Straub et al, 2004). Amongst the
Adoption, Usage and Impact of Broadband: LTK Households Yogesh K. D%vivedi
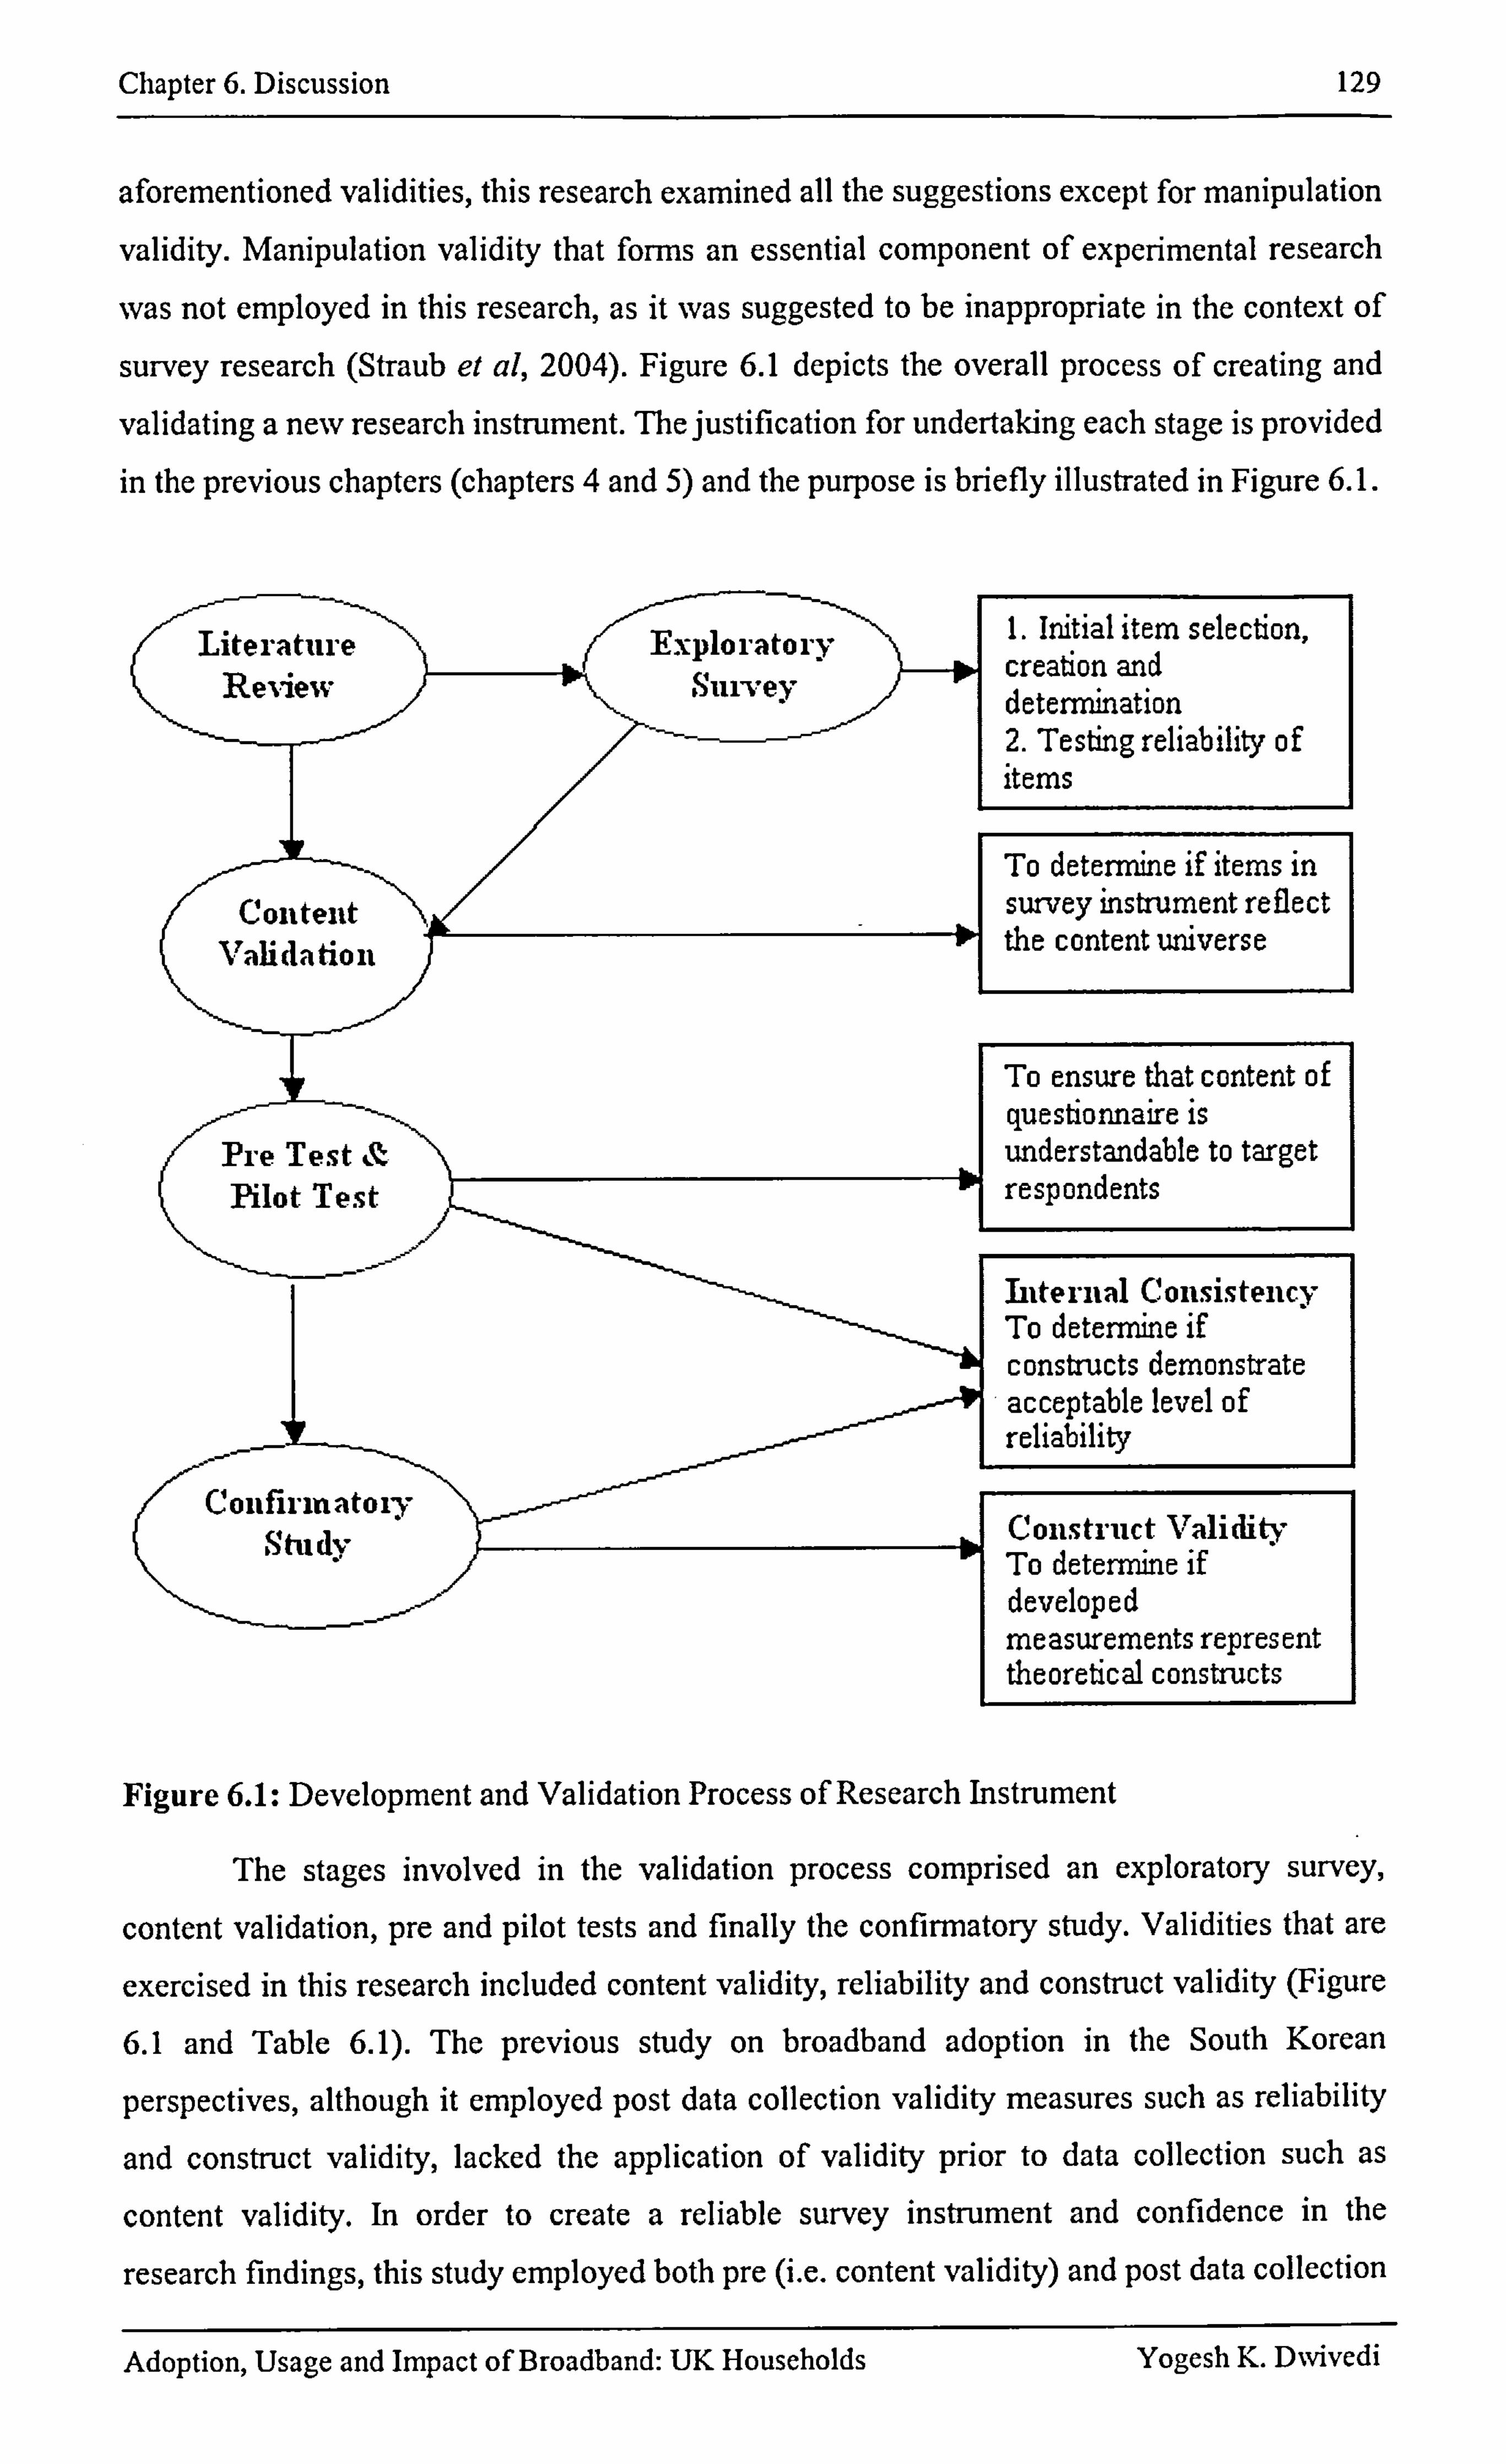
Chapter 6. Discussion 129
aforementioned validities, this researcb examined all the suggestions except for manipulation
validity. Manipulation validity that forms an essential component of experimental research
was not employed in this research, as it was suggested to be inappropriate in the context of
survey research (Straub et al, 2004). Figure 6.1 depicts the overall process of creating and
validating a new research instrument. The justification for undertaking each stage is provided in the previous chapters (chapters 4 and 5) and the purpose is briefly illustrated in Figure 6.1.
Literature Rexiew
Content Validation
Exploratory Survey
1. Initial item selection, creation and determination 2. Testing reliability of items
Pre Test & Pilot Test
collfirmatory S tu dy
To determine if items in survey instrument reflect the content universe
To ensure that content of questionnaire is understandable to target respondents
Internal Consistency To determine if constructs demonstrate acceptable level of reliability
Constrild Validity To deternune if developed measurements represent theoretical constructs
Figure 6.1: Development and Validation Process of Research Instrument
The stages involved in the validation process comprised an exploratory survey,
content validation, pre and pilot tests and finally the confirmatory study. Validities that are
exercised in this research included content validity, reliability and construct validity (Figure
6.1 and Table 6.1). The previous study on broadband adoption in the South Korean
perspectives, although it employed post data collection validity measures such as reliability
and construct validity, lacked the application of validity prior to data collection such as
content validity. In order to create a reliable survey instrument and confidence in the
research findings, this study employed both pre (i. e. content validity) and post data collection
Adoption, Usage and Impact of Broadband: UK Households Yogesh K. DNvivedi
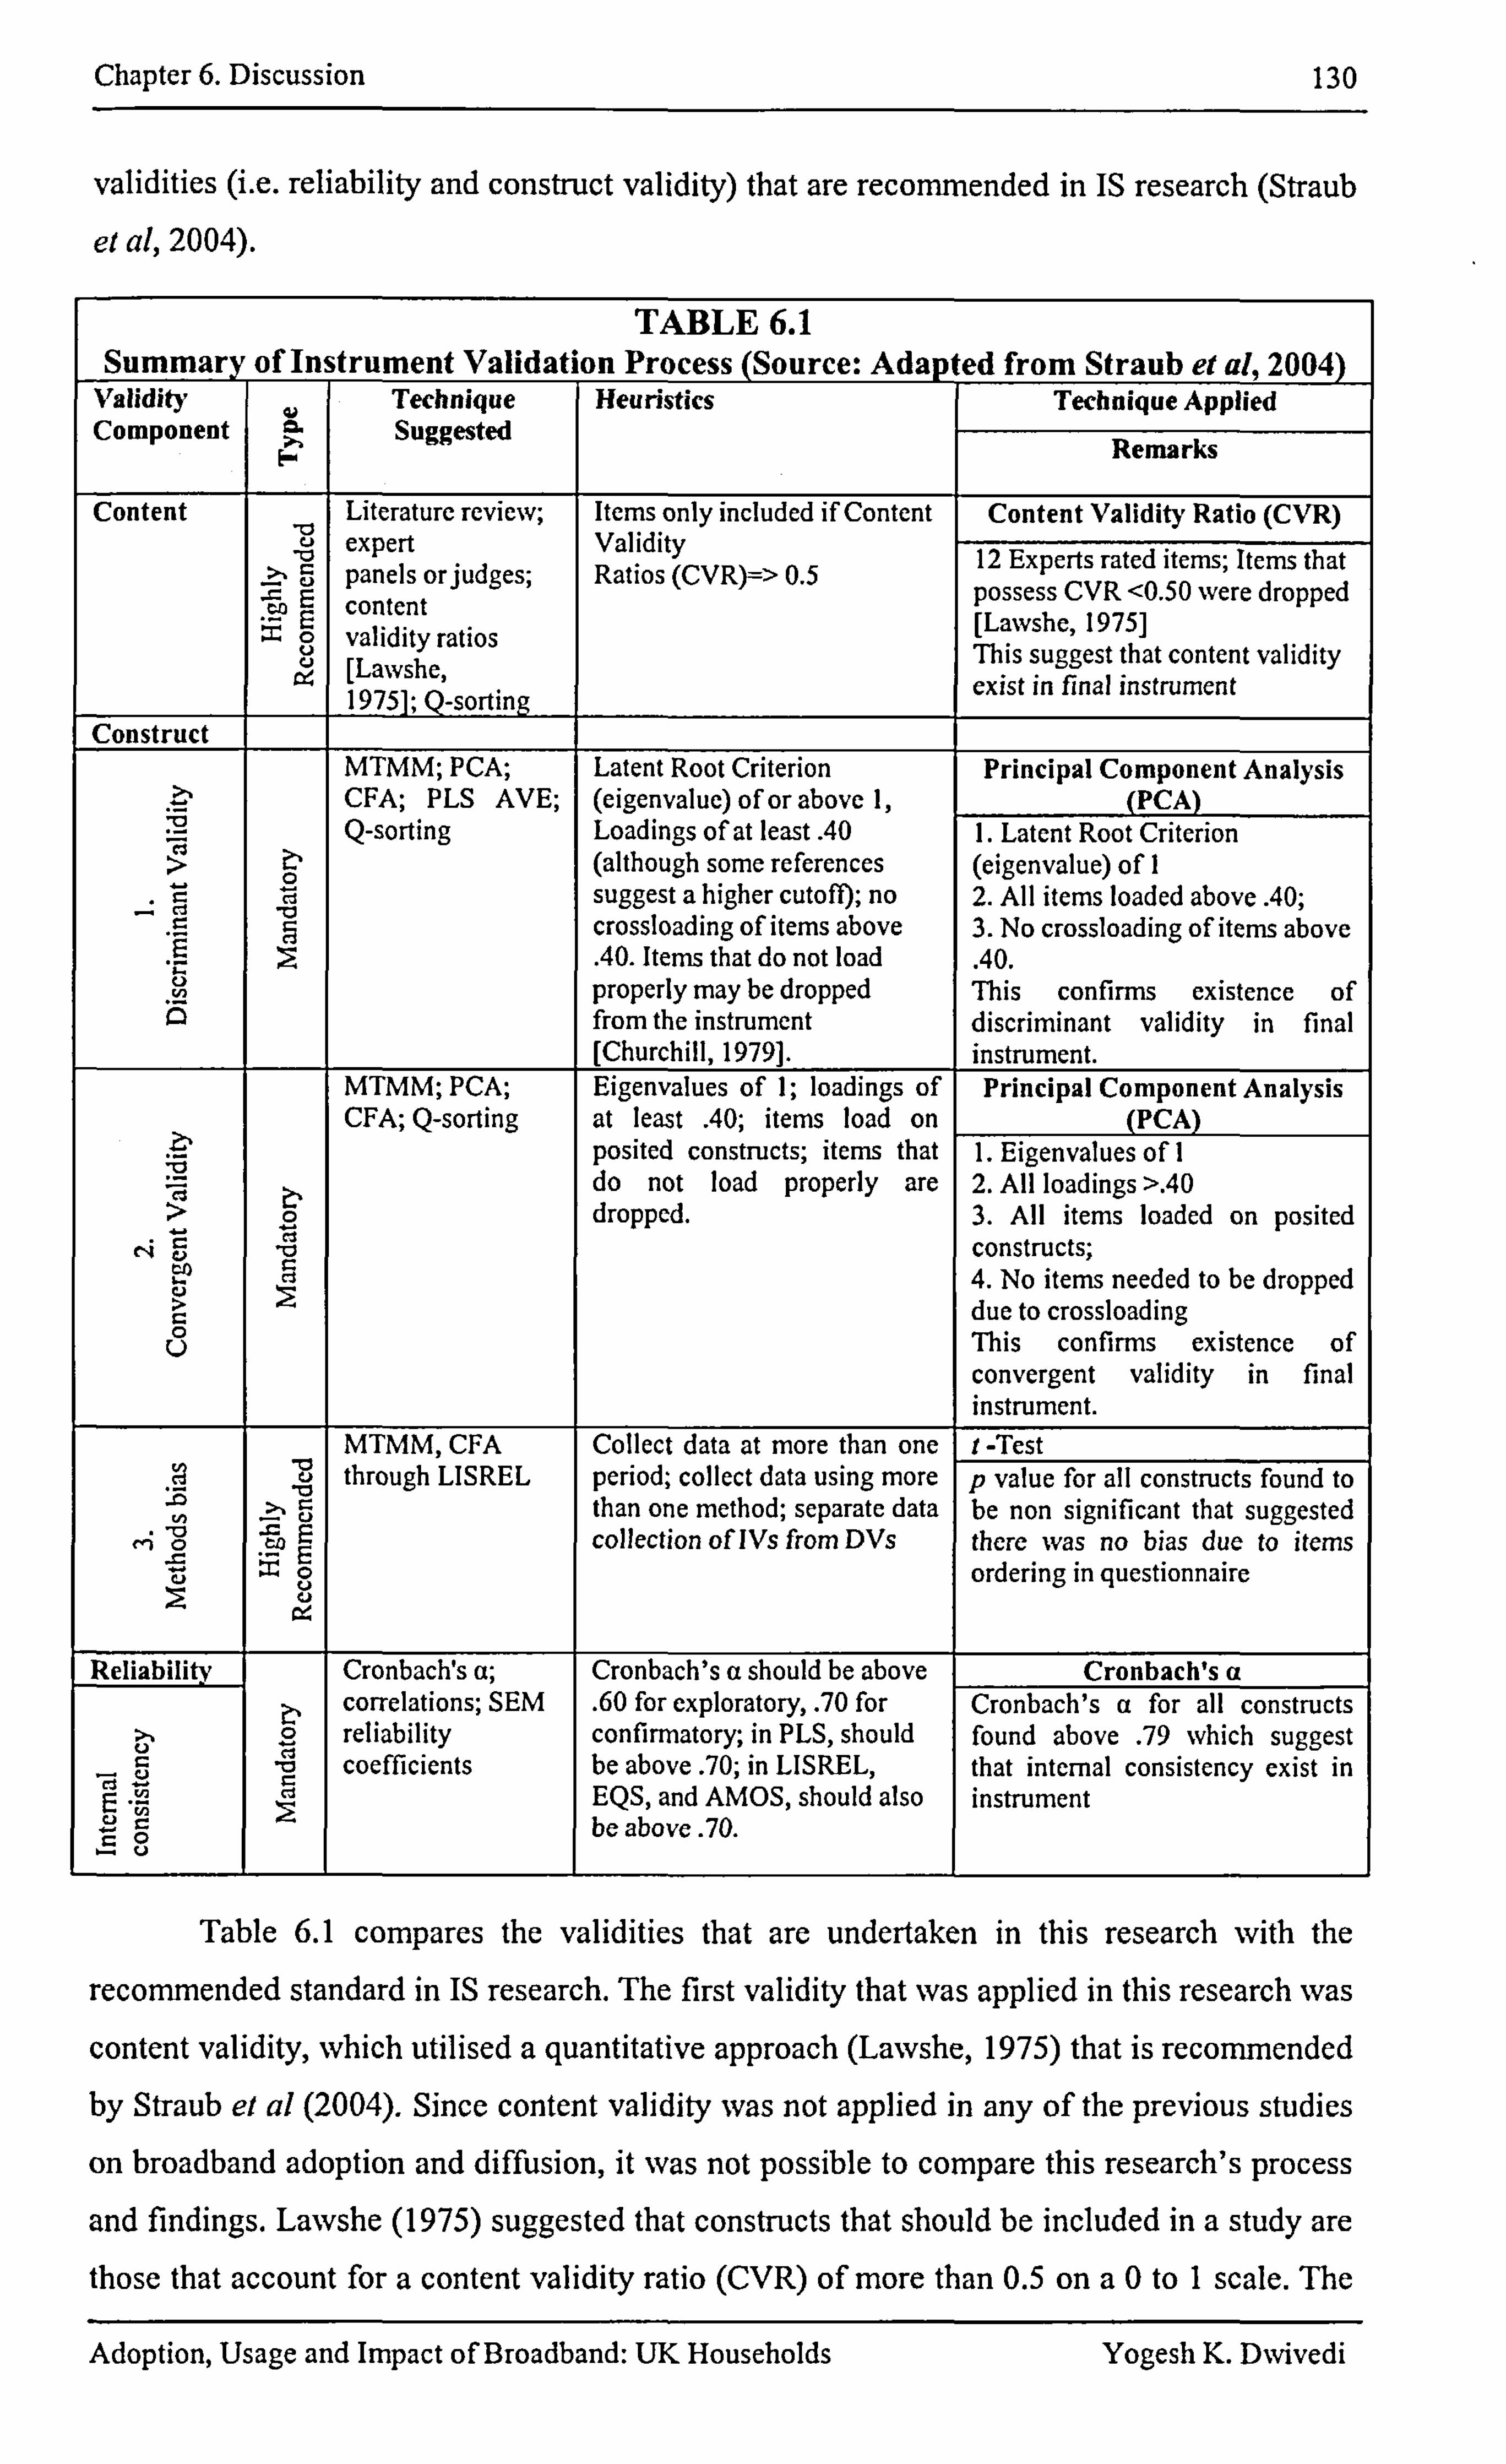
Chapter 6. Discussion 130
validities (i. e. reliability and construct validity) that are recommended in IS research (Straub
ef al, 2004).
TABLE 6.1 Summar of Instrument Validation Process (Source: Ada
Validity Technique Heuristics Component Suggested
k- Content Literature review; Items only included if Content
expert Validity >, panels orjudges; Ratios (CVR)=> 0.5
E E content
validity ratios [Lawshe,
Construct >..
cd E
0
C)
0 U
2 _iz 2
. _a fn 0
E ci
0 d
Z,
b
5
MTMM; PCA; CFA; PLS AVE; Q-sorting
MTMM; PCA; CFA; Q-sorting
Latent Root Criterion (eigenvalue) of or above 1, Loadings of at least . 40 (although some references suggest a higher cutoff); no crossloading of items above . 40. Items that do not load properly may be dropped from the instrument [Churchill, 1979]. Eigenvalues of 1; loadings of at least
. 40; items load on posited constructs; items that do not load properly are dropped.
ýE
"0 E
MTMM, CFA through LISREL
Collect data at more than one period; collect data using more than one method; separate data collection of Ws from DVs
Cd
Cronbach's a; correlations; SEM reliability coefficients
Cronbach's a should be above . 60 for exploratory, . 70 for confirmatory; in PLS, should be above. 70; in LISREL, EQS, and AMOS, should also be above . 70.
from Straub et al, ý Technique Applied
Remarks
Content Validity Ratio (CVR)
12 Experts rated items; Items that possess CVR <0.50 were dropped [Lawsbe, 1975] This suggest that content validity exist in final instrument
Principal Component Analysis
1. Latent Root Criterion (eigenvalue) of 1 2. All items loaded abovc. 40; 3. No crossloading of items above . 40. This confirms existence of discriminant validity in final instrument. Principal Component Analysis
1. Eigenvalues of 1 2. All loadings >. 40 3. All items loaded on posited constructs; 4. No items needed to be dropped due to crossloading This confirms existence of convergent validity in final instrument. i -Test p value for all constructs found to be non significant that suggested there was no bias due to items ordering in questionnaire
Cronbach's a Cronbach's a for all constructs found above . 79 which suggest that internal consistency exist in instrument
Table 6.1 compares the validities that are undertaken in this research with the
recominended standard in IS research. The first validity that was applied in this research was
content validity, which utilised a quantitative approach (Lawshe, 1975) that is recommended by Straub et al (2004). Since content validity was not applied in any of the previous studies
on broadband adoption and diffusion, it was not possible to compare this research's process
and findings. Lawshe (1975) suggested that constructs that should be included in a study are those that account for a content validity ratio (CVR) of more than 0.5 on a0 to I scale. The
Adoption, Usage and Impact of Broadband: UK Households Yogesh K. DNvivedi
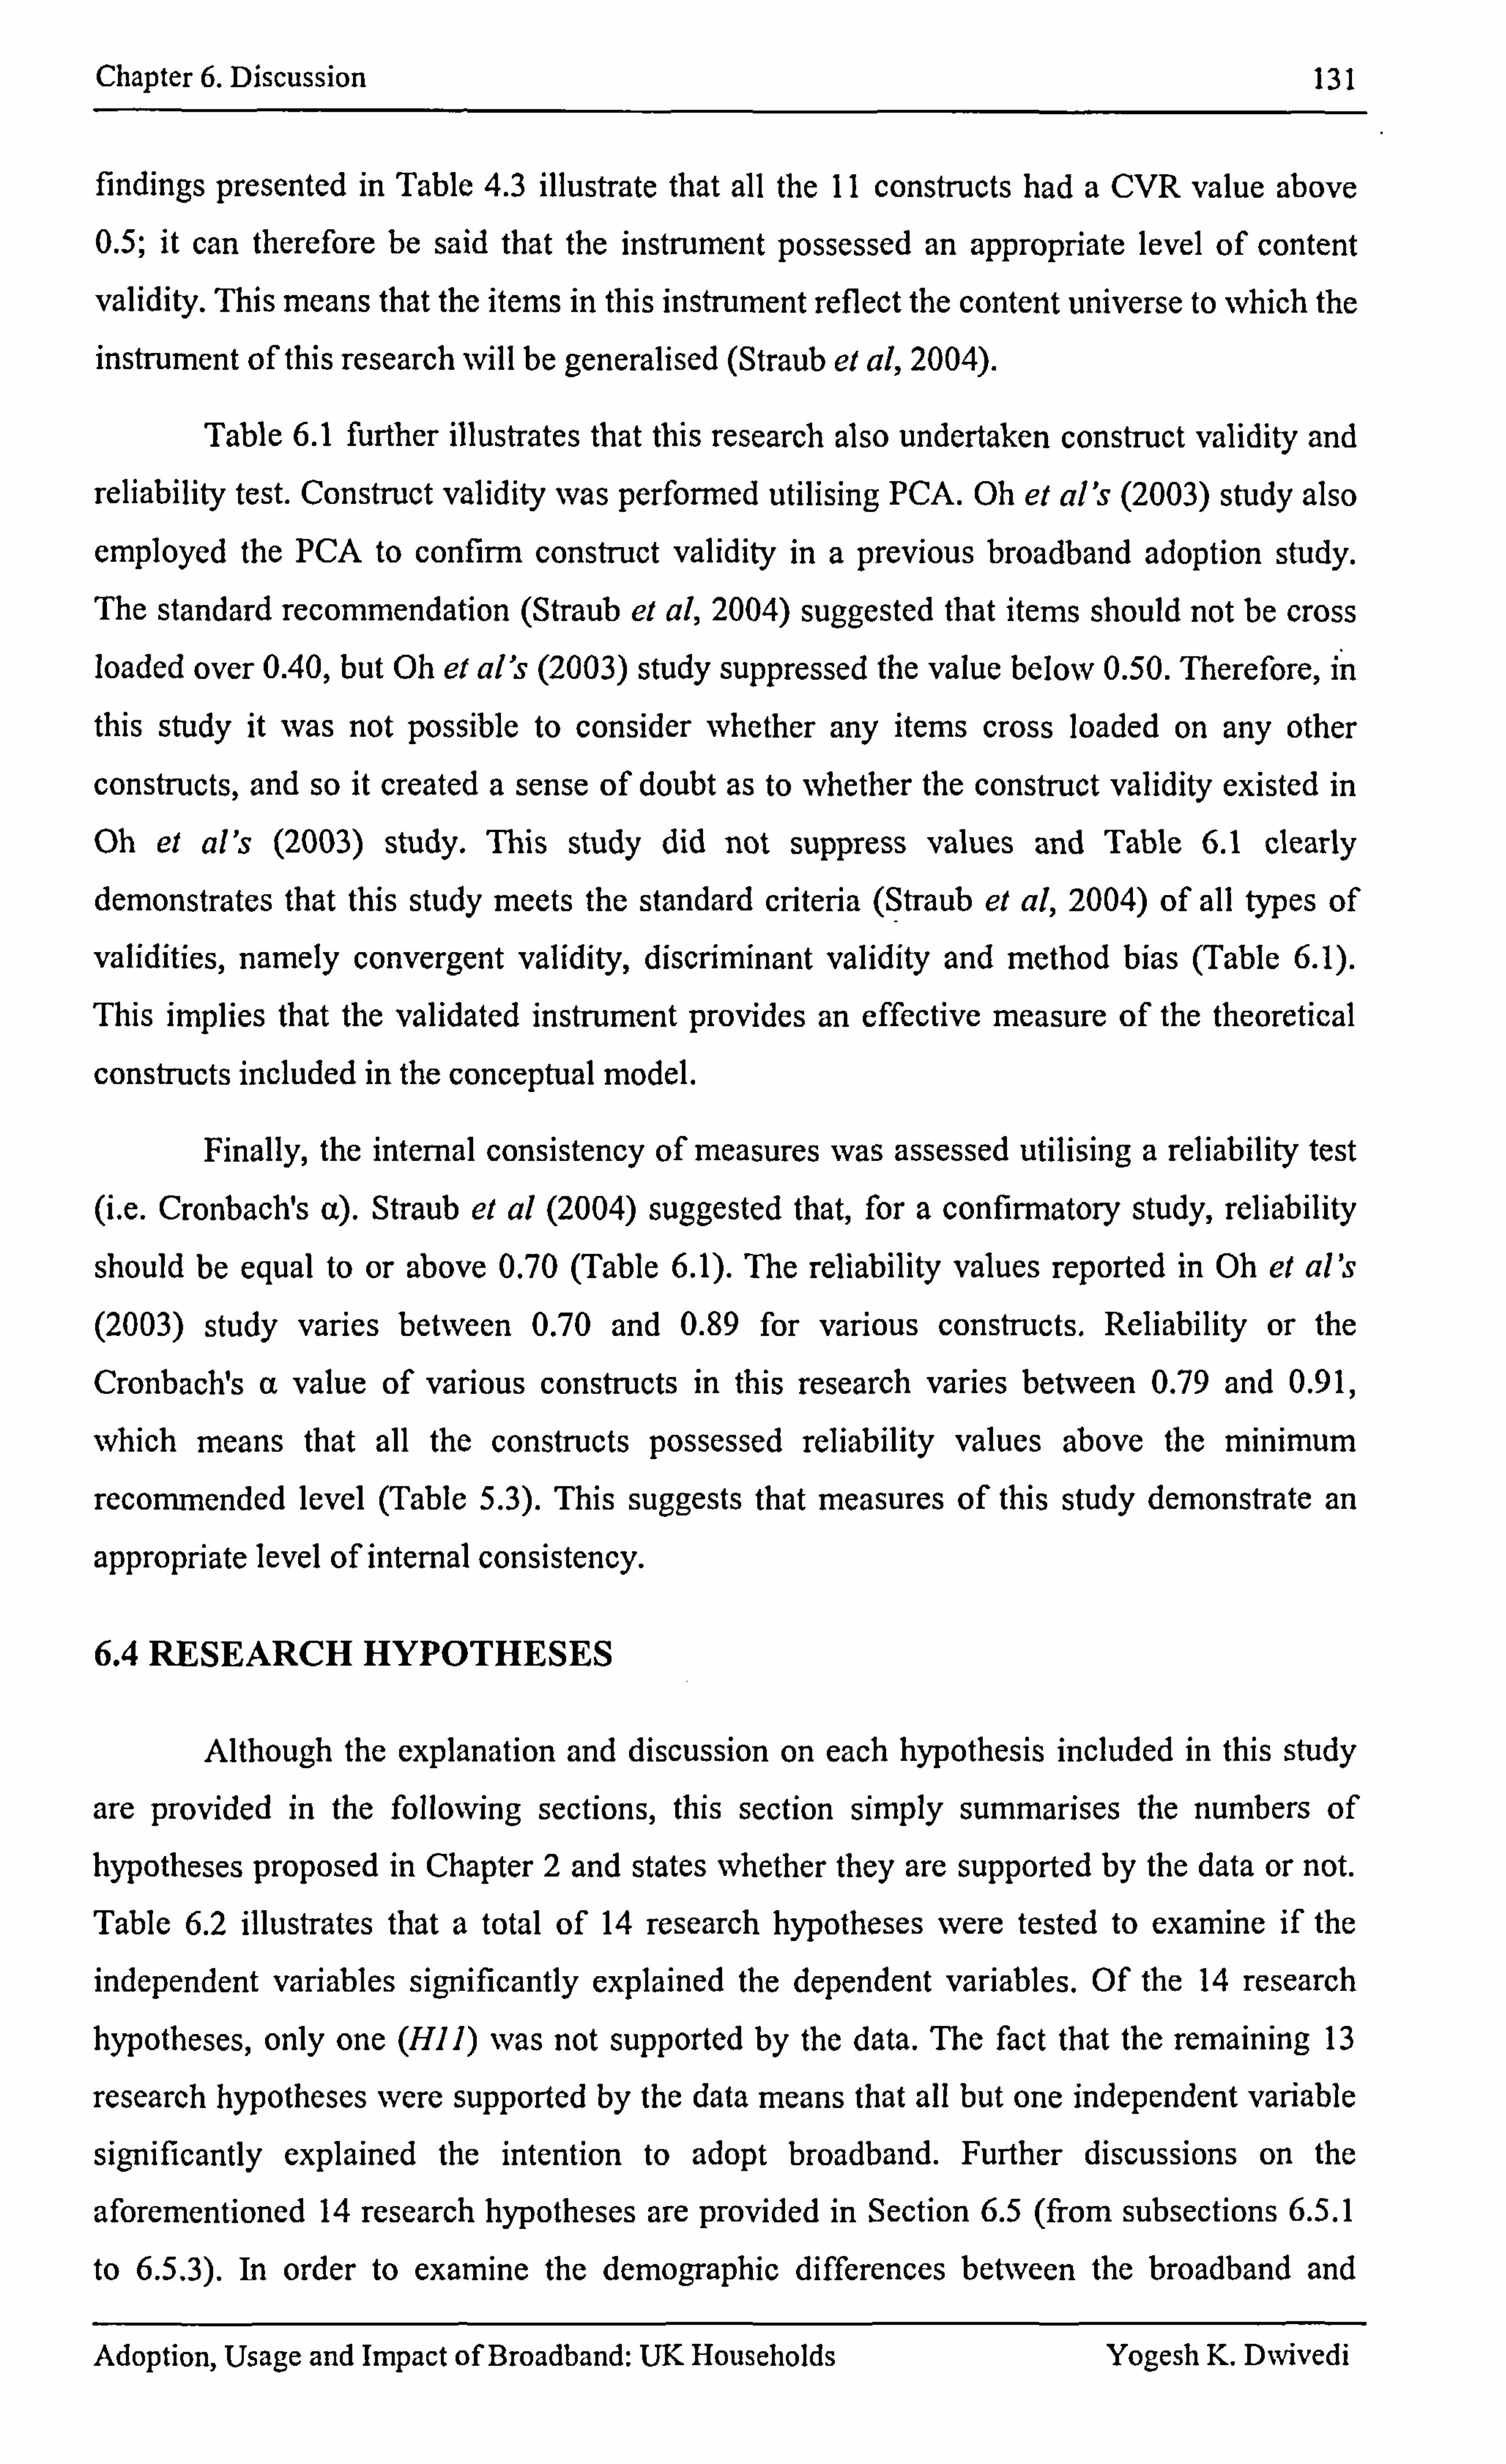
Chapter 6. Discussion 131
findings presented in Table 4.3 illustrate that all the II constructs had a CVR value above 0.5; it can therefore be said that the instrument possessed an appropriate level of content
validity. This means that the items in this instrument reflect the content universe to which the instrument of this research will be generalised (Straub et al, 2004).
Table 6.1 further illustrates that this research also undertaken construct validity and
reliability test. Construct validity was performed utilising PCA. Oh et al's (2003) study also
employed the PCA to confirm construct validity in a previous broadband adoption study. The standard recommendation (Straub et al, 2004) suggested that items should not be cross loaded over 0.40, but Oh et al's (2003) study suppressed the value below 0.50. Therefore, in
this study it was not possible to consider whether any items cross loaded on any other
constructs, and so it created a sense of doubt as to whether the construct validity existed in
Oh el al's (2003) study. This study did not suppress values and Table 6.1 clearly demonstrates that this study meets the standard criteria (Straub et al, 2004) of all types of
validities, namely convergent validity, discriminant validity and method bias (Table 6.1).
This implies that the validated instrument provides an effective measure of the theoretical
constructs included in the conceptual model.
Finally, the internal consistency of measures was assessed utilising a reliability test
(i. e. Cronbach's a). Straub et al (2004) suggested that, for a confirmatory study, reliability
should be equal to or above 0.70 (Table 6.1). The reliability values reported in Oh et al's (2003) study varies between 0.70 and 0.89 for various constructs. Reliability or the
Cronbach's a value of various constructs in this research varies between 0.79 and 0.91,
which means that all the constructs possessed reliability values above the minimum
recommended level (Table 5.3). This suggests that measures of this study demonstrate an
appropriate level of internal consistency.
6.4 RESEARCH HYPOTHESES
Although the explanation and discussion on each hypothesis included in this study
are provided in the following sections, this section simply summarises the numbers of hypotheses proposed in Chapter 2 and states whether they are supported by the data or not. Table 6.2 illustrates that a total of 14 research hypotheses were tested to examine if the
independent variables significantly explained the dependent variables. Of the 14 research hypotheses, only one (HII) was not supported by the data. The fact that the remaining 13
research hypotheses were supported by the data means that all but one independent variable
significantly explained the intention to adopt broadband. Further discussions on the
aforementioned 14 research hypotheses are provided in Section 6.5 (from subsections 6.5.1
to 6.5.3). In order to examine the demographic differences between the broadband and
Adoption, Usage and Impact of Broadband: UK Households Yogesh K. DNvivedi
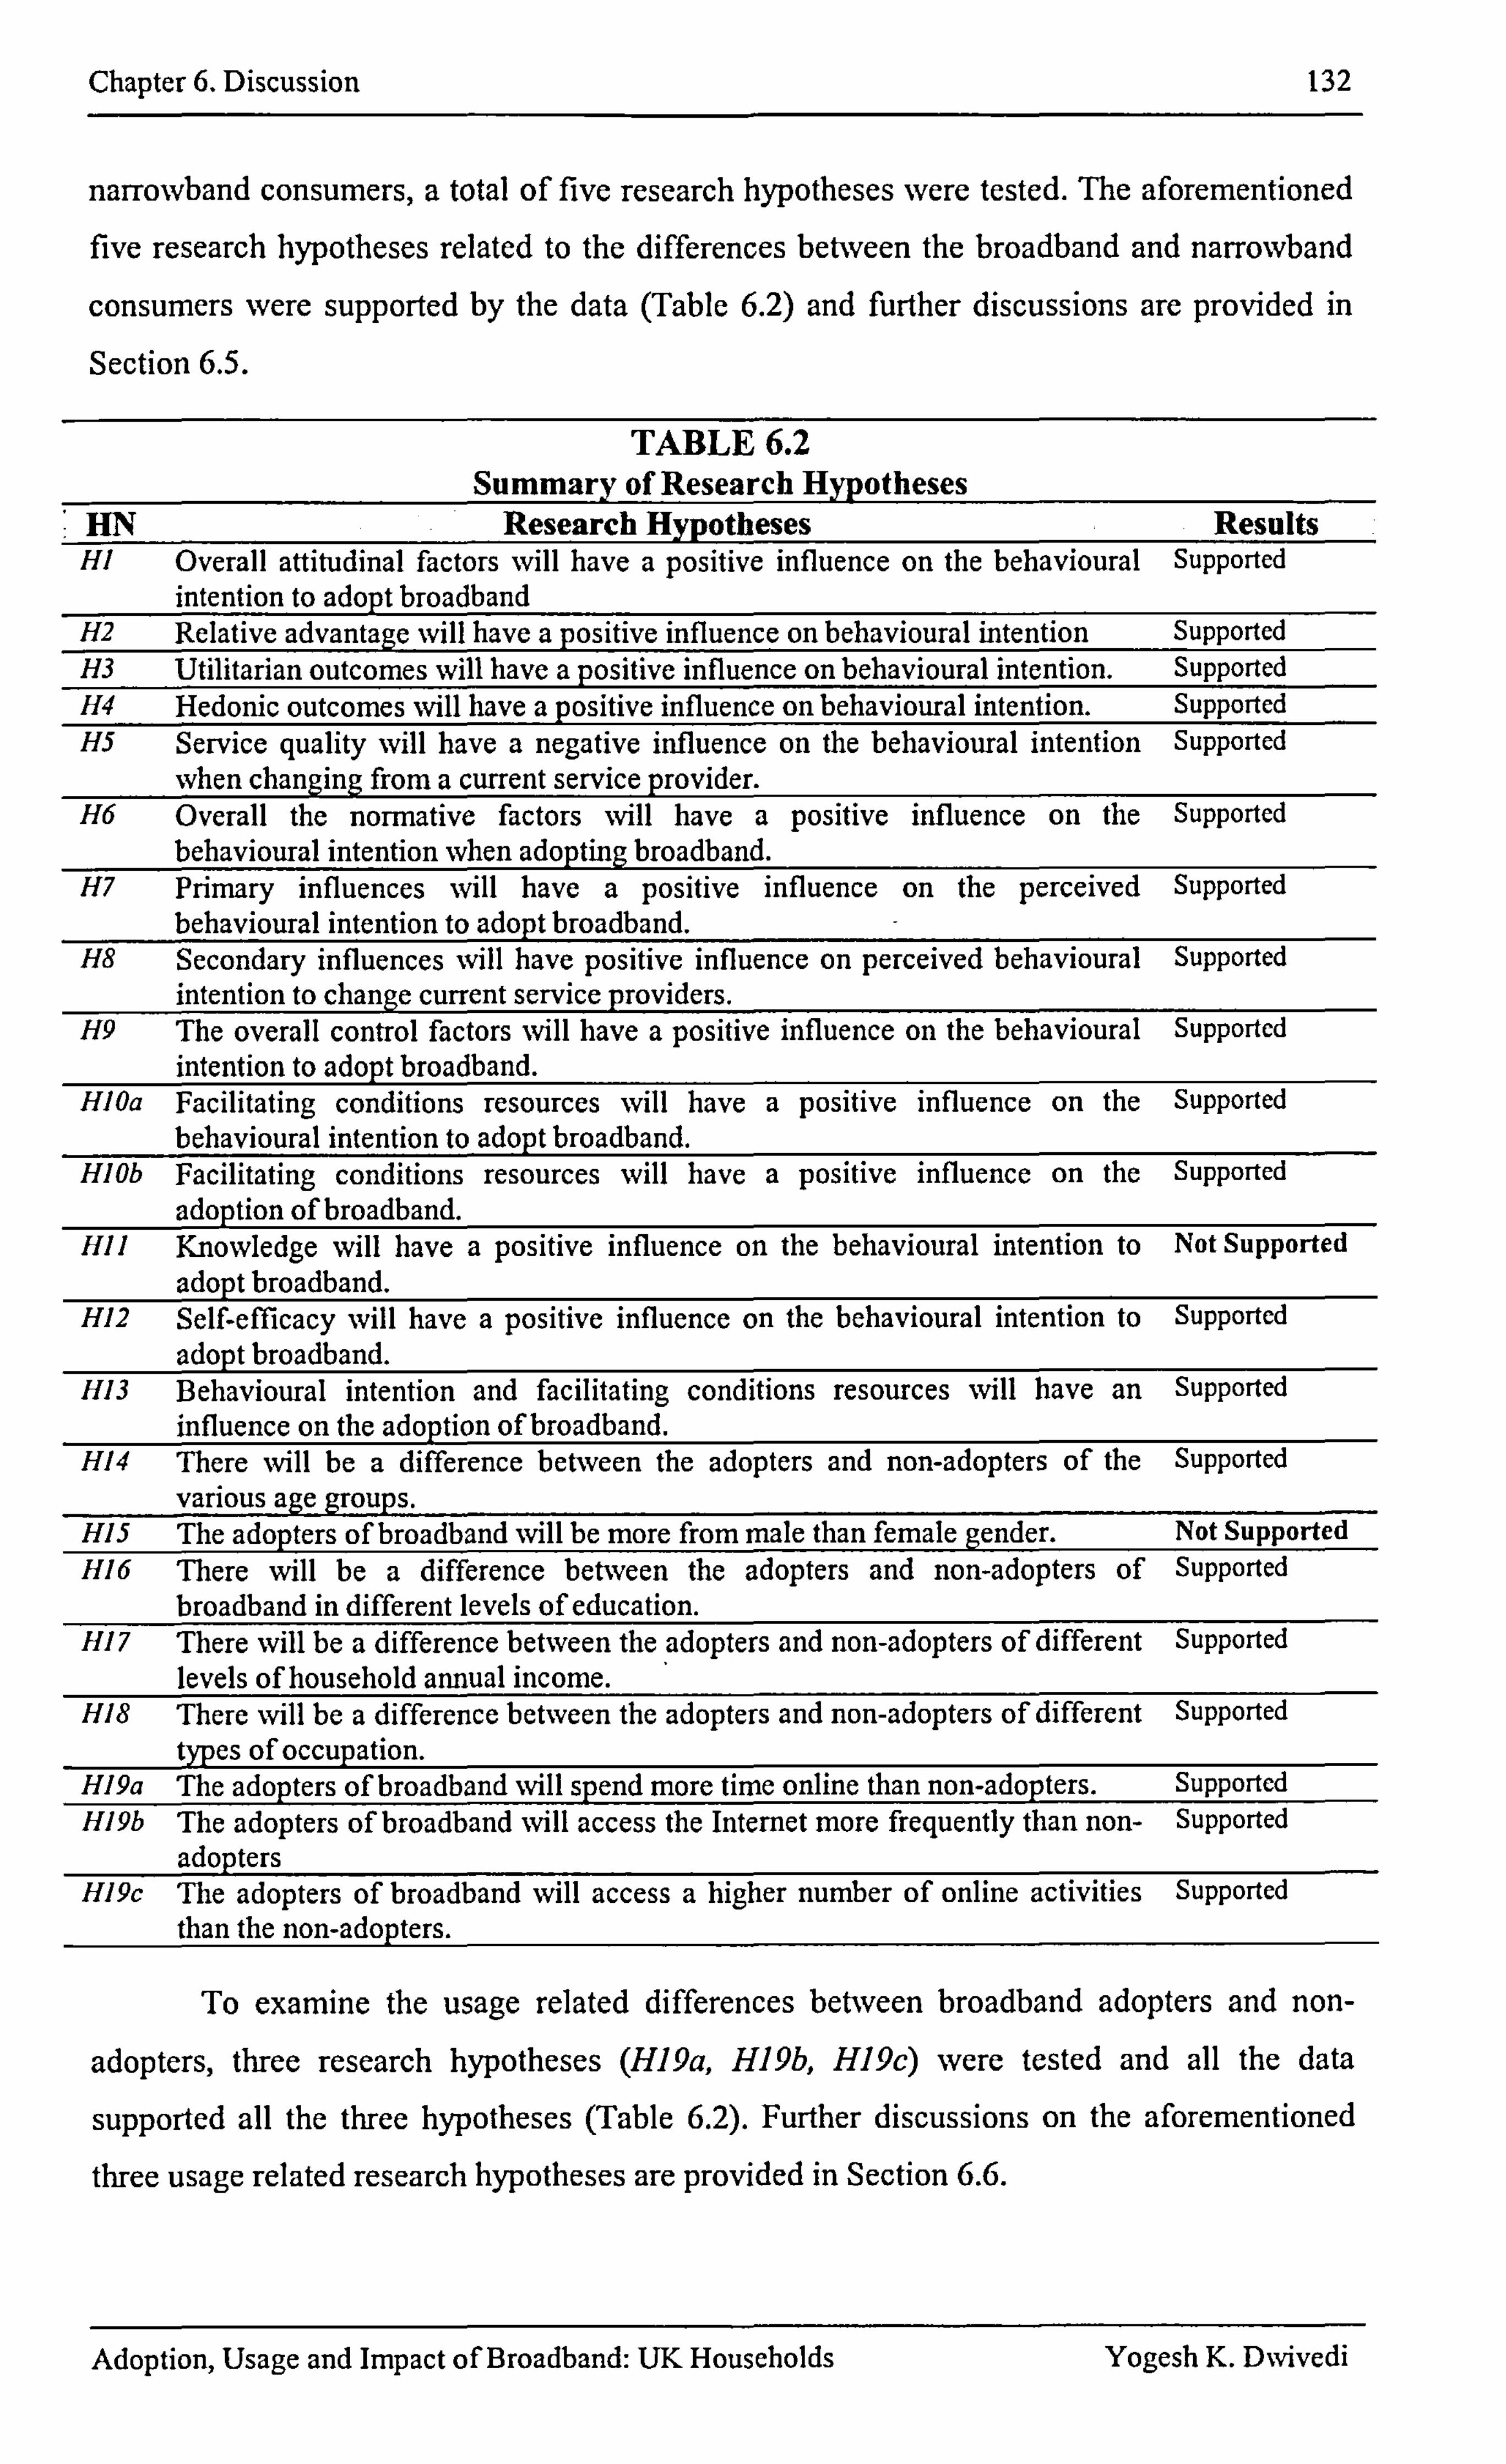
Chapter 6. Discussion 132
narrowband consumers, a total of five research hypotheses were tested. The aforementioned five research hypotheses related to the differences between the broadband and narrowband
consumers were supported by the data (Table 6.2) and further discussions are provided in
Section 6.5.
TABLE 6.2 Summary of Research Hypotheses
HN Research Hypotheses Results HI Overall attitudinal factors will have a positive influence on the behavioural Supported
intention to adopt broadband H2 Relative advantage will have a positive influence on behavioural intention Supported H3 Utilitarian outcomes will have a positive influence on behavioural intention. Supported H4 Hedonic outcomes will have a positive influence on behavioural intention. Supported H5 Service quality will have a negative influence on the behavioural intention Supported
when changing from a current service provider. H6 Overall the normative factors will have a positive influence on the Supported
behavioural intention when adopting broadband. H7 Primary influences will have a positive influence on the perceived Supported
behavioural intention to adopt broadband. H8 Secondary influences will have positive influence on perceived behavioural Supported
intention to change current service providers, H9 The overall control factors will have a positive influence on the behavioural Supported
intention to adopt broadband. H10a Facilitating conditions resources will have a positive influence on the Supported
behavioural intention to adopt broadband. H10b Facilitating conditions resources will have a positive influence on the Supported
adoption of broadband. HII Knowledge will have a positive influence on the behavioural intention to Not Supported
adoptbroadband. H12 Self-efficacy will have a positive influence on the behavioural intention to Supported
adoptbroadband. H13 Behavioural intention and facilitating conditions resources will have an Supported
influence on the adoption of broadband. H14 There will be a difference between the adopters and non-adopters of the Supported
various age groups. H15 The adopters of broadband will be more from male than female gender. Not Supported H16 There will be a difference between the adopters and non-adopters of Supported
broadband in different levels of education. H17 There will be a difference between the adopters and non-adopters of different Supported
levels of household annual income. H18 There will be a difference between the adopters and non-adopters of different Supported
types of occupation. H19a The adopters of broadband will spend more time online than non-adopters. Supported H19b The adopters of broadband will access the Internet more frequently than non- Supported
adopters H19c The adopters of broadband will access a higher number of online activities Supported
than the non-adopters.
To examine the usage related differences between broadband adopters and non-
adopters, three research hypotheses (H19a, H19b, H19c) were tested and all the data
supported all the three hypotheses (Table 6.2). Further discussions on the aforementioned
three usage related research hypotheses are provided in Section 6.6.
Adoption, Usage and Impact of Broadband: UK Housebolds Yogesh K. D%vivedi
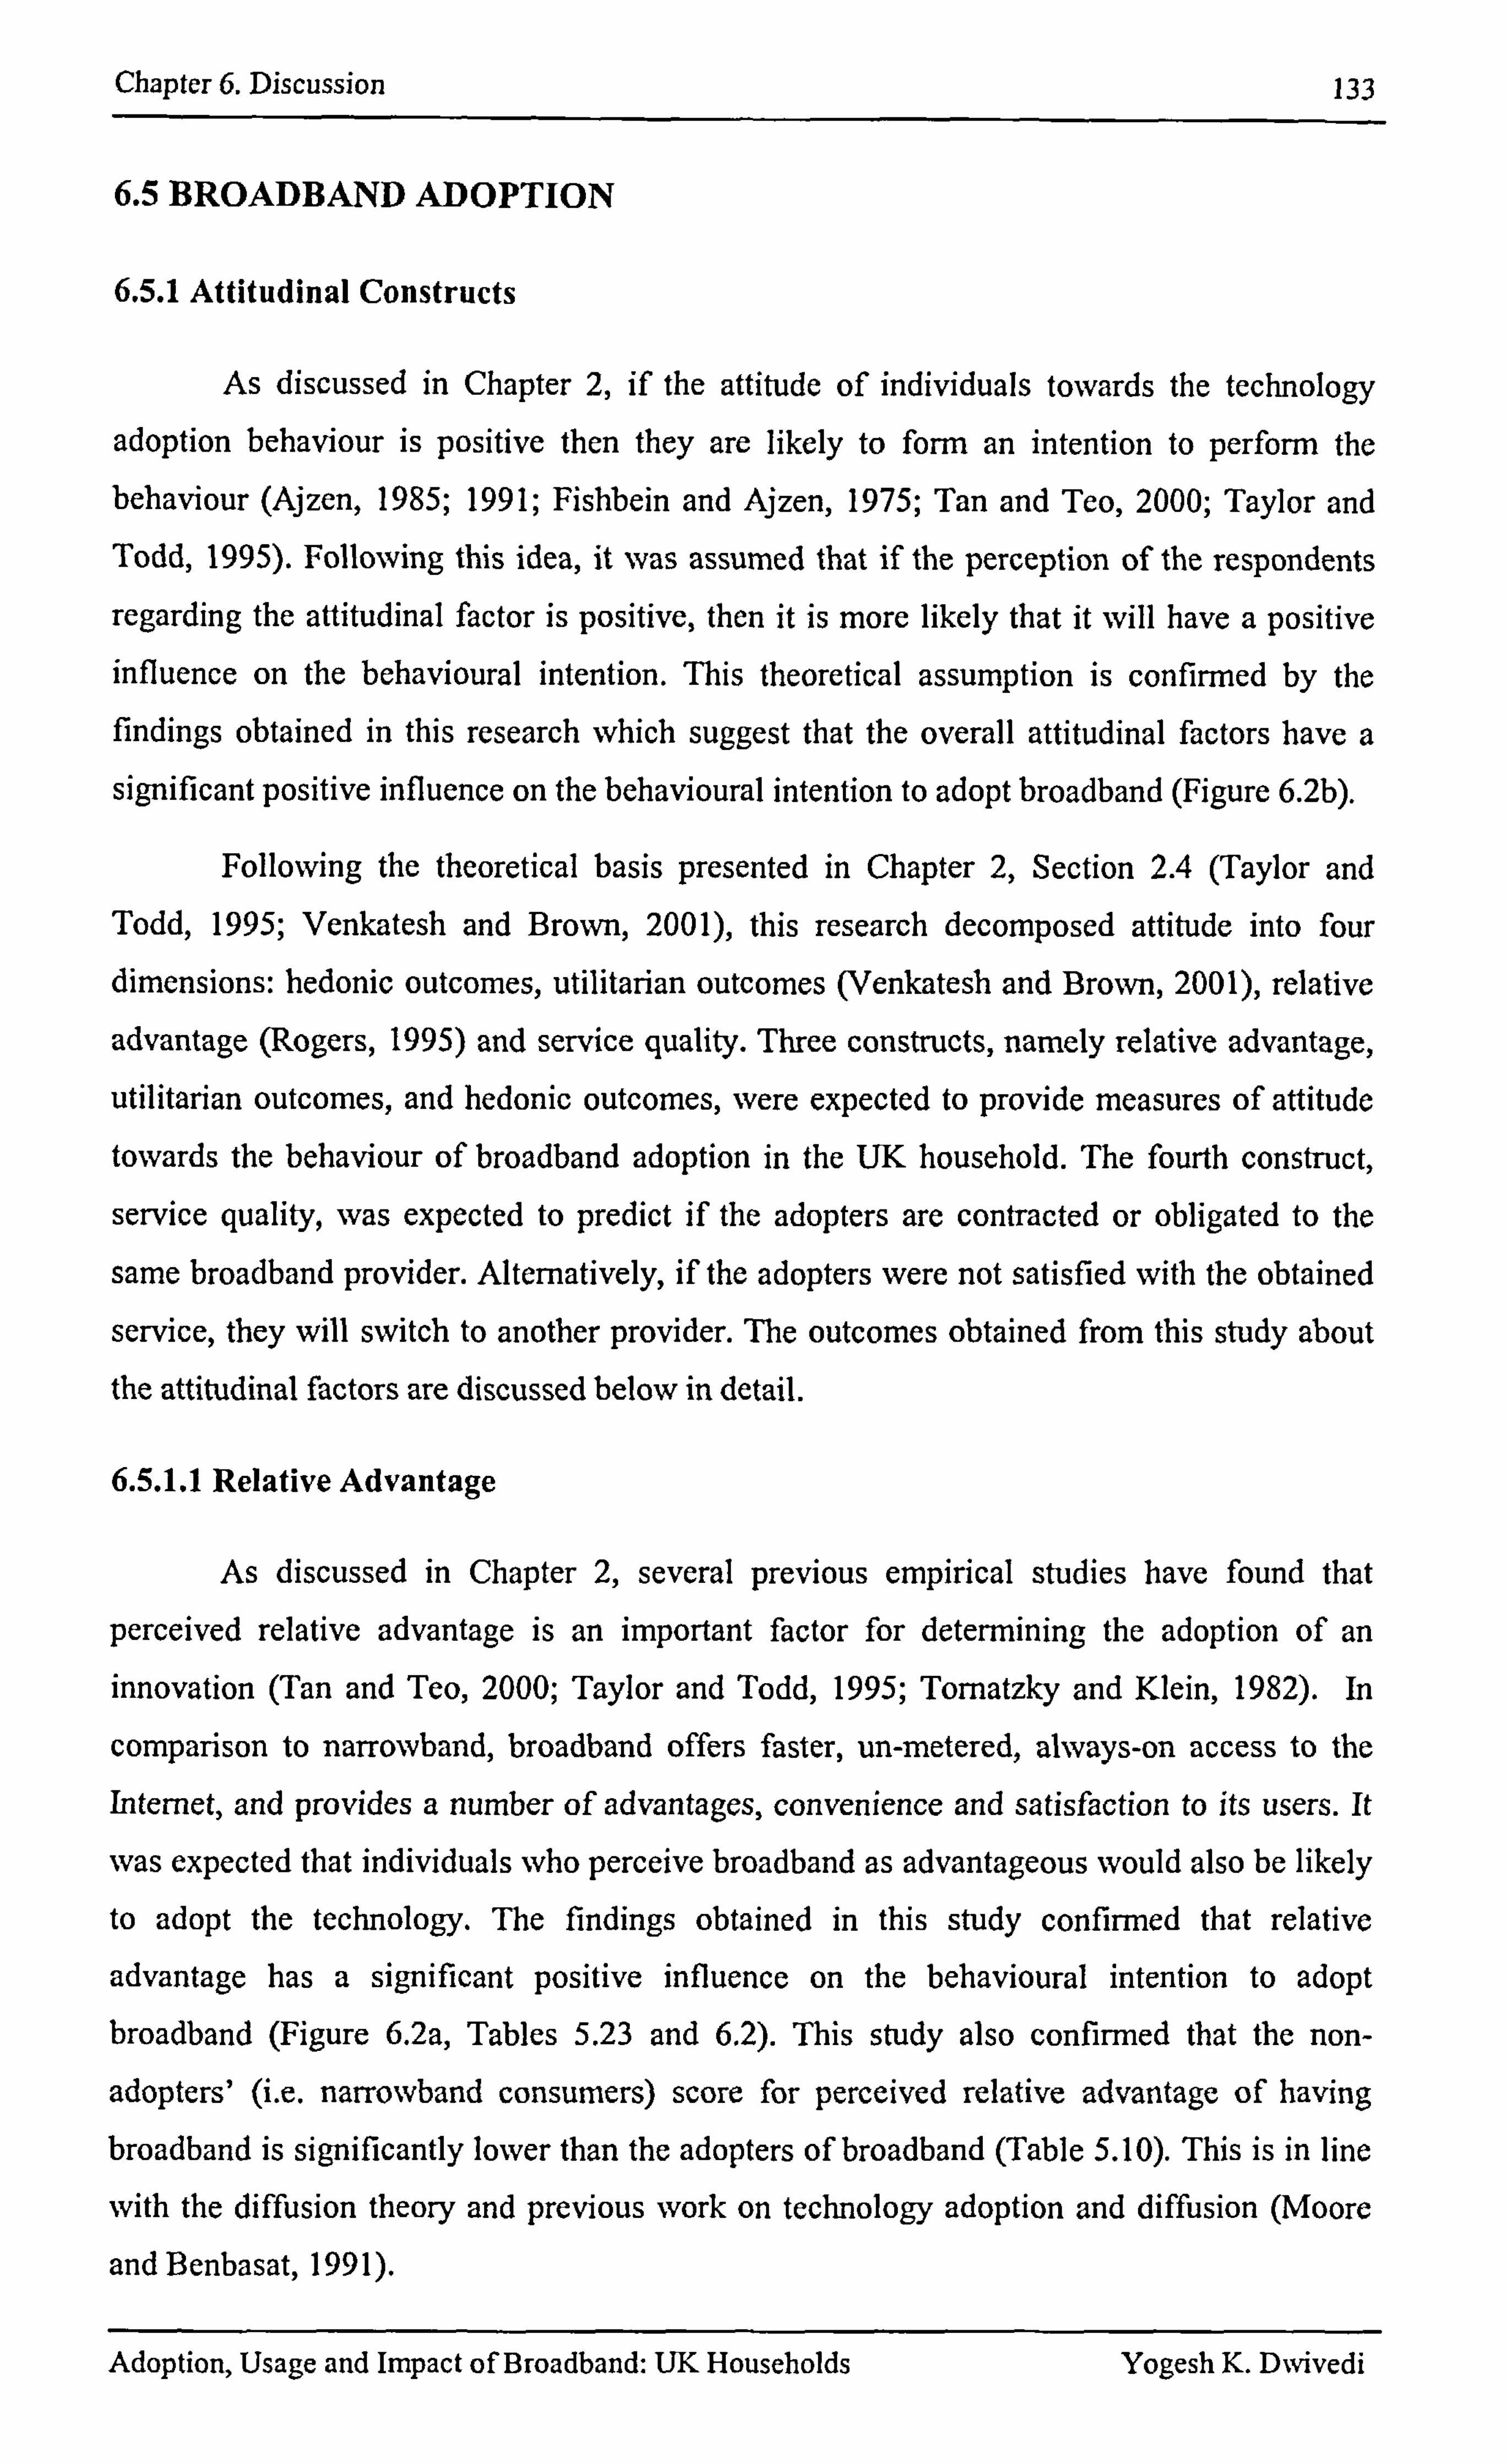
Chapter 6. Discussion
6.5 BROADBAND ADOPTION
6.5.1 Attitudinal Constructs
133
As discussed in Chapter 2, if the attitude of individuals towards the technology
adoption behaviour is positive then they are likely to form an intention to perform the behaviour (Ajzen, 1985; 1991; Fishbein and Ajzen, 1975; Tan and Teo, 2000; Taylor and Todd, 1995). Following this idea, it was assumed that if the perception of the respondents
regarding the attitudinal factor is positive, then it is more likely that it will have a positive influence on the behavioural intention. This theoretical assumption is confirmed by the findings obtained in this research which suggest that the overall attitudinal factors have a
significant positive influence on the behavioural intention to adopt broadband (Figure 6.2b).
Following the theoretical basis presented in Chapter 2, Section 2.4 (Taylor and Todd, 1995; Venkatesh and Brown, 2001), this research decomposed attitude into four
dimensions: hedonic outcomes, utilitarian outcomes (Venkatesh and Brown, 2001), relative
advantage (Rogers, 1995) and service quality. Three constructs, namely relative advantage,
utilitarian outcomes, and hedonic outcomes, were expected to provide measures of attitude towards the behaviour of broadband adoption in the UK household. The fourth construct,
service quality, was expected to predict if the adopters are contracted or obligated to the
same broadband provider. Alternatively, if the adopters were not satisfied with the obtained
service, they will switch to another provider. The outcomes obtained from this study about the attitudinal factors are discussed below in detail.
6.5.1.1 Relative Advantage
As discussed in Chapter 2, several previous empirical studies have found that
perceived relative advantage is an important factor for determining the adoption of an innovation (Tan and Teo, 2000; Taylor and Todd, 1995; Tornatzky and Klein, 1982). In
comparison to narrowband, broadband offers faster, un-metered, always-on access to the Internet, and provides a number of advantages, convenience and satisfaction to its users. It
was expected that individuals who perceive broadband as advantageous would also be likely
to adopt the technology. The findings obtained in this study confirmed that relative
advantage has a significant positive influence on the behavioural intention to adopt broadband (Figure 6.2a, Tables 5.23 and 6.2). This study also confirmed that the non-
adopters' (i. e. narrowband consumers) score for perceived relative advantage of having
broadband is significantly lower than the adopters of broadband (Table 5.10). This is in line
with the diffusion theory and previous work on technology adoption and diffusion (Moore
and Benbasat, 199 1).
Adoption, Usage and Impact of Broadband: UK Households Yogesh K. DNvivedi
Chapter 6. Discussion 134
6.5.1.2 Utilitarian Outcomes
As defined in Chapter 2, utilitarian outcomes referred to the extent to which using a technology enhances the effectiveness of household activities such as budgeting, homework
and office work (Venkatesh and Brown, 2001). This construct was proposed and validated to
examine the adoption of technology (i. e. PC) in a household setting (Venkatesb and Brown,
2001). Theoretically, it has been argued that broadband can offer a more flexible lifestyle
(BSG, 2004). For instance, many people subscribe to broadband in order to work at home
instead of travelling to the office; broadband can assist the children with their homework,
and many more household activities can be performed conveniently using the faster access of
the Internet offered via broadband. Therefore, it is expected that the greater the perception of
the usefulness of broadband for work or household related activities, the more likely it is that
broadband technology will be adopted in the home. The findings obtained from this study are
consistent with the above assumption. The findings of this study confinned that the
perceived utilitarian outcomes construct has a significant positive influence on the
behavioural intention to adopt broadband (Figure 6.2a, Tables 5.23 and 6.2). It was also found that non-adopters scored significantly lower than adopters on perceived utilitarian
outcomes (Table 5.10).
6.5.1.3 Hedonic Outcomes
Venkatesh and Brown (2001) defined hedonic outcomes as pleasure derived from
PC use; for example, for games, fun, and entertainment. Hedonic information systems are described as a self-fulfilling activity and strongly connected to the home and leisure
activities, focused on the fun aspect of using information systems, encouraging prolonged
rather than productive use (Heijden, 2004). Empirical findings ftom the Venkatesh and Brown (2001) study established that, when adopting a technology, the role of entertainment (PC games and video games) was important as a factor for consideration on the consumer decision-making process (Venkatesh and Brown, 2001). The entertainment potential of a PC
was much more enhanced by the advent of the Internet (Venkatesh and Brown, 2001). The
Internet offered the opportunity to play online games, download music and video, chat and
send online messages (Venkatesh and Brown, 2001). However, this potential was severely hampered by the slow speed of dial-up Internet (Rose el al, 1999). This barrier is being
overcome by broadband technology, which offers faster download speeds and streaming
capabilities to Internet users, and hence more convenience and compelling environments (Anderson et al, 2002; BSG, 2004). Considering the entertainment potential that broadband
offers in comparison to narrowband, it was expected that individuals who perceive broadband as a good entertainment medium will also be likely to adopt the technology. The
Adoption, Usage and Impact of Broadband: UK Households Yogesh K. DNvivedi
Chapter 6. Discussion 135
findings confirm the underlying research hypotheses that states hedonic outcomes will have
a significant positive influence on the behavioural intention (Figure 6.2a, Tables 5.23 and 6.2). This is in line %vith the findings of recent studies (Lee et al, 2003, Lee and Choudrie,
2002) that suggested that an important factor that was responsible for broadband adoption in
South Korea was the PC bang phenomenon. It also supported Anderson et al's (2002) study
that argued that broadband users are more likely to use the Internet for fun and entertainment in comparison to narrowband users.
The findings also suggested that the non-adopters scored significantly lower than the
adopters on perceived hedonic outcomes (Table 5.10). However an important issue that was
observed from the findings was that the agreement of respondents on perceived hedonic
outcomes of both broadband and narrowband consumers were much lower than the
aforementioned two attitudinal constructs (i. e. relative advantage and utilitarian outcomes) (Table 5.10). A possible reason for that is the recent legal restriction against freeloading of
music from the Internet (Anderson, 2000; Bhattachajee et al, 2003; Cowen, 2004;
Premkumar, 2003). The restriction is likely to reduce impact on the consumer attitude
towards using broadband for entertainment purposes. Freeloading and peer-to-peer online
sharing of music is considered similar to software piracy (Bliattachaijec et al, 2003) and
considered as life threatening to the music industry (Premkumar, 2003).
Since the early stages of high-speed Internet diffusion, digital freeloading of music has become a cause for concern for regulators and lawmakers in the United Kingdom and the
rest of Europe (Anderson, 2000). The sensitivity of the piracy issue became evident when the
music industry across the Europe, including the UK, sued hundreds of consumers who were
engaged in sharing music files on the Internet (Cowen, 2004). A study that examined the
relationship between regulations, information technologies and human behaviour found that
regulation does affect the human behaviour of file sharing in peer-to-peer applications (Mlcakova and Whiteley, 2004). Therefore, such legal regulation might inhibit consumers to
realise the entertainment potential of broadband. This was considered to be a plausible
reason forwhy respondents of this study considered hedonic outcomes as less important.
6.5.1.4 Service Quality
It was discussed in Chapter 2 that only a limited number of studies have included the
service quality construct to measure the successful adoption of technology. DeLone and McLean (2003) extended the IS success model (DeLone and McLean, 1992) by integrating a
service quality construct. The service quality construct was included to evaluate the fact that
an IS department also has a role in facilitating end-user computing via the services that are
offered to business personnel wishing to develop their own systems (Rosemann and Vessey,
Adoption, Usage and Impact of Broadband: UK Households Yogesh K. D%vivedi
Chapter 6. Discussion 136
2005). However, this construct was not employed in the case of PC adoption study in
household context (Venkatesh and Brown, 2001). This is because, when purchasing PC, the
consumers have only one opportunity to make a choice to purchase or not to purchase. And
once a product is sold, the seller is not expected to provide any further after-sales customer
support. However, the case of a broadband subscription is different to a PC purchase. That is,
the consumers sign an annual contract and during this period, if the provided service is not
satisfactory, they can discontinue the broadband subscription.
Alternatively, if consumers have a choice of providers then they might transfer to the
competitors. Therefore, it is important to understand whether consumers are satisfied with their current providers and provided services. The findings of this study suggest that service
quality has a significant negative influence on the behavioural intention to change the current
service provider (Figure 6.2a, Tables 5.23 and 6.2). This means that if the consumer
perception is lower for the quality of service obtained from the current service providers,
s/he is more likely to switch to new providers. It was also expected that the non-adopters
would score significantly lower than the adopters of broadband on service quality, which is
confirmed by the findings obtained from Mest (Table 5.10).
6.5.2 Normative Constructs
As per the discussion provided in Chapter 2 the subjective norm in its original form
in the TPB is employed as a single dimensional construct and is considered directly related
to the behavioural intention. This is because a person's behaviour is based on their
perception of what others think of what they should do (Tan and Teo, 2000). Following the
theoretical arguments in the existing studies, it was expected that the stronger the perceived
social influence to adopt broadband, the more likely it is that consumers will develop a
stronger intent to subscribe to broadband (AJzen, 1985; 1991; Fishbein and Ajzen, 1975, Tan
and Teo, 2000; Taylor and Todd, 1995; Venkatesh and Brown, 200 1). Findings of this study
confirmed the research hypothesis, which confirmed that, overall, the normative factors have
a positive influence on the behavioural intention to adopt broadband (Figure 6.2b).
In terms of consumer-oriented service, the sources of influence could be the
adopter's friends, family and colleagues/peers (Tan and Teo, 2000). Rice et al (1990) defined
such influence as social pressures where members of a social network affect one another's behaviour. Venkatesh and Brown's (2001) study suggests that social influences are
significant detenninants of the purchasing behaviour of PCs. Similarly, it was also expected
that households with broadband connections are likely to influence their relatives and friends
by telling and demonstrating to them the benefits and convenience offered by broadband.
Measures that influence adopters can appear in two forms that are termed as primary and
Adoption, Usage and Impact of Broadband: UK Households Yogesh K. DNvivedi
Chapter 6. Discussion 137
secondary influences (Taylor and Todd, 1995; Venkatesh and Brown, 2001). These two dimensions are separated and defined below. The findings obtained from this study on the
contributions of the primary and secondary influence factors in explaining behavioural
intention to adopt broadband are discussed in detail below.
6.5.2.1 Primary Influences
A social influence from friends, colleagues, peers and family members that take the form of conversations and messages, and assist in forming perceptions of broadband
adoption, is defined as a primary influence (Venkatesh and Brown, 2001). Considering the findings from the previous studies (Taylor and Todd, 1995; Venkatesh and Brown, 2001), it
was expected that if broadband adopters are influenced by their social networks with positive
messages, they are more likely to have a strong behavioural intention to adopt broadband.
The findings of this study confirined that primary influen ces have a statistically significant
positive influence on the perceived behavioural intention to adopt broadband (Figure 6.2a,
Tables 5.26 and 6.2). It was also examined to determine whether the perception of primary influence differs between narrowband and broadband consumers when regarding the influence to adopt broadband. The findings confirmed that non-adopters differed
significantly from adopters in terms of primary influences (Table 5.10).
6.5.2.2 Secondary Influences
As discussed in Chapter 2, messages that are disseminated using mass media, such
as TV and newspaper advertisements (secondary sources of information) are considered to be secondary influences, which are likely to influence consumer's intentions to adopt or
reject the technology in question (Rogers, 1995; Venkatesh and Brown, 2001). In terms of this research, a secondary influence affects those who have already adopted broadband but
are not satisfied with the service quality; hence, if the advertisements on TV or in
newspapers, which advertise broadband packages that are economical and offer a better
quality service, they are more likely to cause the adopters to contract with a new provider. The aforementioned theoretical argument was supported by the findings obtained in this
research. The results illustrate that secondary influences have a positive influence on the
perceived behavioural intention to change current service providers (Figure 6.2a, Tables 5.26
and 6.2). However, it was found that non-adopters did not score significantly lower than the
adopters in terms of secondary influence (Table 5.10).
Adoption, Usage and Impact of Broadband: UK Households Yogesh K. DNvivedi
Chapter 6. Discussion 138
6.5.3 Control Constructs
Findings from this study provide evidence that the overall control factors have a
significant positive influence on the behavioural intention to adopt broadband (Figure 6.2b).
The finding is consistent with TPB, which suggests that the presences of constraints can inhibit both the behavioural intention to perform behaviour and the actual behaviour itself
(Ajzen, 1985; 1991). The findings of this research and the above theoretical argument are in
line with the obtained findings from these studies that illustrated that the higher the
perception of an individual's control over their internal and external constraint, the more likely that he/she will adopt the technology in question (Ajzen, 1991; Tan and Teo, 2000).
However, if the individual's control over the external and internal constraints is low, then despite having a strong behavioural intention, he/she is less likely to adopt the technology (Ajzen, 1991; 1985).
In order to develop a better understanding, consistent with the DTPB and MATH the
current study considered the following three constructs as barriers to the adoption of broadband: high costs (i. e. facilitating conditions resources); the ease/difficulty of PCs,
Internet use (i. e. self-efficacy); and the lack of knowledge on broadband's benefits
(Mathieson, 1991; Taylor and Todd, 1995; Venkatesh and Brown, 2001). The empirical
evidence from this research for the role of the aforementioned three control constructs for
explaining the behavioural intention and actual adoption of broadband is provided below.
6.5.3.1 Facilitating Conditions Resources
The South Korean government's vision recognised an affordable monthly cost of broadband for a middle-income household as an important factor that led to the high rates of
adoption (Lee and Choudrie, 2002). An exploratory study on broadband adoption in the UK
also suggests that a high monthly cost is a major barrier that is inhibiting the adoption of broadband in the household (Dwivedi et al, 2003). Therefore, it is expected that if the
monthly cost to subscribe broadband is perceived as high, then adoption will be slow. Furthennore, broadband technology is not compatible to the specifications of old PCs and
necessitates either an upgrade or the purchase of a new PC. However, PCs are not easily
replaceable devices for the medium and lower income households.
Therefore an economic barrier in the form of costs that are incurred when upgrading
or purchasing new personal computers inhibits the adoption of broadband in the household.
In line with the theoretical basis, these findings suggest that the facilitating conditions
resources have a significant positive influence on both the behavioural intentions to adopt
and the actual adoption of broadband (Figure 6.2a, Tables 5.26 and 6.2). The findings also
Adoption, Usage and Impact of Broadband: UK Households Yogesh K. DNvivedi
Chapter 6. Discussion 139
suggest that the non-adopters scored significantly lower than the adopters on the perceived
resources to subscribe to broadband (Table 5.10).
6.5.3.2 Self-efficacy
The findings of this study provided evidence that self-efficacy has a positive influence on the behavioural intention to adopt broadband (Figure 6.2a, Tables 5.26 and 6.2).
This is because the use of broadband also requires using a PC and the Internet. The ease or difficulty of use and requisite knowledge of a PC and Internet use were expected to have an impact upon broadband adoption. An approach to remove such a barrier can be seen in a
country such as South Koreawhere broadband was successfully deployed. The South Korean
government installed a variety of promotion policies such as "The Ten Million Program"
which was designed to boost Internet use amongst housewives, the elderly, military
personnel, farmers, and excluded social sectors such as low-income families, the disabled
and even prisoners (Choudrie and Lee, 2004; Lee el al, 2003; Lee and Choudrie, 2002).
This promotion of providing PC and Internet skills in the year 2000 contributed towards the adoption of the Internet. A total of 4.1 million people, including one million housewives, obtained such skills (Choudrie and Lee, 2004; Lee et al, 2003; Lee and Choudrie, 2002). This initiative led to the removal of barriers of self-efficacy amongst the
household consumers, which then manifested in large-scale broadband adoption in
households within a very short period of time.
Although basic skills required for accessing the Internet are similar for both
narrowband and broadband consumers, the latter is expected to possess a higher self-efficacy than the earlier one (Oh et al, 2003):
"Aere is little difference between the skills neededfor using a modem connection over plain old telephone service networks and broadband connection to the internet. However, when an individual uses the broadband intemet, he or she can have access to additional infonnation and services such as video on demand, high-quality MP3 digital music, broadcasting services and other multi-media services. An individual may also need different skills and experience in order to use or to take advantage of the broadband intemet connection. Time is also requiredfor a user to leam holv to set up the system and what he or she can access via the broadband " Oh et al (2003).
The above statement clearly suggests that broadband consumers would have a
stronger perception of skills in comparison to the narrowband ones. This study provides
empirical evidence that the non-adopters (i. e. narrowband consumers) scored significantly lower than the broadband adopters on the perceived skills (Table 5.10).
Adoption, Usage and Impact of Broadband: UK Households Yogesh K. DNvivedi
Chapter 6. Discussion
6.5.3.3 Knowledge
140
Rogers (1995) suggested that the level of knowledge about an innovation, its risks
and benefits affect the adoption rate. The greater the awareness of the benefits of the innovation amongst the consumers and users, the more likely an innovation gets adopted. Previous research suggests that, in South Korea, the consumers were aware of the potentials
of broadband (Choudrie and Lee, 2004; Lee et al, 2003; Lee and Choudrie, 2002). The
consumers were also aware of the benefits of faster Internet access, which was essential to
satisfy their needs. This was considered to be one of the factors that accelerated broadband
adoption in South Korea. Therefore, in Chapter 2 it was explained that the adoption of broadband requires a clear message of its usages and benefits amongst the total segments of
society (Choudrie and Lee, 2004; Lee et al, 2003; Lee and Choudrie, 2002; Rogers, 1995).
Also, if consumers are not aware of the benefits of adopting a particular innovation,
then it is expected that they are more likely to reject the decision to make a purchase due to
the lack of the perceived needs. However, in contrast to the theoretical reasoning, the
empirical findings suggest that the knowledge construct is unlikely to have a large impact on
variance of bebavioural intention to adopt broadband (Figure 6.2a, Table 5.26). This is in
line with the argument that the majority of consumers are already aware of what to do with
the Internet as it permeates people's lives and work environments (Oh et al, 2003). This may be a possible reason why this construct has not contributed largely towards explaining the
variance in behavioural intention of adopting broadband.
6.5.4 Research Model of Broadband Adoption (MBA)
A summary of the research hypotheses test, and also a reflection on the hypotheses
in relation to proposed conceptual model, were provided above. This subsection summarises
the above discussion and reflects on the perfon-nance of the broadband adoption model in
comparison to its guiding models and framework.
Figure 6.2a illustrates the validated model of broadband adoption (MBA) that was
proposed in Chapter 2 (Figure 2.6). Figure 6.2a depicts the paths from relative advantage,
utilitarian outcomes and hedonic outcomes towards the behavioural intention to adopt broadband (BI) being significant. Consistent with the hypothesis, the fourth attitudinal
construct (service quality) significantly explained the behavioural intention to change service
providers. The path from the overall attitudinal dimension to BI is also significant. As it was hypothesised, paths from the primary influence and overall normative factors to BI are
significant. The second normative construct (secondary influences) is significantly related to
the behavioural intention to change service providers. Of the three control constructs, two,
Adoption, Usage and Impact of Broadband: UK Households Yogesh K. DNvivedi
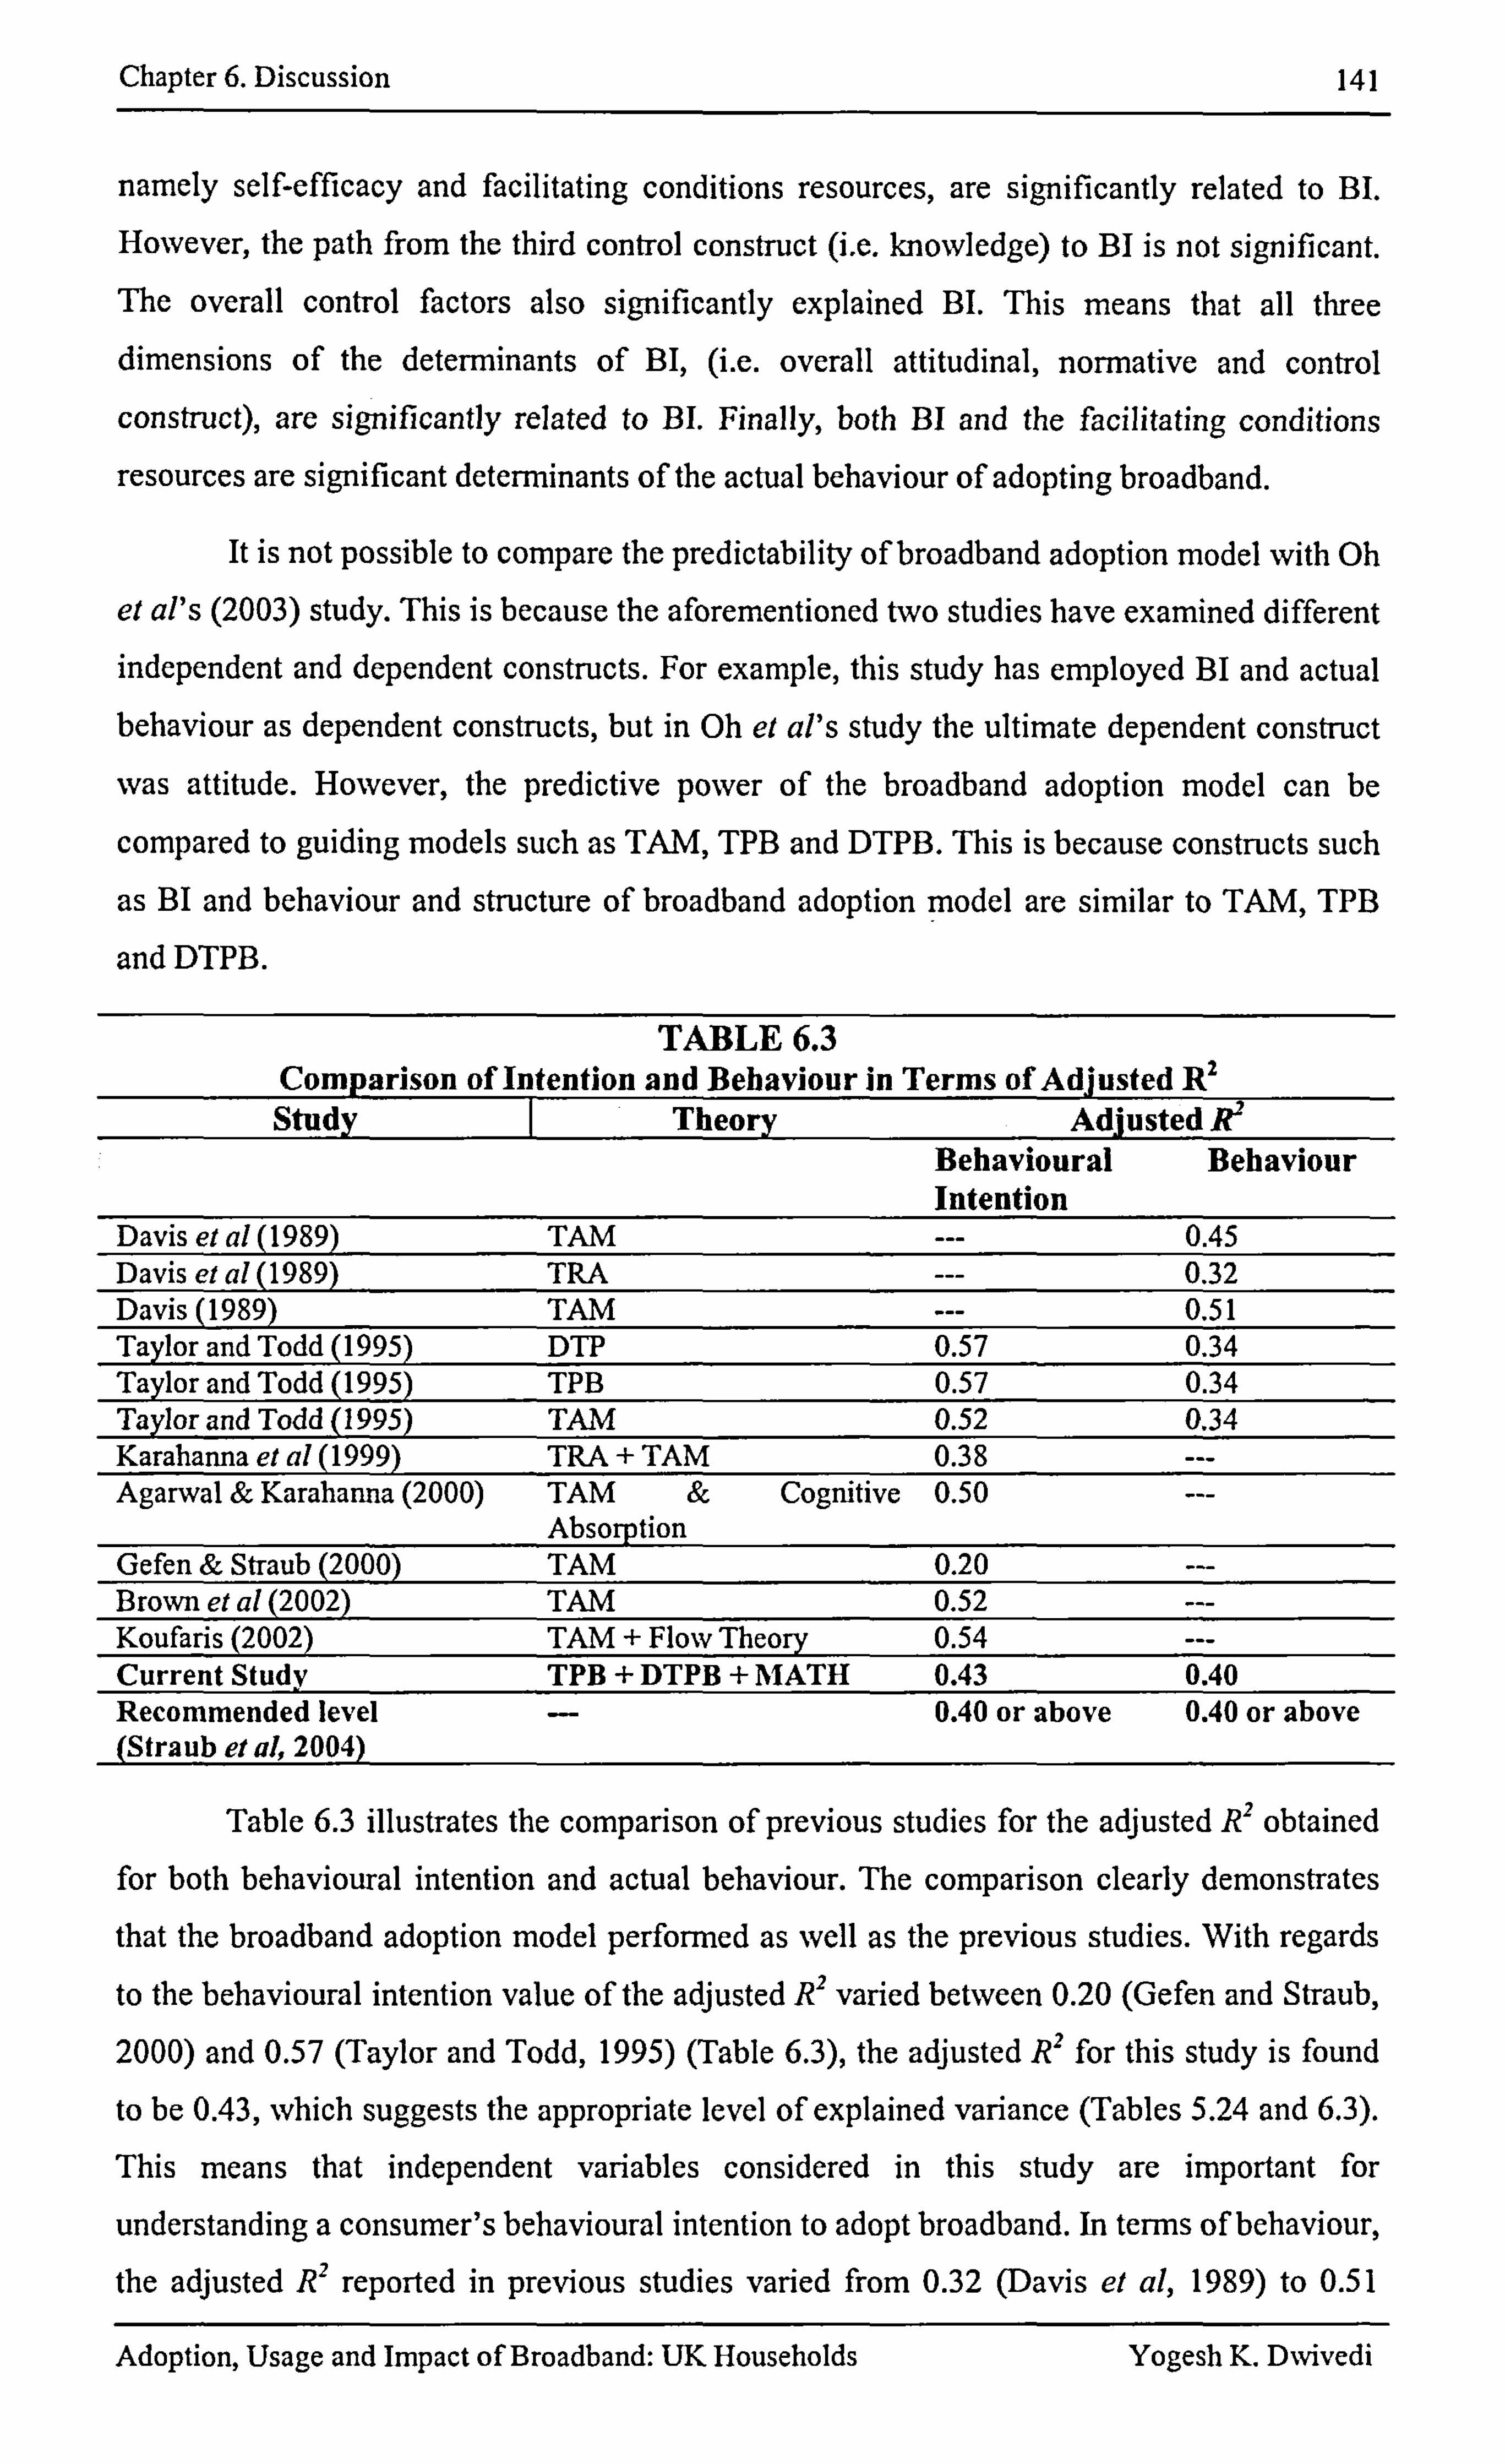
Chapter 6. Discussion 141
namely self-efficacy and facilitating conditions resources, are significantly related to BI. However, the path from the third control construct (i. e. knowledge) to BI is not significant. The overall control factors also significantly explained BI. This means that all three dimensions of the determinants of BI, (i. e. overall attitudinal, normative and control
construct), are significantly related to BI. Finally, both BI and the facilitating conditions
resources are significant deten-ninants of the actual behaviour of adopting broadband.
It is not possible to compare the predictability of broadband adoption model with Oh
el al's (2003) study. This is because the aforementioned two studies have examined different
independent and dependent constructs. For example, this study has employed BI and actual behaviour as dependent constructs, but in Oh et al's study the ultimate dependent construct
was attitude. However, the predictive power of the broadband adoption model can be
compared to guiding models such as TAM, TPB and DTPB. This is because constructs such
as BI and behaviour and structure of broadband adoption model are similar to TAM, TPB
and DTPB.
TA. BLE 6.3 Comparison of Intention and Behaviour in Terms of Adjusted R2
Behavioural Behaviour Intention
Davis et al (1989) TAM 0.45 Davis et al (1989) TRA --- 0.32 Davis (1989) TAM --- 0.51 Taylor and Todd (1995) DTP 0.57 0.34 Taylor and Todd (1995) TPB 0.57 0.34 Taylor and Todd (1995) TAM 0.52 0.34 Karahanna et al (1999) TRA + TAM 0.38 --- Agarwal & Karahanna (2000) TAM & Cognitive
Absorption 0.50 ---
Gefen & Straub (2000) TAM 0.20 --- Brown et al (2002) TAM 0.52 --- Koufaris (2002) TAM + Flow Theory 0.54 --- Current Study TPB + DTPB + MATH 0.43 0.40 Recommended level (Straub et al, 2004)
0.40 or above 0.40 or above
Table 6.3 illustrates the comparison of previous studies for the adjusted R2 obtained
for both behavioural intention and actual behaviour. The comparison clearly demonstrates
that the broadband adoption model performed as well as the previous studies. With regards
to the behavioural intention value of the adjusted R2 varied between 0.20 (Gefen and Straub,
2000) and 0.57 (Taylor and Todd, 1995) (Table 6.3), the adjusted R2 for this study is found
to be 0.43, which suggests the appropriate level of explained variance (Tables 5.24 and 6.3).
This means that independent variables considered in this study are important for
understanding a consumer's behavioural intention to adopt broadband. In terms of behaviour,
the adjusted R2 reported in previous studies varied from 0.32 (Davis et al, 1989) to 0.51
Adoption, Usage and Impact of Broadband: UK Households Yogesh K. Dwivedi
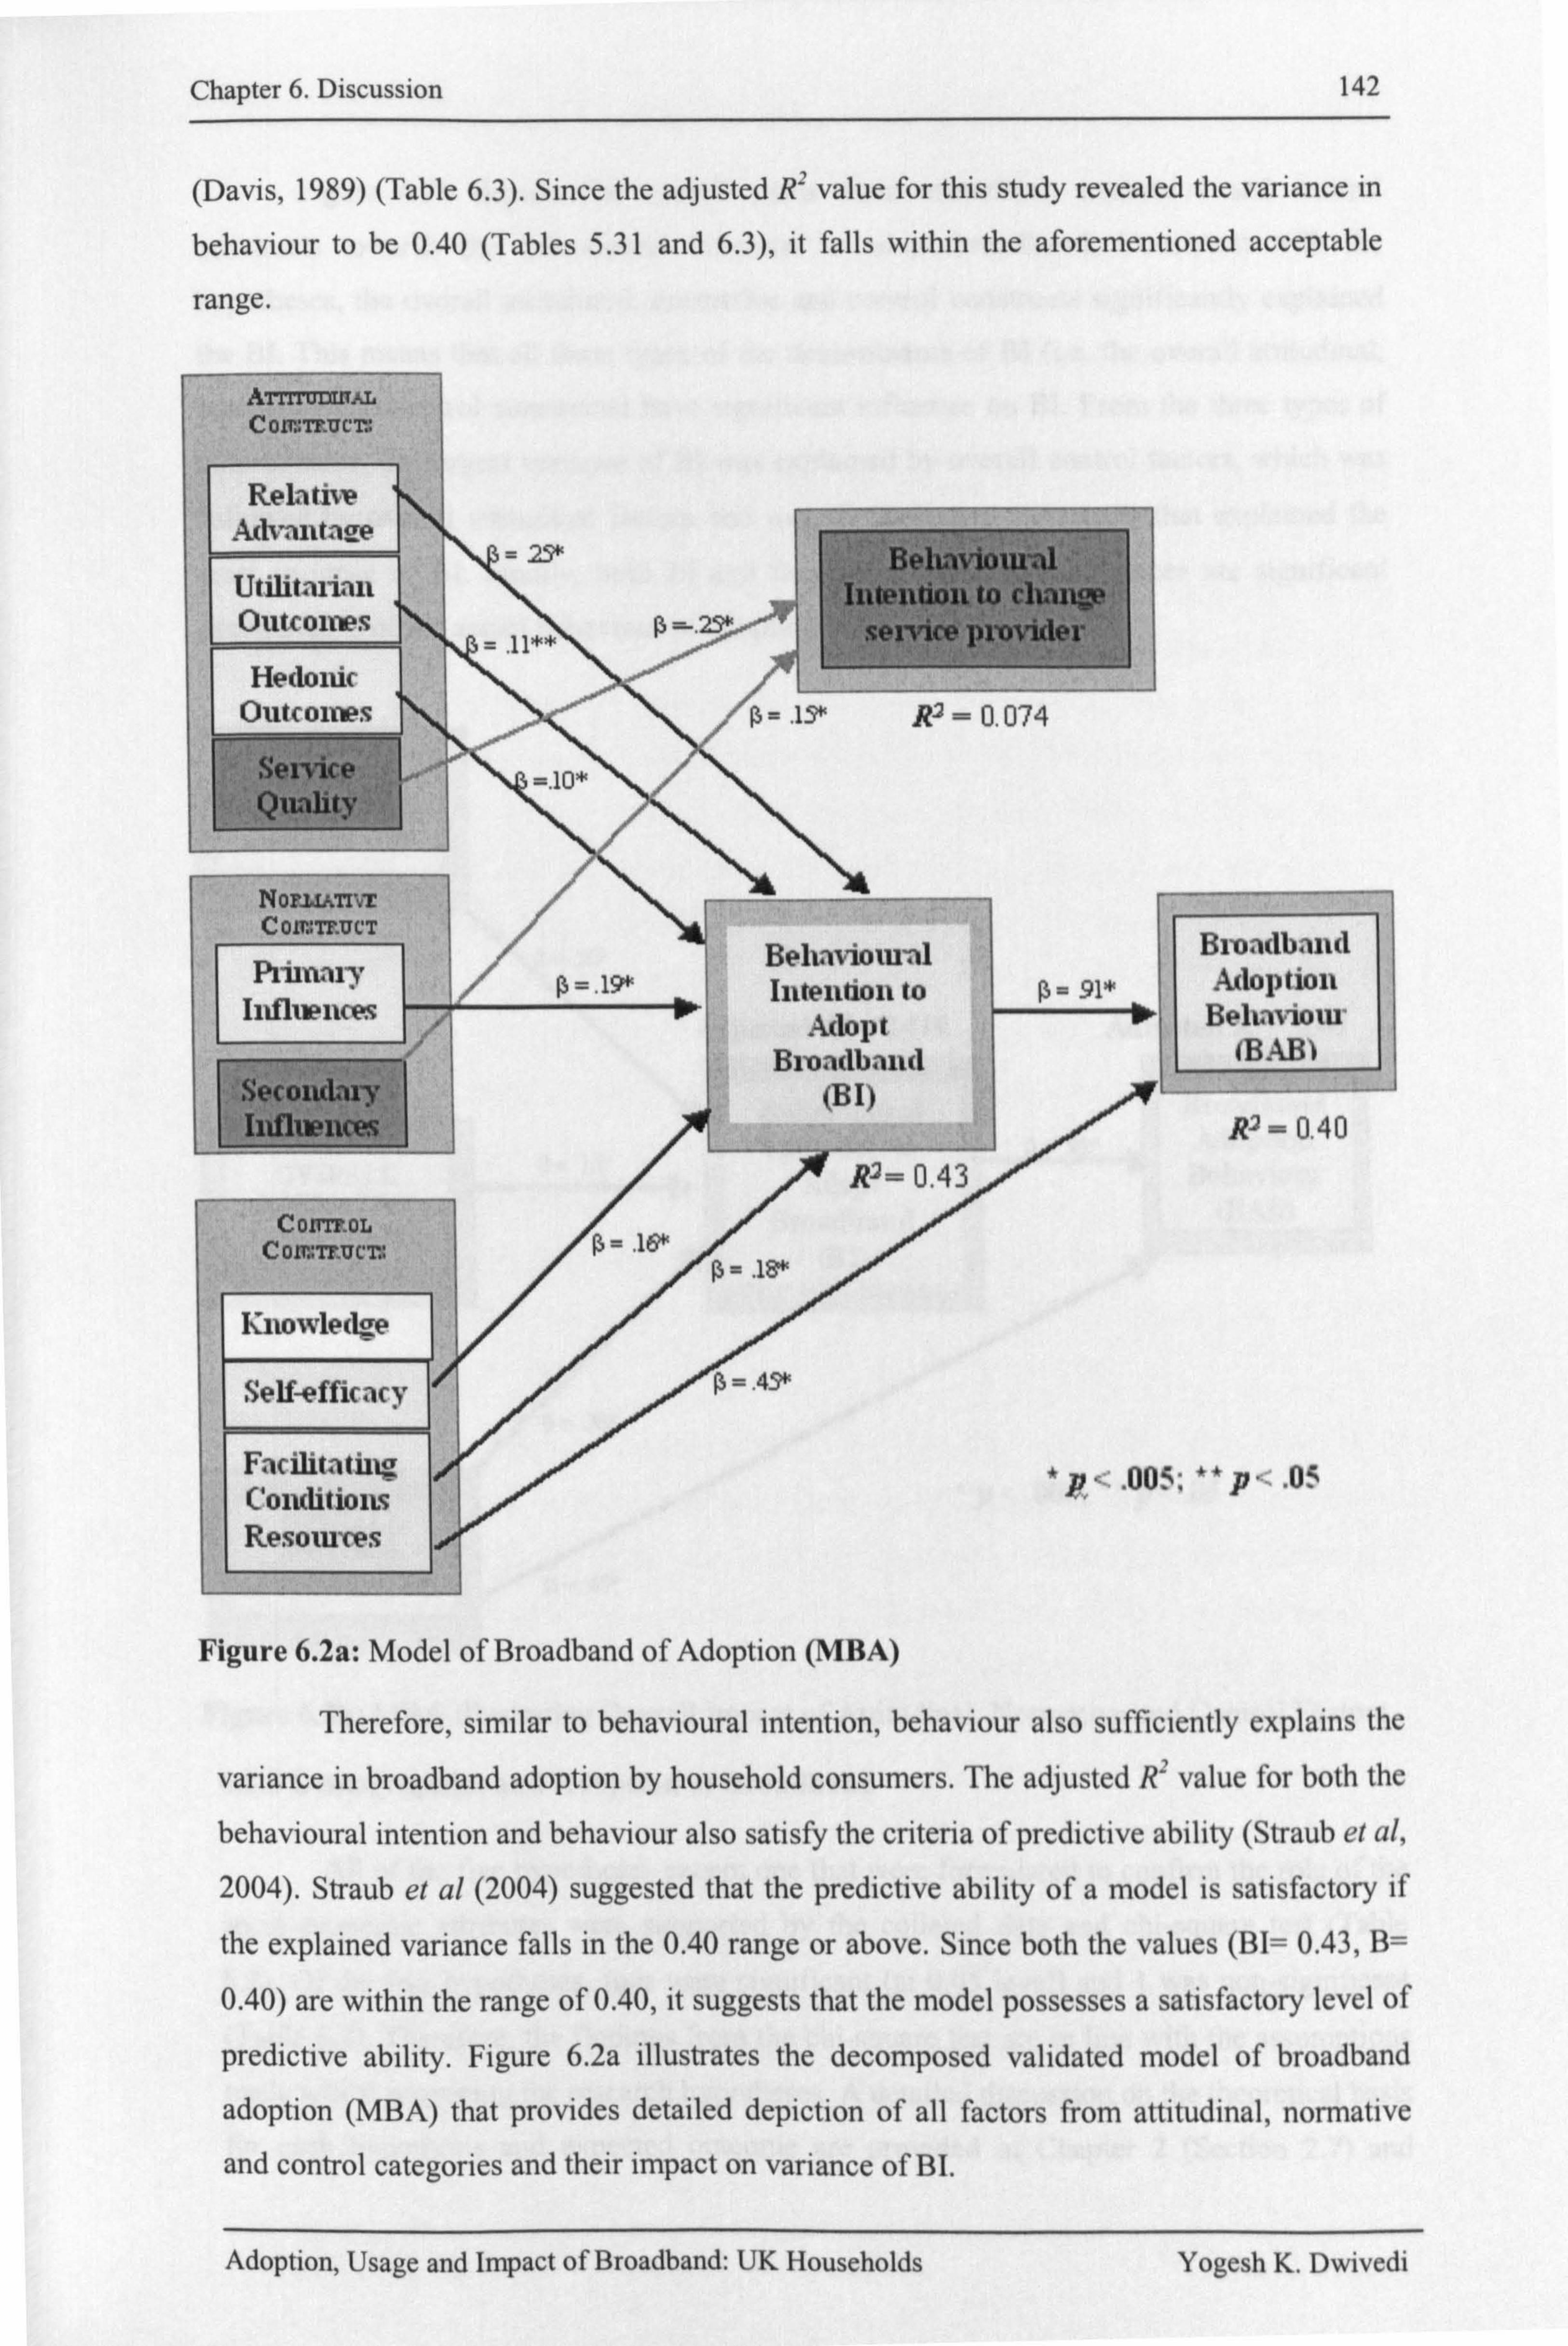
Chapter 6. Discussion 142
(Davis, 1989) (Table 6.3). Since the adjusted R2 value for this study revealed the variance in
behaviour to be 0.40 (Tables 5.31 and 6.3), it falls within the aforementioned acceptable
range.
Commurr.
ReLati-sv Advant-w-re
25* Behaviom-al utilitaltall 111(eiltiolk to clwlllgaeý Outcomes p
-ice PI-01*IeF sen
Hedoiuc Out(Olivs 1 0= . 1-'3* R-2 = 0.074
Service * =. 10 Quably
Noru&mr COMMUCT
pitit'lly Belvivioxmil p 19* Intention to P= 91* lilfllv-iicv,. s - - --ilp- Adopt
tsecoudary Broadband
(B 1)
. 00 ,X R-2= 0.43
Co ir. Tru c T.
Knowledge
Self-efficacy
R-2 = 0.40
F. -tcihtý-ttülg * P, <ý . 005; **p-: - . 05 Coluhgiolls
--wý Resoxuws
Figure 6.2a: Model of Broadband of Adoption (MBA)
Therefore, similar to behavioural intention, behaviour also sufficiently explains the
variance in broadband adoption by household consumers. The adjusted R2 value for both the
behavioural intention and behaviour also satisfy the critena of predictive ability (Straub et A
2004). Straub et al (2004) suggested that the predictive ability of a model is satisfactory if
the explained variance falls in the 0.40 range or above. Since both the values (Bl= 0.43, B=
0.40) are within the range of 0.40, it suggests that the model possesses a satisfactory level of
predictive ability. Figure 6.2a illustrates the decomposed validated model of broadband
adoption (MBA) that provides detailed depiction of all factors from attitudinal, normative
and control categories and their impact on variance of Bl.
Adoption, Usage and impact of Broadband: UK Households Yogesh K. Dwivedi
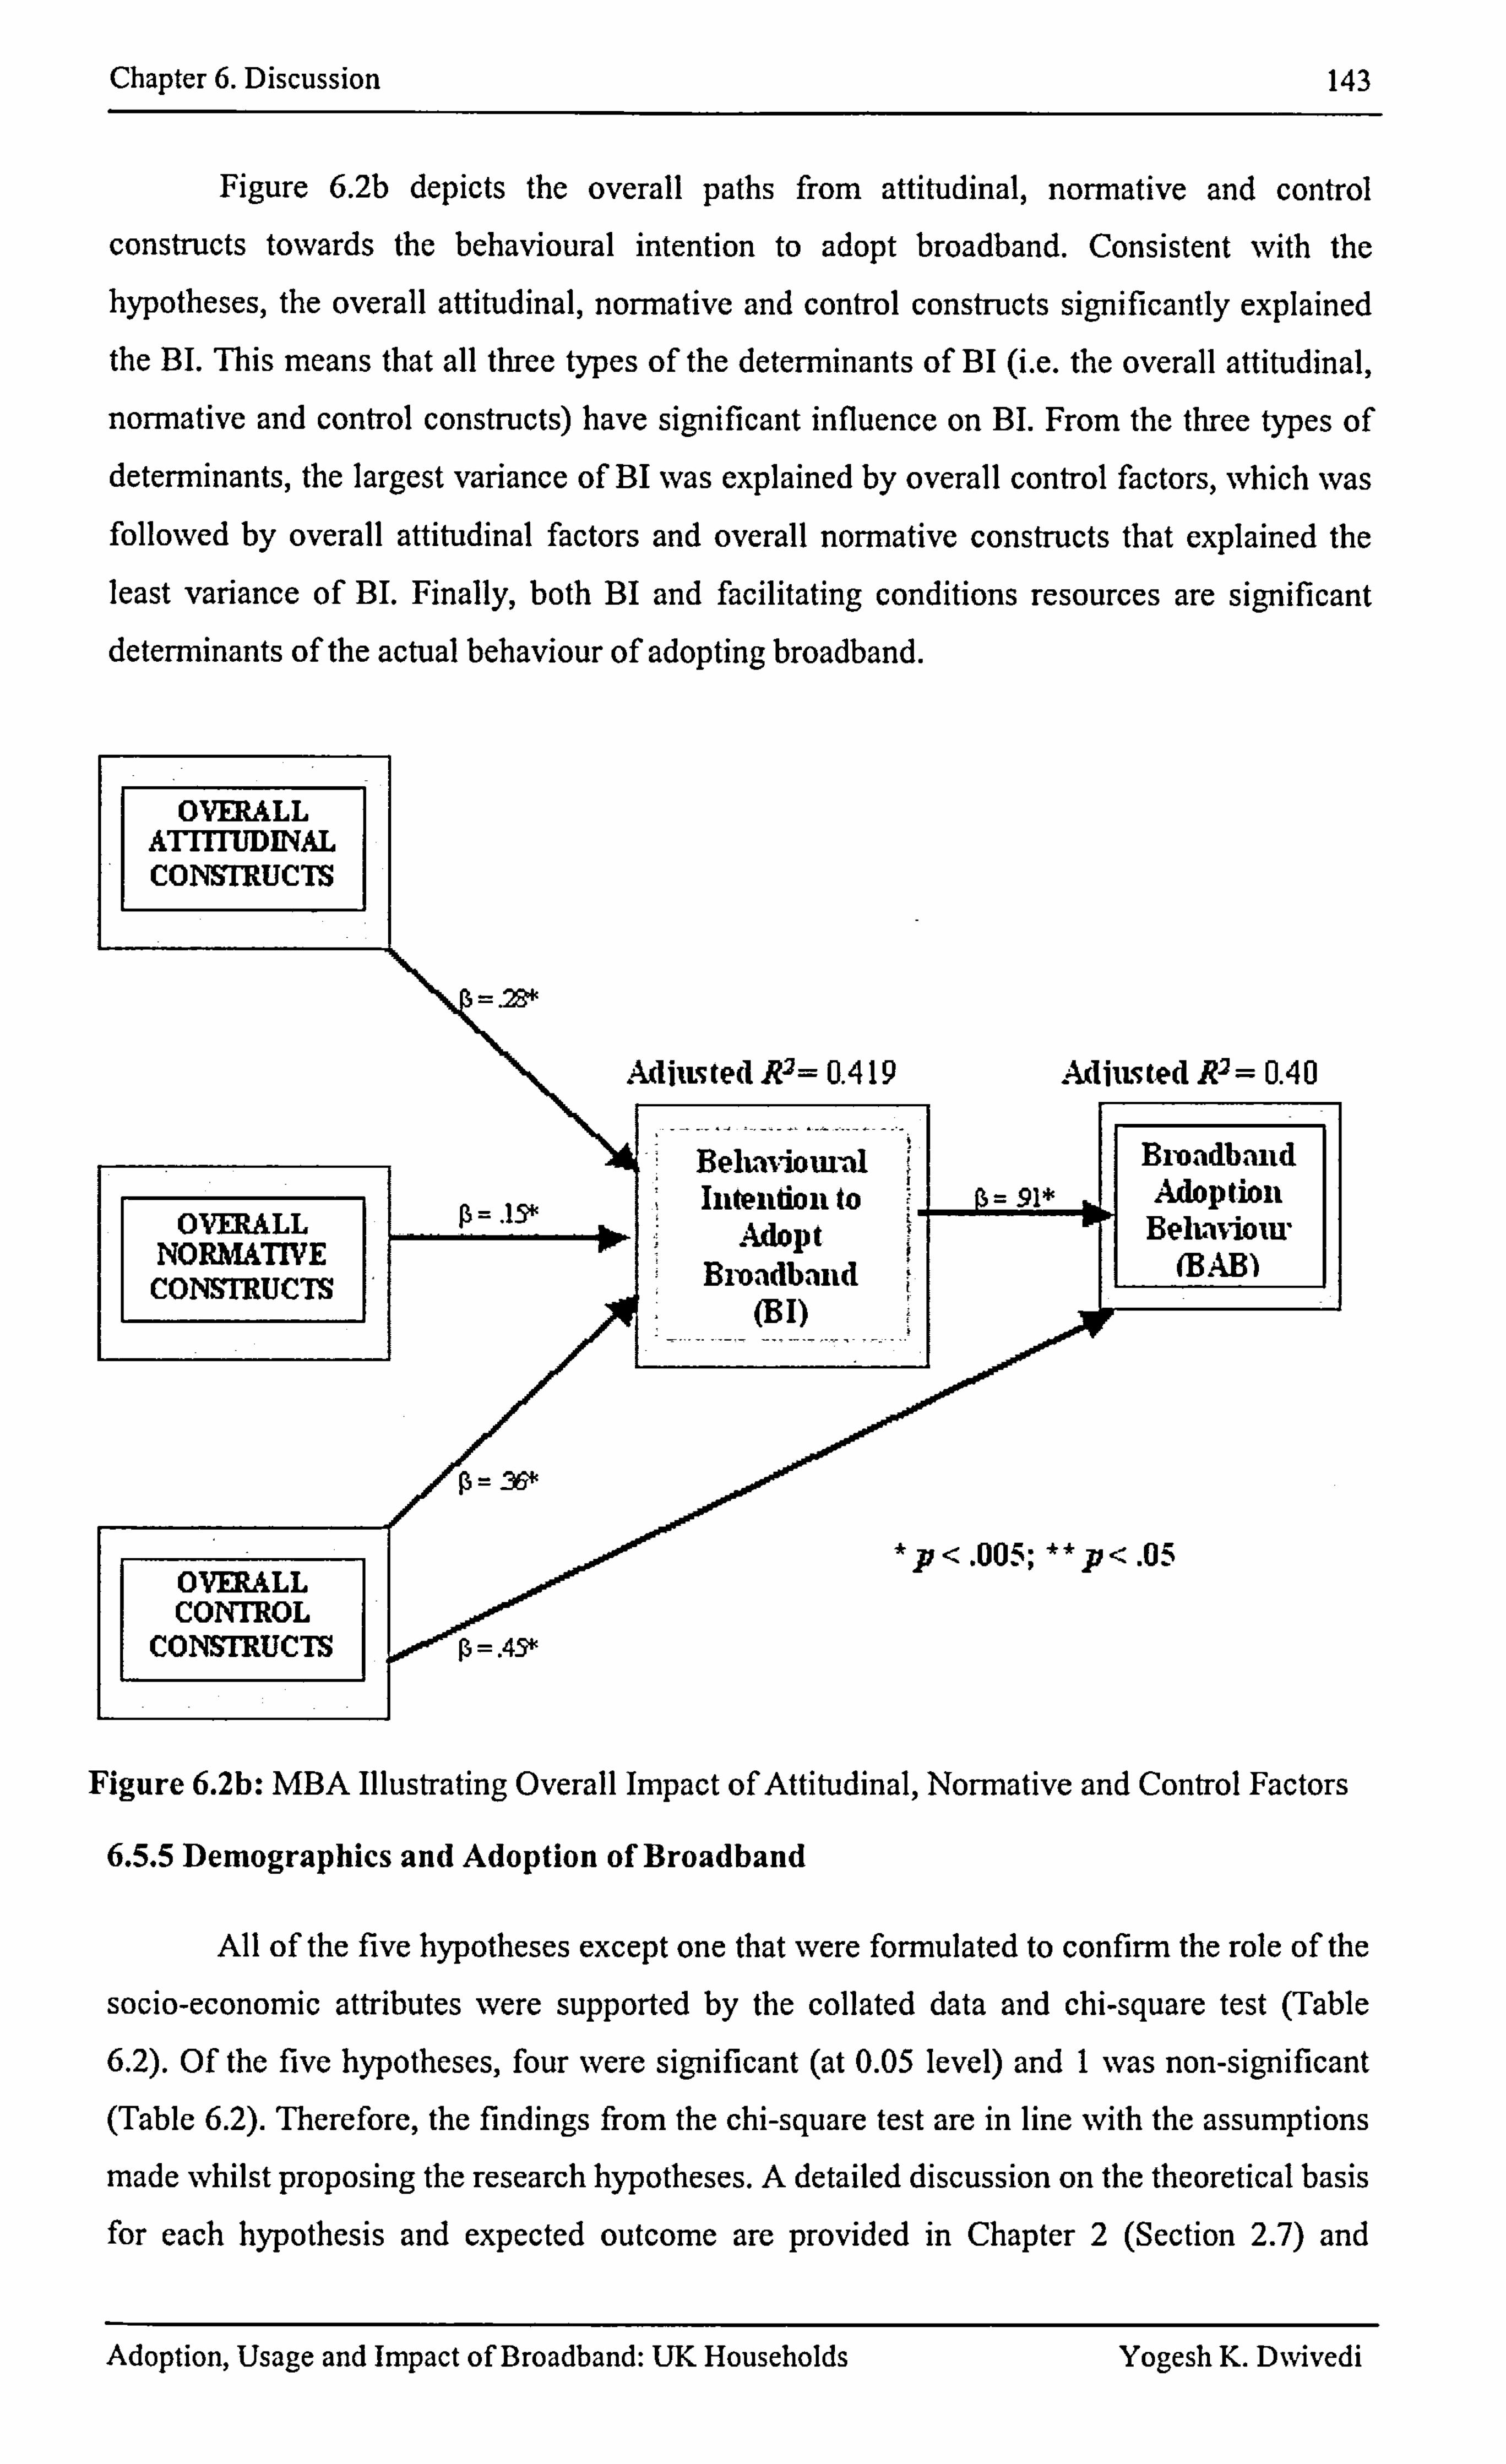
Chapter 6. Discussion 143
Figure 6.2b depicts the overall paths from attitudinal, normative and control
constructs towards the behavioural intention to adopt broadband. Consistent with the hypotheses, the overall attitudinal, non-native and control constructs significantly explained the Bl. This means that all three types of the determinants of BI (i. e. the overall attitudinal,
normative and control constructs) have significant influence on BI. From the three types of determinants, the largest variance of BI was explained by overall control factors, which was followed by overall attitudinal factors and overall normative constructs that explained the least variance of BI. Finally, both BI and facilitating conditions resources are significant determinants of the actual behaviour of adopting broadband.
OVERALL ATITrUDINAL CONMUCTS
=. 23*
Adiasted R2= 0.419 Ad i us te d R2 = 0.4 0
Broadband avioun Belu al Adoption Intention to B= 91*
OVERALL op Behaviour NORMATIVE Adopt
Brondband (BAB) CONSMUCTS (Bl)
p= -%- *P<. 005; **P<. 05
CONTROL oooý
OVERALL 000000'0'
CONMUCTS wol" P =. 4-'3*
Figure 6.2b: MBA Illustrating Overall Impact of Attitudinal, Normative and Control Factors
6.5.5 Demographics and Adoption of Broadband
All of the five hypotheses except one that were formulated to confirm the role of the
socio-economic attributes were supported by the collated data and chi-square test (Table
6.2). Of the five hypotheses, four were significant (at 0.05 level) and 1 was non-significant (Table 6.2). Therefore, the findings from the chi-square test are in line with the assumptions
made whilst proposing the research hypotheses. A detailed discussion on the theoretical basis
for each hypothesis and expected outcome are provided in Chapter 2 (Section 2.7) and
Adoption, Usage and Impact of Broadband: UK Households Yogesh K. DNvivedi
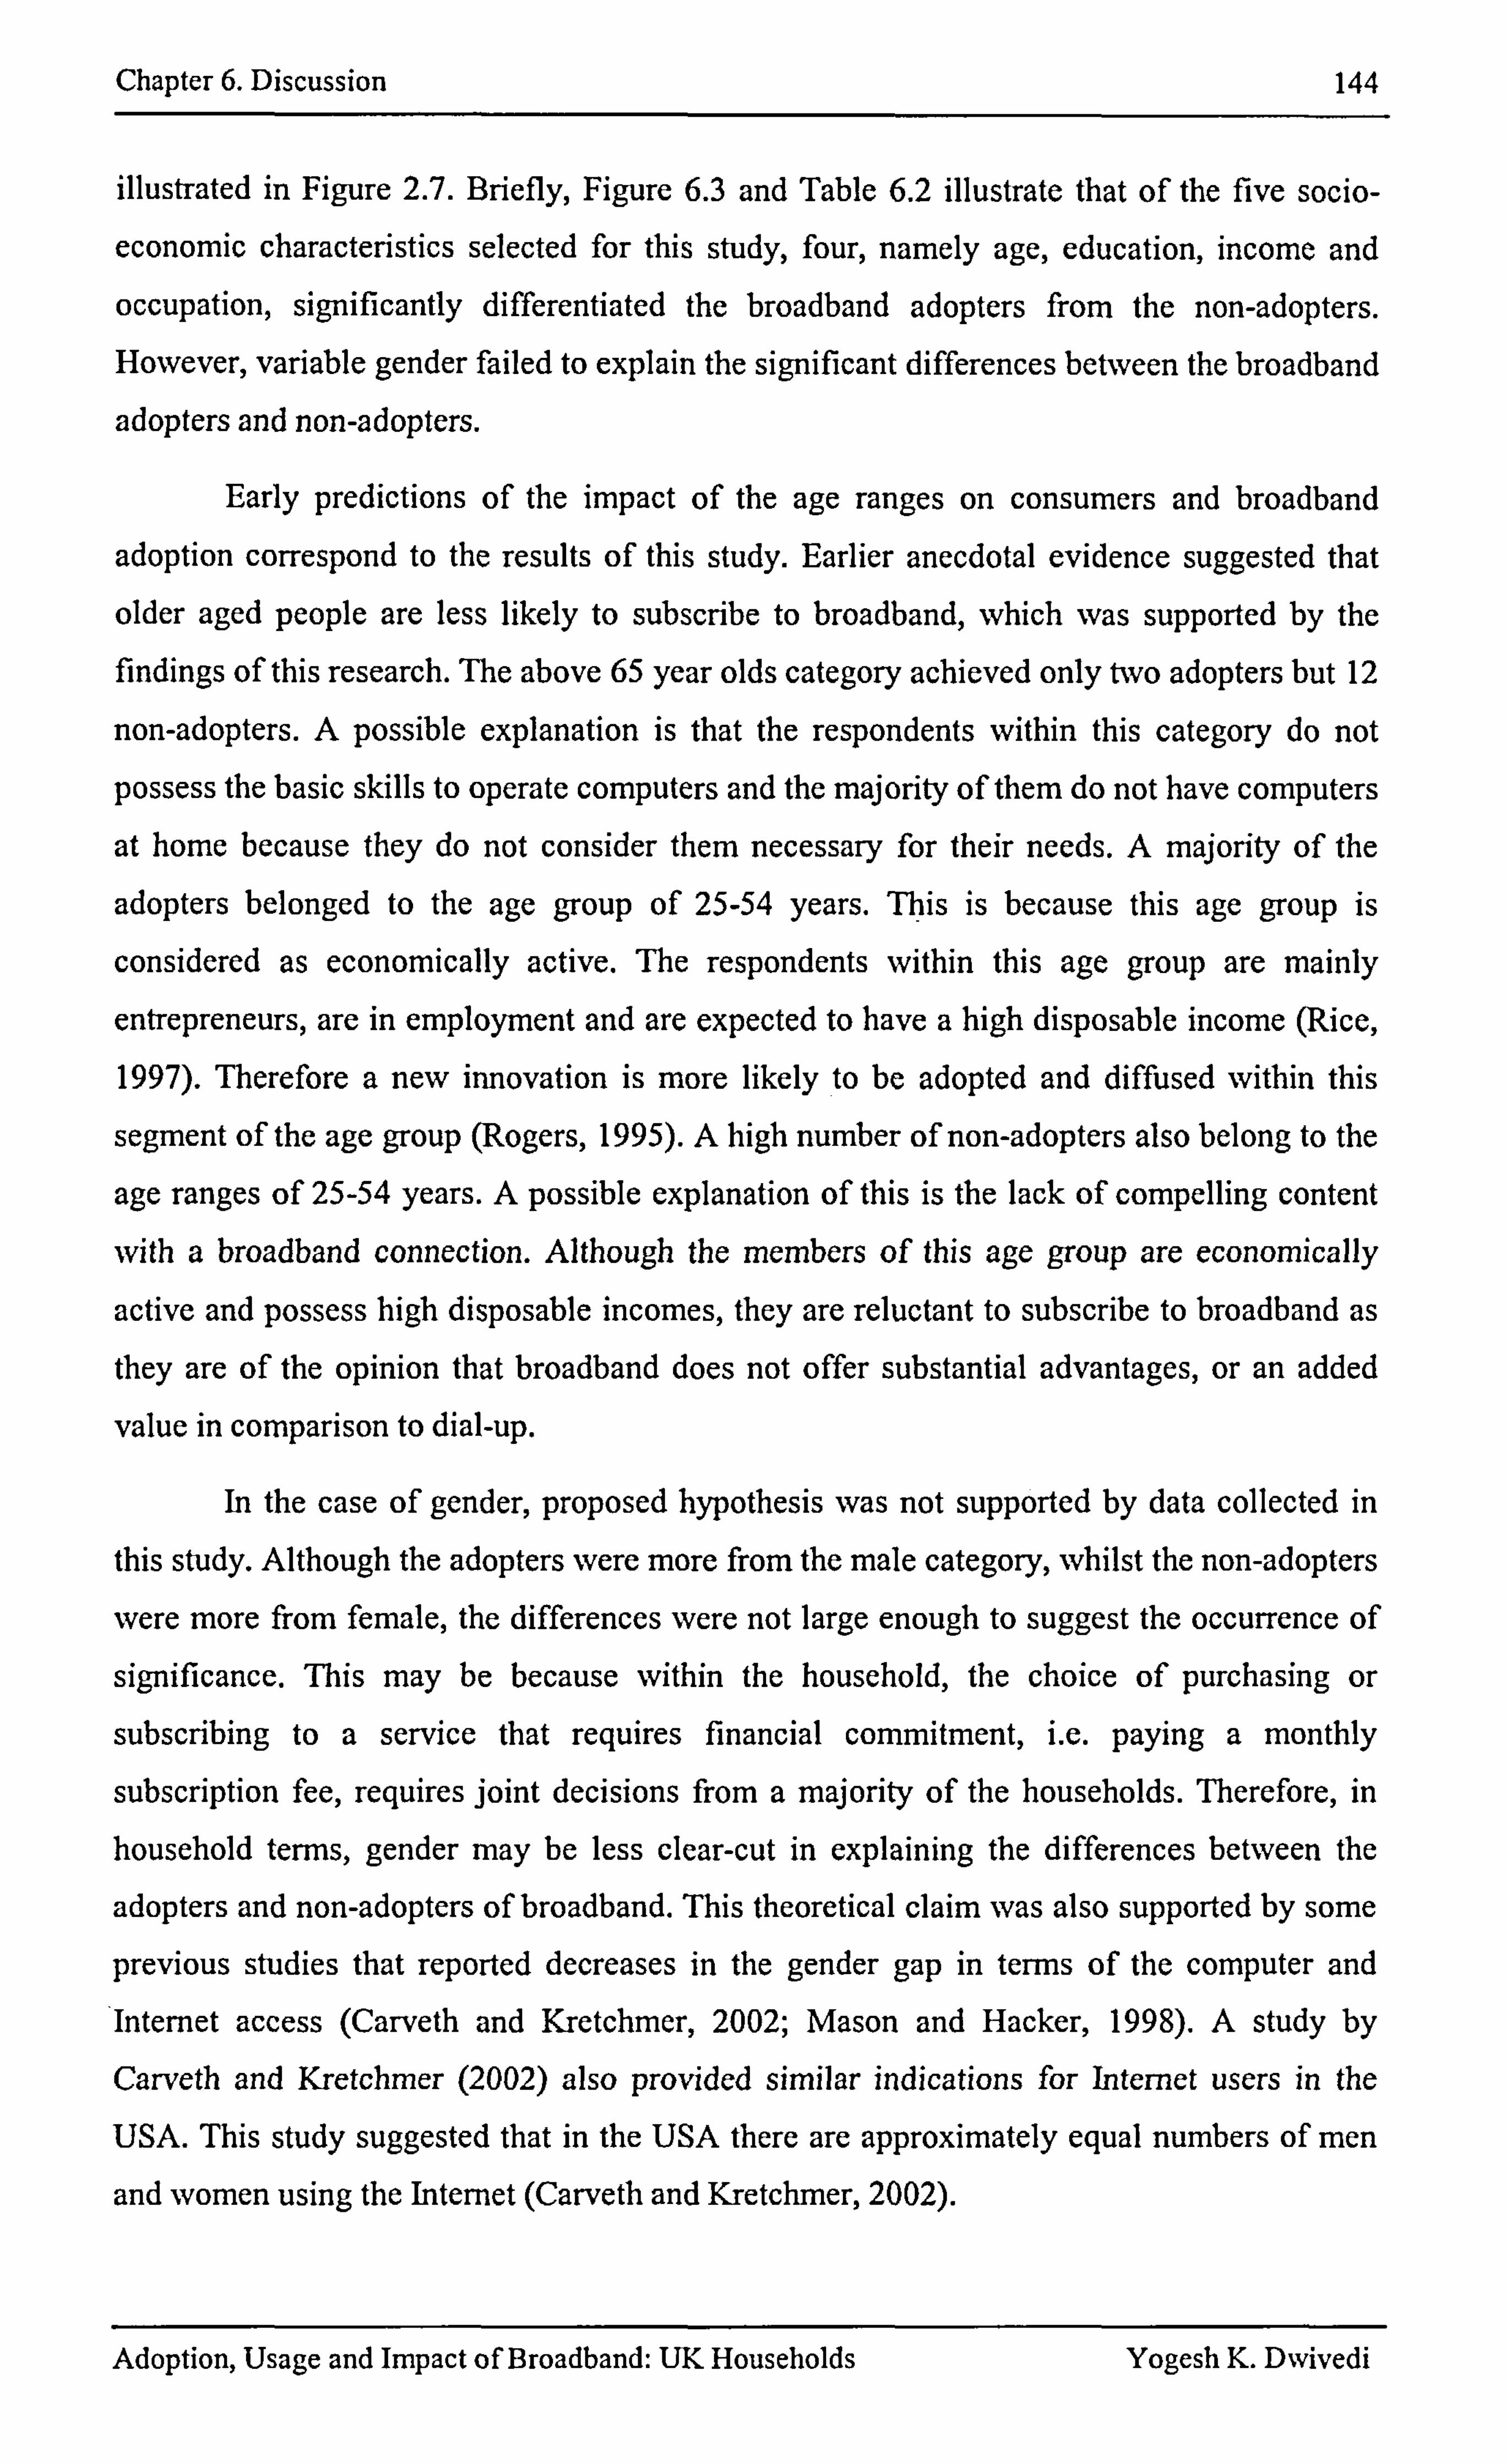
Chapter 6. Discussion 144
illustrated in Figure 2.7. Briefly, Figure 6.3 and Table 6.2 illustrate that of the five socio-
economic characteristics selected for this study, four, namely age, education, income and
occupation, significantly differentiated the broadband adopters from the non-adopters. However, variable gender failed to explain the significant differences between the broadband
adopters and non-adopters.
Early predictions of the impact of the age ranges on consumers and broadband
adoption correspond to the results of this study. Earlier anecdotal evidence suggested that
older aged people are less likely to subscribe to broadband, which was supported by the findings of this research. The above 65 year olds category achieved only two adopters but 12
non-adopters. A possible explanation is that the respondents within this category do not
possess the basic skills to operate computers and the majority of them do not have computers
at home because they do not consider them necessary for their needs. A majority of the
adopters belonged to the age group of 25-54 years. This is because this age group is
considered as economically active. The respondents within this age group are mainly
entrepreneurs, are in employment and are expected to have a high disposable income (Rice,
1997). Therefore a new innovation is more likely to be adopted and diffused within this
segment of the age group (Rogers, 1995). A high number of non-adopters also belong to the
age ranges of 25-54 years. A possible explanation of this is the lack of compelling content
with a broadband connection. Although the members of this age group are economically
active and possess high disposable incomes, they are reluctant to subscribe to broadband as they are of the opinion that broadband does not offer substantial advantages, or an added
value in comparison to dial-up.
In the case of gender, proposed hypothesis was not supported by data collected in
this study. Although the adopters were more from the male category, whilst the non-adopters
were more from female, the differences were not large enough to suggest the occurrence of
significance. This may be because within the household, the choice of purchasing or
subscribing to a service that requires financial commitment, i. e. paying a monthly
subscription fee, requires joint decisions from a majority of the households. Therefore, in
household terms, gender may be less clear-cut in explaining the differences between the
adopters and non-adopters of broadband. This theoretical claim was also supported by some
previous studies that reported decreases in the gender gap in terms of the computer and Internet access (Carveth and Kretchmer, 2002; Mason and Hacker, 1998). A study by
Carveth and Kretchmer (2002) also provided similar indications for Internet users in the
USA. This study suggested that in the USA there are approximately equal numbers of men
and women using the Internet (Carveth and Kretchmer, 2002).
Adoption, Usage and Impact of Broadband: UK Households Yogesh K. Dwivedi
Chapter 6. Discussion 145
It was expected that a large number of the educated respondents are more likely to
adopt broadband. The findings of this are in accordance with the predictions for
demographic variables, such as income and education. The findings suggest that the lowest
proportion of the adopters possess only a GCSE qualification, which is the lowest listed level
of education. Contrastingly, a majority of the adopters possessed an undergraduate and
postgraduate level education. This is because broadband is a utility tool for accessing study
material and an effective communication medium. Further-more, highly educated people are
most likely to hold higher occupation positions of employment; hence, they may need broadband to undertake office work at home.
Age I, I (x2 (5, M= 357) = 15.016, p= .0 10)
I Gender I
I Education I
I Income I
I Occupation I
(x2(4, N= 341) = 24.532, p <. 001)
(x2(5, M= 345) = 17.181, p =. 004)
(. 42 (7, N= 347) = 28.40 1, p< . 00 1)
Broadband Adoption
Figure 6.3: Effects of Demographic Variables on Broadband Adoption
The findings suggest that the majority of broadband adopters belong to either of the higher occupational categories, 'A' or '13'. It was not expected that the respondents from the
lowest occupational category i. e. 'E' would have a broadband connection; however, the findings imply that the largest number of broadband adopters belong to this category. This
can be attributed to the following reasons: the respondents are in employment that maps to
the occupational category W; however other family members may hold higher levels of
occupation. Second, as Rice (1997) argued, an anomaly in the occupational category may
occur when a respondent who belongs to 'B' obtains redundancy in employment and then immediately drops to the grade T 'section. This is despite the fact that the disposable
income could have increased due to redundancy payments (Rice, 1997).
Freeman (1995) also discusses the link between unemployment and the diffusion of ICTs. It was found in this research that the unemployed respondents in category 'E' are
engaged in re-skilling in order to achieve white-collar jobs (Freeman, 1995). ICTs facilitate
the process of re-skilling; therefore, it is more likely that such unemployed respondents become the adopters of broadband than non-adopters. The other reason behind this exception is that occupational segment 'E' consists of a majority of respondents who are studying at
various levels; thereby, they require Internet access at home. This is in accordance with Freeman's (1995) view that the most intensive use of technological resources such as
Adoption, Usage and Impact of Broadband: UK Households Yogesh K. D%vivedi
Chapter 6. Discussion 146
computers comes after school hours (Freeman, 1995). Therefore, students are most likely to
adopt new technologies including computers and broadband as a means of facilitating their
studies and improving performance.
The findings also revealed that income levels are good predictors of broadband
adopters and non-adopters, which is in line with the arguments offered in the theoretical
section (Venkatesh el al, 2000; Rogers, 1995). Further, it can be learnt that the adopters are fewer from the lower income groups. However, the numbers of adopters increase as the income level rises. Therefore, the numbers of non-adopters are higher in the lower income
group but decrease as the income level increases. The numbers of non-adopters is minimal in
the highest income category.
6.6 USAGE AND IMPACT OF BROADBAND
6.6.1 Usage of Broadband
As described in Chapter 1, studies related with usage and impact of broadband have
been in the form of user surveys, which have examined the broadband users' behaviour in
comparison to the narrowband users. Results from initial studies suggested that Internet users behave differently when they have broadband access. Broadband users use the online facilities on a longer basis, utilise more services or applications and apply them more often (Anderson et al, 2002; Carriere et al, 2000; Dwivedi and Choudrie, 2003a; Horrigan et al, 2001). In comparison to the dial-up users, broadband users spend more total time on
electronic media applications (Bouvard and Kurtzman, 2001). Although the aforementioned
studies examined the usage of broadband, they lack theoretical underpinnings, as they are data led and exploratory in nature. In order to examine and confirm differences with regards to the usage of the Internet between the broadband and narrowband household consumers in
the UK, this study employed two theoretical constructs; namely the rate of Internet use and
variety of internet use (Shih and Venkatesb, 2004). Figure 6.4 illustrates that both the
aforementioned theoretical constructs successfully distinguished broadband consumers from
the narrowband ones. In terms of both duration of internet access that is, how long
consumers spent online and frequency, that is how many times consumers access the internet
on a daily basis the broadband consumers significantly exceeded the narrowband ones (Figure 6.4). This implies that due to the advantages that broadband offers, such as faster
access, always-on access, faster download, un-metered access, consumers have been using the Internet in a more intense manner than the narrowband users.
Similar to the rate of use, the advantages of broadband also significantly influenced
UK consumers in terms of the variety of Internet use (Figure 6.4). Variety in this context
Adoption, Usage and Impact of Broadband: UK Households Yogesh K. DNvivedi
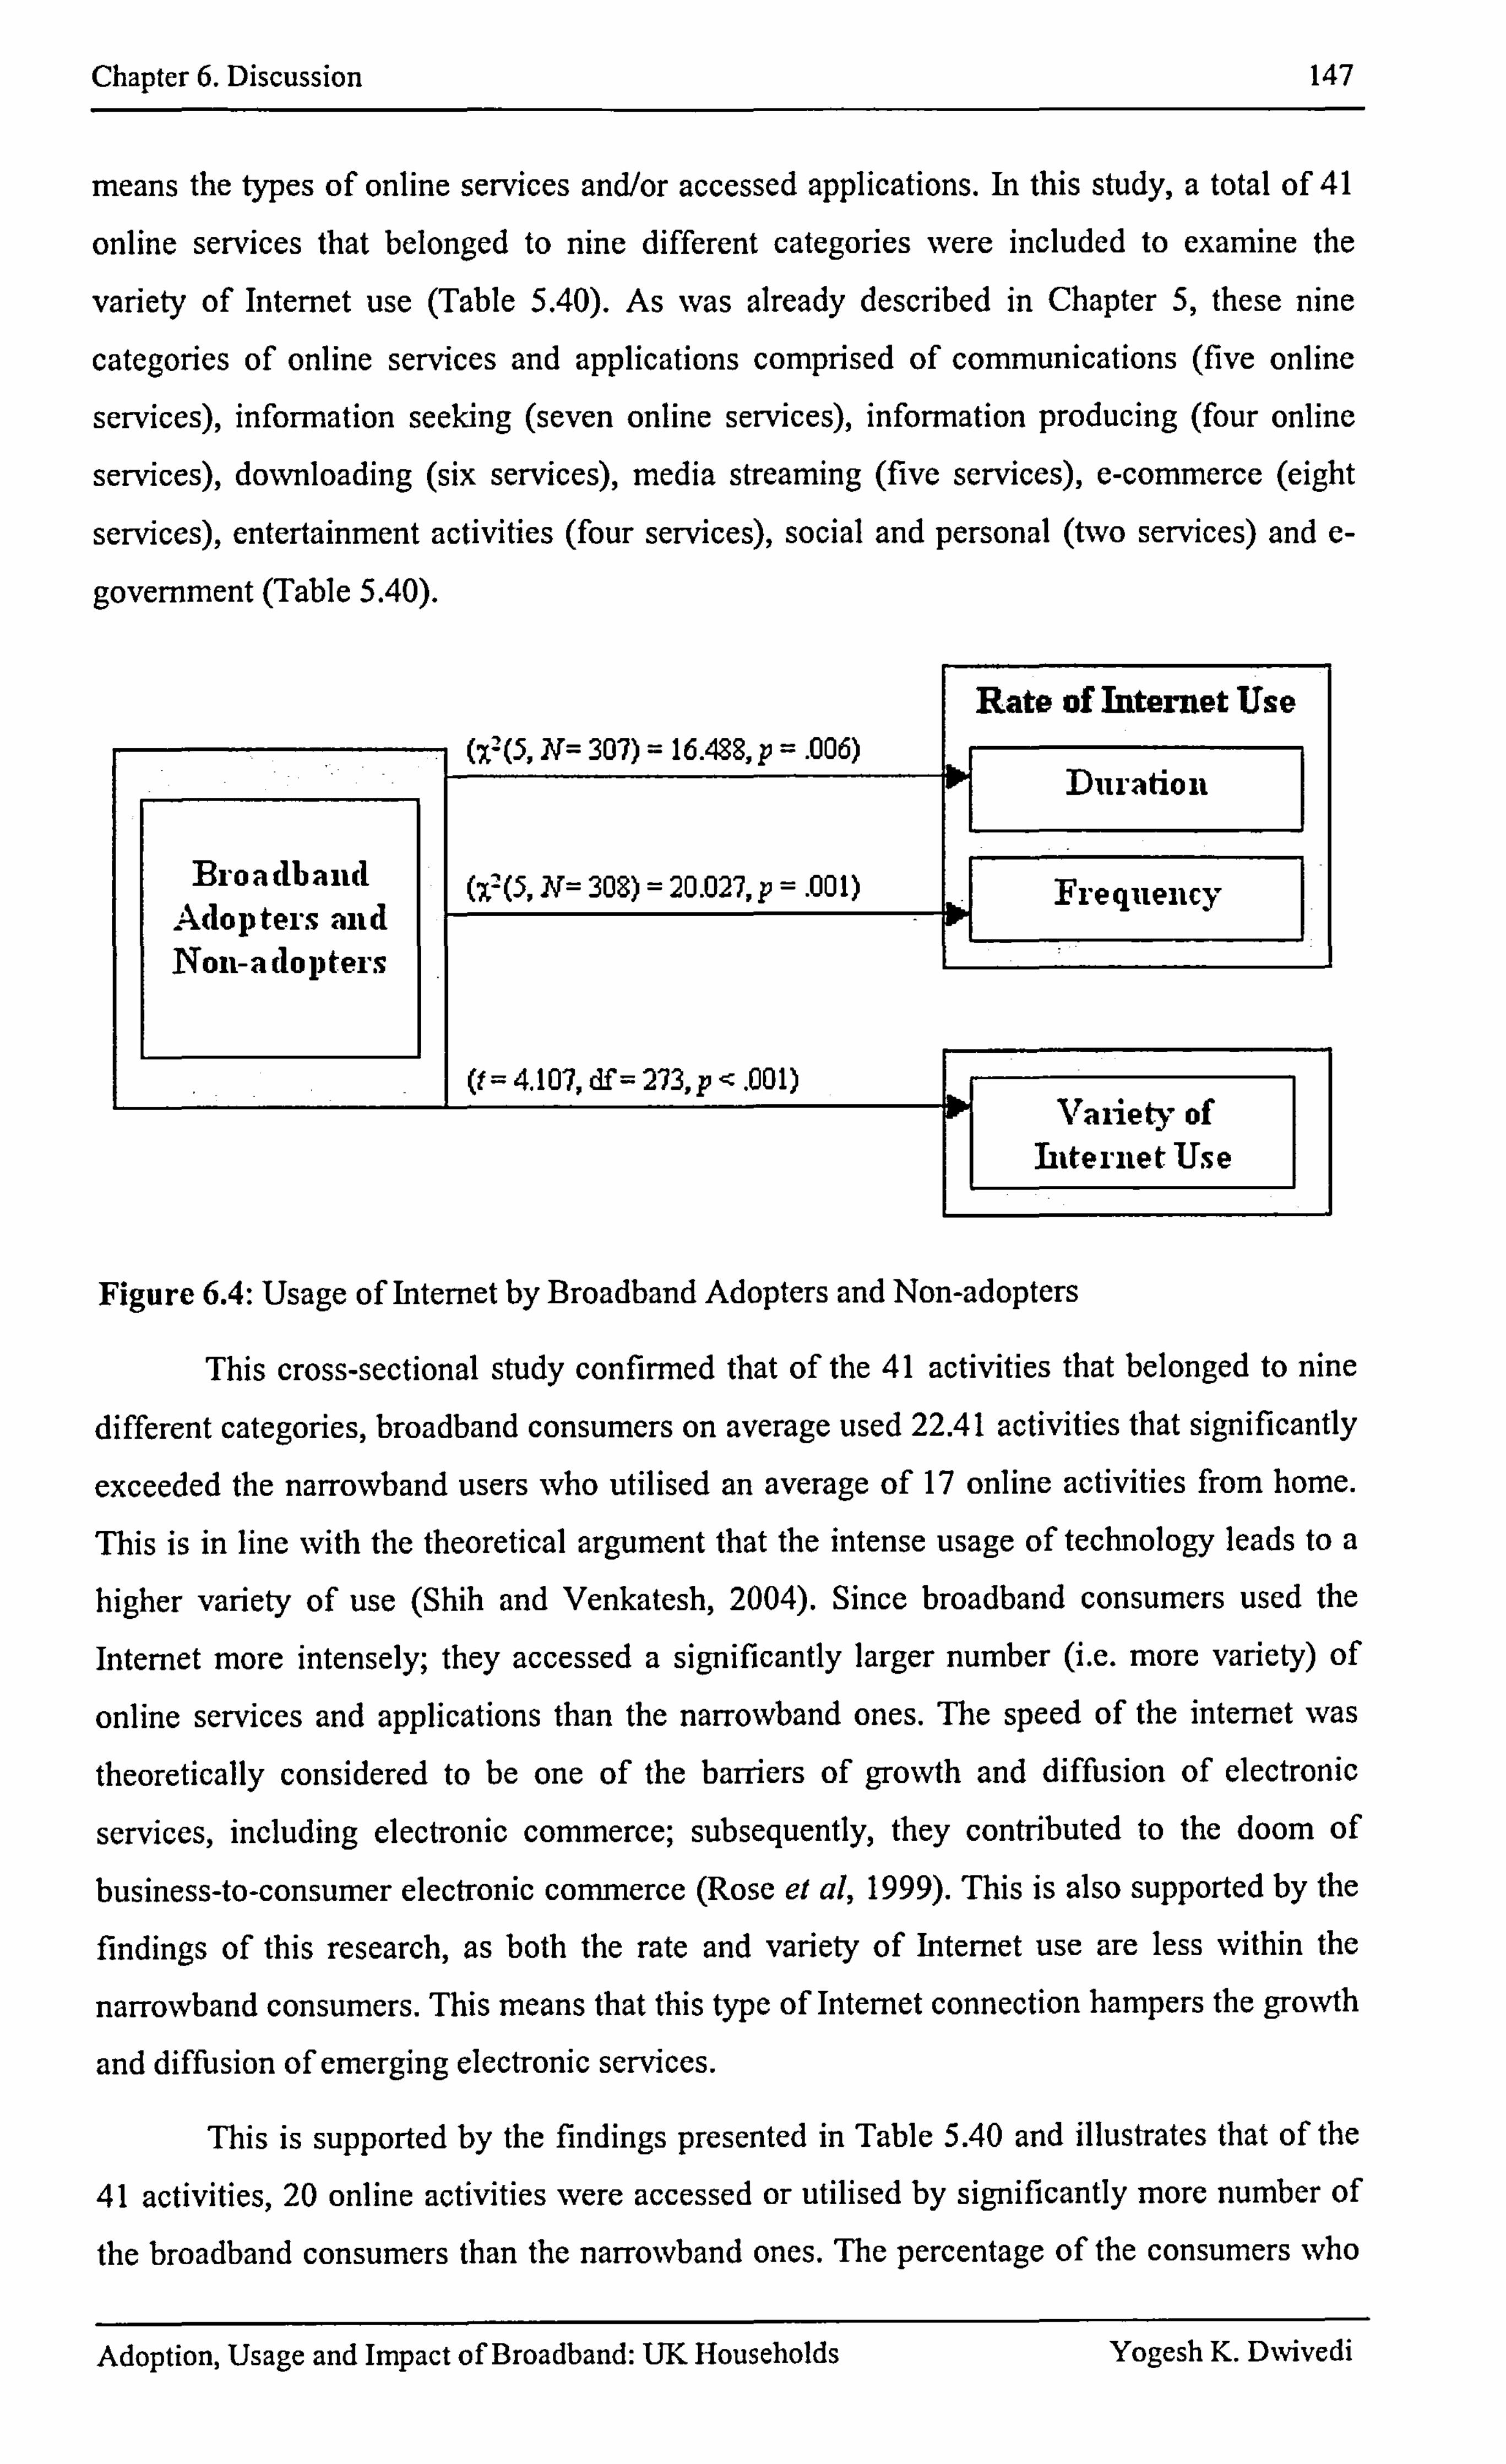
Chapter 6. Discussion 147
means the types of online services and/or accessed applications. In this study, a total of 41
online services that belonged to nine different categories were included to examine the
variety of Internet use (Table 5.40). As was already described in Chapter 5, these nine
categories of online services and applications comprised of communications (five online
services), information seeking (seven online services), information producing (four online
services), downloading (six services), media streaming (five services), e-commerce (eight
services), entertainment activities (four services), social and personal (two services) and e-
govemment (Table 5.40).
(x2(5, N= 307) = 16.488, p= . 006)
Rate of Internet Use
Broadband Adopters and Non-adopteFs
Duration
X= 308) = 20.027, p =. 001)
4.107, df = 273, p< . 00 1) Vaiiety of
Liternet Use
Figure 6.4: Usage of Internet by Broadband Adopters and Non-adopters
This cross-sectional study confirmed that of the 41 activities that belonged to nine
different categories, broadband consumers on average used 22.41 activities that significantly
exceeded the narrowband users Nvbo utilised an average of 17 online activities from home.
This is in line with the theoretical argument that the intense usage of technology leads to a
higher variety of use (Shih and Venkatesh, 2004). Since broadband consumers used the
Internet more intensely; they accessed a significantly larger number (i. e. more variety) of
online services and applications than the narrowband ones. The speed of the internet was
theoretically considered to be one of the barriers of growth and diffusion of electronic
services, including electronic commerce; subsequently, they contributed to the doom of
business-to-consumer electronic commerce (Rose et al, 1999). This is also supported by the
findings of this research, as both the rate and variety of Internet use are less within the
narrowband consumers. This means that this type of Internet connection hampers the growth
and diffusion of emerging electronic services.
This is supported by the findings presented in Table 5.40 and illustrates that of the
41 activities, 20 online activities were accessed or utilised by significantly more number of
the broadband consumers than the narrowband ones. The percentage of the consumers who
Adoption, Usage and Impact of Broadband: UK Households Yogesh K. Dwivedi
Chapter 6. Discussion 148
accessed the remaining 21 activities were also more from the broadband categories than
narrowband ones; however, the differences were not large enough to be significant. The 21
activities can be placed in the following two categories: first, online services such as email,
which does not require high speed access; hence, the services are used equally by
narrowband and broadband consumers; second, new online services such as video
conferencing and Voll? that requires high speed Internet; hence, it is not convenient to access them utilising narrowband, and consequently, few respondents tried such services. Contrastingly, although these services can be accessed utilising broadband, there are many
new consumers who may not be aware of them and subsequently they are not being utilised. However, as these emerging services mature, increasing numbers of broadband consumers
will access them, but due to bandwidth problems, the narrowband consumers may not be
able to do so. This will then lead to significant differences in the percentage of the
consumers. Again this indicates that narrowband will slow down the adoption and diffusion
of new electronic services.
6.6.2 Impact of Broadband
According to the diffusion literature, new innovations are likely to change the
associated behaviours of users, which are termed as perceived consequences or the impact of
new innovations (Rogers, 1995; Shih and Venkatesh, 2004; Vitalari et al, 1985). Previous
studies have demonstrated the impacts of various technologies (e. g. automobiles, telephones,
computers and Internet) on a user's daily life (Anderson and Tracey, 2001; Vitalari et al, 1985). It was argued in Chapter 2 that since broadband offers an alternative way of work and
entertainment and consumes time that traditionally has been spent on other activities, it is
likely that broadband will alter the time allocation pattern of a user's daily activities. Therefore, it was also a part of the research aim of this study to investigate the impact of broadband upon changes in the time allocation patterns of a UK household.
The discussion presented in Section 6.6.1 illustrates that the Internet usage behaviour of broadband consumers differs from the narrowband ones; hence, it is likely to have an impact on their daily life. The findings of this study indicate the relationship between technology use and changes in time allocation patterns, which is depicted in Figure
6.5. The significant increase in total time spent online (Figure 6.4) and frequency of Internet
access (Figure 6.4) may have triggered an imbalance in the equilibrium in the household
systems that existed before the adoption and use of broadband. This imbalance is adjusted due to the changes in time allocation patterns on various daily life activities. The findings
provide evidence that all twenty activities are affected by the change in time allocation
patterns (Table 5.41). However, the magnitude of the effect was more on the activities
Adoption, Usage and Impact of Broadband: UK Households Yogesh K. DNvivedi
Chapter 6. Discussion 149
closely related to broadband use. These include an increase in working at home and a decrease in working at an office, thereby decreasing the commuting in traffic. Similarly,
watching television and reading were considered to be cognate activities and their usage
patterns were closely similar to computer and Internet use (Vitalari et al. 1985). Therefore, a
substantial number of respondents reported a reduction or increase in time for these activities (Table 5.41). It was also found that there is a significant difference between the narrowband
and broadband consumers in terms of changes in time allocation patterns for five activities that comprised a decrease in shopping in store, increases in job related work at home,
decreases in working in the office, decreases in commuting in traffic and a reduction in
reading newspapers and books (Table 5.41).
Although differences occurred for the remaining 15 activities, they were not large
enough to be statistically significant (Table 5.41). This was because the aforementioned five
activities have a close relation to high-speed Internet connection use, whereas the other 15 do
not. For example, performing job related tasks at home does require high-speed Internet
services for efficiency and effectiveness reasons. Similarly, shopping online requires a high-
speed Internet service for security and convenience reasons. Therefore, these activities were
significantly affected by Internet use, as opposed to the impacts on other activities such as
the time spent on sport, which has the least relation to Internet use.
The above discussion supports the theoretical arguments presented in Chapter 2
(Section 2.10). The findings support the model of homeostasis that was utilised to
conceptualise the impact of broadband on the time allocation patterns of households. This is
similar to the previous study (Vitalari el al, 1985) that examined the impact of computer use in the household. Subscribing to the Internet at home may affect a consumer in one of the
following three possible ways. First, a lack of change in the existing pattern of behaviour; as is illustrated in Table 5.41, respondents reported no change in the way they acted. This is
because the characteristics of household users, such as age, are such that they elicit a low
level of interest in the Internet (Vitalari el al, 1985).
Second, short term changes in the behaviour for those activities that are reported by
a small number of respondents. Such activities are mainly external in nature and include
sports, eating and socialising with friends (Vitalari et al, 1985). The reason why a technology
- in this case, broadband - affects unrelated activities is that, at the initial stage of adoption,
users try to experiment and undertake new activities with technology and consequently have
less time to spend on other activities. However, such changes slowly disappear as users get
acquainted and adjusted to the use of new technology (Vitalari et al, 1985). It was also
argued that the aforementioned short-term changes might become long-term if the use of the
Internet is continued over time (Vitalari et al, 1985). For example, online shopping may be
Adoption, Usage and Impact of Broadband: UK Households Yogesh K. DNvivedi
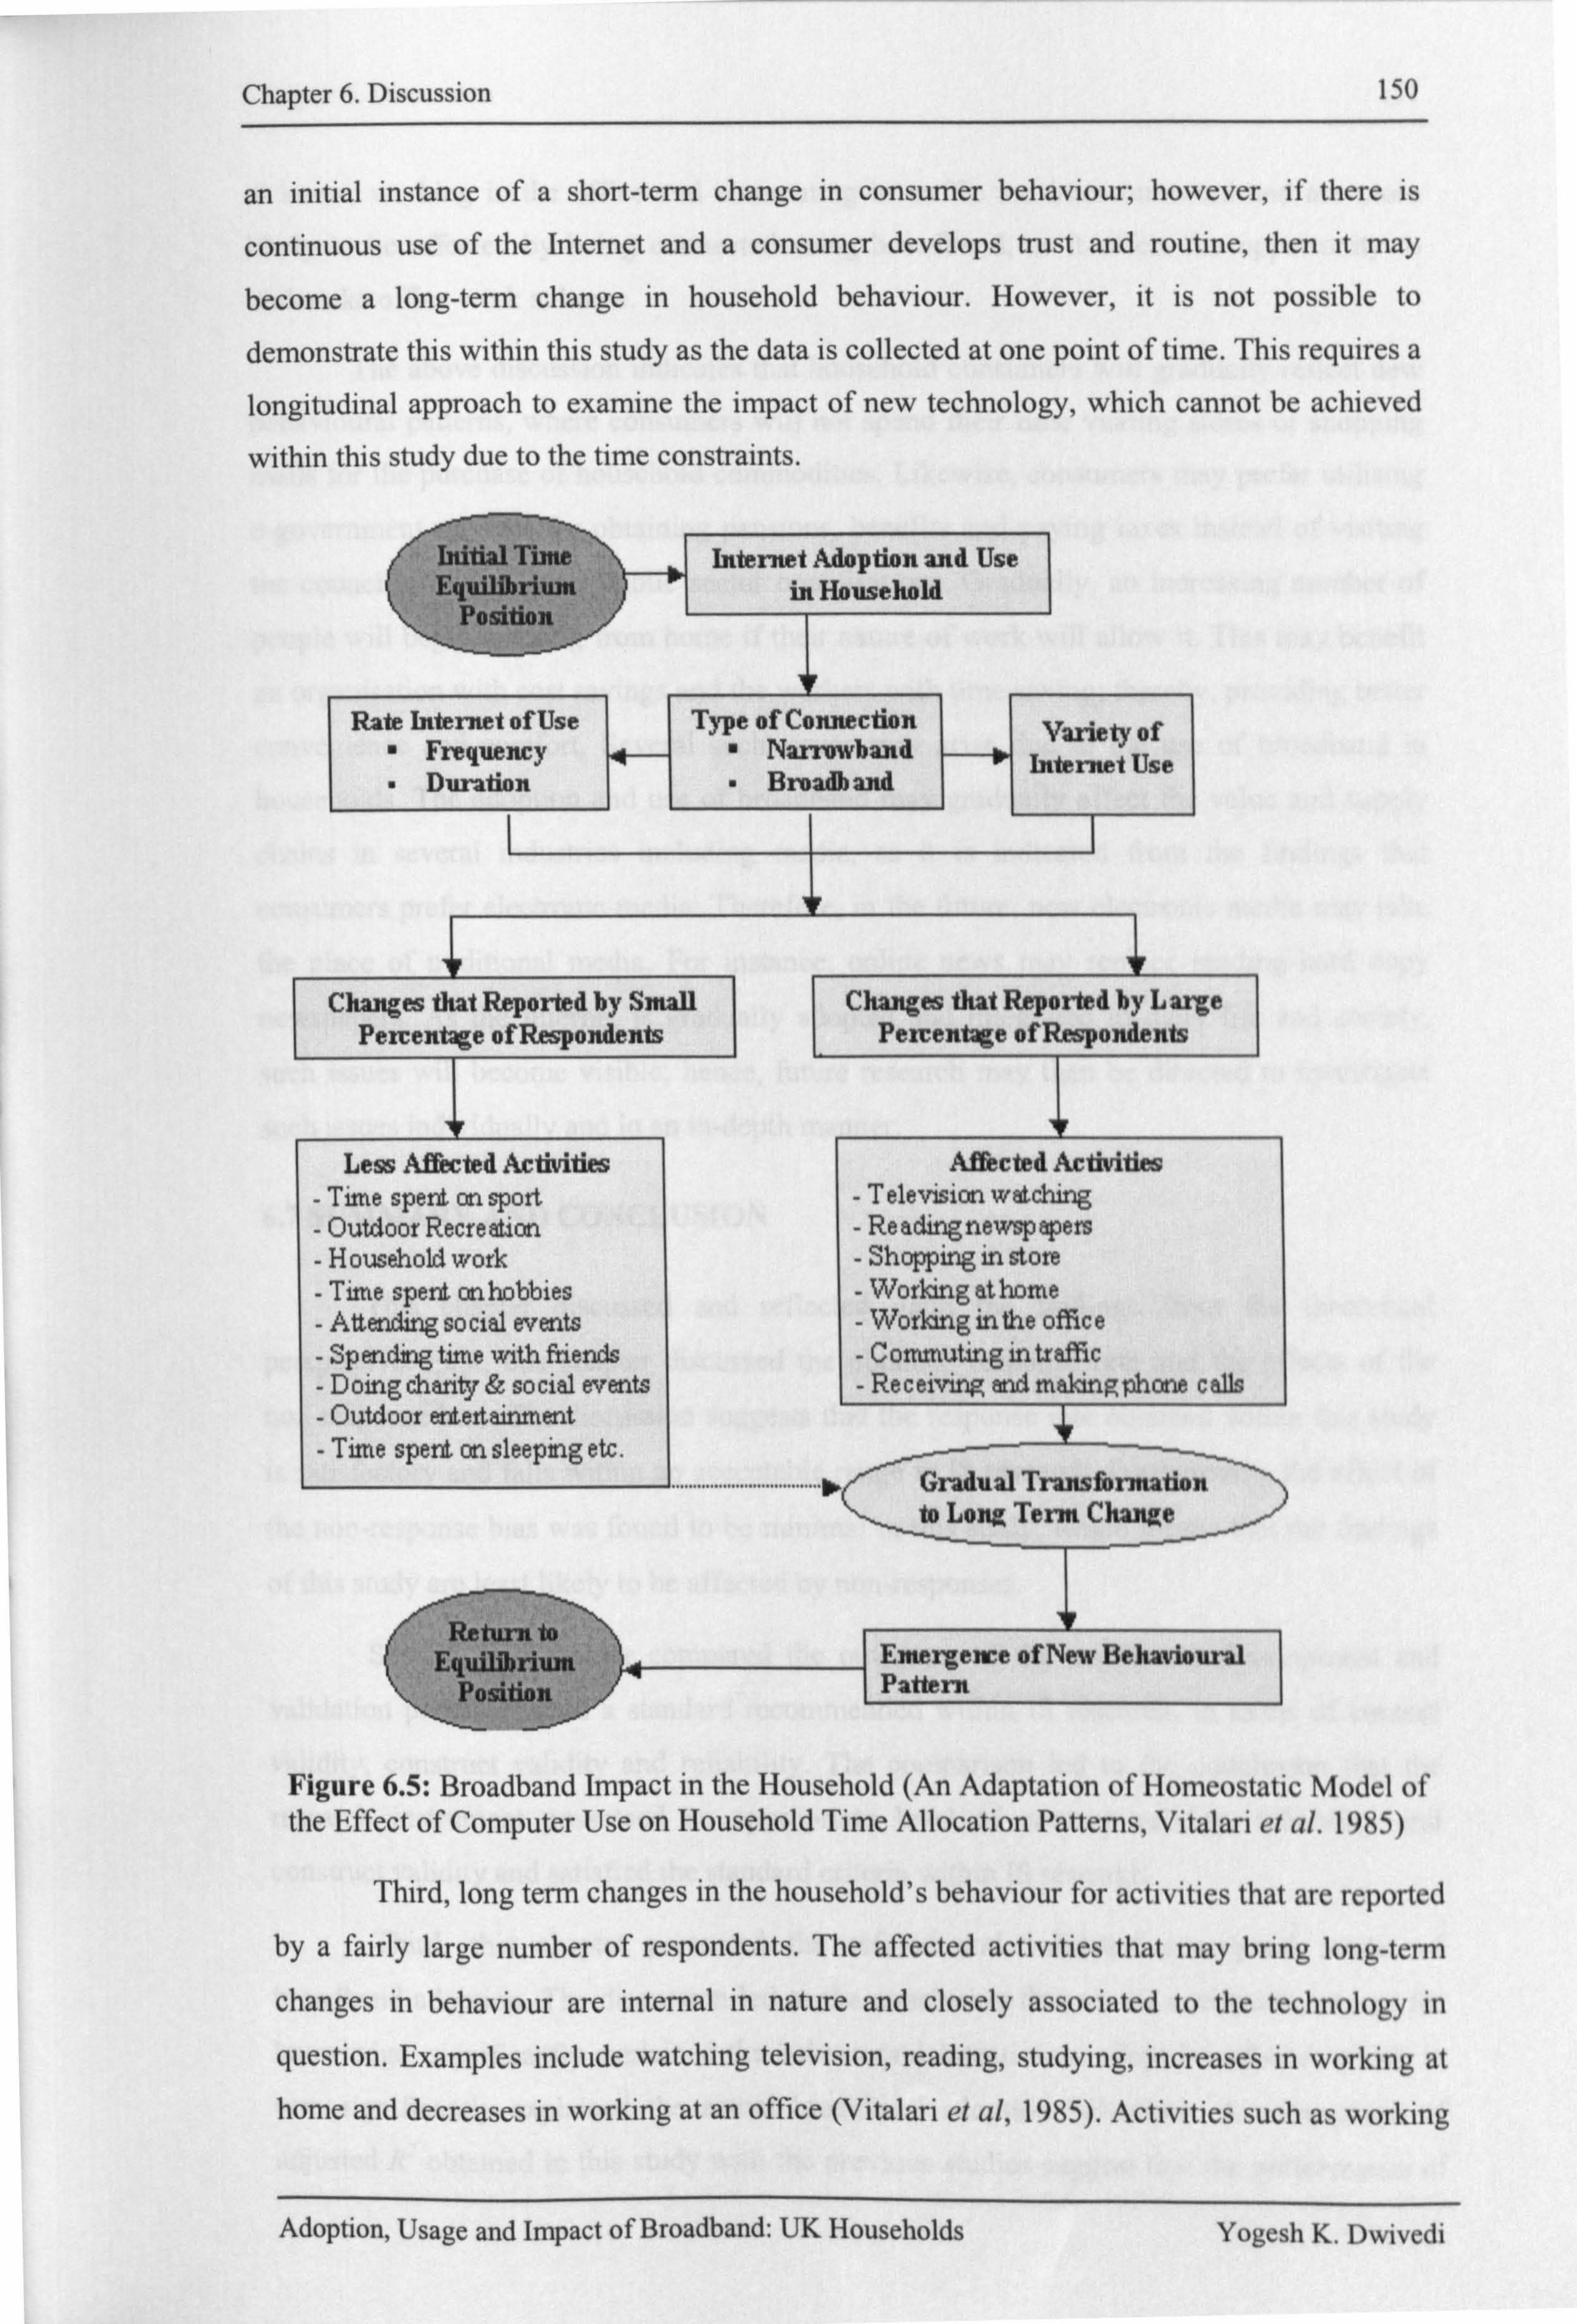
Chapter 6. Discussion 150
an initial instance of a short-term change in consumer behaviour; however, if there is
continuous use of the Internet and a consumer develops trust and routine, then it may
become a long-term change in household behaviour. However, it is not possible to
demonstrate this within this study as the data is collected at one point of time. This requires a
longitudinal approach to examine the impact of new technology, which cannot be achieved
within this study due to the time constraints.
Initial Time Internet Adoption and Use Equilibrium in Housekold
Position
Rate Intentet of Use Type of Connection Variety of Frequency Narrawband, Intermet Use Duration Broadband
Changes that Reported by Small Percentage of Respondents
I
Less Affected Activities
- T=e spert on. sport - Outdoor Recre alion -H ousehold work - T=e spent on. hobbies
- Attending social events - Spending time with ftiends
- Doing charity & social events - Outdoor entertainment - Time spent on. sleeping etc.
Changes that Reported by Large Percentage of Respondents
I
Affected Ac*ltiew
- Television watcl-ýing - Readingnewspapers
- Shopping in store - Working at home
- Working in the office - Commuting In traffic - Re c eiving and making phone c &Us
Gradual Transformation to Long Tenn ChaMe
Return ti) Emergence of New Bekavioux-J Paftern
I
Figure 6.5: Broadband Impact in the Household (An Adaptation of Homeostatic Model of the Effect of Computer Use on Household Time Allocation Patterns, Vitalari et al. 1985)
Third, long term changes in the household's behaviour for activities that are reported by a fairly large number of respondents. The affected activities that may bring long-term
changes in behaviour are internal in nature and closely associated to the technology in
question. Examples include watching television, reading, studying, increases in working at home and decreases in working at an office (Vitalari et al, 1985). Activities such as working
Adoption, Usage and Impact of Broadband: UK Households Yogesh K. Dwivedi
Chapter 6. Discussion 151
at home, working in the office and commuting in traffic are interconnected and are more likely to be affected by being connected using broadband, as it offers the opportunity to
undertake office work at home.
The above discussion indicates that household consumers will gradually reflect new behavioural patterns, where consumers will not spend their time visiting stores or shopping
malls for the purchase of household commodities. Likewise, consumers may prefer utilising
e-government services for obtaining pensions, benefits and paying taxes instead of visiting the council office or other public sector organisations. Gradually, an increasing number of
people will begin working from home if their nature of work will allow it. This may benefit
an organisation with cost savings and the workers with time saving; thereby, providing better
convenience and comfort. Several such issues may arise due to the use of broadband in
households. The adoption and use of broadband may gradually affect the value and supply
chains in several industries including media, as it is indicated from the findings that
consumers prefer electronic media. Therefore, in the future, new electronic media may take
the place of traditional media. For instance, online news may replace reading hard copy
newspapers. As the Internet is gradually adopted and integrated in daily life and society,
such issues will become visible; hence, future research may then be directed to investigate
such issues individually and in an in-depth manner.
6.7 SUMMARY AND CONCLUSION
This chapter discussed and reflected upon the findings from the theoretical
perspective. First, this chapter discussed the obtained response rate and the effects of the
non-response bias. The discussion suggests that the response rate obtained within this study is satisfactory and falls within an acceptable range in IS research. Furthermore, the effect of
the non-response bias was found to be minimal in this study, which means that the findings
of this study are least likely to be affected by non-responses.
Second, this chapter compared the outcomes of the instrument development and
validation processes with a standard recommended within IS research, in terms of content
validity, construct validity and reliability. The comparison led to the conclusion that the
research instrument possessed an appropriate level of content validity, reliability and
construct validity and satisfied the standard criteria within IS research.
Third, this chapter presented the refined and validated conceptual model of broadband adoption. The discussion led to the conclusion that all the constructs, except for
knowledge, significantly explained the behavioural intention to adopt broadband; which in
turn significantly explained the actual broadband adoption behaviour. A comparison of
adjusted R2 obtained in this study with the previous studies suggest that the perfon-nance of
Adoption, Usage and Impact of Broadband: UK Households Yogesh K. D%vivedi
Chapter 6. Discussion 152
the conceptual model that was used to understand the behavioural intention for the adoption
and actual broadband adoption is as good as its guiding models.
Fourth, this chapter also discussed the usage and impact of broadband on household
consumers. The discussion revealed that the broadband users differ from narrowband ones
with regards to the usage and impact of the Internet. From the discussion, it can be
concluded that broadband consumers significantly differ from narrowband ones in terms of duration and the frequency of Internet access on a daily basis. It was also found that the use
of broadband significantly affected the time allocation patterns on those activities that
closely resemble it or those whose execution is dependent on the faster access of the Internet.
Finally, the next chapter (Chapter 7) will conclude this dissertation. Chapter 7 will initially provide a summary, as well as conclusions drawn from each chapter. Then
discussions on research contribution, limitations and further research directions are provided.
Adoption, Usage and Impact of Broadband: UK Households Yogesh K. DNvivedi

Chapter 7. Conclusions and Future Research Directions 153
7.1 INTRODUCTION
This chapter provides a conclusion to the results and discussions of the research
presented in this thesis. The chapter begins with an overview of this research in Section 7.2.
This is followed by the main conclusions drawn from this research in Section 7.3. Then
Section 7.4 provides a discussion of the research contributions and implications of this
research in terms of the theory, policy and practice. This is followed by the research limitations in Section 7.5. A review of the future research directions in the area of broadband
diffusion and adoption is provided in Section 7.6. Finally, the summary of the chapter is
provided in Section 7.7.
7.2 RESEARCH OVERVIEW
Chapter I defined the research problem and outlined the research motivation for
conducting this research. Given large-scale investments in developing and upgrading infrastructures, the slow uptake and decreasing rate of residential broadband adoption in the
UK was the motivation for this research. The literature analysis indicated that existing
research on broadband had frequently examined this issue from macro level perspectives,
such as the geography of the country, density of population, competition amongst Internet
Service Providers (ISPs), local loop unbundling, stakeholder analysis and government
policies. Although the aforementioned types of studies were helpful to prepare and promote
the broadband market, they offered limited implications to the ISPs who are the most important supply side stakeholders and who are directly involved with the household
consumers.
However, the analysis of the literature suggested that an examination of broadband
adoption, usage and impact from the consumers' perspective has just begun to emerge and is
yet to be undertaken. It was also found that initial studies from the broadband consumers'
perspective are mainly data driven and exploratory in nature. A recently conducted study (Oh et al, 2003) has made initial efforts in investigating the influence of the diffusion of innovation characteristics on attitude building towards the use of broadband in South Korea.
However, the contributions of the study were also limited, as it did not examine how various factors including attitude influence the behavioural intentions (BI) and actual adoption of broadband. This study also excluded the issue of broadband usage and impact on consumers
and how it differs from narrowband consumers. Since both aforementioned issues, which
were excluded from Oh el al's (2003) study, are imperative for understanding broadband
adoption, the implications of the study for ISPs and policy makers were limited.
Adoption, Usage and Impact of Broadband: UK Households Yogesh K. D%vivedi
Chapter 7. Conclusions and Future Research Directions 154
Therefore, this research aimed to identify and determine the consumer level factors
that influence broadband adoption and use and, consequently, its impact on LJK household
consumers. The objectives to achieve the overall aim include: developing a conceptual
model; developing and validating a research instrument; then conducting data collection and
analysis in order to validate and refine the conceptual model; and finally outlining implications for theory, practice and policy. Chapter I also provided brief information on
potential research approaches, outlined the research contribution to theory, practice and
policy and finally provided an overview of the dissertation.
In order to achieve the first objective of this research, Chapter 2 first reviewed the
various technology adoption and diffusion related theories and models including the Diffusion of Innovations, TRA, TPB, DTPB, TAM, MATH and Use Diffusion Models.
Since the aforementioned adoption and diffusion theories and models provided this research
with a number of underlying constructs or factors, they were considered to be guiding frameworks for current research. Chapter 2 then discussed and justified the reason for
selecting factors that were expected to predict the BI to adopt broadband, which ultimately
explains the broadband adoption behaviour (BAB). Also the BAB is expected to differentiate
between the rate and variety of Internet usage between broadband and narrowband users.
Using selected factors, a conceptual model of broadband adoption was developed.
The proposed conceptual model is based on the assumption that the attitudinal, normative
and control factors are responsible for influencing BI to adopt broadband, which in turn is
expected to predict the BAB. This study also included constructs that investigated whether the broadband users differ from narrowband users with regards to usage and the impact of the Internet. Whilst discussing the aforementioned factors, a number of underlying hypotheses were also proposed that are required to be tested in order to validate and refine the conceptual model. Accomplishment of Chapter 2 led to achieve the first objective of this
research, which is "to develop a conceptual modelfor exandning consitiner adoption, usage
and inipact of broadband".
Chapter 3 provided an overview of the research approaches utilised within the
information systems (IS) field and then selected an appropriate research approach for
guiding this research. To validate and understand the conceptual model it was found that a
quantitative research approach would be more appropriate than a qualitative one. An
overview of the underlying epistemologies was provided in order to decide whether
positivism is appropriate as a philosophical foundation for this research. Following this, an
overview discussion on various issues related to the available research approaches in the IS
field, and a justification for the selection of the survey as a research approach, is provided.
Adoption, Usage and Impact of Broadband: UK Households Yogesh K. D%vivedi
Chapter 7. Conclusions and Future Research Directions 155
The survey research approach was considered most appropriate when conducting this study. The survey approach facilitates data collection from a wide geographical area (i. e.
nationwide) within a limited time and resources (Fowler, 2002). This was required to determine if the selected underlying constructs significantly explained the consumers' decision regarding broadband adoption and subsequent use and impact. Following this, there
was a detailed account of the various aspects of the survey approach. It was found that for
the purpose of this research it was appropriate to employ UK-Info Disk V 11 as a sampling frame, with stratified random sampling as a basis of sample selection and a postal (i. e. mail)
questionnaire as a data collection tool. The reasons for the aforementioned selection were
also provided in a detailed manner. The issues relating to the data analysis were then discussed in detail and it was concluded that a number of statistical techniques such as factor
analysis, 1-test, ANOVA, X2 test, discriminant analysis, binary correlations, linear and logistics regression analysis were appropriate to utilise for data analysis purposes in this
research.
Chapter 4 described the development process for a research instrument. The
development process was achieved in three stages, which were made up of the exploratory
survey, content validity and instrument testing. The exploratory stage included surveying the known existing instruments, choosing appropriate items, creating the required new items and then determining if the selected items were appropriate enough to measure the perceptions of
adopters and non-adopters. This stage also examined the reliability of the initial scale. At this
stage it was found that although the majority of items either selected from the existing instrument or newly created ones were important enough to describe the behaviour of the
adopters and non-adopters, the reliability of the scale was low in most cases. The exploratory
stage also helped to identify a new construct that is termed as 'service quality'. 'Me output of this stage of the research was utilised as an input for the content validation stage.
The content validation stage involved the creation of new items for each construct
and then validation of their representativeness, utilising a quantitative approach. These new items were created utilising the items obtained from the exploratory stage and also
resurveying the literature and selecting the relevant items. In order to achieve the
representativeness of the items, several experts working on broadband related issues
evaluated the newly created items. This led to the calculation of a content validity ratio that
was the basis of the exclusion or inclusion of the items. The outcome of this stage was the inclusion of representative items and the exclusion of non-related items.
The instrument testing stage was sub-divided into two stages, which included the pre
and pilot tests. The purpose of the pre-test was to obtain feedback from the respondents on
the instrument, in order to improve the wording of items. The purpose of the pilot test was to
Adoption, Usage and Impact of Broadband: UK Households Yogesh K. DNvivedi
Chapter 7. Conclusions and Future Research Directions 156
confirm the reliability of the items. The findings obtained from the pilot test demonstrated an
acceptable level of reliability for all the constructs. The reliability of all the ten scales improved after conducting a content validity and pre-test. This demonstrates the importance
of performing a content validation for the increasing reliability of scale and also the
representativeness of the items. The final output of the three-stage instrument development
process that was undertaken in Chapter 4 is a parsimonious, 40-item instrument, consisting
of II scales, all with a high level of reliability.
Chapter 5 presented the findings obtained from the data analysis of the conducted
survey that examined consumer adoption, usage and impact of broadband in the UK
households. The findings were obtained using several steps. The first step was to calculate the survey's response rate and conduct a response bias test. The estimated response rate was 26.6% and the response bias test suggested that there was no significant difference for the demographic characteristics such as the age and gender of the respondents and non-
respondents. Also the response bias test showed no significant difference between the
responses of the respondents and non-respondents with regards to key constructs such as
relative advantage, utilitarian outcomes, hedonic outcomes, service quality, secondary influence, knowledge, self-efficacy and facilitating conditions resources. Responses for one
of the construct 'primary influence' were found to be significantly different for the
respondents and non-respondents. Since all other constructs and demographics were non-
significant, it was concluded that there were minimal chances of a response bias in collected data.
Chapter 5 also presented the findings that illustrate the reliability test, construct
validity and effect of ordering of the questionnaire items. The reliability test confirmed that
the measures are internally consistent, as all the constructs possessed a Cronbach's alpha
above 0.70. Construct validity was established utilising Principal Component Analysis
(PCA). Results of the PCA provided evidence of higher KMO values, a significant
probability of Bartlett's test of sphericity, extraction of nine components consistent with the
number of independent factors in the conceptual model (all nine factors possessed
eigenvalues above 1), factors loaded above 0.40 and no cross loading above 0.40. This
confirms that both types of the construct validity (i. e. convergent and discriminant) exist in
the survey instrument. A Mest was conducted to confirm if any difference occurs due to the
ordering of the questionnaire's questions. The results indicated that there was no significant difference between the responses with or without the questions being ordered. This further
strengthened the existence of the construct validity in the survey instrument.
This was followed by the descriptive statistics for both the items and the scale being
provided. The findings suggested that the survey respondents showed strong agreement for
Adoption, Usage and Impact of Broadband: UK Households Yogesh K. DNvivedi
Chapter 7. Conclusions and Future Research Directions 157
all the constructs except the behavioural intention to change service providers (BISP). Results from the Mest and discriminant analysis suggested that there was a significant difference that occurred between the obtained responses from the narrowband and broadband
consumers with regards to the attitudinal, normative and control constructs. Examination of the demographic differences that arose by employing the chi-square test suggested that the broadband consumers significantly differed from the narrowband consumers in terms of age, education, occupation and income. Finally, the regression analysis suggested that the
attitudinal, normative and control constructs significantly explained the BI that, in turn,
significantly explained the BAB, along with the facilitating conditions resources.
The findings related to the usage of the Internet suggested that the broadband
consumers significantly differed to the narrowband ones in tenris of consumers' online habits and Internet use variations. The numbers of broadband consumers were exceedingly
and significantly higher than the narrowband consumers for accessing or using 19 online services from a total of 41 services examined in this research. The last section of Chapter 5
examined the effects of broadband usage on a consumer's time allocation pattern in twenty daily life activities. The findings suggested that, for all twenty activities, the broadband
consumers' time allocation pattern differed from the narrowband ones; however, a significant difference was found to be apparent for only five activities.
Chapter 6 discussed and reflected upon the findings from the theoretical
perspectives. This chapter first discussed the obtained response rate and effects of the non-
response bias. The discussion suggests that the response rate obtained within this study is
satisfactory and falls within a range that is acceptable in the IS research. Furthermore, the
effects of a non-response bias were found to be minimal in this study, which means that the findings of this study are least likely to be affected due to non-responses. Then the outcomes
of the overall instrument development and validation process were also compared to a
recommended standard within IS research with regards to content validity, construct validity
and reliability. The comparison led to the conclusion that a research instrument possessed an
appropriate level of content validity, reliability and construct validity and satisfied the
standard criteria within IS research. Accomplishment of chapters 3,4,5, along with part of Chapter 6, led to the achievement of the second objective of this research, which was "to
operationalise the consinicts included in conceptual niodel by developing a research instrinnent and deinonstrate their reliability and validity".
Chapter 6 then presented and discussed the refined and validated conceptual model
of broadband adoption. The discussion led to the conclusion that all the constructs except knowledge significantly explained the BI to adopt broadband, which in turn significantly
explained BAB. Comparison of the adjusted R2 obtained in this study compared with
Adoption, Usage and Impact of Broadband: UK Households Yogesh K. DNvivedi
Chapter 7. Conclusions and Future Research Directions 158
previous studies suggests that the performance of the conceptual model that can be used to
understand the BI for the adoption and actual broadband adoption is as good as its guiding
models. This chapter then discussed the usage and impacts of broadband on household
consumers. The discussion revealed that the findings supported the assumption made in
Chapter 2 that broadband users differ from narrowband users with regards to the usage and impact of the Internet. It is possible to conclude from the discussion that broadband
consumers differ significantly from the narrowband ones in terms of duration and frequency
of Internet access on a daily basis.
It was also found that the use of broadband significantly affected the time allocation
patterns on those activities that closely resemble it or those whose execution is dependent on faster access of Internet. Completion of Chapter 5 and Chapter 6 led to achieving the third
objective of this research, which was "to enipirically validate and refine the conceptual
inodel that is proposed to exandne hroadband adoption, usage and inipact in UK
households". Accomplishment of these two chapters also led to answering all research
questions outlined in Chapter 2 (Section 2.3.1).
7.3 MAIN CONCLUSIONS
The following main conclusions are drawn from this research and are based on
underlying research questions proposed in Chapter 2 (Section 3.2.1):
1. All three types of construct, namely overall attitudinal, normative and control
constructs significantly explained the BI of consumers when adopting broadband.
Amongst the aforementioned three types of construct, overall control construct
contributed to the largest variance (P = 0.367) when explaining BI of broadband
consumers. The overall attitudinal constructs contributed to the second largest
variance (P = 0.282), whilst overall normative constructs (P = 0.15 1) contributed the
least amongst the aforementioned three types of constructs.
2. A total of seven constructs from attitudinal (relative advantage, utilitarian outcomes, hedonic outcomes), normative (primary influence) and control (knowledge, self-
efficacy and facilitating conditions resources) categories were expected to be
correlated to the BI of consumers when adopting broadband in the UK household.
Of the aforementioned seven constructs, six including relative advantage, utilitarian
outcomes, hedonic outcomes, primary influence, self-efficacy and facilitating
conditions resources significantly correlated to the BI of consumers when adopting broadband in the UK household. The only one that did not was knowledge.
Adoption, Usage and Impact of Broadband: UK Households Yogesh K. D%vivedi
Chapter 7. Conclusions and Future Research Directions 159
3. In terms of the size of the effect of the six aforementioned constructs that
contributed significantly to the behavioural intentions, relative advantage exhibited largest (P = 0.255) and hedonic outcomes (P = 0.10) demonstrated the least variance to the BI when adopting broadband in the UK households. Primary influence
explained the second largest variance (P=0.195), which was followed by
facilitating conditions resources (P=0.180). The fourth strongest construct was
self-efficacy (P = 0.165) and the fifth one was utilitarian outcomes (P = 0.113).
4. Both BI and the control construct significantly correlated to the broadband adoption behaviour in the UK households. In terms of relative impact of the two
aforementioned constructs that contributed significantly to the BAB, BI had much higher impacts (Exp (B) = 2.50) than the control construct (Exp (B) = 1.57).
5. Amongst the five demographic factors that were included in this research except
gender, all the other four factors (i. e. age, income, occupation and education)
associated with the adoption of broadband in UK households.
6. Although both service quality and secondary influence constructs were significantly
correlated to the BI when changing current service provider (BISP), the overall
explained variance was low (adjusted R square = 0.074). This meant that both the
aforementioned constructs were also not able to explain the variation of BISP.
7. The rate of Internet usage differs for the broadband and narrowband users. Broadband users spend more time and access the Internet more frequently than
narrowband ones.
8. Broadband users access significantly more online activities than narrowband users.
9. The use of broadband is associated with the time spent on various daily life
activities. However, the magnitude of that association differs according to the nature
of the activities. The association was more on activities such as an increase in
working at home, a decrease in shopping in a physical store and a decrease in
working in the office compared to activities such as spending time with family and friends.
7.4 RESEARCH OFFERINGS AND IMPLICATIONS
This research presents one of the initial efforts towards understanding the adoption
and usage behaviour and impact of broadband in UK households. Also this study is one of
only a few studies that address the issue of individual adoption and usage of technology in
the household that is beyond the boundary of workplace. The following comment illustrates
Adoption, Usage and Impact of Broadband: UK Households Yogesh K. DNvivedi
Chapter 7. Conclusions and Future Research Directions 160
the importance of conducting a study that examines technology adoption in the household
context.
"Much work ill the area of home computing remains to be done to better understand the adoption of technologies at home given its potential implications for society ill general andfor the workplace ill particular " (Venkatesh and Brown, 200 1).
By employing the quantitative approach, this study is an initial effort that confirms the role of various constructs (such as relative advantage, utilitarian outcomes, hedonic
outcomes, primary influence, secondary influence, knowledge, self-efficacy and facilitating
conditions resources) for understanding adoption of broadband in household. This study not
only initially validated the model of adoption of technology in households (MATH) for
examining broadband but also extended it by incorporating constructs such as 'relative
advantage', 'service quality' and also the decomposing social influence into two categories,
namely, 'primary influence' and 'secondary influence'.
Findings of this study empirically suggest that primary influence plays a key role in
the first time adoption decision of broadband in households, whilst secondary influence
emphasises a key role of continued subscription with the same service providers. An added
strength of this research is that, unlike other related studies on technology adoption, the
current work investigated all three components of diffusion comprising adoption, usage and impact. This in turn helped in obtaining an extensive understanding of adoption and usage from the perspective of household consumers. This study brings about several theoretical
contributions and implications to practice and policy. These contributions and implications
are discussed below.
7.4.1 Offerings to Theory
The first offering of this research towards theory is that it integrates the appropriate inforination systems (IS) literature in order to enhance the knowledge of technology
adoption from the consumer perspectives. That is, initially, this research evaluates the
flexibility of various models when studying the technology adoption issues. Second, it
assimilates previous research findings to develop a coherent and comprehensive picture of
the technology adoption research conducted in the IS field. Third, this research introduces a
conceptual model that integrates factors from different technology adoption models so as to
study home technology diffusion from a consumer's perspective.
The second offering is to empirically confirm the appropriateness of various
constructs and validate the conceptual model in the context of household consumers. Venkatesh and Brown's (2001) study was based on the semi-structured interview method for
data collection. The study examined PC adoption within American households. The study
Adoption, Usage and Impact of Broadband: UK Households Yogesh K. DNvivedi
Chapter 7. Conclusions and Future Research Directions 161
advised researchers to move beyond and employ a survey research approach for validating the conceptual model in order to utilise it for examining technology adoption from a household consumer's perspectives. This is emphasised in the following future research direction:
"A study that employs a survey with itemsIquestions measuring the various dimensions/consti-ucts ivill help achieve methodological triangulation and examine genei-alisability. Stich a quantitative study will also help shed more light on the asymmetry between the belief stnicture influencing intenders and non intenders" (Venkatesh and Brown, 2001).
As suggested above, this study employs a survey with items/questions measuring the
various constructs such as relative advantage, utilitarian outcomes, hedonic outcomes,
primary influence, secondary influence, knowledge, self-efficacy and facilitating conditions
resources specifically in the context of broadband adoption; therefore, the approach of this
study is similar to that suggested by Venkatesh and Brown (2001). This quantitative study
clearly illustrated the asymmetry between the factors influencing the adopters (i. e. broadband consumers) and non-adopters (i. e. narrowband consumers).
The third offering is that this research introduced and validated novel constructs
such as 'service quality', 'secondary influence' and 'perceived behavioural intention to
change service provider' for investigating the continued adoption of broadband in the household. Since these constructs were not included in any of the guiding frameworks,
including TPB, DTPB, MATH and Diffusion of Innovation, there is an offering that
contributes towards theory development in the form of a theory extension. These constructs
can be utilised to measure the perception of household consumers towards the continued
adoption of subscription-based emerging technology and new Internet based services.
The fourth theoretical offering of this research was to confin-n the role of socio-
economic variables such as age, education, income and occupation when explaining the
actual adoption of broadband. This was considered to be one of the important research issues
of this study, which is to investigate the socio-economic characteristics in order to determine
their effect on the adoption of broadband. This study concludes that the age, education, income and occupation are important variables that distinguish broadband's adopters and
non-adopters, but gender does not. Referring to the research question that was posed initially
in Chapter 2, it was learnt that there is the occurrence of an unequal or heterogeneous
adoption rate or digital divide in various variables, including age, income, occupation and
education.
The fifth contribution of this research towards theory is to successfully utilise
theoretical constructs such as the rate and variety of Internet use to examine the differences
Adoption, Usage and Impact of Broadband: UK Households Yogesh K. DNvivedi
Chapter 7. Conclusions and Future Research Directions 162
between the narrowband and broadband consumers. Previous studies that focused upon the
usage of broadband in households contained two main limitations. First, the existing studies were data driven and exploratory in nature; therefore, they lacked theoretical underpinning. Second, these studies either examined broadband or narrowband consumers; therefore, they lacked a cross-sectional approach to distinguish the broadband consumers from narrowband
ones.
This research adapted the usage constructs from the use diffusion model to distinguish in terms of usage the broadband consumers from narrowband. Therefore, by
overcoming the two aforementioned limitations of previous studies, this research provides better understanding of Internet usage and helps to enhance theoretical underpinning.
The sixth theoretical contribution of this research is to develop theoretical
understanding of the impact of broadband use in the household. The discussion on the impact
of broadband in the previous chapter (Chapter 6) suggested that findings supported the
overall assumptions made that were illustrated in Figure 6.5 and the concept of homeostasis
in household systems (Robinson 1977, Vitalari et aL 1985). Therefore this study provides an incremental contribution towards theory development in the area of the impact of ICTs in
households. This study also contributes to academia by confinning the findings of previous
studies relating to the impact of broadband related issues and also by analysing the differences in the behaviour of broadband and dial-up users.
The seventh offering towards the theory is the analysis of the approaches that are
utilised to study technology adoption and diffusion related issues. Several such studies were
conducted to review research approaches employed within IS area and were considered important, as they provides further direction towards the utilisation of available research
approaches. However, no such effort has been made to review research approaches
specifically employed to examine technology adoption and diffusion related issues. The
current study conducted a review of articles related with technology adoption and diffusion
published in four respected and peer reviewed journals including MIS Quarterly, European
Journal of Information Systems, Information Systems Research and Information Systems
Journal. Details about its process and findings were presented in the 'Research
Methodology' chapter (Chapter 4). By doing so, this study contributed by reflecting upon the
use of various research approaches for investigating technology adoption and diffusion
issues from the perspectives of both users (i. e. in organisations) and consumers (i. e. in
households).
The eighth theoretical offering is the development and validation of a survey instrument. In a situation where theory is advanced, but prior instrumentation is not
Adoption, Usage and Impact of Broadband: UK Households Yogesh K. Divivedi
Chapter 7. Conclusions and Future Research Directions 163
developed and validated, it is essential to involve the creation and validation of new
measures and such efforts are considered a major contribution to scientific practice in the IS field. As Straub et al (2004) mentioned that:
"Researchers who are able to engage in the extra effort to create and validate instrumentationfor established theoretical constructs are testing the robustness of the constructs and theoretical links to methodlineasurement change. Ais practice, thus, represents a major contribution to scientific practice in thefield" (Straub et al, 2004).
Moore and Benbasat (1991) and Davis (1989) provide examples of such work on instrument development and validation, which the authors considered as a major contribution towards IS field. Although the constructs utilised in this research have taken from
established theories and models such as TPB, DTPB, MATH and the Diffusion of Innovation, prior instrumentation to study broadband adoption and diffusion was not developed and validated in existing studies. Therefore it was considered essential to create
and validate a new research instrument for constructs included in the conceptual model.
Since this study satisfied the criteria quoted above (Straub et al, 2004) it makes a
substantial contribution towards the research methodology. This was achieved by modifying,
creating and validating measures that correspond to various constructs included in the
conceptual model. The research instrument developed and validated in this research can be
utilised to examine various emerging technologies within the context of households.
7.4.2 Offerings to Industry and Policy
This study concludes that the amongst seven independent variables, six constructs including relative advantage, utilitarian outcomes, hedonic outcomes, primary influence,
self-efficacy and facilitating conditions resources significantly influence the BI of
consumers when adopting broadband in the UK household. The only exception is
knowledge. It was found that relative advantage was most important and hedonic outcomes least important in terms influencing the BI when adopting broadband in the UK households.
Other important constructs that fall within two extremes were primary influence, facilitating
conditions resources, self-efficacy and utilitarian outcomes. The aforementioned findings of this research generate a number of issues that may assist both policy makers and ISPs for
increasing consumer adoption of broadband.
For example, since relative advantage is found to be strongest construct, it indicates
that ISPs have to provide broadband services to consumers in such a package that would illustrate a clear advantage over narrowband consumers. Similarly, facilitating conditions
resources is the third most important factor in terms of influencing BI to adopt broadband.
Adoption, Usage and Impact of Broadband: UK Households Yogesh K. Divivedi
Chapter 7. Conclusions and Future Research Directions 164
This has implications for both ISPs and policy makers. For instance, ISPs have to think
about more consumer centric services and alternative price plans so that all consumers who
want to subscribe broadband would be able to do so. Policy makers have to provide
alternative places for broadband access where lower income groups or those who cannot
afford it can use high speed Internet., lt may help to increase behavioural intention to adopt broadband and therefore encourage overall adoption and diffusion of broadband in the LJK
household.
As mentioned above, self-efficacy is also an important factor that influences
behavioural intention to adopt broadband, which brings policy-related issues. This suggests
that there is a need to equip citizens with the skills to use computers and the Internet. Since
both utilitarian outcomes and hedonic outcomes are important factors for explaining behavioural intentions, it is important to integrate more content and applications for the
purpose of household and entertainment utility.
One of the research questions of this study was to investigate the socio-economic
characteristics in order to determine their impact on the adoption of broadband. Referring to
the research question that was posed initially in Chapter 2, it was learnt that there is the
occurrence of an unequal or heterogeneous adoption rate or digital divide in various dimensions including age, income, occupation and education.
It has been learnt that an important implication for supply side stakeholders, such as
policy makers and industry, is to identify segments of society that are slow in adopting broadband. By obtaining results such as those afforded by this research, the reasons for slow
adoption can be explored and appropriate measures can be developed and implemented so
that they can be overcome.
As discussed before, broadband service providers may face two key challenges. First, there are consumers who cannot afford the current price plan. Therefore, the ISPs may
consider providing alternative price plans in order to create a mass-market demand, which is
an issue currently being emphasised. Second, some of the consumers with a high annual household income may also be reluctant to subscribe to broadband due to a lack of
compelling content; hence, the challenges to the ISPs are to integrate content and
applications and make them apparent to the ordinary members of the public.
The ISPs may overcome the aforementioned challenges by offering differential price
plans and segment specific broadband subscription packages. For example, the ISPs can differentiate within the offered subscription price ranges depending upon factors such as the
income levels and needs of the users. Further ideas of fulfilling this challenge are as follows.
First, with an increasing demand in the lower income segments and those with fewer needs
Adoption, Usage and Impact of Broadband: UK Households Yogesh K. D%vivedi
Chapter 7. Conclusions and Future Research Directions 165
of broadband, ISPs may offer price plans that can compete with the current price plan of un-
metered narrowband.
Currently, there is a price gap between the two packages; therefore, a low price plan
of un-metered narrowband is an inhibiting factor for broadband adoption in the segments
with lower incomes and fewer needs. Second, since cost is not a factor of consideration when
segmenting between the higher income and occupation levels, it should be offered in
broadband packages with even faster speeds and appealing content. Such packages may
assist in illustrating the clear benefits of broadband over narrowband to consumers of higher
incomes and occupation levels, and provide them with added reasons for subscribing to broadband.
A recently published report that was submitted to the Department of Trade and Industry (DTI) suggests that the penetration of broadband is likely to promote usage of
advanced Internet content and applications; however, due to the lack of data at present, it is
difficult to support this theoretical claim (Analysys, 2005). The Analysys report states that:
"Much has been made of the requirement for countries to invest in broadband communications infrastructure, and to promote its usage. Increased take-up of broadband access services is expected to stinjulate usage of advanced Intenlet content and applications by consumers and by businesses, thus changing individuals' behaviour, creating new industries, or increasing productivity in existing industries. However, data to prove the theory is hard to come by" (Analysys, June 2005).
The Analysys (2005) report supported the aforementioned claim on the basis of the
secondary data obtained from the studies conducted in the USA. This research is one of initial efforts that provides primary data in the context of the UK and supports the
aforementioned theory. The findings of the current study clearly illustrate that the UK
broadband consumers do tend to use the Internet differently to the narrowband consumers. Both the rate of and variety of internet usage is significantly higher for the broadband
consumers in comparison to the narrowband ones. That means broadband consumers use the
Internet more than the narrowband ones.
Furthermore, this study also examined the usage of 41 online services and
applications. The study suggests that for all online services the numbers of broadband
consumers were higher than the total number of narrowband ones. It was also illustrated that
for the usage of many services, the differences between the numbers of broadband and
narrowband consumers were significant. Thus, the findings of this study may assist in
justifying investment in the area of broadband deployment and assist policy making
organisations such as DTI and Ofcom that are involved in the development and deployment
of broadband in the UK.
Adoption, Usage and Impact of Broadband: UK Households Yogesh K. D%vivedi
Chapter 7. Conclusions and Future Research Directions 166
The findings also have important implications for the electronic mass media and telecommunication industries. The mass-media industry is likely to benefit from the diffusion of broadband, as more respondents use online material rather than utilising traditional reading resources. This may encourage the online media industry to attract
revenues from advertising and subscription fees. According to the findings, receiving and
making phone calls have decreased for both narrowband and broadband consumers. Therefore, the telecommunication industry may have to transform in terms of its business
model. For example, the new business model may find a means of pricing consumers at instances of phone calls, which makes using Voll? or other emerging applications a
consequence of a broadband environment.
Bearing the aforementioned points in mind, it can be argued that the contributions of this research are substantial for both policy makers and the telecommunication industry.
Therefore, this research is viewed to be pertinent for the current period of broadband
deployment. The above discussion on contributions and implications of this research has led
to achieve the fourth and final objective of this study which was "to provide implicationsfor
practice andpolicy that may encourage consunter adoption and use of broadband ".
7.5 RESEARCH LIMITATIONS
One of the limitations of this study was related to availability of the sample frame.
The Electoral Register is considered to be a most comprehensive sample frame for the UK
population. However, it could not be employed to obtain the respondent addresses due to
recent legal restrictions that have been placed upon utilising the Electoral Register for any data collection purposes. The UK-Info Disk VII database, which was utilised as a sample frame for this research, is as comprehensive as the Electoral Register. This is because it is
derived from Electoral Register and is regularly updated. However, it does not provide
addresses in the form of lists; instead it requires an initial extraction of addresses, creation of
a list and then utilisation of that list. Since the UK-Info Disk V 11 does not allow extraction
of all addresses available in the database, it excludes some parts of the UK population from
being included in the sample frame. This limited the ability to generalise the findings for the
entire UK population. Hence, even though responses were received from various parts of the
UK, the findings of this study were considered to be a representative sample from which
respondents were selected, instead of the whole UK population.
Although the response rate that was obtained in this research was considered
acceptable in IS research, there was the possibility of a non-response bias. Though the
possibility of a non-response bias cannot be ruled out completely, the non-response bias test
undertaken in this research suggests that it bad minimal chances of affecting the findings.
Adoption, Usage and Impact of Broadband: UK Households Yogesh K. Dwivedi
Chapter 7. Conclusions and Future Research Directions 167
This study provides a snapshot of broadband adoption, usage and the impact of broadband in the UK households. The findings may change as technology becomes
established and consumers become more experienced in its use. However, as this research has a limited completion timeframe, it is not possible to conduct further data collection in
order to observe the effect of time on the adoption, usage and impact of broadband.
This study was focused upon utilising a quantitative approach that may have limited
the ability of this research when attempting to obtain an in-depth view of household
technology adoption and usage. However, due to the time and resources there was a
constraint such that it was not possible to conduct both qualitative and quantitative research.
The data for the current study was collected using a postal questionnaire, which limited the ability to include important variables such as family life stage/life cycle. This
variable considers family as a consuming unit that progresses through a series of stages and is characterised by disposable income and the total number of members in a family. As this
variable is an incremental one, it offers a deeper and richer understanding. Therefore, this
variable will be very useful to investigate why a particular age or income group is more
oriented towards adopting broadband than others. Additionally, it will be useful to collect in-
depth data by conducting interviews that examine variables such as the life stage and
relationships amongst age, education, income and social class. This will provide a clearer
and more complete picture of broadband adoption and will certainly be helpful in developing
a further understanding of the critical segments for subject areas related to diffusion and
marketing.
The impact component of this study was constrained by the following limitations.
First, the findings were generalised to the household. The data was collected from only the
household head in order to examine the impact of broadband upon the online habits and time
allocation patterns. However, the behaviour of the household head may differ to the other
members of the family. Second, the study is based on self-reports and recall measures rather
than observation or diaries. Finally, although the study showed the impact of broadband, it
did not reveal why and how that occurs; therefore, this is difficult to explore using only a
survey research approach.
7.6 FUTURE RESEARCH DIRECTIONS
With regard to adoption and usage in the future, this research intends to examine
whether the findings obtained from this study are specific to the UK households or whether
the results will be the same across other countries of the world. This would require a cross-
cultural approach when understanding broadband adoption.
Adoption, Usage and Impact of Broadband: UK Households Yogesh K. DNvivedi
Chapter 7. Conclusions and Future Research Directions 168
The questionnaire findings would have been strengthened if it had been possible to
also supplement them using interviews. As mentioned in the previous limitations section, this supporting tool had to be abandoned due to the limitations of time and resources. The
findings would also have been reinforced if the research had been a longitudinal one. The
data for this research has been collected over a short period of time and provides a snapshot. However, it could be expanded over a longer period of time to offer a longitudinal study. Further justification for undertaking a longitudinal study is the reasoning that the elimination
of any variables could achieve anomalies in the obtained results.
The aforementioned limitations to study the impact of broadband can be overcome by
conducting a longitudinal and qualitative enquiry that will employ a combination of data
collection tools such as diary, observations, interviews and questionnaires. The research
suggests a longitudinal, qualitative study to be an appropriate future direction to overcome this
limitation. 'Mis will allow an in-depth understanding of the impact of broadband and its
implications in the context of the household to be obtained. Further, this will lead to an
examination of the usage and impact of broadband differing amongst the various members of a household.
Due to the emergence of B-2-C, C-2-C electronic commerce and e-government
services, there is now an emphasis upon the diffusion of high speed Internet; therefore, studying
the impact of broadband on a household consumer becomes a very broad area. There is a need
to research specific areas such as new communication methods, music and software downloads,
entertainment, retail, travel and tourism on an individual basis in order to determine the real
impact.
Furtherniore, there is a need to explore associated issues such as the positive and
negative impact of these changes on the growth and development of the Internet, the difftision
and sustainability of broadband technology, family life and work, social interaction and development, and growth of the business-to-consumer, consumer-to-consumer electronic
conunerce and e-government services areas. I
Finally, this research was focused upon considering the advantages of broadband due to
the slow rate of adoption and its effect on adoption and diffusion of new electronic services. There are several negative aspects of broadband adoption; however, this issue was not included
within this study due time and resource constraints. Example of the negative aspects of broadband adoption includes the problem of online security in tenns of transactions such as
online shopping and online banking. Furthermore, broadband also raises the issue of the security
of children accessing the internet at home (Udo, 2001). Therefore, it is advisable that future
Adoption, Usage and Impact of Broadband: UK Households Yogesh K. DNvivedi
Chapter 7. Conclusions and Future Research Directions 169
research may undertake issues into consideration such privacy and security when examining the
adoption and usage of broadband.
7.7 SUMMARY
This chapter provided an overview and conclusion to the results and discussions of the research presented in this thesis. First, the contents of each chapter were discussed briefly
followed by drawing the main conclusions of this research. This was followed by a discussion of the research contributions and implications that this research has made in terms
of the theory, policy and practice. Following that, the research limitations were listed.
Finally, the future research directions in the area of broadband diffusion and adoption were
provided.
Adoption, Usage and Impact of Broadband: UK Households Yogesh K. DNvivedi

References
References
170
Aganval, R. and Karahanna, E. (2000). Time flies Nvhen you're having fun: Cognitive
absorption and beliefs about information technology usage. MIS Quarterly, 24 (4),
665-694.
zen, 1.2002 . onstructing a TpB Questionnaire: Conceptual and Me oo og cal Considerations. Available From:
htlp: //xv,. v,, v-unix. oit. umass. edu/-aizenlpdfý/b. measurement. pdf, Accessed 20
August 2005.
Ajzen, 1. (1991). The theory of planned behaviour. Organisational behaviour and humall
decision processes, 50,179-211.
Ajzen, 1. (1988). Attitudes, Personality, and Behaviour. The Dorsey Press, Chicago.
Ajzen, 1. and Madden, T. J. (1986). Prediction of goal directed behaviour: Attitudes,
intentions, and perceived behavioural control. Journal of Experimental Social
Psychology, 22,453-474.
Ajzen, 1. (1985). From intentions to actions: A theory of planned behaviour. In Actioij
ControL Froin Cognition to Behavior (Kuhl, J. and Beckmann, J. Eds. ), pp. 11-39.
Springer, Heidelberg.
Ajzen, 1. and Fishbein, M. (1980). Understanding attitudes and predicting social behavior.
Prentice-Hall, NJ.
Aladwani, A. M. (2002). The development of two tools for measuring the easiness and
usefulness of transactional Web sites. European Journal of Inforniation Systenis, II
(3), 223-234.
AI-Jabri, 1. M. (1996). Gender differences in computer attitudes among secondary school
students in Saudi Arabia. Journal of Computer Information Systems, 37 (1), 70-75.
Analysys (2005). Sophisticated broadband services. Final Report for the Departnient of Trade and Industry. Available From:
btlp: //NvNvNv. eRovmonitor. con-t/reports/ýep11610. pd Accessed 15 July 2005.
Anckar, B. (2003). Drivers and inhibitors to E-commerce adoption: exploring the rationality
of consumer behaviour in the electronic marketplace. In Proceedings of the 110'
Adoption, Usage and Impact of Broadband: UK Households Yogesh K. D%vivedi
References 171
ECIS on New Paradigms in Organizations, Markets and Society (Ciborra, C. et al., Ed. ), Napoli, Italy.
Anderson, B., Gale, C., Jones, M. L. R., and McWilliam, A. (2002). Domesticating
broadband-what consumers really do with flat rate, always-on and fast Internet
access? BT Technology Journal, 20 (1), 103 -114.
Anderson, B. and Tracey, K. (2001). Digital Living: The impact (or Otherwise) of the
Internet on everyday life. Anzerican Behavioral Scientist, 45,45 6-475.
Anderson, B., McWilliam, A., Lacohee, H., Clucas, E. and Gershuny, J. (1999). Family life
in digital home- domestic telecommunications at the end of the 20'h Century. BT
TechnolqSy Journal, 17 (1), 85-97.
Anderson, T. (2000). Regulation part 2: Digital transactions area a cause for concern. Net
iniperative. Available From:
http: //%vw,, v. netimperative. com/2000/05/04/Regulation Part 2, Accessed 15
September 2004.
B. A. G. (2003). Australia's broadband connectivity. Available From:
htlp: Hw%vw. noie. gov. aigpublications/NOIE/BAG/report/index. btm, Accessed 25
March 2004.
Bagozzi, R. P. (1981). Attitudes, Intentions and Behaviour: A test of some key hypotheses.
Journal ofPersonality and Social Psychology, 41,607-627.
Bandura, A. (1977). Self-efficacy: Toward a unifying theory of behavioural change. Psychological Review, 84 (2), 191-215.
Baskerville, R. and Pries-Heja, J. (2001). A multiple-theory analysis of a diffusion of information technology case. Infornzation Systenis Journal, 11 (3), 181-20 1.
BBC News (2005). Broadband reveals digital divide. Available From:
htip: //news. bbc. co. uk/l/hi/technology/4483065. stm, Accessed 25 May 2005.
Benbasat, 1. and Zmud, R. W. (1999). Empirical research in information systems: the
practice of relevance. MIS Quarterly, 23,3-17.
Bhattachadee, S., Gopal, R. D. and Sanders, G. L. (2003). Digital music and online sharing:
software piracy 2.0? Connnunications of the ACM, 46 (7), 107-111.
Adoption, Usage and Impact of Broadband: UK Households Yogesh K. DNvivedi
References 172
Boland, R. (1985). Phenomenology: A preferred approach to research in information
systems, in Research Methods in Information Systenis, Mumford, E., Hirschheim,
R. A., Fitzgerald, G. and Wood Harper, T. (Eds. ), NorthHolland, Amsterdam, 193-
201.
Bouvard, P. and Kurtzman, W. (2001) The broadband revolution: how superfast internet
access changes media habits in American households. Available From:
ht! p: //Nvwxv. arbitron. com/doNvnloads/broadband. pd Accessed 25 October 2002.
Boudreau, M., Gefen, D. and Straub, D. (2001). Validation in IS research: A state-of-the art
assessment. MIS Quarterly, 25 (1), 1-23.
Brancheau, J. C. and Wetherbe, J. C. (1990). The adoption of spreadsheet software: testing innovation diffusion theory in the context of end-user computing. Information
Systenis Research, 1,115 -143.
Brace, N., Kemp, R. and Snelgar, R. (2003). SPSSfor psychologists: a guide to data analysis
using SPSSfor ivindows, New York: Palgave Macmillan.
Brown, S. and Venkatesh, V. (2003). Bringing non-adopters along: the challenge facing the
PC industry. Communications of the A CM, 46 (4), 76-80.
Brown, S. A., Massey, A. P., Montoya-Weiss, M. M. and Burkman, J. R. (2002). Do I really have to? User acceptance of mandated technology. European Jounial ofInfornzation Systems, 11 (4), 267-282.
BSG Briefing Paper (2004). The impact of broadband-enabled ICT, content, applications and
services on the UK economy and society to 2010. London, United Kingdom
Available From:
htlp: H%v%v%v. broadbanduk. org/news/news pdfs/Sept%202004/BSG Phase 2 BB Im
pact BackgroundPaper Sept04(l). pdf, Accessed 30 October 2004.
BSG Report (2001). Report and strategic recommendations. London, Available From:
htlp: //xv,, v%v. broadbanduk. orgLreports/BSG Reportl. pd Accessed 30 November
2002
Burgess, R. (1986). Key Variables in social investigation. Routledge, London.
Adoption, Usage and Impact of Broadband: UK Households Yogesh K. DNvivedi
References 173
BurnIcrant, R. E. and Page, T. J. (1988). The structure and antecedents of the normative and
attitudinal components of Fishbein's Theory of Reasoned Action. Journal of Experiniental Social Psychology, 24,66-87.
Caldeira, M. M. and Ward, I M. (2003). Using resource based theory to interpret the
successful adoption and use of infon-nation systems and technology in
manufacturing small and medium sized enterprises. European Jounial of Information Systems, 12 (2), 78-92.
Caldeira, M. M. and Ward, J. M. (2002). Understanding the successful adoption and use of IS/IT in SMEs: An explanation from Portuguese manufacturing industries.
Infonnation Systenis Journal, 12 (2), 121-152.
Carriere, R., Rose, J., Sirois, L., Turcotte, N. and Christian, Z. (2000). Broadband changes
everything, McKinsey & Company, Available
From: htjp: //wNv%v. mckinsey. de/ doNvnloads/knoNvmatters/telecommunications/broad
band changg"df, Accessed 25 November 2002.
Carveth, R. and Kretchmer, S. B. (2002). The digital divide in Western Europe: problems
and prospects. Inforining Science, 5 (3), 239-249.
Chau, P. Y. K. and Hu, P. J. H. (2001). Information technology acceptance. Decision
Sciences, 32,699-719.
Chau, P. Y. K. and Tam, K. Y. (1997). Factors affecting the adoption of open systems: An
exploratory study. MIS Quarterly, 21 (1), 1-24.
Chen, Y., Lou, H. and Luo, W. (2001-2002). Distance learning technology adoption: a
motivation perspective. Journal of Coinputer Inforination Systents, 42 (2), 3 843.
Chinn, M. D. and Fairlie, R W. (2004). The determinants of the global digital divide: A
cross-country analysis of computer and Internet penetration. Discussion Paper
Series, Institute for the Study of Labour, Bonn, Germany.
Choudrie, J. and Lee, H. (2004). Broadband development in South Korea: institutional and
cultural factor. European Journal ofInfornzation Systems, 13 (2), 103-114.
Choudrie, J., Papazafeiropoulou, A. and Lee, H. (2003a). A web of stakeholders and
strategies: A case of broadband diffusion in South Korea. Journal of Infonnation
Technology, 18 (4), 280-303.
Adoption, Usage and Impact of Broadband: UK Households Yogesh K. Mvivedi
References 174
Choudrie, J., Papazafeiropoulou, A. and Lee, H. (2003b). Applying stakeholder theory to
analyse the diffusion of broadband in South Korea: The importance of the
government's role. In Proceedings of the 11'ý ECIS on New Paradigms ill Organizations, Markets and Society, Napoli, Italy.
Churchill, G. A. Jr. (1979). A Paradigm for Developing Better Measures of Marketing
Constructs. Journal ofMarketing Research, 16 (1), 64-73.
Chwelos, P., Benbasat, 1. and Dexter, A. S. (2001). Research report: Empirical test of an EDI
adoption model. Infornzation Systenis Research, 12 (3), 304-321.
Compeau, D. and Higgins, C. (1991). A social cognitive theory perspective on individual
reactions to computing technology. In Proceedings of the 12'h International
Conference on Infornzation Systeins, New York, 187-198.
Cooper, R. B. and Zmud, R. W. (1990). Information technology implementation research: A
technological diffusion approach. Management Science, 36 (2), 123-139.
Comford, T. and Smithson, S. (1996). Project research in inforination systeins: a student's
guide. Macmillan Press Ltd., London.
Cowen, T. (2004). Why the music industry is suing you, your neighbour, or your child. The
Social Affairs Unit Report, London, UK. Available From:
htip: //NvNv,. v. socialaffairsunit. org. uk/blog/archives/000 I 83. pbp, Accessed 15 April
2005.
Crabtree, J. (2003). Fat pipes, connected people-rethinking broadband Britain. iSOCIETY
Report, London. Available From:
http: //iviv,. v. theworkfoundation. coDV Mdfll 843730146. pdf, Accessed 30 March 2004.
Davis, F. D. (1989). Perceived usefulness, perceived ease of use, and user acceptance of infonnation technology. MIS Quarterly, 13,319-340.
Davis, F. D., Bagozzi, R. P. and Warshaw, P. R. (1989). User acceptance of computer technology: a comparison of two theoretical models. Managenient Science, 35 (8),
982-1003.
DeLone, W. H. and McLean, E. R. (2003). The DeLone and McLean model of information
systems success: A ten-year update. Journal of Managenient Inforination Systenis,
19 (4), 9-30.
Adoption, Usage and Impact of Broadband: UK Households Yogesh K. DNvivedi
References 175
DeLone, W. H. and McLean, E. R. (1992). Information systems success: The quest for the dependent variable. Information Systems Research, 3 (1), 60-95.
DeSanctis, G. and Poole, M. S. (1994). Capturing the complexity in advanced technology
use: Adaptive structuration theory. Organization Science, 5,121-147.
Dutton, W. H., Gennaro, C. di and Hargrave, A. M. (2005). The Internet in Britain: The
Oxford Intemet Survey (OXIS), Available From:
htlp: //xvw%v. oii. ox. ac. uk/research/oxis/OxIS 2005 Intemet Survey. pd Accessed 20
July 2005.
Dwivedi, Y. K. and Choudrie, J. (2003a). The impact of broadband on the consumer online habit and usage of Internet activities. In Proceedings of the 8t" UKAIS Annual
Conference on Co-ordination and Co-opetilion: the IS role (Levy, M. et al., Eds. ),
Wanvick, UK.
Dwivedi, Y. K. and Choudrie, J. (2003b). Considering the impact of broadband upon the
growth and development of B-2-C electronic commerce. In Proceedings of the ITS
Asia- Australasian Regional Conference (Cooper, R. et al., Eds. ), Perth, Australia.
Dwivedi, Y. K., Choudrie, J. and Gopal, U. (2003). Broadband stakeholders analysis: ISPs
perspective. In Proceedings of the ITS Asia- Australasian Regional Conference
(Cooper, R. et al., Eds. ), Perth, Australia.
Emory, C. W. and Cooper D. R. (199 1). Business Research Methods. Irwin, Boston.
Fan, M., Stallaert, J. and Whinston, A. B. (2000). The adoption and design methodologies of
component based enterprise systems. European Journal of Information Systenis, 9
(1), 25-35.
Farhoomand, A. F. (1992). Scientific progress of management information systems. In
Information Systems Research: Issues, Methods and Practical Guidelines, Galliers,
R. D., (ed. ), Blackwell Scientific, Oxford.
Finch, J. (1986). Age. In Key Variables in Social Investigation, Burgess, R., (Ed. ),
Routledge, London.
Firth, L. and Kelly, T. (2001). Broadband briefing paper. ITU, Geneva. Accessed from:
NvNvNv. itu. intfbroadband, Accessed 25 July 2003.
Adoption, Usage and Impact of Broadband: UK Households Yogesh K. DNvivedi
References 176
Fishbein, M. and Ajzen, 1. (1975). Belief, attitude, intention, and behavior: All
introduction to theory and research. Addison-Wesley, Reading.
Foxall, G. R. (1992). The behavioural perspective model of purchase and
consumption: from consumer theory to marketing practice. Journal of the Acadeiny ofMarkefing Science, 20,189-198.
Fowler, F. J. Jr. (2002). Survey research methods. SAGE Publications Inc., London.
Freeman, C. (1995). Unemployment and the diffusion of Information Technologies: the two-
edged nature of technical change. Policy Paper No. 32, ESRC.
Fulk, J., Steinfield, C. W., Schmitz, J. and Power, J. G. (1987). A social information
processing model of media use in organisations. Conununication Research, 14 (5),
529-552.
Fulk, J. and Boyd, B. (1991). Emerging theories of communication in organisations. Jounlal
ofManagenient, 17 (2), 407446.
Galliers, R. D. (1992). Choosing Information systems research approaches. In Infonnation
Systenis Research: Issues, Methods and Practical Guidelines, Galliers, R. D., (ed. ),
Blackwell Scientific, Oxford.
Galliers, R. D. and Land, F. F. (1987). Choosing an appropriate information systems
research methodology. Communications of the A CM, 30 (11), 900-902.
Gefen, D. and Straub, D. W. (1997). Gender differences in the perception and use of E-Mail:
An extension to the technology acceptance model. MIS Quarterly, 21 (4), 3 89-40 1.
Gefen, D. and Straub, D. W. (2000). The relative importance of perceived ease of use in IS
adoption: A study of e-commerce adoption. Journal of the Association for
Information Systeins, 1,1-28.
Gilligan, C. and Wilson, R. M. S. (2003). Strategic marketing planning. Buttenvorth-
Heinemann, Oxford.
Gilbert, N. (200 1). Researching Social Life. Sage Publications, London.
Gorsuch, R. L. (1988). Exploratory factor analysis. In Handbook of inultivariate
experiniental psychology, Nesselroade, J. R. and Cattell, R. B. (Eds. ), Plenum Press,
New York.
Adoption, Usage and Impact of Broadband: UK Households Yogesh K. Dwivedi
References 177
Greene, W. H. (1997). Econometric Analysis, 3rd ed. Prentice Hall.
Guimaraes, T. and Dallow, P. (1999). Empirically testing the benefits, problems, and success factors for telecommuniting programmes, European Jounial ofInfornialioll Systeins,
8 (1), 40-54.
Haring, J., Rohlfs, J. and Shooshan, H. (2002). Propelling the broadband bandwagon.
Strategic Policy Research, Maryland.
Harris, A. L., Medlin, D. and Dave, D. S. (1996). Multimedia technology as a learning tool:
A study of demographic and cultural impacts. Jounial of Coniputer Infonnation
Systems, 36 (4), 18-2 1.
Heijden, H. (2004). User acceptance of hedonic information systems. MIS Quarterly,
28 (4), 695-705.
Heijden, H., Verhagen, T. and Creemers, M. (2003). Understanding online purchase intentions: contributions from technology and trust perspectives. European Jounial
ofInformation Systems, 12 (1), 4148.
Hinton, P. R., Brownlow, C., McMurray, I. and Cozens, B. (2004). SPSS explained. Routledge Inc., East Sussex, England.
Hoffer, J. A. and Alexander, M. B. (1992). The diffusion of database machines. Database,
23,13-20.
Holmes, M. C. (1997). Comparison of gender differences among information systems
professionals: A cultural perspective. Journal of Coniputer Infontiation Systenis, 38
(4), 78-86.
Horrigan, J. B. and Rainie, L. (2002). The broadband difference: how online Americans'
behaviour changes with high-speed Internet connections at home. Accessed from: ht! p: //Nv%vw. pewintemet. org/12dfs/PIP Broadband Report. pd ,
Accessed 20 September
2002.
Hu, P. J., Chau, P. Y. K., Sheng, 0. R. L. and Tam, Y. K. (1999). Examining the technology
acceptance model using physician acceptance of telemedicine technology. Journal of Management Infonnation Systems, 16,91-112.
Adoption, Usage and Impact of Broadband: UK Households Yogesh K. D-wivedi
References 178
Huang, W., Arnbra, J. D. and Bhalla, V. (2002). An empirical investigation of the adoption
of e-Government in Australian citizens: Some unexpected research findings. Journal
of Computer Information Systems, 43 (1), 15 -22.
lacovou, C. L., Benbasat, 1. and Dexter, A. S. (1995). Electronic data interchange and small
organisations: adoption and impact of technology. MIS Quarterly, 19 (4), 465-486.
Igbaria, M., Zinatelli, N., Cragg, P. and Cavaye, A. L. M. (1997). Personal computing
acceptance factors in small firms: a structural equation model. MIS Quarterly, 21
(3), 279-303.
International Telecommunication Union (2001). A broadband future: reconciling
opportunities and uncertainties. ITU News, 6,3-7. Available From:
htlp: //www. itu. int/itunews/issue/Xdf/2001/06. pdf, Accessed 20 September 2002.
Jackson S. and Scott S. (2001). Gender. Routledge, London.
Kaplan, B. and Maxwell, J. A. (1994). Qualitative research methods for evaluating computer
information systems. In Evaluating Health Care Information Systems: Methods and
Applications, Anderson, J. G., Aydin, C. E. and Jay, S. J. (eds. ), Sage, Thousand Oaks,
CA.
Karahanna, E., Straub, D. W., and Chervany, N. L. (1999). Information technology adoption
across time: A cross-sectional comparison of pre-adoption and post-adoption
beliefs. MIS Quarterly, 23 (2), 183-213.
Keeter, S., Miller, C., Kohut, A., Groves, R. M. and Presser, S. (2000). Consequences of
reducing nonresponse in a national telephone survey. Public Opinion Quarterly, 64
(2), 125-148.
Kinnes, S. (2005). One in three rejects technology. Times Online. Accessed From:
http: //wxv-, v. timesonline. co. uk/article/0,, 2103-1687615,00. html, Accessed 25 July
2005.
Kitchenham, B. A. and Pfleeger, S. L. (2002). Principles of survey research part 2:
Designing a survey. Softivare Engineering Notes, 27 (1), 18-20.
Koufaris, M. (2002). Applying the technology acceptance model and flow theory to online
consumer behavior. Inforination Systenis Research, 13 (2), 205-223.
Kraut, R. (1996). The Intemet@ Home. Communication oftheACM, 39 (12), 32-35.
Adoption, Usage and Impact of Broadband: UK Households Yogesh K. D%vivedi
References 179
Lacohee, H. and Anderson, B. (2001). Interacting with telephone. Interizatimial Jourizal of Hunzan-Compitter Studies, 54,665-699.
Langdale, J. V. (1997). International competitiveness in East Asia: Broadband
telecommunications and interactive multimedia, Telecoininunications Policy, 21,
235-249.
Lawshe, C. H. (1975). A quantitative approach to content validity. Personnel Psychology,
28,563-575.
Lee, H., O'Keefe, B. and Yun, K. (2003). The growth of broadband and electronic
commerce in South Korea: contributing factors. Yhe Inforination Society, 19,81- 93.
Lee, H. and Choudric, J. (2002). Investigating broadband technology deployment in South
Korea. Brunel- DTI International Technology Services Mission to South Korea.
DISC, Brunel University, Uxbridge, UK.
Lewis, B. R., Snyder, C. A. and Rainer, K. R. Jr. (1995). An empirical assessment of the
information resources management construct. Journal of Management Information
Sweins, 12 (1), 199-223. 1-
Mason, S. M. and Hacker, K. L. (2003). Applying communication theory to digital divide
research. IT& Society, 1 (5), 40-5 5.
Mathieson, K. (1991). Predicting user intentions: comparing the technology acceptance
model with the theory of planned behaviour. Infornzation Systenis Research, 2 (3),
173-191.
McCalla, R. and Ezingeard, J. N. (2005). Examining the link between technology use,
emotional expression and service quality perceptions: the data collection protocol. In
Proceedings of the 13'h European Conference on Inforination Systenis, 26h to 28fl'
June, Regensberg, Germany.
Mingers, J. (2003). The paucity of multi-method research: a review of the information
systems literature. Information Systems Journal, 13 (3), 233-249.
Mingers, J. (2001). Combining IS research methods: Towards a pluralist methodology.
Infornzation Systenis Research, 12 (3), 240-259.
Mingers, J. and Stowell. F. (1997). Infonnation Systenis: An Einerging Discipline?
McGraw-Hill, London, U. K.
Adoption, Usage and Impact of Broadband: UK Households Yogesh K. DNvivedi
References 180
Mlcakova, A. and Whitley, E. A. (2004). Configuring peer-to-peer sofhvare: an empirical
study of bow users react to the regulatory features of software. European Journal of Information Systems, 13 (1), 95-102.
Moore, G. C. and Benbasat, 1. (1991). Development of an instrument to measure the
perceptions of adopting an information technology innovation. Inforination Systems
Research, 2 (3), 192-222.
Moore, G. C. (1987). End-user computing and office automation: A diffusion of innovation
perspective. Infor, 25,214-235.
Morgan, D. H. J. (1986). Gender. In Key Variables in Social Investigation, Burgess, R.,
(Ed. ), Routledge, London.
Morris, M. G. and Venkatesh V. (2000). Age differences -in technology adoption decisions:
Implications for a changing work force. Personnel Psychology, 53 (2), 375-403
Mustonen-Ollila, E. and Lyytinen, K. (2003). Why organizations adopt Information system
process innovations: a longitudinal study using diffusion of innovations theory.
Information Systems Journal, 13 (3), 275-297.
Myers, M. D. (1997). Qualitative research in information systems. MIS Quarterly, 21 (2),
241-242.
Myers, R. H. (1990). Classical and modern regression with applications. PWS-KENT
Publishing Company, Boston.
Nandhakumar, J. and Jones, M. (1997). Too close for comfort? Distance and engagement in
interpretive information systems research. Infonnalion Systems Jounial, 7,109-13 1.
National Broadband Task Force (2001). The new national dream: Networking the nation for
broadband access. Ottawa Industry, Canada.
Nilikanta, S. and Scammel, W. (1990). The effect of information sources and communication
channels on the diffusion of innovation in a database development environment. Management Science, 36,24-40.
OECD (2001). Working party on telecommunication and information services policies: the
development of broadband access in OECD countries, OECD, Paris. Available from:
htip: Hw%v%v. oecd. orp/dataoecd/48/33/2475737. pd , Accessed 12 March 2003.
Adoption, Usage and Impact of Broadband: UK Households Yogesh K. DNvivedi
References 181
Ofcorn (2005). The Ofcorn Internet and broadband update. Available From:
httT): //AvAvAv. broadbanduk. org/rel2orts/0fcoM`/`20lntemetandBroadbandý/`200404.0df, Accessed 20 July 2005.
Ofcom (2004). The Ofcom, Internet and broadband update. Available From:
httl2: //w%v-, v. ofcom. oriz. uk/research/telecoms/rer)orts/int bband updt/IntemetandBroadband. pd Accessed 20 July 2005.
Office of the c-Envoy (2001). UK online: The broadband future. Available From:
ht! p: //archive. cabinetoffice. jzov. uk/e-envoy/reports-broadband/Sfile/ukonline. pdf, Accessed 15 July 2003.
Office of Technology Policy (2002). Understanding broadband demand: A review of critical issues. U. S. Department of Commerce, Washington, DC.
Oftel (2003). International benchmarking study of Internet access (dial-up and broadband).
Available from:
http: //%výv-, v. ofcom. org. uk/static/ýrchive/0ftel/ýublications/ýesearch/2003/benchintO6 03 full. pdf, Accessed 15'h December 2003.
Oh, S., Alm, J. and Kim, B. (2003). Adoption of broadband Internet in Korea: the role of
experience in building attitude. Jounial ofInfonnation Technology, 18 (4), 267-280.
Oliver, R. L., and Bearden, W. 0. (1985). Crossover effects in the theory of reasoned action: A moderating influence attempt. Journal of Consinner Research, 12,324-340.
Olson, J. R. and Boyer, K. K. (2003). Factors influencing the utilization of Internet
purchasing in small organizations. Jounial of Operations Managenient, 21,225-245.
Orlikowski, W. J. and Baroudi, J. J. (1991). Studying information technology in
organizations: Research approaches and assumptions. Information Systems
Research, 2 (1), 1-28.
Parasuraman, A., Zeitham], V. A. and Malhotra, A. (2005). E-S-QUAL: A multiple-item
scale for assessing electronic service quality. Journal of Service Research, 7 (3),
213-234.
Parasuraman, A., Berry, L. and Zeithaml, V. A. (1991). Refinement and assessment of the
'SERVQUAL' Scale. Jounial ofRetailing, 67 (4), 420-451
Adoption, Usage and Impact of Broadband: UK Households Yogesh K. DNvivedi
References 182
Parasuraman, A., Zeithaml, V. A. and Berry, L. (1988). SERVQUAL: A multiple-item scale for measuring consumer perceptions of service quality. Journal of Retailing, 64 (4),
1240.
Parthasarathy, M. and Bhattachedee, A. (1998). Understanding post adoption bebavior in the
context of online services. Infonnation Systems Research, 9 (4), 362-379.
Pearson, M. J., Crosby, L., Bahmanziari, T. and Conrad, E. (2002). An empirical investigation into the relationship between organisational culture and computer efficacy as moderated by age and gender. Jounial of Computer Infonnation Systeins, 43 (2), 58-70.
Plouffe, C. R., Hulland, I S. and Vandenboseb, M. (2001). Research report: richness versus parsimony in modeling technology adoption decisions- understanding merchant
adoption of a smart card-based payment system. Information Systenis Research, 12 (2), 208-222.
Premkumar, G. P. (2003). Alternative distribution strategies for digital music. Communications of the A CM, 46 (9), 89-95.
Prernkumar, G., Ramamurthy, K. and Crum, M. (1997). Deten-ninants of EDI adoption in the
transportation industry. European Journal ofInformation Systems, 6 (2), 107-12 1.
Rice, C. (1997). Understanding Customers. Butter worth-Heinemann, Oxford.
Rice, R. E., Grant, A. E., Schmitz, J. and Torobin, J. (1990). Individual and network influences on the adoption and perceived outcomes of electronic messaging. Social
Networks, 12 (1), 27-55.
Robinson, J. P. (1977). How Americans Use Time. Praeger, New York.
Rogers, E. M. (1995). Diffusion ofInnovations. Free Press, New York.
Rose, G., Khoo, H. and Straub, D. W. (1999). Current technological impediments to B-2-C Electronic Conu-nerce. Communications of the Association foi- Inforniation Systenis,
l (16). Reprint accessed from: htip: //cais. isworld. oriz/articles/1-16/article. htm
Rosemann, M. and Vessey, 1. (2005). Linking theory and practice: Performing a reality
check on a model of IS success. In Proceedings of the 13'ý European Conference on Infonnation Systeins, 26th to 28th June, Regensberg, Gen-nany.
Adoption, Usage and Impact of Broadband: UK Housebolds Yogesh K. Dxvivedi
References 183
Salancik, G. R. and Pfeffer, J. (1978). A social information processing approach to job
attitudes and task design. Administrative Science Quarterly, 23 (2), 224-253.
Sawyer, S., Allen, J. P. and Heejin, L. (2003). Broadband and mobile opportunities: a socio- technical perspective. Jounial ofInfonnation Technology, 18 (4), 121-136.
Schifter, D. B. and Ajzen, 1. (1985). Intention, perceived control, and weight loss: An
application of the theory of planned behavior. Jountal of Personality and Social
Psychology, 49,843-85 1.
Shih, C. F. and Venkatesh, A. (2004). Beyond adoption: Development and application of
a use-diffusion model. Journal ofMarketing, 68,59-72.
Shih, C. F. and Venkatesh, A (2003) "A Comparative Study of Home Computer Adoption
and Use in Three Countries: U. S., SWEDEN, AND INDIA", CRITO Working
Paper, [online], NOAH, hLtp: //xv,, vw. crito. uci. edu/noah/t)ublications. htm
Shimp, T. A. and Kavas, A. (1984). The theory of reasoned action applied to coupon usage. Journal of Consumer Research, 11,795-809.
Smitby H. J., Milberg, S. J. and Burke, S. J. (1996). Information privacy: Measuring
individuals' concern about organizational practices. MIS Quarterly, 20 (2), 167-197.
Solomon, S. L. and O'Brien, J. A. (1990). The effect of demographic factors on attitudes toward sofhvare piracy. Journal of Computer Information Systems, 30 (3), 40-46.
Stanton, L. J. (2004). Factors influencing the adoption of residential broadband connections
to Internet. In Proceedings of the 37h Hawaii Intemational Conference on System
Sciences, Hawaii, USA.
Stevens, J. (1996). Applied Multivariate Statisticsfor the Social Sciences. Lawrence ErIbaurn
Associates, Inc., New Jersey.
Storey, V. C., Straub, D. W., Stewart, K. A. and Welke, R. J. (2000). A conceptual investigation of the e-commerce industry. Communications of the A CM, 43 (7), 117-
123.
Straub, D. W., Gefen, D. and Boudreau, M. C. (2005). Quantitative Research. In Research in
Information Systems: A Handbook for Research Supervisors and Aeir Students.
Avison, D. and Pries-Heje, J. (Ed. ), Elsevier, Amsterdam.
Adoption, Usage and Impact of Broadband: UK Households Yogesh K. DNvivedi
References 184
Straub, D. W., Boudreau, M-C. and Gefen, D. (2004). Validation guidelines for IS positivist
research. Communications of the Associationfor Information Systems, 13,3 80427.
Stynes, D. J. and George L. P. (1984). A Review of Logit Models with Implications for
Modeling Recreation Choices. Journal qfLeisure Research, 16,295-3 10.
Suomi, R. and Pekkola, J. (1998). Inhibitors and motivators for tele-Nvork: some Finnish
experiences. European Journal ofInformation Systems, 7 (4), 221-23 1.
Sussman, S. W. and Siegal, W. S. (2003). Informational influence in organisations: an integrated approach to knowledge adoption. Infonnation Systenis Research, 14 (1),
47-65.
Tabachnick, B. G. and Fidell, L. S. (1989). Using multivariate statistics, Harper and Row,
New York.
Tan, M. and Teo, T. S. H. (2000). Factors influencing the adoption of Internet banking.
Journal of the Associationfor the Infonnation Systems, 1.
Taylor, S. and Todd, P. A. (1995). Understanding information technology usage: A test of
competing models. Information Systems Research, 6 (1), 44-176.
Teo, H. H., Wei, K. K. and Benbasat, 1. (2003). Predicting intention to adopt inter-
organizational linkages: an institutional perspective. MIS Quarterly, 27 (1), 1949.
Teo, T. S. H. and Pian, Y. (2003). A contingency perspective on Internet adoption and
competitive advantage. European Journal ofInforination Systems, 12 (2), 78-92.
Tolsby, J. (1998). Effects of organizational culture on a large scale IT introduction effort: a
case study of the Norwegian Army's EDBLF project. Ettropean Jounial of Information Systeins, Vol 7, No. 2, pp 108-114.
Torkzadeh, G. and Dhillon, G. (2002). Measuring factors that influence the success of Intemet commerce. Information Systenis Research, 13 (2), 187-204.
Tornatzky, L. G. and Klein, K. J. (1982). Innovation characteristics and innovation adoption- implementation: a meta-analysis of findings. IEEE Transactions on Engineering
Management, 29,28-45.
Adoption, Usage and Impact of Broadband: UK Households Yogesh K. DNvivedi
References 185
Triandis, H. C. (1979). Values, attitudes, and interpersonal behaviour. In Nehraska
Symposium on Motivation: Beliefs, Attitudes, and Values, University of Nebraska
Press, Lincoln, NE, 195-259.
Udo, G. J. (2001). Privacy and security concerns as a major barriers of e-commerce: a survey
study. Infon-nation Management and Computer Security, 9 (4), 165-174.
UK-Info Disk Vil. Available From:
htlp: Hxvwýv. 192. coMIproducts. cfm? icdaction=details&item id=41.
Venkatesh, A. (2001). The home of the future: an ethnographic study of new information
technologies in the home. Advances in Consunier Research, XXVIII, 88-96.
Venkatesh, A. (2000). Computers and new media technologies in Indian households: based
on a study of eight major cities in India. CRITO Working Paper, NOAH,
htlp: //iv-%vw. rito. uci. edu/noah/publications. htm
Venkatesh, A. and Vitalari, N. (1992). An emerging distributed work arrangement: an investigation of computer-based supplemental work at home. Managenlent Science,
38 (12), 1687-1706.
Venkatesh, A. and Vitalari, N. (1987). A post-adoption analysis of computing in the home.
Jounial ofEconomic Psychology, 8 (2), 161-180.
Venkatesh, A., Shih, C. F. E. and Stolzoff, N. C. (2000). A longitudinal analysis of
computing in the home census data 1984-1997. In Home Inforinalics and Telenzatics: Information, Technology and Society (Sloane and Felix van Rijn Eds. ),
205-215.
Venkatesh, V. and Brown, S. (2001). A longitudinal investigation of personal computers in
homes: Adoption determinants and emerging challenges. MIS Quarterly, 25 (1), 71-
102.
Venkatesh, V., Morris, M. G., Davis, B. G. and Davis, F. D. (2003). User acceptance of information technology: Toward a unified view. MIS Quarterly, 27 (3), 425-478.
Venkatesb, V. (2000). Determinants of perceived ease of use: integrating control, intrinsic
motivation, and emotion into the technology acceptance model. In nnation Systems fo
Research, 11 (4), 342-365.
Adoption, Usage and Impact of Broadband: UK Households Yogesh K. D%vivedi
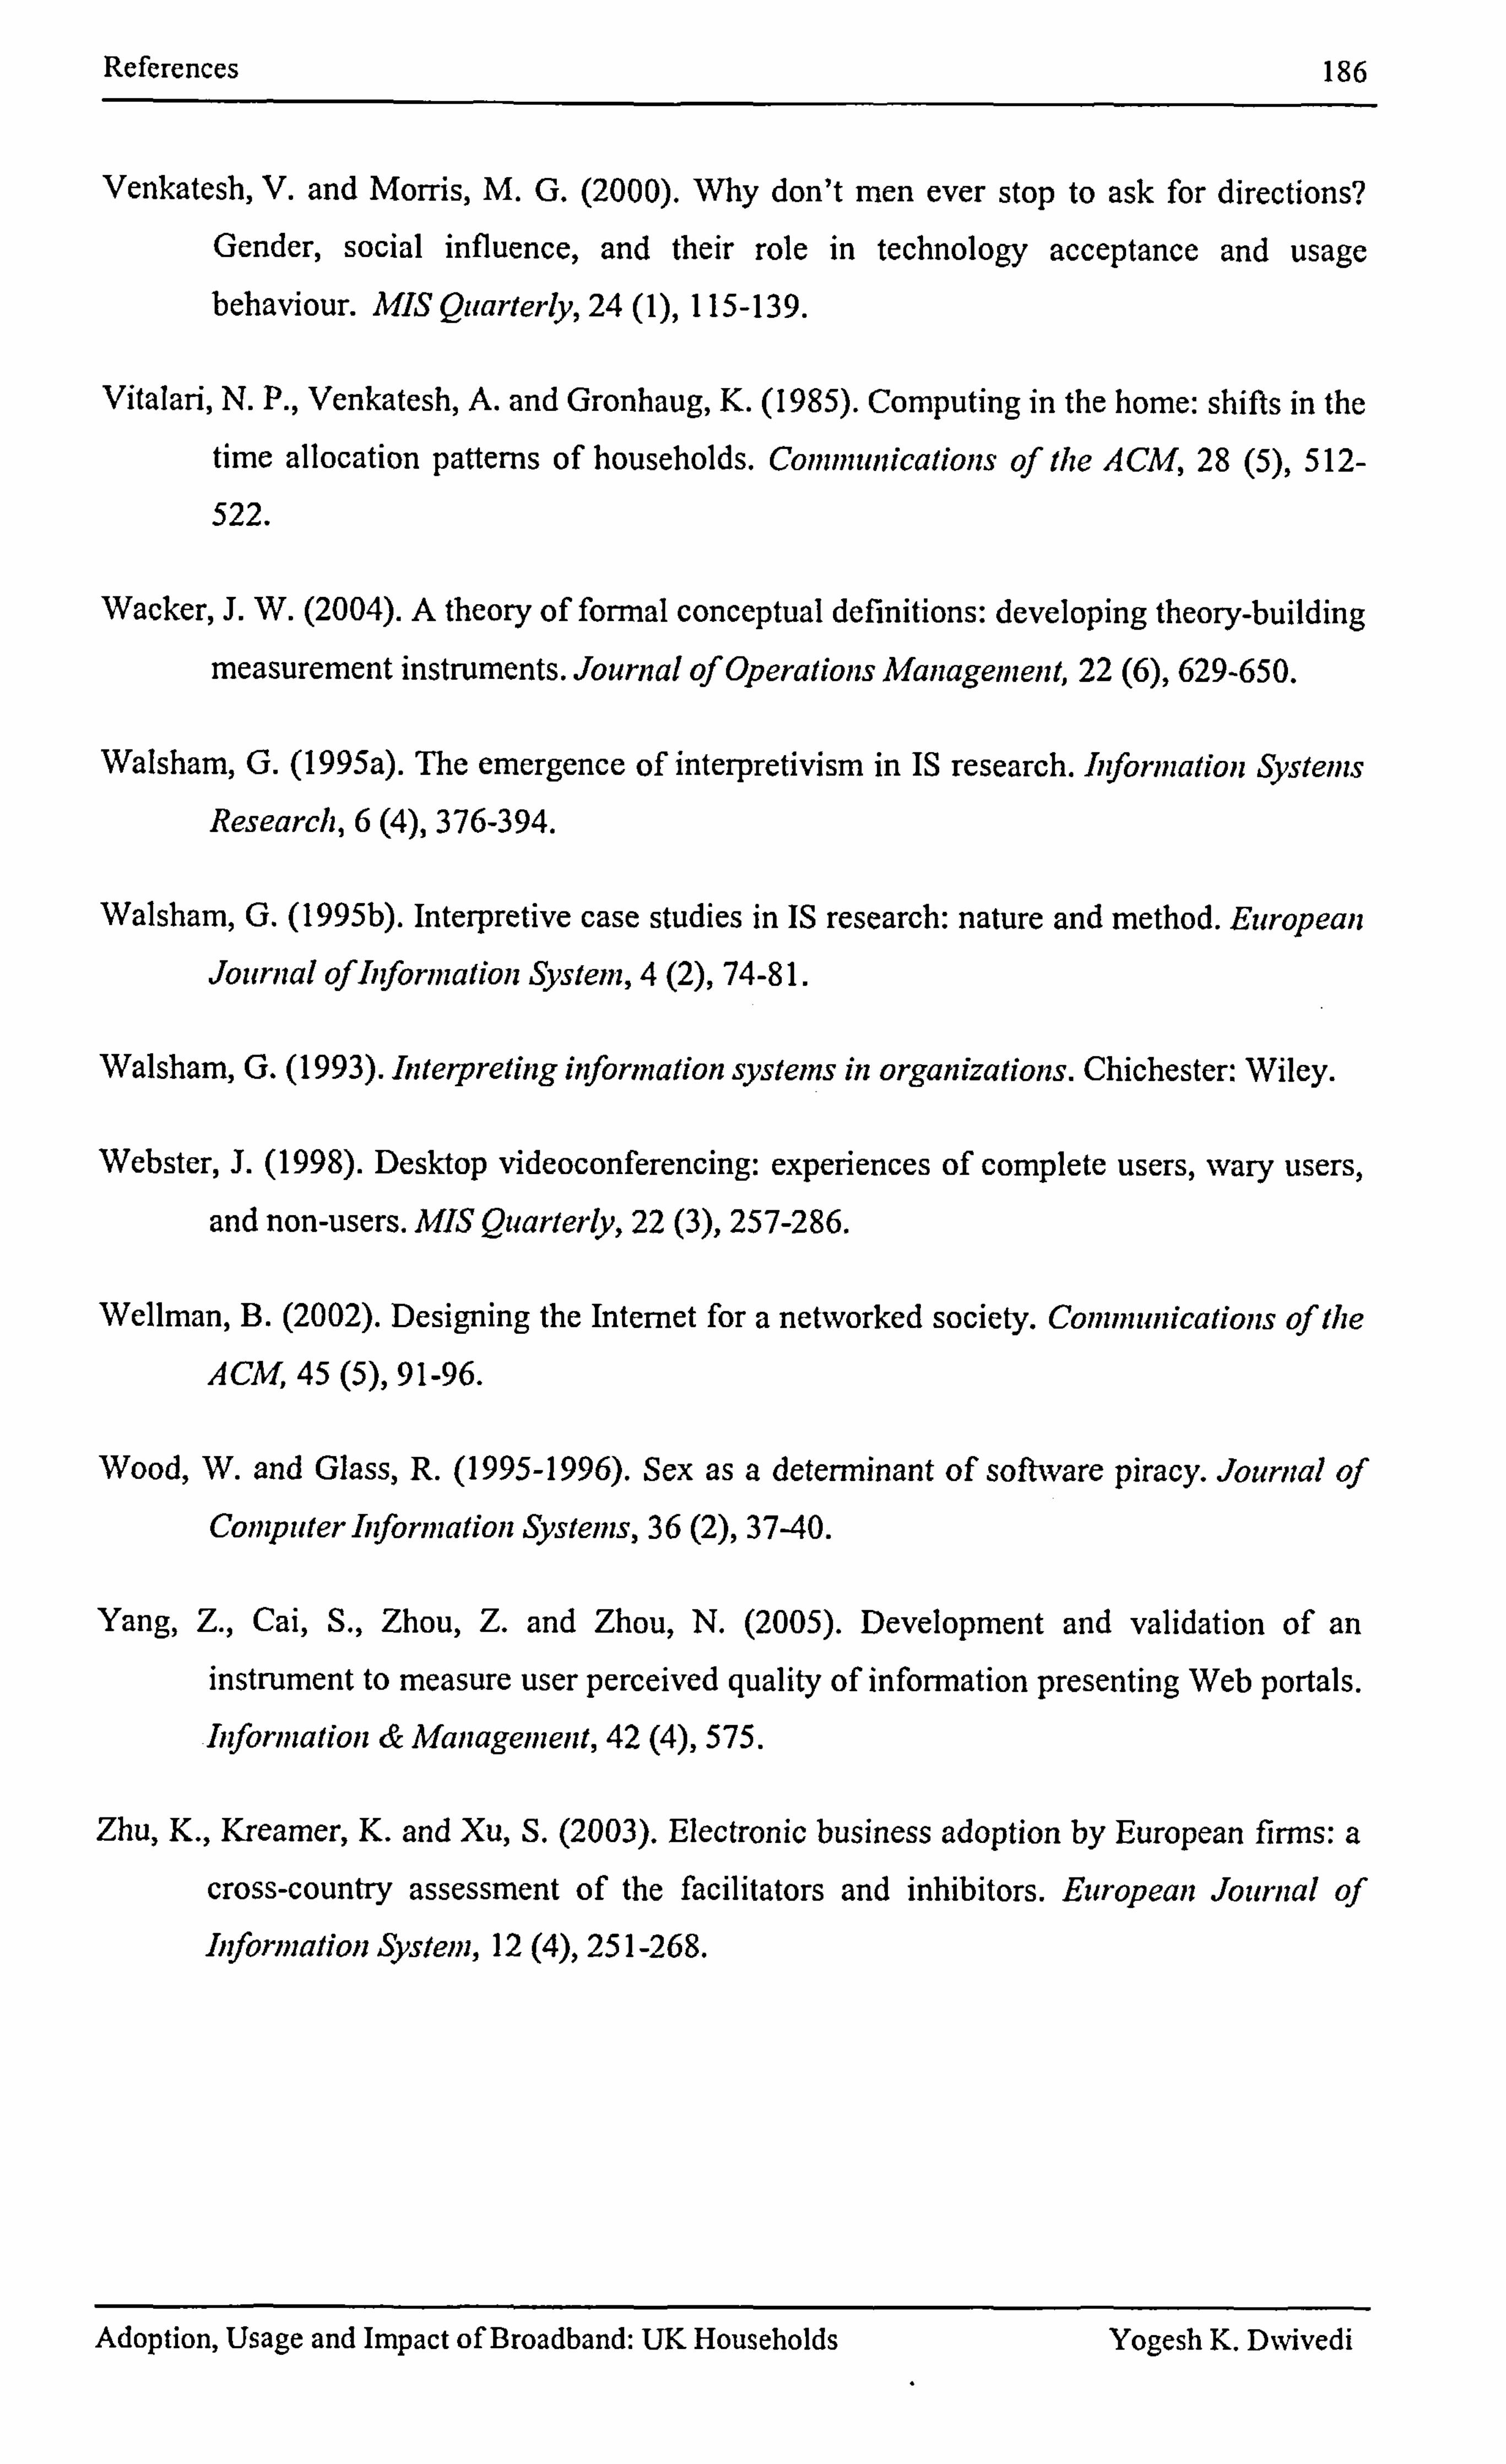
References 186
Venkatesb, V. and Morris, M. G. (2000). Why don't men ever stop to ask for directions?
Gender, social influence, and their role in technology acceptance and usage behaviour. MIS Quarterly, 24 (1), 115-139.
Vitalari, N. P., Venkatesh, A. and Gronhaug, K. (1985). Computing in the home: shifts in the time allocation patterns of households. Communications of the ACM, 28 (5), 512-
522.
Wacker, J. W. (2004). A theory of forinal conceptual definitions: developing theory-building
measurement instruments. Jou"ial of Operations Managenient, 22 (6), 629-650.
Walsham, G. (1995a). The emergence of interpretivism in IS research. Information Systems
Research, 6 (4), 376-394.
Walsham, G. (1995b). Interpretive case studies in IS research: nature and method. European Journal ofInformation System, 4 (2), 74-8 1.
Walsharn, G. (1993). Interpreting information systems in organizations. Chichester: Wiley.
Webster, J. (1998). Desktop videoconferencing: experiences of complete users, wary users,
and non-users. MIS Quarterly, 22 (3), 257-286.
Wellman, B. (2002). Designing the Internet for a networked society. Conunullications of the ACM, 45 (5), 91-96.
Wood, W. and Glass, R. (1995-1996). Sex as a detenninant of soffivare piracy. Jountal of Computer Infonnation Systems, 36 (2), 37-40.
Yang, Z., Cai, S., Zhou, Z. and Zhou, N. (2005). Development and validation of an instrument to measure user perceived quality of information presenting Web portals. Information & Management, 42 (4), 575.
Zhu, K., Kreamer, K. and Xu, S. (2003). Electronic business adoption by European firms: a
cross-country assessment of the facilitators and inhibitors. European Jounial of Information System, 12 (4), 251-268.
Adoption, Usage and Impact of Broadband: UK Households Yogesh K. D%vivedi

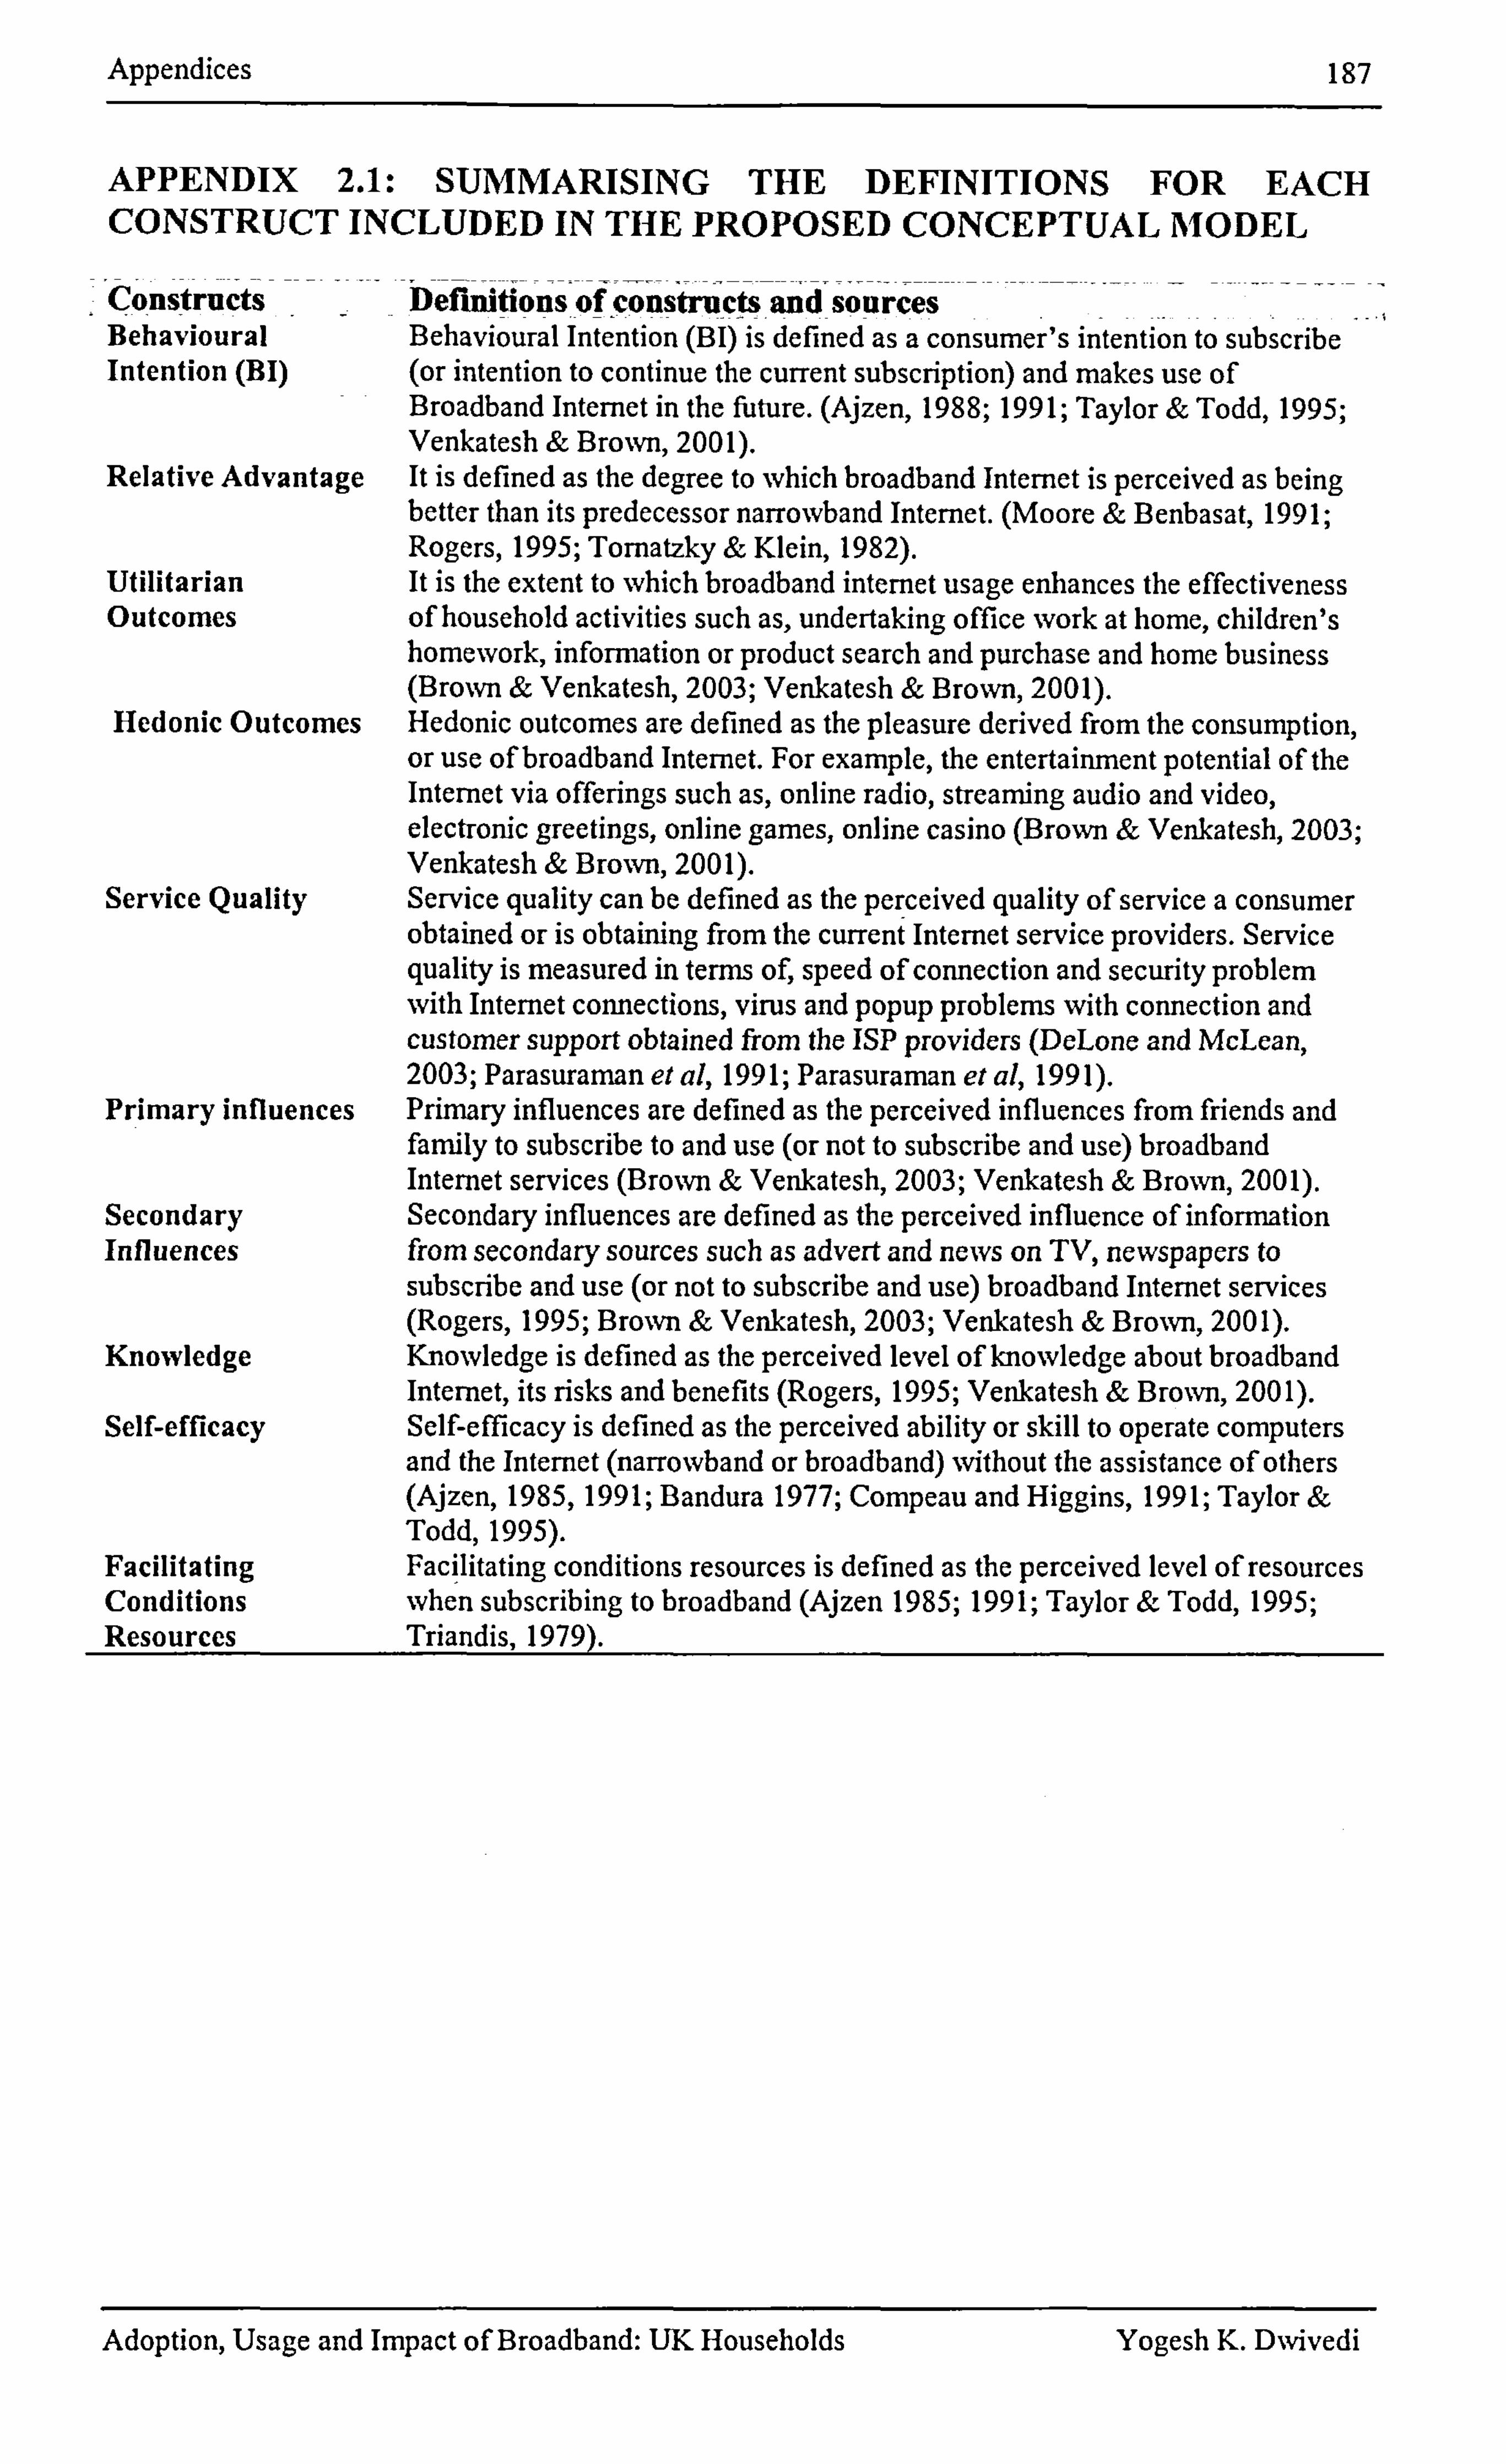
Appendices 187
APPENDIX 2.1: SUMMARISING THE DEFINITIONS FOR EACH CONSTRUCT INCLUDED IN THE PROPOSED CONCEPTUAL MODEL
Cons tructs Definitions of constru cts and sources Behavioural Behavioural Intention (BI) is defined as a consumer's intention to subscribe Intention (131) (or intention to continue the current subscription) and makes use of
Broadband Internet in the future. (Ajzen, 1988; 1991; Taylor & Todd, 1995; Venkatesh & Brown, 2001).
Relative Advantage It is defined as the degree to which broadband Internet is perceived as being better than its predecessor narrowband Internet. (Moore & Benbasat, 1991; Rogers, 1995; Tomatzky & Klein, 1982).
Utilitarian It is the extent to which broadband internet usage enhances the effectiveness Outcomes of household activities such as, undertaking office work at home, children's
homework, information or product search and purchase and home business (Brown & Venkatesh, 2003; Venkatesh & Brown, 2001).
Hedonic Outcomes Hedonic outcomes are defined as the pleasure derived from the consumption, or use of broadband Internet. For example, the entertainment potential of the Internet via offerings such as, online radio, streaming audio and video, electronic greetings, online games, online casino (Brown & Venkatesh, 2003; Venkatesh & Brown, 2001).
Service Quality Service quality can be defined as the perceived quality of service a consumer obtained or is obtaining from the current Internet service providers. Service quality is measured in terms of, speed of connection and security problem with Internet connections, virus and popup problems with connection and customer support obtained from the ISP Providers (DeLone and McLean, 2003; Parasuraman et al, 199 1; Parasuraman et al, 199 1).
Primary influences Primary influences are defined as the perceived influences from friends and fan-tily to subscribe to and use (or not to subscribe and use) broadband Internet services (Brown & Venkatesh, 2003; Venkatesh & Brown, 2001).
Secondary Secondary influences are defined as the perceived influence of information Influences from secondary sources such as advert and news on TV, newspapers to
subscribe and use (or not to subscribe and use) broadband Internet services (Rogers, 1995; Brown & Venkatesh, 2003; Venkatesh & Brown, 2001).
Knowledge Knowledge is defined as the perceived level of knowledge about broadband Internet, its risks and benefits (Rogers, 1995; Venkatesh & Brown, 200 1).
Self-efficacy Self-efficacy is defined as the perceived ability or skill to operate computers and the Internet (narrowband or broadband) without the assistance of others (Ajzen, 1985,1991; Bandura 1977; Compeau and Higgins, 1991; Taylor & Todd, 1995).
Facilitating Facilitating conditions resources is defined as the perceived level of resources Conditions when subscribing to broadband (Ajzen 1985; 1991; Taylor & Todd, 1995; Resources Triandis, 1979).
Adoption, Usage and Impact of Broadband: UK Households Yogesh K. D%vivedi
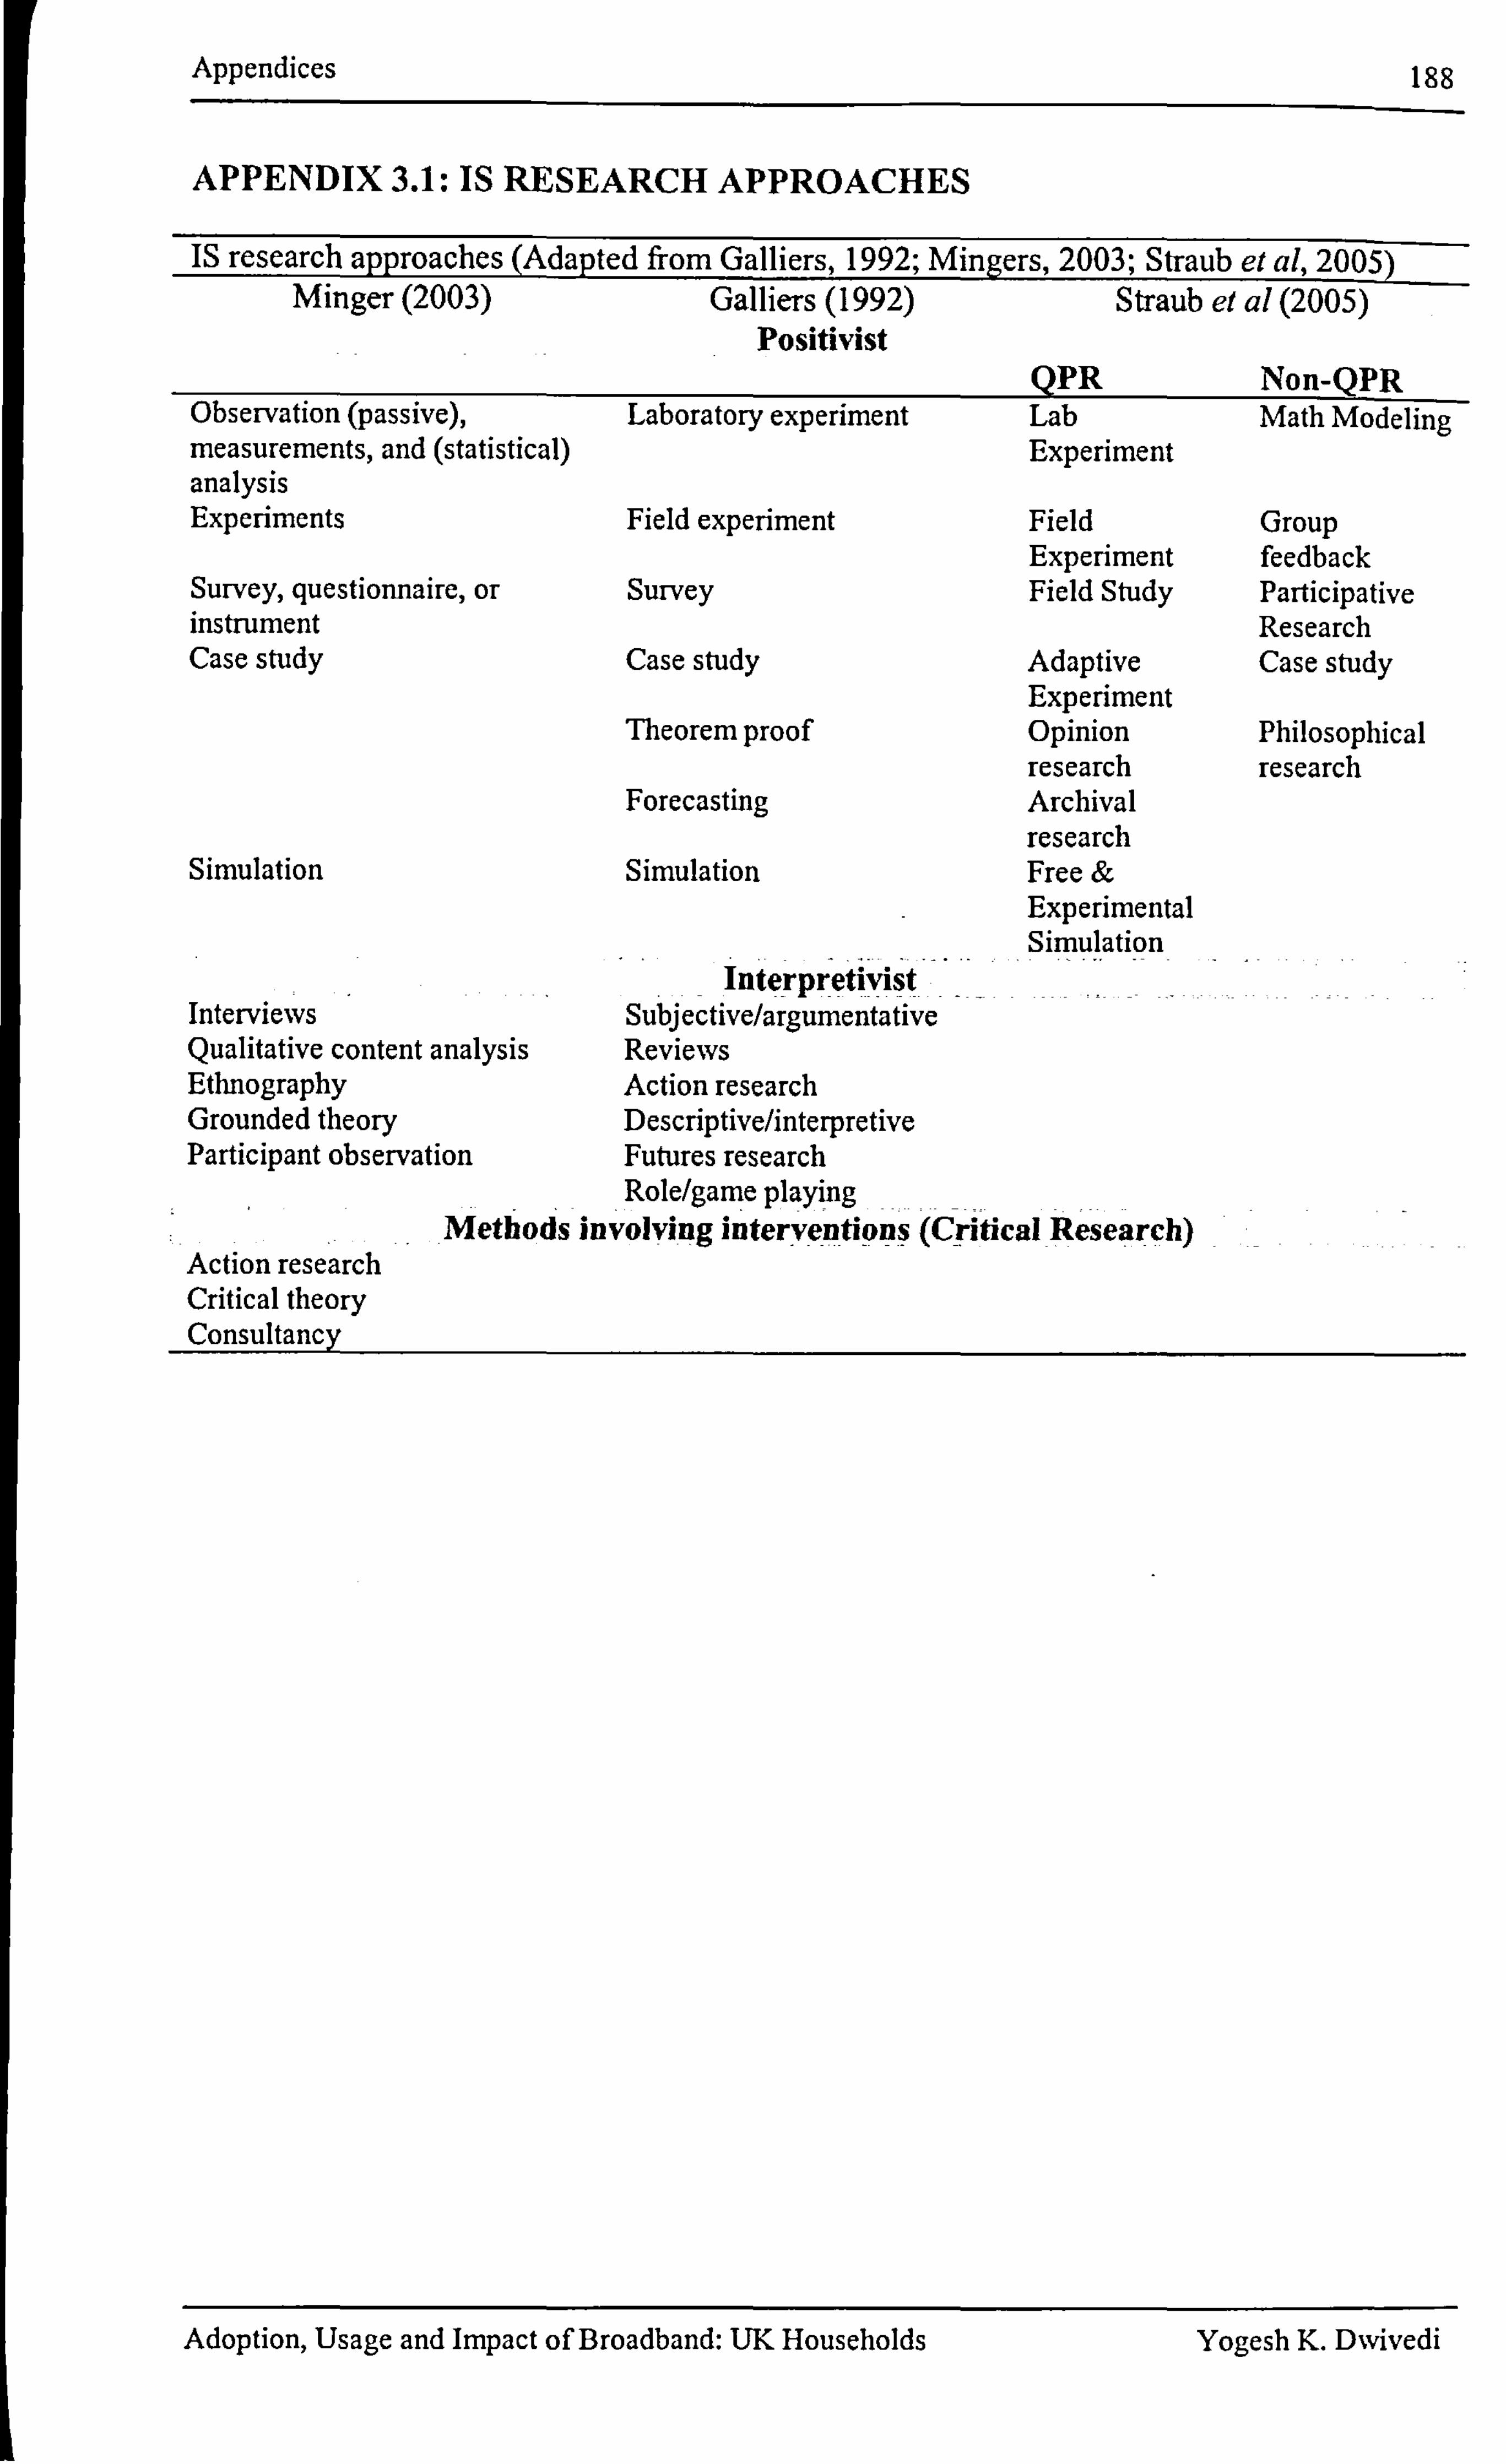
Appendices
APPENDIX 3.1: IS RESEARCH APPROACHES
188
_IS research approaches (Adapted from Galliers, 1992; Mingers, 2003; Straub et al, 005)
Minger(2003) Galliers (1992) Straub et al (2005) Positivist
QPR Non- WR Observation (passive), Laboratory experiment Lab Math Modeling measurements, and (statistical) Experiment analysis Experiments Field experiment Field Group
Experiment feedback Survey, questionnaire, or Survey Field Study Participative instrument Research Case study Case study Adaptive Case study
Experiment Theorem proof Opinion Philosophical
research research Forecasting Archival
research Simulation Simulation Free &
Experimental Simulation
Interpretivist Interviews Subjective/argumentative Qualitative content analysis Reviews Ethnography Action research Grounded theory Descriptive/interpretive Participant observation Futures research
Role/game playing Methods involving interventions (Critical Research)
Action research Critical theory
_Consultancy
Adoption, Usage and Impact of Broadband: UK Households Yogesh K. Divivedi
Appendices 189
APPENDIX 3.2: DESCRIPTION OF IS RESEARCH APPROACHES
Description of IS research approaches (Adapted from Mingers, 2003) Research method Description (Minger 2003, pp 237-240) Experiments This category includes both laboratory and field experiments and any
statistical analysis of results. Mingers defined experiment as an artificially generated situation involving the deliberate manipulation of certain conditions potentially relevant to the outcome.
(Passive) observation, It includes internally or externally published quantitative data, measurement and (statistical) observation, recording or measurement and their analysis. analysis Survey, questionnaire, or All fornis of data production involving the circulation of a pre- instrument structured set of questions no matter how administered. Surveys
shade into observation and measurement when the questions largely result in numerical answers, and into (structured) interviews when they are administered face-to-face and allow open-ended responses. The category includes any statistical analysis of the results.
Simulation The artificial production of data in such a way that it is representative of some aspects of a relevant real situation. It is related to experiments in that experimental design can be used in the generation and analysis of results.
Case study In this paper, it refers to a type- of positivist research, which often includes other methods such as interviews and questionnaires.
Interviews An interview can be defined as a real-time conversation between researcher and respondent to discover the respondent's personal views. They range from structured interviews with a fixed set of questions through to unstructured, open-ended discussions. They can also involve several people as in focus groups.
Qualitative content analysis It is concerned with the analysis of texts for the occurrence of specific categories or terms in interpretive manner by recognising the role of analyst in the process. This category can shade into grounded theory and ethnography.
Ethnography/Hermeneutics This involves the description of a particular culture in its own terins by the involved researcher immersing themselves in the language, practices, and values of a particular organisation with the aim to understand what happens through the eyes of the people involved. Its variant hermeneutics is particularly concerned with interpreting textual material. This category can overlap with the participant observation, and with critical theory when it adopts a critical rather than descriptive perspective.
Grounded theory It uses data from a range of sources (including quantitative) in order to generate theories that plausibly explain relationships among the concepts within the data. It is distinguished from a positivistic approach to data analysis in that it does accept an independent, pre- existing reality about which truth can be discovered. Indeed, (social) theories are always interpretations, and truth is enacted.
Participant observation In this method the researcher becomes an active participant in the situation, usually, but not always, without the knowledge of the other people involved. It is common to distinguish degrees of involvement: complete participant, participant-as-observer, observer-as-participant and complete observer, the latter essentially being pure ethnography.
Action research In this, the researcher explicitly becomes involved in intervening in the situation and attempting to bring about change. It is distinguished from consultancy in that the researcher enters the situation with particular theoretical or methodological tools and then uses the process and results of the intervention to evaluate the theory or method.
Critical theory It emphasises linking theory and practice, with research being grounded in practice. This category accepts several complementary research methods from different domains.
Adoption, Usage and Impact of Broadband: UK Households Yogesh K. Dwivedi
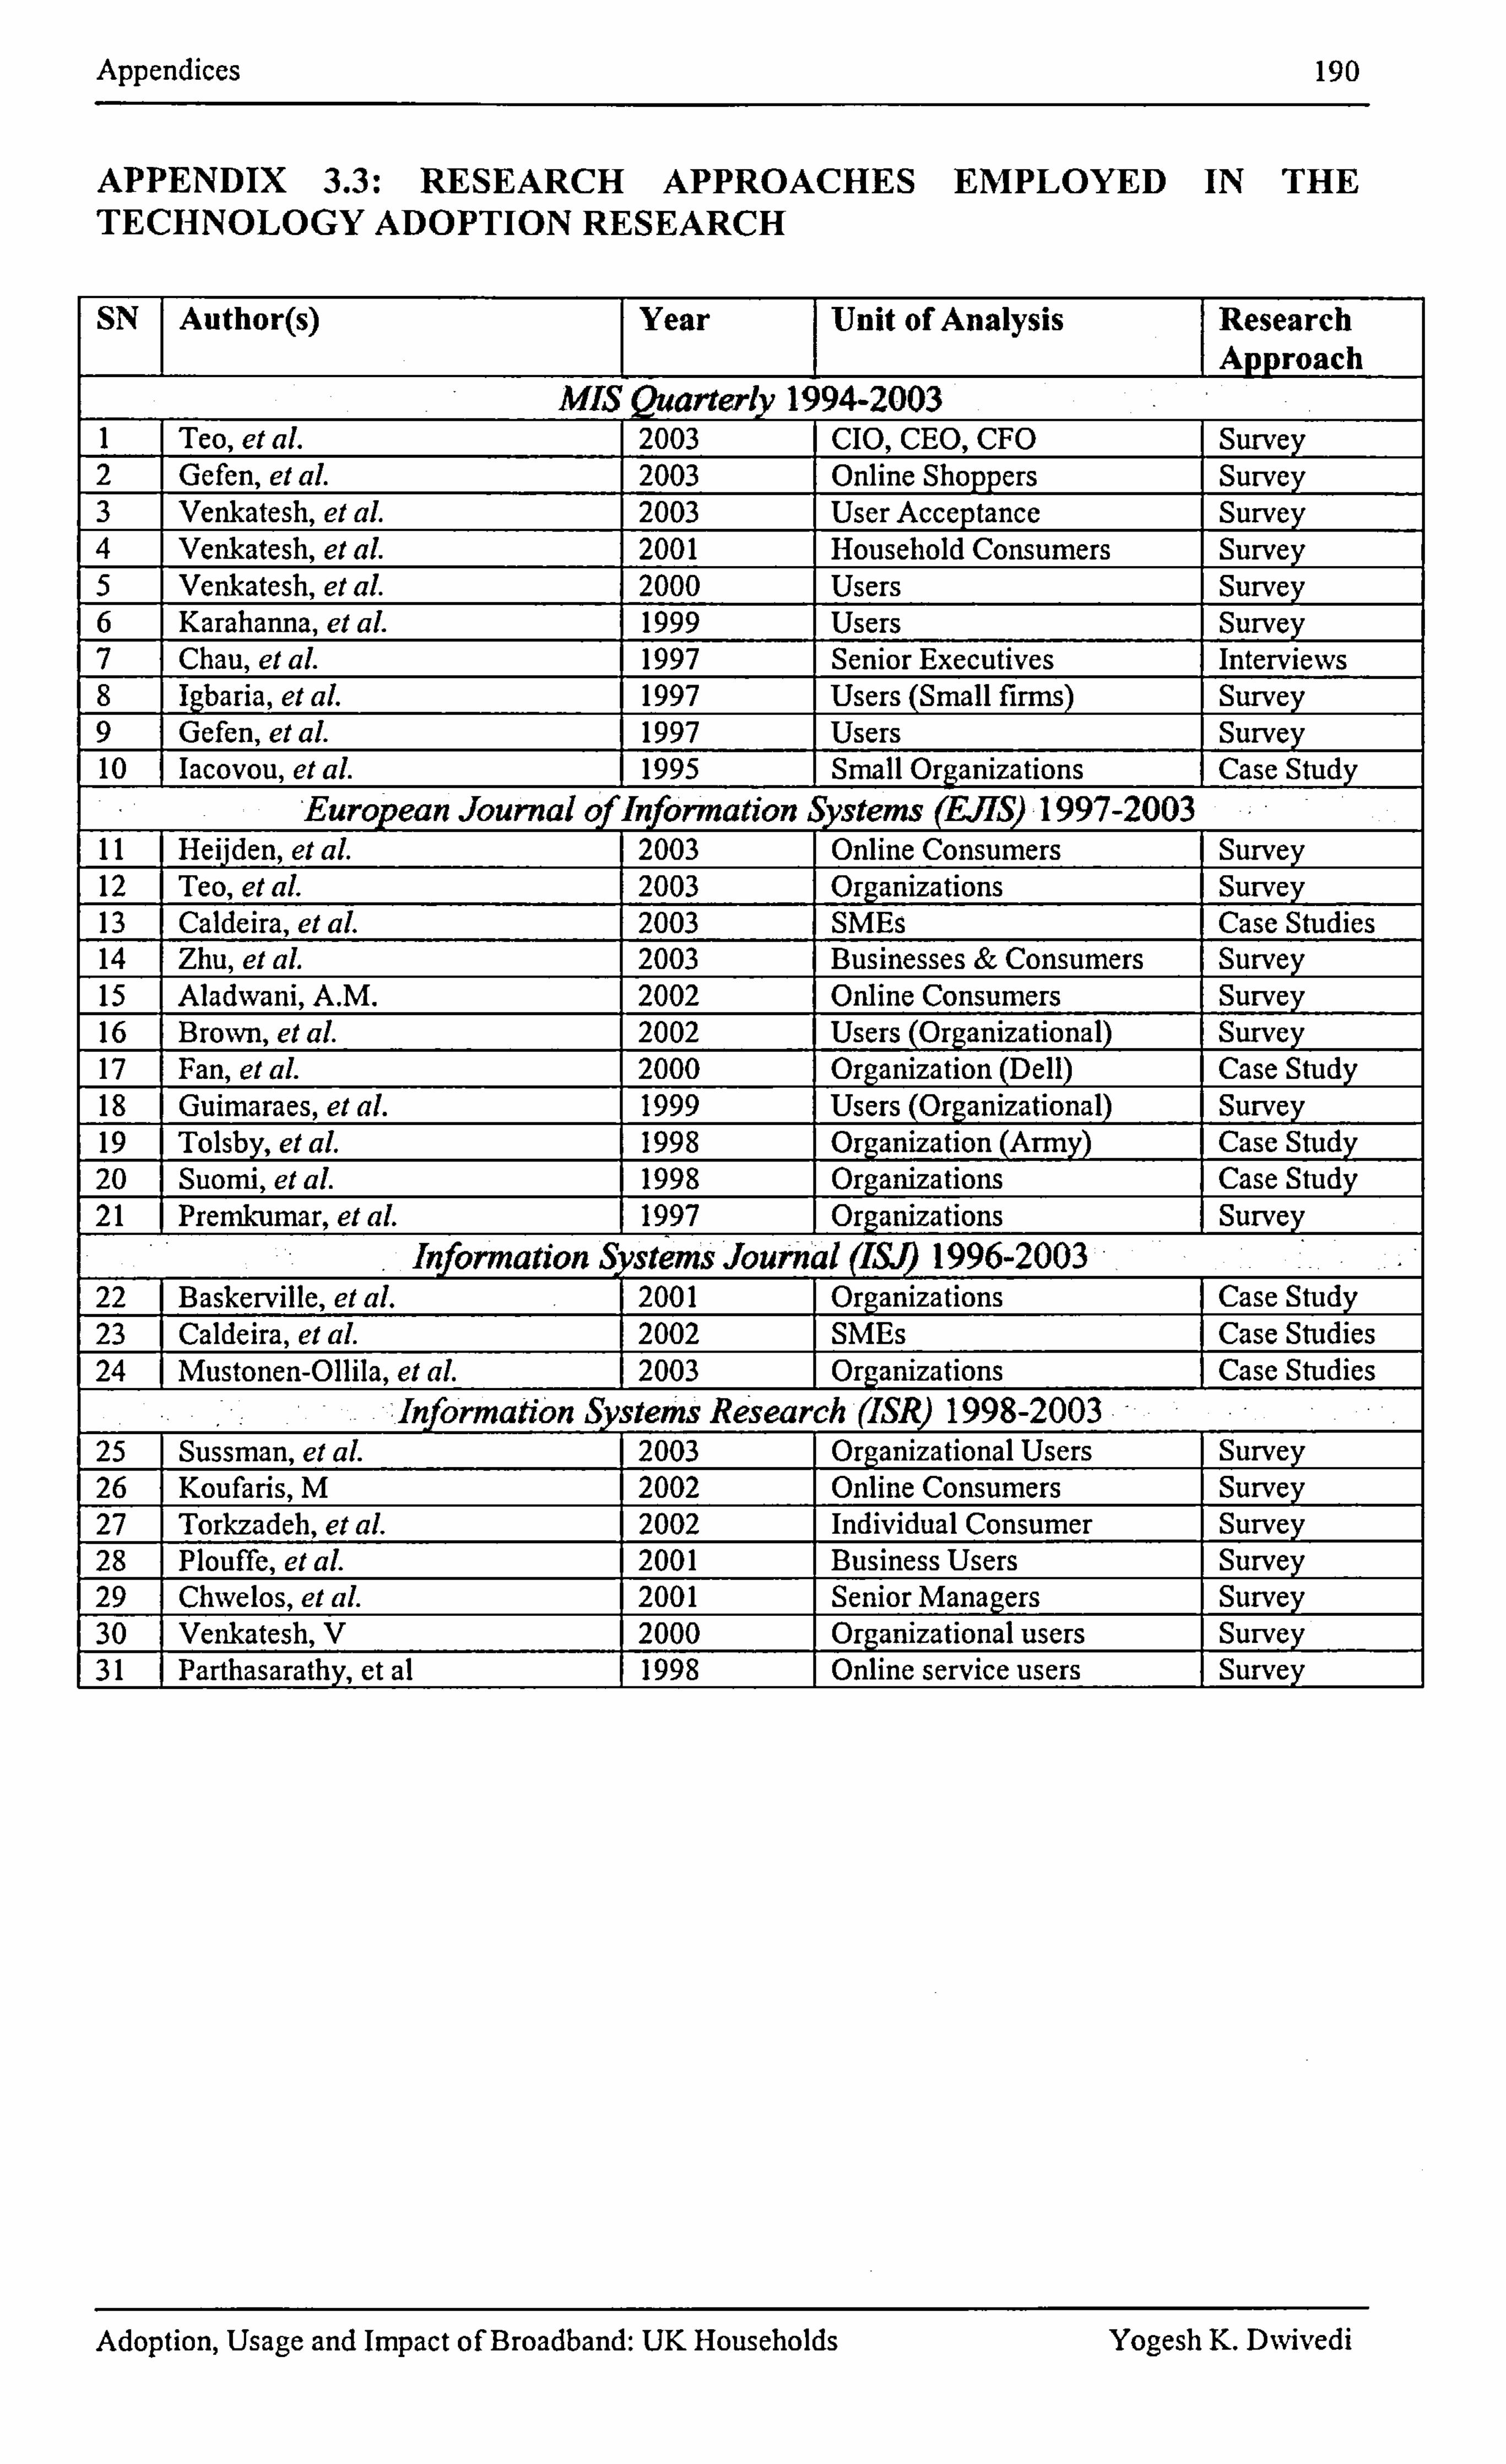
Appendices 190
APPENDIX 3.3: RESEARCH APPROACHES EMPLOYED IN THE TECHNOLOGY ADOPTION RESEARCH
SN Author(s) Year Unit of Analysis Research Approach
Quarterly 1 94-2003 I Teo, et aL 2003 CIO, CEO, CFO Survey 2 Gefen, et aL 2003 Online Shoppers Survey 3 Venkatesh, et A 2003 User Acceptance Survey 4 Venkatesh, et aL 2001 Household Consumers Survey 5 Venkatesh, et aL 2000 Users Survey 6 Karahanna, et aL 1999 Users Survey 7 Chau, et aL 1997 Senior Executives Interviews 8 Igbaria, et aL 1997 Users (Small firms) Survey 9 Gefen, et aL 1997 Users Survey 10 Iacovou, et aL 1995 Small Organizations Case Study
'European Journal o Information tems (EAS) 1997-2003 - 11 Heiiden, et aL 2003 Online Consumers Survey 12 Teo, et aL 2003 Organizations Survey 13 Caldeira, et aL 2003 SMEs Case Studies 14 Zhu, et aL 2003 Businesses & Consumers Survey 15 Aladwani, A. M. 2002 Online Consumers Survey 16 Brown, et aL 2002 Users (Organizational) Survey 17 Fan, et aL 2000 Organization (Dell) Case Study 18 Guimaraes, et al. 1999 Users (Organizational) Survey 19 Tolsby, et aL 1998 Organization (Army) Case Study 20 Suorni, et aL 1998 Organizations Case Study 21 Premkumar, et aL 1997 Organizations Survey
Information S ystems Journ I (ISJý 1996-2003 22 Baskerville, et al. 2001 Organizations Case Study 23 Caldeira, el aL 2002 SMEs Case Studies 24 Mustonen-Ollila, el aL 2003 Organizations Case Studies
I ý' i Information tems Resea (ISR) 1998-2003 25 Sussman, el aL 2003 Organizational Users Survey 26 Koufaris, M 2002 Online Consumers Survey 27 Torkzadeh, et A 2002 Individual Consumer Survey 28 Plouffe, et aL 2001 Business Users Survey 29 Chwelos, et aL 2001 Senior Managers Survey 30 Venkatesh, V 2000 Organizational users Survey
-31- TParthasarathy, et al 1998 Online service users Survey
Adoption, Usage and Impact of Broadband: UK Households Yogesh K. DNvivedi
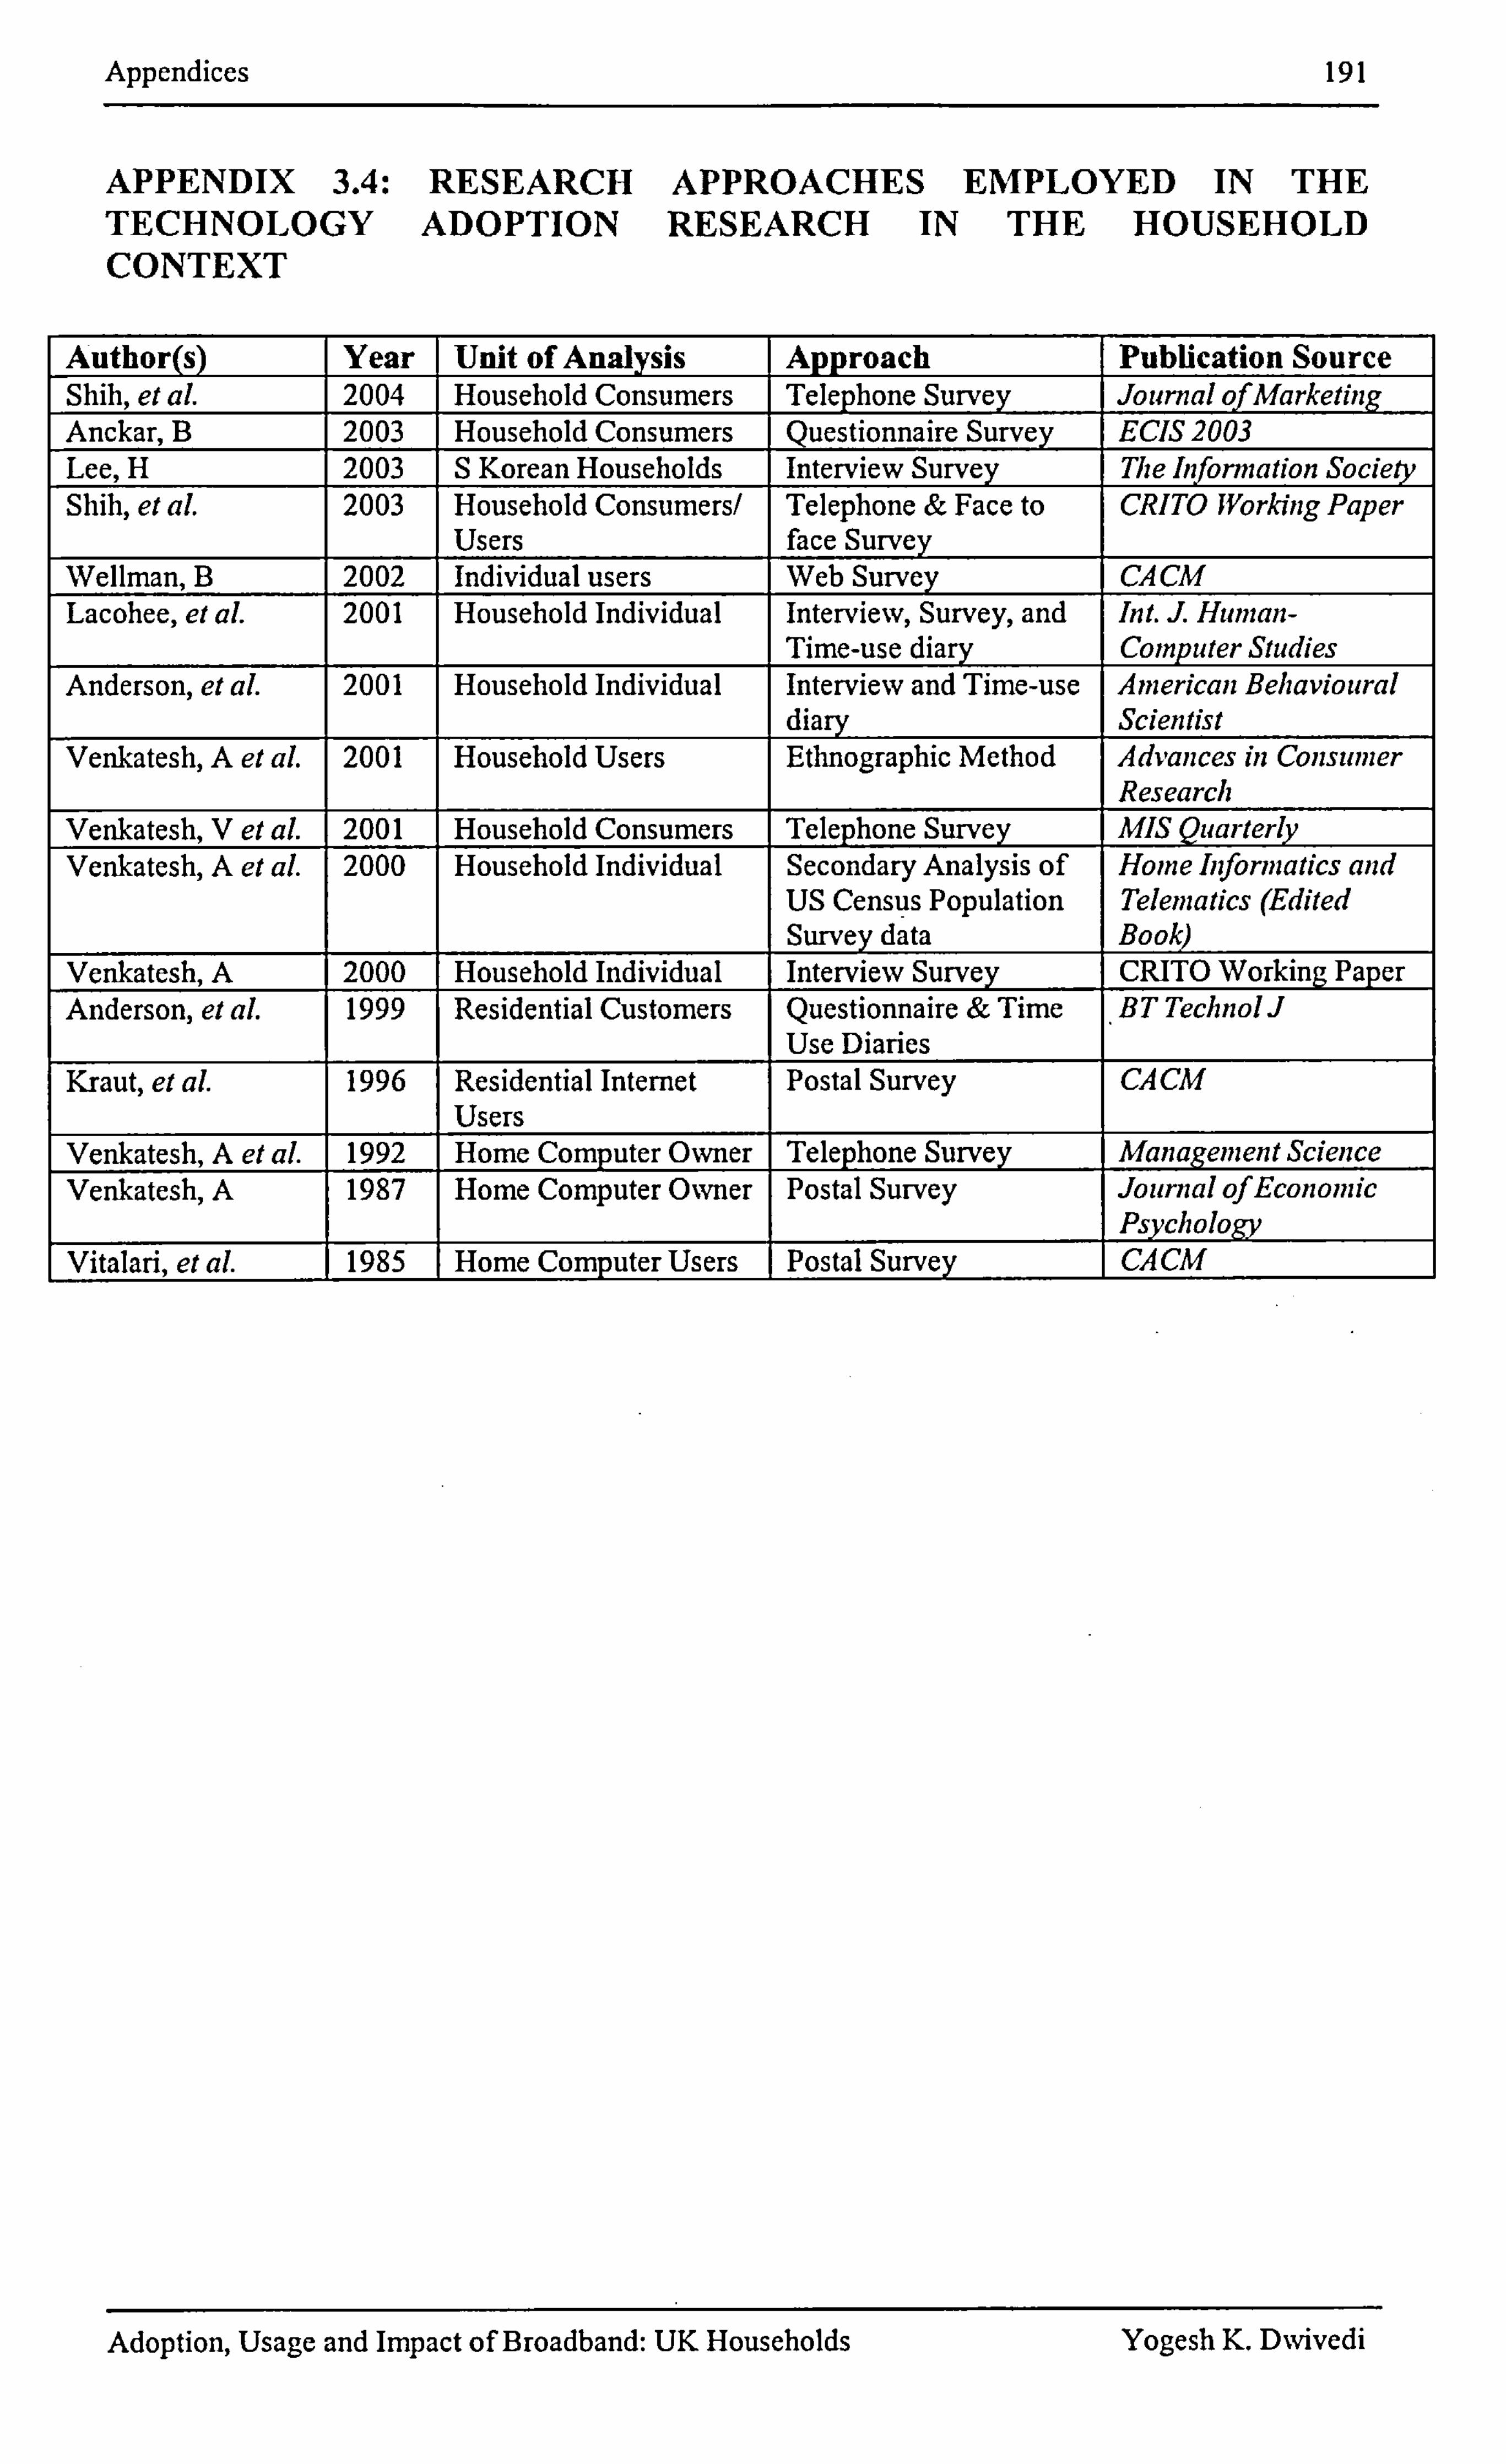
Appendices 191
APPENDIX 3.4: RESEARCH APPROACHES EMPLOYED IN THE TECHNOLOGY ADOPTION RESEARCH IN THE HOUSEHOLD CONTEXT
Author(s) Year Unit of Analysis Approach Publication Source Shih, et aL 2004 Household Consumers Telephone Survey Journal qfMarketing Anckar, B 2003 _ Household Consumers Questionnaire Survey ECIS 2003 Lee, H 2003 _ S Korean Households Interview Survey The Information Society Shih, et aL 2003 Household Consumers/
Users Telephone & Face to face Survey
CRITO Workitig Paper
Wellman, B 2002 Individual users Web Survey CACM Lacohee, et al. 2001 Household Individual Interview, Survey, and
Time-use diary Int. J Human- Computer Studies
Anderson, et al. 2001 Household Individual Interview and Time-use diary
knerican Behavioural Scientist
Venkatesh, A et aL 2001 Household Users Ethnographic Method 4 iices in Consumer Research
Venkatesh, V et A 2001 Household Consumers Telephone Survey MIS Quarterly Venkatesh, A et aL 2000 Household Individual Secondary Analysis of
US Census Population Survey data
Home Infoniiatics and Telematics (Edited Book)
Venkatesh, A 2000 Household Individual Interview Survey CRITO Working Paper Anderson et aL 1999 Residential Customers Questionnaire & Time
Use Diaries BT Technol J
Kraut, et aL 1996 Residential Internet Users
Postal Survey C. 4CM
Venkatesh, A et aL 1992 Home Computer Owner Telephone Survey Management Science Venkatesh, A 1987 Home Computer Owner Postal Survey Journal ofEconomic
Psychology Vitalari, et aL 1985 Home ýomputer Users Postal Survey C, 4 CM
Adoption, Usage and Impact of Broadband: UK Households Yogesh K. D%vivcdi
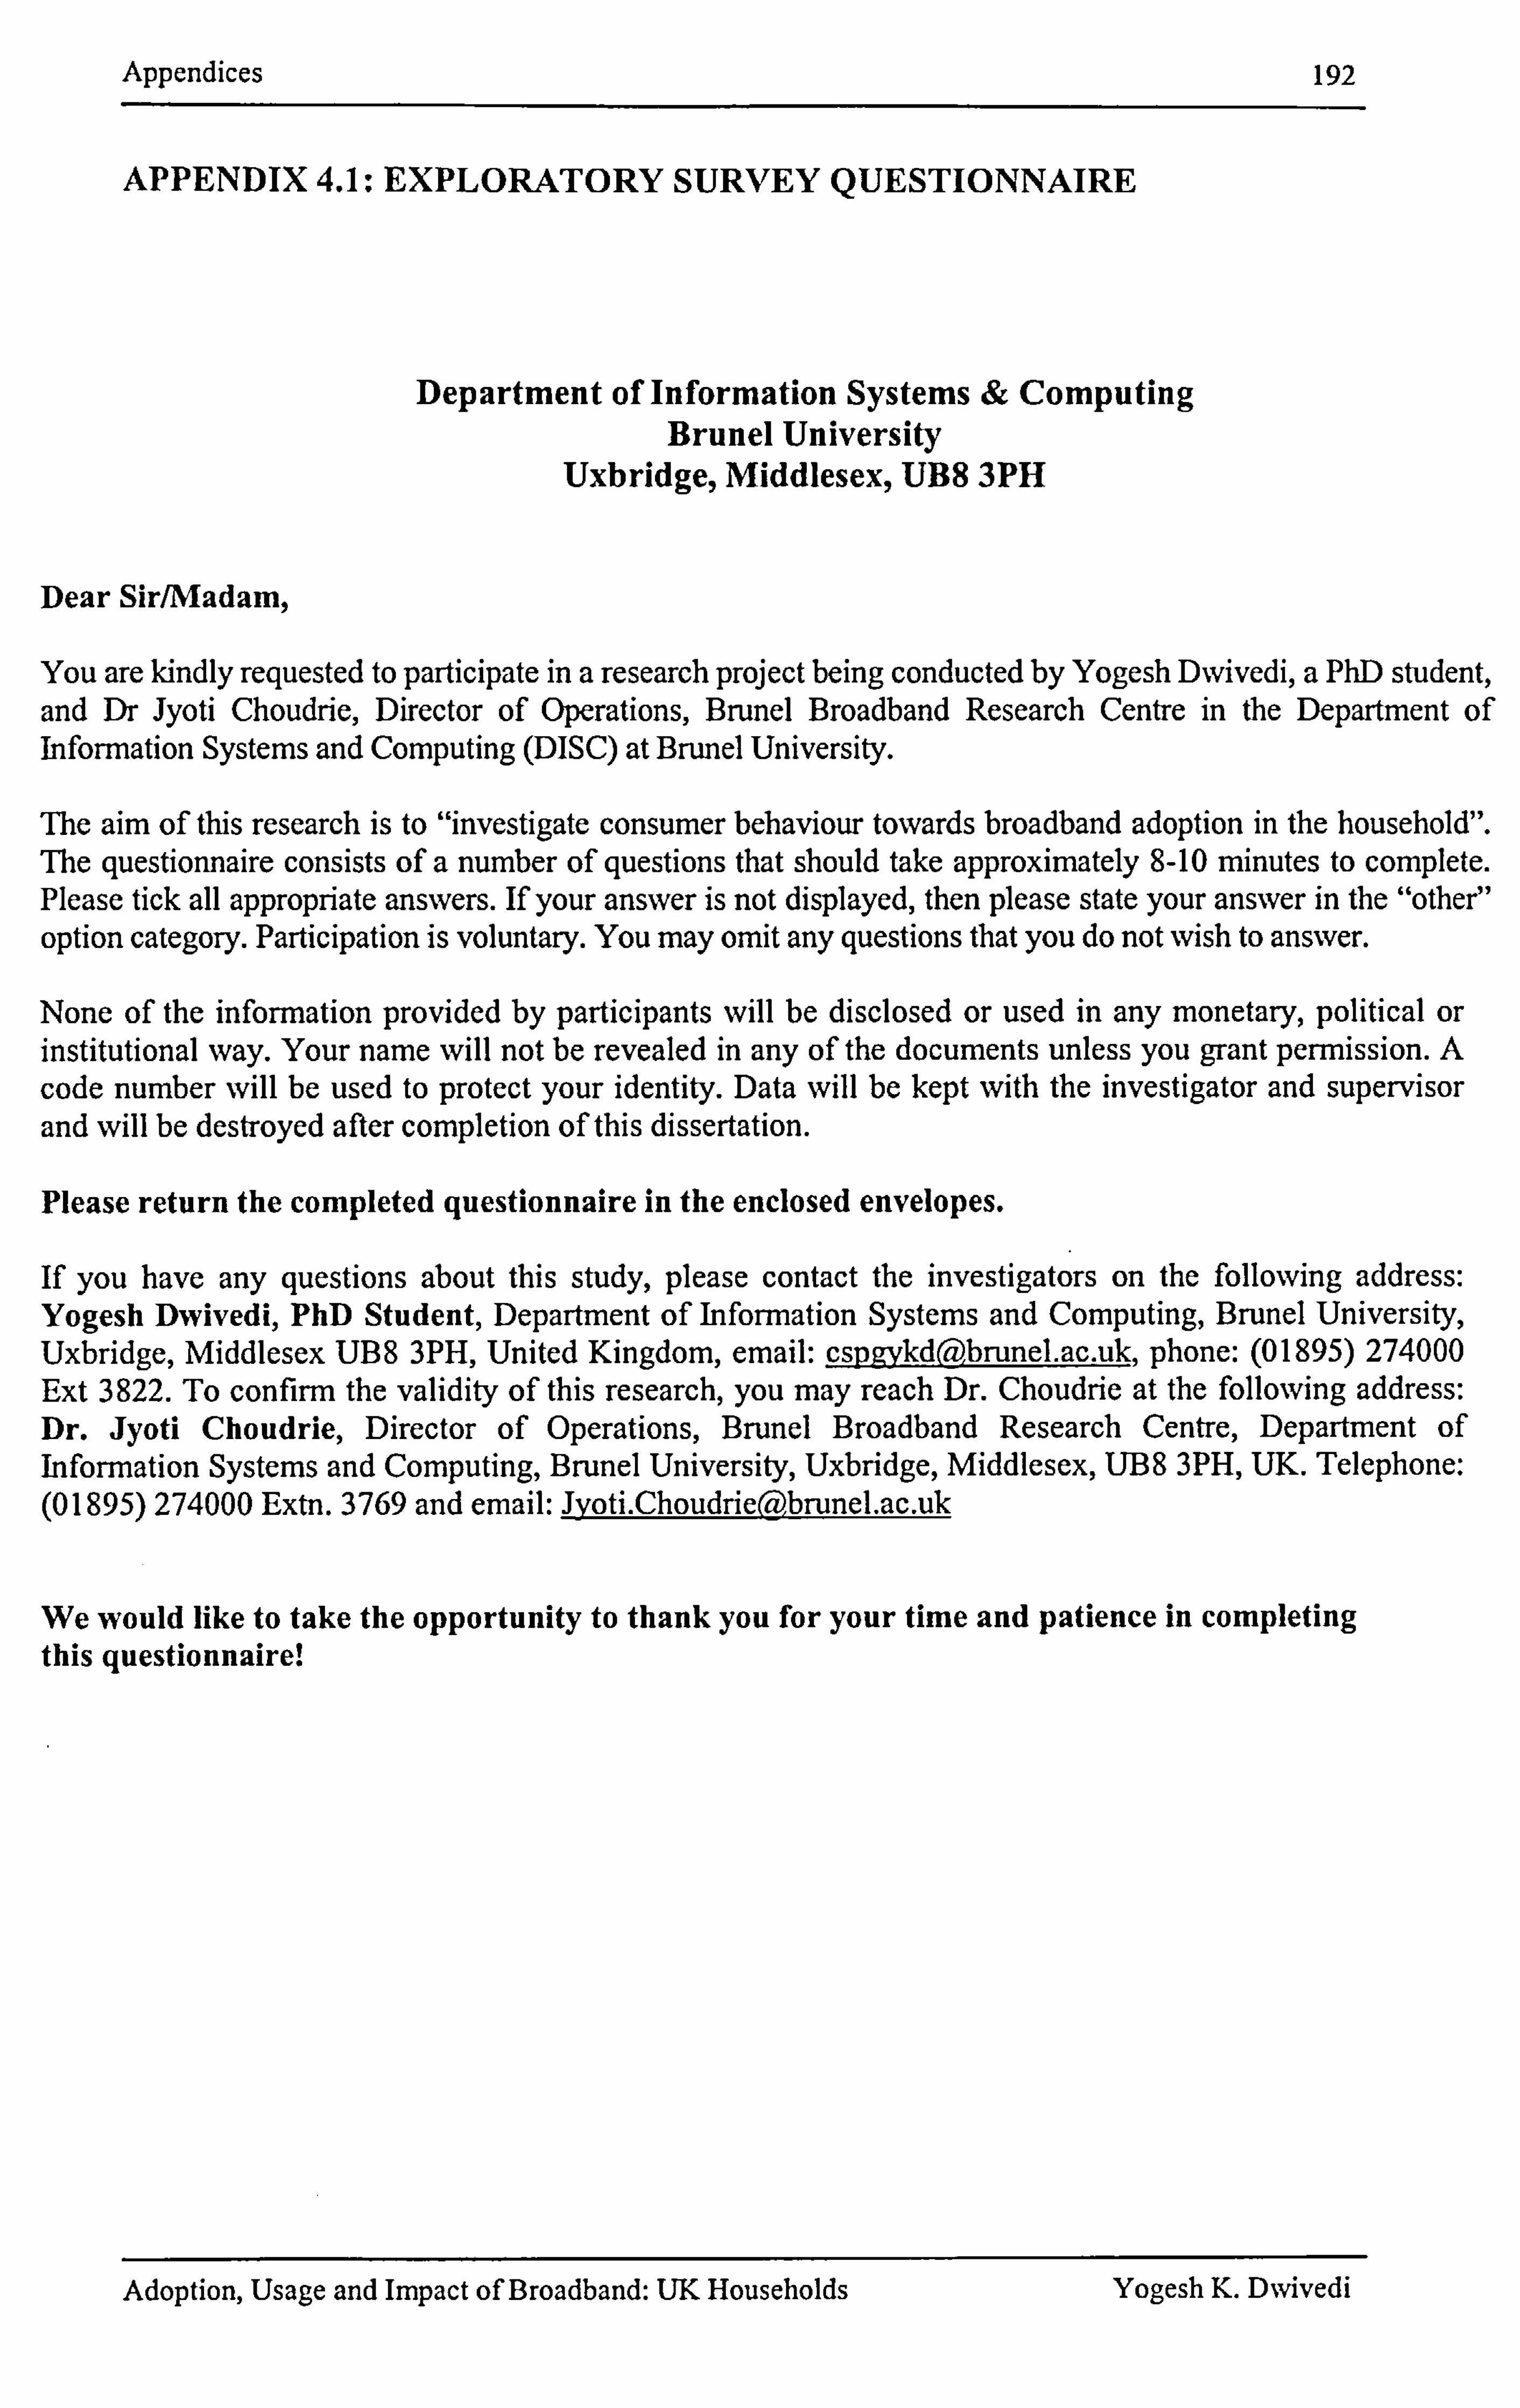
Appendices
APPENDIX 4.1: EXPLORATORY SURVEY QUESTIONNAIRE
Department of Information Systems & Computing Brunel University
Uxbridge, Middlesex, UB8 3PH
Dear Sir/Madam,
192
You are kindly requested to participate in a research project being conducted by Yogesh Dwivedi, a PhD student, and Dr Jyoti Choudrie, Director of Operations, Brunel Broadband Research Centre in the Department of Information Systems and Computing (DISC) at Brunel University.
The aim of this research is to "investigate consumer behaviour towards broadband adoption in the household". The questionnaire consists of a number of questions that should take approximately 8-10 minutes to complete. Please tick all appropriate answers. If your answer is not displayed, then please state your answer in the "other" option category. Participation is voluntary. You may omit any questions that you do not wish to answer.
None of the information provided by participants will be disclosed or used in any monetary, political or institutional way. Your name will not be revealed in any of the documents unless you grant permission. A code number will be used to protect your identity. Data will be kept with the investigator and supervisor and will be destroyed after completion of this dissertation.
Please return the completed questionnaire in the enclosed envelopes.
If you have any questions about this study, please contact the investigators on the following address: Yogesh Dwivedi, PhD Student, Department of Information Systems and Computing, Brunel University,
Pbrunel. ac. uk, phone: (01895) 274000 Uxbridge, Middlesex UB8 3PH, United Kingdom, email: cspgykd , Ext 3822. To confirm the validity of this research, you may reach Dr. Choudrie at the following address: Dr. Jyoti Choudrie, Director of Operations, Brunel Broadband Research Centre, Department of Information Systems and Computing, Brunel University, Uxbridge, Middlesex, U138 3PH, UK. Telephone: (0 1895) 274000 Extn. 3769 and email: Jyoti. Choudrie(a)brunel. ac. uk
We would like to take the opportunity to thank you for your time and patience in completing this questionnaire!
Adoption, Usage and Impact of Broadband: UK Households Yogesh K. DNvivedi
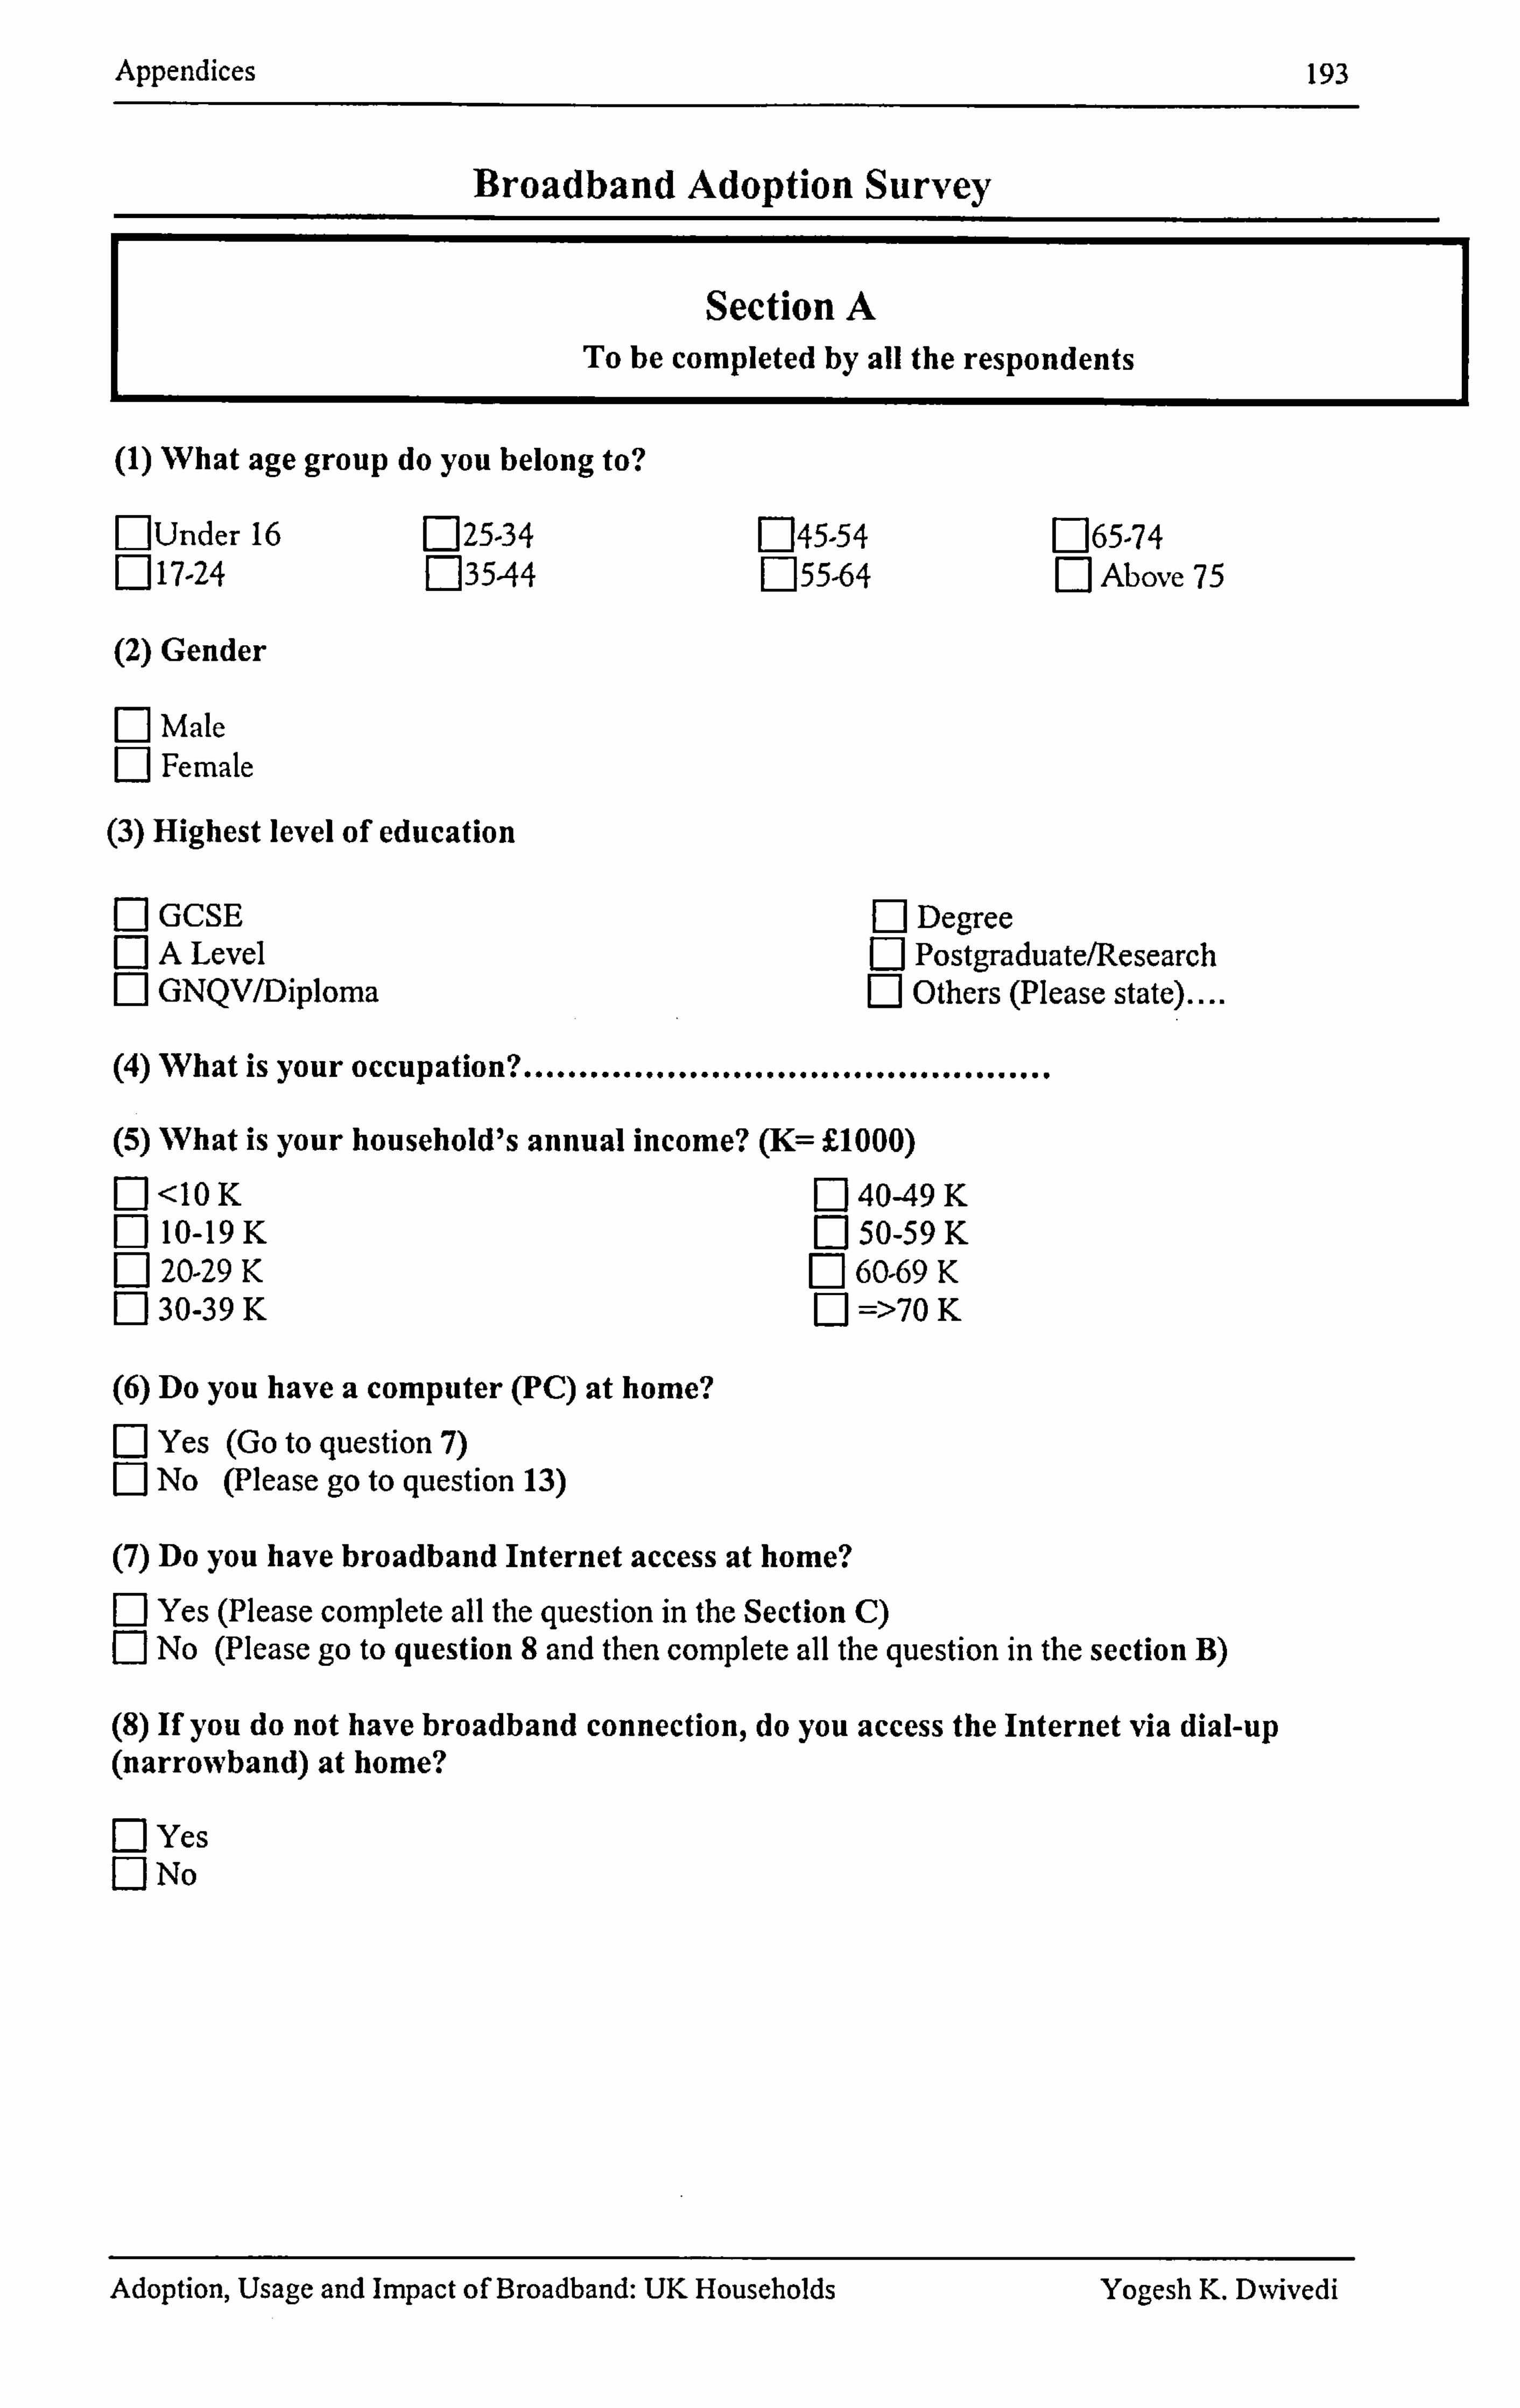
Appendices 193
Broadband Adoption Survey
Section A To be completed by all the respondents
(1) What age group do you belong to?
FlUnder 16 [: ]25-34 0 17-24 n35-44
(2) Gender
n Mate F] Female
(3) Highest level of education
Fj GCSE F1 A Level El GNQV/Diploma
F1 Degree F] Postgraduate/Research El Others (Please state)....
(4) What is your occupation? ................................................
(5) What is your household's annual income? (K7- E1000)
M<10K [: 140-49 K F] 10-19 K El 50-59 K F] 20-29 K Fý 60-69 K n 30-39 K [: 1 =>70 K
(6) Do you have a computer (PC) at home? R Yes (Go to question 7) F] No (Please go to question 13)
(7) Do you have broadband Internet access at home?
Yes (Please complete all the question in the Section Q No (Please go to question 8 and then complete all the question in the section B)
(8) If you do not have broadband connection, do you access the Internet via dial-up (narrowband) at home?
El Yes F] No
E145-54 n65-74 [: 155-64 n Above 75
Adoption, Usage and Impact of Broadband: UK Households Yogesh K. DNvivedi
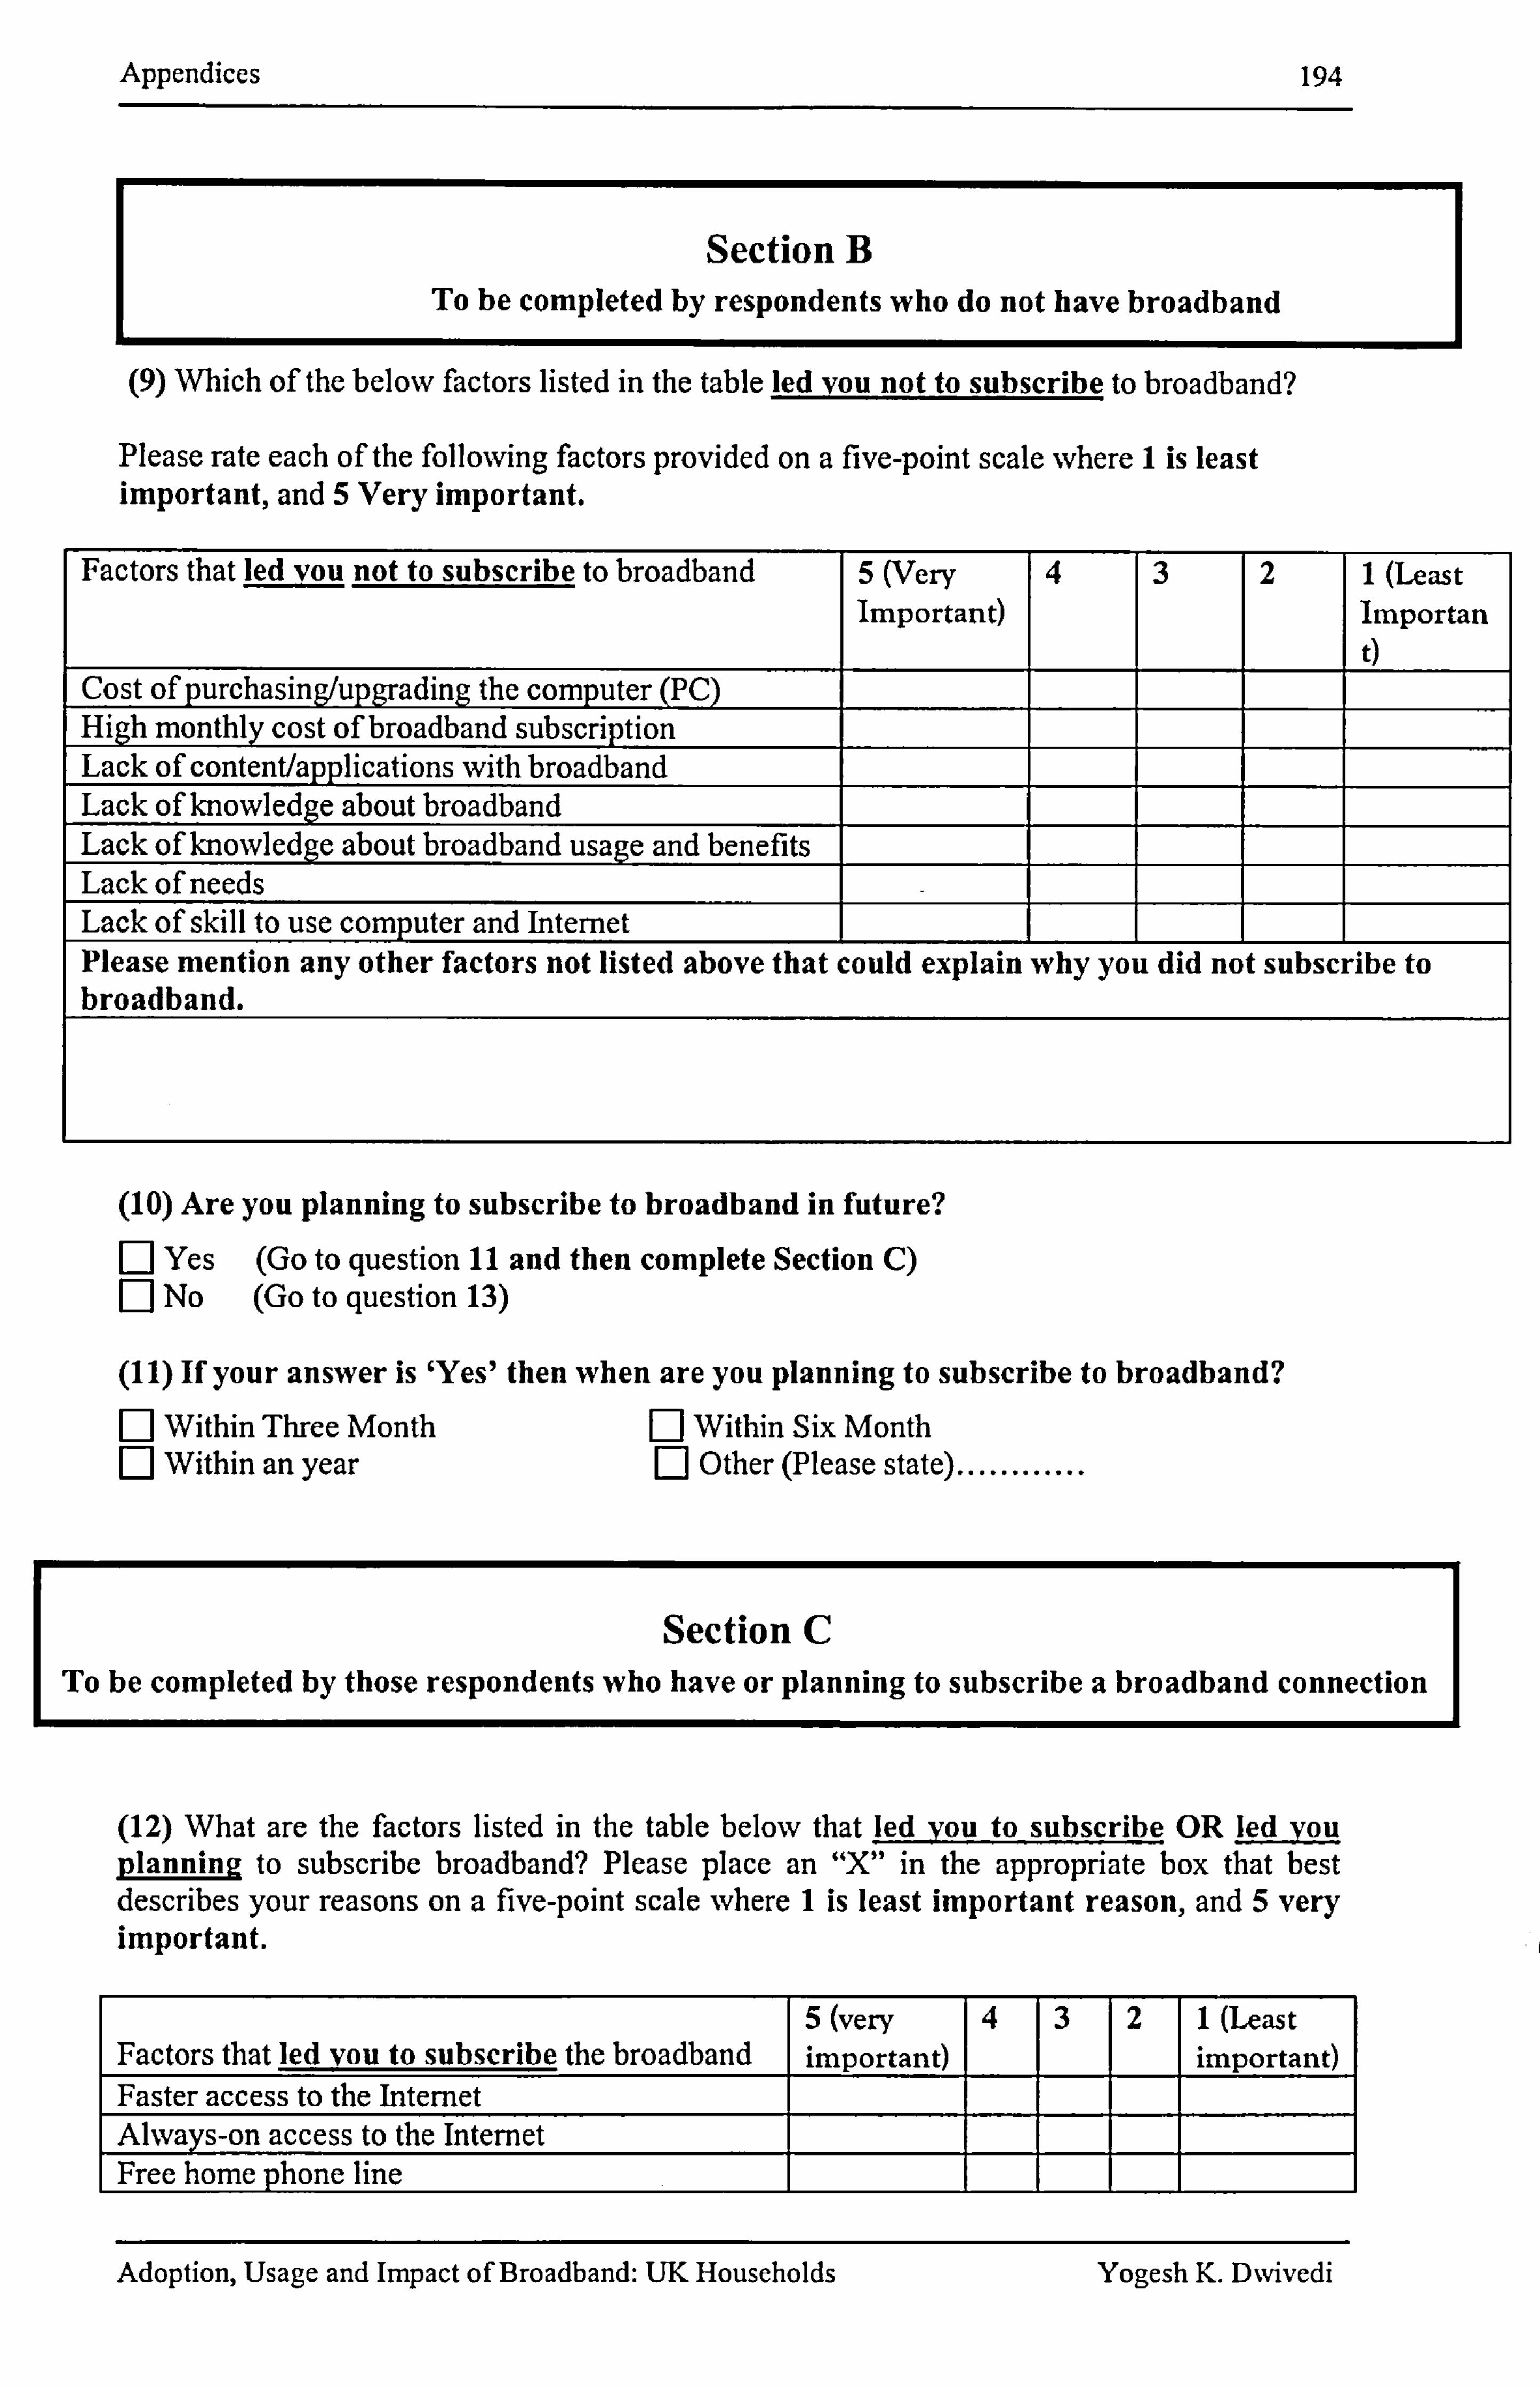
Appendices 194
Section B To be completed by respondents who do not have broadband
(9) Which of the below factors listed in the table led you not to subscribe to broadband?
Please rate each of the following factors provided on a five-point scale where 1 is least important, and 5 Very important.
Factors that led vou not to subscribe to broadband 5 (Very Important)
4 3 2 1 (Least Importan 0
Cost of purchasing/upgrading the computer (PC) High monthly cost of broadband subscription Lack of content/applications with broadband Lack of knowledge about broadband Lack of knowledge about broadband usage and benefits Lack of needs Lack of skill to use computer and Internet Please mention any other factors not listed above that could explain why you did not subscribe to broadband.
(10) Are you planning to subscribe to broadband in future? [: 1 Yes (Go to question 11 and then complete Section Q F1 No (Go to question 13)
(11) If your answer is 'Yes' then when are you planning to subscribe to broadband? F] Within Three Month F1 Within Six Month Fj Within an year El Other (Please state) ............
Section C To be completed by those respondents who have or planning to subscribe a broadband connection
(12) What are the factors listed in the table below that led vou to subscribe OR led vou planning to subscribe broadband? Please place an "X" in the appropriate box that best describes your reasons on a five-point scale where 1 is least important reason, and 5 very important.
Factors that led you to subscribe the broadband 5 (very important)
4 3 2 1 (Least important)
Faster access to the Internet Always-on access to the Internet Free home phone line
Adoption, Usage and Impact of Broadband: UK Households Yogesh K. Dxvivedi

Appendices 195
Un-metered access to Internet To perform j ob-related tasks To find educational/research materials To perform home business To download files faster To helpwitb children's homework To perform the personal and household activities i. e. online shopping & information search To play online games For entertainment, such as music and movies To communicate with family, friends and relatives My family members and relatives influenced me to subscribe a broadband My friends influenced me to subscribe to broadband I saw TV/News advert and thought of trying it out. My kids influenced me to subscribed to broadband. Having broadband enhances my social status Please mention any other factors not listed above that you believe driving broadband adoption in households.
(13) Would you be willing to provide 5-10 minutes for an interview on this issue?
n Yes n No
If you agree to an interview, then can you please provide your phone number, email or home address whereby we can contact you:
Phone number/E-mail/ ................................................................................
Thank you very much for your valuable time and patience for completing this questionnaire!
Adoption, Usage and Impact of Broadband: UY, Households Yogesh K. DNvivedi
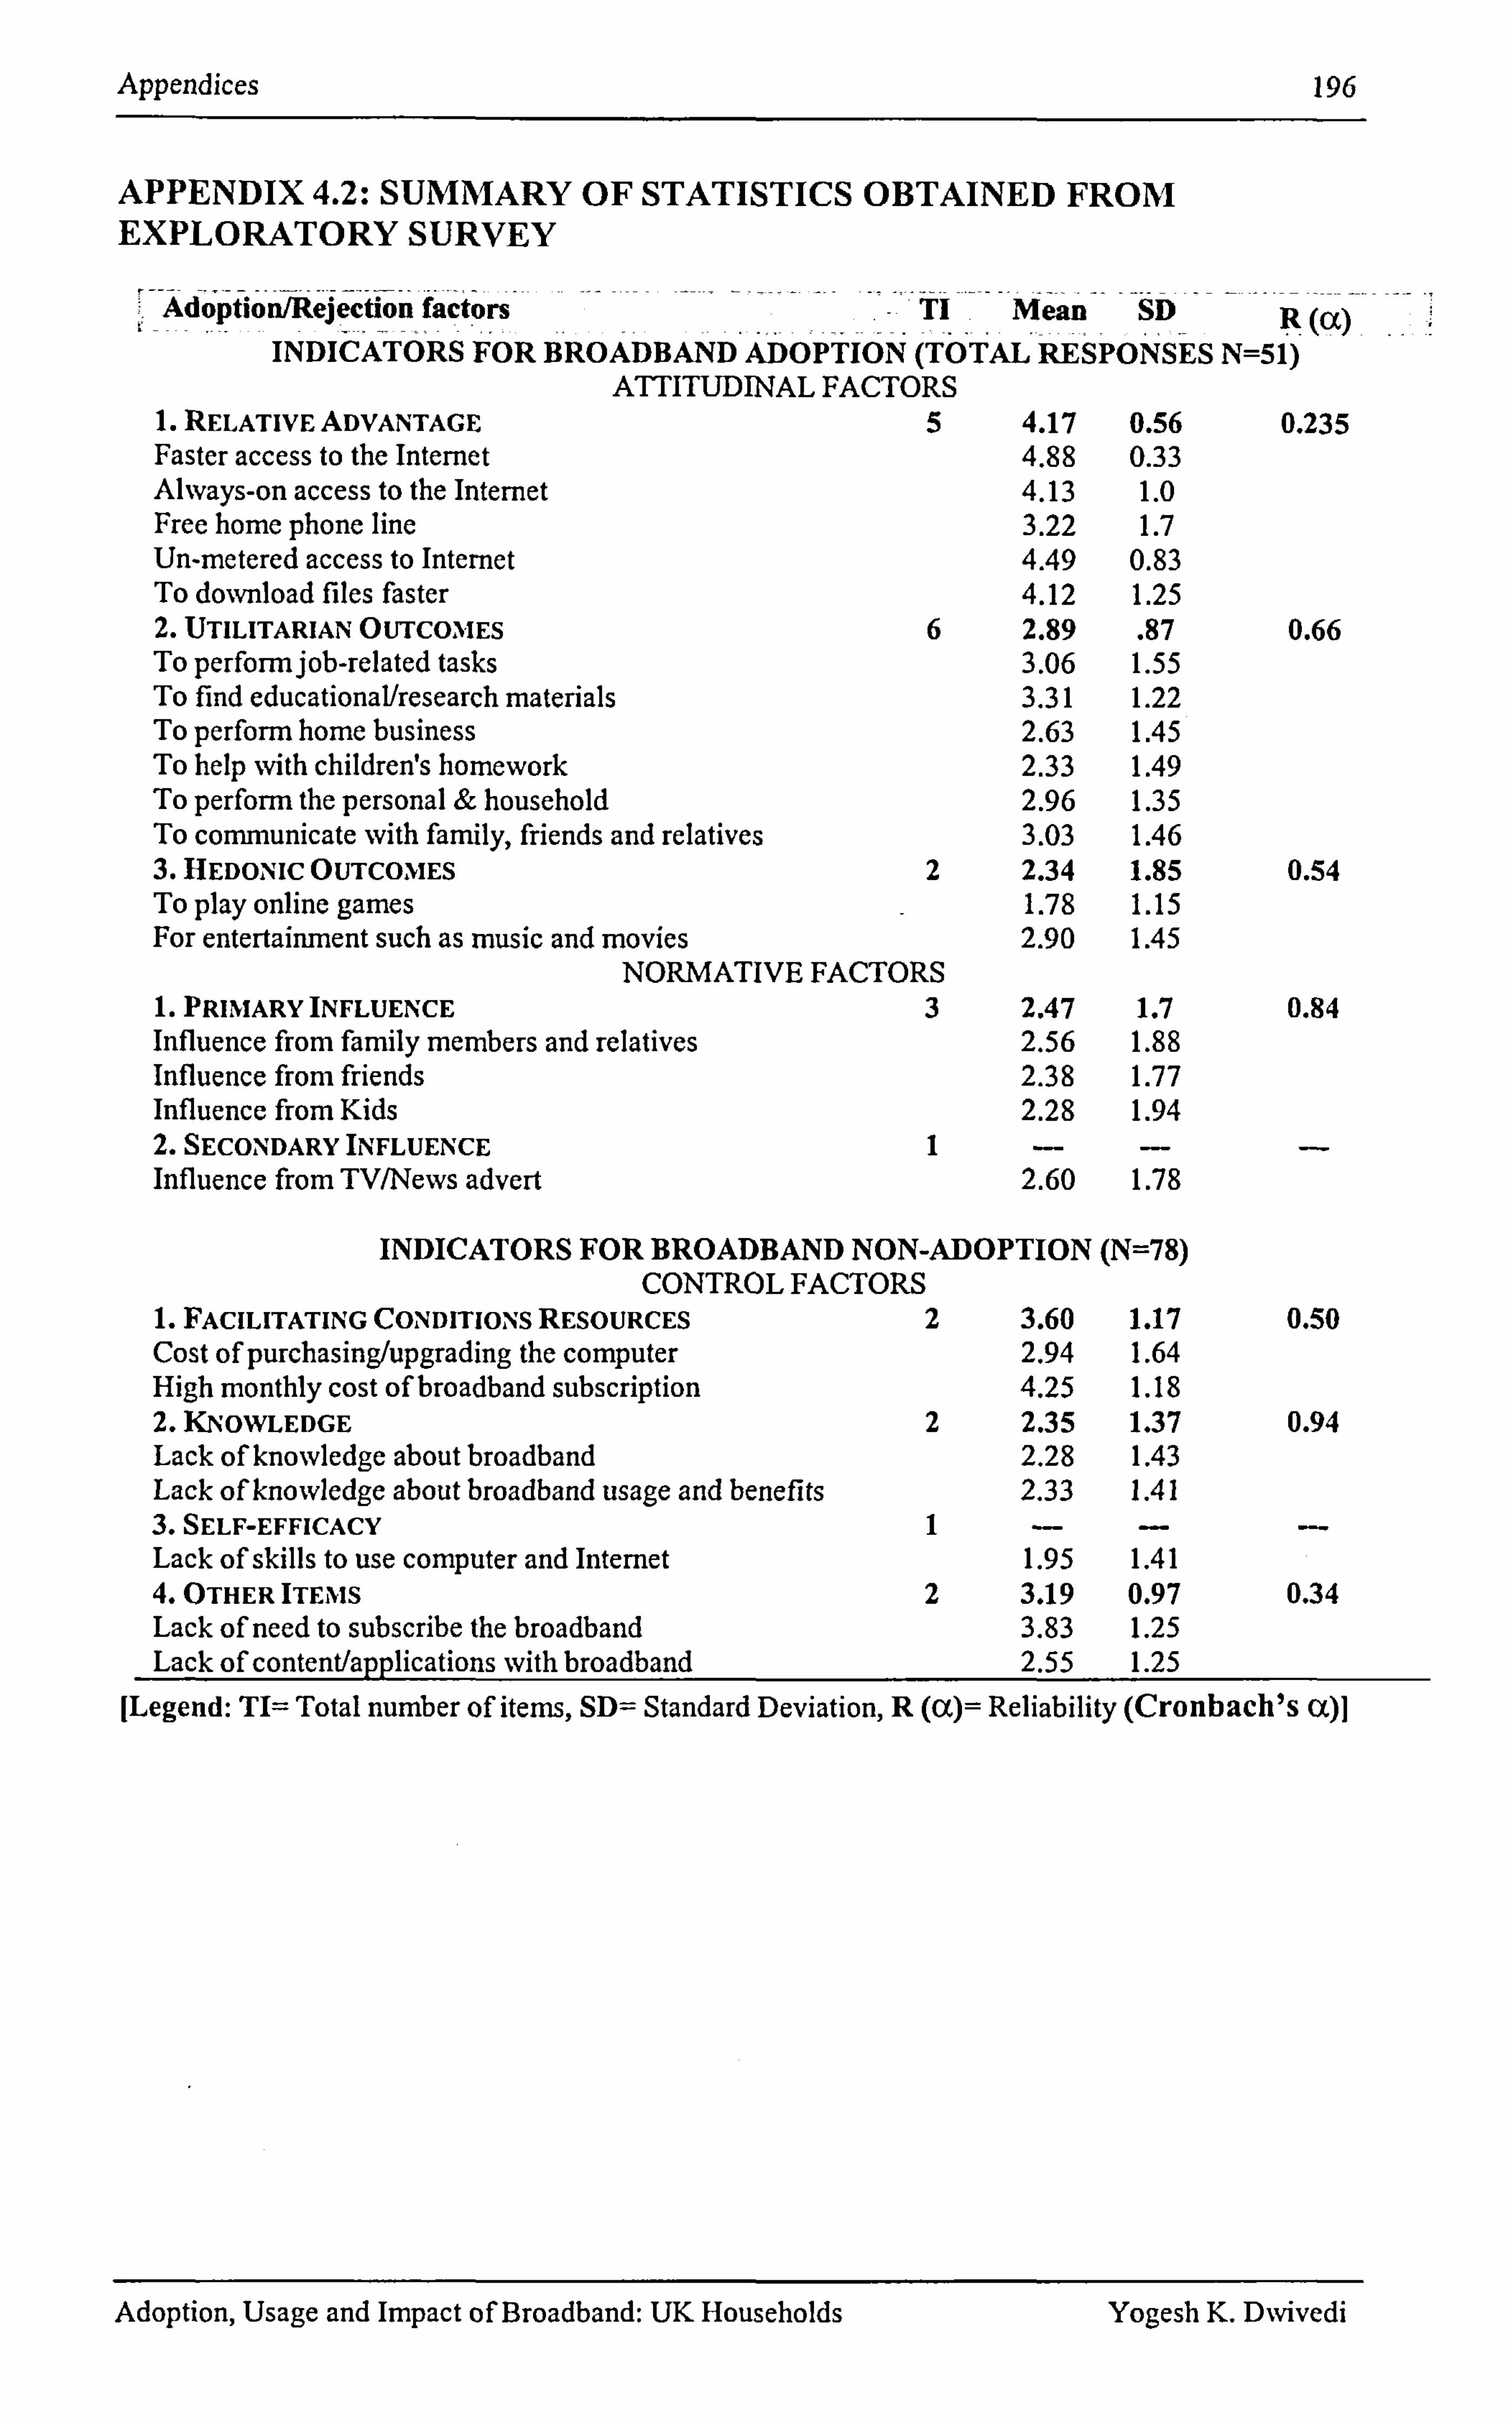
Appendices 196
APPENDIX 4.2: SUMMARY OF STATISTICS OBTAINED FROM EXPLORATORY SURVEY
Adoption/Rejection factors TI Mean SD R (a) INDICATORS FOR BROADBAND ADOPTION (TOTAL RESPONSES N=51)
ATTITUDINAL FACTORS 1. RELATIVE ADVANTAGE 5 4.17 0.56 0.235 Faster access to the Internet 4.88 0.33 Always-on access to the Internet 4.13 1.0 Free home phone line 3.22 1.7 Un-metered access to Internet 4.49 0.83 To download files faster 4.12 1.25 2. UTILITARIAN OUTCOMES 6 2.89 . 87 0.66 To perform job-related tasks 3.06 1.55 To find educational/research materials 3.31 1.22 To perform home business 2.63 1.45 To help -with children's homework 2.33 1.49 To perform the personal & household 2.96 1.35 To communicate with family, friends and relatives 3.03 1.46 3. HEDONIC OUTCOMES 2 2.34 1.85 0.54 To play online games 1.78 1.15 For entertainment such as music and movies 2.90 1.45
NORMATIVE FACTORS 1. PRIMARY INFLUENCE 3 2.47 1.7 0.84 Influence from family members and relatives 2.56 1.88 Influence from friends 2.38 1.77 Influence from Kids 2.28 1.94 2. SECONDARYINFLUENCE 1 - - Influence from TV/News advert 2.60 1.78
INDICATORS FOR BROADBAND NON-ADOPTION (N=78) CONTROLFACTORS
1. FACILITATING CONDITIONS RESOURCES 2 3.60 1.17 0.50 Cost of purchasing/upgrading the computer 2.94 1.64 High monthly cost of broadband subscription 4.25 1.18 2. KNOWLEDGE 2 2.35 1.37 0.94 Lack of knowledge about broadband 2.28 1.43 Lack of knowledge about broadband usage and benefits 2.33 1.41 3. SELF-EFFICACY 1 - -- Lack of skills to use computer and Internet 1.95 1.41 4. OTHER ITEINIS 2 3.19 0.97 0.34 Lack of need to subscribe the broadband 3.83 1.25 Lack of content/aDr)lications with broadband 2.55 1.25
[Legend: TI= Total number of items, SD= Standard Deviation, R (cc)= Reliability (Cronbach's (x)]
Adoption, Usage and Impact of Broadband: UK Households Yogesh K. D%vivedi

Appendices 197
APPENDIX 4.3: CONTENT VALIDITY QUESTIONNAIRE
Subject: Research hell) in content validation of broadband diffusion survey instrument
Dear SirflNladam
I am Yogesh Kumar DNvivedi, pursuing a PhD (IS) under the supervision of Dr Jyoti Choudrie, Director of Operations, Brunel Broadband Research Centre in the Department of Information Systems and Computing (DISC) at Brunel University. The aim of my PhD research is to "investigate broadband diffusion in the UK household".
At this stage I am conducting a content validation of the survey instrument. I would be much obliged if you could participate in the content validation of the survey instrument prepared to investigate broadband diffusion.
I am contacting you since I am aware about your knowledge and academic or industrial expertise in one of the following areas: telecommunication management research, broadband difftision, technology diffusion, technology diffusion in the household, electronic commerce and e-business adoption, diffusion and adoption in general and consumer behaviour. The details about how to complete the questions are provided in the beginning of attached questionnaire. We would like to take this opportunity to thank you for your valuable time and patience for participating in content validity survey on broadband diffusion study!
Looking forward to your reply,
Sincerely,
Yogesh K. Dwivedi
Adoption, Usage and Impact of Broadband: UK Households Yogesh K. D%vivedi
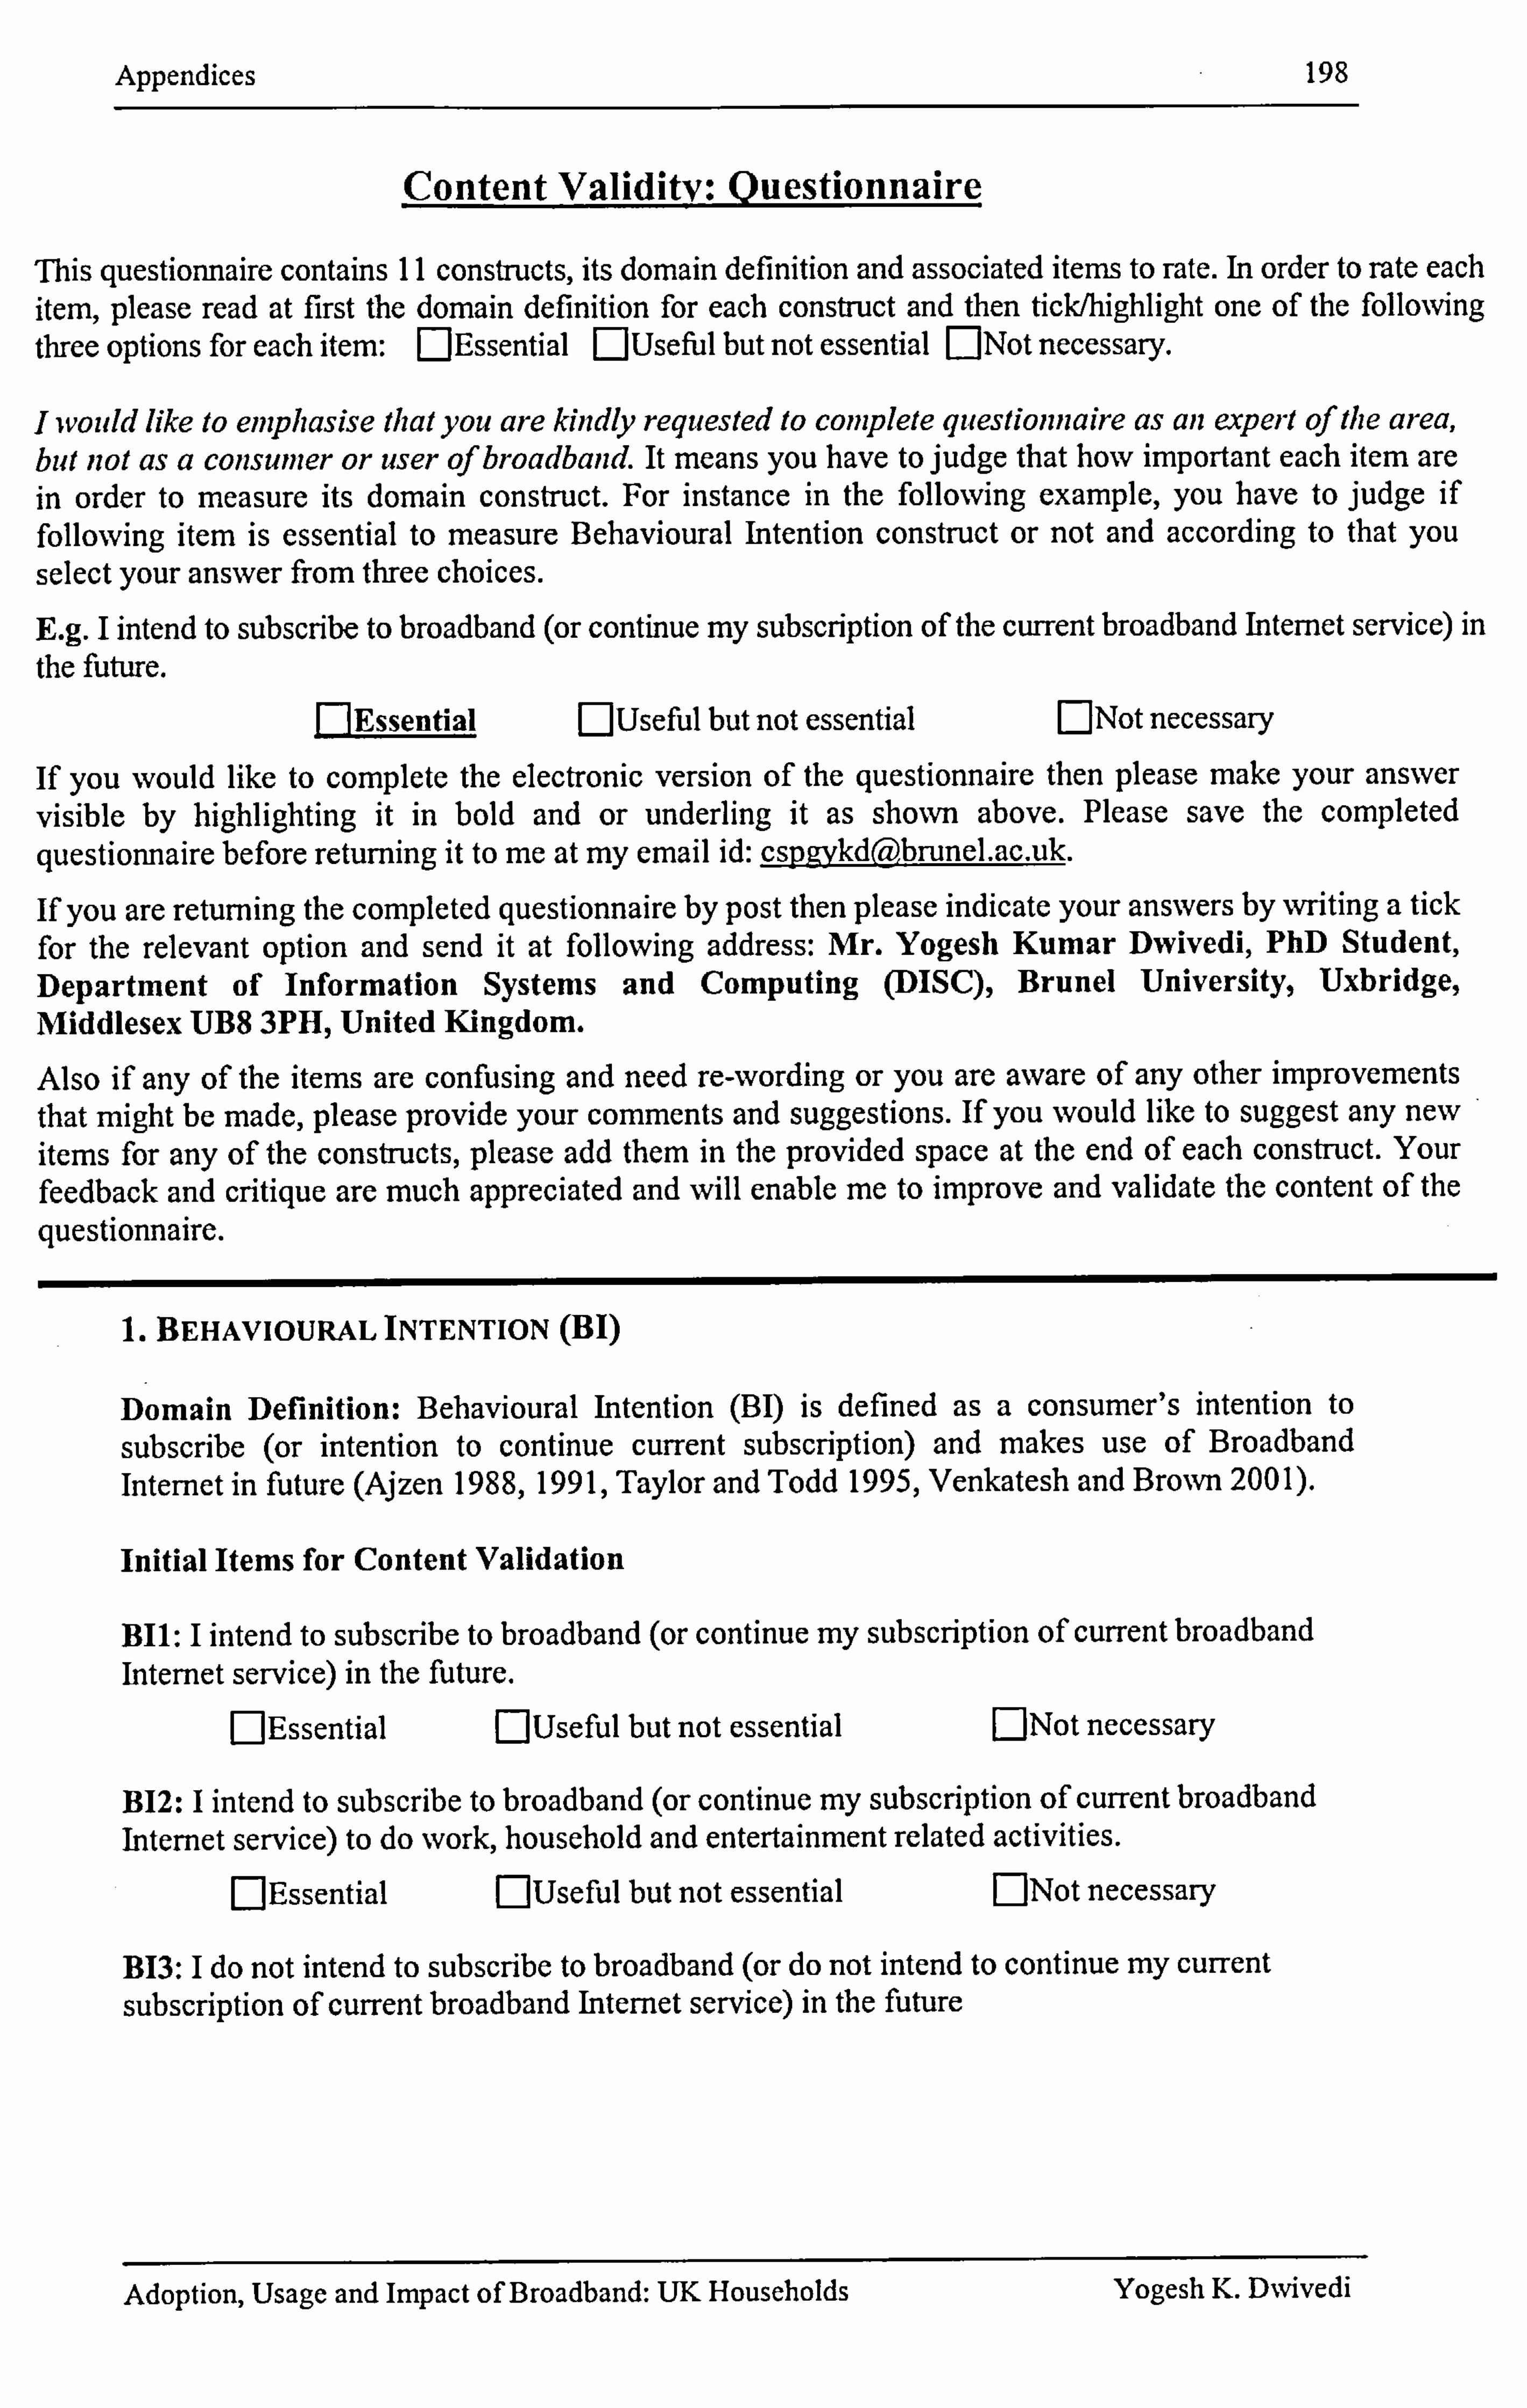
Appendices 198
Content Validitv: Ouestionnaire
This questionnaire contains II constructs, its domain definition and associated items to rate. In order to rate each item, please read at first the domain definition for each construct and then tick/highlight one of the following three options for each item: EjEssential ElUseftil but not essential []Not necessary.
I would like to eniphasise that you are kindly requested to coniplete questionnaire as an expert of the area, but not as a consunier or user of broadband. It means you have to judge that how important each item are in order to measure its domain construct. For instance in the following example, you have to judge if following item is essential to measure Behavioural Intention construct or not and according to that you select your answer from three choices. E. g. I intend to subscribe to broadband (or continue my subscription of the current broadband Internet service) in the future.
FIEssential E]Usefial but not essential E]Not necessary
If you would like to complete the electronic version of the questionnaire then please make your answer visible by highlighting it in bold and or underling it as shown above. Please save the completed questionnaire before returning it to me at my email id: cspgykd(a), brunel. ac. uk.
If you are returning the completed questionnaire by post then please indicate your answers by writing a tick for the relevant option and send it at following address: Mr. Yogesh Kumar Dwivedi, PhD Student, Department of Information Systems and Computing (DISC), Brunei University, Uxbridge, Middlesex UB8 3PH, United Kingdom.
Also if any of the items are confusing and need re-wording or you are aware of any other improvements that might be made, please provide your comments and suggestions. If you would like to suggest any new items for any of the constructs, please add them in the provided space at the end of each construct. Your feedback and critique are much appreciated and will enable me to improve and validate the content of the questionnaire.
1. BEHAVIOURAL INTENTION (BI)
Domain Definition: Behavioural Intention (BI) is defined as a consumer's intention to subscribe (or intention to continue current subscription) and makes use of Broadband Internet in future (Ajzen 1988,1991, Taylor and Todd 1995, Venkatesh and Brown 2001).
Initial Items for Content Validation
Bll: I intend to subscribe to broadband (or continue my subscription of current broadband Internet service) in the future.
FIEssential EJUseful but not essential [: ]Not necessary
B12: I intend to subscribe to broadband (or continue my subscription of current broadband Internet service) to do work, household and entertainment related activities.
FlEssential ElUseful but not essential EINot necessary
B13: I do not intend to subscribe to broadband (or do not intend to continue my current subscription of current broadband Internet service) in the future
Adoption, Usage and Impact of Broadband: UK Households Yogesh K. D%vivedi
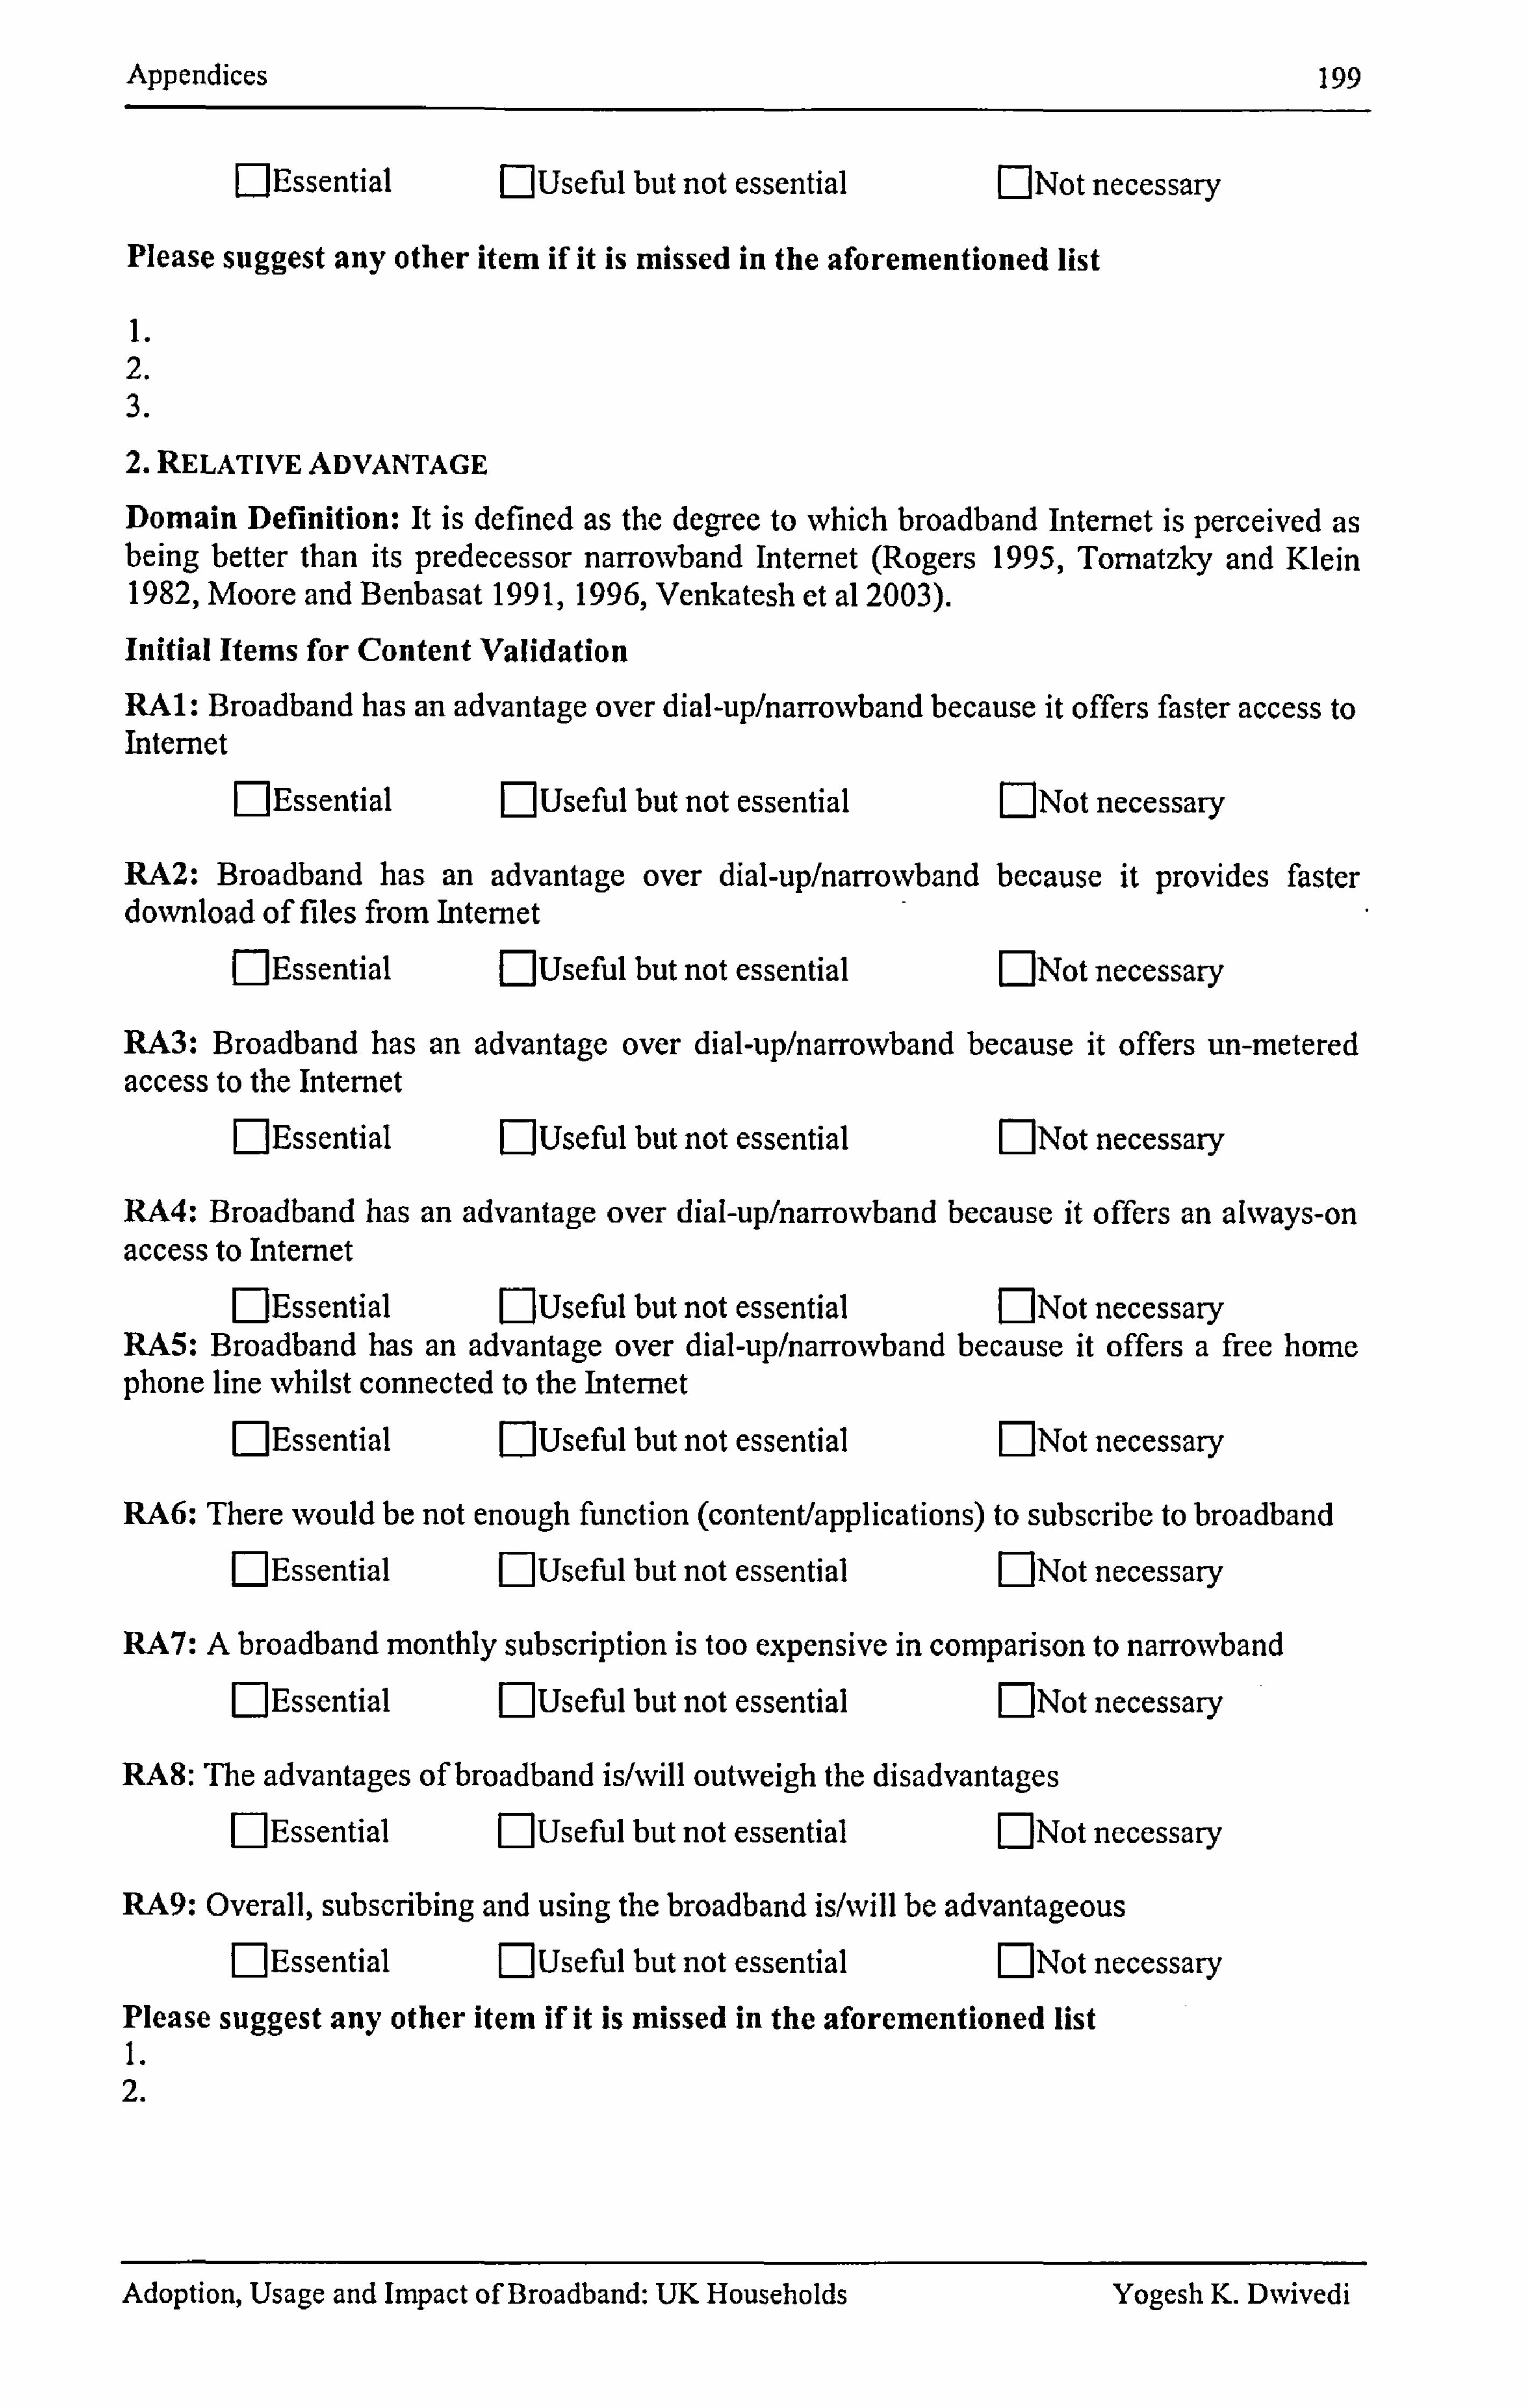
Appendices
FlEssential ElUseful. but not essential FINot necessary
Please suggest any other item if it is missed in the aforementioned list
1. 2. 3. 2. RELATIVE ADVANTAGE
199
Domain Definition: It is defined as the degree to which broadband Internet is perceived as being better than its predecessor narrowband Internet (Rogers 1995, Torriatzky and Klein 1982, Moore and Benbasat 1991,1996, Venkatesh et al 2003).
Initial Items for Content Validation
RAl: Broadband has an advantage over dial-up/narrowband because it offers faster access to Internet
FlEssential EjUseful but not essential [: ]Not necessary
RA2: Broadband has an advantage over dial-up/narrowband because it provides faster download of files from Internet
FIEssential E]Useful but not essential [: ]Not necessary
RA3: Broadband has an advantage over dial-up/narroNvband because it offers un-metered access to the Internet
FIEssential [: ]Useful but not essential [: ]Not necessary
RA4: Broadband has an advantage over dial-up/narrowband because it offers an always-on access to Internet
nEssential nUseful but not essential EjNot necessary RA5: Broadband has an advantage over dial-up/narrowband because it offers a free home phone line Nvhilst connected to the Internet
DEssential FjUseful but not essential EINot necessary
RA6: There would be not enough function (content/applications) to subscribe to broadband FIEssential FlUseful but not essential [: ]Not necessary
RA7: A broadband monthly subscription is too expensive in comparison to narrowband FIEssential FlUseful but not essential EjNot necessary
RA8: The advantages of broadband is/will outweigh the disadvantages FIEssential E]Usefal but not essential EINot necessary
RA9: Overall, subscribing and using the broadband is/%vill be advantageous FIEssential FlUseful but not essential EjNot necessary
Please suggest any other item if it is missed in the aforementioned list I. 2.
Adoption, Usage and Impact of Broadband: UK Households Yogesh K. Dwivedi

Appendices 200
3. UTILITARIAN OUTCOMES
Domain definition: It is the extent to which using Broadband Internet enhances the effectiveness of household activities such as doing office work at home, children's homework, information or product search and purchase and home business (Venkatesh and Brown 2001, Brown and Venkatesh 2003).
Initial Items for Content Validation
U01: Broadband Internet can be useful to find educational/research materials at home FIEssential nUseful but not essential [DNot necessary
U02: Broadband Internet can be useful for distance learning and accessing library resources at home
REssential MUseful but not essential [: ]Not necessary
U03: Broadband Internet can be helpful to perform j ob-related tasks at home r-JEssential EjUseful but not essential E]Not necessary
U04: Broadband Internet can provide good a medium of-communication such as email, chat, web cam etc.
FýEssential DUsefial but not essential EjNot necessary
U05: Broadband Internet can help in performing personal and household activities such as online shopping and information search
MEssential MUseful but not essential E: ]Not necessary
U06: Broadband Internet can be helpful to establish and operate a home business
REssential EjUseful but not essential E]Not necessary
U07: Broadband Internet can help children to do their homework [-]Essential [: ]Useful but not essential E]Not necessary
UOS: Broadband can enable to finish Internet related work more quickly FIEssential. [: ]Useful but not essential FlNot necessary
U09: Broadband Internet cannot improve work perfon-nance amongst bousebold members FIEssential FjUseful but not essential E]Not necessary
UOIO: Broadband Internet generally increases the productivity of household members FlEssential FlUseful but not essential [DNot necessary
UO 11: Broadband Internet cannot enhance the effectiveness of household members f-JEssential FlUseful but not essential EjNot necessary
UO 12: Broadband Internet makes household work easier MEssential EjUseful but not essential [: ]Not necessary
U013: Broadband Internet is not useful to an individual's household work FýEssential E]Useful but not essential E]Not necessary
Adoption, Usage and Impact of Broadband: UK Households Yogesh K. Dwivedi
Appendices 201
U014: Subscribing to and using broadband is compatible with most aspects of my everyday life
ElEssential, EJUseful but not essential EINot necessary
U015: Overall broadband Internet is useful to me and other members in the family. FjEsscntial FjUseful but not essential [: ]Not necessary
Please suggest any other item if it is missed in the aforementioned list I. 2. 3. 4. HEDONIC OUTCOMES
Domain definition: hedonic outcomes are defined as the pleasure derived from the consumption, or use of broadband Internet. For example, the entertainment potential of the Internet via offerings such as, online radio, streaming audio and video, electronic greetings, online games, online casino. Initial Items for Content Validation
H01: Broadband Internet can provide a good medium of entertainment such as listening and downloading of music and movies
FIEssential MUseful but not essential []Not necessary H02: Broadband Internet can provide a good medium of playing online games
FýEssential FýUseful but not essential [: ]Not necessary H03: Broadband Internet can provide a good medium for online casino
MEssential FlUseful but not essential EINot necessary H04: Broadband Internet can provide a good medium for sending and receiving electronic greetings and to participate in virtual groups.
FlEssential FýUseful but not essential [: ]Not necessary Please suggest any other item if it is missed in the aforementioned list I. 2. 3.
5. SERVICE QUALITY
Domain Definition: Service quality can be defined as the perceived quality of service consumer obtained or are obtaining from their current Internet service providers in terms of speed of connection and security problem with Internet connections, virus and popup problems with connection and customer support obtained from the ISP providers. Initial Items for Content Validation
SQ1: I am satisfied with the speed of Internet access (narrowband or broadband) obtained from my current service providers
FIEssential nUseful but not essential F]Not necessary
SQ2: I am not satisfied with the speed of Internet access (narrowband or broadband) from my current service providers
FIEssential FlUseful but not essential E]Not necessary
Adoption, Usage and Impact of Broadband: UK Households Yogesh K. D%vivedi
Appendices 202
SQ3: I am satisfied with the security measures provided with Internet access (narrowband or broadband) obtained from my current service providers
FIEssential. FlUseful but not essential EjNot necessary
SQ4: I am not satisfied with the security measures provided with Internet access (narrowband or broadband) obtained from my current service providers
FIEssential FlUseful, but not essential [: ]Not necessary
SQ5: I get too many popups with my current Internet access (narrowband or broadband) nEssential FlUseful. but not essential []Not necessary
SQ6: My current Internet connection (narrowband or broadband) is free from the problem of too many popups
FIEssential MUseful but not essential nNot necessary
SQ7: I frequently face virus attack problems associated with the current Internet access (narrowband or broadband)
FlEssential FýUseful but not essential []Not necessary
SQ8: I do not face virus attack problems associated with my current Internet access (narrowband or broadband)
ElEssential nUseful but not essential [: ]Not necessary
SQ9: I obtained satisfactory customer/technical support from my current service providers whenever I needed it
FlEssential FýUseful but not essential []Not necessary
SQ10: Customer/technical support from my current service providers is not satisfactory. REssential RUseful but not essential E]Not necessary
SQI 1: Overall service quality of my current Internet connection is good and I will continue using it
FlEssential FýUseful but not essential [: ]Not necessary
SQ12: Overall service quality of my current Internet connection is not satisfactory and I will discontinue it and will not subscribe to any other providers in the near future.
FlEssential nUseful but not essential [: ]Not necessary
SQ13: Overall service quality of my current Internet connection is not satisfactory and I will discontinue it but will subscribe to other providers in the near future.
FIEssential nUseful but not essential [: ]Not necessary
Please suggest any other item if it is missed in the aforementioned list 1. 2. 3.
Adoption, Usage and Impact of Broadband: UK Households Yogesh K. Dwivedi
Appendices 203
6. PRIMARY INFLUENCES (INFLUENCES FROM FRIENDS AND FAMILY)
Domain definition: Primary influences are defined as the perceived influences from friends and family to subscribe to and use (or not to subscribe and use) broadband Internet services (Venkatesh and Brown 2001, Brown and Venkatesh 2003).
Initial Items for Content Validation
P11: My friends would think that I should subscribe to and use (or continue current subscription) broadband at home
FIEssential nUseful but not essential [: ]Not necessary
P12: My collogues will think that I should subscribe to and use (or continue current subscription) broadband
DEssential nUseful but not essential ONot necessary
P13: My family members (i. e. spouse, kids) think that I should subscribe (or continue current subscription) to broadband
FIEssential FlUseful but not essential EINot necessary
P14: My relatives think that I should subscribe (or continue current subscription) to broadband
MEssential nUseful but not essential []Not necessary
Please suggest any other item if it is missed in the aforementioned list
I. 2. 3. 7. SECONDARY INFLUENCES (MEDIA INFLUENCES)
Domain definition: Secondary influences are defined as the perceived influence of information from secondary sources such as advert and news on TV, newspaper etc. to subscribe and use (or not to subscribe and use) broadband Internet services (Venkatesh and Brown 2001, Brown and Venkatesh 2003).
Initial Items for Content Validation
Sll: TV and radio adverts influence me in my decisions of subscribing to broadband
FlEssential RUseful but not essential []Not necessary
S12: TV and radio adverts influence me when I subscribe to broadband FýEssential [: ]Useful but not essential []Not necessary
S13: Newspaper adverts influence me when subscribing to broadband
FlEssential FýUseful but not essential FjNot necessary
S14: Newspaper adverts influence me not when subscribing to broadband nEssential nUseful but not essential []Not necessary
Please suggest any other item if it is missed in the aforementioned list
I. 2.
Adoption, Usage and Impact of Broadband: UK Households Yogesh K. DNvivedi
Appendices 204
8. REQUISITE KNOWLEDGE
Domain definition: Requisite knowledge is defined as the perceived level of knowledge about broadband Internet, its risks and benefits (Rogers, 1995, Venkatesh and Brown 200 1). Initial Items for Content Validation
RK1: I have difficulty in explaining why adopting broadband Internet may be beneficial FlEssential nUseful but not essential [: ]Not necessary
RK2: I could communicate to others the pros and cons of adopting broadband nEssential EJUseful but not essential EINot necessary
RK3: I have no difficulty in telling others about the results of adopting and using broadband MEssential FlUseful but not essential MNot necessary
RK4: I have difficulty in telling, %vhether it is good or bad to adopt broadband Internet nEssential MUseful but not essential [: ]Not necessary
RK5: I do not know how broadband Internet is different from narrowband Internet MEssential MUseful but not essential [: ]Not necessary
RK6: I do not know the benefits that broadband offer and cannot be obtained by narrowband MEssential FlUseful but not essential [: ]Not necessary
Please suggest any other item if it is missed in the aforementioned list 1. 2. 3.
9. SELF EFFICACY (Skills of using PC and Internet)
Domain definition: Self-efficacy defined as the perceived ability or skill to operate computer and Internet (narrowband or broadband) without help of others (Taylor and Todd, 1995).
Initial Items for Content Validation
SEI: I would feel comfortable using the computer and Internet on my own nEssential E]Usefal but not essential [: ]Not necessary
SE2: I would be able to use the computer and Internet even if there was no one around to show me how to use it.
MEssential E]Useful but not essential EINot necessary
SE3: Learning to operate the PC and Internet is easy for me EJEssential DUsefal but not essential [: ]Not necessary
SE4: I clearly understand how to use the PC and Internet []Essential FjUseful but not essential []Not necessary
SE5: I find the computer and Internet inflexible to interact with ElEssential MUseful but not essential E]Not necessary
Adoption, Usage and Impact of Broadband: UK Households Yogesh K. DNvivedi
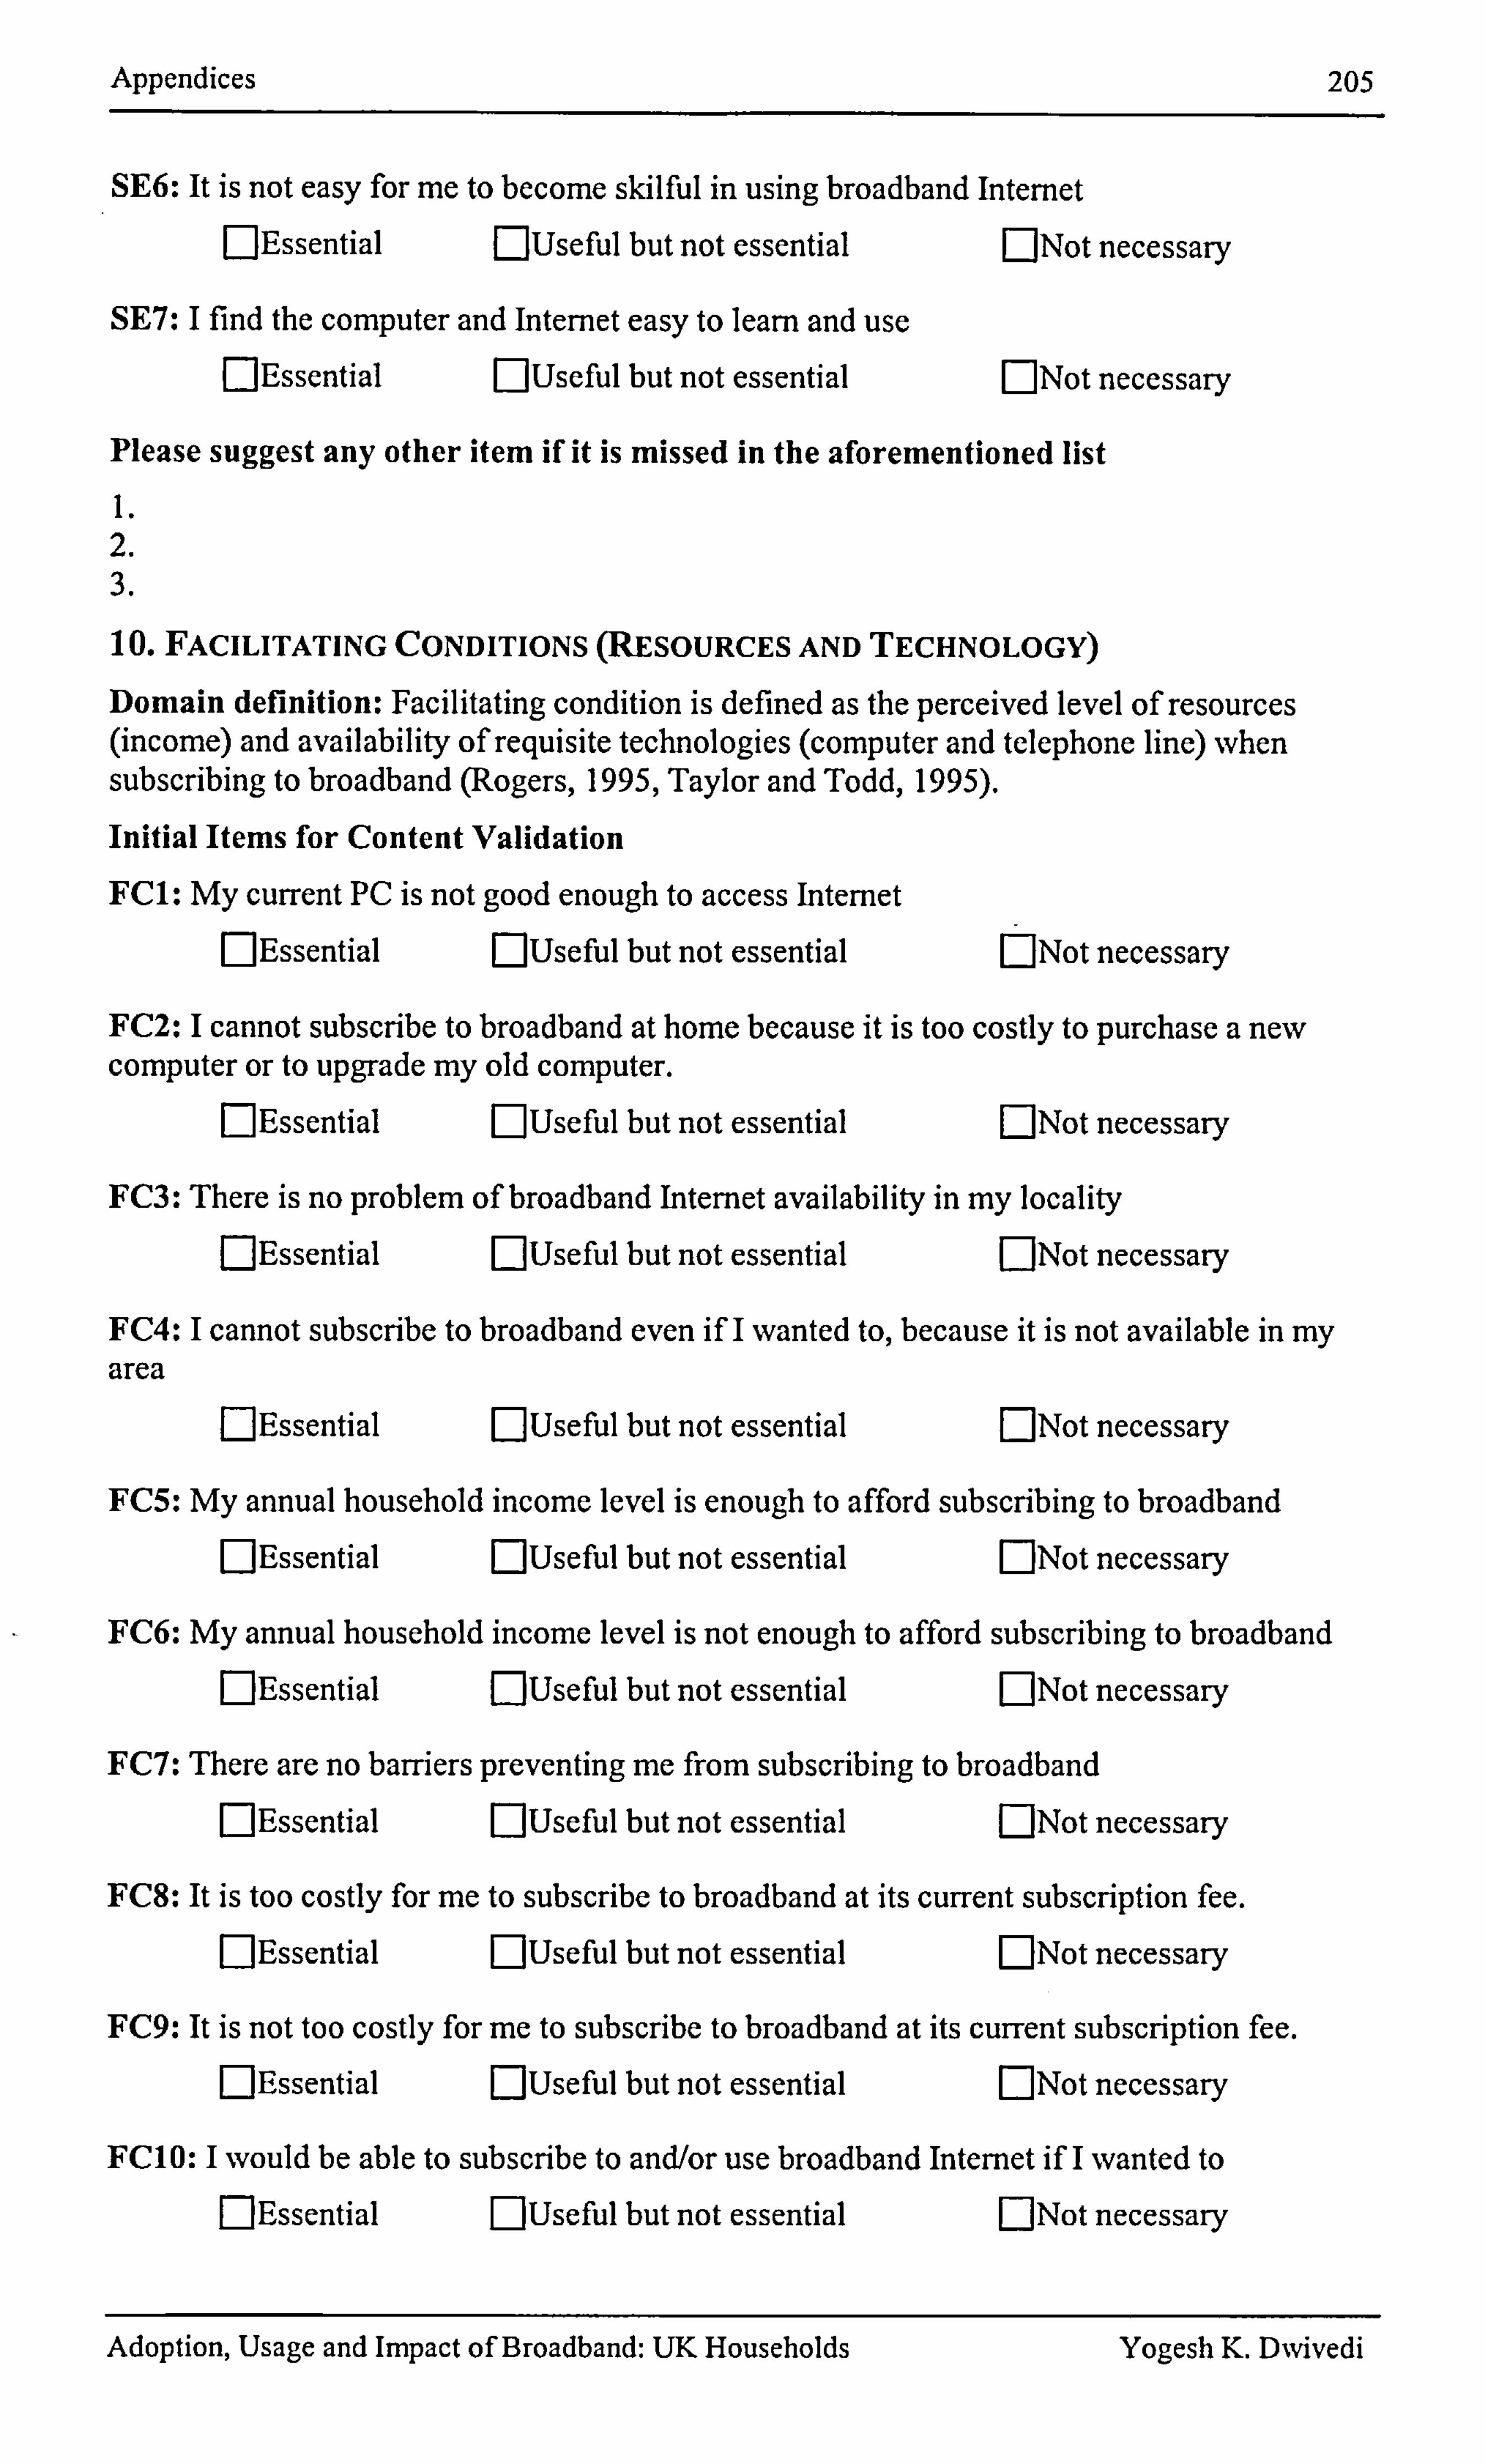
Appendices
SE6: It is not easy for me to become skilful in using broadband Internet FýEssential MUseful but not essential [: ]Not necessary
SE7: I find the computer and Internet easy to learn and use nEssential FlUseful but not essential [: ]Not necessary
Please suggest any other item if it is missed in the aforementioned list I. 2. 3.
10. FACILITATING CONDITIONS (RESOURCES AND TECHNOLOGY)
Domain definition: Facilitating condition is defined as the perceived level of resources (income) and availability of requisite technologies (computer and telephone line) when subscribing to broadband (Rogers, 1995, Taylor and Todd, 1995).
Initial Items for Content Validation
FC1: My current PC is not good enough to access Internet FIEssential FlUseful but not essential [: ]Not necessary
FC2: I cannot subscribe to broadband at home because it is too costly to purchase a new computer or to upgrade my old computer.
DEssential FlUseful but not essential EINot necessary
FC3: There is no problem of broadband Internet availability in my locality
FIEssential FlUseful but not essential FINot necessary
205
FC4: I cannot subscribe to broadband even if I wanted to, because it is not available in my area
nEssential FlUseful but not essential EjNot necessary
FC5: My annual household income level is enough to afford subscribing to broadband FlEssential EJUseful but not essential E]Not necessary
FC6: My annual household income level is not enough to afford subscribing to broadband nEssential nUseful but not essential E]Not necessary
FC7: There are no barriers preventing me from subscribing to broadband ElEssential FlUseful but not essential [: ]Not necessary
FC8: It is too costly for me to subscribe to broadband at its current subscription fee. FIEssential FlUseful but not essential [: ]Not necessary
FC9: It is not too costly for me to subscribe to broadband at its current subscription fee. DEssential FlUseful but not essential [: ]Not necessary
FC10: I would be able to subscribe to and/or use broadband Internet if I wanted to FýEssential FlUseful but not essential [: ]Not necessary
Adoption, Usage and Impact of Broadband: UK Households Yogesh K. DNvivedi
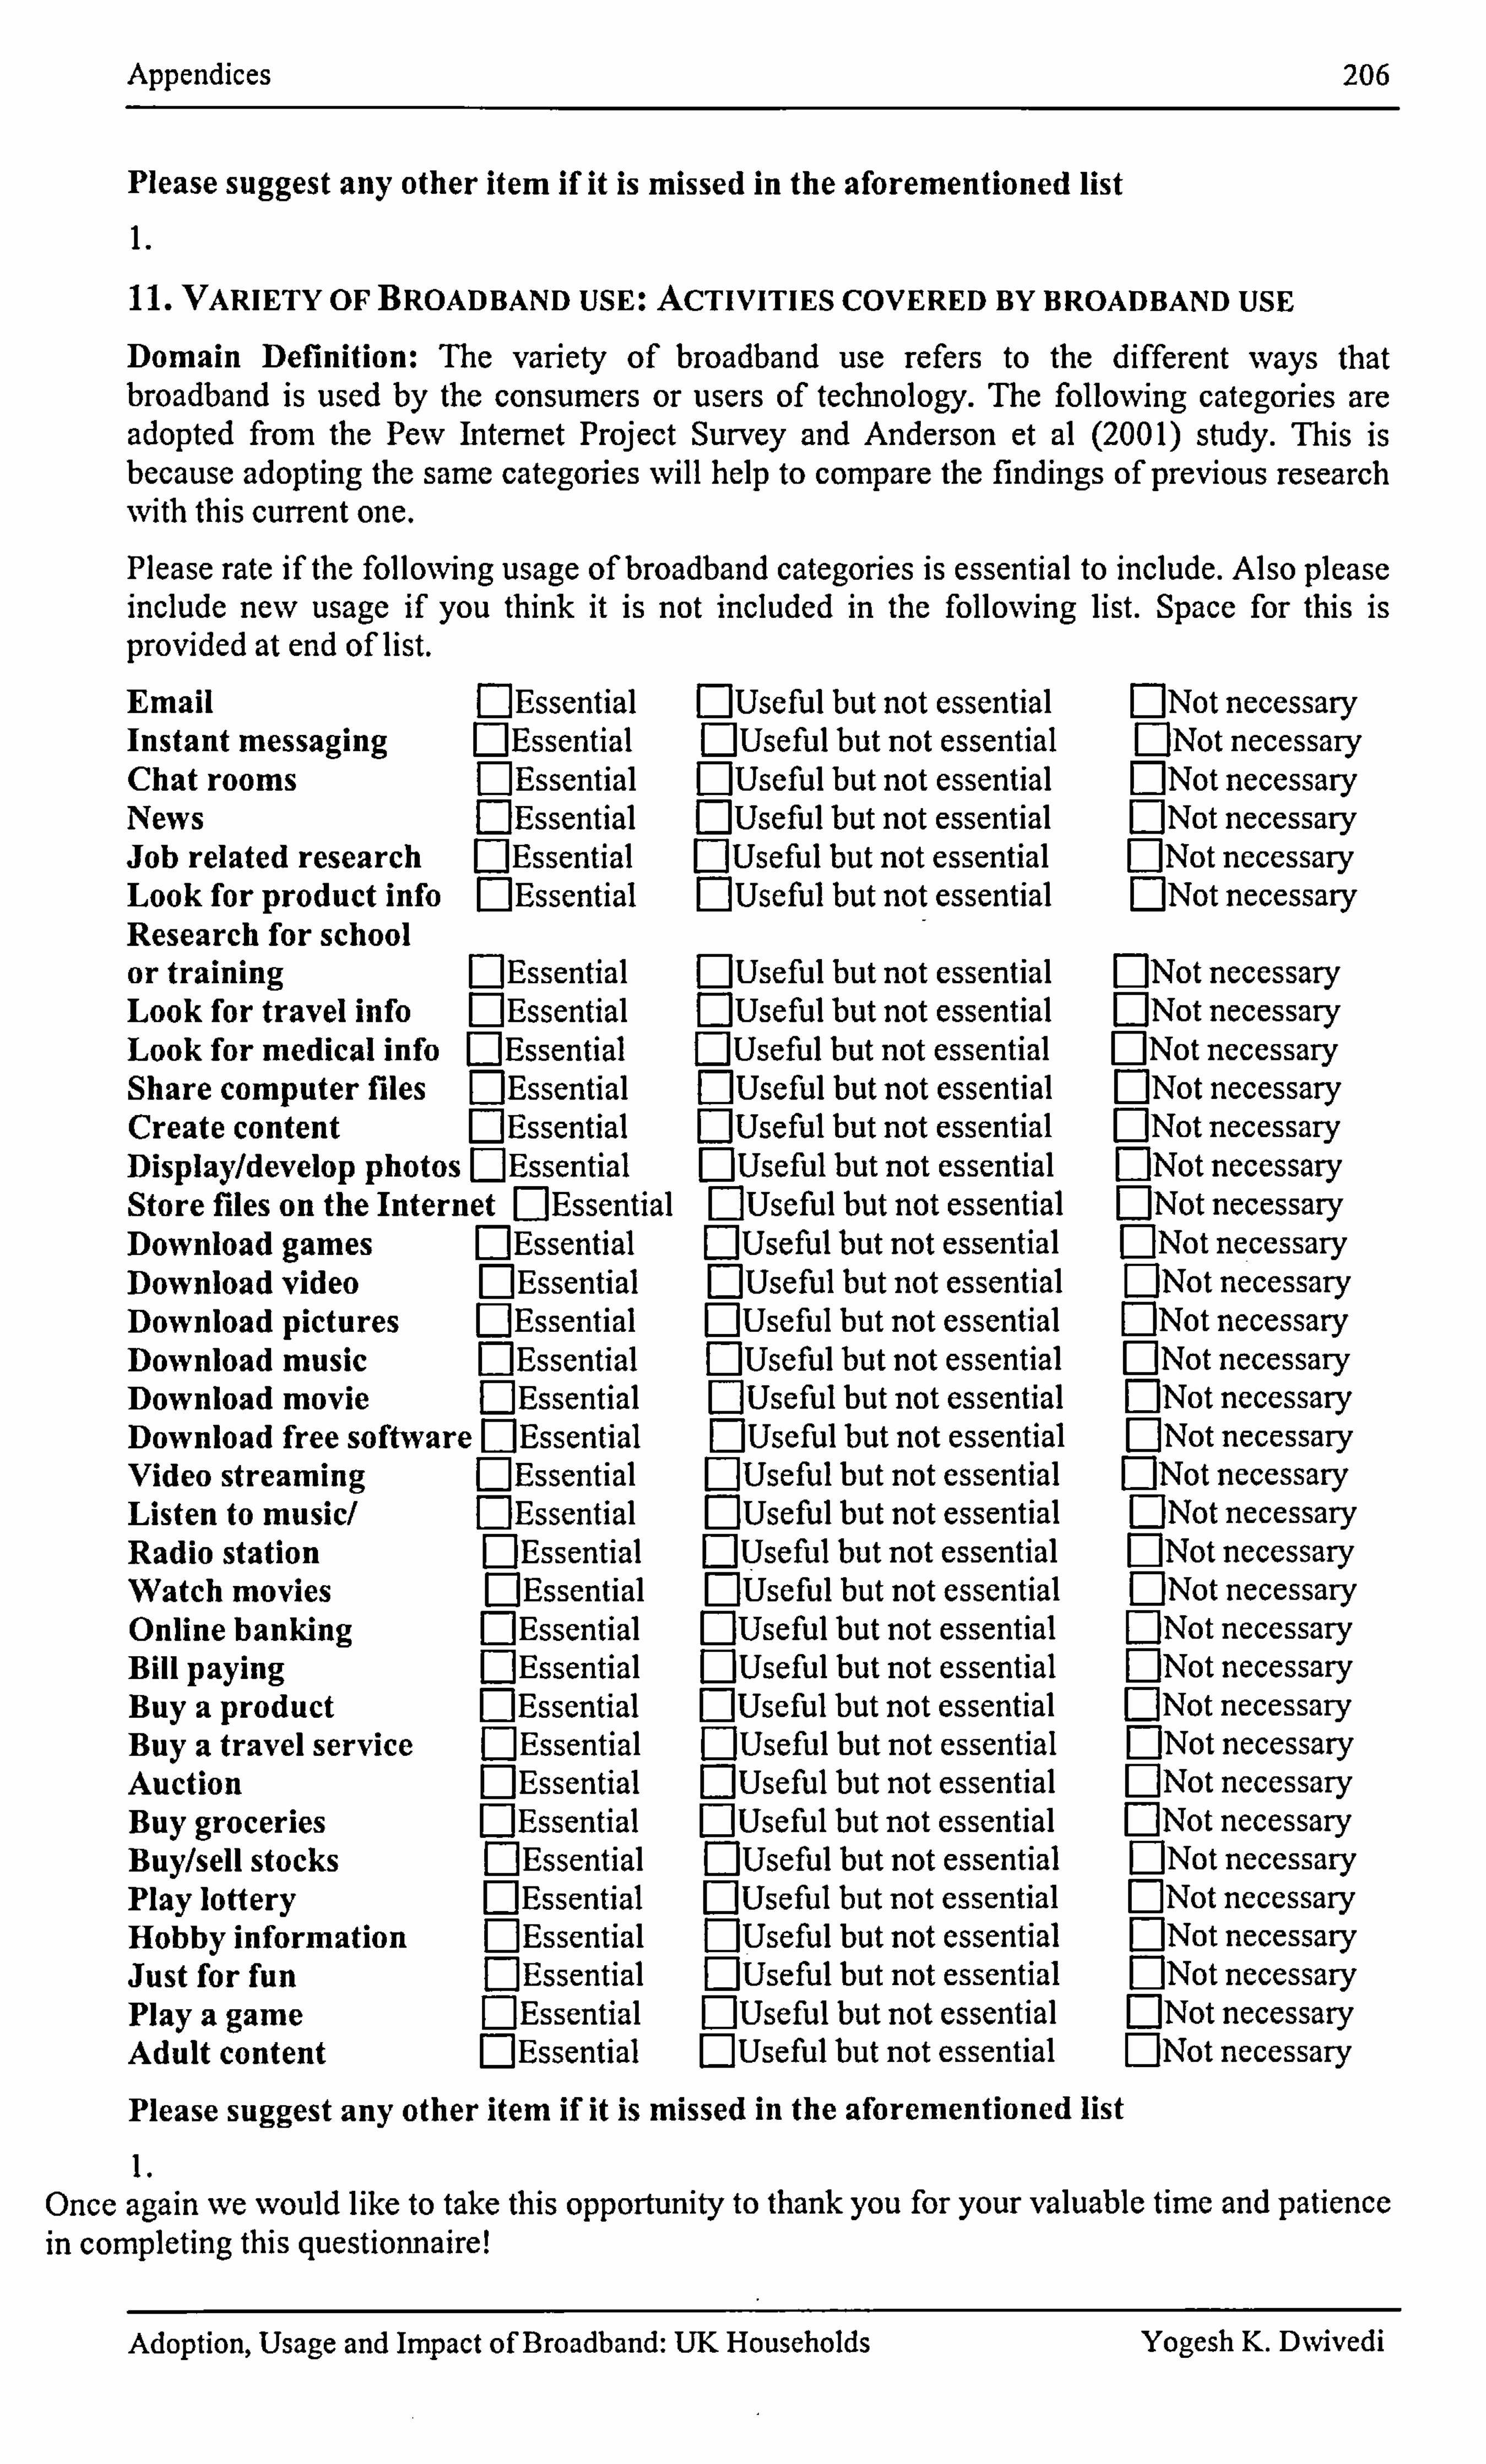
Appendices 206
Please suggest any other item if it is missed in the aforementioned list 1.
11. VARIETY OF BROADBAND USE: ACTIVITIES COVERED BY BROADBAND USE
Domain Definition: The variety of broadband use refers to the different ways that broadband is used by the consumers or users of technology. The following categories are adopted from the Pew Internet Project Survey and Anderson et al (2001) study. This is because adopting the same categories will help to compare the findings of previous research with this current one.
Please rate if the following usage of broadband categories is essential to include. Also please include new usage if you think it is not included in the following list. Space for this is provided at end of list.
Email ElEssential ElUseful but not essential [: ]Not necessary Instant messaging nEssential E]Useful but not essential [: ]Not necessary Chat rooms DEssential DUseful but not essential E]Not necessary News ElEssential EJUsefial but not essential E]Not necessary Job related research FlEssential [JUseful but not essential ONot necessary Look for product info DEssential EJUseful but not essential EjNot necessary Research for school or training [JEssential EJUseful but not essential E]Not necessary Look for travel info EjEssential [: ]Useful but not essential [: ]Not necessary Look for medical info [: ]Essential [: ]Useful but not essential ONot necessary Share computer files [: ]Essential ElUseful but not essential E]Not necessary Create content ElEssential EJUseful but not essential ONot necessary Display/develop photos [DEssential ElUseful but not essential EjNot necessary Store files on the Internet E]Essential E]Useful but not essential []Not necessary Download games ElEssential [: ]Useful but not essential E]Not necessary Download video ElEssential EJUseful but not essential E]Not necessary Download pictures E]Essential E]Usefal but not essential EjNot necessary Download music ElEssential E]Useful but not essential [: ]Not necessary Download movie EjEssential E]Useful but not essential EjNot necessary Download free software [: ]Essential ElUseful but not essential [: ]Not necessary Video streaming E]Essential E]Useful but not essential EjNot necessary Listen to music/ nEssential ElUseful but not essential [: ]Not necessary Radio station nEssential ElUseful but not essential E]Not necessary Watch movies DEssential ElUseful but not essential EjNot necessary Online banking ElEssential E]Usefal but not essential EjNot necessary Bill paying E]Essential FjUseful but not essential EjNot necessary Buy a product ElEssential ElUseful but not essential [: ]Not necessary Buy a travel service nEssential nUseful but not essential [: ]Not necessary Auction DEssential nUseful but not essential E]Not necessary Buy groceries FlEssential [JUseful but not essential EjNot necessary Buy/sell stocks ElEssential ElUseful but not essential ONot necessary Play lottery FlEssential. [: ]Useful but not essential E: ]Not necessary Hobby information DEssential E]Useful but not essential EjNot necessary Just for fun ElEssential OUseful but not essential [ý]Not necessary Play a game nEssential ElUseful but not essential [: ]Not necessary Adult content ElEssential E]Useful but not essential EjNot necessary Please suggest any other item if it is missed in the aforementioned list
1. Once again we would like to take this opportunity to thank you for your valuable time and patience in completing this questionnaire!
Adoption, Usage and Impact of Broadband: UK Households Yogesh K. DNvivedi
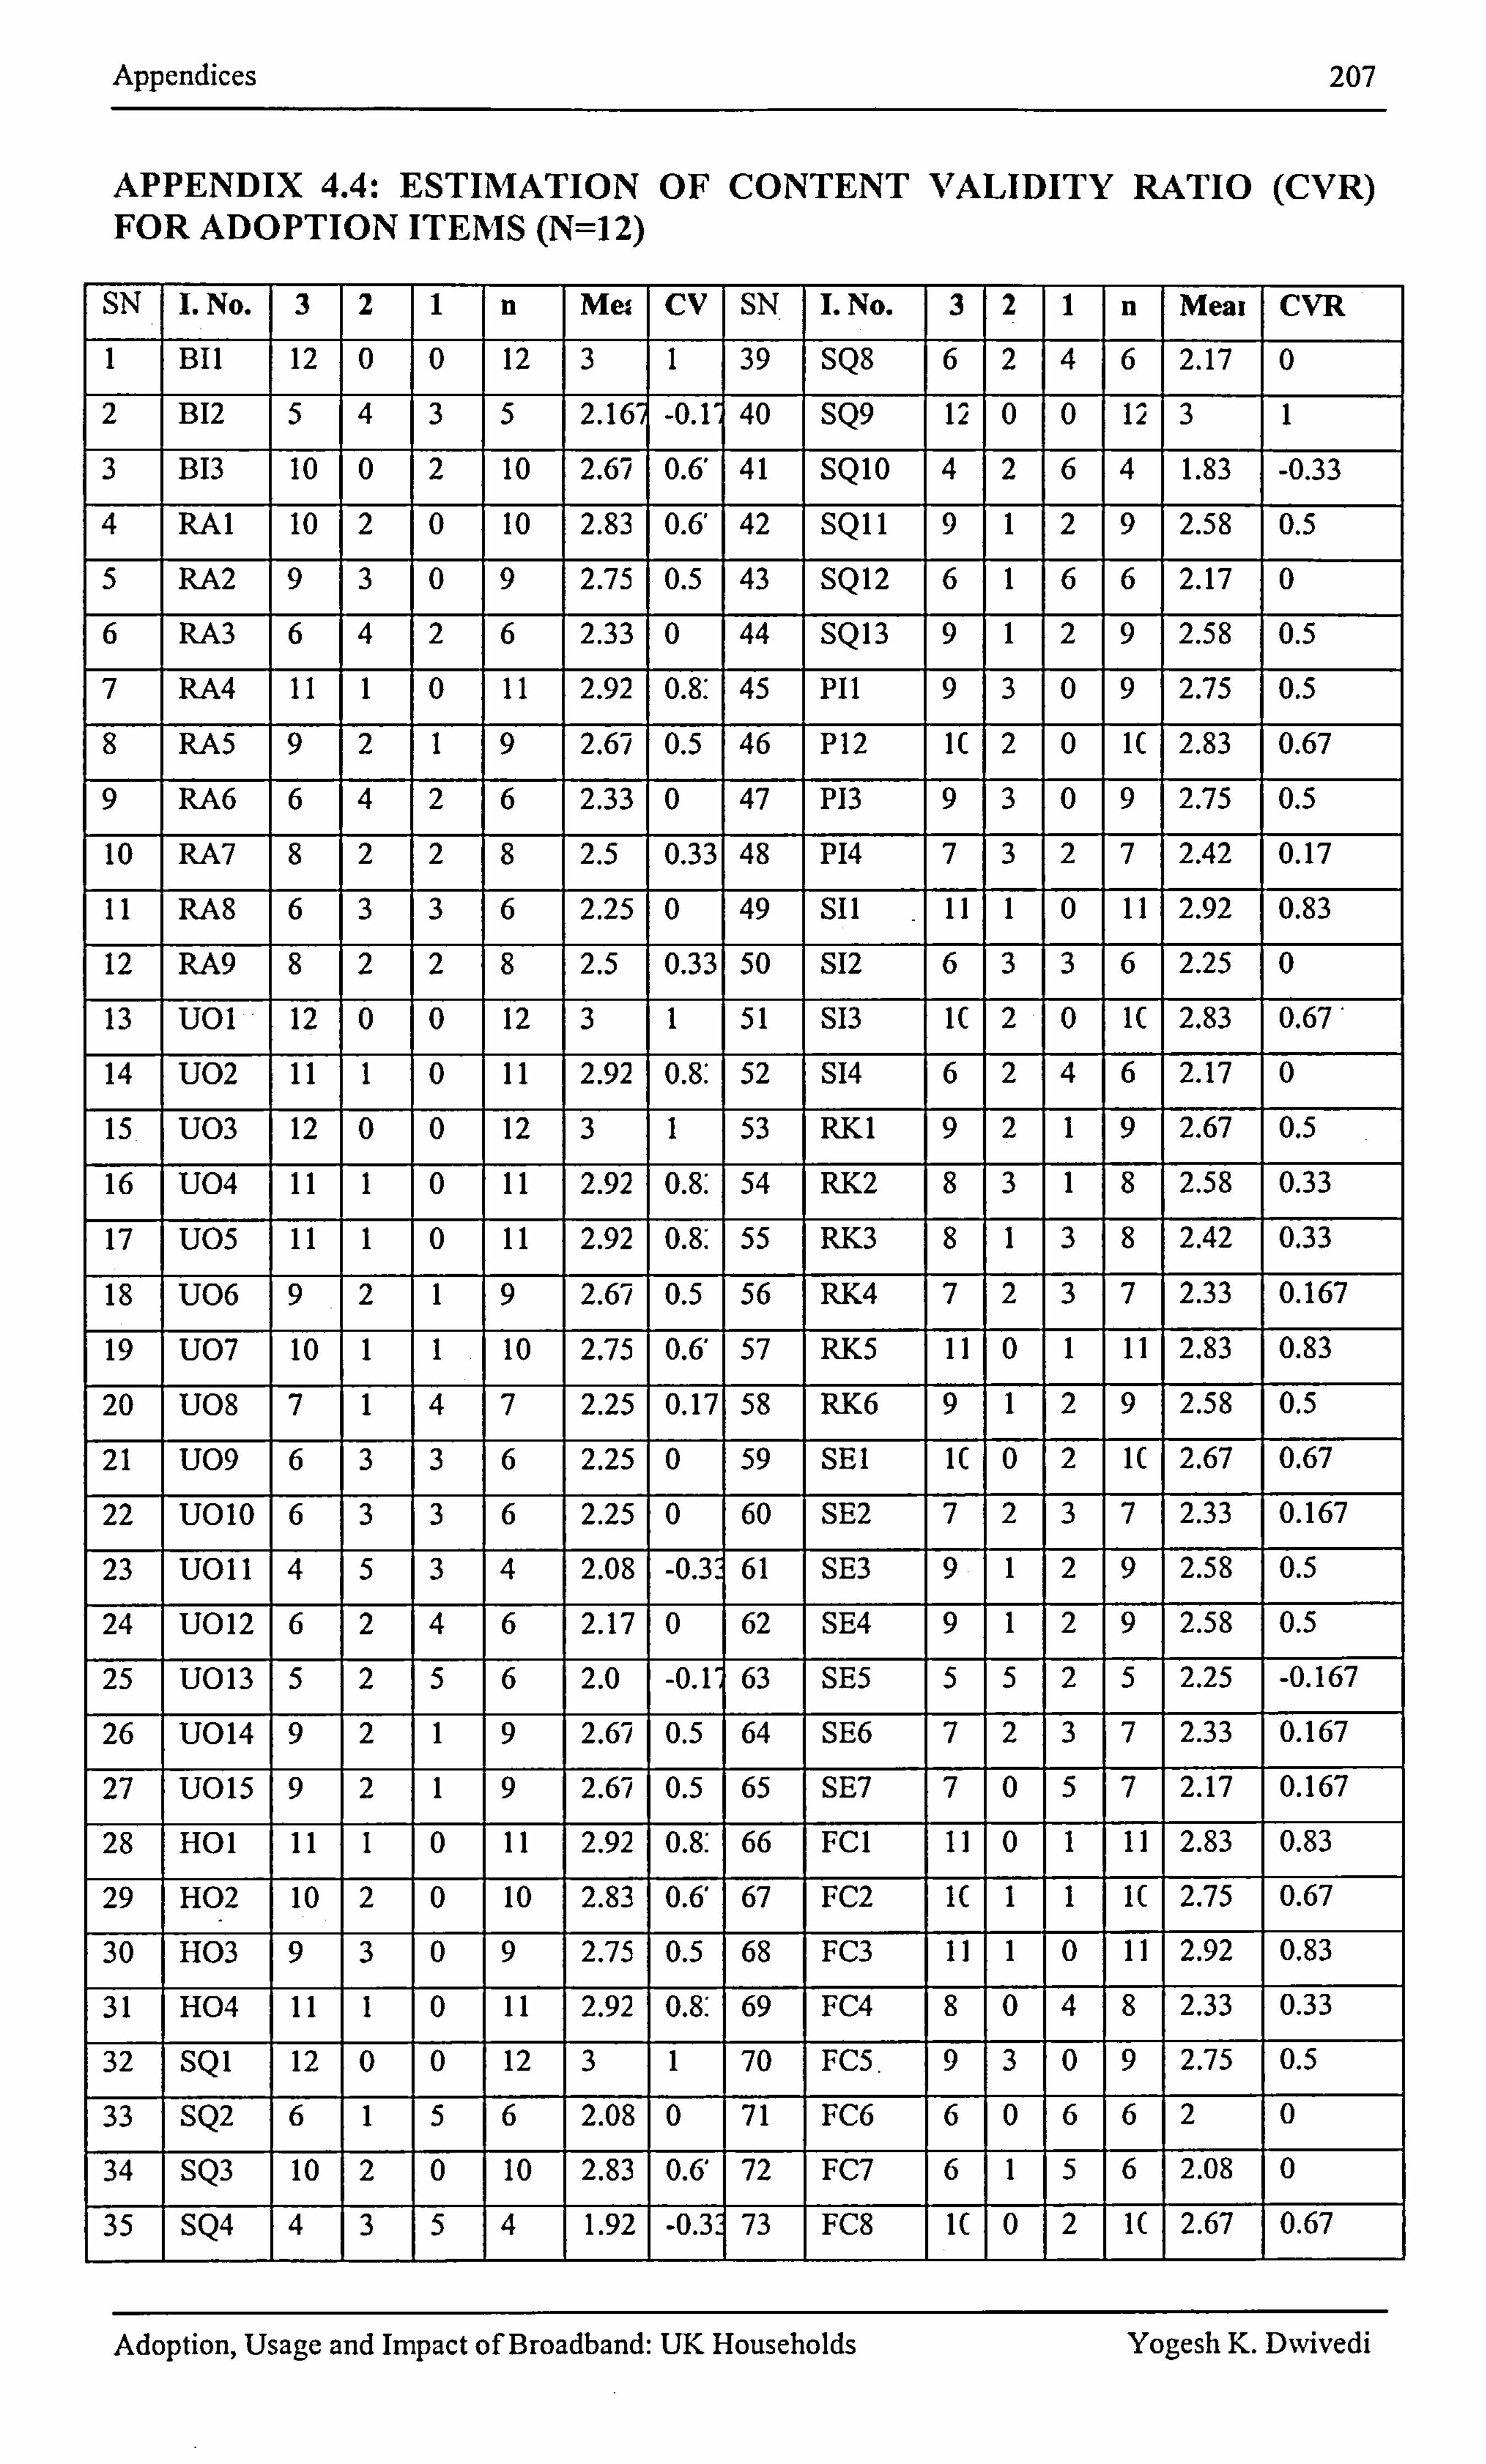
Appendices 207
APPENDIX 4.4: ESTIMATION OF CONTENT VALIDITY RATIO (CVR) FOR ADOPTION ITEMS (N=12)
SN 1. No. 3 2 1 n Mei CV SN 1. No. 3 2 1 n Meai CVR
I BII 12 0 0 12 3 1 39 SQ8 6 2 4 6 2.17 0
2 B12 5 4 3 5 2.16 -0.17, 40 SQ9 12 0 0 12 3 1
3 B13 10 0 2 10 2.677 0.6' 41 SQIO 4 2 6 4 1.83 -0.33 4 RAI 10 2 0 10 2.83 0.6' 42 SQII 9 1 2 9 2.58 0.5
5 RA2 9 3 0 9 2.75 0.5 43 SQ12 6 1 6 6 2.17 0
6 RA3 6 4 2 6 2.33 0 44 SQ13 9 1 2 9 2.58 0.5
7 RA4 11 1 0 11 2.92 0.8: 45 PH 9 3 0 9 2.75 0.5
8 RA5 9 2 1 9 2.67 0.5 46 P12 IC 2 0 1 2.83 0.67
9 RA6 6 4 2 6 2.33 0 47 P13 9 3 0 9 2.75 0.5
10 RA7 8 2 2 8 2.5 0.33 48 P14 7 3 2 7 2.42 0.17
11 RA8 6 3 3 6 2.25 0 49 SII II 1 0 11 2.92 0.83
12 RA9 8 2 2 8 2.5 0.33 50 S12 6 3 3 6 2.25 0
13 UOI 12 0 0 12 3 1 51 S13 I( 2 0 1( 2.83 0.67'
14 U02 II 1 0 11 2.92 0.8: 52 S14 6 2 4 6 2.17 0
15 U03 12 0 0 12 3 1 53 RKI 9 2 1 9 2.67 0.5
16 U04 II 1 0 11 2.92 0.8. ' 54 RK2 8 3 1 8 2.58 0.33
17 U05 II 1 0 11 2.92 0.8. ' 55 RK3 8 1 3 8 2.42 0.33
18 U06 9 2 1 9 2.67 0.5 56 RK4 7 2 3 7 2.33 0.167
19 U07 10 1 1 10 2.75 0.6' 57 RK5 I1 0 1 11 2.83 0.83
20 U08 7 1 4 7 2.25 0.17 58 RK6 9 1 2 9 2.58 0.5
21 U09 6 3 3 6 2.25 0 59 SEI I( 0 2 1( 2.67 0.67
22 U010 6 3 3 6 2.25 0 60 SE2 7 2 3 7 2.33 0.167
23 U011 4 5 3 4 2.08 -O. K 61 SE3 9 1 2 9 2.58 0.5
24 U012 6 2 4 6 2.17 0 62 SE4 9 1 2 9 2.58 0.5
25 U013 5 2 5 6 2.0 -0.1" 63 SE5 5 5 2 5 2.25 -0.167 26 U014 9 2 1 9 2.67 0.5 64 SE6 7 2 3 7 2.33 0.167
27 U015 9 2 1 9 2.67 0.5 65 SE7 7 0 5 7 2.17 0.167
28 HOI II 1 0 11 2.92 0.8' 66 FCI I1 0 1 11 2.83 0.83
29 H02 10 2 0 10 2.83 0.6' 67 FC2 I( I 1 1( 2.75 0.67
30 H03 9 3 0 9 2.75 0.5 68 FC3 II 1 0 11 2.92 0.83
31 H04 II 1 0 11 2.92 0.8' 69 FC4 8 0 4 8 2.33 0.33
32 SQI 12 0 0 12 3 1 70 FC5. 9 3 0 9 2.75 0.5
33 SQ2 6 1 5 6 2.08 0 71 FC6 6 0 6 6 2 0
34 SQ3 10 2 0 10 2.83 0.6' 72 FC7 6 1 5 6 2.08 0
35 SQ4 4 3 5 4 1.92 -0.1 73 FC8 I( 0 2 1( 2.67 0.67
Adoption, Usage and Impact of Broadband: UK Households Yogesh K. Dwivedi
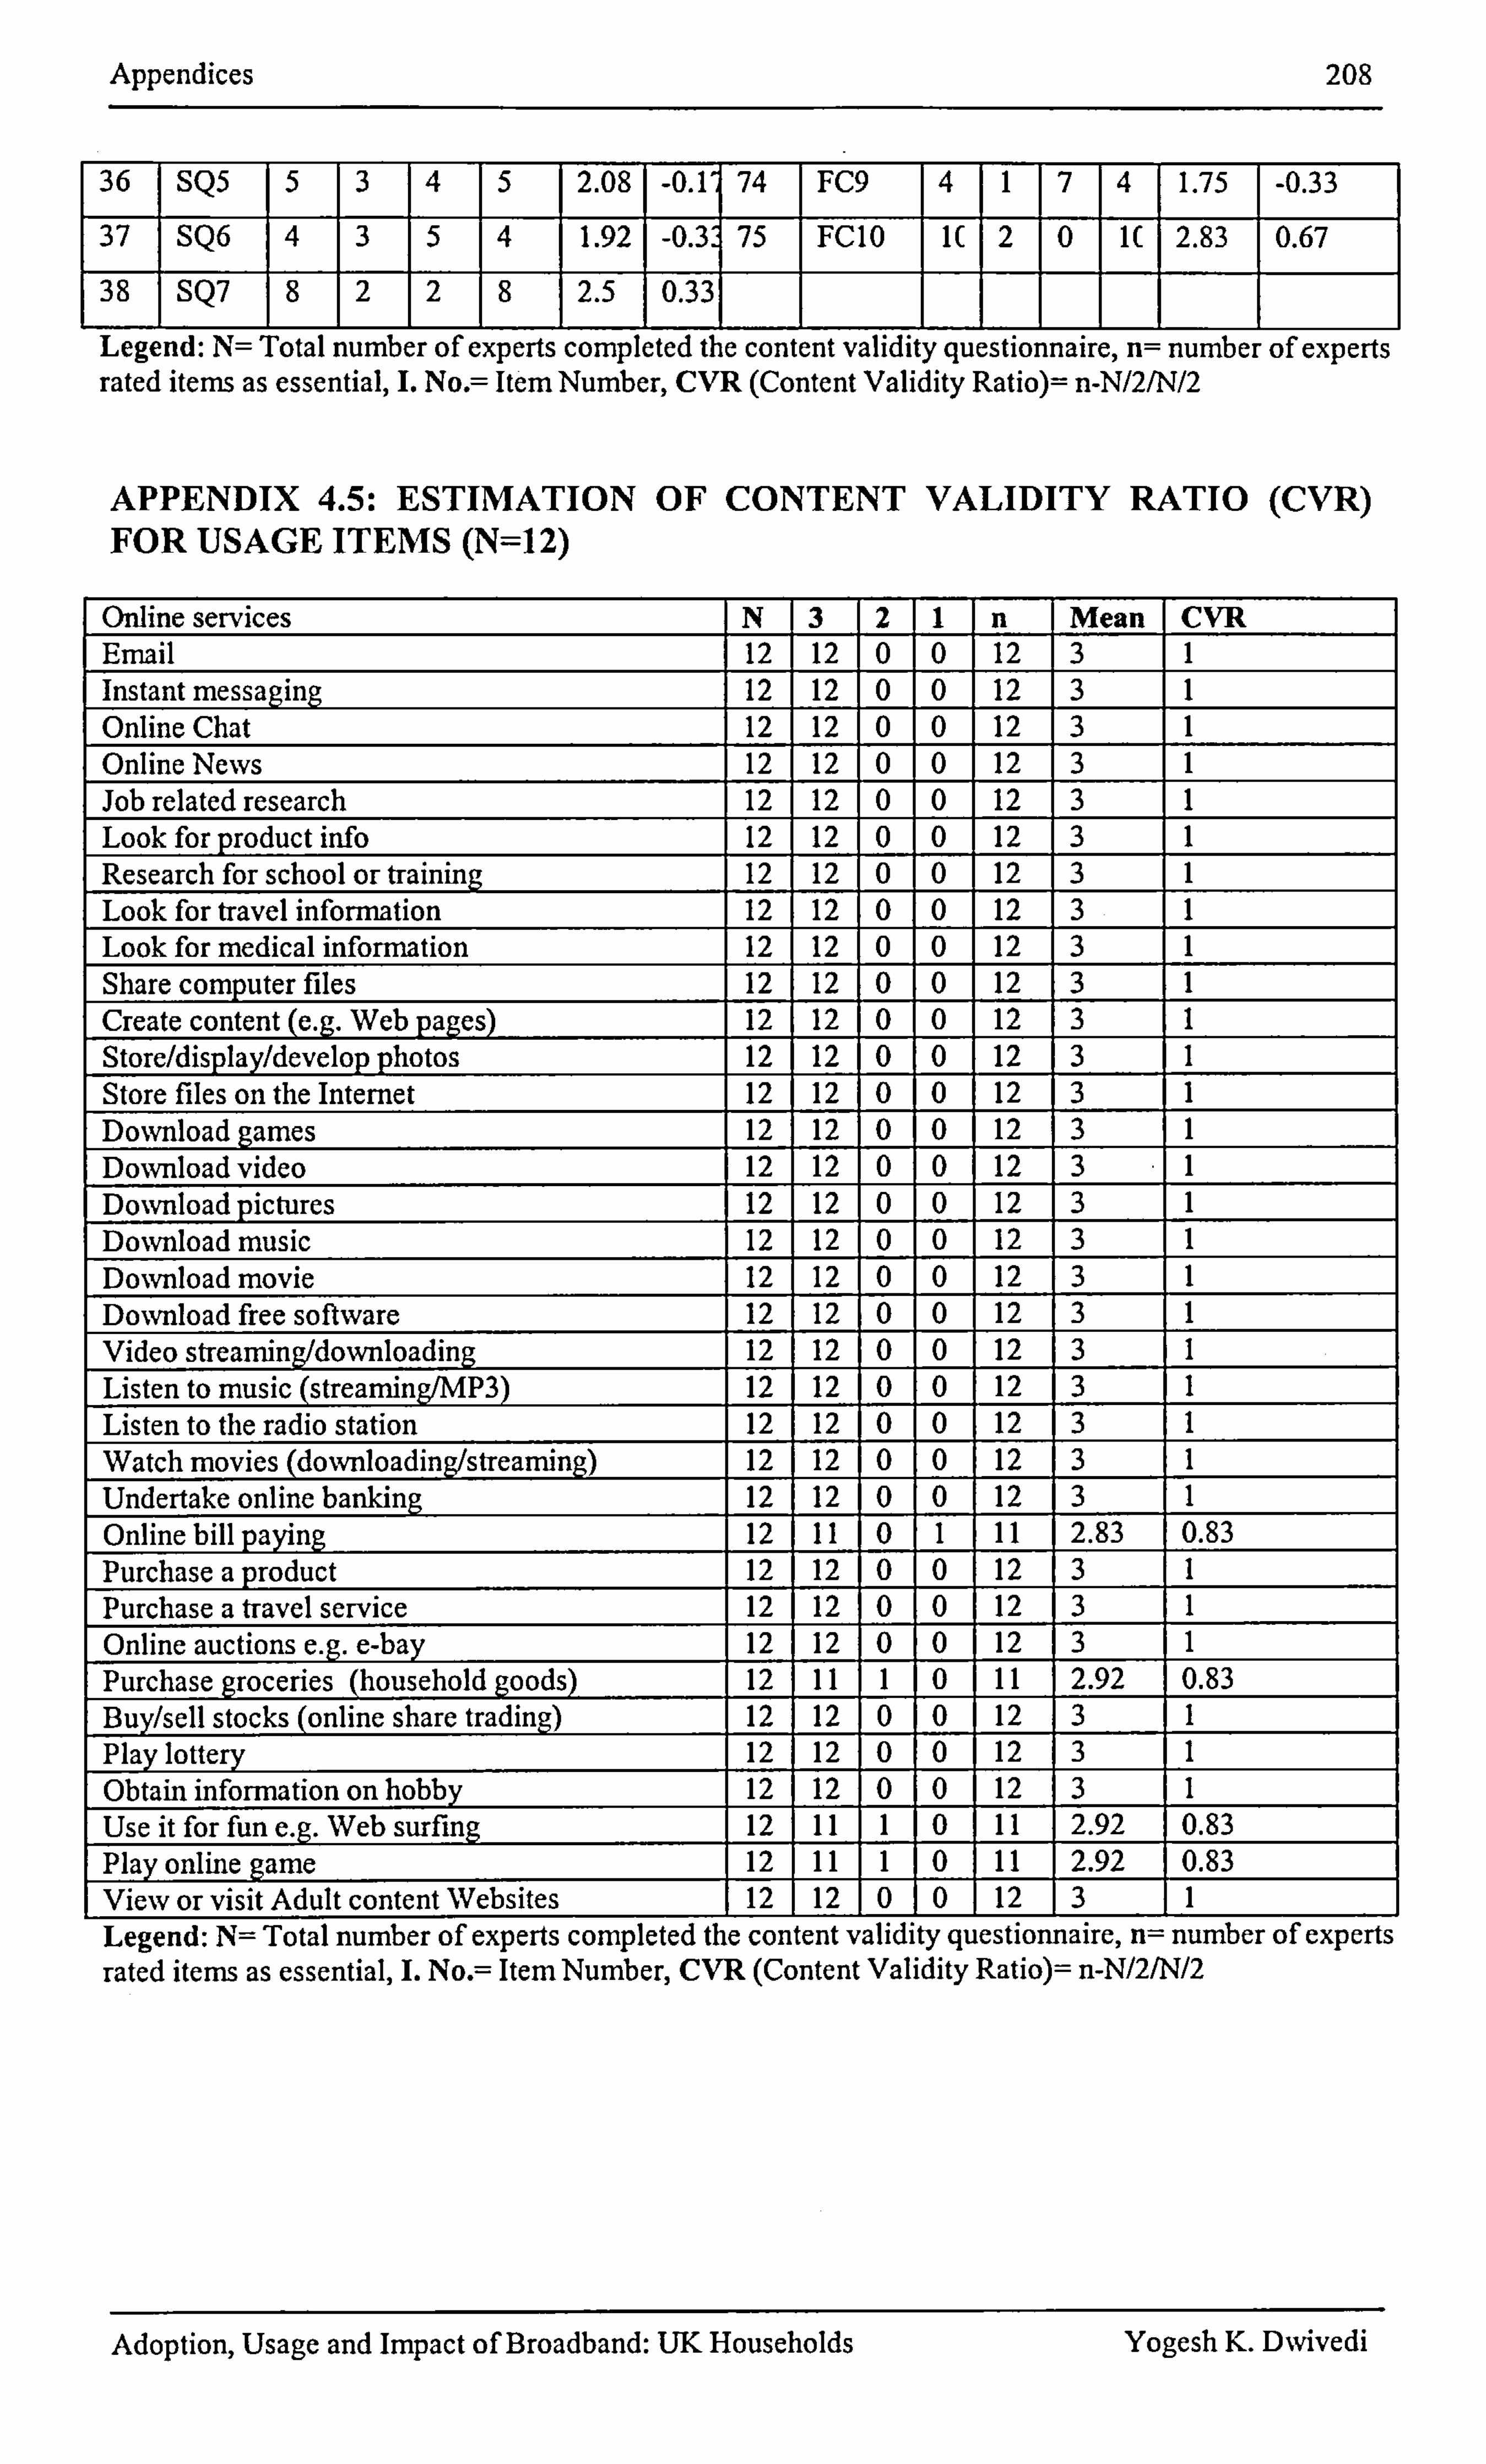
Appendices 208
36 SQ5 5 3 4 5 2.08 -0.1, 74 FC9 4 1 7 4 1.75 -0.33 37 SQ6 4 3 5 4 1.92 -0.3ý 75 FCIO R 2 0 1( 2.83 0.67
38 SQ7 8 2 2 8 2.5 0.33
Legend: N= Total number of experts completed the content validity questionnaire, n= number of experts rated items as essential, 1. No. = Item Number, CVR (Content Validity Ratio)= n-N/2/N/2
APPENDIX 4.5: ESTIMATION OF CONTENT VALIDITY RATIO (CVR) FOR USAGE ITEMS (N=12)
Online services N 3 2 1 n Mean CVR Email 12 12 0 0 12 3 1 Instant messaging 12 12 0 0 12 3 1 Online Chat 12 12 0 0 12 3 1 Online News 12 12 0 0 12 3 1 Job related research 12 12 0 0 12 3 1 Look for product info 12 12 0 0 12 3 1 Research for school or training 12 12 0 0 12 3 1 Look for travel information 12 12 0 0 12 3 1 Look for medical infomiation 12 12 0 0 12 3 1 Share computer files 12 12 0 0 12 3 1 Create content (e. g. Web pages) 12 12 0 0 12 3 1 Store/display/develop photos 12 12 0 0 12 3 1 Store files on the Intemet 12 12 0 0 12 3 1 Download games 12 12 0 0 12 3 1 Download video 12 12 0 0 12 3 1 Download pictures 12 12 0 0 12 3 1 Download music 12 12 0 0 12 3 1 Download movie 12 12 0 0 12 3 1 Download free software 12 12 0 0 12 3 1 Video strean-dng/downloading 12 12 0 0 12 3 1 Listen to music (streaming/MP3) 12 12 0 0 12 3 1 Listen to the radio station 12 12 0 0 12 3 1 Watch movies (doNvnloading/streaming) 12 12 0 0 12 3 1 Undertake online banking 12 12 0 0 12 3 1 Online bill paying 12 11 0
11 11 2.83 0.83
Purchase a product 12 12 0 0 12 3 1 Purchase a travel service 12 12 0 0 12 3 1 Online auctions e. g. e-bay 12 12 0 0 12 3 1 Purchase groceries (household goods) 12 11 1 0 11 2.92 0.83 Buy/sell stocks (online share trading) 12 12 0
.0 12 3 1
Play lottery 12 12 0 0 12 3 1 Obtain infonnation on hobby 12 12 0 0 12 3 1 Use it for fun e. g. Web surfing 12 11 1 0 11 2.92 0.83 Play online game 12 F q 11 1 0 11 2.92 0.83 View or visit Adult content Websites II 2 12 0 0 1 12
.3 1
Legend: N= Total number of experts completed the content validity questionnaire, n= number of experts rated items as essential, 1. No. = Item Number, CVR (Content Validity Ratio)= n-N/2/N/2
Adoption, Usage and Impact of Broadband: UK Households Yogesh K. DNvivedi
Appendices
APPENDIX 4.6: PRE-TEST QUESTIONNAIRE: PART I
School of Information Systems, Computing and Mathematics (SISCM) Department of Information Systems and Computing (DISC)
Uxbridge, Middlesex, UB8 3PH, UK
PRE-TEST (Part-1)
On
209
"An empirical study to investigate the diffusion (Adoption) of
broadband in the UK households"
Undertaken by
Yogesh K. Dwivedi, PhD (IS) Candidate (0024624)
Supervised by
Dr Jyoti Choudrie, Lecturer
Adoption, Usage and Impact of Broadband: UK Households Yogesh K. D%vivedi
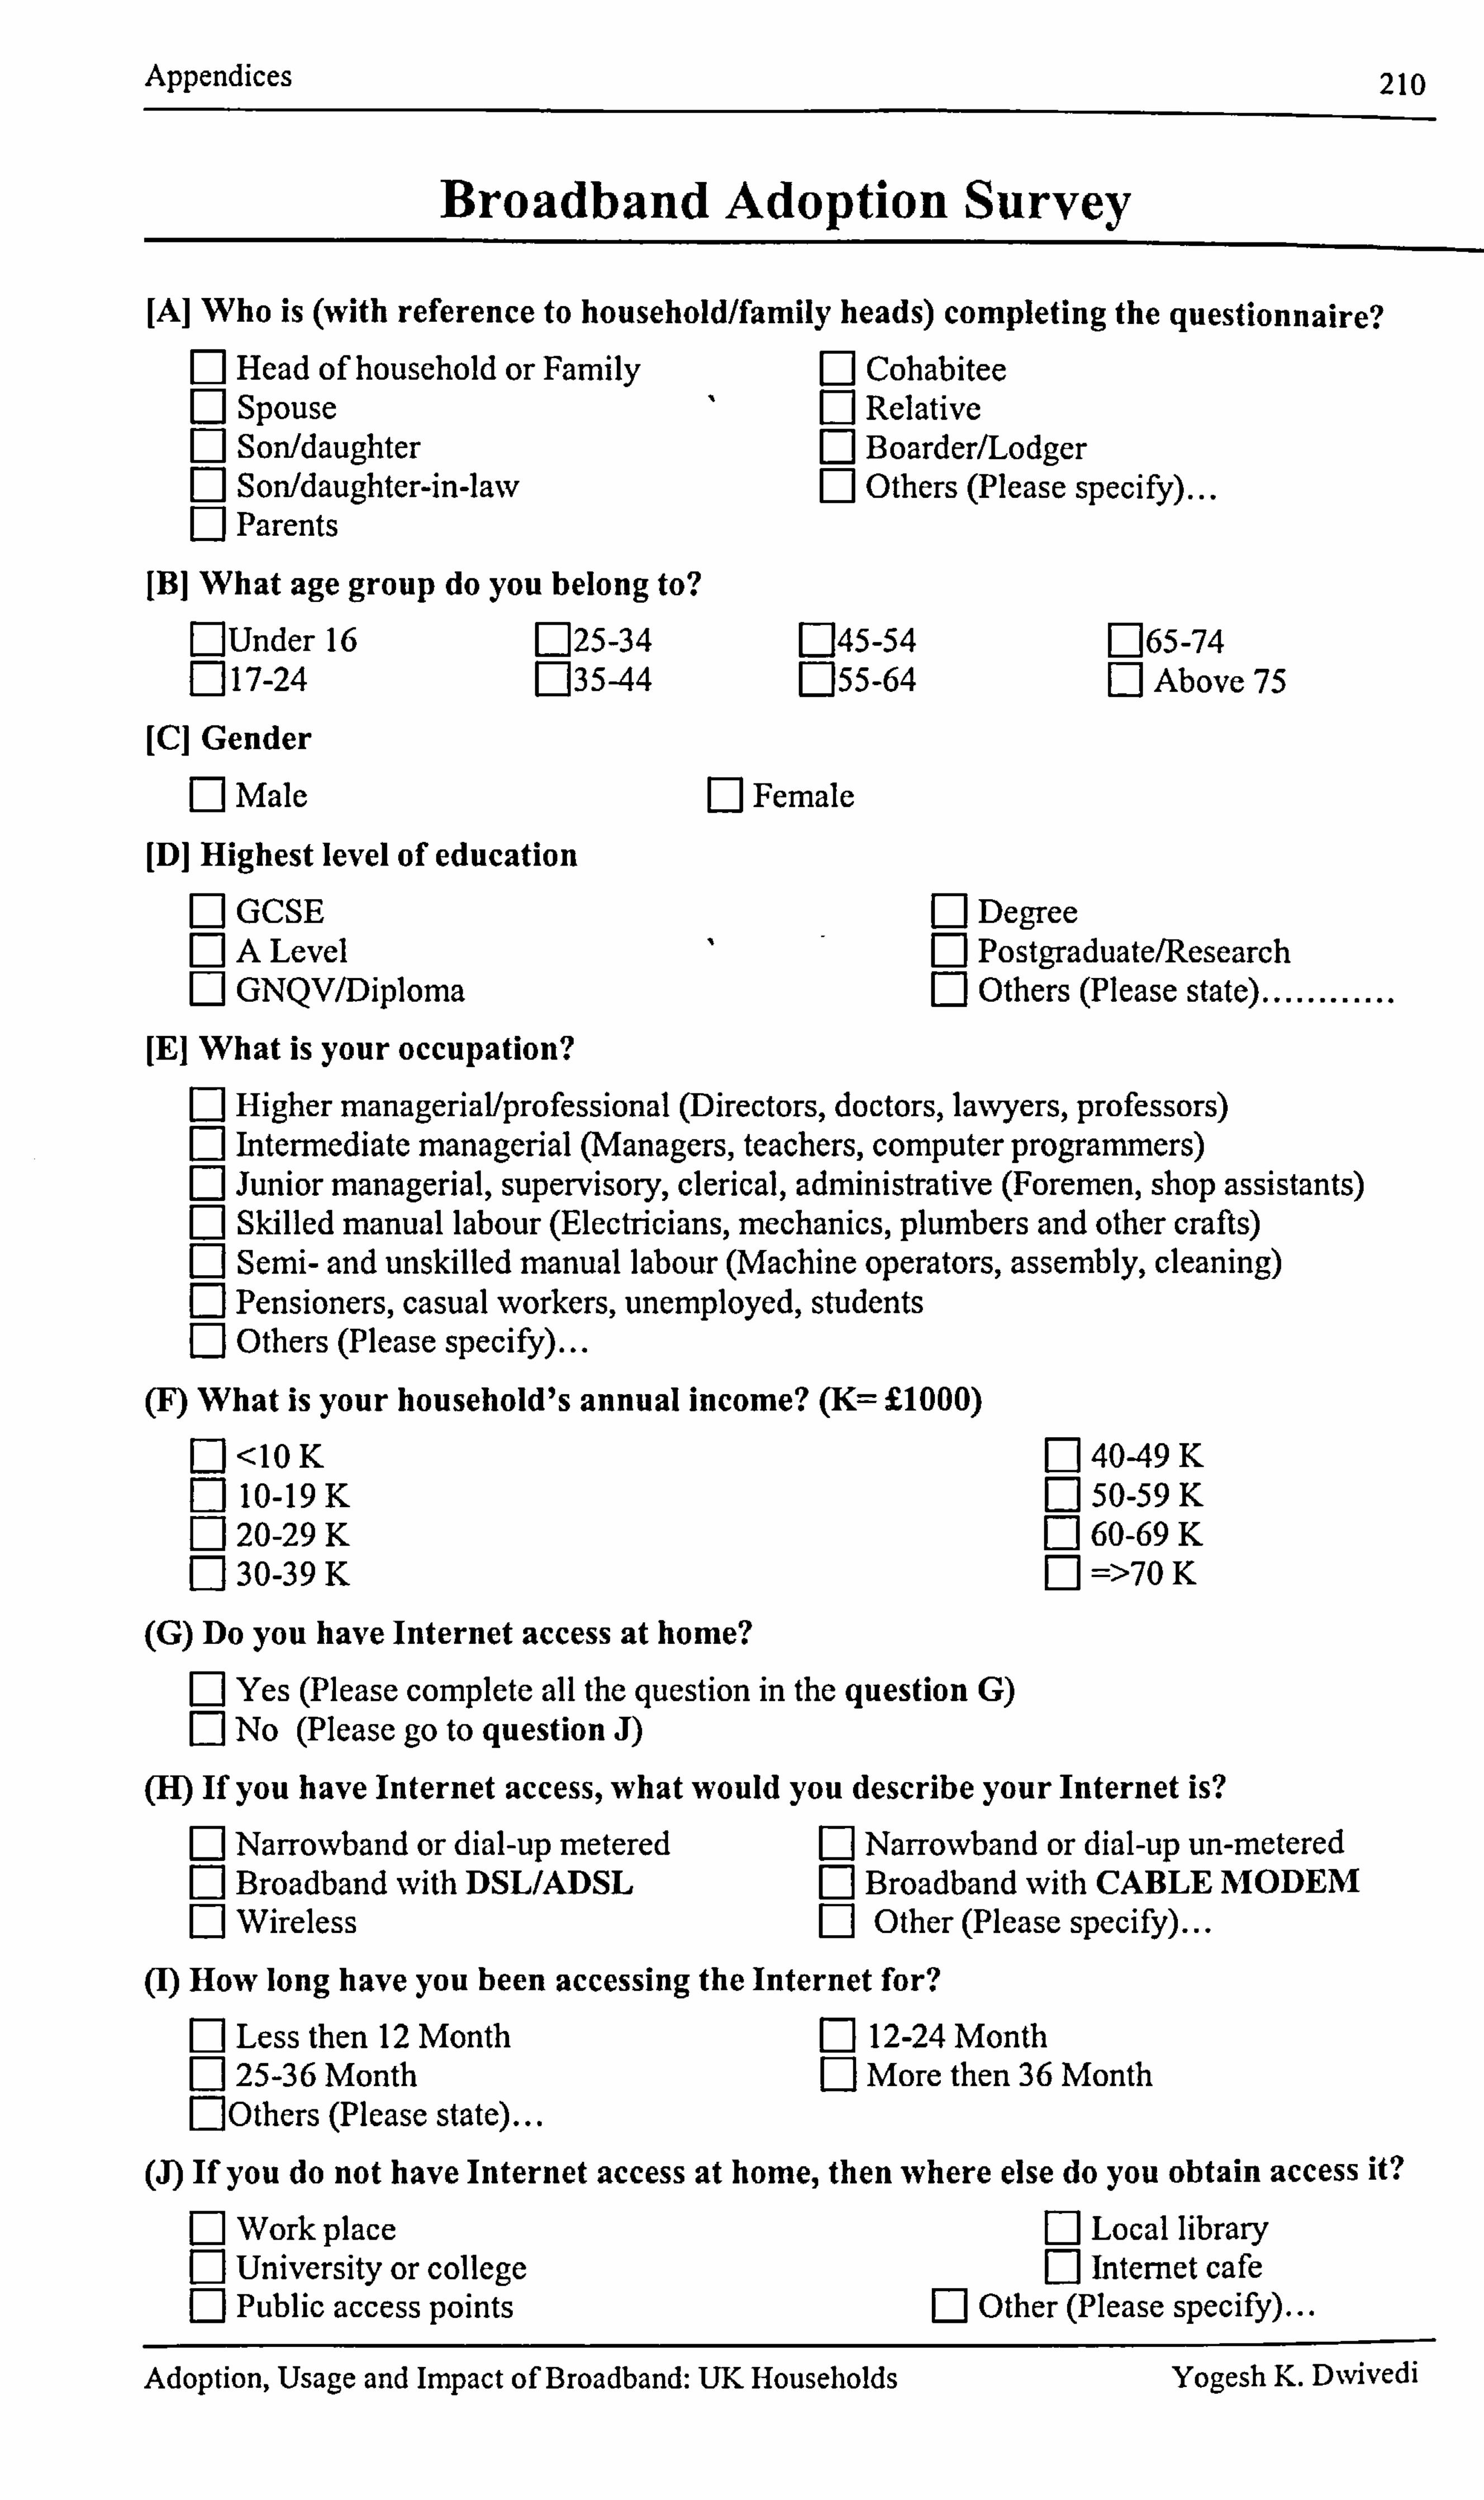
Appendices 210
Broadband Adoption Survey
[A] Who is (with reference to household/family heads) completing the questionnaire? n Head of household or Family F] Spouse F] Son/daughter n Son/daughter-in-law F-I Parents
F] Cohabitee F] Relative El Boarder/Lodger El Others (Please specify)
[B] What age group do you belong to? FlUnder 16 F125-34 n45-54 n 17-24 [: 13544 n55-64
[C] Gender Fý Male F] Female
[D] Highest level of education GCSE A Level GNQV/Diploma
[E] What is your occupation?
F-165-74 Ej Above 75
F] Degree F-1 Postgraduate/Research [: 1 Others (Please state) ............
Higher managerial/professional (Directors, doctors, lawyers, professors) Intermediate managerial (Managers, teachers, computer programmers)
Ej Junior managerial, supervisory, clerical, administrative (Foremen, shop assistants) F] Skilled manual labour (Electricians, mechanics, plumbers and other crafts)
Semi- and unskilled manual labour (Machine operators, assembly, cleaning) Pensioners, casual workers, unemployed, students Others (Please specify)...
(F) What is your household's annual income? (K-- 0000) n<IOK n 40-49 K
10-19 K 50-59 K 20-29 K 60-69 K
M 30-39 K El =>70 K
(G) Do you have Internet access at home?
Yes (Please complete all the question in the question G) No (Please go to question J)
(H) If you have Internet access, what would you describe your Internet is? F1 Narrowband or dial-up metered El Broadband with DSL/ADSL M Wireless
F] Narrowband or dial-up un-metered Broadband with CABLE MODEM Other (Please specify)...
(1) How long have you been accessing the Internet for?
F] Less then 12 Month n 25-36 Month [: ]Others (Please state)
M 12-24 Month F] More then 36 Month
(J) If you do not have Internet access at home, then where else do you obtain access it? Fý Workplace
University or college Public access points
Local library Intemet cafe
Other (Please specify)
Adoption, Usage and Impact of Broadband: UK Households Yogesh K. Dwivedi
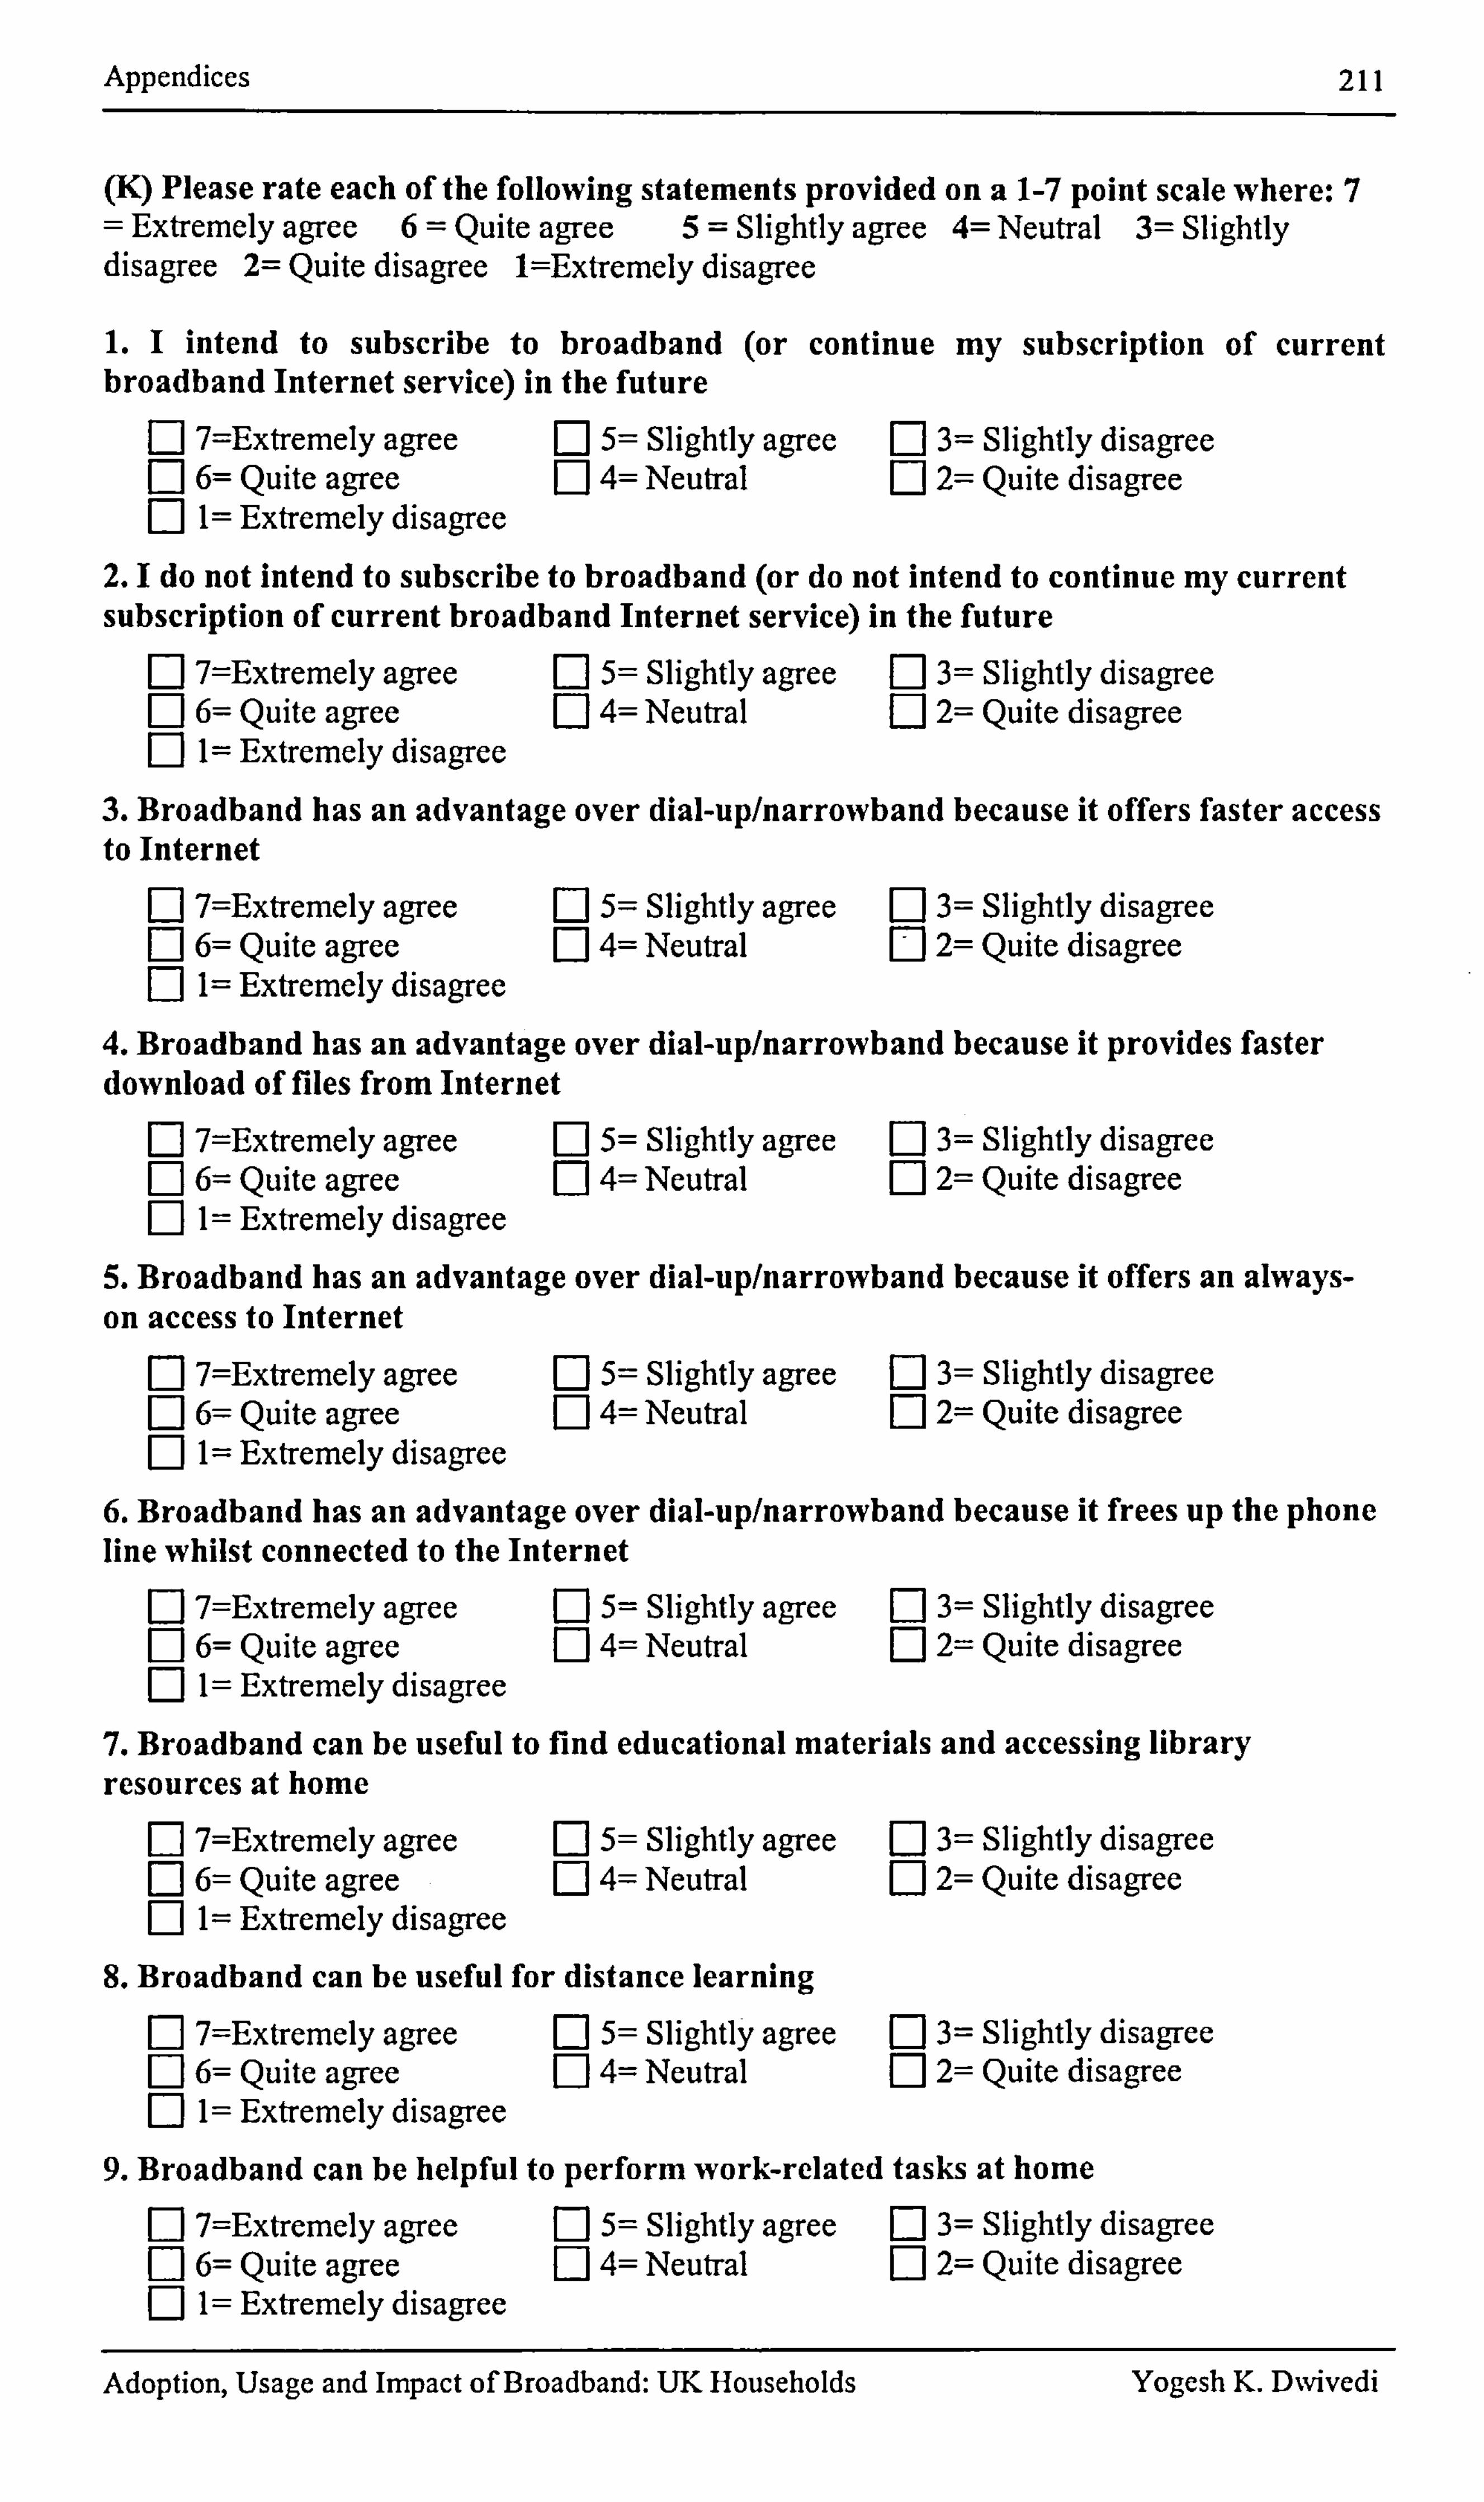
Appendices 211
(K) Please rate each of the following statements provided on a 1-7 point scale where: 7 = Extremely agree 6= Quite agree 5= Slightly agree 4= Neutral 3= Slightly disagree 2= Quite disagree 1=Extremely disagree
1.1 intend to subscribe to broadband (or continue my subscription of current broadband Internet service) in the future
Ej 7=Extremely agree Ej 5= Slightly agree El 3= Slightly disagree Fý 6= Quite agree El 4= Neutral Ej 2= Quite disagree R 1= Extremely disagree
2.1 do not intend to subscribe to broadband (or do not intend to continue my current subscription of current broadband Internet service) in the future
7=Extremely agree El 5= Slightly agree El 3= Slightly disagree 6= Quite agree El 4= Neutral 2= Quite disagree 1= Extremely disagree
3. Broadband has an advantage over dial-up/narrowband because it offers faster access to Internet
R 7=Extremely agree [I 5= Slightly agree E] 3= Slightly disagree F-1 6= Quite agree EJ 4= Neutral El 2= Quite disagree r-1 1= Extremely disagree
4. Broadband has an advantage over dial-up/narrowband because it provides faster download of files from Internet
El 7=Extremely agree El 5= Slightly agree 3= Slightly disagree 6= Quite agree D 4= Neutral 2= Quite disagree 1= Extremely disagree
5. Broadband has an advantage over dial-up/narrowband because it offers an always- on access to Internet
M 7=Extremely agree Ej 5= Slightly agree [: 1 3= Slightly disagree El 6= Quite agree 0 4= Neutral Ej 2= Quite disagree R I= Extremely disagree
6. Broadband has an advantage over dial-up/narrowband because it frees up the phone line whilst connected to the Internet
F] 7=Extremely agree Ej 5= Slightly agree El 3= Slightly disagree F] 6= Quite agree EJ 4= Neutral Ej 2= Quite disagree n 1= Extremely disagree
7. Broadband can be useful to find educational materials and accessing library resources at home
F-1 7=Extremely agree [: 1 5= Slightly agree Ej 3= Slightly disagree Ej 6= Quite agree EJ 4= Neutral 2= Quite disagree F1 1= Extremely disagree
8. Broadband can be useful for distance learning
7=Extremely agree Ej 5= Slightly agree El 3= Slightly disagree 6= Quite agree F] 4= Neutral 2= Quite disagree I= Extremely disagree
9. Broadband can be helpful to perform work-related tasks at home F1 7=Extremely agree El 5= Slightly agree E] 3= Slightly disagree F1 6= Quite agree El 4= Neutral 2= Quite disagree n 1= Extremely disagree
Adoption, Usage and Impact of Broadband: UK Households Yogesh K. D%vivedi
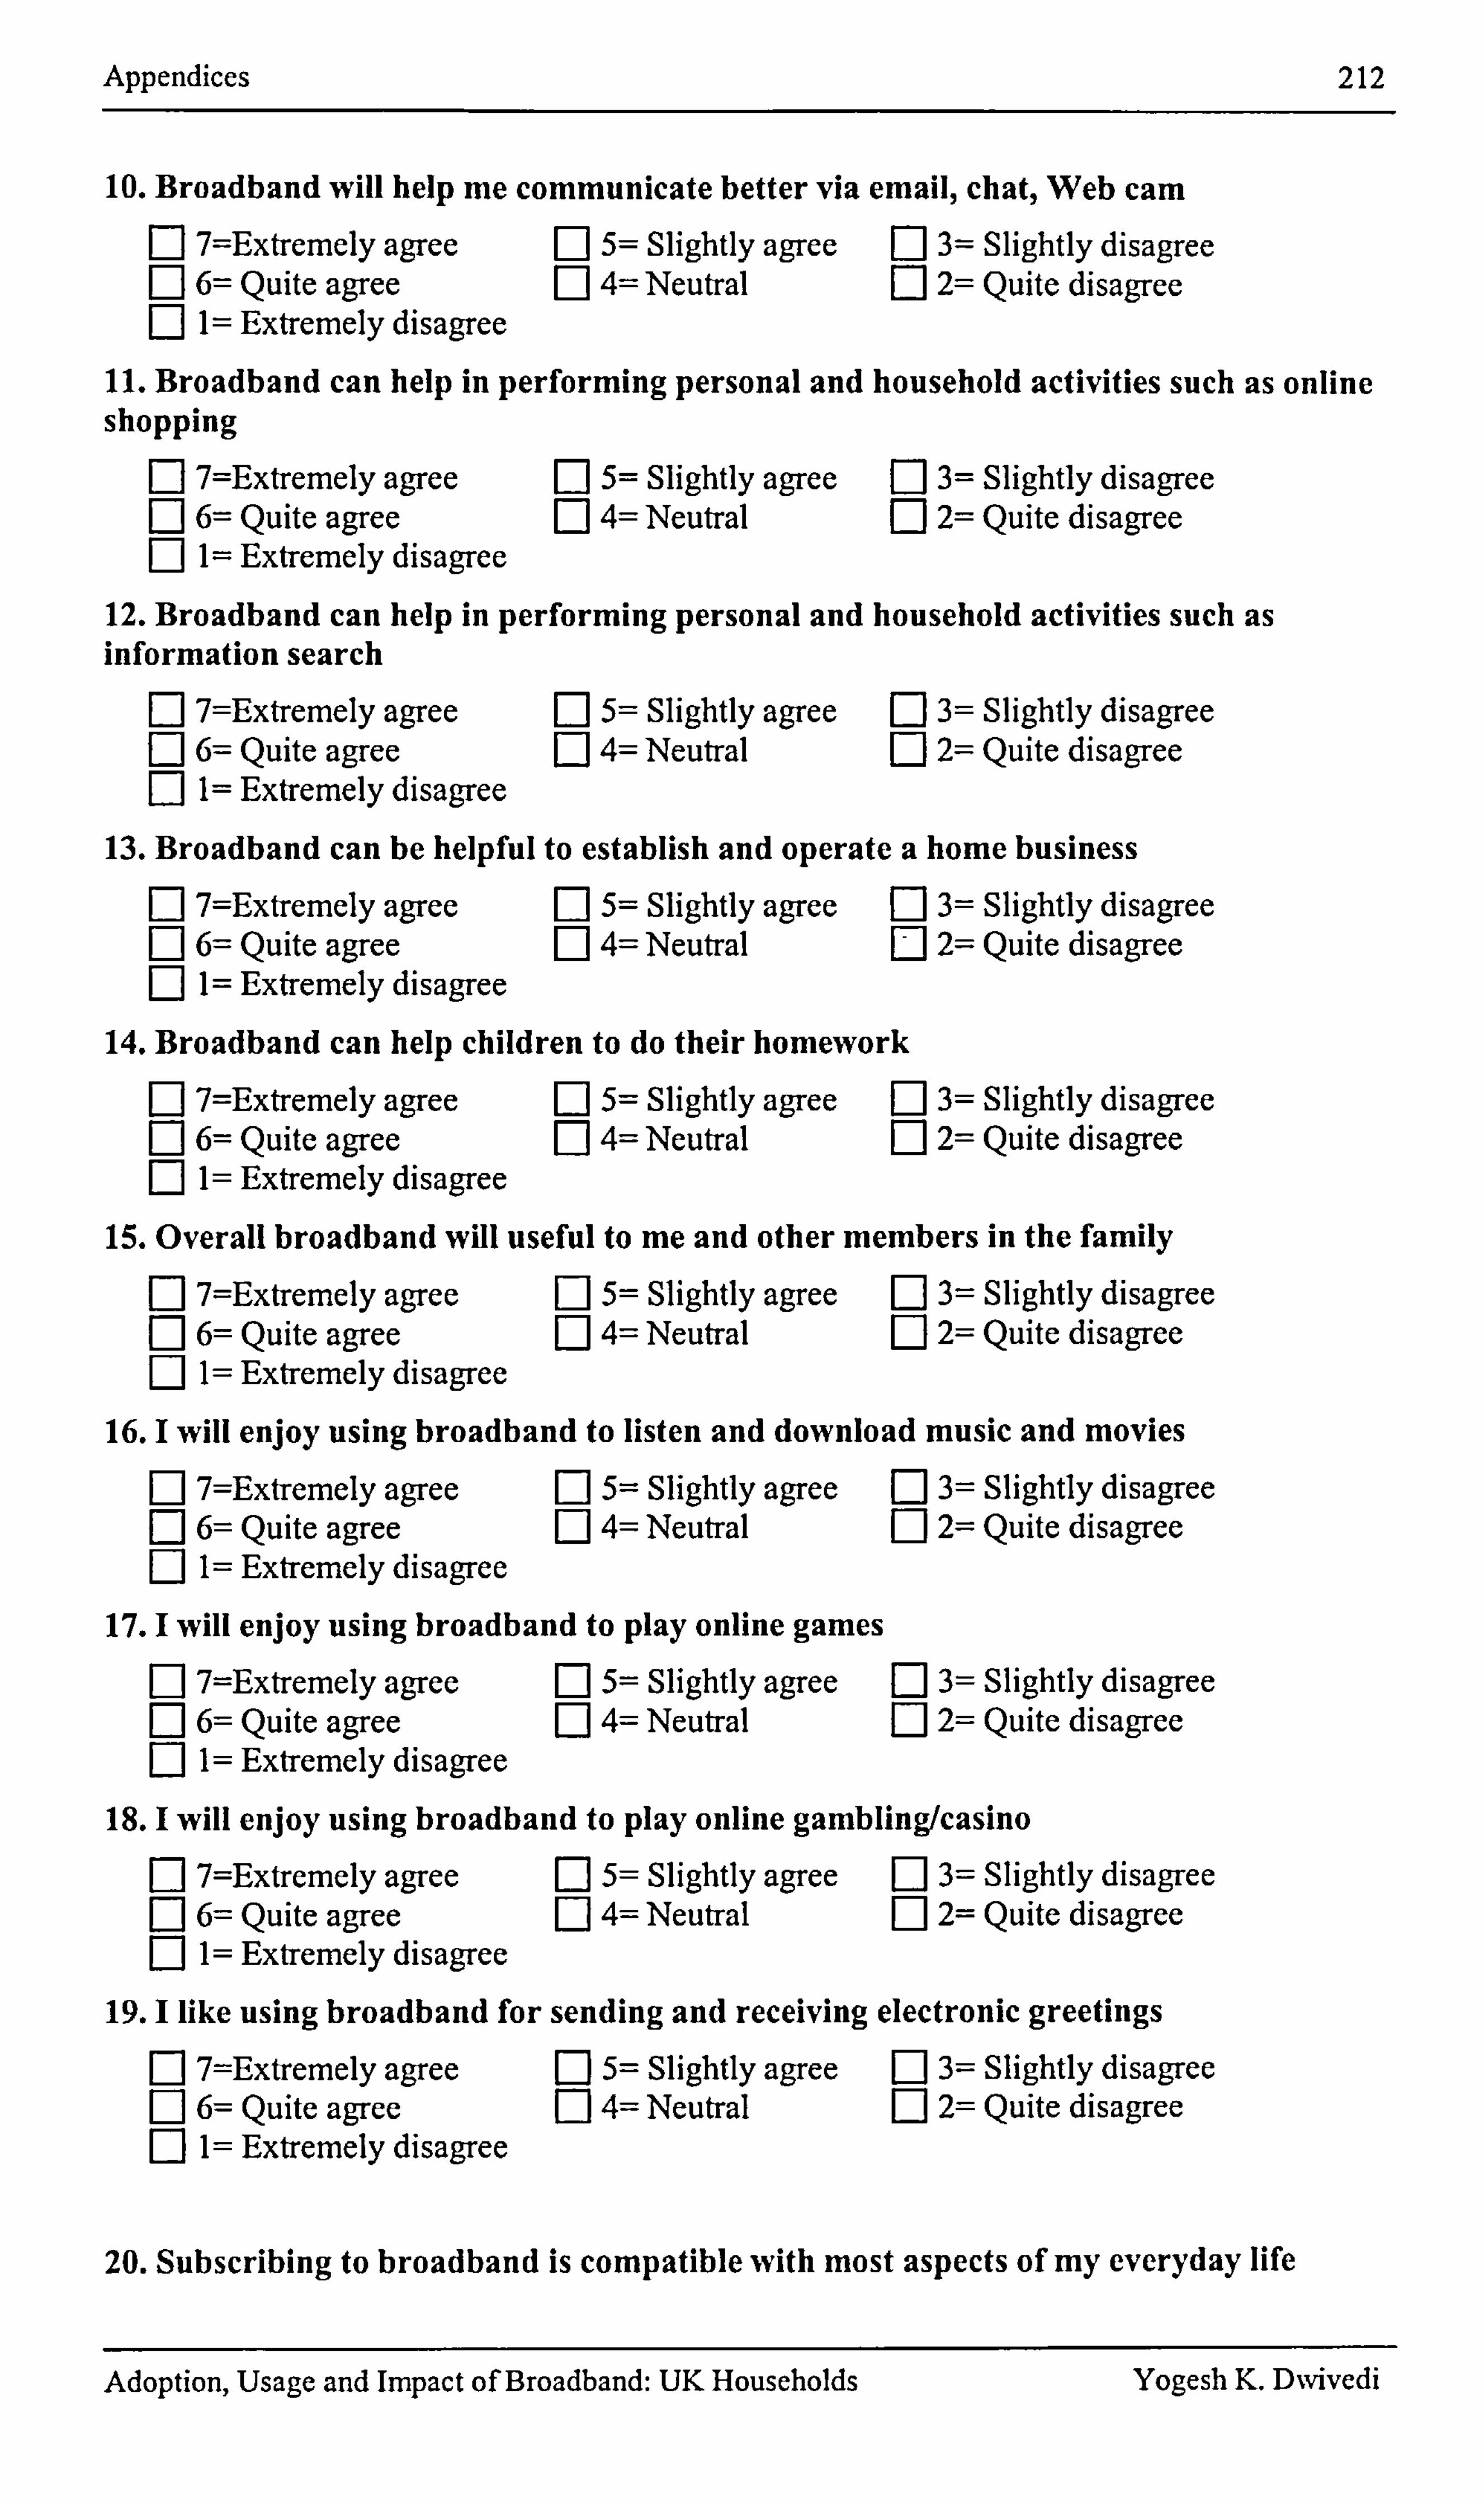
Appendices 212
10. Broadband will help me communicate better via email, chat, Web cam 7=Extremely agree [: 1 5= Slightly agree [I 3= Slightly disagree 6= Quite agree El 4= Neutral Ej 2= Quite disagree
F-1 1= Extremely disagree
11. Broadband can help in performing personal and household activities such as online shopping
El 7=Extremely agree [: 1 5= Slightly agree El 3= Slightly disagree F-1 6= Quite agree EJ 4= Neutral Ej 2= Quite disagree n 1= Extremely disagree
12. Broadband can help in performing personal and household activities such as information search
F-1 7=Extremely agree Ej 5= Slightly agree El 3= Slightly disagree 6= Quite agree EJ 4= Neutral Ej 2= Quite disagree 1= Extremely disagree
13. Broadband can be helpful to establish and operate a home business
7=Extremely agree [I 5= Slightly agree El 3= Slightly disagree 6= Quite agree El 4= Neutral [: 1 2= Quite disagree 1= Extremely disagree
14. Broadband can help children to do their homework
7=Extremely agree [: 1 5= Slightly agree Ej 3= Slightly disagree 6= Quite agree D 4= Neutral El 2= Quite disagree 1= Extremely disagree
15. Overall broadband will useful to me and other members in the family n 7=Extremely agree [: 1 5= Slightly agree Ej 3= Slightly disagree n 6= Quite agree El 4= Neutral Ej 2= Quite disagree F] 1 =Extremely disagree
16.1 will enjoy using broadband to listen and download music and movies F] 7=Extremely agree [I 5= Slightly agree Ej 3= Slightly disagree Ej 6= Quite agree Ej 4= Neutral 2= Quite disagree F] 1= Extremely disagree
17.1 will enjoy using broadband to play online games 7=Extremely agree [I 5= Slightly agree 3= Slightly disagree 6= Quite agree El 4= Neutral 2= Quite disagree 1= Extremely disagree
18.1 will enjoy using broadband to play online gambling/casino r-1 7=Extremely agree Ej 5= Slightly agree El 3= Slightly disagree
6= Quite agree E] 4= Neutral 2= Quite disagree 1= Extremely disagree
19.1 like using broadband for sending and receiving electronic greetings M 7=Extremely agree E] 5= Slightly agree E] 3= Slightly disagree F1 6= Quite agree El 4= Neutral Ej 2= Quite disagree F] 1= Extremely disagree
20. Subscribing to broadband is compatible with most aspects of my everyday life
Adoption, Usage and Impact of Broadband: UK Households Yogesh K. D%vivedi
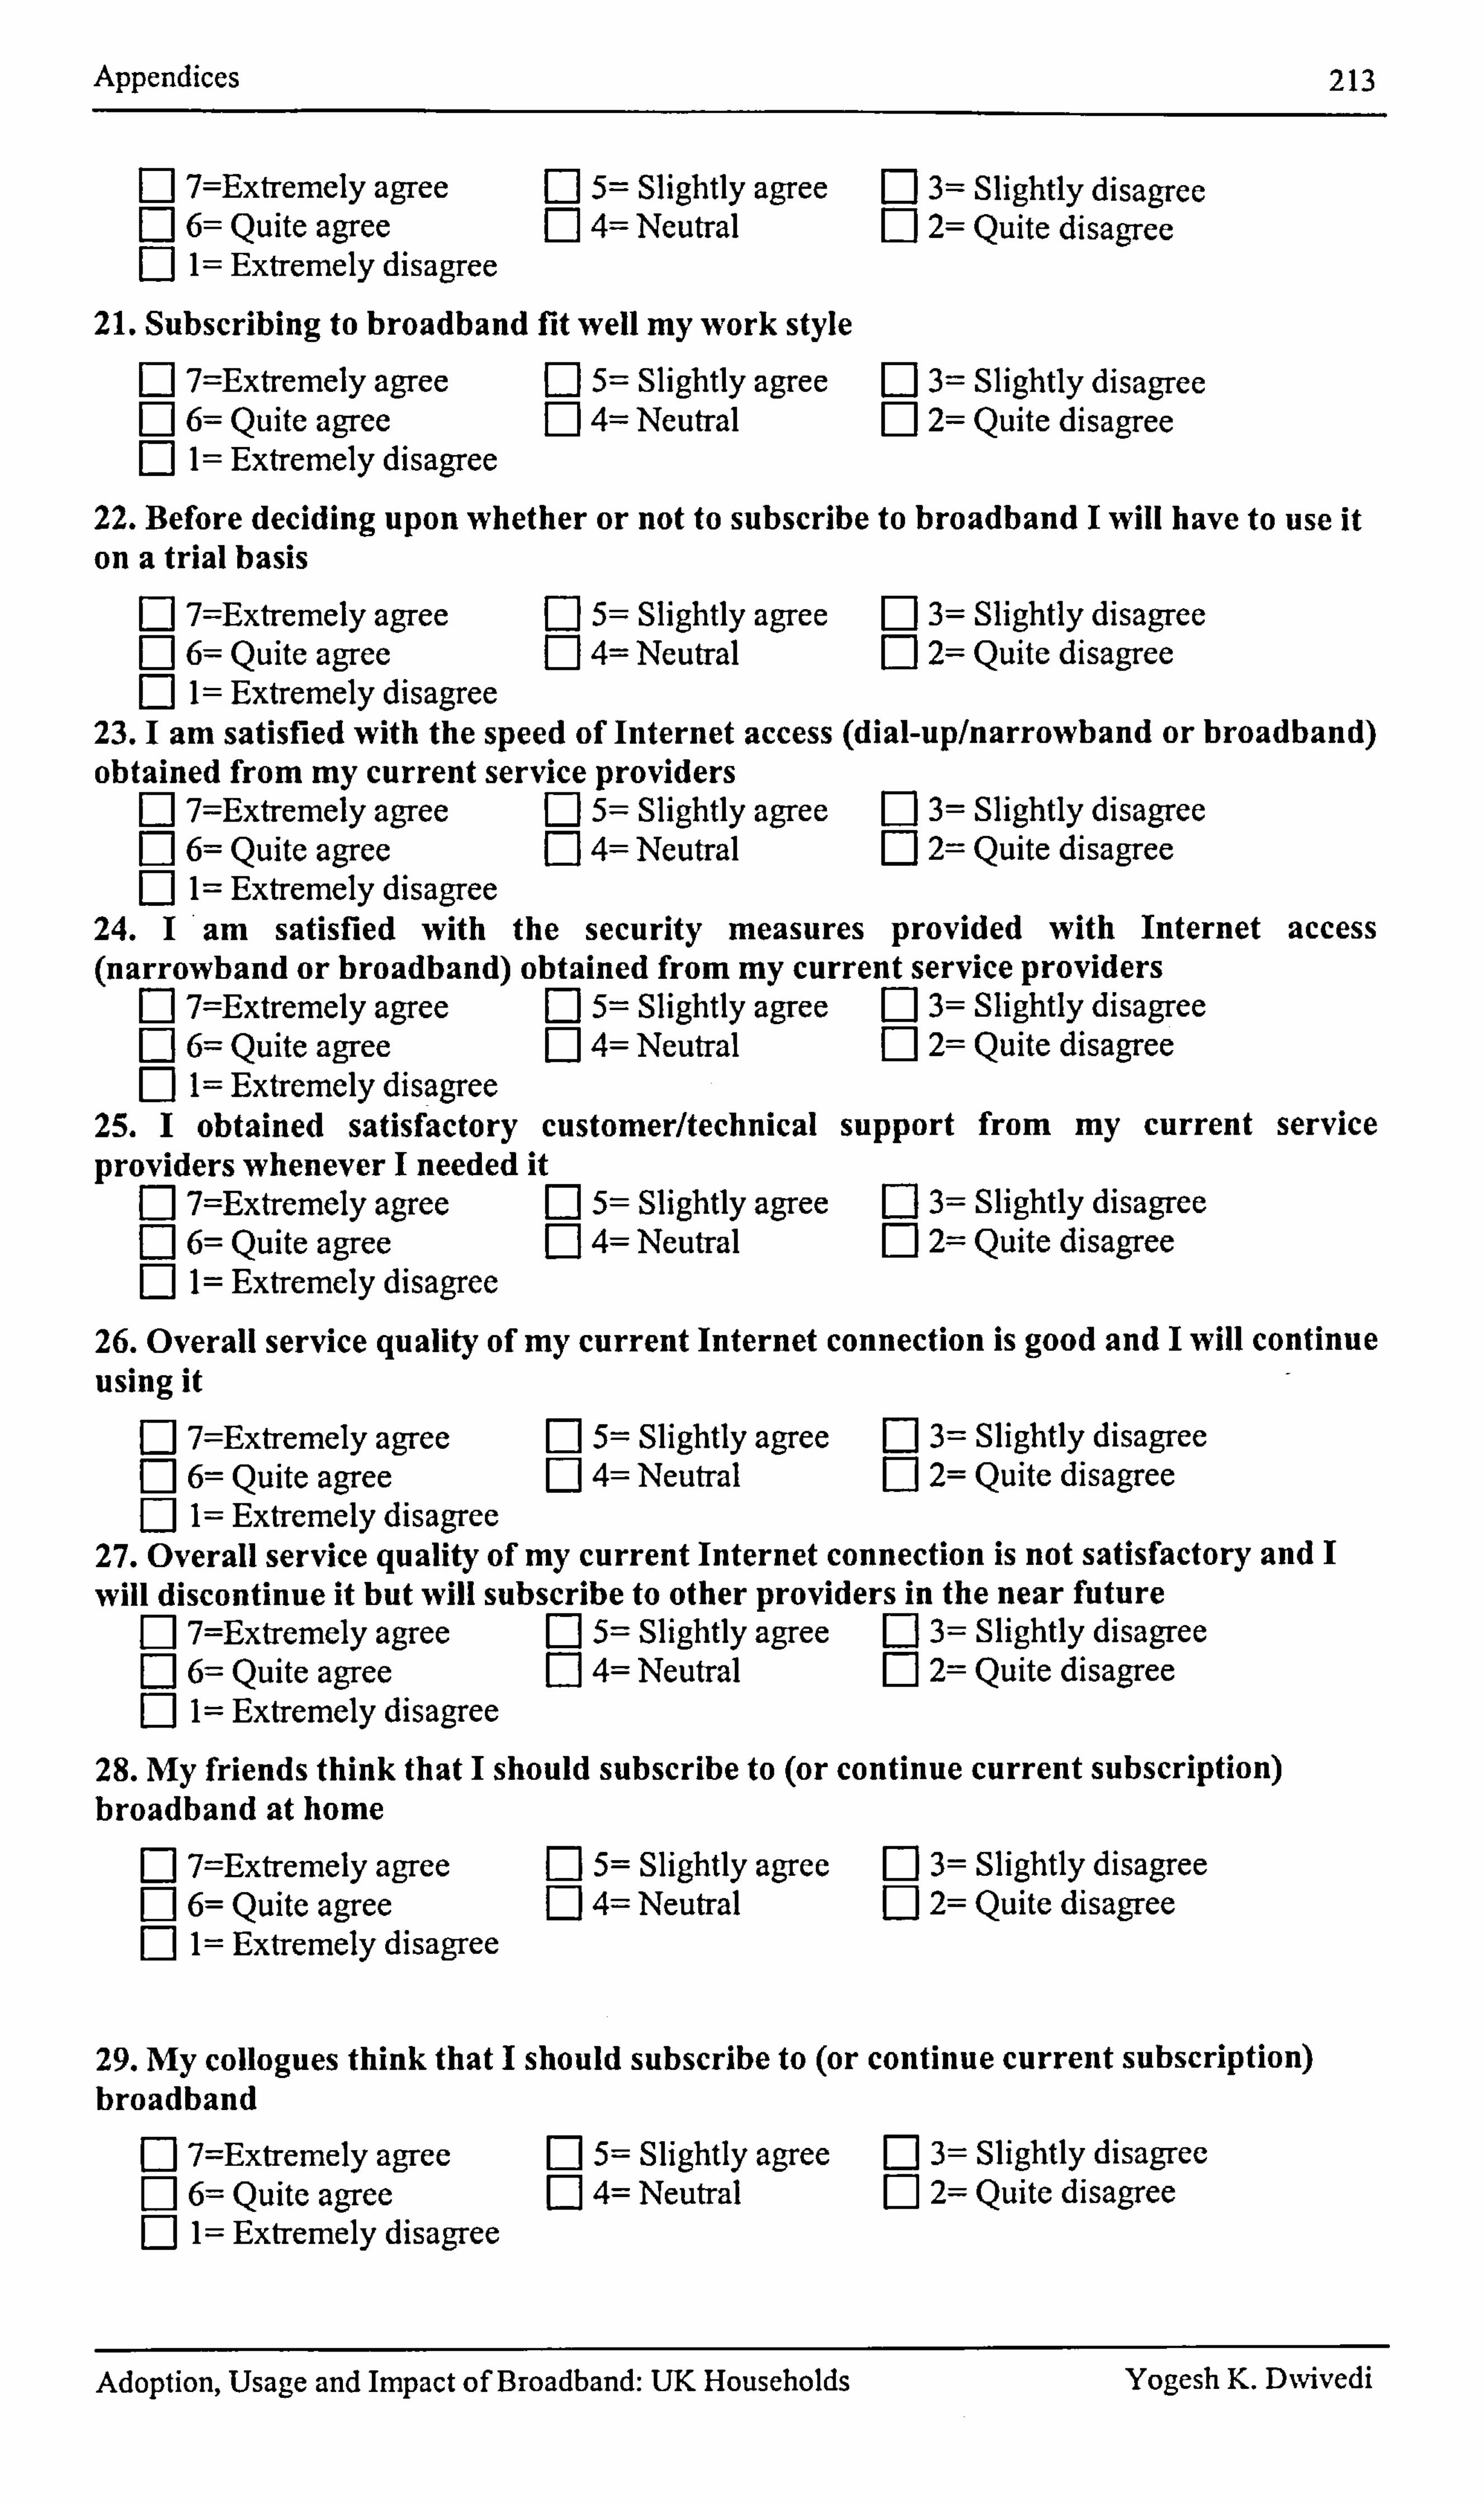
Appendices 213
7=Extremely agree El 5= Slightly agree El 3= Slightly disagree 6= Quite agree El 4= Neutral El 2= Quite disagree
F] 1= Extremely disagree
21. Subscribing to broadband fit well my work style 7=Extremely agree 5= Slightly agree F] 3= Slightly disagree 6= Quite agree 4= Neutral 2= Quite disagree
F] 1= Extremely disagree
22. Before deciding upon whether or not to subscribe to broadband I will have to use it on a trial basis
[: ] 7=Extremely agree Ej 5= Slightly agree El 3= Slightly disagree F] 6= Quite agree F] 4= Neutral 2= Quite disagree F] 1= Extremely disagree
23.1 am satisfied with the spe ed of Internet access (dial-up/ narrowband or broadband) obtained from my current ser vice providers
n 7=Extremely agree Ej 5= Slightly agree El 3= Slightly disagree F1 6= Quite agree D 4= Neutral Ej 2= Quite disagree F] 1= Extremely disagree
24.1 am satisfied with the security measures provi ded with Internet access (narrowband or broadband) obtained from my current serv ice providers
n 7=Extremely agree Ej 5= Slightly agree 3= Slightly disagree Ej 6= Quite agree El 4= Neutral 2= Quite disagree n 1= Extremely disagree
25.1 obtained satisfactorv customer/technical sunDort from mv current service providers whenever I needed it
Fý 7=Extremely agree Fj 5= Slightly agree 3= Slightly disagree F1 6= Quite agree F1 4= Neutral 2= Quite disagree F] 1= Extremely disagree
26. Overall service quality of my current Internet connection is good and I will continue using it
F] 7=Extremely agree 5= Slightly agree E] 3= Slightly disagree n 6= Quite agree 4= Neutral 2= Quite disagree F] 1= Extremely disagree
27. Overall service quality of my current Internet connection is not satisfactory and I will discontinue it but will subscribe to other providers in the near future
7=Extremely agree E] 5= Slightly agree E] 3= Slightly disagree 6= Quite agree D 4= Neutral [: 1 2= Quite disagree 1= Extremely disagree
28. My friends think that I should subscribe to (or continue current subscription) broadband at home
F-1 7=Extremely agree El 5= Slightly agree Ej 3= Slightly disagree F] 6= Quite agree n 4= Neutral 2= Quite disagree n 1= Extremely disagree
29. My collogues think that I should subscribe to (or continue current subscription) broadband
M 7=Extremely agree [I 5= Slightly agree Ej 3= Slightly disagree F-1 6= Quite agree EJ 4= Neutral 2= Quite disagree M 1= Extremely disagree
Adoption, Usage and Impact of Broadband: UK Households Yogesh K. D%vivedi
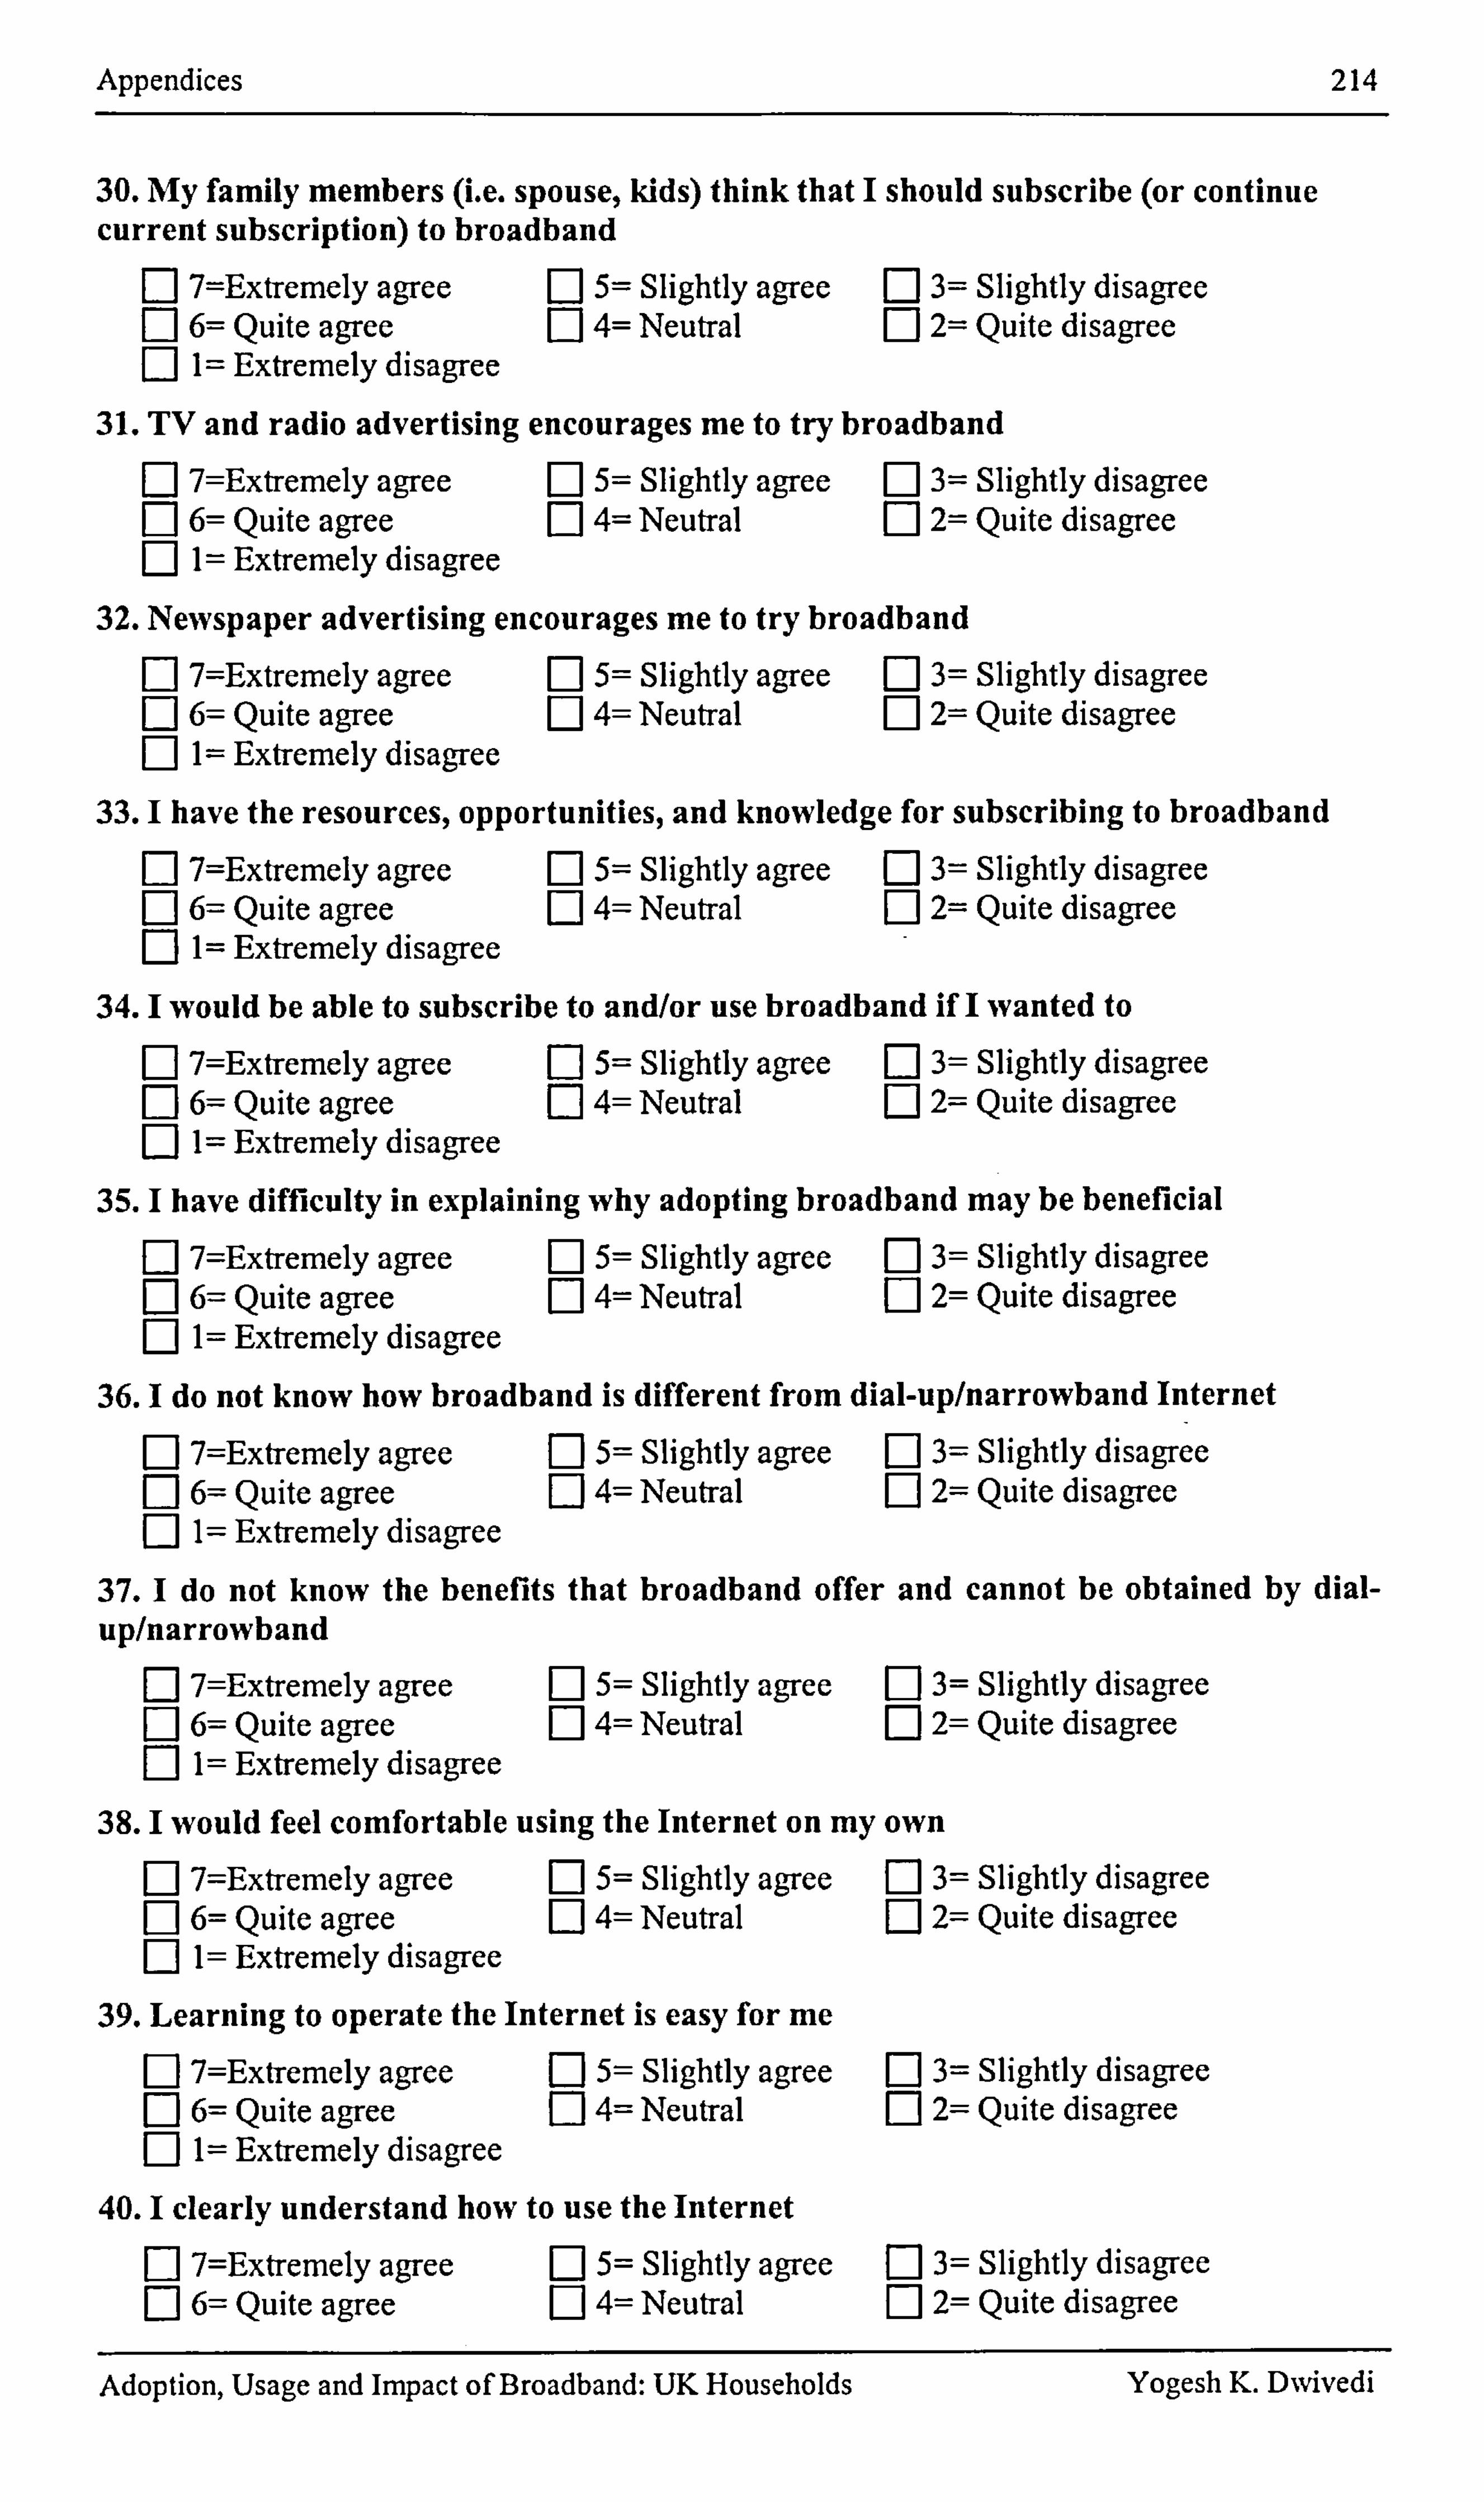
Appendices
30. My family members (i. e. spouse, kids) think that I should subscribe (or continue current subscription) to broadband
F-1 7=Extremely agree Ej 5= Slightly agree Ej 3= Slightly disagree 6= Quite agree El 4= Neutral 2= Quite disagree 1= Extremely disagree
31. TV and radio advertising encourages me to try broadband
7=Extremely agree [: ] 5= Slightly agree [: 1 3= Slightly disagree 6= Quite agree El 4= Neutral [: 1 2= Quite disagree 1= Extremely disagree
32. Newspaper advertising encourages me to try broadband El 7=Extremely agree El 5= Slightly agree Ej 3= Slightly disagree Ej 6= Quite agree 0 4= Neutral 2= Quite disagree F-1 1= Extremely disagree
214
33.1 have the resources, opportunities, and knowledge for subscribing to broadband M 7=Extremely agree [I 5= Slightly agree Ej 3= Slightly disagree
6= Quite agree El 4= Neutral 2= Quite disagree 1= Extremely disagree
34.1 would be able to subscribe to and/or use broadband if I wanted to
7=Extremely agree [D 5= Slightly agree F-1 3= Slightly disagree 6= Quite agree El 4= Neutral Ej 2= Quite disagree I= Extremely disagree
35.1 have difficulty in explaining why adopting broadband may be beneficial F] 7=Extremely agree 0 5= Slightly agree El 3= Slightly disagree F-1 6= Quite agree EJ 4= Neutral 2= Quite disagree F] 1= Extremely disagree
36.1 do not know how broadband is different from dial-up/narrowband Internet R 7=Extremely agree El 5= Slightly agree [: 1 3= Slightly disagree M 6= Quite agree F-1 4= Neutral E] 2= Quite disagree F] I= Extremely disagree
37.1 do not know the benefits that broadband offer and cannot be obtained by dial- up/narrowband
Ej 7=Extremely agree 0 5= Slightly agree [: 1 3= Slightly disagree 6= Quite agree 0 4= Neutral Ej 2= Quite disagree 1= Extremely disagree
38.1 would feel comfortable using the Internet on my own F] 7=Extremely agree El 5= Slightly agree El 3= Slightly disagree
6= Quite agree EJ 4= Neutral Ej 2= Quite disagree 1= Extremely disagree
39. Learning to operate the Internet is easy for me F] 7=Extremely agree El 5= Slightly agree Ej 3= Slightly disagree n 6= Quite agree F1 4= Neutral El 2= Quite disagree F] 1= Extremely disagree
40.1 clearly understand how to use the Internet R 7=Extremely agree El 5= Slightly agree El 3= Slightly disagree F-1 6= Quite agree E1 4= Neutral [: 1 2= Quite disagree
Adoption, Usage and Impact of Broadband: UK Households Yogesh K. DNvivedi
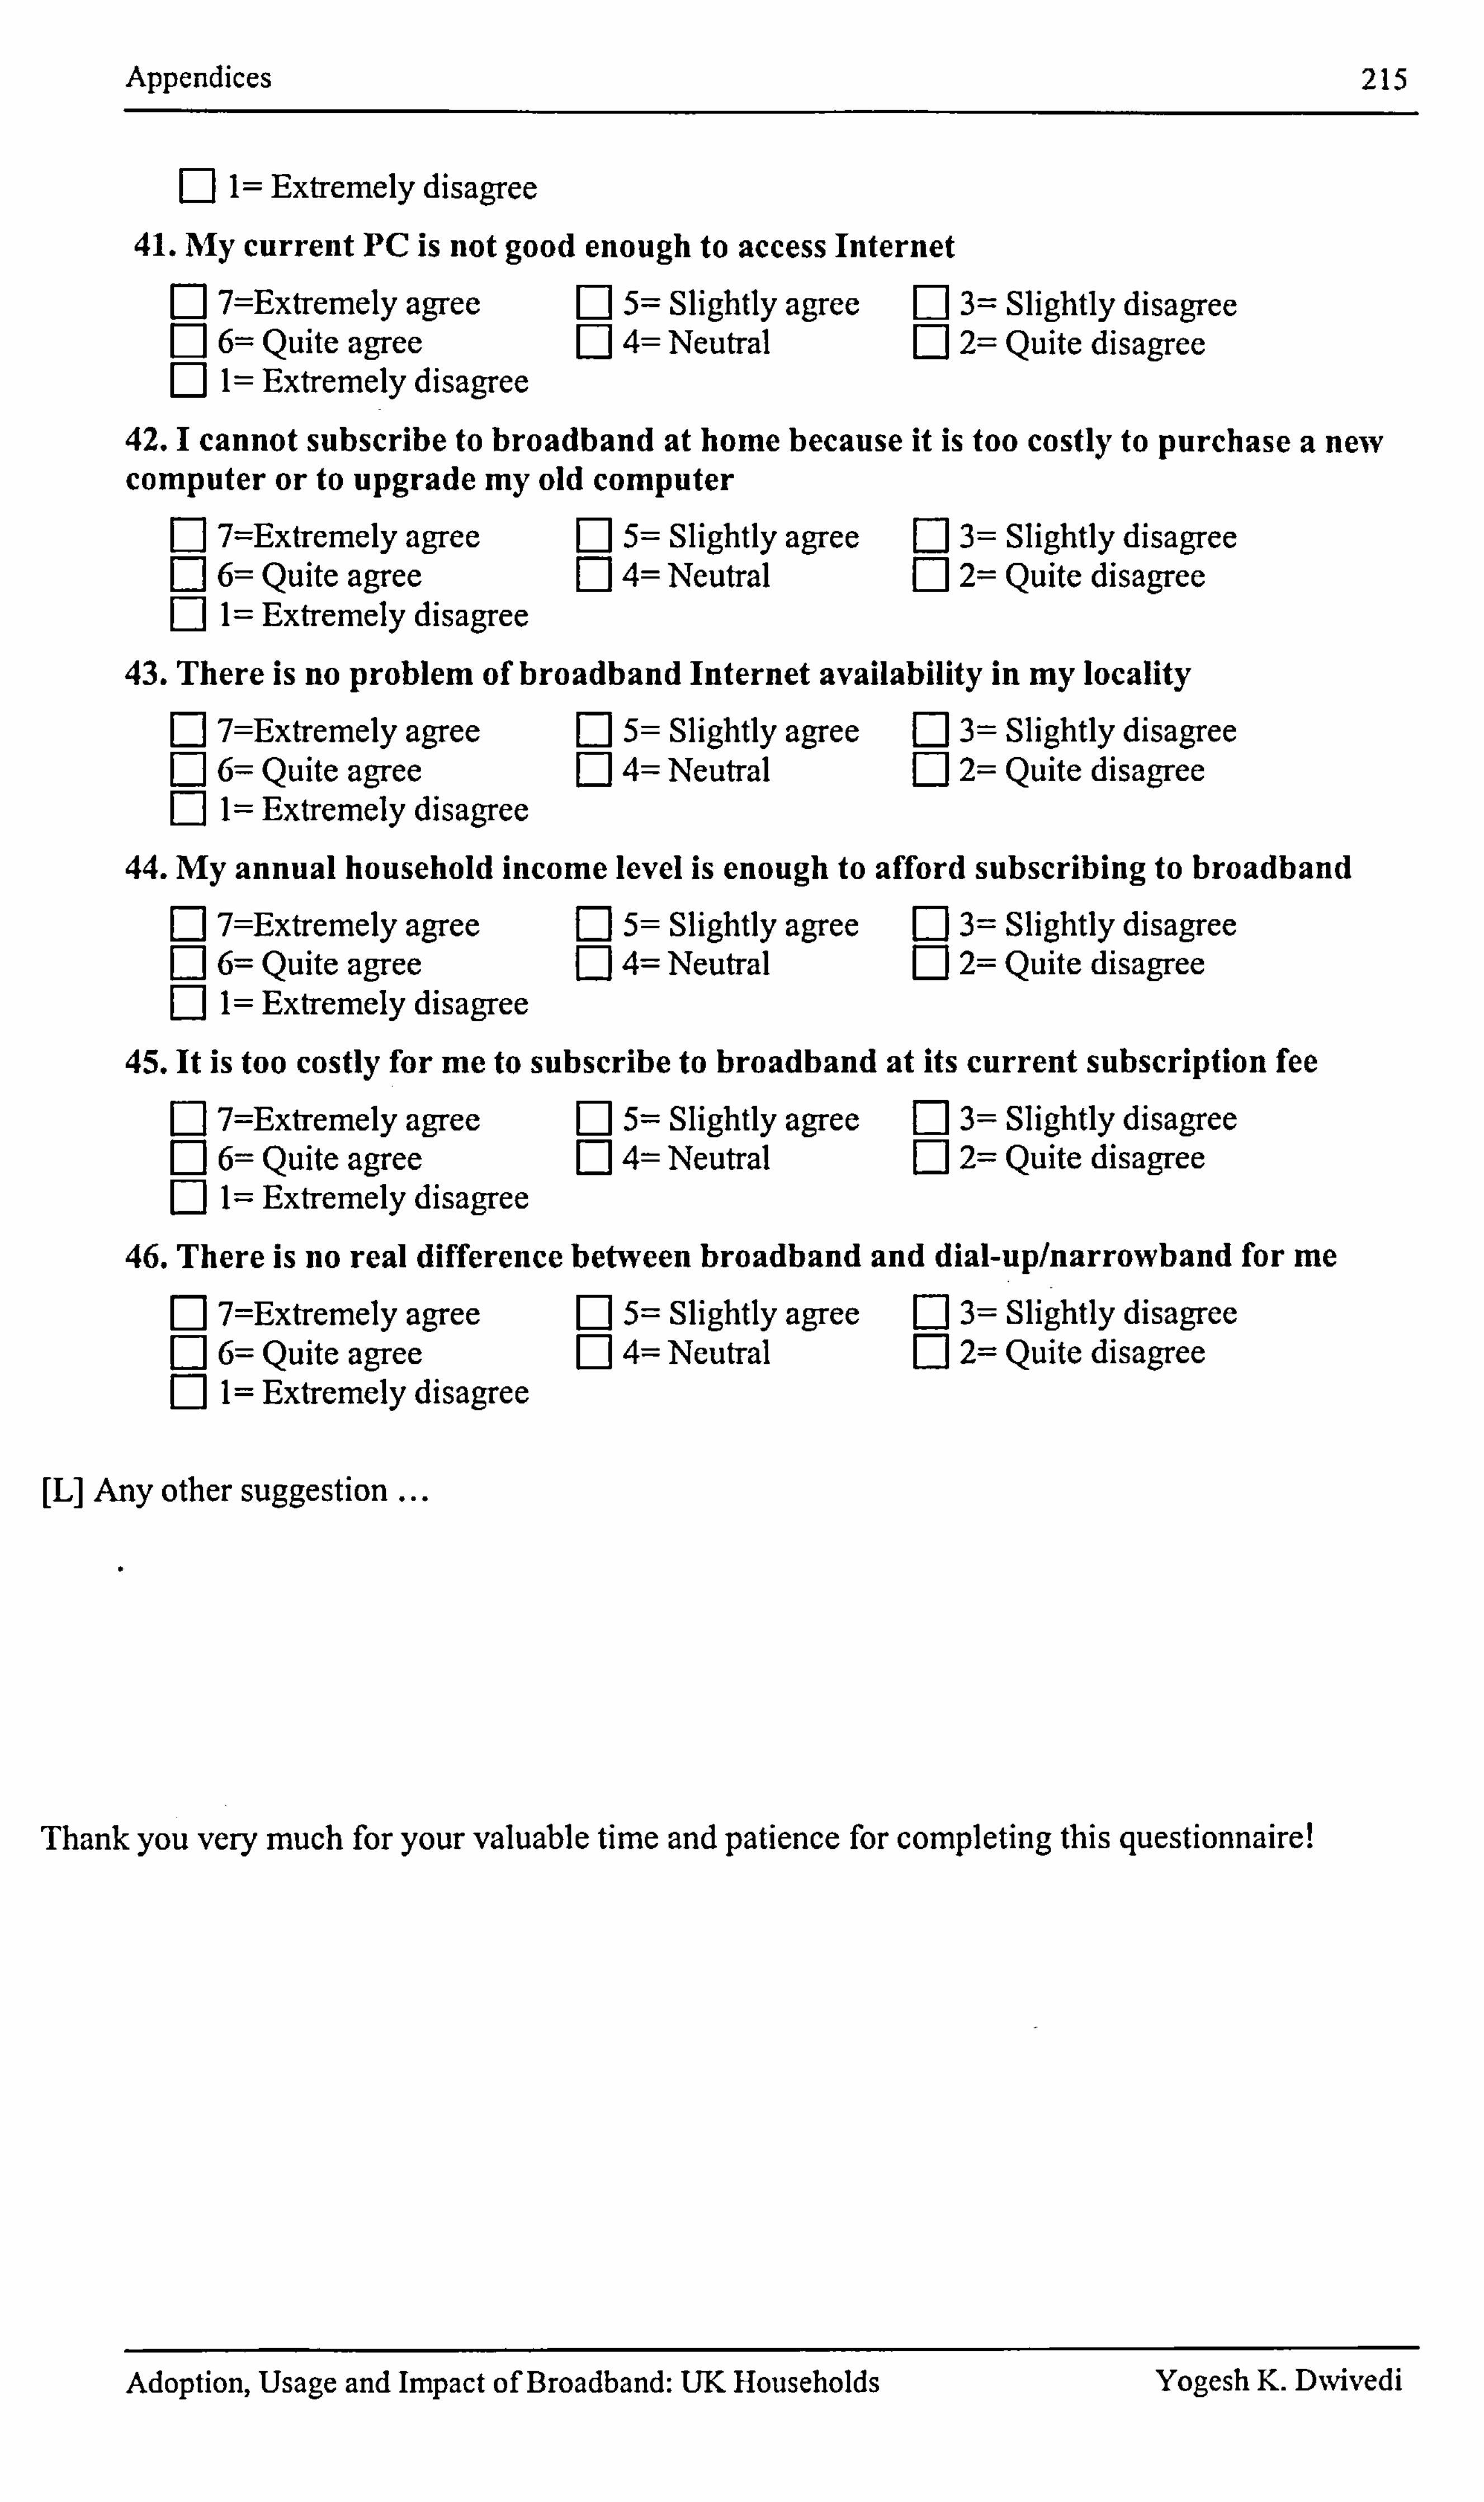
Appendices 215
F1 1= Extremely disagree
41. My current PC is not good enough to access Internet
7=Extremely agree El 5= Slightly agree El 3= Slightly disagree 6= Quite agree [j 4= Neutral Ej 2= Quite disagree 1= Extremely disagree
42.1 cannot subscribe to broadband at home because it is too costly to purchase a new computer or to upgrade my old computer
7=Extremely agree [: 1 5= Slightly agree 3= Slightly disagree 6= Quite agree Ej 4= Neutral 2= Quite disagree
F] 1= Extremely disagree
43. There is no problem of broadband Internet availability in my locality F1 7=Extremely agree M 5= Slightly agree Ej 3= Slightly disagree E] 6= Quite agree EJ 4= Neutral El 2= Quite disagree [: ] 1= Extremely disagree
44. My annual household income level is enough to afford subscribing to broadband Ej 7=Extremely agree ED5= Slightly agree Ej 3= Slightly disagree F] 6= Quite agree EJ 4= Neutral Ej 2= Quite disagree F-1 1= Extremely disagree
45. It is too costly for me to subscribe to broadband at its current subscription fee R 7=Extremely agree 0 5= Slightly agree El 3= Slightly disagree
Ej 6= Quite agree EJ 4= Neutral Ej 2= Quite disagree [] 1= Extremely disagree
46. There is no real difference between broadband and dial-up/narrowband for me Fj 7=Extremely agree El 5= Slightly agree 3= Slightly disagree [: ] 6= Quite agree El 4= Neutral 2= Quite disagree Fý 1= Extremely disagree
[L] Any other suggestion
Thank you very much for your valuable time and patience for completing this questionnaire!
Adoption, Usage and Impact of Broadband: UK Households Yogesh K. DNvivedi
Appendices 216
APPENDIX 4.7: PRE-TEST QUESTIONNAIRE: PART 11
School of Information Systems, Computing and Mathematics (SISCM) Department of Information Systems and Computing (DISC)
Uxbridge, Middlesex, U118 3PH, UK
PRE-TEST (Part-11)
On
An empirical study to investigate the diffusion (Usage of
broadband in the UK households
Undertaken by
Yogesh K. Dwivedi (0024624), PhD (IS) Candidate
Supervised by
Dr Jyoti Choudrie, Lecturer
Adoption, Usage and Impact of Broadband: UK Households Yogesh K. DNvivedi
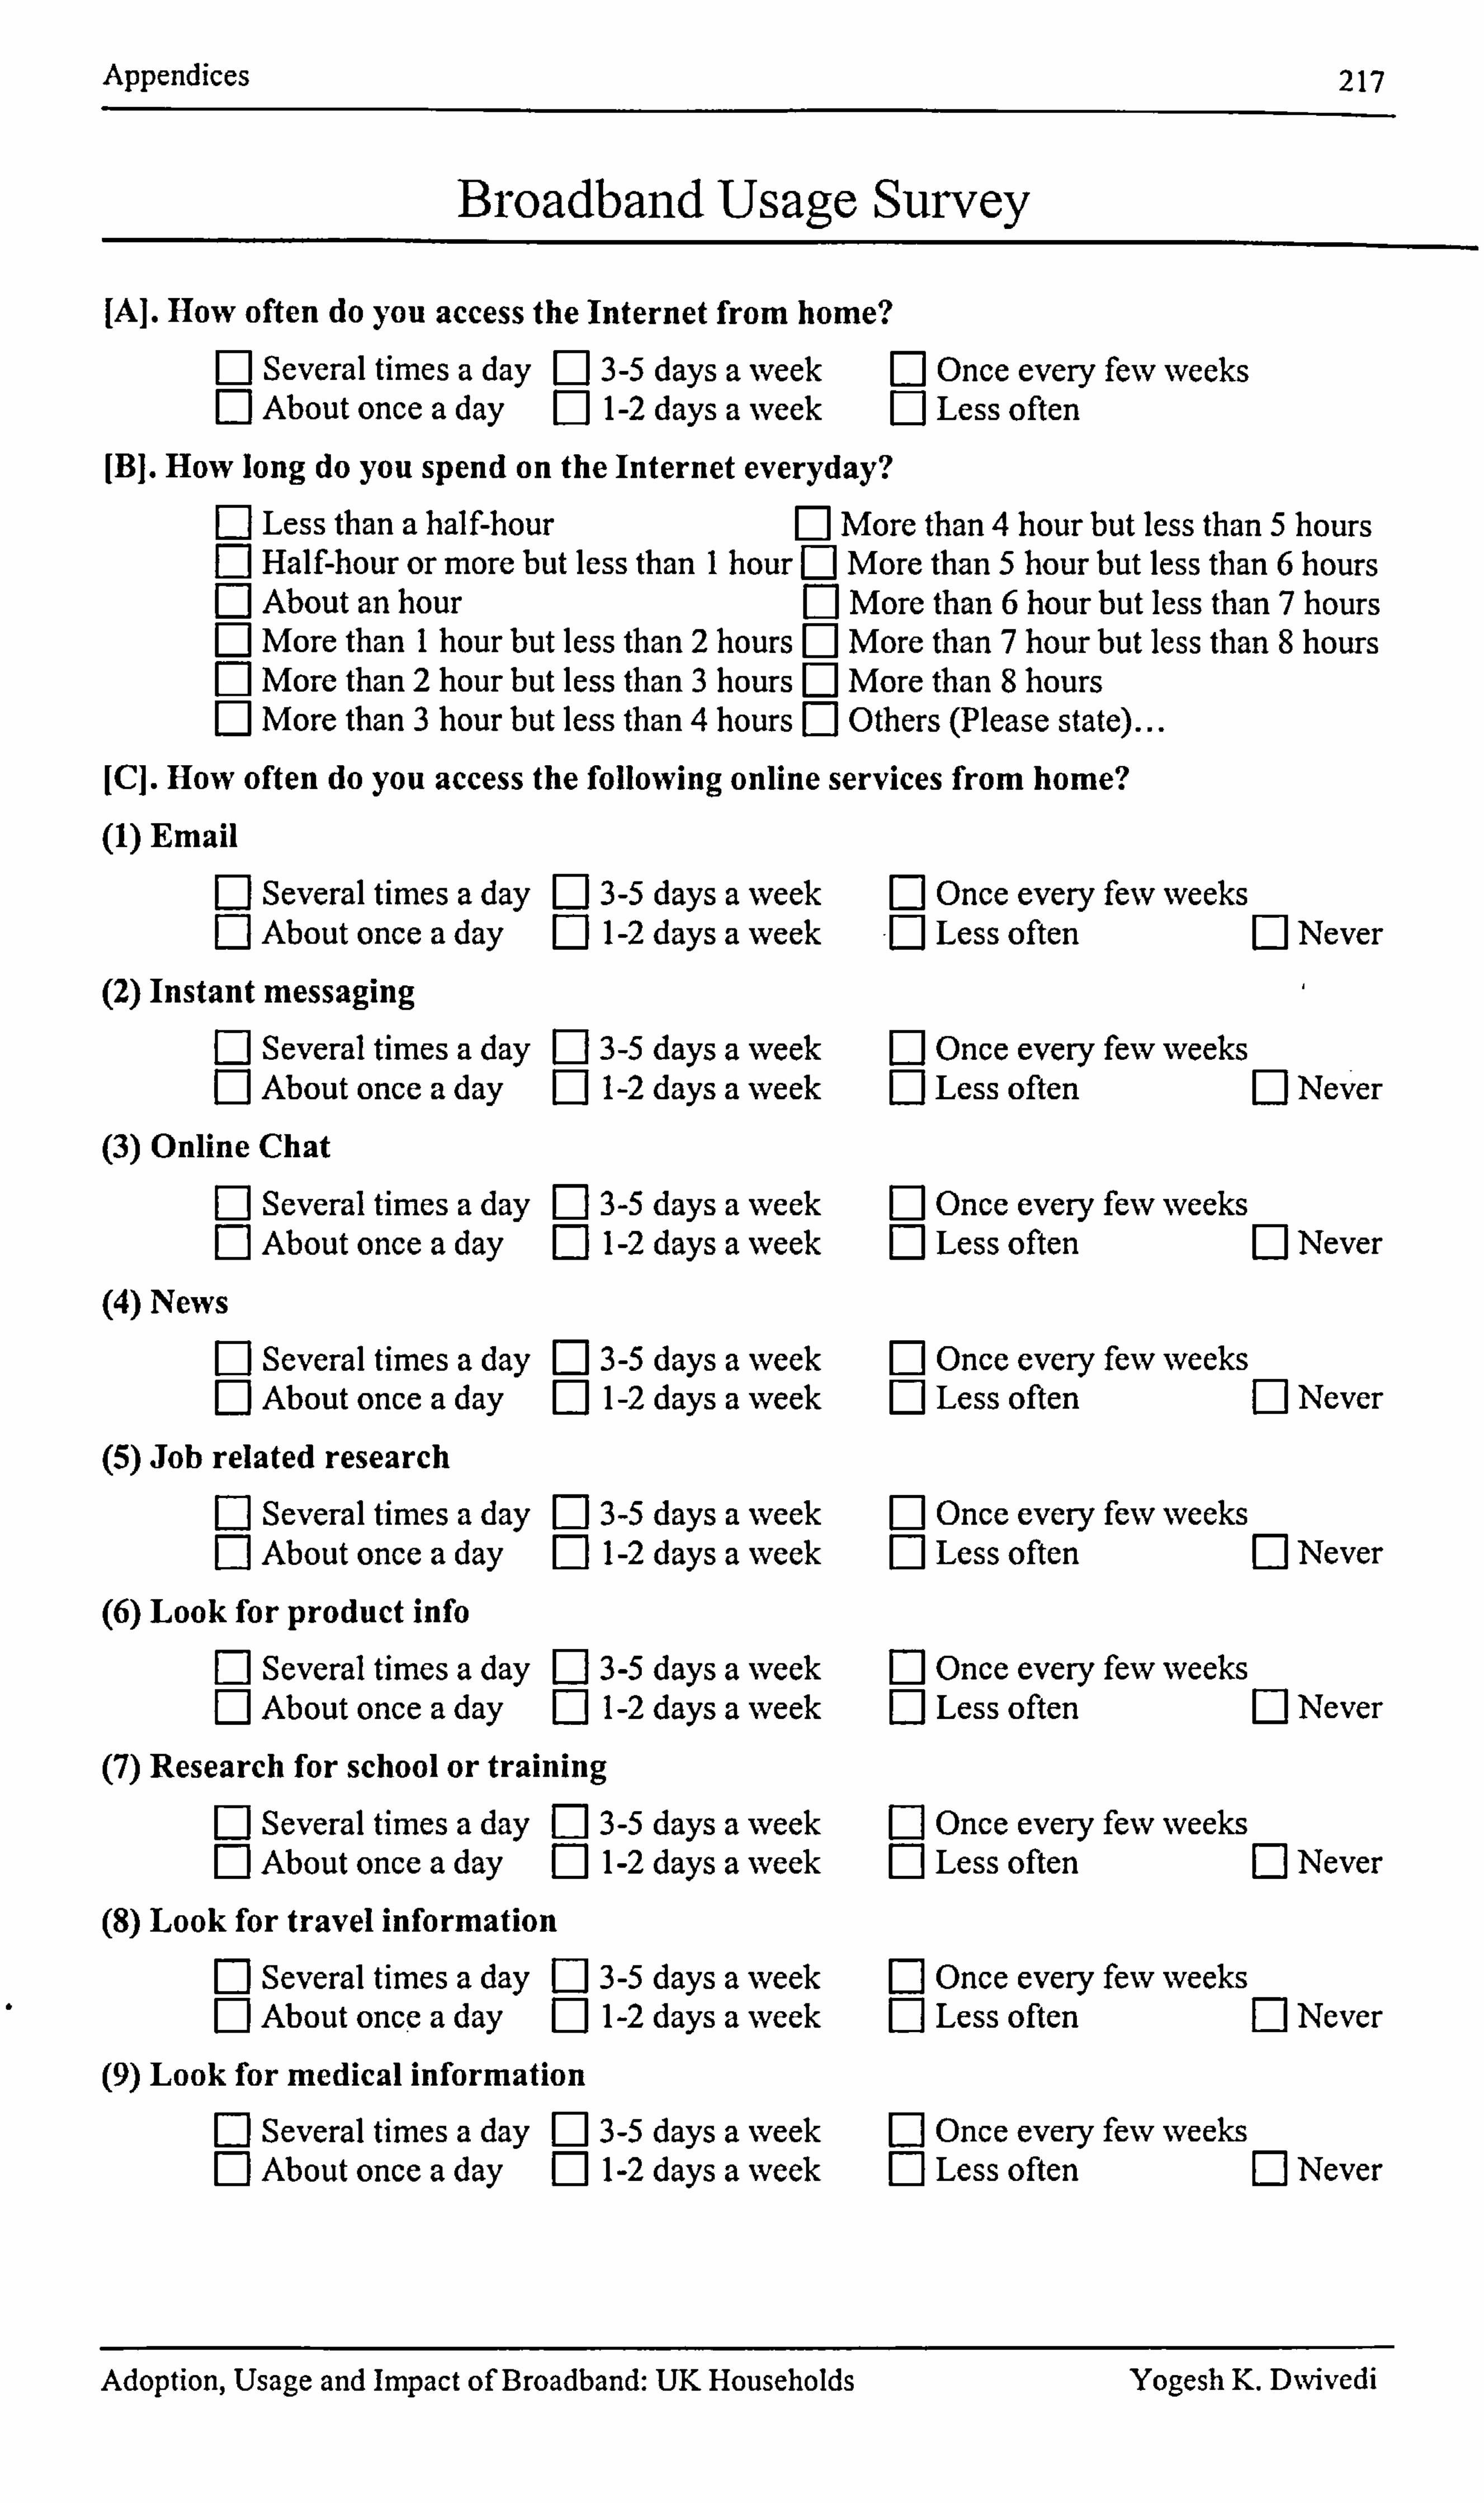
Appendices 217
Broadband Usage Survey
[A]. How often do you access the Internet from home? F] Several times a day 3-5 days a week El Once every few weeks R About once a day 1-2 days a week [: ] Less often
[B]. How long do you spend on the Internet everyday? Less than a half-hour F1 More than 4 hour but less than 5 hours Half-hour or more but less than I hour M More than 5 hour but less than 6 hours About an hour F] More than 6 hour but less than 7 hours More than 1 hour but less than 2 hours M More than 7 hour but less than 8 hours More than 2 hour but less than 3 hours El More than 8 hours
F] More than 3 hour but less than 4 hours [I Others (Please state)... [C]. How often do you access the following online services from home?
(1) Email R Several times a day Ej 3-5 days a week Ej Once every few weeks F1 About once a day [] 1-2 days a week [: ] Less often [: 1 Never
(2) Instant messaging Fj Several times a day El 3-5 days a week Ej Once every few weeks F] About once a day Ej 1-2 days a week Ej Less often [: ] Never
(3) Online Chat
F] Several times a day El 3-5 days a week [: 1 Once every few weeks n About once a day Ej 1-2 days a week El Less often [: 1 Never
(4) News F] Several times a day El 3-5 days a week [I Once every few weeks R About once a day E] 1-2 days a week El Less often El Never
(5) Job related research F] Several times a day 3-5 days a week El Once every few weeks n About once a day 1-2 days a week 0 Less often El Never
(6) Look for product info f-1 Several times a day El 3-5 days a week El Once every few weeks F-1 About once a day [: ] 1-2 days a week E] Less often [: 1 Never
(7) Research for school or training R Several times a day El 3-5 days a week E] Once every few weeks r-I About once a day El 1-2 days a week El Less often El Never
(8) Look for travel information Fý Several times a day El 3-5 days a week E] Once every few weeks R About once a day E] 1-2 days a week El Less often [I Never
(9) Look for medical information
M Several times a day 3-5 days a week El Once every few weeks Fý About once a day 1-2 days a week Fý Less often El Never
Adoption, Usage and Impact of Broadband: UK Households Yogesh K. D%vivedi
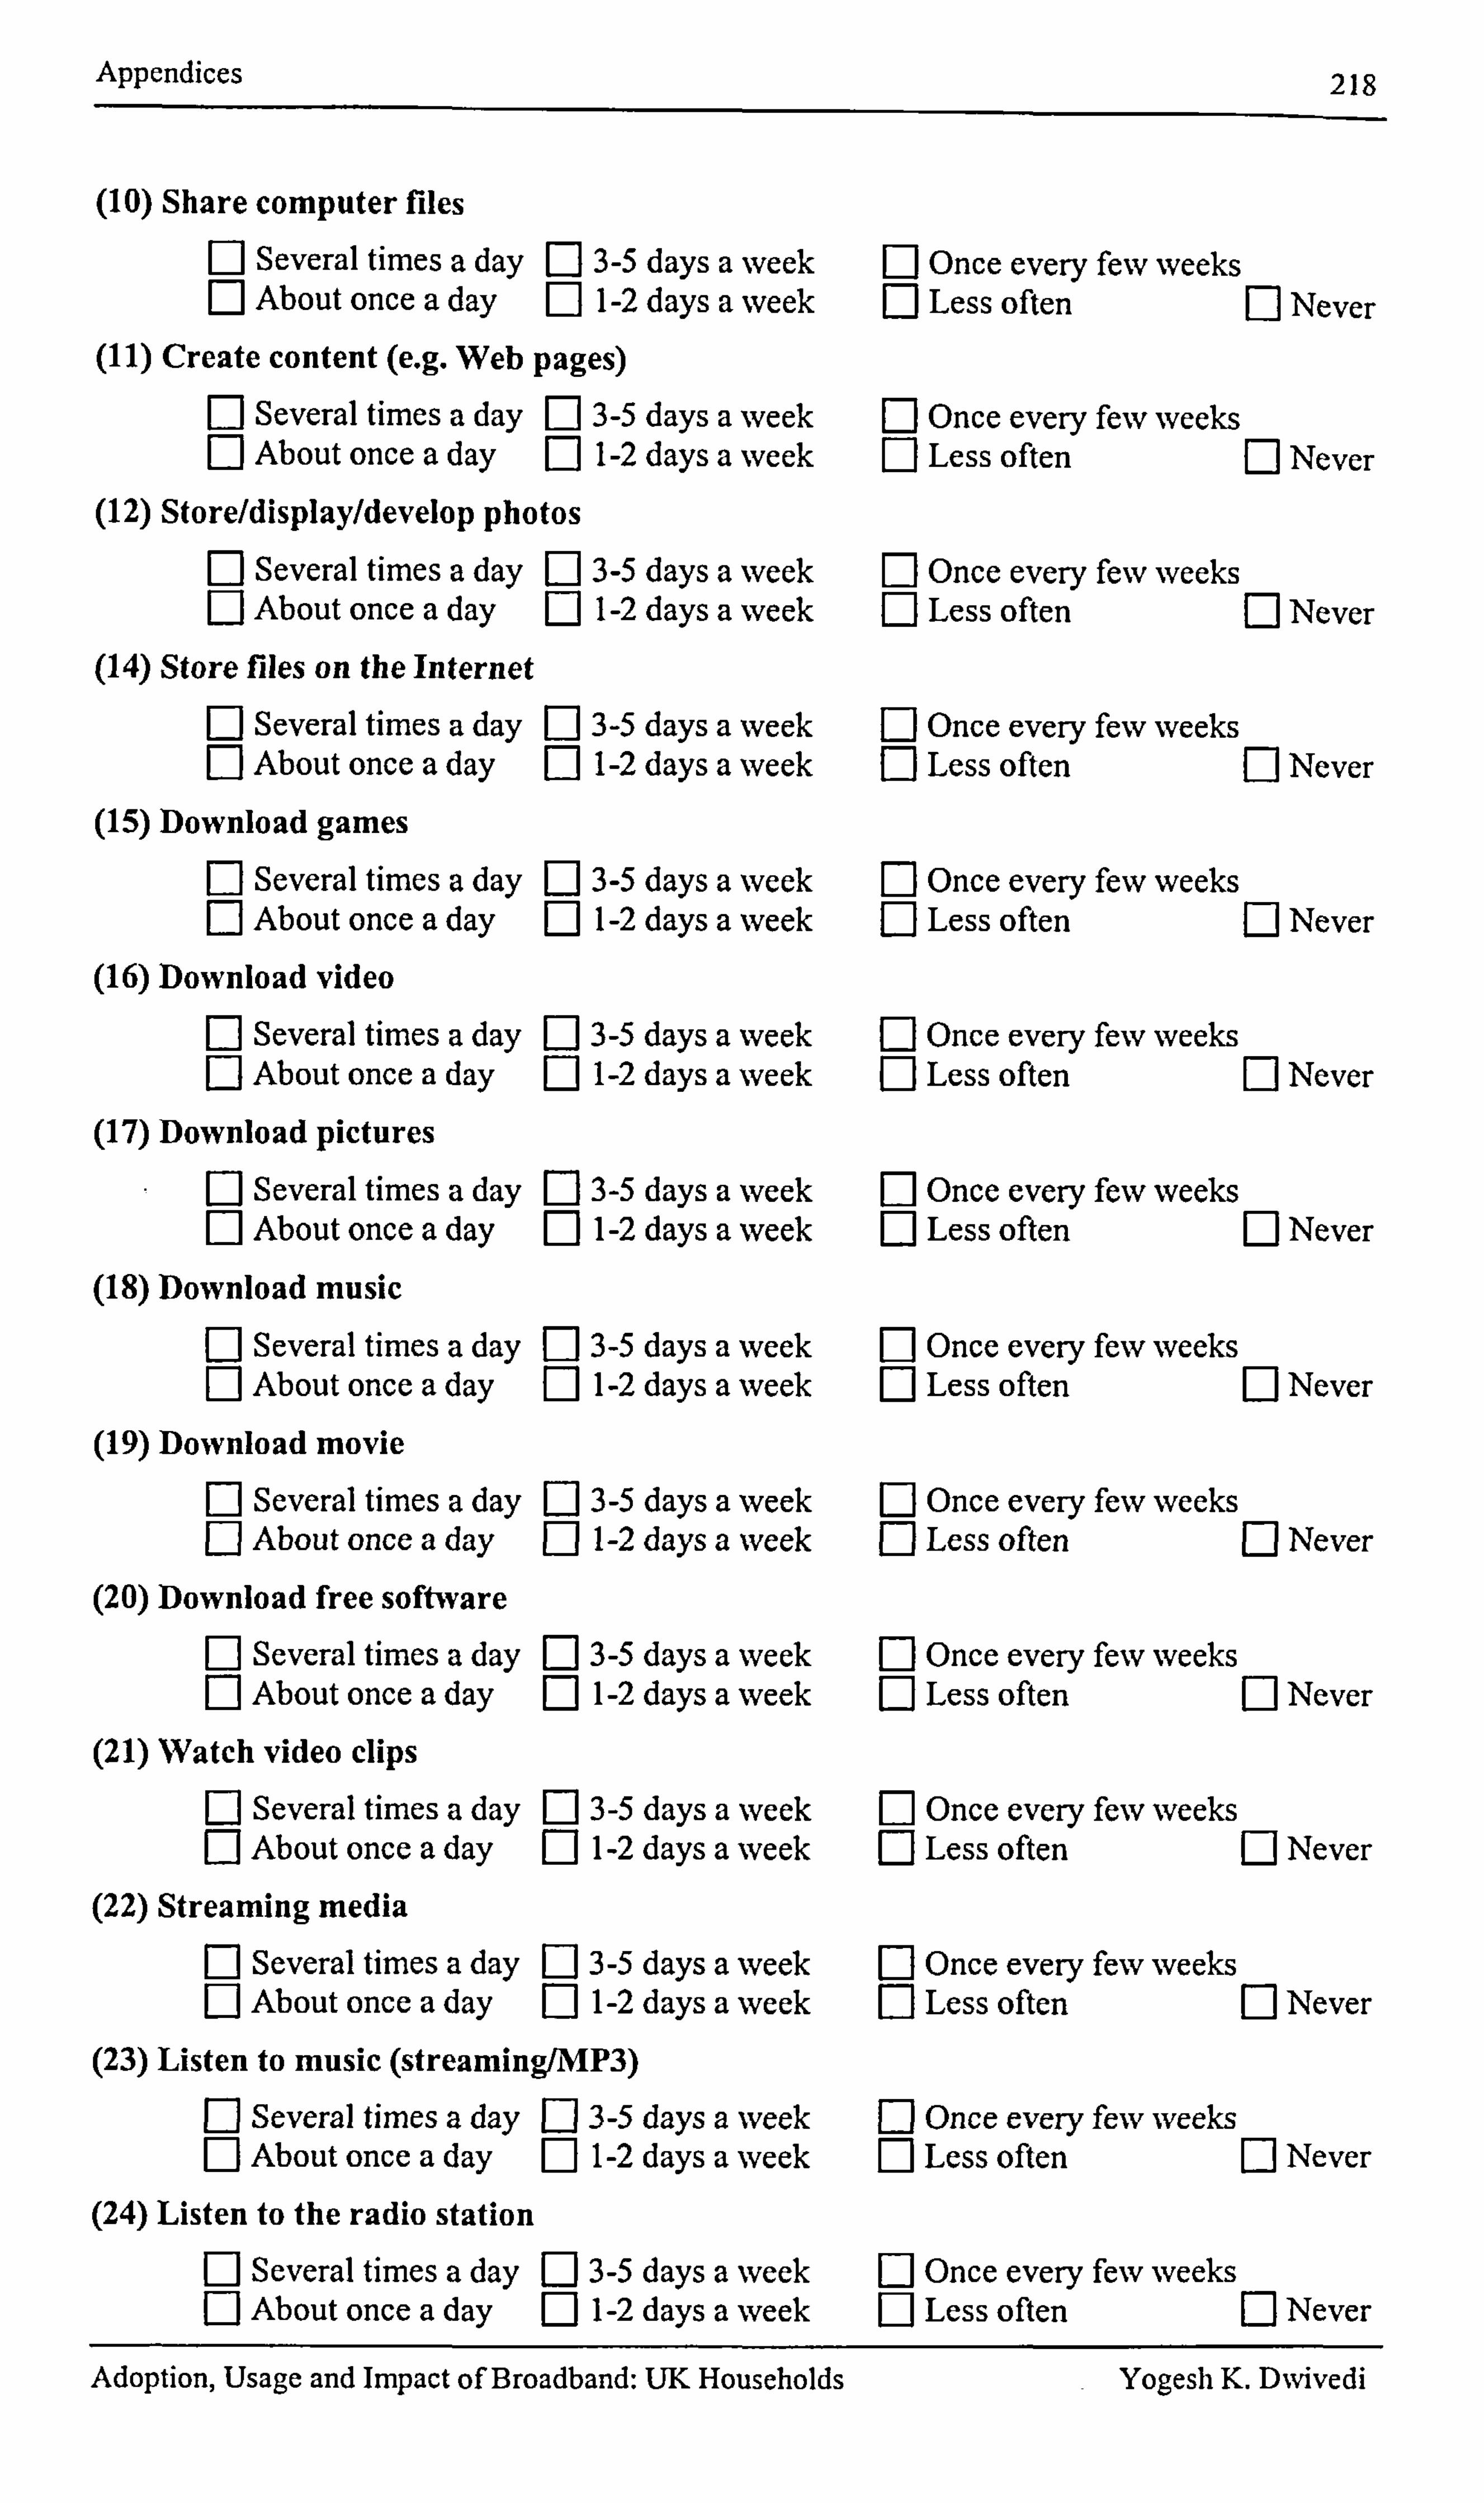
Appendices 218
(10) Share computer riles F] Several times a day [] 3-5 days a week El Once every few weeks n About once a day El 1-2 days a week Ej Less often 0 Never
(11) Create content (e. g. Web pages) Fý Several times a day 3-5 days a week Once every few weeks r-1 About once a day 1-2 days a week El Less often [I Never
(12) Store/display/develop photos F-1 Several times a day Ej 3-5 days a week El Once every few weeks F1 About once a day [: ] 1-2 days a week Ej Less often [] Never
(14) Store flies on the Internet F] Several times a day El 3-5 days a week [: 1 Once every few weeks n About once a day [11-2 days a week E] Less often El Never
(15) Download games Several times a day [: 13-5 days a week [I Once every few weeks About once a day Ej 1-2 days a week E] Less often [I Never
(16) Download video Fý Several times a day Ej 3-5 days a week El Once every few weeks F] About once a day Ej 1-2 days a week Ej Less often Ej Never
(17) Download pictures n Several times a day El 3-5 days a week F-1 Once every few weeks El About once a day El 1-2 days a week Ej Less often Ej Never
(18) Download music F] Several times a day n 3-5 days a week [I Once every few weeks F] About once a day El 1-2 days a week Ej Less often [] Never
(19) Download movie Several times a day El 3-5 days a week El Once every few weeks About once a day Ej 1-2 days a week EDLess often El Never
(20) Download free sofitware
Several times a day El 3-5 days a week El Once every few weeks About once a day El 1-2 days a week E] Less often [: ] Never
(21) Watch video clips F] Several times a day El 3-5 days a week El Once every few weeks n About once a day El 1-2 days a week El Less often [: 1 Never
(22) Streaming media M Several times a day El 3-5 days a week El Once every few weeks F1 About once a day E] 1-2 days a week [: ] Less often El Never
(23) Listen to music (streaming/MP3)
Several times a day [13-5 days a week R Once every few weeks About once a day Ej 1-2 days a week El Less often El Never
(24) Listen to the radio station F] Several times a day [: 13-5 days a week E] Once every few weeks f-1 About once a day F1 1-2 days a week E] Less often E] Never
Adoption, Usage and Impact of Broadband: UK Households Yogesh K. DNvivedi
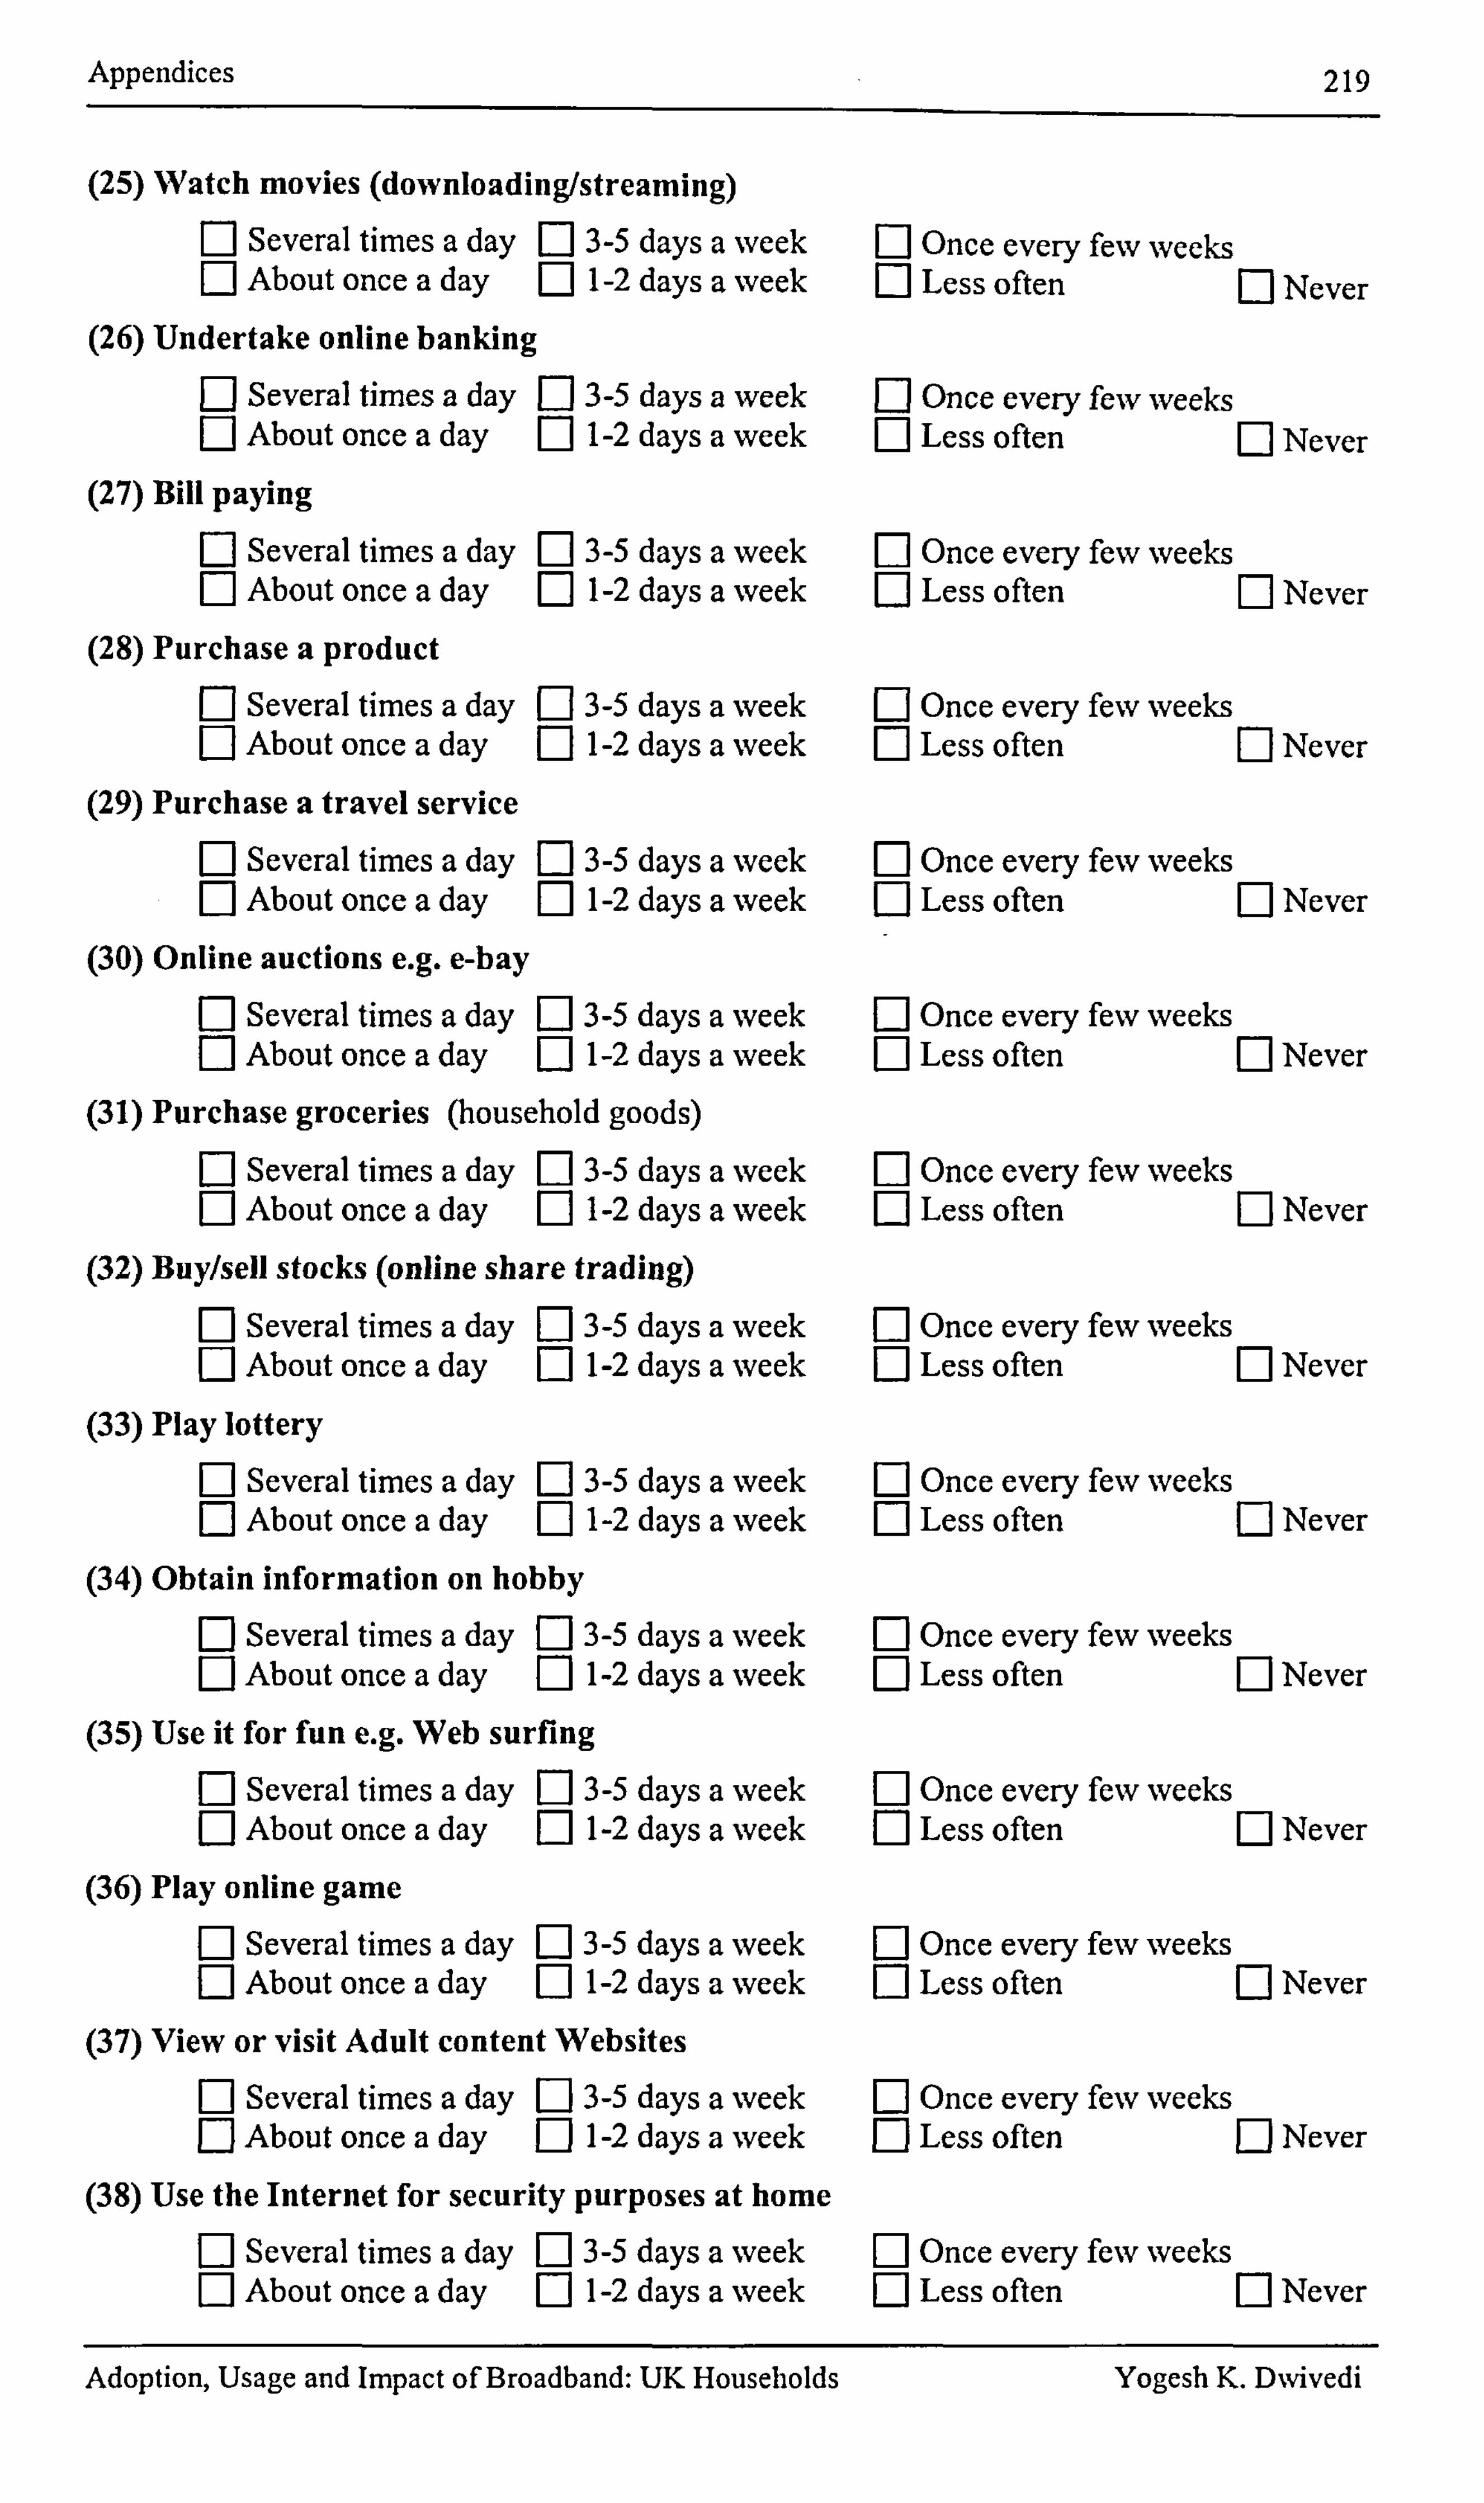
Appendices 219
(25) Watch movies (downloading/streaming)
F] Several times a day [: 13-5 days a week Ej Once every few weeks F] About once a day E] 1-2 days a week El Less often M Never
(26) Undertake online banking F1 Several times a day El 3-5 days a week El Once every few weeks F1 About once a day Ej 1-2 days a week [: 1 Less often [: 1 Never
(27) Bill paying Several times a day El 3-5 days a week El Once every few weeks About once a day E] 1-2 days a week [: ] Less often El Never
(28) Purchase a product F-1 Several times a day r-I 3-5 days a week F1 About once a day F1 1-2 days a week
(29) Purchase a travel service Several times a day 3-5 days a week About once a day 1-2 days a week
(30) Online auctions e. g. e-bay R Several times a day M 3-5 days a week Fý About once a day F] 1-2 days a week
(31) Purchase groceries (household goods) F-1 Several times a day R 3-5 days a week F1 About once a day F1 1-2 days a week
n Once every few weeks El Less often El Never
Once every few weeks Less often E] Never
F] Once every few weeks F] Less often E] Never
Once every few weeks Less often [] Never
(32) Buy/sell stocks (online share trading) R Several times a day El 3-5 days a week Once every few weeks F1 About once a day Ej 1-2 days a week El Less oflen El Never
(33) Play lottery F] Several times a day El 3-5 days a week Once every few weeks E] About once a day [: ] 1-2 days a week El Less often El Never
(34) Obtain information on hobby D Several times a day El 3-5 days a week El Once every few weeks F] About once a day El 1-2 days a week Ej Less often 0 Never
(35) Use it for fun e. g. Web surfing M Several times a day D 3-5 days a week El Once every few weeks F] About once a day El 1-2 days a week E: ] Less often [: 1 Never
(36) Play online game Fj Several times a day El 3-5 days a week Ej Once every few weeks Ej About once a day [: ] 1-2 days a week El Less often E: ] Never
(37) View or visit Adult content Websites F] Several times a day 3-5 days a week El Once every few weeks Fý About once a day 1-2 days a week El Less often El Never
(38) Use the Internet for security purposes at home F] Several times a day El 3-5 days a week El Once every few weeks El About once a day El 1-2 days a week El Less often [: 1 Never
Adoption, Usage and Impact of Broadband: UK Households Yogesh K. D%vivedi
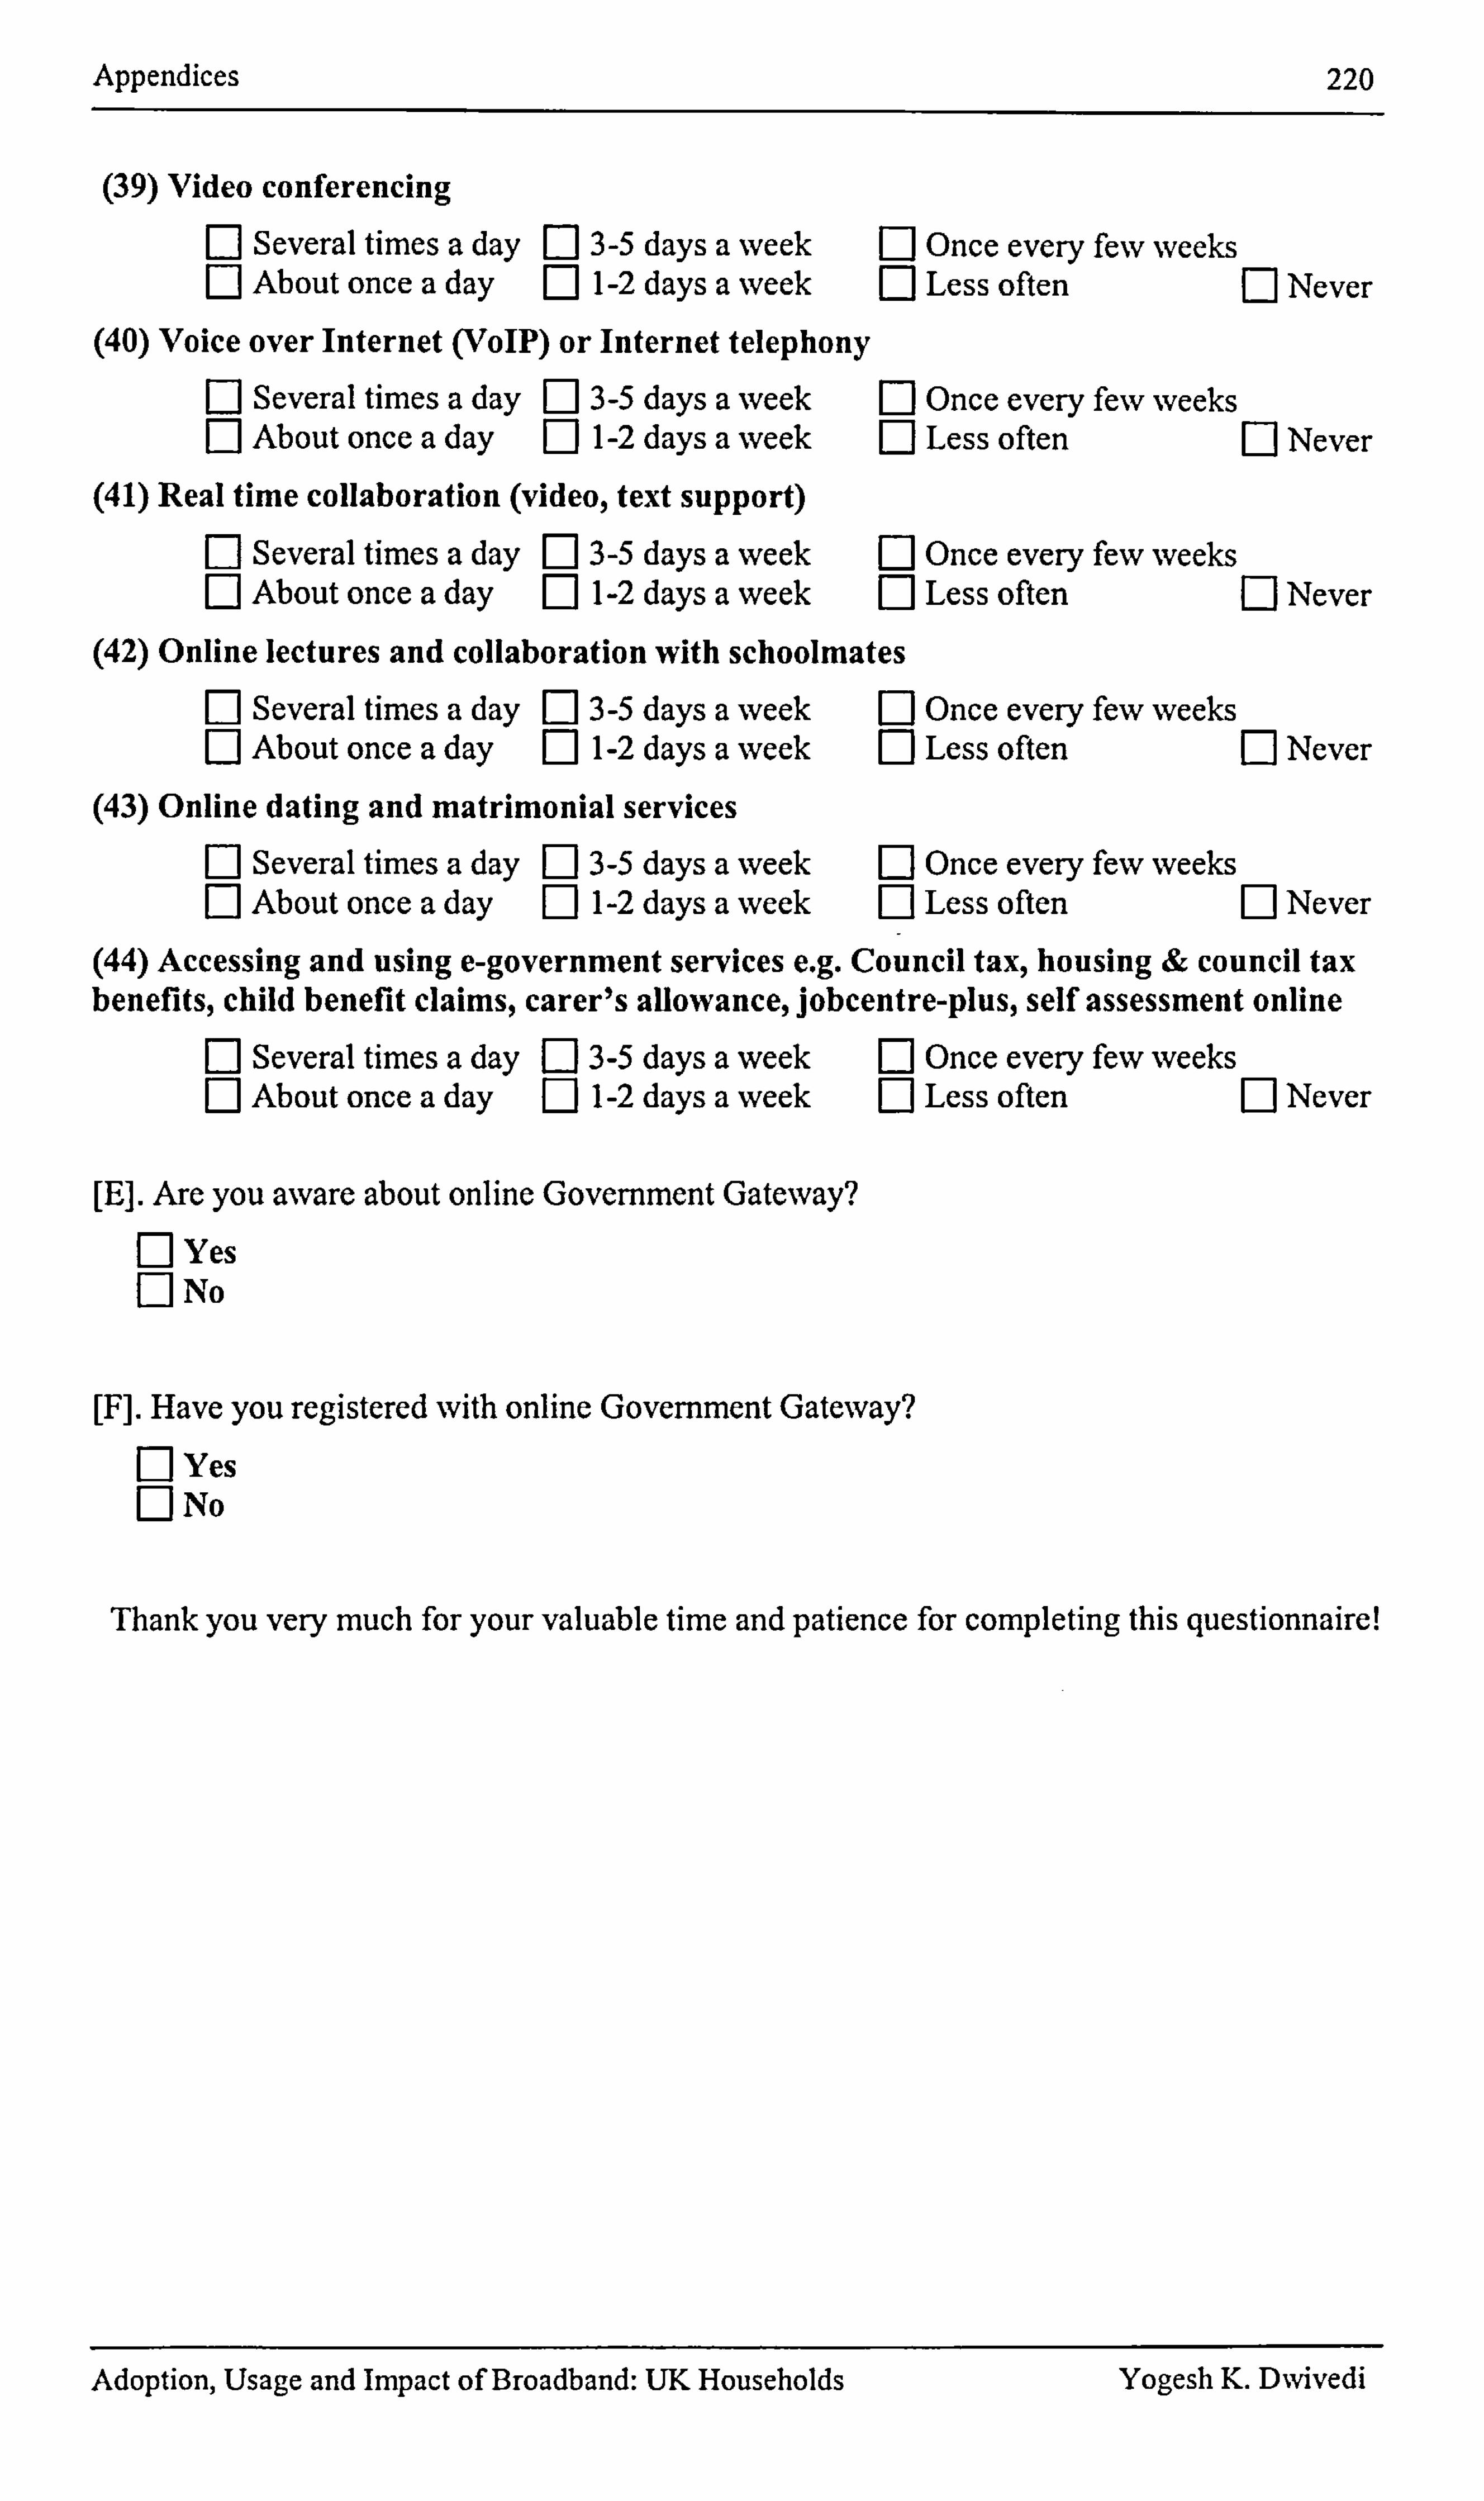
Appendices 220
(39) Video conferencing F-1 Several times a day 3-5 days a week n About once a day 1-2 days a week
(40) Voice over Internet (VoIP) or Internet telephony F] Several times a day F] 3-5 days a week n About once a day n 1-2 days a week
(41) Real time collaboration (video, text support) Several times a day R 3-5 days a week About once a day F1 1-2 days a week
[I Once every few weeks El Less often El Never
El Once every few weeks El Less often El Never
M Once every few weeks El Less often [: 1 Never
(42) Online lectures and collaboration with schoolmates Several times a day El 3-5 days a week About once a day F1 1-2 days a week
(43) Online dating and matrimonial services Several times a day 3-5 days a week About once a day 1-2 days a week
Fl Once every few weeks El Less often E] Never
Fl Once every few weeks El Less often [: 1 Never
(44) Accessing and using e-government services e. g. Council tax, housing & council tax benefits, child benefit claims, carer's allowance, jobcentre-plus, self assessment online
Several times a day F1 3-5 days a week About once a day F] 1-2 days a week
[E]. Are you aware about online Government Gateway?
Yes No
M Once every few weeks El Less often [: ] Never
[F]. Have you registered with online Government Gateway? Fý Yes F1 No
Thank you very much for your valuable time and patience for completing this questionnaire!
Adoption, Usage and Impact of Broadband: UK Households Yogesh K. DNvivedi

Appendices 221
APPENDIX 4.8: PILOT QUESTIONNAIRE
Department of Information Systems & Computing Brunel University Uxbridge, Middlesex, UB8 3PH
Dear Sir/Madam,
You are kindly requested to participate in a pilot study that is part of a nationwide survey research being conducted by Yogesh DNvivedi, a PhD candidate, under the supervision of Dr Jyoti Choudrie, Director of Operations, Brunel Broadband Research Centre in the School of Information Systems, Computing and Mathematics, Brunel University.
The aim of this research is to "investigate broadband adoption, usage and impact in the UK household". The questionnaire consists of a number of questions that should take approximately 15 minutes to complete. Please tick all appropriate answers. If your answer is not displayed, then please state your answer in the "other" option category. Participation is voluntary. You may omit any questions that you do not wish to answer.
Since this is a pilot study your comments will be valuable to improve the questionnaire. Please suggest how long it takes to complete questionnaire, if the length is appropriate and if the questions are understandable.
None of the information provided by the participants will be disclosed or used in any monetary, political or institutional way.
Your name will not be revealed in any of the documents unless you grant permission. A code number will be used to protect your identity.
Data will be kept with the investigator and supervisor and will be destroyed after completion of this dissertation.
Please return the completed questionnaire in the self addressed stamped envelopes enclosed with the questionnaire. If you have any questions about this study, please contact the investigators on the following address: Yogesh Dwivedi, PhD Student, School of Infon-nation Systems, Computing and Mathematics, Brunel University, Uxbridge, Middlesex UB8 3PH, United Kingdom, email: cspgykd(o-), brunel. ac. uk, phone: (01895) 265969. To confirm the validity of this research, you may contact Dr. Choudrie at the following address: Dr. Jyoti Choudrie, Director of Operations, Brunel Broadband Research Centre, School of Information Systems, Computing and Mathematics, Brunel University, Uxbridge, Middlesex, U138 3PH, UK. Telephone: (0 1895) 266012 and email: Jyoti. Choudrie(a-)brunel. ac. uk
We would like to take this opportunity to thank you for your time and patience in completing this questionnaire!
Adoption, Usage and Impact of Broadband: UK Households Yogesh K. DNvivedi
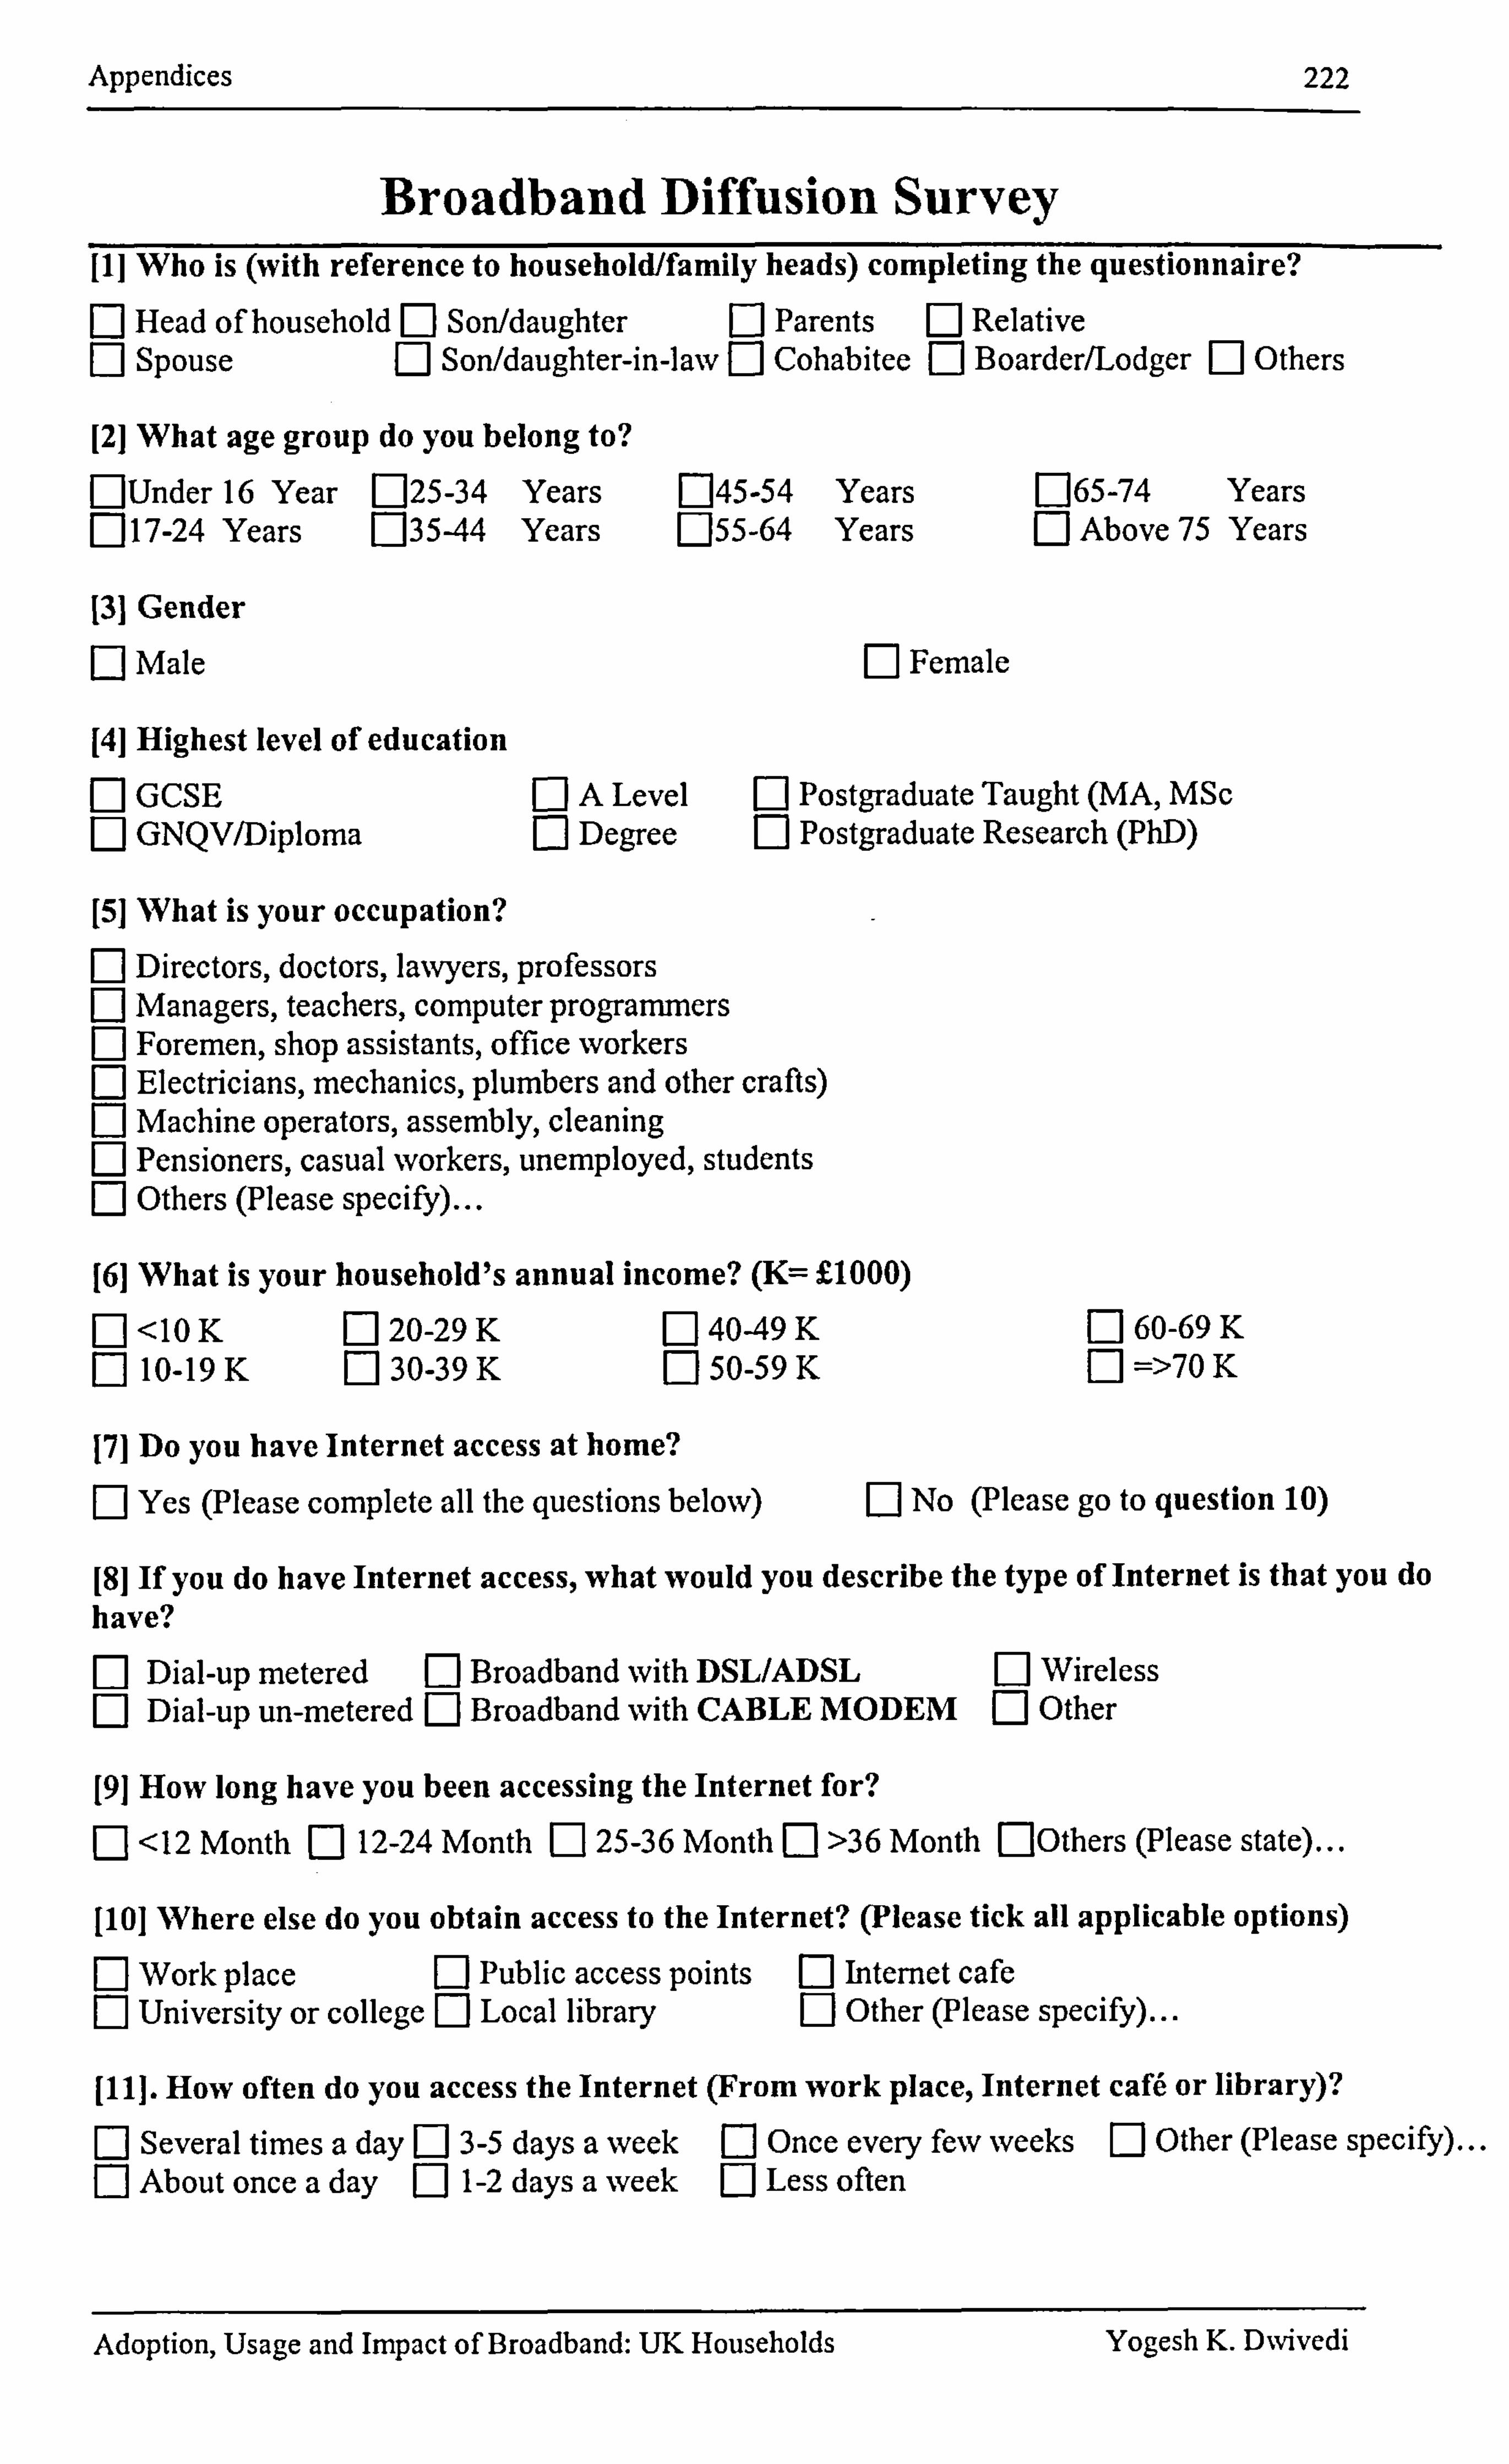
Appendices
Broadband Diffusion Survey
222
[I] Who is (with reference to household/family heads) completing the questionnaire? n Head of household Son/daughter El Parents El Relative F1 Spouse Son/daughter-in-law Ej Cohabitee E] Boarder/Lodger El Others
[21 What age group do you belong to? FlUnder 16 Year E125-34 Years E145-54 Years E165-74 Years F] 17-24 Years F135-44 Years 055-64 Years EJ Above 75 Years
131 Gender [: ] Male El Female
[41 Highest level of education F1 GCSE EJ A Level El Postgraduate Taught (MA, MSc F1 GNQV/Diploma [: ] Degree n Postgraduate Research (PhD)
[51 What is your occupation? Fý Directors, doctors, lawyers, professors F-1 Managers, teachers, computer programmers F1 Foremen, shop assistants, office workers EJ Electricians, mechanics, plumbers and other crafts) n Machine operators, assembly, cleaning F] Pensioners, casual workers, unemployed, students n Others (Please specify)...
[61 What is your household's annual income? (K= E1000) F1 <10 K El 20-29 K [: 140-49 K El 60-69 K E] 10-19 K El 30-39 K El 50-59 K =>70 K
171 Do you have Internet access at home? n Yes (Please complete all the questions below) [: ] No (Please go to question 10)
[81 If you do have Internet access, what would you describe the type of Internet is that you do have?
Dial-up metered n Broadband with DSL/ADSL El Wireless Dial-up un-metered n Broadband with CABLE MODEM Ej Other
[91 How long have you been accessing the Internet for? F1 <12 Month F1 12-24 Month El 25-36 Month Fý >36 Month ElOthers (Please state)
[101 Where else do you obtain access to the Internet? (Please tick all applicable options) Fý Workplace Ej Public access points n Internet cafe F1 University or college [: 1 Local library Ej Other (Please specify)...
[111. How often do you access the Internet (From work place, Internet caN or library)?
Ej Several times a day Ej 3-5 days a week E] once every few weeks Ej Other (Please specify) Fý About once a day Ej 1-2 days a week F] Less often
Adoption, Usage and Impact of Broadband: UK Households Yogesh K. Dwivedi
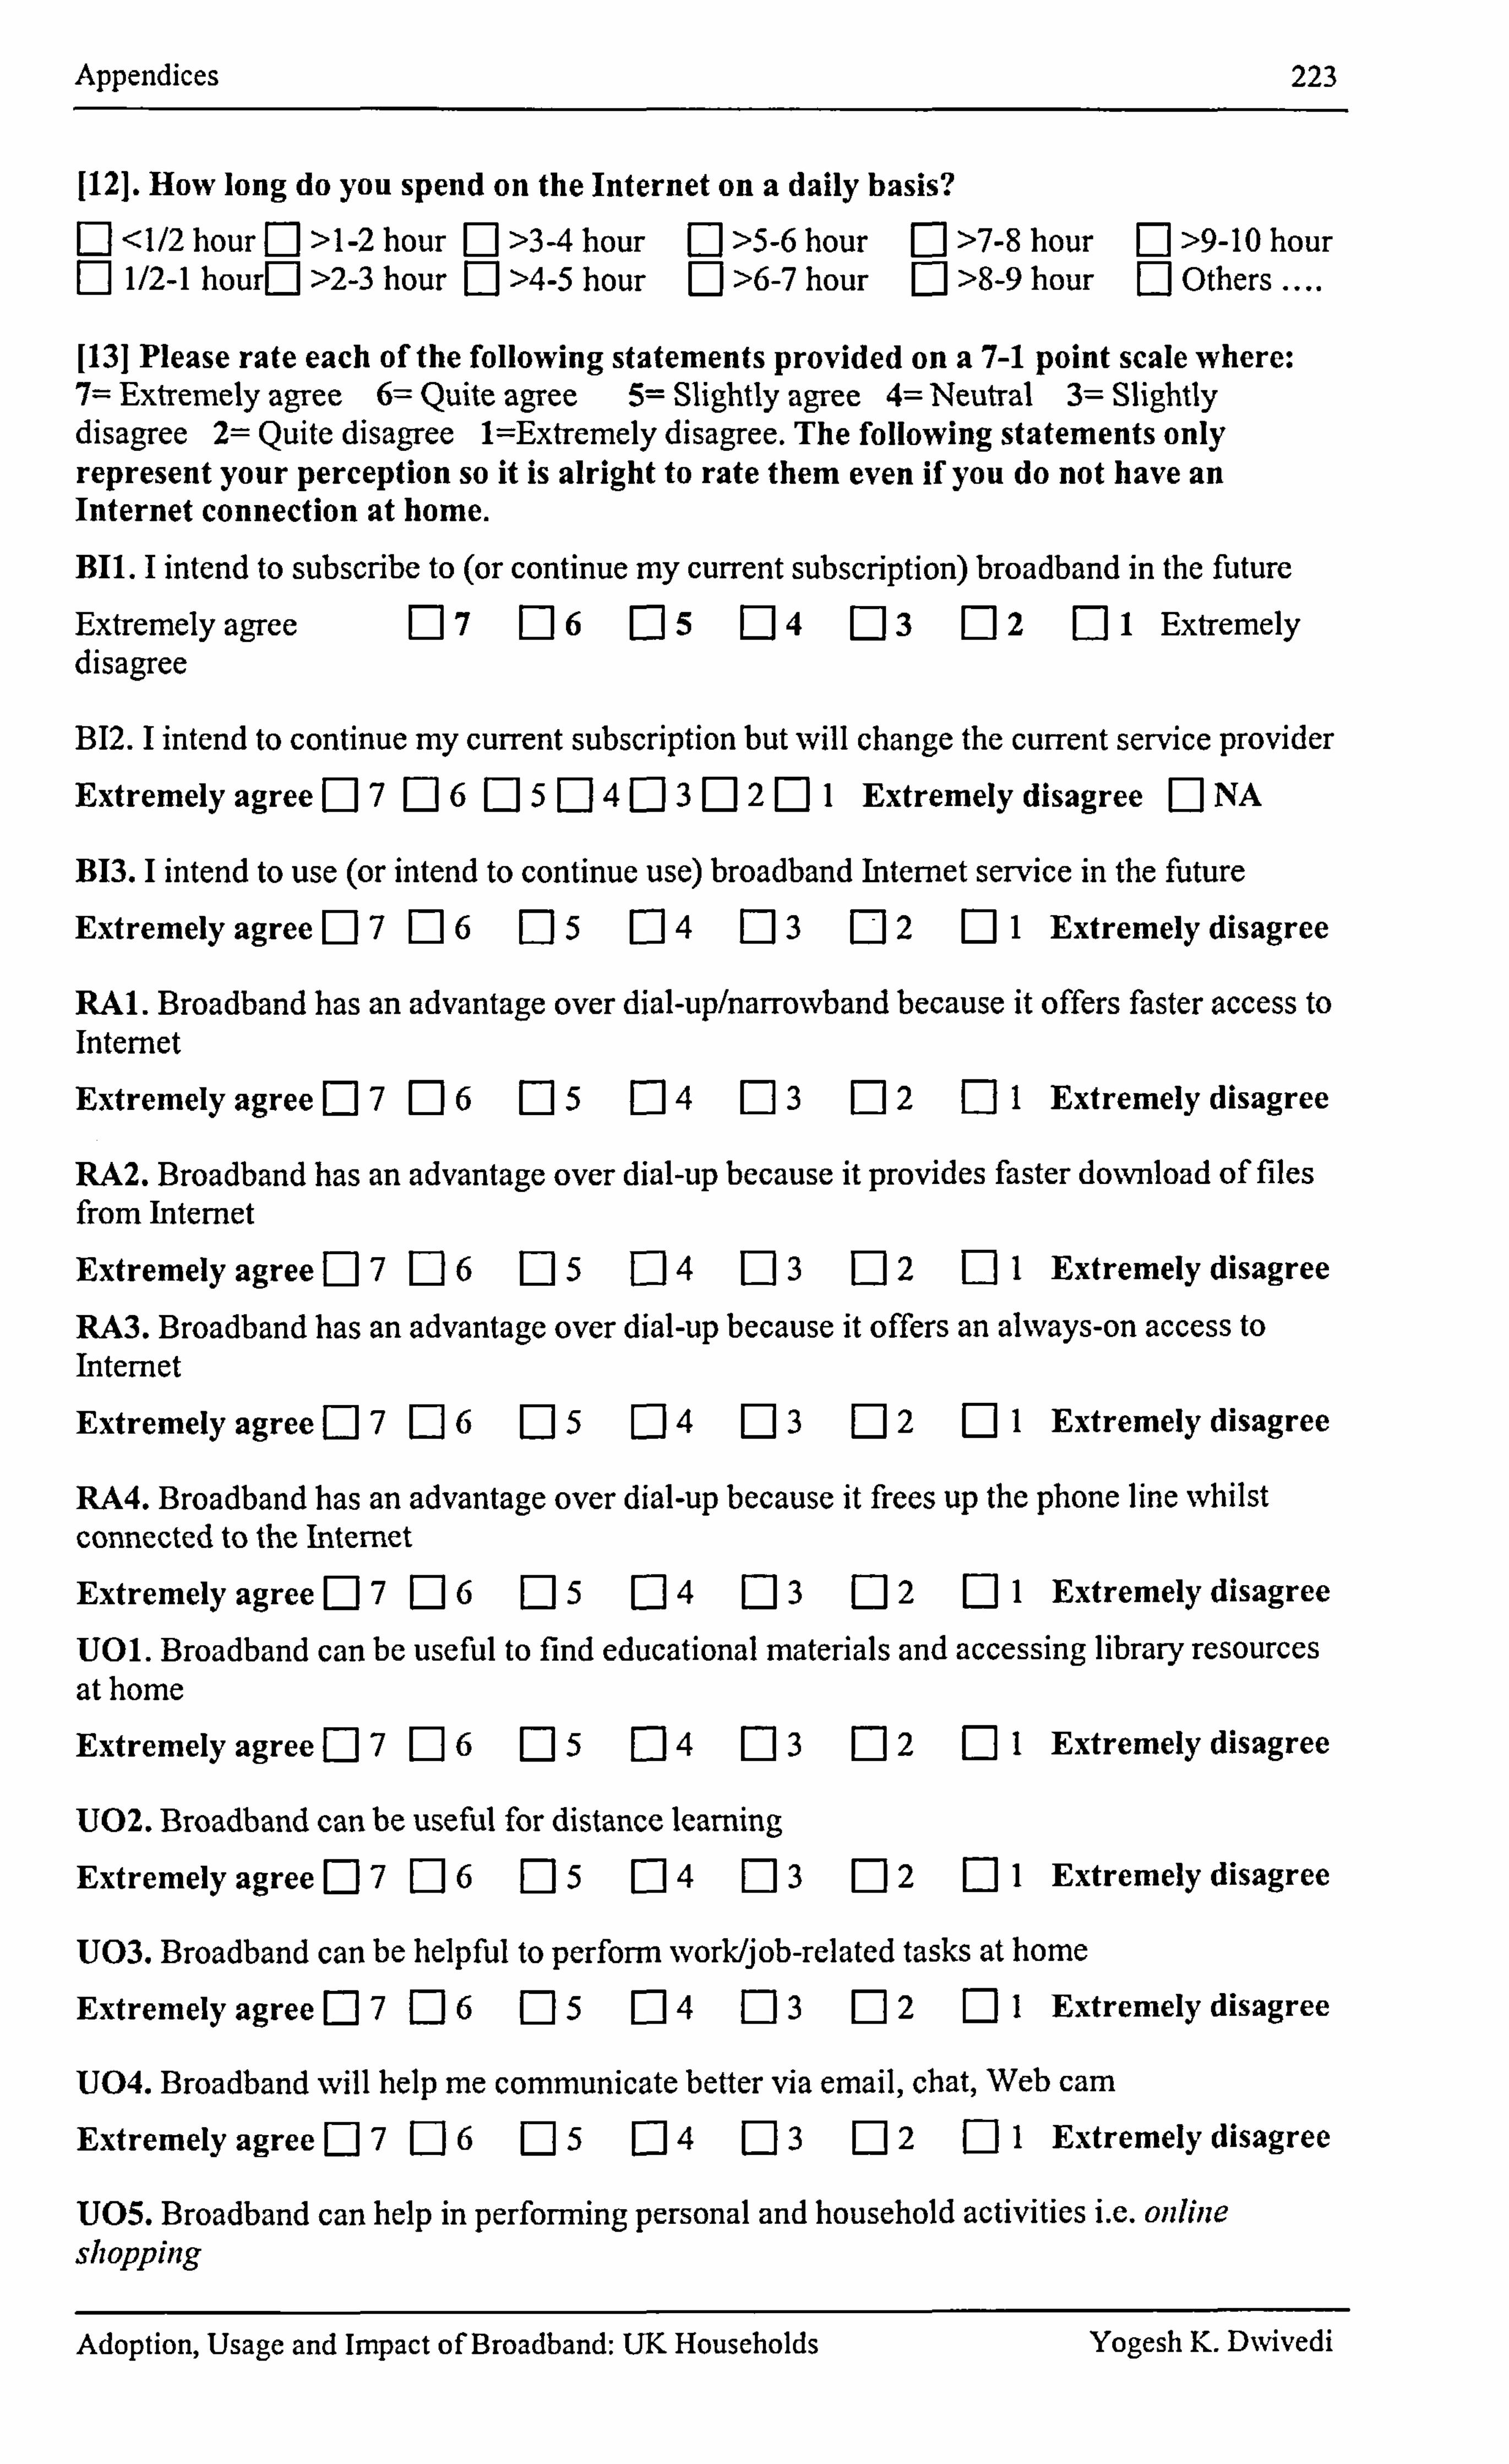
Appendices 223
1121. How long do you spend on the Internet on a daily basis? F1 <1/2 hour F1 >1-2 hour El >34 hour El >5-6 hour El >7-8 hour El >9-10 hour F1 1/2-1 hourEl >2-3 hour E] >4-5 hour Ej >6-7 hour [: ] >8-9 hour Ej Others ....
[131 Please rate each of the following statements provided on a 7-1 point scale where: 7= Extremely agree 6= Quite agree 5= Slightly agree 4= Neutral 3= Slightly disagree 2= Quite disagree 1=Extremely disagree. The following statements only represent your perception so it is alright to rate them even if you do not have an Internet connection at home.
BIL I intend to subscribe to (or continue my current subscription) broadband in the future
Extremely agree E17 E16 E15 E14 E13 [: 12 Ell Extremely disagree
B12. I intend to continue my current subscription but will change the current service provider Extremely agree [: ] 7 [: 16 [: 15 [: ] 4Ej3Ej 2E] I Extremely disagree [: ] NA
B13. I intend to use (or intend to continue use) broadband Internet service in the future
Extremely agree [: 17 E16 [15 [: 14 E13 [: 12 Ej 1 Extremely disagree
RAL Broadband has an advantage over dial-up/narrowband because it offers faster access to Internet
Extremely agreeE]7 E16 E15 E14 E: 1 3 [: 12 El 1 Extremely disagree
RA2. Broadband has an advantage over dial-up because it provides faster download of files from Internet
Extremely agreeEl 7 [: 16 E15 Ej 4 E13 E12 F1 I Extremely disagree
RA3. Broadband has an advantage over dial-up because it offers an always-on access to Internet
Extremely agree F] 7 [: 16 [: 15 Ej 4 [: 13 Ej 2 Ej I Extremely disagree
RA4. Broadband has an advantage over dial-up because it frees up the phone line whilst connected to the Internet
Extremely agree [: 17 Ej 6 [: 15 4321 Extremely disagree
U01. Broadband can be useful to find educational materials and accessing library resources at home
Extremely agree [] 7 [: ] 6 05 EJ4 ED 02 El I Extremely disagree
U02. Broadband can be useful for distance learning
Extremely agreeE] 7 El 6 El 5 E14 E13 [: 12 1 Extremely disagree
U03. Broadband can be helpful to perform work/job-related tasks at home
Extremely agreeE]7 E16 E15 E14 E13 E12 Ej I Extremely disagree
U04. Broadband will help me communicate better via email, chat, Web cam Extremely agreeE] 7 [j 6 [: ] 5 Ej 4 Ej 3 Ej 2 [11 Extremely disagree
U05. Broadband can help in performing personal and household activities i. e. oidine shopping
Adoption, Usage and Impact of Broadband: UK Households Yogesh K. Dxvivedi
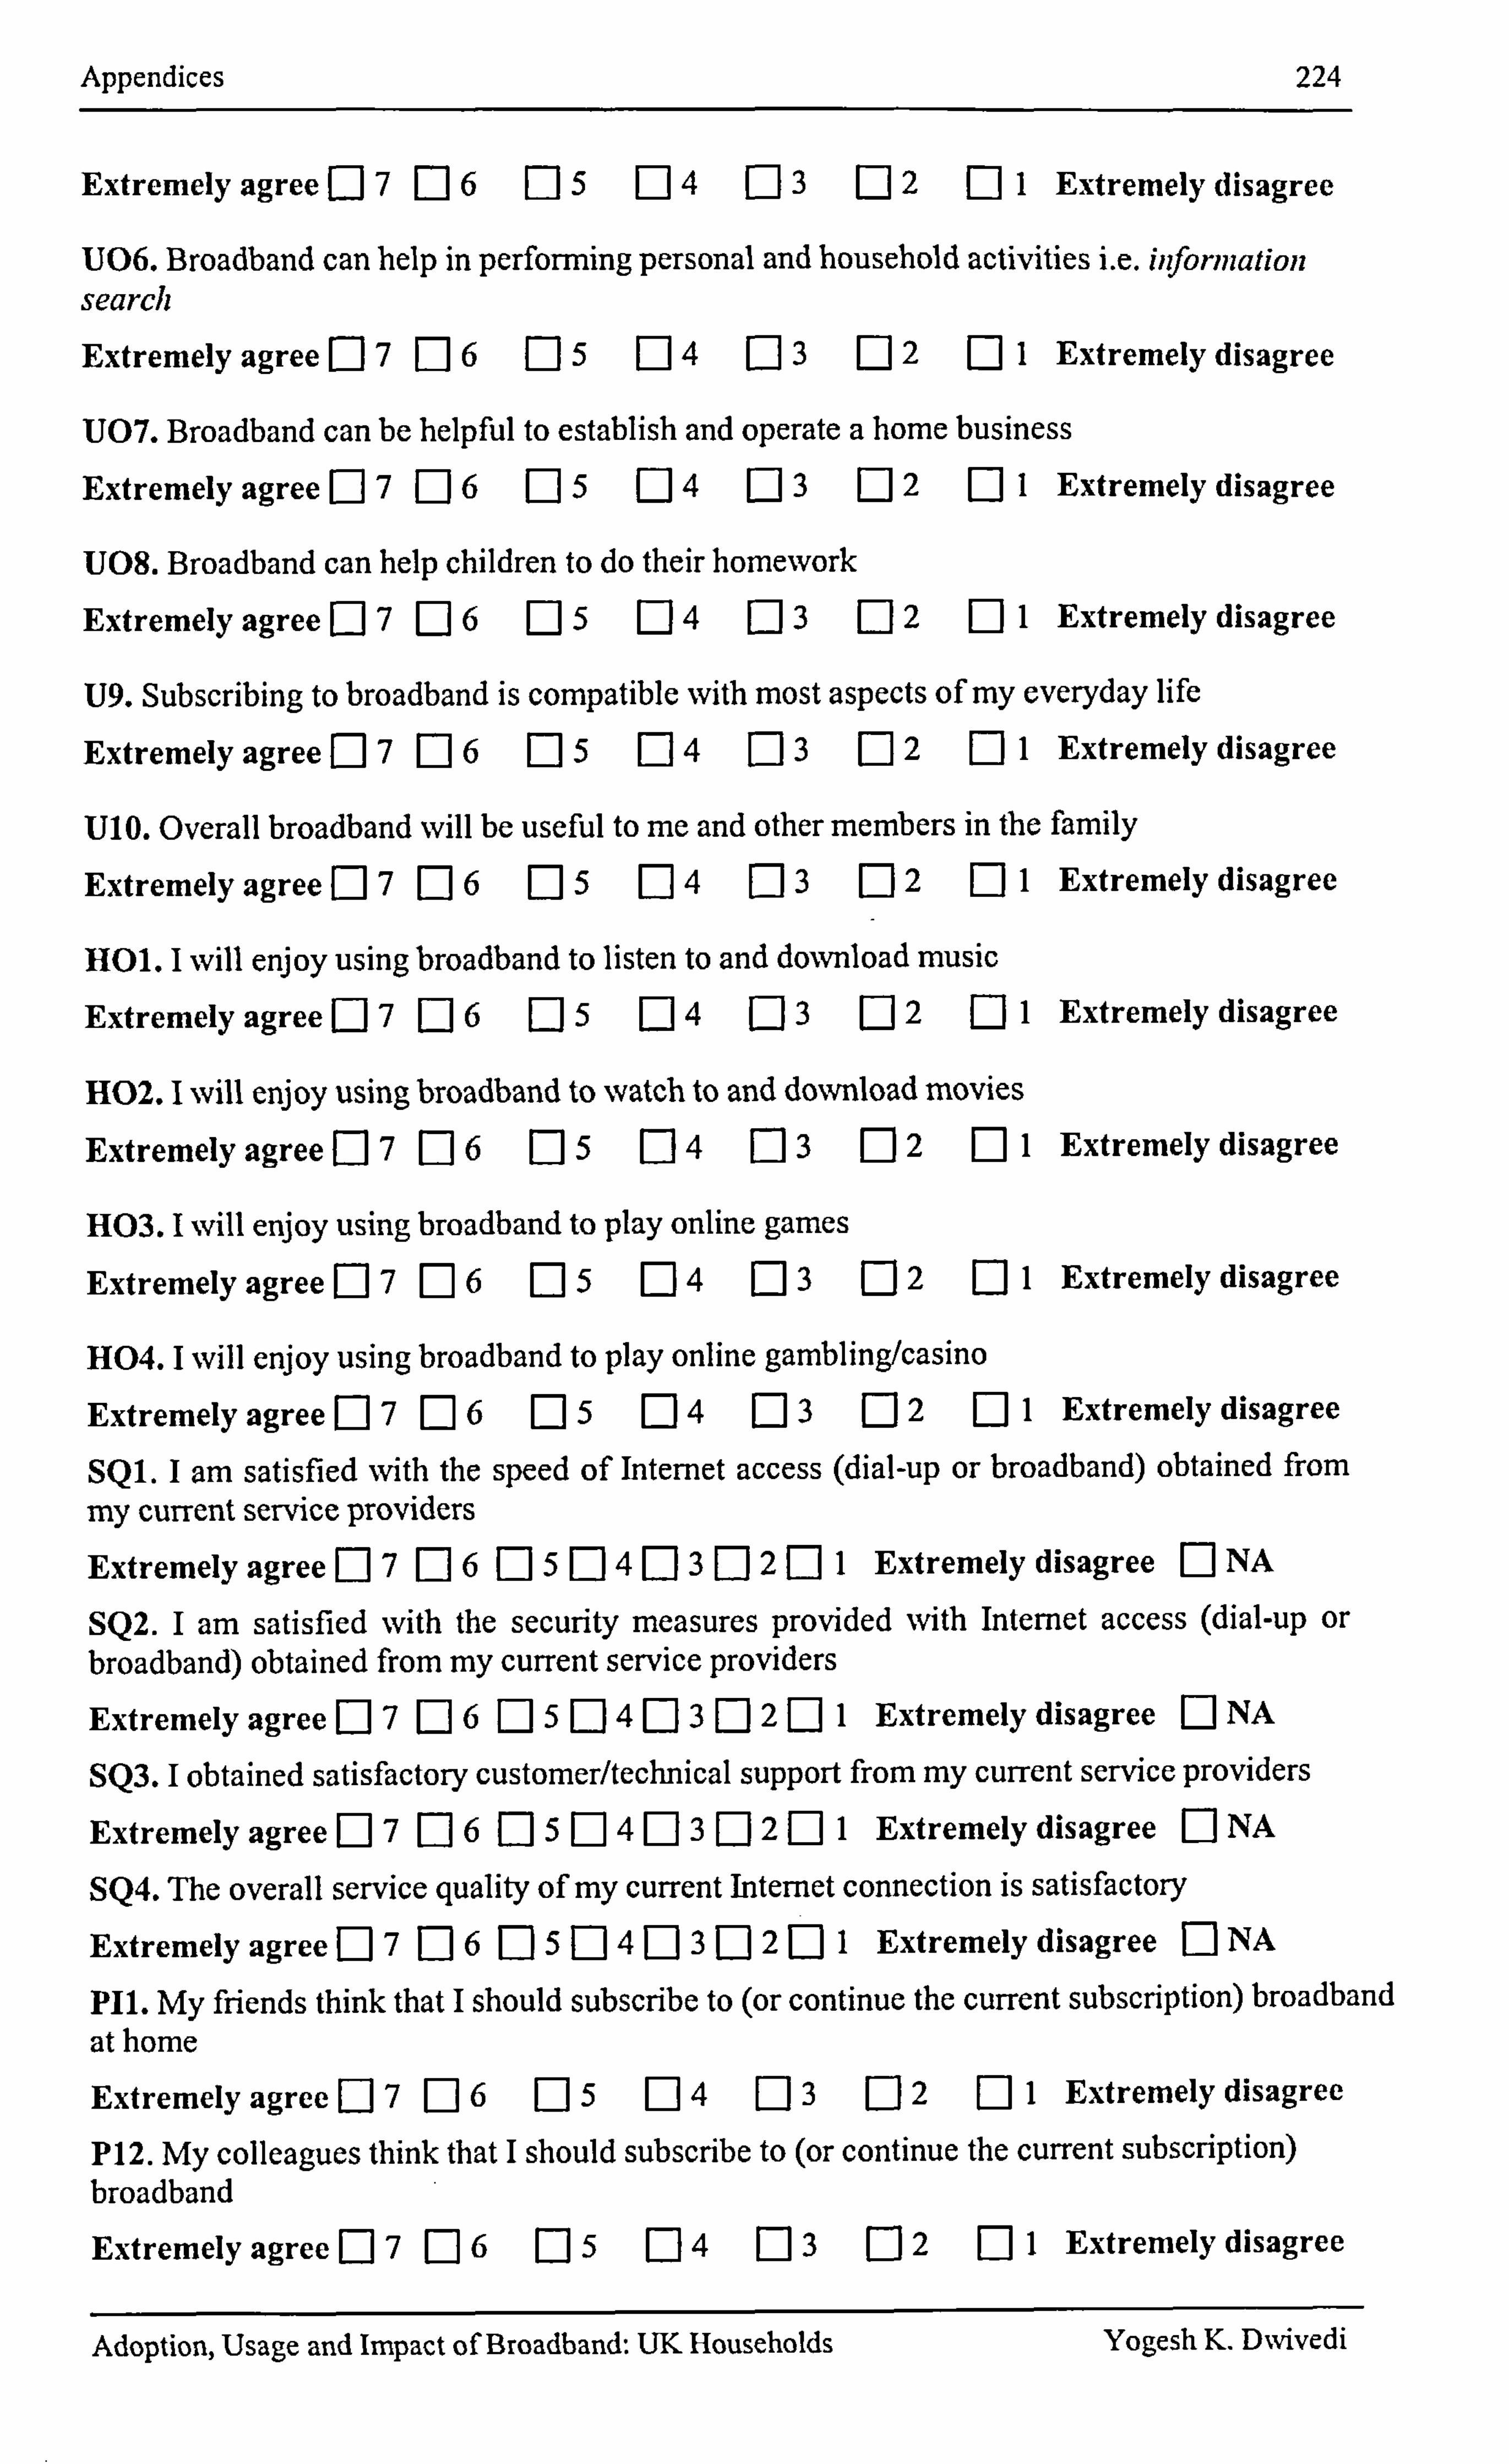
Appendices 224
Extremely agree [: 17 E16 [: 15 [: ] 4 EJ 3 [: ] 2 [: 11 Extremely disagree
U06. Broadband can help in performing personal and household activi ties i. e. information search Extremely agreeEJ7 E16 05 E14 El 3 02 El I Extremely disagree
U07. Broadband can be helpful to establish and operate a home busine ss Extremely agree [: 17 [J 6 E15 EJ 4 [: 13 2 EJ I Extremely disagree
U08. Broadband can help children to do their homework
Extremely agreeEJ7 EJ 6 El 5 E14 ED F] 2 El I Extremely disagree
U9. Subscribing to broadband is compatible with most aspects of my everyday life
Extremely agree El 7 El 6 [: 15 [: 14 [: 13 [: ] 2 [: ] I Extremely disagree
U10. Overall broadband will be useful to me and other members in the family
Extremely agreeE] 7 [: 16 EJ5 04 E13 E] 2 E] I Extremely disagree
HOL I will enjoy using broadband to listen to and download music
Extremely agree F] 7 EJ 6 E] 5 [: 14 El 3 [12 [11 Extremely disagree
H02. I will enjoy using broadband to watch to and download movies
Extremely agree [: 17 E] 6 El 5 El 4 El 3 E] 2 El I Extremely disagree
H03. I will enjoy using broadband to play online games
Extremely agree El 7 El 6 El 5 El 4 El 3 EJ 21 Extremely disagree
H04. I will enjoy using broadband to play online gambling/casino
Extremely agree [: 17 E] 6 EJ5 EJ 4 EJ3 [: ] 2 [: ] I Extremely disagree
SQI. I am satisfied with the speed of Internet access (dial-up or broadband) obtained from my current service providers Extremely agreeE] 7 [: 16 [15 [: 14 R3 [] 2 Fý I Extremely disagree [: 1 NA
SQ2. I am satisfied with the security measures provided with Internet access (dial-up or broadband) obtained from my current service providers Extremely agreeEJ 7 [: 16 [: 15 [: ] 4 [: 1 3EJ 2E] I Extremely disagree [: INA
SQ3. I obtained satisfactory customer/technical support from my current service providers
Extremely agreeEJ706 El 5 [: ] 4 [: 13 [: ] 2E] I Extremely disagree EINA
SQ4. The overall service quality of my current Internet connection is satisfactory
Extremely agreeEJ 7 [: ] 6 [15 [: ] 4E] 3 [: ] 2 [: ] I Extremely disagree El NA
P11. My friends think that I should subscribe to (or continue the current subscription) broadband
at home
Extremely agree [: 17 EJ6 E15 04 ED El 2 El I Extremely disagree
P12. My colleagues think that I should subscribe to (or continue the current subscription) broadband
Extremely agreeEJ 7 E] 6 El 5 El 4 El 3 [: 12 E] I Extremely disagree
Adoption, Usage and Impact of Broadband: UK Households Yogesh K. Dxvivedi

Appendices 225
P13. My family members (i. e. spouse, kids) think that I should subscribe to (or continue the current subscription) to broadband
Extremely agree [17 E16 [: 15 [: 14 E13 [: 12 [: 11 Extremely disagree S11. TV and radio advertising encourages me to try broadband
Extremely agreeE]7 E16 E35 E14 E13 n2 [: 11 Extremely disagree
S12. Newspaper advertising encourages me to try broadband
Extremely agreeE] 7 El 6 Ej 5 E34 E13 E32 El I Extremely disagree
Kl. I do not have difficulty in explaining why adopting broadband may be beneficial
Extremely agreeE]7 El 6 El 5 E14 E13 Ej 2 Ej I Extremely disagree
K2. I know how broadband is different from dial-up/narrowband Internet
Extremely agreeE] 7 [: 16 El 5 El 4 [: 13 Ej 2 El I Extremely disagree
K3. I know the benefits that broadband offer and cannot be obta ined by dial-up/narrowband
Extremely agree [17 E16 [: 15 E14 n3[: 12 El I Extremely disagree
SK1. I would feel comfortable using the Internet on my own Extremely agreeE] 7 [: 16 [: 15 [: 14 E13 E12 Ej I Extremely disagree
SK2. Learning to operate the Internet is easy for me Extremely agreeEj 7 [: ] 6 Ej 5 [: 14 E13 E12 I Extremely disagree
SK3. I clearly understand how to use the Internet
Extremely agreeE17 D6 [: 15 E14 E13 E12 I Extremely disagree
FCTI. My current PC is good enough to access the Internet
Extremely agrecE17 n6 E15 [14 [: 13 [: ] 2 El I Extremely disagree
FCT2. There is no problem of broadband Internet availability in my locality
Extremely agreeEj 7 [16 E15 E] 4 [: 13 E12 [: 11 Extremely disagree
FCR1. My annual household income level is enough to afford subscribing to broadband
Extremely agreeE]7 E16 E15 [: ] 4 [: 13 E12 El I Extremely disagree
FCR2. It is not too costly to purchase a new computer or to upgrade my old computer Extremely agreeE] 7 [: 16 E15 [: ] 4 [: 13 [: 12 [: 11 Extremely disagree
FCR3. It is not too costly for me to subscribe to broadband at its current subscription fee
Extremely agreeE]7 E16 E] 5 E14 Ej 3 Ej 2 Ej I Extremely disagree
FCR4. I would be able to subscribe to broadband if I wanted to Extremely agreeE] 7 [16 [D 5 [: ] 4 E13 [: 12 Ej I Extremely disagree
[141 Are you aware about online Government Gateway? F] Yes [: 1 No
115] Have you registered with online Government Gateway? r-1 Yes F] No
Adoption, Usage and Impact of Broadband: UK Households Yogesh K. D%vivedi
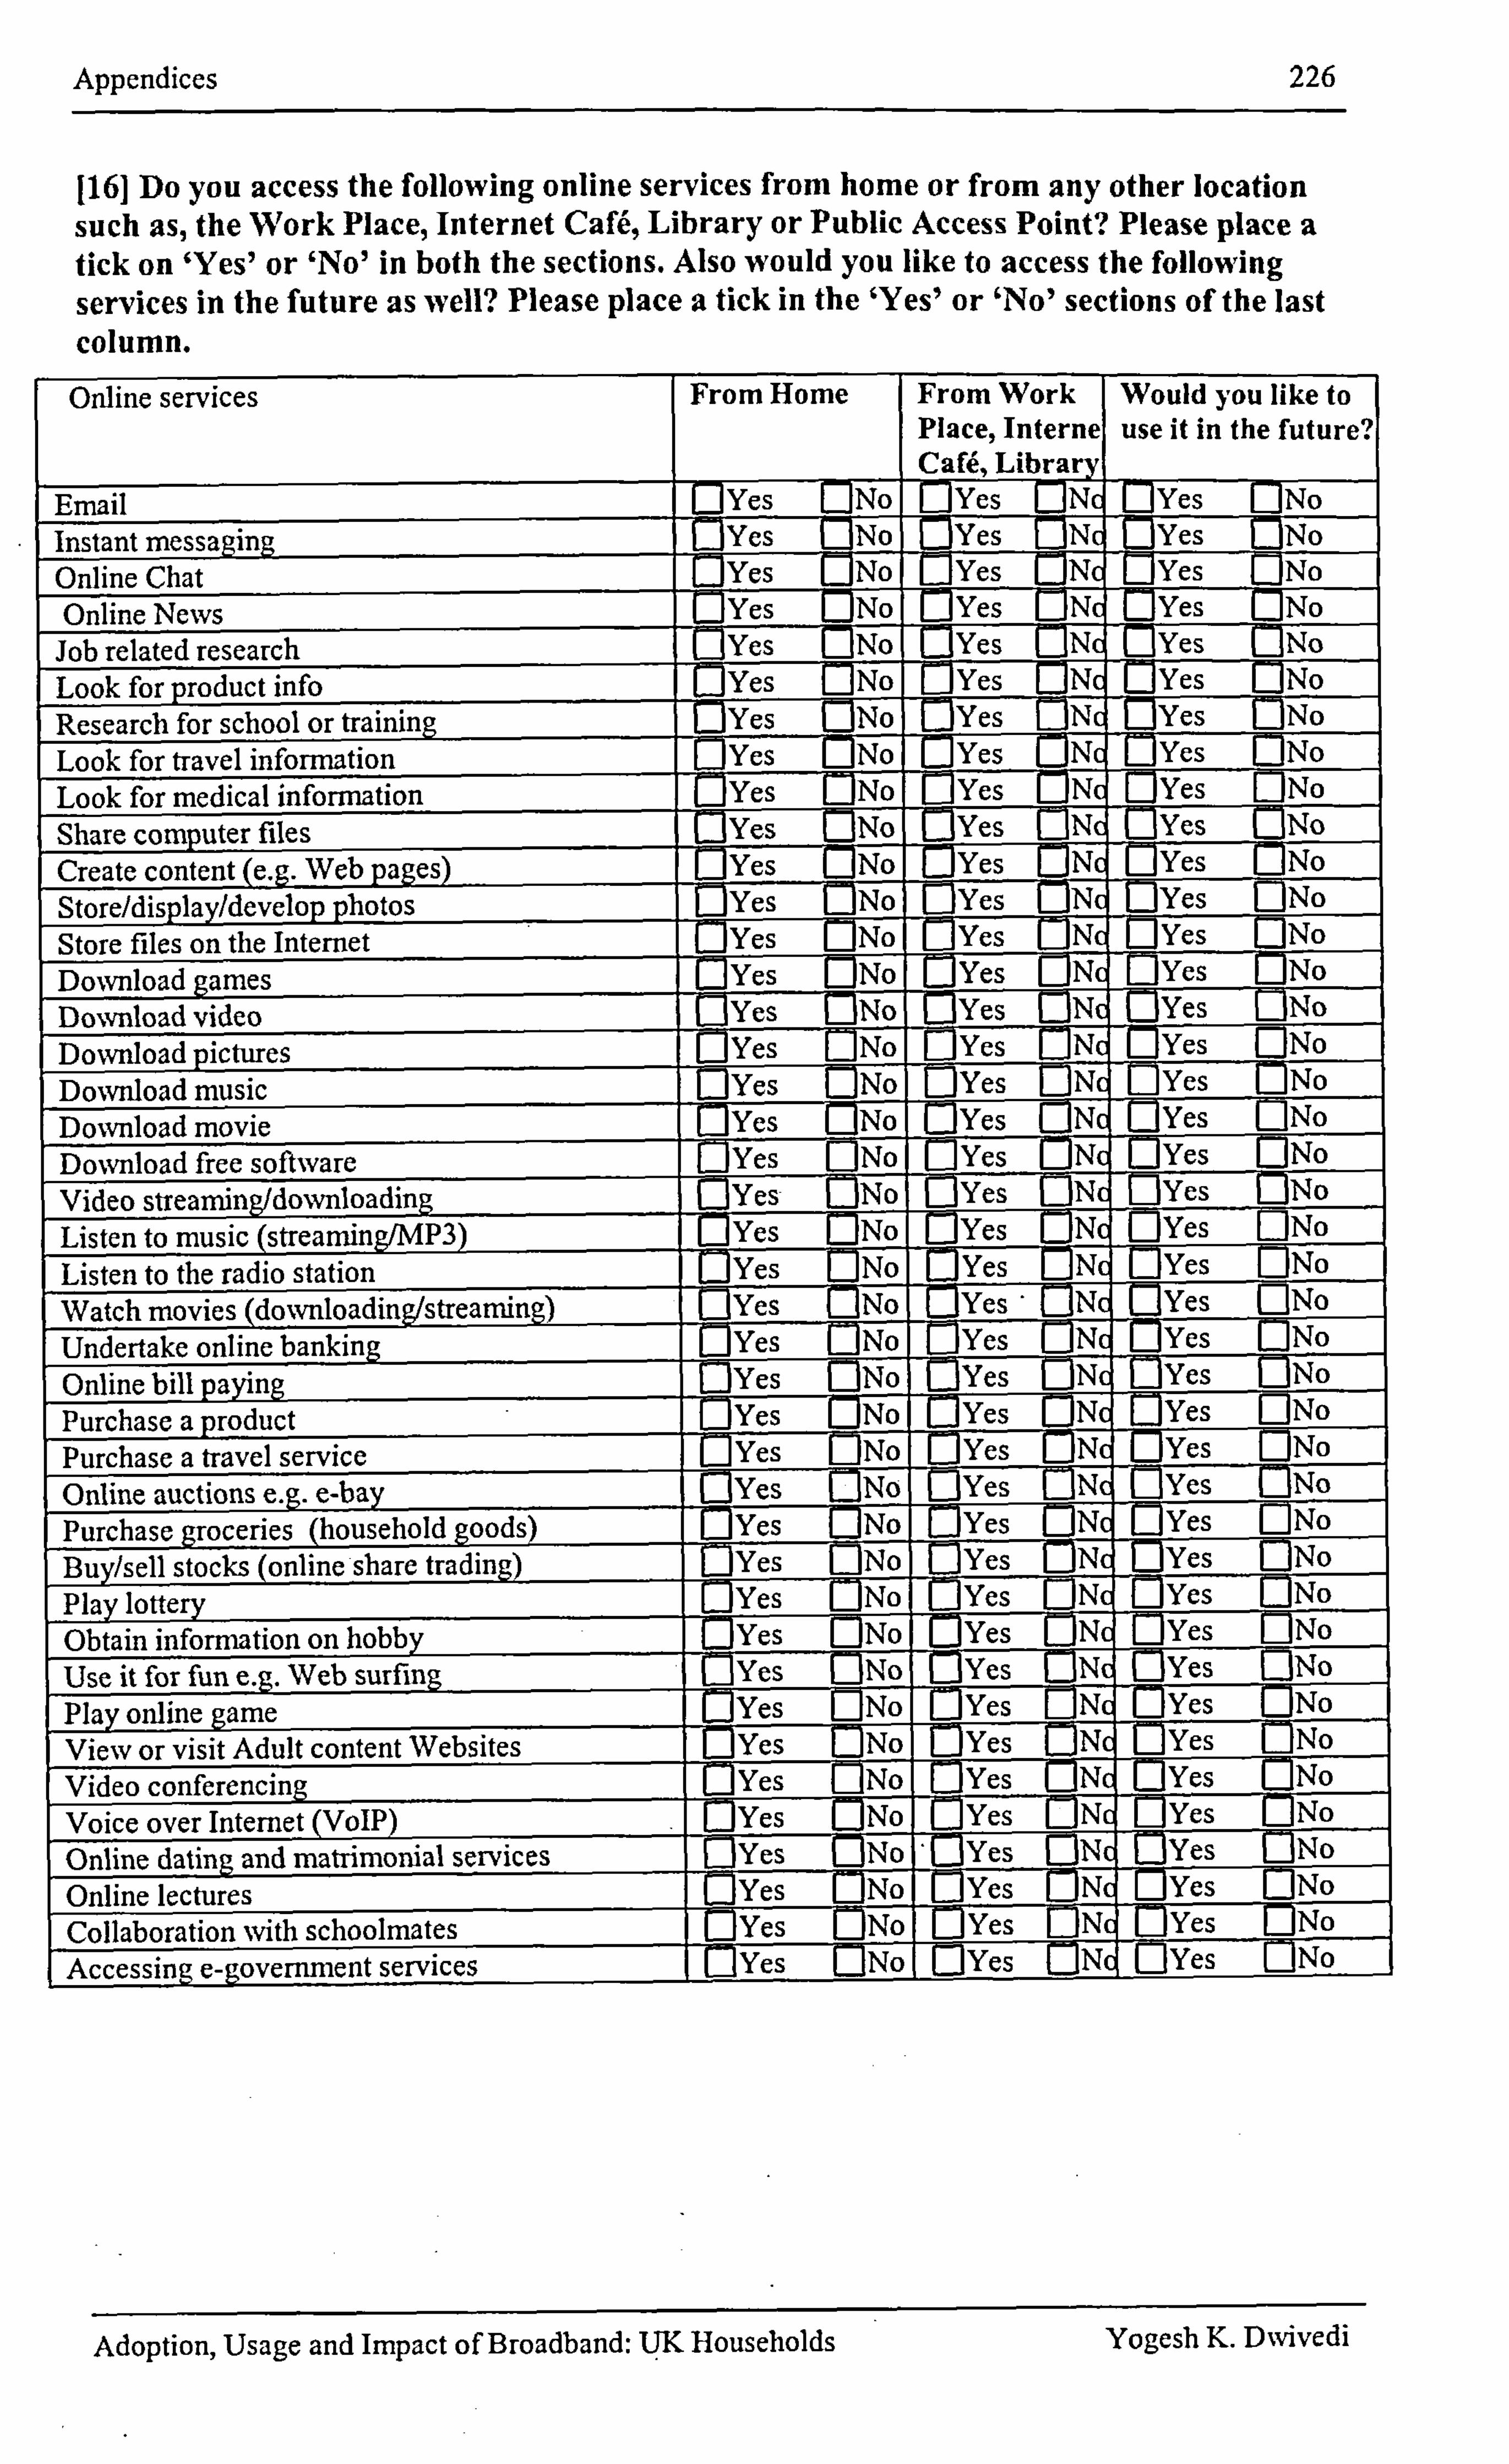
Appendices 226
116] Do you access the following online services from home or from any other location such as, the Work Place, Internet CaM, Library or Public Access Point? Please place a tick on 'Yes' or 'No' in both the sections. Also would you like to access the following services in the future as well? Please place a tick in the 'Yes' or 'No' sections of the last column. Online services
-
From Home
_ -
From Work Place, Interne CaN, Librar
-
Would you like to use it in the future?
Email [ T es L y jNo E j Yes LjNc [ :] Ye s E]No Instant messaging [ j Yes No, ' ' Yes Nq [ :] Yes []No
Online Chat Fj Yes L jNo M Yes Nd L) Yes LjNo - - Online News Ej Yes LjNo Ej Yes Nc 0 Yes Cl No
Job related research El yes EJNo [] Yes EIN -
C]No - Look for product info E] Yes EjNo Yes EjNc [ :F es []No y
Research for school or training Yes []No Yes EINS Lj Yes QNo
Look for travel information El yes EjNo Yes LjNc [ :] Yes [: ]No Look for medical information - E] Yes [ : ]No Yes Nc Ej Yes E]No Share computer files Yes E]No D yes Nc El yes CINO Create content (e. g. Web pages) [ :] Yes No. Fj Yes L-jNc E] Yes []No Store/display/develop photos Yes
_ ̀ ___ 0No Yes N( Lj Yes No
Store files on the Internet _[ :] Y e s 0No El yes N( Lj Yes No I Download games Lj Yes LjNo Yes [: ]Nc
- Lj YcS No I
_ Download video E] Yes LjNo Ej Yes [: ]Nc ( ] YesE1No, Download pictures - E] Yes [: ]No 0 Yes Nc
__ Lj Yes EjNo
Download music [: ] Yes LjNo DNc ýYes E] Yes T]No _ Download movie [: ] Yes L]No c3 yes CINc Yes =N o
Download free software [_J Yes [: )No Yes Nd [: ] Yes No Video strean-ýing/downloading [] Yes No [: ] Yes ONd Yes E]No Listen to music (streaming/MP3) [: ] Yes LjNo E] Yes CDNc Yes E]No Listen to the radio station - [j Yes ONo Yes I JNc E] Yes EJNo Watch movies (downloadinLstrean-dng) [j Yes LjNq Ej Yes Nc Lj Yes E]No Undertake online banking Lj Yes E]No Yes EjNc [: ] Yes L]No Online bill paying E] Yes LjNo Yes ONc Yes No Purchase a product El yes LjNo Yes ON( Ej Yes No I Purchase a travel service E] Yes [: ]No Yes ONc Ej Yes No Online au y D Yes LjNo E] YeS Nc
_ E] Yes LjNo
- - Purchase groceries (household goods) Lj Yes No Yes LJNc EJ EIN o Yes Buy/sell stocks (online sbare trading) [: )Yes No Yes__[: )Nc Ej Yes LjNo Play lottery Yes E]No Yes N( [: ]Yes
- EjNo
Obtain information on hobby Yes EJNo Yes N( E ]Yes No I - Use it for fun e. g. Web surfing - 0
-yes [: ]No I- IYes LJN( Ej ONo Yes
Play online game Yes No Yes [: ]N( Lj Yes LjNo View or visit Adult content Websites - [: ]Yes EjNo
- Yes EjNd
- [: ] Yes FINo
Video conferencing L jYes E]No Yes E]Nc E] Yes E]No Voice over Internet (VoIP) Ej Yes LjNo Yes Nc E] Yes No Online dating and matrimonial services Yes LjNo ' o Yes Nc E] Yes [: ]No Online lectures E ]Yes
_ _ No 1_
Yes Nc Lj Yes No - Collaboration with schoolmates [] Y es E3No I E ]Yes E)N( E 1: ]No ]Yes
Accessing e-government services F [7 Yes__ F_jNn I F- ]Ye.. -; [-IN d E ]Yes LjNo
Adoption, Usage and Impact of Broadband: UK Households Yogesh K. Dxvivedi
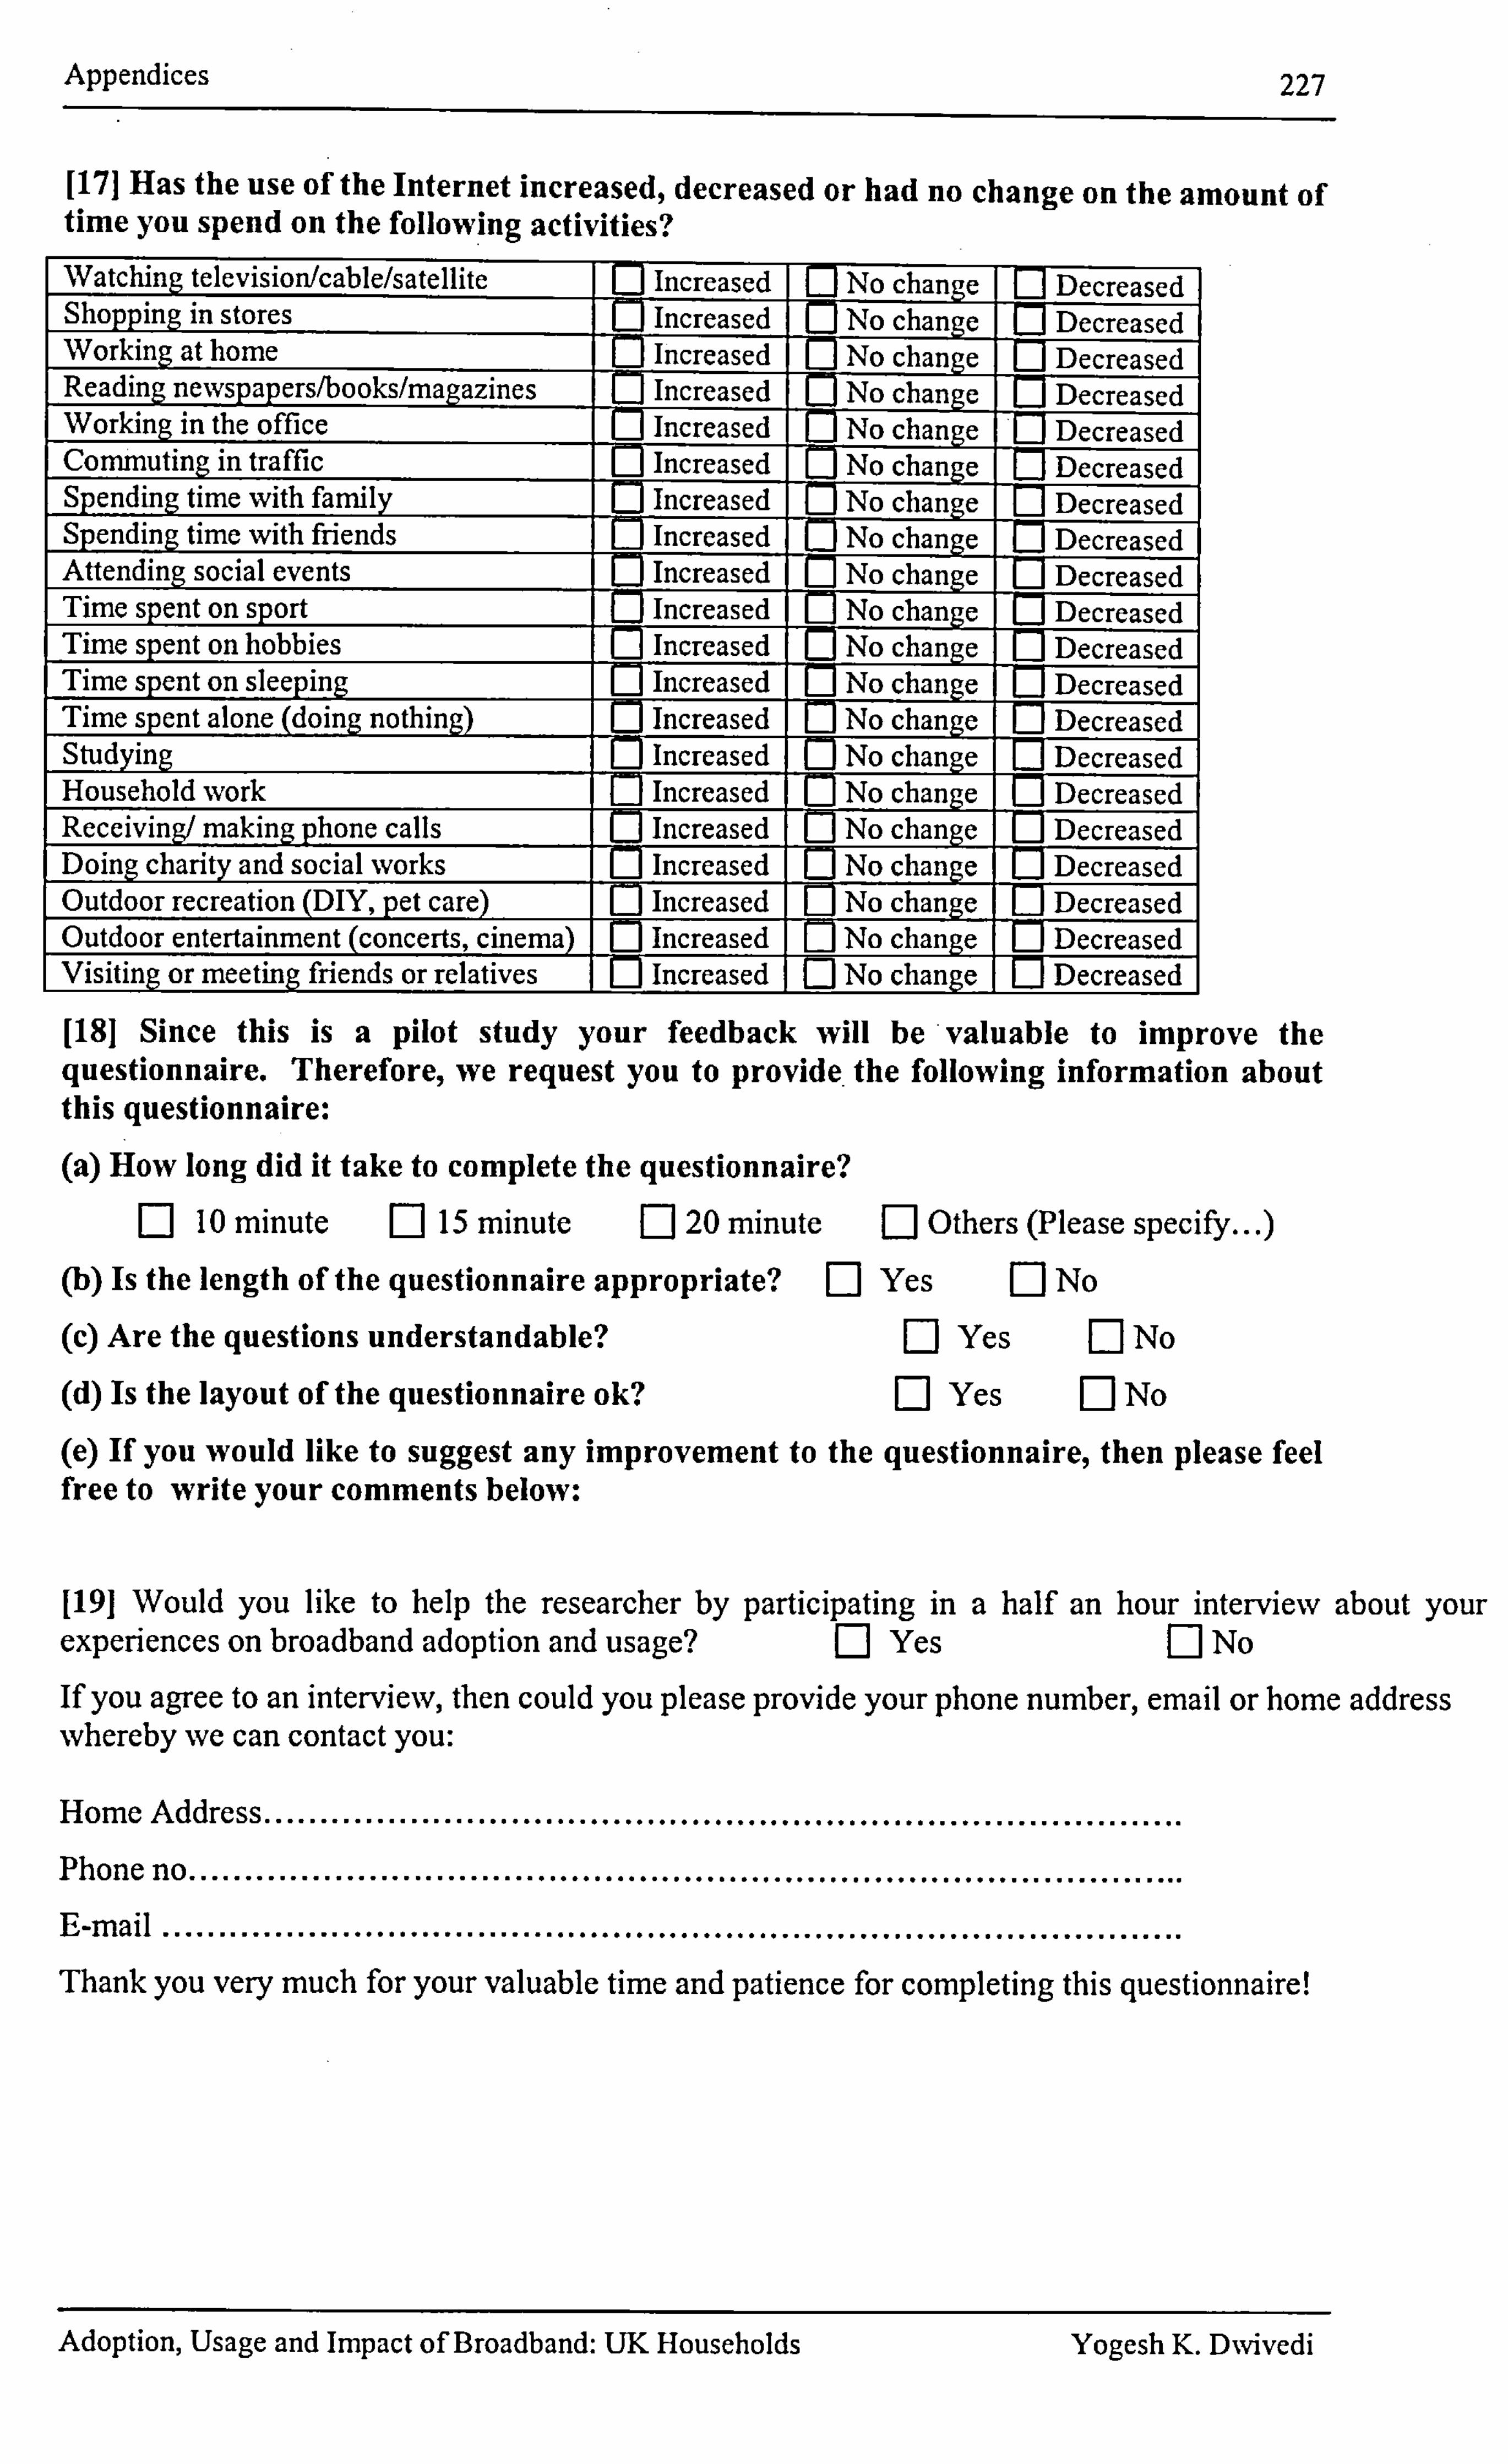
Appendices 227
[171 Has the use of the Internet increased, decreased or had no change on the amount of time you spend on the following activities? Watching television/cable/satellite Increased No change- - [I -Decreased Shopping in stores Lj Increased Lj No chaEge - 17 F-Decreased Working at home [I Increased Lj No change Lj Decreased Reading newspapersibooks/magazines ed No change Lj Decreased Working in the office El Increased 0 No change El Decreased Commuting in traffic 0 Increased U No change d Spending time with family El Increased
- No change - E T-D-ecreased
Spending time with friends TI Increased U No change - 0 -Decreased Attending social events Lj Increased [: ] No change Lj Decreased Time spent on sport [j Increased Lj No change - CJ -Decreased Time spent on hobbies [: ] Increased Lj No change d Time spent on sleeping El Increased U
- No change - El -Decreased
Time spent alone (doing nothing) E3 -
Increased -
17 No change T T-Decreased Studying E3 In creased Lj No chang LJ Decreased Household work Increased Q No change U Decreased Receiving/ making phone calls C3 Increased No change Lj Decreased Doing charity and social works El Increased No change - [: [-I D-ecreased Outdoor recreation (DIY, pet care) El . Increased -'O NO ch e 2 T F-Decreased Outdoor entertainment (concerts, cinemý) El Increased El No chan L-- e Decreased Visiting or meeting friends or relatives El Increased El No change El Decreased
[181 Since this is a pilot study your feedback will be valuable to improve the questionnaire. Therefore, we request you to provide. the following information about this questionnaire: (a) How long did it take to complete the questionnaire?
El 10 minute Ej 15 minute [: ] 20 minute El Others (Please specify (b) Is the length of the questionnaire appropriate? EJ Yes El No
(c) Are the questions understandable? El Yes Fý No
(d) Is the layout of the questionnaire ok? El Yes El No
(e) If you would like to suggest any improvement to the questionnaire, then please feel free to write your comments below:
1191 Would you like to help the researcher by participating in a half an hour interview about your experiences on broadband adoption and usage? D Yes El No
If you agree to an interview, then could you please provide your phone number, email or home address whereby we can contact you:
Home Address .................................................................................. Phone no ......................................................................................... E-mail ........................................................................................... Thank you very much for your valuable time and patience for completing this questionnaire!
Adoption, Usage and Impact of Broadband: UK Households Yogesh K. DNvivedi
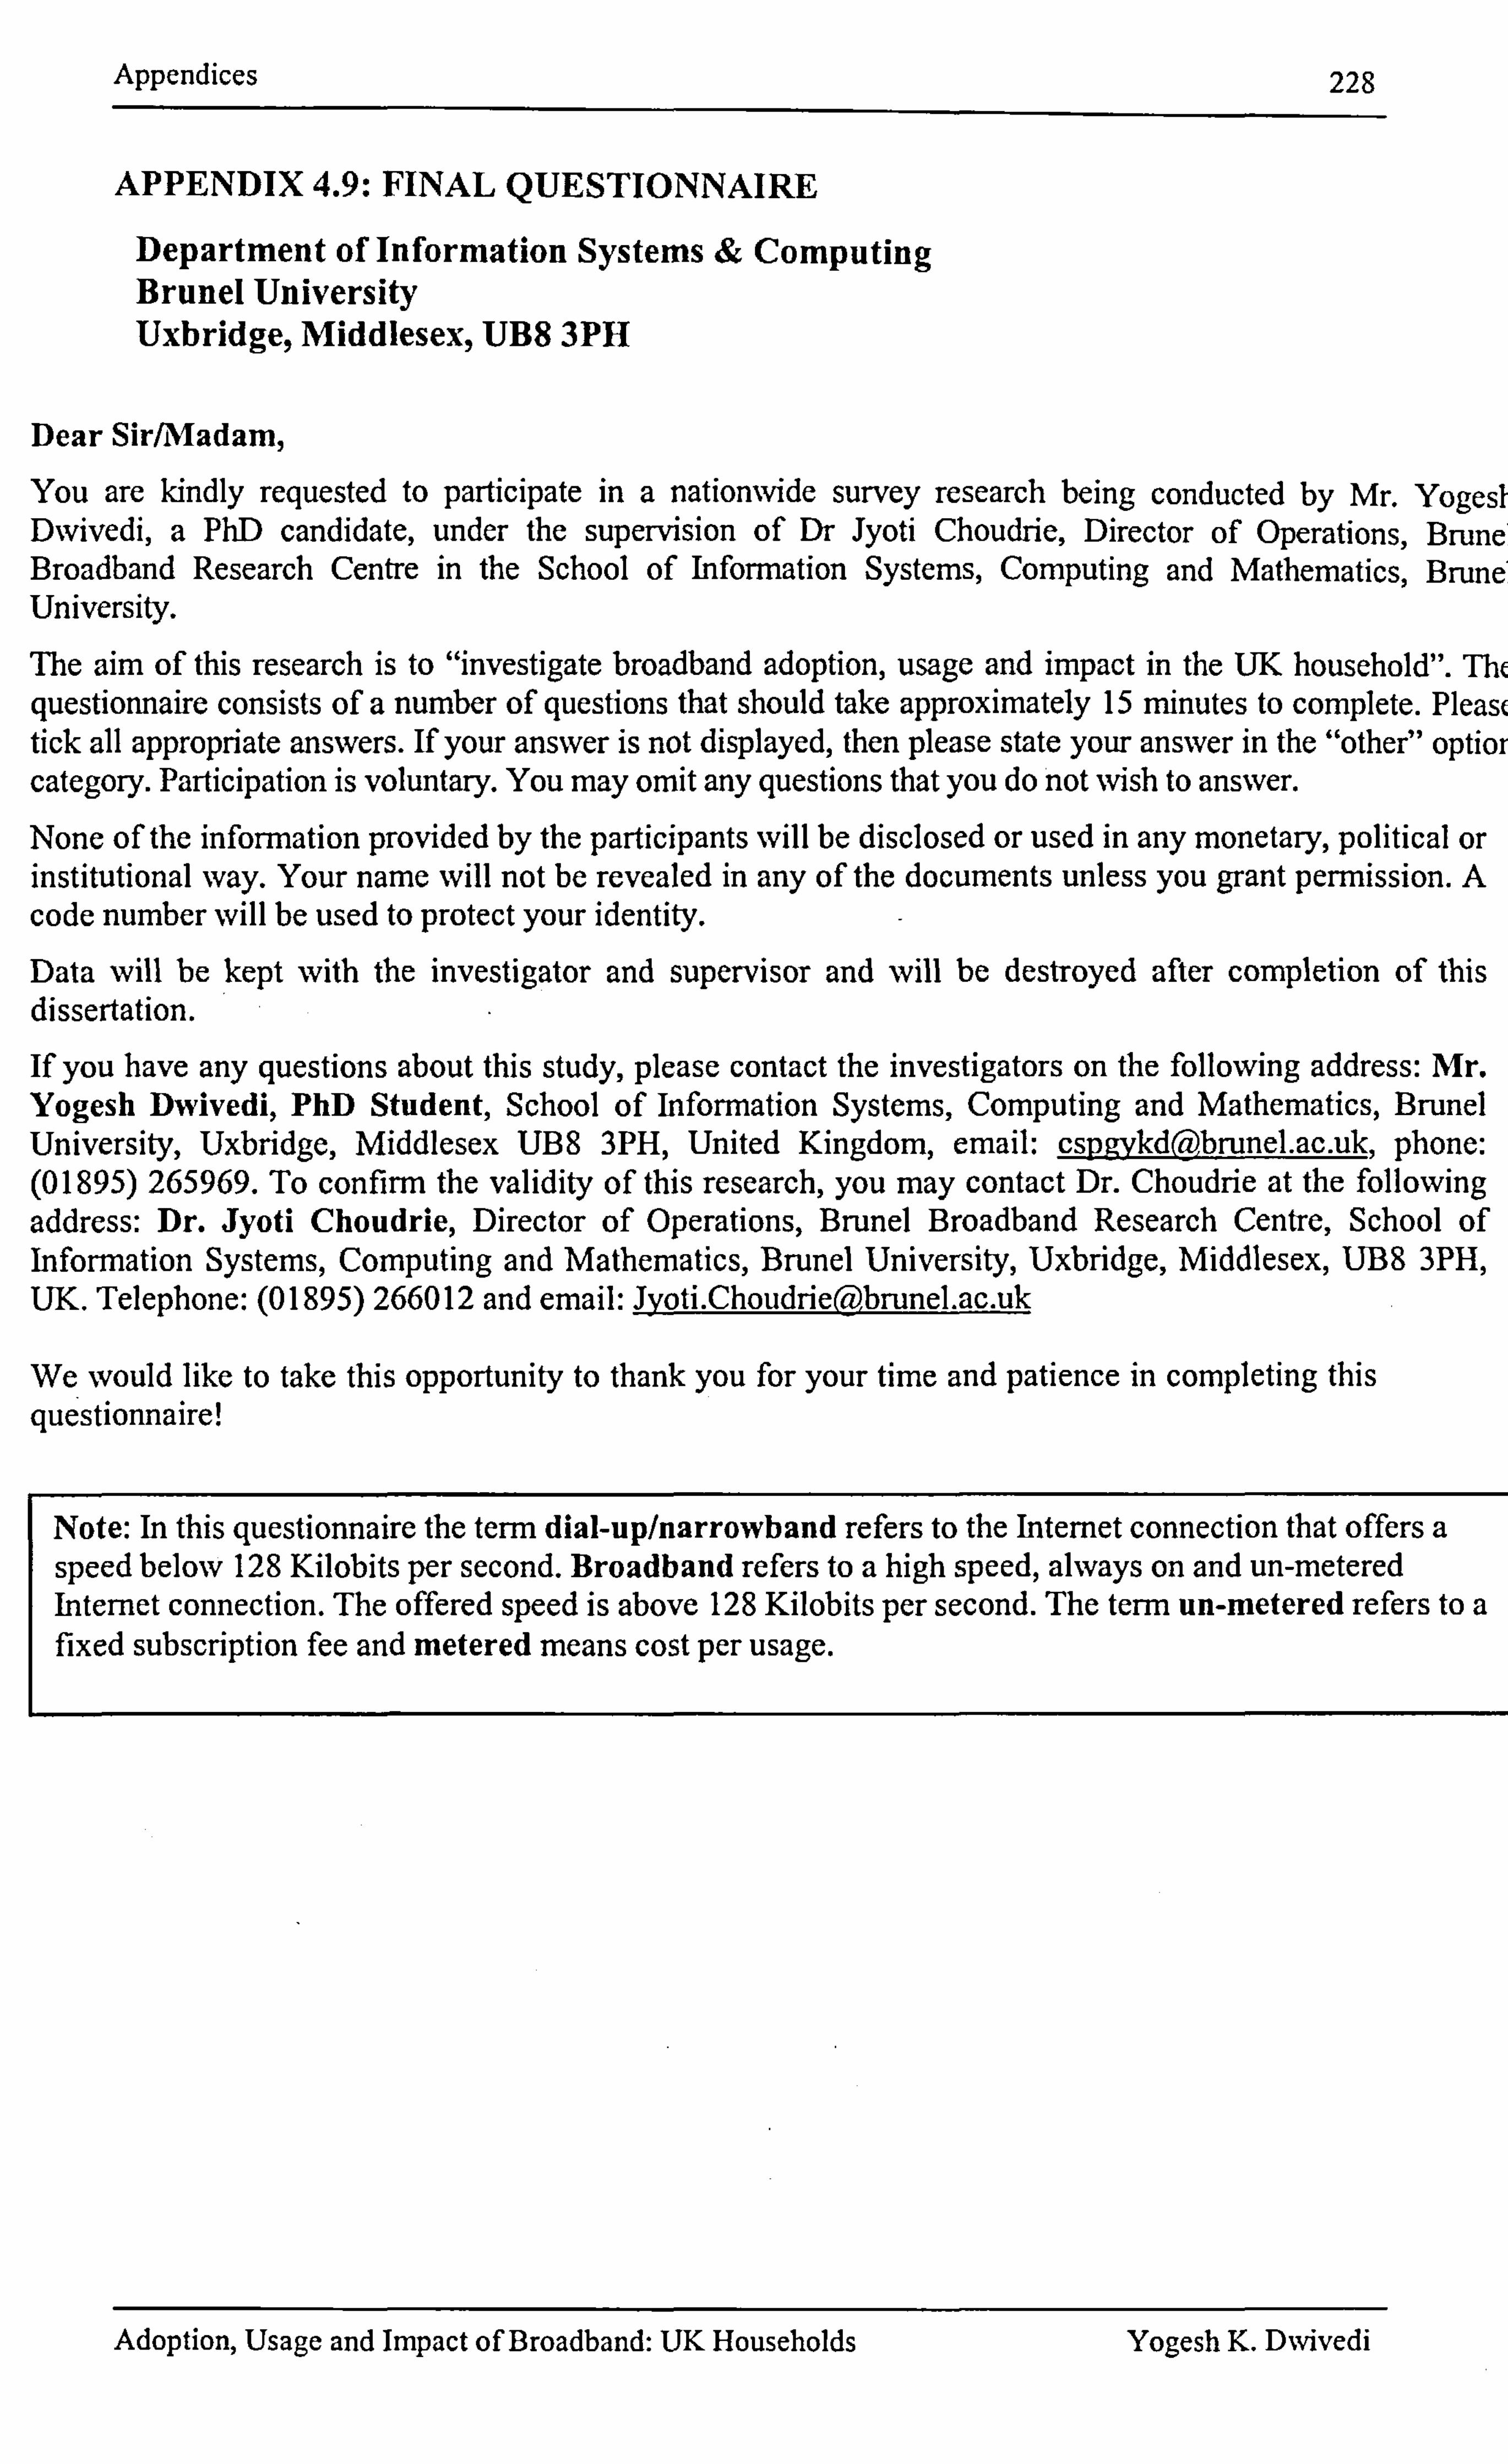
Appendices 228
APPENDIX 4.9: FINAL QUESTIONNAIRE
Department of Information Systems & Computing Brunel University Uxbridge, Middlesex, UB8 3PH
Dear Sir/iMadam,
You are kindly requested to participate in a nationwide survey research being conducted by Mr. Yogest Dwivedi, a PhD candidate, under the supervision of Dr Jyoti Choudrie, Director of Operations, Brune Broadband Research Centre in the School of Information Systems, Computing and Mathematics, Brune University.
'111e aim of this research is to "investigate broadband adoption, usage and impact in the UK household". Th( questionnaire consists of a number of questions that should take approximately 15 minutes to complete. Pleasc tick all appropriate answers. If your answer is not displayed, then please state your answer in the "other" optior category. Participation is voluntary. You may omit any questions that you do not wish to answer. None of the information provided by the participants will be disclosed or used in any monetary, political or institutional way. Your name will not be revealed in any of the documents unless you grant permission. A code number will be used to protect your identity.
Data will be kept with the investigator and supervisor and will be destroyed after completion of this dissertation.
If you have any questions about this study, please contact the investigators on the following address: Mr. Yogesh Dwivedi, PhD Student, School of Information Systems, Computing and Mathematics, Brunel University, Uxbridge, Middlesex U138 3PH, United Kingdom, email: cspgykdebrunel-ac. u , phone: (01895) 265969. To confirm the validity of this research, you may contact Dr. Choudrie at the following address: Dr. Jyoti Choudrie, Director of Operations, Brunel Broadband Research Centre, School of Information Systems, Computing and Mathematics, Brunel University, Uxbridge, Middlesex, U138 3PH, UK. Telephone: (0 1895) 266012 and email: Jyoti. Choudrieebrunel. ac. uk
We would like to take this opportunity to thank you for your time and patience in completing this questionnaire!
Note: In this questionnaire the term dial-up/narrowband refers to the Internet connection that offers a speed below 128 Kilobits per second. Broadband refers to a high speed, always on and un-metered Internet connection. The offered speed is above 128 Kilobits per second. The term un-metered refers to a fixed subscription fee and metered means cost per usage.
Adoption, Usage and Impact of Broadband: UK Households Yogesh K. D%vivedi
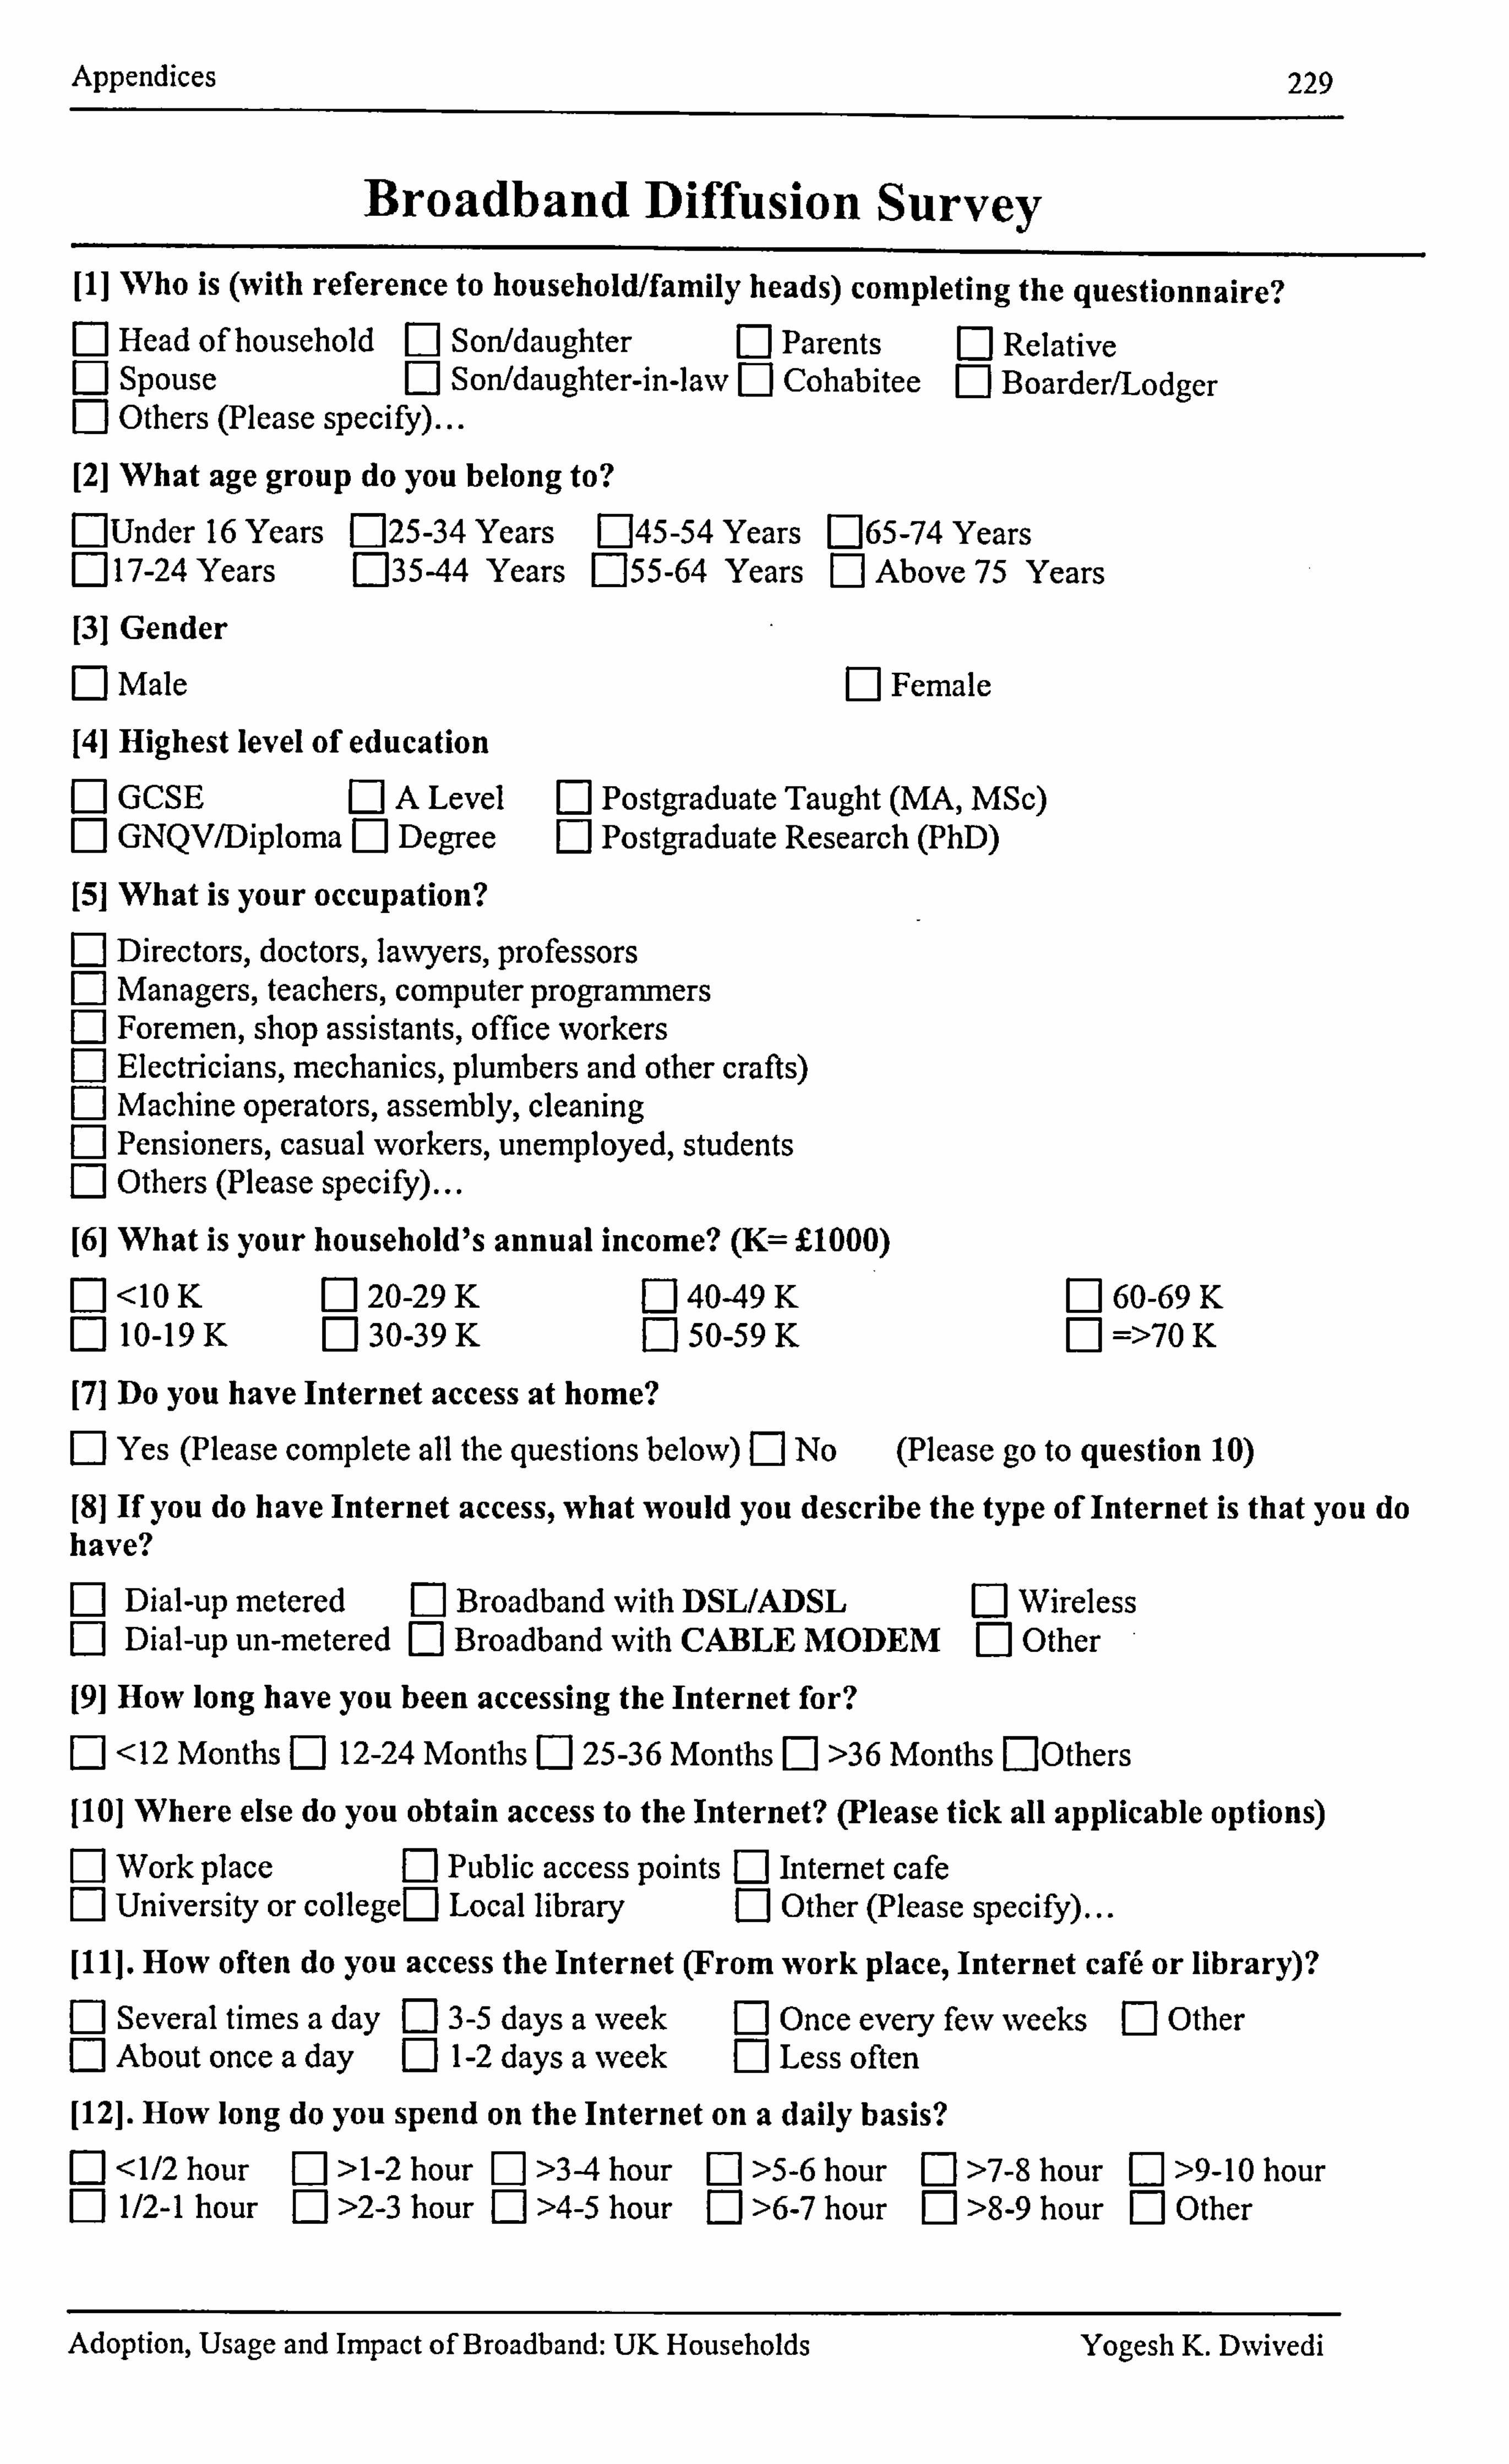
Appendices 229
Broadband Diffusion Survey [11 Who is (with reference to household/family heads) completing the questionnaire? M Head of household El Son/daughter El Parents M Relative F1 Spouse E] Son/daughter-in-law [: 1 Cohabitee [: ] Boarder/Lodger n Others (Please specify)... [21 What age group do you belong to? ElUnder 16 Years Fý25-34 Years E345-54 Years 065-74 Years F1 17-24 Years M35-44 Years E155-64 Years El Above 75 Years
[31 Gender M Male Female
[41 Highest level of education GCSE [: 1 A Level Ej Postgraduate Taught (MA, MSc) GNQV/Diploma Ej Degree [: 1 Postgraduate Research (PhD)
[51 What is your occupation? Directors, doctors, lawyers, professors Managers, teachers, computer programmers Foremen, shop assistants, office workers
F] Electricians, mechanics, plumbers and other crafts) n Machine operators, assembly, cleaning Fj Pensioners, casual workers, unemployed, students F-I Others (Please specify)... [61 What is your household's annual income? (K= VOOO) R<1OK E: 1 20-29 K F] 4049 K E] 60-69 K n 10-19K [: ] 30-39 K F-1 50-59 K El =>70 K [71 Do you have Internet access at home? F1 Yes (Please complete all the questions beloW) E] No (Please go to question 10) [81 If you do have Internet access, what would you describe the type of Internet is that you do have? F-1 Dial-up metered Fý Broadband with DSL/ADSL El Wireless F] Dial-up un-metered Ej Broadband with CABLE MODEM [: ] Other [91 How long have you been accessing the Internet for? n <12 Months Ej 12-24 Months [125-36 Months [I >36 Months nOthers
1101 Where else do you obtain access to the Internet? (Please tick all applicable options) F-1 Work place F1 Public access points D Internet cafe D University or collegeF1 Local library Ej Other (Please specify)... [ 111. How often do you access the Internet (From work place, Internet caM or library)?
F] Several times a day n 3-5 days a week [] Once every few weeks [: 1 Other n About once a day Ej 1-2 days a week F1 Less often [121. How long do you spend on the Internet on a daily basis?
EJ <1/2 hour El >1-2 hour El >3-4 hour E1 >5-6 hour El >7-8 hour F1 >9-10 hour F1 1/2-1 hour F1 >2-3 hour Ej >4-5 hour Ej >6-7 hour E] >8-9 hour El Other
Adoption, Usage and Impact of Broadband: UK Households Yogesh K. Dwivedi
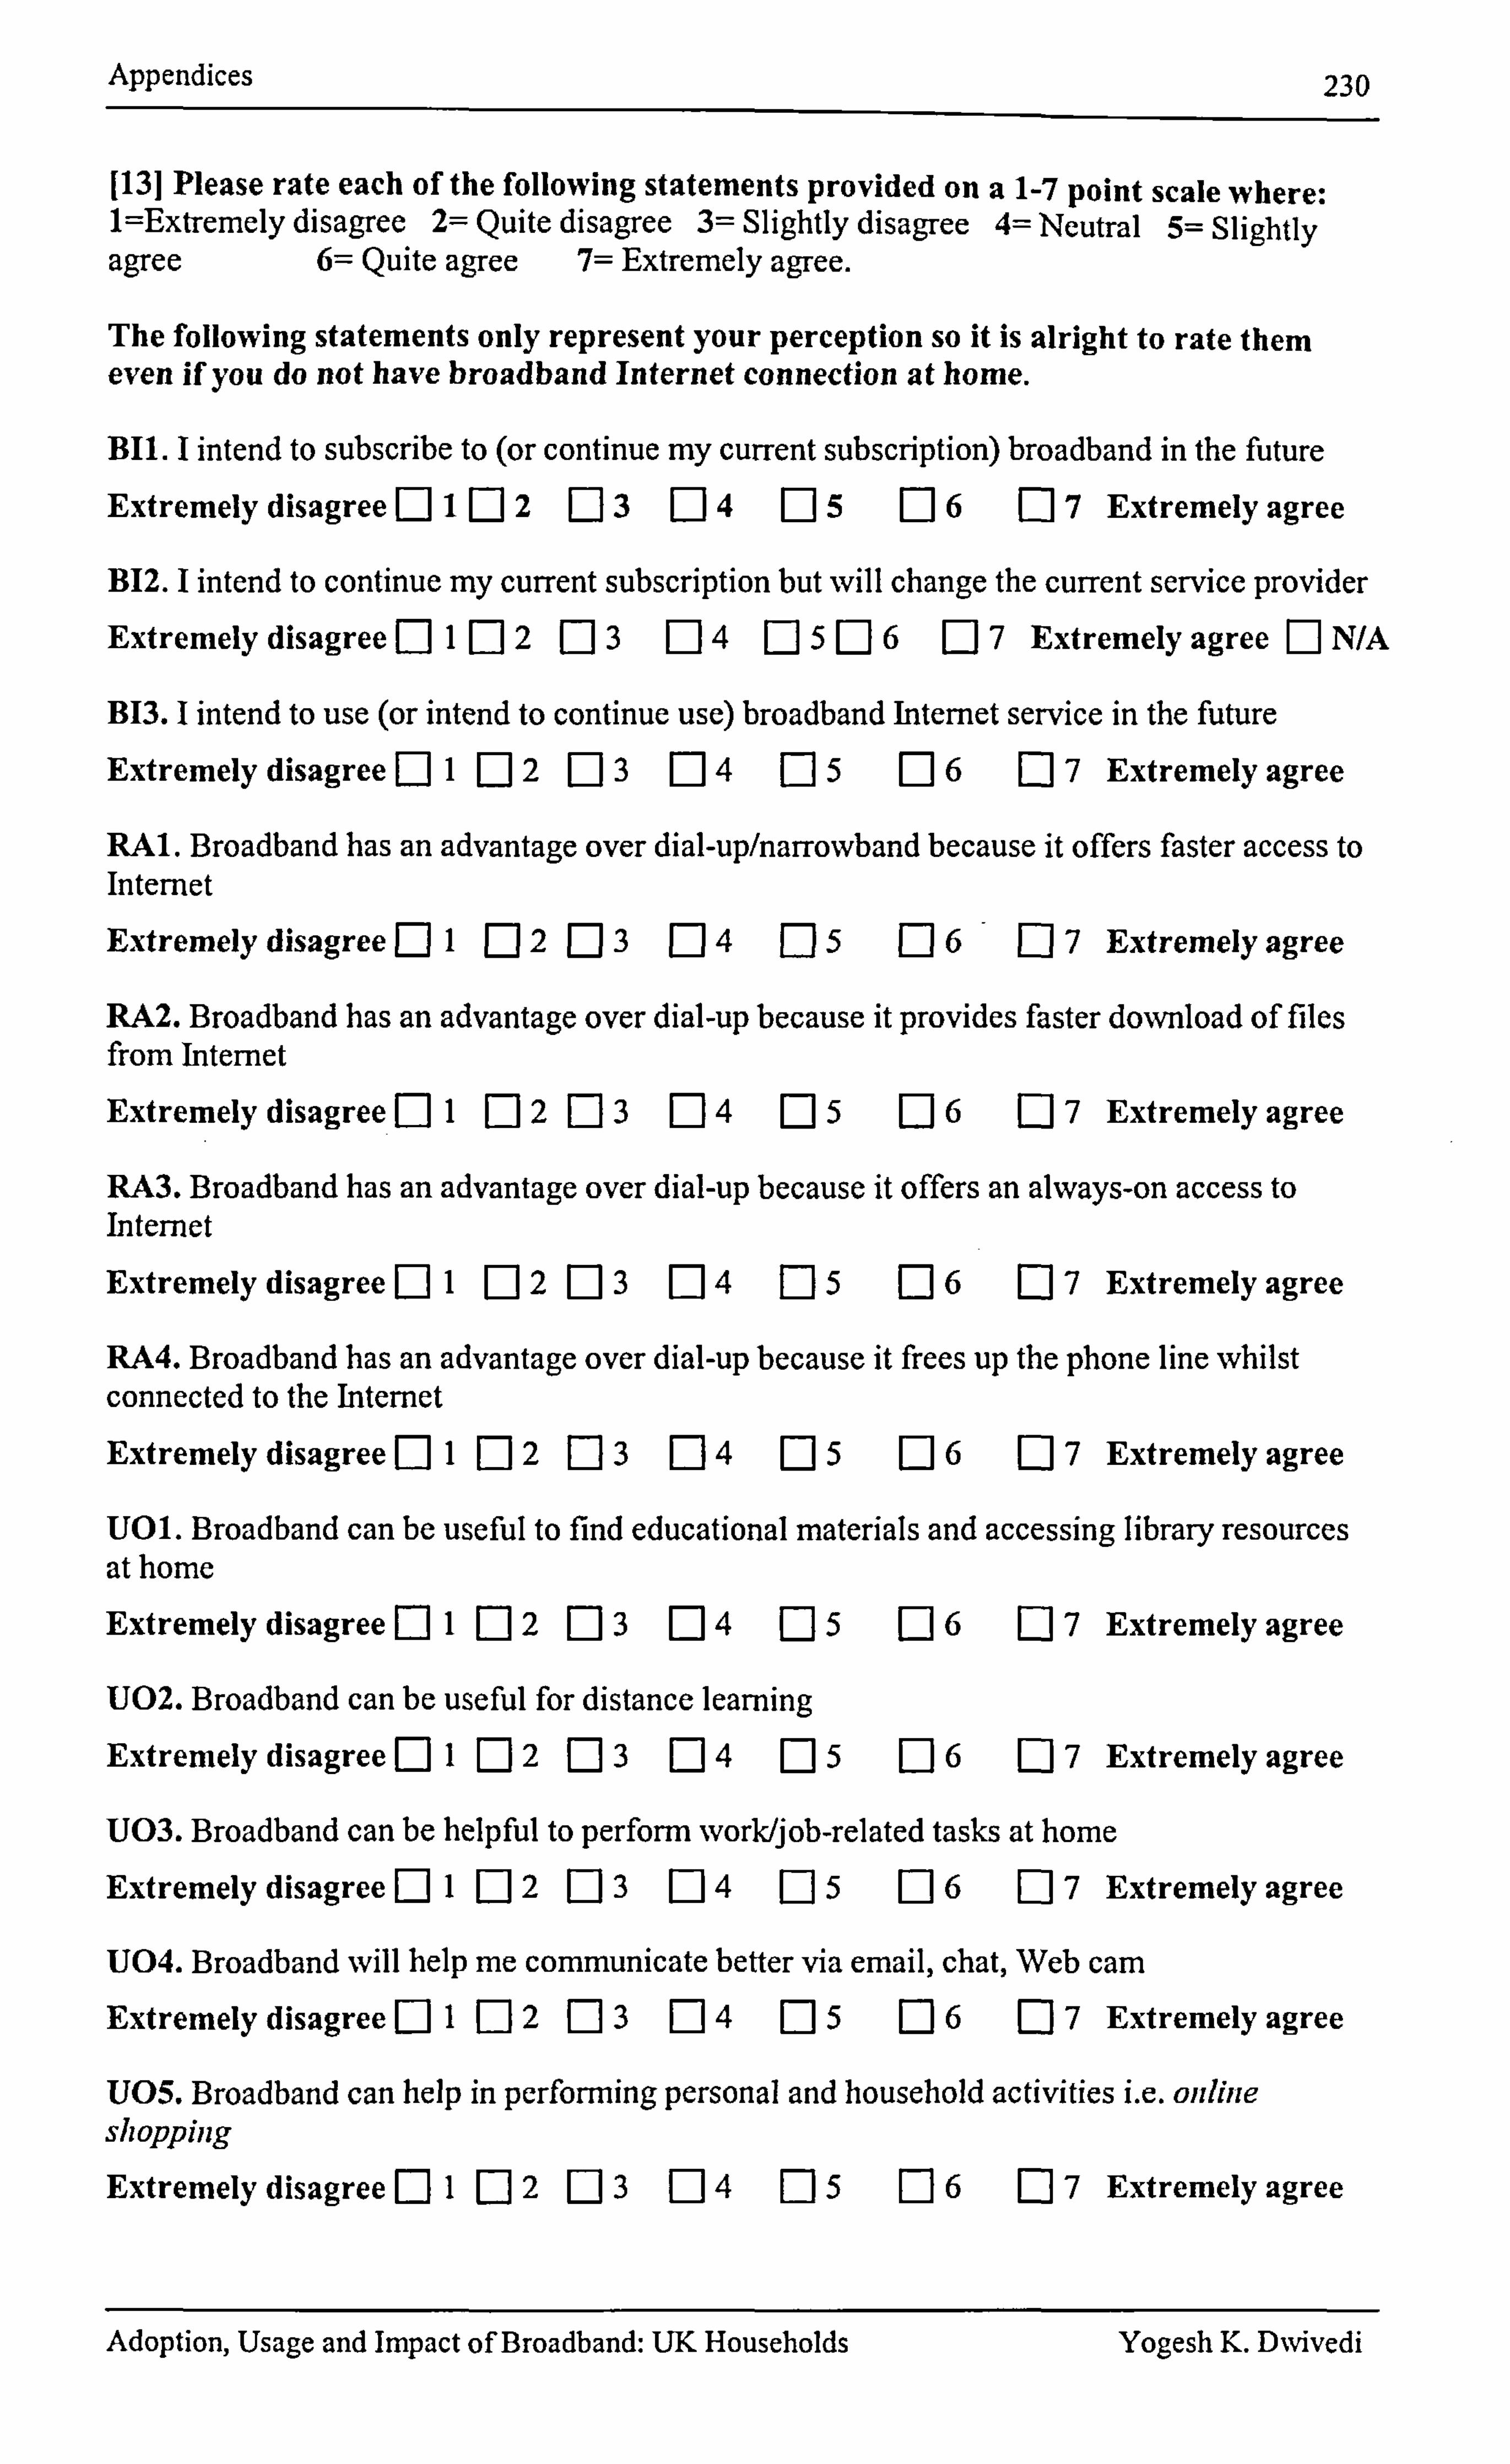
Appendices 230
[131 Please rate each of the following statements provided on a 1-7 point scale where: 1=Extremely disagree 2= Quite disagree 3= Slightly disagree 4= Neutral 5= Slightly agree 6= Quite agree 7= Extremely agree.
The following statements only represent your perception so it is alright to rate them even if you do not have broadband Internet connection at home.
BIL I intend to subscribe to (or continue my current subscription) broadband in the future
Extremely disagreeE] 1 Ej 2 El 3 [j 4 El 5 [16 El 7 Extremely agree
B12. I intend to continue my current subscription but will change the current service provider Extremely disagreeE] IM2 Ej 3 [: ] 4 [: ] 5 [] 6 [: ] 7 Extremely agree Ej N/A
B13. I intend to use (or intend to continue use) broadband Internet service in the future
Extremely disagreeE] I [: ] 2 [: ] 3 [: ] 4 E15 Ej 6 Ej 7 Extremely agree
RAL Broadband has an advantage over dial-up/narrowband because it offers faster access to Internet
Extremely disagreeE] I E12 Ej 3 E14 F-15 [: 16 - Ej 7 Extremely agree
RA2. Broadband has an advantage over dial-up because it provides faster download of files from Internet
Extremely disagree [ý] I E12 E13 E] 4 E15 [] 6 Ej 7 Extremely agree
RA3. Broadband has an advantage over dial-up because it offers an always-on access to Internet
Extremely disagreeE: 1 I Ej 2 [: 13 [: ] 4 E15 Fj 6 Ej 7 Extremely agree
RA4. Broadband has an advantage over dial-up because it frees up the phone line whilst connected to the Internet
Extremely disagree Fý I El 2 [13 E] 4 EJ 56 Ej 7 Extremely agree
U01. Broadband can be useful to find educational materials and accessing library resources at home
Extremely disagree [: 11 El 2 Ej 3 Ej 4 [15 [: 16 07 Extremely agree
U02. Broadband can be useful for distance learning
Extremely disagree Ej I E] 2 [13 Ej 4 Ej 5 6 [: 17 Extremely agree
U03. Broadband can be helpful to perform work/job-rel ated tasks at home
Extremely disagree Ej I Ej 2 [: ] 3 [: 14 [: 15 [: ] 6 El 7 Extremely agree
U04. Broadband will help me communicate better via email, cha t, Web cam Extremely disagree [: 11 F1 2 El 3 Ej 4 [: 15 El 6 El 7 Extremely agree
U05. Broadband can help in performing personal and household activities i. e. online shopping Extremely disagreeE] I F] 2 [j 3 E14 E15 E16 E: 1 7 Extremely agree
Adoption, Usage and Impact of Broadband: UK Households Yogesh K. DNvivedi
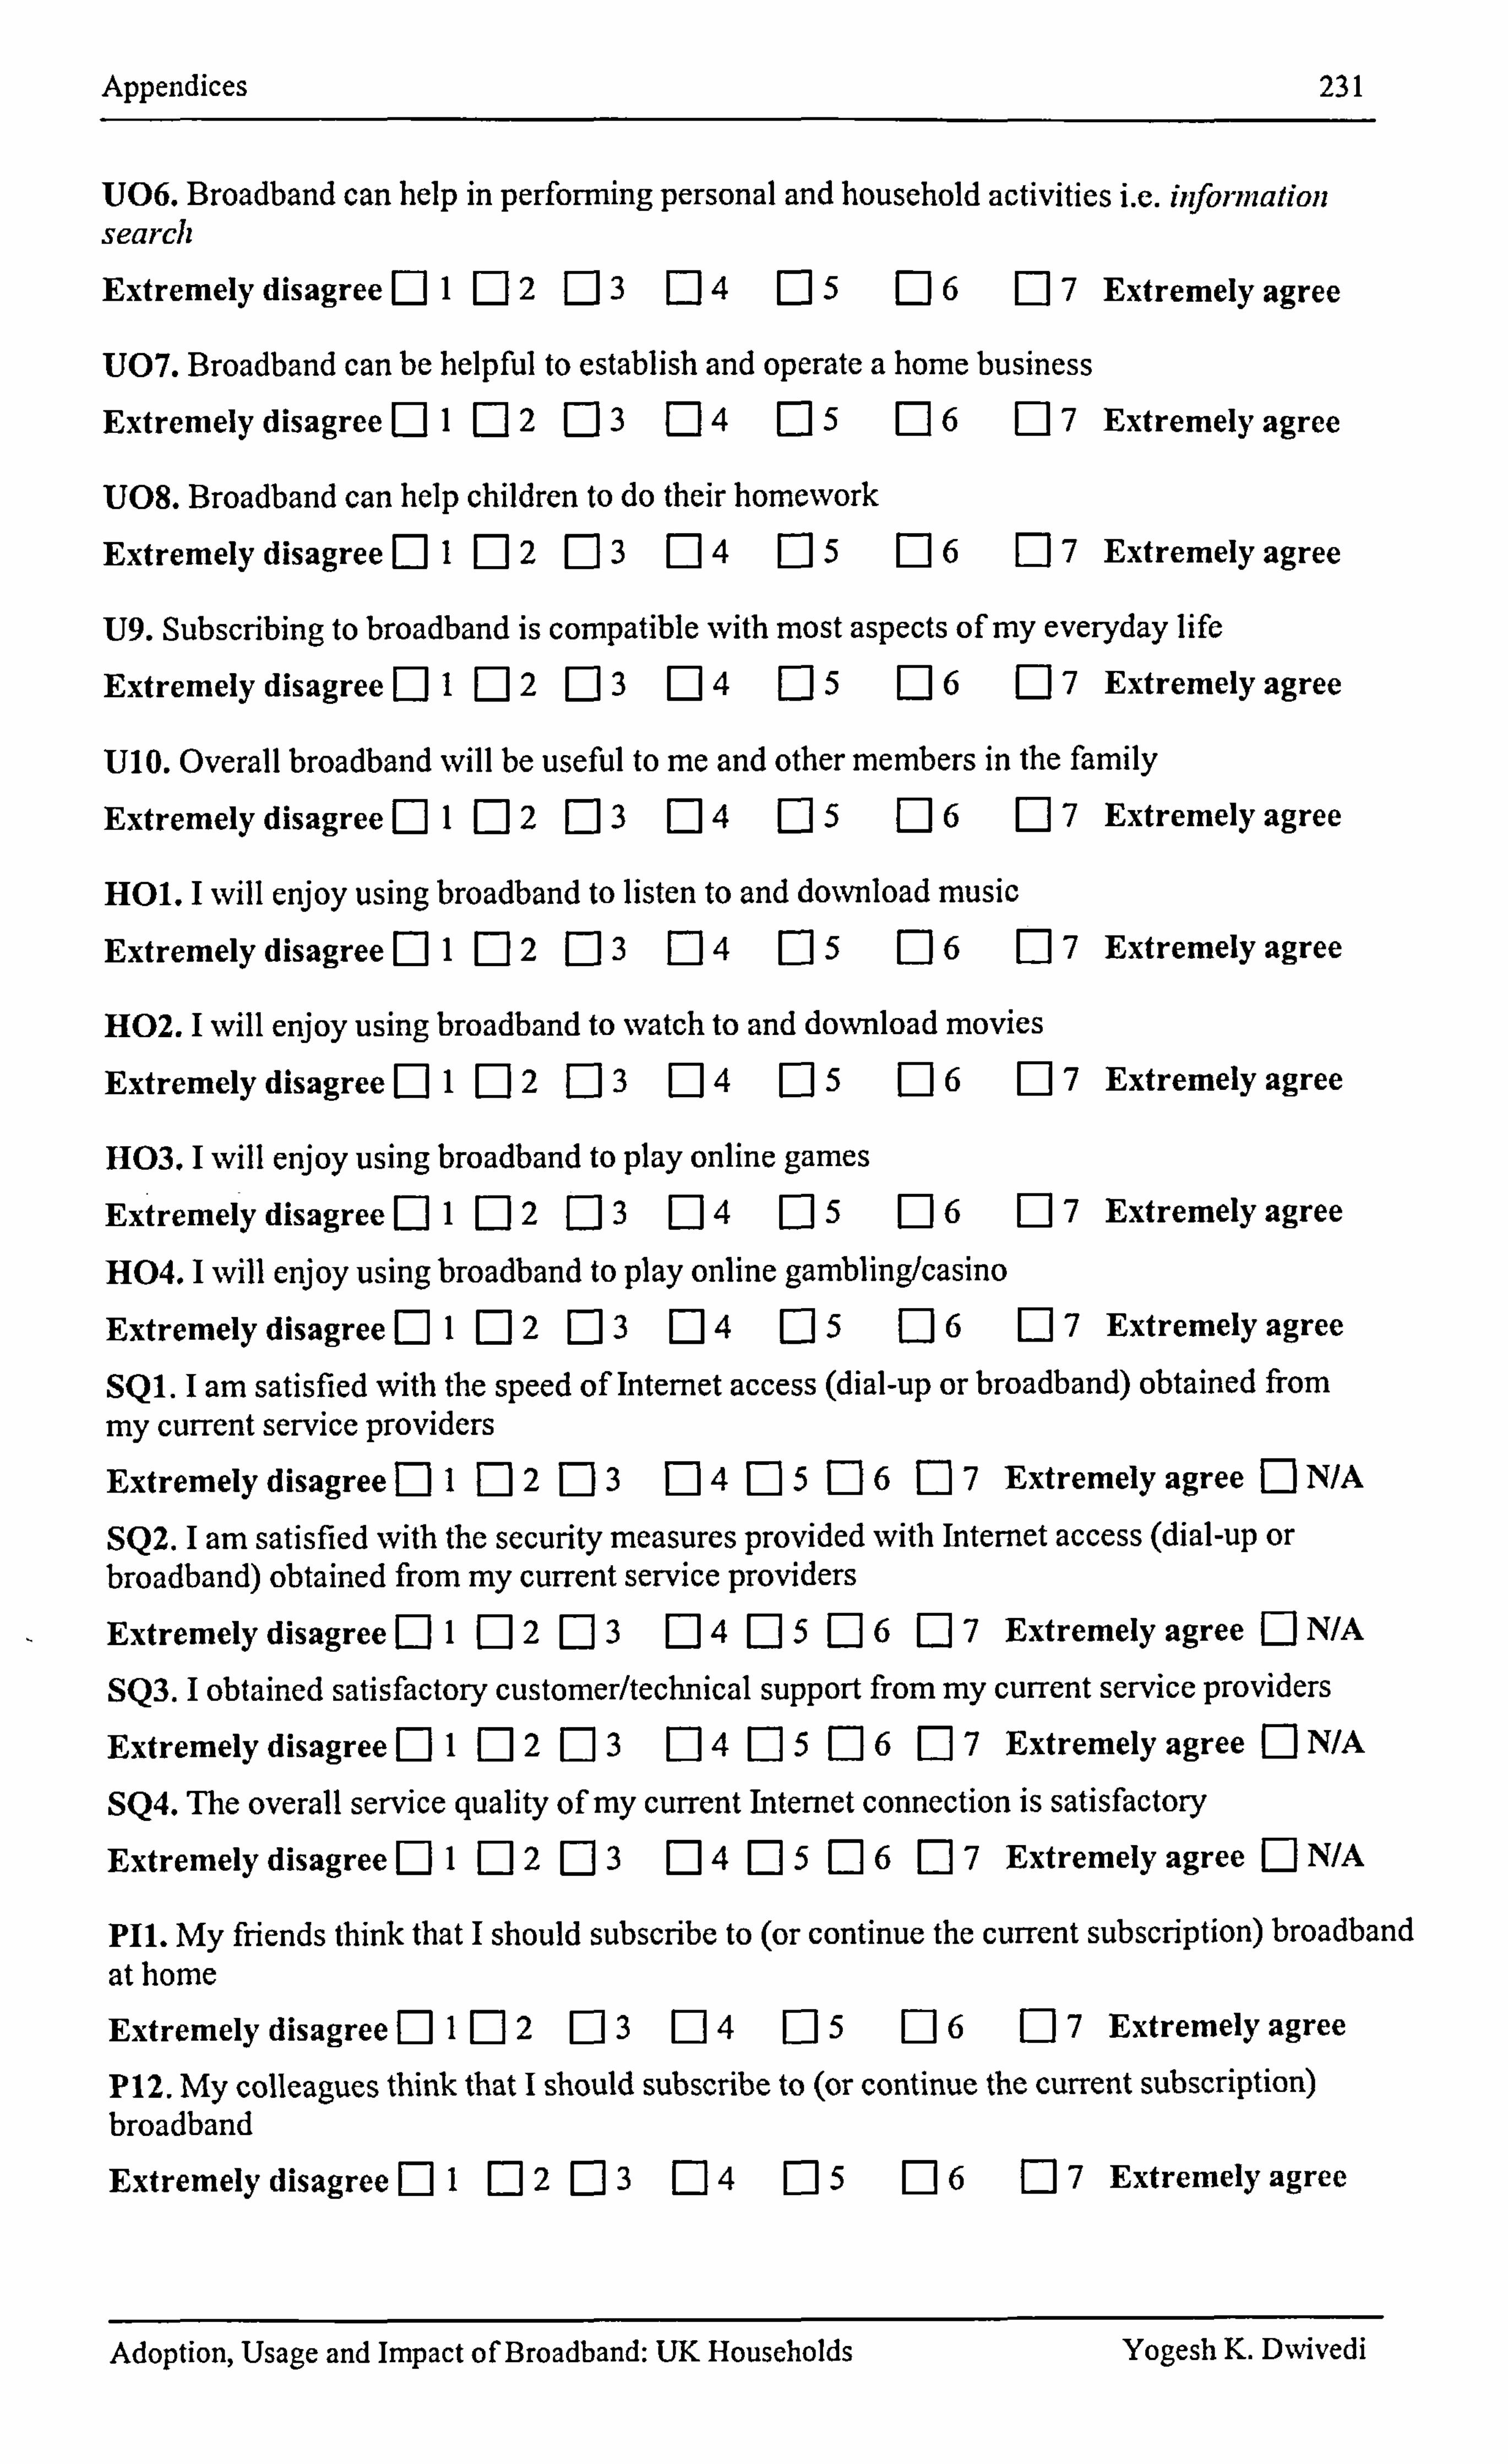
Appendices 231
U06. Broadband can help in performing personal and household activities i. e. infornzation search Extremely disagree [J I [: ] 2 EJ 3 EJ 4 EJ 5 EJ 6 [: 17 Extremely agree
U07. Broadband can be helpful to establish and operate a home business
Extremely disagreeE] I E] 2 EJ 3 [] 4 E15 E16 07 Extremely agree
U08. Broadband can help children to do their homework
Extremely disagreeF-l I El 2 [: ] 3 E] 4 E15 E16 7 Extremely agree
U9. Subscribing to broadband is compatible with most aspects of my everyday life
Extremely disagree [ý] I Ej 2 [: ] 3 [: ] 4 [: 15 [: 16 [17 Extremely agree
U10. Overall broadband will be useful to me and other members in the family
Extremely disagreeE] 1 [: 12 EJ 3 EJ4 EJ 5 E: 1 6 [: 17 Extremely agree
HOI. I will enjoy using broadband to listen to and download music Extremely disagreeE] 1 [: 12 [: ] 3 [: 14 E] 5 [: 16 [17 Extremely agree
H02. I will enjoy using broadband to watch to and download movies Extremely disagree [: 11 [J 2 [: 13 04 [-] 5 [: 16 [: 17 Extremely agree
H03. I will enjoy using broadband to play online games Ex tremely disagree El I EJ 2 El 3 EJ4 El 5 El 607 Extremely agree
H04. I will enjoy using broadband to play online gambling/casino Extremely disagreeE] I E] 2 EJ 3 EJ 4 [: ] 5 [: ] 6 [: 17 Extremely agree
SQ1. I am satisfied with the speed of Internet access (dial-up or broadband) obtained from my current service providers Extremely disagree El I E12 E13 E14E15 E16 El 7 Extremely agree 0 N/A
SQ2. I am satisfied with the security measures provided with Internet access (dial-up or broadband) obtained from my current service providers Extremely disagree F1 I [: ] 2 [: J 3 EJ 4E] 506[: 17 Extremely agree [: 1 N/A
SQ3. I obtained satisfactory customer/technical support from my current service providers Extremely disagree [: 11 [: 12 [: 13 [: 14 [: 15 El 6 [: 17 Extremely agree El N/A
SQ4. The overall service quality of my current Internet connection is satisfactory Extremely disagree [: 11 E12 EJ 3 EJ4 El 5n6[: 17 Extremely agree [: ] N/A
P11. My friends think that I should subscribe to (or continue the current subscription) broadband at home
Extremely disagreeE] I E: 1 2 [: 13 [: 14 E15 EJ 6 [: 17 Extremely agree
P12. My colleagues think that I should subscribe to (or continue the current subscription) broadband
Extremely disagree [: 11 El 2 EJ 3 El 4 [: 15 [: 16 [: 17 Extremely agree
Adoption, Usage and Impact of Broadband: UK Households Yogesh K. DNvivedi
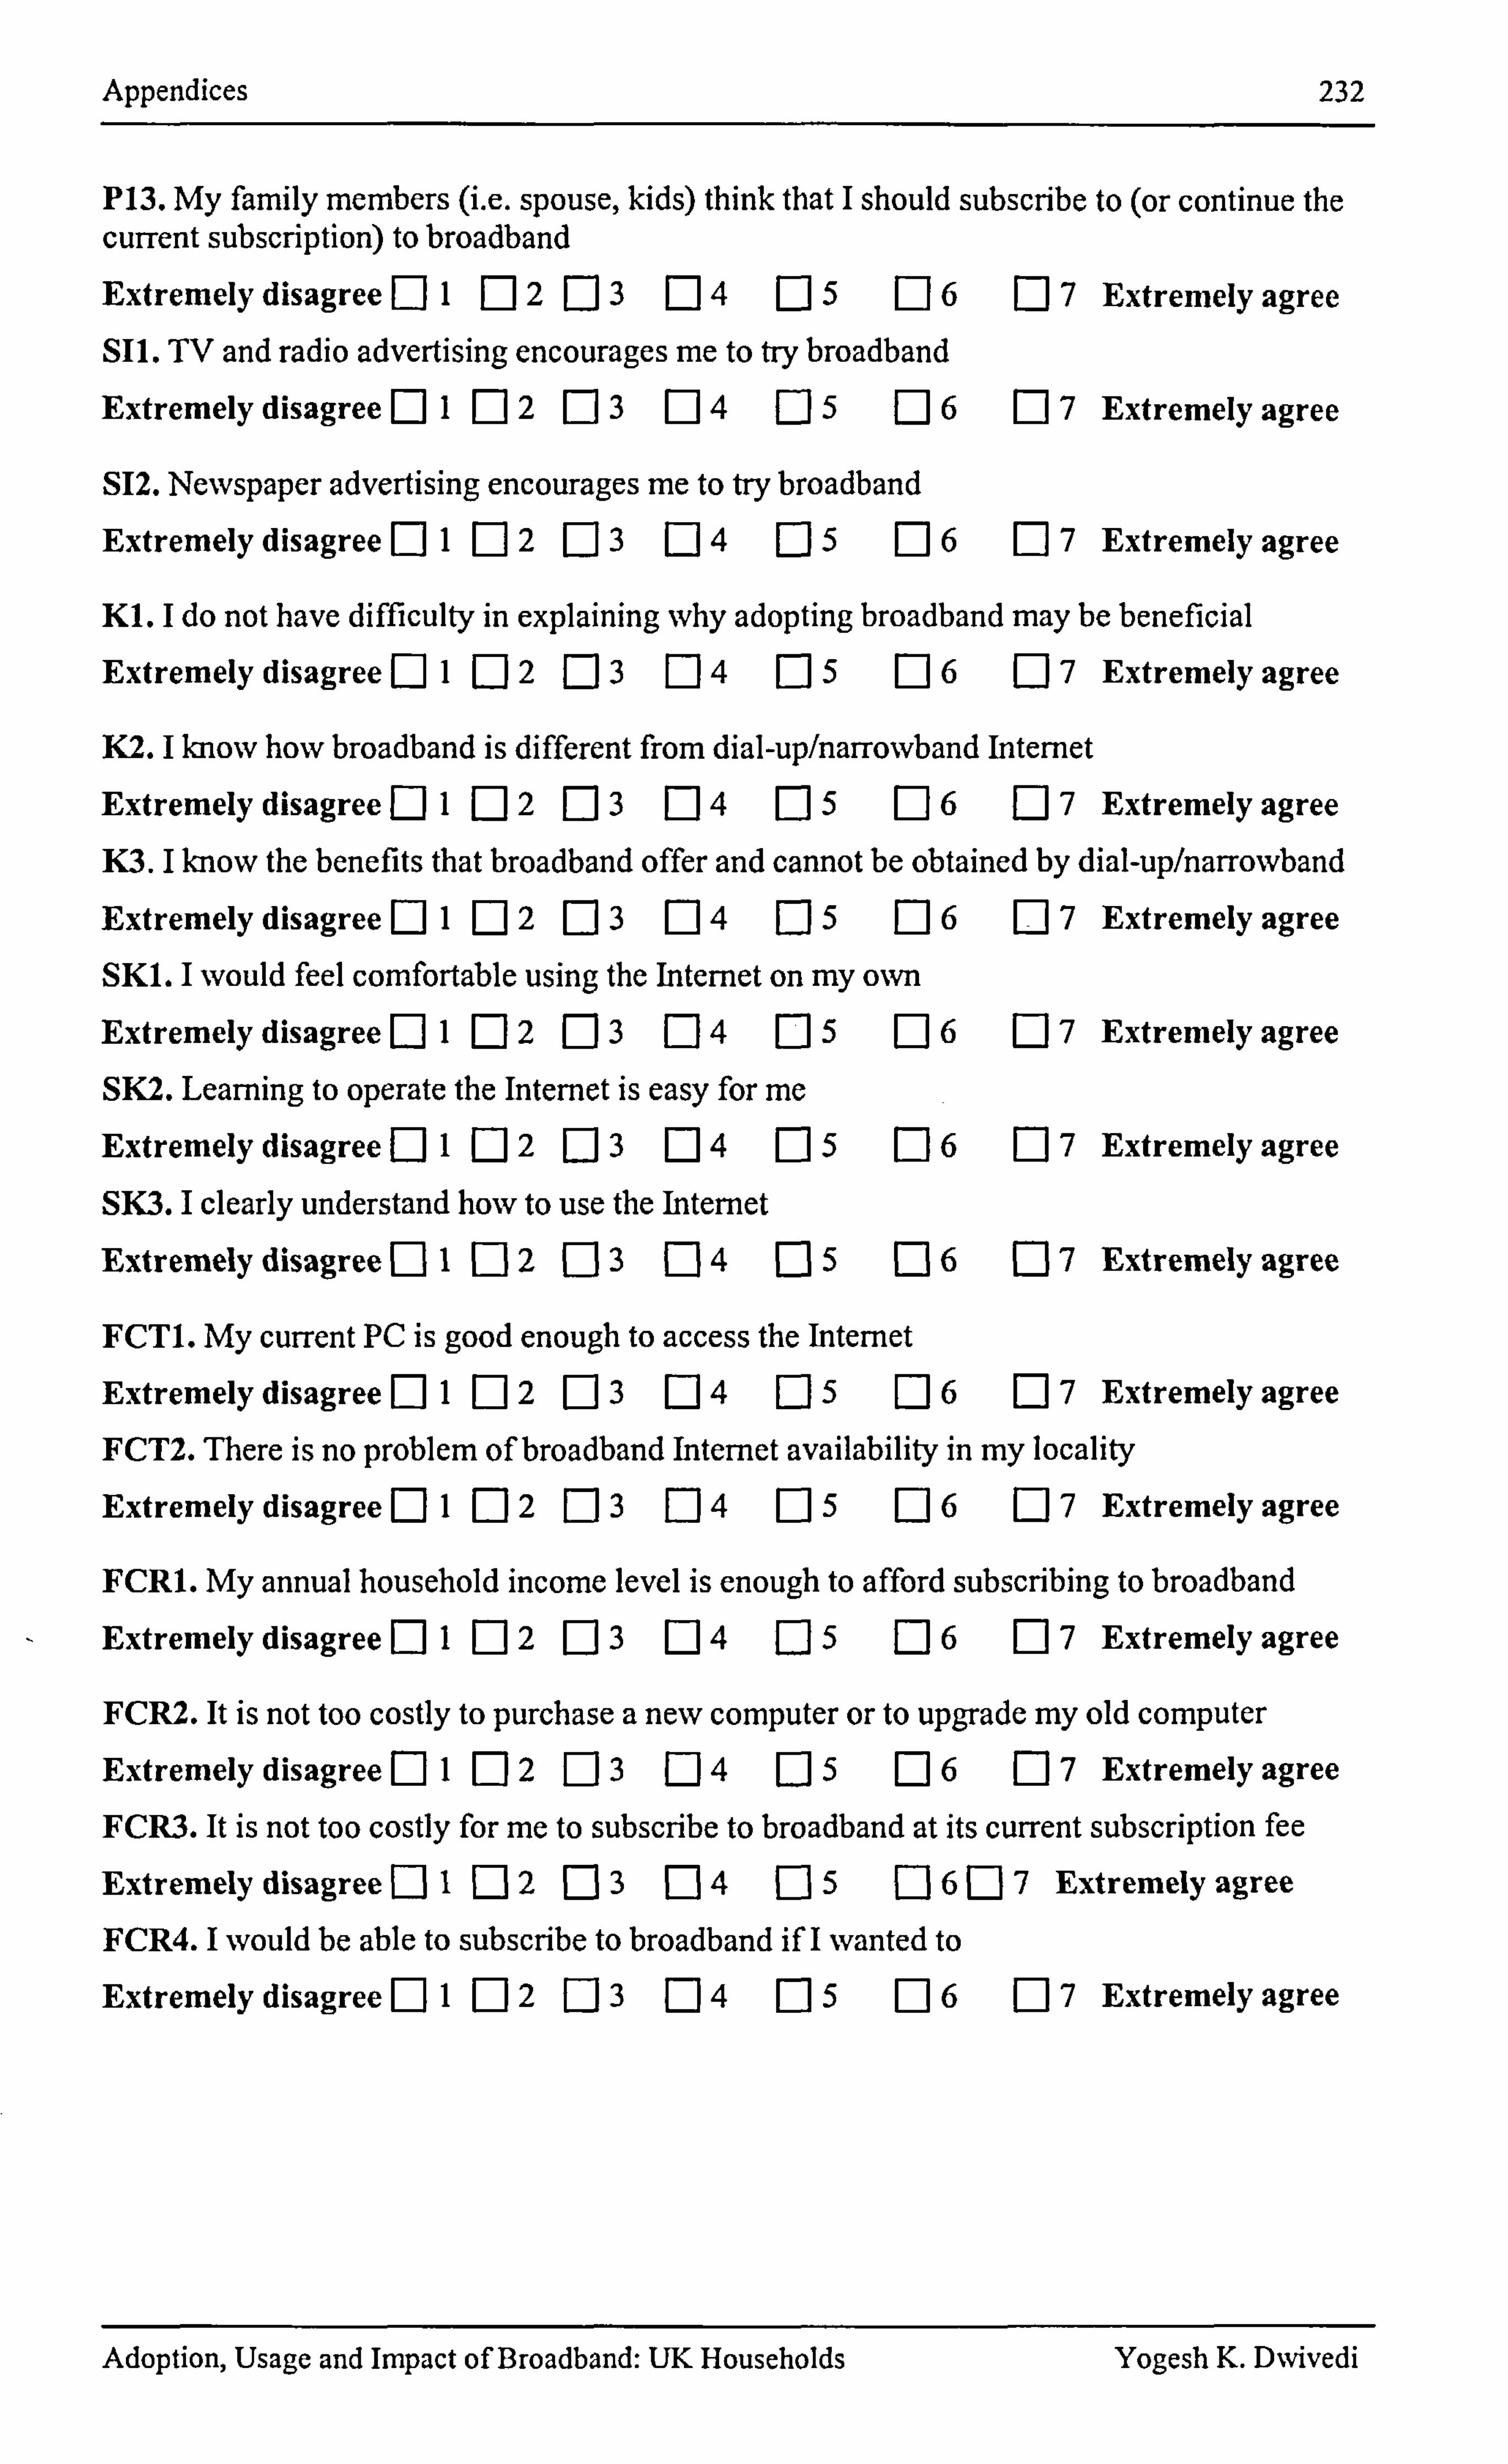
Appendices 232
P13. My family members (i. e. spouse, kids) think that I should subscribe to (or continue the current subscription) to broadband
Extremely disagree DIE: 1 2 E] 3 Ej 4 Ej 5 [: 16 Ej 7 Extremely agree SIL TV and radio advertising encourages me to try broadband
Extremely disagreeE] I Ej 2 [: 13 [: 14 [: 15 Ej 6 El 7 Extremely agree
S12. Newspaper advertising encourages me to try broadband
Extremely disagree [: 11 [: 12 [: ] 3 [: 14 Ej 5 Ej 6 [: 17 Extremely agree
KI. I do not have difficulty in explaining why adopting broadband may be beneficial
Extremely disagree [I I [: ] 2 [: ] 3 E14 [-] 5 E16 [: 17 Extremely agree
K2. I know how broadband is different from dial-up/narrowband Internet
Extremely disagree [D I [: ] 2 E13 E14 [: ] 5 E16 Ej 7 Extremely agree K3. I know the benefits that broadband offer and cannot be obtained by dial-up/narrowband
Extremely disagree [: 11 E] 2 E13 E14 E] 5 E16 [: 17 Extremely agree SKI. I would feel comfortable using the Internet on my own Extremely disagree [: 11 ED2 E13 E14 [: 15 [: ] 6 [: 17 Extremely agree SK2. Leaming to operate the Intemet is easy for me Extremely disagree [: ] I E] 2 E] 3 E14 E15 E16 E] 7 Extremely agree SK3. I clearly understand how to use the Internet
Extremely disagreeE] I E12 E33 E34 El 5 [: 16 Ej 7 Extremely agree
FCT1. My current PC is good enough to access the Internet
Extremely disagree [: 11 El 2 [: ] 3 [: ] 4 E15 Ej 6 Ej 7 Extremely agree FCT2. There is no problem of broadband Internet availability in my locality
Extremely disagreeE] I E12 E] 3 E] 4 [: ] 5 [: 16 El 7 Extremely agree
FCRI. My annual household income level is enough to afford subscribing to broadband
Extremely disagreeE] I El 2 [: ] 3 [: 14 E] 5 E16 [: 17 Extremely agree
FCR2. It is not too costly to purchase a new computer or to upgrade my old computer Extremely disagreeE] 1 [: 12 E13 Ej 4 [-] 5 E16 Ej 7 Extremely agree FCR3. It is not too costly for me to subscribe to broadband at its current subscription fee
Extremely disagree [: 11 EJ2 []3 E14 EJ 5 Ej 6 [: ] 7 Extremely agree FCR4. I would be able to subscribe to broadband if I wanted to Extremely disagree [: ] 1 [: 12 [: ] 3 [14 [-] 5 [: ] 6 [: 17 Extremely agree
Adoption, Usage and Impact of Broadband: UK Households Yogesh K. DNvivedi
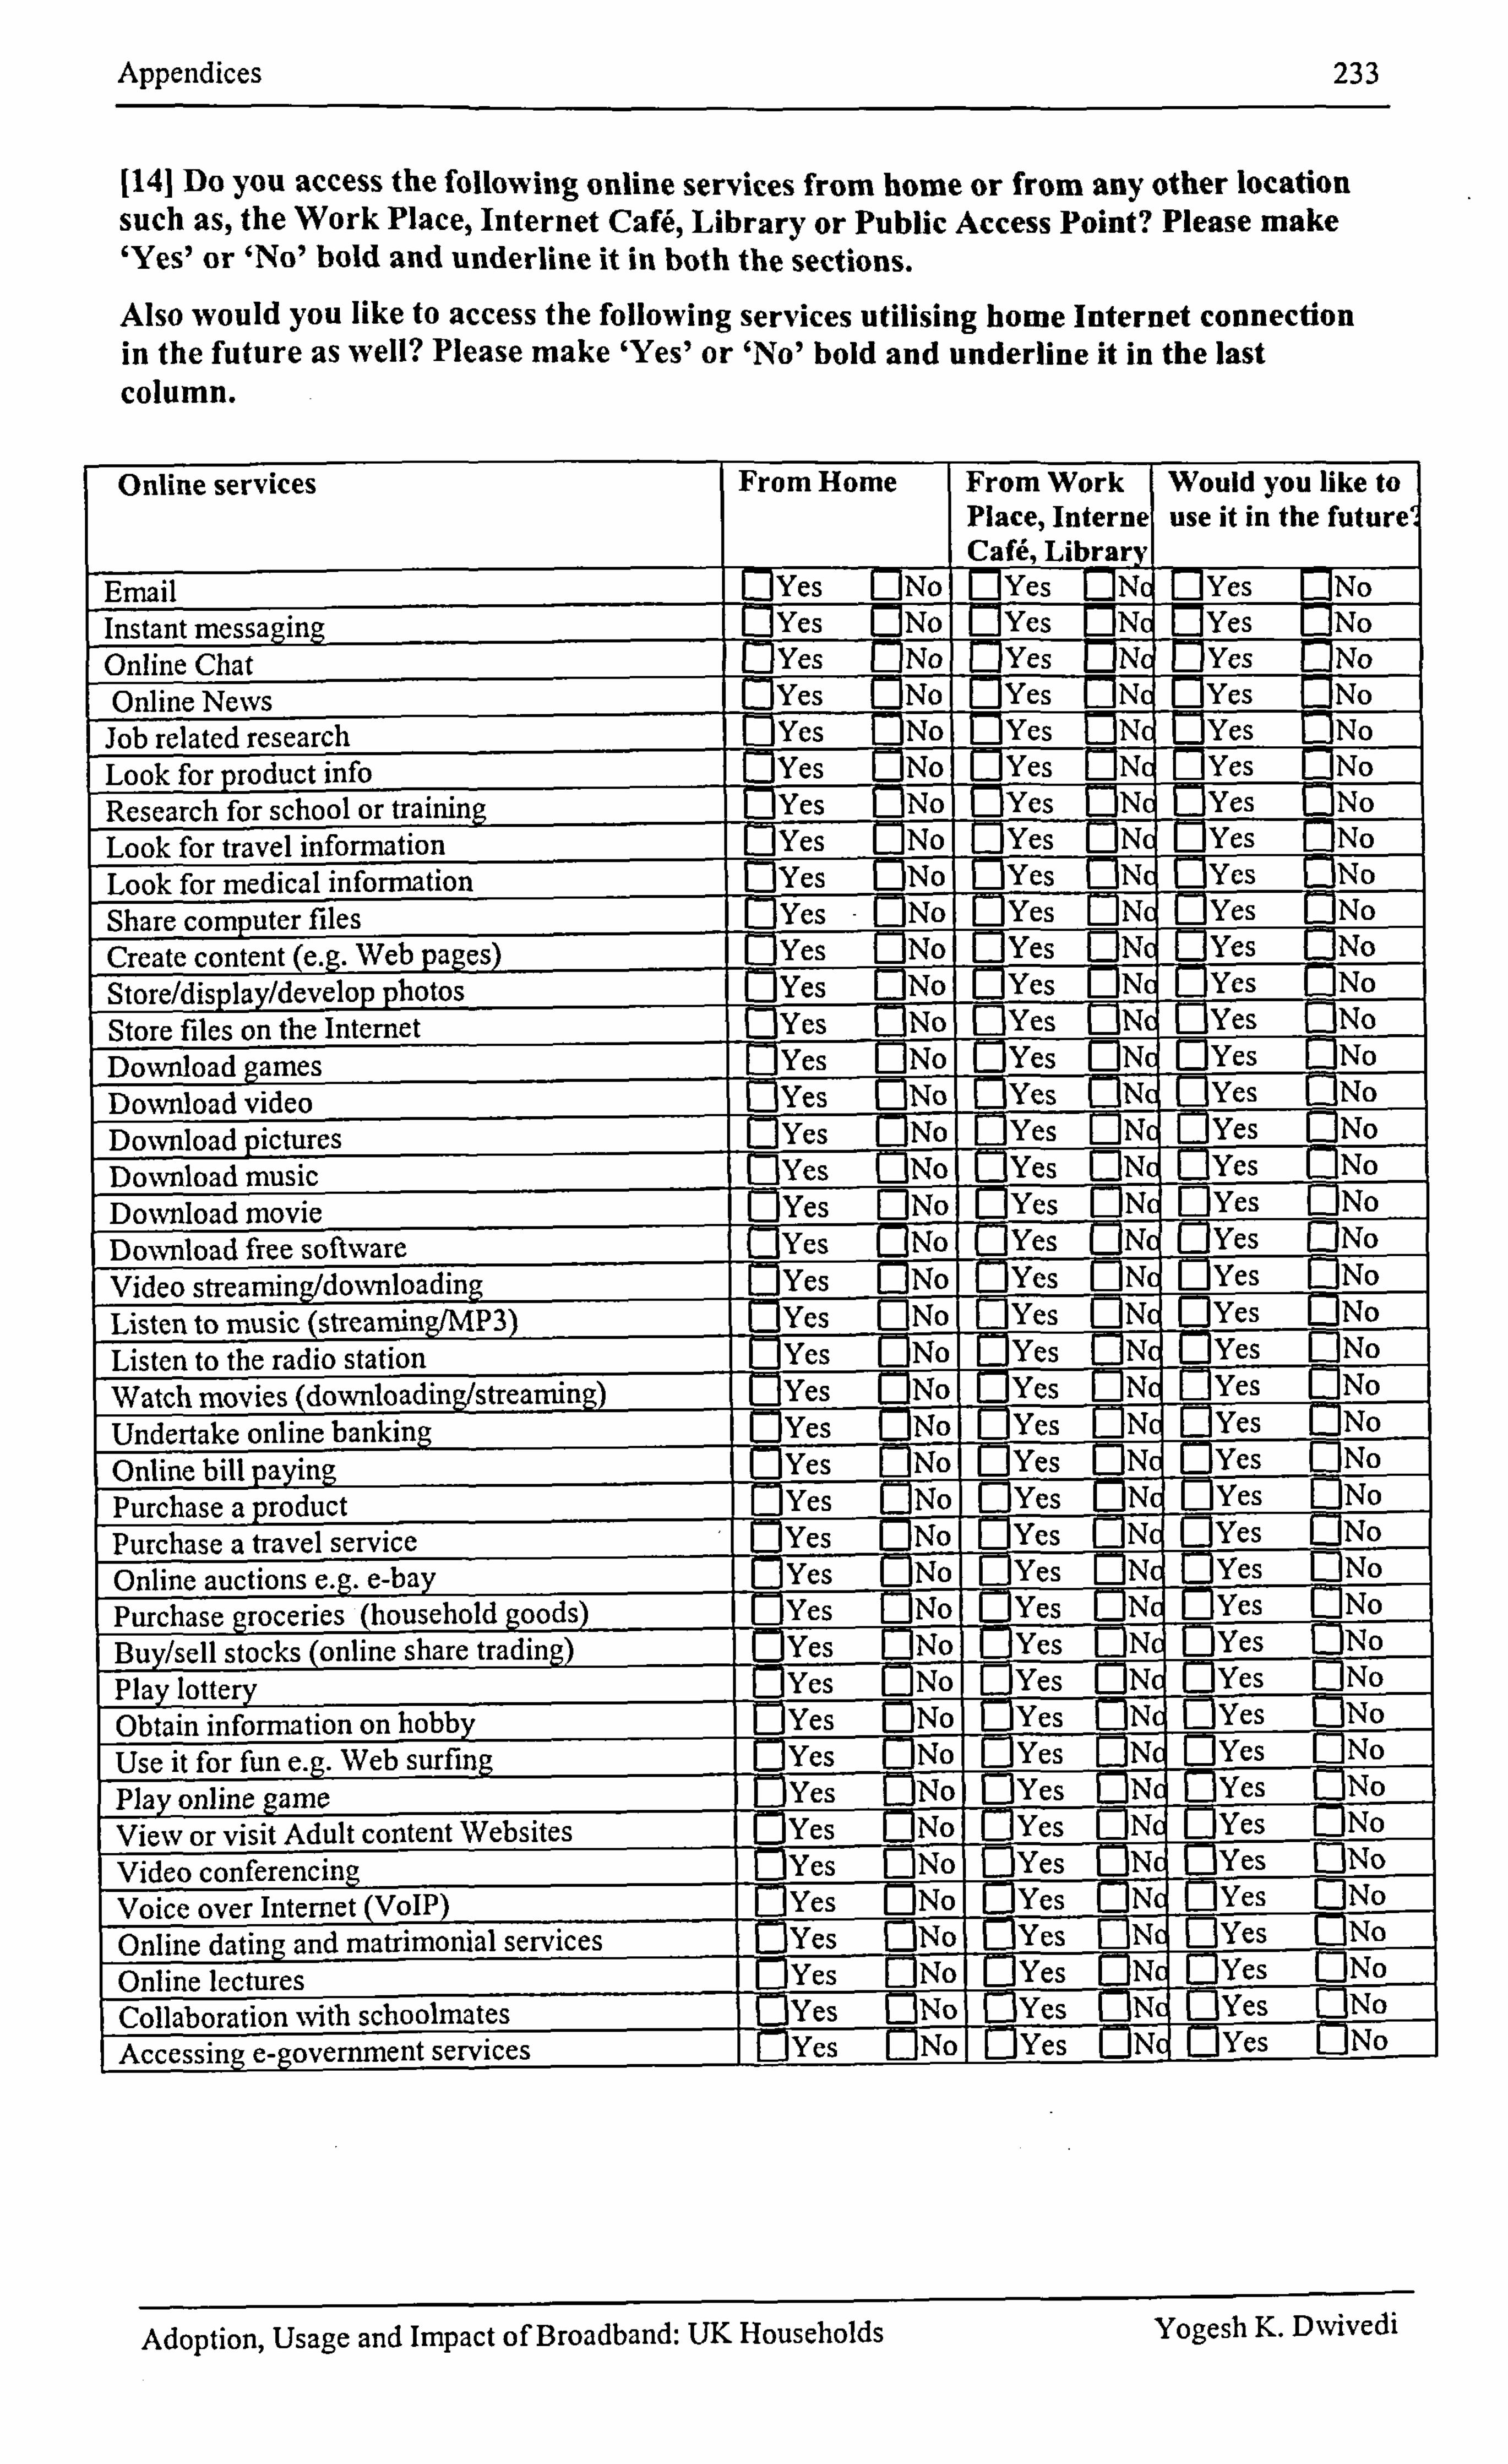
Appendices 233
1141 Do you access the following online services from home or from any other location such as, the Work Place, Internet CaR, Library or Public Access Point? Please make 'Yes' or 'No' bold and underline it in both the sections. Also would you like to access the following services utilising home Internet connection in the future as well? Please make 'Yes' or 'No' bold and underline it in the last column.
Online services From Home From Work Place, Interne Caff, Librall
Would you like to use it in the future.
- - Email L j Yes Lj No L j Yes L jN c [ ] Yes es E]N o Instant messaging U yes O No. E l yes MN ( E ] Yes N o Online Chat n Yer E] No E ] Yes L J Nc L
- J Yes
- No I
Online News E ] Yes E j No E j Yes [ : ]N ý [ T y cs E --
]N oI Job related research [ :] Yes L j No [ :] Yes E ] Nc C J Yes r ]N o Look for product info Yes [ :] No E j Yes U Nc L j Yes L j No Research for school or training [ :] Yes L j No Nd O yes 0 No Look for travel information Yes
- O No
- Ej Yes [ :] Nd [ :] Yes [
- ] No
- Look for medical infonmflon [] E Yes I No E] Yes Cj Nd LJ YCS CI N o Share computer files
- Yes Ej No Ej Yes Nc [
- :] Yes
- No
Create content (e. g. Web pages) M Yes Lj No [ :] Yes Ej Nc - -
[3 Yes [ -
j No Store/display/develop photos El yes Lj No [ j Yes EI Nc 0 yes E] No Store files on the Internet Yes N- Yes Nc es 0 Download games Ej Yes Lj No Ej Yes Ej N( O yes [
-A No
Download video Yes No [: ] Yes Cj Nc Yes [ :] No
Download pictures [ :] Yes E] No El yes E] Ný E] Yes No
Download music E] YCS C] No D yes Nc El yes Ej No
Download movie Yes E] No Yes Nc Yes Ej No
Download ftee software C] Yes [: ] 0 Yes Nc (D yes [J No
Video strearning/downloading E] Yes [: ] No EJ YCs Nc O Yes --
No
Listen to music (strearningfMP3) [] Yes [: ] No U-1 yes N( Lj yes D No
Listen to the radio station - [7] Yes
- F-1 0 D yes E: ] N( Yes No
Watch movies (downloading/streaming) r3 Yes No E] Yes 1 7] Nc E] Yes O No
Undertake online banking EJ Ycs No - El yes
- -- Nc D yes E] No
Online bill paying - C] Yes [: ] No [j Y es 0 Nc EJ Ycs D No
Purchase a product D yes Lj No
- Lj Yes
- EI N T O Yes LJ No
Purchase a travel service [] Yes -
Ej No [ T Yes [] Nc Ej Yes Lj No
Online auctions e. g. e-bay Y-e- s C3 No [D yes [] Nc Yes Lj No
Purchase groceries (household goods) Ej Yes No Ej Yes Nc cs D No
Buyjsell stocks (online share trading) Yes Ej No D yes Nd Yes Lj No -
Play lottery - C lYes No [] Yes Nd Yes O No
Obtain information on hobby E )Yes No Yes Nd [: ]Yes TT No
Use it for fun e. g. Web surfing [: ]Yes Ej No -
L jYes [: ] Ný Yes rT No
Play online game [7 1Yes LJ o N
- [: ]Yes
- E] Nc LJ YCS No
View or visit Adult content Websites E3 Yes Ej No - (7 cs Y
- E] Nc Ej Yes Lj No I
Video conferencing M Yes
- -
El C jY es Nc VF-1Z No I
Voice over Internet (VoIP) M Y es No Ej Yes EJ Nc - E ]Yes ýjo
Online datkig and matrimonial services Yes [] No - [j Yes
- Nc Yes F1 No
Online lectures E ]Yes [: ] No -
E JY es - Yes No
Collaborationwith schoolmates [ 3Yes [3 N o C: 3Yes U Nc 0 Yes -
O -
NO --1
Accessing e-government services E ]Yes O No [ ]Yes [I N T O Yes 1 l No _I
Adoption, Usage and Impact of Broadband: UK Households Yogesh K. DNvivedi
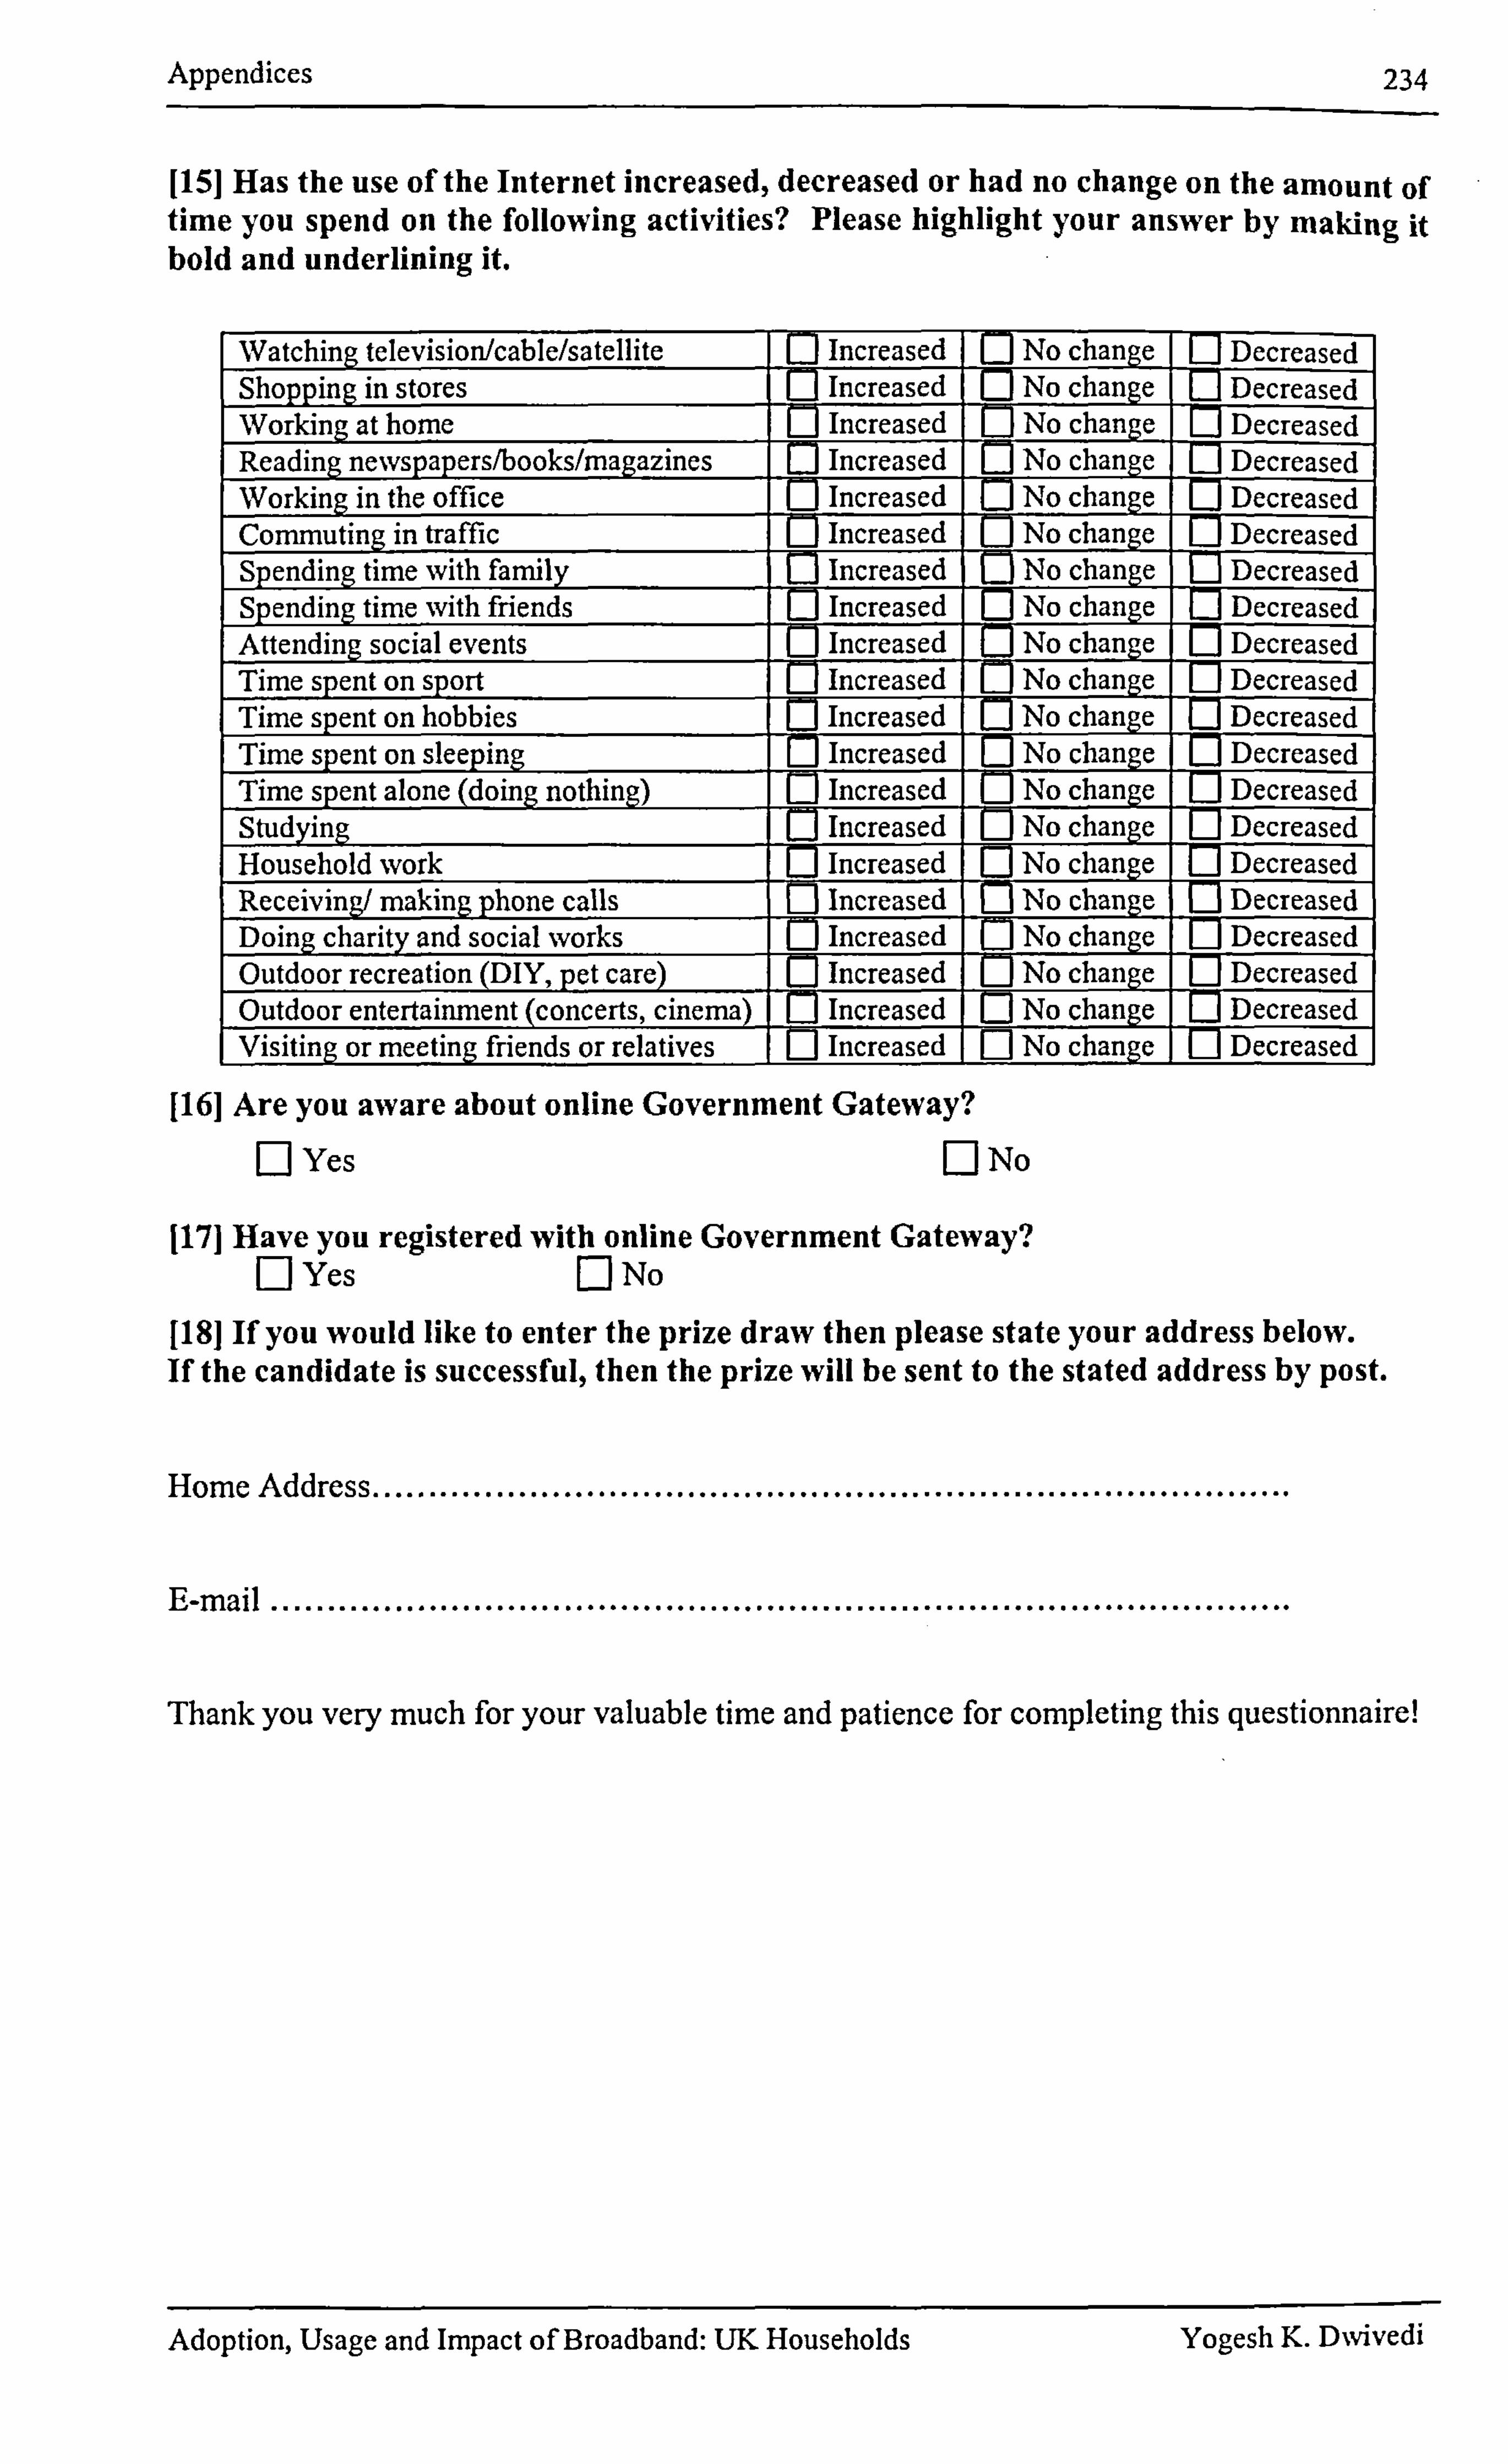
Appendices 234
[151 Has the use of the Internet increased, decreased or had no change on the amount of time you spend on the following activities? Please highlight your answer by making it bold and underlining it.
Watching television/cable/satellite Increased No change Lj Decreased Shopping in stores L] Increased Lj No change Ll Decreased Working at home El Increased El No change Lj Decreased Reading ne%vspapers/books/magazines El Increased
- o change Ll Decreased Working in the office Lj increased ange L-j Decreased Commuting in traffic
- E] Increased
- Lj No change [j Decreased
Spending time with family [] Increased Ll No change 0 Decre-ased Spending time with friends El Increased E] No change Lj Decreased Attending social events Ej Increased C] No change Lj Decreased Time spent on sport El Increased El No change U Decreased Time spent on hobbies Ej Increased El No change Lj Decreased Time spent on sleeping d [j No change Lj
- Decreased
- Time spent alone (doing nothing) Increased Ll No change [I D-ecreased Studying El Increased o change Lj Decreased Household work El Increased EJ No change 0 Decreased Receiying/ making phone calls El Increased 0 No change El Decremed Doing charity and social works Increased El No change Lj Decreased Outdoor recreation (DIY, pet care) -Increased Lj No change Lj
- Decreased
- Outdoor entertainment (concerts, cinemil: Increased -[: [No change -
[3 Decreased Visiting or meeting friends or relatives El Increased 0 No change El Decreased
1161 Are you aware about online Government Gateway?
El Yes Fl No
1171 Have you registered with online Government Gateway? El Yes r-1 No
[181 If you would like to enter the prize draw then please state your address below. If the candidate is successful, then the prize will be sent to the stated address by post.
Home Address ..................................................................................
E-mail ...........................................................................................
Thank you very much for your valuable time and patience for completing this questionnaire!
Adoption, Usage and Impact of Broadband: UK Households Yogesh K. DNvivedi