a study on the stall detection of an axial compressor through
TRANSCRIPT
applied sciences
Article
A Study on the Stall Detection of an AxialCompressor through Pressure Analysis
Haoying Chen 1,† ID , Fengyong Sun 2,†, Haibo Zhang 2,* and Wei Luo 1,†
1 Jiangsu Province Key Laboratory of Aerospace Power System, College of Energy and Power Engineering,Nanjing University of Aeronautics and Astronautics, No. 29 Yudao Street, Nanjing 210016, China;[email protected] (H.C.); [email protected] (W.L.)
2 AVIC Aero-engine Control System Institute, No. 792 Liangxi Road, Wuxi 214000, China;[email protected]
* Correspondence: [email protected]† These authors contributed equally to this work.
Received: 5 June 2017; Accepted: 22 July 2017; Published: 28 July 2017
Abstract: In order to research the inherent working laws of compressors nearing stall state,a series of compressor experiments are conducted. With the help of fast Fourier transform, theamplitude–frequency characteristics of pressures at the compressor inlet, outlet and blade tip regionoutlet are analyzed. Meanwhile, devices imitating inlet distortion were applied in the compressorinlet distortion disturbance. The experimental results indicated that compressor blade tip regionpressure showed a better performance than the compressor’s inlet and outlet pressures in regards todescribing compressor characteristics. What’s more, compressor inlet distortion always disturbed thecompressor pressure characteristics. Whether with inlet distortion or not, the pressure characteristicsof pressure periodicity and amplitude frequency could always be maintained in compressor blade tippressure. For the sake of compressor real-time stall detection application, a compressor stall detectionalgorithm is proposed to calculate the compressor pressure correlation coefficient. The algorithm alsoshowed a good monotonicity in describing the relationship between the compressor surge marginand the pressure correlation coefficient.
Keywords: stall state; inlet distortion; pressure characteristics; detection algorithm
1. Introduction
With the expansion of the advanced aircraft envelope, aero propulsion has put forward higherrequirements for the performance and stability of compressors. During aircraft super maneuveroperation processes, compressor inlet conditions badly deteriorate. The worsening inlet airflow couldshrink compressor surge margins and lead the compressor to rotating stall and surge. Meanwhile,compressor stall and surge are the main influencing factors that cause inherent aerodynamicinstabilities in the compressor operational envelope [1,2]. A large number of studies have been carriedout on the model of surge and rotational stall. Due to their complexity, it is difficult to establish anaccurate real-time mathematical model. At present, most research is aimed at single compressor parts.In 1980s, the United States carried out computer simulation research of the whole turbofan engine surge,and published a research report [3,4]. Also, a NASA report pointed out that the T700 engine adoptsactive stability control to control the compressor, but the technical details are unknown [5]. Wadiaidentified the same problem [6,7]. As is well known, the compressor characteristics map of pressureratio versus mass flow rate could reflect the compressor working performance. In other words, the inletpressure and outlet pressure of the compressor could reflect compressor performance, to a certainextent. In order to investigate the relationship between the compressor pressure and performance,the study of the compressor requires massive numerical simulations and experiments [8,9].
Appl. Sci. 2017, 7, 766; doi:10.3390/app7080766 www.mdpi.com/journal/applsci
Appl. Sci. 2017, 7, 766 2 of 14
As the pressures are easily observed or have been stored in other engine control sub-systems,pressures monitored at the inlet and outlet of the compressor are apparently the first choices forcompressor performance analysis. In fact, inlet and outlet pressures on the compressor have played animportant role in the engine fuel and nozzle throat area control system. However, the compressor’sinlet pressure is easily disturbed by the inlet air conditions, such as compressor inlet distortion.As a result, the application of compressor potential performance needs more accurate estimations ofcompressor surge margins. Traditional compressor safety protections are restricted in the compressorpotential performance application. Therefore, studies on the information at compressor blade tipregion, including pressure, have been gradually emphasized. The references written by Li, Shi andBrand [10–12] researched the working principal of compressor blade tip performance, which is difficultto apply in the engine compressor control system. The references written by Dhingra, Liu andWhite [13–15] studied the pressures at the compressor blade tip region, and found some interestinglaws about the relationship between blade tip pressures and compressor surge margin. Nevertheless,compressor inlet distortion disturbances are neglected, which the papers written by Dong, Lesser, Seoand Gunn [16–19] verified are significant impact factors in the compressor working performance.
In this paper, the research is focused on estimating compressor stability through examining thecompressor pressure signals under different compressor inlet aerodynamic conditions, includinginlet distortion influences. A series of experiments were conducted to research the laws that affecthow the compressor inherently works near stall state. The experiments approached the compressorfrom normal operating state to near stall state by controlling the flow of the compressor, while at thesame time simulating the compressor’s inlet distortion flow field. In order to discover the stabilityboundary of the compressor, the experiments measured the total pressure at the inlet and outlet ofcompressor under different speeds, and forced surge tests. In addition, the experiments also capturedthe compressor surge boundary under the condition of inlet distortion. Experiments on inlet-forcedsurge tests were conducted by adding a distortion simulator to the inlet section of the compressor.There are two kinds of distortion simulators used in these experiments. One simulated 90 degrees ofa circumferential sole distortion device, and the other is 90 degrees of circumferential symmetricaldistortion device. The fast Fourier transform (FFT) method enabled the comparison of inlet conditions,as well as the analysis of compressor inlet pressure, outlet pressure and blade tip region pressure. Thecompressor pressure amplitude–frequency characteristics were discussed with the FFT method [20,21].At last, a new compressor stall detection is proposed, and blade tip region pressure is applied withthe algorithm.
In the first section of this paper, the experiment facility and process will be briefly introduced.Then, FFT method principals are mentioned, and the pressures collected in the experiments areanalyzed. Finally, a compressor pressure signal analysis algorithm is proposed and applied tocompressor stability analysis.
2. Compressor Experiment Facilities
The compressor experiments were conducted within the low speed compressor facilities ofNanjing University of Aeronautics and Astronautics. Different compressor working conditions wererealized with the auxiliary of an air mass flow control valve. In the case of given compressor revolutionsper minute (RPM), the compressor’s geometric structure and the actuating mechanism of the controlsystem are fixed during the experiments. As the airflow control valve turns down, working conditionsget closer to the surge limit line for the compressor. Revolutions of 600 RPM, 800 RPM, and 1000 RPMare separately experimented under three inlet conditions. The inlet conditions are: without inletdistortion, with sole inlet distortion, and with symmetrical inlet distortion.
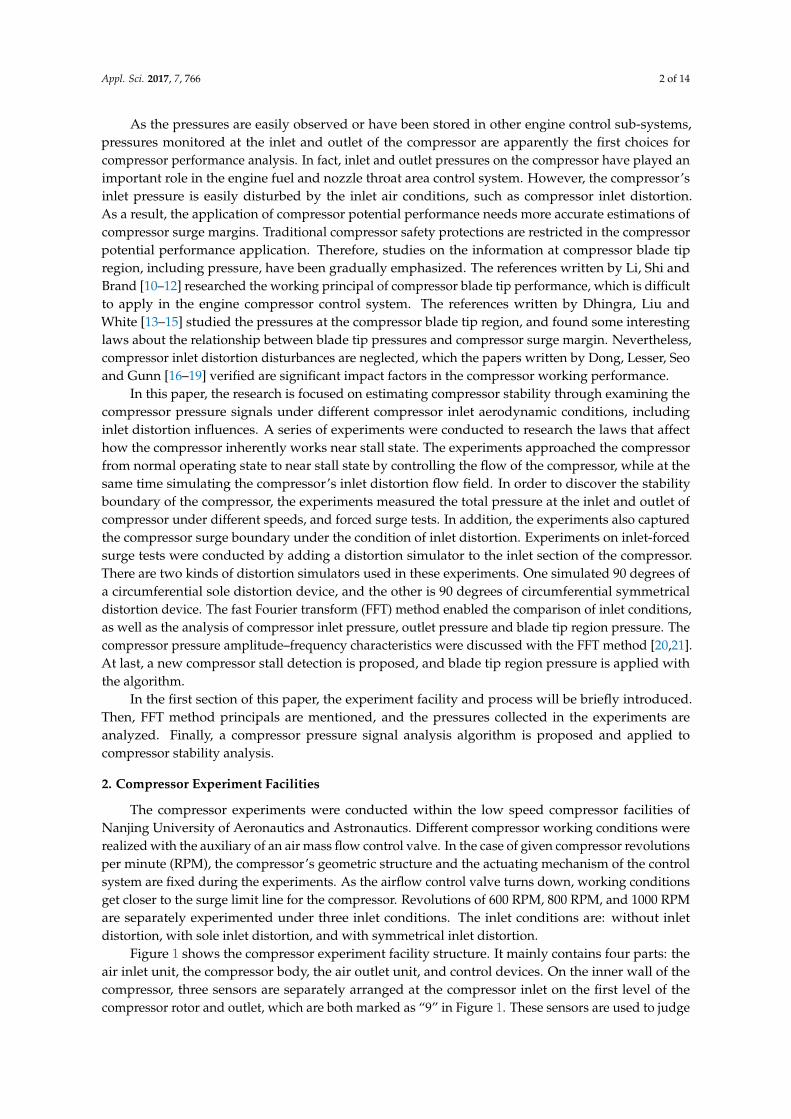
Figure 1 shows the compressor experiment facility structure. It mainly contains four parts: theair inlet unit, the compressor body, the air outlet unit, and control devices. On the inner wall of thecompressor, three sensors are separately arranged at the compressor inlet on the first level of thecompressor rotor and outlet, which are both marked as “9” in Figure 1. These sensors are used to judge
Appl. Sci. 2017, 7, 766 3 of 14
compressor stall and measure compressor pressure signals. In order to reduce the sensor installationvolume, the sensors are embedded directly into the probe head.
The signal measurement system in these experiments includes steady state measurement anddynamic measurement. The steady state measuring system includes a rotation speed measuringinstrument, a pressure-measuring system, a steady pressure probe, and a signal storage processor,which is mainly used to get steady compressor pressure signals under different inlet conditions.The total of pressure-measuring points are set in the compressor inlet and outlet. The dynamicmeasuring system includes a dynamic pressure-measuring instrument, a dynamic pressure sensor,and a signal storage processor, which is mainly used to obtain a dynamic pressure signal and judge thecompressor stall. The dynamic pressure-measuring points are set in the compressor inlet, outlet andthe compressor first stage. In these experiments, the Programmable Quad Bridge Amplifier (PQBA)signal-acquisition module of the LMS signal acquisition system is adopted. The highest samplingfrequency of the LMS dynamic signal acquisition system can get up to 200 kHz, and the digitalanalogue conversion accuracy is 16 bit. The dynamic pressure-measuring instruments adopted in thistest are Copal Electronics Company P-2000 dynamic pressure sensors.
Appl. Sci. 2017, 7, 766 3 of 14
compressor rotor and outlet, which are both marked as “9” in Figure 1. These sensors are used to judge compressor stall and measure compressor pressure signals. In order to reduce the sensor installation volume, the sensors are embedded directly into the probe head.
The signal measurement system in these experiments includes steady state measurement and dynamic measurement. The steady state measuring system includes a rotation speed measuring instrument, a pressure-measuring system, a steady pressure probe, and a signal storage processor, which is mainly used to get steady compressor pressure signals under different inlet conditions. The total of pressure-measuring points are set in the compressor inlet and outlet. The dynamic measuring system includes a dynamic pressure-measuring instrument, a dynamic pressure sensor, and a signal storage processor, which is mainly used to obtain a dynamic pressure signal and judge the compressor stall. The dynamic pressure-measuring points are set in the compressor inlet, outlet and the compressor first stage. In these experiments, the Programmable Quad Bridge Amplifier (PQBA) signal-acquisition module of the LMS signal acquisition system is adopted. The highest sampling frequency of the LMS dynamic signal acquisition system can get up to 200 kHz, and the digital analogue conversion accuracy is 16 bit. The dynamic pressure-measuring instruments adopted in this test are Copal Electronics Company P-2000 dynamic pressure sensors.
Figure 1. Compressor experiment facility.
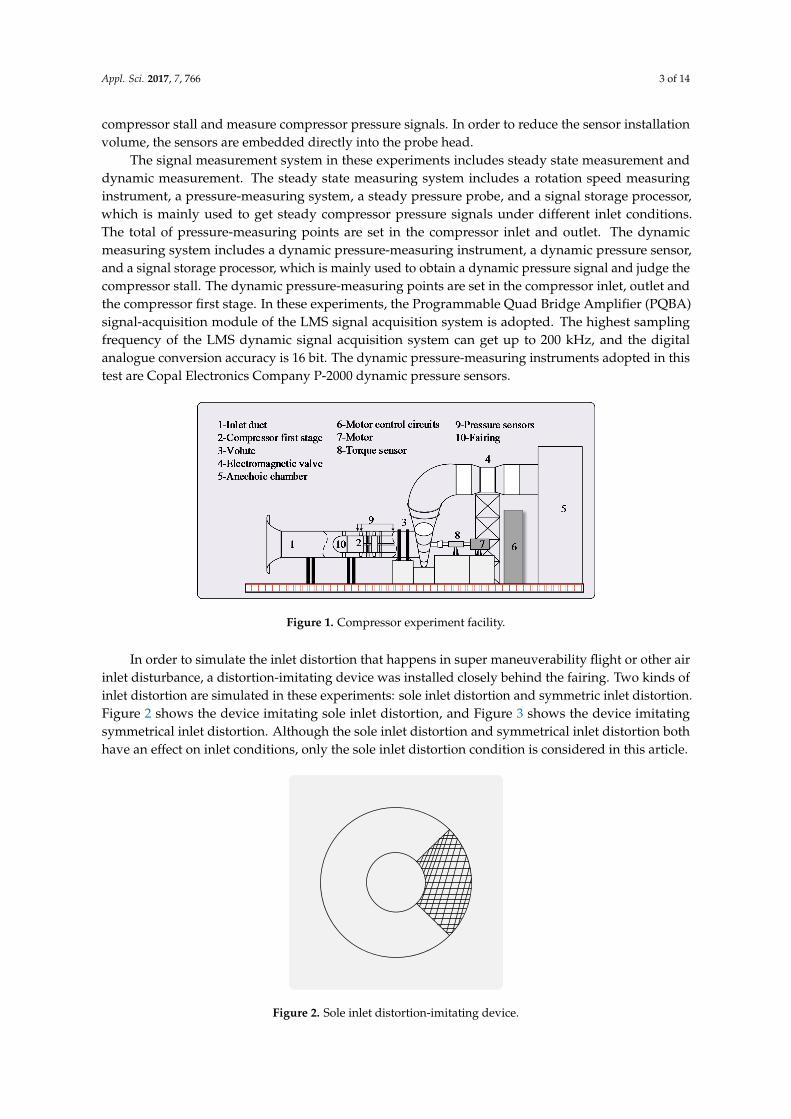
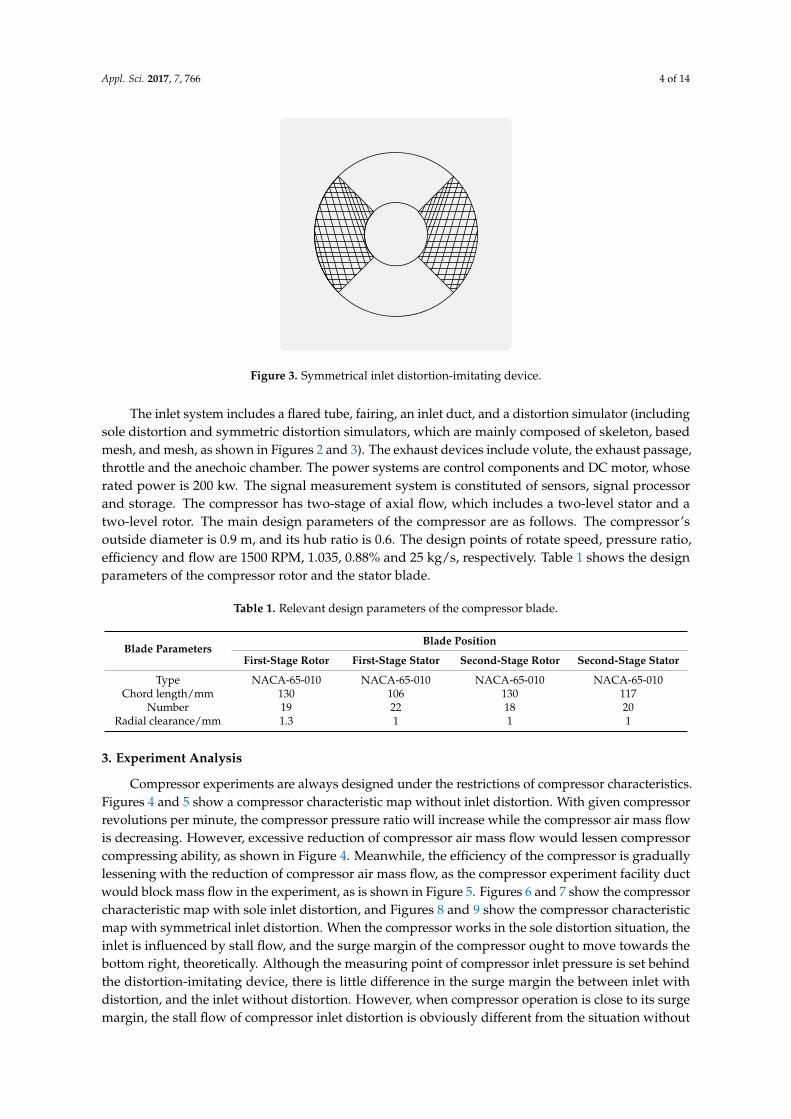
In order to simulate the inlet distortion that happens in super maneuverability flight or other air inlet disturbance, a distortion-imitating device was installed closely behind the fairing. Two kinds of inlet distortion are simulated in these experiments: sole inlet distortion and symmetric inlet distortion. Figure 2 shows the device imitating sole inlet distortion, and Figure 3 shows the device imitating symmetrical inlet distortion. Although the sole inlet distortion and symmetrical inlet distortion both have an effect on inlet conditions, only the sole inlet distortion condition is considered in this article.
Figure 2. Sole inlet distortion-imitating device.
Figure 1. Compressor experiment facility.
In order to simulate the inlet distortion that happens in super maneuverability flight or other airinlet disturbance, a distortion-imitating device was installed closely behind the fairing. Two kinds ofinlet distortion are simulated in these experiments: sole inlet distortion and symmetric inlet distortion.Figure 2 shows the device imitating sole inlet distortion, and Figure 3 shows the device imitatingsymmetrical inlet distortion. Although the sole inlet distortion and symmetrical inlet distortion bothhave an effect on inlet conditions, only the sole inlet distortion condition is considered in this article.
Appl. Sci. 2017, 7, 766 3 of 14
compressor rotor and outlet, which are both marked as “9” in Figure 1. These sensors are used to judge compressor stall and measure compressor pressure signals. In order to reduce the sensor installation volume, the sensors are embedded directly into the probe head.
The signal measurement system in these experiments includes steady state measurement and dynamic measurement. The steady state measuring system includes a rotation speed measuring instrument, a pressure-measuring system, a steady pressure probe, and a signal storage processor, which is mainly used to get steady compressor pressure signals under different inlet conditions. The total of pressure-measuring points are set in the compressor inlet and outlet. The dynamic measuring system includes a dynamic pressure-measuring instrument, a dynamic pressure sensor, and a signal storage processor, which is mainly used to obtain a dynamic pressure signal and judge the compressor stall. The dynamic pressure-measuring points are set in the compressor inlet, outlet and the compressor first stage. In these experiments, the Programmable Quad Bridge Amplifier (PQBA) signal-acquisition module of the LMS signal acquisition system is adopted. The highest sampling frequency of the LMS dynamic signal acquisition system can get up to 200 kHz, and the digital analogue conversion accuracy is 16 bit. The dynamic pressure-measuring instruments adopted in this test are Copal Electronics Company P-2000 dynamic pressure sensors.
Figure 1. Compressor experiment facility.
In order to simulate the inlet distortion that happens in super maneuverability flight or other air inlet disturbance, a distortion-imitating device was installed closely behind the fairing. Two kinds of inlet distortion are simulated in these experiments: sole inlet distortion and symmetric inlet distortion. Figure 2 shows the device imitating sole inlet distortion, and Figure 3 shows the device imitating symmetrical inlet distortion. Although the sole inlet distortion and symmetrical inlet distortion both have an effect on inlet conditions, only the sole inlet distortion condition is considered in this article.
Figure 2. Sole inlet distortion-imitating device.
Figure 2. Sole inlet distortion-imitating device.
Appl. Sci. 2017, 7, 766 4 of 14
Appl. Sci. 2017, 7, 766 4 of 14
Figure 3. Symmetrical inlet distortion-imitating device.
The inlet system includes a flared tube, fairing, an inlet duct, and a distortion simulator (including sole distortion and symmetric distortion simulators, which are mainly composed of skeleton, based mesh, and mesh, as shown in Figures 2 and 3). The exhaust devices include volute, the exhaust passage, throttle and the anechoic chamber. The power systems are control components and DC motor, whose rated power is 200 kw. The signal measurement system is constituted of sensors, signal processor and storage. The compressor has two-stage of axial flow, which includes a two-level stator and a two-level rotor. The main design parameters of the compressor are as follows. The compressor’s outside diameter is 0.9 m, and its hub ratio is 0.6. The design points of rotate speed, pressure ratio, efficiency and flow are 1500 RPM, 1.035, 0.88% and 25 kg/s, respectively. Table 1 shows the design parameters of the compressor rotor and the stator blade.
Table 1. Relevant design parameters of the compressor blade.
Blade Parameters Blade Position
First-Stage Rotor First-Stage Stator Second-Stage Rotor Second-Stage StatorType NACA-65-010 NACA-65-010 NACA-65-010 NACA-65-010
Chord length/mm 130 106 130 117 Number 19 22 18 20
Radial clearance/mm 1.3 1 1 1
3. Experiment Analysis
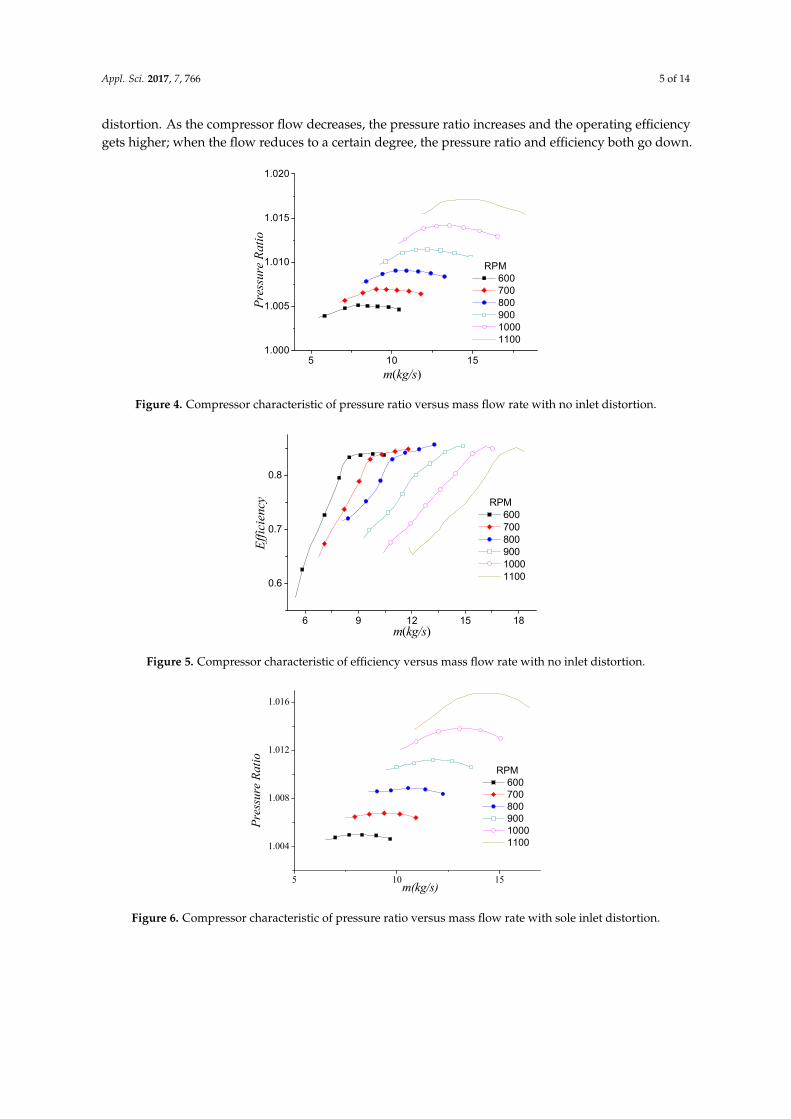
Compressor experiments are always designed under the restrictions of compressor characteristics. Figures 4 and 5 show a compressor characteristic map without inlet distortion. With given compressor revolutions per minute, the compressor pressure ratio will increase while the compressor air mass flow is decreasing. However, excessive reduction of compressor air mass flow would lessen compressor compressing ability, as shown in Figure 4. Meanwhile, the efficiency of the compressor is gradually lessening with the reduction of compressor air mass flow, as the compressor experiment facility duct would block mass flow in the experiment, as is shown in Figure 5. Figures 6 and 7 show the compressor characteristic map with sole inlet distortion, and Figures 8 and 9 show the compressor characteristic map with symmetrical inlet distortion. When the compressor works in the sole distortion situation, the inlet is influenced by stall flow, and the surge margin of the compressor ought to move towards the bottom right, theoretically. Although the measuring point of compressor inlet pressure is set behind the distortion-imitating device, there is little difference in the surge margin the between inlet with distortion, and the inlet without distortion. However, when compressor operation is close to its surge margin, the stall flow of compressor inlet distortion is obviously different from the situation without distortion. As the compressor flow decreases, the pressure ratio increases and the operating efficiency gets higher; when the flow reduces to a certain degree, the pressure ratio and efficiency both go down.
Figure 3. Symmetrical inlet distortion-imitating device.
The inlet system includes a flared tube, fairing, an inlet duct, and a distortion simulator (includingsole distortion and symmetric distortion simulators, which are mainly composed of skeleton, basedmesh, and mesh, as shown in Figures 2 and 3). The exhaust devices include volute, the exhaust passage,throttle and the anechoic chamber. The power systems are control components and DC motor, whoserated power is 200 kw. The signal measurement system is constituted of sensors, signal processorand storage. The compressor has two-stage of axial flow, which includes a two-level stator and atwo-level rotor. The main design parameters of the compressor are as follows. The compressor’soutside diameter is 0.9 m, and its hub ratio is 0.6. The design points of rotate speed, pressure ratio,efficiency and flow are 1500 RPM, 1.035, 0.88% and 25 kg/s, respectively. Table 1 shows the designparameters of the compressor rotor and the stator blade.
Table 1. Relevant design parameters of the compressor blade.
Blade ParametersBlade Position
First-Stage Rotor First-Stage Stator Second-Stage Rotor Second-Stage Stator
Type NACA-65-010 NACA-65-010 NACA-65-010 NACA-65-010Chord length/mm 130 106 130 117
Number 19 22 18 20Radial clearance/mm 1.3 1 1 1
3. Experiment Analysis
Compressor experiments are always designed under the restrictions of compressor characteristics.Figures 4 and 5 show a compressor characteristic map without inlet distortion. With given compressorrevolutions per minute, the compressor pressure ratio will increase while the compressor air mass flowis decreasing. However, excessive reduction of compressor air mass flow would lessen compressorcompressing ability, as shown in Figure 4. Meanwhile, the efficiency of the compressor is graduallylessening with the reduction of compressor air mass flow, as the compressor experiment facility ductwould block mass flow in the experiment, as is shown in Figure 5. Figures 6 and 7 show the compressorcharacteristic map with sole inlet distortion, and Figures 8 and 9 show the compressor characteristicmap with symmetrical inlet distortion. When the compressor works in the sole distortion situation, theinlet is influenced by stall flow, and the surge margin of the compressor ought to move towards thebottom right, theoretically. Although the measuring point of compressor inlet pressure is set behindthe distortion-imitating device, there is little difference in the surge margin the between inlet withdistortion, and the inlet without distortion. However, when compressor operation is close to its surgemargin, the stall flow of compressor inlet distortion is obviously different from the situation without
Appl. Sci. 2017, 7, 766 5 of 14
distortion. As the compressor flow decreases, the pressure ratio increases and the operating efficiencygets higher; when the flow reduces to a certain degree, the pressure ratio and efficiency both go down.Appl. Sci. 2017, 7, 766 5 of 14
Figure 4. Compressor characteristic of pressure ratio versus mass flow rate with no inlet distortion.
Figure 5. Compressor characteristic of efficiency versus mass flow rate with no inlet distortion.
Figure 6. Compressor characteristic of pressure ratio versus mass flow rate with sole inlet distortion.
5 10 151.000
1.005
1.010
1.015
1.020
m(kg/s)
Pres
sure
Rat
io RPM
600 700 800 900 1000 1100
6 9 12 15 18
0.6
0.7
0.8
Effic
ienc
y
m(kg/s)
RPM 600 700 800 900 1000 1100
5 10 15
1.004
1.008
1.012
1.016
RPM 600 700 800 900 1000 1100
Pres
sure
Rat
io
m(kg/s)
Figure 4. Compressor characteristic of pressure ratio versus mass flow rate with no inlet distortion.
Appl. Sci. 2017, 7, 766 5 of 14
Figure 4. Compressor characteristic of pressure ratio versus mass flow rate with no inlet distortion.
Figure 5. Compressor characteristic of efficiency versus mass flow rate with no inlet distortion.
Figure 6. Compressor characteristic of pressure ratio versus mass flow rate with sole inlet distortion.
5 10 151.000
1.005
1.010
1.015
1.020
m(kg/s)
Pres
sure
Rat
io RPM
600 700 800 900 1000 1100
6 9 12 15 18
0.6
0.7
0.8
Effic
ienc
y
m(kg/s)
RPM 600 700 800 900 1000 1100
5 10 15
1.004
1.008
1.012
1.016
RPM 600 700 800 900 1000 1100
Pres
sure
Rat
io
m(kg/s)
Figure 5. Compressor characteristic of efficiency versus mass flow rate with no inlet distortion.
Appl. Sci. 2017, 7, 766 5 of 14
Figure 4. Compressor characteristic of pressure ratio versus mass flow rate with no inlet distortion.
Figure 5. Compressor characteristic of efficiency versus mass flow rate with no inlet distortion.
Figure 6. Compressor characteristic of pressure ratio versus mass flow rate with sole inlet distortion.
5 10 151.000
1.005
1.010
1.015
1.020
m(kg/s)
Pres
sure
Rat
io RPM
600 700 800 900 1000 1100
6 9 12 15 18
0.6
0.7
0.8
Effic
ienc
y
m(kg/s)
RPM 600 700 800 900 1000 1100
5 10 15
1.004
1.008
1.012
1.016
RPM 600 700 800 900 1000 1100
Pres
sure
Rat
io
m(kg/s)
Figure 6. Compressor characteristic of pressure ratio versus mass flow rate with sole inlet distortion.
Appl. Sci. 2017, 7, 766 6 of 14Appl. Sci. 2017, 7, 766 6 of 14
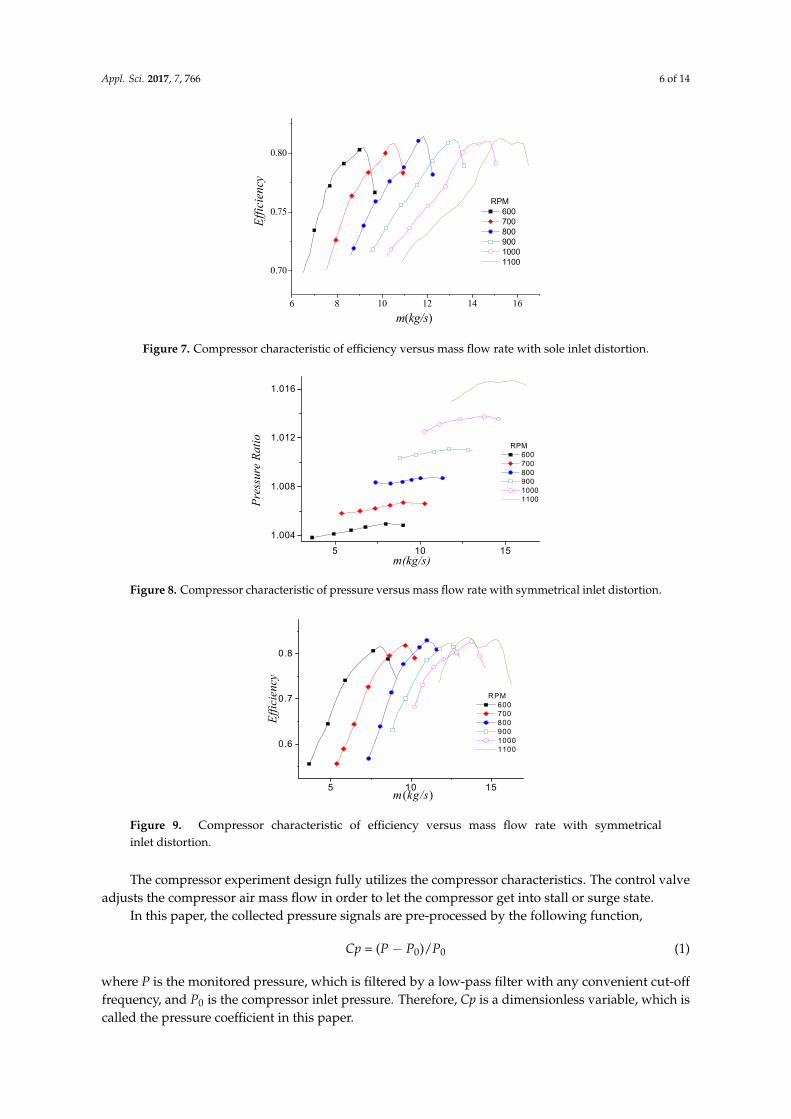
Figure 7. Compressor characteristic of efficiency versus mass flow rate with sole inlet distortion.
Figure 8. Compressor characteristic of pressure versus mass flow rate with symmetrical inlet
distortion.
Figure 9. Compressor characteristic of efficiency versus mass flow rate with symmetrical inlet distortion.
The compressor experiment design fully utilizes the compressor characteristics. The control valve adjusts the compressor air mass flow in order to let the compressor get into stall or surge state.
In this paper, the collected pressure signals are pre-processed by the following function,
Cp = (P − P0)/P0 (1)
6 8 10 12 14 16
0.70
0.75
0.80
m(kg/s)
Effic
ienc
y
RPM 600 700 800 900 1000 1100
5 10 15
1.004
1.008
1.012
1.016
m(kg/s)
Pres
sure
Rat
io RPM 600 700 800 900 1000 1100
5 10 15
0.6
0.7
0.8
m(kg/s)
Effic
ienc
y
RPM 600 700 800 900 1000 1100
Figure 7. Compressor characteristic of efficiency versus mass flow rate with sole inlet distortion.
Appl. Sci. 2017, 7, 766 6 of 14
Figure 7. Compressor characteristic of efficiency versus mass flow rate with sole inlet distortion.
Figure 8. Compressor characteristic of pressure versus mass flow rate with symmetrical inlet
distortion.
Figure 9. Compressor characteristic of efficiency versus mass flow rate with symmetrical inlet distortion.
The compressor experiment design fully utilizes the compressor characteristics. The control valve adjusts the compressor air mass flow in order to let the compressor get into stall or surge state.
In this paper, the collected pressure signals are pre-processed by the following function,
Cp = (P − P0)/P0 (1)
6 8 10 12 14 16
0.70
0.75
0.80
m(kg/s)
Effic
ienc
y
RPM 600 700 800 900 1000 1100
5 10 15
1.004
1.008
1.012
1.016
m(kg/s)
Pres
sure
Rat
io RPM 600 700 800 900 1000 1100
5 10 15
0.6
0.7
0.8
m(kg/s)
Effic
ienc
y
RPM 600 700 800 900 1000 1100
Figure 8. Compressor characteristic of pressure versus mass flow rate with symmetrical inlet distortion.
Appl. Sci. 2017, 7, 766 6 of 14
Figure 7. Compressor characteristic of efficiency versus mass flow rate with sole inlet distortion.
Figure 8. Compressor characteristic of pressure versus mass flow rate with symmetrical inlet
distortion.
Figure 9. Compressor characteristic of efficiency versus mass flow rate with symmetrical inlet distortion.
The compressor experiment design fully utilizes the compressor characteristics. The control valve adjusts the compressor air mass flow in order to let the compressor get into stall or surge state.
In this paper, the collected pressure signals are pre-processed by the following function,
Cp = (P − P0)/P0 (1)
6 8 10 12 14 16
0.70
0.75
0.80
m(kg/s)Ef
ficie
ncy
RPM 600 700 800 900 1000 1100
5 10 15
1.004
1.008
1.012
1.016
m(kg/s)
Pres
sure
Rat
io RPM 600 700 800 900 1000 1100
5 10 15
0.6
0.7
0.8
m(kg/s)
Effic
ienc
y
RPM 600 700 800 900 1000 1100
Figure 9. Compressor characteristic of efficiency versus mass flow rate with symmetricalinlet distortion.
The compressor experiment design fully utilizes the compressor characteristics. The control valveadjusts the compressor air mass flow in order to let the compressor get into stall or surge state.
In this paper, the collected pressure signals are pre-processed by the following function,
Cp = (P − P0)/P0 (1)
where P is the monitored pressure, which is filtered by a low-pass filter with any convenient cut-offfrequency, and P0 is the compressor inlet pressure. Therefore, Cp is a dimensionless variable, which iscalled the pressure coefficient in this paper.
Appl. Sci. 2017, 7, 766 7 of 14
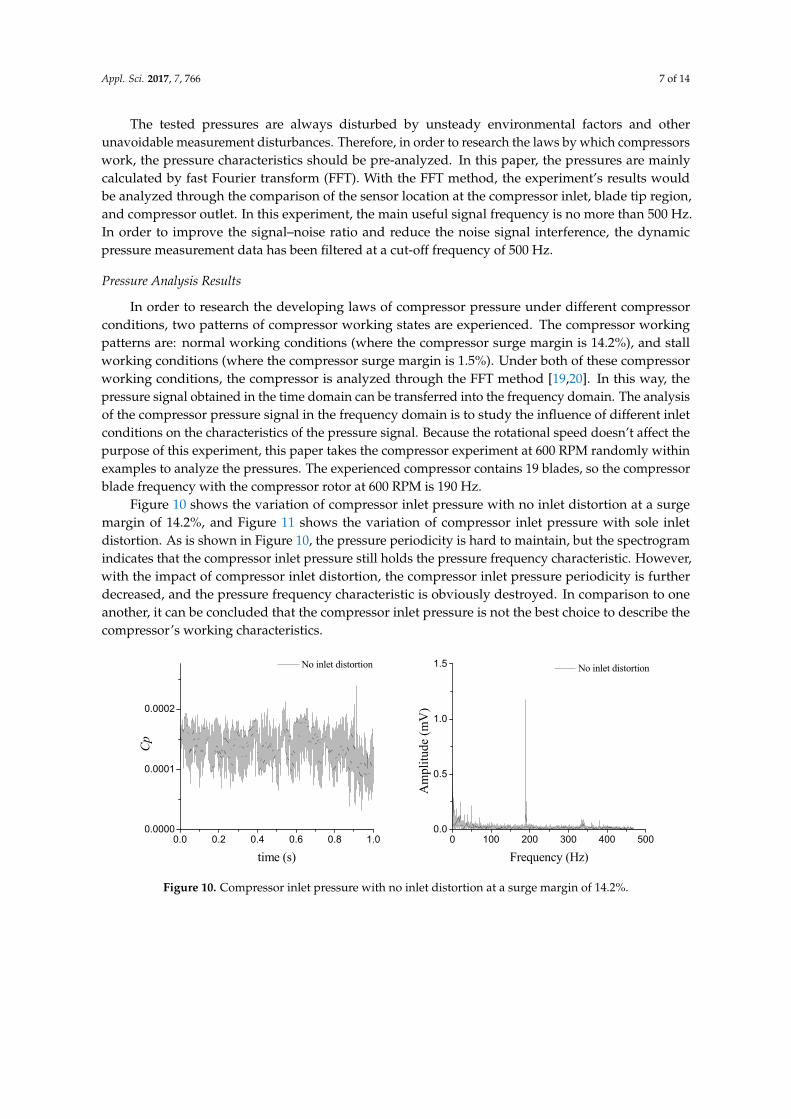
The tested pressures are always disturbed by unsteady environmental factors and otherunavoidable measurement disturbances. Therefore, in order to research the laws by which compressorswork, the pressure characteristics should be pre-analyzed. In this paper, the pressures are mainlycalculated by fast Fourier transform (FFT). With the FFT method, the experiment’s results wouldbe analyzed through the comparison of the sensor location at the compressor inlet, blade tip region,and compressor outlet. In this experiment, the main useful signal frequency is no more than 500 Hz.In order to improve the signal–noise ratio and reduce the noise signal interference, the dynamicpressure measurement data has been filtered at a cut-off frequency of 500 Hz.
Pressure Analysis Results
In order to research the developing laws of compressor pressure under different compressorconditions, two patterns of compressor working states are experienced. The compressor workingpatterns are: normal working conditions (where the compressor surge margin is 14.2%), and stallworking conditions (where the compressor surge margin is 1.5%). Under both of these compressorworking conditions, the compressor is analyzed through the FFT method [19,20]. In this way, thepressure signal obtained in the time domain can be transferred into the frequency domain. The analysisof the compressor pressure signal in the frequency domain is to study the influence of different inletconditions on the characteristics of the pressure signal. Because the rotational speed doesn’t affect thepurpose of this experiment, this paper takes the compressor experiment at 600 RPM randomly withinexamples to analyze the pressures. The experienced compressor contains 19 blades, so the compressorblade frequency with the compressor rotor at 600 RPM is 190 Hz.
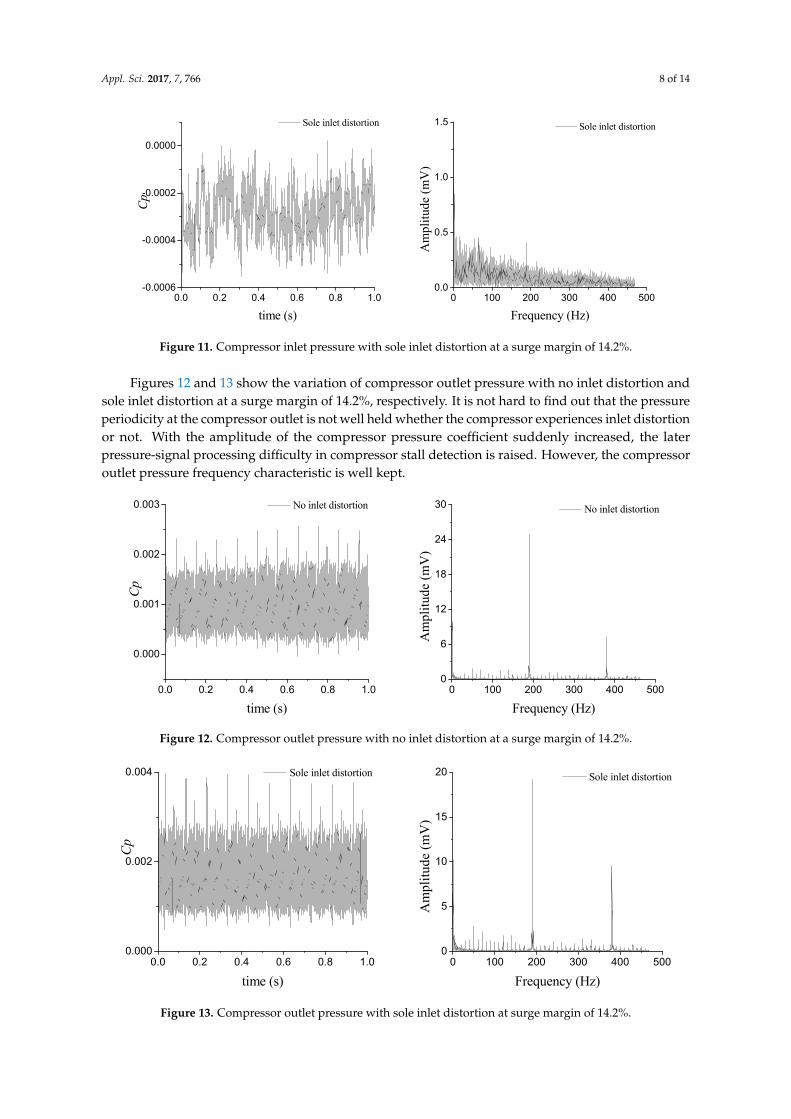
Figure 10 shows the variation of compressor inlet pressure with no inlet distortion at a surgemargin of 14.2%, and Figure 11 shows the variation of compressor inlet pressure with sole inletdistortion. As is shown in Figure 10, the pressure periodicity is hard to maintain, but the spectrogramindicates that the compressor inlet pressure still holds the pressure frequency characteristic. However,with the impact of compressor inlet distortion, the compressor inlet pressure periodicity is furtherdecreased, and the pressure frequency characteristic is obviously destroyed. In comparison to oneanother, it can be concluded that the compressor inlet pressure is not the best choice to describe thecompressor’s working characteristics.
Appl. Sci. 2017, 7, 766 7 of 14
where P is the monitored pressure, which is filtered by a low-pass filter with any convenient cut-off frequency, and P0 is the compressor inlet pressure. Therefore, Cp is a dimensionless variable, which is called the pressure coefficient in this paper.
The tested pressures are always disturbed by unsteady environmental factors and other unavoidable measurement disturbances. Therefore, in order to research the laws by which compressors work, the pressure characteristics should be pre-analyzed. In this paper, the pressures are mainly calculated by fast Fourier transform (FFT). With the FFT method, the experiment’s results would be analyzed through the comparison of the sensor location at the compressor inlet, blade tip region, and compressor outlet. In this experiment, the main useful signal frequency is no more than 500 Hz. In order to improve the signal–noise ratio and reduce the noise signal interference, the dynamic pressure measurement data has been filtered at a cut-off frequency of 500 Hz.
Pressure Analysis Results
In order to research the developing laws of compressor pressure under different compressor conditions, two patterns of compressor working states are experienced. The compressor working patterns are: normal working conditions (where the compressor surge margin is 14.2%), and stall working conditions (where the compressor surge margin is 1.5%). Under both of these compressor working conditions, the compressor is analyzed through the FFT method [19,20]. In this way, the pressure signal obtained in the time domain can be transferred into the frequency domain. The analysis of the compressor pressure signal in the frequency domain is to study the influence of different inlet conditions on the characteristics of the pressure signal. Because the rotational speed doesn’t affect the purpose of this experiment, this paper takes the compressor experiment at 600 RPM randomly within examples to analyze the pressures. The experienced compressor contains 19 blades, so the compressor blade frequency with the compressor rotor at 600 RPM is 190 Hz.
Figure 10 shows the variation of compressor inlet pressure with no inlet distortion at a surge margin of 14.2%, and Figure 11 shows the variation of compressor inlet pressure with sole inlet distortion. As is shown in Figure 10, the pressure periodicity is hard to maintain, but the spectrogram indicates that the compressor inlet pressure still holds the pressure frequency characteristic. However, with the impact of compressor inlet distortion, the compressor inlet pressure periodicity is further decreased, and the pressure frequency characteristic is obviously destroyed. In comparison to one another, it can be concluded that the compressor inlet pressure is not the best choice to describe the compressor’s working characteristics.
Figure 10. Compressor inlet pressure with no inlet distortion at a surge margin of 14.2%.
0.0 0.2 0.4 0.6 0.8 1.00.0000
0.0001
0.0002
0 100 200 300 400 5000.0
0.5
1.0
1.5
Cp
time (s)
No inlet distortion No inlet distortion
Am
plitu
de (m
V)
Frequency (Hz)
Figure 10. Compressor inlet pressure with no inlet distortion at a surge margin of 14.2%.
Appl. Sci. 2017, 7, 766 8 of 14Appl. Sci. 2017, 7, 766 8 of 14
Figure 11. Compressor inlet pressure with sole inlet distortion at a surge margin of 14.2%.
Figures 12 and 13 show the variation of compressor outlet pressure with no inlet distortion and sole inlet distortion at a surge margin of 14.2%, respectively. It is not hard to find out that the pressure periodicity at the compressor outlet is not well held whether the compressor experiences inlet distortion or not. With the amplitude of the compressor pressure coefficient suddenly increased, the later pressure-signal processing difficulty in compressor stall detection is raised. However, the compressor outlet pressure frequency characteristic is well kept.
Figure 12. Compressor outlet pressure with no inlet distortion at a surge margin of 14.2%.
Figure 13. Compressor outlet pressure with sole inlet distortion at surge margin of 14.2%.
0.0 0.2 0.4 0.6 0.8 1.0-0.0006
-0.0004
-0.0002
0.0000
0 100 200 300 400 5000.0
0.5
1.0
1.5
Cp
time (s)
Sole inlet distortion Sole inlet distortion
Am
plitu
de (m
V)
Frequency (Hz)
0.0 0.2 0.4 0.6 0.8 1.0
0.000
0.001
0.002
0.003
0 100 200 300 400 5000
6
12
18
24
30
Cp
time (s)
No inlet distortion No inlet distortion
Am
plitu
de (m
V)
Frequency (Hz)
0.0 0.2 0.4 0.6 0.8 1.00.000
0.002
0.004
0 100 200 300 400 5000
5
10
15
20
Cp
time (s)
Sole inlet distortion Sole inlet distortion
Am
plitu
de (m
V)
Frequency (Hz)
Figure 11. Compressor inlet pressure with sole inlet distortion at a surge margin of 14.2%.
Figures 12 and 13 show the variation of compressor outlet pressure with no inlet distortion andsole inlet distortion at a surge margin of 14.2%, respectively. It is not hard to find out that the pressureperiodicity at the compressor outlet is not well held whether the compressor experiences inlet distortionor not. With the amplitude of the compressor pressure coefficient suddenly increased, the laterpressure-signal processing difficulty in compressor stall detection is raised. However, the compressoroutlet pressure frequency characteristic is well kept.
Appl. Sci. 2017, 7, 766 8 of 14
Figure 11. Compressor inlet pressure with sole inlet distortion at a surge margin of 14.2%.
Figures 12 and 13 show the variation of compressor outlet pressure with no inlet distortion and sole inlet distortion at a surge margin of 14.2%, respectively. It is not hard to find out that the pressure periodicity at the compressor outlet is not well held whether the compressor experiences inlet distortion or not. With the amplitude of the compressor pressure coefficient suddenly increased, the later pressure-signal processing difficulty in compressor stall detection is raised. However, the compressor outlet pressure frequency characteristic is well kept.
Figure 12. Compressor outlet pressure with no inlet distortion at a surge margin of 14.2%.
Figure 13. Compressor outlet pressure with sole inlet distortion at surge margin of 14.2%.
0.0 0.2 0.4 0.6 0.8 1.0-0.0006
-0.0004
-0.0002
0.0000
0 100 200 300 400 5000.0
0.5
1.0
1.5
Cp
time (s)
Sole inlet distortion Sole inlet distortion
Am
plitu
de (m
V)
Frequency (Hz)
0.0 0.2 0.4 0.6 0.8 1.0
0.000
0.001
0.002
0.003
0 100 200 300 400 5000
6
12
18
24
30
Cp
time (s)
No inlet distortion No inlet distortion
Am
plitu
de (m
V)
Frequency (Hz)
0.0 0.2 0.4 0.6 0.8 1.00.000
0.002
0.004
0 100 200 300 400 5000
5
10
15
20
Cp
time (s)
Sole inlet distortion Sole inlet distortion
Am
plitu
de (m
V)
Frequency (Hz)
Figure 12. Compressor outlet pressure with no inlet distortion at a surge margin of 14.2%.
Appl. Sci. 2017, 7, 766 8 of 14
Figure 11. Compressor inlet pressure with sole inlet distortion at a surge margin of 14.2%.
Figures 12 and 13 show the variation of compressor outlet pressure with no inlet distortion and sole inlet distortion at a surge margin of 14.2%, respectively. It is not hard to find out that the pressure periodicity at the compressor outlet is not well held whether the compressor experiences inlet distortion or not. With the amplitude of the compressor pressure coefficient suddenly increased, the later pressure-signal processing difficulty in compressor stall detection is raised. However, the compressor outlet pressure frequency characteristic is well kept.
Figure 12. Compressor outlet pressure with no inlet distortion at a surge margin of 14.2%.
Figure 13. Compressor outlet pressure with sole inlet distortion at surge margin of 14.2%.
0.0 0.2 0.4 0.6 0.8 1.0-0.0006
-0.0004
-0.0002
0.0000
0 100 200 300 400 5000.0
0.5
1.0
1.5
Cp
time (s)
Sole inlet distortion Sole inlet distortion
Am
plitu
de (m
V)
Frequency (Hz)
0.0 0.2 0.4 0.6 0.8 1.0
0.000
0.001
0.002
0.003
0 100 200 300 400 5000
6
12
18
24
30
Cp
time (s)
No inlet distortion No inlet distortion
Am
plitu
de (m
V)
Frequency (Hz)
0.0 0.2 0.4 0.6 0.8 1.00.000
0.002
0.004
0 100 200 300 400 5000
5
10
15
20
Cp
time (s)
Sole inlet distortion Sole inlet distortion
Am
plitu
de (m
V)
Frequency (Hz)
Figure 13. Compressor outlet pressure with sole inlet distortion at surge margin of 14.2%.
Appl. Sci. 2017, 7, 766 9 of 14
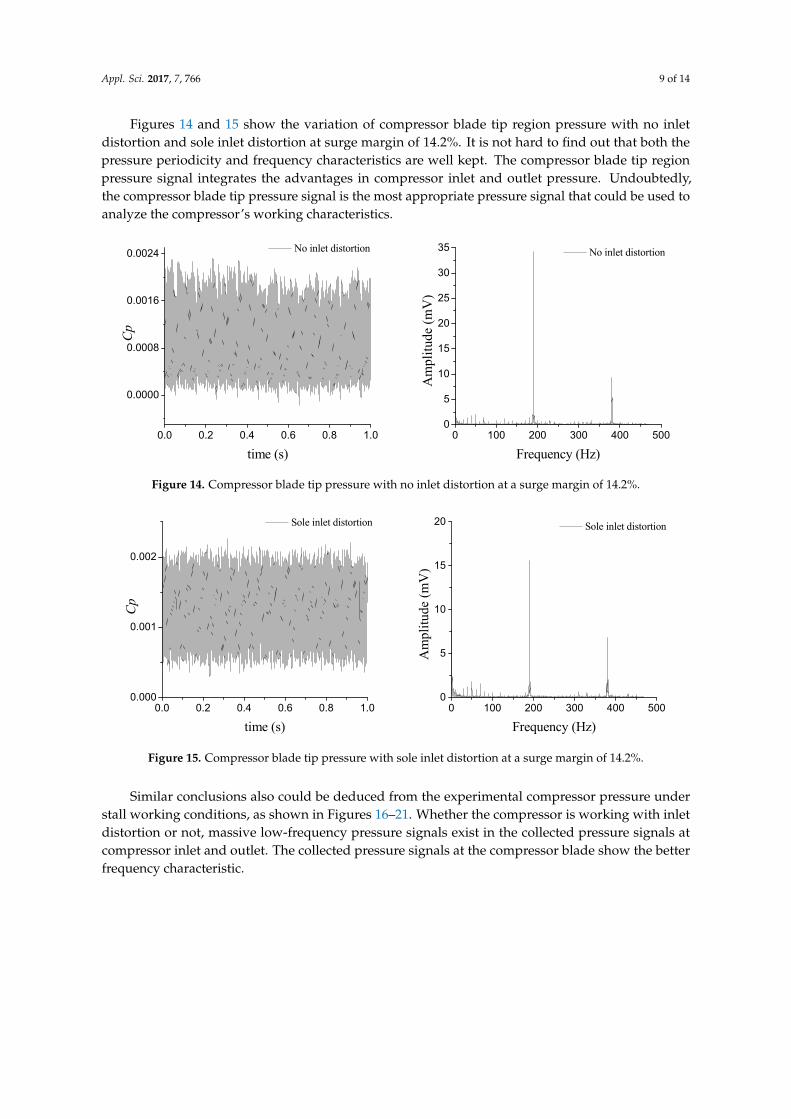
Figures 14 and 15 show the variation of compressor blade tip region pressure with no inletdistortion and sole inlet distortion at surge margin of 14.2%. It is not hard to find out that both thepressure periodicity and frequency characteristics are well kept. The compressor blade tip regionpressure signal integrates the advantages in compressor inlet and outlet pressure. Undoubtedly,the compressor blade tip pressure signal is the most appropriate pressure signal that could be used toanalyze the compressor’s working characteristics.
Appl. Sci. 2017, 7, 766 9 of 14
Figures 14 and 15 show the variation of compressor blade tip region pressure with no inlet distortion and sole inlet distortion at surge margin of 14.2%. It is not hard to find out that both the pressure periodicity and frequency characteristics are well kept. The compressor blade tip region pressure signal integrates the advantages in compressor inlet and outlet pressure. Undoubtedly, the compressor blade tip pressure signal is the most appropriate pressure signal that could be used to analyze the compressor’s working characteristics.
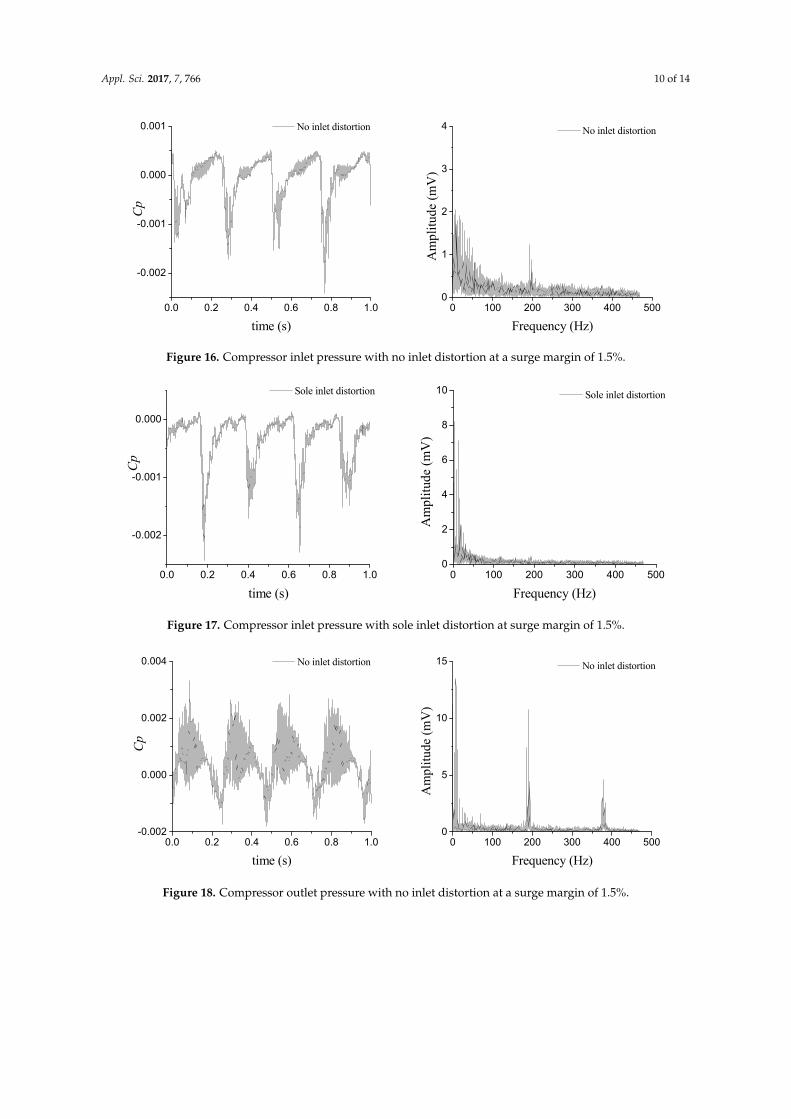
Similar conclusions also could be deduced from the experimental compressor pressure under stall working conditions, as shown in Figures 16–21. Whether the compressor is working with inlet distortion or not, massive low-frequency pressure signals exist in the collected pressure signals at compressor inlet and outlet. The collected pressure signals at the compressor blade show the better frequency characteristic.
Figure 14. Compressor blade tip pressure with no inlet distortion at a surge margin of 14.2%.
Figure 15. Compressor blade tip pressure with sole inlet distortion at a surge margin of 14.2%.
0.0 0.2 0.4 0.6 0.8 1.0
0.0000
0.0008
0.0016
0.0024
0 100 200 300 400 5000
5
10
15
20
25
30
35
Cp
time (s)
No inlet distortion No inlet distortion
Am
plitu
de (m
V)
Frequency (Hz)
0.0 0.2 0.4 0.6 0.8 1.00.000
0.001
0.002
0 100 200 300 400 5000
5
10
15
20
Cp
time (s)
Sole inlet distortion Sole inlet distortion
Am
plitu
de (m
V)
Frequency (Hz)
Figure 14. Compressor blade tip pressure with no inlet distortion at a surge margin of 14.2%.
Appl. Sci. 2017, 7, 766 9 of 14
Figures 14 and 15 show the variation of compressor blade tip region pressure with no inlet distortion and sole inlet distortion at surge margin of 14.2%. It is not hard to find out that both the pressure periodicity and frequency characteristics are well kept. The compressor blade tip region pressure signal integrates the advantages in compressor inlet and outlet pressure. Undoubtedly, the compressor blade tip pressure signal is the most appropriate pressure signal that could be used to analyze the compressor’s working characteristics.
Similar conclusions also could be deduced from the experimental compressor pressure under stall working conditions, as shown in Figures 16–21. Whether the compressor is working with inlet distortion or not, massive low-frequency pressure signals exist in the collected pressure signals at compressor inlet and outlet. The collected pressure signals at the compressor blade show the better frequency characteristic.
Figure 14. Compressor blade tip pressure with no inlet distortion at a surge margin of 14.2%.
Figure 15. Compressor blade tip pressure with sole inlet distortion at a surge margin of 14.2%.
0.0 0.2 0.4 0.6 0.8 1.0
0.0000
0.0008
0.0016
0.0024
0 100 200 300 400 5000
5
10
15
20
25
30
35
Cp
time (s)
No inlet distortion No inlet distortion
Am
plitu
de (m
V)
Frequency (Hz)
0.0 0.2 0.4 0.6 0.8 1.00.000
0.001
0.002
0 100 200 300 400 5000
5
10
15
20
Cp
time (s)
Sole inlet distortion Sole inlet distortion
Am
plitu
de (m
V)
Frequency (Hz)
Figure 15. Compressor blade tip pressure with sole inlet distortion at a surge margin of 14.2%.
Similar conclusions also could be deduced from the experimental compressor pressure understall working conditions, as shown in Figures 16–21. Whether the compressor is working with inletdistortion or not, massive low-frequency pressure signals exist in the collected pressure signals atcompressor inlet and outlet. The collected pressure signals at the compressor blade show the betterfrequency characteristic.
Appl. Sci. 2017, 7, 766 10 of 14Appl. Sci. 2017, 7, 766 10 of 14
Figure 16. Compressor inlet pressure with no inlet distortion at a surge margin of 1.5%.
Figure 17. Compressor inlet pressure with sole inlet distortion at surge margin of 1.5%.
Figure 18. Compressor outlet pressure with no inlet distortion at a surge margin of 1.5%.
0.0 0.2 0.4 0.6 0.8 1.0
-0.002
-0.001
0.000
0.001
0 100 200 300 400 5000
1
2
3
4C
p
time (s)
No inlet distortion No inlet distortion
Am
plitu
de (m
V)
Frequency (Hz)
0.0 0.2 0.4 0.6 0.8 1.0
-0.002
-0.001
0.000
0 100 200 300 400 5000
2
4
6
8
10
Cp
time (s)
Sole inlet distortion Sole inlet distortion
Am
plitu
de (m
V)
Frequency (Hz)
0.0 0.2 0.4 0.6 0.8 1.0-0.002
0.000
0.002
0.004
0 100 200 300 400 5000
5
10
15
Cp
time (s)
No inlet distortion No inlet distortion
Am
plitu
de (m
V)
Frequency (Hz)
Figure 16. Compressor inlet pressure with no inlet distortion at a surge margin of 1.5%.
Appl. Sci. 2017, 7, 766 10 of 14
Figure 16. Compressor inlet pressure with no inlet distortion at a surge margin of 1.5%.
Figure 17. Compressor inlet pressure with sole inlet distortion at surge margin of 1.5%.
Figure 18. Compressor outlet pressure with no inlet distortion at a surge margin of 1.5%.
0.0 0.2 0.4 0.6 0.8 1.0
-0.002
-0.001
0.000
0.001
0 100 200 300 400 5000
1
2
3
4C
p
time (s)
No inlet distortion No inlet distortion
Am
plitu
de (m
V)
Frequency (Hz)
0.0 0.2 0.4 0.6 0.8 1.0
-0.002
-0.001
0.000
0 100 200 300 400 5000
2
4
6
8
10
Cp
time (s)
Sole inlet distortion Sole inlet distortion
Am
plitu
de (m
V)
Frequency (Hz)
0.0 0.2 0.4 0.6 0.8 1.0-0.002
0.000
0.002
0.004
0 100 200 300 400 5000
5
10
15
Cp
time (s)
No inlet distortion No inlet distortion
Am
plitu
de (m
V)
Frequency (Hz)
Figure 17. Compressor inlet pressure with sole inlet distortion at surge margin of 1.5%.
Appl. Sci. 2017, 7, 766 10 of 14
Figure 16. Compressor inlet pressure with no inlet distortion at a surge margin of 1.5%.
Figure 17. Compressor inlet pressure with sole inlet distortion at surge margin of 1.5%.
Figure 18. Compressor outlet pressure with no inlet distortion at a surge margin of 1.5%.
0.0 0.2 0.4 0.6 0.8 1.0
-0.002
-0.001
0.000
0.001
0 100 200 300 400 5000
1
2
3
4
Cp
time (s)
No inlet distortion No inlet distortion
Am
plitu
de (m
V)
Frequency (Hz)
0.0 0.2 0.4 0.6 0.8 1.0
-0.002
-0.001
0.000
0 100 200 300 400 5000
2
4
6
8
10
Cp
time (s)
Sole inlet distortion Sole inlet distortion
Am
plitu
de (m
V)
Frequency (Hz)
0.0 0.2 0.4 0.6 0.8 1.0-0.002
0.000
0.002
0.004
0 100 200 300 400 5000
5
10
15
Cp
time (s)
No inlet distortion No inlet distortion
Am
plitu
de (m
V)
Frequency (Hz)
Figure 18. Compressor outlet pressure with no inlet distortion at a surge margin of 1.5%.
Appl. Sci. 2017, 7, 766 11 of 14Appl. Sci. 2017, 7, 766 11 of 14
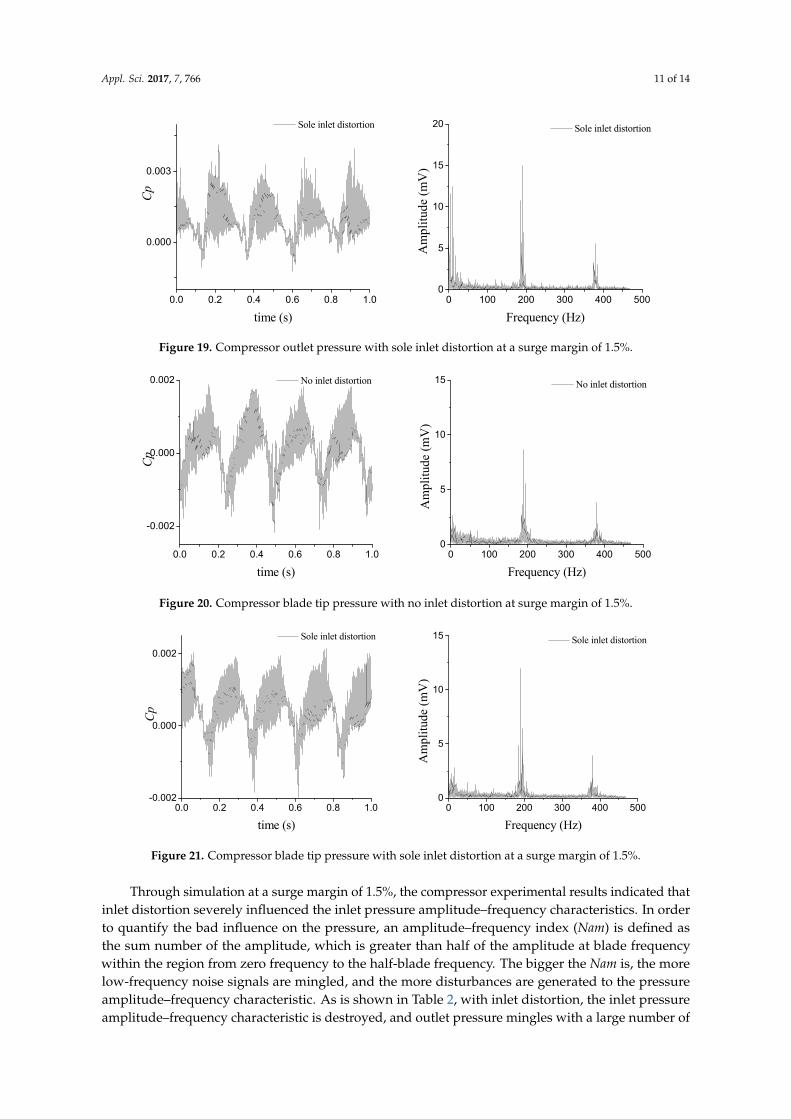
Figure 19. Compressor outlet pressure with sole inlet distortion at a surge margin of 1.5%.
Figure 20. Compressor blade tip pressure with no inlet distortion at surge margin of 1.5%.
Figure 21. Compressor blade tip pressure with sole inlet distortion at a surge margin of 1.5%.
Through simulation at a surge margin of 1.5%, the compressor experimental results indicated that inlet distortion severely influenced the inlet pressure amplitude–frequency characteristics. In order to quantify the bad influence on the pressure, an amplitude–frequency index (Nam) is defined as the sum number of the amplitude, which is greater than half of the amplitude at blade frequency within the region from zero frequency to the half-blade frequency. The bigger the Nam is, the more low-frequency noise signals are mingled, and the more disturbances are generated to the pressure amplitude–frequency characteristic. As is shown in Table 2, with inlet distortion, the inlet pressure amplitude–frequency characteristic is destroyed, and outlet pressure mingles with a large number of low-frequency noise signals. However, the blade tip Nam is continually kept at zero. The
0.0 0.2 0.4 0.6 0.8 1.0
0.000
0.003
0 100 200 300 400 5000
5
10
15
20
Cp
time (s)
Sole inlet distortion Sole inlet distortion
Am
plitu
de (m
V)
Frequency (Hz)
0.0 0.2 0.4 0.6 0.8 1.0
-0.002
0.000
0.002
0 100 200 300 400 5000
5
10
15
Cp
time (s)
No inlet distortion No inlet distortion
Am
plitu
de (m
V)
Frequency (Hz)
0.0 0.2 0.4 0.6 0.8 1.0-0.002
0.000
0.002
0 100 200 300 400 5000
5
10
15
Cp
time (s)
Sole inlet distortion Sole inlet distortion
Am
plitu
de (m
V)
Frequency (Hz)
Figure 19. Compressor outlet pressure with sole inlet distortion at a surge margin of 1.5%.
Appl. Sci. 2017, 7, 766 11 of 14
Figure 19. Compressor outlet pressure with sole inlet distortion at a surge margin of 1.5%.
Figure 20. Compressor blade tip pressure with no inlet distortion at surge margin of 1.5%.
Figure 21. Compressor blade tip pressure with sole inlet distortion at a surge margin of 1.5%.
Through simulation at a surge margin of 1.5%, the compressor experimental results indicated that inlet distortion severely influenced the inlet pressure amplitude–frequency characteristics. In order to quantify the bad influence on the pressure, an amplitude–frequency index (Nam) is defined as the sum number of the amplitude, which is greater than half of the amplitude at blade frequency within the region from zero frequency to the half-blade frequency. The bigger the Nam is, the more low-frequency noise signals are mingled, and the more disturbances are generated to the pressure amplitude–frequency characteristic. As is shown in Table 2, with inlet distortion, the inlet pressure amplitude–frequency characteristic is destroyed, and outlet pressure mingles with a large number of low-frequency noise signals. However, the blade tip Nam is continually kept at zero. The
0.0 0.2 0.4 0.6 0.8 1.0
0.000
0.003
0 100 200 300 400 5000
5
10
15
20
Cp
time (s)
Sole inlet distortion Sole inlet distortion
Am
plitu
de (m
V)
Frequency (Hz)
0.0 0.2 0.4 0.6 0.8 1.0
-0.002
0.000
0.002
0 100 200 300 400 5000
5
10
15
Cp
time (s)
No inlet distortion No inlet distortion
Am
plitu
de (m
V)
Frequency (Hz)
0.0 0.2 0.4 0.6 0.8 1.0-0.002
0.000
0.002
0 100 200 300 400 5000
5
10
15
Cp
time (s)
Sole inlet distortion Sole inlet distortion
Am
plitu
de (m
V)
Frequency (Hz)
Figure 20. Compressor blade tip pressure with no inlet distortion at surge margin of 1.5%.
Appl. Sci. 2017, 7, 766 11 of 14
Figure 19. Compressor outlet pressure with sole inlet distortion at a surge margin of 1.5%.
Figure 20. Compressor blade tip pressure with no inlet distortion at surge margin of 1.5%.
Figure 21. Compressor blade tip pressure with sole inlet distortion at a surge margin of 1.5%.
Through simulation at a surge margin of 1.5%, the compressor experimental results indicated that inlet distortion severely influenced the inlet pressure amplitude–frequency characteristics. In order to quantify the bad influence on the pressure, an amplitude–frequency index (Nam) is defined as the sum number of the amplitude, which is greater than half of the amplitude at blade frequency within the region from zero frequency to the half-blade frequency. The bigger the Nam is, the more low-frequency noise signals are mingled, and the more disturbances are generated to the pressure amplitude–frequency characteristic. As is shown in Table 2, with inlet distortion, the inlet pressure amplitude–frequency characteristic is destroyed, and outlet pressure mingles with a large number of low-frequency noise signals. However, the blade tip Nam is continually kept at zero. The
0.0 0.2 0.4 0.6 0.8 1.0
0.000
0.003
0 100 200 300 400 5000
5
10
15
20
Cp
time (s)
Sole inlet distortion Sole inlet distortion
Am
plitu
de (m
V)
Frequency (Hz)
0.0 0.2 0.4 0.6 0.8 1.0
-0.002
0.000
0.002
0 100 200 300 400 5000
5
10
15
Cp
time (s)
No inlet distortion No inlet distortion
Am
plitu
de (m
V)
Frequency (Hz)
0.0 0.2 0.4 0.6 0.8 1.0-0.002
0.000
0.002
0 100 200 300 400 5000
5
10
15
Cp
time (s)
Sole inlet distortion Sole inlet distortion
Am
plitu
de (m
V)
Frequency (Hz)
Figure 21. Compressor blade tip pressure with sole inlet distortion at a surge margin of 1.5%.
Through simulation at a surge margin of 1.5%, the compressor experimental results indicated thatinlet distortion severely influenced the inlet pressure amplitude–frequency characteristics. In orderto quantify the bad influence on the pressure, an amplitude–frequency index (Nam) is defined asthe sum number of the amplitude, which is greater than half of the amplitude at blade frequencywithin the region from zero frequency to the half-blade frequency. The bigger the Nam is, the morelow-frequency noise signals are mingled, and the more disturbances are generated to the pressureamplitude–frequency characteristic. As is shown in Table 2, with inlet distortion, the inlet pressureamplitude–frequency characteristic is destroyed, and outlet pressure mingles with a large number of
Appl. Sci. 2017, 7, 766 12 of 14
low-frequency noise signals. However, the blade tip Nam is continually kept at zero. The analyzedresults also conclude that the compressor blade tip region pressure showed a better performance thancompressor inlet and outlet on describing the compressor characteristics.
Table 2. The analyzed pressure amplitude–frequency results of Nam.
Working State Surge Margin of 14.2% Surge Margin of 1.5%
Position No Distortion Sole Distortion No Distortion Sole Distortion
inlet 0 2 221 730outlet 0 2 6 5
blade tip 0 0 0 0
4. Compressor Stall Detection Algorithm
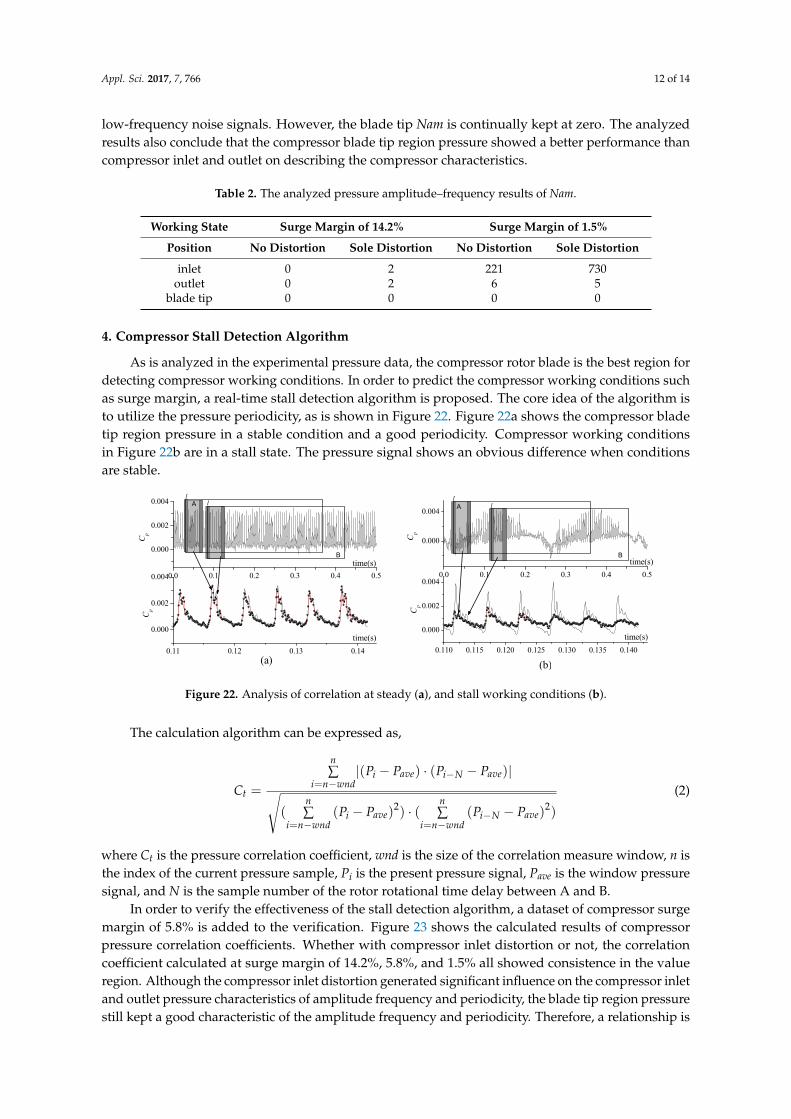
As is analyzed in the experimental pressure data, the compressor rotor blade is the best region fordetecting compressor working conditions. In order to predict the compressor working conditions suchas surge margin, a real-time stall detection algorithm is proposed. The core idea of the algorithm isto utilize the pressure periodicity, as is shown in Figure 22. Figure 22a shows the compressor bladetip region pressure in a stable condition and a good periodicity. Compressor working conditionsin Figure 22b are in a stall state. The pressure signal shows an obvious difference when conditionsare stable.
Appl. Sci. 2017, 7, 766 12 of 14
analyzed results also conclude that the compressor blade tip region pressure showed a better performance than compressor inlet and outlet on describing the compressor characteristics.
Table 2. The analyzed pressure amplitude–frequency results of Nam.
Working State Surge Margin of 14.2% Surge Margin of 1.5% Position No Distortion Sole Distortion No Distortion Sole Distortion
inlet 0 2 221 730 outlet 0 2 6 5
blade tip 0 0 0 0
4. Compressor Stall Detection Algorithm
As is analyzed in the experimental pressure data, the compressor rotor blade is the best region for detecting compressor working conditions. In order to predict the compressor working conditions such as surge margin, a real-time stall detection algorithm is proposed. The core idea of the algorithm is to utilize the pressure periodicity, as is shown in Figure 22. Figure 22a shows the compressor blade tip region pressure in a stable condition and a good periodicity. Compressor working conditions in Figure 22b are in a stall state. The pressure signal shows an obvious difference when conditions are stable.
Figure 22. Analysis of correlation at steady (a), and stall working conditions (b).
The calculation algorithm can be expressed as,
2 2
( ) ( )
( ( ) ) ( ( ) )
n
i ave i N avei n wnd
t n n
i ave i N avei n wnd i n wnd
P P P PC
P P P P
−= −
−= − = −
− ⋅ −=
− ⋅ −
(2)
where Ct is the pressure correlation coefficient, wnd is the size of the correlation measure window, n is the index of the current pressure sample, Pi is the present pressure signal, Pave is the window pressure signal, and N is the sample number of the rotor rotational time delay between A and B.
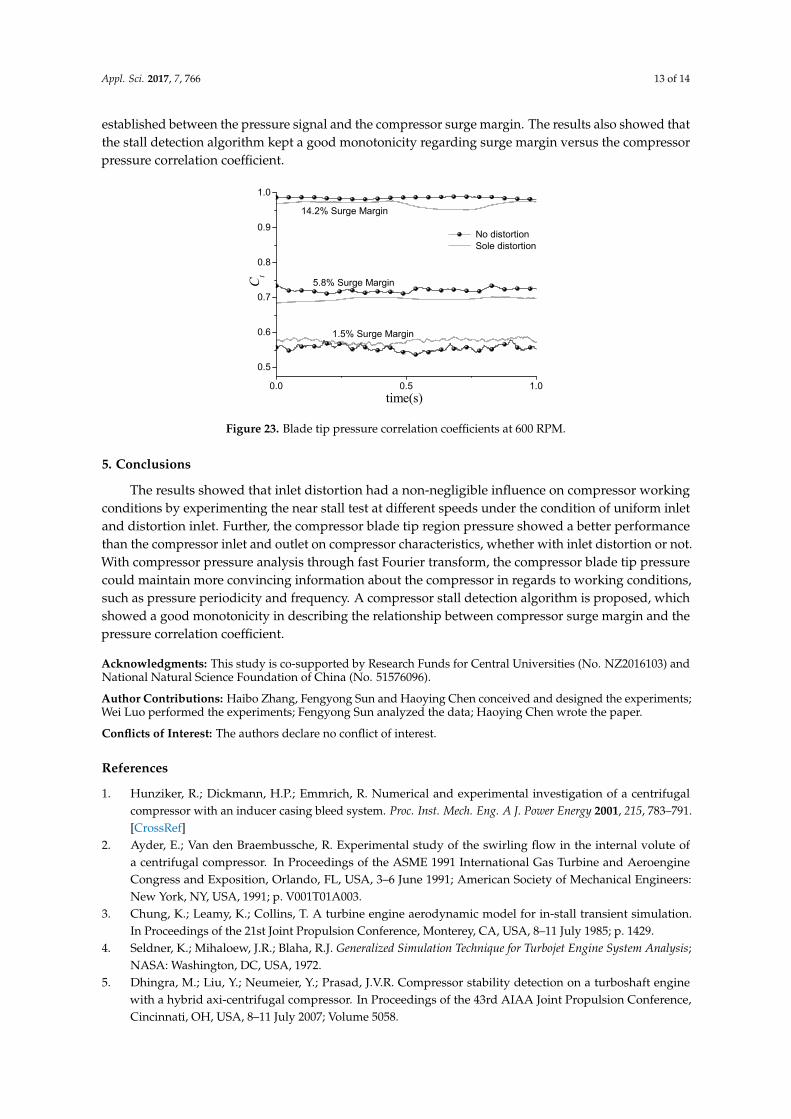
In order to verify the effectiveness of the stall detection algorithm, a dataset of compressor surge margin of 5.8% is added to the verification. Figure 23 shows the calculated results of compressor pressure correlation coefficients. Whether with compressor inlet distortion or not, the correlation coefficient calculated at surge margin of 14.2%, 5.8%, and 1.5% all showed consistence in the value region. Although the compressor inlet distortion generated significant influence on the compressor inlet and outlet pressure characteristics of amplitude frequency and periodicity, the blade tip region pressure still kept a good characteristic of the amplitude frequency and periodicity. Therefore, a relationship is established between the pressure signal and the compressor surge margin. The results also showed that the stall detection algorithm kept a good monotonicity regarding surge margin versus the compressor pressure correlation coefficient.
0.0 0.1 0.2 0.3 0.4 0.5
0.000
0.002
0.004
0.11 0.12 0.13 0.14
0.000
0.002
0.004
l
Cp
time(s)
C p
A
B
(a)
l
time(s)
0.0 0.1 0.2 0.3 0.4 0.5
0.000
0.004
0.110 0.115 0.120 0.125 0.130 0.135 0.140
0.000
0.002
0.004
l
C p
time(s)
B
C p
time(s)
Al
(b)
Figure 22. Analysis of correlation at steady (a), and stall working conditions (b).
The calculation algorithm can be expressed as,
Ct =
n∑
i=n−wnd|(Pi − Pave) · (Pi−N − Pave)|√
(n∑
i=n−wnd(Pi − Pave)
2) · (n∑
i=n−wnd(Pi−N − Pave)
2)
(2)
where Ct is the pressure correlation coefficient, wnd is the size of the correlation measure window, n isthe index of the current pressure sample, Pi is the present pressure signal, Pave is the window pressuresignal, and N is the sample number of the rotor rotational time delay between A and B.
In order to verify the effectiveness of the stall detection algorithm, a dataset of compressor surgemargin of 5.8% is added to the verification. Figure 23 shows the calculated results of compressorpressure correlation coefficients. Whether with compressor inlet distortion or not, the correlationcoefficient calculated at surge margin of 14.2%, 5.8%, and 1.5% all showed consistence in the valueregion. Although the compressor inlet distortion generated significant influence on the compressor inletand outlet pressure characteristics of amplitude frequency and periodicity, the blade tip region pressurestill kept a good characteristic of the amplitude frequency and periodicity. Therefore, a relationship is
Appl. Sci. 2017, 7, 766 13 of 14
established between the pressure signal and the compressor surge margin. The results also showed thatthe stall detection algorithm kept a good monotonicity regarding surge margin versus the compressorpressure correlation coefficient.Appl. Sci. 2017, 7, 766 13 of 14
Figure 23. Blade tip pressure correlation coefficients at 600 RPM.
5. Conclusions
The results showed that inlet distortion had a non-negligible influence on compressor working conditions by experimenting the near stall test at different speeds under the condition of uniform inlet and distortion inlet. Further, the compressor blade tip region pressure showed a better performance than the compressor inlet and outlet on compressor characteristics, whether with inlet distortion or not. With compressor pressure analysis through fast Fourier transform, the compressor blade tip pressure could maintain more convincing information about the compressor in regards to working conditions, such as pressure periodicity and frequency. A compressor stall detection algorithm is proposed, which showed a good monotonicity in describing the relationship between compressor surge margin and the pressure correlation coefficient.
Acknowledgments: This study is co-supported by Research Funds for Central Universities (No. NZ2016103) and National Natural Science Foundation of China (No. 51576096).
Author Contributions: Haibo Zhang, Fengyong Sun and Haoying Chen conceived and designed the experiments; Wei Luo performed the experiments; Fengyong Sun analyzed the data; Haoying Chen wrote the paper.
Conflicts of Interest: The authors declare no conflict of interest.
References
1. Hunziker, R.; Dickmann, H.P.; Emmrich, R. Numerical and experimental investigation of a centrifugal compressor with an inducer casing bleed system. Proc. Inst. Mech. Eng. A J. Power Energy 2001, 215, 783–791.
2. Ayder, E.; Van den Braembussche, R. Experimental study of the swirling flow in the internal volute of a centrifugal compressor. In Proceedings of the ASME 1991 International Gas Turbine and Aeroengine Congress and Exposition, Orlando, FL, USA, 3–6 June 1991; American Society of Mechanical Engineers: New York, NY, USA, 1991; p. V001T01A003.
3. Chung, K.; Leamy, K.; Collins, T. A turbine engine aerodynamic model for in-stall transient simulation. In Proceedings of the 21st Joint Propulsion Conference, Monterey, CA, USA, 8–11 July 1985; p. 1429.
4. Seldner, K.; Mihaloew, J.R.; Blaha, R.J. Generalized Simulation Technique for Turbojet Engine System Analysis; NASA: Washington, DC, USA, 1972.
5. Dhingra, M.; Liu, Y.; Neumeier, Y.; Prasad, J.V.R. Compressor stability detection on a turboshaft engine with a hybrid axi-centrifugal compressor. In Proceedings of the 43rd AIAA Joint Propulsion Conference, Cincinnati, OH, USA, 8–11 July 2007; Volume 5058.
6. Wadia, A.R.; Christensen, D.; Prasad, J.V. Compressor stability management in aircraft engines. In Proceedings of the ICAS 25th Congress of the International Council of the Aeronautical Sciences, Humburg, Germany, 3–8 September 2006.
7. DellaCorte, C.; Johnson, S.M. Progress in NASA Rotorcraft Propulsion. In Proceedings of the Fundamental Aeronautics Meeting, Atlanta, GA, USA, 7–9 October 2008.
0.0 0.5 1.0
0.5
0.6
0.7
0.8
0.9
1.0
Ct
time(s)
No distortion Sole distortion
14.2% Surge Margin
5.8% Surge Margin
1.5% Surge Margin
Figure 23. Blade tip pressure correlation coefficients at 600 RPM.
5. Conclusions
The results showed that inlet distortion had a non-negligible influence on compressor workingconditions by experimenting the near stall test at different speeds under the condition of uniform inletand distortion inlet. Further, the compressor blade tip region pressure showed a better performancethan the compressor inlet and outlet on compressor characteristics, whether with inlet distortion or not.With compressor pressure analysis through fast Fourier transform, the compressor blade tip pressurecould maintain more convincing information about the compressor in regards to working conditions,such as pressure periodicity and frequency. A compressor stall detection algorithm is proposed, whichshowed a good monotonicity in describing the relationship between compressor surge margin and thepressure correlation coefficient.
Acknowledgments: This study is co-supported by Research Funds for Central Universities (No. NZ2016103) andNational Natural Science Foundation of China (No. 51576096).
Author Contributions: Haibo Zhang, Fengyong Sun and Haoying Chen conceived and designed the experiments;Wei Luo performed the experiments; Fengyong Sun analyzed the data; Haoying Chen wrote the paper.
Conflicts of Interest: The authors declare no conflict of interest.
References
1. Hunziker, R.; Dickmann, H.P.; Emmrich, R. Numerical and experimental investigation of a centrifugalcompressor with an inducer casing bleed system. Proc. Inst. Mech. Eng. A J. Power Energy 2001, 215, 783–791.[CrossRef]
2. Ayder, E.; Van den Braembussche, R. Experimental study of the swirling flow in the internal volute ofa centrifugal compressor. In Proceedings of the ASME 1991 International Gas Turbine and AeroengineCongress and Exposition, Orlando, FL, USA, 3–6 June 1991; American Society of Mechanical Engineers:New York, NY, USA, 1991; p. V001T01A003.
3. Chung, K.; Leamy, K.; Collins, T. A turbine engine aerodynamic model for in-stall transient simulation.In Proceedings of the 21st Joint Propulsion Conference, Monterey, CA, USA, 8–11 July 1985; p. 1429.
4. Seldner, K.; Mihaloew, J.R.; Blaha, R.J. Generalized Simulation Technique for Turbojet Engine System Analysis;NASA: Washington, DC, USA, 1972.
5. Dhingra, M.; Liu, Y.; Neumeier, Y.; Prasad, J.V.R. Compressor stability detection on a turboshaft enginewith a hybrid axi-centrifugal compressor. In Proceedings of the 43rd AIAA Joint Propulsion Conference,Cincinnati, OH, USA, 8–11 July 2007; Volume 5058.
Appl. Sci. 2017, 7, 766 14 of 14
6. Wadia, A.R.; Christensen, D.; Prasad, J.V. Compressor stability management in aircraft engines.In Proceedings of the ICAS 25th Congress of the International Council of the Aeronautical Sciences, Humburg,Germany, 3–8 September 2006.
7. DellaCorte, C.; Johnson, S.M. Progress in NASA Rotorcraft Propulsion. In Proceedings of the FundamentalAeronautics Meeting, Atlanta, GA, USA, 7–9 October 2008.
8. Yang, M.; Martinez-Botas, R.; Zhang, Y. Inlet Duct Treatment for Stability Improvement on a High PressureRatio Centrifugal Compressor. In Proceedings of the ASME Turbo Expo 2013: Turbine Technical Conferenceand Exposition, San Antonio, TX, USA, 3–7 June 2013; American Society of Mechanical Engineers: New York,NY, USA, 2013; p. V06CT40A010.
9. Yang, M.; Zheng, X.; Zhang, Y.; Bamba, T.; Tamaki, H.; Huenteler, J.; Li, Z. Stability Improvementof High-Pressure-Ratio Turbocharger Centrifugal Compressor by Asymmetric Flow Control: PartI—Non-Axisymmetric Flow in Centrifugal Compressor. In Proceedings of the ASME Turbo Expo 2010:Power for Land, Sea, and Air, Glasgow, UK, 14–18 June 2010; American Society of Mechanical Engineers:New York, NY, USA, 2010; pp. 1891–1902.
10. Li, Y.L.; Sayma, A.I. Computational fluid dynamics simulations of blade damage effect on the performanceof a transonic axial compressor near stall. Proc. Inst. Mech. Eng. C J. Mech. Eng. Sci. 2015, 229, 2242–2260.[CrossRef]
11. Shi, P.; Qiao, W.; Wang, L.; Chen, W.; Xu, K. Experiment on axial-compressor stability enhancement by bladetip injection. J. Aerosp. Power 2014, 2, 018.
12. Brand, M.L. An Improved Blade Passage Model for Estimating Off-Design Axial Compressor Performance.Master’s Thesis, Massachusetts Institute of Technology, Cambridge, MA, USA, 2013.
13. Dhingra, M.; Armor, J.; Neumeier, Y.; Prasad, J.V.R. Compressor surge: A limit detection and avoidanceproblem. In Proceedings of the AIAA Guidance, Navigation, and Control Conference and Exhibit,San Francisco, CA, USA, 15–18 August 2005.
14. Liu, Y.; Dhingra, M.; Prasad, J.V.R. Correlation measure-based stall margin estimation for a single-stage axialcompressor. J. Eng. Gas Turbines Power 2012, 134, 011603. [CrossRef]
15. White, M.A.; Dhingra, M.; Prasad, J.V.R. Experimental analysis of a waveguide pressure measuring system.J. Eng. Gas Turbines Power 2010, 132, 041603. [CrossRef]
16. Dong, X.; Sun, D.; Li, F.; Jin, D.; Gui, X.; Sun, X. Effects of Rotating Inlet Distortion on Compressor StabilityWith Stall Precursor-Suppressed Casing Treatment. J. Fluids Eng. 2015, 137, 111101. [CrossRef]
17. Lesser, A.; Niehuis, R. Transonic Axial Compressors with Total Pressure Inlet Flow Field Distortions.In Proceedings of the ASME Turbo Expo 2014: Turbine Technical Conference and Exposition, Düsseldorf,Germany, 16–20 June 2014; American Society of Mechanical Engineer: New York, NY, USA, 2014;p. V01AT01A036.
18. Seo, T.W.; Heo, M.W.; Kim, K.Y. Parametric study on aerodynamic performance of a centrifugal compressorwith inlet duct treatment. In Proceedings of the 2014 ISFMFE-6th International Symposium on FluidMachinery and Fluid Engineering, Wuhan, China, 22–22 October 2014.
19. Gunn, E.J.; Tooze, S.E.; Hall, C.A.; Colin, Y. An experimental study of loss sources in a fan operating withcontinuous inlet stagnation pressure distortion. J. Turbomach. 2013, 135, 051002. [CrossRef]
20. Cooley, J.W.; Tukey, J.W. An Algorithm for the Machine Computation of the Complex Fourier Series.Math. Comput. 1965, 19, 297–301. [CrossRef]
21. Frigo, M.; Johnson, S.G. FFTW: An adaptive software architecture for the FFT. In Proceedings of the 1998IEEE International Conference on Acoustics, Speech and Signal Processing, Seattle, WA, USA, 15 May 1998;Volume 3, pp. 1381–1384.
© 2017 by the authors. Licensee MDPI, Basel, Switzerland. This article is an open accessarticle distributed under the terms and conditions of the Creative Commons Attribution(CC BY) license (http://creativecommons.org/licenses/by/4.0/).