a study of crystallization behavior in phase separated
TRANSCRIPT
University of Central Florida University of Central Florida
STARS STARS
Electronic Theses and Dissertations, 2004-2019
2016
A Study of Crystallization Behavior in Phase Separated A Study of Crystallization Behavior in Phase Separated
Chalcogenide Glasses Chalcogenide Glasses
Andrew Buff University of Central Florida
Part of the Materials Science and Engineering Commons
Find similar works at: https://stars.library.ucf.edu/etd
University of Central Florida Libraries http://library.ucf.edu
This Masters Thesis (Open Access) is brought to you for free and open access by STARS. It has been accepted for
inclusion in Electronic Theses and Dissertations, 2004-2019 by an authorized administrator of STARS. For more
information, please contact [email protected].
STARS Citation STARS Citation Buff, Andrew, "A Study of Crystallization Behavior in Phase Separated Chalcogenide Glasses" (2016). Electronic Theses and Dissertations, 2004-2019. 5140. https://stars.library.ucf.edu/etd/5140
A STUDY OF CRYSTALLIZATION BEHAVIOR
IN PHASE SEPARATED CHALCOGENIDE GLASSES
by
ANDREW K. BUFF
B.S. Clemson University, 2013
A thesis submitted in partial fulfillment of the requirements
for the degree of Master of Science
in the Department of Materials Science and Engineering
in the College of Engineering and Computer Science
at the University of Central Florida
Orlando, Florida
Summer Term
2016
Major Professor: Kathleen Richardson
ii
©2016 Andrew K. Buff
iii
ABSTRACT
Chalcogenide glasses (ChG) are known for their wide transmission ranges in the infrared and for
their high refractive indices. However, applications for ChG are often limited by their poor
thermal/mechanical properties. Precipitating a secondary crystalline phase in the glass matrix can
improve these properties, but too much crystallization and/or large or multiple phase crystallites
can lead to a loss in infrared (IR) transmission. Controlled crystallization can be used to tune the
properties of these glasses. This work examines the crystallization behavior in phase separated
chalcogenide glasses in the GeSe2-As2Se3-PbSe glass system.
Specifically, the research presented in this thesis work has investigated the crystallization behavior
in the 20GeSe2-60As2Se3-20PbSe (20 PbSe) and 15GeSe2-45As2Se3-40PbSe (40 PbSe) glasses for
an IR optical system operating in the 3 to 5 µm range. While both of these glasses were found to
have droplet-matrix phase separation, the morphology differed from each other in two key ways.
First, the droplets seen in the 20 PbSe glass (100-130 nm) are roughly twice as big as those in the
40 PbSe glass (35-45 nm). The droplet sizes seen in the base glass directly affect the short
wavelength cutoff of the two glasses where the 20 PbSe glass (1.993 µm) has a longer wavelength
cutoff than the 40 PbSe (1.319 µm). Secondly, the 20 PbSe glass has Pb-rich droplets and the 40
PbSe glass has a Pb-rich matrix, impacting where the initial stages of crystallization are initiated.
Crystallization occurs in the Pb-rich phase and affects the glass-ceramic properties differently
depending on whether the Pb-rich phase is the minority phase (20 PbSe) or the majority phase (40
PbSe). When the crystallization occurs in the majority phase, it greatly affects the hardness,
density, and refractive index. When the crystallization occurs in the minority phase, the hardness
iv
and density change negligibly while the refractive index still shows significant change. While both
glasses show an effective index change and 3-5 µm transmission in their base form, only the 40
PbSe maintains the transmission window after the heat-treatments used in this study.
The work reported in this thesis has shown how the crystallization process can be used to develop
a gradient refractive index (GRIN) component in an IR optical system. While the composition and
crystallization protocols are not optimized for further transfer of the technology to commercial
products, the basis of this work shows the process of developing a glass-ceramic for the
application.
v
ACKNOWLEDGMENTS
I would first like to thank my thesis advisor Dr. Kathleen Richardson at the University of Central
Florida. She was instrumental in guiding through the course of my research. She was always
supportive of my work and provided me with feedback when needed.
I would also like to thank the current and former member of the Glass Processing and
Characterization Laboratory who were always there to give me advice on my research. I would
especially like to thank Dr. Charmayne Smith whose hard work provided a foundation for this
research and whose joyful attitude always made coming to the lab enjoyable.
This work was supported by AFRL Contract Number FA8650-12-C-7225. [PI: T. Mayer, Virginia
Tech University; formerly Penn State University (PSU), K. Richardson (UCF), D. Werner (PSU),
and C. Rivero-Baleine (Lockheed Martin Corporation)].
I would like to acknowledge the help and support that I received throughout my research from the
Penn State team and Clara Rivero-Baleine at Lockheed Martin. I would especially like to thank
Dr. Myungkoo Kang at PSU for his tireless work provided needed answers from TEM on
morphology and composition.
Finally, I must express my very profound gratitude to my parents and to my friends for providing
me with their unfailing support and continuous encouragement throughout my years in graduate
school.
vi
TABLE OF CONTENTS
LIST OF FIGURES ..................................................................................................................... viii
LIST OF TABLES ........................................................................................................................ xii
LIST OF ACRONYMS ............................................................................................................... xiii
CHAPTER ONE: MOTIVATION AND OBJECTIVE ................................................................. 1
Motivation ................................................................................................................................... 1
Objective ..................................................................................................................................... 3
CHAPTER TWO: INTRODUCTION ............................................................................................ 5
Glass-Ceramics ........................................................................................................................... 6
Crystal Nucleation and Growth in Glass .................................................................................. 10
Phase Separation of Glass ......................................................................................................... 13
Scale-Up .................................................................................................................................... 17
CHAPTER THREE: EXPERIMENTAL ...................................................................................... 19
Thermal Analysis ...................................................................................................................... 23
Structure and Morphology Characterization ............................................................................. 24
Optical Properties...................................................................................................................... 27
Quench Rate Experiments......................................................................................................... 29
CHAPTER FOUR: RESULTS AND DISCUSSION ................................................................... 32
Base Glass Properties ................................................................................................................ 32
Activation Energy of Crystallization ........................................................................................ 43
vii
Nucleation and Growth ............................................................................................................. 48
Quench Rate Experiments......................................................................................................... 55
Commercial Scale-Up ............................................................................................................... 63
Glass-Ceramic Properties.......................................................................................................... 69
CHAPTER FIVE: CONCLUSIONS ............................................................................................ 85
APPENDIX A: 2016 DCS PROCEEDING .................................................................................. 90
APPENDIX B: MACH-ZEHNDER INTERFEROMETER FOR 2-D GRIN PROFILE
MEASUREMENT .......................................................................................... 101
APPENDIX C: SAGNAC RING INTERFEROMETER FOR ABSOLUTE INDEX OF
REFRACTION MEASUREMENTS ............................................................. 105
REFERENCES ........................................................................................................................ 108
viii
LIST OF FIGURES
Figure 1- Effect of temperature on enthalpy/volume of a glass forming melt.1 ............................. 5
Figure 2- Glass forming region of GeSe2-As2Se3-PbSe glass system.10 ......................................... 8
Figure 3 - 15GeSe2-45As2Se3-40PbSe DSC curves of base, nucleation-only, and growth-only heat-
treatment ....................................................................................................................................... 13
Figure 4 - (A) Theoretical idealized immiscibility dome in a binary system. (B) Free energy of a
binary immiscible system at a temperature, T1.Adapted from Shelby1 ........................................ 14
Figure 5 – Proposed immiscibility dome in GeSe2-As2Se3-PbSe glass system along the 100-X
(GeSe2: 3 As2Se3)-X PbSe pseudo binary line at 650°C. ............................................................. 16
Figure 6 – Furnace setup for nucleation and growth heat-treatments. Samples were placed on top
of insulating fiber wool. ................................................................................................................ 21
Figure 7 - The FIB-assisted lift-out process for the preparation of a cross-sectional TEM specimen
....................................................................................................................................................... 26
Figure 8 - XEDS line of Schott IRG24 (Ge10As40Se50). Measurement error is approximately ± 1
at%. ............................................................................................................................................... 27
Figure 9 – DSC curves of 20 PbSe and 40 PbSe glasses. Heating rate:10°C/min (40g; 10 mm;
TQ=650°C) .................................................................................................................................... 32
Figure 10 – Transmission window for 20 PbSe and 40 PbSe (40 g; 10 mm; TQ = 650°C) Thickness
normalized to 2 mm. ..................................................................................................................... 35
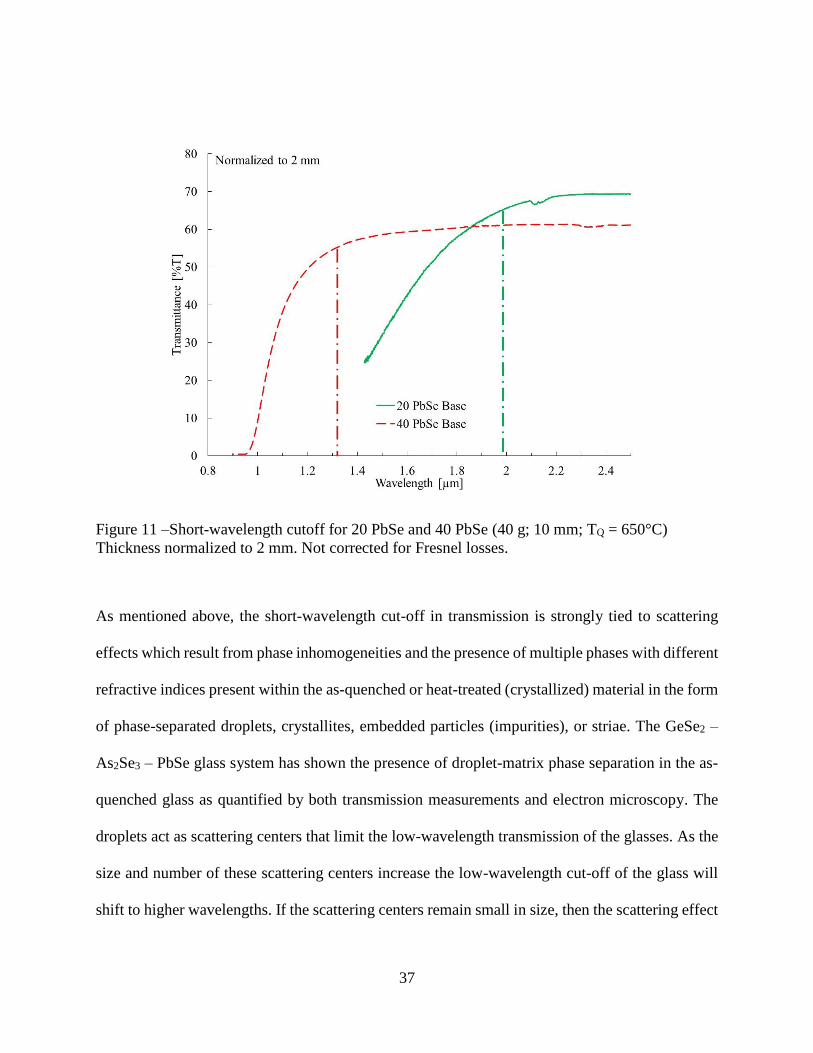
Figure 11 –Short-wavelength cutoff for 20 PbSe and 40 PbSe (40 g; 10 mm; TQ = 650°C)
Thickness normalized to 2 mm. Not corrected for Fresnel losses. ............................................... 37
ix
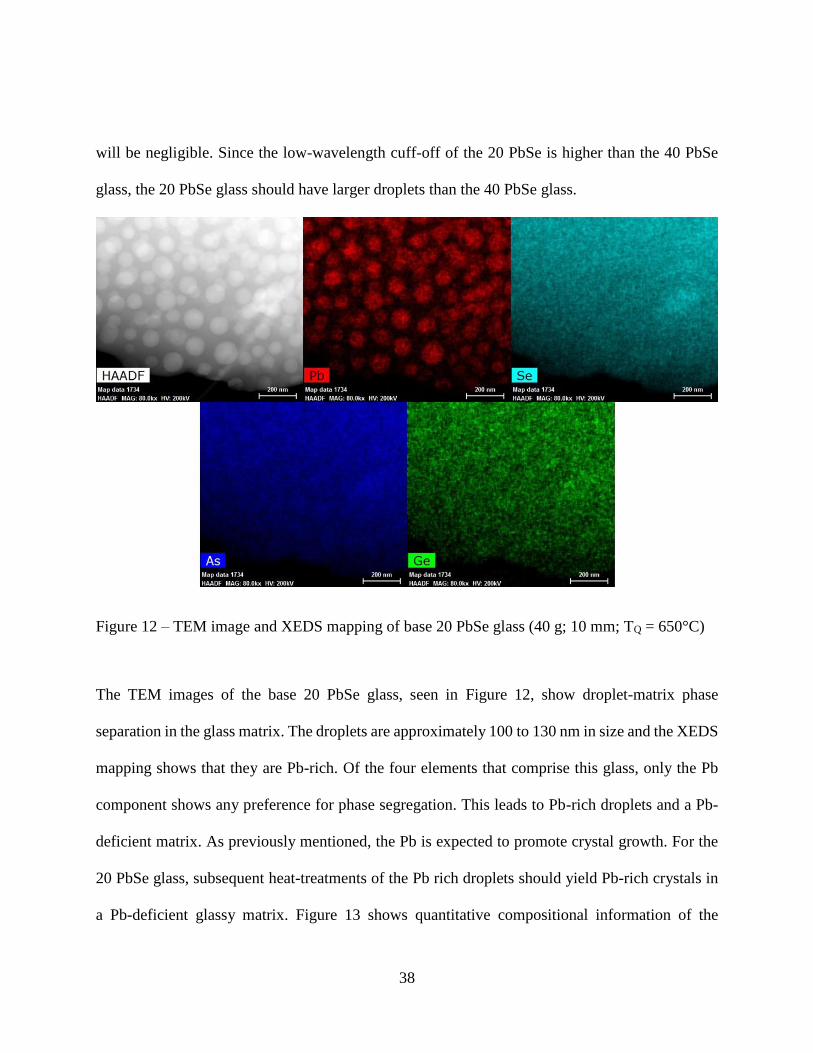
Figure 12 – TEM image and XEDS mapping of base 20 PbSe glass (40 g; 10 mm; TQ = 650°C)
....................................................................................................................................................... 38
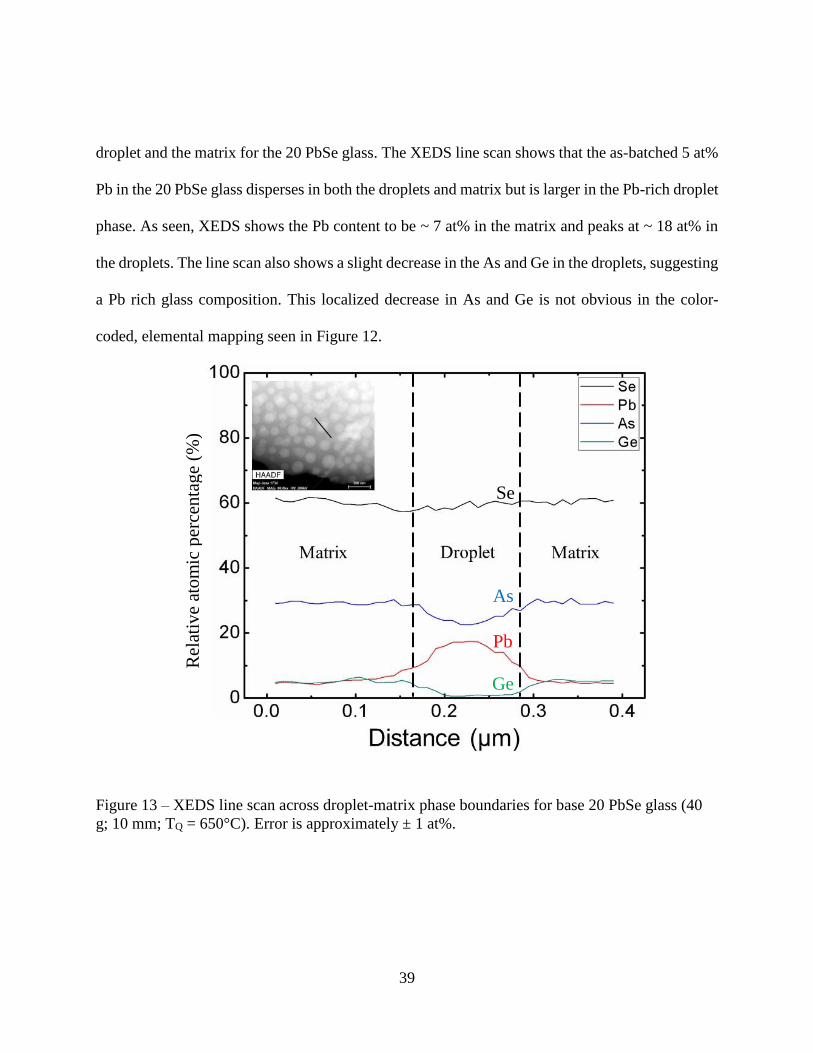
Figure 13 – XEDS line scan across droplet-matrix phase boundaries for base 20 PbSe glass (40 g;
10 mm; TQ = 650°C). Error is approximately ± 1 at%. ................................................................ 39
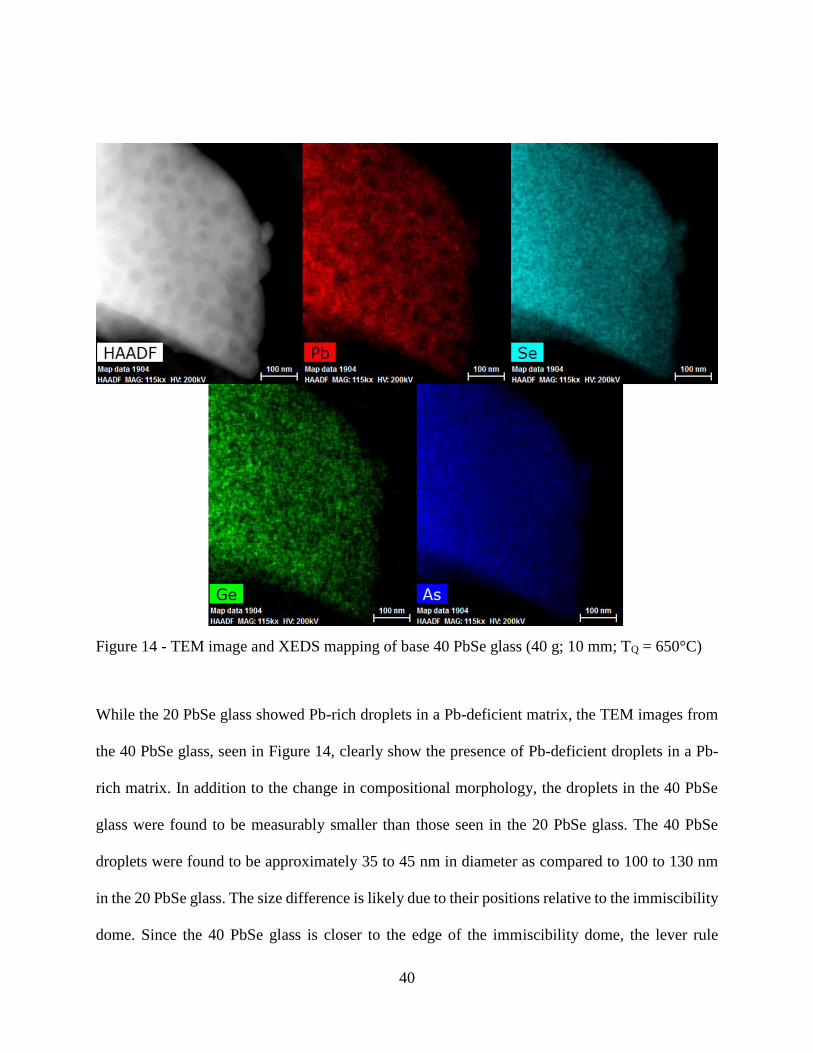
Figure 14 - TEM image and XEDS mapping of base 40 PbSe glass (40 g; 10 mm; TQ = 650°C)40
Figure 15 - XEDS line scan across droplet-matrix phase boundaries for base 40 PbSe glass (40 g;
10 mm; TQ = 650°C). Error is approximately ± 1 at%. ................................................................ 42
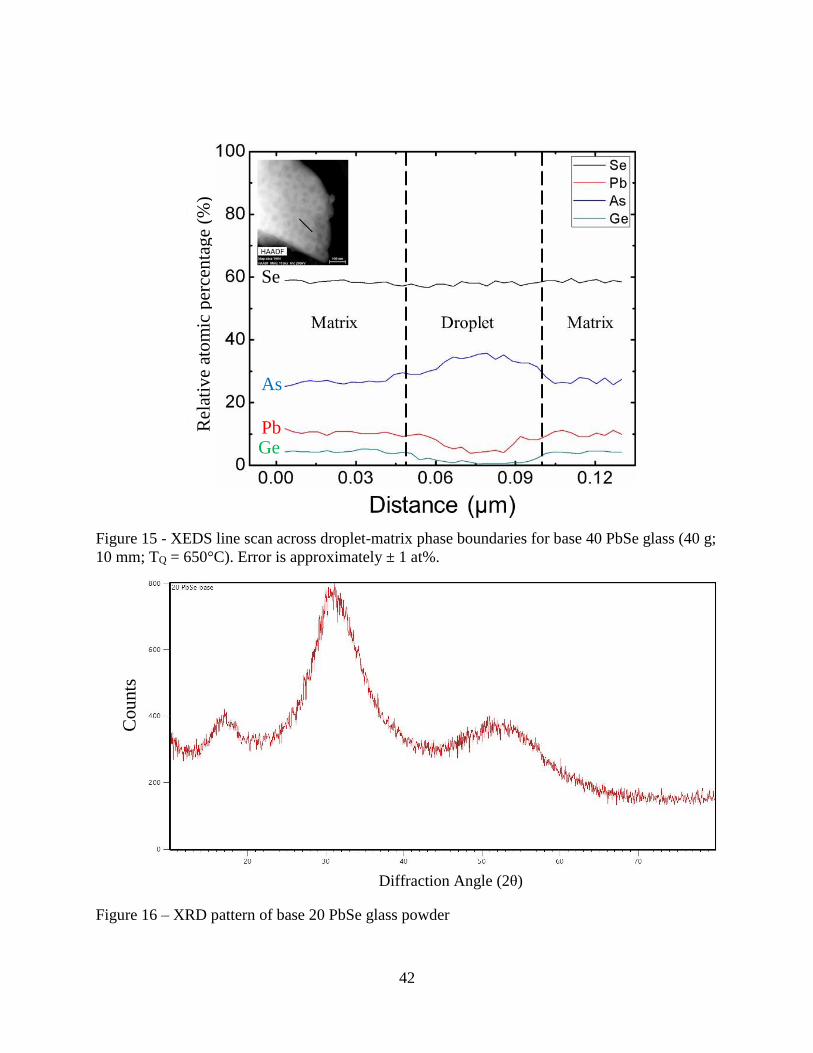
Figure 16 – XRD pattern of base 20 PbSe glass powder .............................................................. 42
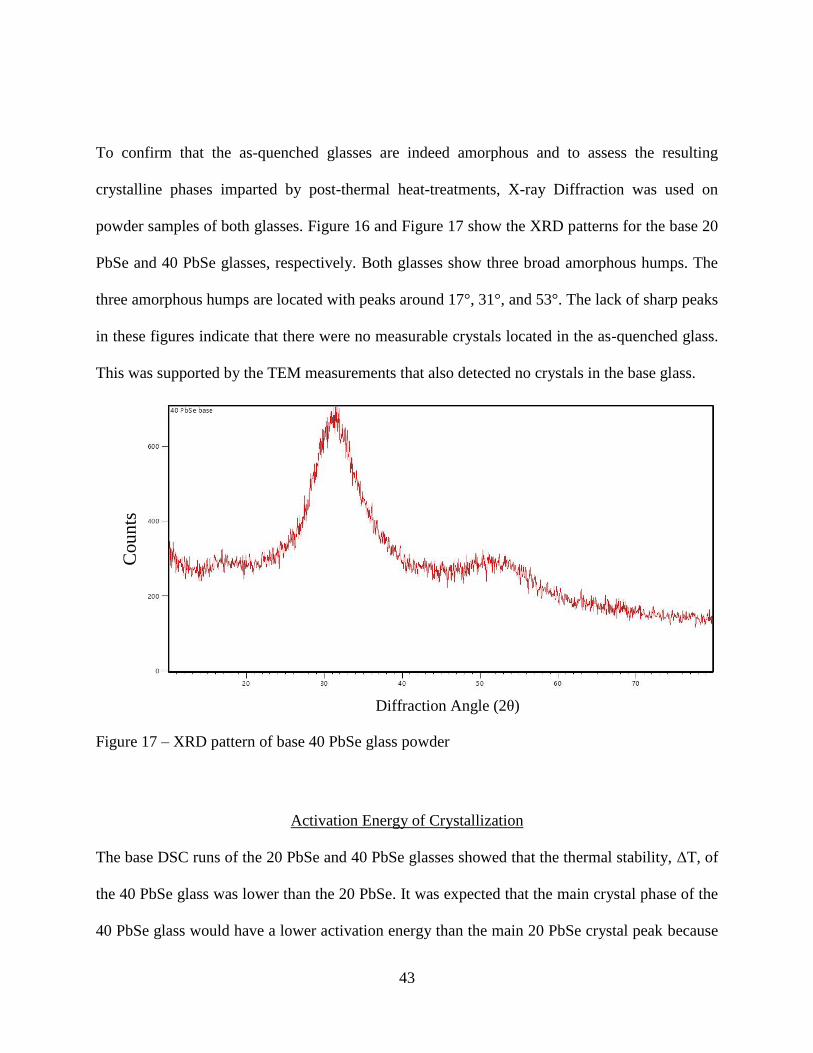
Figure 17 – XRD pattern of base 40 PbSe glass powder .............................................................. 43
Figure 18 – Plots of ln (Tp2/Q) versus 1000/Tp used to determine activation energy of
crystallization through the Kissinger equation. (40 g; 10 mm; TQ = 650°C) ............................... 45
Figure 19 - Plots of ln (Tp/Q) versus 1000/Tp used to determine activation energy of crystallization
through the Augis-Bennett equation. (40 g; 10 mm; TQ = 650°C) ............................................... 46
Figure 20 - Plots of -ln(Q) versus 1000/Tp used to determine activation energy of crystallization
through the Ozawa equation. (40 g; 10 mm; TQ = 650°C) ........................................................... 47
Figure 21 – Nucleation-like and growth-like curves for 20 PbSe (40 g; 10 mm; TQ = 650°C) ... 50
Figure 22 – Nucleation-like and growth-like curves for 20 PbSe (150g; 30mm; TQ = 650°C) ... 52
Figure 23 – Nucleation-like and growth-like curves for 40 PbSe (40g; 10 mm; TQ = 650°C) .... 53
Figure 24 - Nucleation-like and growth-like curves for 40 PbSe (400g; 30 mm; TQ = 650°C) ... 54
Figure 25 – Cross-sectional diagram of sample location from 100g, 30 mm diameter boule ...... 56
Figure 26 – DSC of the slow-cooled and fast cooled 20 PbSe glasses. Heating rate: 10°C/min . 58
x
Figure 27 - Images of fast-cooled and slow-cooled glasses taken with FLIR IR camera. Each disc
is 30 mm in diameter and the grid is composed of approximately 1.5 x 2 mm squares (A) Fast-
cooled without grid (B) Fast-cooled with grid (C) Slow-cooled without grid (D) Slow-cooled with
grid ................................................................................................................................................ 59
Figure 28 – FTIR spectra of the fast-cooled and slow-cooled glasses. Sample thickness was
normalized to 5.5 mm. Not corrected for Fresnel loss .................................................................. 60
Figure 29 – Index homogeneity map of slow-cooled melt at 4.5905 µm ..................................... 61
Figure 30 – Index homogeneity map of fast-cooled melt at 4.5905 µm ....................................... 62
Figure 31 - DSC curves of 20 PbSe glasses melted at UCF (TQ = 650°C). Heating rate: 10°C/min
....................................................................................................................................................... 64
Figure 32 - DSC curves of 20 PbSe glasses melted at AMI. Heating rate: 10°C/min .................. 65
Figure 33 - Transmission window for 20 PbSe UCF (40 g; 10 mm; TQ = 650°C) and AMI melts
....................................................................................................................................................... 66
Figure 34 – Dark-field TEM images of 20 PbSe melts from UCF melt 100 – 130 nm droplets (left)
and AMI melt with 200 to 340 nm (right) .................................................................................... 67
Figure 35 – IR image of 20 PbSe melts. (A) 1 kg commercially polished AMI melt (B) Slow-
cooled UCF melt (100g) (C) Fast-cooled UCF melt (100g) ......................................................... 68
Figure 36 – Index homogeneity map of 1 kg batch AMI glass .................................................... 69
Figure 37 – Dark field TEM image and XEDS mapping of crystallites in 20 PbSe glass heat-treated
at 220°C for 2 hours + 270°C for 30 minutes. Scale bars are 300 nm (40 g; 10 mm; TQ=650°C)70
Figure 38 - SAED of crystalline phase of 20 PbSe glass heat-treated at 220°C for 2 hours + 270°C
for 30 minutes ............................................................................................................................... 71
xi
Figure 39 – FTIR transmission spectra of base and heat-treated 20 PbSe (40 g; 10 mm; TQ=650°C).
Sample thickness normalized to 2 mm. Not corrected for Fresnel Loss ...................................... 74
Figure 40 - XRD of base and heat-treated 20 PbSe glass powder (40 g; 10 mm; TQ = 650°C) ... 75
Figure 41 - XRD of heat-treated 20 PbSe glass powder (220°C-2hr+270°C-30min) with peak
assignments. .................................................................................................................................. 76
Figure 42 – Dark field TEM image and XEDS mapping of 40 PbSe glass heat-treated at 210°C for
2 hours + 250°C for 30 minutes (40 g; 10 mm; TQ = 650°C) ....................................................... 77
Figure 43 – SAED of crystalline phase of 40 PbSe glass heat-treated at 210°C for 2 hours + 250°C
for 30 minutes ............................................................................................................................... 78
Figure 44 – FTIR and UV-Vis-NIR transmission spectra of base and heat-treated 40 PbSe (40 g;
10 mm; TQ = 650°C) Sample thickness normalized to 2 mm. Not corrected for Fresnel loss. .... 80
Figure 45 – XRD of base and heat-treated 40 PbSe glass powder (40 g; 10 mm; TQ = 650°C) .. 81
Figure 46 – XRD of heat-treated 40 PbSe glass powder (210°C-2hr+250°C-30min) with peak
assignments ................................................................................................................................... 83
xii
LIST OF TABLES
Table 1 – Atomic composition of 20 PbSe and 40 PbSe glasses .................................................. 20
Table 2 – Melting and quench parameters for 20 PbSe fast and slow-cooled melts .................... 29
Table 3 - Thermal and physical properties of 20 PbSe and 40 PbSe as-quenched base glass ...... 34
Table 4 – Activation Energies [kJ/mol] determined through the Kissinger, Augis-Bennett, and
Ozawa equations ........................................................................................................................... 48
Table 5 – Refractive index and density measurements of fast-cooled and slow-cooled glasses .. 59
Table 6 – Base, nucleated, and grown properties of 20 PbSe glass with the average standard
deviation for each measurement ................................................................................................... 72
Table 7 - Base, nucleated, and grown properties of 40 PbSe glass .............................................. 78

xiii
LIST OF ACRONYMS
AFRL Air Force Research Laboratory
AMI Amorphous Materials Inc.
ChG Chalcogenide Glass
CTE Coefficient of Thermal Expansion
DARPA Defense Advanced Research Projects Agency
DI Water Deionized Water
Ec Activation Energy for Crystallization
FIB Focused Ion Beam
FTIR Fourier Transform Infrared Spectroscopy
GRIN Gradient Refractive Index
HV Vickers Hardness
IR Infrared
LWIR Long-Wave Infrared
MWIR Mid-Wave Infrared
n Refractive index
NIR Near Infrared
PSU Pennsylvania State University
Q Heating Rate
R Gas Constant
SEM Scanning Electron Microscopy
SWaP Size, Weight, and Power
Tg Glass Transition Temperature
Tp Peak Crystallization Temperature
TQ Quench Temperature
Tx Onset of Crystallization Temperature
TEM Transmission Electron Microscopy
UCF University of Central Florida
UofR University of Rochester
UV Ultraviolet
Vx Volume Fraction of Crystals
Vis Visible Spectrum
XEDS Energy-dispersive X-ray spectroscopy
XRD X-ray Diffraction
1
CHAPTER ONE: MOTIVATION AND OBJECTIVE
Motivation
Chalcogenide glasses are well known for their mid-IR transparency and their high refractive index,
but are often limited by their weak thermal/mechanical properties. Controlled crystallization of the
base glass can improve these properties as observed in oxide glasses.1-3 Additionally, introducing
crystals may introduce other effects such as change in refractive index and nonlinear optical
properties.4-6 Recent activities by researchers have been focused on developing “manufacturable”
gradient refractive index (GRIN) materials.7 This thesis work supports a larger effort by the Glass
Processing and Characterization Laboratory (GPCL) at UCF with collaborators at Penn State
University (PSU) and Lockheed Martin (LMCO) which is examining how to create a gradient
refractive index profile through selective crystallization in bulk chalcogenide glass (ChG)
materials.8 The effort by GPCL, PSU, and LMCO has resulted in a patent issued in 2016.9 This
work specifically examines key attributes of an important ChG system, its properties as related to
the processing route used to prepare the glass, and the corresponding aspects of introducing a
spatially controlled, secondary crystalline phase to realize an optical glass-ceramic nanocomposite.
In certain imaging applications, it has become increasingly important that systems exhibit fast
optical designs (compact in footprint) and wide fields of view which requires many lenses using
classic optical designs. The many optical components in these systems make it difficult to reduce
size, weight, and power (SWaP) while maintaining optical function. Hence, reducing the total
number of components by improving the optical functionality of individual elements can
significantly reduce SWaP in the system.
2
Current materials used for GRIN profiles are not sufficient for advanced optical designs because
they are limited by the maximum refractive index changes that are achievable. In order to attain
these large refractive index changes, a new materials approach is necessary. In our team’s
nanocomposite (glass-ceramic) approach, precipitation (nucleation) and growth of high refractive
index crystals in a (lower refractive index) chalcogenide glass matrix results in a change in the
effective refractive index, neff, of the composite. If the formation of the secondary crystalline phase
can be spatially varied in a controlled way (e.g. via a laser), a GRIN profile can be realized which
yields a gradient in optical and physical properties. This modification is directly correlated to the
volume fraction of the secondary phase in a specific location. As current GRIN technology is
typically limited to axial or radial profiles, the selective crystallization process based on a spatially
varying nanocomposite, would allow a fully three dimensional (3D) GRIN profile with excellent
optical performance in the mid-infrared. While the creation of this GRIN profile is the ultimate
goal of the main project, this is outside the scope of this thesis work.
Glasses from the GeSe2-As2Se3-PbSe ternary have been chosen as the focus of this effort. In
research by Yang et al.10, this glass system was shown to produce glasses with good transparency
in the mid-infrared and exhibited a narrow size distribution of crystallized phase.10 These attributes
suggested that further optimization of heat-treatment protocols to form the high index phase could
result in a low scatter loss composite, if a small crystallite size could be maintained. Compositions
in this system have been shown to nucleate PbSe crystals. PbSe crystals are well known for their
high refractive index11, 12 and for their luminescent properties as quantum dots.11, 12 The high index
3
crystals and narrow size distribution seen in this glass system make it desirable to be used in the
proposed chalcogenide GRIN system.
Objective
The overall aim of this thesis is to study the process of crystallization in phase-separated glass
compositions in the GeSe2-As2Se3-PbSe ternary. While crystallization in homogeneous, non-phase
separated oxide and non-oxide glass materials has been well studied, examination of the role of
the low crystallization resistant phase in a droplet-matrix phase separated morphology material on
various aspects of glass-ceramic formation, has not been widely examined. It is necessary to
understand how the nucleation and growth rates change with temperature and composition of the
base glass, as well as the impact of the parent glass’ morphology on the post-heat-treated physical
properties of the resulting glass-ceramic. Since this system has shown the presence of nanoscale
phase separation which is difficult to eliminate, it is critical to understand the effects of phase
separation on the crystallization behavior in these glasses.
In order to study the effects of composition and phase separation on crystallization, two
compositions spanning both sides of an immiscibility dome were investigated where the less
stable, crystallization-initiating glass phase changes from droplet form to matrix form. While
parallel work beyond this study is examining other methods (i.e. laser irradiation) to address the
spatial control of nuclei formation, this study has exclusively examined a ‘thermal’ approach only,
using a two-step heat-treatment protocol to both nucleate and grow, the resulting crystallites in the
glass. The motivation is to understand how the thermally induced crystallization changes key
4
glass-ceramic optical and physical properties such that the crystallization process can be exploited
for fabricating GRIN optical elements suitable for use in an IR optical system requiring 3 to 5 µm
transmission.
5
CHAPTER TWO: INTRODUCTION
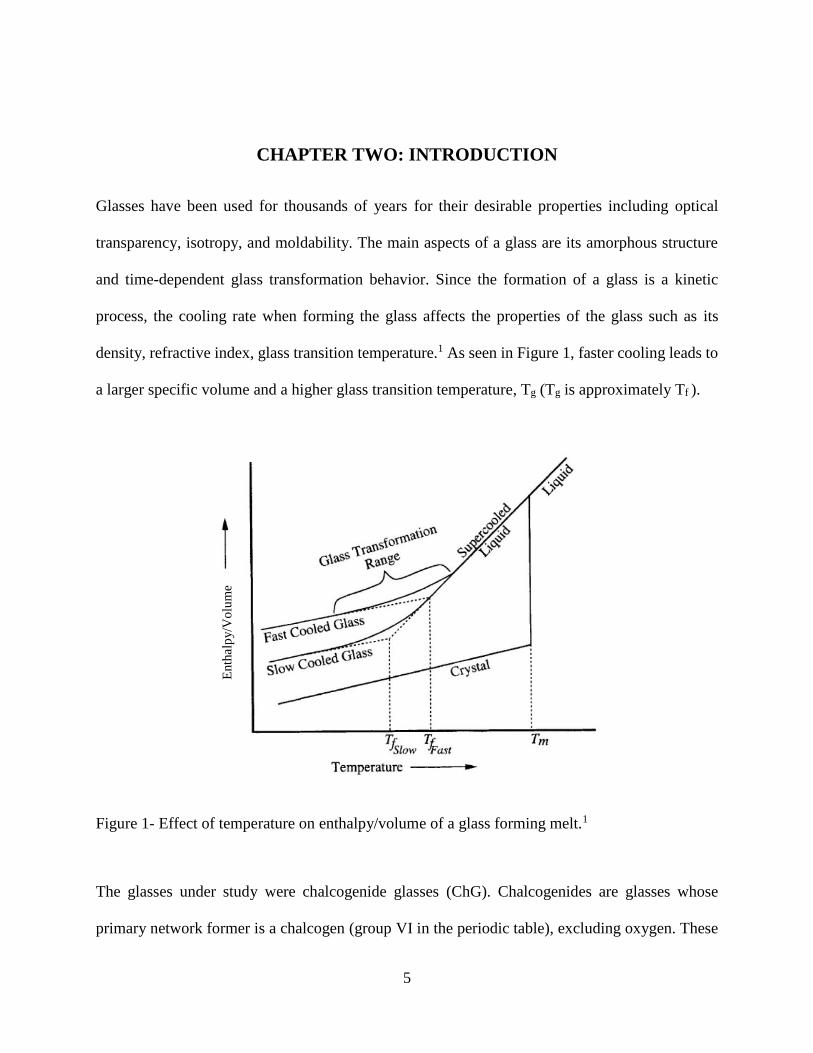
Glasses have been used for thousands of years for their desirable properties including optical
transparency, isotropy, and moldability. The main aspects of a glass are its amorphous structure
and time-dependent glass transformation behavior. Since the formation of a glass is a kinetic
process, the cooling rate when forming the glass affects the properties of the glass such as its
density, refractive index, glass transition temperature.1 As seen in Figure 1, faster cooling leads to
a larger specific volume and a higher glass transition temperature, Tg (Tg is approximately Tf ).
Figure 1- Effect of temperature on enthalpy/volume of a glass forming melt.1
The glasses under study were chalcogenide glasses (ChG). Chalcogenides are glasses whose
primary network former is a chalcogen (group VI in the periodic table), excluding oxygen. These
Enth
alp
y/V
olu
me
6
glasses are well known for their transparency in the infrared (IR) and their high refractive index.
Chalcogenide glasses are commonly used in rewritable memory applications,13 chemical sensors,14
and other IR optical systems.15 The research presented in this thesis supports an effort to improve
chalcogenide glasses through controlled crystallization, creating a glass-ceramic.
Glass-Ceramics
Glasses are widely used in many applications, but are sometimes limited by mechanical strength
or thermal properties. Ceramming of the base glass to produce crystals can improve mechanical
strength, coefficient of thermal expansion (CTE), and create zero porosity materials;16 these
properties are improved while maintaining some of the advantages of glass (isotropy, moldability,
etc.).1, 17 Some of the more famous glass-ceramics applications utilize an improved CTE over the
parent glass through introduction of a secondary, crystalline phase. Examples of this include
Corningware® cookware (lithium aluminosilicate glass-ceramic) and SCHOTT’s Zerodur® space
mirrors.1, 3 Corningware® cookware’s low CTE provides a good resistance to thermal shock and
is a product of a low CTE glass phase and a low CTE crystal phase.1 The Zerodur® glass-ceramic
mirrors have a low CTE glass phase and negative CTE crystal phase producing a CTE that is very
close to zero.3 The key to an optical glass-ceramic is extremely small crystals with a refractive
index that closely matches the parent glass.1 The size of the crystals typically needs to be less than
λ/10, where λ is the wavelength used in the application to reduce scattering (Mie) and thus maintain
high transmission.18
7
Glass-ceramics can also be used in optical applications such as photo-thermo-refractive glass
(PTR) and photochromic lenses.4, 19 PTRs are glass-ceramics that undergo large refractive index
changes after UV-exposure and thermal treatments due to the precipitation of nanoscale crystals
in the areas exposed to UV radiation.4 Photochromic glasses are similar in composition and
processing approach and use light-induced bulk crystallization of silver halide particles to induce
color change (for art applications) or to protect eyes from sunlight by creating a tinting effect of
the glasses.17, 19, 20
The applications for chalcogenide glasses can often be limited by the weak mechanical properties
and poor resistance to thermal shock of the glass which results from the weaker covalent bonding
of large, group VI chalcogen ions which are often blended with similar heavy elements found in
group IV or V. It is this same detriment to mechanical properties which enables infrared
transparency. It is well known that controlled crystallization in chalcogenides can be quite
difficult.21 The low thermal conductivity of chalcogenide glasses can lead to a temperature gradient
during heat-treatment which causes different crystallization rates across the sample. Chalcogenide
glass-ceramics are being studied for applications in cars to aid drivers in low-light conditions and
for applications in the photoelectric field due to their non-linear optical properties.22, 23
8
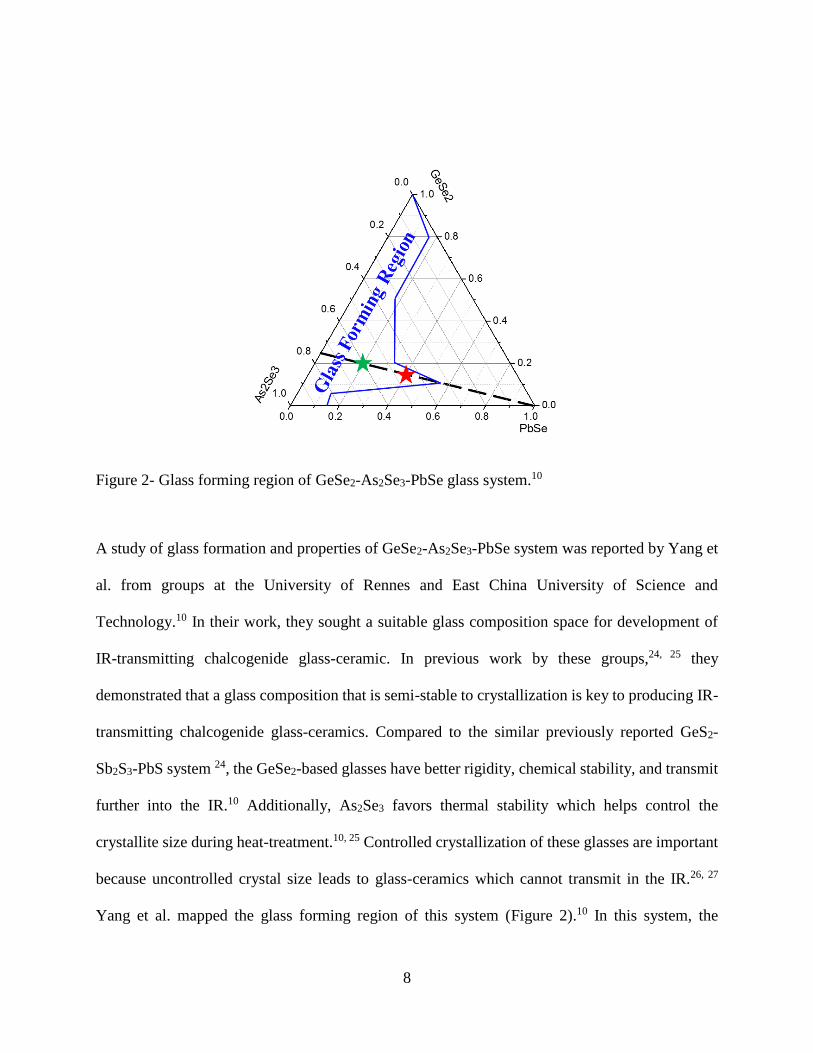
Figure 2- Glass forming region of GeSe2-As2Se3-PbSe glass system.10
A study of glass formation and properties of GeSe2-As2Se3-PbSe system was reported by Yang et
al. from groups at the University of Rennes and East China University of Science and
Technology.10 In their work, they sought a suitable glass composition space for development of
IR-transmitting chalcogenide glass-ceramic. In previous work by these groups,24, 25 they
demonstrated that a glass composition that is semi-stable to crystallization is key to producing IR-
transmitting chalcogenide glass-ceramics. Compared to the similar previously reported GeS2-
Sb2S3-PbS system 24, the GeSe2-based glasses have better rigidity, chemical stability, and transmit
further into the IR.10 Additionally, As2Se3 favors thermal stability which helps control the
crystallite size during heat-treatment.10, 25 Controlled crystallization of these glasses are important
because uncontrolled crystal size leads to glass-ceramics which cannot transmit in the IR.26, 27
Yang et al. mapped the glass forming region of this system (Figure 2).10 In this system, the
9
relatively low Pb content is expected to fill the role of a nucleation agent with further heat-
treatment,10 as similarly reported for an analogous sulfide system.24
As introduced above, through strict control of the relative volume fraction of each phase (glass
and crystallite) in the composite, two-phase material, effective properties can be estimated based
on the lever-rule. The refractive index can increase if the crystal increases the local density or if
the crystallizing species has a higher refractive index than the base glass. The effective refractive
index, neff, is approximately given by Equation ( 1 ) where V and n are the volume fraction and
refractive index of the indicated phase.
𝑛𝑒𝑓𝑓 = (𝑉𝑔𝑙𝑎𝑠𝑠)(𝑛𝑔𝑙𝑎𝑠𝑠) + (𝑉𝑐𝑟𝑦𝑠𝑡𝑎𝑙)(𝑛𝑐𝑟𝑦𝑠𝑡𝑎𝑙) ( 1 )
In this thesis work, crystallization was investigated as a mechanism for increasing the refractive
index of the glass. The desired application needs this increase in refractive index, but it also needs
to maintain the transmission from 3 to 5 µm. Small crystallites can increase the refractive index of
the glass, but large crystals result in scattering which ruins the transmission. In order to take
advantage of the refractive index increase, without losing transmission, the glass has to be
crystallized in a controlled manner. To control the crystallization process, the nucleation and
growth behavior has to be well understood.
10
Crystal Nucleation and Growth in Glass
The characterization of crystal nucleation and growth in glasses can be quite difficult due to the
small sizes of the crystal and the necessary iterative nature of the experiments. Sometimes this
characterization is measured directly through microscopy techniques, but if the crystallization rates
are too high, the rates cannot be measured this way.28 For a quantitative study of crystallization in
glasses, differential scanning calorimetry (DSC) is an extremely valuable tool.28 DSC studies of
glass crystallization can be used to identify activation energy for crystallization 29, 30, nucleation
curves (temperature vs. rate)31, and growth curves (temperature vs. rate).32
Massera et al. performed an extensive study on nucleation and growth rates in TeO2-Bi2O3-ZnO
glasses.28 They determined nucleation-like and growth-like curves, activation energy for
crystallization, the Johnson-Mehl-Avrami exponent, and nucleation/growth rates as a function of
composition using microscopy techniques and thermal analysis techniques developed by Marotta
et al.31 and Ray et al.32 While this study was on tellurites, the same theory and techniques have
been applied to chalcogenides as well to characterize the nucleation and growth behavior.33-35
These studies were used as a basis for the development of nucleation and growth curves in the
GeSe2-As2Se3- PbSe system.
Crystallization is a two-step process involving an initial nucleation of the crystal followed by a
growth of the nuclei by the addition of more atoms. There are two types of nucleation:
homogeneous nucleation and heterogeneous nucleation. Homogeneous nucleation occurs when
nuclei form spontaneously in the melt/matrix. Heterogeneous nucleation occurs when a nuclei
11
forms on a pre-existing surface or interface.1 There are two barriers to the formation of nuclei in
glasses: the thermodynamic barrier and the kinetic barrier. For the thermodynamic barrier, the
formation of the nucleus must reduce the free energy of the system. At a given temperature, there
is a critical radius at which a nucleus that spontaneously forms will reduce the free energy and the
nucleus will be stable. As the temperature decreases, the size of the critical radius decreases
making it more likely for nuclei to form and remain stable.1, 36 For homogeneous nucleation in
glass the change in free energy is represented by:
∆𝐺 = 𝑉∆𝐺𝑉 + 𝐴𝑆𝛾 ( 2 )
where V is the volume of the crystal embryo (nucleus), ΔGV is the bulk free energy change, AS is
the surface area of the particle, and γ is the surface energy of unit area. When the crystals are small,
the positive surface energy term dominates making them unfavorable causing them to redissolve
into the matrix. When the crystals are larger than the critical nucleus size, the bulk free energy
term dominates and the nuclei are stable and grow to larger sizes. In homogeneous nucleation, the
interface that is being created is between the melt/matrix and the crystal. In the case of
heterogeneous nucleation, the crystal is forming on an existing surface or interface. In this
scenario, a smaller interface is formed between for the surface-crystal and crystal-matrix/melt.
While the formation of these interfaces work against the creation of the nuclei, there is also the
elimination of the interface between the surface and the melt/matrix which reduces the free energy
of the system. The overall combination of the creation and elimination of interfaces leads to an
overall reduction in activation energy needed for crystallization.1, 36 Because of this, heterogeneous
12
nucleation is many orders of magnitude faster than homogeneous nucleation. It also follows that a
system with more pre-existing interfaces (crystals, phase separation, voids) will have a higher
nucleation rate compared to a system without such interfaces.
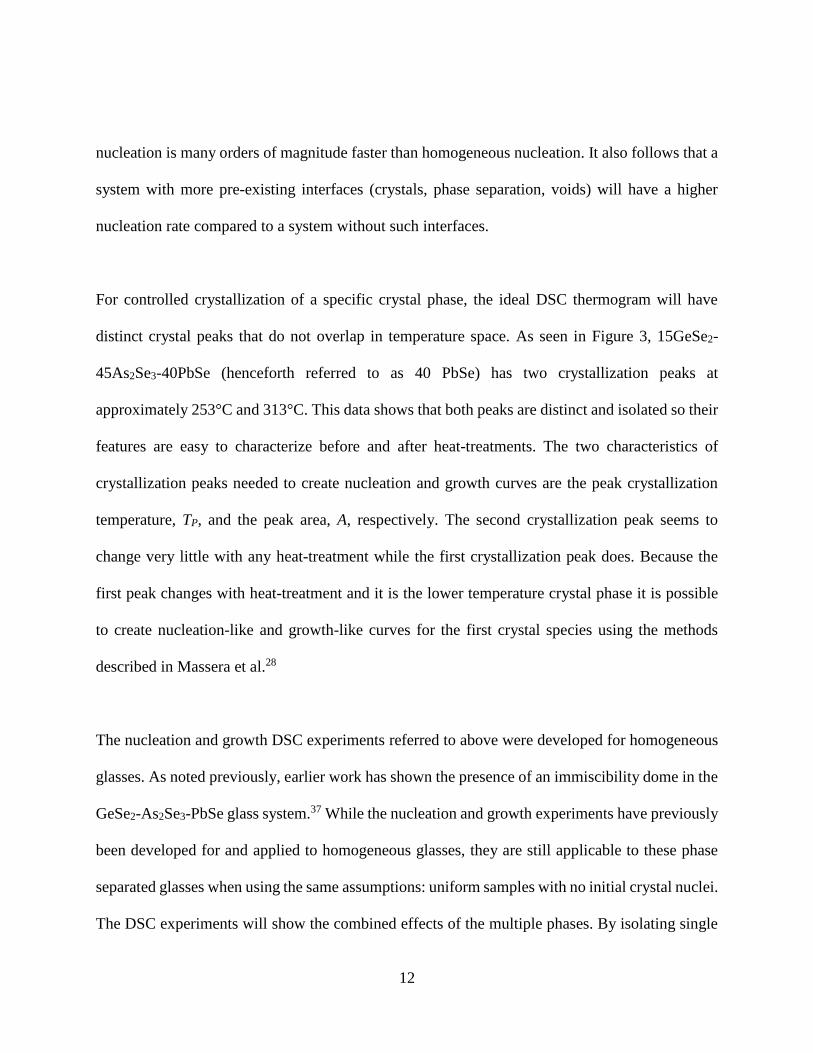
For controlled crystallization of a specific crystal phase, the ideal DSC thermogram will have
distinct crystal peaks that do not overlap in temperature space. As seen in Figure 3, 15GeSe2-
45As2Se3-40PbSe (henceforth referred to as 40 PbSe) has two crystallization peaks at
approximately 253°C and 313°C. This data shows that both peaks are distinct and isolated so their
features are easy to characterize before and after heat-treatments. The two characteristics of
crystallization peaks needed to create nucleation and growth curves are the peak crystallization
temperature, TP, and the peak area, A, respectively. The second crystallization peak seems to
change very little with any heat-treatment while the first crystallization peak does. Because the
first peak changes with heat-treatment and it is the lower temperature crystal phase it is possible
to create nucleation-like and growth-like curves for the first crystal species using the methods
described in Massera et al.28
The nucleation and growth DSC experiments referred to above were developed for homogeneous
glasses. As noted previously, earlier work has shown the presence of an immiscibility dome in the
GeSe2-As2Se3-PbSe glass system.37 While the nucleation and growth experiments have previously
been developed for and applied to homogeneous glasses, they are still applicable to these phase
separated glasses when using the same assumptions: uniform samples with no initial crystal nuclei.
The DSC experiments will show the combined effects of the multiple phases. By isolating single
13
crystal peaks, the energetics of the specific phase’s crystallization behavior can be evaluated
regardless of the presence of the phase separation. The location of the crystallization must be
evaluated by other techniques including electron microscopy.
Figure 3 - 15GeSe2-45As2Se3-40PbSe DSC curves of base, nucleation-only, and growth-only
heat-treatment
Phase Separation of Glass
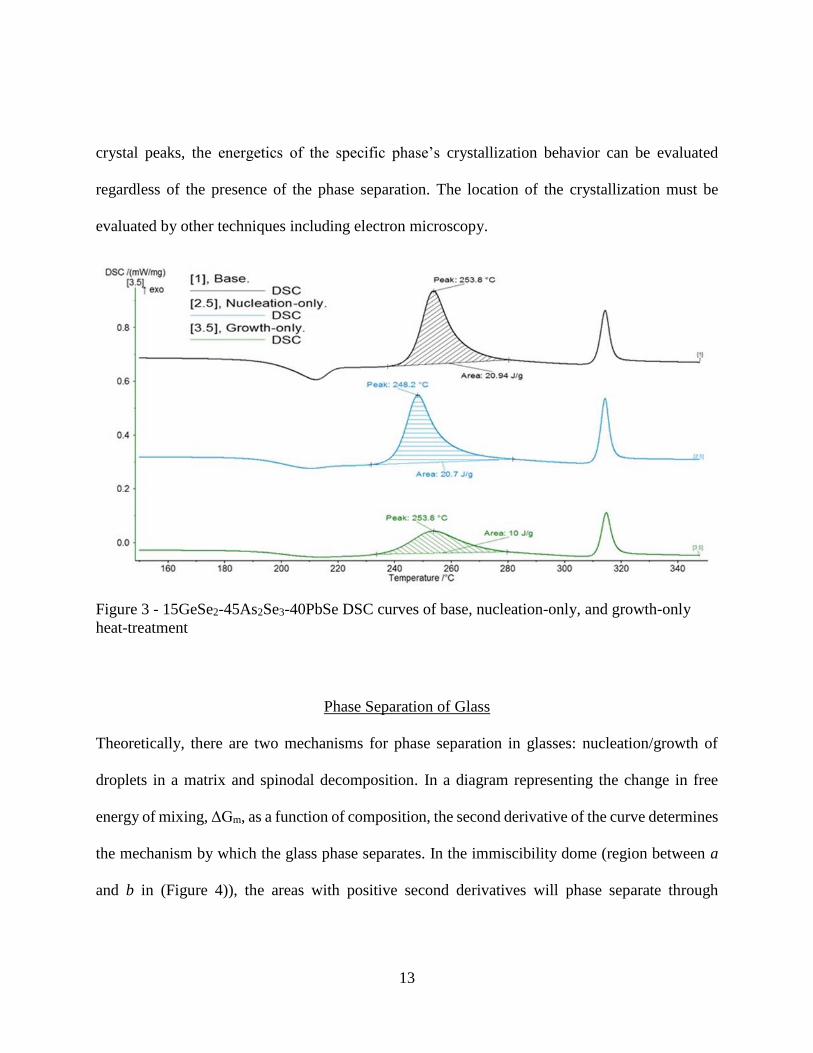
Theoretically, there are two mechanisms for phase separation in glasses: nucleation/growth of
droplets in a matrix and spinodal decomposition. In a diagram representing the change in free
energy of mixing, ΔGm, as a function of composition, the second derivative of the curve determines
the mechanism by which the glass phase separates. In the immiscibility dome (region between a
and b in (Figure 4)), the areas with positive second derivatives will phase separate through
14
nucleation and growth of droplets while negative second derivatives areas go through spinodal
decomposition.
Systematic mapping of the phase separation regions in glasses is typically done by quenching
glasses of the same composition from different temperatures. The resulting quenched samples are
then evaluated via microscopic techniques to determine if phase separation is present. The
immiscibility boundary for that composition can be defined as the temperature between sample
showing phase separation and showing no phase separation. By repeating these experiments at
various compositions along a tie line, the immiscibility dome can be mapped for the binary/pseudo-
binary.1
Figure 4 - (A) Theoretical idealized immiscibility dome in a binary system. (B) Free energy of a
binary immiscible system at a temperature, T1.Adapted from Shelby1
The techniques for detecting phase separation can be quite varied and the most appropriate one
depends on the glass system. At its simplest, phase separation can be visually detected by looking
for the presence of opalescence in a phase separated glass. This technique is not practical in a lot
of studies because the observation of opalescence may only be present in cases of large phase
15
separation, where there is a large difference in refractive index between the separating liquid
phases. This measurement can be aided by the use of a laser and a detector that measures scattering
loss. This allows the detection of phase separation in a quantitative measurement as opposed to a
qualitative measurement by measuring the scattering loss of the various samples.1 Phase separation
can be seen by other methods as well including x-ray small angle scattering (SAXS)1, 38, 39 or
electron microscopy40, 41. These techniques can be very instrument-intensive and expensive, but
they are very accurate in measuring size and detecting phase separation.1
Chenu et al. studied the use of phase separation to create nanocrystalline microstructures in zinc
gallogermanate glasses and glass-ceramics.42 In their work, they melted and quenched glasses with
nanometer scale droplet-matrix phase morphology. This system displays two crystallization
features in the DSC upon heating, a low temperature and a high temperature peak. The low
temperature peak corresponded with crystallization within the droplets while the high temperature
peak corresponded with crystallization in the matrix. Because of this separation, a low temperature
heat-treatment was found to nucleate and grow crystals in the droplets without any crystallization
in the matrix. This treatment resulted in a final glass-ceramic composite with nanocrystals
uniformly distributed in a glass matrix where the droplets were located.
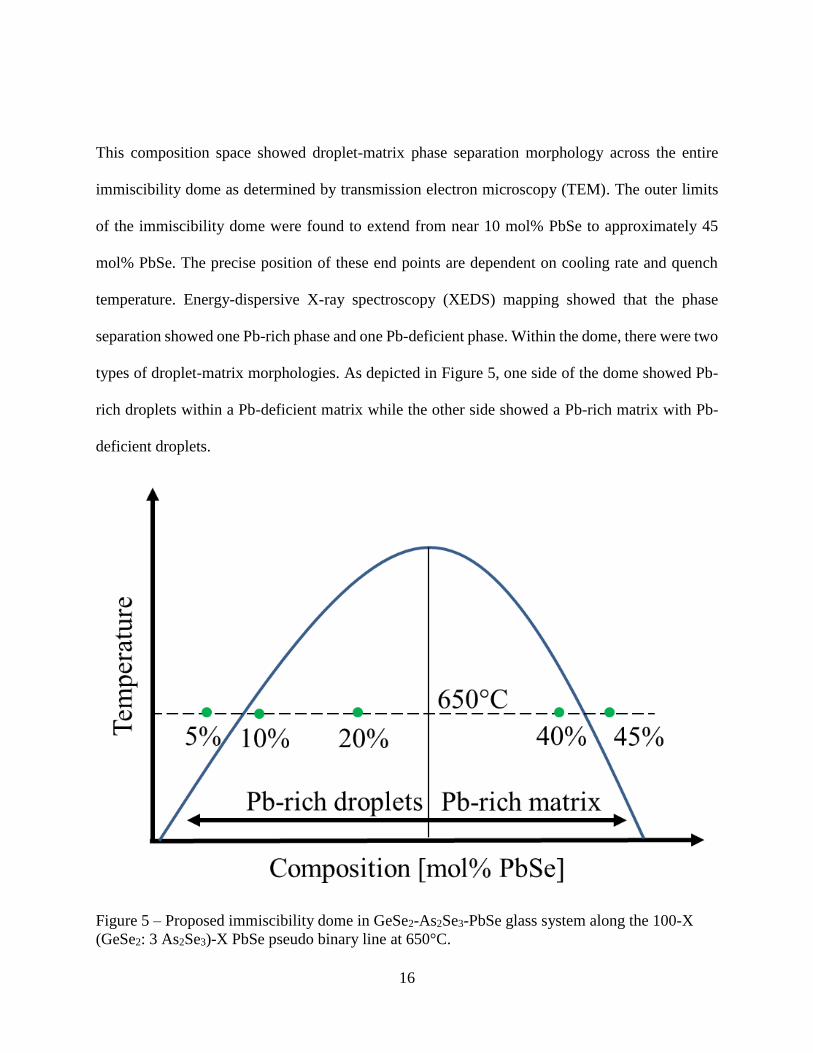
Prior work by our group has shown that the GeSe2-As2Se3-PbSe glass system has an immiscibility
dome along the 100-X(GeSe2: 3 As2Se3)-X PbSe pseudobinary line.37 Figure 5 shows the proposed
immiscibility dome along this composition line generated by optical and physical property
measurements on identical small melt samples (40g) subjected to the same melt/quench protocol.
16
This composition space showed droplet-matrix phase separation morphology across the entire
immiscibility dome as determined by transmission electron microscopy (TEM). The outer limits
of the immiscibility dome were found to extend from near 10 mol% PbSe to approximately 45
mol% PbSe. The precise position of these end points are dependent on cooling rate and quench
temperature. Energy-dispersive X-ray spectroscopy (XEDS) mapping showed that the phase
separation showed one Pb-rich phase and one Pb-deficient phase. Within the dome, there were two
types of droplet-matrix morphologies. As depicted in Figure 5, one side of the dome showed Pb-
rich droplets within a Pb-deficient matrix while the other side showed a Pb-rich matrix with Pb-
deficient droplets.
Figure 5 – Proposed immiscibility dome in GeSe2-As2Se3-PbSe glass system along the 100-X
(GeSe2: 3 As2Se3)-X PbSe pseudo binary line at 650°C.
17
Scale-Up
For these materials to be considered suitable for further use in optical systems, the behavior of
crystalline formation in the starting glass must be understood in melts created at a much larger
scale than the lab-scale (melt sizes < 500g at UCF). Scale-up of the glass melt beyond the lab-scale
sizes is desired to show that these compositions can be commercialized. As the size of melts
increase, it becomes more difficult to extract the heat from the glass melt and thus decreasing the
cooling rate. The cooling rate of a glass melt can have significant impact on the properties of the
glass like Tg, density, and refractive index, as seen in Figure 1. Additionally, slow cooling rates
may lead to the nucleation of crystallites or phase separated droplets.1 While the slow cooling rates
may have negative effects on the glass by producing these inhomogeneities, the slow cooling is
required for yielding better (high) refractive index optical homogeneity. Index inhomogeneity
typically occurs from compositional, and thereby density, fluctuations that result in striae. These
striae are artifacts that degrade transmission through the optical component. Striae are typically
‘born’ upon cooling from the melting region at high temperatures when the molten glass is quite
turbulent as gases escape the melt and convective currents flow within the melt. If the melt is
rapidly quenched, the turbulent flow is “frozen” into the glass, resulting in bubbles or density
gradients. Slow quenching allows the melt enough time to relax so that the fluctuations are not
“frozen” into the glass. Other optical inhomogeneities in the glass may arise as the glass contracts
when the temperature passes through the transformation region, near Tg. As the outside of the glass
melt solidifies before the inside, the contraction during solidification can cause striations in the
18
melt which are then permanently frozen into the glass network. Such striae will be shown in the
further FLIR images of fast versus slow cooled melts in the results and discussion chapter.
This chapter highlights some of the approaches used in experiments performed as part of this study
to investigate crystallization behavior in the phase separated GeSe2-As2Se3-PbSe glass system.
The research focused on two glasses that represent the Pb-rich droplet morphology and the Pb-rich
matrix morphology. These two compositions underwent rigorous testing of their properties and
crystallization behavior.
The following chapters will outline the properties of the two compositions and the experiments
that provided the data. The effect of the phase separation morphology on the crystallization
behavior and post heat-treatment properties will be discussed. In addition to this, the issue of scale-
up, examining more relevant cooling rates with increasing melt size towards commercial scale,
will be demonstrated and discussed.
19
CHAPTER THREE: EXPERIMENTAL
In this chapter, we review the protocols used to batch, melt, quench, heat-treat, and measure the
properties of the glass and glass-ceramic materials are discussed.
Sample Preparation
GeSe2-As2Se3-PbSe glasses were batched in a MBraun Labmaster 130 glove box with a dry
nitrogen atmosphere using elemental starting materials. All glasses were prepared using high
purity raw materials (metals basis) from Alfa Aesar: selenium (99.999%), germanium (99.999%),
antimony (99.999%), and lead (99.999%). No further purification for oxide or moisture removal
was performed. The weighed batch was loaded into cleaned fused quartz tubes and sealed under
vacuum to form sealed ampoules which then become the crucible for the melting. All glasses,
unless otherwise stated, were melted in a rocking furnace overnight at a melting temperature, Tm
= 850°C. The furnace was then cooled to the quench temperature, TQ = 650°C, at 2°C/min prior to
removal from the furnace for quenching. The glasses were removed from the furnace and quenched
by flowing compressed air over the ampoules, constituting a ‘fast’ quench. In the initial part of
this study, such an approach was chosen to minimize the extent of phase separation. The quench
rate for this method was estimated to be ~120°C/min. The samples were subsequently annealed at
177°C for 2 hours to relax quench-related stresses in the glass. The melting and quenching protocol
for these glasses were developed through trial-and-error to achieve robust glass samples that did
not crack upon quenching and could be subsequently removed from the tube following annealing,
for subsequent fabrication and analysis.
20
Fabrication of samples, if required for analysis, was performed by cutting 2.5 mm thick slices from
the rod using a slow speed saw. These slices were then ground and polished by hand to form ~ 2
mm thick discs with two parallel polished surfaces. Grinding was done with silicon carbide
grinding paper with finer and finer grit sizes. The final polishing step was completed using a
polishing pad with 0.05 µm Al2O3 slurry. These fabricated samples were used for many
measurements including transmission measurements, refractive index, and hardness.
The study focused on two glass compositions, 20 GeSe2 – 60 As2Se3 – 20 PbSe (herein referred to
as 20 PbSe) and 15 GeSe2 – 45 As2Se3 – 40 PbSe (referred to as 40 PbSe). The atomic compositions
of these glasses can be found in Table 1.
Table 1 – Atomic composition of 20 PbSe and 40 PbSe glasses
Component 20 PbSe
(at%)
40 PbSe
(at%)
Se 60.0 58.6
Ge 5.0 4.3
As 30.0 25.7
Pb 5.0 11.4
Bulk samples of glass were subsequently heat-treated to form glass-ceramics in furnaces in an
open-air atmosphere, pictured below in Figure 6. The 40 PbSe glass samples were heat-treated at
210°C for 2 hours as a nucleation step followed by growth steps at 230°C, 240°C, or 250°C. The
20 PbSe glasses were heat-treated at 220°C for 2 hours as a nucleation step followed by growth
steps at 250°C, 260°C, or 270°C. Physical and optical properties of the glasses were measured
before and after heat-treatments.
21
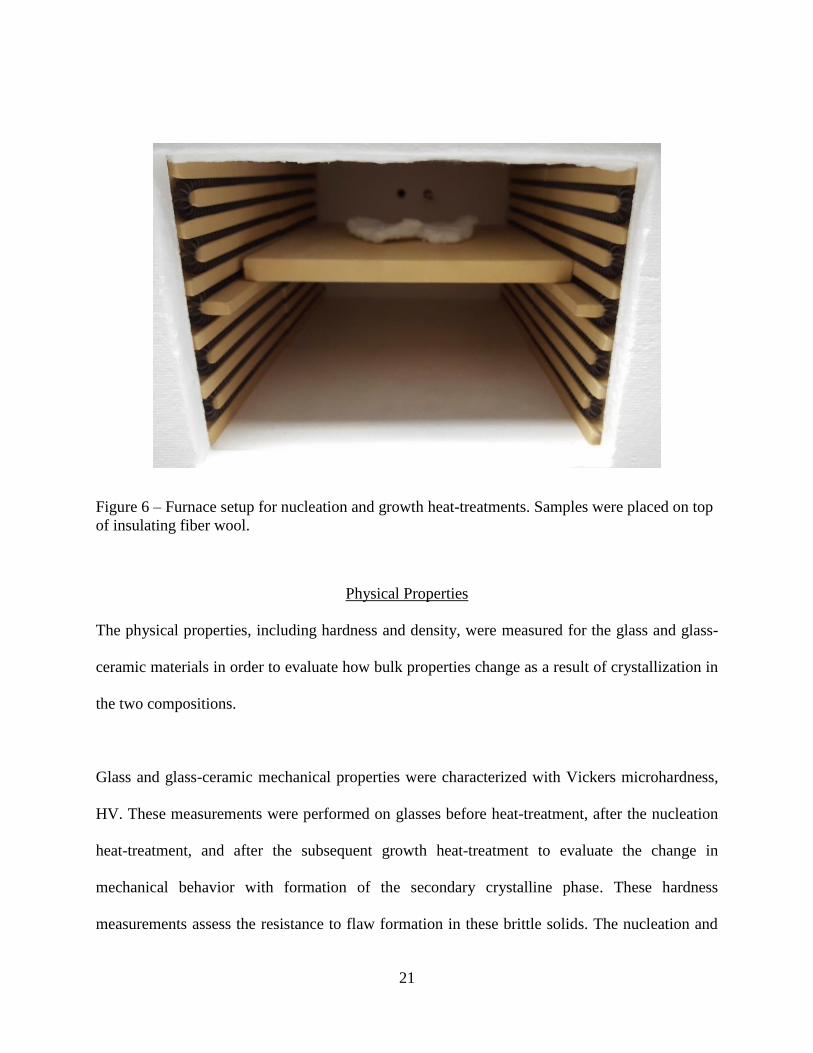
Figure 6 – Furnace setup for nucleation and growth heat-treatments. Samples were placed on top
of insulating fiber wool.
Physical Properties
The physical properties, including hardness and density, were measured for the glass and glass-
ceramic materials in order to evaluate how bulk properties change as a result of crystallization in
the two compositions.
Glass and glass-ceramic mechanical properties were characterized with Vickers microhardness,
HV. These measurements were performed on glasses before heat-treatment, after the nucleation
heat-treatment, and after the subsequent growth heat-treatment to evaluate the change in
mechanical behavior with formation of the secondary crystalline phase. These hardness
measurements assess the resistance to flaw formation in these brittle solids. The nucleation and
22
growth of crystals in a glass matrix should improve the hardness. Since the crystals are harder than
the glass phase, the increased volume fraction of crystals will improve the overall hardness of the
glass-ceramic composite.
Hardness measurements were performed on a Shimadzu DUH-211S Hardness Tester using a
diamond indenter. Indents were created on polished sample surfaces using a 100 mN load with a
hold time of 10 seconds. The hardness tester was calibrated using a metal calibration standard
provided by Shimadzu. Sources of error can occur during this measurement if the sample does not
have perfectly parallel surfaces or if there is extensive pre-existing surface damage (cracks or
scratches).
The densities of the glasses and glass-ceramics were measured at every stage of heat-treatment. In
most cases, crystallization in a glass matrix should lead to an increase in density as the atoms
rearrange to have uniform bond lengths and angles. Such a change in density is important because
it can directly affect the refractive index and can be correlated with extent of crystallization.
Density was measured on glass samples using a method based on the Archimedes principle. The
mass of samples in air (mair), the mass of the samples submerged in DI water (mwater), and the
density of water at the measurement temperature (ρwater) were used to calculate the density of the
sample (ρsample). The relationship can be seen below in Equation ( 3 ).
𝜌𝑠𝑎𝑚𝑝𝑙𝑒 = 𝜌𝑤𝑎𝑡𝑒𝑟𝑚𝑎𝑖𝑟
𝑚𝑎𝑖𝑟−𝑚𝑤𝑎𝑡𝑒𝑟 ( 3 )
23
Thermal Analysis
Thermal analysis of the base glasses provides information on the glass transition and crystallization
behavior. Thermal analysis was performed using a Netzsch DSC 204 F1 Phoenix Differential
Scanning Calorimeter (DSC). Bulk samples of glass were finely crushed (< 125 μm) and put into
sealed aluminum pans (20 ± 5 mg of glass). The base heating rate of the DSC curves was 10
°C/min. The DSC was calibrated by measuring the melting endotherms of indium, tin, bismuth,
zinc, and cesium chloride standards. The instrument error on temperature after calibration was ±
2°C. The DSC was used to create nucleation-like and growth-like curves by analyzing curves after
isothermal holds in the DSC. For these runs, the samples were rapidly heated (20°C/min) to a test
temperature, held for a set time (30 minutes) then rapidly cooled below Tg before being ramped
up at the normal base rate. The activation energy for crystallization was also determined using the
DSC by methods described by Abdel-Wahab et al.,43 Ozawa et al.,44 and Matusita et al.29 Heating
rates of 10, 15, 20, 25, and 30°C/min were used to determine the activation energies by these
methods.
The nucleation rate of a crystal species, I0, can be determined by Equation ( 4 ):
ln(𝐼0) =𝐸𝐶
𝑅𝛽 + 𝐶 ( 4 )
𝛽 = (1
𝑇𝑃−
1
𝑇𝑃0) ( 5 )
where EC is the activation energy for crystal growth, R is the gas constant, and C is a constant. TP
and TP0 are the temperatures corresponding to the maximums of the crystallization exotherms with
24
and without a nucleation step respectively.28 During the nucleation step, the crystal species begins
to nucleate throughout the sample. With these additional nucleation sites, the crystallization
exotherm for this species will shift to lower temperatures compared to the base glass without the
nucleation step. Since β is proportional to ln(I0), a nucleation-like curve can be made for a specific
crystal species by plotting chosen nucleation temperatures on the abscissa and β on the ordinate.
The creation of nucleation-like curves using this method was first shown by Marotta et al.31
Similar to nucleation-like curves, growth-like curves can be made for glasses through DSC
isothermal holds by a process described by Ray et al.32 The area of the crystallization peak is
proportional to the volume fraction of crystals in the glass matrix. If growth occurs during the
isothermal heat-treatment, the subsequent DSC run will show a crystallization peak with a smaller
area compared to the base curve. By plotting the change in area of the peak against the temperature
of the isothermal hold will produce a growth-like curve. For purposes of this work, we summarize
the results of these measurements for the 20 and 40 PbSe compositions as nucleation-like (I) and
growth-like (U) curves.
Structure and Morphology Characterization
X-ray Diffraction (XRD) was performed on the PANalytical Empyrean at Materials
Characterization Facility at UCF. These measurements were run on the base and heat-treated
glasses to see the evolution of crystal phases with heat-treatment. XRD was used to confirm the
amorphous nature of the base glass and to confirm the presence of crystals in the heat-treated
glasses. XRD in conjunction with selected area electron diffraction was used to identify the crystal
25
phases present in the heat-treated glasses. Diffraction patterns were referenced to the JCPDS
database. Glass and glass-ceramic samples were finely ground and put in an aluminum sample
holder. Scans were taken using Cu Kα radiation (1.54 Å) with a 2θ scan range from 10-70°.
Transmission Electron Microscopy (TEM) was performed on thin samples of glass. The images
were obtained using 80 to 200 keV voltage, 1 nA current, and 57k – 225k magnification. Selected
area electron diffraction (SAED) was performed on heat-treated glasses to confirm crystallinity
and attempt crystal identification from the electron diffraction pattern. TEM samples were
prepared by using a focused ion beam-assisted milling followed by a lift-out process at Penn State
University. This was conducted using the FEI Helios 660 dual-beam with carbon and Pt GIS.
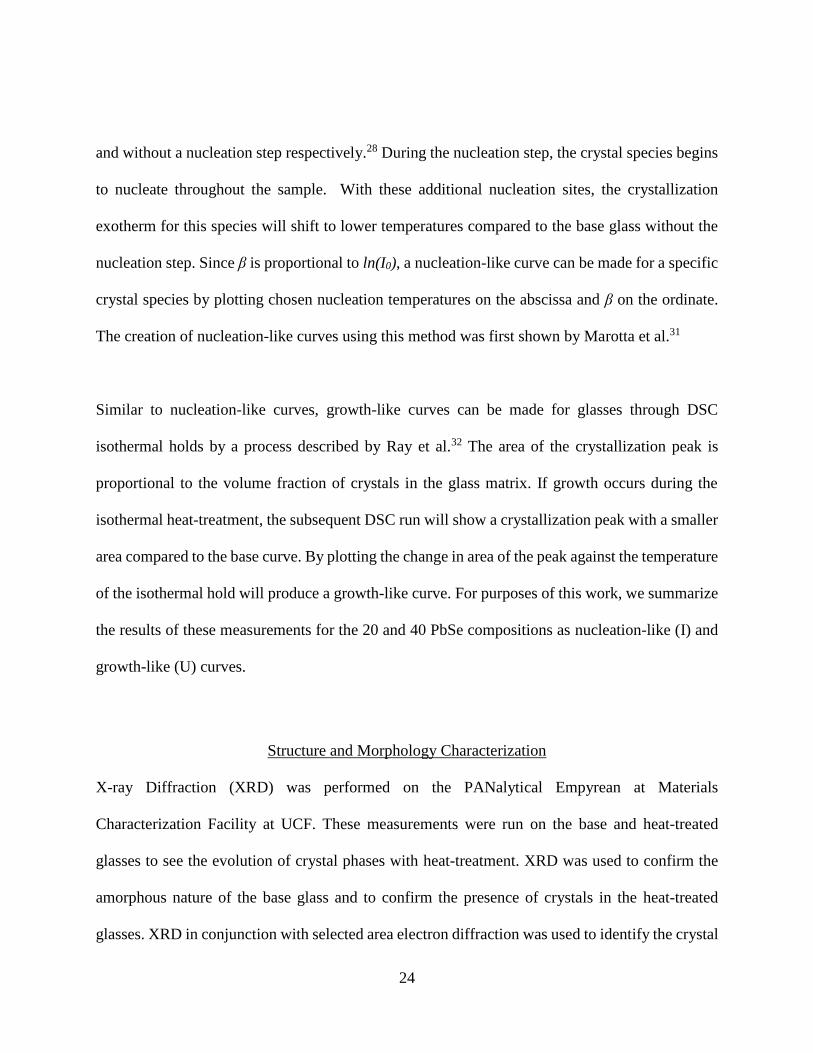
Figure 7 shows the six sequential steps for the process. The first step involved protecting the region
of interest from the ion milling by depositing layers of carbon. This protective mask was created
using the GIS in the dual-beam instruments to deposit a thin layer of carbon assisted by the electron
beam followed by further carbon deposition assisted by the ion beam to a thickness of 2 µm (step
1). After the carbon deposition, rough milling was conducted on regions adjacent to the protective
layers to thin the region of interest and carbon protective layers to < 1 µm thick (step 2). The
sample was then tilted to make a U-shaped cut on the sidewall of the thinned specimen using ion
beam (step 3), and tilted back to thin it to < 500 nm (step 4). The W probe was then brought into
contact with the top of the specimen and attached to the sample using ion-beam deposited Pt. The
specimen was cut free from the sample by ion-milling through the two thin bridges of the specimen
at either side of it, and lifted out of the rest of the sample (step 5). The specimen was then
transferred over to a Cu TEM grid. The specimen was directed into contact with the grid, and
26
attached to the grid with ion-beam deposited Pt. The specimen was cut free from the probe and left
attached to the Cu grid (step 6). The specimen was further thinned down to approximately 50 nm
thick to allow sufficient electron transparency. Lower accelerating voltages (10 and 5 kV) were
used for the final thinning step to decrease the depth of the ion damaged region on both sides of
the sample.
Figure 7 - The FIB-assisted lift-out process for the preparation of a cross-sectional TEM
specimen
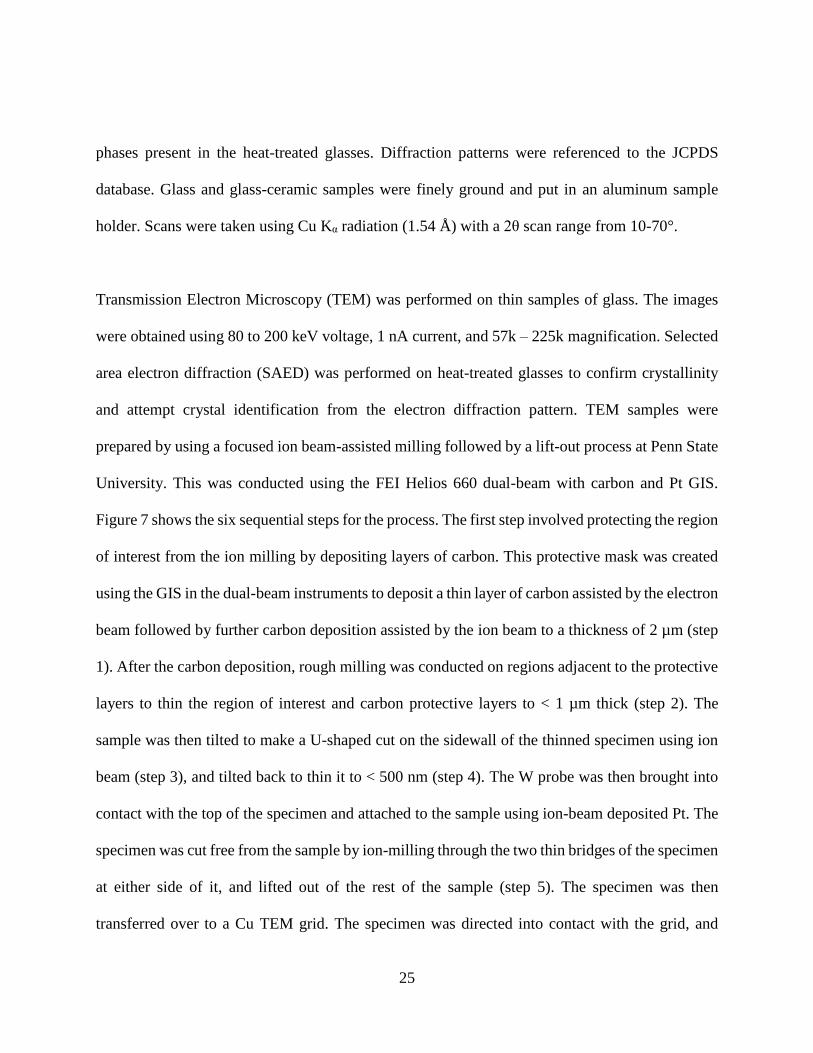
Energy dispersive x-ray spectroscopy (XEDS) was performed on the TEM samples to ascertain
the how the elements were segregated in the glass. Additionally, semi-quantitative compositional
analysis was performed to compare the compositions of the phases across multiple glasses. A
commercial chalcogenide glass (Schott IRG24) was used as a reference for these semi-quantitative
measurements seen below in Figure 8.
27
Figure 8 - XEDS line of Schott IRG24 (Ge10As40Se50). Measurement error is approximately ± 1
at%.
Optical Properties
Applications of glass in optical components require good transmission and characterization of the
refractive index. This is especially important in phase separated glasses where the multiple phases
may cause light scattering. For this GRIN project, an increase in refractive index through
crystallization is sought. Excessive crystallization can negatively affect the transmission.
Therefore, it is important to understand how the refractive index and transmission window change
with crystallization. This section outlines the measurements and instruments used to characterize
these properties as a function of phase separation morphology and heat-treatment.
Se
As
Ge
28
Transmission data was obtained using a ThermoFisher Scientific Nicolet iS5 Fourier Transform
Infrared spectroscopy (FTIR). FTIR was performed on base and heat-treated samples (as described
above). Measurements were done over a range of wavelengths from 1.4 to 25 μm on approximately
2 mm thick double-sided polished samples. For samples with significant transmission below the
lower FTIR limit of 1.4 µm (e.g. the 40 PbSe glass), transmission was measured below 1.4 µm on
a UV-Vis-NIR spectrometer. Sources of error for both instruments come from sample preparation
where poor surface quality and wedging (i.e. non-parallel sides) reduces transmission.
Refractive index was measured before and after heat-treatment of the glasses using a Metricon Inc.
prism coupler (2010M) that was modified to measure the index of bulk and thin film samples in
the infrared. Specifics on the system modification and basic principles of its use and measurements
on other chalcogenide glasses can be found in works by Carlie et al., Qiao et al., and Gleason et
al.45-47 The measurements reported in this thesis used either an optical parametric oscillator
operating at 4.515 μm or a CO2 laser operating at 9.294 µm. Ten measurements were performed
on each sample to attain measurement errors of ± 0.0005 for the 4.515 µm laser and ± 0.0015 for
the 9.294 µm laser. Two different prisms were used depending on the index of the sample. The
lower index samples were measured using an undoped, single-crystal Ge prism (index range ~ 2.05
– 3.05). The higher index samples were measured using an undoped, single-crystal Si prism (index
range ~ 2.95 – 3.35). The index measurements were calibrated using commercial samples (e.g.
ZnSe and IG4) with known refractive indices. Sources of error for these measurements can come
from poor surface quality which leads to poor optical coupling.
29
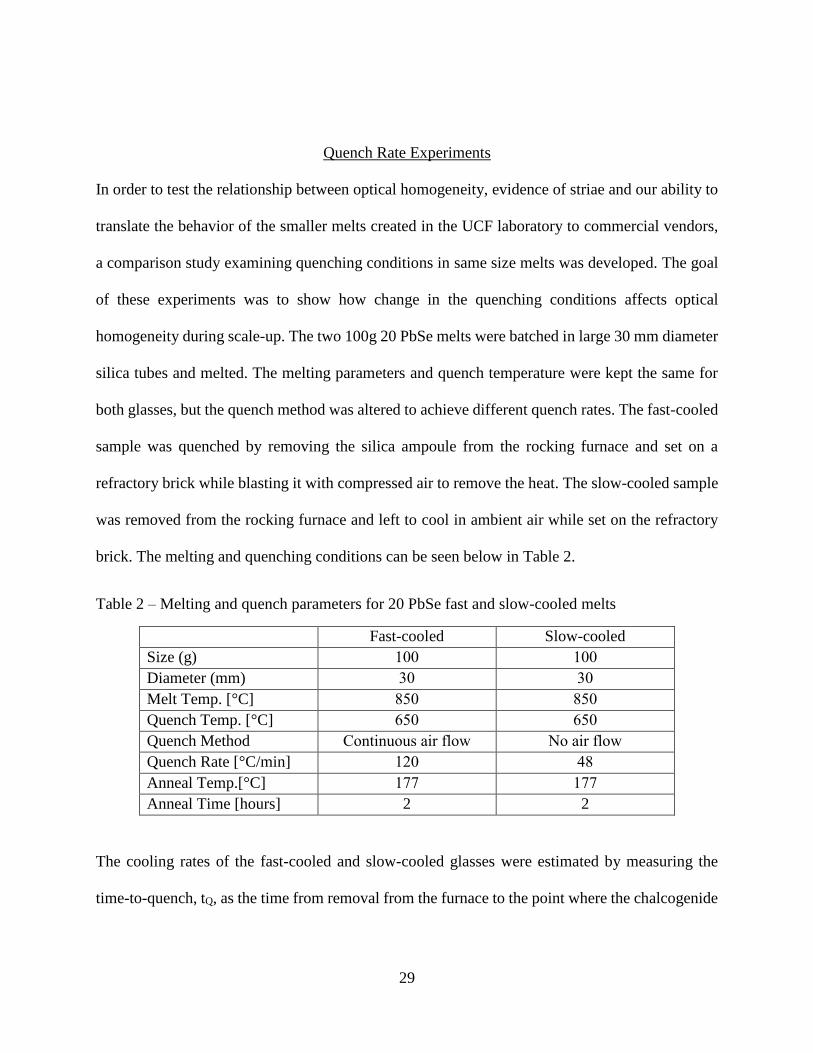
Quench Rate Experiments
In order to test the relationship between optical homogeneity, evidence of striae and our ability to
translate the behavior of the smaller melts created in the UCF laboratory to commercial vendors,
a comparison study examining quenching conditions in same size melts was developed. The goal
of these experiments was to show how change in the quenching conditions affects optical
homogeneity during scale-up. The two 100g 20 PbSe melts were batched in large 30 mm diameter
silica tubes and melted. The melting parameters and quench temperature were kept the same for
both glasses, but the quench method was altered to achieve different quench rates. The fast-cooled
sample was quenched by removing the silica ampoule from the rocking furnace and set on a
refractory brick while blasting it with compressed air to remove the heat. The slow-cooled sample
was removed from the rocking furnace and left to cool in ambient air while set on the refractory
brick. The melting and quenching conditions can be seen below in Table 2.
Table 2 – Melting and quench parameters for 20 PbSe fast and slow-cooled melts
Fast-cooled Slow-cooled
Size (g) 100 100
Diameter (mm) 30 30
Melt Temp. [°C] 850 850
Quench Temp. [°C] 650 650
Quench Method Continuous air flow No air flow
Quench Rate [°C/min] 120 48
Anneal Temp.[°C] 177 177
Anneal Time [hours] 2 2
The cooling rates of the fast-cooled and slow-cooled glasses were estimated by measuring the
time-to-quench, tQ, as the time from removal from the furnace to the point where the chalcogenide
30
glass pulls away from the walls of the silica ampoule. The glass is assumed to be at TQ when
removed from the furnace and at Tg when the glass pulls away from the walls.
In addition to the some of the basic property characterization described above (DSC, density,
FTIR), the internal homogeneity was characterized using an infrared camera and IR
interferometers (index uniformity) to assess if the resulting cooling rate impacted the presence of
visible striae. Additionally, these same samples were measured for refractive index uniformity at
the University of Rochester by the Moore Research Group to more directly quantify the impact of
cooling rate on a commercially relevant metric, within melt index uniformity. High quality optical
glass has a maximum peak-to-valley refractive index variation of 2 x 10⁻⁶ after extensive
annealing.48 While not needed for the present application, index changes induced by formation of
crystal phases must be greater than the index non-uniformity throughout the slice of glass in order
to be detectable. Hence, an index variation of ~ 10-3, at minimum, would be required for this
characterization.
The index uniformity measurements at University of Rochester were performed on a Mach-
Zehnder interferometer at 4.5905 µm. The absolute refractive index at University of Rochester
was measured on their Sagnac interferometer at 4.5905 µm. The Sagnac interferometer measures
the deviation of the beam as it passes through the sample at different angles. These deviation
measurements were then used to calculate the refractive index. Sources of error for these
measurements come from poor surface quality of the test specimen, nonparallel sides, and severe
internal striae as observed by imaging with a FLIR camera or interferometry. A detailed summary

31
of the specifications of sample shape and quality for these measurements can be found in Appendix
B and Appendix C for reference.
32
CHAPTER FOUR: RESULTS AND DISCUSSION
This chapter presents the results of the base glass properties, the crystallization behavior of the
glasses, a discussion on selecting glass-ceramic heat-treatment protocols, the effects of quench rate
on properties, the effects of scale-up on the glass, and the glass-ceramic properties.
Base Glass Properties
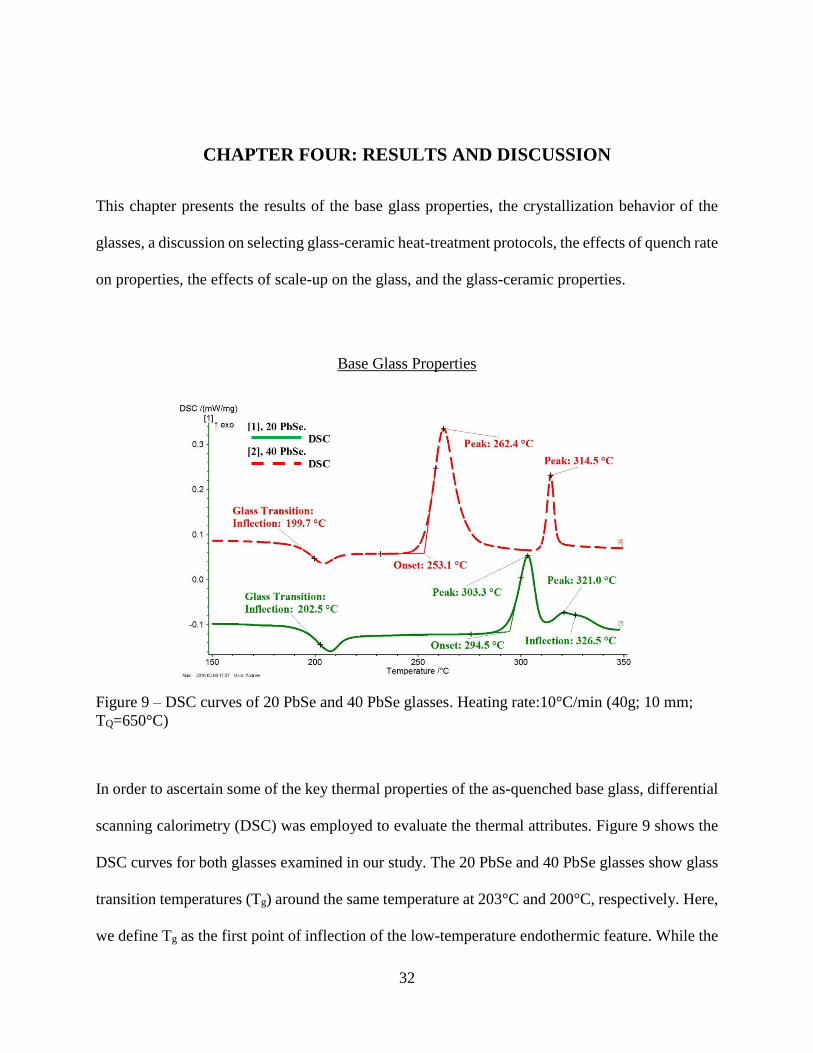
Figure 9 – DSC curves of 20 PbSe and 40 PbSe glasses. Heating rate:10°C/min (40g; 10 mm;
TQ=650°C)
In order to ascertain some of the key thermal properties of the as-quenched base glass, differential
scanning calorimetry (DSC) was employed to evaluate the thermal attributes. Figure 9 shows the
DSC curves for both glasses examined in our study. The 20 PbSe and 40 PbSe glasses show glass
transition temperatures (Tg) around the same temperature at 203°C and 200°C, respectively. Here,
we define Tg as the first point of inflection of the low-temperature endothermic feature. While the
33
Tg of the two glasses are similar, the crystallization features of the two glasses are very different.
As can be seen, the 40 PbSe glass shows two distinct crystallization features with the onset of
crystallization beginning at Tx = 253°C and two peak crystallization temperatures at 262°C and
315°C. The 20 PbSe glass shows one distinct crystallization peak followed by an asymmetric peak
made of at least two crystallization features. The onset of crystallization for 20 PbSe is at 295°C
with peak crystallization rates at 303°C, 321°, and 327°C for the three crystallization features.
The thermal stability of the glasses examined, ΔT, is defined as ΔT=Tx-Tg. As ΔT increases, the
more thermally stable the glass phase is and the less likely it is to crystallize. The ΔT values for
the first crystallization peak in each of the 20 PbSe and 40 PbSe are 92°C and 53.4°C, respectively.
The lower thermal stability of the high Pb glass is consistent with the observations by Xia et al,24
in that they propose that Pb compounds act as a nucleating agent within the glass matrix; making
it easier to crystallize. As the Pb-rich phase is in droplets for the 20 PbSe glass and in the matrix
for the 40 PbSe material, the relative volume fraction of these poor crystallization stability phases
will be markedly different and we may expect to see differences in both starting droplet-matrix
composition and the subsequently formed, crystalline phases.
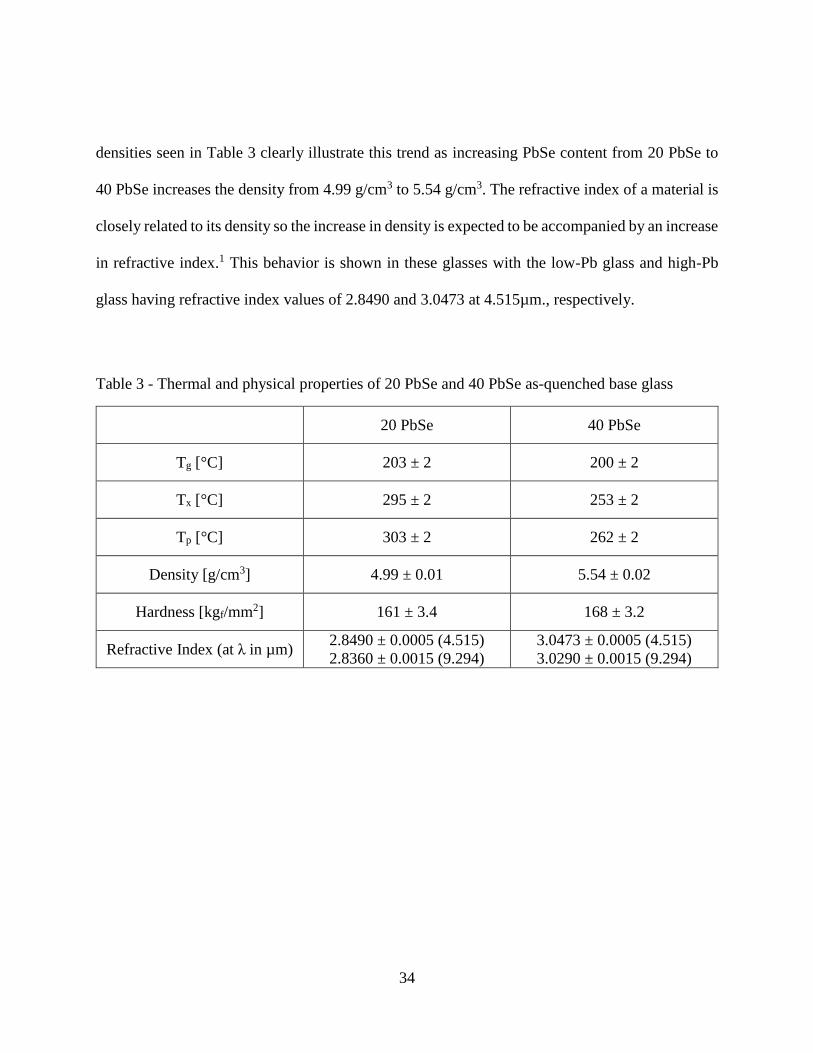
Table 3 shows some of the thermal properties of the base 20 PbSe and 40 PbSe glasses, with the
error of the measurements shown. In addition to acting as a nucleating agent during crystallization,
the large Pb atoms and their presence in higher concentrations in the 40 PbSe base glass, can be
seen to affect the glass properties in several ways. Firstly, the Pb content increases the density as
more and more Pb atoms are stuffed into the free volume of the glass network. The measured
34
densities seen in Table 3 clearly illustrate this trend as increasing PbSe content from 20 PbSe to
40 PbSe increases the density from 4.99 g/cm3 to 5.54 g/cm3. The refractive index of a material is
closely related to its density so the increase in density is expected to be accompanied by an increase
in refractive index.1 This behavior is shown in these glasses with the low-Pb glass and high-Pb
glass having refractive index values of 2.8490 and 3.0473 at 4.515µm., respectively.
Table 3 - Thermal and physical properties of 20 PbSe and 40 PbSe as-quenched base glass
20 PbSe 40 PbSe
Tg [°C] 203 ± 2 200 ± 2
Tx [°C] 295 ± 2 253 ± 2
Tp [°C] 303 ± 2 262 ± 2
Density [g/cm3] 4.99 ± 0.01 5.54 ± 0.02
Hardness [kgf/mm2] 161 ± 3.4 168 ± 3.2
Refractive Index (at λ in µm) 2.8490 ± 0.0005 (4.515)
2.8360 ± 0.0015 (9.294)
3.0473 ± 0.0005 (4.515)
3.0290 ± 0.0015 (9.294)
35
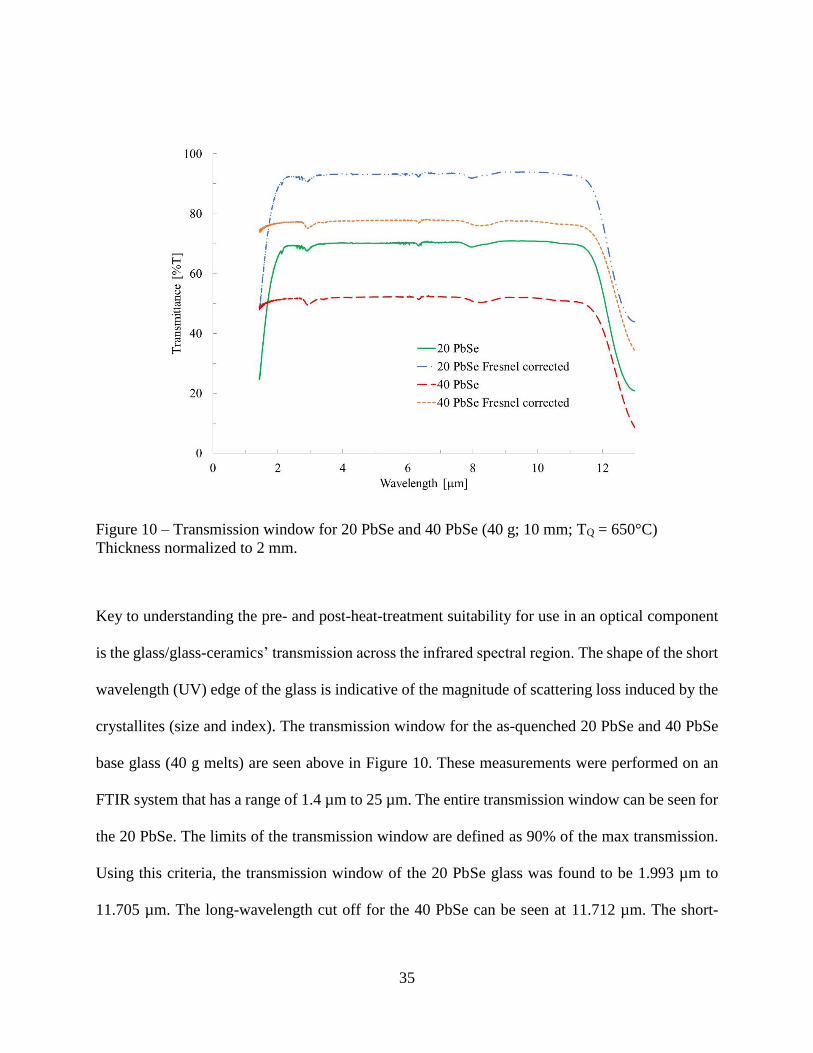
Figure 10 – Transmission window for 20 PbSe and 40 PbSe (40 g; 10 mm; TQ = 650°C)
Thickness normalized to 2 mm.
Key to understanding the pre- and post-heat-treatment suitability for use in an optical component
is the glass/glass-ceramics’ transmission across the infrared spectral region. The shape of the short
wavelength (UV) edge of the glass is indicative of the magnitude of scattering loss induced by the
crystallites (size and index). The transmission window for the as-quenched 20 PbSe and 40 PbSe
base glass (40 g melts) are seen above in Figure 10. These measurements were performed on an
FTIR system that has a range of 1.4 µm to 25 µm. The entire transmission window can be seen for
the 20 PbSe. The limits of the transmission window are defined as 90% of the max transmission.
Using this criteria, the transmission window of the 20 PbSe glass was found to be 1.993 µm to
11.705 µm. The long-wavelength cut off for the 40 PbSe can be seen at 11.712 µm. The short-
36
wavelength cutoff is below the range for the FTIR and can be seen below in UV-Vis-NIR figure
and the short-wavelength cutoff is 1.319 µm.
The desired application for these glasses requires transmission in the 3 to 5 µm range. As can be
seen, both of these glasses show good transmission over these ranges. The observed tail associated
with the rapid quench of this small melt, cannot be assumed to be observed in larger melts that
possess higher thermal mass and require slower cooling rates to avoid thermal shock and to ensure
high optical homogeneity. Here, high homogeneity was not a primary objective of our study, but
rather, the optical properties of the starting material and how this relates to the as-quenched
morphology.
Larger melts will cool more slowly leading to larger, as-quenched droplets of the secondary,
amorphous phase. While the glass remains amorphous, the index difference and size of the droplets
will impact the sharpness (steepness) of the short wavelength edge for the glass. Crystallizing these
glasses will cause the short-wavelength edge to shift to higher wavelengths due to the formation
of scattering crystallites of different refractive index. As long as these crystallites remain below
the 1/10 of the wavelength of light, the scattering tail is acceptable. It is important to be careful
not to crystallize the glass too much as this might ruin the transmission.
37
Figure 11 –Short-wavelength cutoff for 20 PbSe and 40 PbSe (40 g; 10 mm; TQ = 650°C)
Thickness normalized to 2 mm. Not corrected for Fresnel losses.
As mentioned above, the short-wavelength cut-off in transmission is strongly tied to scattering
effects which result from phase inhomogeneities and the presence of multiple phases with different
refractive indices present within the as-quenched or heat-treated (crystallized) material in the form
of phase-separated droplets, crystallites, embedded particles (impurities), or striae. The GeSe2 –
As2Se3 – PbSe glass system has shown the presence of droplet-matrix phase separation in the as-
quenched glass as quantified by both transmission measurements and electron microscopy. The
droplets act as scattering centers that limit the low-wavelength transmission of the glasses. As the
size and number of these scattering centers increase the low-wavelength cut-off of the glass will
shift to higher wavelengths. If the scattering centers remain small in size, then the scattering effect
38
will be negligible. Since the low-wavelength cuff-off of the 20 PbSe is higher than the 40 PbSe
glass, the 20 PbSe glass should have larger droplets than the 40 PbSe glass.
Figure 12 – TEM image and XEDS mapping of base 20 PbSe glass (40 g; 10 mm; TQ = 650°C)
The TEM images of the base 20 PbSe glass, seen in Figure 12, show droplet-matrix phase
separation in the glass matrix. The droplets are approximately 100 to 130 nm in size and the XEDS
mapping shows that they are Pb-rich. Of the four elements that comprise this glass, only the Pb
component shows any preference for phase segregation. This leads to Pb-rich droplets and a Pb-
deficient matrix. As previously mentioned, the Pb is expected to promote crystal growth. For the
20 PbSe glass, subsequent heat-treatments of the Pb rich droplets should yield Pb-rich crystals in
a Pb-deficient glassy matrix. Figure 13 shows quantitative compositional information of the
39
droplet and the matrix for the 20 PbSe glass. The XEDS line scan shows that the as-batched 5 at%
Pb in the 20 PbSe glass disperses in both the droplets and matrix but is larger in the Pb-rich droplet
phase. As seen, XEDS shows the Pb content to be ~ 7 at% in the matrix and peaks at ~ 18 at% in
the droplets. The line scan also shows a slight decrease in the As and Ge in the droplets, suggesting
a Pb rich glass composition. This localized decrease in As and Ge is not obvious in the color-
coded, elemental mapping seen in Figure 12.
Figure 13 – XEDS line scan across droplet-matrix phase boundaries for base 20 PbSe glass (40
g; 10 mm; TQ = 650°C). Error is approximately ± 1 at%.
Rel
ativ
e at
om
ic p
erce
nta
ge
(%)
Se
As
Pb
Ge
40
Figure 14 - TEM image and XEDS mapping of base 40 PbSe glass (40 g; 10 mm; TQ = 650°C)
While the 20 PbSe glass showed Pb-rich droplets in a Pb-deficient matrix, the TEM images from
the 40 PbSe glass, seen in Figure 14, clearly show the presence of Pb-deficient droplets in a Pb-
rich matrix. In addition to the change in compositional morphology, the droplets in the 40 PbSe
glass were found to be measurably smaller than those seen in the 20 PbSe glass. The 40 PbSe
droplets were found to be approximately 35 to 45 nm in diameter as compared to 100 to 130 nm
in the 20 PbSe glass. The size difference is likely due to their positions relative to the immiscibility
dome. Since the 40 PbSe glass is closer to the edge of the immiscibility dome, the lever rule
41
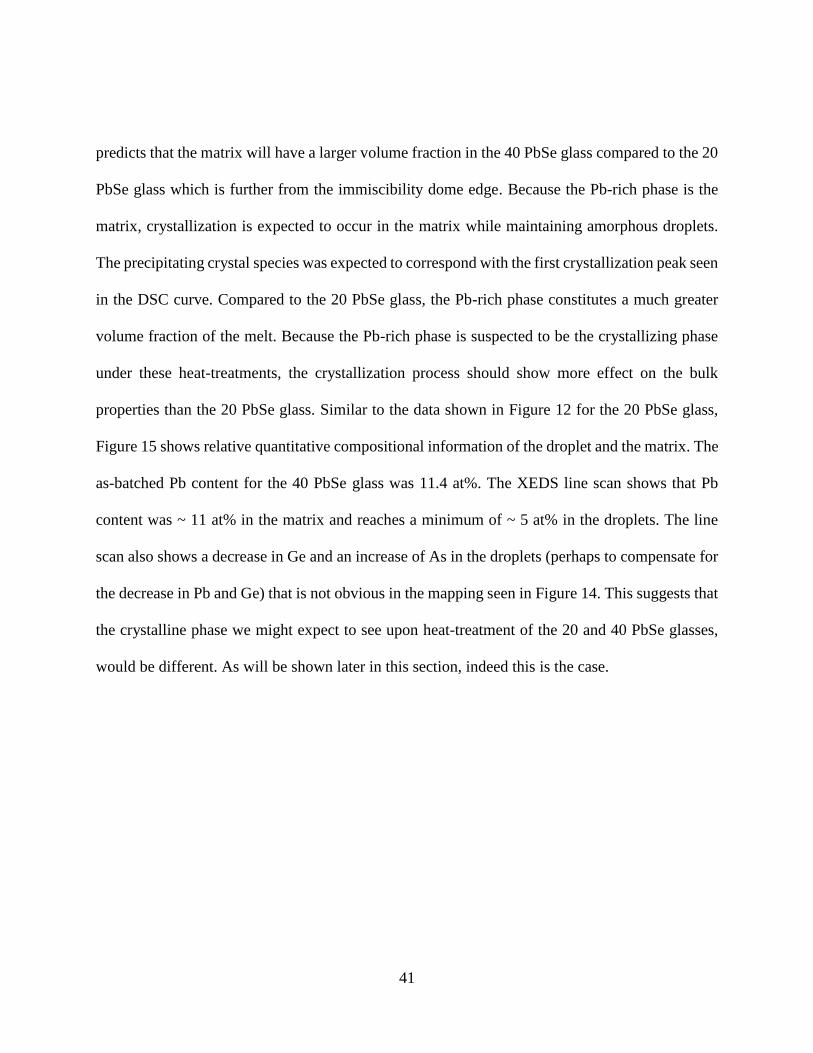
predicts that the matrix will have a larger volume fraction in the 40 PbSe glass compared to the 20
PbSe glass which is further from the immiscibility dome edge. Because the Pb-rich phase is the
matrix, crystallization is expected to occur in the matrix while maintaining amorphous droplets.
The precipitating crystal species was expected to correspond with the first crystallization peak seen
in the DSC curve. Compared to the 20 PbSe glass, the Pb-rich phase constitutes a much greater
volume fraction of the melt. Because the Pb-rich phase is suspected to be the crystallizing phase
under these heat-treatments, the crystallization process should show more effect on the bulk
properties than the 20 PbSe glass. Similar to the data shown in Figure 12 for the 20 PbSe glass,
Figure 15 shows relative quantitative compositional information of the droplet and the matrix. The
as-batched Pb content for the 40 PbSe glass was 11.4 at%. The XEDS line scan shows that Pb
content was ~ 11 at% in the matrix and reaches a minimum of ~ 5 at% in the droplets. The line
scan also shows a decrease in Ge and an increase of As in the droplets (perhaps to compensate for
the decrease in Pb and Ge) that is not obvious in the mapping seen in Figure 14. This suggests that
the crystalline phase we might expect to see upon heat-treatment of the 20 and 40 PbSe glasses,
would be different. As will be shown later in this section, indeed this is the case.
42
Figure 15 - XEDS line scan across droplet-matrix phase boundaries for base 40 PbSe glass (40 g;
10 mm; TQ = 650°C). Error is approximately ± 1 at%.
Figure 16 – XRD pattern of base 20 PbSe glass powder
Pb
Se
As
Ge
Rel
ativ
e at
om
ic p
erce
nta
ge
(%)
Cou
nts
Diffraction Angle (2θ)
43
To confirm that the as-quenched glasses are indeed amorphous and to assess the resulting
crystalline phases imparted by post-thermal heat-treatments, X-ray Diffraction was used on
powder samples of both glasses. Figure 16 and Figure 17 show the XRD patterns for the base 20
PbSe and 40 PbSe glasses, respectively. Both glasses show three broad amorphous humps. The
three amorphous humps are located with peaks around 17°, 31°, and 53°. The lack of sharp peaks
in these figures indicate that there were no measurable crystals located in the as-quenched glass.
This was supported by the TEM measurements that also detected no crystals in the base glass.
Figure 17 – XRD pattern of base 40 PbSe glass powder
Activation Energy of Crystallization
The base DSC runs of the 20 PbSe and 40 PbSe glasses showed that the thermal stability, ΔT, of
the 40 PbSe glass was lower than the 20 PbSe. It was expected that the main crystal phase of the
40 PbSe glass would have a lower activation energy than the main 20 PbSe crystal peak because
Cou
nts
Diffraction Angle (2θ)
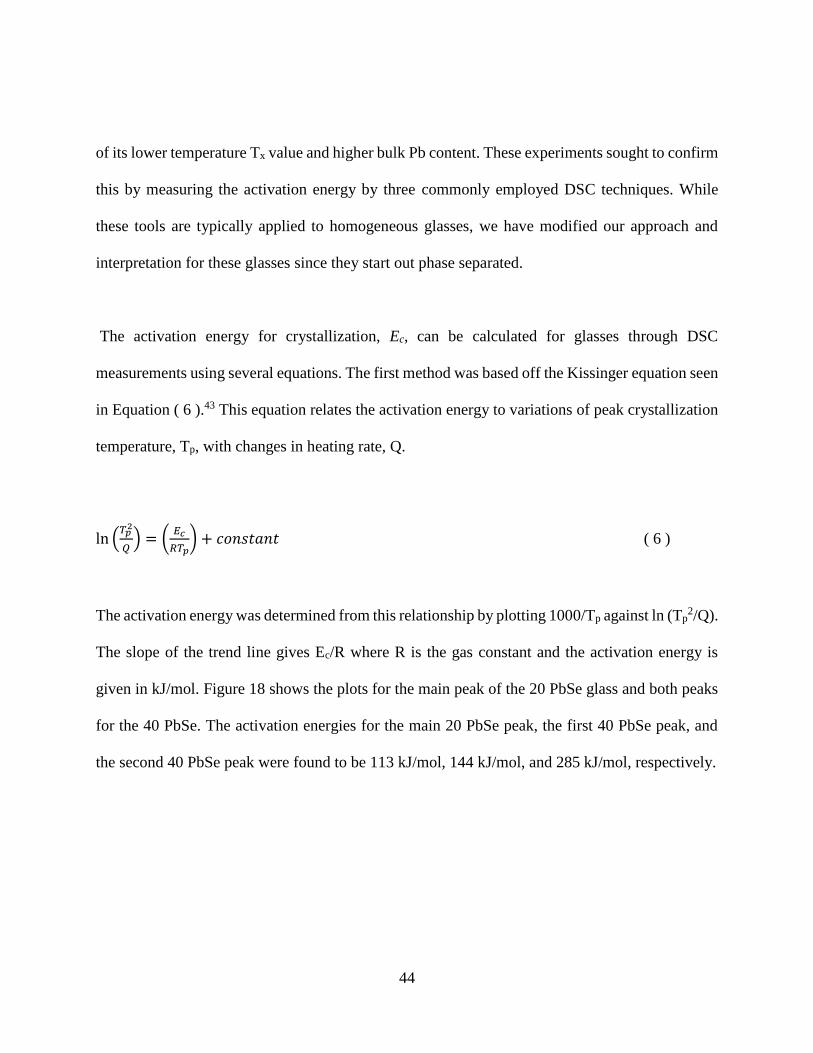
44
of its lower temperature Tx value and higher bulk Pb content. These experiments sought to confirm
this by measuring the activation energy by three commonly employed DSC techniques. While
these tools are typically applied to homogeneous glasses, we have modified our approach and
interpretation for these glasses since they start out phase separated.
The activation energy for crystallization, Ec, can be calculated for glasses through DSC
measurements using several equations. The first method was based off the Kissinger equation seen
in Equation ( 6 ).43 This equation relates the activation energy to variations of peak crystallization
temperature, Tp, with changes in heating rate, Q.
ln (𝑇𝑝
2
𝑄) = (
𝐸𝑐
𝑅𝑇𝑝) + 𝑐𝑜𝑛𝑠𝑡𝑎𝑛𝑡 ( 6 )
The activation energy was determined from this relationship by plotting 1000/Tp against ln (Tp2/Q).
The slope of the trend line gives Ec/R where R is the gas constant and the activation energy is
given in kJ/mol. Figure 18 shows the plots for the main peak of the 20 PbSe glass and both peaks
for the 40 PbSe. The activation energies for the main 20 PbSe peak, the first 40 PbSe peak, and
the second 40 PbSe peak were found to be 113 kJ/mol, 144 kJ/mol, and 285 kJ/mol, respectively.
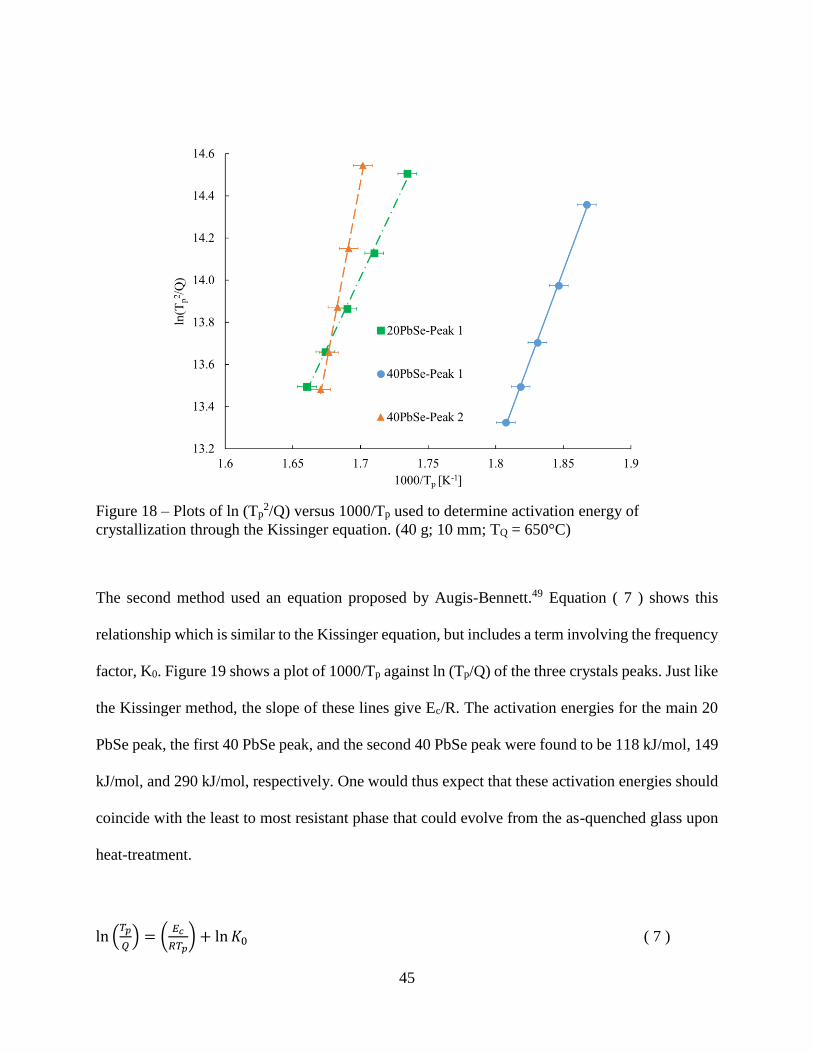
45
Figure 18 – Plots of ln (Tp2/Q) versus 1000/Tp used to determine activation energy of
crystallization through the Kissinger equation. (40 g; 10 mm; TQ = 650°C)
The second method used an equation proposed by Augis-Bennett.49 Equation ( 7 ) shows this
relationship which is similar to the Kissinger equation, but includes a term involving the frequency
factor, K0. Figure 19 shows a plot of 1000/Tp against ln (Tp/Q) of the three crystals peaks. Just like
the Kissinger method, the slope of these lines give Ec/R. The activation energies for the main 20
PbSe peak, the first 40 PbSe peak, and the second 40 PbSe peak were found to be 118 kJ/mol, 149
kJ/mol, and 290 kJ/mol, respectively. One would thus expect that these activation energies should
coincide with the least to most resistant phase that could evolve from the as-quenched glass upon
heat-treatment.
ln (𝑇𝑝
𝑄) = (
𝐸𝑐
𝑅𝑇𝑝) + ln 𝐾0 ( 7 )
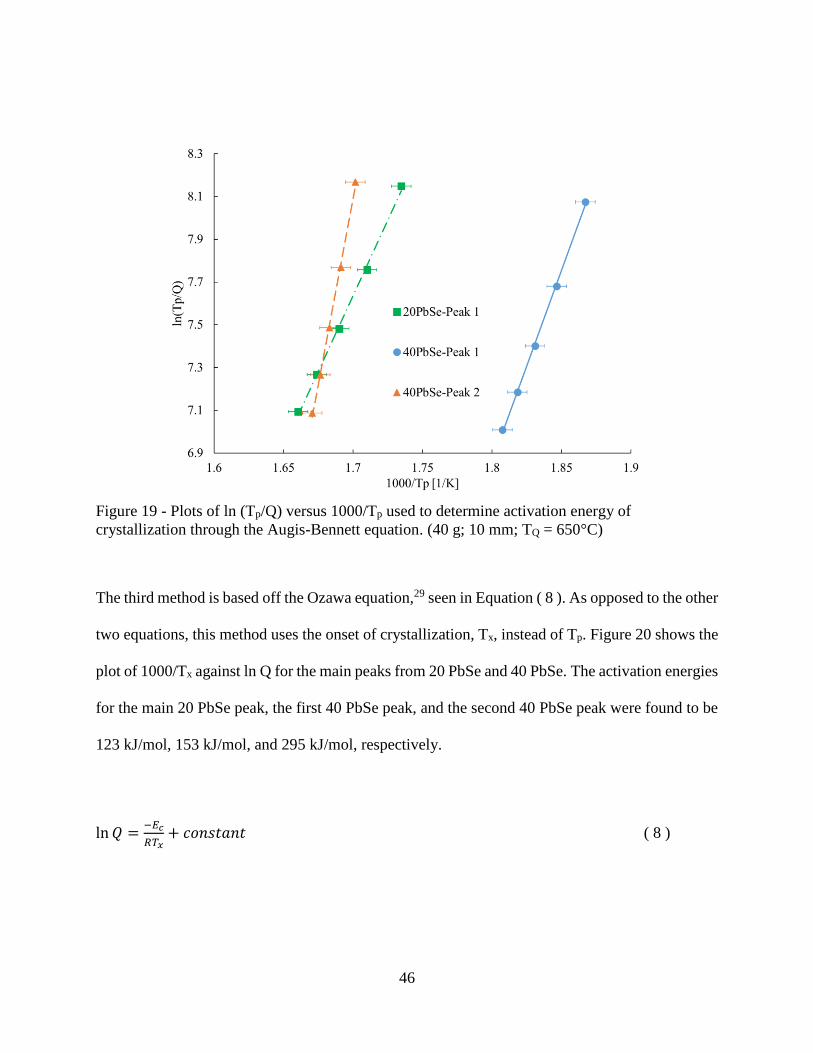
46
Figure 19 - Plots of ln (Tp/Q) versus 1000/Tp used to determine activation energy of
crystallization through the Augis-Bennett equation. (40 g; 10 mm; TQ = 650°C)
The third method is based off the Ozawa equation,29 seen in Equation ( 8 ). As opposed to the other
two equations, this method uses the onset of crystallization, Tx, instead of Tp. Figure 20 shows the
plot of 1000/Tx against ln Q for the main peaks from 20 PbSe and 40 PbSe. The activation energies
for the main 20 PbSe peak, the first 40 PbSe peak, and the second 40 PbSe peak were found to be
123 kJ/mol, 153 kJ/mol, and 295 kJ/mol, respectively.
ln 𝑄 =−𝐸𝑐
𝑅𝑇𝑥+ 𝑐𝑜𝑛𝑠𝑡𝑎𝑛𝑡 ( 8 )
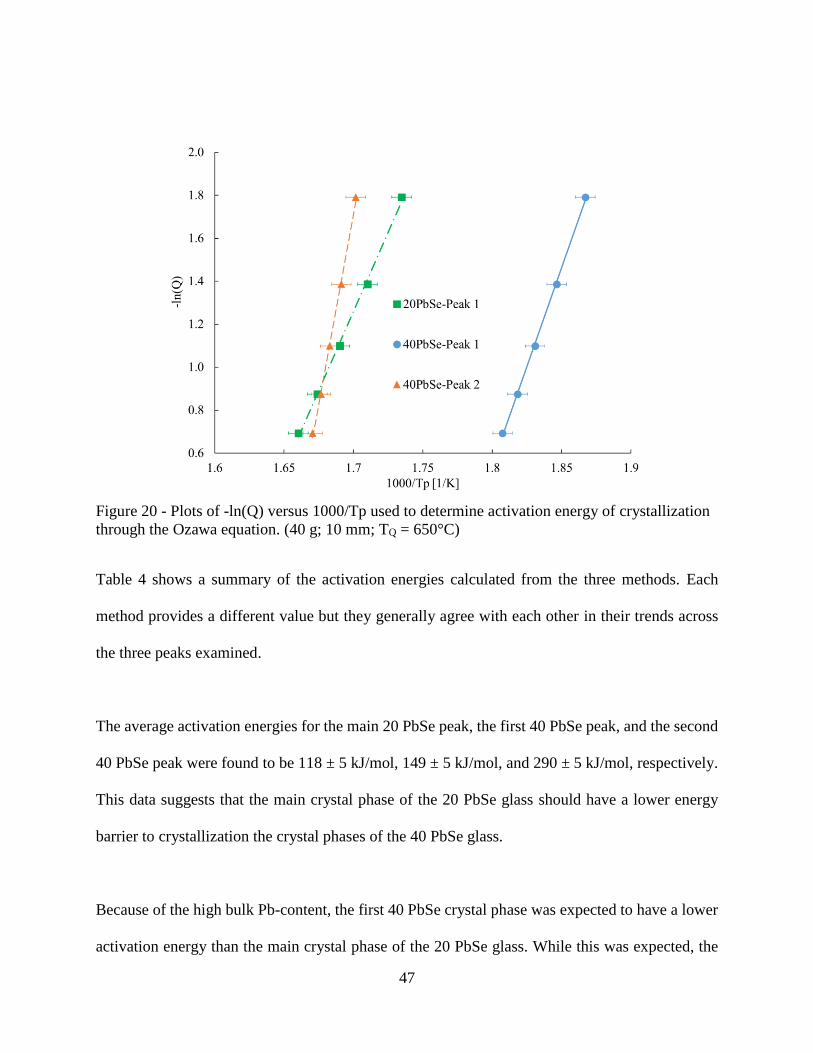
47
Figure 20 - Plots of -ln(Q) versus 1000/Tp used to determine activation energy of crystallization
through the Ozawa equation. (40 g; 10 mm; TQ = 650°C)
Table 4 shows a summary of the activation energies calculated from the three methods. Each
method provides a different value but they generally agree with each other in their trends across
the three peaks examined.
The average activation energies for the main 20 PbSe peak, the first 40 PbSe peak, and the second
40 PbSe peak were found to be 118 ± 5 kJ/mol, 149 ± 5 kJ/mol, and 290 ± 5 kJ/mol, respectively.
This data suggests that the main crystal phase of the 20 PbSe glass should have a lower energy
barrier to crystallization the crystal phases of the 40 PbSe glass.
Because of the high bulk Pb-content, the first 40 PbSe crystal phase was expected to have a lower
activation energy than the main crystal phase of the 20 PbSe glass. While this was expected, the
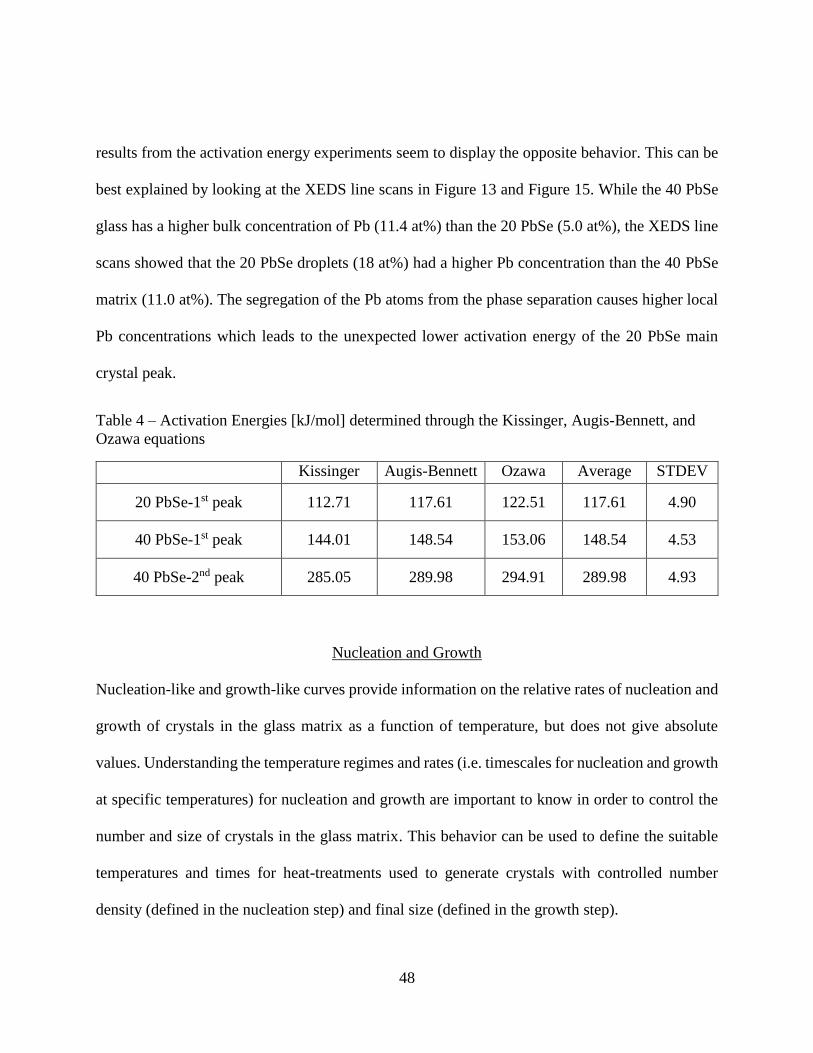
48
results from the activation energy experiments seem to display the opposite behavior. This can be
best explained by looking at the XEDS line scans in Figure 13 and Figure 15. While the 40 PbSe
glass has a higher bulk concentration of Pb (11.4 at%) than the 20 PbSe (5.0 at%), the XEDS line
scans showed that the 20 PbSe droplets (18 at%) had a higher Pb concentration than the 40 PbSe
matrix (11.0 at%). The segregation of the Pb atoms from the phase separation causes higher local
Pb concentrations which leads to the unexpected lower activation energy of the 20 PbSe main
crystal peak.
Table 4 – Activation Energies [kJ/mol] determined through the Kissinger, Augis-Bennett, and
Ozawa equations
Kissinger Augis-Bennett Ozawa Average STDEV
20 PbSe-1st peak 112.71 117.61 122.51 117.61 4.90
40 PbSe-1st peak 144.01 148.54 153.06 148.54 4.53
40 PbSe-2nd peak 285.05 289.98 294.91 289.98 4.93
Nucleation and Growth
Nucleation-like and growth-like curves provide information on the relative rates of nucleation and
growth of crystals in the glass matrix as a function of temperature, but does not give absolute
values. Understanding the temperature regimes and rates (i.e. timescales for nucleation and growth
at specific temperatures) for nucleation and growth are important to know in order to control the
number and size of crystals in the glass matrix. This behavior can be used to define the suitable
temperatures and times for heat-treatments used to generate crystals with controlled number
density (defined in the nucleation step) and final size (defined in the growth step).
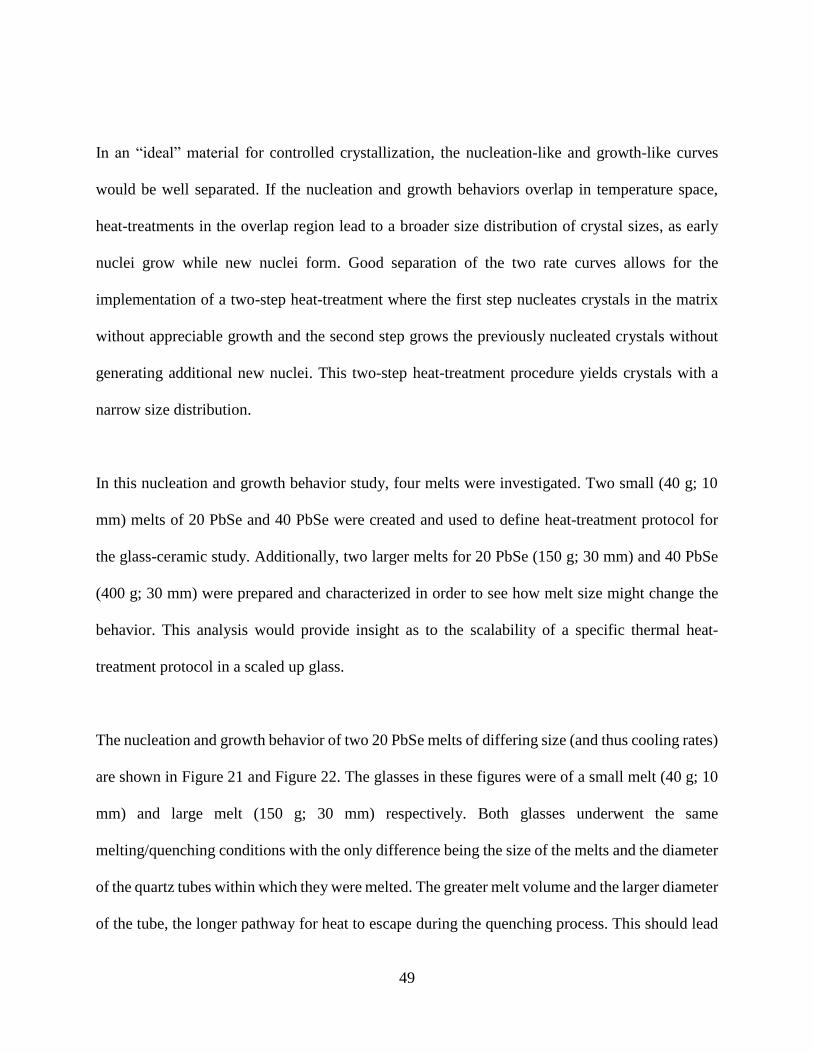
49
In an “ideal” material for controlled crystallization, the nucleation-like and growth-like curves
would be well separated. If the nucleation and growth behaviors overlap in temperature space,
heat-treatments in the overlap region lead to a broader size distribution of crystal sizes, as early
nuclei grow while new nuclei form. Good separation of the two rate curves allows for the
implementation of a two-step heat-treatment where the first step nucleates crystals in the matrix
without appreciable growth and the second step grows the previously nucleated crystals without
generating additional new nuclei. This two-step heat-treatment procedure yields crystals with a
narrow size distribution.
In this nucleation and growth behavior study, four melts were investigated. Two small (40 g; 10
mm) melts of 20 PbSe and 40 PbSe were created and used to define heat-treatment protocol for
the glass-ceramic study. Additionally, two larger melts for 20 PbSe (150 g; 30 mm) and 40 PbSe
(400 g; 30 mm) were prepared and characterized in order to see how melt size might change the
behavior. This analysis would provide insight as to the scalability of a specific thermal heat-
treatment protocol in a scaled up glass.
The nucleation and growth behavior of two 20 PbSe melts of differing size (and thus cooling rates)
are shown in Figure 21 and Figure 22. The glasses in these figures were of a small melt (40 g; 10
mm) and large melt (150 g; 30 mm) respectively. Both glasses underwent the same
melting/quenching conditions with the only difference being the size of the melts and the diameter
of the quartz tubes within which they were melted. The greater melt volume and the larger diameter
of the tube, the longer pathway for heat to escape during the quenching process. This should lead
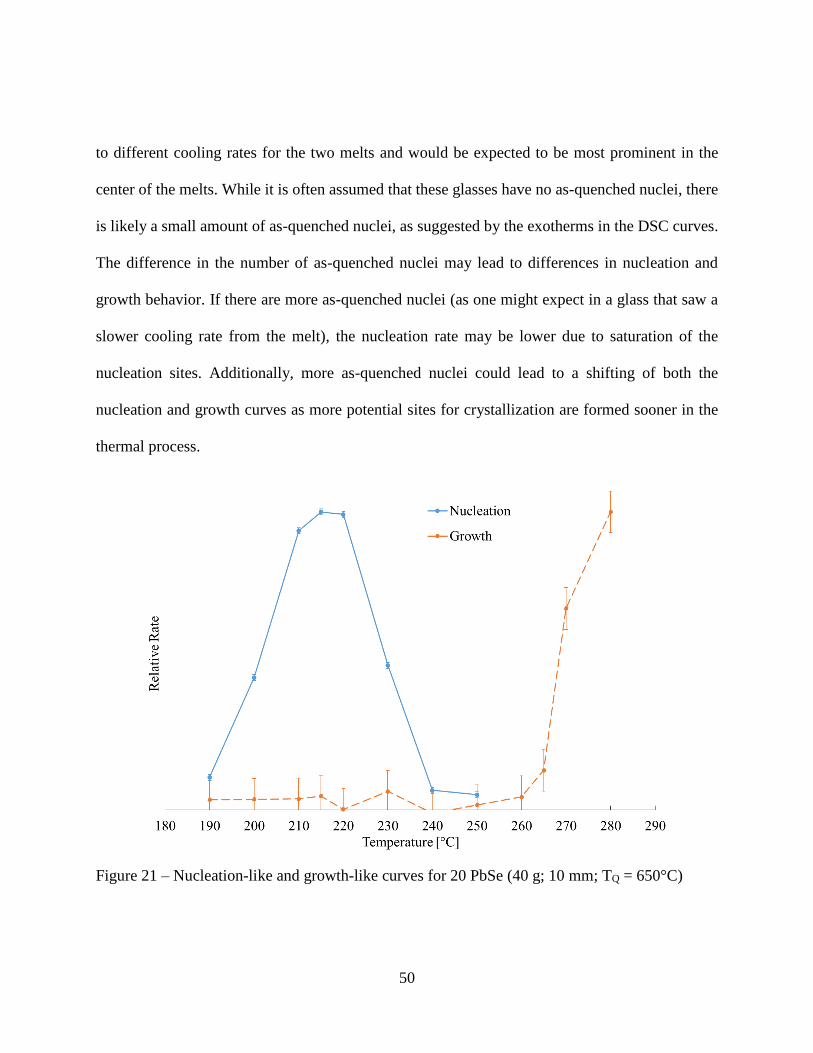
50
to different cooling rates for the two melts and would be expected to be most prominent in the
center of the melts. While it is often assumed that these glasses have no as-quenched nuclei, there
is likely a small amount of as-quenched nuclei, as suggested by the exotherms in the DSC curves.
The difference in the number of as-quenched nuclei may lead to differences in nucleation and
growth behavior. If there are more as-quenched nuclei (as one might expect in a glass that saw a
slower cooling rate from the melt), the nucleation rate may be lower due to saturation of the
nucleation sites. Additionally, more as-quenched nuclei could lead to a shifting of both the
nucleation and growth curves as more potential sites for crystallization are formed sooner in the
thermal process.
Figure 21 – Nucleation-like and growth-like curves for 20 PbSe (40 g; 10 mm; TQ = 650°C)
51
As seen in Figure 21 and Figure 22, the nucleation rates of both large and small melts show similar
behavior with their maxima nucleation in the 215°C – 220°C range and the nucleation regime
between 190°C and 240°C. This suggests that in the lower PbSe containing glass, the concentration
of as-quenched nuclei is likely similar. The growth behavior is also similar, but the large melt
shows higher growth rates over the 260°C to 270°C range compared to the smaller 40g melt,
reaching its maximum measurable growth rate at 270°C as opposed to the small melt which reaches
its maximum measureable growth rate at 280°C. This can likely be explained by the presence of a
larger number of as-quenched nuclei in the large melt which would be expected to cool more
slowly due to its larger volume. With more nuclei, there are more sites for subsequent crystal
growth which increases the rate at which the volume fraction of crystals reaches the saturation
point. Here, the saturation point is defined as the point where the material no longer shows signs
of further crystallization, likely due to a consumption of species required for the crystal phase to
form/further grow. This happens when there is no longer any of these constituents in the (nearby)
residual glass phase to crystallize, or the migration distance is too far for that species to travel, or
the residual glass phase becomes stable once depleted of crystal-forming constituents as compared
to the crystal of interest.
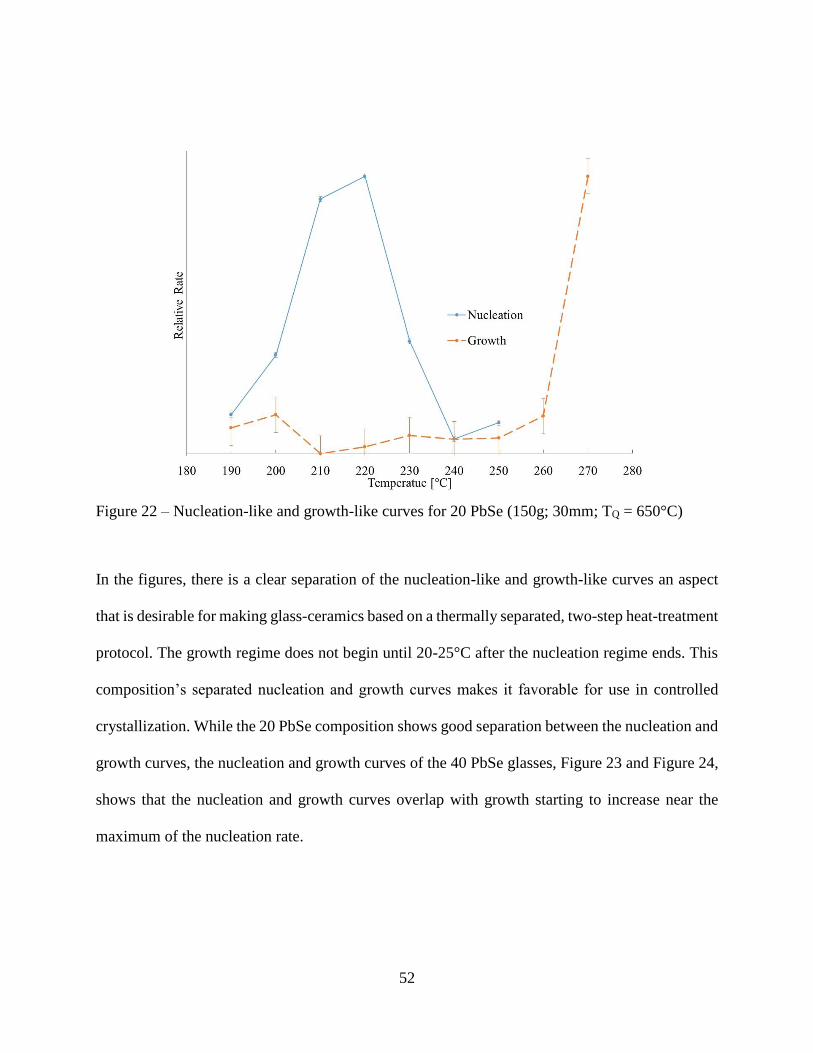
52
Figure 22 – Nucleation-like and growth-like curves for 20 PbSe (150g; 30mm; TQ = 650°C)
In the figures, there is a clear separation of the nucleation-like and growth-like curves an aspect
that is desirable for making glass-ceramics based on a thermally separated, two-step heat-treatment
protocol. The growth regime does not begin until 20-25°C after the nucleation regime ends. This
composition’s separated nucleation and growth curves makes it favorable for use in controlled
crystallization. While the 20 PbSe composition shows good separation between the nucleation and
growth curves, the nucleation and growth curves of the 40 PbSe glasses, Figure 23 and Figure 24,
shows that the nucleation and growth curves overlap with growth starting to increase near the
maximum of the nucleation rate.
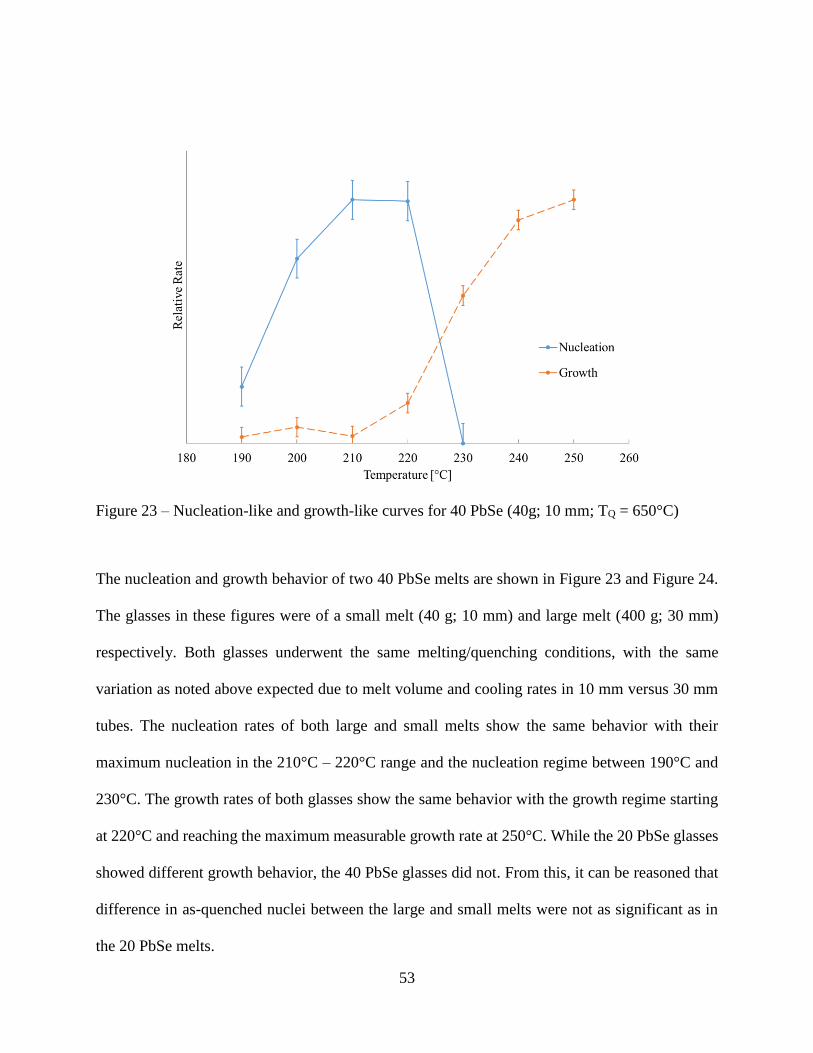
53
Figure 23 – Nucleation-like and growth-like curves for 40 PbSe (40g; 10 mm; TQ = 650°C)
The nucleation and growth behavior of two 40 PbSe melts are shown in Figure 23 and Figure 24.
The glasses in these figures were of a small melt (40 g; 10 mm) and large melt (400 g; 30 mm)
respectively. Both glasses underwent the same melting/quenching conditions, with the same
variation as noted above expected due to melt volume and cooling rates in 10 mm versus 30 mm
tubes. The nucleation rates of both large and small melts show the same behavior with their
maximum nucleation in the 210°C – 220°C range and the nucleation regime between 190°C and
230°C. The growth rates of both glasses show the same behavior with the growth regime starting
at 220°C and reaching the maximum measurable growth rate at 250°C. While the 20 PbSe glasses
showed different growth behavior, the 40 PbSe glasses did not. From this, it can be reasoned that
difference in as-quenched nuclei between the large and small melts were not as significant as in
the 20 PbSe melts.
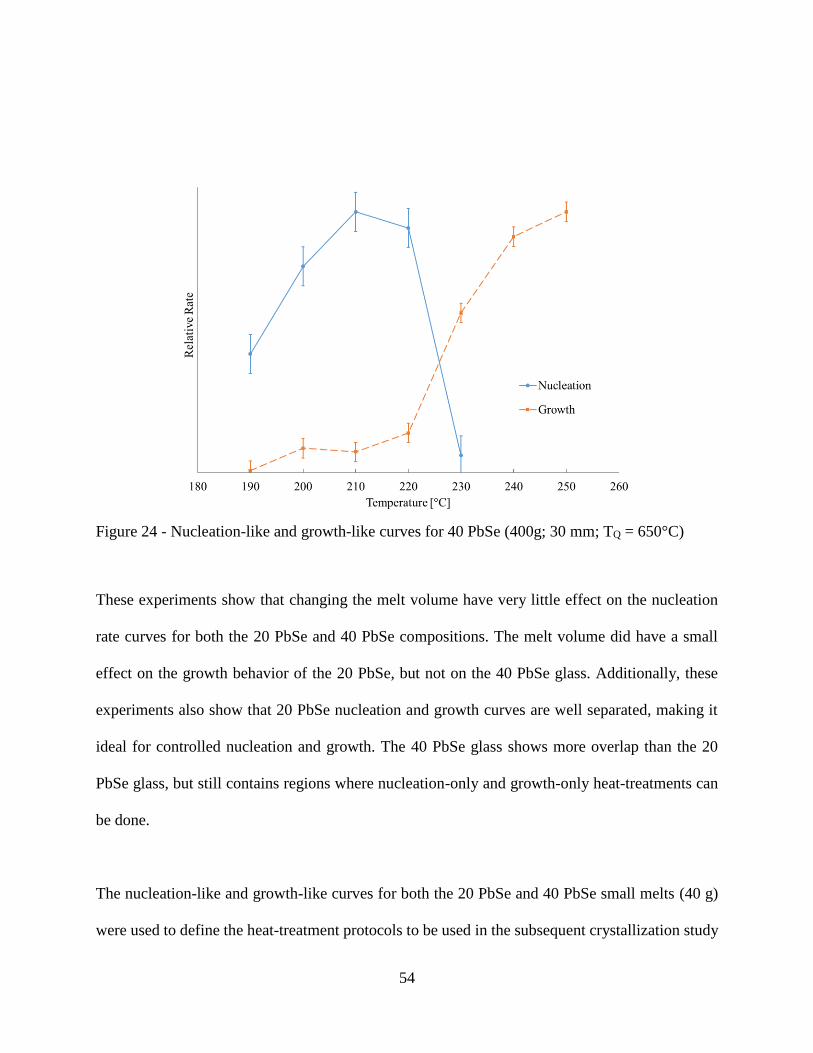
54
Figure 24 - Nucleation-like and growth-like curves for 40 PbSe (400g; 30 mm; TQ = 650°C)
These experiments show that changing the melt volume have very little effect on the nucleation
rate curves for both the 20 PbSe and 40 PbSe compositions. The melt volume did have a small
effect on the growth behavior of the 20 PbSe, but not on the 40 PbSe glass. Additionally, these
experiments also show that 20 PbSe nucleation and growth curves are well separated, making it
ideal for controlled nucleation and growth. The 40 PbSe glass shows more overlap than the 20
PbSe glass, but still contains regions where nucleation-only and growth-only heat-treatments can
be done.
The nucleation-like and growth-like curves for both the 20 PbSe and 40 PbSe small melts (40 g)
were used to define the heat-treatment protocols to be used in the subsequent crystallization study
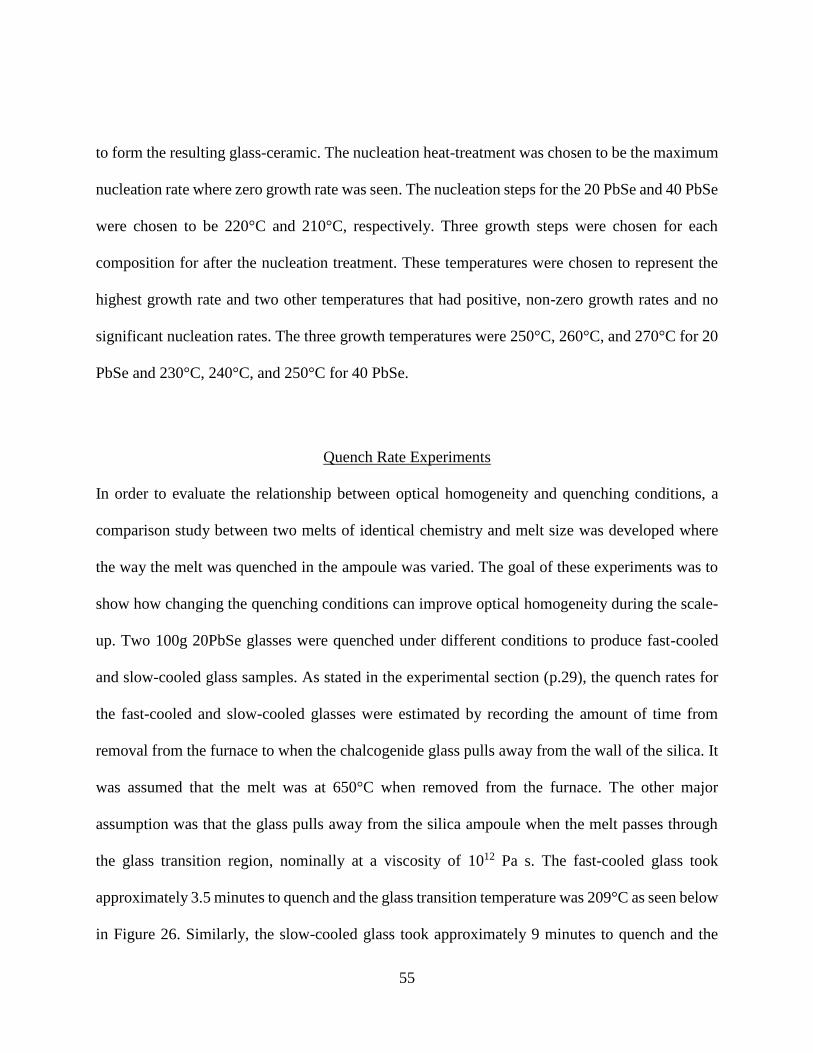
55
to form the resulting glass-ceramic. The nucleation heat-treatment was chosen to be the maximum
nucleation rate where zero growth rate was seen. The nucleation steps for the 20 PbSe and 40 PbSe
were chosen to be 220°C and 210°C, respectively. Three growth steps were chosen for each
composition for after the nucleation treatment. These temperatures were chosen to represent the
highest growth rate and two other temperatures that had positive, non-zero growth rates and no
significant nucleation rates. The three growth temperatures were 250°C, 260°C, and 270°C for 20
PbSe and 230°C, 240°C, and 250°C for 40 PbSe.
Quench Rate Experiments
In order to evaluate the relationship between optical homogeneity and quenching conditions, a
comparison study between two melts of identical chemistry and melt size was developed where
the way the melt was quenched in the ampoule was varied. The goal of these experiments was to
show how changing the quenching conditions can improve optical homogeneity during the scale-
up. Two 100g 20PbSe glasses were quenched under different conditions to produce fast-cooled
and slow-cooled glass samples. As stated in the experimental section (p.29), the quench rates for
the fast-cooled and slow-cooled glasses were estimated by recording the amount of time from
removal from the furnace to when the chalcogenide glass pulls away from the wall of the silica. It
was assumed that the melt was at 650°C when removed from the furnace. The other major
assumption was that the glass pulls away from the silica ampoule when the melt passes through
the glass transition region, nominally at a viscosity of 1012 Pa s. The fast-cooled glass took
approximately 3.5 minutes to quench and the glass transition temperature was 209°C as seen below
in Figure 26. Similarly, the slow-cooled glass took approximately 9 minutes to quench and the
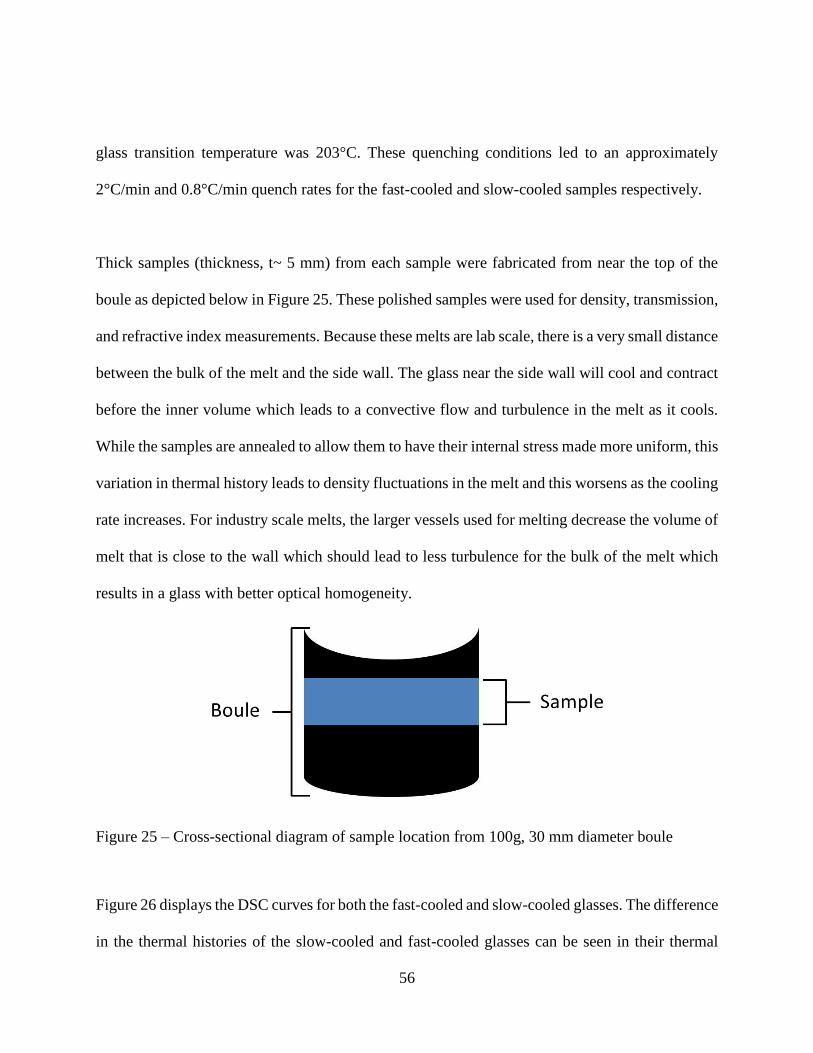
56
glass transition temperature was 203°C. These quenching conditions led to an approximately
2°C/min and 0.8°C/min quench rates for the fast-cooled and slow-cooled samples respectively.
Thick samples (thickness, t~ 5 mm) from each sample were fabricated from near the top of the
boule as depicted below in Figure 25. These polished samples were used for density, transmission,
and refractive index measurements. Because these melts are lab scale, there is a very small distance
between the bulk of the melt and the side wall. The glass near the side wall will cool and contract
before the inner volume which leads to a convective flow and turbulence in the melt as it cools.
While the samples are annealed to allow them to have their internal stress made more uniform, this
variation in thermal history leads to density fluctuations in the melt and this worsens as the cooling
rate increases. For industry scale melts, the larger vessels used for melting decrease the volume of
melt that is close to the wall which should lead to less turbulence for the bulk of the melt which
results in a glass with better optical homogeneity.
Figure 25 – Cross-sectional diagram of sample location from 100g, 30 mm diameter boule
Figure 26 displays the DSC curves for both the fast-cooled and slow-cooled glasses. The difference
in the thermal histories of the slow-cooled and fast-cooled glasses can be seen in their thermal
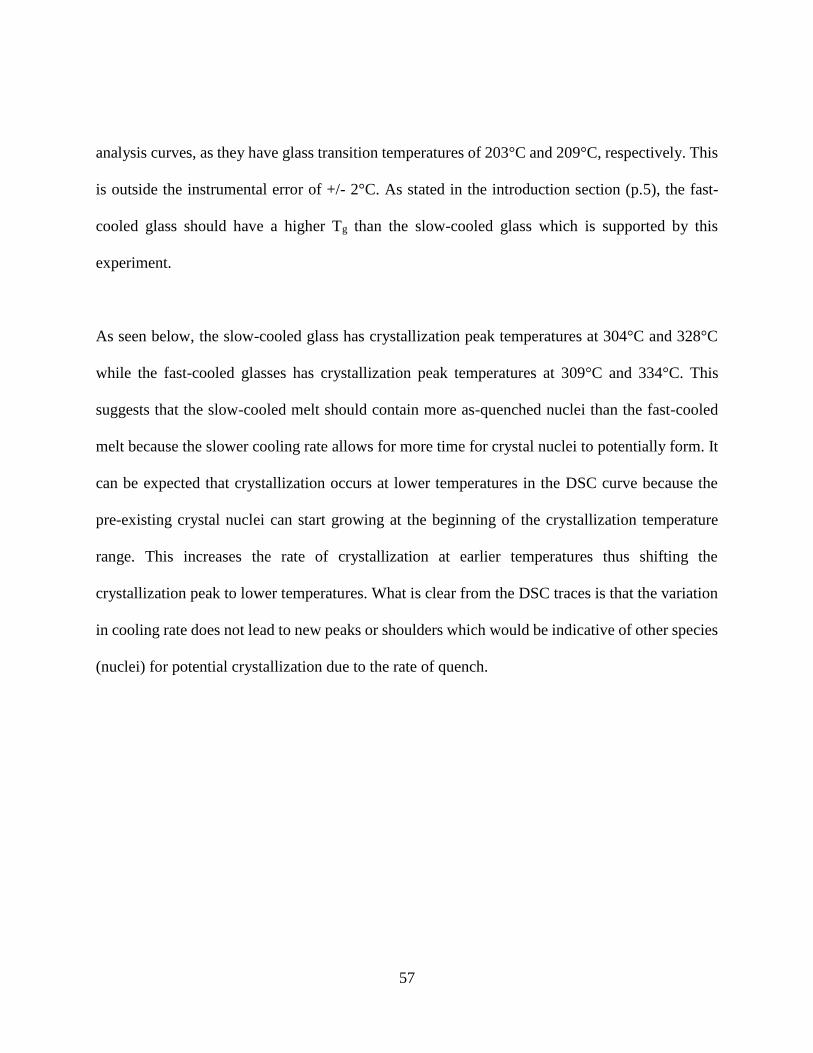
57
analysis curves, as they have glass transition temperatures of 203°C and 209°C, respectively. This
is outside the instrumental error of +/- 2°C. As stated in the introduction section (p.5), the fast-
cooled glass should have a higher Tg than the slow-cooled glass which is supported by this
experiment.
As seen below, the slow-cooled glass has crystallization peak temperatures at 304°C and 328°C
while the fast-cooled glasses has crystallization peak temperatures at 309°C and 334°C. This
suggests that the slow-cooled melt should contain more as-quenched nuclei than the fast-cooled
melt because the slower cooling rate allows for more time for crystal nuclei to potentially form. It
can be expected that crystallization occurs at lower temperatures in the DSC curve because the
pre-existing crystal nuclei can start growing at the beginning of the crystallization temperature
range. This increases the rate of crystallization at earlier temperatures thus shifting the
crystallization peak to lower temperatures. What is clear from the DSC traces is that the variation
in cooling rate does not lead to new peaks or shoulders which would be indicative of other species
(nuclei) for potential crystallization due to the rate of quench.
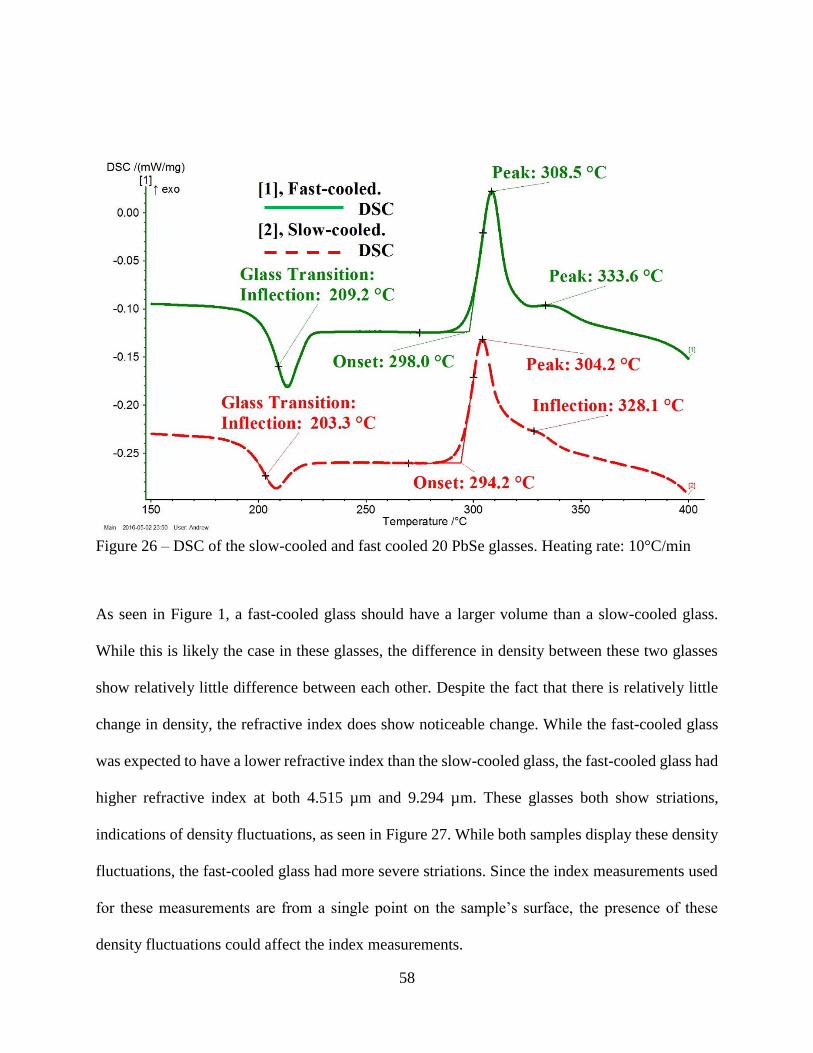
58
Figure 26 – DSC of the slow-cooled and fast cooled 20 PbSe glasses. Heating rate: 10°C/min
As seen in Figure 1, a fast-cooled glass should have a larger volume than a slow-cooled glass.
While this is likely the case in these glasses, the difference in density between these two glasses
show relatively little difference between each other. Despite the fact that there is relatively little
change in density, the refractive index does show noticeable change. While the fast-cooled glass
was expected to have a lower refractive index than the slow-cooled glass, the fast-cooled glass had
higher refractive index at both 4.515 µm and 9.294 µm. These glasses both show striations,
indications of density fluctuations, as seen in Figure 27. While both samples display these density
fluctuations, the fast-cooled glass had more severe striations. Since the index measurements used
for these measurements are from a single point on the sample’s surface, the presence of these
density fluctuations could affect the index measurements.
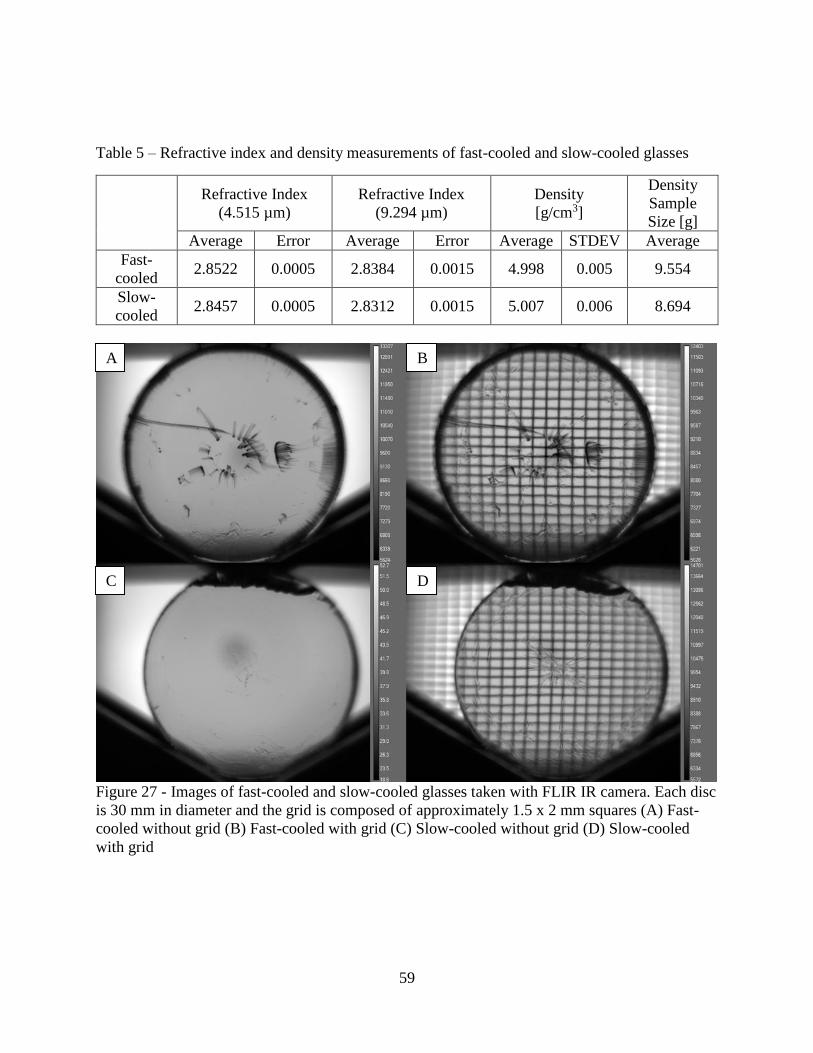
59
Table 5 – Refractive index and density measurements of fast-cooled and slow-cooled glasses
Refractive Index
(4.515 µm)
Refractive Index
(9.294 µm)
Density
[g/cm3]
Density
Sample
Size [g]
Average Error Average Error Average STDEV Average
Fast-
cooled 2.8522 0.0005 2.8384 0.0015 4.998 0.005 9.554
Slow-
cooled 2.8457 0.0005 2.8312 0.0015 5.007 0.006 8.694
Figure 27 - Images of fast-cooled and slow-cooled glasses taken with FLIR IR camera. Each disc
is 30 mm in diameter and the grid is composed of approximately 1.5 x 2 mm squares (A) Fast-
cooled without grid (B) Fast-cooled with grid (C) Slow-cooled without grid (D) Slow-cooled
with grid
A B
C D
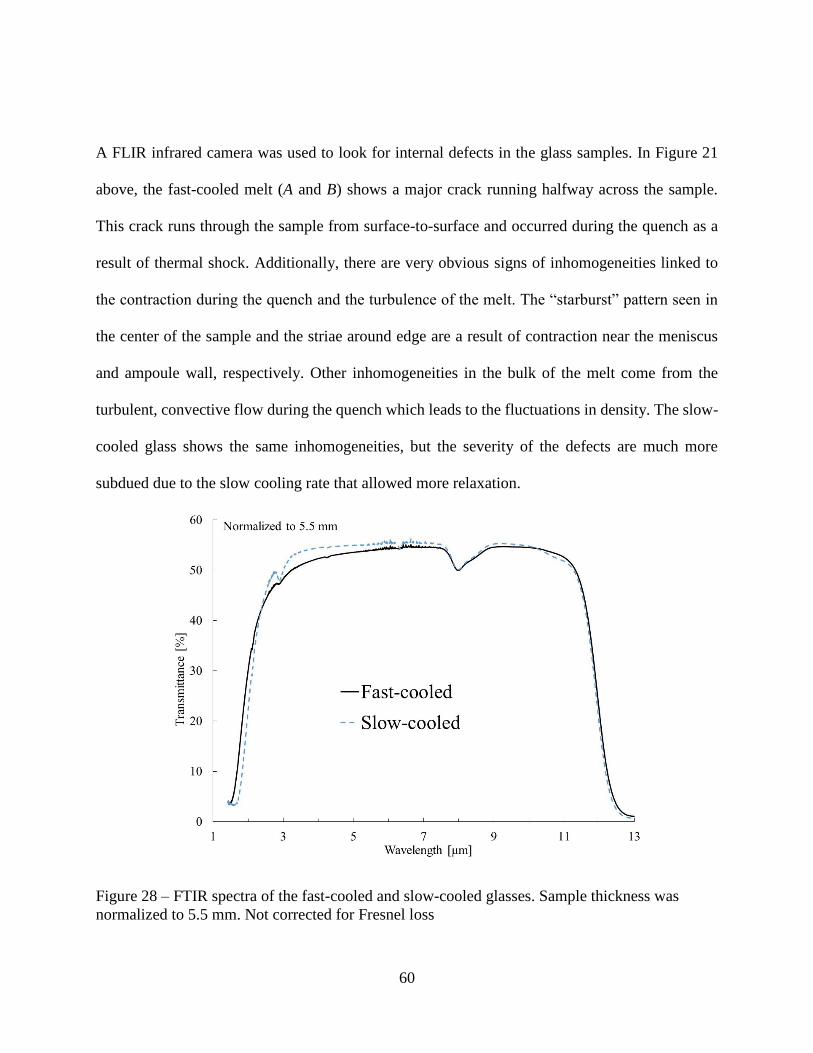
60
A FLIR infrared camera was used to look for internal defects in the glass samples. In Figure 21
above, the fast-cooled melt (A and B) shows a major crack running halfway across the sample.
This crack runs through the sample from surface-to-surface and occurred during the quench as a
result of thermal shock. Additionally, there are very obvious signs of inhomogeneities linked to
the contraction during the quench and the turbulence of the melt. The “starburst” pattern seen in
the center of the sample and the striae around edge are a result of contraction near the meniscus
and ampoule wall, respectively. Other inhomogeneities in the bulk of the melt come from the
turbulent, convective flow during the quench which leads to the fluctuations in density. The slow-
cooled glass shows the same inhomogeneities, but the severity of the defects are much more
subdued due to the slow cooling rate that allowed more relaxation.
Figure 28 – FTIR spectra of the fast-cooled and slow-cooled glasses. Sample thickness was
normalized to 5.5 mm. Not corrected for Fresnel loss
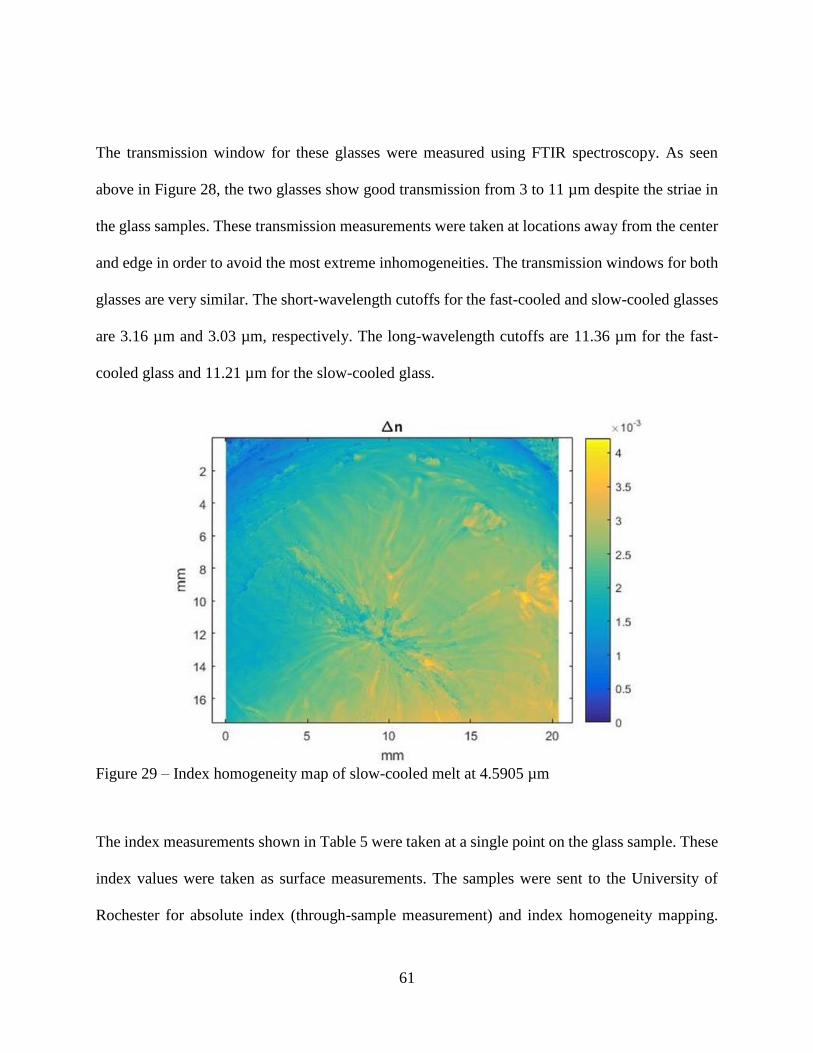
61
The transmission window for these glasses were measured using FTIR spectroscopy. As seen
above in Figure 28, the two glasses show good transmission from 3 to 11 µm despite the striae in
the glass samples. These transmission measurements were taken at locations away from the center
and edge in order to avoid the most extreme inhomogeneities. The transmission windows for both
glasses are very similar. The short-wavelength cutoffs for the fast-cooled and slow-cooled glasses
are 3.16 µm and 3.03 µm, respectively. The long-wavelength cutoffs are 11.36 µm for the fast-
cooled glass and 11.21 µm for the slow-cooled glass.
Figure 29 – Index homogeneity map of slow-cooled melt at 4.5905 µm
The index measurements shown in Table 5 were taken at a single point on the glass sample. These
index values were taken as surface measurements. The samples were sent to the University of
Rochester for absolute index (through-sample measurement) and index homogeneity mapping.
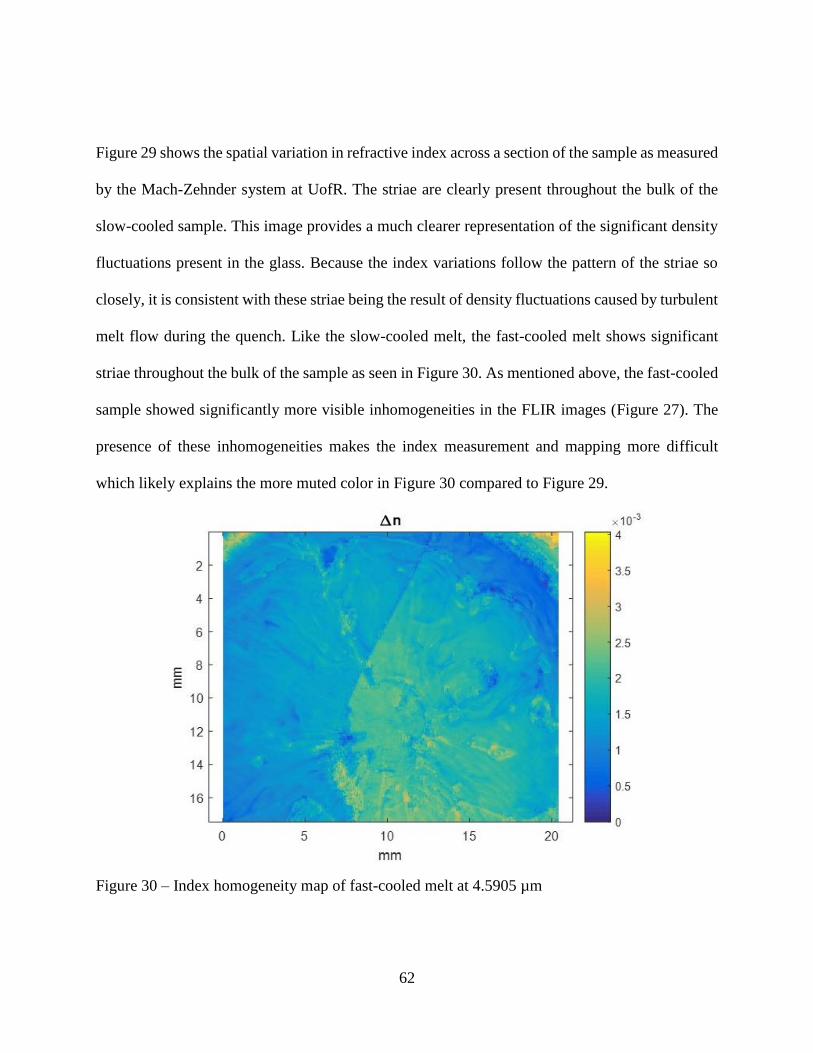
62
Figure 29 shows the spatial variation in refractive index across a section of the sample as measured
by the Mach-Zehnder system at UofR. The striae are clearly present throughout the bulk of the
slow-cooled sample. This image provides a much clearer representation of the significant density
fluctuations present in the glass. Because the index variations follow the pattern of the striae so
closely, it is consistent with these striae being the result of density fluctuations caused by turbulent
melt flow during the quench. Like the slow-cooled melt, the fast-cooled melt shows significant
striae throughout the bulk of the sample as seen in Figure 30. As mentioned above, the fast-cooled
sample showed significantly more visible inhomogeneities in the FLIR images (Figure 27). The
presence of these inhomogeneities makes the index measurement and mapping more difficult
which likely explains the more muted color in Figure 30 compared to Figure 29.
Figure 30 – Index homogeneity map of fast-cooled melt at 4.5905 µm
63
Absolute refractive index at 4.5905 µm was measured on the Sagnac system at UofR. The striae
in both samples made the measurements extremely difficult to make. Eleven measurements were
made on the slow-cooled sample. Each measurement was performed at a different angle while the
deviation of the beam passing through the sample was measured which is then used to calculate
the refractive index. The refractive index at 4.5905 µm was found to be 2.88(476) ± 0.03(215).
Absolute index measurements were also attempted on the fast-cooled sample, but the internal striae
made the measurements impossible.
The quench rate experiments show how the melting and quench protocols for lab-scale melts affect
the properties of the glass samples. The quench rate affects the refractive index, density, and Tg in
ways that were consistent with behavior predicted in Figure 1.1 The quench methods also have a
significant effect on the presence of striae in the melt. The slow-cooled melt showed less extreme
striae because the melt had more time to relax during cooling. This led to a more optical
homogeneous glass that allowed some measurements to be performed at University of Rochester.
The fast-cooled glass showed extremely turbulent striae that prevented full characterization at
University of Rochester.
Commercial Scale-Up
In an effort to show commercial viability, the 20 PbSe composition was scaled up to larger sizes
with a partnership with Amorphous Materials Inc. (AMI). The lab-scale melts made at UCF were
between 40 and 150 g. These glasses were in the form of 10 – 30 mm diameter boules. Figure 31
shows that these melts have minor differences in the primary Tg, Tx, and Tp values, but show the
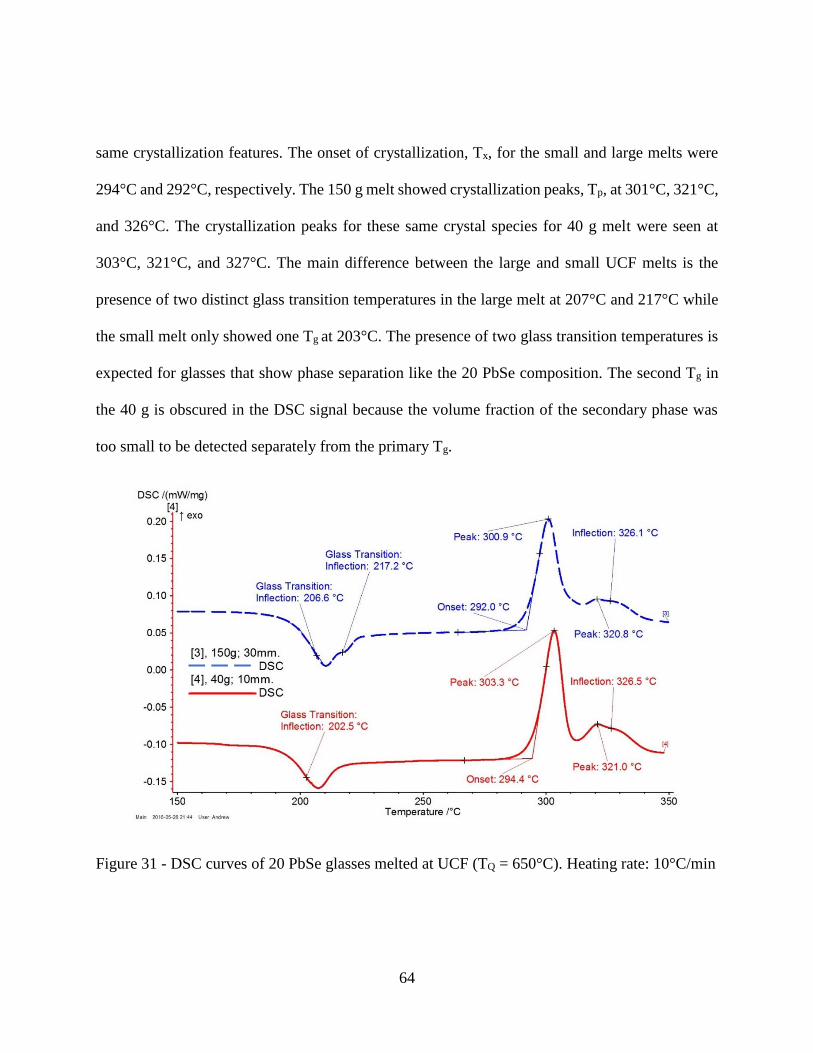
64
same crystallization features. The onset of crystallization, Tx, for the small and large melts were
294°C and 292°C, respectively. The 150 g melt showed crystallization peaks, Tp, at 301°C, 321°C,
and 326°C. The crystallization peaks for these same crystal species for 40 g melt were seen at
303°C, 321°C, and 327°C. The main difference between the large and small UCF melts is the
presence of two distinct glass transition temperatures in the large melt at 207°C and 217°C while
the small melt only showed one Tg at 203°C. The presence of two glass transition temperatures is
expected for glasses that show phase separation like the 20 PbSe composition. The second Tg in
the 40 g is obscured in the DSC signal because the volume fraction of the secondary phase was
too small to be detected separately from the primary Tg.
Figure 31 - DSC curves of 20 PbSe glasses melted at UCF (TQ = 650°C). Heating rate: 10°C/min
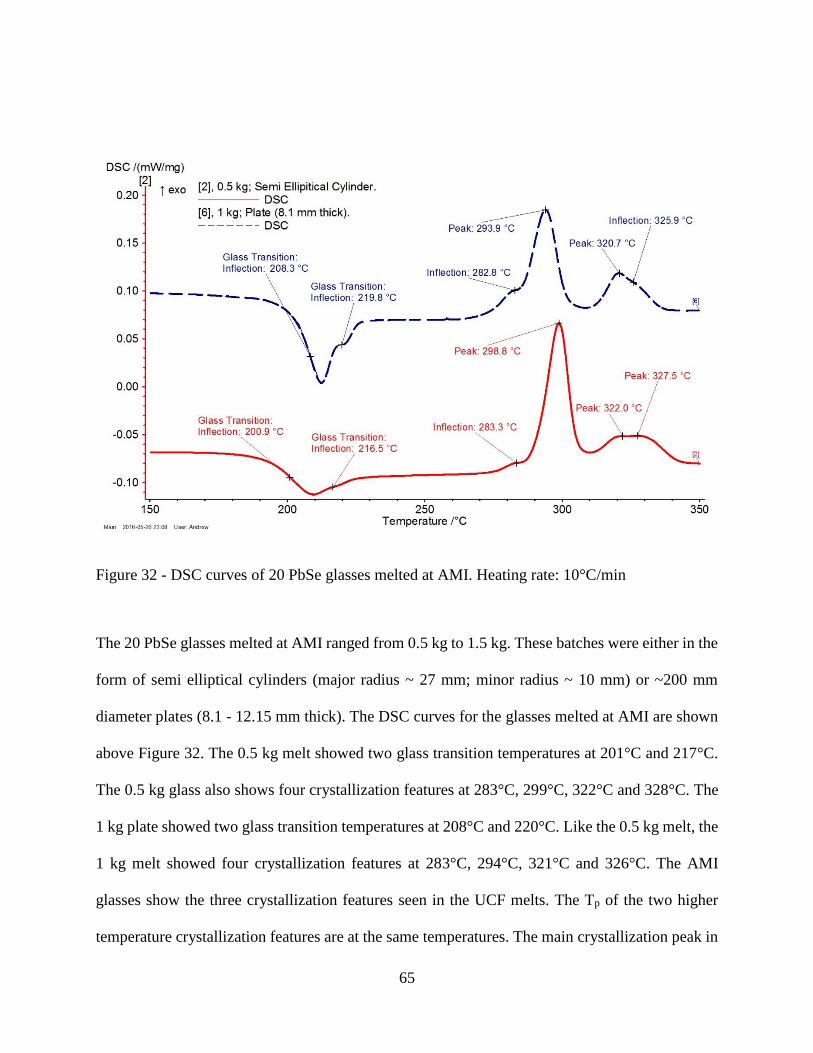
65
Figure 32 - DSC curves of 20 PbSe glasses melted at AMI. Heating rate: 10°C/min
The 20 PbSe glasses melted at AMI ranged from 0.5 kg to 1.5 kg. These batches were either in the
form of semi elliptical cylinders (major radius ~ 27 mm; minor radius ~ 10 mm) or ~200 mm
diameter plates (8.1 - 12.15 mm thick). The DSC curves for the glasses melted at AMI are shown
above Figure 32. The 0.5 kg melt showed two glass transition temperatures at 201°C and 217°C.
The 0.5 kg glass also shows four crystallization features at 283°C, 299°C, 322°C and 328°C. The
1 kg plate showed two glass transition temperatures at 208°C and 220°C. Like the 0.5 kg melt, the
1 kg melt showed four crystallization features at 283°C, 294°C, 321°C and 326°C. The AMI
glasses show the three crystallization features seen in the UCF melts. The Tp of the two higher
temperature crystallization features are at the same temperatures. The main crystallization peak in
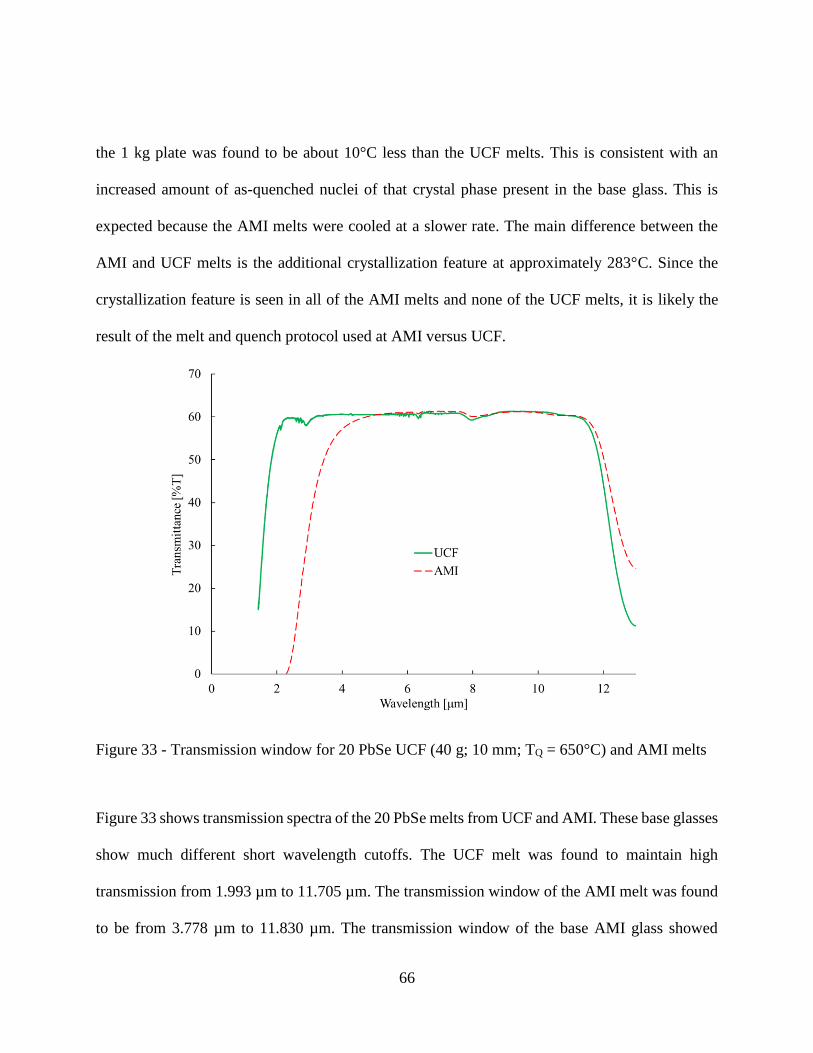
66
the 1 kg plate was found to be about 10°C less than the UCF melts. This is consistent with an
increased amount of as-quenched nuclei of that crystal phase present in the base glass. This is
expected because the AMI melts were cooled at a slower rate. The main difference between the
AMI and UCF melts is the additional crystallization feature at approximately 283°C. Since the
crystallization feature is seen in all of the AMI melts and none of the UCF melts, it is likely the
result of the melt and quench protocol used at AMI versus UCF.
Figure 33 - Transmission window for 20 PbSe UCF (40 g; 10 mm; TQ = 650°C) and AMI melts
Figure 33 shows transmission spectra of the 20 PbSe melts from UCF and AMI. These base glasses
show much different short wavelength cutoffs. The UCF melt was found to maintain high
transmission from 1.993 µm to 11.705 µm. The transmission window of the AMI melt was found
to be from 3.778 µm to 11.830 µm. The transmission window of the base AMI glass showed
C
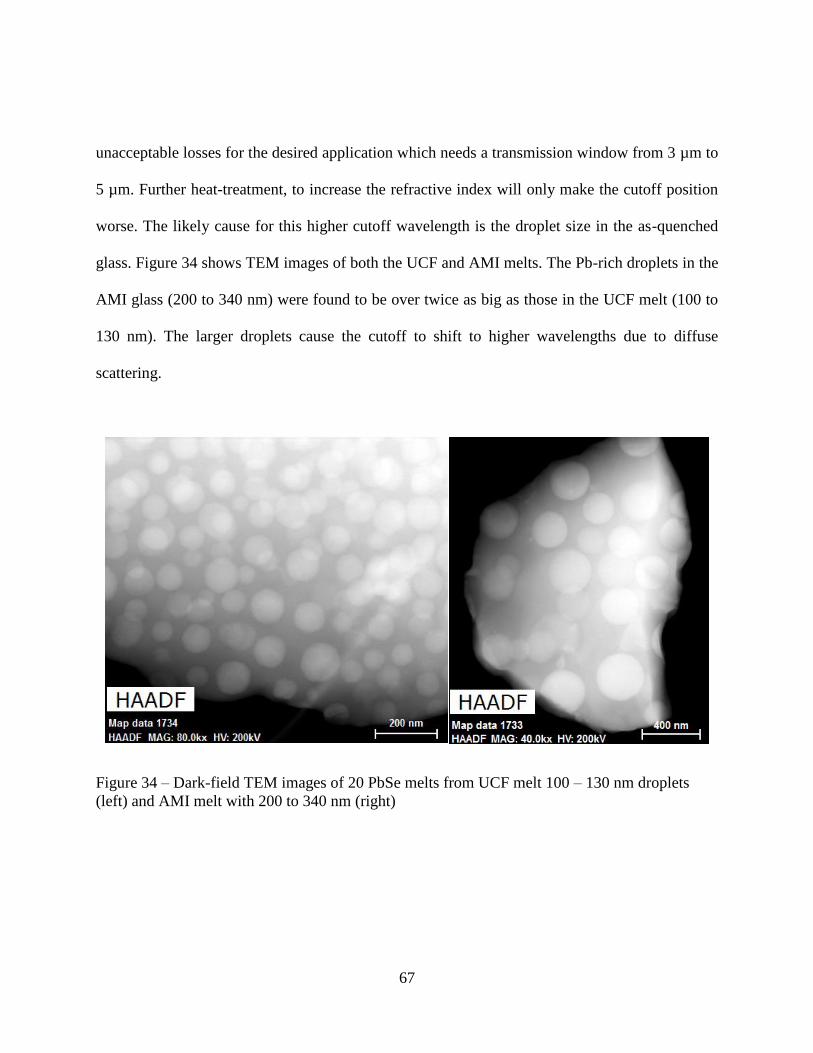
67
unacceptable losses for the desired application which needs a transmission window from 3 µm to
5 µm. Further heat-treatment, to increase the refractive index will only make the cutoff position
worse. The likely cause for this higher cutoff wavelength is the droplet size in the as-quenched
glass. Figure 34 shows TEM images of both the UCF and AMI melts. The Pb-rich droplets in the
AMI glass (200 to 340 nm) were found to be over twice as big as those in the UCF melt (100 to
130 nm). The larger droplets cause the cutoff to shift to higher wavelengths due to diffuse
scattering.
Figure 34 – Dark-field TEM images of 20 PbSe melts from UCF melt 100 – 130 nm droplets
(left) and AMI melt with 200 to 340 nm (right)
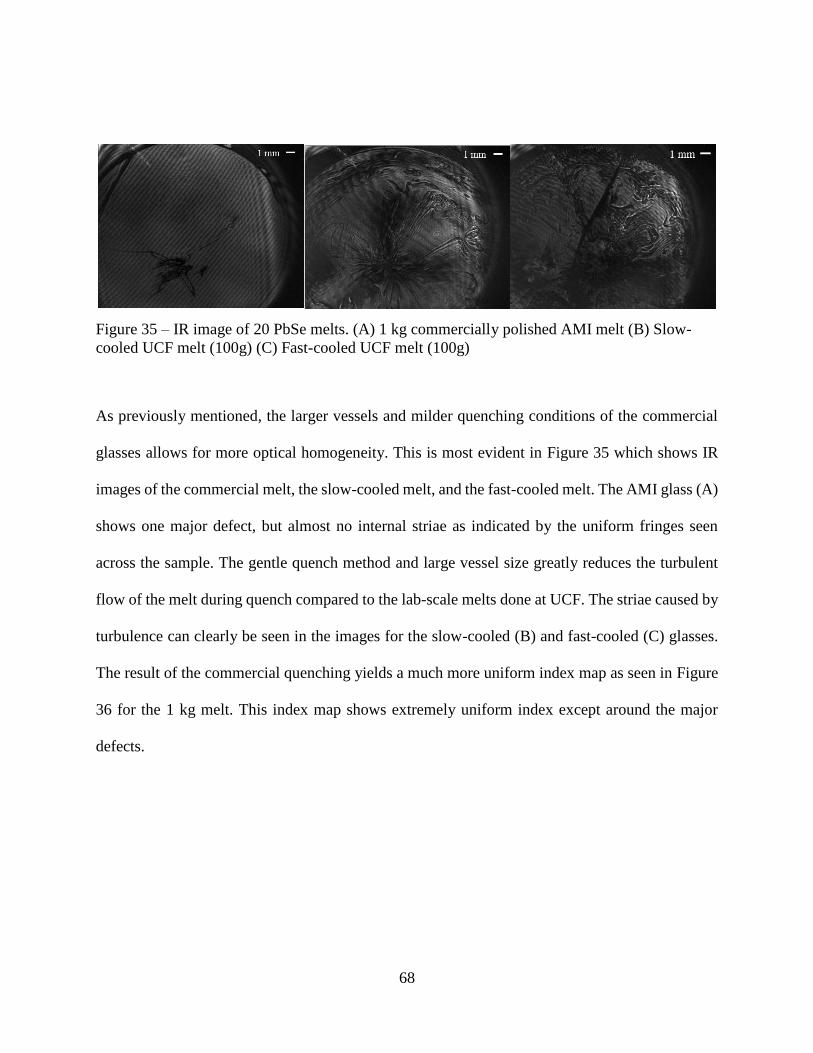
68
Figure 35 – IR image of 20 PbSe melts. (A) 1 kg commercially polished AMI melt (B) Slow-
cooled UCF melt (100g) (C) Fast-cooled UCF melt (100g)
As previously mentioned, the larger vessels and milder quenching conditions of the commercial
glasses allows for more optical homogeneity. This is most evident in Figure 35 which shows IR
images of the commercial melt, the slow-cooled melt, and the fast-cooled melt. The AMI glass (A)
shows one major defect, but almost no internal striae as indicated by the uniform fringes seen
across the sample. The gentle quench method and large vessel size greatly reduces the turbulent
flow of the melt during quench compared to the lab-scale melts done at UCF. The striae caused by
turbulence can clearly be seen in the images for the slow-cooled (B) and fast-cooled (C) glasses.
The result of the commercial quenching yields a much more uniform index map as seen in Figure
36 for the 1 kg melt. This index map shows extremely uniform index except around the major
defects.
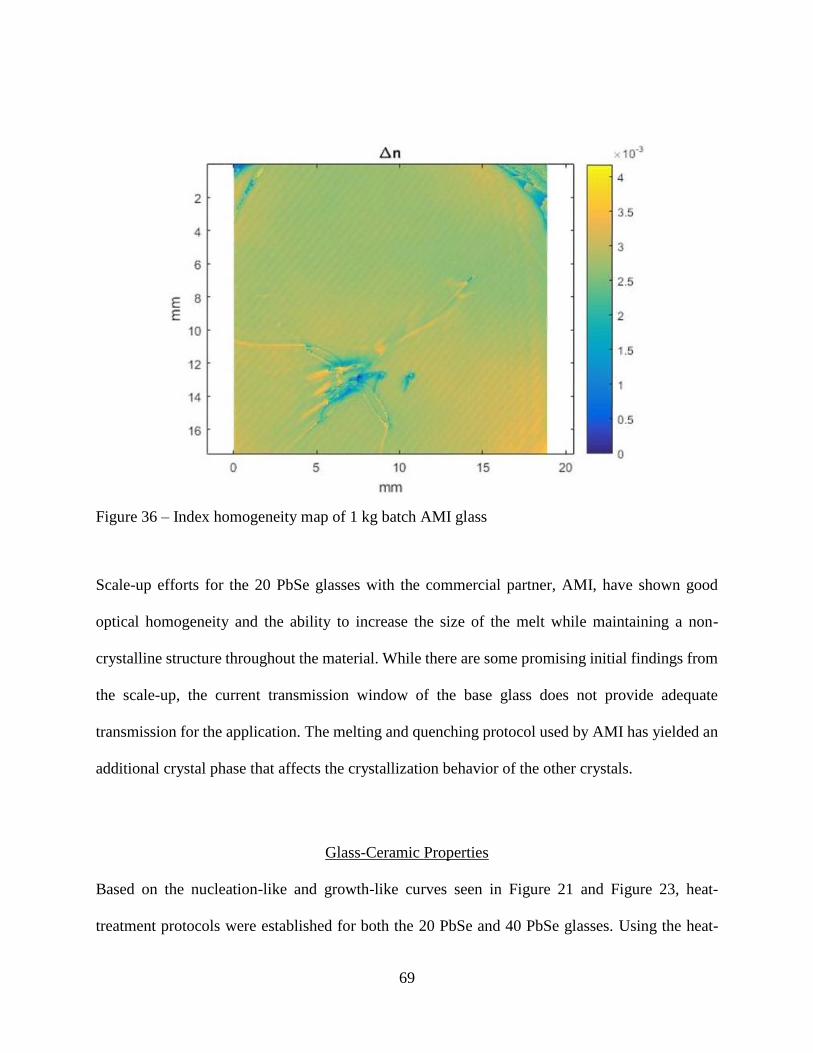
69
Figure 36 – Index homogeneity map of 1 kg batch AMI glass
Scale-up efforts for the 20 PbSe glasses with the commercial partner, AMI, have shown good
optical homogeneity and the ability to increase the size of the melt while maintaining a non-
crystalline structure throughout the material. While there are some promising initial findings from
the scale-up, the current transmission window of the base glass does not provide adequate
transmission for the application. The melting and quenching protocol used by AMI has yielded an
additional crystal phase that affects the crystallization behavior of the other crystals.
Glass-Ceramic Properties
Based on the nucleation-like and growth-like curves seen in Figure 21 and Figure 23, heat-
treatment protocols were established for both the 20 PbSe and 40 PbSe glasses. Using the heat-
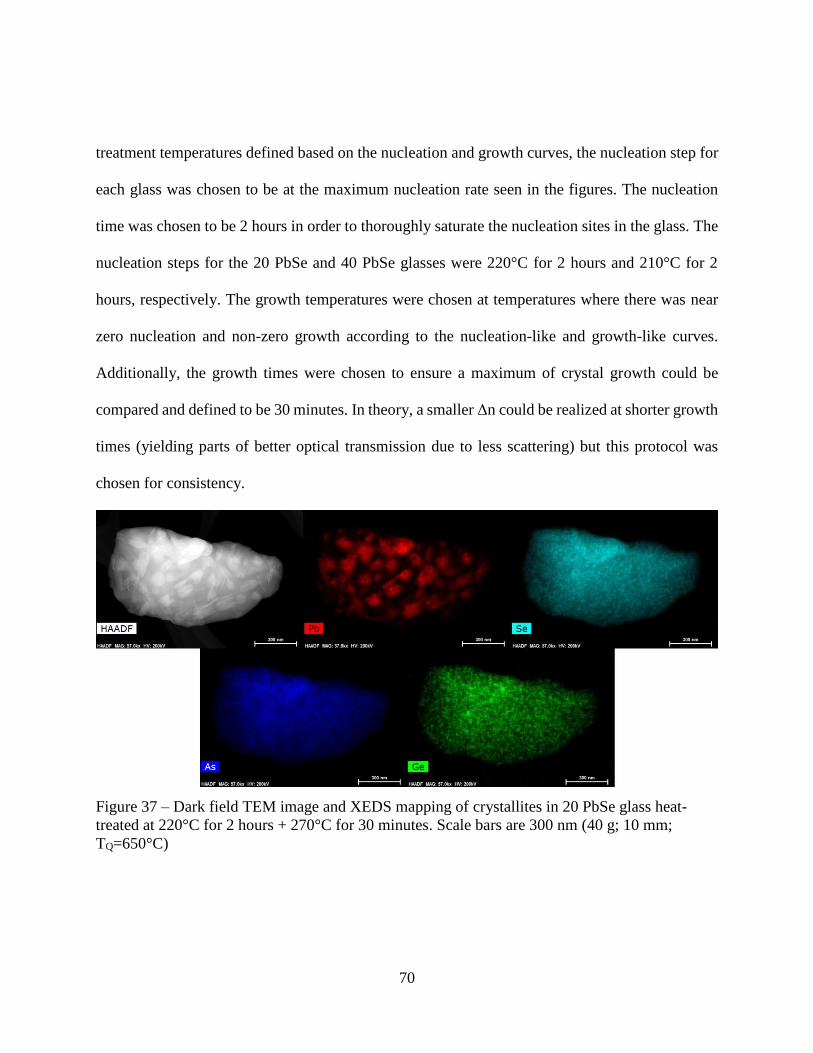
70
treatment temperatures defined based on the nucleation and growth curves, the nucleation step for
each glass was chosen to be at the maximum nucleation rate seen in the figures. The nucleation
time was chosen to be 2 hours in order to thoroughly saturate the nucleation sites in the glass. The
nucleation steps for the 20 PbSe and 40 PbSe glasses were 220°C for 2 hours and 210°C for 2
hours, respectively. The growth temperatures were chosen at temperatures where there was near
zero nucleation and non-zero growth according to the nucleation-like and growth-like curves.
Additionally, the growth times were chosen to ensure a maximum of crystal growth could be
compared and defined to be 30 minutes. In theory, a smaller Δn could be realized at shorter growth
times (yielding parts of better optical transmission due to less scattering) but this protocol was
chosen for consistency.
Figure 37 – Dark field TEM image and XEDS mapping of crystallites in 20 PbSe glass heat-
treated at 220°C for 2 hours + 270°C for 30 minutes. Scale bars are 300 nm (40 g; 10 mm;
TQ=650°C)
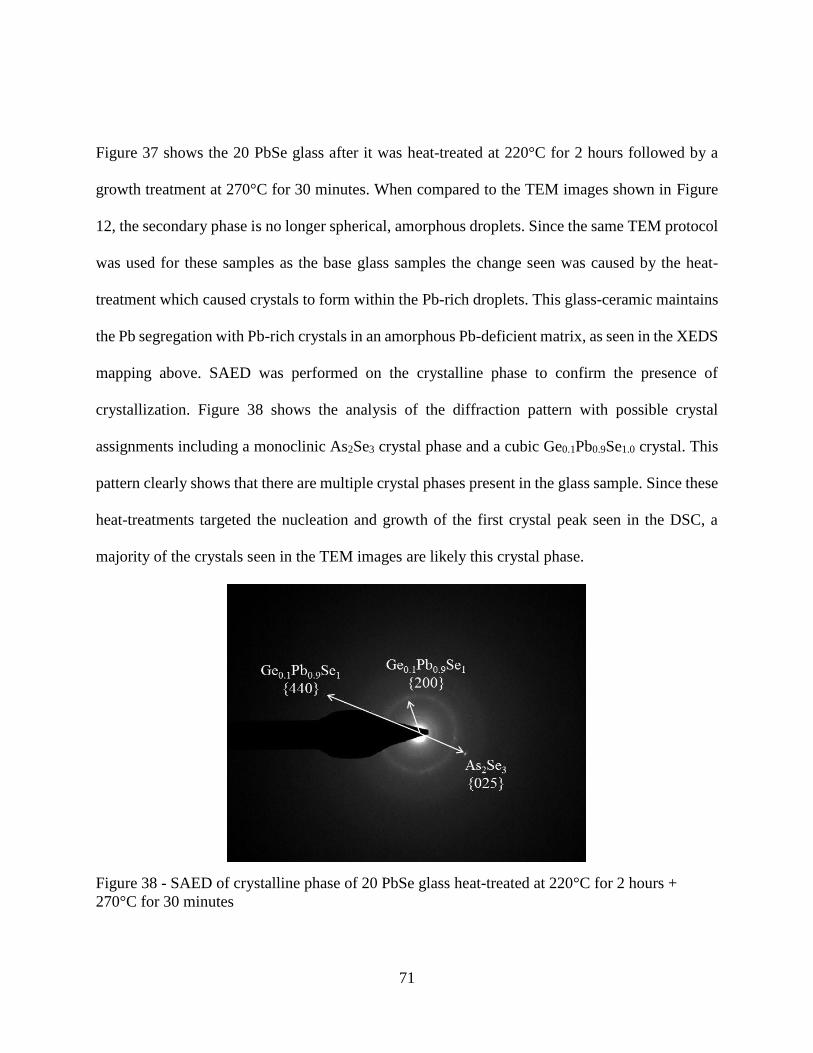
71
Figure 37 shows the 20 PbSe glass after it was heat-treated at 220°C for 2 hours followed by a
growth treatment at 270°C for 30 minutes. When compared to the TEM images shown in Figure
12, the secondary phase is no longer spherical, amorphous droplets. Since the same TEM protocol
was used for these samples as the base glass samples the change seen was caused by the heat-
treatment which caused crystals to form within the Pb-rich droplets. This glass-ceramic maintains
the Pb segregation with Pb-rich crystals in an amorphous Pb-deficient matrix, as seen in the XEDS
mapping above. SAED was performed on the crystalline phase to confirm the presence of
crystallization. Figure 38 shows the analysis of the diffraction pattern with possible crystal
assignments including a monoclinic As2Se3 crystal phase and a cubic Ge0.1Pb0.9Se1.0 crystal. This
pattern clearly shows that there are multiple crystal phases present in the glass sample. Since these
heat-treatments targeted the nucleation and growth of the first crystal peak seen in the DSC, a
majority of the crystals seen in the TEM images are likely this crystal phase.
Figure 38 - SAED of crystalline phase of 20 PbSe glass heat-treated at 220°C for 2 hours +
270°C for 30 minutes
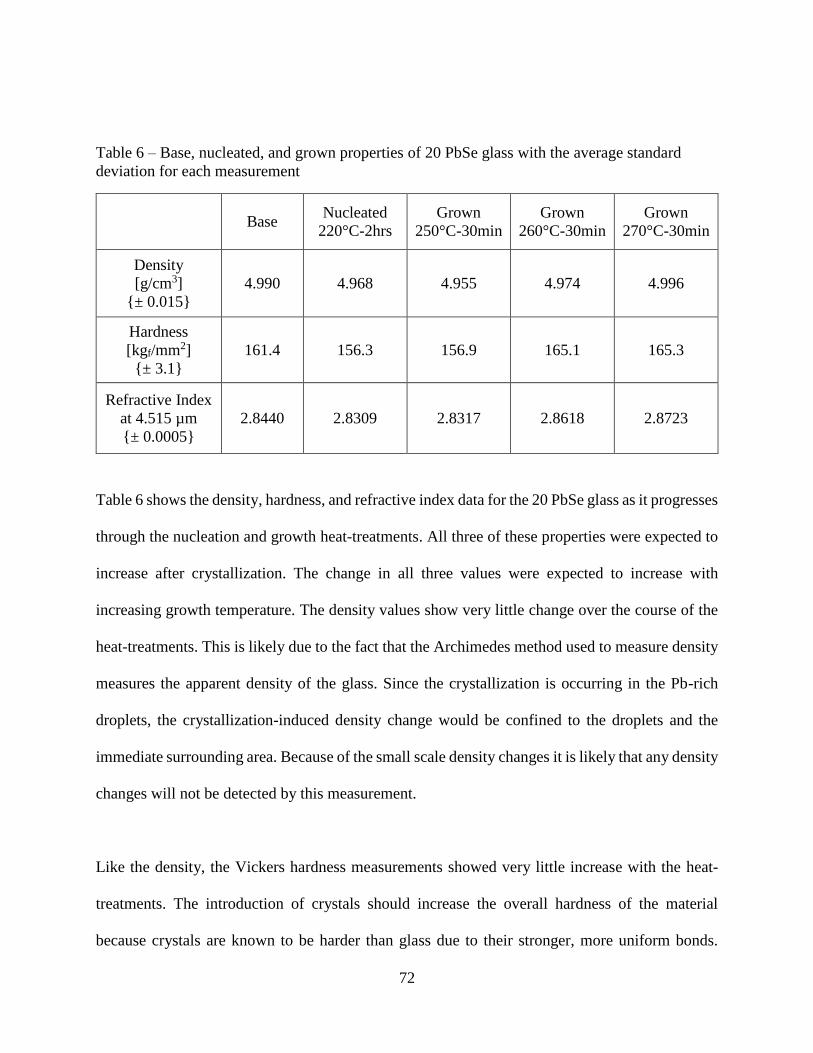
72
Table 6 – Base, nucleated, and grown properties of 20 PbSe glass with the average standard
deviation for each measurement
Base Nucleated
220°C-2hrs
Grown
250°C-30min
Grown
260°C-30min
Grown
270°C-30min
Density
[g/cm3]
{± 0.015}
4.990 4.968 4.955 4.974 4.996
Hardness
[kgf/mm2]
{± 3.1}
161.4 156.3 156.9 165.1 165.3
Refractive Index
at 4.515 µm
{± 0.0005}
2.8440 2.8309 2.8317 2.8618 2.8723
Table 6 shows the density, hardness, and refractive index data for the 20 PbSe glass as it progresses
through the nucleation and growth heat-treatments. All three of these properties were expected to
increase after crystallization. The change in all three values were expected to increase with
increasing growth temperature. The density values show very little change over the course of the
heat-treatments. This is likely due to the fact that the Archimedes method used to measure density
measures the apparent density of the glass. Since the crystallization is occurring in the Pb-rich
droplets, the crystallization-induced density change would be confined to the droplets and the
immediate surrounding area. Because of the small scale density changes it is likely that any density
changes will not be detected by this measurement.
Like the density, the Vickers hardness measurements showed very little increase with the heat-
treatments. The introduction of crystals should increase the overall hardness of the material
because crystals are known to be harder than glass due to their stronger, more uniform bonds.
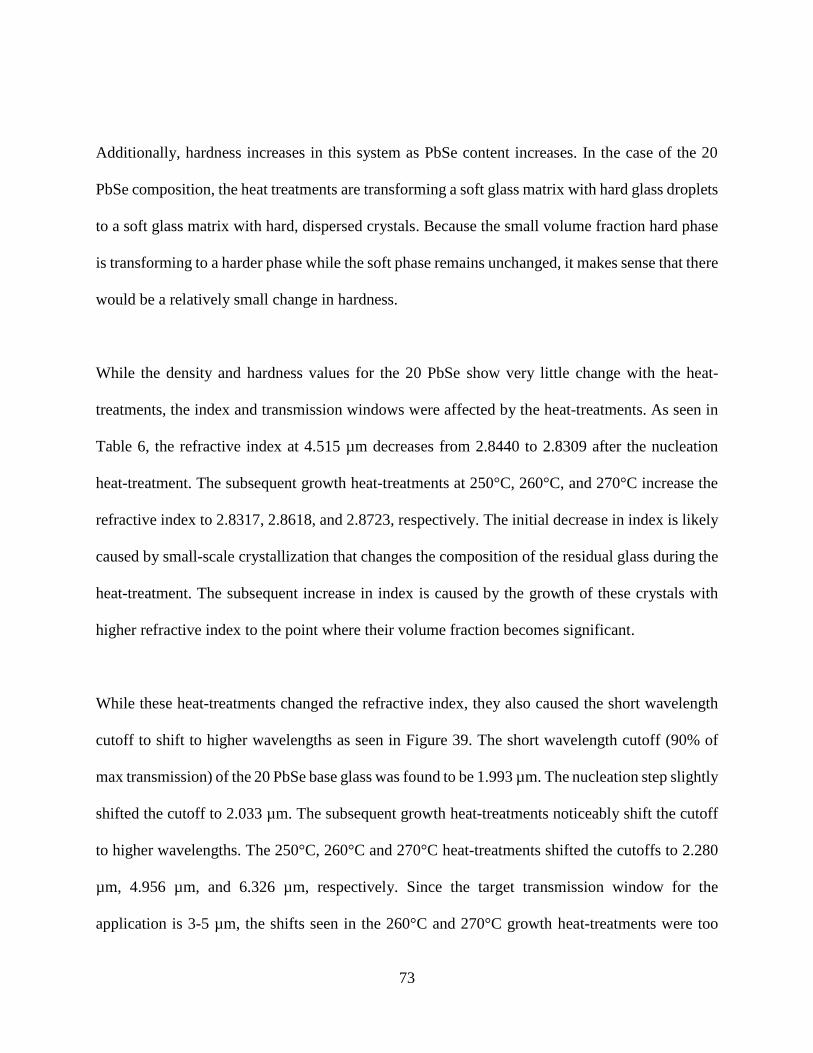
73
Additionally, hardness increases in this system as PbSe content increases. In the case of the 20
PbSe composition, the heat treatments are transforming a soft glass matrix with hard glass droplets
to a soft glass matrix with hard, dispersed crystals. Because the small volume fraction hard phase
is transforming to a harder phase while the soft phase remains unchanged, it makes sense that there
would be a relatively small change in hardness.
While the density and hardness values for the 20 PbSe show very little change with the heat-
treatments, the index and transmission windows were affected by the heat-treatments. As seen in
Table 6, the refractive index at 4.515 µm decreases from 2.8440 to 2.8309 after the nucleation
heat-treatment. The subsequent growth heat-treatments at 250°C, 260°C, and 270°C increase the
refractive index to 2.8317, 2.8618, and 2.8723, respectively. The initial decrease in index is likely
caused by small-scale crystallization that changes the composition of the residual glass during the
heat-treatment. The subsequent increase in index is caused by the growth of these crystals with
higher refractive index to the point where their volume fraction becomes significant.
While these heat-treatments changed the refractive index, they also caused the short wavelength
cutoff to shift to higher wavelengths as seen in Figure 39. The short wavelength cutoff (90% of
max transmission) of the 20 PbSe base glass was found to be 1.993 µm. The nucleation step slightly
shifted the cutoff to 2.033 µm. The subsequent growth heat-treatments noticeably shift the cutoff
to higher wavelengths. The 250°C, 260°C and 270°C heat-treatments shifted the cutoffs to 2.280
µm, 4.956 µm, and 6.326 µm, respectively. Since the target transmission window for the
application is 3-5 µm, the shifts seen in the 260°C and 270°C growth heat-treatments were too
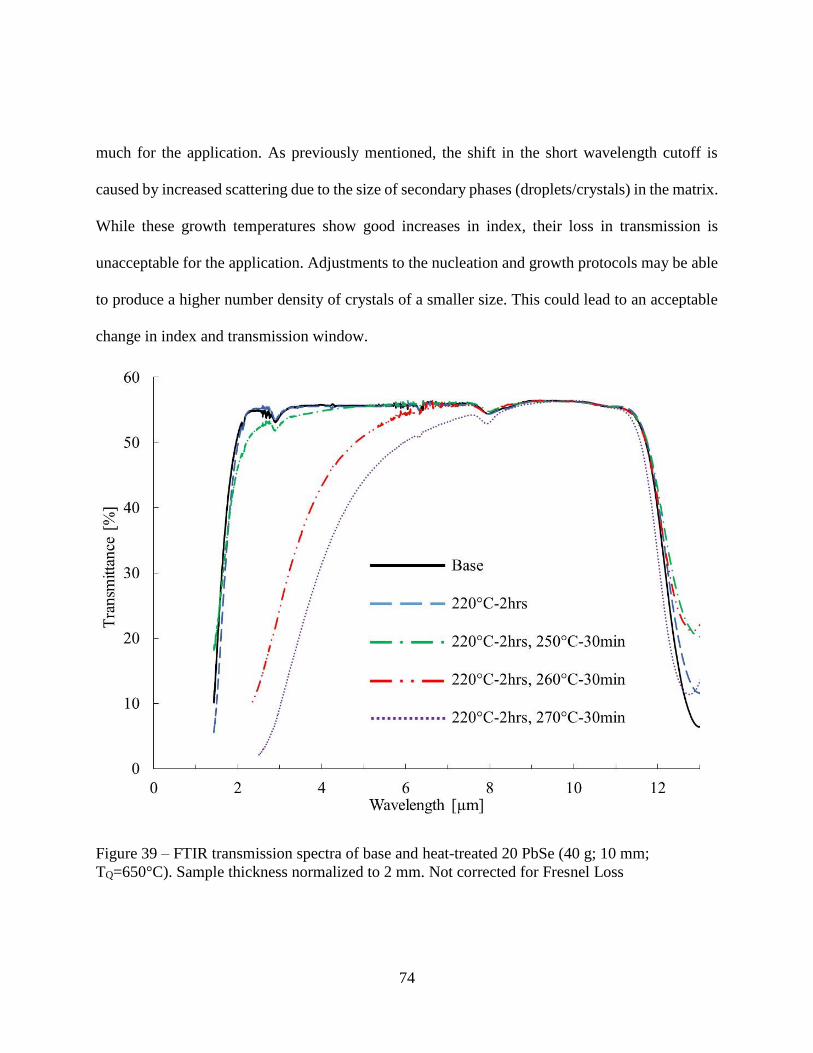
74
much for the application. As previously mentioned, the shift in the short wavelength cutoff is
caused by increased scattering due to the size of secondary phases (droplets/crystals) in the matrix.
While these growth temperatures show good increases in index, their loss in transmission is
unacceptable for the application. Adjustments to the nucleation and growth protocols may be able
to produce a higher number density of crystals of a smaller size. This could lead to an acceptable
change in index and transmission window.
Figure 39 – FTIR transmission spectra of base and heat-treated 20 PbSe (40 g; 10 mm;
TQ=650°C). Sample thickness normalized to 2 mm. Not corrected for Fresnel Loss
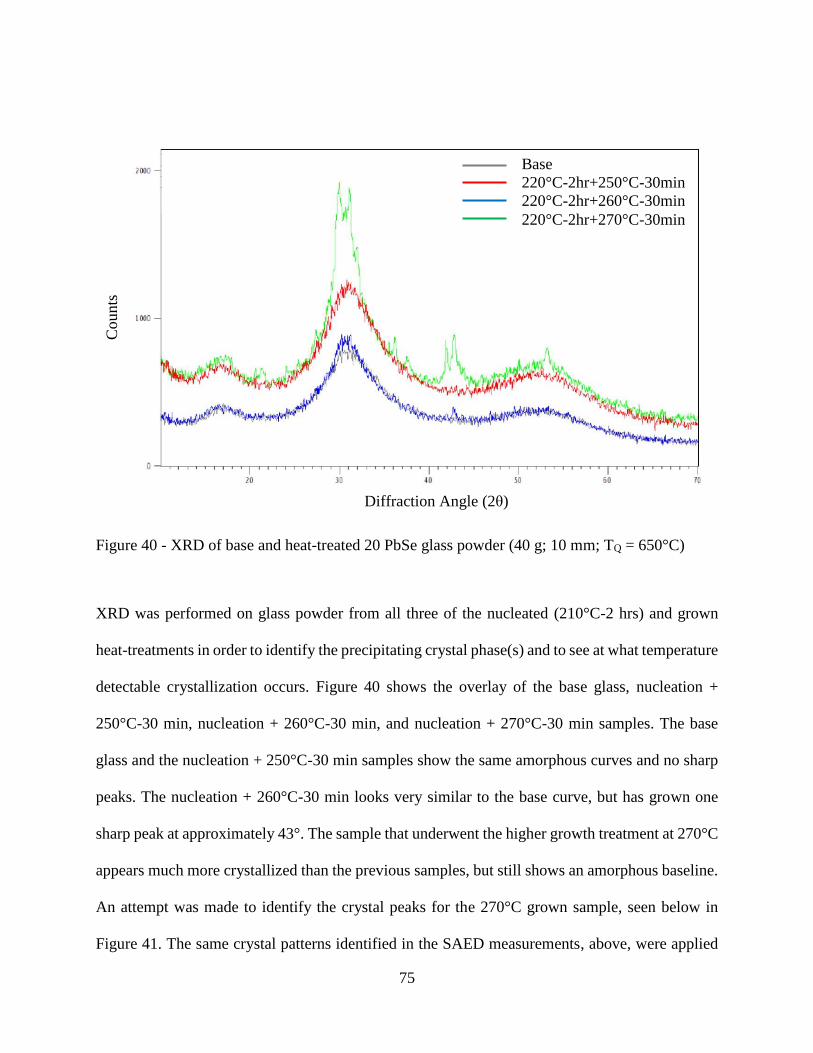
75
Figure 40 - XRD of base and heat-treated 20 PbSe glass powder (40 g; 10 mm; TQ = 650°C)
XRD was performed on glass powder from all three of the nucleated (210°C-2 hrs) and grown
heat-treatments in order to identify the precipitating crystal phase(s) and to see at what temperature
detectable crystallization occurs. Figure 40 shows the overlay of the base glass, nucleation +
250°C-30 min, nucleation + 260°C-30 min, and nucleation + 270°C-30 min samples. The base
glass and the nucleation + 250°C-30 min samples show the same amorphous curves and no sharp
peaks. The nucleation + 260°C-30 min looks very similar to the base curve, but has grown one
sharp peak at approximately 43°. The sample that underwent the higher growth treatment at 270°C
appears much more crystallized than the previous samples, but still shows an amorphous baseline.
An attempt was made to identify the crystal peaks for the 270°C grown sample, seen below in
Figure 41. The same crystal patterns identified in the SAED measurements, above, were applied
Base
220°C-2hr+250°C-30min
220°C-2hr+260°C-30min
220°C-2hr+270°C-30min
Diffraction Angle (2θ)
Counts
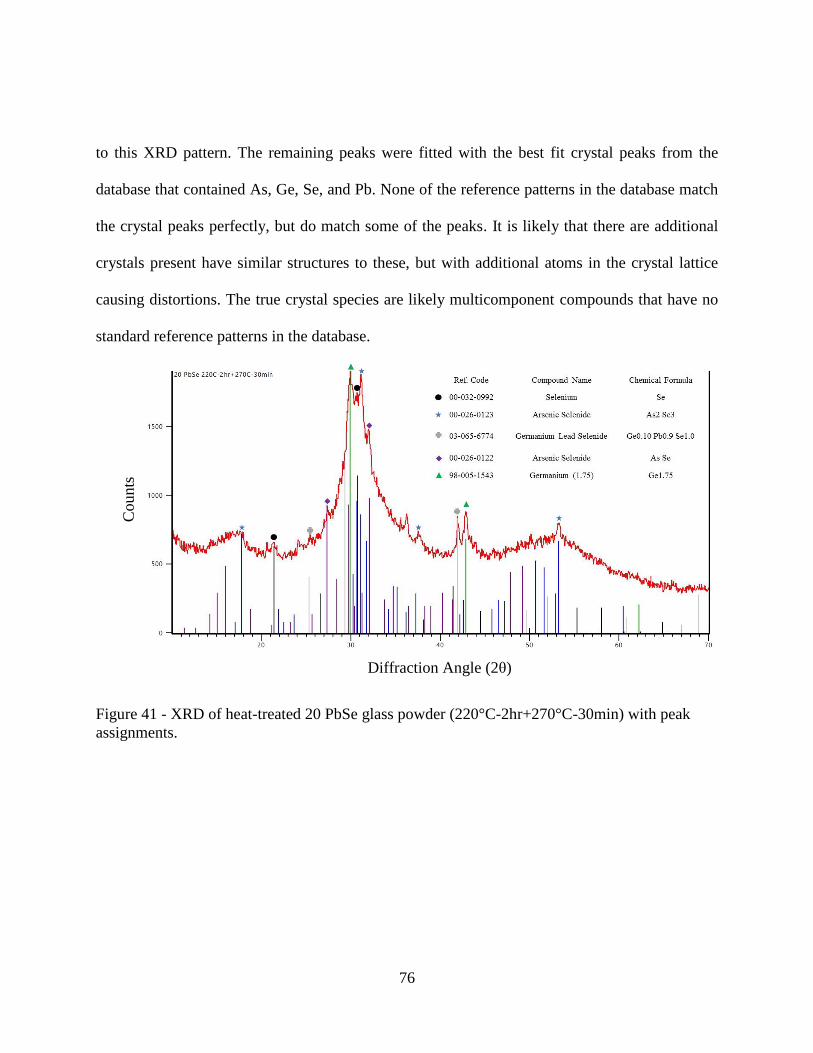
76
to this XRD pattern. The remaining peaks were fitted with the best fit crystal peaks from the
database that contained As, Ge, Se, and Pb. None of the reference patterns in the database match
the crystal peaks perfectly, but do match some of the peaks. It is likely that there are additional
crystals present have similar structures to these, but with additional atoms in the crystal lattice
causing distortions. The true crystal species are likely multicomponent compounds that have no
standard reference patterns in the database.
Figure 41 - XRD of heat-treated 20 PbSe glass powder (220°C-2hr+270°C-30min) with peak
assignments.
Diffraction Angle (2θ)
Counts
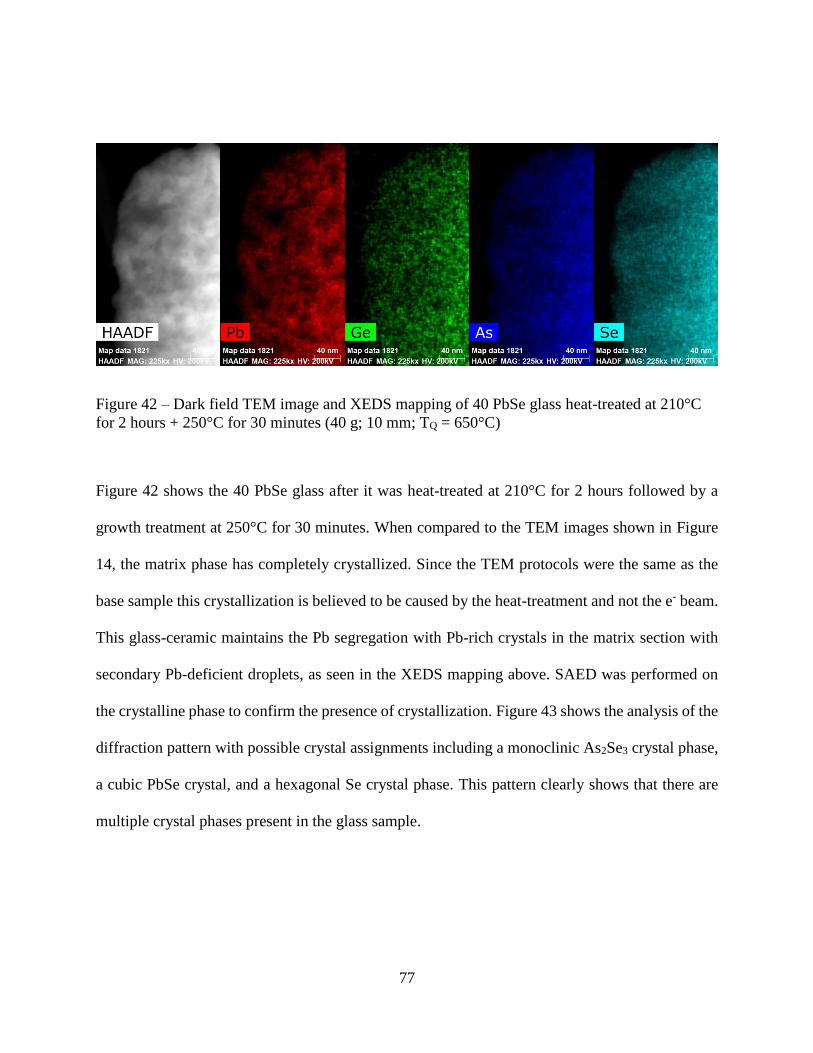
77
Figure 42 – Dark field TEM image and XEDS mapping of 40 PbSe glass heat-treated at 210°C
for 2 hours + 250°C for 30 minutes (40 g; 10 mm; TQ = 650°C)
Figure 42 shows the 40 PbSe glass after it was heat-treated at 210°C for 2 hours followed by a
growth treatment at 250°C for 30 minutes. When compared to the TEM images shown in Figure
14, the matrix phase has completely crystallized. Since the TEM protocols were the same as the
base sample this crystallization is believed to be caused by the heat-treatment and not the e- beam.
This glass-ceramic maintains the Pb segregation with Pb-rich crystals in the matrix section with
secondary Pb-deficient droplets, as seen in the XEDS mapping above. SAED was performed on
the crystalline phase to confirm the presence of crystallization. Figure 43 shows the analysis of the
diffraction pattern with possible crystal assignments including a monoclinic As2Se3 crystal phase,
a cubic PbSe crystal, and a hexagonal Se crystal phase. This pattern clearly shows that there are
multiple crystal phases present in the glass sample.
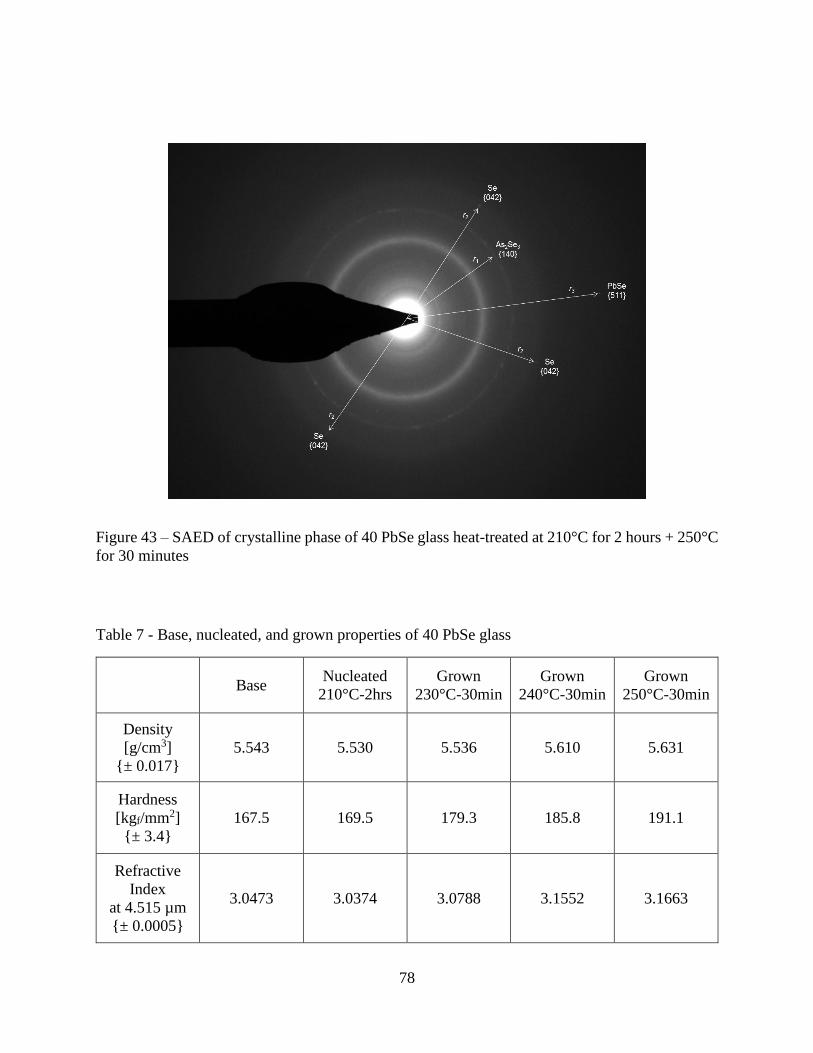
78
Figure 43 – SAED of crystalline phase of 40 PbSe glass heat-treated at 210°C for 2 hours + 250°C
for 30 minutes
Table 7 - Base, nucleated, and grown properties of 40 PbSe glass
Base Nucleated
210°C-2hrs
Grown
230°C-30min
Grown
240°C-30min
Grown
250°C-30min
Density
[g/cm3]
{± 0.017}
5.543 5.530 5.536 5.610 5.631
Hardness
[kgf/mm2]
{± 3.4}
167.5 169.5 179.3 185.8 191.1
Refractive
Index
at 4.515 µm
{± 0.0005}
3.0473 3.0374 3.0788 3.1552 3.1663
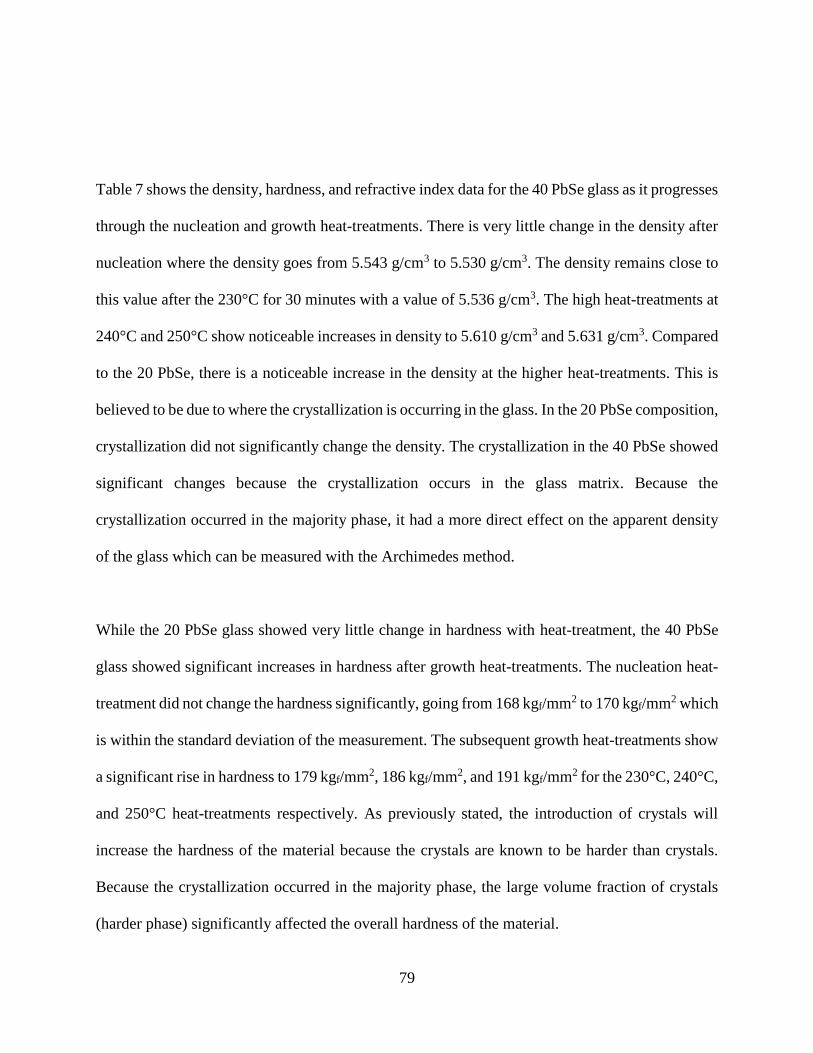
79
Table 7 shows the density, hardness, and refractive index data for the 40 PbSe glass as it progresses
through the nucleation and growth heat-treatments. There is very little change in the density after
nucleation where the density goes from 5.543 g/cm3 to 5.530 g/cm3. The density remains close to
this value after the 230°C for 30 minutes with a value of 5.536 g/cm3. The high heat-treatments at
240°C and 250°C show noticeable increases in density to 5.610 g/cm3 and 5.631 g/cm3. Compared
to the 20 PbSe, there is a noticeable increase in the density at the higher heat-treatments. This is
believed to be due to where the crystallization is occurring in the glass. In the 20 PbSe composition,
crystallization did not significantly change the density. The crystallization in the 40 PbSe showed
significant changes because the crystallization occurs in the glass matrix. Because the
crystallization occurred in the majority phase, it had a more direct effect on the apparent density
of the glass which can be measured with the Archimedes method.
While the 20 PbSe glass showed very little change in hardness with heat-treatment, the 40 PbSe
glass showed significant increases in hardness after growth heat-treatments. The nucleation heat-
treatment did not change the hardness significantly, going from 168 kgf/mm2 to 170 kgf/mm2 which
is within the standard deviation of the measurement. The subsequent growth heat-treatments show
a significant rise in hardness to 179 kgf/mm2, 186 kgf/mm2, and 191 kgf/mm2 for the 230°C, 240°C,
and 250°C heat-treatments respectively. As previously stated, the introduction of crystals will
increase the hardness of the material because the crystals are known to be harder than crystals.
Because the crystallization occurred in the majority phase, the large volume fraction of crystals
(harder phase) significantly affected the overall hardness of the material.
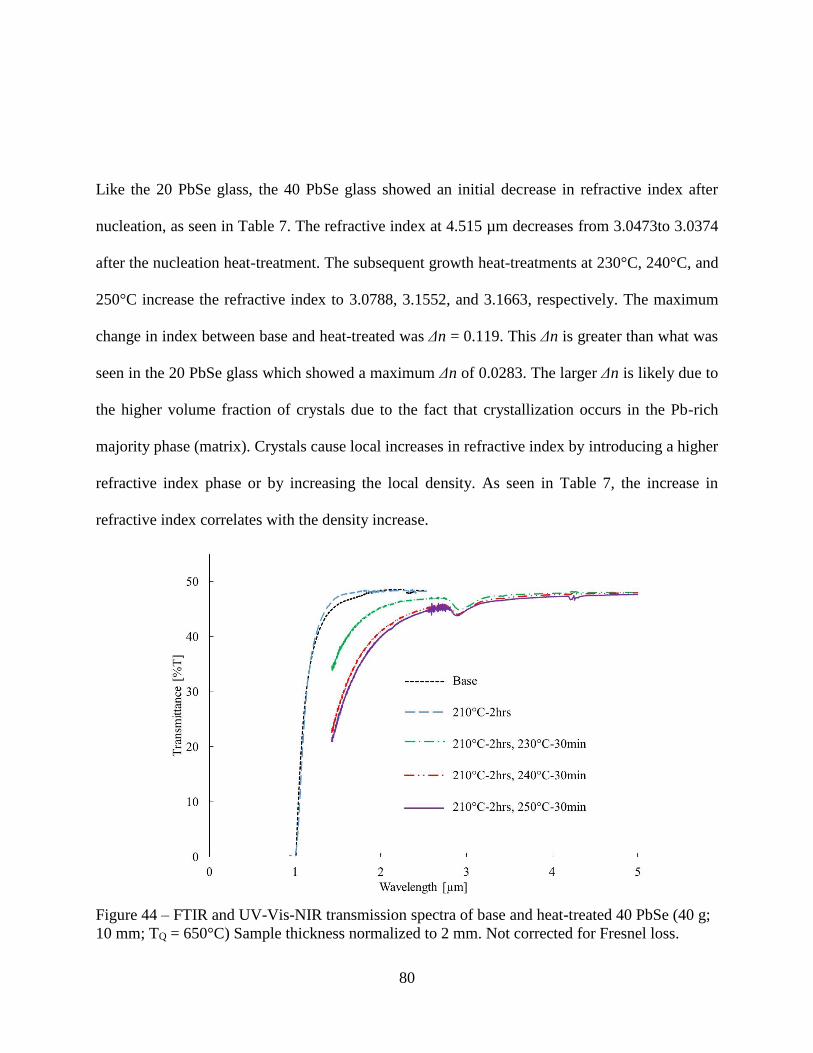
80
Like the 20 PbSe glass, the 40 PbSe glass showed an initial decrease in refractive index after
nucleation, as seen in Table 7. The refractive index at 4.515 µm decreases from 3.0473to 3.0374
after the nucleation heat-treatment. The subsequent growth heat-treatments at 230°C, 240°C, and
250°C increase the refractive index to 3.0788, 3.1552, and 3.1663, respectively. The maximum
change in index between base and heat-treated was Δn = 0.119. This Δn is greater than what was
seen in the 20 PbSe glass which showed a maximum Δn of 0.0283. The larger Δn is likely due to
the higher volume fraction of crystals due to the fact that crystallization occurs in the Pb-rich
majority phase (matrix). Crystals cause local increases in refractive index by introducing a higher
refractive index phase or by increasing the local density. As seen in Table 7, the increase in
refractive index correlates with the density increase.
Figure 44 – FTIR and UV-Vis-NIR transmission spectra of base and heat-treated 40 PbSe (40 g;
10 mm; TQ = 650°C) Sample thickness normalized to 2 mm. Not corrected for Fresnel loss.
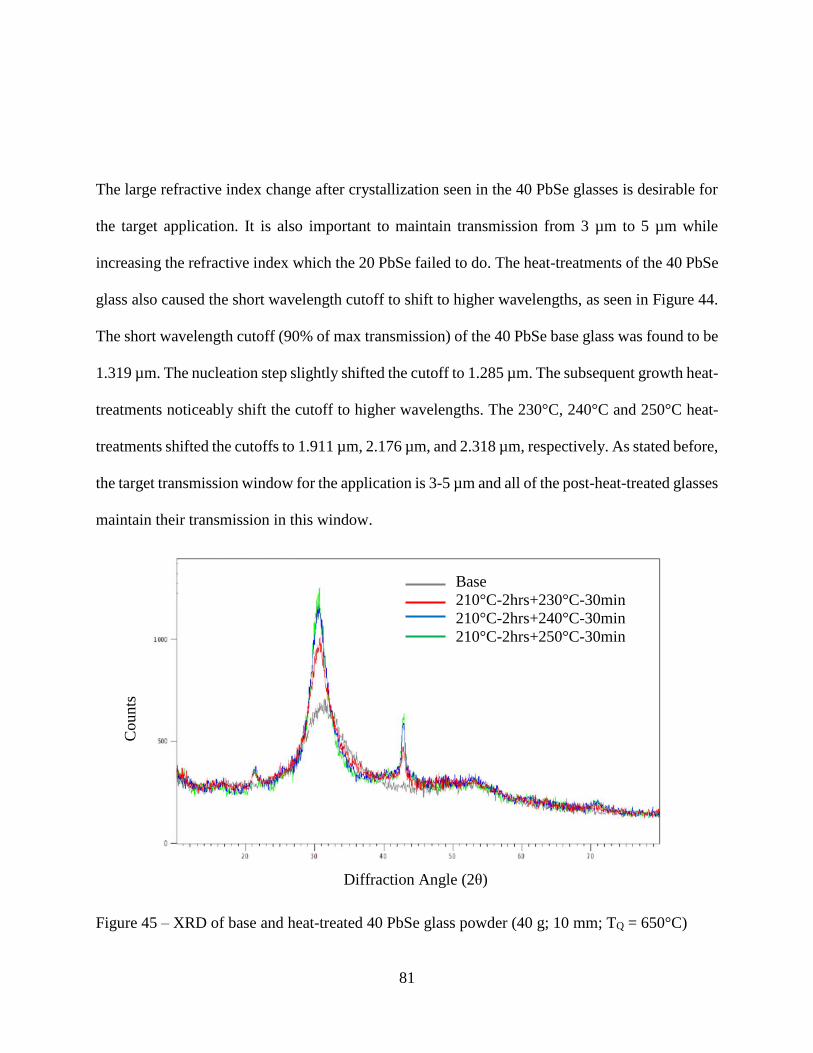
81
The large refractive index change after crystallization seen in the 40 PbSe glasses is desirable for
the target application. It is also important to maintain transmission from 3 µm to 5 µm while
increasing the refractive index which the 20 PbSe failed to do. The heat-treatments of the 40 PbSe
glass also caused the short wavelength cutoff to shift to higher wavelengths, as seen in Figure 44.
The short wavelength cutoff (90% of max transmission) of the 40 PbSe base glass was found to be
1.319 µm. The nucleation step slightly shifted the cutoff to 1.285 µm. The subsequent growth heat-
treatments noticeably shift the cutoff to higher wavelengths. The 230°C, 240°C and 250°C heat-
treatments shifted the cutoffs to 1.911 µm, 2.176 µm, and 2.318 µm, respectively. As stated before,
the target transmission window for the application is 3-5 µm and all of the post-heat-treated glasses
maintain their transmission in this window.
Figure 45 – XRD of base and heat-treated 40 PbSe glass powder (40 g; 10 mm; TQ = 650°C)
Base
210°C-2hrs+230°C-30min
210°C-2hrs+240°C-30min
210°C-2hrs+250°C-30min
Counts
Diffraction Angle (2θ)
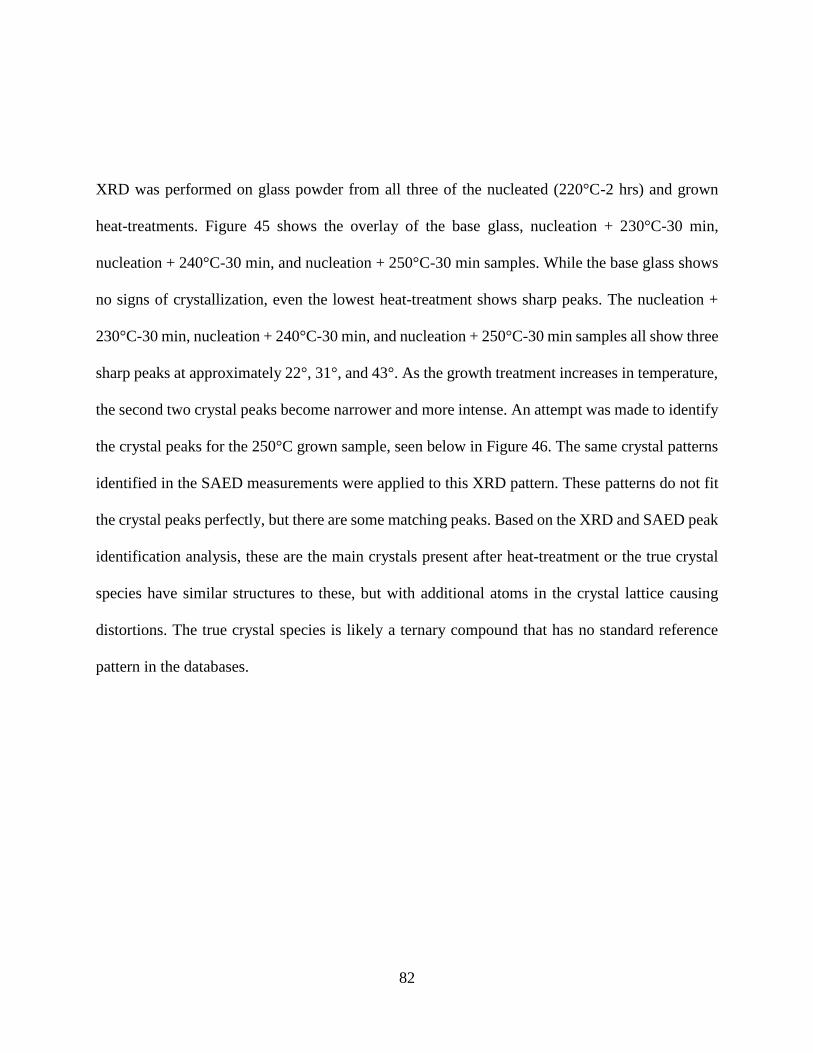
82
XRD was performed on glass powder from all three of the nucleated (220°C-2 hrs) and grown
heat-treatments. Figure 45 shows the overlay of the base glass, nucleation + 230°C-30 min,
nucleation + 240°C-30 min, and nucleation + 250°C-30 min samples. While the base glass shows
no signs of crystallization, even the lowest heat-treatment shows sharp peaks. The nucleation +
230°C-30 min, nucleation + 240°C-30 min, and nucleation + 250°C-30 min samples all show three
sharp peaks at approximately 22°, 31°, and 43°. As the growth treatment increases in temperature,
the second two crystal peaks become narrower and more intense. An attempt was made to identify
the crystal peaks for the 250°C grown sample, seen below in Figure 46. The same crystal patterns
identified in the SAED measurements were applied to this XRD pattern. These patterns do not fit
the crystal peaks perfectly, but there are some matching peaks. Based on the XRD and SAED peak
identification analysis, these are the main crystals present after heat-treatment or the true crystal
species have similar structures to these, but with additional atoms in the crystal lattice causing
distortions. The true crystal species is likely a ternary compound that has no standard reference
pattern in the databases.
83
Figure 46 – XRD of heat-treated 40 PbSe glass powder (210°C-2hr+250°C-30min) with peak
assignments
The 20 PbSe and 40 PbSe glasses examined in the study both showed droplet-matrix phase
separation morphology upon quenching from the melt, but showed opposite Pb-segregation
behavior. Specifically, 20 PbSe glass exhibited Pb-rich droplets in a Pb-deficient matrix whereas
40 PbSe exhibited Pb-deficient droplets within a Pb-rich matrix. The Pb-segregation into the
droplet or matrix phase of the resulting amorphous phase separated morphology has a large effect
on the crystallization behavior on the property evolution of the two glasses. Because the 20 PbSe
glass had Pb-rich droplets, the observed crystallization largely took place within the droplets.
Conversely, the 40 PbSe glass had a Pb-rich matrix and thus crystallization mainly occurring the
matrix. With crystallization in the continuous/majority phase, the 40 PbSe properties are affected
more significantly as seen in the larger changes in hardness, density, and refractive index by the

84
crystallization process than the 20 PbSe where the crystallization occurs in the
discontinuous/minority phase.
85
CHAPTER FIVE: CONCLUSIONS
The research presented in this thesis work has investigated the crystallization behavior in two
multicomponent GeSe2-As2Se3-PbSe glass compositions containing 20 and 40 mol% PbSe (20
PbSe and 40 PbSe, respectively). The glass system was studied to determine its suitability for use
as a candidate GRIN component for use in an IR optical system. Glasses for the desired application
must exhibit suitable transmission within the spectral window of use and a sufficient refractive
index modification to yield a glass-ceramic composite with measurable n as compared to the base
glass’ refractive index. For the target application, we required a material that exhibited
transmission from 3 µm to 5 µm and the ability to induce a measurable change in induced refractive
index (through controlled crystallization of a high index, nanocrystalline phase) enabling two- to
three-dimensional spatial control and formation of a gradient refractive index.
Both glass compositions were found to exhibit droplet-matrix phase separation for melt sizes and
melt/quench protocols used in the study. The as-quenched glass morphology of both glasses
possessed a less stable (to crystallization) Pb-rich phase and a more stable, Pb-deficient phase. The
two compositions differed in two key ways in that 20 PbSe possessed Pb-rich droplets and 40PbSe
was dominated by a Pb-rich matrix phase.
The thermal and physical properties of both glasses were investigated and it was found that both
compositions exhibited crystallization that could be controlled through specific nucleation and
growth thermal protocols. Thermal analysis was used to generate nucleation and growth curves
that provided guidance to the targeted thermal regimes used for subsequent heat-treatments. Index
86
change, while maintaining suitable transmission, was quantified for both targeted heat-treatment
protocols. It was found that the extent and rates of crystallization varied markedly with
composition as related to the starting, as-quenched chemistry and morphology. The resulting post-
heat-treatment crystallization results in both of the glasses studied, result in a positive induced
refractive index change while only the 40 PbSe maintains the required MWIR transmission.
Key findings from the characterization of as-quenched base glass morphology showed that:
- Crystallization tends to occur in the Pb-rich phase of the glass.
- The 20 PbSe glass had Pb-rich droplets and the 40 PbSe glass had a Pb-rich matrix which
expected to directly affect the crystallization behavior; the magnitude of this compositional
variation between droplets and matrices was quantified via XEDS on TEM specimens
prepared to analyze phase separation.
- Droplets in the 20 PbSe glass exhibited a 2-3X increase in Pb (at%) level from the
concentration batched and a concurrent decrease in Ge and As; Se showed no variation in
concentration inside or outside the droplet.
- Droplets in the 40 PbSe glass exhibited a reduction in Pb content (~2X) and Ge content
with a ~1.2X increase in As content.
- Droplets in the 20 PbSe glass (100-130 nm) were found to be roughly twice as big as those
in the 40 PbSe glass (35-45 nm).
- Droplet sizes seen in the respective base glass compositions directly affected the short
wavelength cutoff of the two glasses; the 20 PbSe glass was found to cut off (90% point, ~
2 mm part thickness) at 1.993 µm, whereas the 40 PbSe had a shorter wavelength cutoff of
87
1.319 µm. This is consistent with both the size of the scattering centers seen in the glasses
and the expected index difference between the two glass phases estimated based on Pb-
content.
- Scale-up of the lab-scale melts to commercial size for 20 PbSe, exacerbated the
transmission issue since the larger melt (~1 kg) required slower cooling rates resulting in
glasses that contained larger droplet sizes (200-340 nm); in comparison, this led to a
transmission cutoff (3.78 µm) in the middle of the desired transmission window for a t = 3
mm part.
Nucleation and growth regimes were defined through the creation of nucleation and growth rate
curves from DSC analysis for both compositions. Key findings resulting from these experiments
showed:
- The influence of melt size (40g and 150g) while measurable, was small as defined by the
position of the temperatures of maximum nucleation and growth rate; 40 PbSe glass
showed greater overlap between the two curves reducing the temperature regime where
growth could take place without measurable nucleation.
- Two-step thermal treatment conditions were chosen based on these curves which allowed
selection of suitable temperatures where nucleation could occur without growth (step 1)
and growth could occur without nucleation (step 2). These (specific) temperatures/times
were chosen to create nanocomposite samples that were analyzed for property modification
discussed below.
- Activation energies for crystallization (based on analysis of the first exotherm found in
each glass’ DSC scan) were calculated; it was found that crystallization in the 20 PbSe had
88
a lower activation energy than that seen in the 40 PbSe starting material; we postulate this
is due to the higher local Pb content present in the (first) crystallizing phase being present
in the majority (matrix) phase, rather than in the minority (droplet) phase.
The impact of crystallization on glass’ physical properties were investigated. It was found for the
specific nucleation and growth times and temperatures chosen for this specific example, that:
- Crystallization was found to occur initially in the Pb-rich phase; post heat-treated
(crystallized) glass-ceramics exhibited changes in hardness, density, and refractive index
when crystallization was in the majority (matrix) phase.
- When the crystallization occurred in the minority phase, the hardness and density were
changed negligibly while the refractive index still showed significant change.
- After the two-step heat-treatment protocol, both glasses were shown to produce a
significant Δn, but the heat-treatment required to attain this Δn in the 20 PbSe glass led to
an unacceptable loss in transmission.
This work demonstrates how phase separated glasses differ in their post heat-treated physical
property changes. Additionally, the role of the lower stability phase being in the majority (matrix)
or minority (droplets) for metastable phase separated glasses has been shown. These findings show
how control of the crystallization process can be used to develop a nanocomposite glass-ceramic
with a measurable refractive index change (up to 0.119) with a corresponding acceptable MWIR
transmission. From these findings, such materials can be considered candidates for GRIN
components in an IR optical system. While the composition and crystallization protocols may
require further optimization the basis of this work clearly demonstrates how knowledge of the
89
starting glass morphology and crystallization behavior can be used to engineer a suitable glass-
ceramic for advanced optical applications.

90
APPENDIX A:
2016 DCS PROCEEDING
91
Engineering Novel Infrared Glass Ceramics for Advanced Optical Solutions
K. Richardson*a, A. Buffa, C. Smitha, L. Siskena, J. David Musgravesb, P. Wachtelb, T. Mayerc, e,
A. Swisherc, A. Pogrebnyakovc, M. Kangc, C. Pantanoc, D. Wernerc, A. Kirkd, S. Aikend, C.
Rivero-Baleined
aCollege of Optics and Photonics, CREOL, University of Central Florida, 4000 Central Florida
Blvd., Orlando, FL, USA 29650; bIRradiance Glass, Inc., 3267 Progress Drive, Orlando, FL,
USA 32826; cDept. of Electrical Engineering, The Pennsylvania State University, University
Park, PA, USA 16802; dLockheed Martin Corporation, Orlando, FL, USA 32819; enow at
Virginia Polytechnic Institute and State University, Blacksburg VA 24061
Abstract
Advanced photonic devices require novel optical materials that serve specified optical function
but also possess attributes which can be tailored to accommodate specific optical design,
manufacturing or component/device integration constraints. Multi-component chalcogenide glass
(ChG) materials have been developed which exhibit broad spectral transparency with a range of
physical properties that can be tuned to vary with composition, material microstructure and form.
Specific tradeoffs that highlight the impact of material morphology and optical properties
including transmission, loss and refractive index, are presented. This paper presents the
crystallization behavior and property evolution of 20 GeSe2-60 As2Se3-20 PbSe glass including a
demonstration of a 1D GRIN profile through the use of controlled crystallization.
Keywords: Chalcogenide glass, GRIN, glass-ceramic, nucleation, crystallization, infrared nanocomposite
Introduction
Chalcogenide glasses are well known for their mid-IR transparency and their high refractive index, but are limited by
their weak thermal/mechanical properties. Controlled crystallization of the base glass can improve these properties as
observed in oxide and non-oxide glasses.1, 3, 24 Additionally, introducing crystals may introduce other effects such as
change in refractive index and nonlinear optical properties.4-6 Recent activities by researchers including the those of
the present effort8 have been investigating the strategy to realize manufacturable gradient refractive index materials
as part of the DARPA M-GRIN program.7
A study of glass formation and properties of GeSe2-As2Se3-PbSe system was reported by Yang et al.10 In their work,
they sought a suitable glass composition space for development of IR-transmitting chalcogenide glass-ceramic. In
their previous work,24, 25 the group demonstrated that a stable glass composition is key to producing IR-transmitting
chalcogenide glass-ceramics. Compared to the similar previously reported GeS2-Sb2S3-PbS system24, the GeSe2-based
glasses have better rigidity, chemical stability, and transmit further into the IR.10 Additionally, As2Se3 favors thermal
stability which helps control the crystallite size during heat-treatment.10, 25 Controlled crystallization of these glasses
are important because uncontrolled crystal size leads to opaque glass-ceramics which cannot transmit in the IR.26, 27
Yang et al. mapped the glass forming region of this system (Figure 1).10 In this system, the relatively low Pb content
is expected to fill the role of a nucleation agent with further heat-treatment,10 as similarly reported for an analogous
sulfide system.24
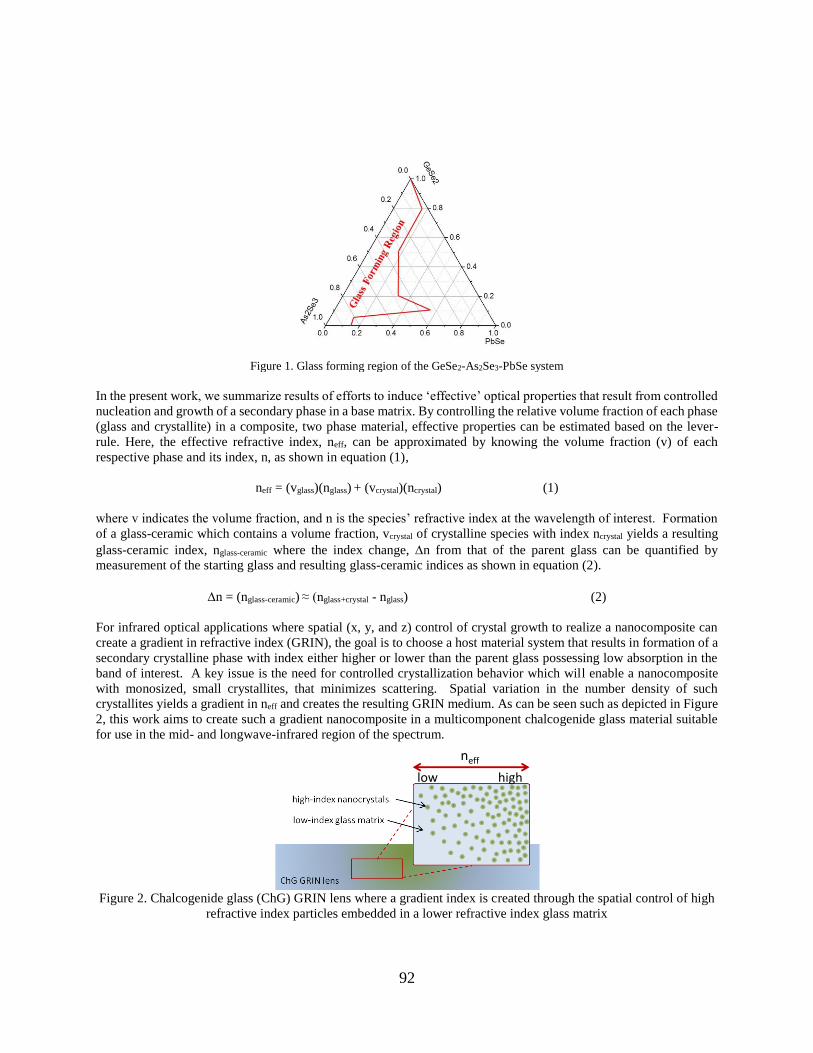
92
In the present work, we summarize results of efforts to induce ‘effective’ optical properties that result from controlled
nucleation and growth of a secondary phase in a base matrix. By controlling the relative volume fraction of each phase
(glass and crystallite) in a composite, two phase material, effective properties can be estimated based on the lever-
rule. Here, the effective refractive index, neff, can be approximated by knowing the volume fraction (v) of each
respective phase and its index, n, as shown in equation (1),
neff = (vglass)(nglass) + (vcrystal)(ncrystal) (1)
where v indicates the volume fraction, and n is the species’ refractive index at the wavelength of interest. Formation
of a glass-ceramic which contains a volume fraction, vcrystal of crystalline species with index ncrystal yields a resulting
glass-ceramic index, nglass-ceramic where the index change, n from that of the parent glass can be quantified by
measurement of the starting glass and resulting glass-ceramic indices as shown in equation (2).
n = (nglass-ceramic) ≈ (nglass+crystal - nglass) (2)
For infrared optical applications where spatial (x, y, and z) control of crystal growth to realize a nanocomposite can
create a gradient in refractive index (GRIN), the goal is to choose a host material system that results in formation of a
secondary crystalline phase with index either higher or lower than the parent glass possessing low absorption in the
band of interest. A key issue is the need for controlled crystallization behavior which will enable a nanocomposite
with monosized, small crystallites, that minimizes scattering. Spatial variation in the number density of such
crystallites yields a gradient in neff and creates the resulting GRIN medium. As can be seen such as depicted in Figure
2, this work aims to create such a gradient nanocomposite in a multicomponent chalcogenide glass material suitable
for use in the mid- and longwave-infrared region of the spectrum.
Figure 2. Chalcogenide glass (ChG) GRIN lens where a gradient index is created through the spatial control of high
refractive index particles embedded in a lower refractive index glass matrix
Figure 1. Glass forming region of the GeSe2-As2Se3-PbSe system
neff
low high
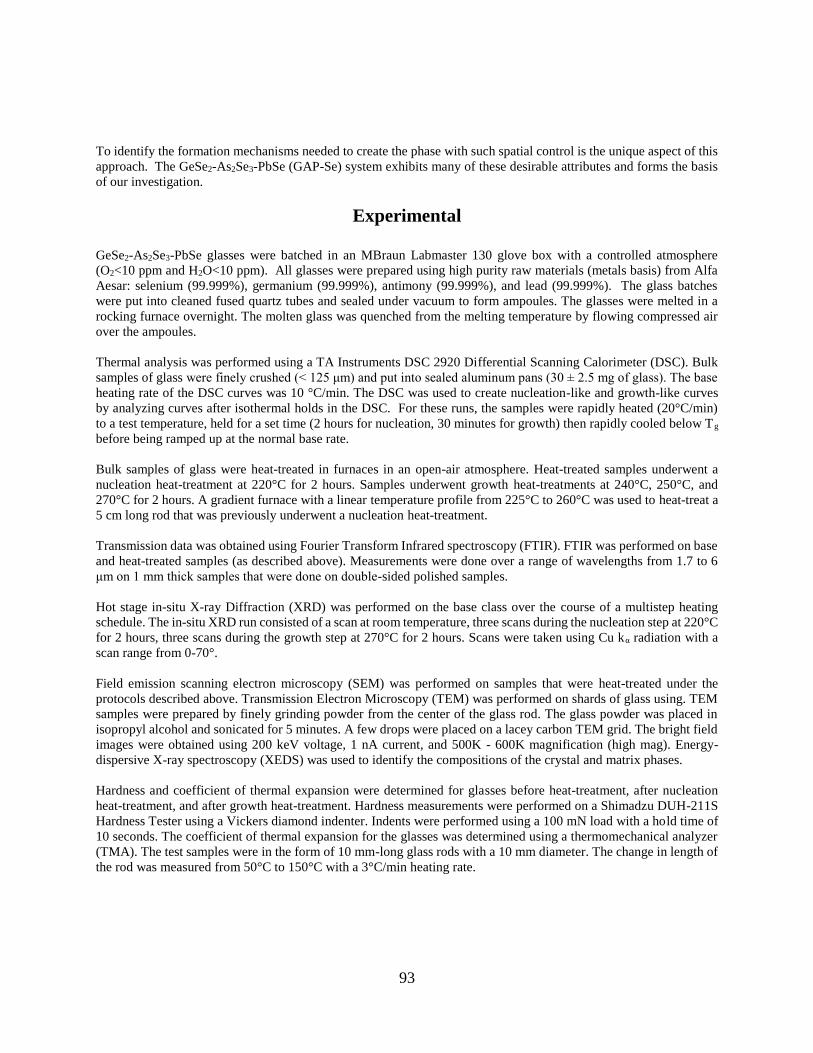
93
To identify the formation mechanisms needed to create the phase with such spatial control is the unique aspect of this
approach. The GeSe2-As2Se3-PbSe (GAP-Se) system exhibits many of these desirable attributes and forms the basis
of our investigation.
Experimental
GeSe2-As2Se3-PbSe glasses were batched in an MBraun Labmaster 130 glove box with a controlled atmosphere
(O2<10 ppm and H2O<10 ppm). All glasses were prepared using high purity raw materials (metals basis) from Alfa
Aesar: selenium (99.999%), germanium (99.999%), antimony (99.999%), and lead (99.999%). The glass batches
were put into cleaned fused quartz tubes and sealed under vacuum to form ampoules. The glasses were melted in a
rocking furnace overnight. The molten glass was quenched from the melting temperature by flowing compressed air
over the ampoules.
Thermal analysis was performed using a TA Instruments DSC 2920 Differential Scanning Calorimeter (DSC). Bulk
samples of glass were finely crushed (< 125 μm) and put into sealed aluminum pans (30 ± 2.5 mg of glass). The base
heating rate of the DSC curves was 10 °C/min. The DSC was used to create nucleation-like and growth-like curves
by analyzing curves after isothermal holds in the DSC. For these runs, the samples were rapidly heated (20°C/min)
to a test temperature, held for a set time (2 hours for nucleation, 30 minutes for growth) then rapidly cooled below Tg
before being ramped up at the normal base rate.
Bulk samples of glass were heat-treated in furnaces in an open-air atmosphere. Heat-treated samples underwent a
nucleation heat-treatment at 220°C for 2 hours. Samples underwent growth heat-treatments at 240°C, 250°C, and
270°C for 2 hours. A gradient furnace with a linear temperature profile from 225°C to 260°C was used to heat-treat a
5 cm long rod that was previously underwent a nucleation heat-treatment.
Transmission data was obtained using Fourier Transform Infrared spectroscopy (FTIR). FTIR was performed on base
and heat-treated samples (as described above). Measurements were done over a range of wavelengths from 1.7 to 6
μm on 1 mm thick samples that were done on double-sided polished samples.
Hot stage in-situ X-ray Diffraction (XRD) was performed on the base class over the course of a multistep heating
schedule. The in-situ XRD run consisted of a scan at room temperature, three scans during the nucleation step at 220°C
for 2 hours, three scans during the growth step at 270°C for 2 hours. Scans were taken using Cu kα radiation with a
scan range from 0-70°.
Field emission scanning electron microscopy (SEM) was performed on samples that were heat-treated under the
protocols described above. Transmission Electron Microscopy (TEM) was performed on shards of glass using. TEM
samples were prepared by finely grinding powder from the center of the glass rod. The glass powder was placed in
isopropyl alcohol and sonicated for 5 minutes. A few drops were placed on a lacey carbon TEM grid. The bright field
images were obtained using 200 keV voltage, 1 nA current, and 500K - 600K magnification (high mag). Energy-
dispersive X-ray spectroscopy (XEDS) was used to identify the compositions of the crystal and matrix phases.
Hardness and coefficient of thermal expansion were determined for glasses before heat-treatment, after nucleation
heat-treatment, and after growth heat-treatment. Hardness measurements were performed on a Shimadzu DUH-211S
Hardness Tester using a Vickers diamond indenter. Indents were performed using a 100 mN load with a hold time of
10 seconds. The coefficient of thermal expansion for the glasses was determined using a thermomechanical analyzer
(TMA). The test samples were in the form of 10 mm-long glass rods with a 10 mm diameter. The change in length of
the rod was measured from 50°C to 150°C with a 3°C/min heating rate.
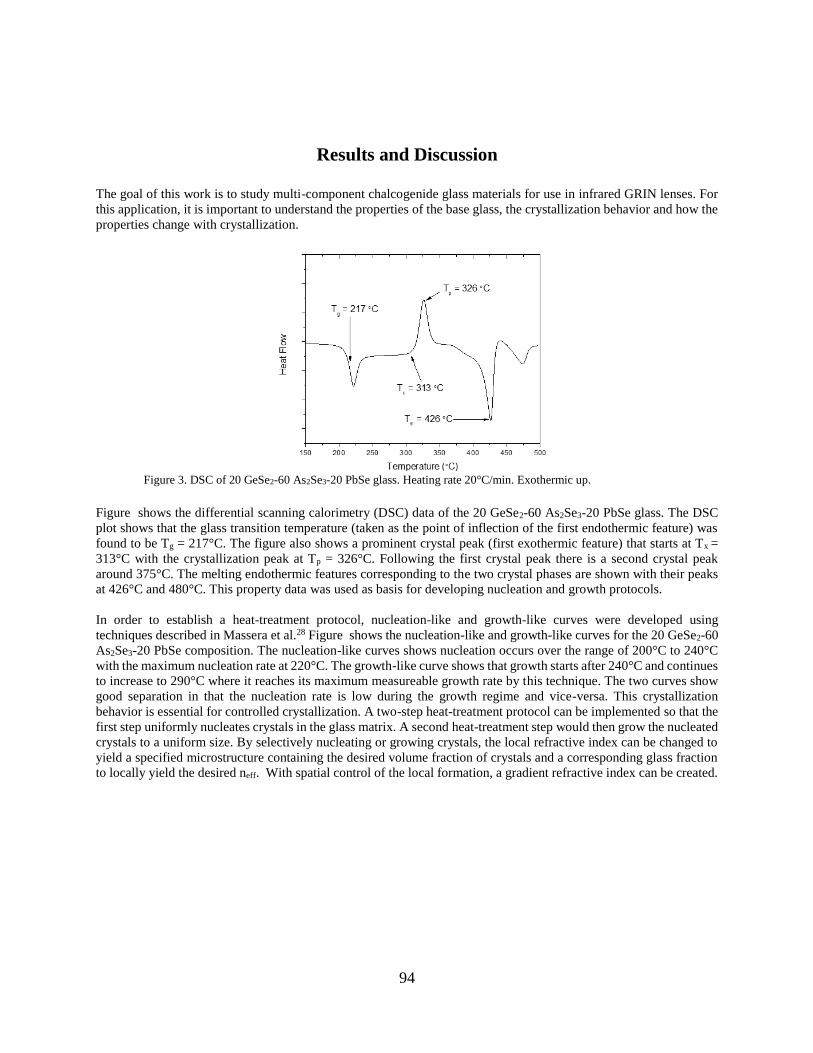
94
Results and Discussion
The goal of this work is to study multi-component chalcogenide glass materials for use in infrared GRIN lenses. For
this application, it is important to understand the properties of the base glass, the crystallization behavior and how the
properties change with crystallization.
Figure 3. DSC of 20 GeSe2-60 As2Se3-20 PbSe glass. Heating rate 20°C/min. Exothermic up.
Figure shows the differential scanning calorimetry (DSC) data of the 20 GeSe2-60 As2Se3-20 PbSe glass. The DSC
plot shows that the glass transition temperature (taken as the point of inflection of the first endothermic feature) was
found to be Tg = 217°C. The figure also shows a prominent crystal peak (first exothermic feature) that starts at Tx =
313°C with the crystallization peak at Tp = 326°C. Following the first crystal peak there is a second crystal peak
around 375°C. The melting endothermic features corresponding to the two crystal phases are shown with their peaks
at 426°C and 480°C. This property data was used as basis for developing nucleation and growth protocols.
In order to establish a heat-treatment protocol, nucleation-like and growth-like curves were developed using
techniques described in Massera et al.28 Figure shows the nucleation-like and growth-like curves for the 20 GeSe2-60
As2Se3-20 PbSe composition. The nucleation-like curves shows nucleation occurs over the range of 200°C to 240°C
with the maximum nucleation rate at 220°C. The growth-like curve shows that growth starts after 240°C and continues
to increase to 290°C where it reaches its maximum measureable growth rate by this technique. The two curves show
good separation in that the nucleation rate is low during the growth regime and vice-versa. This crystallization
behavior is essential for controlled crystallization. A two-step heat-treatment protocol can be implemented so that the
first step uniformly nucleates crystals in the glass matrix. A second heat-treatment step would then grow the nucleated
crystals to a uniform size. By selectively nucleating or growing crystals, the local refractive index can be changed to
yield a specified microstructure containing the desired volume fraction of crystals and a corresponding glass fraction
to locally yield the desired neff. With spatial control of the local formation, a gradient refractive index can be created.
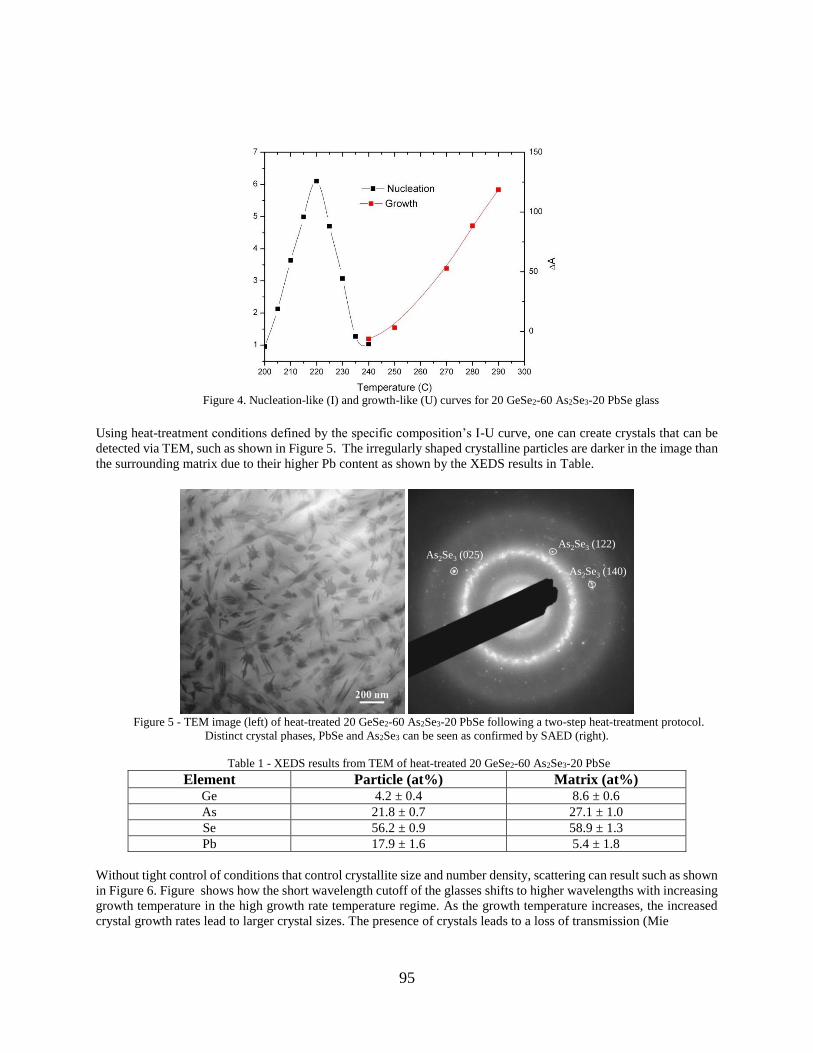
95
Figure 4. Nucleation-like (I) and growth-like (U) curves for 20 GeSe2-60 As2Se3-20 PbSe glass
Using heat-treatment conditions defined by the specific composition’s I-U curve, one can create crystals that can be
detected via TEM, such as shown in Figure 5. The irregularly shaped crystalline particles are darker in the image than
the surrounding matrix due to their higher Pb content as shown by the XEDS results in Table.
Figure 5 - TEM image (left) of heat-treated 20 GeSe2-60 As2Se3-20 PbSe following a two-step heat-treatment protocol.
Distinct crystal phases, PbSe and As2Se3 can be seen as confirmed by SAED (right).
Table 1 - XEDS results from TEM of heat-treated 20 GeSe2-60 As2Se3-20 PbSe
Element Particle (at%) Matrix (at%) Ge 4.2 ± 0.4 8.6 ± 0.6
As 21.8 ± 0.7 27.1 ± 1.0
Se 56.2 ± 0.9 58.9 ± 1.3
Pb 17.9 ± 1.6 5.4 ± 1.8
Without tight control of conditions that control crystallite size and number density, scattering can result such as shown
in Figure 6. Figure shows how the short wavelength cutoff of the glasses shifts to higher wavelengths with increasing
growth temperature in the high growth rate temperature regime. As the growth temperature increases, the increased
crystal growth rates lead to larger crystal sizes. The presence of crystals leads to a loss of transmission (Mie
As2Se3 (122)As2Se3 (025)
As2Se3 (140)
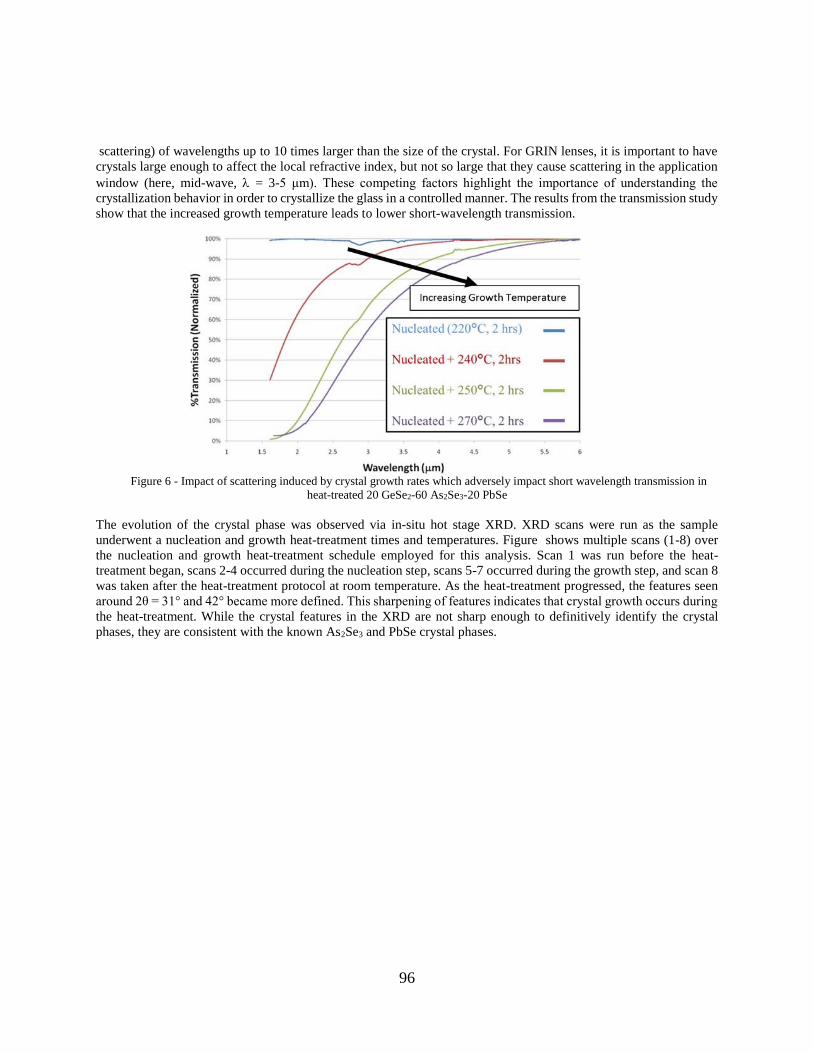
96
scattering) of wavelengths up to 10 times larger than the size of the crystal. For GRIN lenses, it is important to have
crystals large enough to affect the local refractive index, but not so large that they cause scattering in the application
window (here, mid-wave, = 3-5 μm). These competing factors highlight the importance of understanding the
crystallization behavior in order to crystallize the glass in a controlled manner. The results from the transmission study
show that the increased growth temperature leads to lower short-wavelength transmission.
Figure 6 - Impact of scattering induced by crystal growth rates which adversely impact short wavelength transmission in
heat-treated 20 GeSe2-60 As2Se3-20 PbSe
The evolution of the crystal phase was observed via in-situ hot stage XRD. XRD scans were run as the sample
underwent a nucleation and growth heat-treatment times and temperatures. Figure shows multiple scans (1-8) over
the nucleation and growth heat-treatment schedule employed for this analysis. Scan 1 was run before the heat-
treatment began, scans 2-4 occurred during the nucleation step, scans 5-7 occurred during the growth step, and scan 8
was taken after the heat-treatment protocol at room temperature. As the heat-treatment progressed, the features seen
around 2θ = 31° and 42° became more defined. This sharpening of features indicates that crystal growth occurs during
the heat-treatment. While the crystal features in the XRD are not sharp enough to definitively identify the crystal
phases, they are consistent with the known As2Se3 and PbSe crystal phases.
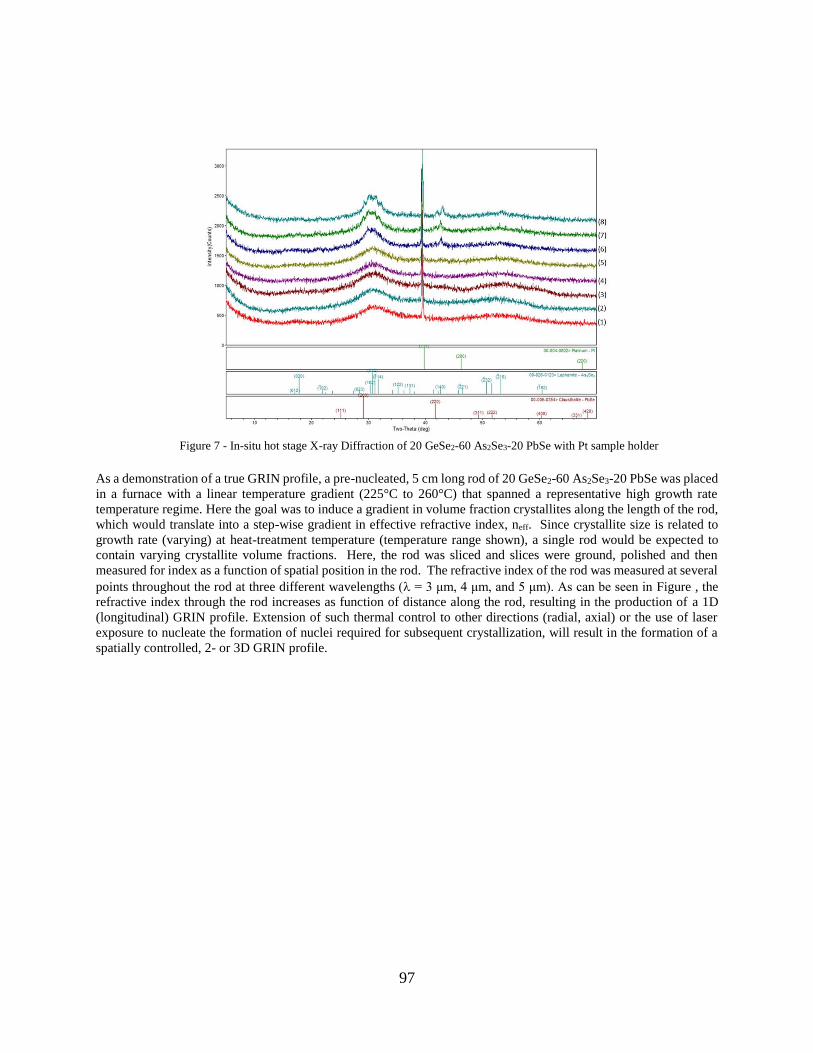
97
Figure 7 - In-situ hot stage X-ray Diffraction of 20 GeSe2-60 As2Se3-20 PbSe with Pt sample holder
As a demonstration of a true GRIN profile, a pre-nucleated, 5 cm long rod of 20 GeSe2-60 As2Se3-20 PbSe was placed
in a furnace with a linear temperature gradient (225°C to 260°C) that spanned a representative high growth rate
temperature regime. Here the goal was to induce a gradient in volume fraction crystallites along the length of the rod,
which would translate into a step-wise gradient in effective refractive index, neff. Since crystallite size is related to
growth rate (varying) at heat-treatment temperature (temperature range shown), a single rod would be expected to
contain varying crystallite volume fractions. Here, the rod was sliced and slices were ground, polished and then
measured for index as a function of spatial position in the rod. The refractive index of the rod was measured at several
points throughout the rod at three different wavelengths = 3 μm, 4 μm, and 5 μm). As can be seen in Figure , the
refractive index through the rod increases as function of distance along the rod, resulting in the production of a 1D
(longitudinal) GRIN profile. Extension of such thermal control to other directions (radial, axial) or the use of laser
exposure to nucleate the formation of nuclei required for subsequent crystallization, will result in the formation of a
spatially controlled, 2- or 3D GRIN profile.
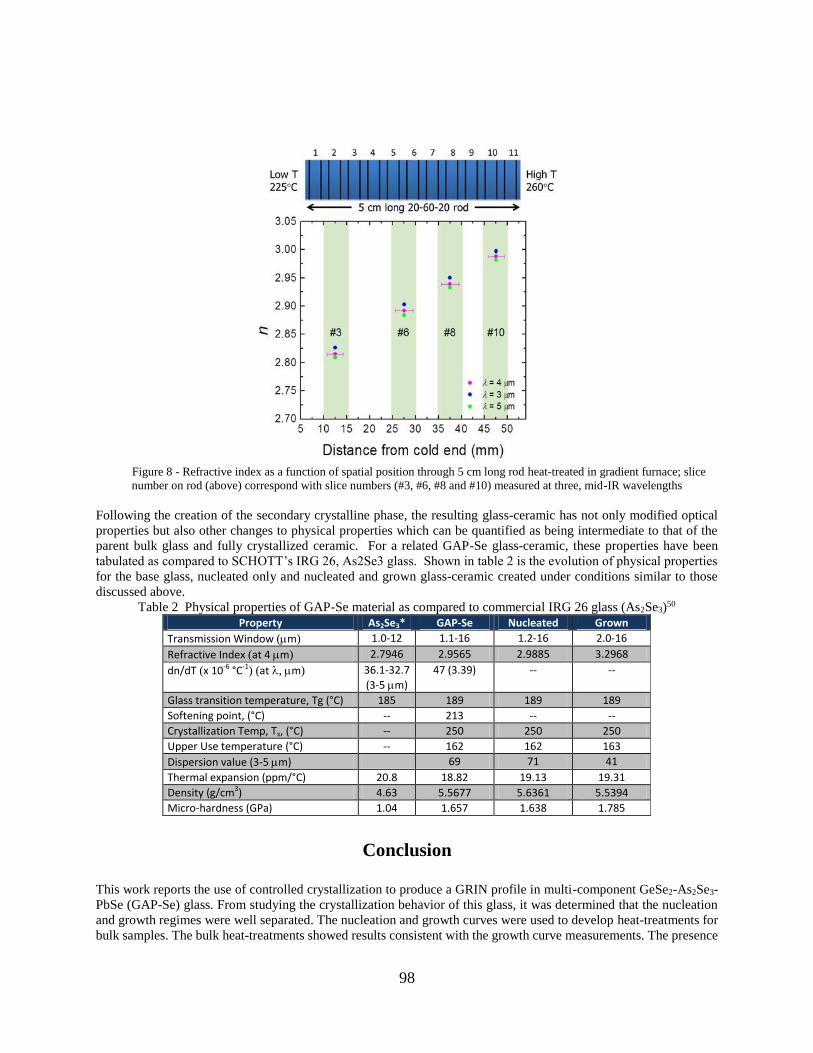
98
Figure 8 - Refractive index as a function of spatial position through 5 cm long rod heat-treated in gradient furnace; slice
number on rod (above) correspond with slice numbers (#3, #6, #8 and #10) measured at three, mid-IR wavelengths
Following the creation of the secondary crystalline phase, the resulting glass-ceramic has not only modified optical
properties but also other changes to physical properties which can be quantified as being intermediate to that of the
parent bulk glass and fully crystallized ceramic. For a related GAP-Se glass-ceramic, these properties have been
tabulated as compared to SCHOTT’s IRG 26, As2Se3 glass. Shown in table 2 is the evolution of physical properties
for the base glass, nucleated only and nucleated and grown glass-ceramic created under conditions similar to those
discussed above.
Table 2 Physical properties of GAP-Se material as compared to commercial IRG 26 glass (As2Se3)50
Conclusion
This work reports the use of controlled crystallization to produce a GRIN profile in multi-component GeSe2-As2Se3-
PbSe (GAP-Se) glass. From studying the crystallization behavior of this glass, it was determined that the nucleation
and growth regimes were well separated. The nucleation and growth curves were used to develop heat-treatments for
bulk samples. The bulk heat-treatments showed results consistent with the growth curve measurements. The presence
Property As2Se3* GAP-Se Nucleated Grown
Transmission Window (m) 1.0-12 1.1-16 1.2-16 2.0-16
Refractive Index (at 4 m) 2.7946 2.9565 2.9885 3.2968
dn/dT (x 10-6 °C-1) (at , m) 36.1-32.7
(3-5 m)
47 (3.39) -- --
Glass transition temperature, Tg (°C) 185 189 189 189
Softening point, (°C) -- 213 -- --
Crystallization Temp, Tx, (°C) -- 250 250 250
Upper Use temperature (°C) -- 162 162 163
Dispersion value (3-5 m) 69 71 41
Thermal expansion (ppm/°C) 20.8 18.82 19.13 19.31
Density (g/cm3) 4.63 5.5677 5.6361 5.5394
Micro-hardness (GPa) 1.04 1.657 1.638 1.785
99
of Pb-rich crystals after heat-treatment were able to locally change the refractive index of the glass. The authors were
able to demonstrate an effective 1D GRIN profile using a gradient furnace to spatially control the growth rate in the
glass. The same formation of the GRIN behavior results in changes in the physical properties which are intermediate
to that of the base glass and that of a fully crystallized ceramic of the same conditions.
ACKNOWLEDGMENTS
This work was supported by the Defense Advanced Research Projects Agency under Air Force Research
Laboratory contract FA8650-12-C-7225 through the M-GRIN Tech Area 2 program.
REFERENCES
[1] Mueller, R. W., Hoeness, H. W. and Glaswerke, S., "Spin-cast ZERODUR mirror substrates
of the 8 m class and lightweighted substrates for secondary mirrors," Adaptive optics and optical
structures, 288-97 (1990).
[2] Shelby, J. E., [Introduction to Glass Science and Technology], The Royal Society of Chemistry,
Cambridge, UK (2005).
[3] Xia, F., Zhang, X., Ren, J., Chen, G., Ma, H. and Adam, J. L. , "Glass formation and
crystallization behavior of a novel GeS2-Sb2S3-PbS chalcogenide glass system," J Am Ceram Soc
89(7), 2154-7 (2006).
[4] Lumeau, J., Sinitskii, A., Glebova, L., Glebov, L. B. and Zanotto, E. D. , "Method to assess the
homogeneity of partially crystallized glasses: application to a photo-thermo-refractive glass,"
J.Non Cryst.Solids 355(34-36), 1760-8 (2009).
[5] Oikawa, T., Honma, T. and Komatsu, T. , "Laser-induced crystal growth of nonlinear optical
Ba3Ti 3O6 (BO3)2 on glass surface," Crystal Research and Technology 43(12), 1253-1257
(2008).
[6] Zeng, H., Liu, Z., Jiang, Q., Li, B., Yang, C., Shang, Z., Ren, J. and Chen, G. , "Large third-
order optical nonlinearity of ZnO-Bi2O3-B2O3 glass-ceramic containing Bi2ZnB2O7
nanocrystals," Journal of the European Ceramic Society 34(16), 4383-4388 (2014).
[7] Mayer, T., Werner, D., Rivero-Baleine, C. and Richardson, K. "Innovative Design and
Manufacturing of Gradient-Index-Based Transformation Optics Components," FA8650-12-C-
7225 (2012).
[8] Maher, M. "Manufacturable Gradient Index Optics (M-GRIN)," DARPA, 2016
<http://www.darpa.mil/program/manufacturable-gradient-index-optics> (17 February 2016).
[9] Yang, G., Zhang, X., Ren, J., Yunxia, Y., Chen, G., Ma, H. and Adam, J. L. , "Glass formation
and properties of chalcogenides in a GeSe 2-As2Se3-PbSe system," J Am Ceram Soc 90(5), 1500-
1503 (2007).
[10] Donghui, Z., Fang, X., Guorong, C., Xianghua, Z., Hongli, M. and Adam, L. J. , "Formation
and properties of chalcogenide glasses in the GeSe2-As2Se3-CdSe system," J Am Ceram Soc
88(11), 3143-6 (2005).
[11] Cheng Ji-jian, "Microstructure and properties of selenide glasses after controlled
crystallization," Proceedings of the International and VIIth University Conference on Glass
Science, 303-8 (1983).
100
[12] Soon-Mo Song, Se-Young Choi and Yong-Keun Lee , "Crystallization property effects in
Ge30Se60Te10 glass," J.Non Cryst.Solids 217(1), 79-82 (1997).
[13] Massera, J., Remond, J., Musgraves, J., Davis, M. J., Misture, S., Petit, L. and Richardson, K.
, "Nucleation and growth behavior of glasses in the TeO2–Bi2O3–ZnO glass system," J.Non
Cryst.Solids 356(52–54), 2947-2955 (2010).
[14] SCHOTT , "Infrared Chalcogenide Glasses," 17 February 2016
<http://www.us.schott.com/advanced_optics/english/products/optical-materials/ir-
materials/infrared-chalcogenide-glasses/> (17 February 2016).

101
APPENDIX B:
MACH-ZEHNDER INTERFEROMETER FOR 2-D GRIN PROFILE
MEASUREMENT
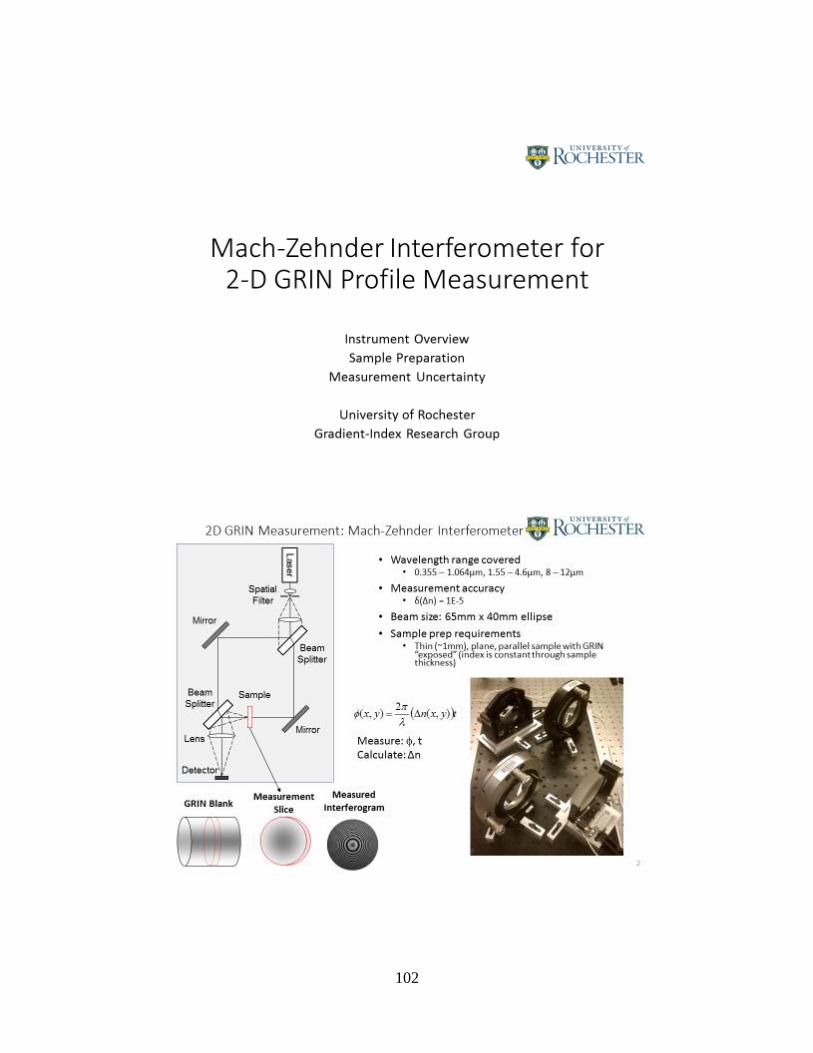
102
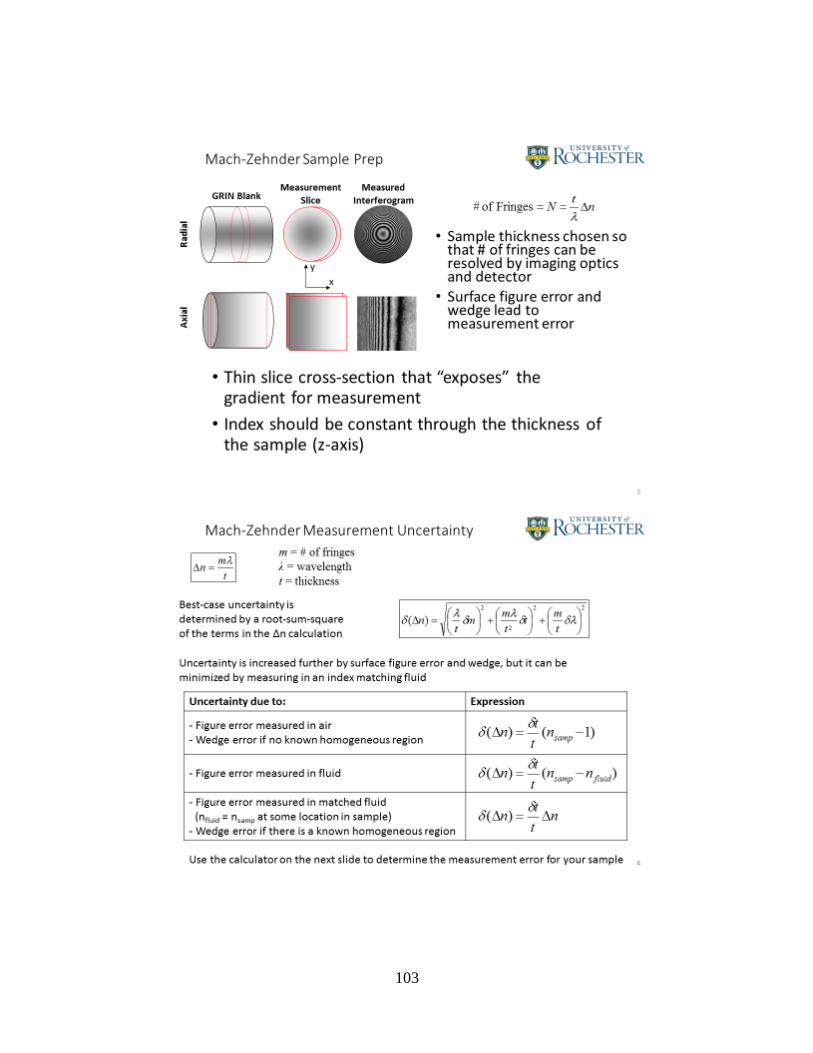
103
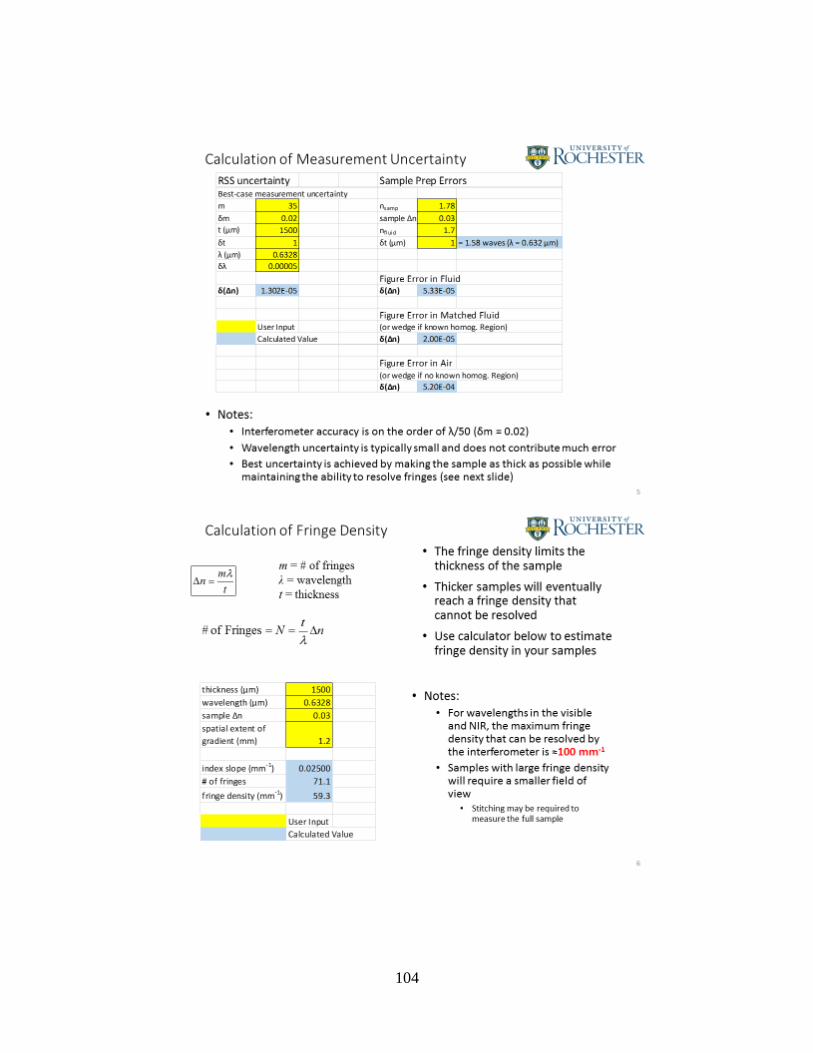
104

105
APPENDIX C:
SAGNAC RING INTERFEROMETER FOR ABSOLUTE INDEX OF
REFRACTION MEASUREMENTS
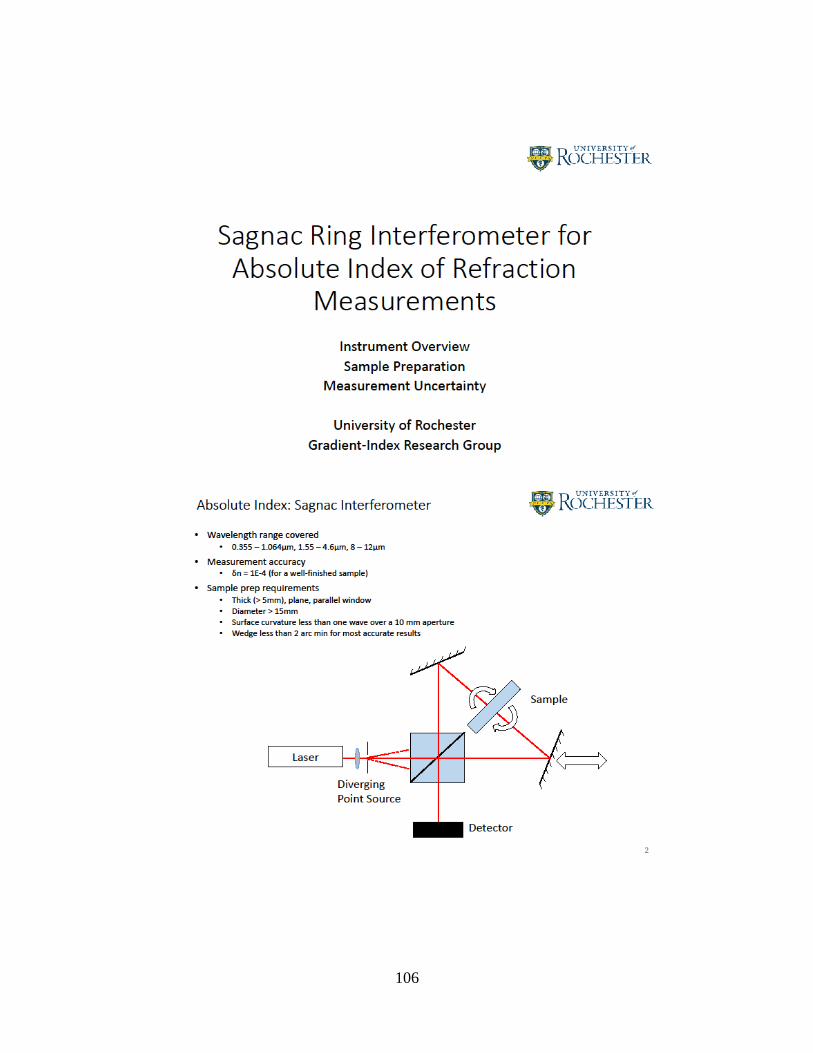
106
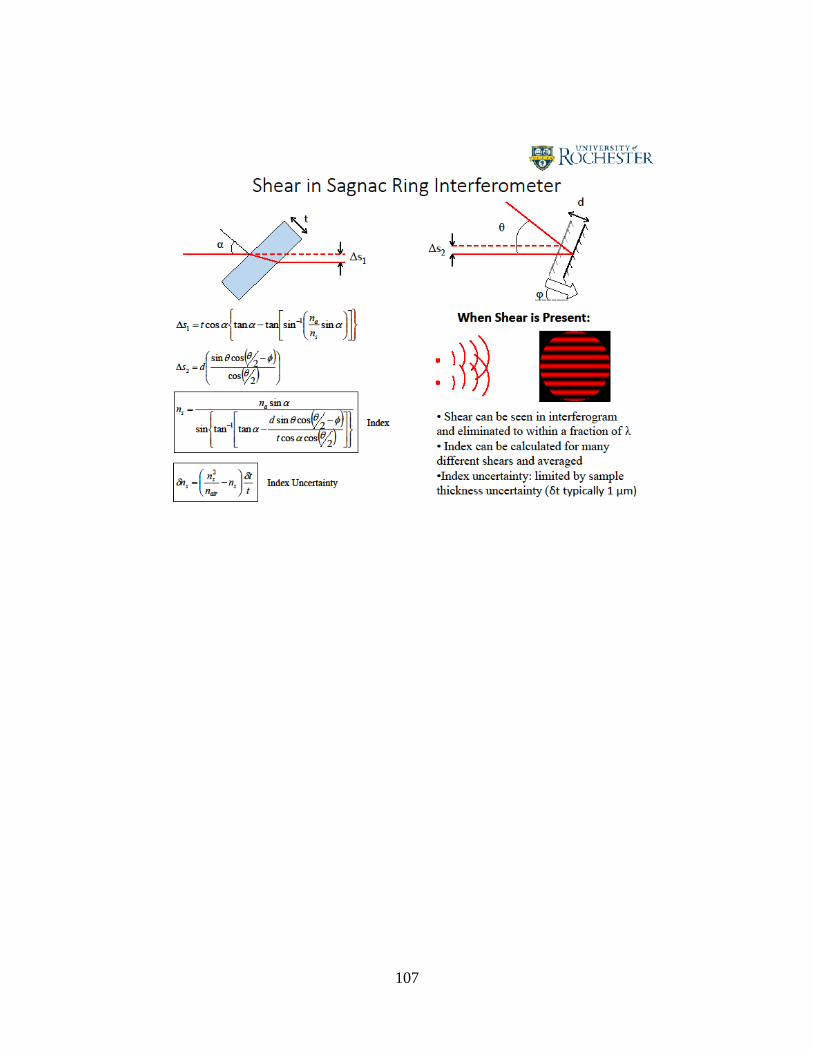
107
108
REFERENCES
1. J.E. Shelby, Introduction to Glass Science and Technology; The Royal Society of Chemistry,
Cambridge, UK, 2005.
2. T.H. Courtney, Mechanical Behavior of Materials; Waveland Press, Inc., Long Grove, Illinois,
2000.
3. R.W. Mueller, H.W. Hoeness and S. Glaswerke. "Spin-cast ZERODUR mirror substrates of the
8 m class and lightweighted substrates for secondary mirrors," Proceedings of the SPIE - The
International Society for Optical Engineering, 1271, 288-97 (1990).
4. J. Lumeau, A. Sinitskii, L. Glebova, L.B. Glebov and E.D. Zanotto. "Method to assess the
homogeneity of partially crystallized glasses: application to a photo-thermo-refractive glass," J.
Non Cryst. Solids, 355, 1760-8 (2009).
5. T. Oikawa, T. Honma and T. Komatsu. "Laser-induced crystal growth of nonlinear optical
Ba3Ti 3O6 (BO3)2 on glass surface," Crystal Research and Technology, 43, 1253-7 (2008).
6. H. Zeng, Z. Liu, Q. Jiang, et al. "Large third-order optical nonlinearity of ZnO-Bi2O3-B2O3
glass-ceramic containing Bi2ZnB2O7 nanocrystals," Journal of the European Ceramic Society,
34, 4383-8 (2014).
7. M. Maher, "Manufacturable Gradient Index Optics (M-GRIN)," 2016,
8. T. Mayer, D. Werner, C. Rivero-Baleine and K. Richardson. "Innovative Design and
Manufacturing of Gradient-Index-Based Transformation Optics Components," FA8650-12-C-
7225, (2012).
9. K. Richardson, J.D. Musgraves, P. Wachtel, C. Rivero-Baleine and T. Mayer. "Method of
Forming an Optical Device and Optical Apparatus," U.S. Pat. 9,340,446, 2016.
10. G. Yang, X. Zhang, J. Ren, et al. "Glass formation and properties of chalcogenides in a GeSe
2-As2Se3-PbSe system," J Am Ceram Soc, 90, 1500-3 (2007).
11. B. Jensen and A. Torabi. "The refractive index of compounds PbTe, PbSe, and PbS," IEEE J.
Quant. Electron., QE-20, 618-21 (1984).
12. S. Sapra, J. Nanda, J.M. Pietryga, J.A. Hollingsworth and D.D. Sarma. "Unraveling internal
structures of highly luminescent PbSe nanocrystallites using variable-energy synchrotron radiation
photoelectron spectroscopy," J Phys Chem B, 110, 15244-50 (2006).
109
13. S. Hudgens and B. Johnson. "Overview of phase-change chalcogenide nonvolatile memory
technology," MRS Bull, 29, 829-32 (2004).
14. K. Richardson, N. Carlie, J. David Musgraves, et al. "Integrated chalcogenide waveguide
resonators for mid-IR sensing: Leveraging material properties to meet fabrication challenges,"
(2011).
15. L. Yajing, S. Baoan, D. Wei, et al. "Application of chalcogenide glass in car night-vision
system," Infrared and Laser Engineering, 43, 2815-18 (2014).
16. M. Roze, L. Calvez, Y. Ledemi, M. Allix, G. Matzen and X. Zhang. "Optical and mechanical
properties of glasses and glass-ceramics based on the Ge-Ga-Se system," J Am Ceram Soc, 91,
3566-70 (2008).
17. A.K. Varshneya, Fundamentals of Inorganic Glasses; Academics Press, Inc., San Diego, CA,
1994.
18. M.J. Madou, Fundamentals of microfabrication and nanotechnology. Volume 1, Volume 1,
CRC Press, Boca Raton, FL, 2012.
19. W.H. Armistead and S.D. Stookey. "Photochromic silicate glasses sensitized by silver halides,"
Science, 144, 150-4 (1964).
20. S.D. Stookey, G.H. Beall and J.E. Pierson. "Full-color photosensitive glass," J. Appl. Phys.,
49, 5114-23 (1978).
21. X. Zhang, H. Ma, J. Lucas, Y. Guimond and S. Kodjikian. "Optical fibers and molded optics
in infrared transparent glass-ceramic," J. Non Cryst. Solids, 336, 49-52 (2004).
22. G. Dong, H. Tao, X. Zhao, X. Xiao, C. Lin and H. Guo. "Second harmonic generation in
transparent microcrystalline -CdGa2S4-containing chalcogenide glass ceramics," Opt. Commun.,
274, 466-70 (2007).
23. L. Calvez, H. Ma, J. Lucas and X. Zhang. "Selenium-based glasses and glass ceramics
transmitting light from the visible to the far-IR," 19, 129-32 (2007).
24. F. Xia, X. Zhang, J. Ren, G. Chen, H. Ma and J.L. Adam. "Glass formation and crystallization
behavior of a novel GeS2-Sb2S3-PbS chalcogenide glass system," J Am Ceram Soc, 89, 2154-7
(2006).
25. Z. Donghui, X. Fang, C. Guorong, Z. Xianghua, M. Hongli and L.J. Adam. "Formation and
properties of chalcogenide glasses in the GeSe2-As2Se3-CdSe system," J Am Ceram Soc, 88,
3143-6 (2005).
110
26. Cheng Ji-jian, "Microstructure and properties of selenide glasses after controlled
crystallization," J. Non Cryst. Solids, 56, 303-8 (1983).
27. Soon-Mo Song, Se-Young Choi and Yong-Keun Lee. "Crystallization property effects in
Ge30Se60Te10 glass," J. Non Cryst. Solids, 217, 79-82 (1997).
28. J. Massera, J. Remond, J. Musgraves, et al. "Nucleation and growth behavior of glasses in the
TeO2–Bi2O3–ZnO glass system," J. Non Cryst. Solids, 356, 2947-55 (2010).
29. K. Matusita, T. Komatsu and R. Yokota. "Kinetics of nonisothermal crystallization process
and activation energy for crystal growth in amorphous materials," J. Mater. Sci., 19, 291-6 (1984).
30. S. Kurajica, A. Bezjak and E. Tkalcec. "Resolution of overlapping peaks and the determination
of kinetic parameters for the crystallization of multicomponent system from DTA or DSC curves:
Part I. Non-isothermal kinetics," Thermochimica Acta, 288, 123- (1996).
31. A. Marotta, A. Buri and F. Branda. "Nucleation in glass and differential thermal analysis," J.
Mater. Sci., 16, 341-4 (1981).
32. C.S. Ray, K.S. Ranasinghe and D.E. Day. "Determining crystal growth rate-type of curves in
glasses by differential thermal analysis," Solid State Sciences, 3, 727-32 (2001).
33. J. ShanelovA, J. Malek, M.D. Alcala and J.M. Criado. "Kinetics of crystal growth of
germanium disulfide in Ge0.38S0.62 chalcogenide glass," J. Non Cryst. Solids, 351, 557-67
(2005).
34. H.L. Ma, M. Matecki, X.H. Zhang and S. Rogard. "Determination of the nucleation and crystal
growth rate curves of a chalcohalide glass from DSC experiments," J. Mater. Sci. Lett., 16, 21-2
(1997).
35. E.R. Shaaban, "Non-isothermal crystallization kinetic studies on a ternary,
Sb0.14As0.38Se0.48 chalcogenide semi-conducting glass," Physica B, 373, 211-16 (2006).
36. Smallman, Raymond E., Ngan,A.H.W., Physical metallurgy and advanced materials;
Butterworth-Heinemann, Amsterdam [u.a.], 2007.
37. C. Smith, K. Chamma, D. McClane, et al. "Investigation of Morphology Changes in the GeSe2-
As2Se3-PbSe System with Varying PbSe Content," GOMD, (2015).
38. V.V. Golubkov, O.S. Dymshits, V.I. Petrov, et al. "Small-angle X-ray scattering and low-
frequency Raman scattering study of liquid phase separation and crystallization in titania-
containing glasses of the ZnO-Al2O3-SiO2 System," J. Non Cryst. Solids, 351, 711-21 (2005).
39. I.S. Patel, P.W. Schmidt and S.M. Ohlberg. "Small-angle X-ray scattering study of phase
separation in glasses," J. Appl. Phys., 43, 1636-41 (1972).
111
40. S. Bhattacharyya, T. Hoche, K. Hahn and P.A. van Aken. "Various transmission electron
microscopic techniques to characterize phase separation - illustrated using a LaF3 containing
aluminosilicate glass," J. Non Cryst. Solids, 355, 393-6 (2009).
41. O. Dargaud, L. Cormier, N. Menguy and G. Patriarche. "Multi-scale structuration of glasses:
Observations of phase separation and nanoscale heterogeneities in glasses by Z-contrast scanning
electron transmission microscopy," J. Non Cryst. Solids, 358, 1257-62 (2012).
42. S. Chenu, E. Veron, C. Genevois, et al. "Tuneable Nanostructuring of Highly Transparent Zinc
Gallogermanate Glasses and Glass-Ceramics," Advanced Optical Materials, 2, 364-72 (2014).
43. F. Abdel-Wahab, "Observation of phase separation in some Se-Te-Sn chalcogenide glasses,"
Physica B, 406, 1053-9 (2011).
44. T. Ozawa, "Kinetic analysis of derivative curves in thermal analysis," 2, 301-24 (1970).
45. N. Carlie, N.C. Anheier J., H.A. Qiao, et al. "Measurement of the refractive index dispersion
of As2Se3 bulk glass and thin films prior to and after laser irradiation and annealing using prism
coupling in the near- and mid-infrared spectral range," Rev. Sci. Instrum., 82, 053103 (7 pp.)
(2011).
46. H.A. Qiao, N.C. Anheier, J.D. Musgrave, K. Richardson and D.W. Hewak. "Measurement of
chalcogenide glass optical dispersion using a mid-infrared prism coupler," Proceedings of the SPIE
- The International Society for Optical Engineering, 8016, 80160F (10 pp.) (2011).
47. B. Gleason, K. Richardson, L. Sisken and C. Smith. "Refractive Index and Thermo-Optic
Coefficients of Ge-As-Se Chalcogenide Glasses," (2016).
48. Schott Glass, "Extremely high homogeneity for large precision optics," 2016, (2013).
49. J.A. Augis and J.E. Bennett. "Calculation of the Avrami parameters for heterogeneous solid
state reactions using a modification of the Kissinger method," J Therm Anal, 13, 283-92 (1978).
50. Schott Glass. "Infrared Chalcogenide Glasses," 2016.
51. K. Richardson, A. Buff, C. Smith, et al. “Engineering Novel Infrared Glass Ceramics for
Advanced Optical Solutions,” Proc. SPIE Vol. 9822 paper # 9822-4, Baltimore MD (2016).