a stratified sampling approach to the spatial accuracy assessment of digital cartography: an...
TRANSCRIPT
7th International Symposium on Spatial Accuracy Assessment in Natural Resources and Environmental Sciences. Edited by M. Caetano and M. Painho.
99
A stratified sampling approach to the spatial accuracy assessment of digital cartography: an application to the Portuguese Ecological Reserve
Miguel Peixoto1, Ana Cristina Costa1, Marco Painho1 and Thomas Bartoschek1, 2 1 Instituto Superior de Estatística e Gestão de Informação Universidade Nova de Lisboa Campus de Campolide, 1070-312 Lisboa, Portugal Tel.: + 351 21 387 04 13; Fax: + 351 21 387 21 40 [email protected]; [email protected]; [email protected]; [email protected]
2 Institute for Geoinformatics University of Münster Robert-Koch-Str. 26-28, 48149 Münster, Germany Tel.: +49 (0) 251 83 33083; Fax: +49 (0) 251 83 39763 [email protected]
Abstract Managing spatial data in paper maps is quite different from managing digital spatial information. Sometimes manual vectorization of scanned maps is the only way to produce digital cartography, especially when the only source of spatial information is a paper map. Digital scanning and manual vectorization are two processes well known for adding error to data and accuracy is a particularly important issue for users of spatial information. The National Ecological Reserve (Reserva Ecológica Nacional - REN) established in the Portuguese national law protects areas with a diversified bio-physic structure and specific ecological characteristics. This information is often required to manage several human activities, such as mineral extraction, real estate, industry, tourism, etc. REN maps were originally produced in paper and were vectorized to produce digital cartography. The objective of this study is to measure the spatial accuracy and to assure the conformity with the original cartography. The accuracy of the REN digital cartography was assessed through a stratified sampling scheme, with strata defined as ecological classes within each county. The global sample size and the strata samples sizes were first determined assuring proportional area representation of each class. The sampling methodology assumes a sampling error equal to 1% for the estimation of the digital cartography errors proportion in the whole study area, for a 95% confidence level. The complexity and uncertainty inherent to each ecological class was taken into consideration on the computation of those samples sizes by using the results from a previous pilot study. The final global sample size and the strata sample sizes were established assuring at least two sample units in each stratum. The sampling methodology and the accuracy assessment procedure are detailed, finally the results are discussed and some conclusions of this study are drawn.
Keywords: data quality; quality control; stratified sampling; National Ecological Reserve
1 Introduction The natural patrimony preservation and appraisal can only be reached through an effective and adjusted legal protection in tune with the physical reality. The community’s public conscience for this matter also plays an important role in environmental protection. The public conscience can only be enlightened by spreading specific information on this topic to the Society. The quality of the information is an important factor, because it allows to have confidence in the
7th International Symposium on Spatial Accuracy Assessment in Natural Resources and Environmental Sciences. Edited by M. Caetano and M. Painho.
100
use of information and guarantees the adequacy of the results of this use. The REN constitutes an ideal set of geographic information to make this awareness effort, however, no so long ago, this information was in paper maps. Spreading and managing spatial data in paper maps is quite different from spreading and managing digital spatial information.
In September 14, 2001 a agreement between Instituto Superior de Estatística e Gestão de Informação of Universidade Nova de Lisboa (ISEGI-UNL) and Direcção Regional do Ambiente do Alentejo (DRA Alentejo), nowdays Comissão de Coordenação e Desenvolvimento Regional do Alentejo (CCDR Alentejo) was established and signed. The main objective of this agreement was to turn available an accurate digital geographic database of the REN in Portugal of the Alentejo region, to the Portuguese community.
The digital geographic database was created from the REN original paper cartography through digital scanning, geo-referencing and manual vectorization (Painho et al. 2005), all these processes are well known for adding error to spatial data information, thus accuracy assessment was a particularly important issue and played a major role during all this effort. This article explains the methodology used to assess the spatial data quality and conformity of the REN’s digital geographic database with it’s the original paper cartography.
1.1 The Portuguese National Ecological Reserve The REN is a Portuguese legal instrument that provides to sensitive ecosystems protection. Portugal has a law that defines areas of REN where these sensitive ecosystems are located stating also what kind of protection they need. In those areas it is forbidden the lotting of land, sewer construction, building construction, hydraulic works, road construction, land cut and the vegetation destruction. The delimitation of those areas was a manual processes (Painho and Gomes, 1999).
The REN was first legally established in July 5, 1983 by the Decree-law nr. 321/83. Official journal 152/83 Series I., issued by the Minister of Quality of Life and was defined as “[…].an essential area for the ecological stability and sustainable management of natural resources […]” (Decreto-Lei n.º 321/83, 1983). REN’s definition continues in a more up to date Decree-law as “[…] a basic and diverse biophysical structure that, by conditioning the use of areas with specific ecological characteristics, secures the protection of ecosystems and the remaining and intensification of the biological process indispensable to a well-balanced framing of human activities. […]” (Decreto-Lei n.º 93/90, 1990).
The REN regulation was created to “-[…] enable resources and land use exploitation, protecting certain functions and potentialities for which the ecological balance and the biophysical structure of regions depend upon, as well as the permanency of many of their economic, social and cultural values.[…] ” (Decreto-Lei n.º 93/90, 1990).
According to article nr 2 of Decree-law nr. 321/83, 1983, the areas that are considered as REN are:
1 - Costal zones: a) Beaches. b) Coastal dunes, primary and secondary. c) Cliffs, including protection bands up to 200m. d) If dunes and cliffs don’t exist inside a 500 m band, a protection buffer for the coastal
zone.
7th International Symposium on Spatial Accuracy Assessment in Natural Resources and Environmental Sciences. Edited by M. Caetano and M. Painho.
101
e) Estuaries, lagoons, costal lakes and adjacent wet lands, including a 100 m protection band.
f) Islands, Islets and emersed rocks.
2 - Inland ecosystems: a) Lakes, including a 100 m protection band. b) Dams, including a 100 m protection band. c) Rivers and water streams. d) Tops of the streams. e) Steep slope zones, slopes over 25%. f) Scarps, including protection bands. g) Maximum infiltration areas. h) Erosion risk areas. i) Highways and secondary roads, including protection bands. j) Maritime natural water line, including protection bands.
2 Methodological framework The purpose of the accuracy assessment is to identify and quantify positional and thematic errors in the REN - Portuguese Ecological Reserve digital geographic database, by comparing the REN classification of the digital database versus the reference paper cartography at various spatial locations.
The accuracy of the REN digital geographic database was assessed through a stratified random sampling scheme. This section details the sampling methodology, and in particular the statistical details for the computation of the global sample size, the stratum sample sizes, the positional and thematic errors proportions estimates and the sampling error.
Nusser and Klaas (2003) state that, ideally, accuracy estimates are based on probability samples and statistical estimation methods that provide a measure of the precision of the estimated accuracy rate. In fact, a probability-based sampling strategy has multiple advantages from which the most important one is that it allows estimates of parameters from a limited number of units to be extrapolated, with known uncertainty, to the entire population. Among the probability sampling designs, stratified random sampling is a powerful and flexible method that is widely used in practice.
In a stratified random sampling approach, the target population is divided into H non-overlapping subpopulations, called strata. A simple random sample without replacement of units is independently selected from each stratum, where the stratum sample sizes are nh (h=1,…,H), and the global sample size is n=Σnh.
There are several reasons for the popularity of stratified random sampling, including the following (Cochran, 1977; Lehtonen and Pahkinen, 1996): (i) stratification can enhance the precision of estimates if each stratum is homogeneous; (ii) stratification provides unbiased estimates of parameters not only for the whole population, but also for each stratum; (iii) stratification can guarantee representation of small subpopulations in the sample if desired.
The amount of increase in precision of sample estimates accomplished by stratification will depend on the degree of homogeneity that is achieved within strata, i.e. stratification enhances
7th International Symposium on Spatial Accuracy Assessment in Natural Resources and Environmental Sciences. Edited by M. Caetano and M. Painho.
102
precision when within-stratum variation is low. When geographic strata are used, a positive spatial correlation is beneficial since positive spatial correlation indicates that geographically nearby elements have similar response values, thus producing the favourable within stratum homogeneity (Stehman, 2000).
For the accuracy assessment of the REN digital geographic database, a stratified sampling design is particularly recommended since reasonable estimates are needed for REN classes that are inherently complex or have a poor readability in the original paper map. Furthermore, since stratification ensures that a specified sample size is obtained in each stratum (REN class), including those small ones that would not be prevalent in a simple random or systematic sample without stratification, this strategy also guarantees unbiased estimates for small REN classes.
In this study, the target population is the region represented by the REN digital cartography map, and the area sampling frame is the REN region from the digital geographic database, with 739 strata defined as REN classes and regions not classified as REN, within each county. The parameters to be estimated are the digital cartography, positional and thematic, errors proportions for the entire area of interest and within each stratum. The global study area accounts for 25.510,48 Km2 in Alentejo, Southern Portugal.
The area sampling frame provides a description of the population and strata boundaries. The sampling protocol used with an area frame is based on first selecting a sample of spatial locations, followed by associating a sampling unit with each sampled location (Stehman and Czaplewski, 1998). The sampling algorithm and the response design implemented are detailed by Bartoschek et al. (2006).
The comparison of the REN classes from the digital geographic database and reference classifications is conducted on the scale of a sampling unit. The sampling units are defined as site locations (spatial coordinates) within the boundaries of the 43 counties from the digital geographic database. Therefore, the statistical population associated with this point sampling unit is viewed as continuous, rather than partitioned into discrete spatial units (e.g. pixels).
Accuracy assessment problems are usually treated in a finite population sampling framework, since the sampling units employed, or recommended for various accuracy assessment projects, are usually defined as pixels, polygons, and fixed-area plots (Stehman and Czaplewski, 1998).The sampling design and inference for a continuous population, such as the REN region, requires a special statistical framework.
Typically, the size Nh of stratum h is the number of sampling units in stratum h. Since points are the units being sampled, Nh is the area (in square-meters) of stratum h, and N is the whole REN area from the digital geographic database. Thus, the weight Wh of stratum h is equal to its relative size:
Wh = Nh/N, h = 1, 2, …, H (1)
The global sample size n is the total number of units to be sampled. Allocation provides a tool for determining the number of sample units to be taken from each stratum under the constraint that the total number of units to be sampled is n. Proportional allocation means that strata are sampled in proportion to their size. Thus, the number of sample units nh in stratum h is given by
7th International Symposium on Spatial Accuracy Assessment in Natural Resources and Environmental Sciences. Edited by M. Caetano and M. Painho.
103
nh = Wh x n, h = 1, 2, …, H (2)
In this study, a projected global sample size is first determined taking into consideration the desired sampling error and the sample proportional allocation. Let us first introduce some additional notation and definitions. The most important parameters to be estimated are the digital geographic database, positional and thematic, errors proportions for the entire area of interest, which are denoted by pp and pt, respectively. The parameters pp,h and pt,h denote the digital geographic database, positional and thematic, errors proportions within each stratum h, respectively. Since the formulations for the parameters pp and pt (pp,h and pt,h) are analogous, the notation p (ph) will be used to designate any of these errors proportions.
The estimator of a given parameter θ is denoted by θ̂ , the variance of θ̂ by V( θ̂ ), and the
estimator of this variance is denoted by ( )θ̂V̂ . Hence, the sampling error of the estimation of a
given parameter θ is defined by
( )θ= α−ˆVzd
21 (3)
where z1-α/2 is the 1–α/2 quantile of the standard normal distribution, for a given confidence level (1–α)%.
For stratified random sampling, an unbiased estimator of p is
∑=
=H
hhh pWp
1ˆˆ (4)
where Wh is the weight of stratum h given in equation (1), and hp̂ is the errors proportion observed in the sample of the h stratum.
The variance of this estimator is given by:
( ) ( )∑=
−−=
H
1h h
hhh
2h n
)p1(pf1Wp̂V (5)
and its unbiased estimator is:
( ) ( )∑= −
−−=
H
1h h
hhh
2h 1n
)p̂1(p̂f1Wp̂V̂ (6)
where (1–fh) is the finite population correction factor for stratum h (fh=nh/Nh is the stratum h sampling rate).
For stratified random sampling with proportional allocation (STP), the variance of the estimator of p becomes (by replacing nh from equation (2) in equation (5)):
( ) ( )n
Sf1p̂V2within
STP −= (7)
where (1–f) is the finite population correction factor (f=n/N is the sampling rate), and the within-stratum variance is given by
7th International Symposium on Spatial Accuracy Assessment in Natural Resources and Environmental Sciences. Edited by M. Caetano and M. Painho.
104
∑=
−=H
1hhhh
2within )p1(pWS (8)
In the infinite population sampling framework the (1–f) correction factor is equal to 1 (as the sampling rate is equal to zero), thus equation (7) becomes:
( )n
Sp̂V2within
,STP =∞ (9)
Replacing the variance of the STP estimator of p (from equation 9) in equation (3), and then solving for sample size, produces the formula to compute the global sample size with the desired sampling error precision for the estimation of p, under an infinite population STP approach:
2within
2
21S
d
zn ⎟
⎟
⎠
⎞
⎜⎜
⎝
⎛=
α− (10)
Sample size depends on the within-stratum variance which assumes the knowledge of the true proportion of errors within each stratum. This cannot be done without assuming a value for the unknown true accuracy. The most conservative strategy is to consider an accuracy of 50% for all strata (i.e. ph=0.5 for all strata), because ph(1–ph) is always less than or equal to 0.25.
In order to overcome this limitation, and to take into consideration the complexity and uncertainty inherent to each REN class, the results from a previous pilot study were used to set up the value of ph for each stratum h. The pilot study used a simple random sample of 1000 units which was post-stratified by major REN classes within each county. The overall positional and thematic accuracy estimate was approximately equal to 98% ( 02.0p̂pilot = ).
Not distinguishing positional from thematic errors, the errors proportion within each post-stratum were also estimated and the highest one was equal to 17%.
The computation of the projected global sample size assumed a sampling error precision for the estimation of p equal to 1% (d value), a 95% confidence level ( 96.1z
21=α−
), and the
value of ph for each stratum h was set up using the following criterions: • ph was assumed equal to 0.02 for strata corresponding to regions that were not
classified as REN within each county, because they are expect to have a high accuracy rate in the digital geographic database and the overall pilot study accuracy estimate was 98%.
• ph was assumed equal to its corresponding estimated value in the pilot study (strata matching major REN classes within each county) whenever that estimate was different from zero.
• ph was assumed equal to 0.07 whenever the corresponding pilot study estimated value (strata matching major REN classes within each county) was equal to zero or the reference paper cartography had poor readability.
• ph was assumed equal to 0.17 for strata with high complexity and uncertainty (small strata that result from crossing major REN classes within each county), because that was the highest error rate estimated in the pilot study.
7th International Symposium on Spatial Accuracy Assessment in Natural Resources and Environmental Sciences. Edited by M. Caetano and M. Painho.
105
The global sample size determined using this methodology is equal to 1668 units. Consequently, after the sample proportional allocation, several strata sample sizes were computed as zero or one, due to their small areas. However, at least two units per stratum are required to estimate the within-stratum variability. Therefore, the sample sizes of those strata were set to two, in order to assess the precision of the errors proportions estimates in all strata. Thus, the final global sample size is equal to 2668 units and, consequently, the sampling error is expected to be below 1%, for a 95% confidence level.
The accuracy of the REN digital geographic database was assessed through equation (4), which was used to estimate both positional and thematic errors proportions for the entire area of interest; and a 95% confidence interval was computed as
( )p̂V̂96.1p̂ ± (11)
where the ( )p̂V̂ formulation is given by equation (6) with the finite population correction factor for each stratum h set to one. The sampling error of the estimation of p is the half confidence interval width.
Note that an estimator of ( ) ∞,STPp̂V given by equation (9) can no longer be used, for this
sampling design, since the final global sample was not proportionally allocated to strata.
Regarding the estimation of the remaining parameters of interest, each hp̂ is computed as the digital geographic database errors proportion observed in the sample of the h stratum. In order to assess the precision of those estimates, the variance of each hp̂ is estimated by:
( ) ( )1np̂1p̂p̂V̂
h
hhh −
−= (12)
Strata sampling errors and 95% confidence intervals for all ph can be computed using an analogous formulation of equation (11).
3 Results and discussion
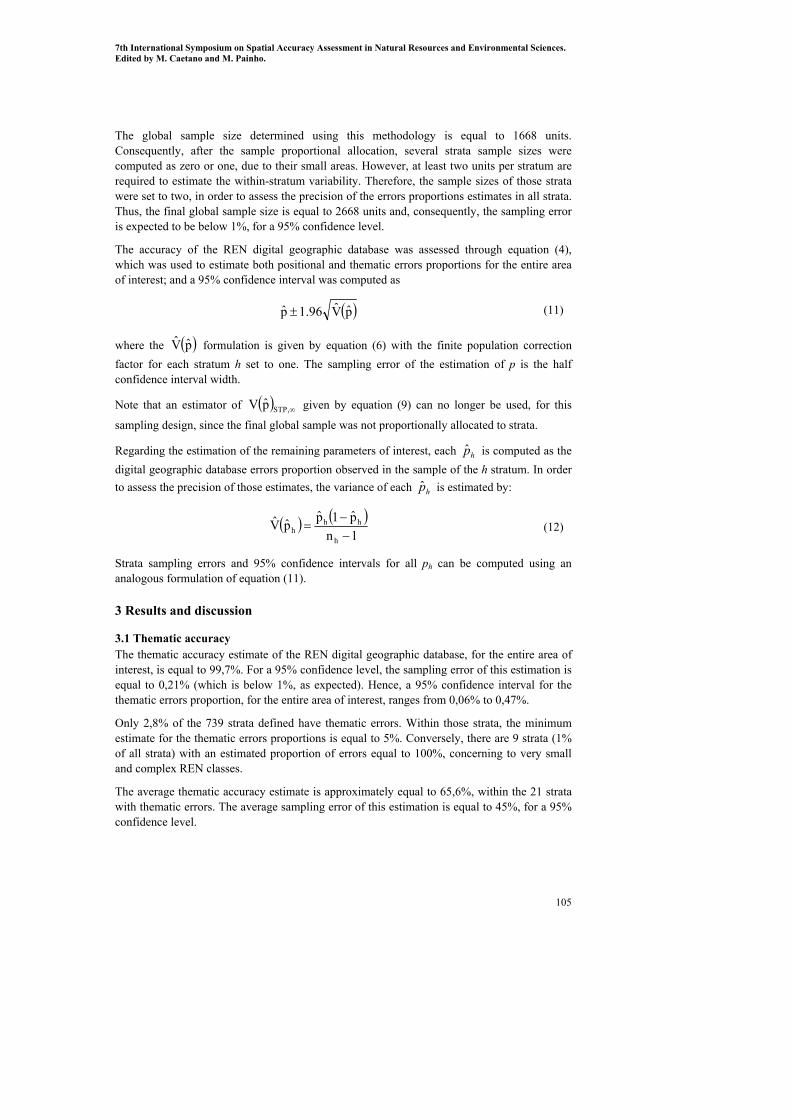
3.1 Thematic accuracy The thematic accuracy estimate of the REN digital geographic database, for the entire area of interest, is equal to 99,7%. For a 95% confidence level, the sampling error of this estimation is equal to 0,21% (which is below 1%, as expected). Hence, a 95% confidence interval for the thematic errors proportion, for the entire area of interest, ranges from 0,06% to 0,47%.
Only 2,8% of the 739 strata defined have thematic errors. Within those strata, the minimum estimate for the thematic errors proportions is equal to 5%. Conversely, there are 9 strata (1% of all strata) with an estimated proportion of errors equal to 100%, concerning to very small and complex REN classes.
The average thematic accuracy estimate is approximately equal to 65,6%, within the 21 strata with thematic errors. The average sampling error of this estimation is equal to 45%, for a 95% confidence level.
7th International Symposium on Spatial Accuracy Assessment in Natural Resources and Environmental Sciences. Edited by M. Caetano and M. Painho.
106
Strata corresponding to regions that were not classified as REN within each county do not have positional errors. Only 3 of those 43 strata have thematic errors, and their maximum errors proportion estimate is equal to 16.7%. The average thematic accuracy estimate of those 43 strata is approximately equal to 99%, as expected.
Figure 1 Thematic errors found by county in Alentejo.
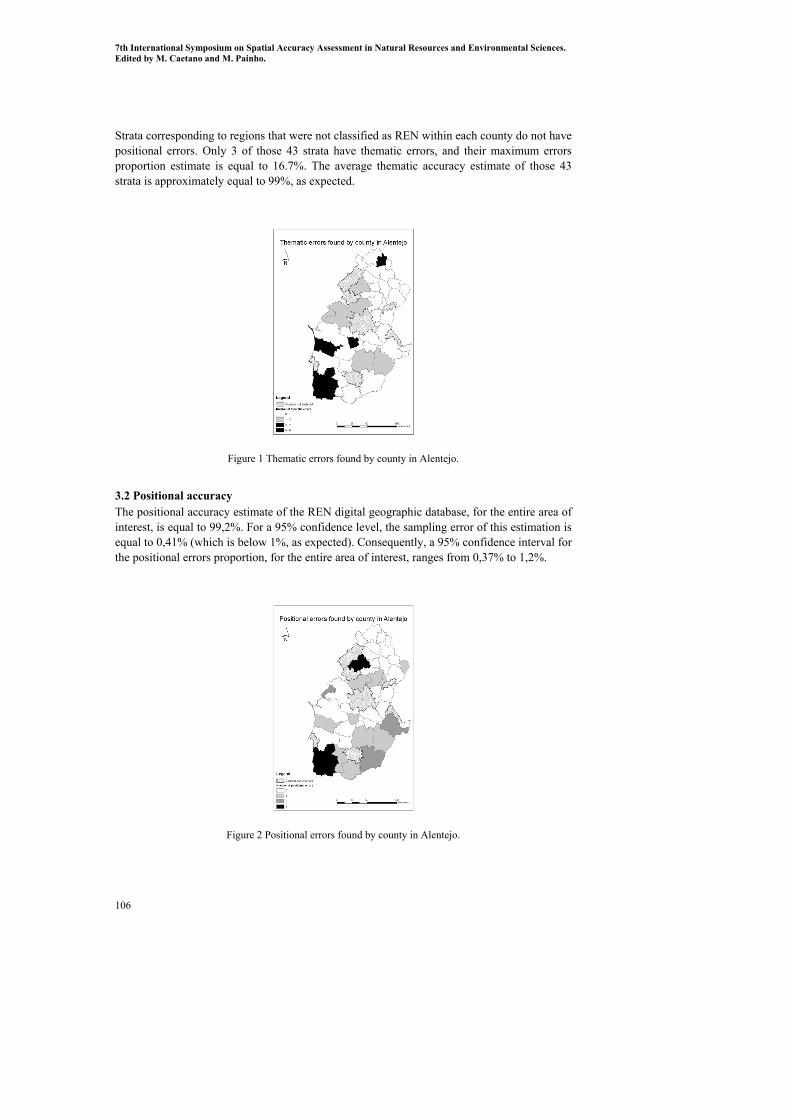
3.2 Positional accuracy The positional accuracy estimate of the REN digital geographic database, for the entire area of interest, is equal to 99,2%. For a 95% confidence level, the sampling error of this estimation is equal to 0,41% (which is below 1%, as expected). Consequently, a 95% confidence interval for the positional errors proportion, for the entire area of interest, ranges from 0,37% to 1,2%.
Figure 2 Positional errors found by county in Alentejo.
7th International Symposium on Spatial Accuracy Assessment in Natural Resources and Environmental Sciences. Edited by M. Caetano and M. Painho.
107
Just 3,1% of the 739 strata defined have positional errors. Within those strata, the minimum and maximum estimates for the positional errors proportions are equal to 2% and 50%, respectively.
The average positional accuracy estimate is approximately equal to 33,7%, within the 23 strata with positional errors. The average sampling error of this estimation is equal to 33,7%, for a 95% confidence level.
3.3 Overall accuracy The overall accuracy of the REN digital geographic database is assessed through the sum of the positional and thematic errors proportions estimates, for the entire area of interest, and it is approximately equal to 98,9%.
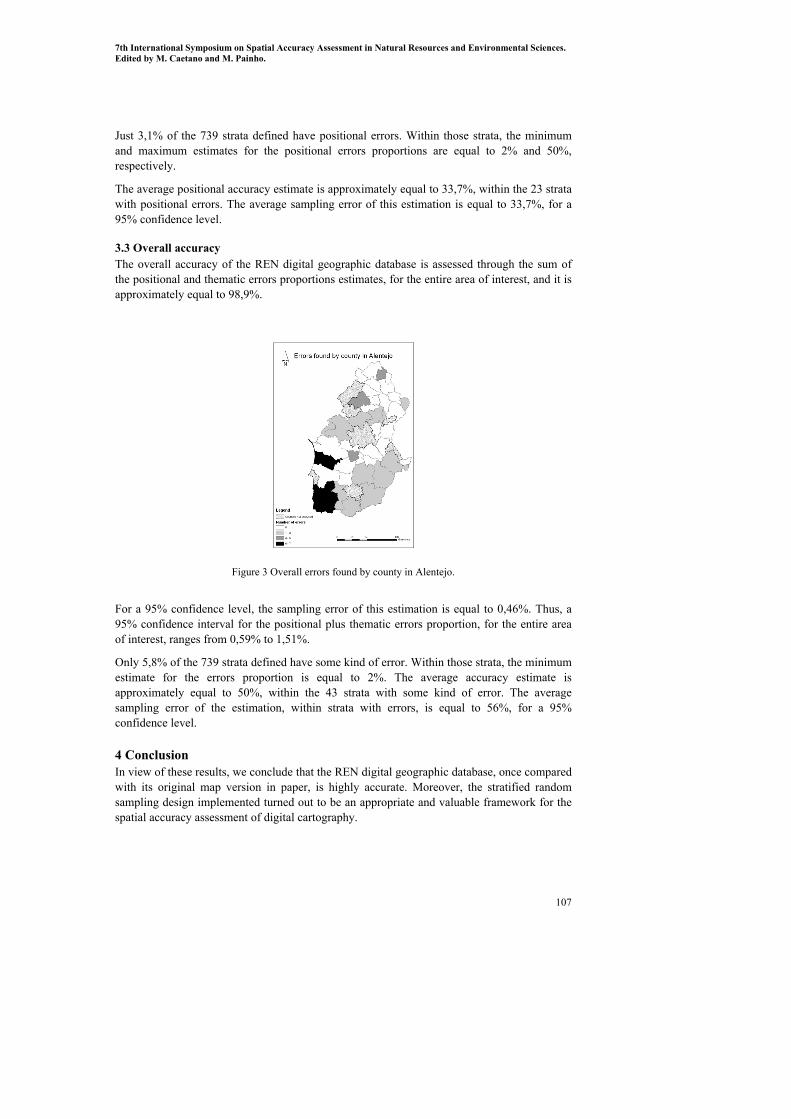
Figure 3 Overall errors found by county in Alentejo.
For a 95% confidence level, the sampling error of this estimation is equal to 0,46%. Thus, a 95% confidence interval for the positional plus thematic errors proportion, for the entire area of interest, ranges from 0,59% to 1,51%.
Only 5,8% of the 739 strata defined have some kind of error. Within those strata, the minimum estimate for the errors proportion is equal to 2%. The average accuracy estimate is approximately equal to 50%, within the 43 strata with some kind of error. The average sampling error of the estimation, within strata with errors, is equal to 56%, for a 95% confidence level.
4 Conclusion In view of these results, we conclude that the REN digital geographic database, once compared with its original map version in paper, is highly accurate. Moreover, the stratified random sampling design implemented turned out to be an appropriate and valuable framework for the spatial accuracy assessment of digital cartography.

7th International Symposium on Spatial Accuracy Assessment in Natural Resources and Environmental Sciences. Edited by M. Caetano and M. Painho.
108
References Bartoschek, T., Painho, M., Henriques, R., Peixoto, M. and Costa, A. C., 2006 (accepted), RENalyzer: A tool to facilitate the spatial accuracy assessment of digital cartography. In: Spatial Accuracy Research Group (Eds.), Proceedings of the Seventh International Symposium on Spatial Accuracy Assessment in Natural Resources and Environmental Sciences. Cochran, W. G., 1977, Sampling Techniques. 3rd Edition, John Wiley & Sons, New York. Decreto-Lei n.º 321/83, Diário da República n.º 152/83, Série I - de 05 de Julho de 1983. Decreto-Lei n.º 93/90, Diário da República n.º 65/90, Série I - de 19 de Março de 1990. Lehtonen, R. and Pahkinen, E. J., 1996, Practical Methods for Design and Analysis of Complex Surveys. Revised Edition, November 1996, Statistics in Practice, John Wiley & Sons, Chichester. Nusser, S. M. and Klaas, E. E., 2003, Survey methods for assessing land cover map accuracy. Environmental and Ecological Statistics 10, 309–331. Painho, M. and Gomes, R., 1999, “Using GIS on the delimitation of a National Ecological Reserve”, Third Annual Conference of the Society for Conservation GIS, Idlewild, CA July 24-26, 1999. Painho, M., Peixoto, M, and Brito, P., 2005, “Relatório Final: SIG de Ambiente e Recursos Naturais para o Alentejo” para a Direcção Regional de Ambiente e Ordenamento do Território do Alentejo, ISEGI. Stehman, S. V., 2000, Practical Implications of Design-Based Sampling Inference for Thematic Map Accuracy Assessment. Remote Sens. Environ. 72, 35–45. Stehman, S. V. and Czaplewski, R. L., 1998, Design and Analysis for Thematic Map Accuracy Assessment: Fundamental Principles. Remote Sens. Environ. 64, 331–344.