a stochastic method for the generation of optimized building layouts respecting urban regulations
TRANSCRIPT

A STOCHASTIC METHOD FOR THE GENERATION OF OPTIMIZED BUILDINGLAYOUTS RESPECTING URBAN REGULATIONS
S. Hea,∗, J. Perreta, M. Brasebina, M. Bredifb
a IGN, COGIT,73 avenue de Paris,94160 Saint Mande,France; Universite Paris-Est(shuang.he, julien.perret, mickael.brasebin)@ign.fr
b IGN, MATIS,73 avenue de Paris,94160 Saint Mande,France; Universite [email protected]
KEY WORDS: building layout, urban planning, stochastic optimization, point process, RJMCMC, simulated annealing
ABSTRACT:
In most countries, a project for the development of an urban area has to obey zoning regulations. In France, such zoning regulations arespecified in local urban planning schemes (LUPS or PLU in French) defining the right to build at the scale of a parcel. Such rules define,for example, the maximal building height. As the rules are stated in technical documents, they are not easy for non-professionals tocomprehend. It is also hard for professionals to assess their impacts. Driven by such issues, we propose to generate 3D building layoutsthat comply with these rules while optimizing urban indicators (e.g. floor area ratio). A building layout can be seen as a realization ofa marked point process (MPP), which is a stochastic model mapping from a probability space to configurations of geometric objects,namely horizontal 3D boxes. Then, the problem of finding an optimized building layout is converted into finding the optimal realizationof a MPP of 3D boxes. We solve this optimization problem by trans-dimensional simulated annealing (TDSA), which allows to exploreboth parameter space and model space in order to find the combination optimizing a given criterion or energy function. A global energyfunction is defined as the sum of weighted energy terms. Each energy term is able to penalize the building layouts that violate a specificrule or favor the ones according to the optimization task. TDSA generates the optimal building layout by minimizing this global energyusing the coupling of a simulated annealing scheme with a Reversible Jump Markov Chain Monte Carlo (RJMCMC) sampler. Westudied several common types of the French PLU rules and modeled them into energy terms. A case study is conducted and the resultsshow that our proposed approach is capable of such an optimization task within a short computation time.
1 INTRODUCTION
As urbanization is increasing, environmental, social and econom-ical issues that cities are facing are becoming more and more criti-cal. Thus, in order to consider these issues, urban planners designplans with the aim to regulate city development. These plans arevarious and differ by their scale (scale of a city or of a building)or by their preoccupations (displacement, social dwellings, etc.).The conception of these documents is a difficult task for two mainreasons:
1. the information contained in plans is expressed with free textand their influence on a territory is difficult to assess;
2. as different city issues have complex relationships, the ap-plication of a plan supposed to improve an aspect of the citycan decrease the performances of other aspects.
To support the design of such documents, it is necessary to pro-vide tools that enable to check if the application of a given doc-ument has no side-effect according to the designers’ wishes butalso regarding other aspects of the city. Among different exist-ing documents, this work is focused on constructability regula-tion. This kind of regulation is widely defined worldwide and de-scribes constraints that new buildings have to respect to obtain aconstruction permit. The aim of this article is to propose a robustsimulation through the generation of building layouts that respectconstraints expressed by these regulations. In France, buildingregulation is specified in local urban planning schemes (LUPSsor PLU in French). On the one hand, such schemes define theright to build at the scale of a parcel through 2D and 3D morpho-logical rules (maximal height or floor area, for example) that, inparticular, projected buildings must respect. On the other hand,
PLU documents are opposable, which means that a permit cannotbe rejected if a project respects its rules.
In section 2, a state of the art describes several works that simu-late similar constructability restrictions. Then, our proposed sim-ulator that is based on the ”trans-dimensional simulated anneal-ing ” optimization method is presented in section 3. In orderto produce desirable building layouts, this simulator integratesconstraints from the regulation in its optimization function as de-scribed in section 4. Some experimentations are carried out onreal world data and with French regulations (section 5).
2 STATE OF THE ART
Different works try to ease the comprehension of urban regula-tion through several types of approaches by: linking regulation torelated geographic features in a 3D viewer (Metral et al., 2009);producing buildable hulls from geometric constraints (El Mak-chouni, 1987, Murata, 2004, Brasebin et al., 2011); offering thepossibility to explore a predefined set of parametric buildings re-specting rules (Coors et al., 2009); generating buildings (Turkieniczet al., 2008, Parish and Muller, 2001, Brasebin, 2014) or propos-ing extensions to existing buildings (Laurini and Vico, 1999).Among these works, building generation offers, in our opinion,the most promising results as it directly provides objects that canbe built. Nevertheless, mentioned approaches use heuristics orprocedural modeling that do not always fit with every terrain con-figuration and cannot integrate preferences of different builder-agents. Thus, we found necessary to adapt a building generationmethod to the specificity of urban regulations.
Building generation methods are explored through various fieldssuch as architecture (Frazer, 1995), urban planning (Rittel andWebber, 1973), geosimulation (Ruas et al., 2011) or computer

graphics (Wonka et al., 2003). The goal of the generation dif-fers according to the domain. (Vanegas, 2013) distinguishes ge-ometric and behavior based approaches that are not always dis-cordant. Behavior based approaches aim to produce buildingsby integrating human processes and decisions whereas geomet-ric approaches are designed to create fast and visually believableobjects. As the objective of this paper is to simulate urban reg-ulations, it is necessary to integrate the preferences of differentagents that can construct buildings in order to assess the influ-ence of the rules on different actors (for example, households orbuilding promoters). Generally, these preferences are translatedinto utility functions that agents try to maximize.
To maximize such functions, optimization methods are used suchas Multi-Agent Systems (Ruas et al., 2011) or meta-heuristicslike evolutionary algorithms (Frazer, 1995) or simulated anneal-ing (Bao et al., 2013) combined to geometric generative methodslike primitive instancing (Perret et al., 2010, Kampf et al., 2010)or shape grammars (Talton et al., 2011). In order to integrateconstraints, a large set of methods and their comparison are de-scribed in (Coello Coello, 2010) including rejection, penalizationof the optimization function or fixing automatically solutions thatdo not respect constraints.
3 PROPOSED APPROACH
(Brasebin, 2014) proposes a generic approach to generate build-ing according to a model of French regulations. His method togenerate buildings is based on the approach presented in (Tour-naire et al., 2010) for extracting building footprints from digitalelevation models which relies on marked point processes, a classof random processes which realizations represent a set of objectsin a certain parameter space. Whereas in (Tournaire et al., 2010),a configuration represents a collection of rectangle footprints inimage space, in (Brasebin, 2014), a configuration consists of rect-angular parallelepipeds or cuboids we will from now on refer toas boxes, each representing a building placed inside a land parcel.The author proposes to optimize a given criteria (such as buildingvolume) and a constraint management by rejection during the op-timization process. Using rejection allows for genericity in thisapproach, but might deteriorate generated optimized configura-tions: the creation of a non connex configuration search spaceand ”barrier effects” due to strict constraints (such as ”a buildingmust be aligned with the roads”). Our objective is to propose amore robust simulator, based on (Brasebin, 2014) principles, thatovercomes these issues by using an alternative constraints man-agement approach.
3.1 Marked point process
A marked point process (Van Lieshout, 2000) is a stochastic modeldefined by a probabilized space (Ω, π) with Ω =
⋃∞n=0K
n
where K denotes the set of possible values of a single objectand n the number of such elements in a configuration. A sim-ple probabilization of Ω may be given by the probabilization ofK and a discrete probability over N that samples the number n ofobjects. Assuming that the probabilization of K may be sampleddirectly, this yields a direct sampling of Ω according to this so-called reference process. What is needed is however a sampler ofΩ according to a target density π that encodes the target objectivefunction to be minimized. We will present, in the next sections,how this may be achieved using Reversible Jump Markov ChainMonte Carlo (RJMCMC) and simulated annealing.
In our problem, each realization of the marked point process isa building layout (a configuration of n buildings). Extending the
Figure 1: The land parcel, a single building box object and arealization of the marked point process of boxes.
parameterization of 2D rectangles introduced in (Tournaire et al.,2010), each building is described by its 2D center ci = (xi, yi),its 2D semi-major axis vector ~vi = (ρi, θi), its aspect ratio ri ≤1 and its height hi, using ri = li
Liwhere Li = 2‖~vi‖ and li are
respectively the horizontal box dimensions along and across ~vi.
For efficiency, we prevent the sampling of buildings which cen-ters ci lie outside the considered land parcel. This generation ofcenters ci within the land parcel only is performed using a tri-angulation of its defining polygon and a parameterization c′i =(x′i, y
′i) ∈ [0, 1]2 that enables the uniform sampling of points in-
side this set of triangles (Turk, 1990). K is therefore defined asequation 1. Furthermore, ri is limited to [rmin, 1] in order to bet-ter control building shapes, hi is sampled in [hmin, hmax] withhmin the minimum height of a building and hmax the maximumheight depending of the local planning rules. Figure 1 illustratesthe search space as well as a realization of the process.
3.2 Reversible Jump Markov Chain Monte Carlo
RJMCMC is an extension of MCMC that allows the samplingfrom a configuration space Ω of varying dimension (Green, 1995)that only requires the unnormalized evaluation of its target dis-tribution. This approach consists in using reversible kernels Qi
associated with probabilities q(i|Xt) modeling a random modifi-cation of the current configuration Xt to successively propose anew configuration and evaluate its acceptance probability. The al-gorithm operated by repeating such steps in order to build a seriesof configurations which stationary distribution is the desired tar-get distribution π. A generic implementation of this algorithm isavailable and detailed in (Bredif and Tournaire, 2012). In the pro-posed approach, the reversible kernels used are: birth and deathkernel, edge translation kernel, and height scaling kernel.
3.3 Trans-Dimensional Simulated Annealing
In order to drive the RJMCMC sampler to the target probabil-ity distribution, whe use simulated annealing (SA), a widely usedlocal metaheuristic (Salamon et al., 2002). This approach of cou-pling a RJMCMC sampler within a simulated annealing may bereferred to as Trans-Dimensional Simulated Annealing (TDSA)(Singh et al., 2008). The idea of the approach is to sample in-creasingly more selectively from the RJMCMC sampler until aconvergence criteria is reached (usually a given number of itera-tions or a maximum variation of energy during a certain numberof iterations).
3.4 Energetic modeling
An attractive property of a marked point processX is that we candefine its probability density function (pdf) through a Gibbs en-ergy with respect to the reference process: f(X) = Z−1e−E(X),where Z =
∫Xe−E(X)dµ(X) is the normalization factor, with
µ(.) as the probability distribution of the reference process. Theenergy function E(X) can express the quality of a configurationof marked points. In our case, it indicates the conformity withurban planning rules as well as a desired criteria to optimize (thetotal building volume for instance). We introduce a global en-ergy composed as the sum of finite weighted energy terms, eachof which is formed according to a specific urban planning rule.

K =
point︷ ︸︸ ︷[0, 1]× [0, 1]︸ ︷︷ ︸
c′i
mark︷ ︸︸ ︷× [ρmin, ρmax]× [0, π]︸ ︷︷ ︸
~vi
× [rmin, 1]︸ ︷︷ ︸ri
× [hmin, hmax]︸ ︷︷ ︸hi
. (1)
Therefore, the problem of finding the optimal building layout thatcomplies with urban planning rules can be translated into findingthe configuration of building boxes X by maximizing the proba-bility f(.) using a RJMCMC sampler under a TDSA framework:X = argmaxf(.). Urban planning rules vary by countries andcities. The French urban planning scheme is studied in this paper.Common rules are extracted and modeled by energy terms. Thedetail is presented in the following section.
4 URBAN RULES TO ENERGY TERMS
A PLU (French urban planning scheme) document provides azoning plan dividing an urban territory into several zones, andspecifies applicable regulations for each type of zone. The reg-ulations may include all or some of the 16 articles provided bythe urban planning code. Each of these articles describes a fixedtheme. For instance, article 1 describes prohibited land use andarticle 16 describes electronic communication infrastructures andnetwork. This work only focuses on the articles that regulate thespatial aspects of buildings. Therefore, the studied articles are:
• Article 6: building position in relation to public roads,
• Article 7: building position in relation to separative limits,
• Article 8: building position in relation to other buildings,
• Article 9: building footprint,
• Article 10: building height,
• Article 14: floor area ratio.
Articles 6 and 7 can be considered as one theme: building posi-tion in relation to parcel borders (front, side, and back borders).Front borders are the borders adjacent to public roads (or at leastpublic space). Side and back borders are separative limits adja-cent to private roads or other parcels. Regarding the buildingsposition, the most common rules are for orientation and location.Therefore, we take into account the following types of rules whengenerating optimal building layouts:
• Rule A1: distance to parcel borders,
• Rule A2: distance between buildings,
• Rule A3: parcel coverage ratio,
• Rule A4: floor area ratio,
• Rule B1: angle to parcel borders,
• Rule B2: building height.
Rules B1 and B2 can be satisfied by directly setting constraints ongeometry parameters ρ and h before MPP sampling if the rulesdo not depend on dynamic building attributes (e.g location and/orheight of itself and/or of its adjacent buildings). For example, ifthe angle rule is that all buildings should be parallel to a fixedborder, which means it does not depend on dynamic building at-tributes, then the constraint on ρ can be known before sampling.If the angle rule requires a building to be parallel to its nearestborder, which means it depends on its own location, then the rulecannot be configured before sampling. Similar for rule B2, the
actual rule may have constraints on height differences betweenadjacent buidings. In such cases, rules B1 and B2 should be mod-eled by energy functions, along with rules A1 to A4. We discussthe energetic modeling of these rules by categorizing them intothree types: unary, binary, and global energy.
4.1 Unary energy
If the calculation of a type of energy for one building does notdepend on the attributes of other buildings, we refer to such kindof energy as unary energy. Among all types of rules that westudied in this work, rule A1 can be modeled by unary distanceenergy Eud , and rule B1 can be modeled by unary angle energyEuθ , when it needs energetic modeling. Thus the total unaryenergy can be defined as their weighted sum:
Eu = wudEud + wuθEuθ (2)
Unary distance energy There are generally three types of bor-ders: front, side, and back borders. One parcel can consist ofzero or more than one borders of each type. Regarless of theborder type, we refer to the distance from a building to a borderas a unary distance. A PLU rule for unary distance could be asimple constraint involving only one given constant, for instance,d < 2m. It could also depend on external and/or internal pa-rameters. For instance, d > max(c/2, h), where c is the largestwidth of the road adjacent to the border considered as an externalparameter, and h is the building height considered as an internalparameter. The valuation of external parameters can be done be-fore launching the optimization process, whereas the valuation ofinternal parameters has to be performed during the optimizationprocess. Regardless of the timing of valuation, the left value ofthe constraint has to be calculated before energetic modeling.
Therefore, all PLU rules for unary distance can eventually bedescribed by the union of finite disjoint real intervals: duij ∈⋃n
k=1 Ik(ak, bk)|Ik ∩ ∀Ip 6=k = ∅, where duij is the distancefrom the ith building to the jth border, and Ik is an real inter-val with endpoints ak and bk. The corresponding energy can bedefined as:
Eudij =
0 duij ∈
⋃Ik
g(duij) duij /∈⋃Ik
(3)
where g(.) is a penalty function that penalizes non-acceptabledistance values.
If the rules for all borders are of logical conjunction: dui1 ∈A1&dui2 ∈ A2...&d
uim ∈ Am, then the unary distance energy for
ith building is Eudi =
∑mj=1E
udij . If there exist rules of logical
disjunction like duij ∈ Aj ||duik ∈ Ak, thenEudijk
= min(Eudij , E
udik ).
There could also be of logical conjunction in each operand oflogical disjunction, so the final Eud
i can hardly be discribed bya generic formula. Example of such complex rules can be foundin section 5. Eventually, the overall unary distance energy for aparcel with n buildings is:
Eud =
n∑i=1
Eudi (4)
Unary angle energy We refer to the angle between a buildingand a parcel border as unary angle. All PLU rules for unary anglecan be eventually described by the union of finite disjoint realintervals: θuij ∈
⋃nk=1 Ik(ak, bk)|Ik ∩ ∀Ip6=k = ∅, where θuij
is the angle from the ith building to the jth border, and Ik is anreal interval with endpoints ak and bk. The corresponding energycan be defined as:
Euθij =
0 θuij ∈
⋃Ik
g(θuij) θuij /∈⋃Ik
(5)
where g(.) is a penalty function that penalizes non-acceptable an-gle values.
In practice, a PLU rule for unary angle normally only involvesone border, for example, each building should be parallel to afixed border or to it’s nearest border. The involved Jth border canbe determined before energetic modeling. Therefore, the unaryangle energy for the ith building is:
Euθi = E
uθiJ(i) (6)
The overall unary angle energy for a parcel with n buildings is:
Euθ =
n∑i=1
Euθi (7)
4.2 Binary energy
If the calculation of a type of energy invloves two buildings in thesame parcel, we refer to such kind of energy as binary energy.Among all types of rules that we studied in this work, rule A2can be modeled by binary distance energy Ebd , and rule B2 canbe modeled by binary height energy Ebh , when it concerns theheight difference between two adjacent buildings. Thus the totalbinary energy can be defined as their weighted sum:
Eb = wbdEbd + wbhEbh (8)
Binary distance energy We refer to the distance between twobuildings on the same parcel as binary distance. All PLU rules forbinary distance can be eventually described by the union of finitedisjoint real intervals: dbij ∈
⋃nk=1 Ik(ak, bk)|Ik ∩ ∀Ip6=k = ∅,
where dbij is the distance between the ith and the jth building,and Ik is an real interval with endpoints ak and bk. The corre-sponding energy can be defined as:
Ebdij =
0 dbij ∈
⋃Ik
g(dbij) dbij /∈⋃Ik
(9)
where g(.) is a penalty function that penalizes non-acceptablevalues. The overall binary distance energy for a parcel with nbuildings is therefore:
Ebd =
n−1,n∑i=1,j>i
Ebdij (10)
Binary height energy We refer to the height difference be-tween two buildings on the same parcel as binary height. All PLUrules for binary height can be described by the union of finite dis-joint real intervals: hb
ij ∈⋃n
k=1 Ik(ak, bk)|Ik ∩ ∀Ip6=k = ∅,where hb
ij is the height difference between the ith and the jth
buildings, and Ik is an real interval with endpoints ak and bk.The corresponding energy can be defined as:
Ebhij =
0 hb
ij ∈⋃Ik
g(hbij) hb
ij /∈⋃Ik
(11)
where g(.) is a penalty function that penalizes non-acceptablevalues. The overall binary height energy for a parcel with n build-ings is therefore:
Ebh =
n−1,n∑i=1,j>i
Ebhij (12)
4.3 Global energy
If the calculation of a type of energy involves all buildings in thesame parcel, we refer to such kind of energy as global energy.Among all types of rules that we studied in this work, rule A3can be modeled by global coverage energy Egc , and rule A4 canbe modeled by global builtup energy Egf . Thus the total globalenergy can be defined as their weighted sum:
Eg = wgcEgc + wgfEgf (13)
Global converage energy is used to model the PLU rule forparcel coverage ratio (PCR). Normally, a constant valuemaxpcris given as the upper limit of PCR, and the implicit lower limitof PCR is zero (no building on the parcel). Therefore, the globalcoverage energy can be defined as:
Egc =
0 xc ∈ [0,maxpcr]
g(xc) xc ∈ (maxpcr,+∞)(14)
where g(.) is a penalty function that penalizes non-acceptablevalues.
In order to help urban planners to access the effect of the PLU rulefor PCR, an optimization task for PCR is often demanded, whichis to generate building layouts with PCR values approching tomaxpcr. Therefore, an alternative global coverage energy func-tion can be defined as:
Egc =
g1(xc) xc ∈ [0,maxpcr]
g2(xc) xc ∈ (maxpcr,+∞)(15)
where g1(.) and g2(.) can be different penalty functions that pe-nalizes less favorable values and non-acceptable values respect-fully.
Global builtup energy is used to model the PLU rule for floorarea ratio (FAR). Normally, a constant value maxfar is givenas the upper limit of FAR, and the implicit lower limit of FAR iszero (no buildings on the parcel). Therefore, the global builtupenergy can be defined as:
Egf =
0 xf ∈ [0,maxfar]
g(xf ) xf ∈ (maxfar,+∞)(16)
where g(.) is a penalty function that penalizes non-acceptablevalues.
Similarly, optimization for FAR is also frequently demanded, andan alternative global builtup energy function can be defined as:
Egf =
g1(xf ) xf ∈ [0,maxfar]
g2(xf ) xf ∈ (maxfar,+∞)(17)
where g1(.) and g2(.) can be different penalty functions that pe-nalizes less favorable values and non-acceptable values respect-fully.
5 CASE STUDY
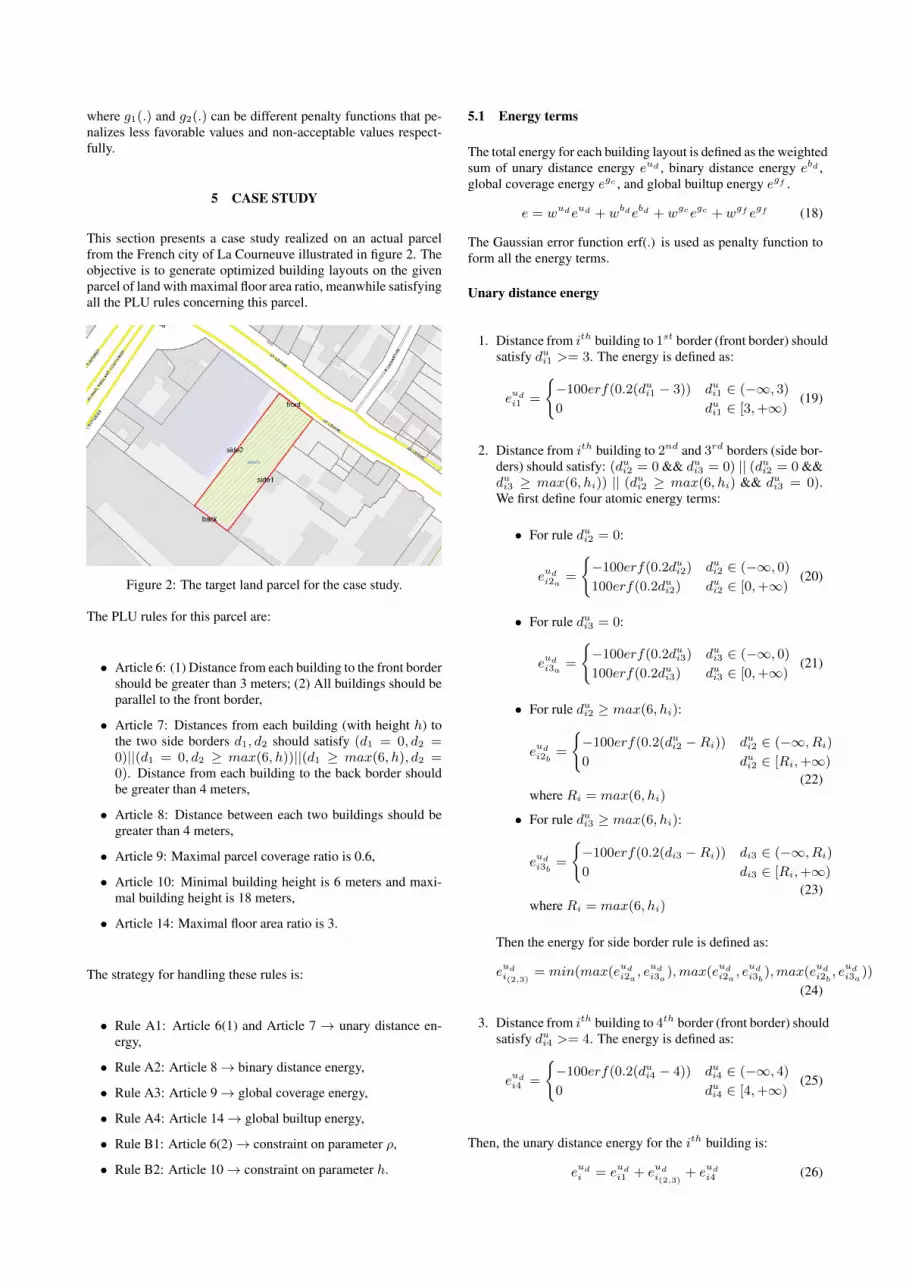
This section presents a case study realized on an actual parcelfrom the French city of La Courneuve illustrated in figure 2. Theobjective is to generate optimized building layouts on the givenparcel of land with maximal floor area ratio, meanwhile satisfyingall the PLU rules concerning this parcel.
Figure 2: The target land parcel for the case study.
The PLU rules for this parcel are:
• Article 6: (1) Distance from each building to the front bordershould be greater than 3 meters; (2) All buildings should beparallel to the front border,
• Article 7: Distances from each building (with height h) tothe two side borders d1, d2 should satisfy (d1 = 0, d2 =0)||(d1 = 0, d2 ≥ max(6, h))||(d1 ≥ max(6, h), d2 =0). Distance from each building to the back border shouldbe greater than 4 meters,
• Article 8: Distance between each two buildings should begreater than 4 meters,
• Article 9: Maximal parcel coverage ratio is 0.6,
• Article 10: Minimal building height is 6 meters and maxi-mal building height is 18 meters,
• Article 14: Maximal floor area ratio is 3.
The strategy for handling these rules is:
• Rule A1: Article 6(1) and Article 7 → unary distance en-ergy,
• Rule A2: Article 8→ binary distance energy,
• Rule A3: Article 9→ global coverage energy,
• Rule A4: Article 14→ global builtup energy,
• Rule B1: Article 6(2)→ constraint on parameter ρ,
• Rule B2: Article 10→ constraint on parameter h.
5.1 Energy terms
The total energy for each building layout is defined as the weightedsum of unary distance energy eud , binary distance energy ebd ,global coverage energy egc , and global builtup energy egf .
e = wudeud + wbdebd + wgcegc + wgf egf (18)
The Gaussian error function erf(.) is used as penalty function toform all the energy terms.
Unary distance energy
1. Distance from ith building to 1st border (front border) shouldsatisfy dui1 >= 3. The energy is defined as:
eudi1 =
−100erf(0.2(dui1 − 3)) dui1 ∈ (−∞, 3)
0 dui1 ∈ [3,+∞)(19)
2. Distance from ith building to 2nd and 3rd borders (side bor-ders) should satisfy: (dui2 = 0 && dui3 = 0) || (dui2 = 0 &&dui3 ≥ max(6, hi)) || (dui2 ≥ max(6, hi) && dui3 = 0).We first define four atomic energy terms:
• For rule dui2 = 0:
eudi2a
=
−100erf(0.2dui2) dui2 ∈ (−∞, 0)
100erf(0.2dui2) dui2 ∈ [0,+∞)(20)
• For rule dui3 = 0:
eudi3a
=
−100erf(0.2dui3) dui3 ∈ (−∞, 0)
100erf(0.2dui3) dui3 ∈ [0,+∞)(21)
• For rule dui2 ≥ max(6, hi):
eudi2b
=
−100erf(0.2(dui2 −Ri)) dui2 ∈ (−∞, Ri)
0 dui2 ∈ [Ri,+∞)
(22)where Ri = max(6, hi)
• For rule dui3 ≥ max(6, hi):
eudi3b
=
−100erf(0.2(di3 −Ri)) di3 ∈ (−∞, Ri)
0 di3 ∈ [Ri,+∞)
(23)where Ri = max(6, hi)
Then the energy for side border rule is defined as:
eudi(2,3)
= min(max(eudi2a, e
udi3a
),max(eudi2a, e
udi3b
),max(eudi2b, e
udi3a
))
(24)
3. Distance from ith building to 4th border (front border) shouldsatisfy dui4 >= 4. The energy is defined as:
eudi4 =
−100erf(0.2(dui4 − 4)) dui4 ∈ (−∞, 4)
0 dui4 ∈ [4,+∞)(25)
Then, the unary distance energy for the ith building is:
eudi = e
udi1 + e
udi(2,3)
+ eudi4 (26)

And the total unary distance energy for a configuration with nbuildings is:
eud =
n∑i=1
eudi (27)
Binary distance energy Distance from ith and jth buildingshould satisfy dbij >= 4. The energy is defined as:
ebdij =
−100erf(0.2(dbij − 4)) dbij ∈ (−∞, 4)
0 dbij ∈ [4,+∞)(28)
Then, the total binary distance energy for a configuration with nbuildings is:
ebd =
n−1,n∑i=1,j>i
ebdij (29)
Global coverage energy The parcel coverage ratio should sat-isfy xc ≤ 0.6, so the global coverage energy is defined as:
egc =
0 xc ∈ [0, 0.6]
100erf(xc − 0.6) xc ∈ (0.6,+∞)(30)
Global builtup energy The floor area ratio should satisfy isxf ≤ 3, and there is an optimization task for the final buildinglayout approching to the upper limit xf = 3. Thus we define theenergy function as:
egf =
10(xf − 3)2 xf ∈ [0, 3]
100erf(xf − 3) xf ∈ (3,+∞)(31)
5.2 Implementation and results
The proposed approach is implemented using the open sourcec++ library librjmcmc (Bredif and Tournaire, 2012), which pro-vides a framework for stochastic optimization using RJMCMCsamper and simulated annealing. We use this framework for sim-ulating urban planning rules using a marked point process ofcuboids. 50 experiments are conducted on a machine (HP work-station Z210) with 3.3GHz dual core CPU (Intel Core i5-2500)and 8 GB memory under 32 bit Linux environment (Ubuntu 13.04).The average CPU computation time is 252892 ms (approx. 4minutes and 12 seconds) per experiment with 3 million iterationsfor simulated annealing.
e = 30eud + 20ebd + 20egc + 50egf (32)
The weights of the energy terms used in these experiments aregiven in Equation 32. The statistics of the parcel coverage ra-tio and floor area ratio are given in Table 1. The results can beassessed from two aspects: 1) the optimization of the floor arearatio and 2) the comformity with all the PLU rules reflected byenergy values. Therefore, we verify the two results with highestand lowest floor area ratio and the two results with highest andlowest energy.
Table 1: Statistics of 50 experiments.floor area ratio parcel coverge ratio
min max average min max average1.60993 2.99672 2.21107 0.310011 0.61312 0.469303
5.2.1 Results with the highest and lowest floor area ratioSince the optimization task of this case study is to maximize thefloor area ratio within an upper limit FAR ≤ 3, we verify thesetwo extreme outcomes. The result with the highest floor area ra-tio is shown in Figure 3, and its detailed properties are given inTable 2. Some rules can be satisfied within acceptable toleranceof error (in blue). There is one violation of the rule (in red) maynot be accepted in reality, but it can be easily fixed by postpro-cessing transformation. The result with the lowest floor area ratiois shown in Figure 4, and its detailed properties are given in Table3. All the PLU rules are satisfied within 0.2 meters tolerance oferror, and the floor area ratio reached to 53.66% of its maximum.This result validates our approach by showing that even the worstpossible result can still be satisfying.
(a) Building layout
(b) Footprints
(c) Energy plot
Figure 3: Result with the highest floor area ratio.
5.2.2 Results with the highest and lowest energy Since thecompliance of the PLU rules and the optimization of floor arearatio are reflected by energy, we verify these two extreme out-comes. The result with the highest energy value is shown in Fig-
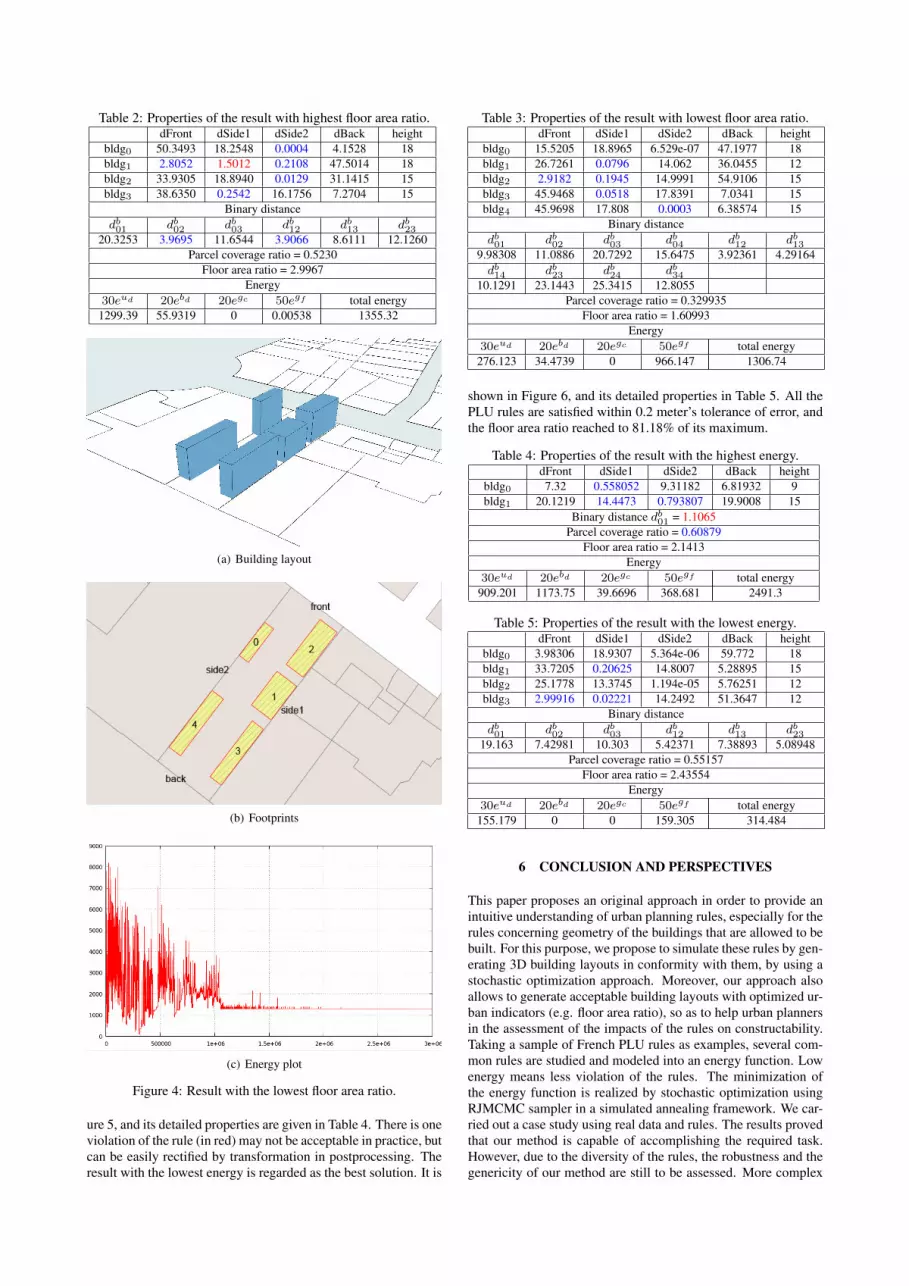
Table 2: Properties of the result with highest floor area ratio.dFront dSide1 dSide2 dBack height
bldg0 50.3493 18.2548 0.0004 4.1528 18bldg1 2.8052 1.5012 0.2108 47.5014 18bldg2 33.9305 18.8940 0.0129 31.1415 15bldg3 38.6350 0.2542 16.1756 7.2704 15
Binary distancedb01 db02 db03 db12 db13 db23
20.3253 3.9695 11.6544 3.9066 8.6111 12.1260Parcel coverage ratio = 0.5230
Floor area ratio = 2.9967Energy
30eud 20ebd 20egc 50egf total energy1299.39 55.9319 0 0.00538 1355.32
(a) Building layout
(b) Footprints
(c) Energy plot
Figure 4: Result with the lowest floor area ratio.
ure 5, and its detailed properties are given in Table 4. There is oneviolation of the rule (in red) may not be acceptable in practice, butcan be easily rectified by transformation in postprocessing. Theresult with the lowest energy is regarded as the best solution. It is
Table 3: Properties of the result with lowest floor area ratio.dFront dSide1 dSide2 dBack height
bldg0 15.5205 18.8965 6.529e-07 47.1977 18bldg1 26.7261 0.0796 14.062 36.0455 12bldg2 2.9182 0.1945 14.9991 54.9106 15bldg3 45.9468 0.0518 17.8391 7.0341 15bldg4 45.9698 17.808 0.0003 6.38574 15
Binary distancedb01 db02 db03 db04 db12 db13
9.98308 11.0886 20.7292 15.6475 3.92361 4.29164db14 db23 db24 db34
10.1291 23.1443 25.3415 12.8055Parcel coverage ratio = 0.329935
Floor area ratio = 1.60993Energy
30eud 20ebd 20egc 50egf total energy276.123 34.4739 0 966.147 1306.74
shown in Figure 6, and its detailed properties in Table 5. All thePLU rules are satisfied within 0.2 meter’s tolerance of error, andthe floor area ratio reached to 81.18% of its maximum.
Table 4: Properties of the result with the highest energy.dFront dSide1 dSide2 dBack height
bldg0 7.32 0.558052 9.31182 6.81932 9bldg1 20.1219 14.4473 0.793807 19.9008 15
Binary distance db01 = 1.1065Parcel coverage ratio = 0.60879
Floor area ratio = 2.1413Energy
30eud 20ebd 20egc 50egf total energy909.201 1173.75 39.6696 368.681 2491.3
Table 5: Properties of the result with the lowest energy.dFront dSide1 dSide2 dBack height
bldg0 3.98306 18.9307 5.364e-06 59.772 18bldg1 33.7205 0.20625 14.8007 5.28895 15bldg2 25.1778 13.3745 1.194e-05 5.76251 12bldg3 2.99916 0.02221 14.2492 51.3647 12
Binary distancedb01 db02 db03 db12 db13 db23
19.163 7.42981 10.303 5.42371 7.38893 5.08948Parcel coverage ratio = 0.55157
Floor area ratio = 2.43554Energy
30eud 20ebd 20egc 50egf total energy155.179 0 0 159.305 314.484
6 CONCLUSION AND PERSPECTIVES
This paper proposes an original approach in order to provide anintuitive understanding of urban planning rules, especially for therules concerning geometry of the buildings that are allowed to bebuilt. For this purpose, we propose to simulate these rules by gen-erating 3D building layouts in conformity with them, by using astochastic optimization approach. Moreover, our approach alsoallows to generate acceptable building layouts with optimized ur-ban indicators (e.g. floor area ratio), so as to help urban plannersin the assessment of the impacts of the rules on constructability.Taking a sample of French PLU rules as examples, several com-mon rules are studied and modeled into an energy function. Lowenergy means less violation of the rules. The minimization ofthe energy function is realized by stochastic optimization usingRJMCMC sampler in a simulated annealing framework. We car-ried out a case study using real data and rules. The results provedthat our method is capable of accomplishing the required task.However, due to the diversity of the rules, the robustness and thegenericity of our method are still to be assessed. More complex

(a) Building layout
(b) Footprints
(c) Energy plot
Figure 5: Result with the highest energy.
rules and use cases will be studied in the near future. We planto lead extra work to design an energy term weight determinationmethod.
This work is realized in the context of the FEDER e-PLU project(http://www.e-plu.fr/) whose aim is to propose a web platformdedicated to territorial engineering. This platform will provideservices such as 3D city navigation, right to build consultationand co-design of urban regulations and will be tested on Plaine-Commune inter-communality by the end of 2015.
Some extensions of the simulator will be realized such as the pos-sibility of managing several types of objects associated to pro-jected buildings. This includes objects such as parking spaces,whose dimensions are linked, in the regulation, to the parcel floorarea, or building architectural elements, that can be generatedwith procedural grammars (as it is realized in (Talton et al., 2011)).A last perspective is to link this tool with other simulators thatconsider other phenomena such as solar radiation or house prices
(a) Building layout
(b) Footprints
(c) Energy plot
Figure 6: Result with the lowest energy.
in order to assess the influence of the regulation on these phe-nomena.
REFERENCES
Bao, F., Yan, D.-M., Mitra, N. J. and Wonka, P., 2013. Generat-ing and exploring good building layouts. ACM Transactions onGraphics.
Brasebin, M., 2014. Les donnees geographiques 3D pour simulerl’impact de la reglementation urbaine sur la morphologie du bati.(to appear). PhD thesis, Universite Paris-Est.
Brasebin, M., Perret, J. and Haeck, C., 2011. Towards a 3d ge-ographic information system for the exploration of urban rules:application to the french local urban planning schemes. In: 28thurban data management symposium (UDMS 2011).
Bredif, M. and Tournaire, O., 2012. librjmcmc: An open-sourcegeneric c++ library for stochastic optimization. In: The XXII

Congress of the International Society of Photogrammetry and Re-mote Sensing.
Coello Coello, C. A., 2010. Constraint-handling techniques usedwith evolutionary algorithms. In: Proceedings of the 12th annualconference companion on Genetic and evolutionary computation,GECCO ’10, ACM, New York, NY, USA, pp. 2603–2624.
Coors, V., Hunlich, K. and On, G., 2009. Constraint-based gen-eration and visualization of 3d city models. In: J. Lee andS. Zlatanova (eds), 3D Geo-Information Sciences, Lecture Notesin Geoinformation and Cartography, Springer Berlin Heidelberg,pp. 365–378.
El Makchouni, M., 1987. Un systeme graphique intelligent d’aidea la conception des plans d’occupation des sols : Sygripos. In:12th Urban Data Management Symposium, Blois, France.
Frazer, J., 1995. An evolutionary architecture. Themes Series,Architectural Association.
Green, P. J., 1995. Reversible jump markov chain monte carlocomputation and bayesian model determination. Biometrika82(4), pp. 711–732.
Kampf, J. H., Montavon, M., Bunyesc, J., Bolliger, R. and Robin-son, D., 2010. Optimisation of buildings’ solar irradiation avail-ability. Solar Energy 84(4), pp. 596–603.
Laurini, R. and Vico, F., 1999. 3d symbolic visual simulationof building rule effects in urban master plans. In: R. Shibasakiand Z. Shi (eds), The Second International Workshop on Urban3D/Multi-Media Mapping (UM3’99), pp. 33–40.
Metral, C., Falquet, G. and Cutting-Decelle, A., 2009. Towardssemantically enriched 3d city models: an ontology-based ap-proach. In: GeoWeb.
Murata, M., 2004. 3d-gis application for urban planning basedon 3d city model. In: 24th Annual ESRI International User Con-ference, pp. 9–13.
Parish, Y. I. H. and Muller, P., 2001. Procedural modelingof cities. In: Proceedings of the 28th annual conference onComputer graphics and interactive techniques, SIGGRAPH ’01,ACM, New York, NY, USA, pp. 301–308.
Perret, J., Curie, F., Gaffuri, J. and Ruas, A., 2010. A multi-agentsystem for the simulation of urban dynamics. In: 10th EuropeanConference on Complex Systems (ECCS’2010).
Rittel, H. W. J. and Webber, M. M., 1973. Dilemmas in a generaltheory of planning. Policy Sciences 4(2), pp. 155–169.
Ruas, A., Perret, J., Curie, F., Mas, A., Puissant, A., Skupinski,G., Badariotti, D., Weber, C., Gancarski, P., Lachiche, N., Lesbe-gueries, J. and Braud, A., 2011. Conception of a gis-platformto simulate urban densification based on the analysis of topo-graphic data. In: Advances in Cartography and GIScience. Vol-ume 2, Lecture Notes in Geoinformation and Cartography, Vol. 6,Springer Berlin Heidelberg, pp. 413–430.
Salamon, P., Sibani, P. and Frost, R., 2002. Facts, Conjectures,and Improvements for Simulated Annealing. Monographs onMathematical Modeling and Computation, Society for Industrialand Applied Mathematics.
Singh, H. K., Isaacs, A., Ray, T. and Smith, W., 2008.A simulated annealing algorithm for single objective Trans-Dimensional optimization problems. In: Hybrid Intelligent Sys-tems, 2008. HIS '08. Eighth International Conference on,IEEE, pp. 19–24.
Talton, J. O., Lou, Y., Lesser, S., Duke, J., Mech, R. and Koltun,V., 2011. Metropolis procedural modeling. ACM Trans. Graph.
Tournaire, O., Bredif, M., Boldo, D. and Durupt, M., 2010. An ef-ficient stochastic approach for building footprint extraction fromdigital elevation models. ISPRS Journal of Photogrammetry andRemote Sensing 65(4), pp. 317–327.
Turk, G., 1990. Generating random points in triangles. In: A. S.Glassner (ed.), Graphics Gems, Academic Press, pp. 24–28.
Turkienicz, B., Goncalves, B. B. and Grazziotin, P., 2008. City-zoom : A visualization tool for the assessment of planning reg-ulations. International Journal of Architectural Computing 6(1),pp. 79–95.
Van Lieshout, M. N. M., 2000. Markov point processes and theirapplications. Imperial College Press, London.
Vanegas, C. A., 2013. Modeling the Appearance and Behavior ofUrban Spaces. PhD thesis, Purdue University.
Wonka, P., Wimmer, M., Sillion, F. and Ribarsky, W., 2003. In-stant architecture. ACM Trans. Graph. 22(3), pp. 669–677.