a steady state mathematical model for riyadh sewage treatment plant al-mutaz
TRANSCRIPT

A. S. Al-Mozini, I. S. Al-Mutaz and A. E. Abasaeed, “A Steady State Mathematical Model for Riyadh Sewage Treatment Plant”, 7th Saudi Engineering Conference, Riyadh, November, 2007.
A STEADY STATE MATHEMATICAL MODEL FOR RIYADH SEWAGE TREATMENT PLANT
A. S. Al-Mozini1, I. S. Al-Mutaz2 and A. E. Abasaeed2,*
1 Riyadh Sewage Treatment Plant (RSTP), north plant, Riyadh, Saudi Arabia, and 2 Chemical Engineering Department, King Saud University, PO Box 800, Riyadh
11421, Saudi Arabia ABSTRACT
The activated sludge process is the technology used to treat the sewage in Riyadh Sewage Treatment Plant (RSTP); the north plant. Due to the complex nature of the process, a simplified steady stat*e model that captures the most important features of the RSTP was developed. Actual operating and design conditions were obtained from RSTP data bank. Part of the plant’s output data (state variables) was used to calibrate the model while the remaining part was used for model validation. A computer program was developed to solve the resulting model equations. The model was tuned based on actual plant data. Before running simulation investigation, the model was verified using different sets of plant data (needless to say that at this stage the model was used without further tuning). Parametric investigation was carried out using various operating conditions and design parameters. Means to improve the performance of the unit was investigated and suggested.
* Corresponding author, [email protected]

A. S. Al-Mozini, I. S. Al-Mutaz and A. E. Abasaeed, “A Steady State Mathematical Model for Riyadh Sewage Treatment Plant”, 7th Saudi Engineering Conference, Riyadh, November, 2007.
Introduction
The main objectives of the biological treatment of wastewater e.g. the
activated sludge process, are: to coagulate and remove the non-settleable colloidal
solids and to stabilize the organic matter. In a conventional activated sludge process,
wastewater is brought into contact with a previously developed biological floc
particles (a great variety of microorganisms come into play that include bacteria,
protozoa, rotifers, nematodes, fungi and algae) in an aerated tank. Part of the organic
matter in wastewater becomes a carbon and an energy source for cell growth. The
biological mass is discharged from the aeration tank to secondary gravity clarifier for
separation of the suspended solids from the treated wastewater [Metcalf and Eddy
Inc., 2003; Sundstrom and Klei, 1979]. Due to the continual production of biomass,
some of the biomass is recycled to the aeration tank while the remaining part is
discarded to avoid buildup of biomass in the system [Sundstrom and Klei, 1979].
Also, the activated sludge process removes carbonaceous Biological Oxygen Demand
(BOD) and oxidized ammonia. Nitrification occurs when nitrifying bacteria called
nitrosomas oxidize ammonia to nitrite and nitrobacter continues the oxidation to
nitrate. A denitrification process is then employed to convert the formed nitrate to
nitrogen gas. This occurs in an anoxic environment [Dosta, et al., 2007; Saziye and
Ridvan, 2006; Stare, et al., 2006; Metcalf and Eddy Inc., 2003; Hao and Huang,
1996]. This process configuration is used in the north plant in Riyadh Sewage
Treatment Plant, RSTP.
Modeling of activated sludge processes is complicated by the vast number of
bioreactions that take place. A great deal of research efforts was devoted to
developing models that describe the activated sludge process [Stare, et al., 2006;
Moussa, et al., 2005; Kim, 2000; Henze, et al., 2000; Gujer, et al., 1999; Abasaeed,

A. S. Al-Mozini, I. S. Al-Mutaz and A. E. Abasaeed, “A Steady State Mathematical Model for Riyadh Sewage Treatment Plant”, 7th Saudi Engineering Conference, Riyadh, November, 2007.
1999; Ibrahim and Abasaeed, 1995; Henze, et al., 1987; Dold and Marais, 1986; Dold,
et al., 1980]. Henze et al., (1987) proposed a mathematical model that predicts
degradation of organic matter as well as nitrification and denitrification in suspended
growth wastewater treatment. Perhaps the recently developed model (ASM3) which
predicts oxygen consumption, sludge production, nitrification and denitrification of
the activated sludge process, provides a rather detailed and comprehensive model
[Gujer et al., 1999]. Despite all efforts and refinements in the models, part of the final
outcome remains empirical [Ibrahim and Abasaeed, 1995]. Therefore, the best
approach is to produce a model that is simple mathematically, yet, captures the
documented important events in the system. This is particularly true when applying
practical control strategy to real systems [Stare, et al., 2006; Kim, 2000; Ibrahim and
Abasaeed, 1995].
In this contribution, we present a rather simplified model to describe the
performance of an activated sludge plant operated in Riyadh. The actual plant data
over a period of one year will be used to calibrate some of the model parameters. The
model will then be tested against other plant data without further adjustment of the
parameters.
Plant Description
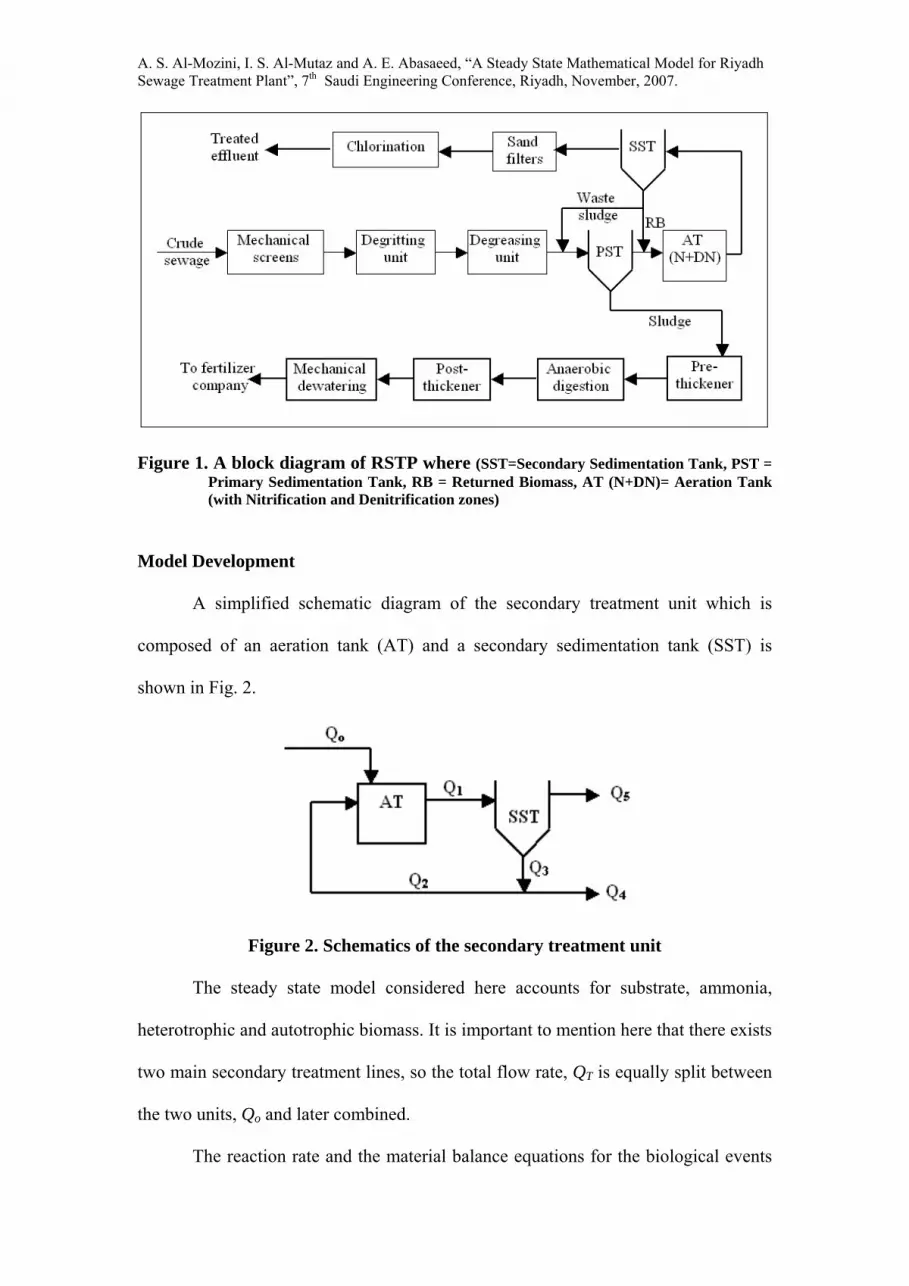
A block diagram of Riyadh Sewage Treatment Plant is shown in Figure 1
[OMM, 1992]. The block diagram can be divided into five main sections: (1)
preliminary, (2) primary, (3) secondary, (4) tertiary and (5) sludge treatment
sections. Raw wastewater enters the plant (middle section) through the preliminary
treatment section which composed of (a) mechanical screens to remove trash,
coarse solids and floating matters (b) a degritting unit to remove gravel, sands and
any particle of size greater than 200 μm (c) a degreasing unit that removes oil and

A. S. Al-Mozini, I. S. Al-Mutaz and A. E. Abasaeed, “A Steady State Mathematical Model for Riyadh Sewage Treatment Plant”, 7th Saudi Engineering Conference, Riyadh, November, 2007.
grease and serves as a backup unit for the degritting unit. Pretreated wastewater is
then passed to the primary sedimentation tank (PST). In the PST, readily settleable
solids and floating particles are removed. The unit also serves as the basin that
receives wasted sludge from the secondary sedimentation tank (SST). The
complete draw-off the sludge to the sludge treatment section (bottom section)
occurs in this unit. The partially treated wastewater is then passed to the secondary
treatment section to coagulate and remove the nonsettleable colloidal solids and to
reduce the BOD and nutrients such as phosphorous and nitrogen. This section is
composed of (a) aeration tanks (AT) in which the wastewater passes alternating
aerobic (for nitrification, N) and anoxic (for denitrification, DN) zones (b)
secondary sedimentation tank (SST) in which the mixed liquor is separated from
the activated sludge synthesized in the aeration tanks. The separated sludge is
partly sent to the aeration tank (AT) and party wasted to the PST. In the tertiary
treatment section, the treated water from the SST is percolated through sand
filters. Chlorine solution is used to disinfect the treated before sending it for reuse
from the plant. The bottom part of the RSTP block diagram is the sludge handling
section which is composed of (a) pre-thickeners to adjust the water content (b) an
anaerobic digestion unit in which biogas (methane and carbon dioxide) and a
fertilizer-rich sludge are produced (c) post-thickeners and (d) a mechanical
dewatering unit to reduce the volume of the sludge before shipping to fertilizers’
companies.
The basic design characteristics of RSTP are: nominal flow is 200000 m3/day,
peak flow rate is 320000 m3/day, average influent and effluent soluble solids are 400
and 10 mg/l respectively, average influent and effluent BOD are 300 and 10 mg/l
respectively.
A. S. Al-Mozini, I. S. Al-Mutaz and A. E. Abasaeed, “A Steady State Mathematical Model for Riyadh Sewage Treatment Plant”, 7th Saudi Engineering Conference, Riyadh, November, 2007.
Figure 1. A block diagram of RSTP where (SST=Secondary Sedimentation Tank, PST =
Primary Sedimentation Tank, RB = Returned Biomass, AT (N+DN)= Aeration Tank (with Nitrification and Denitrification zones)
Model Development
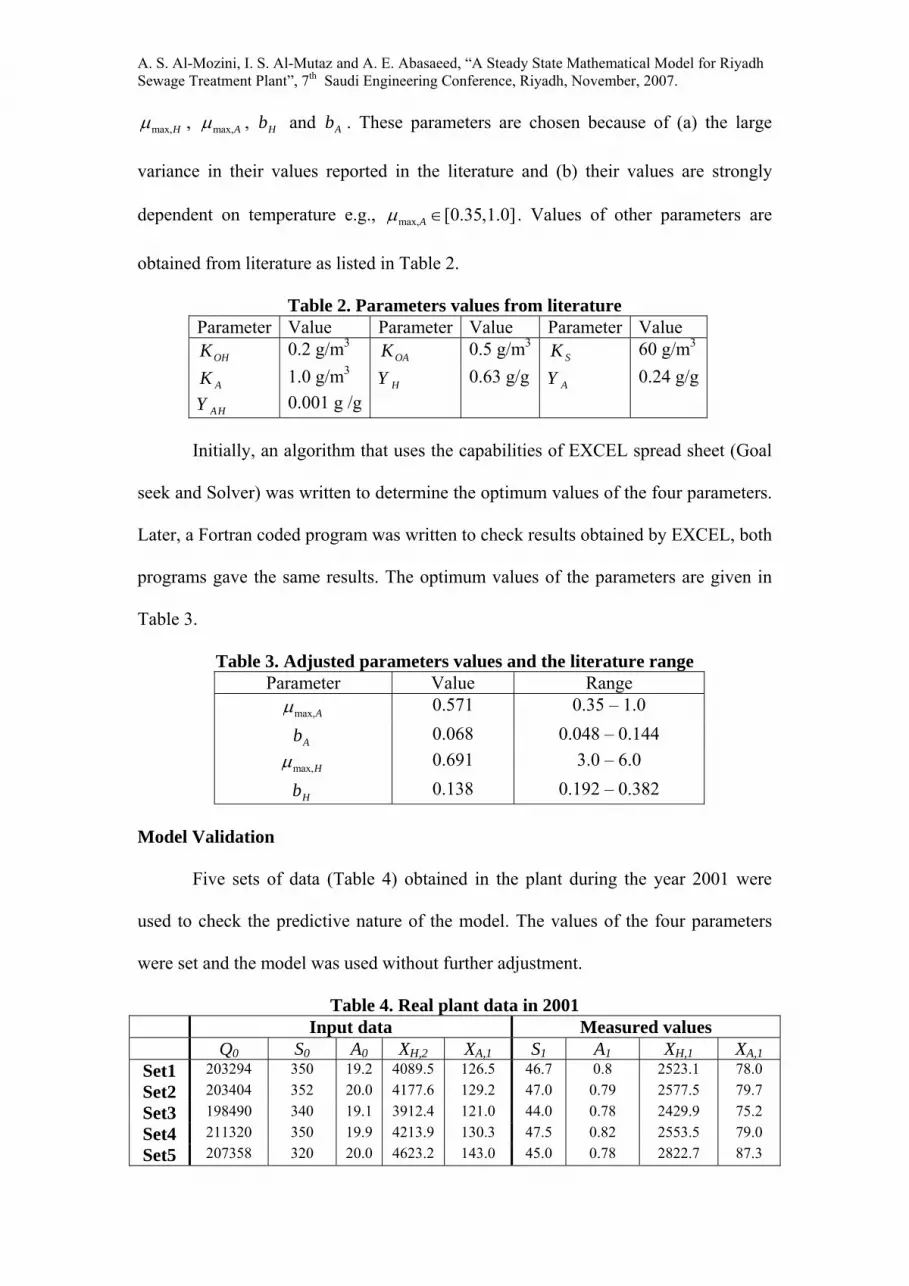
A simplified schematic diagram of the secondary treatment unit which is
composed of an aeration tank (AT) and a secondary sedimentation tank (SST) is
shown in Fig. 2.
Figure 2. Schematics of the secondary treatment unit
The steady state model considered here accounts for substrate, ammonia,
heterotrophic and autotrophic biomass. It is important to mention here that there exists
two main secondary treatment lines, so the total flow rate, QT is equally split between
the two units, Qo and later combined.
The reaction rate and the material balance equations for the biological events

A. S. Al-Mozini, I. S. Al-Mutaz and A. E. Abasaeed, “A Steady State Mathematical Model for Riyadh Sewage Treatment Plant”, 7th Saudi Engineering Conference, Riyadh, November, 2007.
that take place in this process are shown below.
Rate of aerobic growth of heterotrophs, RH
1max, 1
1
* * *( ) ( )H H H
S OH
S OR XS K K O
μ=+ +
(1)
Rate of decay of heterotrophs, DH
1.H HD b X= (2)Rate of aerobic growth of autotrophs, RA
1max, 1
1
* * *( ) ( )A A A
A OA
A OR XA K K O
μ=+ +
(3)
Rate of decay of autotrophs, RA
1.H HD b X= (4)Mass balances around aeration tank (AT)
(a) substrate removal
1 10 0 2 2 1 1 1
( . ) . . . H
H
d V S RQ S Q S Q S Vdt Y
= + − − (5)
(b) Ammonia removal
1 10 0 2 2 1 1 1 1
( . ) 1. . . . . .A AH AH HA
d V A Q A Q A Q A V R Y Y V Rdt Y
⎛ ⎞= + − − + −⎜ ⎟
⎝ ⎠ (6)
(c) Heterotrophic biomass
1 10 0 2 2 1 1 1 1 1
( . ) . . . . . .HH H H H H H
d V X Q X Q X Q X V R V b Xdt
= + − + − (7)
(d) Autotrophic biomass
1 10 0 2 2 1 1 1 1 1
( . ) . . . . . .AA A A A A A
d V X Q X Q X Q X V R V b Xdt
= + − + − (8)
Mass balances around settler (SST)
The main function of the settler is to separate the biomass from the treated
liquor, therefore, the concentrations of the substrate and ammonia entering or leaving
the unit is similar, thus:

A. S. Al-Mozini, I. S. Al-Mutaz and A. E. Abasaeed, “A Steady State Mathematical Model for Riyadh Sewage Treatment Plant”, 7th Saudi Engineering Conference, Riyadh, November, 2007.
Heterotrophic biomass: 2 31 1 3 3
( . ) . .HH H
d V X Q X Q Xdt
= −
where 3 2 5H H HX X X= =
(9)
Autotrophic biomass: 2 31 1 3 3
( . ) . .AA A
d V X Q X Q Xdt
= −
where 3 2 5A A AX X X= =
(10)
Substrate: 1 2 3 4 5S S S S S= = = = (11)
Ammonia: 1 2 3 4 5A A A A A= = = = (12)
It is clear from Fig. 2 that the flow rates can be related by:
1 2 3 4oQ Q Q Q Q= + = + and 3 2 5Q Q Q= + (13)
The steady state equations are obtained by setting the left hand sides of
equations (5 – 10) equal to zero.
Model Calibration
The steady state model equations (5–10) together with the rate equations (1–4)
and equations (11–13) are used to calibrate the model against plant data obtained over
a one year period as shown in Table 1 for the year 1997.
Table 1. Actual plant data (monthly average) for the year 1997. QT So S1 Ao A1 XH1 XA1
1 211404 359 30.0 18.9 0.6 2577.5 79.7 2 220102 368 42.0 17.8 0.4 2471.3 76.4 3 215374 334 49.0 18.0 0.3 2531.7 78.3 4 203347 345 46.0 18.0 0.8 2428.4 75.1 5 204552 338 41.0 18.0 0.6 2667.0 82.5 6 187747 352 57.0 18.8 1.0 2474.2 76.5 7 207358 350 47.8 17.4 0.7 2467.7 76.3 8 197247 355 36.8 18.8 0.6 2471.3 76.4 9 198005 324 51.7 19.4 0.5 2607.4 80.6 10 194279 344 51.0 20.1 1.9 2515.0 77.8 11 194500 367 55.0 21.8 1.1 2504.8 77.5 12 199609 386 47.0 22.0 0.9 2582.6 79.9
Average 202794 351.8 46.2 19.1 0.785 2524.9 78.1 Maximum 220102 386 57 22 1.9 2667.0 82.5 Minimum 187747 324 30 17.4 0.3 2428.4 75.1
% Difference 17.2 19.1 90.0 26.4 533.3 9.8 9.8
The plant data in Table 1 is used to adjust four model parameters, namely,
A. S. Al-Mozini, I. S. Al-Mutaz and A. E. Abasaeed, “A Steady State Mathematical Model for Riyadh Sewage Treatment Plant”, 7th Saudi Engineering Conference, Riyadh, November, 2007.
max,Hμ , max,Aμ , Hb and Ab . These parameters are chosen because of (a) the large
variance in their values reported in the literature and (b) their values are strongly
dependent on temperature e.g., max, [0.35,1.0]Aμ ∈ . Values of other parameters are
obtained from literature as listed in Table 2.
Table 2. Parameters values from literature Parameter Value Parameter Value Parameter Value OHK 0.2 g/m3 OAK 0.5 g/m3
SK 60 g/m3 AK 1.0 g/m3 HY 0.63 g/g AY 0.24 g/g AHY 0.001 g /g
Initially, an algorithm that uses the capabilities of EXCEL spread sheet (Goal
seek and Solver) was written to determine the optimum values of the four parameters.
Later, a Fortran coded program was written to check results obtained by EXCEL, both
programs gave the same results. The optimum values of the parameters are given in
Table 3.
Table 3. Adjusted parameters values and the literature range Parameter Value Range max,Aμ 0.571 0.35 – 1.0 Ab 0.068 0.048 – 0.144 max,Hμ 0.691 3.0 – 6.0 Hb 0.138 0.192 – 0.382 Model Validation
Five sets of data (Table 4) obtained in the plant during the year 2001 were
used to check the predictive nature of the model. The values of the four parameters
were set and the model was used without further adjustment.
Table 4. Real plant data in 2001 Input data Measured values Q0 S0 A0 XH,2 XA,1 S1 A1 XH,1 XA,1 Set1 203294 350 19.2 4089.5 126.5 46.7 0.8 2523.1 78.0 Set2 203404 352 20.0 4177.6 129.2 47.0 0.79 2577.5 79.7 Set3 198490 340 19.1 3912.4 121.0 44.0 0.78 2429.9 75.2 Set4 211320 350 19.9 4213.9 130.3 47.5 0.82 2553.5 79.0 Set5 207358 320 20.0 4623.2 143.0 45.0 0.78 2822.7 87.3

A. S. Al-Mozini, I. S. Al-Mutaz and A. E. Abasaeed, “A Steady State Mathematical Model for Riyadh Sewage Treatment Plant”, 7th Saudi Engineering Conference, Riyadh, November, 2007.
A comparison between model prediction and the five sets of real plant data
(2001 data) is shown in Table 5. Also, a 5% parity plot between measured and
predicted values is shown in Fig. 3.
Table 5. Comparison between predicted values and plant data in 2001 Measured values Predicted values S1 A1 XH,1 XA,1 S1 A1 XH,1 XA,1 Set1 46.7 0.80 2523.1 78.0 46.7 0.80 2523.8 78.0 Set2 47.0 0.79 2577.5 79.7 45.7 0.83 2581.0 79.9 Set3 44.0 0.78 2429.9 75.2 45.2 0.81 2440.1 75.5 Set4 47.5 0.82 2553.5 79.0 48.2 0.89 2566.1 79.4 Set5 45.0 0.78 2822.7 87.3 42.8 0.73 2831.3 87.6
Figure 3. A 5% parity plot for the five sets (dashed line is + 5% off solid line)
It is clear from both Table 5 and Fig. 3 that the model predictions are very
close to real plant data. They all (except for ammonia removal which showed
fluctuations reaching 9% of the measured values) fit within a 5% margin.

A. S. Al-Mozini, I. S. Al-Mutaz and A. E. Abasaeed, “A Steady State Mathematical Model for Riyadh Sewage Treatment Plant”, 7th Saudi Engineering Conference, Riyadh, November, 2007.
Sensitivity Analysis
Figures 4 and 5 show the effect of various parameters (namely, max,Hμ and Qo)
on the performance of the units. It is clear from Fig. 4 that increasing max,Hμ leads to
an increase in the concentration of the heterotrophs (XH1) and a decrease in substrate
concentration (S1) while insignificantly affecting XA1 (<0.01%) and A1 (<1.5%).
Figure 5 shows significant increase of S1 and A1 which is accompanied by significant
drop in XH1 and XA1 as the fresh feed flow rate, Qo, is increased.
Figure 4. Effect of max,Hμ on S1, A1, XH1 and XA1
Conclusions
Riyadh sewage treatment plant (RSTP) used the activated sludge process to
treat sewage. A simplified steady state model was developed for the plant. Plant data
collected in 1997 was used to calibrate the model by adjusting some parameters. The
predictive nature of the calibrated model was then tested (without further adjustment)
against five sets of plant data collected in 2001. Model predictions were very close

A. S. Al-Mozini, I. S. Al-Mutaz and A. E. Abasaeed, “A Steady State Mathematical Model for Riyadh Sewage Treatment Plant”, 7th Saudi Engineering Conference, Riyadh, November, 2007.
(within + 5% margins) to real plant data. Sensitivity of model predictions to
parameters values analysis was also assessed. It is important to note that this model
was calibrated using data spanning summer and winter, therefore, temperature effects
are implicitly considered.
Figure 5. Effect of influent flow rate, Qo, on S1, A1, XH1 and XA1
Nomenclature A0 fresh feed ammonia concentration, g/m3 A1 aeration tank effluent ammonia concentration, g/m3 A2 effluent ammonia concentration, g/m3 bA decay rate of nitrifiers, day-1 bH heterotrophic decay rate, day-1 KA ammonia half saturation, gN/m3 KS substrate half saturation, gCOD/m3 KOH oxygen half saturation for heterotrophs, gO2/m3 KOA oxygen half saturation for autotrophs , gO2/m3 S0 fresh feed substrate concentration, g/m3 S1 aeration tank effluent substrate concentration, g/m3 S2 effluent substrate concentration, g/m3 Q0 fresh feed flow rate, m3/d Q1 aeration tank effluent flow rate, m3/d Q2 return activated sludge flow rate, m3/d Q3 sludge withdraw from secondary clarifier, m3/d Q4 secondary sedimentation tank liquor flow rate, m3/d Q5 wasting flow rate, m3/d XH1 heterotrophic biomass concentration, g/m3

A. S. Al-Mozini, I. S. Al-Mutaz and A. E. Abasaeed, “A Steady State Mathematical Model for Riyadh Sewage Treatment Plant”, 7th Saudi Engineering Conference, Riyadh, November, 2007.
XA1 autotrophic biomass concentration, g/m3 XH2 return heterotrophic biomass concentration, g/m3 XA2 return autotrophic biomass concentration, g/m3 RH aerobic growth of heterotrophic organism RA aerobic growth of autotrophic organism YAH N content of biomass, gN/gCOD O oxygen concentration, g/m3 V1 Volume of aeration tank, m3 YH heterotrophic yield coefficient, gCOD/gCOD YA autotrophic yield coefficient, gCOD/gN Greek letters μmax,H maximum growth rate of heterotrophic organisms, day-1 μmax,A maximum growth rate of autotrophic organisms, day-1
References
Abasaeed, A. E. (1999). Sensitivity analysis on a sequencing reactor model: II. Effect of stoichiometric and operating parameters. J. Chem. Technol. & Biotechnol. 74: 451-599.
Dold, P. L. and Marais, G. V. (1986). Evaluation of the general activated sludge proposed by the IAWPRC task group. Water Science Technology. 18: 63-89.
Dold, P. L., Ekama, G. A. and Marais, G. V. (1980). A general model for activated sludge process. Prog. Wat. Technol. 12: 47-77.
Dosta, J., Gali, A., El-Hadj, B., Mace, S. and Mata-Alvarez, J. (2007). Operation and model description of a sequencing batch reactor treating reject water for biological nitrogen removal via nitrite. Bioresource Technology. 98: 2065-2075.
Gujer, W., Henze, M., Mino, T., Loosdrecht, M. C. (1999). Activated sludge model No. 3. Water Science Technology. 39: 183-193.
Hao, O. J. and Huang, J. (1996). Alternating aerobic-anoxic process for nitrogen removal: Process evaluation. Water Environment Research. 68: 83-93.
Henze, M., Grady, C. P., Gujer, W., Marais, G. V. and Matsuo, T. (1987). A general model for single-sludge wastewater treatment systems. Water Researcher, 21: 505-515.
Henze, M., Gujer, W., Mino, T., Loosdrecht, M. C. (2000). Activated sludge models ASM1, ASM2, ASM2d and ASM3. IWA publishing, London, UK.
Ibrahim, G. and Abasaeed, A. E. (1995). Modeling of sequencing batch reactors. Water Research. 29: 1761-1766.
Kim, H. (2000). Temporal activated sludge systems: modeling approach and process control. Ph.D. thesis. University of Maryland-College Park, USA.
Metcalf and Eddy, Inc. (2003). Wastewater engineering treatment and reuse. 4th edition, Tata, McGraw Hill, New Delhi.
Moussa, M. S., Hooijmans, C. M., Lubberding, H. J., Gijzen, H. J. and Loosdrecht, M. C. (2005). Modelling nitrification, heterotrophic growth and predation in activated sludge. Water Research. 39: 5080-5098.
Operation and Maintenance Manual (OMM) for North Plant in RSTP. (1992). Riyadh Sewage Treatment Plant Documentations.
Saziye, B. and Ridvan, B., (2006). Dynamics of an activated sludge process with nitrification and denitrification: start-up simulation and optimization using

A. S. Al-Mozini, I. S. Al-Mutaz and A. E. Abasaeed, “A Steady State Mathematical Model for Riyadh Sewage Treatment Plant”, 7th Saudi Engineering Conference, Riyadh, November, 2007.
evolutionary algorithm. Computers & Chemical Engineering, 30: 490-499. Stare, A., Hvala, N. and Vrecko, D. (2006). Modeling, identification and validation of
Models for predictive ammonia control in a wastewater treatment plant – A case study. ISA Transactions, 45: 159-174.
Sundstrom, D. W. and Klei, H. E. (1979). Wastewater treatment. Prentice-Hall Inc., Englewood Cliffs, N. J. USA.