a robust content-based image retrieval system using multiple features representations
TRANSCRIPT
Abstract. The similarity measurements and the representation of the visual features are two important issues in Content-Based Image Retrieval (CBIR). In this paper, we compared between the combination of wavelet-based representations of the texture feature and the color feature with and without using the color layout feature. To represent the color information, we used Global Color Histogram (GCH) beside the color layout feature and with respect to the texture information, we used Haar and Daubechies wavelets. Based on some commonly used Euclidean and Non-Euclidean similarity measures, we tested different categories of images and measured the retrieval accuracy when combining such techniques. The experiments showed that the combination of GCH and 2-D Haar wavelet transform using the cosine distance gives good results while the best results obtained when adding the color layout feature to this combination by using the Euclidean distance. The results reflected the importance of using the spatial information beside the color feature itself and the importance of choosing good similarity distance measurements. Index Terms—Content-Based Image Retrieval, Global Color Histogram, 2-D Haar Wavelet Transform, Daubechies Wavelets, Color layout, Similarity Measurements.
I. INTRODUCTION
The last few years have witnessed many advanced techniques evolving in Content-Based Image Retrieval (CBIR) systems. CBIR is considered as the process of retrieving desired images from huge databases based on extracted features from the image themselves without resorting to a keyword [1]. Features are derived directly from the images and they are extracted and analyzed automatically by means of computer processing [2]. Many commercial and research content-based image retrieval systems have been built and developed (For example: QBIC, Netra, and Photobook [3]). CBIR aims at searching image libraries for specific image features like colors and textures and querying is performed by comparing feature vectors (e.g. color histograms) of a search image with the feature vectors of all images in the database. The visual features are classified into low and high level features according to their complexity and the use of semantics [1]. The use of simple features like color or shape is not efficient [4]. When retrieving images using combinations of these features there is a need for testing the accuracy of these combinations and comparing them with the single features based retrieval in order to find the combinations that give the best matches that enhance the performance of CBIR systems. In fact, some CBIR systems give good results for special cases of database images as till now no standard data set for testing the accuracy of CBIR Systems [5]. So one of the most important challenges facing the evaluation of
CBIR systems performance is creating a common image collection and obtaining relevance judgments [6]. On the other hand the use of similarity measurements is very effective in CBIR. After extracting the required features from images the retrieval process becomes the measurement of similarity between the feature vectors one for the query image and the other for each database image. Section III will present some of the common used similarity distance measurements include Euclidean and Non-Euclidean distance measures. The rest of this paper is organized as follows: section II briefly covers the feature extraction process using Global Color Histogram, Haar and Daubechies wavelets, and the color layout algorithm. Section III shows how we used the similarity measurements to get the distance between each two feature vectors. Section IV presents the experimental results for comparing wavelets, similarity measurements, and the combination of color, texture, and color layout features, and finally with concluding remarks.
II. VISUAL FEATURES REPRESENTATIONS
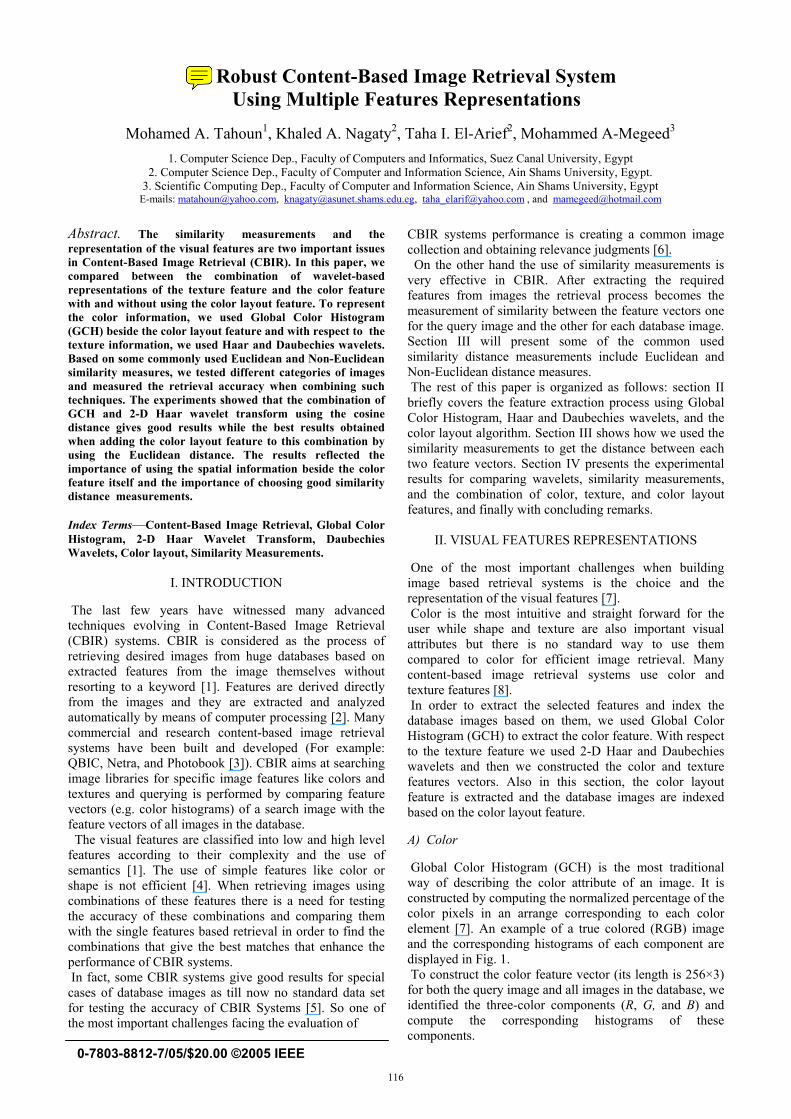
One of the most important challenges when building image based retrieval systems is the choice and the representation of the visual features [7]. Color is the most intuitive and straight forward for the user while shape and texture are also important visual attributes but there is no standard way to use them compared to color for efficient image retrieval. Many content-based image retrieval systems use color and texture features [8]. In order to extract the selected features and index the database images based on them, we used Global Color Histogram (GCH) to extract the color feature. With respect to the texture feature we used 2-D Haar and Daubechies wavelets and then we constructed the color and texture features vectors. Also in this section, the color layout feature is extracted and the database images are indexed based on the color layout feature. A) Color Global Color Histogram (GCH) is the most traditional way of describing the color attribute of an image. It is constructed by computing the normalized percentage of the color pixels in an arrange corresponding to each color element [7]. An example of a true colored (RGB) image and the corresponding histograms of each component are displayed in Fig. 1. To construct the color feature vector (its length is 256×3) for both the query image and all images in the database, we identified the three-color components (R, G, and B) and compute the corresponding histograms of these components.
A Robust Content-Based Image Retrieval System Using Multiple Features Representations
Mohamed A. Tahoun1, Khaled A. Nagaty2, Taha I. El-Arief2, Mohammed A-Megeed3
1. Computer Science Dep., Faculty of Computers and Informatics, Suez Canal University, Egypt
2. Computer Science Dep., Faculty of Computer and Information Science, Ain Shams University, Egypt. 3. Scientific Computing Dep., Faculty of Computer and Information Science, Ain Shams University, Egypt
E-mails: [email protected], [email protected], [email protected] , and [email protected]
0-7803-8812-7/05/$20.00 ©2005 IEEE 116
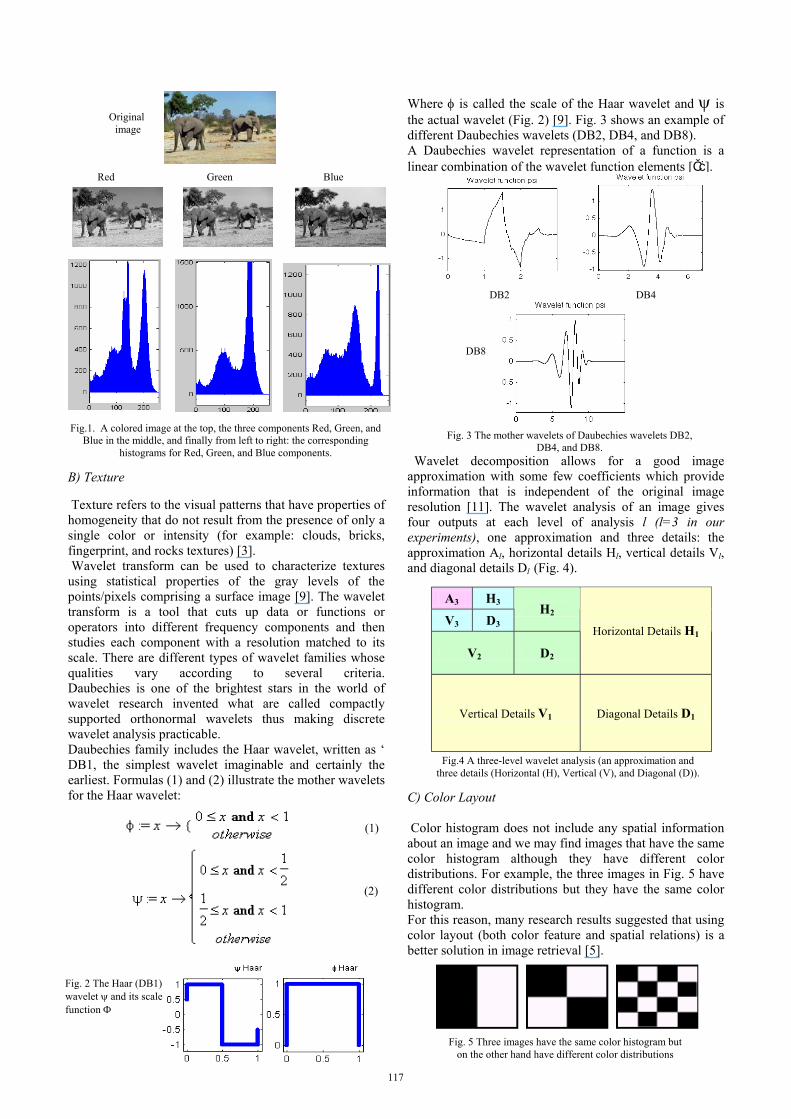
B) Texture Texture refers to the visual patterns that have properties of homogeneity that do not result from the presence of only a single color or intensity (for example: clouds, bricks, fingerprint, and rocks textures) [3]. Wavelet transform can be used to characterize textures using statistical properties of the gray levels of the points/pixels comprising a surface image [9]. The wavelet transform is a tool that cuts up data or functions or operators into different frequency components and then studies each component with a resolution matched to its scale. There are different types of wavelet families whose qualities vary according to several criteria. Daubechies is one of the brightest stars in the world of wavelet research invented what are called compactly supported orthonormal wavelets thus making discrete wavelet analysis practicable. Daubechies family includes the Haar wavelet, written as ‘ DB1, the simplest wavelet imaginable and certainly the earliest. Formulas (1) and (2) illustrate the mother wavelets for the Haar wavelet:
Where φ is called the scale of the Haar wavelet and ψ is the actual wavelet (Fig. 2) [9]. Fig. 3 shows an example of different Daubechies wavelets (DB2, DB4, and DB8). A Daubechies wavelet representation of a function is a linear combination of the wavelet function elements [١٠]. Wavelet decomposition allows for a good image approximation with some few coefficients which provide information that is independent of the original image resolution [11]. The wavelet analysis of an image gives four outputs at each level of analysis l (l=3 in our experiments), one approximation and three details: the approximation Al, horizontal details Hl, vertical details Vl, and diagonal details Dl (Fig. 4). C) Color Layout Color histogram does not include any spatial information about an image and we may find images that have the same color histogram although they have different color distributions. For example, the three images in Fig. 5 have different color distributions but they have the same color histogram. For this reason, many research results suggested that using color layout (both color feature and spatial relations) is a better solution in image retrieval [5].
Fig. 5 Three images have the same color histogram but on the other hand have different color distributions
(1)
(2)
Fig.1. A colored image at the top, the three components Red, Green, and Blue in the middle, and finally from left to right: the corresponding
histograms for Red, Green, and Blue components.
Red Green Blue
Original image
A3 H3
V3 D3 H2
V2 D2
Horizontal Details H1
Vertical Details V1 Diagonal Details D1
Fig.4 A three-level wavelet analysis (an approximation and three details (Horizontal (H), Vertical (V), and Diagonal (D)).
DB8
DB2 DB4
Fig. 3 The mother wavelets of Daubechies wavelets DB2, DB4, and DB8.
Fig. 2 The Haar (DB1) wavelet ψ and its scale function Φ
117
In traditional color layout image indexing, the image is divided into equal-sized blocks and then the average color is computed on the pixels in each block [10]. These values are stored for image matching using similarity measures. In our experiments the steps for creating the color layout feature vector from an image are:
1- Divide the image into 16x16 sub-blocks. 2- Extract the color feature components for each sub-
block (Identifying the three components R, G, and B for each block).
3- Calculate the average for each of the three components in each sub-block.
4- Then construct the color layout feature vector (16x16x3) that will represent the color layout feature.
III. SIMILARITY DISTANCE MEASURING
Once the features vectors are created, the matching process becomes the measuring of a metric distance between the features vectors. Understanding the relationship among distance measures can help choosing a suitable one for a particular application [12]. In this section, we show how the features vectors are compared together using different Euclidean and Non-Euclidean similarity measurements. After comparing each query image with all the database images the obtained distances will be sorted and the corresponding images are displayed during the retrieval process.
A) Manhattan Distance
The first used distance measure is called city block metric or L1 distance and its general form is expressed in (3): Where q and r are two vectors in n-dimensional space. To test the similarity between each two color feature vectors one for the query image and the other for each database image, we used the city block distance measure which is known as Manhattan Distance (4) as the histogram comparison distance measure:
Where Hi (j) denote the histogram value for the ith image, j is one of the G possible gray levels,
ii NM * is the number of pixels in an image i,
kk NM * is the number of pixels in image k, and M is the number of rows and N is the number of columns. We calculated the distance between each two corresponding histograms of the three components Red, Green, and Blue. Then we used the following transformation (5) to convert the three distances into one distance that will be sorted and used as the basis for displaying the results: Where CD is the distance between the two color feature vectors, and (R) DC , (G)DC , and (B)DC are the distances
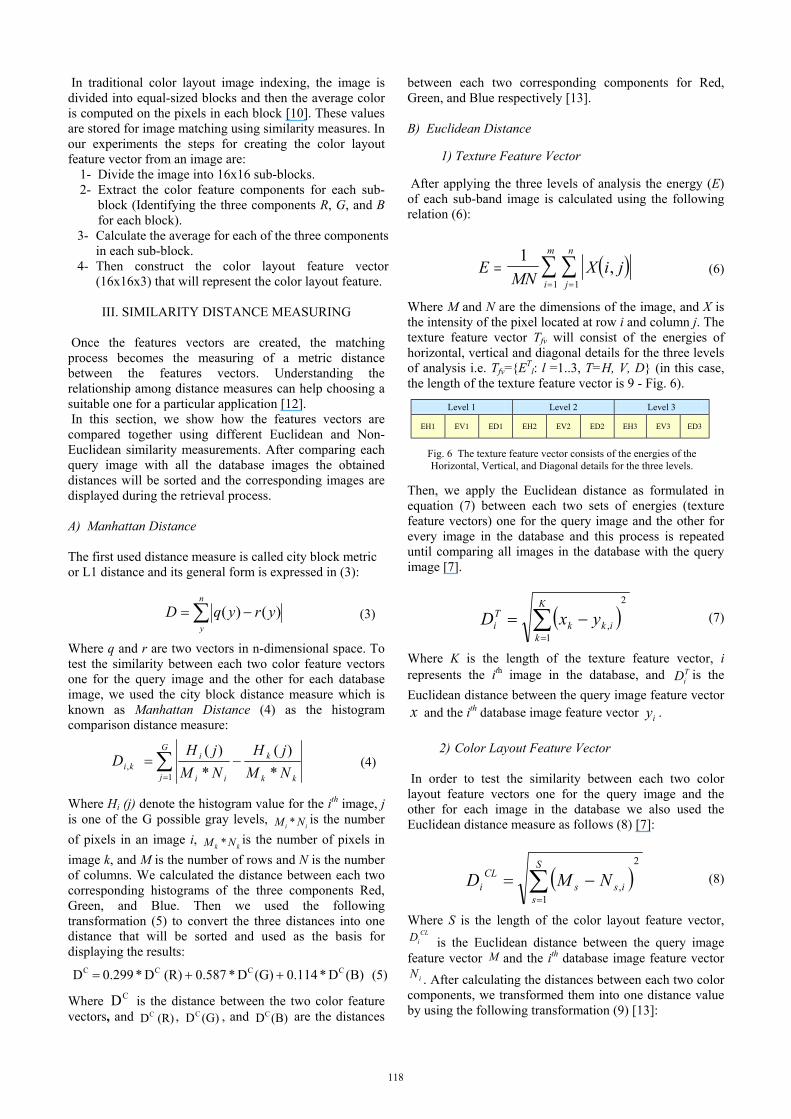
between each two corresponding components for Red, Green, and Blue respectively [13]. B) Euclidean Distance 1) Texture Feature Vector After applying the three levels of analysis the energy (E) of each sub-band image is calculated using the following relation (6):
Where M and N are the dimensions of the image, and X is the intensity of the pixel located at row i and column j. The texture feature vector Tfv will consist of the energies of horizontal, vertical and diagonal details for the three levels of analysis i.e. Tfv={ET
l: l =1..3, T=H, V, D} (in this case, the length of the texture feature vector is 9 - Fig. 6). Then, we apply the Euclidean distance as formulated in equation (7) between each two sets of energies (texture feature vectors) one for the query image and the other for every image in the database and this process is repeated until comparing all images in the database with the query image [7].
Where K is the length of the texture feature vector, i represents the ith image in the database, and T
iD is the Euclidean distance between the query image feature vector x and the ith database image feature vector iy .
2) Color Layout Feature Vector
In order to test the similarity between each two color layout feature vectors one for the query image and the other for each image in the database we also used the Euclidean distance measure as follows (8) [7]:
Where S is the length of the color layout feature vector, CL
iD is the Euclidean distance between the query image feature vector M and the ith database image feature vector
iN . After calculating the distances between each two color components, we transformed them into one distance value by using the following transformation (9) [13]:
∑ −=n
y
yryqD )()( (3)
∑=
−=G
j kk
k
ii
iki NM
jHNMjH
D1
, *)(
*)(
(4)
( )EMN
X i jj
n
i
m
===∑∑1
11,
(6)
( )2
1,∑
=
−=K
kikk
Ti yxD (7)
( )2
1,∑
=
−=S
siss
CLi NMD
(8)
Fig. 6 The texture feature vector consists of the energies of the Horizontal, Vertical, and Diagonal details for the three levels.
Level 1 Level 2 Level 3
EH1 EV1 ED1 EH2 EV2 ED2 EH3 EV3 ED3
(B)D* 0.114 (G)D *0.587 (R) D* 0.299 D CCCC ++= (5)
118
Where CLD is the final Euclidean distance between the
two color layout feature vectors and )(RDCL, )(GDCL
, and )(BDCL are the Euclidean distances between each two
corresponding components for Red, Green, and Blue respectively. C) Correlation Distance
In this measurement, the similarity between each two feature vectors x and y is measured by computing the Pearson-r correlation Corr(x,y) as in (10):
Where x and y are the means of x and y respectively, while n is the number of columns. We used this Nun-Euclidean similarity measurement to measure the distance between the texture and color layout features vectors using the same steps done in the subsection (B). D) Cosine Similarity Distance The cosine distance is another Non-Euclidean distance measure and we also used it to get the distance between each two feature vectors in both texture and color layout features based on the energies and the color layout algorithm respectively. The similarity distance between two feature vectors D and Q will be given by (11):
Where ),....,( 10 ndddD = is the database image feature vector, ),....,( 10 nqqqQ = is the query image feature vector, and n is
the length of the feature vector [12]. E) Point-to-Point Similarity Distance This measure is related to the wavelet decomposition approach where the texture feature vectors are constructed based on the sub-bands or the details themselves resulting from the 3-levels wavelet of analysis and in this case, we did not compute the energies of these sub-bands (the texture feature vector length is also 9). By using wavelet analysis, we can define a similarity distance )),(),,(( yxyxS ′′ for any pair of image points on the reference image ),( yxf and the matched image ),( yxf ′′′ on any given level [14]. If we consider single point to point match on the jth level, the similarity distance can be defined using three differential components Dj,p f (x, y), p = 1, 2, 3. By using the following feature vector (Bj) in (12):
, p = 1,2, 3 (12)
Where denotes to L2 norm and ),( yxAj denotes to the approximation, we can define a normalized similarity distance as formulated in (13) [14]:
),(),()),(),,(( yxByxByxyxSB jjj ′′′−=′′ (13)
In order to calculate the similarity distance for the whole image, we calculated the arithmetic mean of all similarity distances which defined as the sum of their values divided by the number of pixels then we can get a single distance value between each query image and all images database.
IV. EXPERIMENTS AND RESULTS
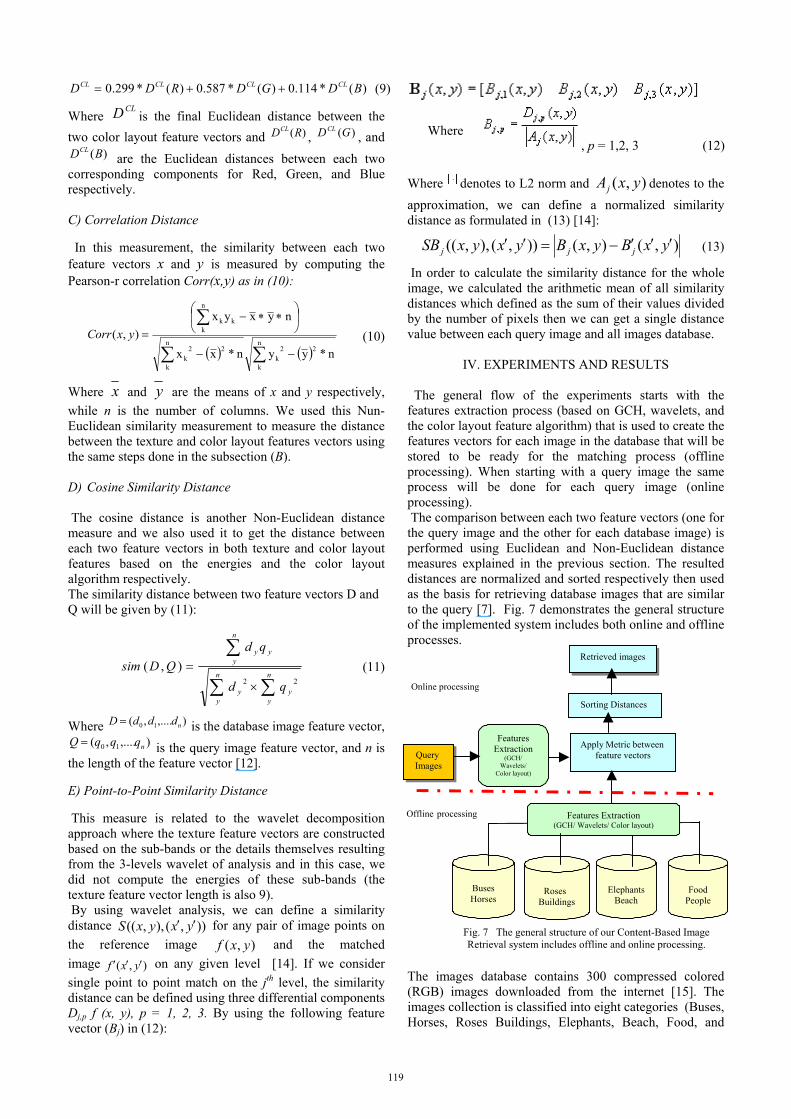
The general flow of the experiments starts with the features extraction process (based on GCH, wavelets, and the color layout feature algorithm) that is used to create the features vectors for each image in the database that will be stored to be ready for the matching process (offline processing). When starting with a query image the same process will be done for each query image (online processing). The comparison between each two feature vectors (one for the query image and the other for each database image) is performed using Euclidean and Non-Euclidean distance measures explained in the previous section. The resulted distances are normalized and sorted respectively then used as the basis for retrieving database images that are similar to the query [7]. Fig. 7 demonstrates the general structure of the implemented system includes both online and offline processes.
The images database contains 300 compressed colored (RGB) images downloaded from the internet [15]. The images collection is classified into eight categories (Buses, Horses, Roses Buildings, Elephants, Beach, Food, and
)(*0.114)(* 0.587)( * .2990 BDGDRDD CLCLCLCL ++= (9)
( ) ( )∑∑
∑
−−
∗∗−
=n
k
22k
n
k
22k
n
kkk
n*yyn*xx
nyxyx),( yxCorr
(10)
∑∑
∑
×
=n
yy
n
yy
n
yyy
qd
qdQDsim
22
),(
(11)
Query Images
Apply Metric between feature vectors
Sorting Distances
Retrieved images
Features Extraction
(GCH/ Wavelets/
Color layout)
Offline processing
Online processing
Food
People
Roses Buildings
Elephants
Beach
Buses Horses
Features Extraction (GCH/ Wavelets/ Color layout)
Fig. 7 The general structure of our Content-Based Image Retrieval system includes offline and online processing.
Where
119
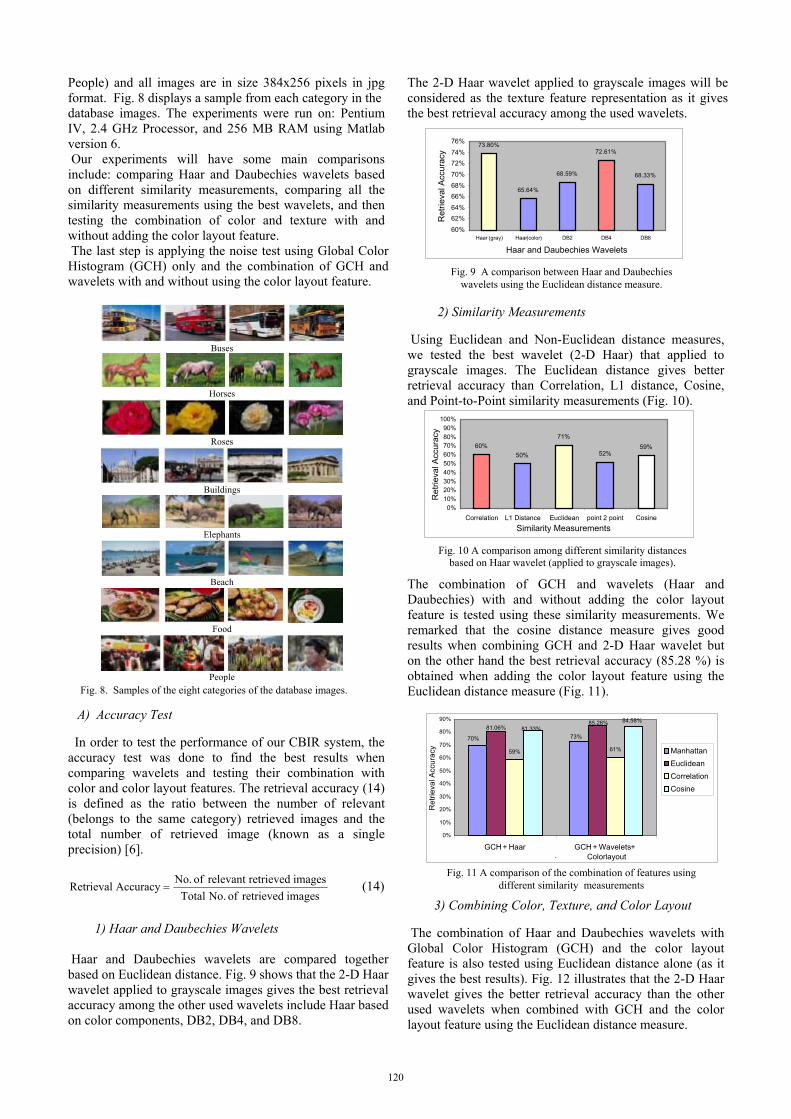
People) and all images are in size 384x256 pixels in jpg format. Fig. 8 displays a sample from each category in the database images. The experiments were run on: Pentium IV, 2.4 GHz Processor, and 256 MB RAM using Matlab version 6. Our experiments will have some main comparisons include: comparing Haar and Daubechies wavelets based on different similarity measurements, comparing all the similarity measurements using the best wavelets, and then testing the combination of color and texture with and without adding the color layout feature. The last step is applying the noise test using Global Color Histogram (GCH) only and the combination of GCH and wavelets with and without using the color layout feature.
Buses
Horses
Roses
Buildings
Elephants
Beach
Food
People
A) Accuracy Test
In order to test the performance of our CBIR system, the accuracy test was done to find the best results when comparing wavelets and testing their combination with color and color layout features. The retrieval accuracy (14) is defined as the ratio between the number of relevant (belongs to the same category) retrieved images and the total number of retrieved image (known as a single precision) [6].
images retrieved of No. Totalimages retrievedrelevant of No.Accuracy Retrieval =
1) Haar and Daubechies Wavelets Haar and Daubechies wavelets are compared together based on Euclidean distance. Fig. 9 shows that the 2-D Haar wavelet applied to grayscale images gives the best retrieval accuracy among the other used wavelets include Haar based on color components, DB2, DB4, and DB8.
The 2-D Haar wavelet applied to grayscale images will be considered as the texture feature representation as it gives the best retrieval accuracy among the used wavelets. 2) Similarity Measurements Using Euclidean and Non-Euclidean distance measures, we tested the best wavelet (2-D Haar) that applied to grayscale images. The Euclidean distance gives better retrieval accuracy than Correlation, L1 distance, Cosine, and Point-to-Point similarity measurements (Fig. 10). The combination of GCH and wavelets (Haar and Daubechies) with and without adding the color layout feature is tested using these similarity measurements. We remarked that the cosine distance measure gives good results when combining GCH and 2-D Haar wavelet but on the other hand the best retrieval accuracy (85.28 %) is obtained when adding the color layout feature using the Euclidean distance measure (Fig. 11). 3) Combining Color, Texture, and Color Layout The combination of Haar and Daubechies wavelets with Global Color Histogram (GCH) and the color layout feature is also tested using Euclidean distance alone (as it gives the best results). Fig. 12 illustrates that the 2-D Haar wavelet gives the better retrieval accuracy than the other used wavelets when combined with GCH and the color layout feature using the Euclidean distance measure.
Fig. 8. Samples of the eight categories of the database images.
73.80%
65.64%
72.61%
68.33%68.59%
60%62%64%66%68%70%72%74%76%
Haar (gray) Haar(color) DB2 DB4 DB8
Haar and Daubechies Wavelets
Ret
rieva
l Acc
urac
y
Fig. 9 A comparison between Haar and Daubechies
wavelets using the Euclidean distance measure.
60%50%
71%
52%59%
0%10%20%30%40%50%60%70%80%90%
100%
Correlation L1 Distance Euclidean point 2 point CosineSimilarity Measurements
Ret
rieva
l Acc
urac
y
Fig. 10 A comparison among different similarity distances based on Haar wavelet (applied to grayscale images).
59% 61%
73%70%
81.06%85.28%
81.33%84.58%
0%
10%
20%
30%
40%
50%
60%
70%
80%
90%
GCH + Haar GCH + Wavelets +Colorlayout.
Ret
rieva
l Acc
urac
y Manhattan EuclideanCorrelationCosine
Fig. 11 A comparison of the combination of features using
different similarity measurements (14)
120
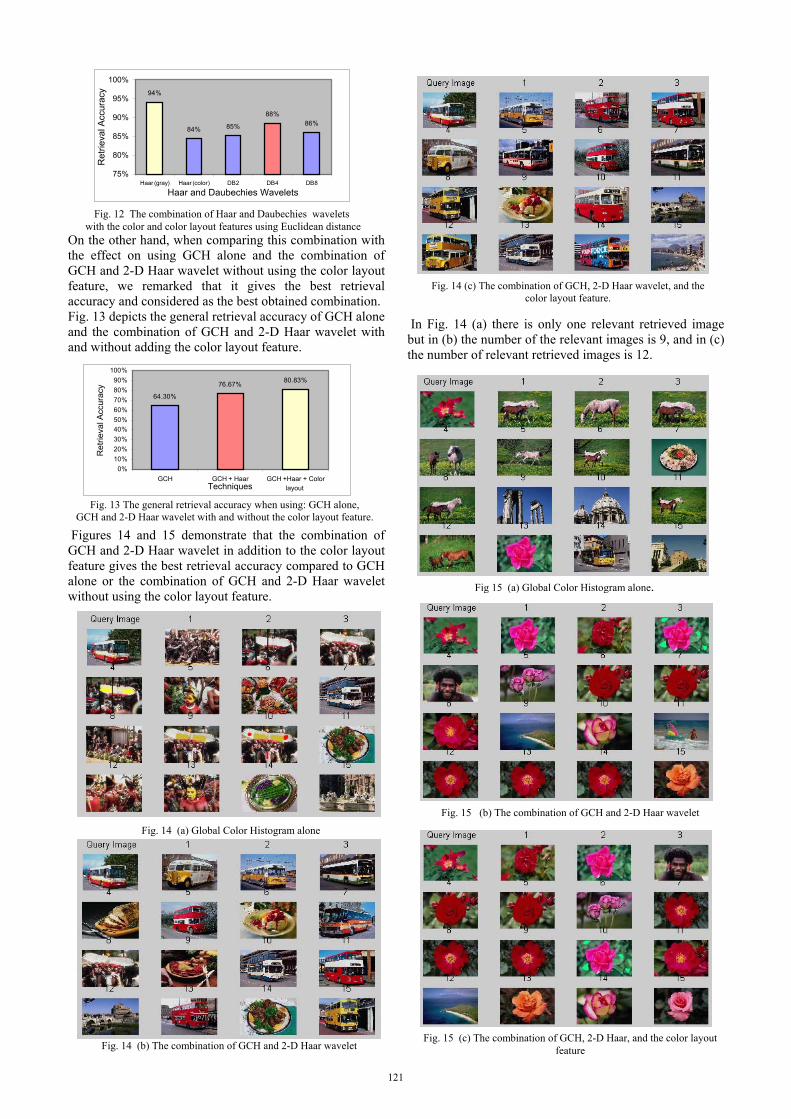
On the other hand, when comparing this combination with the effect on using GCH alone and the combination of GCH and 2-D Haar wavelet without using the color layout feature, we remarked that it gives the best retrieval accuracy and considered as the best obtained combination. Fig. 13 depicts the general retrieval accuracy of GCH alone and the combination of GCH and 2-D Haar wavelet with and without adding the color layout feature.
Figures 14 and 15 demonstrate that the combination of GCH and 2-D Haar wavelet in addition to the color layout feature gives the best retrieval accuracy compared to GCH alone or the combination of GCH and 2-D Haar wavelet without using the color layout feature.
In Fig. 14 (a) there is only one relevant retrieved image but in (b) the number of the relevant images is 9, and in (c) the number of relevant retrieved images is 12.
94%
84% 85%
88%86%
75%
80%
85%
90%
95%
100%
Haar (gray) Haar (color) DB2 DB4 DB8
Haar and Daubechies Wavelets
Ret
rieva
l Acc
urac
y
Fig. 12 The combination of Haar and Daubechies wavelets with the color and color layout features using Euclidean distance
64.30%
76.67% 80.83%
0%10%20%30%40%50%60%70%80%90%
100%
GCH GCH + Haar GCH +Haar + Colorlayout Techniques
Ret
rieva
l Acc
urac
y
Fig. 13 The general retrieval accuracy when using: GCH alone, GCH and 2-D Haar wavelet with and without the color layout feature.
Fig. 14 (b) The combination of GCH and 2-D Haar wavelet
Fig. 14 (a) Global Color Histogram alone
Fig 15 (a) Global Color Histogram alone.
Fig. 15 (b) The combination of GCH and 2-D Haar wavelet
Fig. 15 (c) The combination of GCH, 2-D Haar, and the color layout feature
Fig. 14 (c) The combination of GCH, 2-D Haar wavelet, and the color layout feature.
121
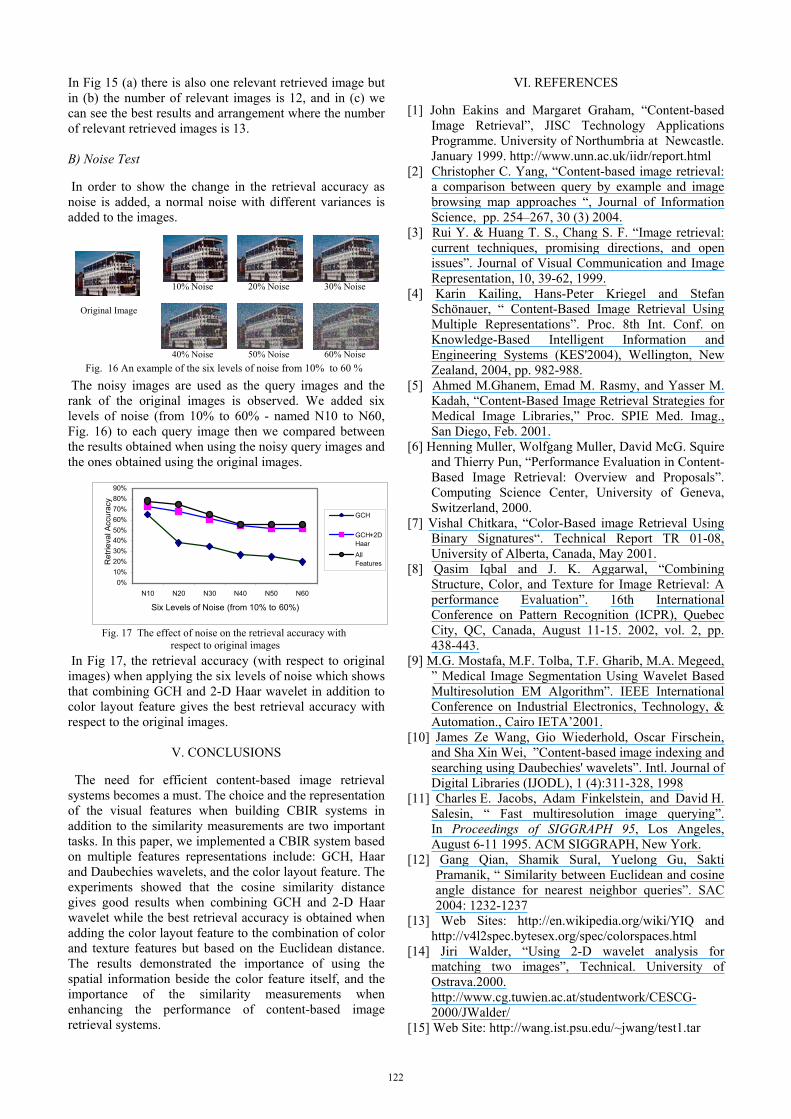
In Fig 15 (a) there is also one relevant retrieved image but in (b) the number of relevant images is 12, and in (c) we can see the best results and arrangement where the number of relevant retrieved images is 13. B) Noise Test In order to show the change in the retrieval accuracy as noise is added, a normal noise with different variances is added to the images. The noisy images are used as the query images and the rank of the original images is observed. We added six levels of noise (from 10% to 60% - named N10 to N60, Fig. 16) to each query image then we compared between the results obtained when using the noisy query images and the ones obtained using the original images. In Fig 17, the retrieval accuracy (with respect to original images) when applying the six levels of noise which shows that combining GCH and 2-D Haar wavelet in addition to color layout feature gives the best retrieval accuracy with respect to the original images.
V. CONCLUSIONS
The need for efficient content-based image retrieval systems becomes a must. The choice and the representation of the visual features when building CBIR systems in addition to the similarity measurements are two important tasks. In this paper, we implemented a CBIR system based on multiple features representations include: GCH, Haar and Daubechies wavelets, and the color layout feature. The experiments showed that the cosine similarity distance gives good results when combining GCH and 2-D Haar wavelet while the best retrieval accuracy is obtained when adding the color layout feature to the combination of color and texture features but based on the Euclidean distance. The results demonstrated the importance of using the spatial information beside the color feature itself, and the importance of the similarity measurements when enhancing the performance of content-based image retrieval systems.
VI. REFERENCES [1] John Eakins and Margaret Graham, “Content-based
Image Retrieval”, JISC Technology Applications Programme. University of Northumbria at Newcastle. January 1999. http://www.unn.ac.uk/iidr/report.html
[2] Christopher C. Yang, “Content-based image retrieval: a comparison between query by example and image browsing map approaches “, Journal of Information Science, pp. 254–267, 30 (3) 2004.
[3] Rui Y. & Huang T. S., Chang S. F. “Image retrieval: current techniques, promising directions, and open issues”. Journal of Visual Communication and Image Representation, 10, 39-62, 1999.
[4] Karin Kailing, Hans-Peter Kriegel and Stefan Schönauer, “ Content-Based Image Retrieval Using Multiple Representations”. Proc. 8th Int. Conf. on Knowledge-Based Intelligent Information and Engineering Systems (KES'2004), Wellington, New Zealand, 2004, pp. 982-988.
[5] Ahmed M.Ghanem, Emad M. Rasmy, and Yasser M. Kadah, “Content-Based Image Retrieval Strategies for Medical Image Libraries,” Proc. SPIE Med. Imag., San Diego, Feb. 2001.
[6] Henning Muller, Wolfgang Muller, David McG. Squire and Thierry Pun, “Performance Evaluation in Content-Based Image Retrieval: Overview and Proposals”. Computing Science Center, University of Geneva, Switzerland, 2000.
[7] Vishal Chitkara, “Color-Based image Retrieval Using Binary Signatures“. Technical Report TR 01-08, University of Alberta, Canada, May 2001.
[8] Qasim Iqbal and J. K. Aggarwal, “Combining Structure, Color, and Texture for Image Retrieval: A performance Evaluation”. 16th International Conference on Pattern Recognition (ICPR), Quebec City, QC, Canada, August 11-15. 2002, vol. 2, pp. 438-443.
[9] M.G. Mostafa, M.F. Tolba, T.F. Gharib, M.A. Megeed, ” Medical Image Segmentation Using Wavelet Based Multiresolution EM Algorithm”. IEEE International Conference on Industrial Electronics, Technology, & Automation., Cairo IETA’2001.
[10] James Ze Wang, Gio Wiederhold, Oscar Firschein, and Sha Xin Wei, ”Content-based image indexing and searching using Daubechies' wavelets”. Intl. Journal of Digital Libraries (IJODL), 1 (4):311-328, 1998
[11] Charles E. Jacobs, Adam Finkelstein, and David H. Salesin, “ Fast multiresolution image querying”. In Proceedings of SIGGRAPH 95, Los Angeles, August 6-11 1995. ACM SIGGRAPH, New York.
[12] Gang Qian, Shamik Sural, Yuelong Gu, Sakti Pramanik, “ Similarity between Euclidean and cosine angle distance for nearest neighbor queries”. SAC 2004: 1232-1237
[13] Web Sites: http://en.wikipedia.org/wiki/YIQ and http://v4l2spec.bytesex.org/spec/colorspaces.html
[14] Jiri Walder, “Using 2-D wavelet analysis for matching two images”, Technical. University of Ostrava.2000. http://www.cg.tuwien.ac.at/studentwork/CESCG-2000/JWalder/
[15] Web Site: http://wang.ist.psu.edu/~jwang/test1.tar
0%10%20%30%40%50%60%70%80%90%
N10 N20 N30 N40 N50 N60
Six Levels of Noise (from 10% to 60%)
Ret
rieva
l Acc
urac
y
GCH
GCH+2DHaarAllFeatures
Fig. 17 The effect of noise on the retrieval accuracy with respect to original images
Original Image
10% Noise
40% Noise
20% Noise
50% Noise 60% Noise
30% Noise
Fig. 16 An example of the six levels of noise from 10% to 60 %
122