a register allocation framework based on hierarchical cyclic interval graphs
TRANSCRIPT
������McGill UniversitySchool of Computer ScienceACAPS LaboratoryAdvanced Compilers, Architecturesand Parallel SystemsA Register Allocation FrameworkBased onHierarchical Cyclic Interval GraphsLaurie J. HendrenGuang R. GaoErik R. AltmanyChandrika MukerjiACAPS Technical Memo 33 (Revised)February 26, 1993(Original version November 25, 1991)yDept. of Electrical Enginering, McGill University, 3480 University Street, Montr�eal, Qu�ebecACAPS � School of Computer Science � 3480 University St. �Montr�eal �Canada �H3A 2A7
AbstractIn this paper, we propose the use of cyclic interval graphs as an alternative repre-sentation for register allocation. The \thickness" of the cyclic interval graph capturesthe notion of overlap between live ranges of variables relative to each particular pointof time in the program execution. We demonstrate that cyclic interval graphs providea feasible and e�ective representation that accurately captures the periodic nature oflive ranges found in loops.A new heuristic algorithm for minimum register allocation, the fat cover algorithm,has been developed and implemented to exploit such program structure. In addition,a new spilling algorithm is proposed that makes use of the extra information availablein the interval graph representation. These two algorithms work together to provide atwo-phase register allocation process that does not require iteration of the spilling orcoloring phases.We extend the notion of cyclic interval graphs to hierarchical cyclic interval graphsand we outline a framework for a compiler to use this representation when perform-ing register allocation for programs with hierarchical control structure such as nestedconditionals and loops. The e�ectiveness of our approach has been demonstrated byexperimenting with a collection of challenging loops.
i
Contents1 Introduction 12 Cylic Interval Graphs 32.1 Interference Graphs and Chaitin's Heuristics : : : : : : : : : : : : : : : : : : : : 32.2 Cyclic Interval Graphs : : : : : : : : : : : : : : : : : : : : : : : : : : : : : : : : : 32.3 Coloring Cyclic Interval Graphs : : : : : : : : : : : : : : : : : : : : : : : : : : : : 62.4 Further Observations about Cyclic Interval Graphs : : : : : : : : : : : : : : : : : 73 Finding a Minimal Coloring of Cyclic Interval Graphs 83.1 The Fat Cover Algorithm : : : : : : : : : : : : : : : : : : : : : : : : : : : : : : : 83.1.1 An Introductory Example of the Fat Cover Algorithm : : : : : : : : : : : 93.1.2 A Formal Description of the Fat Cover Algorithm : : : : : : : : : : : : : 93.2 Two Other Approaches : : : : : : : : : : : : : : : : : : : : : : : : : : : : : : : : 113.2.1 An Interference Graph Algorithm : : : : : : : : : : : : : : : : : : : : : : 113.2.2 A Greedy Algorithm : : : : : : : : : : : : : : : : : : : : : : : : : : : : : 113.3 A Hybrid Algorithm : : : : : : : : : : : : : : : : : : : : : : : : : : : : : : : : : : 123.4 An Experimental Comparison : : : : : : : : : : : : : : : : : : : : : : : : : : : : 134 Finding a k-Coloring of Cyclic Interval Graphs 164.1 Chameleon Intervals, Register Floats, and Register Spills : : : : : : : : : : : : : : 174.2 Reducing the Width of an Interval Graph : : : : : : : : : : : : : : : : : : : : : : 185 Hierarchical Cyclic Interval Graphs 206 Interval Graph Performance on Benchmark Programs 257 Related Work 29ii
8 Conclusions and Future Work 31R References 32List of Figures1 An Interference Graph and an Interval Graph : : : : : : : : : : : : : : : : : : : : 42 A Cyclic Interval Graph : : : : : : : : : : : : : : : : : : : : : : : : : : : : : : : : 53 An Example of the Fat Cover Algorithm : : : : : : : : : : : : : : : : : : : : : : : 94 An Example of Applying the Hybrid Fat Cover Algorithm : : : : : : : : : : : : : 145 Number of Extra Registers Used in Coloring 1000 Random Graphs : : : : : : : : 156 An Example of Register Spilling and Register Floating : : : : : : : : : : : : : : : 177 An Example of Introducing Spill Code : : : : : : : : : : : : : : : : : : : : : : : : 218 Nested Loops as Hierarchical Structured Interval Graphs : : : : : : : : : : : : : : 229 Examples of Consistent Allocation Required for Conditionals : : : : : : : : : : : 2310 A Nested Conditional and its Hierarchical Structured Interval Graph : : : : : : : 24List of Tables1 Number of Double Precision Loads and Stores with 16 registers for Tomcat. : : : 272 Number of Double Precision Loads and Stores with 16 registers for Loop 8. : : : 273 Number of Double Precision Loads and Stores with 32 registers. : : : : : : : : : 274 Interval Graph Statistics (after Spilling). : : : : : : : : : : : : : : : : : : : : : : : 28iii
1 IntroductionRegister allocation plays an important role in compiler optimization. In fact, for modernhigh-performance processor architectures, register allocation has been viewed as a techniquewhich \adds the largest single improvement" among various compiler optimizations [1]. Thetechnology advance in the past decade has widened the gap between the speed of the CPUand memory (DRAMs), and this gap (a form of the Von Neumann bottleneck) is expected tocontinue to grow [2]. Therefore, the bene�t of keeping variables in registers is increasing, andthus the impact of good register allocation strategies is also increasing.Register allocators in many modern compilers employ the classical graph coloring methodoriginally proposed by Chaitin and improved by others[3, 4, 5, 6]. In this method, an interferencegraph is built to direct register allocation. Each node in the graph corresponds to a live range ofa program variable. An edge between two nodes in the graph represents interference between thetwo live ranges. Chaitin's heuristics color the graph with k colors such that adjacent nodes areassigned di�erent colors. Thus, a k-coloring of the interference graph corresponds to a feasibleregister assignment with k registers. If the graph is not k-colorable, spill code is introduced.Given a set of live ranges, the interference graph encodes the overlapping or interferenceof all live ranges for an entire code segment, most often an entire procedure or function body.Thus, this representation provides a concise summary of the constraints that must be met fora correct register allocation. Furthermore, interference graph approaches are well-suited togeneral purpose register allocation that works even for programs with irregular and complex ow of control.However, we believe that this concise and general strategy is sometimes also a weakness ofthe interference graph approach. From our point of view, interference graphs sometimes providea representation of the problem that is too abstract, particularly in the case of well-structuredinner-loop nests. More speci�cally, an interference graph does not encode any notion of therelative time of overlaps between live ranges. This information is very useful in developinge�ective coloring and spilling heuristics. This is particularly true when one considers howto e�ectively model the live range of a loop variable: its lifetime may cross the boundary ofiterations, and it may be de�ned and used repetitively at regular intervals. Another weaknessof the interference graph approach is the potential expense required to to rebuild and recolorthe interference graph after spill code has been introduced.Although there have been successful e�orts so improve Chaitin's original interferencegraph approach (these are presented in Section 7), we propose a new approach that is basedon a di�erent representation - cyclic interval graphs. Intuitively, the \thickness" of each pointin the cyclic interval graph captures information about overlapping live ranges of variables ata particular location in the program. We will see that this information | the \fat spot" | iscrucial in developing our new heuristic algorithms.1
We argue that an approach based on such interval graphs can address some of the short-comings of the interference graph approaches. Since our approach takes advantage of programstructure and the relative times of live ranges, we have focused on methods for structured pro-grams, and in particular large inner-loops and loop nests. The main contributions of this paperinclude:� We demonstrate that cyclic interval graphs provide a feasible and e�ective represen-tation to characterize sequences of live ranges of variables in successive iterations of aloop. (Section 2)� A new heuristic algorithm for minimum register allocation, the fat cover algorithm, hasbeen developed, implemented, and studied. (Section 3)� A new spilling algorithm is proposed that makes use of the extra information availablein the interval graph representation. Whenever possible, it favors register oats (movingvalues from one register to another) over the traditional register spills (storing a spilledvariable into memory). Furthermore, the spilling phase is only invoked once, and thereis no need for iterating the allocation and spilling phases.(Section 4)The possibility of using interval graphs as a model for register allocation was noted in[7, 8]. However, to our knowledge, previous research was theoretical in nature and mainlyfocussed on the algorithmic aspects of the interval graph model. Furthermore, the issues ofapplying such models to real programs with hierarchical control structures (such as nestedconditionals and loops) have not been addressed. In this paper, our objective is quite di�erent:we are primarily interested in the feasibility of using interval graphs in register allocators ofreal life compilers.It is important to note that we do not claim that our interval graph methods can solveall the problems in register allocation. In general, we do not accept the view that there isan ultimate \best" method for register allocation. On the contrary, we believe that di�erentapproaches are suited to di�erent sorts of programs. For example, for program segments withvery irregular control ow, there is little program structure to exploit, and the interference graphrepresentation is probably the best abstraction. However, for program segments such as nestedloops and structured conditionals, there is often program structure that can be exploited byencoding the problem as cyclic interval graphs. Thus, we view the interference graph approachand the cyclic interval graph approach as complementary.It should be noted that in most of the paper we concentrate on examples that are inner-most loops. However, in Section 5, we discuss how our scheme naturally extends to a hierarchicalmethod that can handle nested loops and conditionals. In Section 6, we present experimentalresults to demonstrate the e�ectiveness of our approach for two large loops that are di�cult tocolor. We compare the results of our prototype spilling and coloring implementations with theresults observed from compiling these loops with state-of-the-art optimizing compilers (SUN2
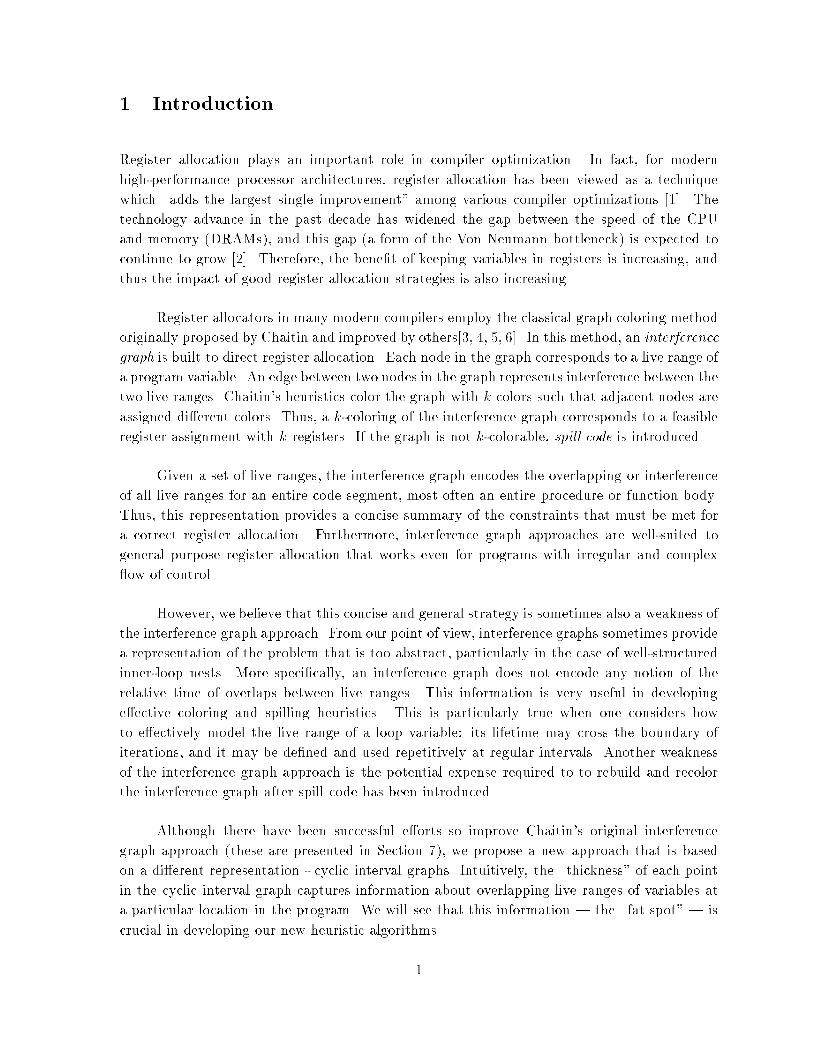
Sparc C compiler, the MIPS C compiler, and the IBM RS6000 compiler). Finally, we presentrelated work in Section 7 and our conclusions in Section 8.2 Cylic Interval GraphsIn this section, we �rst review the traditional interference graph representation, and then in-troduce our cyclic interval graph representation.2.1 Interference Graphs and Chaitin's HeuristicsAs outlined in Section 1, the traditional approach uses an interference graph representationwhere nodes represent live ranges of variables, and edges represent interference between twolive ranges. To be more precise, according to [4], two live ranges interfere, \if one of them islive at a de�nition point of the other." A node has degree k if it has k neighbors. Chaitin'smethod colors the graph with k colors such that two adjacent nodes are assigned di�erent colors.Thus, a k-coloring of the interference graph corresponds to a feasible register assignment withk registers.The basic heuristics of Chaitin's original method are based on a simple observation: agraph G having a node X with degree less than k is k-colorable if and only if the reduced graphG0 formed by removing X with all its adjacent edges is k-colorable. Thus, Chaitin's algorithmtries to remove all nodes of degree less than k. If at some point there remains only nodeswith degree greater or equal to k, then spilling is performed. This involves the introduction ofsome spill code (to store the de�nition of the spilled variable to memory and to load it for lateruses) according to some heuristic. As the spill code replaces one long live-range with severalshort live-ranges, the interference graph is rebuilt and the coloring process must be repeateduntil a k-coloring succeeds without introducing any new spill code. Many improvements onChaitin's original method have been proposed. For example, one such improvement is basedon the observation that it is not always necessary to spill a node with k or more neighbors [6].If some of the neighbors can be allocated the same color, then spilling is not necessary. This isone example where one can observe that a k-coloring can be achieved if the correct subset ofnodes are colored the same color.2.2 Cyclic Interval GraphsThe cyclic interval graph approach has been designed to expose program structure that is usefulin choosing which intervals to color the same color, and which intervals are best to spill.One challenge in designing this new representation is determining how to represent liveranges of loop variables. Figure 1 (a) shows a loop with n iterations. The numbers written3
alongside the instructions are the instruction numbers. Four scalar variables are de�ned andused in the loop: X1 { X4. Note that in the case of loops each variable has a sequence of liveranges that correspond to di�erent iterations of the loop. For example, the live range of thevariable X4, can be split into several segments. For the �rst iteration, X4 is de�ned outsidethe loop and dies at instruction 2 within the loop. This is one section of X4's live range. Inaddition, for each iteration i of the loop, X4 is de�ned in instruction 4 of iteration i, and is livebetween this de�nition and the last use in instruction 2 of the following iteration i+ 1. Thereis a similar situation for X3. In order to accurately capture this information in our approach,we would like to �nd a representation that incorporates the regular periodic nature of variablesthat are de�ned in some iteration i and last used in some later iteration i0.In Figure 1 (c), we show the interval graph for the program in Figure 1 (a). The X axisrepresents the instruction numbers of the code, while the Y axis represents the variables of theprogram. The solid circles of the diagram illustrate the point of de�nition while the crossesillustrate the points of last use. For example, X1 is de�ned in instruction 1 and last used ininstruction 3. Note that the lifetimes of each variable are represented by a sequence of intervals,one interval for each iteration.for i = 1 to n {X1 = X3 * 10; (1)X2 = X4 * 20; (2)X3 = X1 + 5; (3)X4 = X2 + X3; (4)} x1
x2
x3
x4
1 period1 period
X1
X4
X3
X2
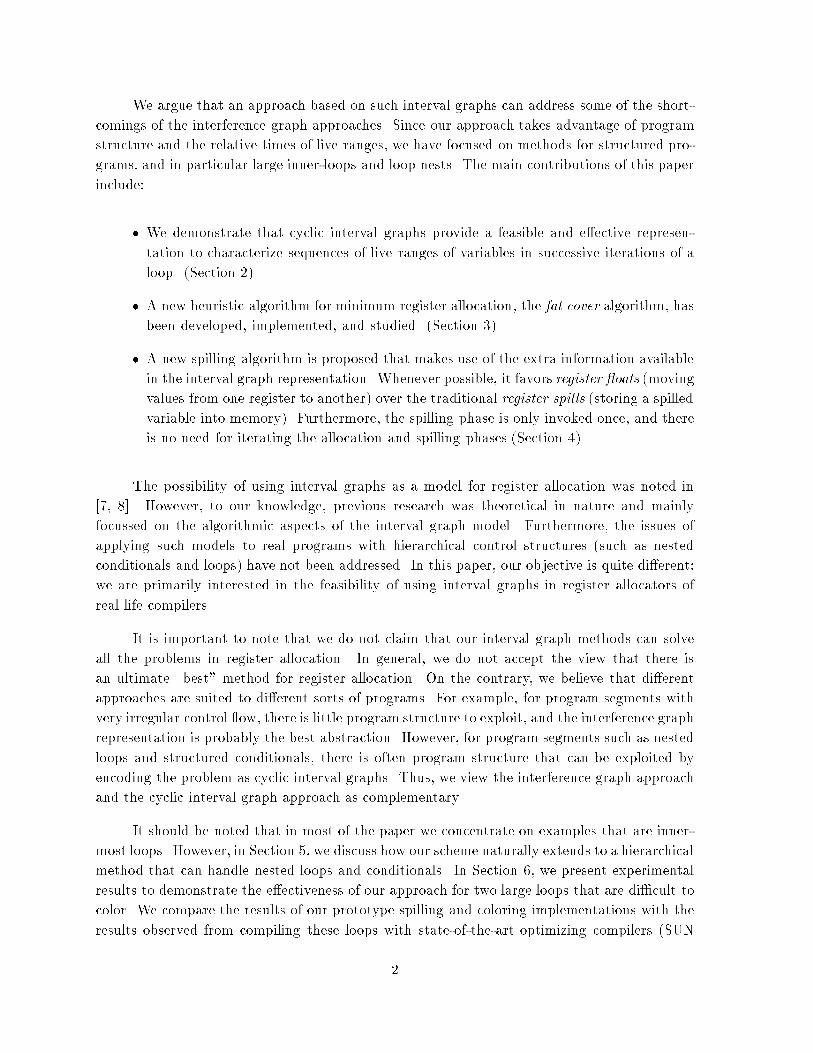
1 2 3 4(a) A Loop Program (b) An Interference Graph (c) An Interval GraphFigure 1: An Interference Graph and an Interval GraphAs illustrated in Figure 1(c), the live range of a loop variable can be represented as aperiodic interval: a sequence of lifetime intervals that are equally spaced in time by some period.Such a periodic interval can be characterized by the interval corresponding to one period. Forexample, the live ranges of variables X1 { X4 in Figure 1 (c) have a period of one iteration.The live ranges of variables X1 and X2 do not extend across the boundary between iterations,therefore, they each can be expressed as one interval, i.e. X1: [1 : 3), X2: [2 : 4). Thevariables X3 and X4, however, are de�ned in one iteration and used in the next. Therefore,for convenience, we represent its live range as a pair of two intervals, i.e. X3: ([0 : 1); [3 : 5])and X4: ([0; 2); [4; 5]), where the interval [0 : 1), for X3 as an instance, can be considered anextension of the interval [3 : 5] that is wrapped around to �t in one period. The numbers 0 and5 do not correspond to any instructions but merely provide a joining point for two successiveiterations. We call such a \wrapped" interval | a cyclic interval. In Figure 2 (a), we show thecyclic interval graph representation for Figure 1 (c).4
X4
X3
X2
X1
[0,2)
[0,1)
[2,4)
[1,3)
X2
X3
X4
X1
0 1 2 3 54
[3,5]
[4,5]
x2
X1
X3
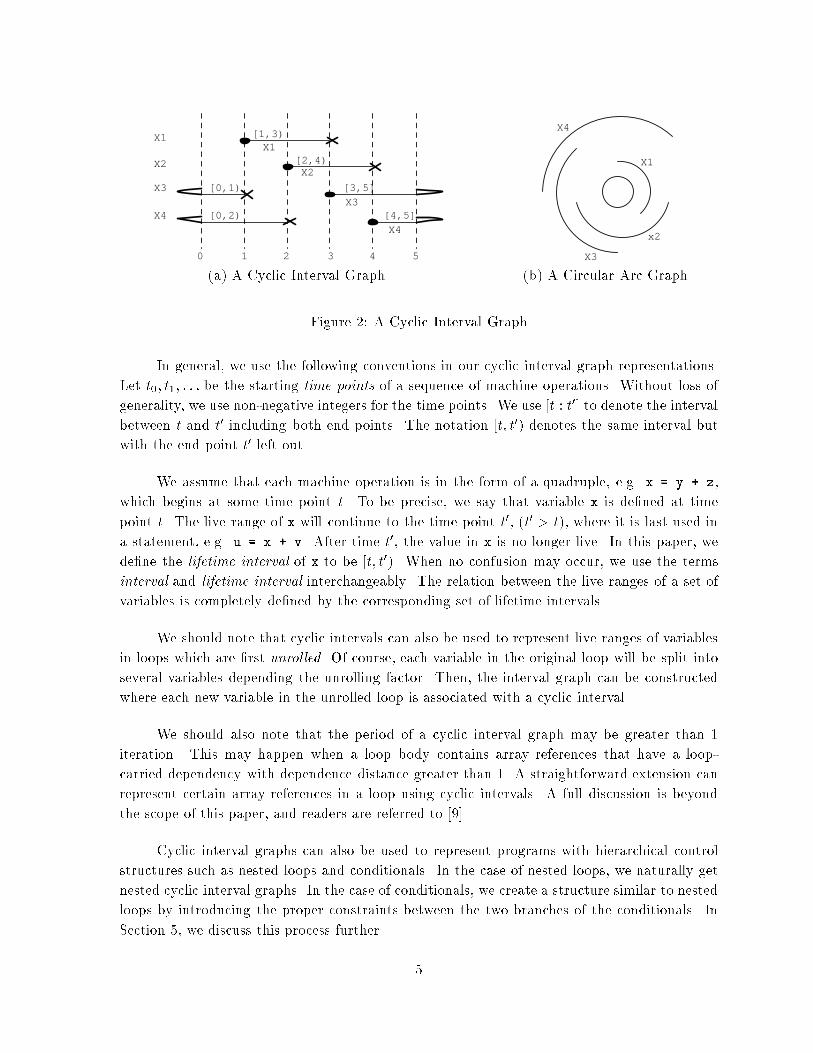
X4(a) A Cyclic Interval Graph (b) A Circular Arc GraphFigure 2: A Cyclic Interval GraphIn general, we use the following conventions in our cyclic interval graph representations.Let t0; t1; : : : be the starting time points of a sequence of machine operations. Without loss ofgenerality, we use non-negative integers for the time points. We use [t : t0] to denote the intervalbetween t and t0 including both end points. The notation [t; t0) denotes the same interval butwith the end point t0 left out.We assume that each machine operation is in the form of a quadruple, e.g. x = y + z,which begins at some time point t. To be precise, we say that variable x is de�ned at timepoint t. The live range of x will continue to the time point t0, (t0 > t), where it is last used ina statement, e.g. u = x + v. After time t0, the value in x is no longer live. In this paper, wede�ne the lifetime interval of x to be [t; t0). When no confusion may occur, we use the termsinterval and lifetime interval interchangeably. The relation between the live ranges of a set ofvariables is completely de�ned by the corresponding set of lifetime intervals.We should note that cyclic intervals can also be used to represent live ranges of variablesin loops which are �rst unrolled. Of course, each variable in the original loop will be split intoseveral variables depending the unrolling factor. Then, the interval graph can be constructedwhere each new variable in the unrolled loop is associated with a cyclic interval.We should also note that the period of a cyclic interval graph may be greater than 1iteration. This may happen when a loop body contains array references that have a loop-carried dependency with dependence distance greater than 1. A straightforward extension canrepresent certain array references in a loop using cyclic intervals. A full discussion is beyondthe scope of this paper, and readers are referred to [9].Cyclic interval graphs can also be used to represent programs with hierarchical controlstructures such as nested loops and conditionals. In the case of nested loops, we naturally getnested cyclic interval graphs. In the case of conditionals, we create a structure similar to nestedloops by introducing the proper constraints between the two branches of the conditionals. InSection 5, we discuss this process further. 5
Before presenting the main problems to be solved on cyclic interval graphs, we �rstintroduce the following de�nitions.De�nition 2.1 A time t is covered by an interval I1 : [t1; t10), if (t1 � t < t10), or by aninterval I10 : [t1; t10] if (t1 � t � t10), or by a cyclic interval I2 : ([t1; t10); [t2; t20]), if t iscovered by either ([t1; t10) or [t2; t20]).De�nition 2.2 Two intervals I1; I2 overlap if there exists a time t that is covered by both I1and I2.2.3 Coloring Cyclic Interval GraphsOur two main coloring problems can be formulated as:� Problem 1 (Finding a Minimum Coloring of a Cyclic Interval Graph): Given a set oflive ranges represented as a cyclic interval graph G, �nd a minimum register (color)assignment for the intervals in G such that overlapping intervals are assigned di�erentregisters.� Problem 2 (Finding a k-coloring of a Cyclic Interval Graph with Minimum SpillingCost): Given a set of live ranges represented by a cyclic interval graph G and a set ofk registers, �nd an assignment of the k registers for the intervals in G. Introduce spillcode when necessary, and keep the spill cost to a minimum.The importance of Problem 2 is obvious and is probably familiar to most compiler writers.We therefore focus on the importance of Problem 1, the problem of �nding a minimum coloringof a cyclic interval graph. We argue that this is an important problem for the following tworeasons:1. It has important applications in situations when the smallest number of registers isrequired. For example, when allocating registers interprocedurally it is bene�cial toallocate a minimal number of registers to each procedure using such a solution. Thisreduces the amount of register saving required at procedure call time, and can alsoimprove interprocedural register allocation [10].2. Using the information captured by interval graphs, we have developed a two-step ap-proach for solving Problem 2. This approach makes e�ective use of the optimal solutionof Problem 1 to minimize the spilling cost. As we show in Section 4, this is particularlyimportant for programs in which the register pressure is close to k.The above two problems are treated in Section 3 and Section 4 respectively.6
2.4 Further Observations about Cyclic Interval GraphsOur problems are related to the class of circular-arc graph coloring problems [11, 12]. A graphG is called a circular-arc graph if its vertices can be placed in a one-to-one correspondence witha set of circular arcs of a circle in such a way that two vertices of G are joined by an edgeif and only if the corresponding two arcs intersect one another. In Figure 2 (b), we show thecircular-arc graph representation of our example. Intuitively, one can think of \bending" eachof the interval into an arc. Since the intervals are periodic, we can �t them into one circle.Theoretically, the problem of determining a k-coloring for a circular arc graph with n arcs hasa complexity of O(nk!klogk) [12]. In this paper, we are interested in fast heuristic methodswhich �nd a k-coloring quickly, and generates e�cient code for spilling when necessary.As in any general graph coloring problem, �nding the minimum coloring of a cyclic intervalgraph is NP-hard [12]. For our purpose of register allocation, it is most important to use theinformation provided in the interval graph as guiding heuristics for our algorithmic solutions.From our examples, we can observe that the number of minimum registers needed for a cyclicinterval graph is related to the thickness of the graph, which we will formally de�ne below.De�nition 2.3 The width of a cyclic interval graph G at time t, written as width(G,t), is thenumber of intervals covering t.De�nition 2.4 The maximum width of a cyclic interval graph G, written Wmax(G), is themaximum width(G; t), for all t which is covered by some interval in G. The minimum widthof a cyclic interval graph G, written Wmin(G), is the minimum width(G; t), for all t which iscovered by some interval in G.Now, we state the following theorems about the number of colors required to minimallycolor acyclic and cyclic interval graphs.The following theorem addresses the problem of optimal coloring of acyclic interval graphs.Theorem 2.1 Let G be an interval graph containing no cyclic intervals. Then G is optimallycolorable with Wmax(G) colors.Proof: First, it is obvious that G cannot be colored with less than k colors. Nowlet us complete the proof by sketching an algorithm (called left-to-right algorithm) which willguarantee to �nd the optimal coloring of G. Assume G spans from time 0 to time n. Startingfrom the left end (at time, t = 0), move from left to right along the time line. For each interval,I , which ends at t, release its color back to the pool of free colors. For each interval I beginningat t, give t a free color which is not being used by any interval covering t. Initially, the pool7
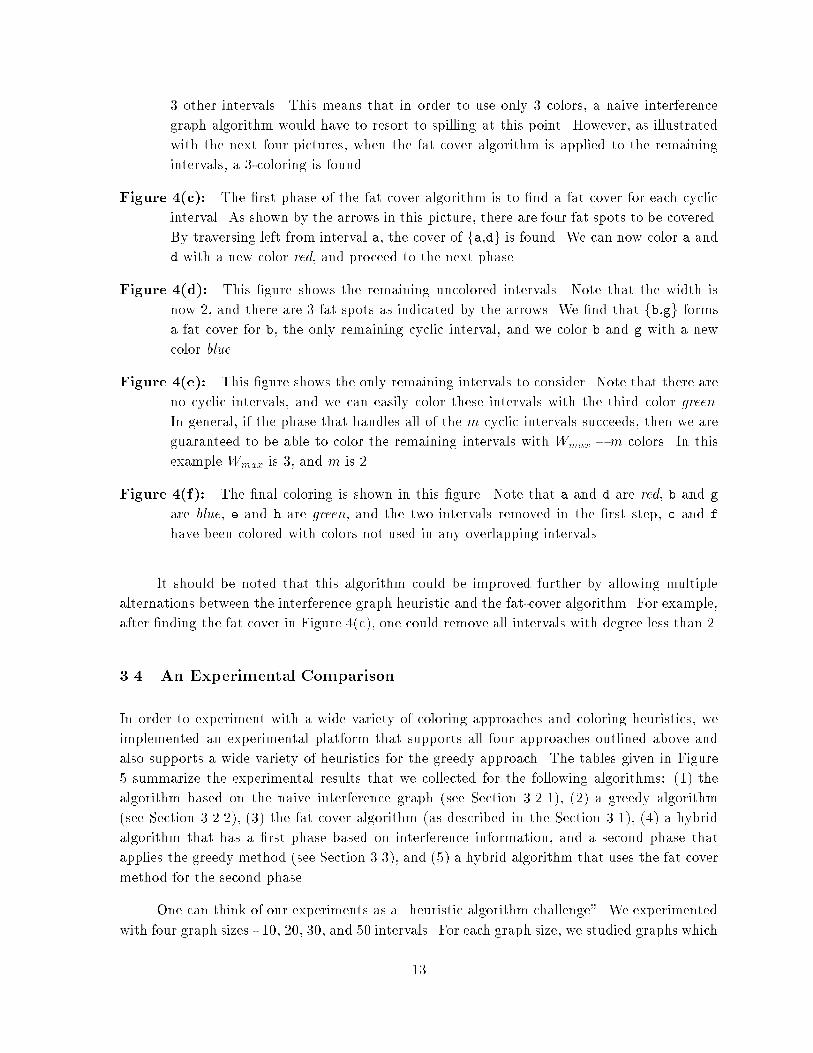
contains k = Wmax(G) free colors. Since there will never be more than Wmax(G) intervalscovering any time t, the algorithm will successfully �nd a k-coloring for G.For a cyclic interval graph G, k = Wmax(G) may not be enough to color G. This is dueto the constraints caused by the cyclic intervals. However, we can establish the following upperbound:Theorem 2.2 Let G be an interval graph containing cyclic intervals. Then G is optimallycolorable with Wmax(G) � k � Wmax(G) +Wmin(G) colors.Proof: First, it is obvious that G cannot be colored with less than k colors. Nowlet us complete the proof by sketching an algorithm which will guarantee to �nd the coloringof G in Wmax(G) + Wmin(G) colors. Cut G at the point where it has the minimum widthWmin(G). Take the intervals covering the cutting point out of G and call the remaining partG0. Obviously, we can now treat G0 as an acyclic graph. Coloring G0 with the left-to-rightalgorithm guarantees it to be colored with no more than k0 = Wmax colors (Theorem 2.1).Then, it is trivial to see that we can use Wmin(G) more colors to color the removed intervals.3 Finding a Minimal Coloring of Cyclic Interval GraphsIn this section we examine heuristic algorithms for coloring cyclic interval graphs using a mini-mal number of colors. More speci�cally, given a cyclic interval graph G, we would like to �nd afast algorithm that can color G with as few colors as possible. Such algorithms will all use somesort of heuristic, and therefore they are not guaranteed to �nd the optimal solution. However,our goal is to �nd algorithms that always �nd the optimal or close to optimal solutions. Insubsection 3.1 we develop a new algorithm, the fat cover algorithm. In subsection 3.2 we givea short summary of two other approaches to the minimal coloring problem and, in subsection3.3 we describe another important method, the hybrid algorithm. Finally, in subsection 3.4 wepresent experimental results to compare the e�ectiveness of the four algorithms.3.1 The Fat Cover AlgorithmGiven the fact that the optimal k for a cyclic interval graph G is bounded by Wmax(G) andWmin(G) +Wmax(G) (Theorem 2.2), and our experimental observations which indicate that alarge majority of graphs that could represent programs can be colored in Wmax colors, we havedeveloped an algorithm, called the fat cover algorithm, that is speci�cally designed to work wellfor graphs that can be colored in Wmax colors.The key to this algorithm is the observation that the fat spots of the interval graph arethe locations that are most important, and that we can iteratively reduce the maximum width8
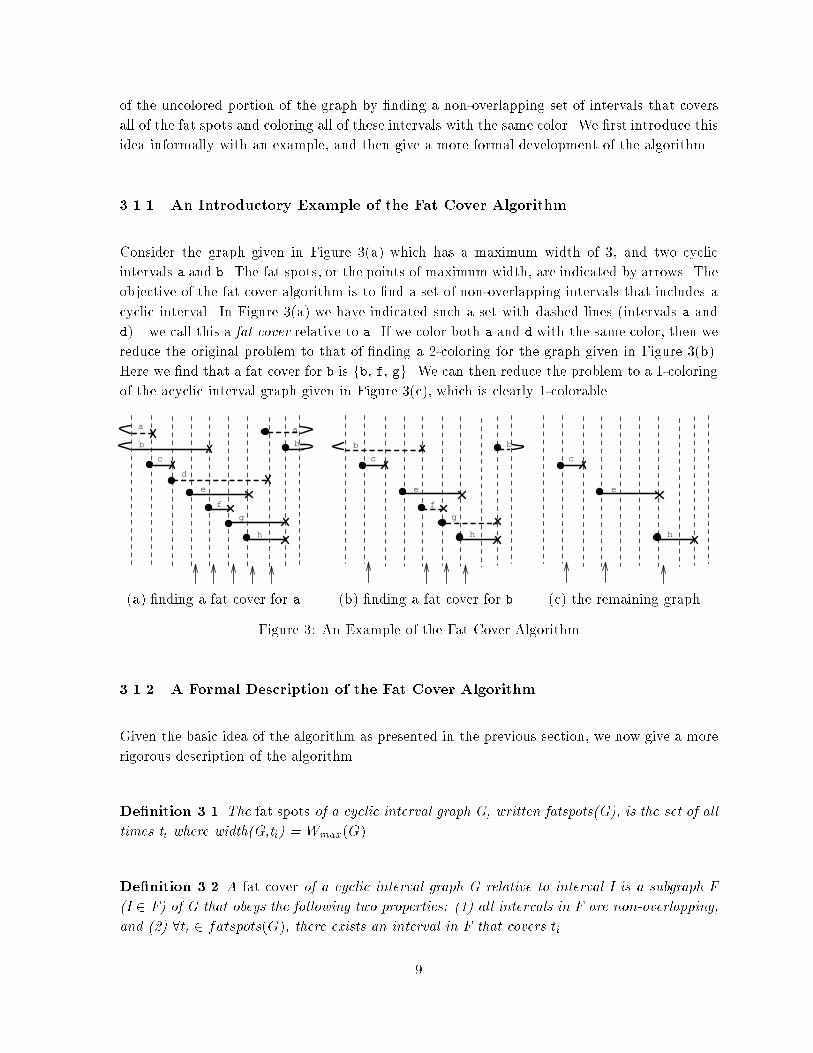
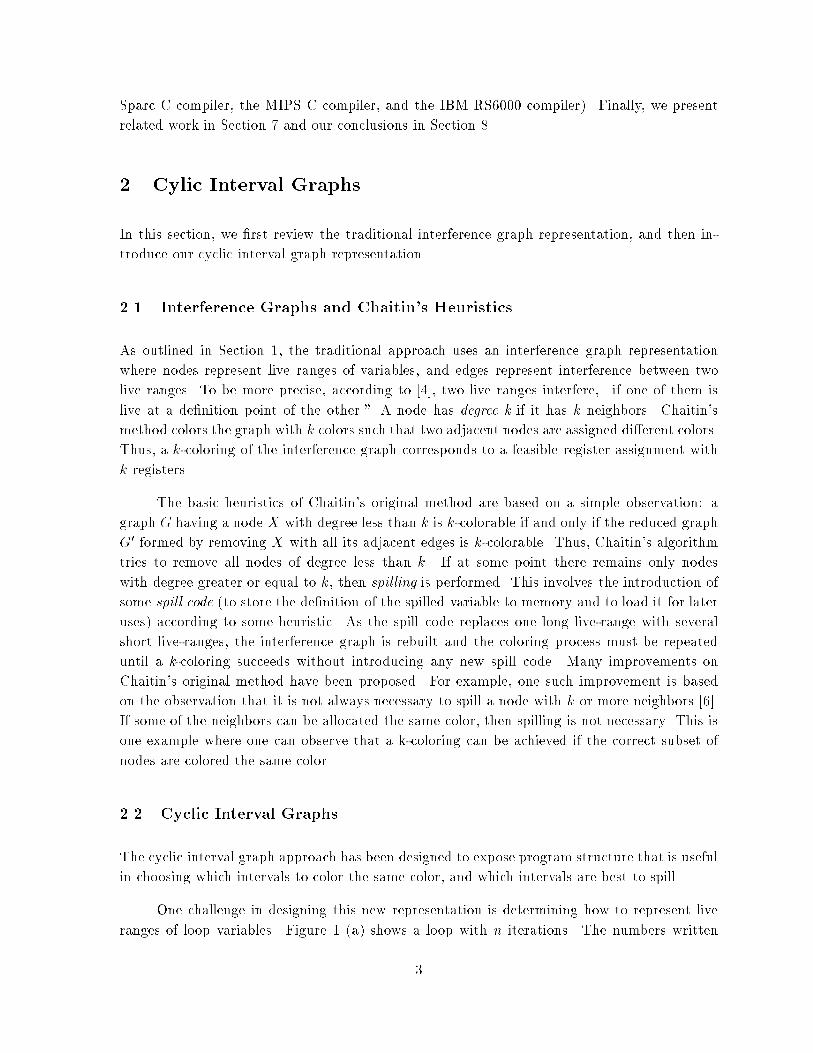
of the uncolored portion of the graph by �nding a non-overlapping set of intervals that coversall of the fat spots and coloring all of these intervals with the same color. We �rst introduce thisidea informally with an example, and then give a more formal development of the algorithm.3.1.1 An Introductory Example of the Fat Cover AlgorithmConsider the graph given in Figure 3(a) which has a maximum width of 3, and two cyclicintervals a and b. The fat spots, or the points of maximum width, are indicated by arrows. Theobjective of the fat cover algorithm is to �nd a set of non-overlapping intervals that includes acyclic interval. In Figure 3(a) we have indicated such a set with dashed lines (intervals a andd) { we call this a fat cover relative to a. If we color both a and d with the same color, then wereduce the original problem to that of �nding a 2-coloring for the graph given in Figure 3(b).Here we �nd that a fat cover for b is fb, f, gg. We can then reduce the problem to a 1-coloringof the acyclic interval graph given in Figure 3(c), which is clearly 1-colorable.h
g
f
e
d
c
bb
aa
b b
c
e
f
g
h
c
e
h(a) �nding a fat cover for a (b) �nding a fat cover for b (c) the remaining graphFigure 3: An Example of the Fat Cover Algorithm3.1.2 A Formal Description of the Fat Cover AlgorithmGiven the basic idea of the algorithm as presented in the previous section, we now give a morerigorous description of the algorithm.De�nition 3.1 The fat spots of a cyclic interval graph G, written fatspots(G), is the set of alltimes ti where width(G,ti) = Wmax(G).De�nition 3.2 A fat cover of a cyclic interval graph G relative to interval I is a subgraph F(I 2 F) of G that obeys the following two properties: (1) all intervals in F are non-overlapping,and (2) 8ti 2 fatspots(G), there exists an interval in F that covers ti.9
Theorem 3.1 If a cyclic interval graph G is colorable in k = Wmax(G) colors, then for eachcyclic interval Ic of G, there exists a fat cover for G relative to Ic, call it F , such that G� Fis k � 1 colorable.Proof: Given a k = Wmax(G) coloring of G, pick the color associated with any cyclicinterval Ic, call it C. Now form a set F of all the intervals from G that were colored with C.First, let us show that F is a fat cover of G relative to Ic. By de�nition of a valid coloring,all intervals in F must be non-overlapping, and thus F satis�es the �rst property of De�nition3.2. Furthermore, since G is colorable in exactly Wmax(G) colors, then exactly one interval ateach fat spot must be colored with C. Thus, F clearly satis�es property 2 of De�nition 3.2.Secondly, it is clear that by removing F from G we are left with a graph that is colored withk � 1 colors.The development of our fat cover algorithm was inspired by Theorems 2.1 and 3.1. Givena graph G with m cyclic intervals Ic1 ; Ic2 ; : : : ; Icm, the algorithm proceeds in two phases. The�rst phase attempts to use m colors to �nd a fat cover for each of the m cyclic intervals. Atthe ith step, a traversal from left to right is performed to �nd a fat cover for interval Ici (callthis fat cover Fi). Our implementation ensures that a fat cover will be found in a left to righttraversal, if one exists. If such a cover is found, a traversal from right to left is performed whichassigns the same new color Ci to all of the intervals in Fi.After all of the m cyclic intervals are dealt with in this �rst phase, then the second phaseuses a straightforward left-to-right algorithm to color the remaining intervals. If the �rst phasesucceeds, then the second phase need only consider a reduced graph G0 that contains no cyclicintervals, and has a maximum width of w = Wmax(G)�m. The coloring of G0 is guaranteedto use only w new colors (see proof of Theorem 2.1). Thus, if the �rst phase succeeds, we can�nd an optimal coloring in k = Wmax(G) colors for graph G. If the �rst phase fails to �nd afat cover at some stage, the second phase simply colors the remaining cyclic intervals with newcolors, and applies the simple left to right algorithm to color the remaining intervals. In thiscase, the resulting coloring may or may not be optimal. However Theorem 4.1 ensures that,for a graph G which is k = Wmax(G) colorable, it is possible for our algorithm to succeed inhandling the cyclic intervals by �nding the appropriate fat covers.It should be noted that although the algorithm �nds a fat cover at each step, it may not�nd the fat cover that leads to an optimal solution. That is, for a k-colorable graph G, it mayselect a fatcover F 0 such that G � F 0 is not k � l colorable, even though there exists anotherfatcover F such that G� F is k-colorable.For graphs with one cyclic interval, any fat cover will do, and we do �nd the optimalsolution. This is because we are guaranteed to �nd a fat cover, F , if one exists. Furthermore,if a fat cover is found, we know that the graph G � F will have maximum thickness of k � 1,and G� F will contain no cyclic intervals. Therefore, by theorem 2.1, we can guarantee thatG� F can be colored with k � 1 colors, and G can therefore be colored in k colors.10
Our fat cover algorithm can be thought of as a smart way of deciding which subset ofintervals should be colored with the same color. In some of the more traditional approachesusing interference graphs, a simpli�cation phase is applied to the interference graph in whichpairs of nodes are coalesced into one node, thus forcing them to be colored the same color[3]. In our case we are searching for sets of nodes that have a very speci�c property, that isthey all belong to a fat cover of some cyclic interval. Finding such a set of intervals requiresinformation regarding the location of all the fat spots in the interval graph. This informationis explicit in our cyclic interval graph representation, and is not available in the interferencegraph representation.It should be noted that the fat cover algorithm is not computationally expensive. Foreach of the cyclic intervals, one sweep of the graph is required (where the size of the graph isexactly the number of 3-address statements in the program). All of the remaining intervals canbe handled by one �nal left-to-right sweep. Furthermore, since interval graphs that correspondto programs have at most one new interval per time step, the complexity at each point in thesweep is e�ectively constant.3.2 Two Other ApproachesIn this subsection, we describe a naive coloring algorithm based on Chaitin's original Interfer-ence Graph approach and a Greedy algorithm.3.2.1 An Interference Graph AlgorithmSince a cyclic interval graph contains information about interference (or overlap) among inter-vals, we can use a Chaitin-style reduction algorithm to discover a k which guarantees that acyclic interval graph can be colored in k colors. At the ith step of this algorithm one removes,from among the remaining intervals, the interval with the fewest number of overlapping inter-vals (this corresponds to removing the node with least degree from an interference graph). Fora graph with n intervals, there will be n steps.Call the interval that is removed at step i, Ii, and let di denote the number of overlappingintervals (degree) of Ii at step i. Now pick k = max(d1; d2; : : : ; dn) + 1. We can color theoriginal graph in k colors by coloring the intervals in the order In, I(n�1), : : :, I1. At each stepwe color an interval that has at most k � 1 previously colored overlapping intervals.3.2.2 A Greedy AlgorithmAnother approach to coloring a cyclic interval graph is to �rst color the cyclical intervals,and then use a greedy algorithm to color the remaining intervals. At each step in the greedyalgorithm the following three steps are performed :11
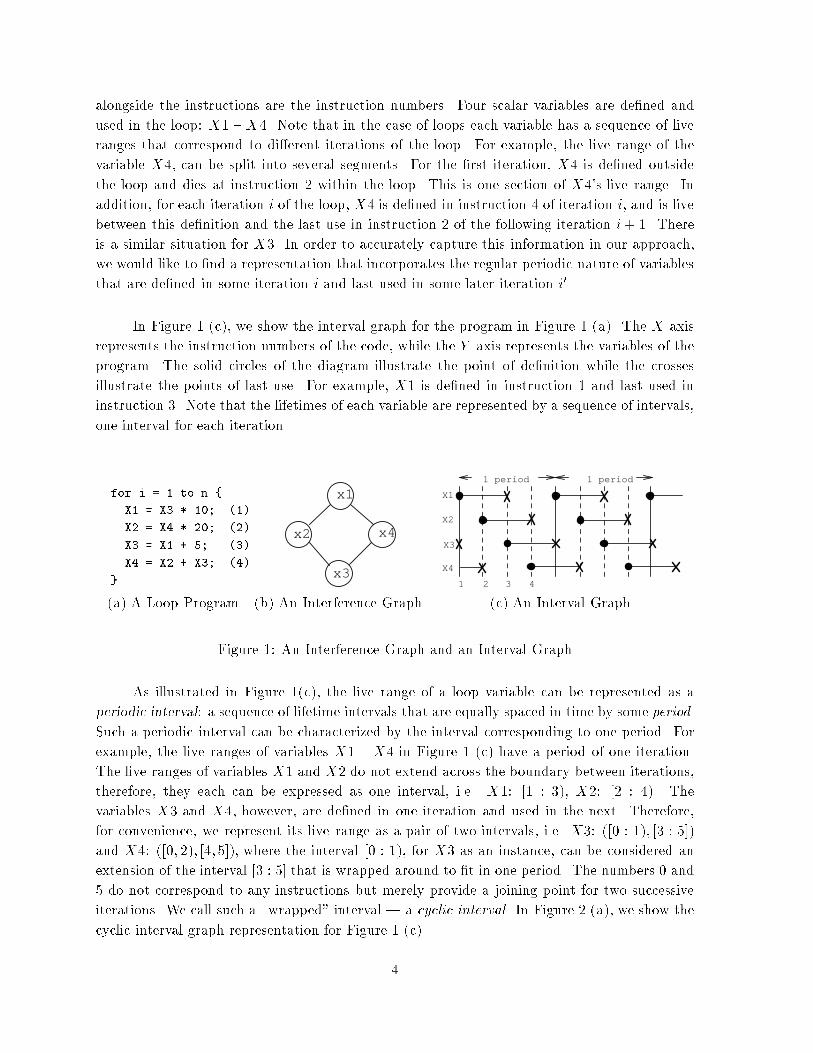
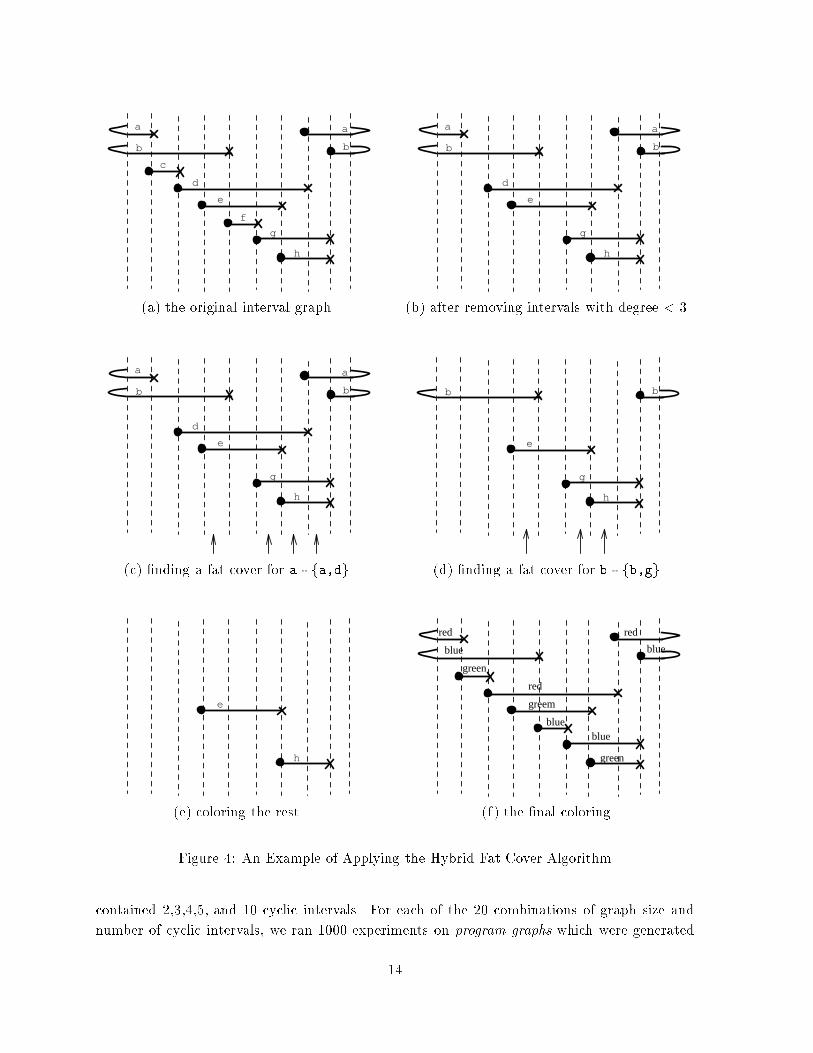
1. From among the uncolored intervals, choose the \best" one to color next, call it Inext.Some possible criteria for choosing the \best" interval include: (a) the leftmost un-colored interval (the interval with the lowest starting time), (b) the longest uncoloredinterval, (c) the interval which overlaps with the most uncolored intervals, or (d) theinterval which has the fewest number of available colors (where a color C is availablefor interval I , only if C has not been used for any interval that overlaps with I).2. From among the colors available for Inext, choose the \best" color, call it Cnext. If nocolor is available for this interval, then allocate a new color. Some possible criteria forchoosing the \best" color include: (a) best-�t (each color is available for some timeintervals, a color that best-�ts is one where the starting and ending times for the colorbest match the starting and ending times for the interval Inext), (b) worst-�t, and (c)the color which can be used for the fewest number of unallocated intervals.3. Assign color Cnext to interval Inext.The experimental results reported in Figure 5 used a greedy algorithm with option (d)for choosing the interval to color, and option (c) for for choosing which color to use (these werefound to be the best heuristics).3.3 A Hybrid AlgorithmA hybrid algorithm can combine the best points of the interference graph approach with eitherthe fat cover method (presented in 3.1) or the greedy method (presented in 3.2.2). Given agraph G, this algorithm �nds the coloring in three phases. The �rst phase applies a reductionstep based on interference information. This phase repeatedly removes all intervals that havefewer than Wmax(G) overlapping intervals. Let us call the intervals removed I1; I2; : : : ; Im, andthe graph remaining G0. Phase 2 applies either a greedy algorithm or the fat cover algorithmto color the intervals in G0, and �nally phase 3 colors the intervals removed by phase 1 in theorder Im; I(m�1); : : : ; I1.Let us illustrate the hybrid fatcover algorithm with a step-by-step example given in Figure4.Figure 4(a): In this picture we give the input interval graph. Notice that this graph has amaximum width of 3, and therefore the fat cover algorithm will try to color it with k=3colors.Figure 4(b): In this �gure we illustrate the graph after the initial reduction phase. Thereduction phase simpli�es the graph by removing all intervals that overlap with only 2other intervals. This is equivalent to applying a Chaitin-like algorithm with k=3. Notethat only intervals c and f were removed, and all of the remaining intervals overlap with12
3 other intervals. This means that in order to use only 3 colors, a naive interferencegraph algorithm would have to resort to spilling at this point. However, as illustratedwith the next four pictures, when the fat cover algorithm is applied to the remainingintervals, a 3-coloring is found.Figure 4(c): The �rst phase of the fat cover algorithm is to �nd a fat cover for each cyclicinterval. As shown by the arrows in this picture, there are four fat spots to be covered.By traversing left from interval a, the cover of fa,dg is found. We can now color a andd with a new color red, and proceed to the next phase.Figure 4(d): This �gure shows the remaining uncolored intervals. Note that the width isnow 2, and there are 3 fat spots as indicated by the arrows. We �nd that fb,gg formsa fat cover for b, the only remaining cyclic interval, and we color b and g with a newcolor blue.Figure 4(e): This �gure shows the only remaining intervals to consider. Note that there areno cyclic intervals, and we can easily color these intervals with the third color green.In general, if the phase that handles all of the m cyclic intervals succeeds, then we areguaranteed to be able to color the remaining intervals with Wmax �m colors. In thisexample Wmax is 3, and m is 2.Figure 4(f): The �nal coloring is shown in this �gure. Note that a and d are red, b and gare blue, e and h are green, and the two intervals removed in the �rst step, c and fhave been colored with colors not used in any overlapping intervals.It should be noted that this algorithm could be improved further by allowing multiplealternations between the interference graph heuristic and the fat-cover algorithm. For example,after �nding the fat cover in Figure 4(c), one could remove all intervals with degree less than 2.3.4 An Experimental ComparisonIn order to experiment with a wide variety of coloring approaches and coloring heuristics, weimplemented an experimental platform that supports all four approaches outlined above andalso supports a wide variety of heuristics for the greedy approach. The tables given in Figure5 summarize the experimental results that we collected for the following algorithms: (1) thealgorithm based on the naive interference graph (see Section 3.2.1), (2) a greedy algorithm(see Section 3.2.2), (3) the fat cover algorithm (as described in the Section 3.1), (4) a hybridalgorithm that has a �rst phase based on interference information, and a second phase thatapplies the greedy method (see Section 3.3), and (5) a hybrid algorithm that uses the fat covermethod for the second phase.One can think of our experiments as a \heuristic algorithm challenge". We experimentedwith four graph sizes - 10, 20, 30, and 50 intervals. For each graph size, we studied graphs which13
a a
b b
c
d
e
f
g
h
a a
b b
d
e
g
h(a) the original interval graph (b) after removing intervals with degree < 3h
g
e
d
bb
aa
b b
e
g
h(c) �nding a fat cover for a - fa,dg (d) �nding a fat cover for b - fb,ggh
e
red red
red
blue blue
blue
greem
green
green
blue(e) coloring the rest (f) the �nal coloringFigure 4: An Example of Applying the Hybrid Fat Cover Algorithmcontained 2,3,4,5, and 10 cyclic intervals. For each of the 20 combinations of graph size andnumber of cyclic intervals, we ran 1000 experiments on program graphs which were generated14
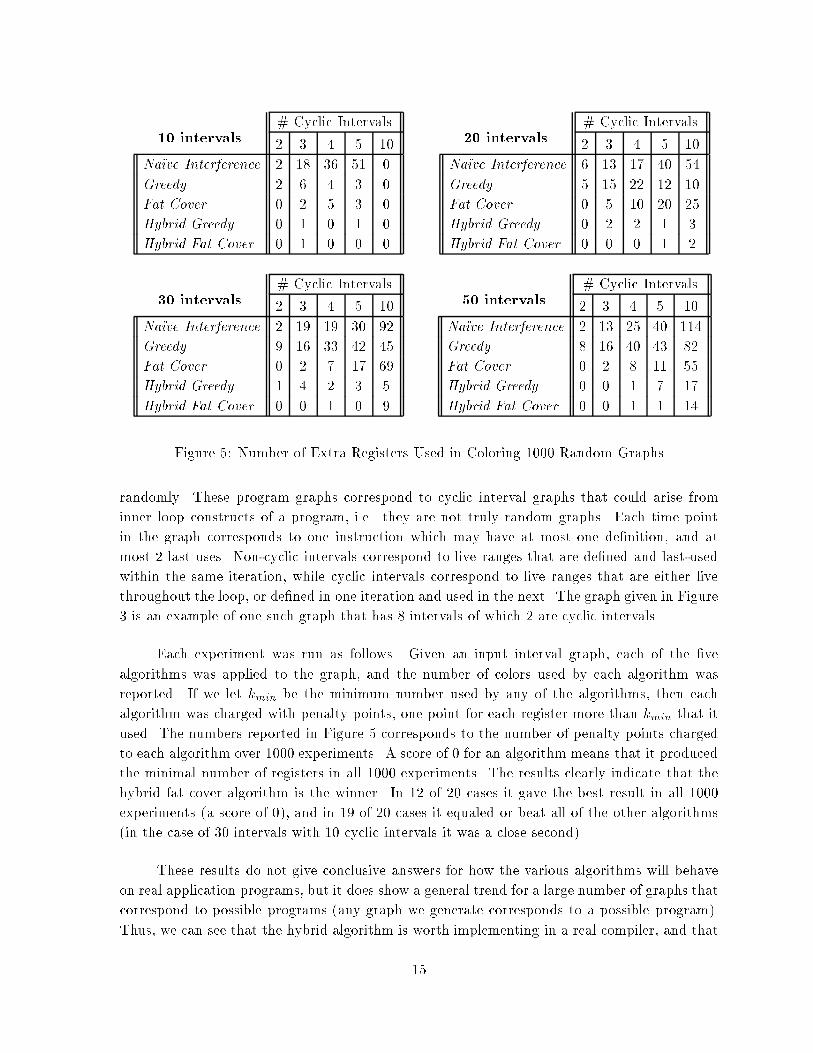
# Cyclic Intervals10 intervals 2 3 4 5 10Na��ve Interference 2 18 36 51 0Greedy 2 6 4 3 0Fat Cover 0 2 5 3 0Hybrid Greedy 0 1 0 1 0Hybrid Fat Cover 0 1 0 0 0 # Cyclic Intervals20 intervals 2 3 4 5 10Na��ve Interference 6 13 17 40 54Greedy 5 15 22 12 10Fat Cover 0 5 10 20 25Hybrid Greedy 0 2 2 1 3Hybrid Fat Cover 0 0 0 1 2# Cyclic Intervals30 intervals 2 3 4 5 10Na��ve Interference 2 19 19 30 92Greedy 9 16 33 42 45Fat Cover 0 2 7 17 69Hybrid Greedy 1 4 2 3 5Hybrid Fat Cover 0 0 1 0 9 # Cyclic Intervals50 intervals 2 3 4 5 10Na��ve Interference 2 13 25 40 114Greedy 8 16 40 43 82Fat Cover 0 2 8 11 55Hybrid Greedy 0 0 1 7 17Hybrid Fat Cover 0 0 1 1 14Figure 5: Number of Extra Registers Used in Coloring 1000 Random Graphsrandomly. These program graphs correspond to cyclic interval graphs that could arise frominner loop constructs of a program, i.e. they are not truly random graphs. Each time pointin the graph corresponds to one instruction which may have at most one de�nition, and atmost 2 last uses. Non-cyclic intervals correspond to live ranges that are de�ned and last-usedwithin the same iteration, while cyclic intervals correspond to live ranges that are either livethroughout the loop, or de�ned in one iteration and used in the next. The graph given in Figure3 is an example of one such graph that has 8 intervals of which 2 are cyclic intervals.Each experiment was run as follows. Given an input interval graph, each of the �vealgorithms was applied to the graph, and the number of colors used by each algorithm wasreported. If we let kmin be the minimum number used by any of the algorithms, then eachalgorithm was charged with penalty points, one point for each register more than kmin that itused. The numbers reported in Figure 5 corresponds to the number of penalty points chargedto each algorithm over 1000 experiments. A score of 0 for an algorithm means that it producedthe minimal number of registers in all 1000 experiments. The results clearly indicate that thehybrid fat cover algorithm is the winner. In 12 of 20 cases it gave the best result in all 1000experiments (a score of 0), and in 19 of 20 cases it equaled or beat all of the other algorithms(in the case of 30 intervals with 10 cyclic intervals it was a close second).These results do not give conclusive answers for how the various algorithms will behaveon real application programs, but it does show a general trend for a large number of graphs thatcorrespond to possible programs (any graph we generate corresponds to a possible program).Thus, we can see that the hybrid algorithm is worth implementing in a real compiler, and that15
the fat cover is likely a better idea than a wide variety of greedy heuristics. As we will see inthe next section, the fat cover algorithm also provides some advantages when we are trying toreduce spill code. Thus, these experiments were important for us to demonstrate that the fatcover algorithm appears to do quite well for a wide variety of graphs. Furthermore, the resultsmotivated us to pursue the next step of integrating the fat cover algorithm with a new spillingstrategy.4 Finding a k-Coloring of Cyclic Interval GraphsIn the previous section we presented the fat cover algorithm that was designed to �nd a coloringin a minimal number of registers. In this section we present a new approach for allocatingregisters given the constraint that only k registers are available, and the minimal number ofregisters required to color the graphs is k0, where k0 > k.General interference graphs have several drawbacks that our interval graph representationsolves naturally:Separation of the spill phase from the coloring phase: Given that we developed a goodalgorithm for coloring a graph G with maximum thickness Wmax(G), we take the ap-proach that register allocation should proceed in two phases. Given k < Wmax(G),the �rst phase transforms G to an equivalent graph G0 that has maximum thicknessWmax(G0) = k. This transformation process introduces register spills and is guaran-teed to produce a graph G0 that can be colored by the second phase without introducingany further register spills. Thus, only one application of each phase is required.This di�ers from most approaches based on interference graphs that introduce spillingduring or after the register allocation phase. These approaches cannot guarantee thatthe spilling will result in a k-colorable interference graph in one pass, and it is necessaryto iterate the coloring/spilling process until a k-colorable solution is found. It shouldbe noted that the approach given in [13] suggested a means of avoiding this iteration,but it uses a more complex algorithm than that required here.Choice of spilled quantities: We use the information stored in the cyclic interval graph tomake good decisions on which intervals to spill. This information is not available inthe interference graph representation, and therefore cannot be exploited in spillingtechniques based on that representation.It should be noted that a similar approach has been used in the context of interferencegraphs [14]. In this approach the \width" 1 of the interference graph was used for oneof the spill heuristics. Similarly our algorithm uses the width of the interval graph as1The width of the interference graph at any given point in time is de�ned to be the number of live variablesat that point. 16
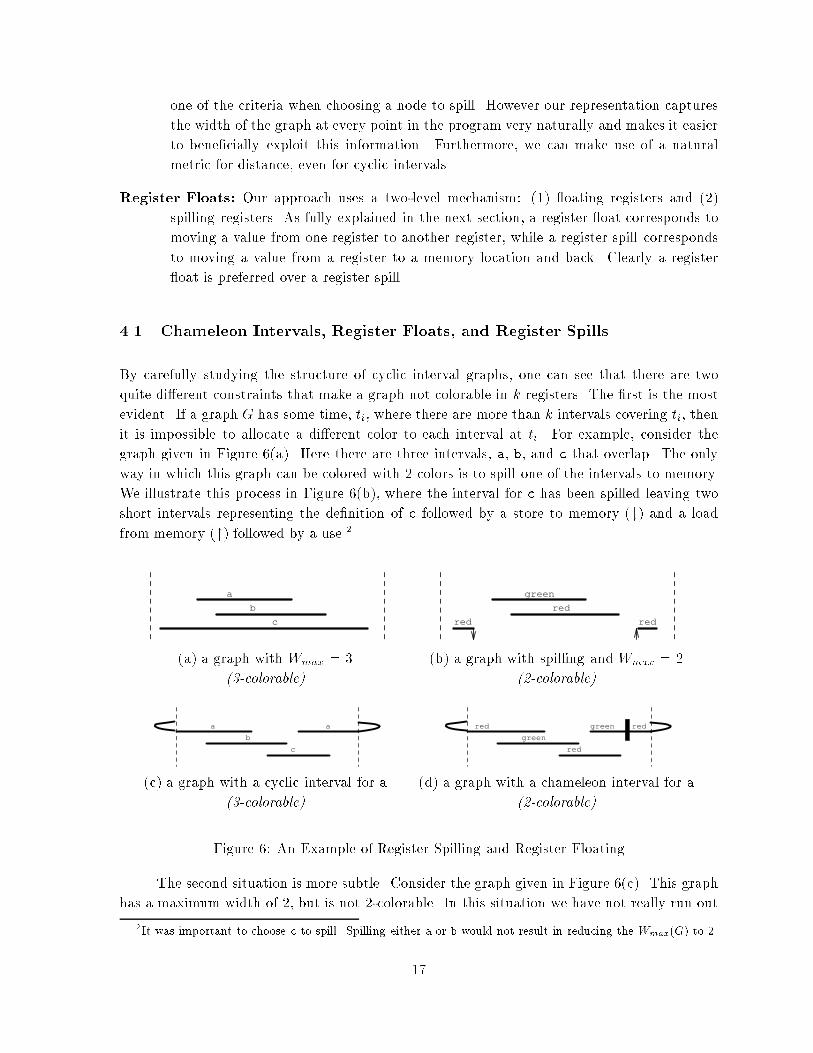
one of the criteria when choosing a node to spill. However our representation capturesthe width of the graph at every point in the program very naturally and makes it easierto bene�cially exploit this information. Furthermore, we can make use of a naturalmetric for distance, even for cyclic intervals.Register Floats: Our approach uses a two-level mechanism: (1) oating registers and (2)spilling registers. As fully explained in the next section, a register oat corresponds tomoving a value from one register to another register, while a register spill correspondsto moving a value from a register to a memory location and back. Clearly a register oat is preferred over a register spill.4.1 Chameleon Intervals, Register Floats, and Register SpillsBy carefully studying the structure of cyclic interval graphs, one can see that there are twoquite di�erent constraints that make a graph not colorable in k registers. The �rst is the mostevident. If a graph G has some time, ti, where there are more than k intervals covering ti, thenit is impossible to allocate a di�erent color to each interval at ti. For example, consider thegraph given in Figure 6(a). Here there are three intervals, a, b, and c that overlap. The onlyway in which this graph can be colored with 2 colors is to spill one of the intervals to memory.We illustrate this process in Figure 6(b), where the interval for c has been spilled leaving twoshort intervals representing the de�nition of c followed by a store to memory (#) and a loadfrom memory (") followed by a use.2c
b
a
red
red
green
red(a) a graph with Wmax = 3 (b) a graph with spilling and Wmax = 2(3-colorable) (2-colorable)a
c
b
a redgreen
red
green
red(c) a graph with a cyclic interval for a (d) a graph with a chameleon interval for a(3-colorable) (2-colorable)Figure 6: An Example of Register Spilling and Register FloatingThe second situation is more subtle. Consider the graph given in Figure 6(c). This graphhas a maximum width of 2, but is not 2-colorable. In this situation we have not really run out2It was important to choose c to spill. Spilling either a or b would not result in reducing the Wmax(G) to 2.17
of colors, and we need not resort to spilling in order to make this graph 2-colorable. Instead,we use the notion of a chameleon interval, an interval that can change color depending on itssurroundings.If we allow the interval for variable a to change color at the location indicated by the solidbar in Figure 6(d), then we can easily color this graph with only two colors. Thus, instead ofintroducing the loads and stores required for a register spill, we need only introduce a registermove that corresponds to the location that interval a changes from green to red. We call thisregister move operation a register oat - a value oats from register to register, but is notspilled.3By using chameleon intervals to �nd register oats, we can color any cyclic interval graphG that hasWmax(G) = k with exactly k colors without introducing any spilling. This is becauseany graph with Wmax(G) = k that is not immediately k-colorable must belong to the class ofgraphs that can be colored if we allow chameleon intervals (as illustrated in Figure 6(d)).Thus, we can use our fat cover algorithm to color the graph, and for each cyclic intervalthat cannot be covered, we simply introduce a chameleon interval. No extra loads or storesneed be introduced: we simply introduce a register oat for each chameleon interval. Sincewe introduce chameleon intervals only for the cyclic intervals that do not have a fat cover, thenumber of chameleon intervals introduced is small (at most Wmin(G)).If more than one register oat is introduced, it is possible that some of register movesdepend on each other. For example, perhaps a red interval needs to turn to green, and a greeninterval needs to turn to red. This can be accomplished either by rotating values through atemporary register, or by swapping the contents of registers using a trick such as a := a xorb; b := b xor a; a := a xor b. It is most straightforward to use a temporary, and sincethe number of cyclic intervals is likely to be less than the maximum width of the graph, atemporary register will be available.4.2 Reducing the Width of an Interval GraphGiven that we have the coloring algorithm described in the previous section, the problem ofk-coloring now reduces to the problem of transforming a graph G, with Wmax(G) = k0, k0 > k,to an equivalent graph G0 with Wmax(G0) = k. Since we are trying to reduce the width of agraph (as shown in Figure 6(b)), this transformation must introduce register spills. Thereforewe would like an approach which attempts to minimize the number of register spills.We have developed a new algorithm, the sweep and split algorithm that is based on thecyclic interval graph representation.4 Like the fat cover coloring algorithm, the sweep and split3The idea of register oats is not new, however di�culty in e�ciently identifying values to treat as register oats has prevented their widespread use. Our interval graph representation provides a natural mechanism|chameleon intervals|for recognizing when to use register oats and the quantities on which to use them.4A similar method was proposed for basic blocks in [5].18
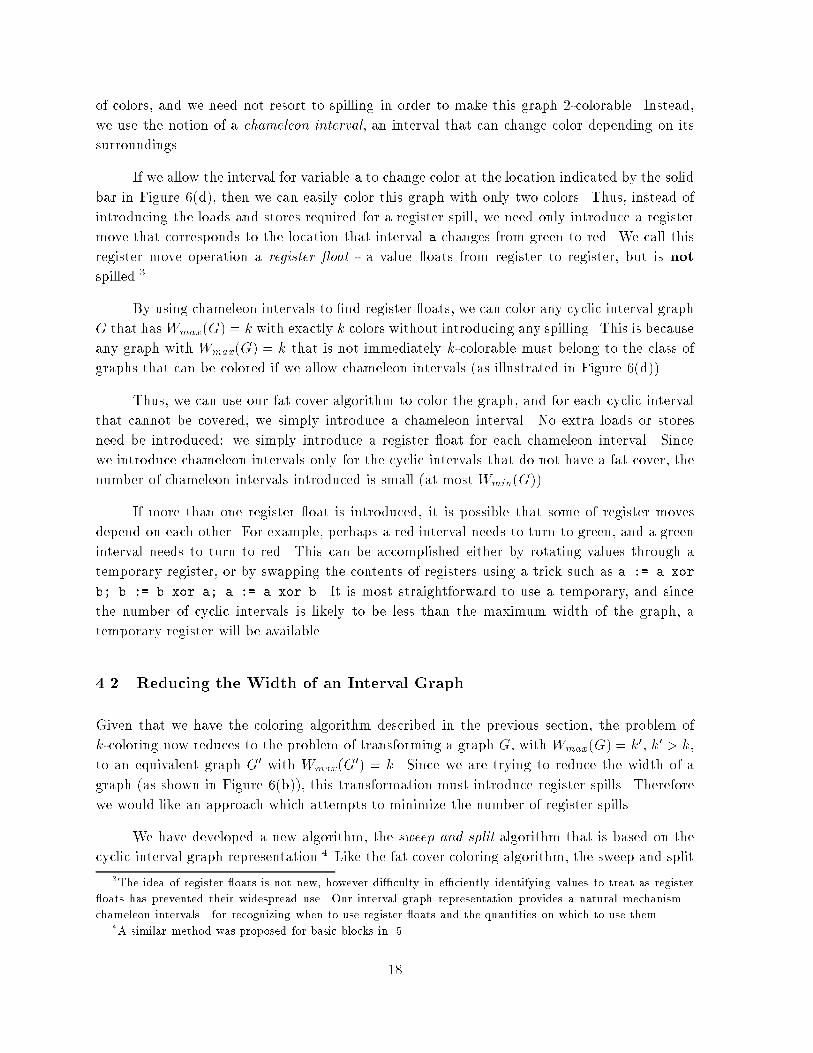
algorithm takes advantage of the extra information available in the interval representation.Since this algorithm is straight-forward, we give only an overview.The central idea of this algorithm is to sweep from left to right over the cyclic intervalgraph. The invariant is that at each time step i, any time to the left of time i is guaranteed tohave a maximum width Wmax(G; i) � k. To move to the next time step, i + 1, there are twosituations. The �rst is that width(G; i)� k, and the second is that width(G; i) = k0; k0 > k. Inthe �rst case, no action is required. In the second case, one must select k0� k intervals to splitby introducing spill code. Thus, the only di�culty is developing a good heuristic for selectingwhich intervals to split.We have developed a heuristic that uses information about time which is readily availablefrom our interval graphs. This heuristic favors intervals that will clear the longest time intervalto the right of i. For non-cyclic intervals this is equivalent to choosing the one with the furthestnext use from i. Note we do not split the whole interval, but only the segment that overlapstime i. The other segments will be split only if the sweep selects those intervals as the ones tosplit at some later step i0. The reasoning behind our heuristic is that according to the invariant,all times to the left of i have already had their widths reduced, and so we should favor intervalsthat will reduce widths to the right of i. If multiple intervals clear the same longest distance,an interval that requires only a load, is preferred over an interval that requires both a load anda store, and if a store is required, then a store that is outside of the loop is preferred.Let us now give a concrete example of applying the sweep and split algorithm to a cyclicinterval graph that corresponds to a small program. In Figure 7(a) we give a small illustrativeprogram, and in Figure 7(b) we give the 3-address code.5 Assuming that the number of availableregisters (k) is 3, Figure 7(c) gives the 3-address code program that results from applying thesweep and split algorithm. Figure 7(d) shows the cyclic interval graph for this loop, and Figures7(d-f) illustrate the sweep and split process that transforms the original graph into one thathas a maximum thickness of 3 (i.e. transforms it into a 3-colorable graph). These steps are asfollows:Figure 7(d): (Time = 1) The sweeping process starts at time step 1. Note that the sweepingline is indicated by the vertical dotted line. There are 6 intervals covering time step 1.In order to reduce the width to 3, three intervals must be selected to be split. Intervalc cannot be split because its use is at time 1. Of the remaining intervals, the bestintervals to select are a, b, and n. Splitting each of these intervals frees the longest timeinterval to the right of the sweeping line.Figure 7(e) (Time = 2): This �gure illustrates the graph resulting from splitting the a, b,and n in the previous step. There are four intervals covering time step 2, and so intervalc is chosen to split.5Assuming right-associativity, and right to left evaluation.19
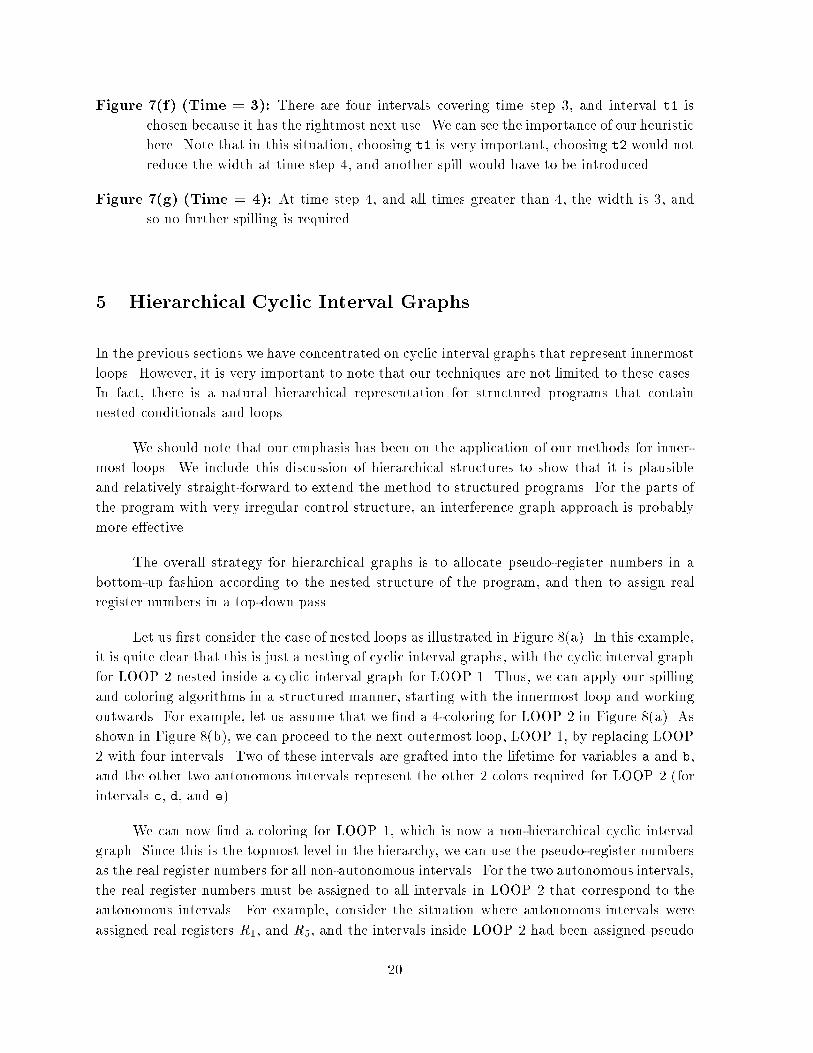
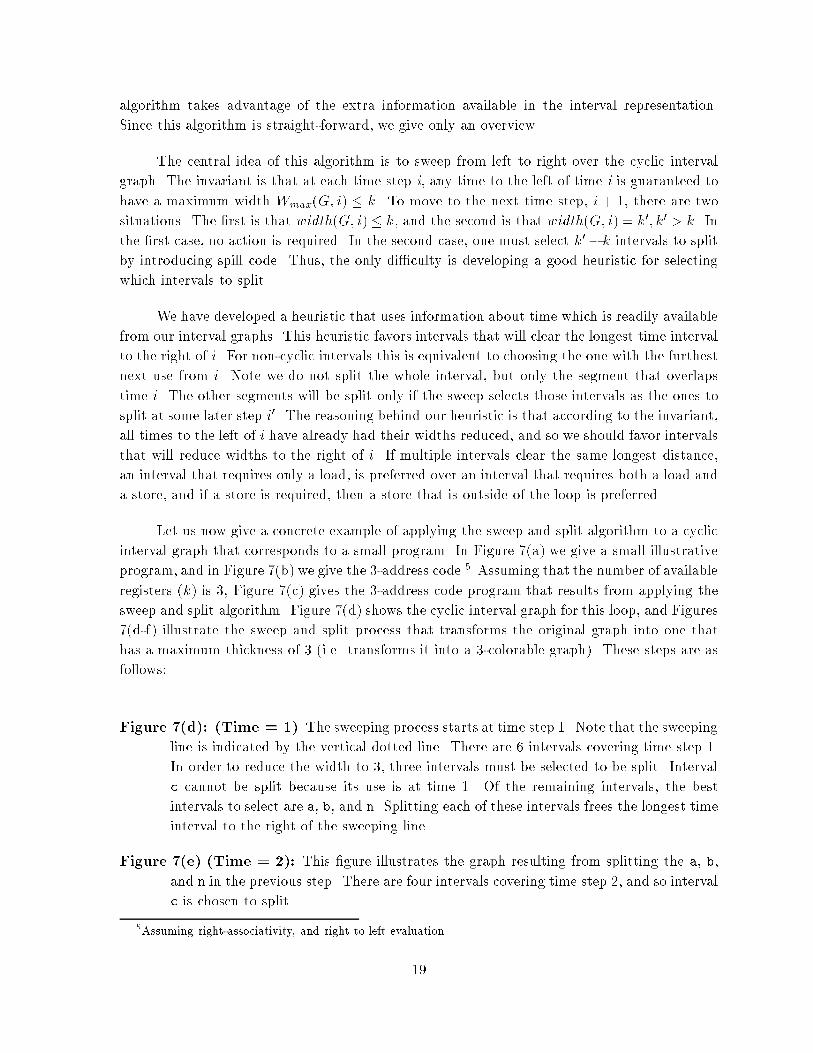
Figure 7(f) (Time = 3): There are four intervals covering time step 3, and interval t1 ischosen because it has the rightmost next use. We can see the importance of our heuristichere. Note that in this situation, choosing t1 is very important, choosing t2 would notreduce the width at time step 4, and another spill would have to be introduced.Figure 7(g) (Time = 4): At time step 4, and all times greater than 4, the width is 3, andso no further spilling is required.5 Hierarchical Cyclic Interval GraphsIn the previous sections we have concentrated on cyclic interval graphs that represent innermostloops. However, it is very important to note that our techniques are not limited to these cases.In fact, there is a natural hierarchical representation for structured programs that containnested conditionals and loops.We should note that our emphasis has been on the application of our methods for inner-most loops. We include this discussion of hierarchical structures to show that it is plausibleand relatively straight-forward to extend the method to structured programs. For the parts ofthe program with very irregular control structure, an interference graph approach is probablymore e�ective.The overall strategy for hierarchical graphs is to allocate pseudo-register numbers in abottom-up fashion according to the nested structure of the program, and then to assign realregister numbers in a top-down pass.Let us �rst consider the case of nested loops as illustrated in Figure 8(a). In this example,it is quite clear that this is just a nesting of cyclic interval graphs, with the cyclic interval graphfor LOOP 2 nested inside a cyclic interval graph for LOOP 1. Thus, we can apply our spillingand coloring algorithms in a structured manner, starting with the innermost loop and workingoutwards. For example, let us assume that we �nd a 4-coloring for LOOP 2 in Figure 8(a). Asshown in Figure 8(b), we can proceed to the next outermost loop, LOOP 1, by replacing LOOP2 with four intervals. Two of these intervals are grafted into the lifetime for variables a and b,and the other two autonomous intervals represent the other 2 colors required for LOOP 2 (forintervals c, d, and e).We can now �nd a coloring for LOOP 1, which is now a non-hierarchical cyclic intervalgraph. Since this is the topmost level in the hierarchy, we can use the pseudo-register numbersas the real register numbers for all non-autonomous intervals. For the two autonomous intervals,the real register numbers must be assigned to all intervals in LOOP 2 that correspond to theautonomous intervals. For example, consider the situation where autonomous intervals wereassigned real registers R1, and R5, and the intervals inside LOOP 2 had been assigned pseudo20
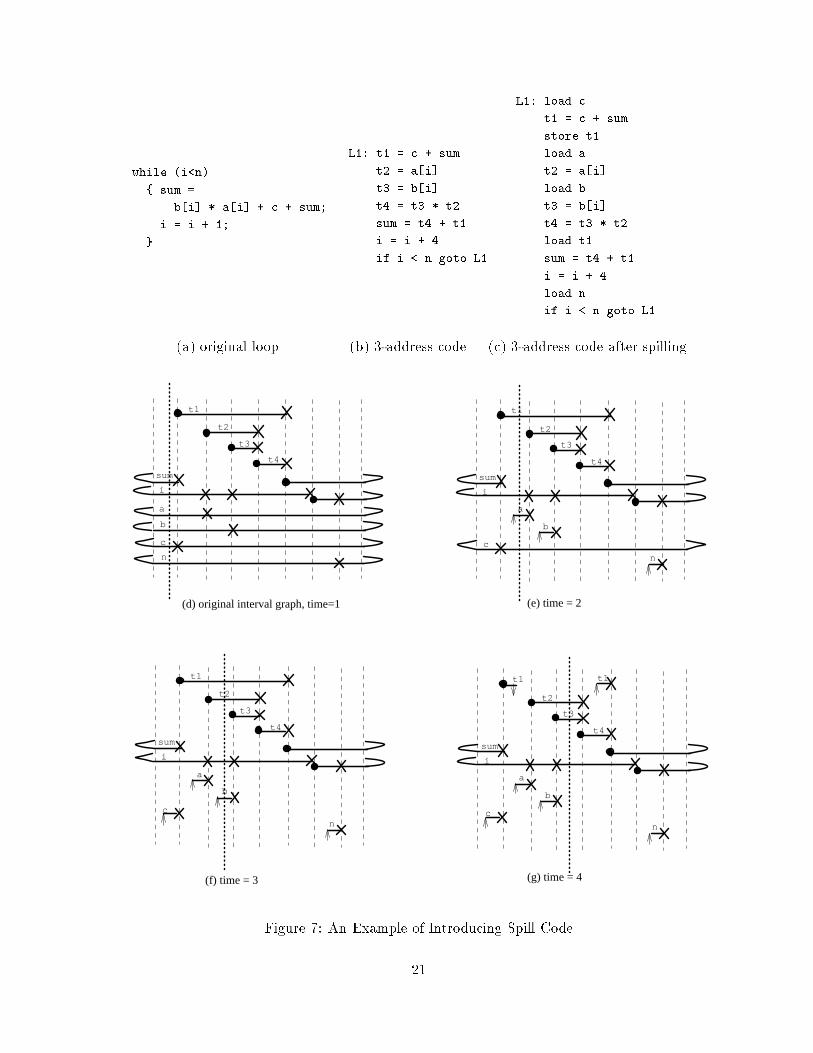
while (i<n){ sum =b[i] * a[i] + c + sum;i = i + 1;} L1: t1 = c + sumt2 = a[i]t3 = b[i]t4 = t3 * t2sum = t4 + t1i = i + 4if i < n goto L1 L1: load ct1 = c + sumstore t1load at2 = a[i]load bt3 = b[i]t4 = t3 * t2load t1sum = t4 + t1i = i + 4load nif i < n goto L1(a) original loop (b) 3-address code (c) 3-address code after spillingt1
t2
t3
t4
sum
i
a
b
c
n
t1
n
c
b
a
i
sum
t4
t3
t2
t1
n
c
b
a
i
sum
t4
t3
t2
t1
n
c
b
a
i
sum
t4
t3
t2
t1
(d) original interval graph, time=1 (e) time = 2
(f) time = 3 (g) time = 4Figure 7: An Example of Introducing Spill Code21
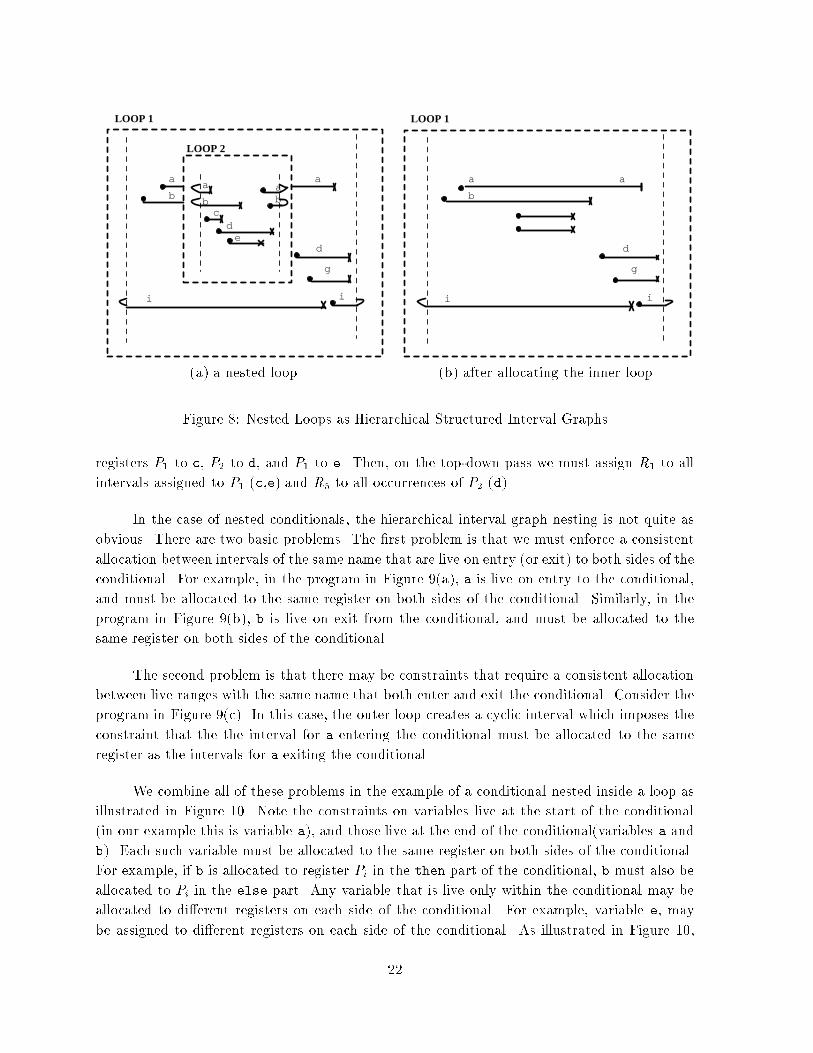
g
d
ii
ab
ed
cb
aa a
b
LOOP 1
LOOP 2
d
g
ii
a a
b
LOOP 1
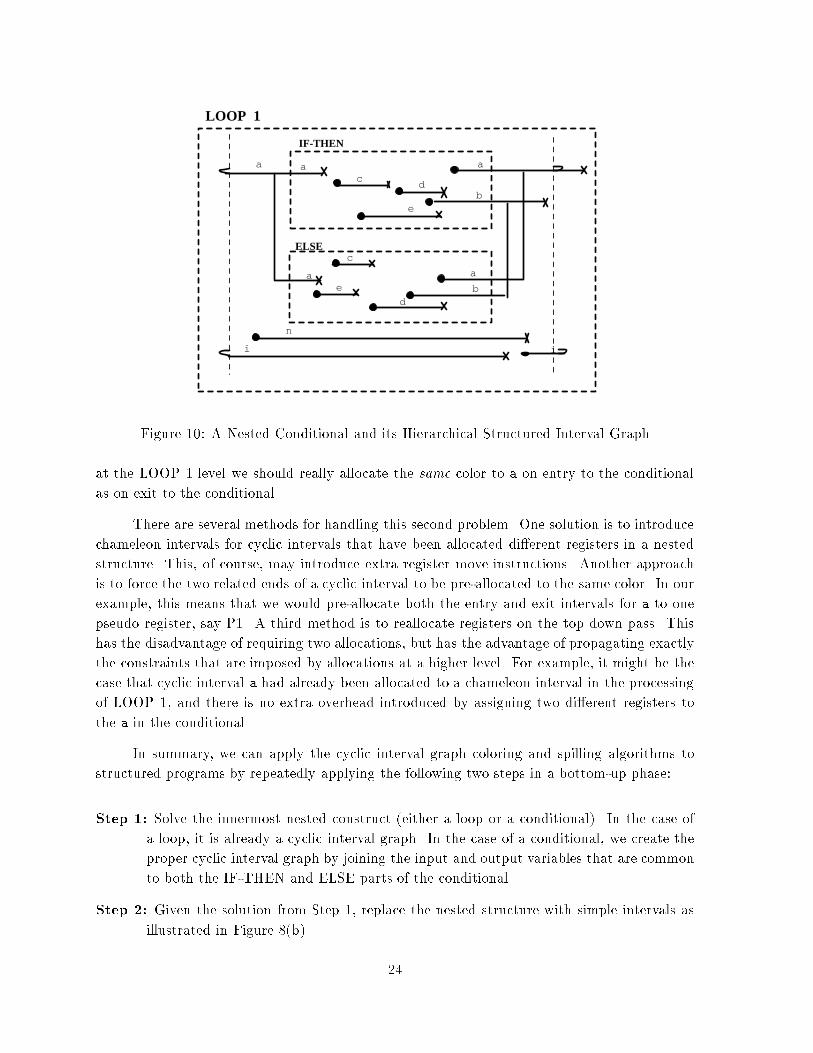
(a) a nested loop (b) after allocating the inner loopFigure 8: Nested Loops as Hierarchical Structured Interval Graphsregisters P1 to c, P2 to d, and P1 to e. Then, on the top-down pass we must assign R1 to allintervals assigned to P1 (c,e) and R5 to all occurrences of P2 (d).In the case of nested conditionals, the hierarchical interval graph nesting is not quite asobvious. There are two basic problems. The �rst problem is that we must enforce a consistentallocation between intervals of the same name that are live on entry (or exit) to both sides of theconditional. For example, in the program in Figure 9(a), a is live on entry to the conditional,and must be allocated to the same register on both sides of the conditional. Similarly, in theprogram in Figure 9(b), b is live on exit from the conditional, and must be allocated to thesame register on both sides of the conditional.The second problem is that there may be constraints that require a consistent allocationbetween live ranges with the same name that both enter and exit the conditional. Consider theprogram in Figure 9(c). In this case, the outer loop creates a cyclic interval which imposes theconstraint that the the interval for a entering the conditional must be allocated to the sameregister as the intervals for a exiting the conditional.We combine all of these problems in the example of a conditional nested inside a loop asillustrated in Figure 10. Note the constraints on variables live at the start of the conditional(in our example this is variable a), and those live at the end of the conditional(variables a andb). Each such variable must be allocated to the same register on both sides of the conditional.For example, if b is allocated to register Pi in the then part of the conditional, b must also beallocated to Pi in the else part. Any variable that is live only within the conditional may beallocated to di�erent registers on each side of the conditional. For example, variable e, maybe assigned to di�erent registers on each side of the conditional. As illustrated in Figure 10,22
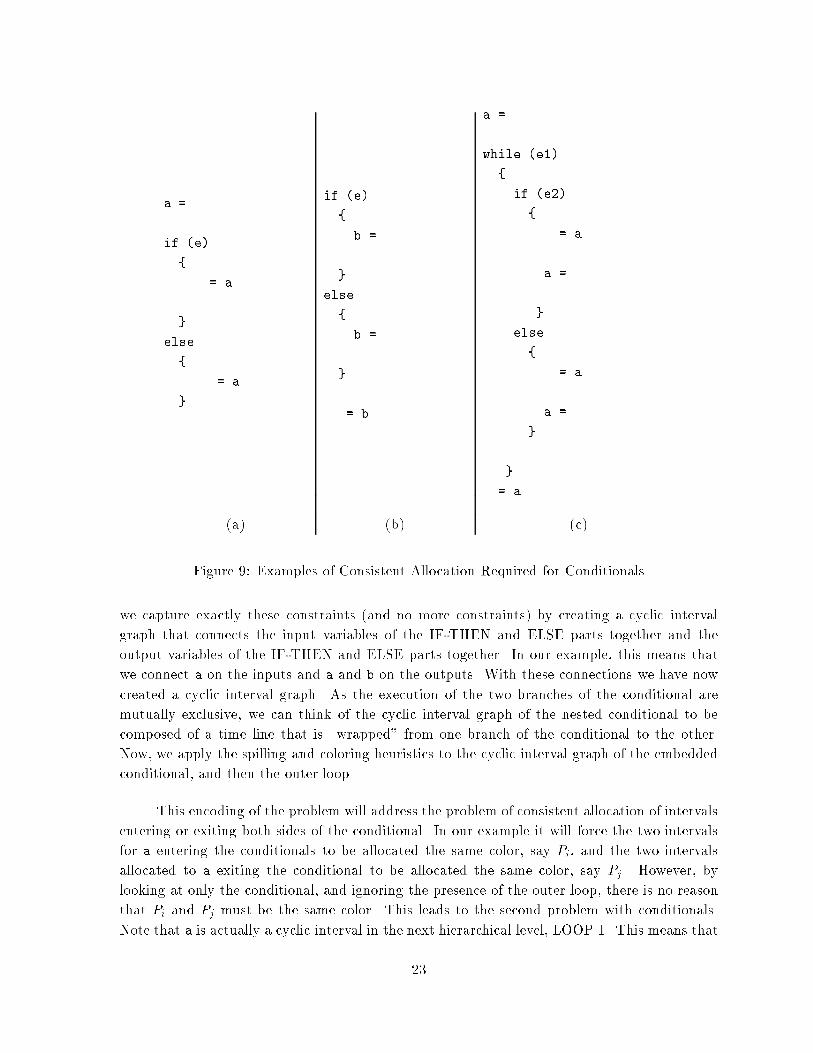
a =...if (e){ ...= a...}else{ ...= a}if (e){ ...b =...}else{ ...b =...}...= b
a =...while (e1){ ...if (e2){ ...= a...a =...}else{ ...= a...a =}...}= a(a) (b) (c)Figure 9: Examples of Consistent Allocation Required for Conditionalswe capture exactly these constraints (and no more constraints) by creating a cyclic intervalgraph that connects the input variables of the IF-THEN and ELSE parts together and theoutput variables of the IF-THEN and ELSE parts together. In our example, this means thatwe connect a on the inputs and a and b on the outputs. With these connections we have nowcreated a cyclic interval graph. As the execution of the two branches of the conditional aremutually exclusive, we can think of the cyclic interval graph of the nested conditional to becomposed of a time line that is \wrapped" from one branch of the conditional to the other.Now, we apply the spilling and coloring heuristics to the cyclic interval graph of the embeddedconditional, and then the outer loop.This encoding of the problem will address the problem of consistent allocation of intervalsentering or exiting both sides of the conditional. In our example it will force the two intervalsfor a entering the conditionals to be allocated the same color, say Pi, and the two intervalsallocated to a exiting the conditional to be allocated the same color, say Pj . However, bylooking at only the conditional, and ignoring the presence of the outer loop, there is no reasonthat Pi and Pj must be the same color. This leads to the second problem with conditionals.Note that a is actually a cyclic interval in the next hierarchical level, LOOP 1. This means that23
LOOP 1
ii
IF-THEN
ELSE
a a
a
a
a
b
b
c
c
d
d
e
e
nFigure 10: A Nested Conditional and its Hierarchical Structured Interval Graphat the LOOP 1 level we should really allocate the same color to a on entry to the conditionalas on exit to the conditional.There are several methods for handling this second problem. One solution is to introducechameleon intervals for cyclic intervals that have been allocated di�erent registers in a nestedstructure. This, of course, may introduce extra register move instructions. Another approachis to force the two related ends of a cyclic interval to be pre-allocated to the same color. In ourexample, this means that we would pre-allocate both the entry and exit intervals for a to onepseudo register, say P1. A third method is to reallocate registers on the top down pass. Thishas the disadvantage of requiring two allocations, but has the advantage of propagating exactlythe constraints that are imposed by allocations at a higher level. For example, it might be thecase that cyclic interval a had already been allocated to a chameleon interval in the processingof LOOP 1, and there is no extra overhead introduced by assigning two di�erent registers tothe a in the conditional.In summary, we can apply the cyclic interval graph coloring and spilling algorithms tostructured programs by repeatedly applying the following two steps in a bottom-up phase:Step 1: Solve the innermost nested construct (either a loop or a conditional). In the case ofa loop, it is already a cyclic interval graph. In the case of a conditional, we create theproper cyclic interval graph by joining the input and output variables that are commonto both the IF-THEN and ELSE parts of the conditional.Step 2: Given the solution from Step 1, replace the nested structure with simple intervals asillustrated in Figure 8(b). 24
The bottom-up phase is then followed by a top-down phase that propagates real registernumbers to the pseudo allocation done on the bottom-up phase. On the top-down phase,extra constraints due to cyclic intervals entering and exiting conditionals must be resolved byintroducing chameleon intervals or recoloring the lower level with some extra initial coloringconstraints.As we shall brie y survey in Section 7, interesting work has been conducted on hier-archical methods for register allocation [15, 16, 17]. However, it is our belief that the clearand simple representation of the cyclic interval graph provides a good basis for representinglive ranges that cross the boundaries of nested program structures. This of course helps in thehierarchical register allocation process.6 Interval Graph Performance on Benchmark ProgramsStandalone versions of our spilling and coloring algorithms were implemented 6. In this sectionwe compare the performance of our interval graph method of spilling and register allocationto the performance of three advanced production C compilers for the IBM RS6000 (Version1:01:003:0013), the Sun Sparc (version bundled with SunOS 4:1:1), and the MIPS (Version2:11:2). Our comparisons use the highest level of optimization o�ered by these compilers. Eachof these three architectures has 32, 32-bit integer registers. The RS6000 also has 32, 64-bit oating point registers, while the Sparc and the MIPS have 16, 64-bit oating point registers.We focus on two inner loop bodies, one taken from Livermore Loop 87, the other from theTomcat SPEC89 benchmark (Release 1.2).8. Both of these benchmarks were selected because ofthe relatively large size of their loop bodies and the large number of variables referenced. Thislarge size is necessary in order to evaluate the e�ciency of register allocation and spilling onthese three architectures with their large register sets. Both benchmarks are also oating pointintensive and use double precision (64-bit) arithmetic. Hence we concentrate on the allocationand spilling of oating point registers.In order to give all compilers approximately equal input, we �rst transformed the inputsource code so that all of the complex transformations had been made explicit. Both loops weremanually unrolled and software pipelined. Common subexpression elimination was performedand reused data values were explicitly assigned to local scalar variables. This transformed codeis isomorphic to the interval graphs which were fed through our spiller and allocator. Theseaggressive optimizations performed tend to increase the lifetime of variables thus increasing the6We are currently integrating the spiller and the register allocator, as well as an interference graph approachinto our McCAT (McGill Compiler Architecture Testbed) research compiler.7To be precise, the Tomcat loop is the \I-LOOP" beginning with \DO 250 I= I1P,I2M".8The Standards Performance Evaluation Corporation (SPEC) benchmark suite can be obtained from 39510Paseo Padre Parkway, Suite 350, Fremont, CA 94538. These benchmarks have been derived from publicly-available CPU intensive application programs. 25
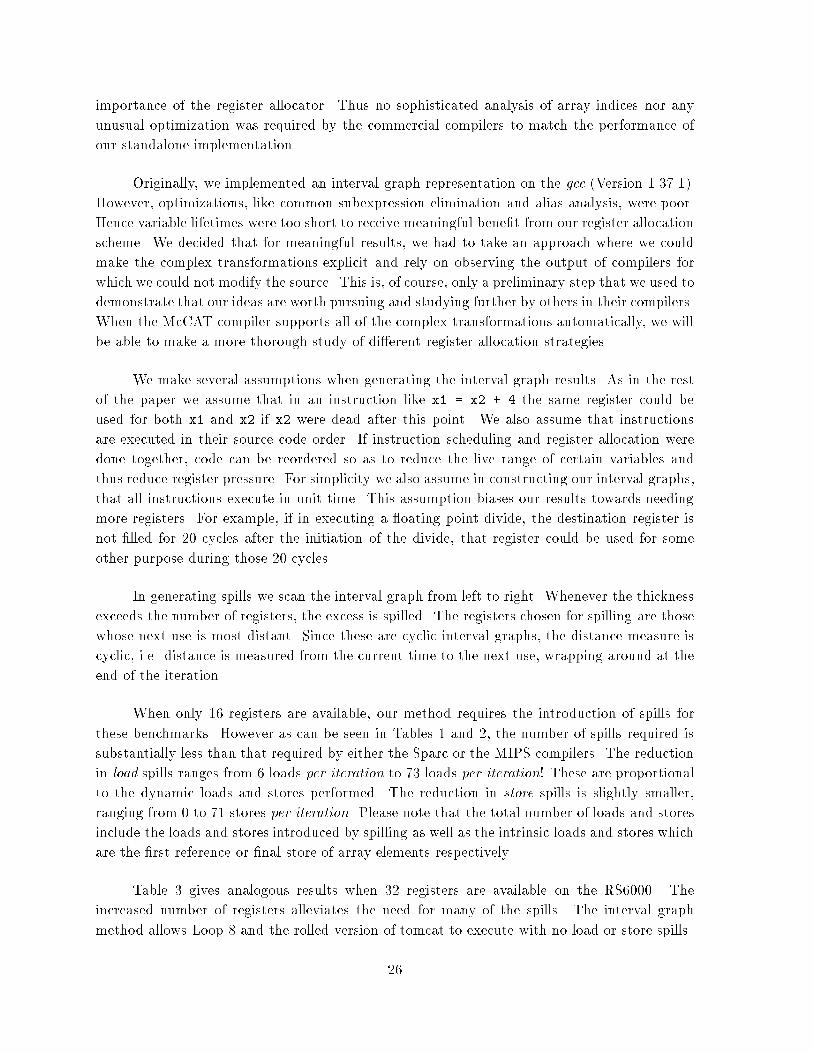
importance of the register allocator. Thus no sophisticated analysis of array indices nor anyunusual optimization was required by the commercial compilers to match the performance ofour standalone implementation.Originally, we implemented an interval graph representation on the gcc (Version 1.37.1).However, optimizations, like common subexpression elimination and alias analysis, were poor.Hence variable lifetimes were too short to receive meaningful bene�t from our register allocationscheme. We decided that for meaningful results, we had to take an approach where we couldmake the complex transformations explicit and rely on observing the output of compilers forwhich we could not modify the source. This is, of course, only a preliminary step that we used todemonstrate that our ideas are worth pursuing and studying further by others in their compilers.When the McCAT compiler supports all of the complex transformations automatically, we willbe able to make a more thorough study of di�erent register allocation strategies.We make several assumptions when generating the interval graph results. As in the restof the paper we assume that in an instruction like x1 = x2 + 4 the same register could beused for both x1 and x2 if x2 were dead after this point. We also assume that instructionsare executed in their source code order. If instruction scheduling and register allocation weredone together, code can be reordered so as to reduce the live range of certain variables andthus reduce register pressure. For simplicity we also assume in constructing our interval graphs,that all instructions execute in unit time. This assumption biases our results towards needingmore registers. For example, if in executing a oating point divide, the destination register isnot �lled for 20 cycles after the initiation of the divide, that register could be used for someother purpose during those 20 cycles.In generating spills we scan the interval graph from left to right. Whenever the thicknessexceeds the number of registers, the excess is spilled. The registers chosen for spilling are thosewhose next use is most distant. Since these are cyclic interval graphs, the distance measure iscyclic, i.e. distance is measured from the current time to the next use, wrapping around at theend of the iteration.When only 16 registers are available, our method requires the introduction of spills forthese benchmarks. However as can be seen in Tables 1 and 2, the number of spills required issubstantially less than that required by either the Sparc or the MIPS compilers. The reductionin load spills ranges from 6 loads per iteration to 73 loads per iteration! These are proportionalto the dynamic loads and stores performed. The reduction in store spills is slightly smaller,ranging from 0 to 71 stores per iteration. Please note that the total number of loads and storesinclude the loads and stores introduced by spilling as well as the intrinsic loads and stores whichare the �rst reference or �nal store of array elements respectively.Table 3 gives analogous results when 32 registers are available on the RS6000. Theincreased number of registers alleviates the need for many of the spills. The interval graphmethod allows Loop 8 and the rolled version of tomcat to execute with no load or store spills.26
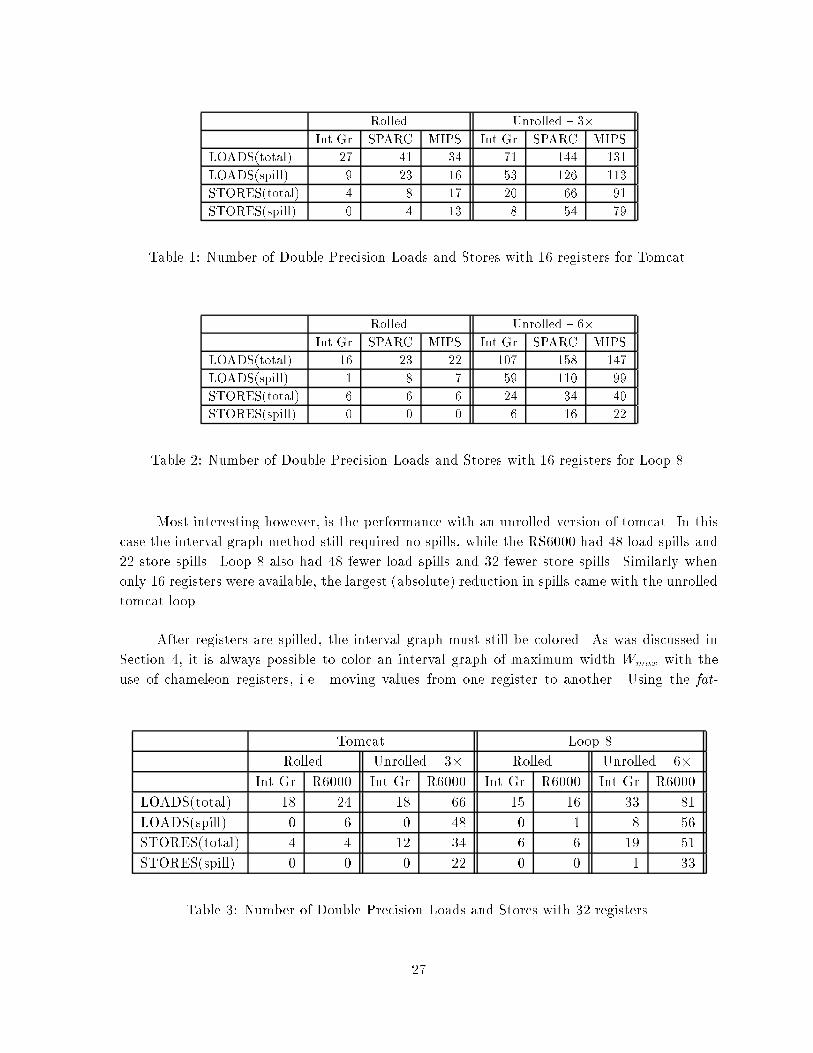
Rolled Unrolled { 3�Int Gr SPARC MIPS Int Gr SPARC MIPSLOADS(total) 27 41 34 71 144 131LOADS(spill) 9 23 16 53 126 113STORES(total) 4 8 17 20 66 91STORES(spill) 0 4 13 8 54 79Table 1: Number of Double Precision Loads and Stores with 16 registers for Tomcat.Rolled Unrolled { 6�Int Gr SPARC MIPS Int Gr SPARC MIPSLOADS(total) 16 23 22 107 158 147LOADS(spill) 1 8 7 59 110 99STORES(total) 6 6 6 24 34 40STORES(spill) 0 0 0 6 16 22Table 2: Number of Double Precision Loads and Stores with 16 registers for Loop 8.Most interesting however, is the performance with an unrolled version of tomcat. In thiscase the interval graph method still required no spills, while the RS6000 had 48 load spills and22 store spills. Loop 8 also had 48 fewer load spills and 32 fewer store spills. Similarly whenonly 16 registers were available, the largest (absolute) reduction in spills came with the unrolledtomcat loop.After registers are spilled, the interval graph must still be colored. As was discussed inSection 4, it is always possible to color an interval graph of maximum width Wmax with theuse of chameleon registers, i.e. moving values from one register to another. Using the fat-Tomcat Loop 8Rolled Unrolled { 3� Rolled Unrolled { 6�Int Gr R6000 Int Gr R6000 Int Gr R6000 Int Gr R6000LOADS(total) 18 24 18 66 15 16 33 81LOADS(spill) 0 6 0 48 0 1 8 56STORES(total) 4 4 12 34 6 6 19 51STORES(spill) 0 0 0 22 0 0 1 33Table 3: Number of Double Precision Loads and Stores with 32 registers.27
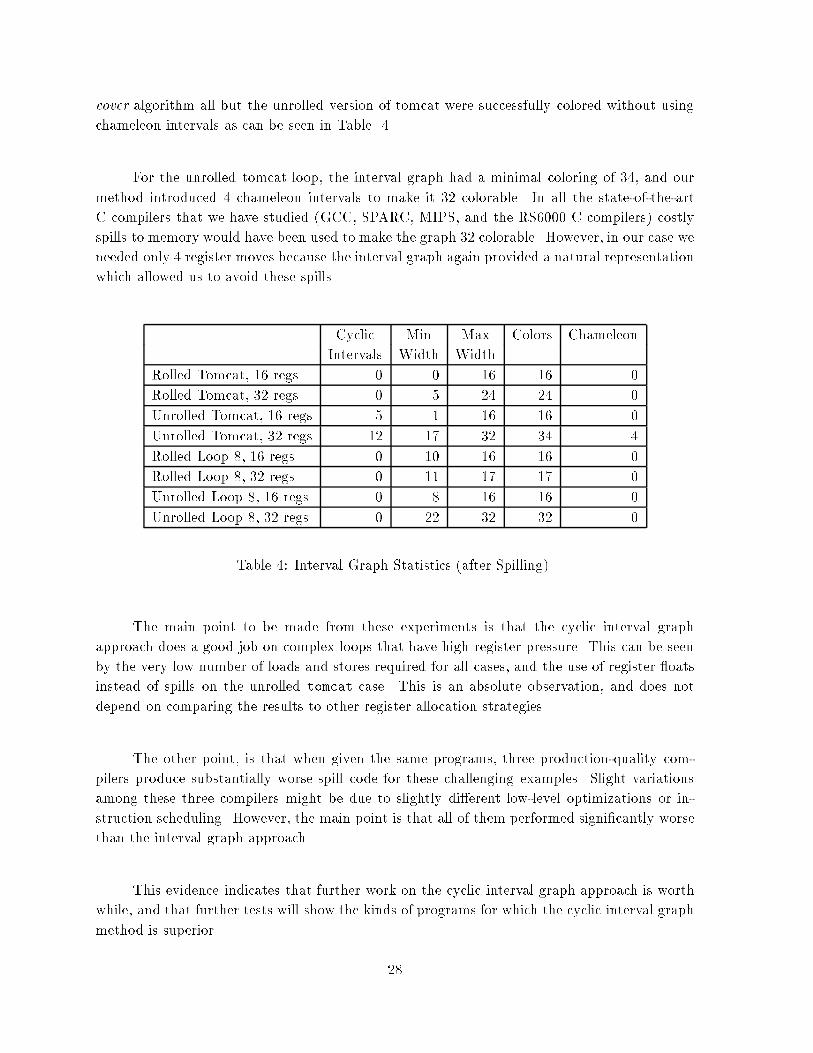
cover algorithm all but the unrolled version of tomcat were successfully colored without usingchameleon intervals as can be seen in Table 4.For the unrolled tomcat loop, the interval graph had a minimal coloring of 34, and ourmethod introduced 4 chameleon intervals to make it 32 colorable. In all the state-of-the-artC compilers that we have studied (GCC, SPARC, MIPS, and the RS6000 C compilers) costlyspills to memory would have been used to make the graph 32 colorable. However, in our case weneeded only 4 register moves because the interval graph again provided a natural representationwhich allowed us to avoid these spills.Cyclic Min Max Colors ChameleonIntervals Width WidthRolled Tomcat, 16 regs 0 0 16 16 0Rolled Tomcat, 32 regs 0 5 24 24 0Unrolled Tomcat, 16 regs 5 1 16 16 0Unrolled Tomcat, 32 regs 12 17 32 34 4Rolled Loop 8, 16 regs 0 10 16 16 0Rolled Loop 8, 32 regs 0 11 17 17 0Unrolled Loop 8, 16 regs 0 8 16 16 0Unrolled Loop 8, 32 regs 0 22 32 32 0Table 4: Interval Graph Statistics (after Spilling).The main point to be made from these experiments is that the cyclic interval graphapproach does a good job on complex loops that have high register pressure. This can be seenby the very low number of loads and stores required for all cases, and the use of register oatsinstead of spills on the unrolled tomcat case. This is an absolute observation, and does notdepend on comparing the results to other register allocation strategies.The other point, is that when given the same programs, three production-quality com-pilers produce substantially worse spill code for these challenging examples. Slight variationsamong these three compilers might be due to slightly di�erent low-level optimizations or in-struction scheduling. However, the main point is that all of them performed signi�cantly worsethan the interval graph approach.This evidence indicates that further work on the cyclic interval graph approach is worthwhile, and that further tests will show the kinds of programs for which the cyclic interval graphmethod is superior. 28
7 Related WorkIn this section, we present a survey of work related to register allocation, graph coloring and,interval graphs.In a number of recent publications, researchers have been trying to improve Chaitin'smethod for register allocation. Briggs et. al. recognized the fact that Chaitin's original heuristicis not guaranteed to �nd the minimum coloring [6]. They proposed a di�erent heuristic methodwhich simpli�es the coloring phase by separating it from the spilling phase. That is, when thegraph has been reduced to the stage where all remaining nodes have a degree greater or equalto k, it does not stop and spill. The algorithm continues the coloring process by selecting oneremaining node to reduce the graph according to some heuristics. At the end of the reductionphase, the nodes are processed in the reverse order and are assigned colors. It is possible thatduring this process, a node with a degree greater or equal to k can still be colored, since morethan one neighbor may have been allocated the same color. This method is based on interferencegraphs, and the coloring and spilling process may be iterated several times. Nonetheless, byavoiding some pointless spilling, improved code was generated for a number of test programs.Bernstein et. al. have introduced a collection of heuristics which reduces the likelihood ofexcessive spill code generation [14]. The width, which is the number of live ranges at a certainpoint in the program, is used to compute the spill cost of a variable. The width coupled withthe depth (of loop nesting) form the basis of their area-based heuristics. This method employsthe interference graph as the basic representation of the program, and may require the graphto be rebuilt after spill code is introduced.Callahan, Carr and Kennedy studied register allocation methods for subscripted variables,which poses a problem for many compilers. According to their method, array references whichare live across several iterations are recognized and a source-to-source transformation calledscalar replacement is performed so that they can be handled by coloring-based register alloca-tors. Register moves are introduced to transfer values of subscripted variables across iterations,thus eliminating some load and store operations. However, the introduction of register moves,and the subsequent processing of register allocation seem to be orthogonal, and there exists nosingle uni�ed framework for this optimization problem.Another approach to the problem of register allocation for scalar and subscripted variableshas been suggested by Duesterwald, Gupta, and So�a [18]. This method uses the integratedregister allocation graph, which is an extension of the interference graph, to represent the color-ing problem for both scalars and subscripted variables. The subscripted variables are allocateda set of registers that form a register pipeline.Eisenbeis et.al.proposed a method based on cyclic scheduling for optimizing register usageon the Cray-2 [19].Interprocedural register allocation has been studied by a number of people [20, 10, 21].For example, Steenkiste and Hennessy have developed an algorithm for interprocedural register29
allocation where a procedure interference graph is constructed. Each node in the graph is aprocedure of the program. Two procedures which are active at the same time are adjacent inthe procedure interference graph. Each node of the graph is assigned a number of color thatequals the number of registers needed by the local variables of the procedure. This numberis determined by an intraprocedural-procedure allocation phase. A coloring algorithm assignsdi�erent colors to adjacent nodes of the procedure interference graph. Therefore, it is evidentthat a good solution for the minimum register allocation problem (as described in Problem 1of Section 2) is important for the intraprocedural allocation phase.Cytron and Ferrante have proposed a method of storage allocation where the amountof storage needed is equal to the maximum number of simultaneously live variables in theoriginal program [22]. The objective of their work is to allocate storage for temporary variablesby renaming, which is a compiler technique that transforms imperative programs to data owgraphs [23, 24]. They have pointed out that the formulation of the register allocation problemas a graph coloring problem based on the traditional interference graph may abstract awayvital information present in the original program (like the width of interval graph), which theirmethod uses to guide the register allocator to achieve an optimal solution e�ciently. Onedi�erence between their work and the work proposed in this paper lies in the treatment of loopvariables. For example, a scalar variable de�ned in a loop, is either changed into an array byscalar expansion when the loop bound is known a priori, or it is transformed to a dynamicallyallocated variable when the loop bound is not known statically [22]. In our work, we treatsuch variables using cyclic intervals, thus the overhead of extra arrays or dynamic allocation isavoided.Callahan and Koblenz have presented a register allocation method via hierarchical graphcoloring [15]. The main idea is to represent the hierarchical program structure as a tree oftiles. Tiles are processed �rst in a bottom up fashion and the local interference graph is createdand colored (perhaps with pseudo registers) on a tile by tile basis to capture the local usagepattern. Then a top down walk binds the pseudo registers to physical registers. Spill code is�nally introduced in the less frequently executed portions of the program. Knobe and Zadeckhave also proposed a hierarchical register allocation scheme based on control trees [17]. A pruneprocedure is executed before coloring to reduce the register pressure to a desired threshold valueby storing some values in memory on entry to a program region and then reloading them onexit. The authors claim that after pruning, the coloring process will terminate if the thresholdvalue is set properly. A live range may need to be split during the coloring process. The coloringalgorithms of both the hierarchical methods described above accept Chaitan's interference graphas their input.Gupta et. al. reported their work in the area of global register allocation using cliqueseparators [16]. A clique separator is a completely connected subgraph. When it is removedfrom the graph, it disconnects the graph into at least two subgraphs. Their algorithm �rstpartitions the code into code segments using clique separators. Each code segment is coloredseparately using the interference graph coloring method. Then, the colored subgraphs are30
combined by the global register allocator. In the presence of branching, the combining processmay introduce register copying at the point where di�erent control ow paths merge.As we pointed out before, our problems are related to the class of circular-arc graphcoloring problems [11, 12]. The idea of using interval graphs for register allocation goes backover 15 years. Tucker was one of the �rst to note the advantages of the representation [7, 8].He also noted that the related concept of circular arc graphs could be applied to programloops. Interval graphs have also been used to overlay arrays and thereby minimize programmemory requirements [25], and to perform channel routing in VLSI layouts [26, 27]. However,the practical use of interval graphs in register allocation appears to have been largely ignoredbecause of perceived di�culties in dealing both with circular arc graphs and hierarchical intervalgraphs, both of which arise when dealing with real programs [14]. A great deal of theoreticalwork has been done, a good summary of which may be found in [28, 29].Using circular arc graphs for register allocation has recently been proposed in high-leveldata ow synthesis for digital systems [30, 31, 32]. In this application domain, the computationis represented by data ow graphs. Data ow graphs with loops can be modeled by cyclicdata ow graphs [33, 34], and the corresponding register allocation problem can be modeled bycircular arc graphs [34]. Unlike in compiler optimization, the hardware-oriented synthesis worktraditionally does not address the issue of code spilling.A recent application of the work described in this paper is the use of cyclic intervalgraph representation in a uni�ed framework of loop scheduling and register allocation [9]. Infact, lifetime intervals can naturally be derived from an instruction schedule, and the registerallocation scheme developed in this paper can be utilized e�ectively in the scheduling framework.Finally, let us reiterate our view of the relation between this work and the other relatedwork in register allocation. We believe that our approach based on interval graphs appearwell suited to certain structured programs, and in particular large inner-loops and loop nests.However, for less structured programs, perhaps the interference graph is the best representation.We expect that these two representations can complement each other in a compiler, and furtherexperiments are clearly required to determine how to combine them in a most e�ective fashion.We are currently implementing a combined approach in our McCAT compiler.8 Conclusions and Future WorkIn this paper we have presented a new approach to register allocation that is based on a hi-erarchical cyclic interval graph representation. Our representation can e�ectively characterizethe overlap between live ranges of variables at di�erent times in a program execution. Further-more, we have demonstrated how the additional information in such a representation is usefulin coloring and spilling algorithms. We believe our method is particularly suitable to handlestructured program segments such as structured loops and conditionals.31
Based on our interval graph framework, we have presented two approaches to the mini-mal coloring problem based on the notion of a fat-cover. In addition, we have presented a newapproach to the k-coloring problem. Our approach introduces the notion of chameleon intervalsand, register oats which help avoid expensive register spills by introducing less expensive regis-ter moves. We presented a new sweep-and-split algorithm that is used to transform graphs thatare not k-colorable into graphs that are guaranteed to be k-colorable. This transformation min-imizes spills by using a powerful heuristic that is guided by information available in the intervalgraph representation, but is not available in the traditional interference graph representation.In addition to illustrating how these algorithms work on inner loops, we have also shownhow the cyclic interval graph representation can be extended to accurately capture the registerallocation constraints in programs with nested loops and conditionals.We have implemented our spilling algorithm and applied it to a collection of challengingloops. By comparing our results to those produced by the MIPS, SPARC, and R6000 productioncompilers, we have demonstrated that the cyclic interval graph representation, combined withour new algorithms, produces very encouraging results.Based on our experimental coloring testbed and our prototype spilling program, ourregister allocation framework is being integrated into the low-level structured intermediate rep-resentation supported by the McCAT compiler [35]. In addition to this implementation e�ort,we are continuing to exploit the extra information available from the interval graph represen-tation. For example, one potential use of such information is the combination of instructionscheduling and register allocation.AcknowledgementsWe would like to thank all of the referees for their insightful comments that helped to improvethe presentation of our ideas. We would also like to acknowledge the suggestion from one refereewho pointed out a natural improvement to the hybrid coloring scheme in which the interferencephases and fat cover phases alternate.References[1] John L. Hennessy and David A. Patterson. Computer Architecture: A Quantitative Ap-proach. Morgan Kaufmann Publishers, Inc., 1990.[2] John L. Hennessy and Norman P. Jouppi. Computer technology and architecture: Anevolving interaction. Computer, 24(9):18{29, September 1991.[3] G. J. Chaitin, M. A. Auslander, A. K. Chandra, J. Cocke, M. E. Hopkins, and P. W.Markstein. Register allocation via coloring. Computer Languages, 6:47{57, January 1981.32
[4] G. J. Chaitin. Register allocation & spilling via graph coloring. In Proceedings of the SIG-PLAN '82 Symposium on Compiler Construction, pages 98{105, Boston, Massachusetts,June 23{25, 1982. ACM SIGPLAN. SIGPLAN Notices, 17(6), June 1982.[5] Frederick Chow and John Hennessy. Register allocation by priority-based coloring. InProceedings of the SIGPLAN '84 Symposium on Compiler Construction, pages 222{232,Montr�eal, Qu�ebec, June 17{22, 1984. ACM SIGPLAN. SIGPLAN Notices, 19(6), June1984.[6] Preston Briggs, Keith D. Cooper, Ken Kennedy, and Linda Torczon. Coloring heuristicsfor register allocation. In Proceedings of the SIGPLAN '89 Conference on ProgrammingLanguage Design and Implementation, pages 275{284, Portland, Oregon, June 21{23, 1989.SIGPLAN Notices, 24(7), July 1989.[7] Alan Tucker. Coloring a family of circular arcs. SIAM Journal on Applied Mathematics,29(3):493{502, November 1975.[8] Alan Tucker. Applied Combinatorics. John Wiley & Sons, Inc., 2nd edition, 1984.[9] Q. Ning and G. R. Gao. A novel framework of register allocation for software pipelining.In Conference Record of the Twentieth Annual ACM SIGPLAN-SIGACT Symposium onPrinciples of Programming Languages, pages 29{42, Charleston, South Carolina, January10{13, 1993.[10] Peter A. Steenkiste and John L. Hennessy. A simple interprocedural register allocationalgorithm and its e�ectiveness for LISP. ACM Transactions on Programming Languagesand Systems, 11(1):1{32, January 1989.[11] V. Klee. What are the intersection graphs of arcs in a circle? American MathematicsMonthly, 76:810{813, 1969.[12] M. R. Garey, D. S. Johnson, G. L. Miller, and C. H. Papadimitriou. The complexityof coloring circular arcs and chords. SIAM Journal on Algebraic and Discrete Methods,1(2):216{227, June 1980.[13] Fred C. Chow and John L. Hennessy. The priority-based coloring approach to registerallocation. ACM Transactions on Programming Languages and Systems, 12(4):501{536,October 1990.[14] David Bernstein, Dina Q. Goldin, Martin C. Golumbic, Hugo Krawczyk, Yishay Man-sour, Itai Nahshon, and Ron Y. Pinter. Spill code minimization techniques for optimizingcompilers. In Proceedings of the SIGPLAN '89 Conference on Programming Language De-sign and Implementation, pages 258{263, Portland, Oregon, June 21{23, 1989. SIGPLANNotices, 24(7), July 1989. 33
[15] David Callahan and Brian Koblenz. Register allocation via hierarchical graph coloring. InProceedings of the ACM SIGPLAN '91 Conference on Programming Language Design andImplementation, pages 192{203, Toronto, Ontario, June 26{28, 1991. SIGPLAN Notices,26(6), June 1991.[16] Rajiv Gupta, Mary Lou So�a, and Tim Steele. Register allocation via clique separators.In Proceedings of the SIGPLAN '89 Conference on Programming Language Design andImplementation, pages 264{274, Portland, Oregon, June 21{23, 1989. SIGPLAN Notices,24(7), July 1989.[17] Kathleen Knobe and Kenneth Zadeck. Register allocation using control trees. TechnicalReport CS-92-13, Department of Computer Science, Brown University, March 1992.[18] Evelyn Duesterwald, Rajiv Gupta, and Mary Lou So�a. Register pipelining: An inte-grated approach to register allocation for scalar and subscripted variables. In U. Kastensand P. Pfahler, editors, Proceedings of the 4th International Conference on Compiler Con-struction, CC '92, number 641 in Lecture Notes in Computer Science, pages 192{206,Paderborn, Germany, October 5{7, 1992. Springer-Verlag.[19] Christine Eisenbeis, William Jalby, and Alain Lichnewsky. Compiler techniques for opti-mizing memory and register usage on the CRAY2. International Journal on High SpeedComputing, 2(2):193{222, 1990. Also published as INRIA Research Report 1302, October1990.[20] Fred C. Chow. Minimizing register usage penalty at procedure calls. In Proceedings of theSIGPLAN '88 Conference on Programming Language Design and Implementation, pages85{94, Atlanta, Georgia, June 22{24, 1988. SIGPLAN Notices, 23(7), July 1988.[21] George S. Taylor, Paul N. Hil�nger, James R. Larus, David A. Patterson, and Benjamin G.Zorn. Evaluation of the SPUR Lisp architecture. In Proceedings of the 13th AnnualInternational Symposium on Computer Architecture, pages 444{452, Tokyo, Japan, June2{5, 1986. IEEE Computer Society and ACM SIGARCH. Computer Architecture News,14(2), June 1986.[22] Ron Cytron and Jeanne Ferrante. What's in a name? or the value of renaming forparallelism detection and storage allocation. In Proceedings of the 1987 InternationalConference on Parallel Processing, pages 19{27, St. Charles, Illinois, August 17{21, 1987.[23] D. J. Kuck, R. H. Kuhn, D. A. Padua, B. Leasure, and M. Wolfe. Dependence graphsand compiler optimizations. In Conference Record of the Eighth Annual ACM Symposiumon Principles of Programming Languages, pages 207{218, Williamsburg, Virginia, January26{28, 1981. ACM SIGACT and SIGPLAN.[24] Jack B. Dennis. Data ow supercomputers. Computer, 13(11):48{56, November 1980.[25] J. Fabri. Automatic Storage Optimization. PhD thesis, University of Michigan, 1982.34
[26] Michael Burstein. Channel routing. In T. Ohtsuki, editor, Layout Design and Veri�ca-tion, volume 4 of Advances in CAD for VLSI, pages 133{167. North-Holland PublishingCompany, Amsterdam, 1986.[27] Ido Dagan, Martin Charles Golumbic, and Ron Yair Pinter. Trapezoid graphs and theircoloring. Discrete Applied Mathematics, 21(1):35{46, September 1988.[28] Martin Charles Golumbic. Interval graphs and related topics. Discrete Mathematics,55(2):113{121, 1985.[29] Wei-Kuan Shih and Wen-Lian Hsu. An O(n1:5) algorithm to color proper circular arcs.Discrete Applied Mathematics, 25(3):321{323, November 1989.[30] C. J. Tseng and D. P. Siewiorek. Automated synthesis of data paths in digital systems.IEEE Transactions on Computer Aided Design, 5(3), July 1986.[31] Fadi J. Kurdahi and Alice C. Parker. REAL: A program for REgister ALlocation. InProceedings of the 24th ACM/IEEE Design Automation Conference, pages 210{215, MiamiBeach, Florida, June 28{July 1, 1987.[32] L. Stok and R. van den Born. Synthesis of concurrent hardware structures. In Proceedingsof the International Symposium on Circuits and Systems, pages 2756{2760, June 1988.[33] Pierre G. Paulin and John P Knight. Scheduling and binding algorithms for high-levelsynthesis. In Proceedings of the 26th ACM/IEEE Design Automation Conference, pages1{6, Las Vegas, Nevada, June 25{29, 1989.[34] L. Stok. Transfer free register allocation in cyclic data ow graphs. In Proceedings of theEuropean Conference on Design Automation, pages 181{186, Brussels, March 1992.[35] L. Hendren, C. Donawa, M. Emami, G. Gao, Justiani, and B. Sridharan. Designing theMcCAT compiler based on a family of structured intermediate representations. In UptalBanerjee, David Gelernter, Alex Nicolau, and David Padua, editors, Proceedings of the 5thInternational Workshop on Languages and Compilers for Parallel Computing, number 757in Lecture Notes in Computer Science, pages 406{420, New Haven, Connecticut, August3{5, 1992. Springer-Verlag. Published in 1993.35