a profile of us importing and exporting companies, 2019-2020
TRANSCRIPT
Data Inquiries Media Inquiries U.S. Census Bureau U.S. Census Bureau Economic Indicators Division, International Trade Public Information Office 301-763-3629 301-763-3030
[email protected] [email protected]
FOR RELEASE AT 8:30 AM EDT, TUESDAY, APRIL 5, 2022
A PROFILE OF U.S. IMPORTING AND EXPORTING COMPANIES, 2019-2020
Release Number: CB22-57
The U.S. Census Bureau, Department of Commerce, releases the report, A Profile of U.S. Importing and Exporting Companies,
2019 - 2020. This report provides information on identified U.S. companies and their known export or import value. Identified
companies are enterprise-level companies that were successfully linked from the 2020 Census Business Register to import or
export transaction records. The known export or import value is the dollar-value of export or import transactions linked to
these identified companies. Using the information from the Census Business Register, this report details trade data by various
company characteristics of U.S. exporting and importing companies. For the full report or to view the explanatory notes on
how these statistics are gathered and compiled, go to International Trade - Profile of U.S. Importing and Exporting Companies
(census.gov).
Exports
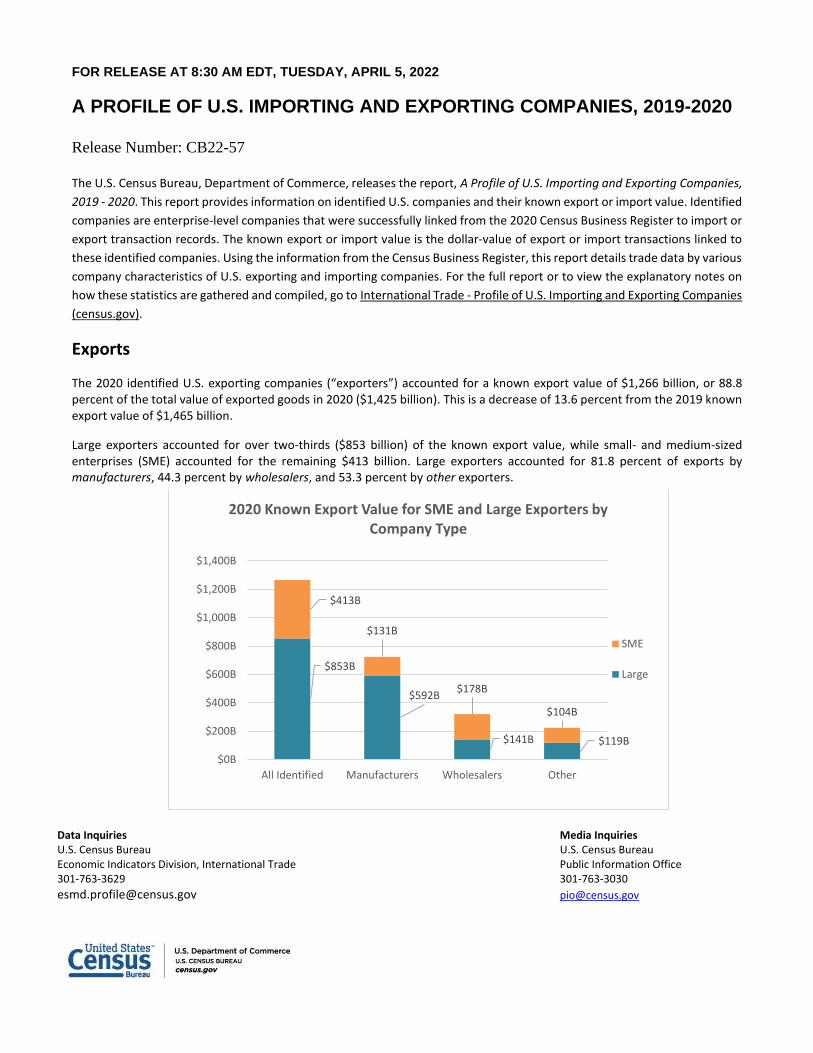
The 2020 identified U.S. exporting companies (“exporters”) accounted for a known export value of $1,266 billion, or 88.8 percent of the total value of exported goods in 2020 ($1,425 billion). This is a decrease of 13.6 percent from the 2019 known export value of $1,465 billion.
Large exporters accounted for over two-thirds ($853 billion) of the known export value, while small- and medium-sized enterprises (SME) accounted for the remaining $413 billion. Large exporters accounted for 81.8 percent of exports by manufacturers, 44.3 percent by wholesalers, and 53.3 percent by other exporters.
$853B
$592B
$141B $119B
$413B
$131B
$178B
$104B
$0B
$200B
$400B
$600B
$800B
$1,000B
$1,200B
$1,400B
All Identified Manufacturers Wholesalers Other
2020 Known Export Value for SME and Large Exporters by Company Type
SME
Large
2
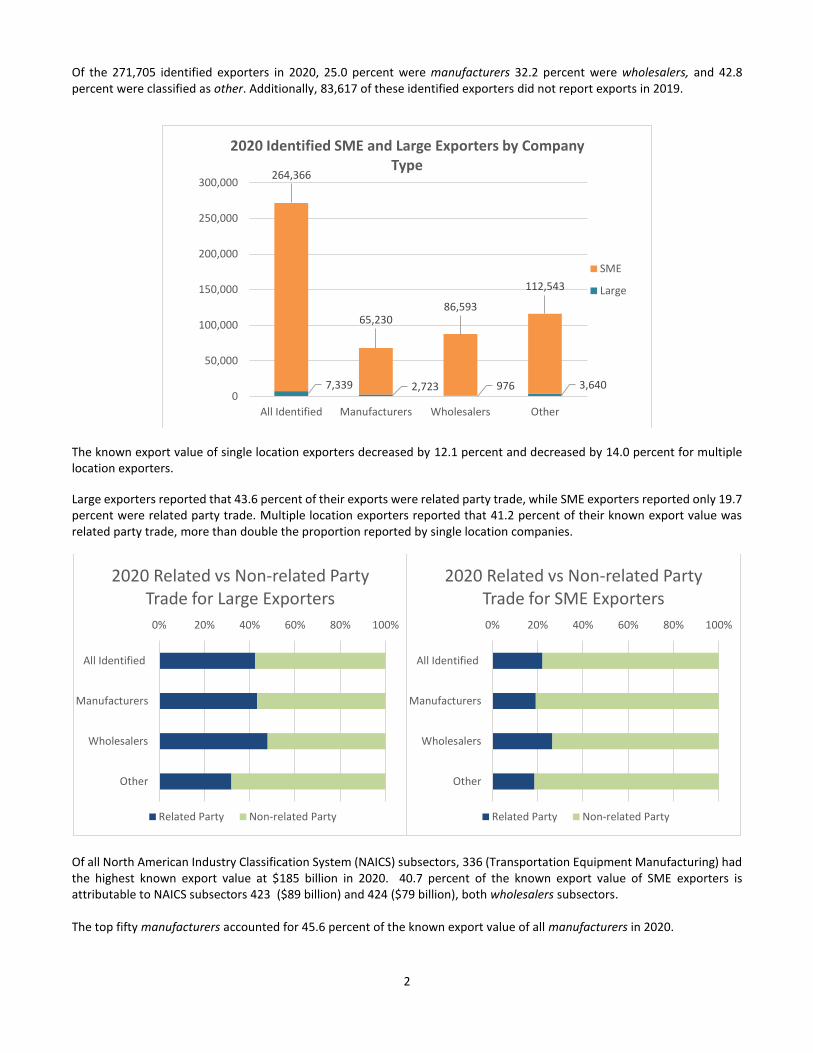
Of the 271,705 identified exporters in 2020, 25.0 percent were manufacturers 32.2 percent were wholesalers, and 42.8 percent were classified as other. Additionally, 83,617 of these identified exporters did not report exports in 2019.
The known export value of single location exporters decreased by 12.1 percent and decreased by 14.0 percent for multiple location exporters.
Large exporters reported that 43.6 percent of their exports were related party trade, while SME exporters reported only 19.7 percent were related party trade. Multiple location exporters reported that 41.2 percent of their known export value was related party trade, more than double the proportion reported by single location companies.
Of all North American Industry Classification System (NAICS) subsectors, 336 (Transportation Equipment Manufacturing) had the highest known export value at $185 billion in 2020. 40.7 percent of the known export value of SME exporters is attributable to NAICS subsectors 423 ($89 billion) and 424 ($79 billion), both wholesalers subsectors. The top fifty manufacturers accounted for 45.6 percent of the known export value of all manufacturers in 2020.
7,339 2,723 976 3,640
264,366
65,23086,593
112,543
0
50,000
100,000
150,000
200,000
250,000
300,000
All Identified Manufacturers Wholesalers Other
2020 Identified SME and Large Exporters by Company Type
SME
Large
0% 20% 40% 60% 80% 100%
All Identified
Manufacturers
Wholesalers
Other
2020 Related vs Non-related Party Trade for Large Exporters
Related Party Non-related Party
0% 20% 40% 60% 80% 100%
All Identified
Manufacturers
Wholesalers
Other
2020 Related vs Non-related Party Trade for SME Exporters
Related Party Non-related Party

3
In 2020, 59.4 percent of exporters reported exporting to only one country, and accounted for 5.4 percent of the known export value. Only 1.5 percent of exporters reported exporting to 25 or more countries but accounted for 68.8 percent of the known export value.
Nearly one-quarter (23.3 percent) of identified exporters reported exports from California (11.5 percent of the known export value), while 14.0 percent of identified exporters reported exports from Texas, which accounted for the largest portion of the known export value at 19.8 percent. California and Florida continue to have the largest number of SME exporters reporting exports, with a combined 39.5 percent of SME exporters reporting exports from these two states.
(1) Top five states determined by known export value.
0%
10%
20%
30%
40%
50%
60%
70%
1 country 2-4 countries 5-9 countries 10-24 countries 25-49 countries 50+ countries
Percent of 2020 Known Export Value within Company Typeby Number of Partner Countries
All Identified Companies Manufacturers Wholesalers Other Companies
$0B $50B $100B $150B $200B $250B $300B
Texas
California
New York
Louisiana
Illinois
Large SME
2020 Known Export Value by Large and SME Exporters by Top Five States (1)
0K 10K 20K 30K 40K 50K 60K 70K 80K
Texas
California
New York
Louisiana
Illinois
2020 Number of Large and SME Exporters by Top Five States (1)
Large SME
4
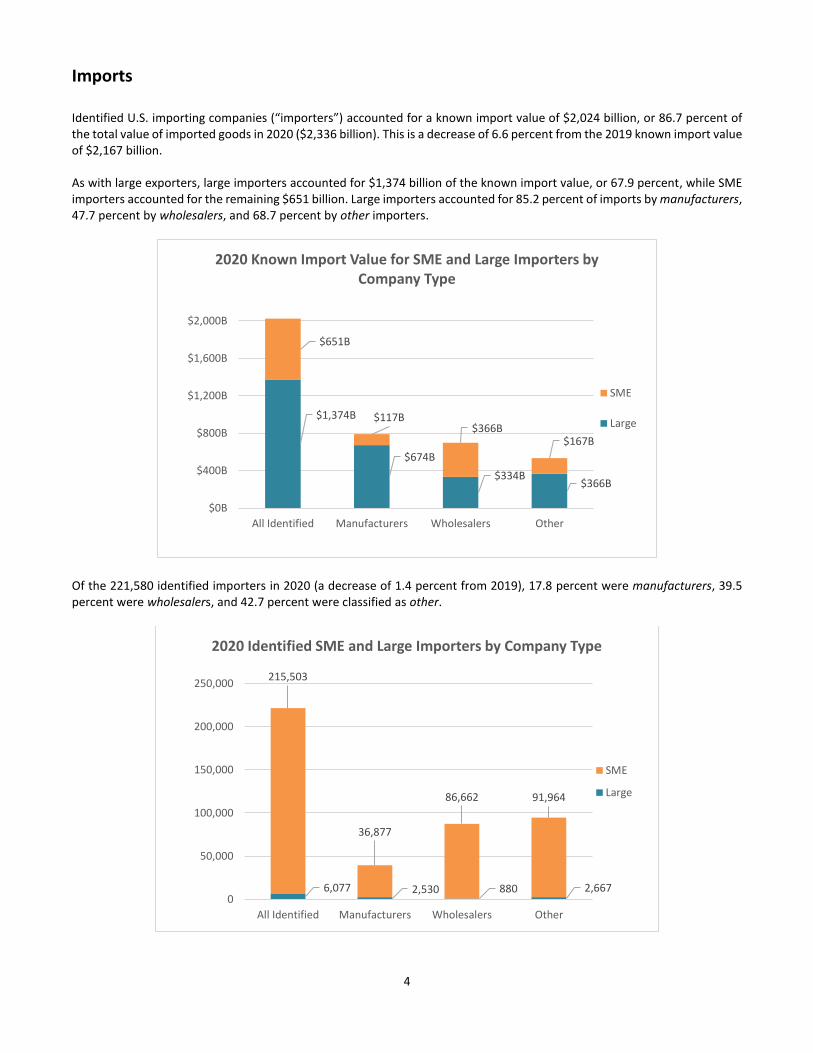
Imports Identified U.S. importing companies (“importers”) accounted for a known import value of $2,024 billion, or 86.7 percent of the total value of imported goods in 2020 ($2,336 billion). This is a decrease of 6.6 percent from the 2019 known import value of $2,167 billion. As with large exporters, large importers accounted for $1,374 billion of the known import value, or 67.9 percent, while SME importers accounted for the remaining $651 billion. Large importers accounted for 85.2 percent of imports by manufacturers, 47.7 percent by wholesalers, and 68.7 percent by other importers.
Of the 221,580 identified importers in 2020 (a decrease of 1.4 percent from 2019), 17.8 percent were manufacturers, 39.5 percent were wholesalers, and 42.7 percent were classified as other.
$1,374B
$674B
$334B$366B
$651B
$117B$366B
$167B
$0B
$400B
$800B
$1,200B
$1,600B
$2,000B
All Identified Manufacturers Wholesalers Other
2020 Known Import Value for SME and Large Importers by Company Type
SME
Large
6,077 2,530 880 2,667
215,503
36,877
86,662 91,964
0
50,000
100,000
150,000
200,000
250,000
All Identified Manufacturers Wholesalers Other
2020 Identified SME and Large Importers by Company Type
SME
Large
5
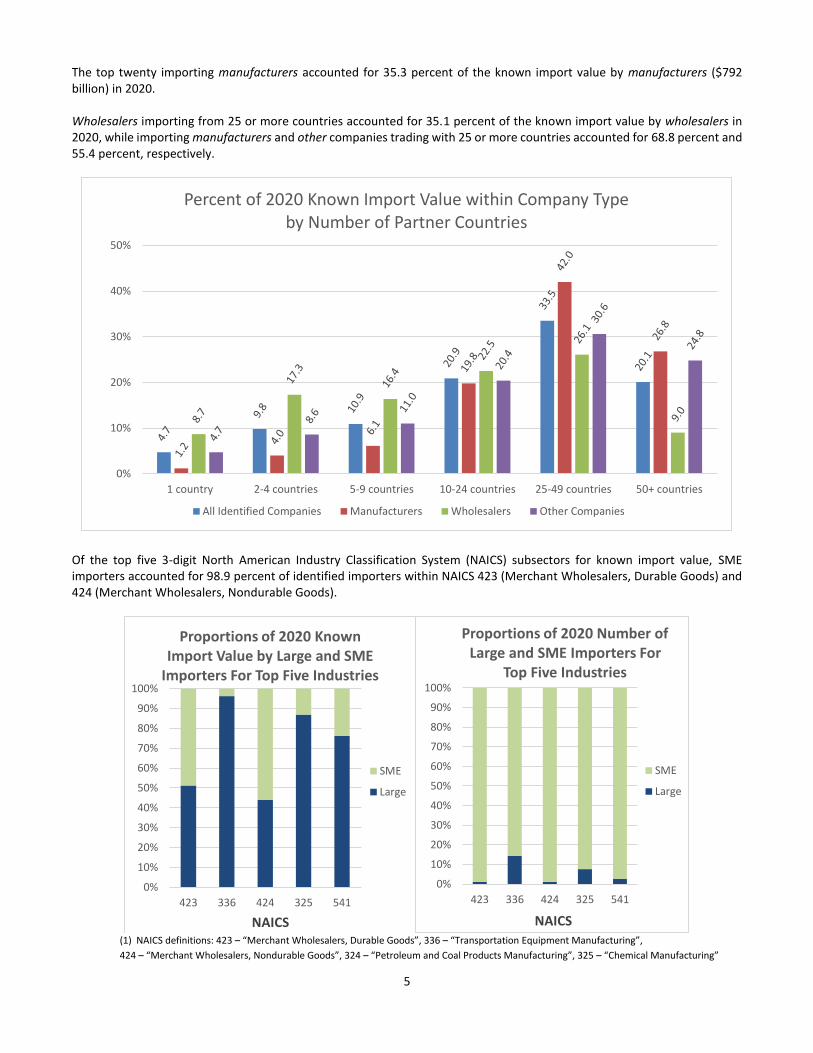
The top twenty importing manufacturers accounted for 35.3 percent of the known import value by manufacturers ($792 billion) in 2020. Wholesalers importing from 25 or more countries accounted for 35.1 percent of the known import value by wholesalers in 2020, while importing manufacturers and other companies trading with 25 or more countries accounted for 68.8 percent and 55.4 percent, respectively.
Of the top five 3-digit North American Industry Classification System (NAICS) subsectors for known import value, SME importers accounted for 98.9 percent of identified importers within NAICS 423 (Merchant Wholesalers, Durable Goods) and 424 (Merchant Wholesalers, Nondurable Goods).
(1) NAICS definitions: 423 – “Merchant Wholesalers, Durable Goods”, 336 – “Transportation Equipment Manufacturing”,
424 – “Merchant Wholesalers, Nondurable Goods”, 324 – “Petroleum and Coal Products Manufacturing”, 325 – “Chemical Manufacturing”
0%
10%
20%
30%
40%
50%
1 country 2-4 countries 5-9 countries 10-24 countries 25-49 countries 50+ countries
Percent of 2020 Known Import Value within Company Typeby Number of Partner Countries
All Identified Companies Manufacturers Wholesalers Other Companies
0%
10%
20%
30%
40%
50%
60%
70%
80%
90%
100%
423 336 424 325 541
Proportions of 2020 Known Import Value by Large and SME
Importers For Top Five Industries
SME
Large
NAICS
0%
10%
20%
30%
40%
50%
60%
70%
80%
90%
100%
423 336 424 325 541
Proportions of 2020 Number of Large and SME Importers For
Top Five Industries
SME
Large
NAICS
6
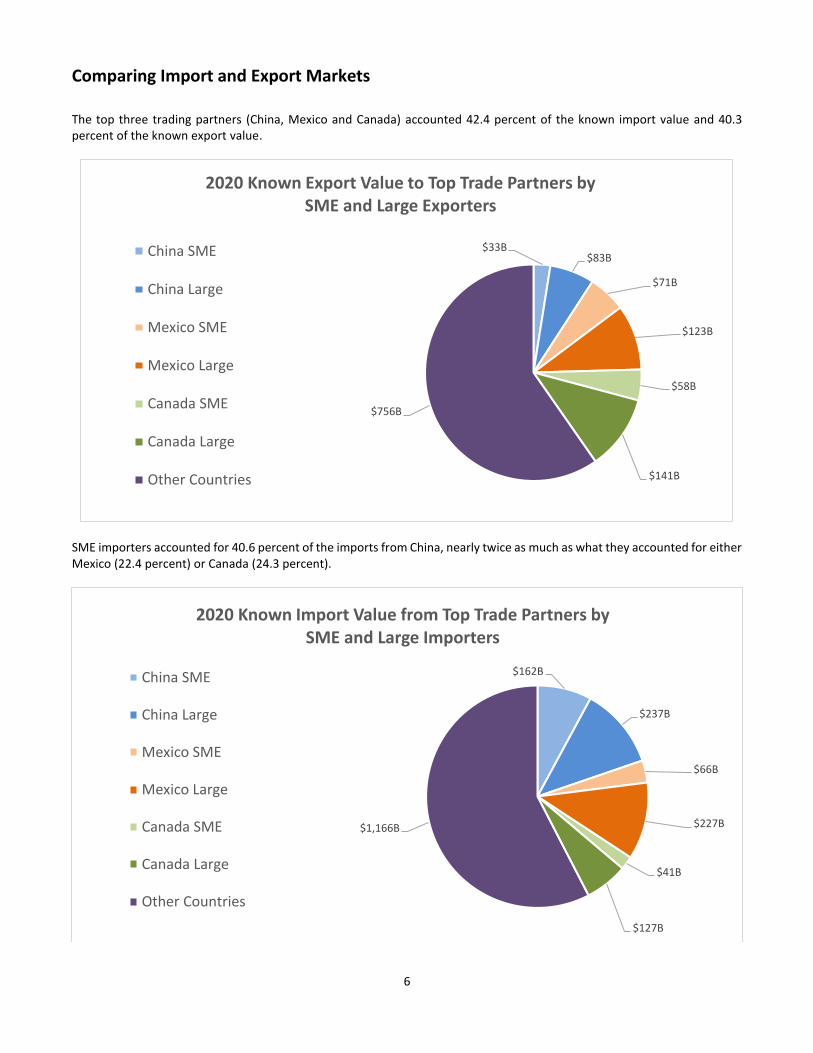
Comparing Import and Export Markets
The top three trading partners (China, Mexico and Canada) accounted 42.4 percent of the known import value and 40.3 percent of the known export value.
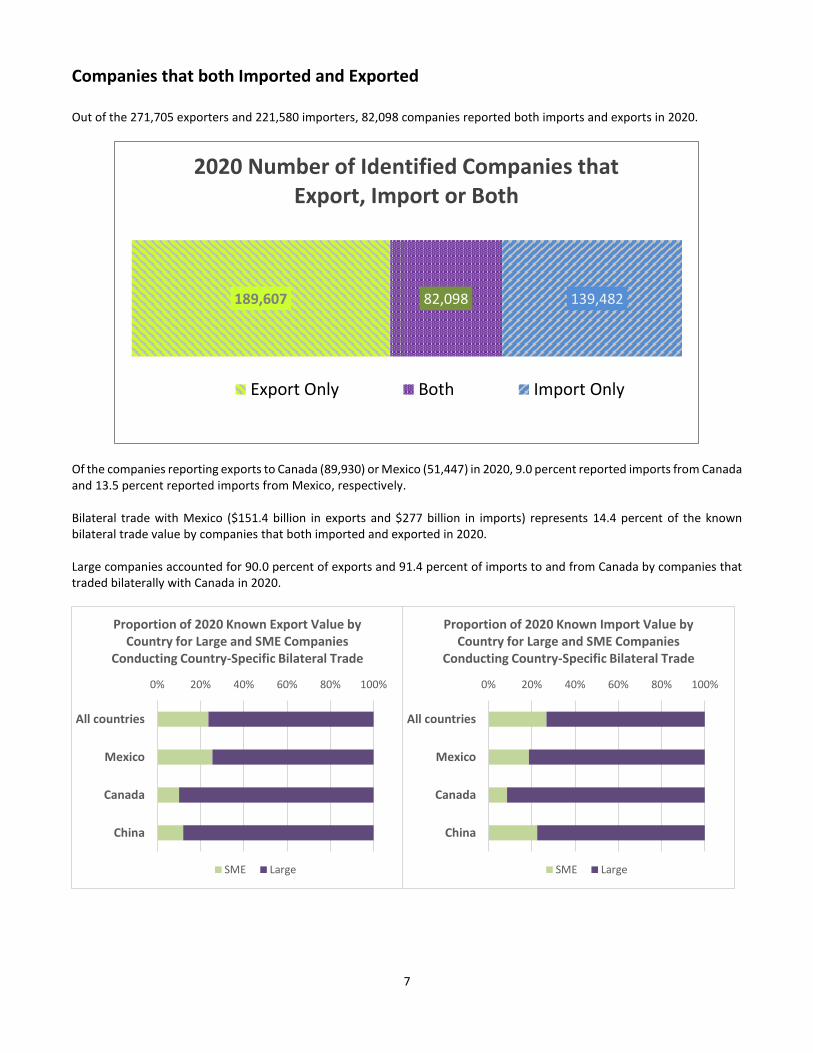
SME importers accounted for 40.6 percent of the imports from China, nearly twice as much as what they accounted for either Mexico (22.4 percent) or Canada (24.3 percent).
$33B$83B
$71B
$123B
$58B
$141B
$756B
2020 Known Export Value to Top Trade Partners bySME and Large Exporters
China SME
China Large
Mexico SME
Mexico Large
Canada SME
Canada Large
Other Countries
$162B
$237B
$66B
$227B
$41B
$127B
$1,166B
2020 Known Import Value from Top Trade Partners bySME and Large Importers
China SME
China Large
Mexico SME
Mexico Large
Canada SME
Canada Large
Other Countries
7
Companies that both Imported and Exported
Out of the 271,705 exporters and 221,580 importers, 82,098 companies reported both imports and exports in 2020.
Of the companies reporting exports to Canada (89,930) or Mexico (51,447) in 2020, 9.0 percent reported imports from Canada and 13.5 percent reported imports from Mexico, respectively.
Bilateral trade with Mexico ($151.4 billion in exports and $277 billion in imports) represents 14.4 percent of the known bilateral trade value by companies that both imported and exported in 2020.
Large companies accounted for 90.0 percent of exports and 91.4 percent of imports to and from Canada by companies that traded bilaterally with Canada in 2020.
189,607 82,098 139,482
2020 Number of Identified Companies that Export, Import or Both
Export Only Both Import Only
0% 20% 40% 60% 80% 100%
All countries
Mexico
Canada
China
Proportion of 2020 Known Export Value by Country for Large and SME Companies
Conducting Country-Specific Bilateral Trade
SME Large
0% 20% 40% 60% 80% 100%
All countries
Mexico
Canada
China
Proportion of 2020 Known Import Value by Country for Large and SME Companies
Conducting Country-Specific Bilateral Trade
SME Large

8
Table 1 – Summary of 2019-2020 Matching Results
Table 1: Distribution of Exports and Imports by Identified and Unidentified Companies (Value in millions of dollars. Details may not sum to total due to rounding.) 2020 Value % of 2020 Value 2019 Value % of 2019 Value
TOTAL EXPORTS 1,424,935 100.0 1,643,161 100.0
Low-value estimates 32,569 2.3 36,114 2.2
US & foreign governments 15 <0.1 46 <0.1
Identified exporters* (known value) 1,265,900 88.8 1,464,623 89.1
Exported merchandise in
both 2019 and 2020 1,239,130 87.0 1,428,098 86.9
Exported merchandise in
only 2019 or only 2020 26,770 1.9 35,837 2.2
Unidentified exports 126,450 8.9 142,378 8.7
Total Imports 2,335,991 100.0 2,497,531 100.0
Low-value estimates 17,477 0.7 18,827 0.8
Articles exported and returned, not
advanced or improved in condition 77,775 3.3 86,459 3.5
Identified importers* (known value) 2,024,454 86.7 2,167,073 86.8
Imported merchandise in
both 2019 and 2020 1,967,674 84.2 2,124,180 85.1
Imported merchandise in
only 2019 or only 2020 56,780 2.4 42,893 1.7
Unidentified imports /1 216,285 9.3 225,172 9.0
*Number of Identified Companies 2020 2019 Both Years 2020 Only 2019 Only
Exporters 271,705 289,372 188,088 83,617 100,925
Importers 221,580 224,699 154,928 66,652 69,771
* Note: Percentages may not add up to 100.0 percent due to rounding
/1 Includes Canadian electricity and natural gas imports
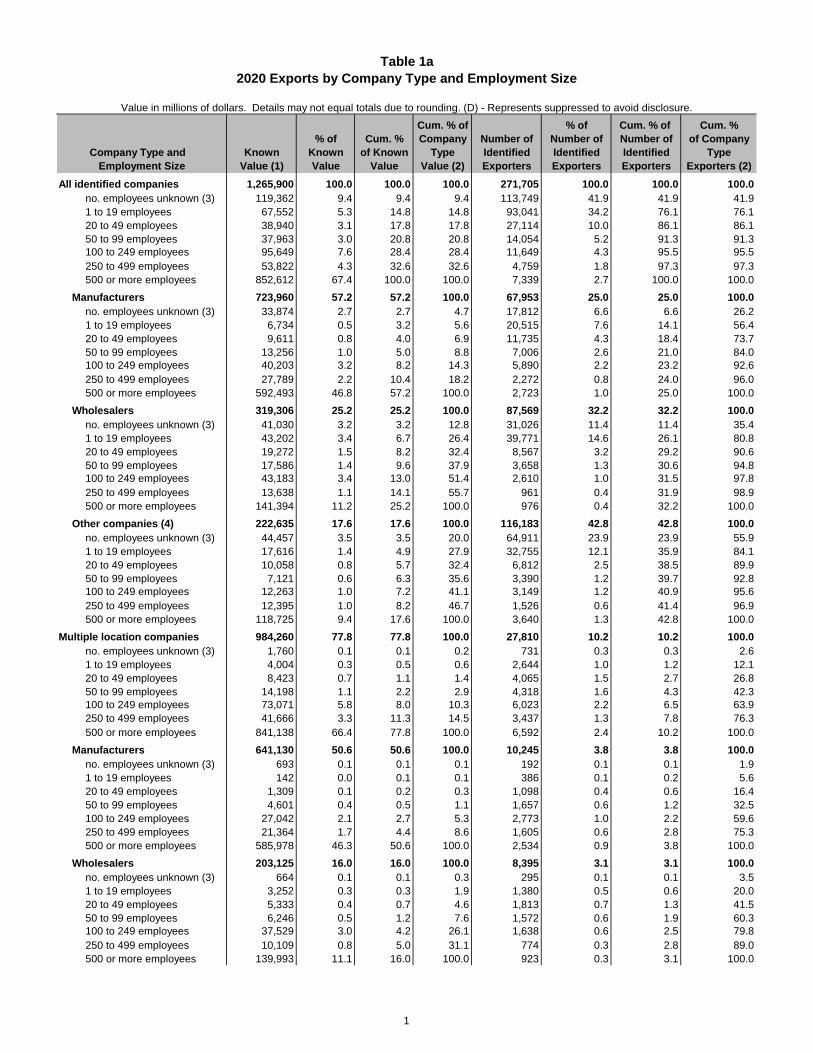
Table 1a
2020 Exports by Company Type and Employment Size
Value in millions of dollars. Details may not equal totals due to rounding. (D) - Represents suppressed to avoid disclosure.
Cum. % of % of Cum. % of Cum. %
% of Cum. % Company Number of Number of Number of of Company
Company Type and Known Known of Known Type Identified Identified Identified Type
Employment Size Value (1) Value Value Value (2) Exporters Exporters Exporters Exporters (2)
All identified companies 1,265,900 100.0 100.0 100.0 271,705 100.0 100.0 100.0
no. employees unknown (3) 119,362 9.4 9.4 9.4 113,749 41.9 41.9 41.9
1 to 19 employees 67,552 5.3 14.8 14.8 93,041 34.2 76.1 76.1
20 to 49 employees 38,940 3.1 17.8 17.8 27,114 10.0 86.1 86.1
50 to 99 employees 37,963 3.0 20.8 20.8 14,054 5.2 91.3 91.3
100 to 249 employees 95,649 7.6 28.4 28.4 11,649 4.3 95.5 95.5
250 to 499 employees 53,822 4.3 32.6 32.6 4,759 1.8 97.3 97.3
500 or more employees 852,612 67.4 100.0 100.0 7,339 2.7 100.0 100.0
Manufacturers 723,960 57.2 57.2 100.0 67,953 25.0 25.0 100.0
no. employees unknown (3) 33,874 2.7 2.7 4.7 17,812 6.6 6.6 26.2
1 to 19 employees 6,734 0.5 3.2 5.6 20,515 7.6 14.1 56.4
20 to 49 employees 9,611 0.8 4.0 6.9 11,735 4.3 18.4 73.7
50 to 99 employees 13,256 1.0 5.0 8.8 7,006 2.6 21.0 84.0
100 to 249 employees 40,203 3.2 8.2 14.3 5,890 2.2 23.2 92.6
250 to 499 employees 27,789 2.2 10.4 18.2 2,272 0.8 24.0 96.0
500 or more employees 592,493 46.8 57.2 100.0 2,723 1.0 25.0 100.0
Wholesalers 319,306 25.2 25.2 100.0 87,569 32.2 32.2 100.0
no. employees unknown (3) 41,030 3.2 3.2 12.8 31,026 11.4 11.4 35.4
1 to 19 employees 43,202 3.4 6.7 26.4 39,771 14.6 26.1 80.8
20 to 49 employees 19,272 1.5 8.2 32.4 8,567 3.2 29.2 90.6
50 to 99 employees 17,586 1.4 9.6 37.9 3,658 1.3 30.6 94.8
100 to 249 employees 43,183 3.4 13.0 51.4 2,610 1.0 31.5 97.8
250 to 499 employees 13,638 1.1 14.1 55.7 961 0.4 31.9 98.9
500 or more employees 141,394 11.2 25.2 100.0 976 0.4 32.2 100.0
Other companies (4) 222,635 17.6 17.6 100.0 116,183 42.8 42.8 100.0
no. employees unknown (3) 44,457 3.5 3.5 20.0 64,911 23.9 23.9 55.9
1 to 19 employees 17,616 1.4 4.9 27.9 32,755 12.1 35.9 84.1
20 to 49 employees 10,058 0.8 5.7 32.4 6,812 2.5 38.5 89.9
50 to 99 employees 7,121 0.6 6.3 35.6 3,390 1.2 39.7 92.8
100 to 249 employees 12,263 1.0 7.2 41.1 3,149 1.2 40.9 95.6
250 to 499 employees 12,395 1.0 8.2 46.7 1,526 0.6 41.4 96.9
500 or more employees 118,725 9.4 17.6 100.0 3,640 1.3 42.8 100.0
Multiple location companies 984,260 77.8 77.8 100.0 27,810 10.2 10.2 100.0
no. employees unknown (3) 1,760 0.1 0.1 0.2 731 0.3 0.3 2.6
1 to 19 employees 4,004 0.3 0.5 0.6 2,644 1.0 1.2 12.1
20 to 49 employees 8,423 0.7 1.1 1.4 4,065 1.5 2.7 26.8
50 to 99 employees 14,198 1.1 2.2 2.9 4,318 1.6 4.3 42.3
100 to 249 employees 73,071 5.8 8.0 10.3 6,023 2.2 6.5 63.9
250 to 499 employees 41,666 3.3 11.3 14.5 3,437 1.3 7.8 76.3
500 or more employees 841,138 66.4 77.8 100.0 6,592 2.4 10.2 100.0
Manufacturers 641,130 50.6 50.6 100.0 10,245 3.8 3.8 100.0
no. employees unknown (3) 693 0.1 0.1 0.1 192 0.1 0.1 1.9
1 to 19 employees 142 0.0 0.1 0.1 386 0.1 0.2 5.6
20 to 49 employees 1,309 0.1 0.2 0.3 1,098 0.4 0.6 16.4
50 to 99 employees 4,601 0.4 0.5 1.1 1,657 0.6 1.2 32.5
100 to 249 employees 27,042 2.1 2.7 5.3 2,773 1.0 2.2 59.6
250 to 499 employees 21,364 1.7 4.4 8.6 1,605 0.6 2.8 75.3
500 or more employees 585,978 46.3 50.6 100.0 2,534 0.9 3.8 100.0
Wholesalers 203,125 16.0 16.0 100.0 8,395 3.1 3.1 100.0
no. employees unknown (3) 664 0.1 0.1 0.3 295 0.1 0.1 3.5
1 to 19 employees 3,252 0.3 0.3 1.9 1,380 0.5 0.6 20.0
20 to 49 employees 5,333 0.4 0.7 4.6 1,813 0.7 1.3 41.5
50 to 99 employees 6,246 0.5 1.2 7.6 1,572 0.6 1.9 60.3
100 to 249 employees 37,529 3.0 4.2 26.1 1,638 0.6 2.5 79.8
250 to 499 employees 10,109 0.8 5.0 31.1 774 0.3 2.8 89.0
500 or more employees 139,993 11.1 16.0 100.0 923 0.3 3.1 100.0
1
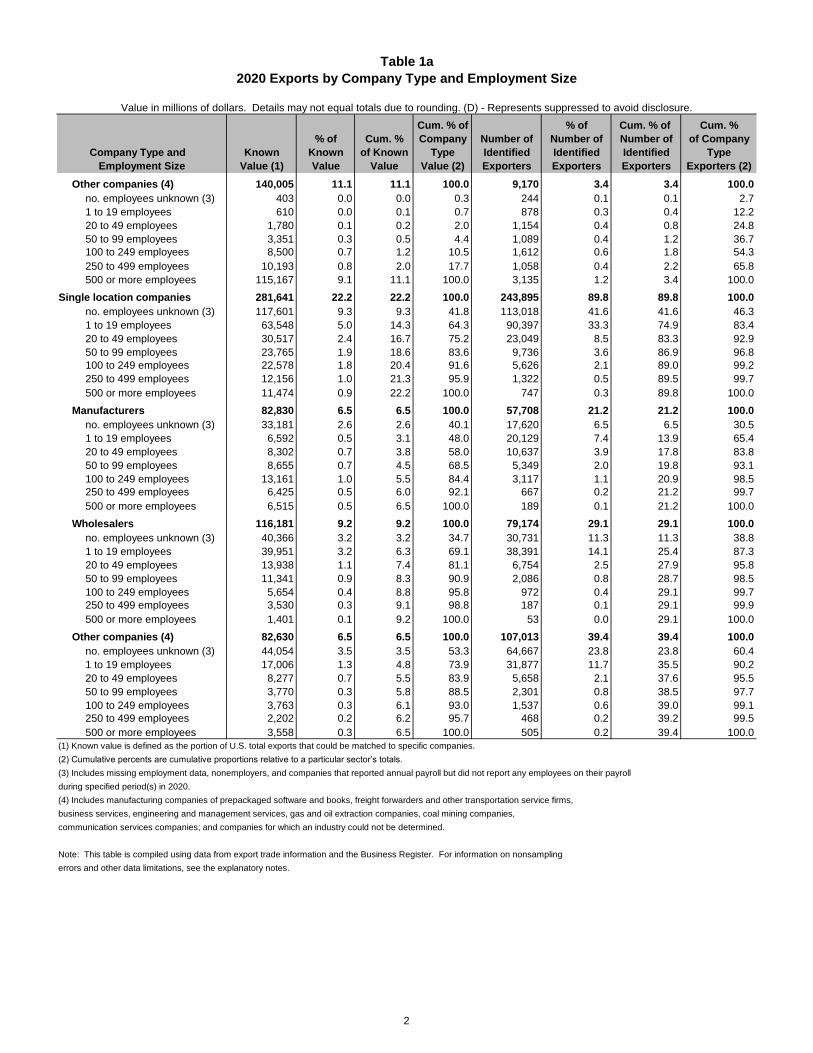
Table 1a
2020 Exports by Company Type and Employment Size
Value in millions of dollars. Details may not equal totals due to rounding. (D) - Represents suppressed to avoid disclosure.
Cum. % of % of Cum. % of Cum. %
% of Cum. % Company Number of Number of Number of of Company
Company Type and Known Known of Known Type Identified Identified Identified Type
Employment Size Value (1) Value Value Value (2) Exporters Exporters Exporters Exporters (2)
Other companies (4) 140,005 11.1 11.1 100.0 9,170 3.4 3.4 100.0
no. employees unknown (3) 403 0.0 0.0 0.3 244 0.1 0.1 2.7
1 to 19 employees 610 0.0 0.1 0.7 878 0.3 0.4 12.2
20 to 49 employees 1,780 0.1 0.2 2.0 1,154 0.4 0.8 24.8
50 to 99 employees 3,351 0.3 0.5 4.4 1,089 0.4 1.2 36.7
100 to 249 employees 8,500 0.7 1.2 10.5 1,612 0.6 1.8 54.3
250 to 499 employees 10,193 0.8 2.0 17.7 1,058 0.4 2.2 65.8
500 or more employees 115,167 9.1 11.1 100.0 3,135 1.2 3.4 100.0
Single location companies 281,641 22.2 22.2 100.0 243,895 89.8 89.8 100.0
no. employees unknown (3) 117,601 9.3 9.3 41.8 113,018 41.6 41.6 46.3
1 to 19 employees 63,548 5.0 14.3 64.3 90,397 33.3 74.9 83.4
20 to 49 employees 30,517 2.4 16.7 75.2 23,049 8.5 83.3 92.9
50 to 99 employees 23,765 1.9 18.6 83.6 9,736 3.6 86.9 96.8
100 to 249 employees 22,578 1.8 20.4 91.6 5,626 2.1 89.0 99.2
250 to 499 employees 12,156 1.0 21.3 95.9 1,322 0.5 89.5 99.7
500 or more employees 11,474 0.9 22.2 100.0 747 0.3 89.8 100.0
Manufacturers 82,830 6.5 6.5 100.0 57,708 21.2 21.2 100.0
no. employees unknown (3) 33,181 2.6 2.6 40.1 17,620 6.5 6.5 30.5
1 to 19 employees 6,592 0.5 3.1 48.0 20,129 7.4 13.9 65.4
20 to 49 employees 8,302 0.7 3.8 58.0 10,637 3.9 17.8 83.8
50 to 99 employees 8,655 0.7 4.5 68.5 5,349 2.0 19.8 93.1
100 to 249 employees 13,161 1.0 5.5 84.4 3,117 1.1 20.9 98.5
250 to 499 employees 6,425 0.5 6.0 92.1 667 0.2 21.2 99.7
500 or more employees 6,515 0.5 6.5 100.0 189 0.1 21.2 100.0
Wholesalers 116,181 9.2 9.2 100.0 79,174 29.1 29.1 100.0
no. employees unknown (3) 40,366 3.2 3.2 34.7 30,731 11.3 11.3 38.8
1 to 19 employees 39,951 3.2 6.3 69.1 38,391 14.1 25.4 87.3
20 to 49 employees 13,938 1.1 7.4 81.1 6,754 2.5 27.9 95.8
50 to 99 employees 11,341 0.9 8.3 90.9 2,086 0.8 28.7 98.5
100 to 249 employees 5,654 0.4 8.8 95.8 972 0.4 29.1 99.7
250 to 499 employees 3,530 0.3 9.1 98.8 187 0.1 29.1 99.9
500 or more employees 1,401 0.1 9.2 100.0 53 0.0 29.1 100.0
Other companies (4) 82,630 6.5 6.5 100.0 107,013 39.4 39.4 100.0
no. employees unknown (3) 44,054 3.5 3.5 53.3 64,667 23.8 23.8 60.4
1 to 19 employees 17,006 1.3 4.8 73.9 31,877 11.7 35.5 90.2
20 to 49 employees 8,277 0.7 5.5 83.9 5,658 2.1 37.6 95.5
50 to 99 employees 3,770 0.3 5.8 88.5 2,301 0.8 38.5 97.7
100 to 249 employees 3,763 0.3 6.1 93.0 1,537 0.6 39.0 99.1
250 to 499 employees 2,202 0.2 6.2 95.7 468 0.2 39.2 99.5
500 or more employees 3,558 0.3 6.5 100.0 505 0.2 39.4 100.0
(1) Known value is defined as the portion of U.S. total exports that could be matched to specific companies.
(2) Cumulative percents are cumulative proportions relative to a particular sector’s totals.
(3) Includes missing employment data, nonemployers, and companies that reported annual payroll but did not report any employees on their payroll
during specified period(s) in 2020.
(4) Includes manufacturing companies of prepackaged software and books, freight forwarders and other transportation service firms,
business services, engineering and management services, gas and oil extraction companies, coal mining companies,
communication services companies; and companies for which an industry could not be determined.
Note: This table is compiled using data from export trade information and the Business Register. For information on nonsampling
errors and other data limitations, see the explanatory notes.
2

Table 1b
2019 Exports by Company Type and Employment Size
Value in millions of dollars. Details may not equal totals due to rounding. (D) - Represents suppressed to avoid disclosure.
Cum. % of % of Cum. % of Cum. %
% of Cum. % Company Number of Number of Number of of Company
Company Type and Known Known of Known Type Identified Identified Identified Type
Employment Size Value (1) Value Value Value (2) Exporters Exporters Exporters Exporters (2)
All identified companies 1,464,623 100.0 100.0 100.0 289,372 100.0 100.0 100.0
no. employees unknown (3) 145,734 10.0 10.0 10.0 119,924 41.4 41.4 41.4
1 to 19 employees 77,503 5.3 15.2 15.2 100,948 34.9 76.3 76.3
20 to 49 employees 45,683 3.1 18.4 18.4 29,011 10.0 86.4 86.4
50 to 99 employees 47,769 3.3 21.6 21.6 14,754 5.1 91.5 91.5
100 to 249 employees 90,680 6.2 27.8 27.8 12,215 4.2 95.7 95.7
250 to 499 employees 56,578 3.9 31.7 31.7 4,928 1.7 97.4 97.4
500 or more employees 1,000,676 68.3 100.0 100.0 7,592 2.6 100.0 100.0
Manufacturers 866,519 59.2 59.2 100.0 71,170 24.6 24.6 100.0
no. employees unknown (3) 40,097 2.7 2.7 4.6 18,421 6.4 6.4 25.9
1 to 19 employees 7,512 0.5 3.3 5.5 21,778 7.5 13.9 56.5
20 to 49 employees 10,721 0.7 4.0 6.7 12,530 4.3 18.2 74.1
50 to 99 employees 15,430 1.1 5.0 8.5 7,249 2.5 20.7 84.3
100 to 249 employees 43,356 3.0 8.0 13.5 6,097 2.1 22.8 92.8
250 to 499 employees 32,086 2.2 10.2 17.2 2,334 0.8 23.6 96.1
500 or more employees 717,317 49.0 59.2 100.0 2,761 1.0 24.6 100.0
Wholesalers 341,714 23.3 23.3 100.0 92,720 32.0 32.0 100.0
no. employees unknown (3) 57,395 3.9 3.9 16.8 32,463 11.2 11.2 35.0
1 to 19 employees 49,523 3.4 7.3 31.3 42,855 14.8 26.0 81.2
20 to 49 employees 22,565 1.5 8.8 37.9 9,024 3.1 29.1 91.0
50 to 99 employees 22,643 1.5 10.4 44.5 3,758 1.3 30.4 95.0
100 to 249 employees 32,460 2.2 12.6 54.0 2,714 0.9 31.4 97.9
250 to 499 employees 10,447 0.7 13.3 57.1 923 0.3 31.7 98.9
500 or more employees 146,681 10.0 23.3 100.0 983 0.3 32.0 100.0
Other companies (4) 256,390 17.5 17.5 100.0 125,482 43.4 43.4 100.0
no. employees unknown (3) 48,242 3.3 3.3 18.8 69,040 23.9 23.9 55.0
1 to 19 employees 20,468 1.4 4.7 26.8 36,315 12.5 36.4 84.0
20 to 49 employees 12,398 0.8 5.5 31.6 7,457 2.6 39.0 89.9
50 to 99 employees 9,696 0.7 6.2 35.4 3,747 1.3 40.3 92.9
100 to 249 employees 14,865 1.0 7.2 41.2 3,404 1.2 41.5 95.6
250 to 499 employees 14,045 1.0 8.2 46.7 1,671 0.6 42.0 96.9
500 or more employees 136,678 9.3 17.5 100.0 3,848 1.3 43.4 100.0
Multiple location companies 1,144,389 78.1 78.1 100.0 28,898 10.0 10.0 100.0
no. employees unknown (3) (D) (D) (D) (D) 607 0.2 0.2 2.1
1 to 19 employees 3,474 0.2 (D) (D) 2,792 1.0 1.2 11.8
20 to 49 employees (D) (D) (D) (D) 4,378 1.5 2.7 26.9
50 to 99 employees 15,906 1.1 3.2 4.0 4,546 1.6 4.3 42.6
100 to 249 employees 67,715 4.6 7.8 10.0 6,289 2.2 6.4 64.4
250 to 499 employees 43,782 3.0 10.8 13.8 3,568 1.2 7.7 76.8
500 or more employees 986,650 67.4 78.1 100.0 6,718 2.3 10.0 100.0
Manufacturers 769,630 52.5 52.5 100.0 10,393 3.6 3.6 100.0
no. employees unknown (3) 487 0.0 0.0 0.1 135 0.0 0.0 1.3
1 to 19 employees 155 0.0 0.0 0.1 346 0.1 0.2 4.6
20 to 49 employees 1,348 0.1 0.1 0.3 1,170 0.4 0.6 15.9
50 to 99 employees 5,401 0.4 0.5 1.0 1,717 0.6 1.2 32.4
100 to 249 employees 29,762 2.0 2.5 4.8 2,840 1.0 2.1 59.7
250 to 499 employees 24,793 1.7 4.2 8.0 1,652 0.6 2.7 75.6
500 or more employees 707,684 48.3 52.5 100.0 2,533 0.9 3.6 100.0
Wholesalers 210,413 14.4 14.4 100.0 8,583 3.0 3.0 100.0
no. employees unknown (3) (D) (D) (D) (D) 245 0.1 0.1 2.9
1 to 19 employees 2,472 0.2 (D) (D) 1,458 0.5 0.6 19.8
20 to 49 employees (D) (D) (D) (D) 1,900 0.7 1.2 42.0
50 to 99 employees 7,530 0.5 2.2 15.2 1,579 0.5 1.8 60.4
100 to 249 employees 26,160 1.8 4.0 27.6 1,718 0.6 2.4 80.4
250 to 499 employees 7,550 0.5 4.5 31.2 762 0.3 2.6 89.3
500 or more employees 144,692 9.9 14.4 100.0 921 0.3 3.0 100.0
3

Table 1b
2019 Exports by Company Type and Employment Size
Value in millions of dollars. Details may not equal totals due to rounding. (D) - Represents suppressed to avoid disclosure.
Cum. % of % of Cum. % of Cum. %
% of Cum. % Company Number of Number of Number of of Company
Company Type and Known Known of Known Type Identified Identified Identified Type
Employment Size Value (1) Value Value Value (2) Exporters Exporters Exporters Exporters (2)
Other companies (4) 164,347 11.2 11.2 100.0 9,922 3.4 3.4 100.0
no. employees unknown (3) 510 0.0 0.0 0.3 227 0.1 0.1 2.3
1 to 19 employees 847 0.1 0.1 0.8 988 0.3 0.4 12.2
20 to 49 employees 2,510 0.2 0.3 2.4 1,308 0.5 0.9 25.4
50 to 99 employees 2,974 0.2 0.5 4.2 1,250 0.4 1.3 38.0
100 to 249 employees 11,793 0.8 1.3 11.3 1,731 0.6 1.9 55.5
250 to 499 employees 11,439 0.8 2.1 18.3 1,154 0.4 2.3 67.1
500 or more employees 134,274 9.2 11.2 100.0 3,264 1.1 3.4 100.0
Single location companies 320,233 21.9 21.9 100.0 260,474 90.0 90.0 100.0
no. employees unknown (3) (D) (D) (D) (D) 119,317 41.2 41.2 45.8
1 to 19 employees 74,029 5.1 (D) (D) 98,156 33.9 75.2 83.5
20 to 49 employees (D) (D) (D) (D) 24,633 8.5 83.7 92.9
50 to 99 employees 31,863 2.2 18.5 84.5 10,208 3.5 87.2 96.9
100 to 249 employees 22,966 1.6 20.0 91.6 5,926 2.0 89.2 99.1
250 to 499 employees 12,796 0.9 20.9 95.6 1,360 0.5 89.7 99.7
500 or more employees 14,026 1.0 21.9 100.0 874 0.3 90.0 100.0
Manufacturers 96,889 6.6 6.6 100.0 60,777 21.0 21.0 100.0
no. employees unknown (3) 39,610 2.7 2.7 40.9 18,286 6.3 6.3 30.1
1 to 19 employees 7,357 0.5 3.2 48.5 21,432 7.4 13.7 65.4
20 to 49 employees 9,373 0.6 3.8 58.1 11,360 3.9 17.7 84.0
50 to 99 employees 10,029 0.7 4.5 68.5 5,532 1.9 19.6 93.1
100 to 249 employees 13,594 0.9 5.5 82.5 3,257 1.1 20.7 98.5
250 to 499 employees 7,293 0.5 6.0 90.1 682 0.2 20.9 99.6
500 or more employees 9,633 0.7 6.6 100.0 228 0.1 21.0 100.0
Wholesalers 131,300 9.0 9.0 100.0 84,137 29.1 29.1 100.0
no. employees unknown (3) (D) (D) (D) (D) 32,218 11.1 11.1 38.3
1 to 19 employees 47,051 3.2 (D) (D) 41,397 14.3 25.4 87.5
20 to 49 employees (D) (D) (D) (D) 7,124 2.5 27.9 96.0
50 to 99 employees 15,113 1.0 8.2 91.5 2,179 0.8 28.7 98.6
100 to 249 employees 6,300 0.4 8.6 96.3 996 0.3 29.0 99.7
250 to 499 employees 2,896 0.2 8.8 98.5 161 0.1 29.1 99.9
500 or more employees 1,989 0.1 9.0 100.0 62 0.0 29.1 100.0
Other companies (4) 92,044 6.3 6.3 100.0 115,560 39.9 39.9 100.0
no. employees unknown (3) 47,732 3.3 3.3 51.9 68,813 23.8 23.8 59.5
1 to 19 employees 19,620 1.3 4.6 73.2 35,327 12.2 36.0 90.1
20 to 49 employees 9,888 0.7 5.3 83.9 6,149 2.1 38.1 95.4
50 to 99 employees 6,721 0.5 5.7 91.2 2,497 0.9 39.0 97.6
100 to 249 employees 3,072 0.2 5.9 94.6 1,673 0.6 39.6 99.0
250 to 499 employees 2,607 0.2 6.1 97.4 517 0.2 39.7 99.5
500 or more employees 2,404 0.2 6.3 100.0 584 0.2 39.9 100.0
(1) Known value is defined as the portion of U.S. total exports that could be matched to specific companies.
(2) Cumulative percents are cumulative proportions relative to a particular sector’s totals.
(3) Includes missing employment data, nonemployers, and companies that reported annual payroll but did not report any employees on their payroll
during specified period(s) in 2019.
(4) Includes manufacturing companies of prepackaged software and books, freight forwarders and other transportation service firms,
business services, engineering and management services, gas and oil extraction companies, coal mining companies,
communication services companies; and companies for which an industry could not be determined.
Note: This table is compiled using data from export trade information and the Business Register. For information on nonsampling
errors and other data limitations, see the explanatory notes.
4
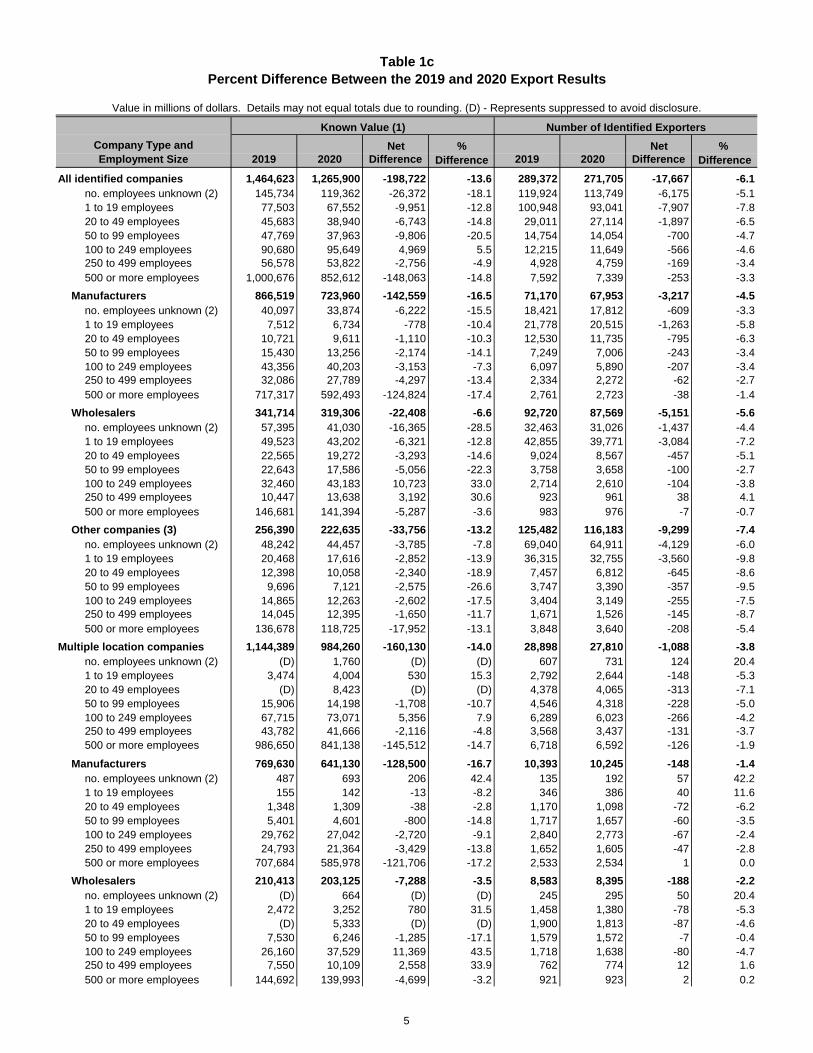
Table 1c
Percent Difference Between the 2019 and 2020 Export Results
Value in millions of dollars. Details may not equal totals due to rounding. (D) - Represents suppressed to avoid disclosure.
Known Value (1) Number of Identified Exporters
Company Type and Net % Net %
Employment Size 2019 2020 Difference Difference 2019 2020 Difference Difference
All identified companies 1,464,623 1,265,900 -198,722 -13.6 289,372 271,705 -17,667 -6.1
no. employees unknown (2) 145,734 119,362 -26,372 -18.1 119,924 113,749 -6,175 -5.1
1 to 19 employees 77,503 67,552 -9,951 -12.8 100,948 93,041 -7,907 -7.8
20 to 49 employees 45,683 38,940 -6,743 -14.8 29,011 27,114 -1,897 -6.5
50 to 99 employees 47,769 37,963 -9,806 -20.5 14,754 14,054 -700 -4.7
100 to 249 employees 90,680 95,649 4,969 5.5 12,215 11,649 -566 -4.6
250 to 499 employees 56,578 53,822 -2,756 -4.9 4,928 4,759 -169 -3.4
500 or more employees 1,000,676 852,612 -148,063 -14.8 7,592 7,339 -253 -3.3
Manufacturers 866,519 723,960 -142,559 -16.5 71,170 67,953 -3,217 -4.5
no. employees unknown (2) 40,097 33,874 -6,222 -15.5 18,421 17,812 -609 -3.3
1 to 19 employees 7,512 6,734 -778 -10.4 21,778 20,515 -1,263 -5.8
20 to 49 employees 10,721 9,611 -1,110 -10.3 12,530 11,735 -795 -6.3
50 to 99 employees 15,430 13,256 -2,174 -14.1 7,249 7,006 -243 -3.4
100 to 249 employees 43,356 40,203 -3,153 -7.3 6,097 5,890 -207 -3.4
250 to 499 employees 32,086 27,789 -4,297 -13.4 2,334 2,272 -62 -2.7
500 or more employees 717,317 592,493 -124,824 -17.4 2,761 2,723 -38 -1.4
Wholesalers 341,714 319,306 -22,408 -6.6 92,720 87,569 -5,151 -5.6
no. employees unknown (2) 57,395 41,030 -16,365 -28.5 32,463 31,026 -1,437 -4.4
1 to 19 employees 49,523 43,202 -6,321 -12.8 42,855 39,771 -3,084 -7.2
20 to 49 employees 22,565 19,272 -3,293 -14.6 9,024 8,567 -457 -5.1
50 to 99 employees 22,643 17,586 -5,056 -22.3 3,758 3,658 -100 -2.7
100 to 249 employees 32,460 43,183 10,723 33.0 2,714 2,610 -104 -3.8
250 to 499 employees 10,447 13,638 3,192 30.6 923 961 38 4.1
500 or more employees 146,681 141,394 -5,287 -3.6 983 976 -7 -0.7
Other companies (3) 256,390 222,635 -33,756 -13.2 125,482 116,183 -9,299 -7.4
no. employees unknown (2) 48,242 44,457 -3,785 -7.8 69,040 64,911 -4,129 -6.0
1 to 19 employees 20,468 17,616 -2,852 -13.9 36,315 32,755 -3,560 -9.8
20 to 49 employees 12,398 10,058 -2,340 -18.9 7,457 6,812 -645 -8.6
50 to 99 employees 9,696 7,121 -2,575 -26.6 3,747 3,390 -357 -9.5
100 to 249 employees 14,865 12,263 -2,602 -17.5 3,404 3,149 -255 -7.5
250 to 499 employees 14,045 12,395 -1,650 -11.7 1,671 1,526 -145 -8.7
500 or more employees 136,678 118,725 -17,952 -13.1 3,848 3,640 -208 -5.4
Multiple location companies 1,144,389 984,260 -160,130 -14.0 28,898 27,810 -1,088 -3.8
no. employees unknown (2) (D) 1,760 (D) (D) 607 731 124 20.4
1 to 19 employees 3,474 4,004 530 15.3 2,792 2,644 -148 -5.3
20 to 49 employees (D) 8,423 (D) (D) 4,378 4,065 -313 -7.1
50 to 99 employees 15,906 14,198 -1,708 -10.7 4,546 4,318 -228 -5.0
100 to 249 employees 67,715 73,071 5,356 7.9 6,289 6,023 -266 -4.2
250 to 499 employees 43,782 41,666 -2,116 -4.8 3,568 3,437 -131 -3.7
500 or more employees 986,650 841,138 -145,512 -14.7 6,718 6,592 -126 -1.9
Manufacturers 769,630 641,130 -128,500 -16.7 10,393 10,245 -148 -1.4
no. employees unknown (2) 487 693 206 42.4 135 192 57 42.2
1 to 19 employees 155 142 -13 -8.2 346 386 40 11.6
20 to 49 employees 1,348 1,309 -38 -2.8 1,170 1,098 -72 -6.2
50 to 99 employees 5,401 4,601 -800 -14.8 1,717 1,657 -60 -3.5
100 to 249 employees 29,762 27,042 -2,720 -9.1 2,840 2,773 -67 -2.4
250 to 499 employees 24,793 21,364 -3,429 -13.8 1,652 1,605 -47 -2.8
500 or more employees 707,684 585,978 -121,706 -17.2 2,533 2,534 1 0.0
Wholesalers 210,413 203,125 -7,288 -3.5 8,583 8,395 -188 -2.2
no. employees unknown (2) (D) 664 (D) (D) 245 295 50 20.4
1 to 19 employees 2,472 3,252 780 31.5 1,458 1,380 -78 -5.3
20 to 49 employees (D) 5,333 (D) (D) 1,900 1,813 -87 -4.6
50 to 99 employees 7,530 6,246 -1,285 -17.1 1,579 1,572 -7 -0.4
100 to 249 employees 26,160 37,529 11,369 43.5 1,718 1,638 -80 -4.7
250 to 499 employees 7,550 10,109 2,558 33.9 762 774 12 1.6
500 or more employees 144,692 139,993 -4,699 -3.2 921 923 2 0.2
5
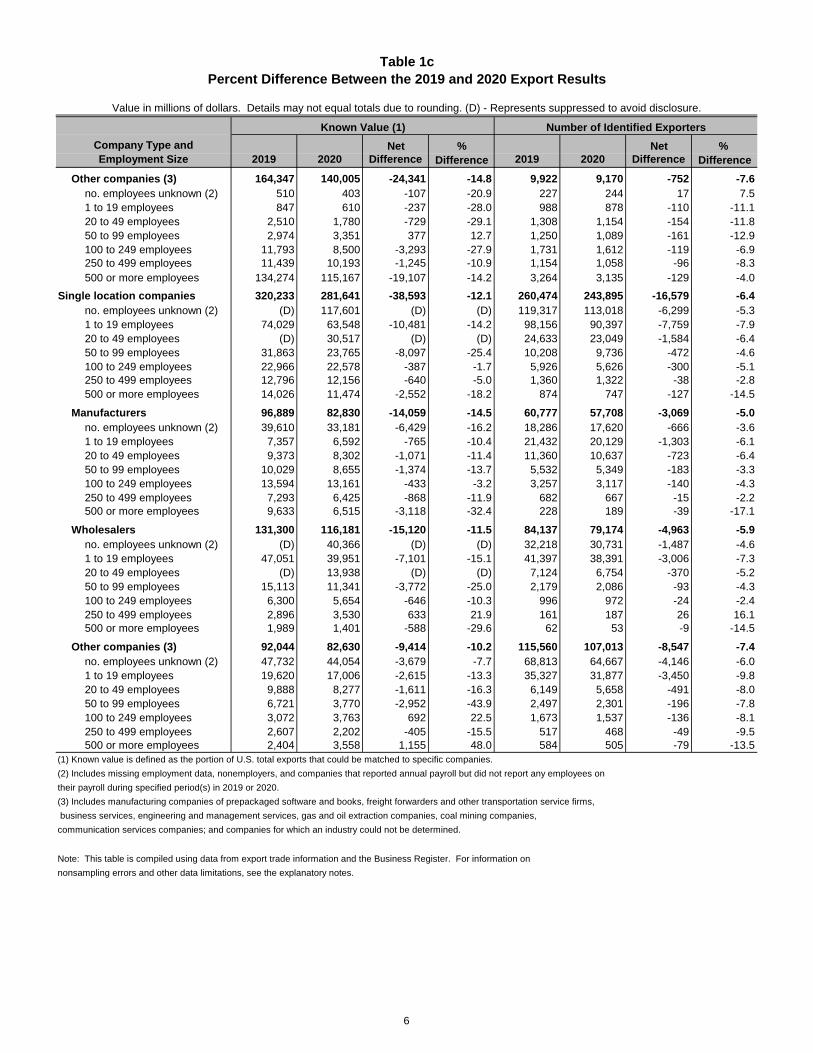
Table 1c
Percent Difference Between the 2019 and 2020 Export Results
Value in millions of dollars. Details may not equal totals due to rounding. (D) - Represents suppressed to avoid disclosure.
Known Value (1) Number of Identified Exporters
Company Type and Net % Net %
Employment Size 2019 2020 Difference Difference 2019 2020 Difference Difference
Other companies (3) 164,347 140,005 -24,341 -14.8 9,922 9,170 -752 -7.6
no. employees unknown (2) 510 403 -107 -20.9 227 244 17 7.5
1 to 19 employees 847 610 -237 -28.0 988 878 -110 -11.1
20 to 49 employees 2,510 1,780 -729 -29.1 1,308 1,154 -154 -11.8
50 to 99 employees 2,974 3,351 377 12.7 1,250 1,089 -161 -12.9
100 to 249 employees 11,793 8,500 -3,293 -27.9 1,731 1,612 -119 -6.9
250 to 499 employees 11,439 10,193 -1,245 -10.9 1,154 1,058 -96 -8.3
500 or more employees 134,274 115,167 -19,107 -14.2 3,264 3,135 -129 -4.0
Single location companies 320,233 281,641 -38,593 -12.1 260,474 243,895 -16,579 -6.4
no. employees unknown (2) (D) 117,601 (D) (D) 119,317 113,018 -6,299 -5.3
1 to 19 employees 74,029 63,548 -10,481 -14.2 98,156 90,397 -7,759 -7.9
20 to 49 employees (D) 30,517 (D) (D) 24,633 23,049 -1,584 -6.4
50 to 99 employees 31,863 23,765 -8,097 -25.4 10,208 9,736 -472 -4.6
100 to 249 employees 22,966 22,578 -387 -1.7 5,926 5,626 -300 -5.1
250 to 499 employees 12,796 12,156 -640 -5.0 1,360 1,322 -38 -2.8
500 or more employees 14,026 11,474 -2,552 -18.2 874 747 -127 -14.5
Manufacturers 96,889 82,830 -14,059 -14.5 60,777 57,708 -3,069 -5.0
no. employees unknown (2) 39,610 33,181 -6,429 -16.2 18,286 17,620 -666 -3.6
1 to 19 employees 7,357 6,592 -765 -10.4 21,432 20,129 -1,303 -6.1
20 to 49 employees 9,373 8,302 -1,071 -11.4 11,360 10,637 -723 -6.4
50 to 99 employees 10,029 8,655 -1,374 -13.7 5,532 5,349 -183 -3.3
100 to 249 employees 13,594 13,161 -433 -3.2 3,257 3,117 -140 -4.3
250 to 499 employees 7,293 6,425 -868 -11.9 682 667 -15 -2.2
500 or more employees 9,633 6,515 -3,118 -32.4 228 189 -39 -17.1
Wholesalers 131,300 116,181 -15,120 -11.5 84,137 79,174 -4,963 -5.9
no. employees unknown (2) (D) 40,366 (D) (D) 32,218 30,731 -1,487 -4.6
1 to 19 employees 47,051 39,951 -7,101 -15.1 41,397 38,391 -3,006 -7.3
20 to 49 employees (D) 13,938 (D) (D) 7,124 6,754 -370 -5.2
50 to 99 employees 15,113 11,341 -3,772 -25.0 2,179 2,086 -93 -4.3
100 to 249 employees 6,300 5,654 -646 -10.3 996 972 -24 -2.4
250 to 499 employees 2,896 3,530 633 21.9 161 187 26 16.1
500 or more employees 1,989 1,401 -588 -29.6 62 53 -9 -14.5
Other companies (3) 92,044 82,630 -9,414 -10.2 115,560 107,013 -8,547 -7.4
no. employees unknown (2) 47,732 44,054 -3,679 -7.7 68,813 64,667 -4,146 -6.0
1 to 19 employees 19,620 17,006 -2,615 -13.3 35,327 31,877 -3,450 -9.8
20 to 49 employees 9,888 8,277 -1,611 -16.3 6,149 5,658 -491 -8.0
50 to 99 employees 6,721 3,770 -2,952 -43.9 2,497 2,301 -196 -7.8
100 to 249 employees 3,072 3,763 692 22.5 1,673 1,537 -136 -8.1
250 to 499 employees 2,607 2,202 -405 -15.5 517 468 -49 -9.5
500 or more employees 2,404 3,558 1,155 48.0 584 505 -79 -13.5
(1) Known value is defined as the portion of U.S. total exports that could be matched to specific companies.
(2) Includes missing employment data, nonemployers, and companies that reported annual payroll but did not report any employees on
their payroll during specified period(s) in 2019 or 2020.
(3) Includes manufacturing companies of prepackaged software and books, freight forwarders and other transportation service firms,
business services, engineering and management services, gas and oil extraction companies, coal mining companies,
communication services companies; and companies for which an industry could not be determined.
Note: This table is compiled using data from export trade information and the Business Register. For information on
nonsampling errors and other data limitations, see the explanatory notes.
6
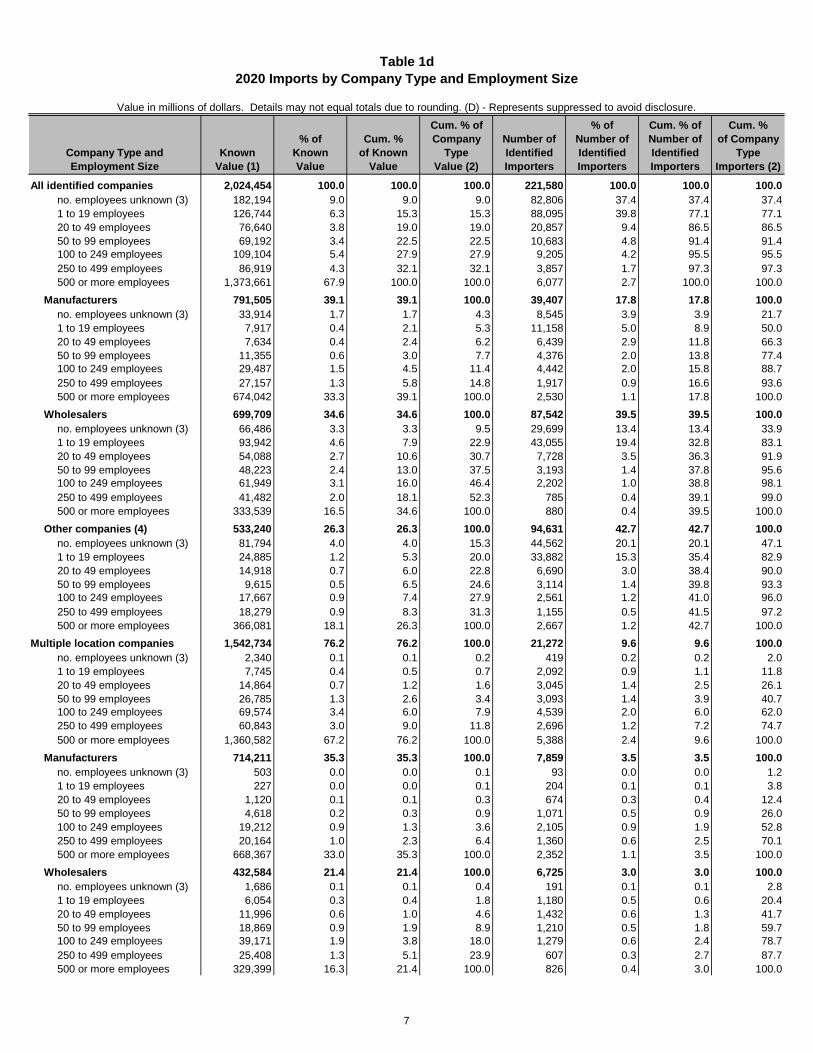
Table 1d
2020 Imports by Company Type and Employment Size
Value in millions of dollars. Details may not equal totals due to rounding. (D) - Represents suppressed to avoid disclosure.
Cum. % of % of Cum. % of Cum. %
% of Cum. % Company Number of Number of Number of of Company
Company Type and Known Known of Known Type Identified Identified Identified Type
Employment Size Value (1) Value Value Value (2) Importers Importers Importers Importers (2)
All identified companies 2,024,454 100.0 100.0 100.0 221,580 100.0 100.0 100.0
no. employees unknown (3) 182,194 9.0 9.0 9.0 82,806 37.4 37.4 37.4
1 to 19 employees 126,744 6.3 15.3 15.3 88,095 39.8 77.1 77.1
20 to 49 employees 76,640 3.8 19.0 19.0 20,857 9.4 86.5 86.5
50 to 99 employees 69,192 3.4 22.5 22.5 10,683 4.8 91.4 91.4
100 to 249 employees 109,104 5.4 27.9 27.9 9,205 4.2 95.5 95.5
250 to 499 employees 86,919 4.3 32.1 32.1 3,857 1.7 97.3 97.3
500 or more employees 1,373,661 67.9 100.0 100.0 6,077 2.7 100.0 100.0
Manufacturers 791,505 39.1 39.1 100.0 39,407 17.8 17.8 100.0
no. employees unknown (3) 33,914 1.7 1.7 4.3 8,545 3.9 3.9 21.7
1 to 19 employees 7,917 0.4 2.1 5.3 11,158 5.0 8.9 50.0
20 to 49 employees 7,634 0.4 2.4 6.2 6,439 2.9 11.8 66.3
50 to 99 employees 11,355 0.6 3.0 7.7 4,376 2.0 13.8 77.4
100 to 249 employees 29,487 1.5 4.5 11.4 4,442 2.0 15.8 88.7
250 to 499 employees 27,157 1.3 5.8 14.8 1,917 0.9 16.6 93.6
500 or more employees 674,042 33.3 39.1 100.0 2,530 1.1 17.8 100.0
Wholesalers 699,709 34.6 34.6 100.0 87,542 39.5 39.5 100.0
no. employees unknown (3) 66,486 3.3 3.3 9.5 29,699 13.4 13.4 33.9
1 to 19 employees 93,942 4.6 7.9 22.9 43,055 19.4 32.8 83.1
20 to 49 employees 54,088 2.7 10.6 30.7 7,728 3.5 36.3 91.9
50 to 99 employees 48,223 2.4 13.0 37.5 3,193 1.4 37.8 95.6
100 to 249 employees 61,949 3.1 16.0 46.4 2,202 1.0 38.8 98.1
250 to 499 employees 41,482 2.0 18.1 52.3 785 0.4 39.1 99.0
500 or more employees 333,539 16.5 34.6 100.0 880 0.4 39.5 100.0
Other companies (4) 533,240 26.3 26.3 100.0 94,631 42.7 42.7 100.0
no. employees unknown (3) 81,794 4.0 4.0 15.3 44,562 20.1 20.1 47.1
1 to 19 employees 24,885 1.2 5.3 20.0 33,882 15.3 35.4 82.9
20 to 49 employees 14,918 0.7 6.0 22.8 6,690 3.0 38.4 90.0
50 to 99 employees 9,615 0.5 6.5 24.6 3,114 1.4 39.8 93.3
100 to 249 employees 17,667 0.9 7.4 27.9 2,561 1.2 41.0 96.0
250 to 499 employees 18,279 0.9 8.3 31.3 1,155 0.5 41.5 97.2
500 or more employees 366,081 18.1 26.3 100.0 2,667 1.2 42.7 100.0
Multiple location companies 1,542,734 76.2 76.2 100.0 21,272 9.6 9.6 100.0
no. employees unknown (3) 2,340 0.1 0.1 0.2 419 0.2 0.2 2.0
1 to 19 employees 7,745 0.4 0.5 0.7 2,092 0.9 1.1 11.8
20 to 49 employees 14,864 0.7 1.2 1.6 3,045 1.4 2.5 26.1
50 to 99 employees 26,785 1.3 2.6 3.4 3,093 1.4 3.9 40.7
100 to 249 employees 69,574 3.4 6.0 7.9 4,539 2.0 6.0 62.0
250 to 499 employees 60,843 3.0 9.0 11.8 2,696 1.2 7.2 74.7
500 or more employees 1,360,582 67.2 76.2 100.0 5,388 2.4 9.6 100.0
Manufacturers 714,211 35.3 35.3 100.0 7,859 3.5 3.5 100.0
no. employees unknown (3) 503 0.0 0.0 0.1 93 0.0 0.0 1.2
1 to 19 employees 227 0.0 0.0 0.1 204 0.1 0.1 3.8
20 to 49 employees 1,120 0.1 0.1 0.3 674 0.3 0.4 12.4
50 to 99 employees 4,618 0.2 0.3 0.9 1,071 0.5 0.9 26.0
100 to 249 employees 19,212 0.9 1.3 3.6 2,105 0.9 1.9 52.8
250 to 499 employees 20,164 1.0 2.3 6.4 1,360 0.6 2.5 70.1
500 or more employees 668,367 33.0 35.3 100.0 2,352 1.1 3.5 100.0
Wholesalers 432,584 21.4 21.4 100.0 6,725 3.0 3.0 100.0
no. employees unknown (3) 1,686 0.1 0.1 0.4 191 0.1 0.1 2.8
1 to 19 employees 6,054 0.3 0.4 1.8 1,180 0.5 0.6 20.4
20 to 49 employees 11,996 0.6 1.0 4.6 1,432 0.6 1.3 41.7
50 to 99 employees 18,869 0.9 1.9 8.9 1,210 0.5 1.8 59.7
100 to 249 employees 39,171 1.9 3.8 18.0 1,279 0.6 2.4 78.7
250 to 499 employees 25,408 1.3 5.1 23.9 607 0.3 2.7 87.7
500 or more employees 329,399 16.3 21.4 100.0 826 0.4 3.0 100.0
7
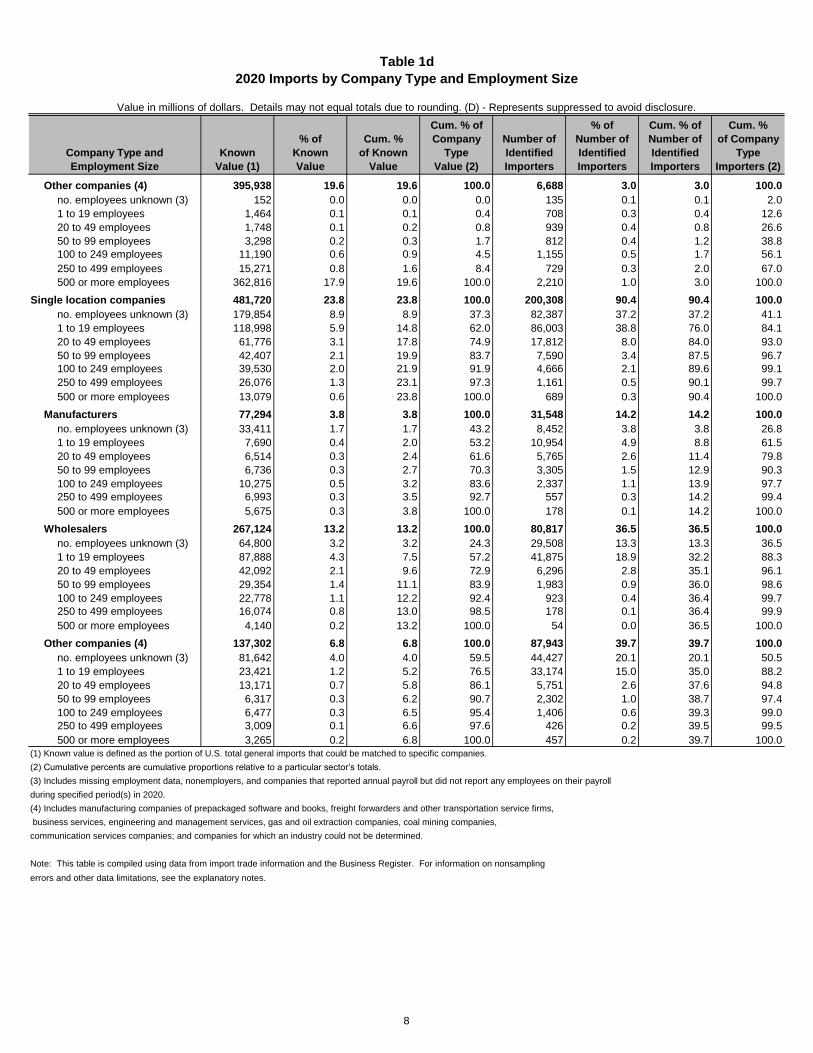
Table 1d
2020 Imports by Company Type and Employment Size
Value in millions of dollars. Details may not equal totals due to rounding. (D) - Represents suppressed to avoid disclosure.
Cum. % of % of Cum. % of Cum. %
% of Cum. % Company Number of Number of Number of of Company
Company Type and Known Known of Known Type Identified Identified Identified Type
Employment Size Value (1) Value Value Value (2) Importers Importers Importers Importers (2)
Other companies (4) 395,938 19.6 19.6 100.0 6,688 3.0 3.0 100.0
no. employees unknown (3) 152 0.0 0.0 0.0 135 0.1 0.1 2.0
1 to 19 employees 1,464 0.1 0.1 0.4 708 0.3 0.4 12.6
20 to 49 employees 1,748 0.1 0.2 0.8 939 0.4 0.8 26.6
50 to 99 employees 3,298 0.2 0.3 1.7 812 0.4 1.2 38.8
100 to 249 employees 11,190 0.6 0.9 4.5 1,155 0.5 1.7 56.1
250 to 499 employees 15,271 0.8 1.6 8.4 729 0.3 2.0 67.0
500 or more employees 362,816 17.9 19.6 100.0 2,210 1.0 3.0 100.0
Single location companies 481,720 23.8 23.8 100.0 200,308 90.4 90.4 100.0
no. employees unknown (3) 179,854 8.9 8.9 37.3 82,387 37.2 37.2 41.1
1 to 19 employees 118,998 5.9 14.8 62.0 86,003 38.8 76.0 84.1
20 to 49 employees 61,776 3.1 17.8 74.9 17,812 8.0 84.0 93.0
50 to 99 employees 42,407 2.1 19.9 83.7 7,590 3.4 87.5 96.7
100 to 249 employees 39,530 2.0 21.9 91.9 4,666 2.1 89.6 99.1
250 to 499 employees 26,076 1.3 23.1 97.3 1,161 0.5 90.1 99.7
500 or more employees 13,079 0.6 23.8 100.0 689 0.3 90.4 100.0
Manufacturers 77,294 3.8 3.8 100.0 31,548 14.2 14.2 100.0
no. employees unknown (3) 33,411 1.7 1.7 43.2 8,452 3.8 3.8 26.8
1 to 19 employees 7,690 0.4 2.0 53.2 10,954 4.9 8.8 61.5
20 to 49 employees 6,514 0.3 2.4 61.6 5,765 2.6 11.4 79.8
50 to 99 employees 6,736 0.3 2.7 70.3 3,305 1.5 12.9 90.3
100 to 249 employees 10,275 0.5 3.2 83.6 2,337 1.1 13.9 97.7
250 to 499 employees 6,993 0.3 3.5 92.7 557 0.3 14.2 99.4
500 or more employees 5,675 0.3 3.8 100.0 178 0.1 14.2 100.0
Wholesalers 267,124 13.2 13.2 100.0 80,817 36.5 36.5 100.0
no. employees unknown (3) 64,800 3.2 3.2 24.3 29,508 13.3 13.3 36.5
1 to 19 employees 87,888 4.3 7.5 57.2 41,875 18.9 32.2 88.3
20 to 49 employees 42,092 2.1 9.6 72.9 6,296 2.8 35.1 96.1
50 to 99 employees 29,354 1.4 11.1 83.9 1,983 0.9 36.0 98.6
100 to 249 employees 22,778 1.1 12.2 92.4 923 0.4 36.4 99.7
250 to 499 employees 16,074 0.8 13.0 98.5 178 0.1 36.4 99.9
500 or more employees 4,140 0.2 13.2 100.0 54 0.0 36.5 100.0
Other companies (4) 137,302 6.8 6.8 100.0 87,943 39.7 39.7 100.0
no. employees unknown (3) 81,642 4.0 4.0 59.5 44,427 20.1 20.1 50.5
1 to 19 employees 23,421 1.2 5.2 76.5 33,174 15.0 35.0 88.2
20 to 49 employees 13,171 0.7 5.8 86.1 5,751 2.6 37.6 94.8
50 to 99 employees 6,317 0.3 6.2 90.7 2,302 1.0 38.7 97.4
100 to 249 employees 6,477 0.3 6.5 95.4 1,406 0.6 39.3 99.0
250 to 499 employees 3,009 0.1 6.6 97.6 426 0.2 39.5 99.5
500 or more employees 3,265 0.2 6.8 100.0 457 0.2 39.7 100.0
(1) Known value is defined as the portion of U.S. total general imports that could be matched to specific companies.
(2) Cumulative percents are cumulative proportions relative to a particular sector’s totals.
(3) Includes missing employment data, nonemployers, and companies that reported annual payroll but did not report any employees on their payroll
during specified period(s) in 2020.
(4) Includes manufacturing companies of prepackaged software and books, freight forwarders and other transportation service firms,
business services, engineering and management services, gas and oil extraction companies, coal mining companies,
communication services companies; and companies for which an industry could not be determined.
Note: This table is compiled using data from import trade information and the Business Register. For information on nonsampling
errors and other data limitations, see the explanatory notes.
8

Table 1e
2019 Imports by Company Type and Employment Size
Value in millions of dollars. Details may not equal totals due to rounding. (D) - Represents suppressed to avoid disclosure.
Cum. % of % of Cum. % of Cum. %
% of Cum. % Company Number of Number of Number of of Company
Company Type and Known Known of Known Type Identified Identified Identified Type
Employment Size Value (1) Value Value Value (2) Importers Importers Importers Importers (2)
All identified companies 2,167,073 100.0 100.0 100.0 224,699 100.0 100.0 100.0
no. employees unknown (3) 180,766 8.3 8.3 8.3 81,582 36.3 36.3 36.3
1 to 19 employees 131,742 6.1 14.4 14.4 90,799 40.4 76.7 76.7
20 to 49 employees 80,609 3.7 18.1 18.1 21,728 9.7 86.4 86.4
50 to 99 employees 70,531 3.3 21.4 21.4 11,057 4.9 91.3 91.3
100 to 249 employees 105,453 4.9 26.3 26.3 9,540 4.2 95.6 95.6
250 to 499 employees 99,927 4.6 30.9 30.9 3,888 1.7 97.3 97.3
500 or more employees 1,498,045 69.1 100.0 100.0 6,105 2.7 100.0 100.0
Manufacturers 929,283 42.9 42.9 100.0 40,269 17.9 17.9 100.0
no. employees unknown (3) 34,892 1.6 1.6 3.8 8,583 3.8 3.8 21.3
1 to 19 employees 7,898 0.4 2.0 4.6 11,356 5.1 8.9 49.5
20 to 49 employees 7,999 0.4 2.3 5.5 6,684 3.0 11.8 66.1
50 to 99 employees 11,479 0.5 2.9 6.7 4,596 2.0 13.9 77.5
100 to 249 employees 30,960 1.4 4.3 10.0 4,546 2.0 15.9 88.8
250 to 499 employees 32,233 1.5 5.8 13.5 1,950 0.9 16.8 93.7
500 or more employees 803,823 37.1 42.9 100.0 2,554 1.1 17.9 100.0
Wholesalers 729,949 33.7 33.7 100.0 88,776 39.5 39.5 100.0
no. employees unknown (3) 66,625 3.1 3.1 9.1 29,336 13.1 13.1 33.0
1 to 19 employees 99,248 4.6 7.7 22.7 44,365 19.7 32.8 83.0
20 to 49 employees 56,726 2.6 10.3 30.5 7,961 3.5 36.3 92.0
50 to 99 employees 49,510 2.3 12.6 37.3 3,193 1.4 37.8 95.6
100 to 249 employees 59,076 2.7 15.3 45.4 2,277 1.0 38.8 98.1
250 to 499 employees 44,047 2.0 17.3 51.4 762 0.3 39.1 99.0
500 or more employees 354,717 16.4 33.7 100.0 882 0.4 39.5 100.0
Other companies (4) 507,842 23.4 23.4 100.0 95,654 42.6 42.6 100.0
no. employees unknown (3) 79,249 3.7 3.7 15.6 43,663 19.4 19.4 45.6
1 to 19 employees 24,596 1.1 4.8 20.4 35,078 15.6 35.0 82.3
20 to 49 employees 15,884 0.7 5.5 23.6 7,083 3.2 38.2 89.7
50 to 99 employees 9,543 0.4 6.0 25.5 3,268 1.5 39.6 93.1
100 to 249 employees 15,417 0.7 6.7 28.5 2,717 1.2 40.9 96.0
250 to 499 employees 23,647 1.1 7.8 33.1 1,176 0.5 41.4 97.2
500 or more employees 339,506 15.7 23.4 100.0 2,669 1.2 42.6 100.0
Multiple location companies 1,677,262 77.4 77.4 100.0 21,787 9.7 9.7 100.0
no. employees unknown (3) 3,502 0.2 0.2 0.2 348 0.2 0.2 1.6
1 to 19 employees 8,786 0.4 0.6 0.7 2,173 1.0 1.1 11.6
20 to 49 employees 17,120 0.8 1.4 1.8 3,185 1.4 2.5 26.2
50 to 99 employees 25,698 1.2 2.5 3.3 3,284 1.5 4.0 41.3
100 to 249 employees 66,182 3.1 5.6 7.2 4,673 2.1 6.1 62.7
250 to 499 employees 73,793 3.4 9.0 11.6 2,750 1.2 7.3 75.3
500 or more employees 1,482,182 68.4 77.4 100.0 5,374 2.4 9.7 100.0
Manufacturers 846,419 39.1 39.1 100.0 7,943 3.5 3.5 100.0
no. employees unknown (3) 177 0.0 0.0 0.0 61 0.0 0.0 0.8
1 to 19 employees 242 0.0 0.0 0.0 186 0.1 0.1 3.1
20 to 49 employees 1,432 0.1 0.1 0.2 685 0.3 0.4 11.7
50 to 99 employees 4,684 0.2 0.3 0.8 1,143 0.5 0.9 26.1
100 to 249 employees 20,527 0.9 1.2 3.2 2,137 1.0 1.9 53.0
250 to 499 employees 23,292 1.1 2.3 5.9 1,384 0.6 2.5 70.5
500 or more employees 796,066 36.7 39.1 100.0 2,347 1.0 3.5 100.0
Wholesalers 455,876 21.0 21.0 100.0 6,837 3.0 3.0 100.0
no. employees unknown (3) 3,036 0.1 0.1 0.7 166 0.1 0.1 2.4
1 to 19 employees 7,115 0.3 0.5 2.2 1,211 0.5 0.6 20.1
20 to 49 employees 13,668 0.6 1.1 5.2 1,486 0.7 1.3 41.9
50 to 99 employees 18,016 0.8 1.9 9.2 1,221 0.5 1.8 59.7
100 to 249 employees 35,616 1.6 3.6 17.0 1,327 0.6 2.4 79.1
250 to 499 employees 29,400 1.4 4.9 23.4 605 0.3 2.7 88.0
500 or more employees 349,024 16.1 21.0 100.0 821 0.4 3.0 100.0
9
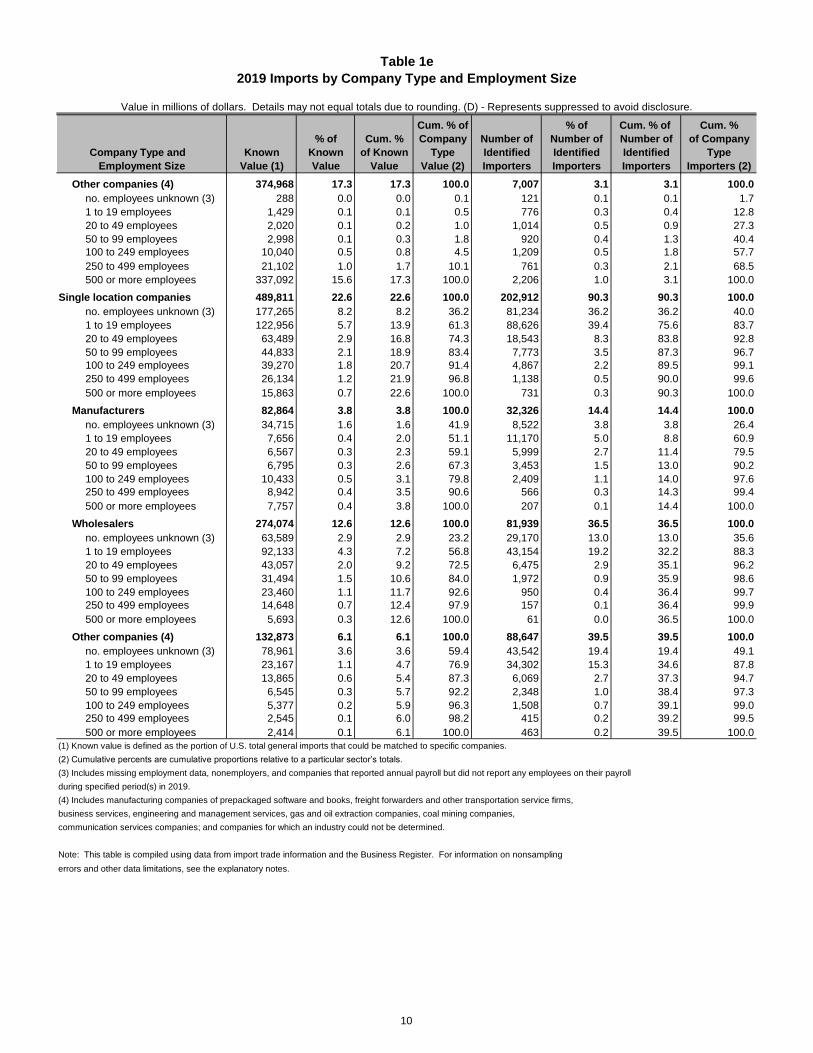
Table 1e
2019 Imports by Company Type and Employment Size
Value in millions of dollars. Details may not equal totals due to rounding. (D) - Represents suppressed to avoid disclosure.
Cum. % of % of Cum. % of Cum. %
% of Cum. % Company Number of Number of Number of of Company
Company Type and Known Known of Known Type Identified Identified Identified Type
Employment Size Value (1) Value Value Value (2) Importers Importers Importers Importers (2)
Other companies (4) 374,968 17.3 17.3 100.0 7,007 3.1 3.1 100.0
no. employees unknown (3) 288 0.0 0.0 0.1 121 0.1 0.1 1.7
1 to 19 employees 1,429 0.1 0.1 0.5 776 0.3 0.4 12.8
20 to 49 employees 2,020 0.1 0.2 1.0 1,014 0.5 0.9 27.3
50 to 99 employees 2,998 0.1 0.3 1.8 920 0.4 1.3 40.4
100 to 249 employees 10,040 0.5 0.8 4.5 1,209 0.5 1.8 57.7
250 to 499 employees 21,102 1.0 1.7 10.1 761 0.3 2.1 68.5
500 or more employees 337,092 15.6 17.3 100.0 2,206 1.0 3.1 100.0
Single location companies 489,811 22.6 22.6 100.0 202,912 90.3 90.3 100.0
no. employees unknown (3) 177,265 8.2 8.2 36.2 81,234 36.2 36.2 40.0
1 to 19 employees 122,956 5.7 13.9 61.3 88,626 39.4 75.6 83.7
20 to 49 employees 63,489 2.9 16.8 74.3 18,543 8.3 83.8 92.8
50 to 99 employees 44,833 2.1 18.9 83.4 7,773 3.5 87.3 96.7
100 to 249 employees 39,270 1.8 20.7 91.4 4,867 2.2 89.5 99.1
250 to 499 employees 26,134 1.2 21.9 96.8 1,138 0.5 90.0 99.6
500 or more employees 15,863 0.7 22.6 100.0 731 0.3 90.3 100.0
Manufacturers 82,864 3.8 3.8 100.0 32,326 14.4 14.4 100.0
no. employees unknown (3) 34,715 1.6 1.6 41.9 8,522 3.8 3.8 26.4
1 to 19 employees 7,656 0.4 2.0 51.1 11,170 5.0 8.8 60.9
20 to 49 employees 6,567 0.3 2.3 59.1 5,999 2.7 11.4 79.5
50 to 99 employees 6,795 0.3 2.6 67.3 3,453 1.5 13.0 90.2
100 to 249 employees 10,433 0.5 3.1 79.8 2,409 1.1 14.0 97.6
250 to 499 employees 8,942 0.4 3.5 90.6 566 0.3 14.3 99.4
500 or more employees 7,757 0.4 3.8 100.0 207 0.1 14.4 100.0
Wholesalers 274,074 12.6 12.6 100.0 81,939 36.5 36.5 100.0
no. employees unknown (3) 63,589 2.9 2.9 23.2 29,170 13.0 13.0 35.6
1 to 19 employees 92,133 4.3 7.2 56.8 43,154 19.2 32.2 88.3
20 to 49 employees 43,057 2.0 9.2 72.5 6,475 2.9 35.1 96.2
50 to 99 employees 31,494 1.5 10.6 84.0 1,972 0.9 35.9 98.6
100 to 249 employees 23,460 1.1 11.7 92.6 950 0.4 36.4 99.7
250 to 499 employees 14,648 0.7 12.4 97.9 157 0.1 36.4 99.9
500 or more employees 5,693 0.3 12.6 100.0 61 0.0 36.5 100.0
Other companies (4) 132,873 6.1 6.1 100.0 88,647 39.5 39.5 100.0
no. employees unknown (3) 78,961 3.6 3.6 59.4 43,542 19.4 19.4 49.1
1 to 19 employees 23,167 1.1 4.7 76.9 34,302 15.3 34.6 87.8
20 to 49 employees 13,865 0.6 5.4 87.3 6,069 2.7 37.3 94.7
50 to 99 employees 6,545 0.3 5.7 92.2 2,348 1.0 38.4 97.3
100 to 249 employees 5,377 0.2 5.9 96.3 1,508 0.7 39.1 99.0
250 to 499 employees 2,545 0.1 6.0 98.2 415 0.2 39.2 99.5
500 or more employees 2,414 0.1 6.1 100.0 463 0.2 39.5 100.0
(1) Known value is defined as the portion of U.S. total general imports that could be matched to specific companies.
(2) Cumulative percents are cumulative proportions relative to a particular sector’s totals.
(3) Includes missing employment data, nonemployers, and companies that reported annual payroll but did not report any employees on their payroll
during specified period(s) in 2019.
(4) Includes manufacturing companies of prepackaged software and books, freight forwarders and other transportation service firms,
business services, engineering and management services, gas and oil extraction companies, coal mining companies,
communication services companies; and companies for which an industry could not be determined.
Note: This table is compiled using data from import trade information and the Business Register. For information on nonsampling
errors and other data limitations, see the explanatory notes.
10

Table 1f
Percent Difference Between the 2019 and 2020 Import Results
Value in millions of dollars. Details may not equal totals due to rounding. (D) - Represents suppressed to avoid disclosure.
Known Value (1) Number of Identified Importers
Company Type and Net % Net %
Employment Size 2019 2020 Difference Difference 2019 2020 Difference Difference
All identified companies 2,167,073 2,024,454 -142,619 -6.6 224,699 221,580 -3,119 -1.4
no. employees unknown (2) 180,766 182,194 1,427 0.8 81,582 82,806 1,224 1.5
1 to 19 employees 131,742 126,744 -4,998 -3.8 90,799 88,095 -2,704 -3.0
20 to 49 employees 80,609 76,640 -3,969 -4.9 21,728 20,857 -871 -4.0
50 to 99 employees 70,531 69,192 -1,339 -1.9 11,057 10,683 -374 -3.4
100 to 249 employees 105,453 109,104 3,651 3.5 9,540 9,205 -335 -3.5
250 to 499 employees 99,927 86,919 -13,008 -13.0 3,888 3,857 -31 -0.8
500 or more employees 1,498,045 1,373,661 -124,384 -8.3 6,105 6,077 -28 -0.5
Manufacturers 929,283 791,505 -137,777 -14.8 40,269 39,407 -862 -2.1
no. employees unknown (2) 34,892 33,914 -979 -2.8 8,583 8,545 -38 -0.4
1 to 19 employees 7,898 7,917 19 0.2 11,356 11,158 -198 -1.7
20 to 49 employees 7,999 7,634 -365 -4.6 6,684 6,439 -245 -3.7
50 to 99 employees 11,479 11,355 -124 -1.1 4,596 4,376 -220 -4.8
100 to 249 employees 30,960 29,487 -1,472 -4.8 4,546 4,442 -104 -2.3
250 to 499 employees 32,233 27,157 -5,076 -15.7 1,950 1,917 -33 -1.7
500 or more employees 803,823 674,042 -129,781 -16.1 2,554 2,530 -24 -0.9
Wholesalers 729,949 699,709 -30,241 -4.1 88,776 87,542 -1,234 -1.4
no. employees unknown (2) 66,625 66,486 -139 -0.2 29,336 29,699 363 1.2
1 to 19 employees 99,248 93,942 -5,307 -5.3 44,365 43,055 -1,310 -3.0
20 to 49 employees 56,726 54,088 -2,638 -4.7 7,961 7,728 -233 -2.9
50 to 99 employees 49,510 48,223 -1,287 -2.6 3,193 3,193 0 0.0
100 to 249 employees 59,076 61,949 2,873 4.9 2,277 2,202 -75 -3.3
250 to 499 employees 44,047 41,482 -2,565 -5.8 762 785 23 3.0
500 or more employees 354,717 333,539 -21,178 -6.0 882 880 -2 -0.2
Other companies (3) 507,842 533,240 25,399 5.0 95,654 94,631 -1,023 -1.1
no. employees unknown (2) 79,249 81,794 2,545 3.2 43,663 44,562 899 2.1
1 to 19 employees 24,596 24,885 289 1.2 35,078 33,882 -1,196 -3.4
20 to 49 employees 15,884 14,918 -966 -6.1 7,083 6,690 -393 -5.5
50 to 99 employees 9,543 9,615 72 0.8 3,268 3,114 -154 -4.7
100 to 249 employees 15,417 17,667 2,251 14.6 2,717 2,561 -156 -5.7
250 to 499 employees 23,647 18,279 -5,367 -22.7 1,176 1,155 -21 -1.8
500 or more employees 339,506 366,081 26,575 7.8 2,669 2,667 -2 -0.1
Multiple location companies 1,677,262 1,542,734 -134,529 -8.0 21,787 21,272 -515 -2.4
no. employees unknown (2) 3,502 2,340 -1,161 -33.2 348 419 71 20.4
1 to 19 employees 8,786 7,745 -1,041 -11.8 2,173 2,092 -81 -3.7
20 to 49 employees 17,120 14,864 -2,256 -13.2 3,185 3,045 -140 -4.4
50 to 99 employees 25,698 26,785 1,087 4.2 3,284 3,093 -191 -5.8
100 to 249 employees 66,182 69,574 3,392 5.1 4,673 4,539 -134 -2.9
250 to 499 employees 73,793 60,843 -12,950 -17.5 2,750 2,696 -54 -2.0
500 or more employees 1,482,182 1,360,582 -121,600 -8.2 5,374 5,388 14 0.3
Manufacturers 846,419 714,211 -132,207 -15.6 7,943 7,859 -84 -1.1
no. employees unknown (2) 177 503 325 183.5 61 93 32 52.5
1 to 19 employees 242 227 -15 -6.1 186 204 18 9.7
20 to 49 employees 1,432 1,120 -312 -21.8 685 674 -11 -1.6
50 to 99 employees 4,684 4,618 -65 -1.4 1,143 1,071 -72 -6.3
100 to 249 employees 20,527 19,212 -1,315 -6.4 2,137 2,105 -32 -1.5
250 to 499 employees 23,292 20,164 -3,127 -13.4 1,384 1,360 -24 -1.7
500 or more employees 796,066 668,367 -127,699 -16.0 2,347 2,352 5 0.2
Wholesalers 455,876 432,584 -23,291 -5.1 6,837 6,725 -112 -1.6
no. employees unknown (2) 3,036 1,686 -1,350 -44.5 166 191 25 15.1
1 to 19 employees 7,115 6,054 -1,061 -14.9 1,211 1,180 -31 -2.6
20 to 49 employees 13,668 11,996 -1,672 -12.2 1,486 1,432 -54 -3.6
50 to 99 employees 18,016 18,869 853 4.7 1,221 1,210 -11 -0.9
100 to 249 employees 35,616 39,171 3,555 10.0 1,327 1,279 -48 -3.6
250 to 499 employees 29,400 25,408 -3,991 -13.6 605 607 2 0.3
500 or more employees 349,024 329,399 -19,625 -5.6 821 826 5 0.6
11

Table 1f
Percent Difference Between the 2019 and 2020 Import Results
Value in millions of dollars. Details may not equal totals due to rounding. (D) - Represents suppressed to avoid disclosure.
Known Value (1) Number of Identified Importers
Company Type and Net % Net %
Employment Size 2019 2020 Difference Difference 2019 2020 Difference Difference
Other companies (3) 374,968 395,938 20,970 5.6 7,007 6,688 -319 -4.6
no. employees unknown (2) 288 152 -136 -47.4 121 135 14 11.6
1 to 19 employees 1,429 1,464 35 2.4 776 708 -68 -8.8
20 to 49 employees 2,020 1,748 -272 -13.5 1,014 939 -75 -7.4
50 to 99 employees 2,998 3,298 300 10.0 920 812 -108 -11.7
100 to 249 employees 10,040 11,190 1,151 11.5 1,209 1,155 -54 -4.5
250 to 499 employees 21,102 15,271 -5,831 -27.6 761 729 -32 -4.2
500 or more employees 337,092 362,816 25,724 7.6 2,206 2,210 4 0.2
Single location companies 489,811 481,720 -8,091 -1.7 202,912 200,308 -2,604 -1.3
no. employees unknown (2) 177,265 179,854 2,589 1.5 81,234 82,387 1,153 1.4
1 to 19 employees 122,956 118,998 -3,958 -3.2 88,626 86,003 -2,623 -3.0
20 to 49 employees 63,489 61,776 -1,713 -2.7 18,543 17,812 -731 -3.9
50 to 99 employees 44,833 42,407 -2,426 -5.4 7,773 7,590 -183 -2.4
100 to 249 employees 39,270 39,530 260 0.7 4,867 4,666 -201 -4.1
250 to 499 employees 26,134 26,076 -58 -0.2 1,138 1,161 23 2.0
500 or more employees 15,863 13,079 -2,784 -17.5 731 689 -42 -5.7
Manufacturers 82,864 77,294 -5,570 -6.7 32,326 31,548 -778 -2.4
no. employees unknown (2) 34,715 33,411 -1,304 -3.8 8,522 8,452 -70 -0.8
1 to 19 employees 7,656 7,690 34 0.4 11,170 10,954 -216 -1.9
20 to 49 employees 6,567 6,514 -53 -0.8 5,999 5,765 -234 -3.9
50 to 99 employees 6,795 6,736 -59 -0.9 3,453 3,305 -148 -4.3
100 to 249 employees 10,433 10,275 -158 -1.5 2,409 2,337 -72 -3
250 to 499 employees 8,942 6,993 -1,949 -21.8 566 557 -9 -1.6
500 or more employees 7,757 5,675 -2,082 -26.8 207 178 -29 -14
Wholesalers 274,074 267,124 -6,949 -2.5 81,939 80,817 -1,122 -1.4
no. employees unknown (2) 63,589 64,800 1,211 1.9 29,170 29,508 338 1.2
1 to 19 employees 92,133 87,888 -4,246 -4.6 43,154 41,875 -1,279 -3
20 to 49 employees 43,057 42,092 -966 -2.2 6,475 6,296 -179 -2.8
50 to 99 employees 31,494 29,354 -2,140 -6.8 1,972 1,983 11 0.6
100 to 249 employees 23,460 22,778 -682 -2.9 950 923 -27 -2.8
250 to 499 employees 14,648 16,074 1,426 9.7 157 178 21 13.4
500 or more employees 5,693 4,140 -1,553 -27.3 61 54 -7 -11.5
Other companies (3) 132,873 137,302 4,429 3.3 88,647 87,943 -704 -0.8
no. employees unknown (2) 78,961 81,642 2,681 3.4 43,542 44,427 885 2
1 to 19 employees 23,167 23,421 254 1.1 34,302 33,174 -1,128 -3.3
20 to 49 employees 13,865 13,171 -694 -5.0 6,069 5,751 -318 -5.2
50 to 99 employees 6,545 6,317 -228 -3.5 2,348 2,302 -46 -2
100 to 249 employees 5,377 6,477 1,100 20.4 1,508 1,406 -102 -6.8
250 to 499 employees 2,545 3,009 464 18.2 415 426 11 2.7
500 or more employees 2,414 3,265 851 35.2 463 457 -6 -1.3
(1) Known value is defined as the portion of U.S. total general imports that could be matched to specific companies.
(2) Includes missing employment data, nonemployers, and companies that reported annual payroll but did not report any employees on
their payroll during specified period(s) in 2019 or 2020.
(3) Includes manufacturing companies of prepackaged software and books, freight forwarders and other transportation service firms,
business services, engineering and management services, gas and oil extraction companies, coal mining companies,
communication services companies; and companies for which an industry could not be determined.
Note: This table is compiled using data from import trade information and the Business Register. For information on nonsampling
errors and other data limitations, see the explanatory notes.
12
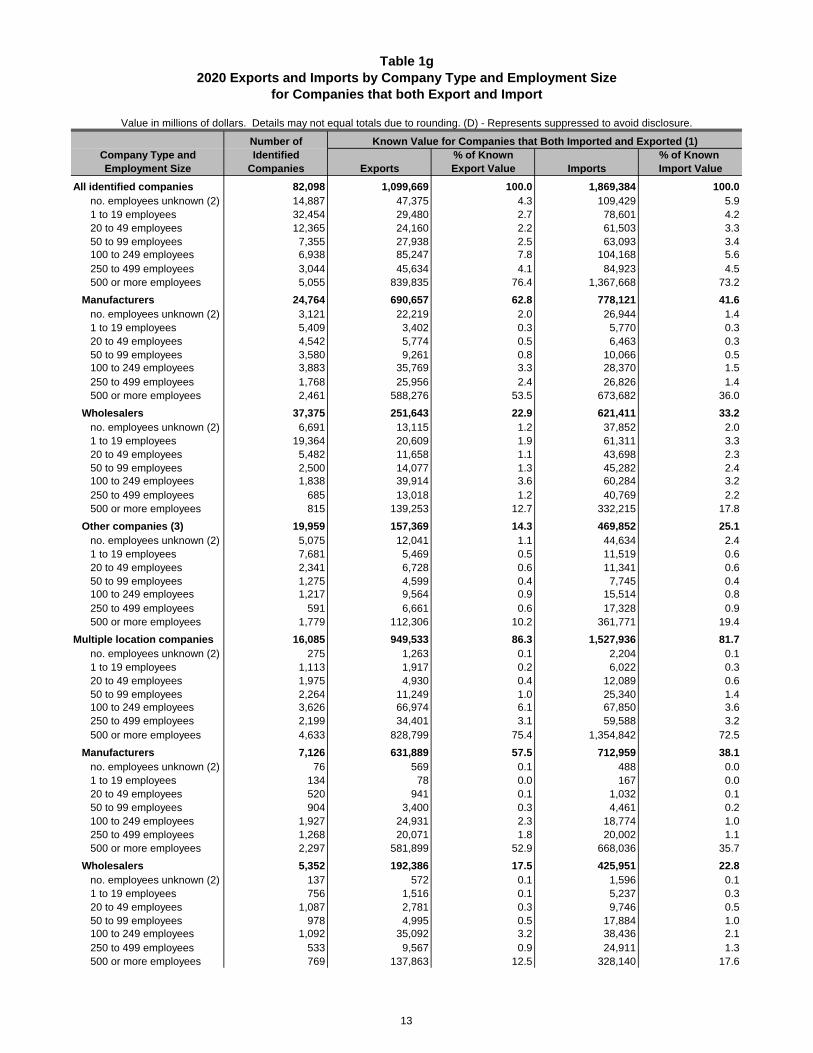
Table 1g
2020 Exports and Imports by Company Type and Employment Size
Value in millions of dollars. Details may not equal totals due to rounding. (D) - Represents suppressed to avoid disclosure.
Number of Known Value for Companies that Both Imported and Exported (1)
Company Type and Identified % of Known % of Known
Employment Size Companies Exports Export Value Imports Import Value
All identified companies 82,098 1,099,669 100.0 1,869,384 100.0
no. employees unknown (2) 14,887 47,375 4.3 109,429 5.9
1 to 19 employees 32,454 29,480 2.7 78,601 4.2
20 to 49 employees 12,365 24,160 2.2 61,503 3.3
50 to 99 employees 7,355 27,938 2.5 63,093 3.4
100 to 249 employees 6,938 85,247 7.8 104,168 5.6
250 to 499 employees 3,044 45,634 4.1 84,923 4.5
500 or more employees 5,055 839,835 76.4 1,367,668 73.2
Manufacturers 24,764 690,657 62.8 778,121 41.6
no. employees unknown (2) 3,121 22,219 2.0 26,944 1.4
1 to 19 employees 5,409 3,402 0.3 5,770 0.3
20 to 49 employees 4,542 5,774 0.5 6,463 0.3
50 to 99 employees 3,580 9,261 0.8 10,066 0.5
100 to 249 employees 3,883 35,769 3.3 28,370 1.5
250 to 499 employees 1,768 25,956 2.4 26,826 1.4
500 or more employees 2,461 588,276 53.5 673,682 36.0
Wholesalers 37,375 251,643 22.9 621,411 33.2
no. employees unknown (2) 6,691 13,115 1.2 37,852 2.0
1 to 19 employees 19,364 20,609 1.9 61,311 3.3
20 to 49 employees 5,482 11,658 1.1 43,698 2.3
50 to 99 employees 2,500 14,077 1.3 45,282 2.4
100 to 249 employees 1,838 39,914 3.6 60,284 3.2
250 to 499 employees 685 13,018 1.2 40,769 2.2
500 or more employees 815 139,253 12.7 332,215 17.8
Other companies (3) 19,959 157,369 14.3 469,852 25.1
no. employees unknown (2) 5,075 12,041 1.1 44,634 2.4
1 to 19 employees 7,681 5,469 0.5 11,519 0.6
20 to 49 employees 2,341 6,728 0.6 11,341 0.6
50 to 99 employees 1,275 4,599 0.4 7,745 0.4
100 to 249 employees 1,217 9,564 0.9 15,514 0.8
250 to 499 employees 591 6,661 0.6 17,328 0.9
500 or more employees 1,779 112,306 10.2 361,771 19.4
Multiple location companies 16,085 949,533 86.3 1,527,936 81.7
no. employees unknown (2) 275 1,263 0.1 2,204 0.1
1 to 19 employees 1,113 1,917 0.2 6,022 0.3
20 to 49 employees 1,975 4,930 0.4 12,089 0.6
50 to 99 employees 2,264 11,249 1.0 25,340 1.4
100 to 249 employees 3,626 66,974 6.1 67,850 3.6
250 to 499 employees 2,199 34,401 3.1 59,588 3.2
500 or more employees 4,633 828,799 75.4 1,354,842 72.5
Manufacturers 7,126 631,889 57.5 712,959 38.1
no. employees unknown (2) 76 569 0.1 488 0.0
1 to 19 employees 134 78 0.0 167 0.0
20 to 49 employees 520 941 0.1 1,032 0.1
50 to 99 employees 904 3,400 0.3 4,461 0.2
100 to 249 employees 1,927 24,931 2.3 18,774 1.0
250 to 499 employees 1,268 20,071 1.8 20,002 1.1
500 or more employees 2,297 581,899 52.9 668,036 35.7
Wholesalers 5,352 192,386 17.5 425,951 22.8
no. employees unknown (2) 137 572 0.1 1,596 0.1
1 to 19 employees 756 1,516 0.1 5,237 0.3
20 to 49 employees 1,087 2,781 0.3 9,746 0.5
50 to 99 employees 978 4,995 0.5 17,884 1.0
100 to 249 employees 1,092 35,092 3.2 38,436 2.1
250 to 499 employees 533 9,567 0.9 24,911 1.3
500 or more employees 769 137,863 12.5 328,140 17.6
for Companies that both Export and Import
13

Table 1g
2020 Exports and Imports by Company Type and Employment Size
Value in millions of dollars. Details may not equal totals due to rounding. (D) - Represents suppressed to avoid disclosure.
Number of Known Value for Companies that Both Imported and Exported (1)
Company Type and Identified % of Known % of Known
Employment Size Companies Exports Export Value Imports Import Value
for Companies that both Export and Import
Other companies (3) 3,607 125,257 11.4 389,026 20.8
no. employees unknown (2) 62 122 0.0 120 0.0
1 to 19 employees 223 322 0.0 619 0.0
20 to 49 employees 368 1,208 0.1 1,311 0.1
50 to 99 employees 382 2,854 0.3 2,996 0.2
100 to 249 employees 607 6,951 0.6 10,639 0.6
250 to 499 employees 398 4,763 0.4 14,675 0.8
500 or more employees 1,567 109,037 9.9 358,666 19.2
Single location companies 66,013 150,136 13.7 341,448 18.3
no. employees unknown (2) 14,612 46,113 4.2 107,225 5.7
1 to 19 employees 31,341 27,563 2.5 72,578 3.9
20 to 49 employees 10,390 19,229 1.7 49,413 2.6
50 to 99 employees 5,091 16,689 1.5 37,753 2.0
100 to 249 employees 3,312 18,273 1.7 36,318 1.9
250 to 499 employees 845 11,233 1.0 25,335 1.4
500 or more employees 422 11,036 1.0 12,826 0.7
Manufacturers 17,638 58,768 5.3 65,162 3.5
no. employees unknown (2) 3,045 21,651 2.0 26,456 1.4
1 to 19 employees 5,275 3,324 0.3 5,604 0.3
20 to 49 employees 4,022 4,833 0.4 5,431 0.3
50 to 99 employees 2,676 5,861 0.5 5,605 0.3
100 to 249 employees 1,956 10,838 1.0 9,596 0.5
250 to 499 employees 500 5,885 0.5 6,824 0.4
500 or more employees 164 6,377 0.6 5,646 0.3
Wholesalers 32,023 59,257 5.4 195,461 10.5
no. employees unknown (2) 6,554 12,543 1.1 36,256 1.9
1 to 19 employees 18,608 19,093 1.7 56,074 3.0
20 to 49 employees 4,395 8,877 0.8 33,952 1.8
50 to 99 employees 1,522 9,082 0.8 27,399 1.5
100 to 249 employees 746 4,822 0.4 21,848 1.2
250 to 499 employees 152 3,450 0.3 15,858 0.8
500 or more employees 46 1,390 0.1 4,075 0.2
Other companies (3) 16,352 32,112 2.9 80,826 4.3
no. employees unknown (2) 5,013 11,919 1.1 44,514 2.4
1 to 19 employees 7,458 5,147 0.5 10,901 0.6
20 to 49 employees 1,973 5,520 0.5 10,030 0.5
50 to 99 employees 893 1,746 0.2 4,749 0.3
100 to 249 employees 610 2,613 0.2 4,875 0.3
250 to 499 employees 193 1,898 0.2 2,653 0.1
500 or more employees 212 3,269 0.3 3,104 0.2
(1) Known value is defined as the portion of U.S. total exports or U.S. total general imports that could be matched to specific companies.
(2) Includes missing employment data, nonemployers, and companies that reported annual payroll but did not report any employees on
their payroll during specified period(s) in 2020.
(3) Includes manufacturing companies of prepackaged software and books, freight forwarders and other transportation service firms,
business services, engineering and management services, gas and oil extraction companies, coal mining companies,
communication services companies; and companies for which an industry could not be determined.
Note: This table is compiled using data from export and import trade information and the Business Register. For information on
nonsampling errors and other data limitations, see the explanatory notes.
14
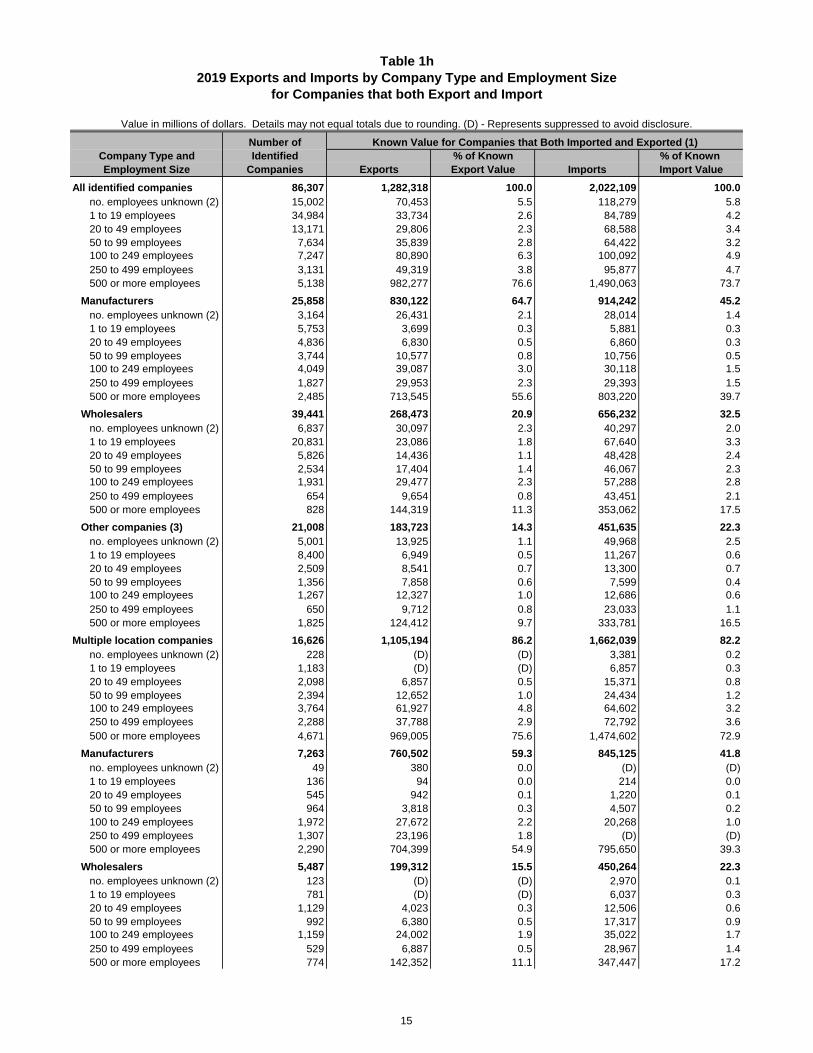
Table 1h
2019 Exports and Imports by Company Type and Employment Size
Value in millions of dollars. Details may not equal totals due to rounding. (D) - Represents suppressed to avoid disclosure.
Number of Known Value for Companies that Both Imported and Exported (1)
Company Type and Identified % of Known % of Known
Employment Size Companies Exports Export Value Imports Import Value
All identified companies 86,307 1,282,318 100.0 2,022,109 100.0
no. employees unknown (2) 15,002 70,453 5.5 118,279 5.8
1 to 19 employees 34,984 33,734 2.6 84,789 4.2
20 to 49 employees 13,171 29,806 2.3 68,588 3.4
50 to 99 employees 7,634 35,839 2.8 64,422 3.2
100 to 249 employees 7,247 80,890 6.3 100,092 4.9
250 to 499 employees 3,131 49,319 3.8 95,877 4.7
500 or more employees 5,138 982,277 76.6 1,490,063 73.7
Manufacturers 25,858 830,122 64.7 914,242 45.2
no. employees unknown (2) 3,164 26,431 2.1 28,014 1.4
1 to 19 employees 5,753 3,699 0.3 5,881 0.3
20 to 49 employees 4,836 6,830 0.5 6,860 0.3
50 to 99 employees 3,744 10,577 0.8 10,756 0.5
100 to 249 employees 4,049 39,087 3.0 30,118 1.5
250 to 499 employees 1,827 29,953 2.3 29,393 1.5
500 or more employees 2,485 713,545 55.6 803,220 39.7
Wholesalers 39,441 268,473 20.9 656,232 32.5
no. employees unknown (2) 6,837 30,097 2.3 40,297 2.0
1 to 19 employees 20,831 23,086 1.8 67,640 3.3
20 to 49 employees 5,826 14,436 1.1 48,428 2.4
50 to 99 employees 2,534 17,404 1.4 46,067 2.3
100 to 249 employees 1,931 29,477 2.3 57,288 2.8
250 to 499 employees 654 9,654 0.8 43,451 2.1
500 or more employees 828 144,319 11.3 353,062 17.5
Other companies (3) 21,008 183,723 14.3 451,635 22.3
no. employees unknown (2) 5,001 13,925 1.1 49,968 2.5
1 to 19 employees 8,400 6,949 0.5 11,267 0.6
20 to 49 employees 2,509 8,541 0.7 13,300 0.7
50 to 99 employees 1,356 7,858 0.6 7,599 0.4
100 to 249 employees 1,267 12,327 1.0 12,686 0.6
250 to 499 employees 650 9,712 0.8 23,033 1.1
500 or more employees 1,825 124,412 9.7 333,781 16.5
Multiple location companies 16,626 1,105,194 86.2 1,662,039 82.2
no. employees unknown (2) 228 (D) (D) 3,381 0.2
1 to 19 employees 1,183 (D) (D) 6,857 0.3
20 to 49 employees 2,098 6,857 0.5 15,371 0.8
50 to 99 employees 2,394 12,652 1.0 24,434 1.2
100 to 249 employees 3,764 61,927 4.8 64,602 3.2
250 to 499 employees 2,288 37,788 2.9 72,792 3.6
500 or more employees 4,671 969,005 75.6 1,474,602 72.9
Manufacturers 7,263 760,502 59.3 845,125 41.8
no. employees unknown (2) 49 380 0.0 (D) (D)
1 to 19 employees 136 94 0.0 214 0.0
20 to 49 employees 545 942 0.1 1,220 0.1
50 to 99 employees 964 3,818 0.3 4,507 0.2
100 to 249 employees 1,972 27,672 2.2 20,268 1.0
250 to 499 employees 1,307 23,196 1.8 (D) (D)
500 or more employees 2,290 704,399 54.9 795,650 39.3
Wholesalers 5,487 199,312 15.5 450,264 22.3
no. employees unknown (2) 123 (D) (D) 2,970 0.1
1 to 19 employees 781 (D) (D) 6,037 0.3
20 to 49 employees 1,129 4,023 0.3 12,506 0.6
50 to 99 employees 992 6,380 0.5 17,317 0.9
100 to 249 employees 1,159 24,002 1.9 35,022 1.7
250 to 499 employees 529 6,887 0.5 28,967 1.4
500 or more employees 774 142,352 11.1 347,447 17.2
for Companies that both Export and Import
15
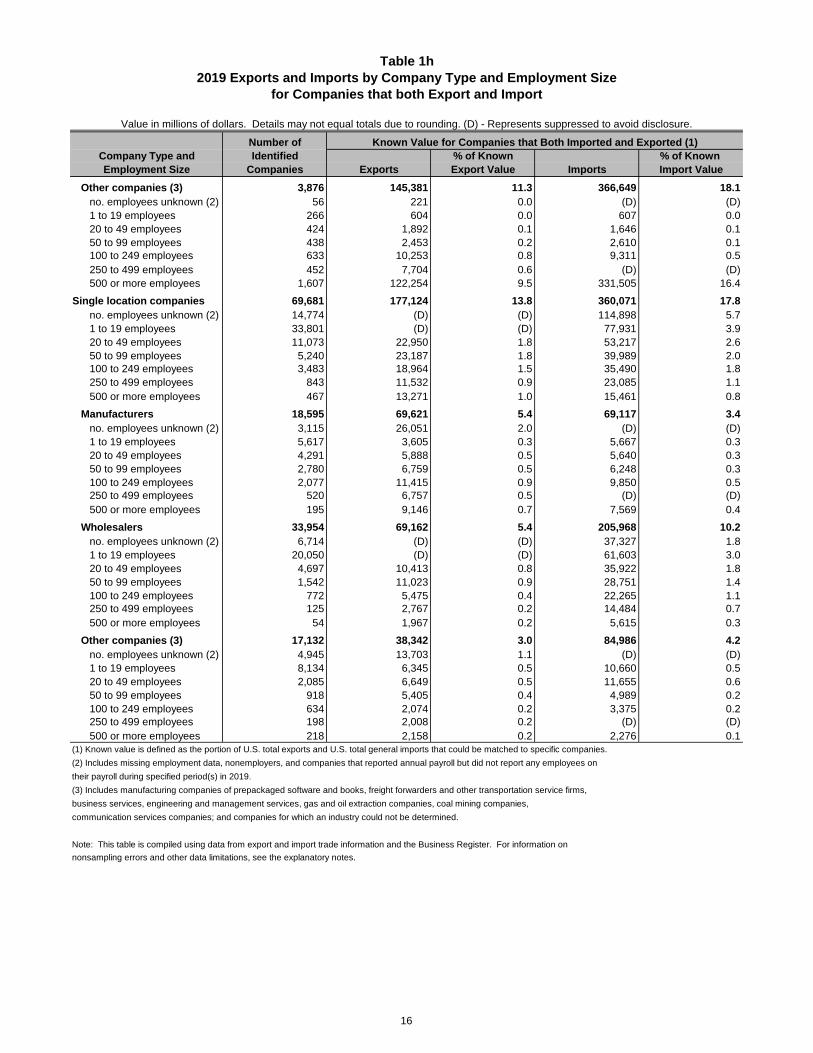
Table 1h
2019 Exports and Imports by Company Type and Employment Size
Value in millions of dollars. Details may not equal totals due to rounding. (D) - Represents suppressed to avoid disclosure.
Number of Known Value for Companies that Both Imported and Exported (1)
Company Type and Identified % of Known % of Known
Employment Size Companies Exports Export Value Imports Import Value
for Companies that both Export and Import
Other companies (3) 3,876 145,381 11.3 366,649 18.1
no. employees unknown (2) 56 221 0.0 (D) (D)
1 to 19 employees 266 604 0.0 607 0.0
20 to 49 employees 424 1,892 0.1 1,646 0.1
50 to 99 employees 438 2,453 0.2 2,610 0.1
100 to 249 employees 633 10,253 0.8 9,311 0.5
250 to 499 employees 452 7,704 0.6 (D) (D)
500 or more employees 1,607 122,254 9.5 331,505 16.4
Single location companies 69,681 177,124 13.8 360,071 17.8
no. employees unknown (2) 14,774 (D) (D) 114,898 5.7
1 to 19 employees 33,801 (D) (D) 77,931 3.9
20 to 49 employees 11,073 22,950 1.8 53,217 2.6
50 to 99 employees 5,240 23,187 1.8 39,989 2.0
100 to 249 employees 3,483 18,964 1.5 35,490 1.8
250 to 499 employees 843 11,532 0.9 23,085 1.1
500 or more employees 467 13,271 1.0 15,461 0.8
Manufacturers 18,595 69,621 5.4 69,117 3.4
no. employees unknown (2) 3,115 26,051 2.0 (D) (D)
1 to 19 employees 5,617 3,605 0.3 5,667 0.3
20 to 49 employees 4,291 5,888 0.5 5,640 0.3
50 to 99 employees 2,780 6,759 0.5 6,248 0.3
100 to 249 employees 2,077 11,415 0.9 9,850 0.5
250 to 499 employees 520 6,757 0.5 (D) (D)
500 or more employees 195 9,146 0.7 7,569 0.4
Wholesalers 33,954 69,162 5.4 205,968 10.2
no. employees unknown (2) 6,714 (D) (D) 37,327 1.8
1 to 19 employees 20,050 (D) (D) 61,603 3.0
20 to 49 employees 4,697 10,413 0.8 35,922 1.8
50 to 99 employees 1,542 11,023 0.9 28,751 1.4
100 to 249 employees 772 5,475 0.4 22,265 1.1
250 to 499 employees 125 2,767 0.2 14,484 0.7
500 or more employees 54 1,967 0.2 5,615 0.3
Other companies (3) 17,132 38,342 3.0 84,986 4.2
no. employees unknown (2) 4,945 13,703 1.1 (D) (D)
1 to 19 employees 8,134 6,345 0.5 10,660 0.5
20 to 49 employees 2,085 6,649 0.5 11,655 0.6
50 to 99 employees 918 5,405 0.4 4,989 0.2
100 to 249 employees 634 2,074 0.2 3,375 0.2
250 to 499 employees 198 2,008 0.2 (D) (D)
500 or more employees 218 2,158 0.2 2,276 0.1
(1) Known value is defined as the portion of U.S. total exports and U.S. total general imports that could be matched to specific companies.
(2) Includes missing employment data, nonemployers, and companies that reported annual payroll but did not report any employees on
their payroll during specified period(s) in 2019.
(3) Includes manufacturing companies of prepackaged software and books, freight forwarders and other transportation service firms,
business services, engineering and management services, gas and oil extraction companies, coal mining companies,
communication services companies; and companies for which an industry could not be determined.
Note: This table is compiled using data from export and import trade information and the Business Register. For information on
nonsampling errors and other data limitations, see the explanatory notes.
16
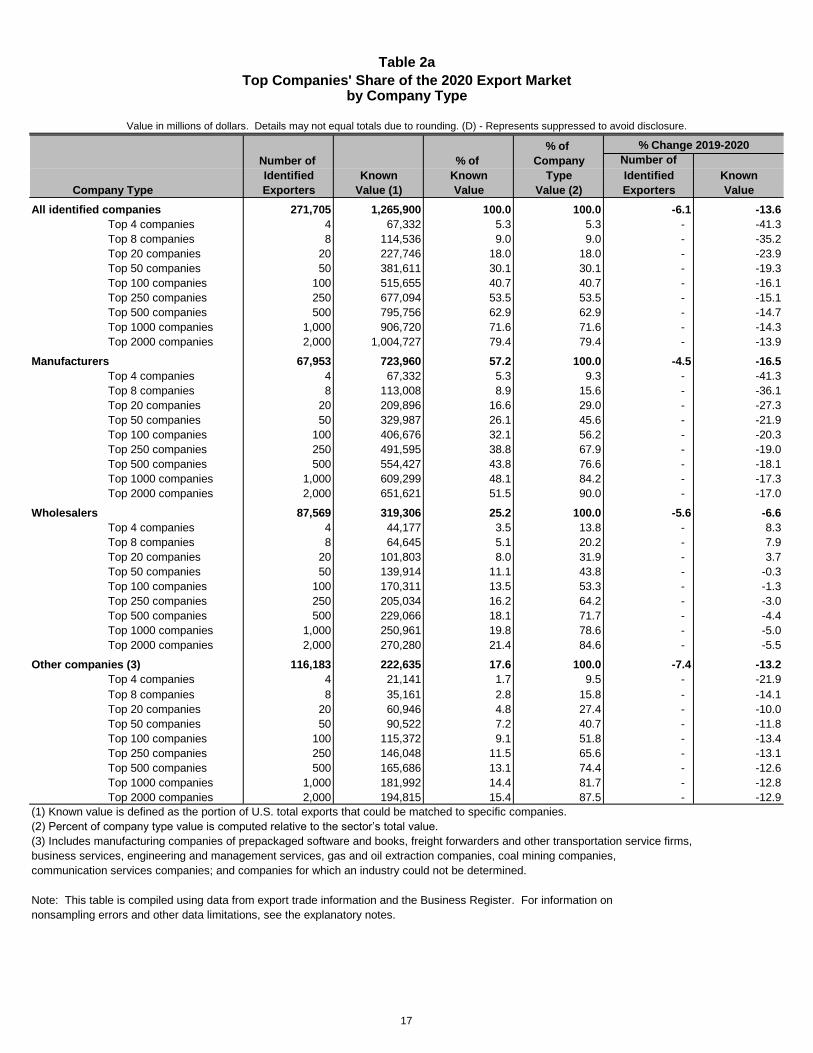
Table 2a
Top Companies' Share of the 2020 Export Marketby Company Type
Value in millions of dollars. Details may not equal totals due to rounding. (D) - Represents suppressed to avoid disclosure.
% of % Change 2019-2020
Number of % of Company Number of
Identified Known Known Type Identified Known
Company Type Exporters Value (1) Value Value (2) Exporters Value
All identified companies 271,705 1,265,900 100.0 100.0 -6.1 -13.6
Top 4 companies 4 67,332 5.3 5.3 - -41.3
Top 8 companies 8 114,536 9.0 9.0 - -35.2
Top 20 companies 20 227,746 18.0 18.0 - -23.9
Top 50 companies 50 381,611 30.1 30.1 - -19.3
Top 100 companies 100 515,655 40.7 40.7 - -16.1
Top 250 companies 250 677,094 53.5 53.5 - -15.1
Top 500 companies 500 795,756 62.9 62.9 - -14.7
Top 1000 companies 1,000 906,720 71.6 71.6 - -14.3
Top 2000 companies 2,000 1,004,727 79.4 79.4 - -13.9
Manufacturers 67,953 723,960 57.2 100.0 -4.5 -16.5
Top 4 companies 4 67,332 5.3 9.3 - -41.3
Top 8 companies 8 113,008 8.9 15.6 - -36.1
Top 20 companies 20 209,896 16.6 29.0 - -27.3
Top 50 companies 50 329,987 26.1 45.6 - -21.9
Top 100 companies 100 406,676 32.1 56.2 - -20.3
Top 250 companies 250 491,595 38.8 67.9 - -19.0
Top 500 companies 500 554,427 43.8 76.6 - -18.1
Top 1000 companies 1,000 609,299 48.1 84.2 - -17.3
Top 2000 companies 2,000 651,621 51.5 90.0 - -17.0
Wholesalers 87,569 319,306 25.2 100.0 -5.6 -6.6
Top 4 companies 4 44,177 3.5 13.8 - 8.3
Top 8 companies 8 64,645 5.1 20.2 - 7.9
Top 20 companies 20 101,803 8.0 31.9 - 3.7
Top 50 companies 50 139,914 11.1 43.8 - -0.3
Top 100 companies 100 170,311 13.5 53.3 - -1.3
Top 250 companies 250 205,034 16.2 64.2 - -3.0
Top 500 companies 500 229,066 18.1 71.7 - -4.4
Top 1000 companies 1,000 250,961 19.8 78.6 - -5.0
Top 2000 companies 2,000 270,280 21.4 84.6 - -5.5
Other companies (3) 116,183 222,635 17.6 100.0 -7.4 -13.2
Top 4 companies 4 21,141 1.7 9.5 - -21.9
Top 8 companies 8 35,161 2.8 15.8 - -14.1
Top 20 companies 20 60,946 4.8 27.4 - -10.0
Top 50 companies 50 90,522 7.2 40.7 - -11.8
Top 100 companies 100 115,372 9.1 51.8 - -13.4
Top 250 companies 250 146,048 11.5 65.6 - -13.1
Top 500 companies 500 165,686 13.1 74.4 - -12.6
Top 1000 companies 1,000 181,992 14.4 81.7 - -12.8
Top 2000 companies 2,000 194,815 15.4 87.5 - -12.9
(1) Known value is defined as the portion of U.S. total exports that could be matched to specific companies.
(2) Percent of company type value is computed relative to the sector’s total value.
(3) Includes manufacturing companies of prepackaged software and books, freight forwarders and other transportation service firms,
business services, engineering and management services, gas and oil extraction companies, coal mining companies,
communication services companies; and companies for which an industry could not be determined.
Note: This table is compiled using data from export trade information and the Business Register. For information on
nonsampling errors and other data limitations, see the explanatory notes.
17
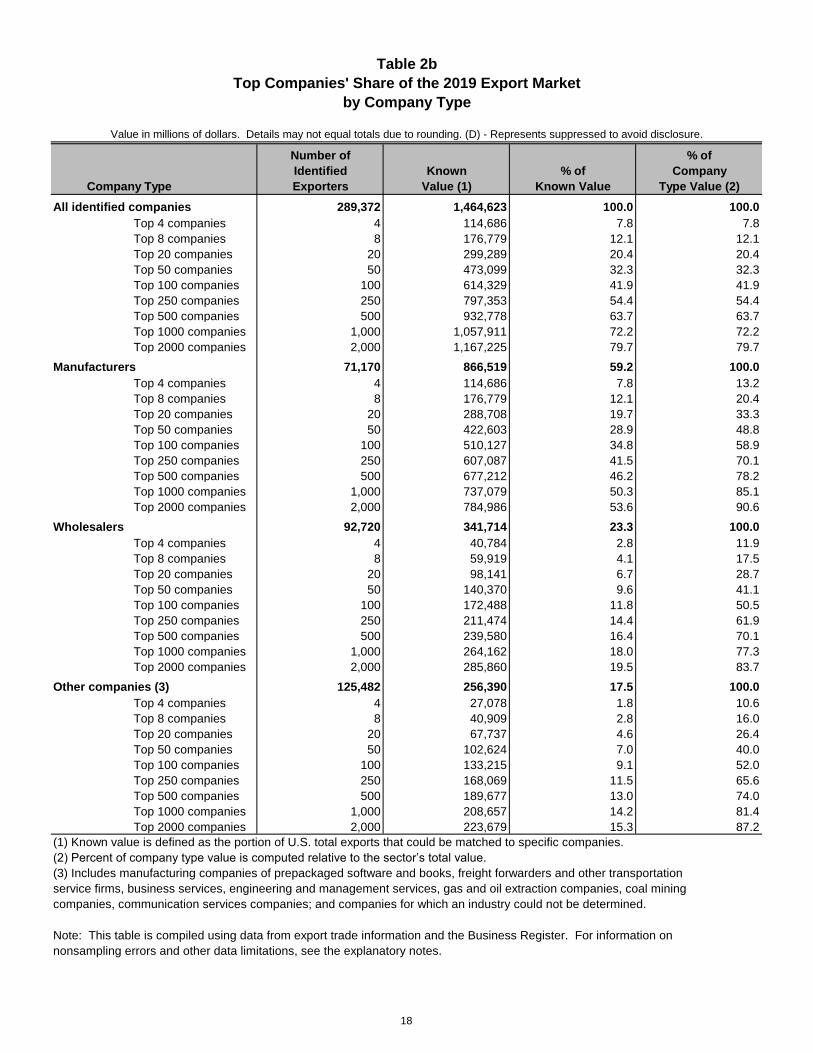
Table 2b
Top Companies' Share of the 2019 Export Market
by Company Type
Number of % of
Identified Known % of Company
Company Type Exporters Value (1) Known Value Type Value (2)
All identified companies 289,372 1,464,623 100.0 100.0
Top 4 companies 4 114,686 7.8 7.8
Top 8 companies 8 176,779 12.1 12.1
Top 20 companies 20 299,289 20.4 20.4
Top 50 companies 50 473,099 32.3 32.3
Top 100 companies 100 614,329 41.9 41.9
Top 250 companies 250 797,353 54.4 54.4
Top 500 companies 500 932,778 63.7 63.7
Top 1000 companies 1,000 1,057,911 72.2 72.2
Top 2000 companies 2,000 1,167,225 79.7 79.7
Manufacturers 71,170 866,519 59.2 100.0
Top 4 companies 4 114,686 7.8 13.2
Top 8 companies 8 176,779 12.1 20.4
Top 20 companies 20 288,708 19.7 33.3
Top 50 companies 50 422,603 28.9 48.8
Top 100 companies 100 510,127 34.8 58.9
Top 250 companies 250 607,087 41.5 70.1
Top 500 companies 500 677,212 46.2 78.2
Top 1000 companies 1,000 737,079 50.3 85.1
Top 2000 companies 2,000 784,986 53.6 90.6
Wholesalers 92,720 341,714 23.3 100.0
Top 4 companies 4 40,784 2.8 11.9
Top 8 companies 8 59,919 4.1 17.5
Top 20 companies 20 98,141 6.7 28.7
Top 50 companies 50 140,370 9.6 41.1
Top 100 companies 100 172,488 11.8 50.5
Top 250 companies 250 211,474 14.4 61.9
Top 500 companies 500 239,580 16.4 70.1
Top 1000 companies 1,000 264,162 18.0 77.3
Top 2000 companies 2,000 285,860 19.5 83.7
Other companies (3) 125,482 256,390 17.5 100.0
Top 4 companies 4 27,078 1.8 10.6
Top 8 companies 8 40,909 2.8 16.0
Top 20 companies 20 67,737 4.6 26.4
Top 50 companies 50 102,624 7.0 40.0
Top 100 companies 100 133,215 9.1 52.0
Top 250 companies 250 168,069 11.5 65.6
Top 500 companies 500 189,677 13.0 74.0
Top 1000 companies 1,000 208,657 14.2 81.4
Top 2000 companies 2,000 223,679 15.3 87.2
(1) Known value is defined as the portion of U.S. total exports that could be matched to specific companies.
(2) Percent of company type value is computed relative to the sector’s total value.
(3) Includes manufacturing companies of prepackaged software and books, freight forwarders and other transportation
service firms, business services, engineering and management services, gas and oil extraction companies, coal mining
companies, communication services companies; and companies for which an industry could not be determined.
Note: This table is compiled using data from export trade information and the Business Register. For information on
nonsampling errors and other data limitations, see the explanatory notes.
Value in millions of dollars. Details may not equal totals due to rounding. (D) - Represents suppressed to avoid disclosure.
18
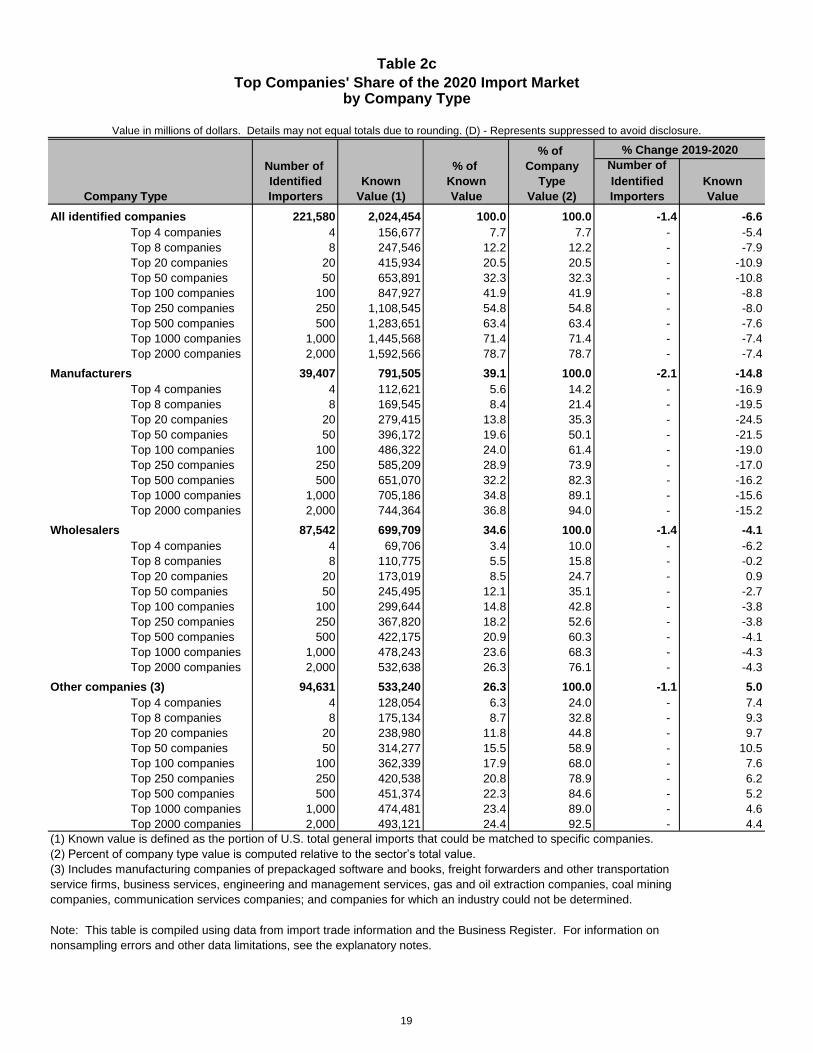
Table 2c
Top Companies' Share of the 2020 Import Marketby Company Type
Value in millions of dollars. Details may not equal totals due to rounding. (D) - Represents suppressed to avoid disclosure.
% of % Change 2019-2020
Number of % of Company Number of
Identified Known Known Type Identified Known
Company Type Importers Value (1) Value Value (2) Importers Value
All identified companies 221,580 2,024,454 100.0 100.0 -1.4 -6.6
Top 4 companies 4 156,677 7.7 7.7 - -5.4
Top 8 companies 8 247,546 12.2 12.2 - -7.9
Top 20 companies 20 415,934 20.5 20.5 - -10.9
Top 50 companies 50 653,891 32.3 32.3 - -10.8
Top 100 companies 100 847,927 41.9 41.9 - -8.8
Top 250 companies 250 1,108,545 54.8 54.8 - -8.0
Top 500 companies 500 1,283,651 63.4 63.4 - -7.6
Top 1000 companies 1,000 1,445,568 71.4 71.4 - -7.4
Top 2000 companies 2,000 1,592,566 78.7 78.7 - -7.4
Manufacturers 39,407 791,505 39.1 100.0 -2.1 -14.8
Top 4 companies 4 112,621 5.6 14.2 - -16.9
Top 8 companies 8 169,545 8.4 21.4 - -19.5
Top 20 companies 20 279,415 13.8 35.3 - -24.5
Top 50 companies 50 396,172 19.6 50.1 - -21.5
Top 100 companies 100 486,322 24.0 61.4 - -19.0
Top 250 companies 250 585,209 28.9 73.9 - -17.0
Top 500 companies 500 651,070 32.2 82.3 - -16.2
Top 1000 companies 1,000 705,186 34.8 89.1 - -15.6
Top 2000 companies 2,000 744,364 36.8 94.0 - -15.2
Wholesalers 87,542 699,709 34.6 100.0 -1.4 -4.1
Top 4 companies 4 69,706 3.4 10.0 - -6.2
Top 8 companies 8 110,775 5.5 15.8 - -0.2
Top 20 companies 20 173,019 8.5 24.7 - 0.9
Top 50 companies 50 245,495 12.1 35.1 - -2.7
Top 100 companies 100 299,644 14.8 42.8 - -3.8
Top 250 companies 250 367,820 18.2 52.6 - -3.8
Top 500 companies 500 422,175 20.9 60.3 - -4.1
Top 1000 companies 1,000 478,243 23.6 68.3 - -4.3
Top 2000 companies 2,000 532,638 26.3 76.1 - -4.3
Other companies (3) 94,631 533,240 26.3 100.0 -1.1 5.0
Top 4 companies 4 128,054 6.3 24.0 - 7.4
Top 8 companies 8 175,134 8.7 32.8 - 9.3
Top 20 companies 20 238,980 11.8 44.8 - 9.7
Top 50 companies 50 314,277 15.5 58.9 - 10.5
Top 100 companies 100 362,339 17.9 68.0 - 7.6
Top 250 companies 250 420,538 20.8 78.9 - 6.2
Top 500 companies 500 451,374 22.3 84.6 - 5.2
Top 1000 companies 1,000 474,481 23.4 89.0 - 4.6
Top 2000 companies 2,000 493,121 24.4 92.5 - 4.4
(1) Known value is defined as the portion of U.S. total general imports that could be matched to specific companies.
(2) Percent of company type value is computed relative to the sector’s total value.
(3) Includes manufacturing companies of prepackaged software and books, freight forwarders and other transportation
service firms, business services, engineering and management services, gas and oil extraction companies, coal mining
companies, communication services companies; and companies for which an industry could not be determined.
Note: This table is compiled using data from import trade information and the Business Register. For information on
nonsampling errors and other data limitations, see the explanatory notes.
19

Table 2d
Top Companies' Share of the 2019 Import Market
by Company Type
Number of % of
Identified Known % of Company
Company Type Importers Value (1) Known Value Type Value (2)
All identified companies 224,699 2,167,073 100.0 100.0
Top 4 companies 4 165,624 7.6 7.6
Top 8 companies 8 268,726 12.4 12.4
Top 20 companies 20 466,574 21.5 21.5
Top 50 companies 50 733,264 33.8 33.8
Top 100 companies 100 929,558 42.9 42.9
Top 250 companies 250 1,204,728 55.6 55.6
Top 500 companies 500 1,389,584 64.1 64.1
Top 1000 companies 1,000 1,560,420 72.0 72.0
Top 2000 companies 2,000 1,718,947 79.3 79.3
Manufacturers 40,269 929,283 42.9 100.0
Top 4 companies 4 135,450 6.3 14.6
Top 8 companies 8 210,637 9.7 22.7
Top 20 companies 20 370,133 17.1 39.8
Top 50 companies 50 504,473 23.3 54.3
Top 100 companies 100 600,323 27.7 64.6
Top 250 companies 250 705,077 32.5 75.9
Top 500 companies 500 776,620 35.8 83.6
Top 1000 companies 1,000 835,320 38.5 89.9
Top 2000 companies 2,000 878,115 40.5 94.5
Wholesalers 88,776 729,949 33.7 100.0
Top 4 companies 4 74,336 3.4 10.2
Top 8 companies 8 111,018 5.1 15.2
Top 20 companies 20 171,410 7.9 23.5
Top 50 companies 50 252,281 11.6 34.6
Top 100 companies 100 311,443 14.4 42.7
Top 250 companies 250 382,384 17.6 52.4
Top 500 companies 500 440,309 20.3 60.3
Top 1000 companies 1,000 499,658 23.1 68.5
Top 2000 companies 2,000 556,460 25.7 76.2
Other companies (3) 95,654 507,842 23.4 100.0
Top 4 companies 4 119,254 5.5 23.5
Top 8 companies 8 160,275 7.4 31.6
Top 20 companies 20 217,904 10.1 42.9
Top 50 companies 50 284,415 13.1 56.0
Top 100 companies 100 336,618 15.5 66.3
Top 250 companies 250 396,071 18.3 78.0
Top 500 companies 500 429,126 19.8 84.5
Top 1000 companies 1,000 453,829 20.9 89.4
Top 2000 companies 2,000 472,166 21.8 93.0
(1) Known value is defined as the portion of U.S. total general imports that could be matched to specific companies.
(2) Percent of company type value is computed relative to the sector’s total value.
(3) Includes manufacturing companies of prepackaged software and books, freight forwarders and other transportation
service firms, business services, engineering and management services, gas and oil extraction companies, coal mining
companies, communication services companies; and companies for which an industry could not be determined.
Note: This table is compiled using data from import trade information and the Business Register. For information on
nonsampling errors and other data limitations, see the explanatory notes.
Value in millions of dollars. Details may not equal totals due to rounding. (D) - Represents suppressed to avoid disclosure.
20
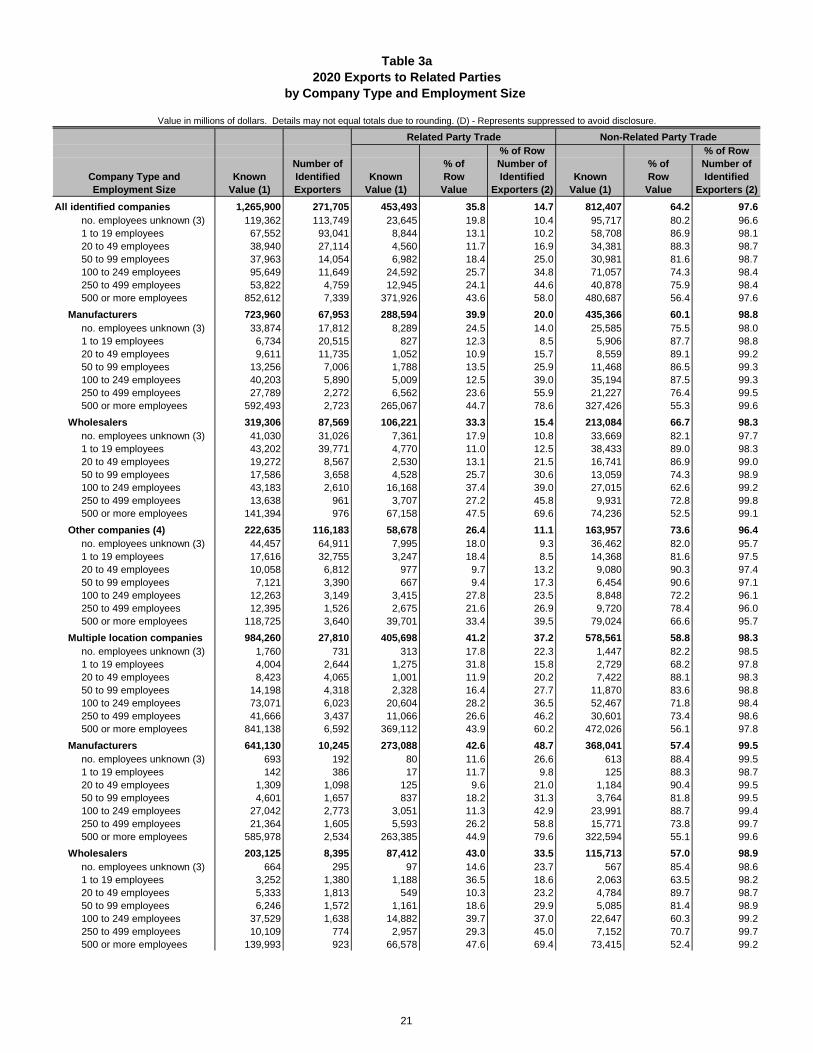
Table 3a
2020 Exports to Related Parties
by Company Type and Employment Size
Value in millions of dollars. Details may not equal totals due to rounding. (D) - Represents suppressed to avoid disclosure.
Related Party Trade Non-Related Party Trade
% of Row % of Row
Number of % of Number of % of Number of
Company Type and Known Identified Known Row Identified Known Row Identified
Employment Size Value (1) Exporters Value (1) Value Exporters (2) Value (1) Value Exporters (2)
All identified companies 1,265,900 271,705 453,493 35.8 14.7 812,407 64.2 97.6
no. employees unknown (3) 119,362 113,749 23,645 19.8 10.4 95,717 80.2 96.6
1 to 19 employees 67,552 93,041 8,844 13.1 10.2 58,708 86.9 98.1
20 to 49 employees 38,940 27,114 4,560 11.7 16.9 34,381 88.3 98.7
50 to 99 employees 37,963 14,054 6,982 18.4 25.0 30,981 81.6 98.7
100 to 249 employees 95,649 11,649 24,592 25.7 34.8 71,057 74.3 98.4
250 to 499 employees 53,822 4,759 12,945 24.1 44.6 40,878 75.9 98.4
500 or more employees 852,612 7,339 371,926 43.6 58.0 480,687 56.4 97.6
Manufacturers 723,960 67,953 288,594 39.9 20.0 435,366 60.1 98.8
no. employees unknown (3) 33,874 17,812 8,289 24.5 14.0 25,585 75.5 98.0
1 to 19 employees 6,734 20,515 827 12.3 8.5 5,906 87.7 98.8
20 to 49 employees 9,611 11,735 1,052 10.9 15.7 8,559 89.1 99.2
50 to 99 employees 13,256 7,006 1,788 13.5 25.9 11,468 86.5 99.3
100 to 249 employees 40,203 5,890 5,009 12.5 39.0 35,194 87.5 99.3
250 to 499 employees 27,789 2,272 6,562 23.6 55.9 21,227 76.4 99.5
500 or more employees 592,493 2,723 265,067 44.7 78.6 327,426 55.3 99.6
Wholesalers 319,306 87,569 106,221 33.3 15.4 213,084 66.7 98.3
no. employees unknown (3) 41,030 31,026 7,361 17.9 10.8 33,669 82.1 97.7
1 to 19 employees 43,202 39,771 4,770 11.0 12.5 38,433 89.0 98.3
20 to 49 employees 19,272 8,567 2,530 13.1 21.5 16,741 86.9 99.0
50 to 99 employees 17,586 3,658 4,528 25.7 30.6 13,059 74.3 98.9
100 to 249 employees 43,183 2,610 16,168 37.4 39.0 27,015 62.6 99.2
250 to 499 employees 13,638 961 3,707 27.2 45.8 9,931 72.8 99.8
500 or more employees 141,394 976 67,158 47.5 69.6 74,236 52.5 99.1
Other companies (4) 222,635 116,183 58,678 26.4 11.1 163,957 73.6 96.4
no. employees unknown (3) 44,457 64,911 7,995 18.0 9.3 36,462 82.0 95.7
1 to 19 employees 17,616 32,755 3,247 18.4 8.5 14,368 81.6 97.5
20 to 49 employees 10,058 6,812 977 9.7 13.2 9,080 90.3 97.4
50 to 99 employees 7,121 3,390 667 9.4 17.3 6,454 90.6 97.1
100 to 249 employees 12,263 3,149 3,415 27.8 23.5 8,848 72.2 96.1
250 to 499 employees 12,395 1,526 2,675 21.6 26.9 9,720 78.4 96.0
500 or more employees 118,725 3,640 39,701 33.4 39.5 79,024 66.6 95.7
Multiple location companies 984,260 27,810 405,698 41.2 37.2 578,561 58.8 98.3
no. employees unknown (3) 1,760 731 313 17.8 22.3 1,447 82.2 98.5
1 to 19 employees 4,004 2,644 1,275 31.8 15.8 2,729 68.2 97.8
20 to 49 employees 8,423 4,065 1,001 11.9 20.2 7,422 88.1 98.3
50 to 99 employees 14,198 4,318 2,328 16.4 27.7 11,870 83.6 98.8
100 to 249 employees 73,071 6,023 20,604 28.2 36.5 52,467 71.8 98.4
250 to 499 employees 41,666 3,437 11,066 26.6 46.2 30,601 73.4 98.6
500 or more employees 841,138 6,592 369,112 43.9 60.2 472,026 56.1 97.8
Manufacturers 641,130 10,245 273,088 42.6 48.7 368,041 57.4 99.5
no. employees unknown (3) 693 192 80 11.6 26.6 613 88.4 99.5
1 to 19 employees 142 386 17 11.7 9.8 125 88.3 98.7
20 to 49 employees 1,309 1,098 125 9.6 21.0 1,184 90.4 99.5
50 to 99 employees 4,601 1,657 837 18.2 31.3 3,764 81.8 99.5
100 to 249 employees 27,042 2,773 3,051 11.3 42.9 23,991 88.7 99.4
250 to 499 employees 21,364 1,605 5,593 26.2 58.8 15,771 73.8 99.7
500 or more employees 585,978 2,534 263,385 44.9 79.6 322,594 55.1 99.6
Wholesalers 203,125 8,395 87,412 43.0 33.5 115,713 57.0 98.9
no. employees unknown (3) 664 295 97 14.6 23.7 567 85.4 98.6
1 to 19 employees 3,252 1,380 1,188 36.5 18.6 2,063 63.5 98.2
20 to 49 employees 5,333 1,813 549 10.3 23.2 4,784 89.7 98.7
50 to 99 employees 6,246 1,572 1,161 18.6 29.9 5,085 81.4 98.9
100 to 249 employees 37,529 1,638 14,882 39.7 37.0 22,647 60.3 99.2
250 to 499 employees 10,109 774 2,957 29.3 45.0 7,152 70.7 99.7
500 or more employees 139,993 923 66,578 47.6 69.4 73,415 52.4 99.2
21
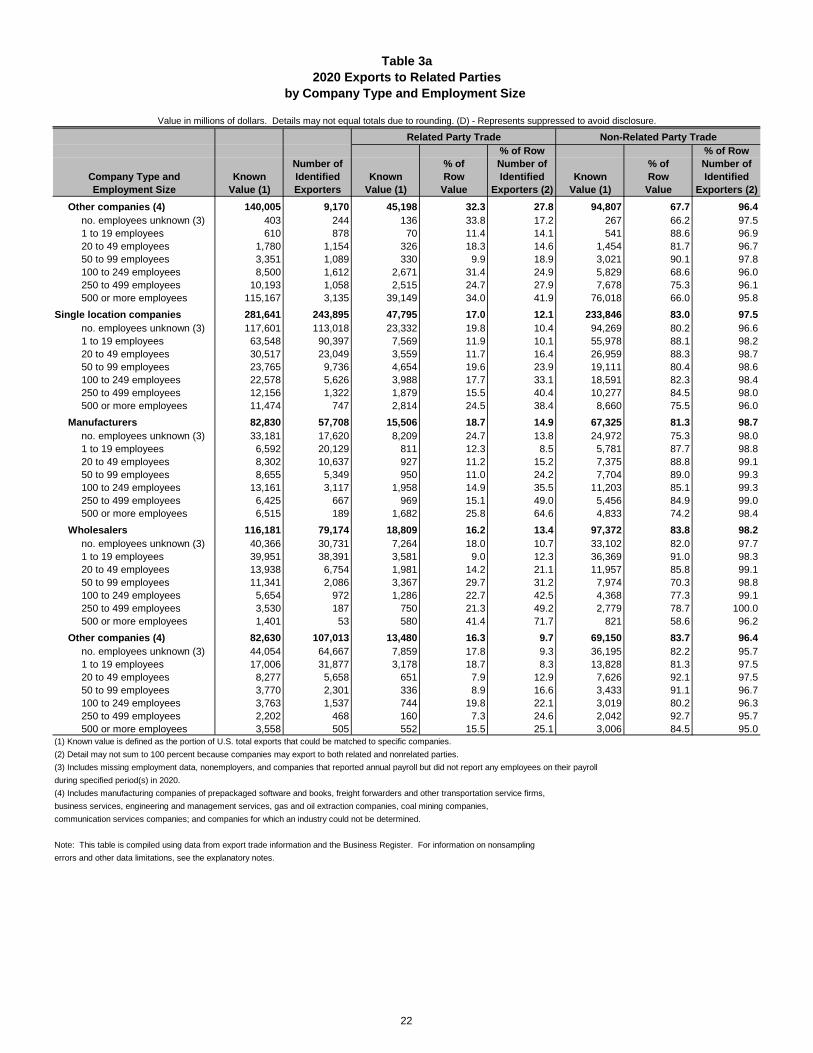
Table 3a
2020 Exports to Related Parties
by Company Type and Employment Size
Value in millions of dollars. Details may not equal totals due to rounding. (D) - Represents suppressed to avoid disclosure.
Related Party Trade Non-Related Party Trade
% of Row % of Row
Number of % of Number of % of Number of
Company Type and Known Identified Known Row Identified Known Row Identified
Employment Size Value (1) Exporters Value (1) Value Exporters (2) Value (1) Value Exporters (2)
Other companies (4) 140,005 9,170 45,198 32.3 27.8 94,807 67.7 96.4
no. employees unknown (3) 403 244 136 33.8 17.2 267 66.2 97.5
1 to 19 employees 610 878 70 11.4 14.1 541 88.6 96.9
20 to 49 employees 1,780 1,154 326 18.3 14.6 1,454 81.7 96.7
50 to 99 employees 3,351 1,089 330 9.9 18.9 3,021 90.1 97.8
100 to 249 employees 8,500 1,612 2,671 31.4 24.9 5,829 68.6 96.0
250 to 499 employees 10,193 1,058 2,515 24.7 27.9 7,678 75.3 96.1
500 or more employees 115,167 3,135 39,149 34.0 41.9 76,018 66.0 95.8
Single location companies 281,641 243,895 47,795 17.0 12.1 233,846 83.0 97.5
no. employees unknown (3) 117,601 113,018 23,332 19.8 10.4 94,269 80.2 96.6
1 to 19 employees 63,548 90,397 7,569 11.9 10.1 55,978 88.1 98.2
20 to 49 employees 30,517 23,049 3,559 11.7 16.4 26,959 88.3 98.7
50 to 99 employees 23,765 9,736 4,654 19.6 23.9 19,111 80.4 98.6
100 to 249 employees 22,578 5,626 3,988 17.7 33.1 18,591 82.3 98.4
250 to 499 employees 12,156 1,322 1,879 15.5 40.4 10,277 84.5 98.0
500 or more employees 11,474 747 2,814 24.5 38.4 8,660 75.5 96.0
Manufacturers 82,830 57,708 15,506 18.7 14.9 67,325 81.3 98.7
no. employees unknown (3) 33,181 17,620 8,209 24.7 13.8 24,972 75.3 98.0
1 to 19 employees 6,592 20,129 811 12.3 8.5 5,781 87.7 98.8
20 to 49 employees 8,302 10,637 927 11.2 15.2 7,375 88.8 99.1
50 to 99 employees 8,655 5,349 950 11.0 24.2 7,704 89.0 99.3
100 to 249 employees 13,161 3,117 1,958 14.9 35.5 11,203 85.1 99.3
250 to 499 employees 6,425 667 969 15.1 49.0 5,456 84.9 99.0
500 or more employees 6,515 189 1,682 25.8 64.6 4,833 74.2 98.4
Wholesalers 116,181 79,174 18,809 16.2 13.4 97,372 83.8 98.2
no. employees unknown (3) 40,366 30,731 7,264 18.0 10.7 33,102 82.0 97.7
1 to 19 employees 39,951 38,391 3,581 9.0 12.3 36,369 91.0 98.3
20 to 49 employees 13,938 6,754 1,981 14.2 21.1 11,957 85.8 99.1
50 to 99 employees 11,341 2,086 3,367 29.7 31.2 7,974 70.3 98.8
100 to 249 employees 5,654 972 1,286 22.7 42.5 4,368 77.3 99.1
250 to 499 employees 3,530 187 750 21.3 49.2 2,779 78.7 100.0
500 or more employees 1,401 53 580 41.4 71.7 821 58.6 96.2
Other companies (4) 82,630 107,013 13,480 16.3 9.7 69,150 83.7 96.4
no. employees unknown (3) 44,054 64,667 7,859 17.8 9.3 36,195 82.2 95.7
1 to 19 employees 17,006 31,877 3,178 18.7 8.3 13,828 81.3 97.5
20 to 49 employees 8,277 5,658 651 7.9 12.9 7,626 92.1 97.5
50 to 99 employees 3,770 2,301 336 8.9 16.6 3,433 91.1 96.7
100 to 249 employees 3,763 1,537 744 19.8 22.1 3,019 80.2 96.3
250 to 499 employees 2,202 468 160 7.3 24.6 2,042 92.7 95.7
500 or more employees 3,558 505 552 15.5 25.1 3,006 84.5 95.0
(1) Known value is defined as the portion of U.S. total exports that could be matched to specific companies.
(2) Detail may not sum to 100 percent because companies may export to both related and nonrelated parties.
(3) Includes missing employment data, nonemployers, and companies that reported annual payroll but did not report any employees on their payroll
during specified period(s) in 2020.
(4) Includes manufacturing companies of prepackaged software and books, freight forwarders and other transportation service firms,
business services, engineering and management services, gas and oil extraction companies, coal mining companies,
communication services companies; and companies for which an industry could not be determined.
Note: This table is compiled using data from export trade information and the Business Register. For information on nonsampling
errors and other data limitations, see the explanatory notes.
22
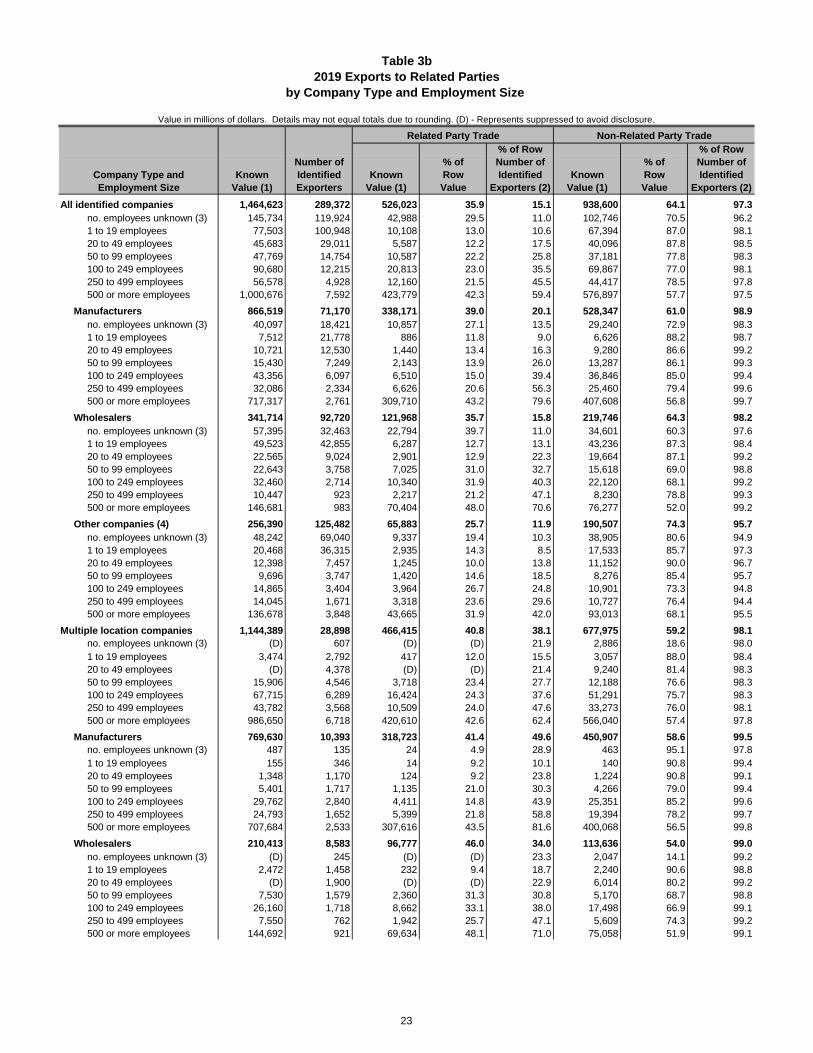
Table 3b
2019 Exports to Related Parties
by Company Type and Employment Size
Value in millions of dollars. Details may not equal totals due to rounding. (D) - Represents suppressed to avoid disclosure.
Related Party Trade Non-Related Party Trade
% of Row % of Row
Number of % of Number of % of Number of
Company Type and Known Identified Known Row Identified Known Row Identified
Employment Size Value (1) Exporters Value (1) Value Exporters (2) Value (1) Value Exporters (2)
All identified companies 1,464,623 289,372 526,023 35.9 15.1 938,600 64.1 97.3
no. employees unknown (3) 145,734 119,924 42,988 29.5 11.0 102,746 70.5 96.2
1 to 19 employees 77,503 100,948 10,108 13.0 10.6 67,394 87.0 98.1
20 to 49 employees 45,683 29,011 5,587 12.2 17.5 40,096 87.8 98.5
50 to 99 employees 47,769 14,754 10,587 22.2 25.8 37,181 77.8 98.3
100 to 249 employees 90,680 12,215 20,813 23.0 35.5 69,867 77.0 98.1
250 to 499 employees 56,578 4,928 12,160 21.5 45.5 44,417 78.5 97.8
500 or more employees 1,000,676 7,592 423,779 42.3 59.4 576,897 57.7 97.5
Manufacturers 866,519 71,170 338,171 39.0 20.1 528,347 61.0 98.9
no. employees unknown (3) 40,097 18,421 10,857 27.1 13.5 29,240 72.9 98.3
1 to 19 employees 7,512 21,778 886 11.8 9.0 6,626 88.2 98.7
20 to 49 employees 10,721 12,530 1,440 13.4 16.3 9,280 86.6 99.2
50 to 99 employees 15,430 7,249 2,143 13.9 26.0 13,287 86.1 99.3
100 to 249 employees 43,356 6,097 6,510 15.0 39.4 36,846 85.0 99.4
250 to 499 employees 32,086 2,334 6,626 20.6 56.3 25,460 79.4 99.6
500 or more employees 717,317 2,761 309,710 43.2 79.6 407,608 56.8 99.7
Wholesalers 341,714 92,720 121,968 35.7 15.8 219,746 64.3 98.2
no. employees unknown (3) 57,395 32,463 22,794 39.7 11.0 34,601 60.3 97.6
1 to 19 employees 49,523 42,855 6,287 12.7 13.1 43,236 87.3 98.4
20 to 49 employees 22,565 9,024 2,901 12.9 22.3 19,664 87.1 99.2
50 to 99 employees 22,643 3,758 7,025 31.0 32.7 15,618 69.0 98.8
100 to 249 employees 32,460 2,714 10,340 31.9 40.3 22,120 68.1 99.2
250 to 499 employees 10,447 923 2,217 21.2 47.1 8,230 78.8 99.3
500 or more employees 146,681 983 70,404 48.0 70.6 76,277 52.0 99.2
Other companies (4) 256,390 125,482 65,883 25.7 11.9 190,507 74.3 95.7
no. employees unknown (3) 48,242 69,040 9,337 19.4 10.3 38,905 80.6 94.9
1 to 19 employees 20,468 36,315 2,935 14.3 8.5 17,533 85.7 97.3
20 to 49 employees 12,398 7,457 1,245 10.0 13.8 11,152 90.0 96.7
50 to 99 employees 9,696 3,747 1,420 14.6 18.5 8,276 85.4 95.7
100 to 249 employees 14,865 3,404 3,964 26.7 24.8 10,901 73.3 94.8
250 to 499 employees 14,045 1,671 3,318 23.6 29.6 10,727 76.4 94.4
500 or more employees 136,678 3,848 43,665 31.9 42.0 93,013 68.1 95.5
Multiple location companies 1,144,389 28,898 466,415 40.8 38.1 677,975 59.2 98.1
no. employees unknown (3) (D) 607 (D) (D) 21.9 2,886 18.6 98.0
1 to 19 employees 3,474 2,792 417 12.0 15.5 3,057 88.0 98.4
20 to 49 employees (D) 4,378 (D) (D) 21.4 9,240 81.4 98.3
50 to 99 employees 15,906 4,546 3,718 23.4 27.7 12,188 76.6 98.3
100 to 249 employees 67,715 6,289 16,424 24.3 37.6 51,291 75.7 98.3
250 to 499 employees 43,782 3,568 10,509 24.0 47.6 33,273 76.0 98.1
500 or more employees 986,650 6,718 420,610 42.6 62.4 566,040 57.4 97.8
Manufacturers 769,630 10,393 318,723 41.4 49.6 450,907 58.6 99.5
no. employees unknown (3) 487 135 24 4.9 28.9 463 95.1 97.8
1 to 19 employees 155 346 14 9.2 10.1 140 90.8 99.4
20 to 49 employees 1,348 1,170 124 9.2 23.8 1,224 90.8 99.1
50 to 99 employees 5,401 1,717 1,135 21.0 30.3 4,266 79.0 99.4
100 to 249 employees 29,762 2,840 4,411 14.8 43.9 25,351 85.2 99.6
250 to 499 employees 24,793 1,652 5,399 21.8 58.8 19,394 78.2 99.7
500 or more employees 707,684 2,533 307,616 43.5 81.6 400,068 56.5 99.8
Wholesalers 210,413 8,583 96,777 46.0 34.0 113,636 54.0 99.0
no. employees unknown (3) (D) 245 (D) (D) 23.3 2,047 14.1 99.2
1 to 19 employees 2,472 1,458 232 9.4 18.7 2,240 90.6 98.8
20 to 49 employees (D) 1,900 (D) (D) 22.9 6,014 80.2 99.2
50 to 99 employees 7,530 1,579 2,360 31.3 30.8 5,170 68.7 98.8
100 to 249 employees 26,160 1,718 8,662 33.1 38.0 17,498 66.9 99.1
250 to 499 employees 7,550 762 1,942 25.7 47.1 5,609 74.3 99.2
500 or more employees 144,692 921 69,634 48.1 71.0 75,058 51.9 99.1
23
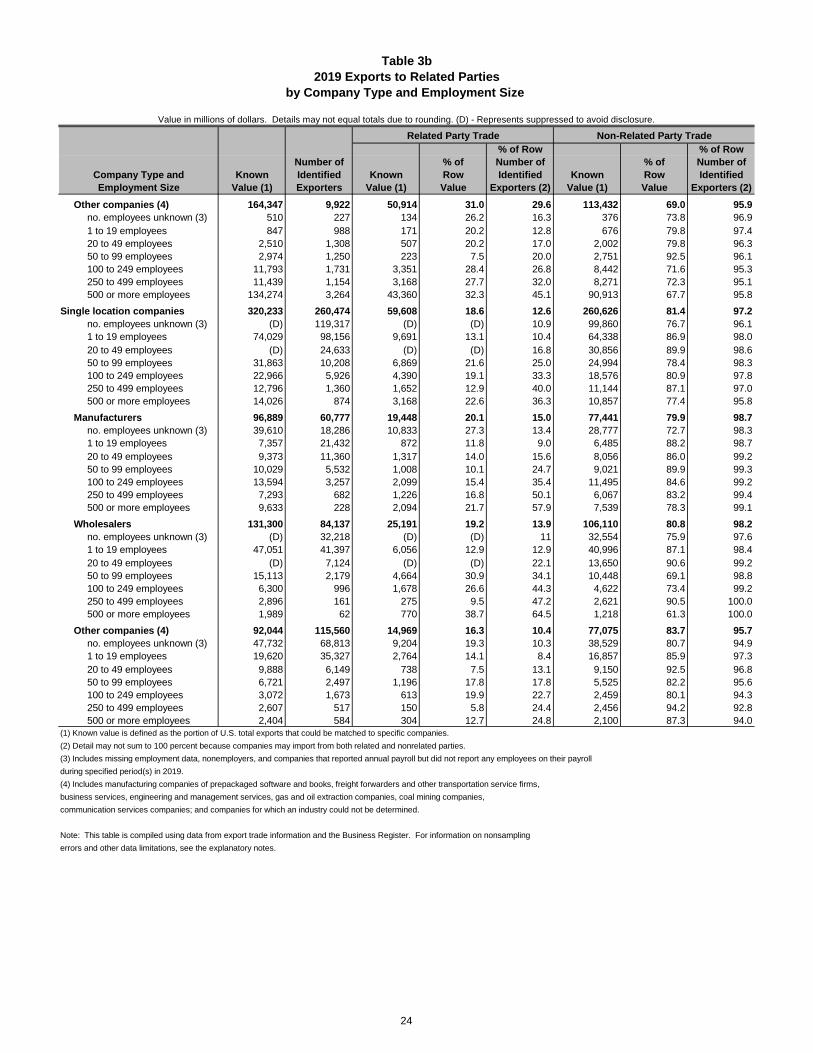
Table 3b
2019 Exports to Related Parties
by Company Type and Employment Size
Value in millions of dollars. Details may not equal totals due to rounding. (D) - Represents suppressed to avoid disclosure.
Related Party Trade Non-Related Party Trade
% of Row % of Row
Number of % of Number of % of Number of
Company Type and Known Identified Known Row Identified Known Row Identified
Employment Size Value (1) Exporters Value (1) Value Exporters (2) Value (1) Value Exporters (2)
Other companies (4) 164,347 9,922 50,914 31.0 29.6 113,432 69.0 95.9
no. employees unknown (3) 510 227 134 26.2 16.3 376 73.8 96.9
1 to 19 employees 847 988 171 20.2 12.8 676 79.8 97.4
20 to 49 employees 2,510 1,308 507 20.2 17.0 2,002 79.8 96.3
50 to 99 employees 2,974 1,250 223 7.5 20.0 2,751 92.5 96.1
100 to 249 employees 11,793 1,731 3,351 28.4 26.8 8,442 71.6 95.3
250 to 499 employees 11,439 1,154 3,168 27.7 32.0 8,271 72.3 95.1
500 or more employees 134,274 3,264 43,360 32.3 45.1 90,913 67.7 95.8
Single location companies 320,233 260,474 59,608 18.6 12.6 260,626 81.4 97.2
no. employees unknown (3) (D) 119,317 (D) (D) 10.9 99,860 76.7 96.1
1 to 19 employees 74,029 98,156 9,691 13.1 10.4 64,338 86.9 98.0
20 to 49 employees (D) 24,633 (D) (D) 16.8 30,856 89.9 98.6
50 to 99 employees 31,863 10,208 6,869 21.6 25.0 24,994 78.4 98.3
100 to 249 employees 22,966 5,926 4,390 19.1 33.3 18,576 80.9 97.8
250 to 499 employees 12,796 1,360 1,652 12.9 40.0 11,144 87.1 97.0
500 or more employees 14,026 874 3,168 22.6 36.3 10,857 77.4 95.8
Manufacturers 96,889 60,777 19,448 20.1 15.0 77,441 79.9 98.7
no. employees unknown (3) 39,610 18,286 10,833 27.3 13.4 28,777 72.7 98.3
1 to 19 employees 7,357 21,432 872 11.8 9.0 6,485 88.2 98.7
20 to 49 employees 9,373 11,360 1,317 14.0 15.6 8,056 86.0 99.2
50 to 99 employees 10,029 5,532 1,008 10.1 24.7 9,021 89.9 99.3
100 to 249 employees 13,594 3,257 2,099 15.4 35.4 11,495 84.6 99.2
250 to 499 employees 7,293 682 1,226 16.8 50.1 6,067 83.2 99.4
500 or more employees 9,633 228 2,094 21.7 57.9 7,539 78.3 99.1
Wholesalers 131,300 84,137 25,191 19.2 13.9 106,110 80.8 98.2
no. employees unknown (3) (D) 32,218 (D) (D) 11 32,554 75.9 97.6
1 to 19 employees 47,051 41,397 6,056 12.9 12.9 40,996 87.1 98.4
20 to 49 employees (D) 7,124 (D) (D) 22.1 13,650 90.6 99.2
50 to 99 employees 15,113 2,179 4,664 30.9 34.1 10,448 69.1 98.8
100 to 249 employees 6,300 996 1,678 26.6 44.3 4,622 73.4 99.2
250 to 499 employees 2,896 161 275 9.5 47.2 2,621 90.5 100.0
500 or more employees 1,989 62 770 38.7 64.5 1,218 61.3 100.0
Other companies (4) 92,044 115,560 14,969 16.3 10.4 77,075 83.7 95.7
no. employees unknown (3) 47,732 68,813 9,204 19.3 10.3 38,529 80.7 94.9
1 to 19 employees 19,620 35,327 2,764 14.1 8.4 16,857 85.9 97.3
20 to 49 employees 9,888 6,149 738 7.5 13.1 9,150 92.5 96.8
50 to 99 employees 6,721 2,497 1,196 17.8 17.8 5,525 82.2 95.6
100 to 249 employees 3,072 1,673 613 19.9 22.7 2,459 80.1 94.3
250 to 499 employees 2,607 517 150 5.8 24.4 2,456 94.2 92.8
500 or more employees 2,404 584 304 12.7 24.8 2,100 87.3 94.0
(1) Known value is defined as the portion of U.S. total exports that could be matched to specific companies.
(2) Detail may not sum to 100 percent because companies may import from both related and nonrelated parties.
(3) Includes missing employment data, nonemployers, and companies that reported annual payroll but did not report any employees on their payroll
during specified period(s) in 2019.
(4) Includes manufacturing companies of prepackaged software and books, freight forwarders and other transportation service firms,
business services, engineering and management services, gas and oil extraction companies, coal mining companies,
communication services companies; and companies for which an industry could not be determined.
Note: This table is compiled using data from export trade information and the Business Register. For information on nonsampling
errors and other data limitations, see the explanatory notes.
24
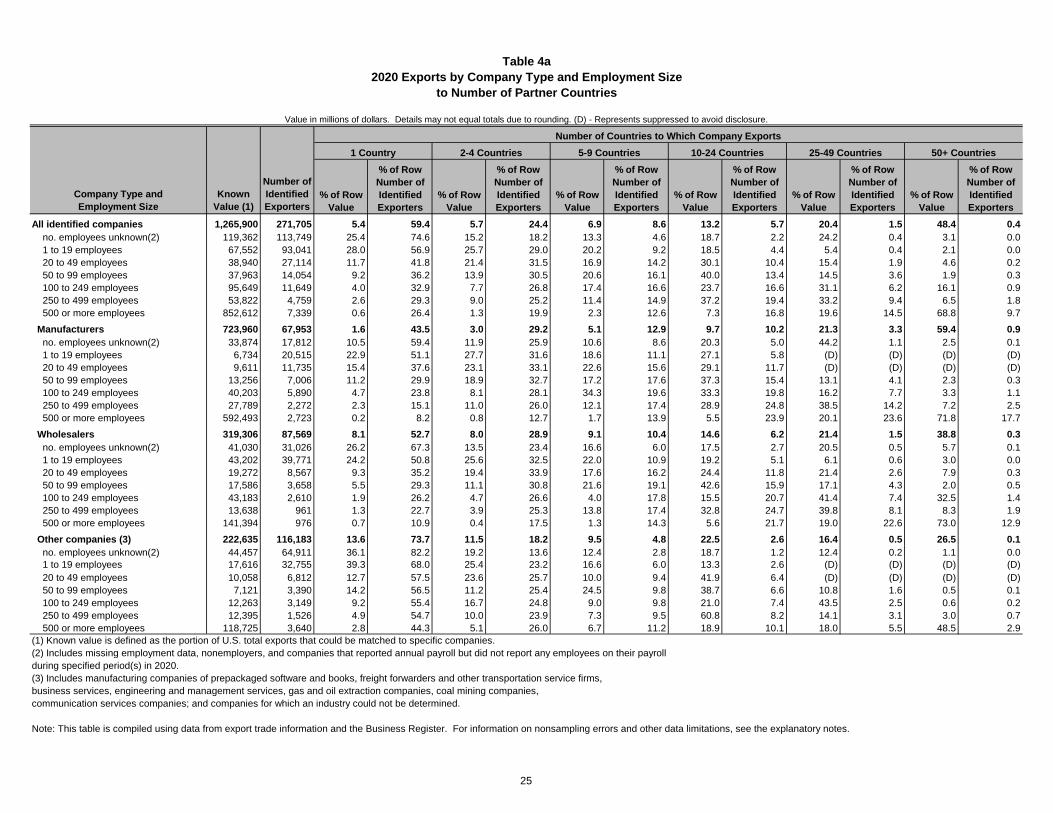
Table 4a
2020 Exports by Company Type and Employment Size
to Number of Partner Countries
Value in millions of dollars. Details may not equal totals due to rounding. (D) - Represents suppressed to avoid disclosure.
% of Row % of Row % of Row % of Row % of Row % of Row
Number of Number of Number of Number of Number of Number of Number of
Company Type and Known Identified % of Row Identified % of Row Identified % of Row Identified % of Row Identified % of Row Identified % of Row Identified
Employment Size Value (1) Exporters Value Exporters Value Exporters Value Exporters Value Exporters Value Exporters Value Exporters
All identified companies 1,265,900 271,705 5.4 59.4 5.7 24.4 6.9 8.6 13.2 5.7 20.4 1.5 48.4 0.4
no. employees unknown(2) 119,362 113,749 25.4 74.6 15.2 18.2 13.3 4.6 18.7 2.2 24.2 0.4 3.1 0.0
1 to 19 employees 67,552 93,041 28.0 56.9 25.7 29.0 20.2 9.2 18.5 4.4 5.4 0.4 2.1 0.0
20 to 49 employees 38,940 27,114 11.7 41.8 21.4 31.5 16.9 14.2 30.1 10.4 15.4 1.9 4.6 0.2
50 to 99 employees 37,963 14,054 9.2 36.2 13.9 30.5 20.6 16.1 40.0 13.4 14.5 3.6 1.9 0.3
100 to 249 employees 95,649 11,649 4.0 32.9 7.7 26.8 17.4 16.6 23.7 16.6 31.1 6.2 16.1 0.9
250 to 499 employees 53,822 4,759 2.6 29.3 9.0 25.2 11.4 14.9 37.2 19.4 33.2 9.4 6.5 1.8
500 or more employees 852,612 7,339 0.6 26.4 1.3 19.9 2.3 12.6 7.3 16.8 19.6 14.5 68.8 9.7
Manufacturers 723,960 67,953 1.6 43.5 3.0 29.2 5.1 12.9 9.7 10.2 21.3 3.3 59.4 0.9
no. employees unknown(2) 33,874 17,812 10.5 59.4 11.9 25.9 10.6 8.6 20.3 5.0 44.2 1.1 2.5 0.1
1 to 19 employees 6,734 20,515 22.9 51.1 27.7 31.6 18.6 11.1 27.1 5.8 (D) (D) (D) (D)
20 to 49 employees 9,611 11,735 15.4 37.6 23.1 33.1 22.6 15.6 29.1 11.7 (D) (D) (D) (D)
50 to 99 employees 13,256 7,006 11.2 29.9 18.9 32.7 17.2 17.6 37.3 15.4 13.1 4.1 2.3 0.3
100 to 249 employees 40,203 5,890 4.7 23.8 8.1 28.1 34.3 19.6 33.3 19.8 16.2 7.7 3.3 1.1
250 to 499 employees 27,789 2,272 2.3 15.1 11.0 26.0 12.1 17.4 28.9 24.8 38.5 14.2 7.2 2.5
500 or more employees 592,493 2,723 0.2 8.2 0.8 12.7 1.7 13.9 5.5 23.9 20.1 23.6 71.8 17.7
Wholesalers 319,306 87,569 8.1 52.7 8.0 28.9 9.1 10.4 14.6 6.2 21.4 1.5 38.8 0.3
no. employees unknown(2) 41,030 31,026 26.2 67.3 13.5 23.4 16.6 6.0 17.5 2.7 20.5 0.5 5.7 0.1
1 to 19 employees 43,202 39,771 24.2 50.8 25.6 32.5 22.0 10.9 19.2 5.1 6.1 0.6 3.0 0.0
20 to 49 employees 19,272 8,567 9.3 35.2 19.4 33.9 17.6 16.2 24.4 11.8 21.4 2.6 7.9 0.3
50 to 99 employees 17,586 3,658 5.5 29.3 11.1 30.8 21.6 19.1 42.6 15.9 17.1 4.3 2.0 0.5
100 to 249 employees 43,183 2,610 1.9 26.2 4.7 26.6 4.0 17.8 15.5 20.7 41.4 7.4 32.5 1.4
250 to 499 employees 13,638 961 1.3 22.7 3.9 25.3 13.8 17.4 32.8 24.7 39.8 8.1 8.3 1.9
500 or more employees 141,394 976 0.7 10.9 0.4 17.5 1.3 14.3 5.6 21.7 19.0 22.6 73.0 12.9
Other companies (3) 222,635 116,183 13.6 73.7 11.5 18.2 9.5 4.8 22.5 2.6 16.4 0.5 26.5 0.1
no. employees unknown(2) 44,457 64,911 36.1 82.2 19.2 13.6 12.4 2.8 18.7 1.2 12.4 0.2 1.1 0.0
1 to 19 employees 17,616 32,755 39.3 68.0 25.4 23.2 16.6 6.0 13.3 2.6 (D) (D) (D) (D)
20 to 49 employees 10,058 6,812 12.7 57.5 23.6 25.7 10.0 9.4 41.9 6.4 (D) (D) (D) (D)
50 to 99 employees 7,121 3,390 14.2 56.5 11.2 25.4 24.5 9.8 38.7 6.6 10.8 1.6 0.5 0.1
100 to 249 employees 12,263 3,149 9.2 55.4 16.7 24.8 9.0 9.8 21.0 7.4 43.5 2.5 0.6 0.2
250 to 499 employees 12,395 1,526 4.9 54.7 10.0 23.9 7.3 9.5 60.8 8.2 14.1 3.1 3.0 0.7
500 or more employees 118,725 3,640 2.8 44.3 5.1 26.0 6.7 11.2 18.9 10.1 18.0 5.5 48.5 2.9
(1) Known value is defined as the portion of U.S. total exports that could be matched to specific companies.
(2) Includes missing employment data, nonemployers, and companies that reported annual payroll but did not report any employees on their payroll
during specified period(s) in 2020.
(3) Includes manufacturing companies of prepackaged software and books, freight forwarders and other transportation service firms,
business services, engineering and management services, gas and oil extraction companies, coal mining companies,
communication services companies; and companies for which an industry could not be determined.
Note: This table is compiled using data from export trade information and the Business Register. For information on nonsampling errors and other data limitations, see the explanatory notes.
Number of Countries to Which Company Exports
50+ Countries25-49 Countries1 Country 2-4 Countries 5-9 Countries 10-24 Countries
25
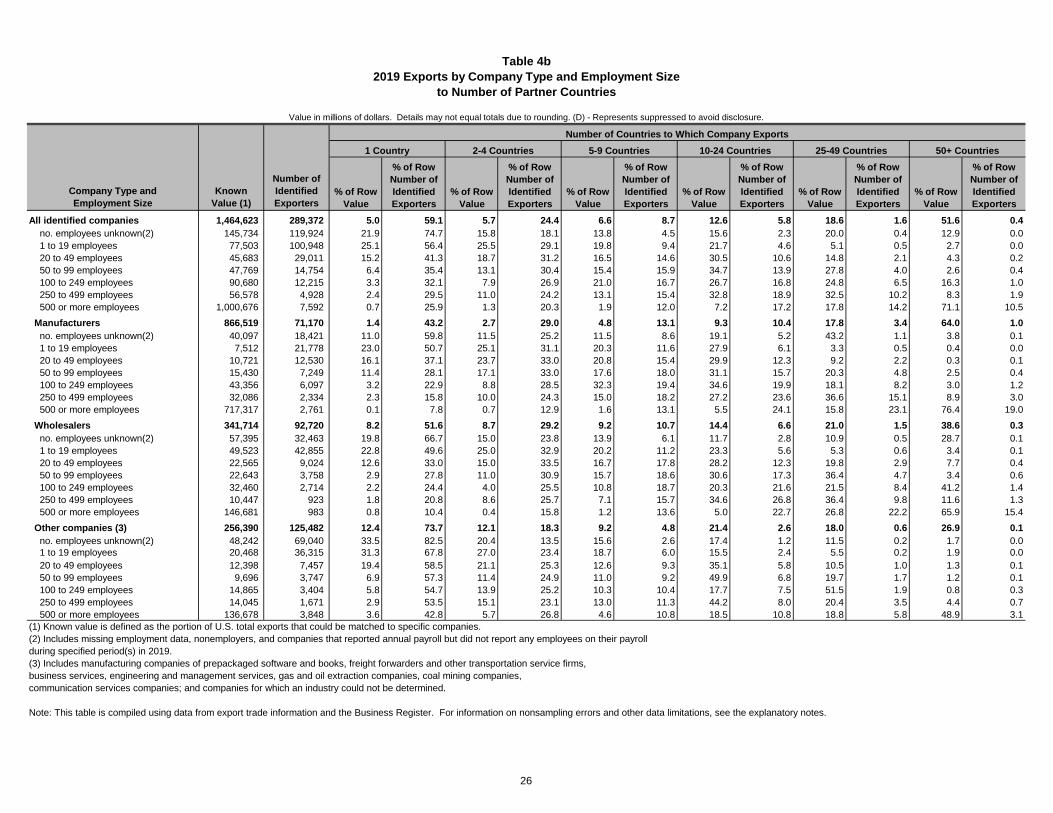
Table 4b
2019 Exports by Company Type and Employment Size
to Number of Partner Countries
Value in millions of dollars. Details may not equal totals due to rounding. (D) - Represents suppressed to avoid disclosure.
% of Row % of Row % of Row % of Row % of Row % of Row
Number of Number of Number of Number of Number of Number of Number of
Company Type and Known Identified % of Row Identified % of Row Identified % of Row Identified % of Row Identified % of Row Identified % of Row Identified
Employment Size Value (1) Exporters Value Exporters Value Exporters Value Exporters Value Exporters Value Exporters Value Exporters
All identified companies 1,464,623 289,372 5.0 59.1 5.7 24.4 6.6 8.7 12.6 5.8 18.6 1.6 51.6 0.4
no. employees unknown(2) 145,734 119,924 21.9 74.7 15.8 18.1 13.8 4.5 15.6 2.3 20.0 0.4 12.9 0.0
1 to 19 employees 77,503 100,948 25.1 56.4 25.5 29.1 19.8 9.4 21.7 4.6 5.1 0.5 2.7 0.0
20 to 49 employees 45,683 29,011 15.2 41.3 18.7 31.2 16.5 14.6 30.5 10.6 14.8 2.1 4.3 0.2
50 to 99 employees 47,769 14,754 6.4 35.4 13.1 30.4 15.4 15.9 34.7 13.9 27.8 4.0 2.6 0.4
100 to 249 employees 90,680 12,215 3.3 32.1 7.9 26.9 21.0 16.7 26.7 16.8 24.8 6.5 16.3 1.0
250 to 499 employees 56,578 4,928 2.4 29.5 11.0 24.2 13.1 15.4 32.8 18.9 32.5 10.2 8.3 1.9
500 or more employees 1,000,676 7,592 0.7 25.9 1.3 20.3 1.9 12.0 7.2 17.2 17.8 14.2 71.1 10.5
Manufacturers 866,519 71,170 1.4 43.2 2.7 29.0 4.8 13.1 9.3 10.4 17.8 3.4 64.0 1.0
no. employees unknown(2) 40,097 18,421 11.0 59.8 11.5 25.2 11.5 8.6 19.1 5.2 43.2 1.1 3.8 0.1
1 to 19 employees 7,512 21,778 23.0 50.7 25.1 31.1 20.3 11.6 27.9 6.1 3.3 0.5 0.4 0.0
20 to 49 employees 10,721 12,530 16.1 37.1 23.7 33.0 20.8 15.4 29.9 12.3 9.2 2.2 0.3 0.1
50 to 99 employees 15,430 7,249 11.4 28.1 17.1 33.0 17.6 18.0 31.1 15.7 20.3 4.8 2.5 0.4
100 to 249 employees 43,356 6,097 3.2 22.9 8.8 28.5 32.3 19.4 34.6 19.9 18.1 8.2 3.0 1.2
250 to 499 employees 32,086 2,334 2.3 15.8 10.0 24.3 15.0 18.2 27.2 23.6 36.6 15.1 8.9 3.0
500 or more employees 717,317 2,761 0.1 7.8 0.7 12.9 1.6 13.1 5.5 24.1 15.8 23.1 76.4 19.0
Wholesalers 341,714 92,720 8.2 51.6 8.7 29.2 9.2 10.7 14.4 6.6 21.0 1.5 38.6 0.3
no. employees unknown(2) 57,395 32,463 19.8 66.7 15.0 23.8 13.9 6.1 11.7 2.8 10.9 0.5 28.7 0.1
1 to 19 employees 49,523 42,855 22.8 49.6 25.0 32.9 20.2 11.2 23.3 5.6 5.3 0.6 3.4 0.1
20 to 49 employees 22,565 9,024 12.6 33.0 15.0 33.5 16.7 17.8 28.2 12.3 19.8 2.9 7.7 0.4
50 to 99 employees 22,643 3,758 2.9 27.8 11.0 30.9 15.7 18.6 30.6 17.3 36.4 4.7 3.4 0.6
100 to 249 employees 32,460 2,714 2.2 24.4 4.0 25.5 10.8 18.7 20.3 21.6 21.5 8.4 41.2 1.4
250 to 499 employees 10,447 923 1.8 20.8 8.6 25.7 7.1 15.7 34.6 26.8 36.4 9.8 11.6 1.3
500 or more employees 146,681 983 0.8 10.4 0.4 15.8 1.2 13.6 5.0 22.7 26.8 22.2 65.9 15.4
Other companies (3) 256,390 125,482 12.4 73.7 12.1 18.3 9.2 4.8 21.4 2.6 18.0 0.6 26.9 0.1
no. employees unknown(2) 48,242 69,040 33.5 82.5 20.4 13.5 15.6 2.6 17.4 1.2 11.5 0.2 1.7 0.0
1 to 19 employees 20,468 36,315 31.3 67.8 27.0 23.4 18.7 6.0 15.5 2.4 5.5 0.2 1.9 0.0
20 to 49 employees 12,398 7,457 19.4 58.5 21.1 25.3 12.6 9.3 35.1 5.8 10.5 1.0 1.3 0.1
50 to 99 employees 9,696 3,747 6.9 57.3 11.4 24.9 11.0 9.2 49.9 6.8 19.7 1.7 1.2 0.1
100 to 249 employees 14,865 3,404 5.8 54.7 13.9 25.2 10.3 10.4 17.7 7.5 51.5 1.9 0.8 0.3
250 to 499 employees 14,045 1,671 2.9 53.5 15.1 23.1 13.0 11.3 44.2 8.0 20.4 3.5 4.4 0.7
500 or more employees 136,678 3,848 3.6 42.8 5.7 26.8 4.6 10.8 18.5 10.8 18.8 5.8 48.9 3.1
(1) Known value is defined as the portion of U.S. total exports that could be matched to specific companies.
(2) Includes missing employment data, nonemployers, and companies that reported annual payroll but did not report any employees on their payroll
during specified period(s) in 2019.
(3) Includes manufacturing companies of prepackaged software and books, freight forwarders and other transportation service firms,
business services, engineering and management services, gas and oil extraction companies, coal mining companies,
communication services companies; and companies for which an industry could not be determined.
Note: This table is compiled using data from export trade information and the Business Register. For information on nonsampling errors and other data limitations, see the explanatory notes.
Number of Countries to Which Company Exports
2-4 Countries1 Country 10-24 Countries5-9 Countries 50+ Countries25-49 Countries
26
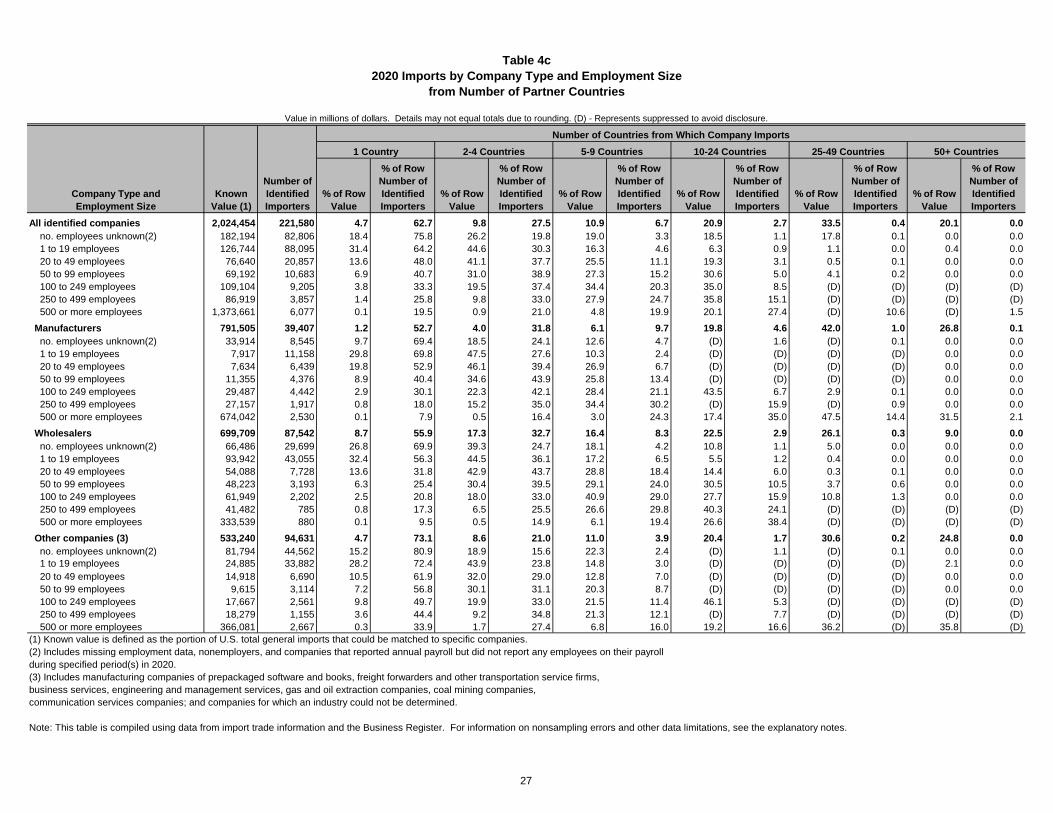
Table 4c
2020 Imports by Company Type and Employment Size
from Number of Partner Countries
Value in millions of dollars. Details may not equal totals due to rounding. (D) - Represents suppressed to avoid disclosure.
% of Row % of Row % of Row % of Row % of Row % of Row
Number of Number of Number of Number of Number of Number of Number of
Company Type and Known Identified % of Row Identified % of Row Identified % of Row Identified % of Row Identified % of Row Identified % of Row Identified
Employment Size Value (1) Importers Value Importers Value Importers Value Importers Value Importers Value Importers Value Importers
All identified companies 2,024,454 221,580 4.7 62.7 9.8 27.5 10.9 6.7 20.9 2.7 33.5 0.4 20.1 0.0
no. employees unknown(2) 182,194 82,806 18.4 75.8 26.2 19.8 19.0 3.3 18.5 1.1 17.8 0.1 0.0 0.0
1 to 19 employees 126,744 88,095 31.4 64.2 44.6 30.3 16.3 4.6 6.3 0.9 1.1 0.0 0.4 0.0
20 to 49 employees 76,640 20,857 13.6 48.0 41.1 37.7 25.5 11.1 19.3 3.1 0.5 0.1 0.0 0.0
50 to 99 employees 69,192 10,683 6.9 40.7 31.0 38.9 27.3 15.2 30.6 5.0 4.1 0.2 0.0 0.0
100 to 249 employees 109,104 9,205 3.8 33.3 19.5 37.4 34.4 20.3 35.0 8.5 (D) (D) (D) (D)
250 to 499 employees 86,919 3,857 1.4 25.8 9.8 33.0 27.9 24.7 35.8 15.1 (D) (D) (D) (D)
500 or more employees 1,373,661 6,077 0.1 19.5 0.9 21.0 4.8 19.9 20.1 27.4 (D) 10.6 (D) 1.5
Manufacturers 791,505 39,407 1.2 52.7 4.0 31.8 6.1 9.7 19.8 4.6 42.0 1.0 26.8 0.1
no. employees unknown(2) 33,914 8,545 9.7 69.4 18.5 24.1 12.6 4.7 (D) 1.6 (D) 0.1 0.0 0.0
1 to 19 employees 7,917 11,158 29.8 69.8 47.5 27.6 10.3 2.4 (D) (D) (D) (D) 0.0 0.0
20 to 49 employees 7,634 6,439 19.8 52.9 46.1 39.4 26.9 6.7 (D) (D) (D) (D) 0.0 0.0
50 to 99 employees 11,355 4,376 8.9 40.4 34.6 43.9 25.8 13.4 (D) (D) (D) (D) 0.0 0.0
100 to 249 employees 29,487 4,442 2.9 30.1 22.3 42.1 28.4 21.1 43.5 6.7 2.9 0.1 0.0 0.0
250 to 499 employees 27,157 1,917 0.8 18.0 15.2 35.0 34.4 30.2 (D) 15.9 (D) 0.9 0.0 0.0
500 or more employees 674,042 2,530 0.1 7.9 0.5 16.4 3.0 24.3 17.4 35.0 47.5 14.4 31.5 2.1
Wholesalers 699,709 87,542 8.7 55.9 17.3 32.7 16.4 8.3 22.5 2.9 26.1 0.3 9.0 0.0
no. employees unknown(2) 66,486 29,699 26.8 69.9 39.3 24.7 18.1 4.2 10.8 1.1 5.0 0.0 0.0 0.0
1 to 19 employees 93,942 43,055 32.4 56.3 44.5 36.1 17.2 6.5 5.5 1.2 0.4 0.0 0.0 0.0
20 to 49 employees 54,088 7,728 13.6 31.8 42.9 43.7 28.8 18.4 14.4 6.0 0.3 0.1 0.0 0.0
50 to 99 employees 48,223 3,193 6.3 25.4 30.4 39.5 29.1 24.0 30.5 10.5 3.7 0.6 0.0 0.0
100 to 249 employees 61,949 2,202 2.5 20.8 18.0 33.0 40.9 29.0 27.7 15.9 10.8 1.3 0.0 0.0
250 to 499 employees 41,482 785 0.8 17.3 6.5 25.5 26.6 29.8 40.3 24.1 (D) (D) (D) (D)
500 or more employees 333,539 880 0.1 9.5 0.5 14.9 6.1 19.4 26.6 38.4 (D) (D) (D) (D)
Other companies (3) 533,240 94,631 4.7 73.1 8.6 21.0 11.0 3.9 20.4 1.7 30.6 0.2 24.8 0.0
no. employees unknown(2) 81,794 44,562 15.2 80.9 18.9 15.6 22.3 2.4 (D) 1.1 (D) 0.1 0.0 0.0
1 to 19 employees 24,885 33,882 28.2 72.4 43.9 23.8 14.8 3.0 (D) (D) (D) (D) 2.1 0.0
20 to 49 employees 14,918 6,690 10.5 61.9 32.0 29.0 12.8 7.0 (D) (D) (D) (D) 0.0 0.0
50 to 99 employees 9,615 3,114 7.2 56.8 30.1 31.1 20.3 8.7 (D) (D) (D) (D) 0.0 0.0
100 to 249 employees 17,667 2,561 9.8 49.7 19.9 33.0 21.5 11.4 46.1 5.3 (D) (D) (D) (D)
250 to 499 employees 18,279 1,155 3.6 44.4 9.2 34.8 21.3 12.1 (D) 7.7 (D) (D) (D) (D)
500 or more employees 366,081 2,667 0.3 33.9 1.7 27.4 6.8 16.0 19.2 16.6 36.2 (D) 35.8 (D)
(1) Known value is defined as the portion of U.S. total general imports that could be matched to specific companies.
(2) Includes missing employment data, nonemployers, and companies that reported annual payroll but did not report any employees on their payroll
during specified period(s) in 2020.
(3) Includes manufacturing companies of prepackaged software and books, freight forwarders and other transportation service firms,
business services, engineering and management services, gas and oil extraction companies, coal mining companies,
communication services companies; and companies for which an industry could not be determined.
Note: This table is compiled using data from import trade information and the Business Register. For information on nonsampling errors and other data limitations, see the explanatory notes.
Number of Countries from Which Company Imports
1 Country 2-4 Countries 5-9 Countries 10-24 Countries 25-49 Countries 50+ Countries
27
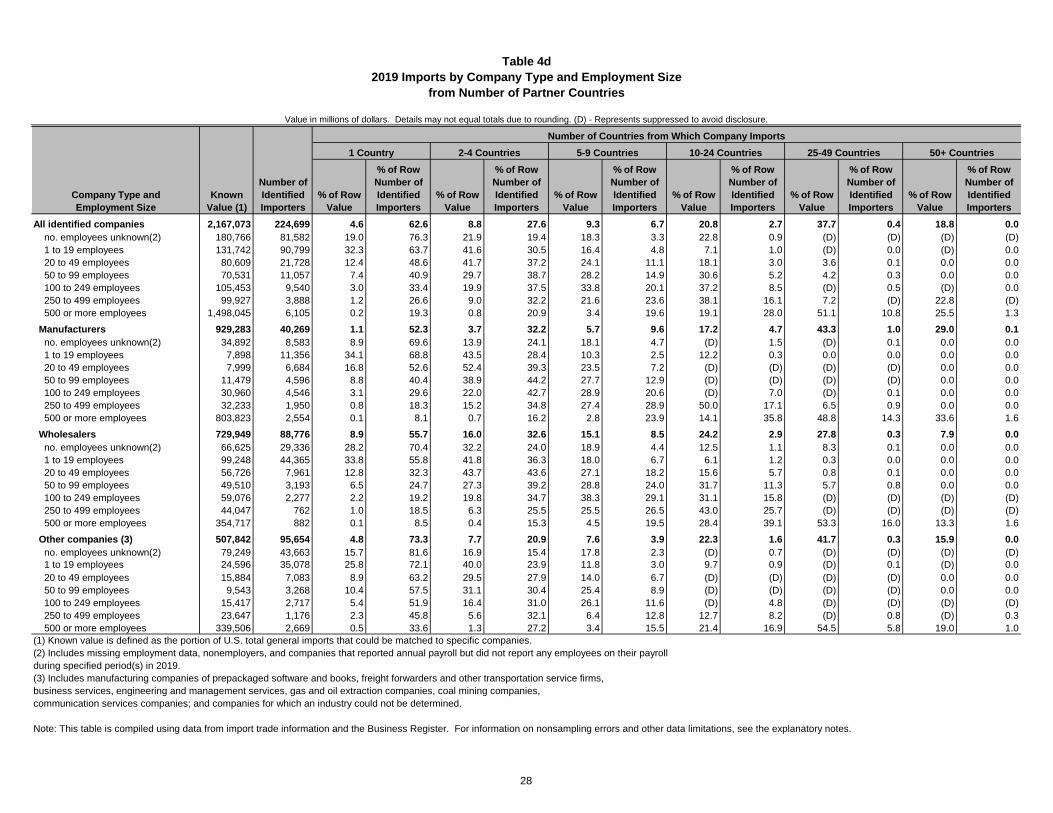
Table 4d
2019 Imports by Company Type and Employment Size
from Number of Partner Countries
Value in millions of dollars. Details may not equal totals due to rounding. (D) - Represents suppressed to avoid disclosure.
% of Row % of Row % of Row % of Row % of Row % of Row
Number of Number of Number of Number of Number of Number of Number of
Company Type and Known Identified % of Row Identified % of Row Identified % of Row Identified % of Row Identified % of Row Identified % of Row Identified
Employment Size Value (1) Importers Value Importers Value Importers Value Importers Value Importers Value Importers Value Importers
All identified companies 2,167,073 224,699 4.6 62.6 8.8 27.6 9.3 6.7 20.8 2.7 37.7 0.4 18.8 0.0
no. employees unknown(2) 180,766 81,582 19.0 76.3 21.9 19.4 18.3 3.3 22.8 0.9 (D) (D) (D) (D)
1 to 19 employees 131,742 90,799 32.3 63.7 41.6 30.5 16.4 4.8 7.1 1.0 (D) 0.0 (D) 0.0
20 to 49 employees 80,609 21,728 12.4 48.6 41.7 37.2 24.1 11.1 18.1 3.0 3.6 0.1 0.0 0.0
50 to 99 employees 70,531 11,057 7.4 40.9 29.7 38.7 28.2 14.9 30.6 5.2 4.2 0.3 0.0 0.0
100 to 249 employees 105,453 9,540 3.0 33.4 19.9 37.5 33.8 20.1 37.2 8.5 (D) 0.5 (D) 0.0
250 to 499 employees 99,927 3,888 1.2 26.6 9.0 32.2 21.6 23.6 38.1 16.1 7.2 (D) 22.8 (D)
500 or more employees 1,498,045 6,105 0.2 19.3 0.8 20.9 3.4 19.6 19.1 28.0 51.1 10.8 25.5 1.3
Manufacturers 929,283 40,269 1.1 52.3 3.7 32.2 5.7 9.6 17.2 4.7 43.3 1.0 29.0 0.1
no. employees unknown(2) 34,892 8,583 8.9 69.6 13.9 24.1 18.1 4.7 (D) 1.5 (D) 0.1 0.0 0.0
1 to 19 employees 7,898 11,356 34.1 68.8 43.5 28.4 10.3 2.5 12.2 0.3 0.0 0.0 0.0 0.0
20 to 49 employees 7,999 6,684 16.8 52.6 52.4 39.3 23.5 7.2 (D) (D) (D) (D) 0.0 0.0
50 to 99 employees 11,479 4,596 8.8 40.4 38.9 44.2 27.7 12.9 (D) (D) (D) (D) 0.0 0.0
100 to 249 employees 30,960 4,546 3.1 29.6 22.0 42.7 28.9 20.6 (D) 7.0 (D) 0.1 0.0 0.0
250 to 499 employees 32,233 1,950 0.8 18.3 15.2 34.8 27.4 28.9 50.0 17.1 6.5 0.9 0.0 0.0
500 or more employees 803,823 2,554 0.1 8.1 0.7 16.2 2.8 23.9 14.1 35.8 48.8 14.3 33.6 1.6
Wholesalers 729,949 88,776 8.9 55.7 16.0 32.6 15.1 8.5 24.2 2.9 27.8 0.3 7.9 0.0
no. employees unknown(2) 66,625 29,336 28.2 70.4 32.2 24.0 18.9 4.4 12.5 1.1 8.3 0.1 0.0 0.0
1 to 19 employees 99,248 44,365 33.8 55.8 41.8 36.3 18.0 6.7 6.1 1.2 0.3 0.0 0.0 0.0
20 to 49 employees 56,726 7,961 12.8 32.3 43.7 43.6 27.1 18.2 15.6 5.7 0.8 0.1 0.0 0.0
50 to 99 employees 49,510 3,193 6.5 24.7 27.3 39.2 28.8 24.0 31.7 11.3 5.7 0.8 0.0 0.0
100 to 249 employees 59,076 2,277 2.2 19.2 19.8 34.7 38.3 29.1 31.1 15.8 (D) (D) (D) (D)
250 to 499 employees 44,047 762 1.0 18.5 6.3 25.5 25.5 26.5 43.0 25.7 (D) (D) (D) (D)
500 or more employees 354,717 882 0.1 8.5 0.4 15.3 4.5 19.5 28.4 39.1 53.3 16.0 13.3 1.6
Other companies (3) 507,842 95,654 4.8 73.3 7.7 20.9 7.6 3.9 22.3 1.6 41.7 0.3 15.9 0.0
no. employees unknown(2) 79,249 43,663 15.7 81.6 16.9 15.4 17.8 2.3 (D) 0.7 (D) (D) (D) (D)
1 to 19 employees 24,596 35,078 25.8 72.1 40.0 23.9 11.8 3.0 9.7 0.9 (D) 0.1 (D) 0.0
20 to 49 employees 15,884 7,083 8.9 63.2 29.5 27.9 14.0 6.7 (D) (D) (D) (D) 0.0 0.0
50 to 99 employees 9,543 3,268 10.4 57.5 31.1 30.4 25.4 8.9 (D) (D) (D) (D) 0.0 0.0
100 to 249 employees 15,417 2,717 5.4 51.9 16.4 31.0 26.1 11.6 (D) 4.8 (D) (D) (D) (D)
250 to 499 employees 23,647 1,176 2.3 45.8 5.6 32.1 6.4 12.8 12.7 8.2 (D) 0.8 (D) 0.3
500 or more employees 339,506 2,669 0.5 33.6 1.3 27.2 3.4 15.5 21.4 16.9 54.5 5.8 19.0 1.0
(1) Known value is defined as the portion of U.S. total general imports that could be matched to specific companies.
(2) Includes missing employment data, nonemployers, and companies that reported annual payroll but did not report any employees on their payroll
during specified period(s) in 2019.
(3) Includes manufacturing companies of prepackaged software and books, freight forwarders and other transportation service firms,
business services, engineering and management services, gas and oil extraction companies, coal mining companies,
communication services companies; and companies for which an industry could not be determined.
Note: This table is compiled using data from import trade information and the Business Register. For information on nonsampling errors and other data limitations, see the explanatory notes.
Number of Countries from Which Company Imports
1 Country 2-4 Countries 5-9 Countries 10-24 Countries 25-49 Countries 50+ Countries
28
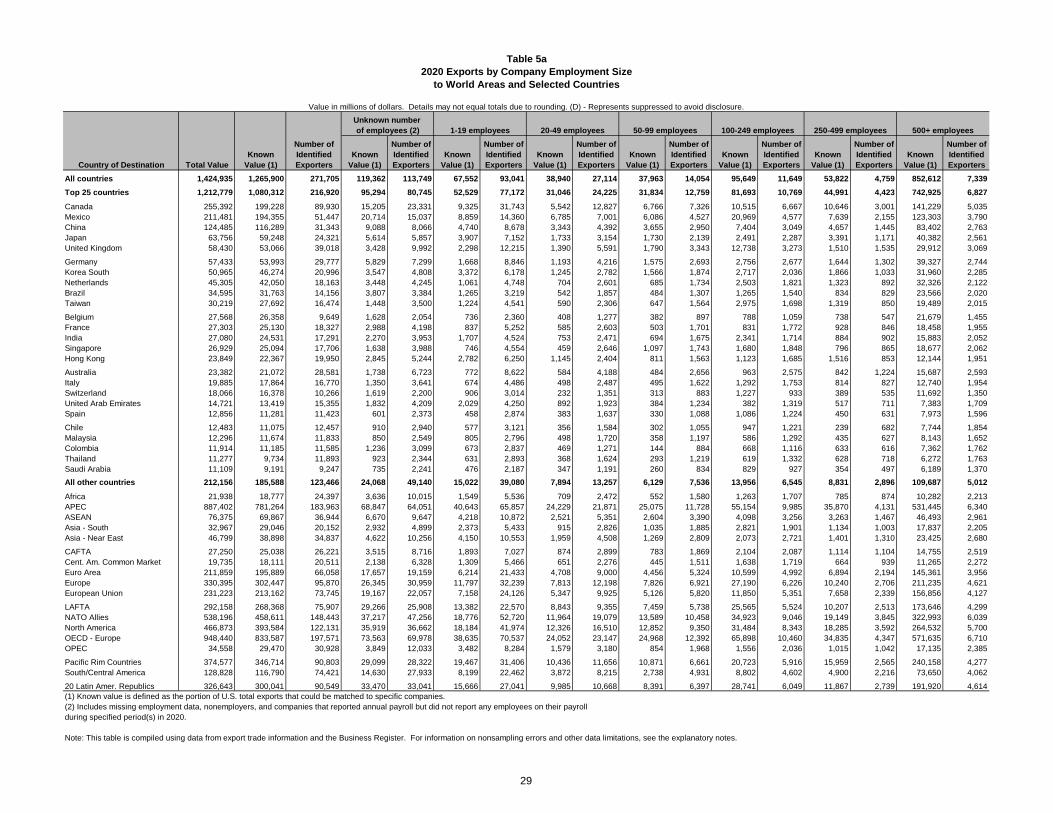
Table 5a
2020 Exports by Company Employment Size
to World Areas and Selected Countries
Number of Number of Number of Number of Number of Number of Number of Number of
Known Identified Known Identified Known Identified Known Identified Known Identified Known Identified Known Identified Known Identified
Country of Destination Total Value Value (1) Exporters Value (1) Exporters Value (1) Exporters Value (1) Exporters Value (1) Exporters Value (1) Exporters Value (1) Exporters Value (1) Exporters
All countries 1,424,935 1,265,900 271,705 119,362 113,749 67,552 93,041 38,940 27,114 37,963 14,054 95,649 11,649 53,822 4,759 852,612 7,339
Top 25 countries 1,212,779 1,080,312 216,920 95,294 80,745 52,529 77,172 31,046 24,225 31,834 12,759 81,693 10,769 44,991 4,423 742,925 6,827
Canada 255,392 199,228 89,930 15,205 23,331 9,325 31,743 5,542 12,827 6,766 7,326 10,515 6,667 10,646 3,001 141,229 5,035
Mexico 211,481 194,355 51,447 20,714 15,037 8,859 14,360 6,785 7,001 6,086 4,527 20,969 4,577 7,639 2,155 123,303 3,790
China 124,485 116,289 31,343 9,088 8,066 4,740 8,678 3,343 4,392 3,655 2,950 7,404 3,049 4,657 1,445 83,402 2,763
Japan 63,756 59,248 24,321 5,614 5,857 3,907 7,152 1,733 3,154 1,730 2,139 2,491 2,287 3,391 1,171 40,382 2,561
United Kingdom 58,430 53,066 39,018 3,428 9,992 2,298 12,215 1,390 5,591 1,790 3,343 12,738 3,273 1,510 1,535 29,912 3,069
Germany 57,433 53,993 29,777 5,829 7,299 1,668 8,846 1,193 4,216 1,575 2,693 2,756 2,677 1,644 1,302 39,327 2,744
Korea South 50,965 46,274 20,996 3,547 4,808 3,372 6,178 1,245 2,782 1,566 1,874 2,717 2,036 1,866 1,033 31,960 2,285
Netherlands 45,305 42,050 18,163 3,448 4,245 1,061 4,748 704 2,601 685 1,734 2,503 1,821 1,323 892 32,326 2,122
Brazil 34,595 31,763 14,156 3,807 3,384 1,265 3,219 542 1,857 484 1,307 1,265 1,540 834 829 23,566 2,020
Taiwan 30,219 27,692 16,474 1,448 3,500 1,224 4,541 590 2,306 647 1,564 2,975 1,698 1,319 850 19,489 2,015
Belgium 27,568 26,358 9,649 1,628 2,054 736 2,360 408 1,277 382 897 788 1,059 738 547 21,679 1,455
France 27,303 25,130 18,327 2,988 4,198 837 5,252 585 2,603 503 1,701 831 1,772 928 846 18,458 1,955
India 27,080 24,531 17,291 2,270 3,953 1,707 4,524 753 2,471 694 1,675 2,341 1,714 884 902 15,883 2,052
Singapore 26,929 25,094 17,706 1,638 3,988 746 4,554 459 2,646 1,097 1,743 1,680 1,848 796 865 18,677 2,062
Hong Kong 23,849 22,367 19,950 2,845 5,244 2,782 6,250 1,145 2,404 811 1,563 1,123 1,685 1,516 853 12,144 1,951
Australia 23,382 21,072 28,581 1,738 6,723 772 8,622 584 4,188 484 2,656 963 2,575 842 1,224 15,687 2,593
Italy 19,885 17,864 16,770 1,350 3,641 674 4,486 498 2,487 495 1,622 1,292 1,753 814 827 12,740 1,954
Switzerland 18,066 16,378 10,266 1,619 2,200 906 3,014 232 1,351 313 883 1,227 933 389 535 11,692 1,350
United Arab Emirates 14,721 13,419 15,355 1,832 4,209 2,029 4,250 892 1,923 384 1,234 382 1,319 517 711 7,383 1,709
Spain 12,856 11,281 11,423 601 2,373 458 2,874 383 1,637 330 1,088 1,086 1,224 450 631 7,973 1,596
Chile 12,483 11,075 12,457 910 2,940 577 3,121 356 1,584 302 1,055 947 1,221 239 682 7,744 1,854
Malaysia 12,296 11,674 11,833 850 2,549 805 2,796 498 1,720 358 1,197 586 1,292 435 627 8,143 1,652
Colombia 11,914 11,185 11,585 1,236 3,099 673 2,837 469 1,271 144 884 668 1,116 633 616 7,362 1,762
Thailand 11,277 9,734 11,893 923 2,344 631 2,893 368 1,624 293 1,219 619 1,332 628 718 6,272 1,763
Saudi Arabia 11,109 9,191 9,247 735 2,241 476 2,187 347 1,191 260 834 829 927 354 497 6,189 1,370
All other countries 212,156 185,588 123,466 24,068 49,140 15,022 39,080 7,894 13,257 6,129 7,536 13,956 6,545 8,831 2,896 109,687 5,012
Africa 21,938 18,777 24,397 3,636 10,015 1,549 5,536 709 2,472 552 1,580 1,263 1,707 785 874 10,282 2,213
APEC 887,402 781,264 183,963 68,847 64,051 40,643 65,857 24,229 21,871 25,075 11,728 55,154 9,985 35,870 4,131 531,445 6,340
ASEAN 76,375 69,867 36,944 6,670 9,647 4,218 10,872 2,521 5,351 2,604 3,390 4,098 3,256 3,263 1,467 46,493 2,961
Asia - South 32,967 29,046 20,152 2,932 4,899 2,373 5,433 915 2,826 1,035 1,885 2,821 1,901 1,134 1,003 17,837 2,205
Asia - Near East 46,799 38,898 34,837 4,622 10,256 4,150 10,553 1,959 4,508 1,269 2,809 2,073 2,721 1,401 1,310 23,425 2,680
CAFTA 27,250 25,038 26,221 3,515 8,716 1,893 7,027 874 2,899 783 1,869 2,104 2,087 1,114 1,104 14,755 2,519
Cent. Am. Common Market 19,735 18,111 20,511 2,138 6,328 1,309 5,466 651 2,276 445 1,511 1,638 1,719 664 939 11,265 2,272
Euro Area 211,859 195,889 66,058 17,657 19,159 6,214 21,433 4,708 9,000 4,456 5,324 10,599 4,992 6,894 2,194 145,361 3,956
Europe 330,395 302,447 95,870 26,345 30,959 11,797 32,239 7,813 12,198 7,826 6,921 27,190 6,226 10,240 2,706 211,235 4,621
European Union 231,223 213,162 73,745 19,167 22,057 7,158 24,126 5,347 9,925 5,126 5,820 11,850 5,351 7,658 2,339 156,856 4,127
LAFTA 292,158 268,368 75,907 29,266 25,908 13,382 22,570 8,843 9,355 7,459 5,738 25,565 5,524 10,207 2,513 173,646 4,299
NATO Allies 538,196 458,611 148,443 37,217 47,256 18,776 52,720 11,964 19,079 13,589 10,458 34,923 9,046 19,149 3,845 322,993 6,039
North America 466,873 393,584 122,131 35,919 36,662 18,184 41,974 12,326 16,510 12,852 9,350 31,484 8,343 18,285 3,592 264,532 5,700
OECD - Europe 948,440 833,587 197,571 73,563 69,978 38,635 70,537 24,052 23,147 24,968 12,392 65,898 10,460 34,835 4,347 571,635 6,710
OPEC 34,558 29,470 30,928 3,849 12,033 3,482 8,284 1,579 3,180 854 1,968 1,556 2,036 1,015 1,042 17,135 2,385
Pacific Rim Countries 374,577 346,714 90,803 29,099 28,322 19,467 31,406 10,436 11,656 10,871 6,661 20,723 5,916 15,959 2,565 240,158 4,277
South/Central America 128,828 116,790 74,421 14,630 27,933 8,199 22,462 3,872 8,215 2,738 4,931 8,802 4,602 4,900 2,216 73,650 4,062
20 Latin Amer. Republics 326,643 300,041 90,549 33,470 33,041 15,666 27,041 9,985 10,668 8,391 6,397 28,741 6,049 11,867 2,739 191,920 4,614
(1) Known value is defined as the portion of U.S. total exports that could be matched to specific companies.
(2) Includes missing employment data, nonemployers, and companies that reported annual payroll but did not report any employees on their payroll
during specified period(s) in 2020.
Note: This table is compiled using data from export trade information and the Business Register. For information on nonsampling errors and other data limitations, see the explanatory notes.
Value in millions of dollars. Details may not equal totals due to rounding. (D) - Represents suppressed to avoid disclosure.
500+ employees1-19 employees 20-49 employees
Unknown number
of employees (2) 50-99 employees 100-249 employees 250-499 employees
29
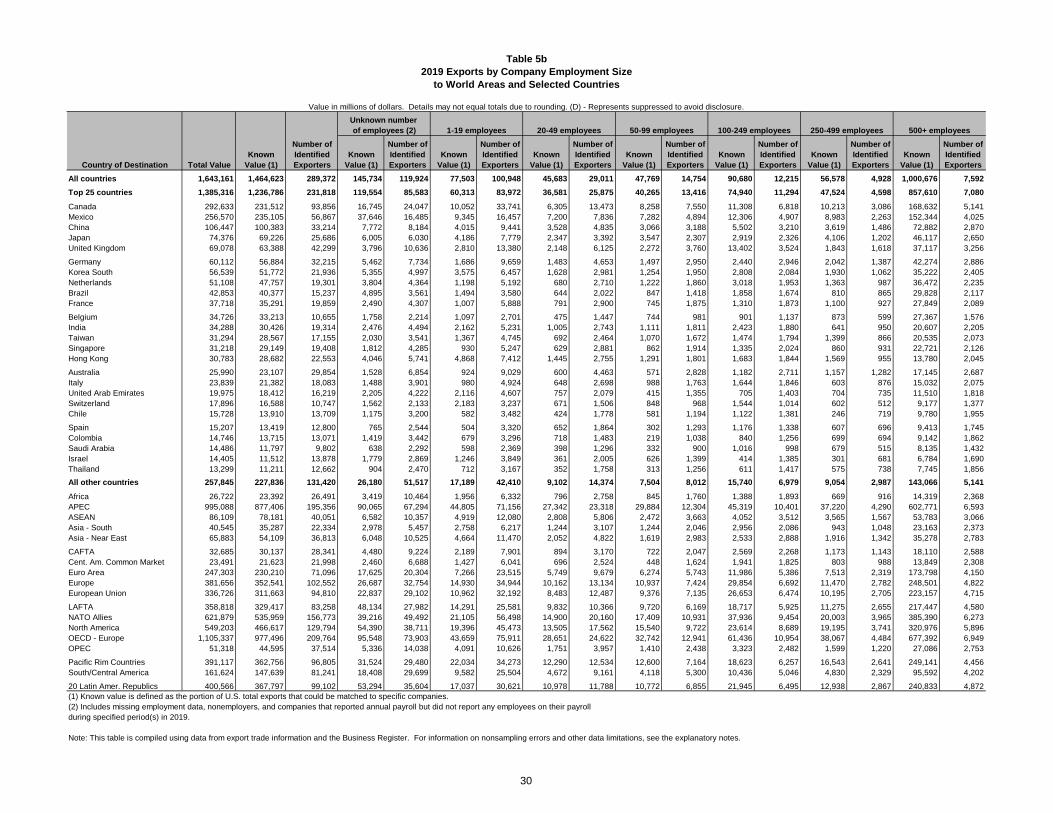
Table 5b
2019 Exports by Company Employment Size
to World Areas and Selected Countries
Number of Number of Number of Number of Number of Number of Number of Number of
Known Identified Known Identified Known Identified Known Identified Known Identified Known Identified Known Identified Known Identified
Country of Destination Total Value Value (1) Exporters Value (1) Exporters Value (1) Exporters Value (1) Exporters Value (1) Exporters Value (1) Exporters Value (1) Exporters Value (1) Exporters
All countries 1,643,161 1,464,623 289,372 145,734 119,924 77,503 100,948 45,683 29,011 47,769 14,754 90,680 12,215 56,578 4,928 1,000,676 7,592
Top 25 countries 1,385,316 1,236,786 231,818 119,554 85,583 60,313 83,972 36,581 25,875 40,265 13,416 74,940 11,294 47,524 4,598 857,610 7,080
Canada 292,633 231,512 93,856 16,745 24,047 10,052 33,741 6,305 13,473 8,258 7,550 11,308 6,818 10,213 3,086 168,632 5,141
Mexico 256,570 235,105 56,867 37,646 16,485 9,345 16,457 7,200 7,836 7,282 4,894 12,306 4,907 8,983 2,263 152,344 4,025
China 106,447 100,383 33,214 7,772 8,184 4,015 9,441 3,528 4,835 3,066 3,188 5,502 3,210 3,619 1,486 72,882 2,870
Japan 74,376 69,226 25,686 6,005 6,030 4,186 7,779 2,347 3,392 3,547 2,307 2,919 2,326 4,106 1,202 46,117 2,650
United Kingdom 69,078 63,388 42,299 3,796 10,636 2,810 13,380 2,148 6,125 2,272 3,760 13,402 3,524 1,843 1,618 37,117 3,256
Germany 60,112 56,884 32,215 5,462 7,734 1,686 9,659 1,483 4,653 1,497 2,950 2,440 2,946 2,042 1,387 42,274 2,886
Korea South 56,539 51,772 21,936 5,355 4,997 3,575 6,457 1,628 2,981 1,254 1,950 2,808 2,084 1,930 1,062 35,222 2,405
Netherlands 51,108 47,757 19,301 3,804 4,364 1,198 5,192 680 2,710 1,222 1,860 3,018 1,953 1,363 987 36,472 2,235
Brazil 42,853 40,377 15,237 4,895 3,561 1,494 3,580 644 2,022 847 1,418 1,858 1,674 810 865 29,828 2,117
France 37,718 35,291 19,859 2,490 4,307 1,007 5,888 791 2,900 745 1,875 1,310 1,873 1,100 927 27,849 2,089
Belgium 34,726 33,213 10,655 1,758 2,214 1,097 2,701 475 1,447 744 981 901 1,137 873 599 27,367 1,576
India 34,288 30,426 19,314 2,476 4,494 2,162 5,231 1,005 2,743 1,111 1,811 2,423 1,880 641 950 20,607 2,205
Taiwan 31,294 28,567 17,155 2,030 3,541 1,367 4,745 692 2,464 1,070 1,672 1,474 1,794 1,399 866 20,535 2,073
Singapore 31,218 29,149 19,408 1,812 4,285 930 5,247 629 2,881 862 1,914 1,335 2,024 860 931 22,721 2,126
Hong Kong 30,783 28,682 22,553 4,046 5,741 4,868 7,412 1,445 2,755 1,291 1,801 1,683 1,844 1,569 955 13,780 2,045
Australia 25,990 23,107 29,854 1,528 6,854 924 9,029 600 4,463 571 2,828 1,182 2,711 1,157 1,282 17,145 2,687
Italy 23,839 21,382 18,083 1,488 3,901 980 4,924 648 2,698 988 1,763 1,644 1,846 603 876 15,032 2,075
United Arab Emirates 19,975 18,412 16,219 2,205 4,222 2,116 4,607 757 2,079 415 1,355 705 1,403 704 735 11,510 1,818
Switzerland 17,896 16,588 10,747 1,562 2,133 2,183 3,237 671 1,506 848 968 1,544 1,014 602 512 9,177 1,377
Chile 15,728 13,910 13,709 1,175 3,200 582 3,482 424 1,778 581 1,194 1,122 1,381 246 719 9,780 1,955
Spain 15,207 13,419 12,800 765 2,544 504 3,320 652 1,864 302 1,293 1,176 1,338 607 696 9,413 1,745
Colombia 14,746 13,715 13,071 1,419 3,442 679 3,296 718 1,483 219 1,038 840 1,256 699 694 9,142 1,862
Saudi Arabia 14,486 11,797 9,802 638 2,292 598 2,369 398 1,296 332 900 1,016 998 679 515 8,135 1,432
Israel 14,405 11,512 13,878 1,779 2,869 1,246 3,849 361 2,005 626 1,399 414 1,385 301 681 6,784 1,690
Thailand 13,299 11,211 12,662 904 2,470 712 3,167 352 1,758 313 1,256 611 1,417 575 738 7,745 1,856
All other countries 257,845 227,836 131,420 26,180 51,517 17,189 42,410 9,102 14,374 7,504 8,012 15,740 6,979 9,054 2,987 143,066 5,141
Africa 26,722 23,392 26,491 3,419 10,464 1,956 6,332 796 2,758 845 1,760 1,388 1,893 669 916 14,319 2,368
APEC 995,088 877,406 195,356 90,065 67,294 44,805 71,156 27,342 23,318 29,884 12,304 45,319 10,401 37,220 4,290 602,771 6,593
ASEAN 86,109 78,181 40,051 6,582 10,357 4,919 12,080 2,808 5,806 2,472 3,663 4,052 3,512 3,565 1,567 53,783 3,066
Asia - South 40,545 35,287 22,334 2,978 5,457 2,758 6,217 1,244 3,107 1,244 2,046 2,956 2,086 943 1,048 23,163 2,373
Asia - Near East 65,883 54,109 36,813 6,048 10,525 4,664 11,470 2,052 4,822 1,619 2,983 2,533 2,888 1,916 1,342 35,278 2,783
CAFTA 32,685 30,137 28,341 4,480 9,224 2,189 7,901 894 3,170 722 2,047 2,569 2,268 1,173 1,143 18,110 2,588
Cent. Am. Common Market 23,491 21,623 21,998 2,460 6,688 1,427 6,041 696 2,524 448 1,624 1,941 1,825 803 988 13,849 2,308
Euro Area 247,303 230,210 71,096 17,625 20,304 7,266 23,515 5,749 9,679 6,274 5,743 11,986 5,386 7,513 2,319 173,798 4,150
Europe 381,656 352,541 102,552 26,687 32,754 14,930 34,944 10,162 13,134 10,937 7,424 29,854 6,692 11,470 2,782 248,501 4,822
European Union 336,726 311,663 94,810 22,837 29,102 10,962 32,192 8,483 12,487 9,376 7,135 26,653 6,474 10,195 2,705 223,157 4,715
LAFTA 358,818 329,417 83,258 48,134 27,982 14,291 25,581 9,832 10,366 9,720 6,169 18,717 5,925 11,275 2,655 217,447 4,580
NATO Allies 621,879 535,959 156,773 39,216 49,492 21,105 56,498 14,900 20,160 17,409 10,931 37,936 9,454 20,003 3,965 385,390 6,273
North America 549,203 466,617 129,794 54,390 38,711 19,396 45,473 13,505 17,562 15,540 9,722 23,614 8,689 19,195 3,741 320,976 5,896
OECD - Europe 1,105,337 977,496 209,764 95,548 73,903 43,659 75,911 28,651 24,622 32,742 12,941 61,436 10,954 38,067 4,484 677,392 6,949
OPEC 51,318 44,595 37,514 5,336 14,038 4,091 10,626 1,751 3,957 1,410 2,438 3,323 2,482 1,599 1,220 27,086 2,753
Pacific Rim Countries 391,117 362,756 96,805 31,524 29,480 22,034 34,273 12,290 12,534 12,600 7,164 18,623 6,257 16,543 2,641 249,141 4,456
South/Central America 161,624 147,639 81,241 18,408 29,699 9,582 25,504 4,672 9,161 4,118 5,300 10,436 5,046 4,830 2,329 95,592 4,202
20 Latin Amer. Republics 400,566 367,797 99,102 53,294 35,604 17,037 30,621 10,978 11,788 10,772 6,855 21,945 6,495 12,938 2,867 240,833 4,872
(1) Known value is defined as the portion of U.S. total exports that could be matched to specific companies.
(2) Includes missing employment data, nonemployers, and companies that reported annual payroll but did not report any employees on their payroll
during specified period(s) in 2019.
Note: This table is compiled using data from export trade information and the Business Register. For information on nonsampling errors and other data limitations, see the explanatory notes.
Value in millions of dollars. Details may not equal totals due to rounding. (D) - Represents suppressed to avoid disclosure.
Unknown number
of employees (2) 50-99 employees 500+ employees100-249 employees 250-499 employees1-19 employees 20-49 employees
30
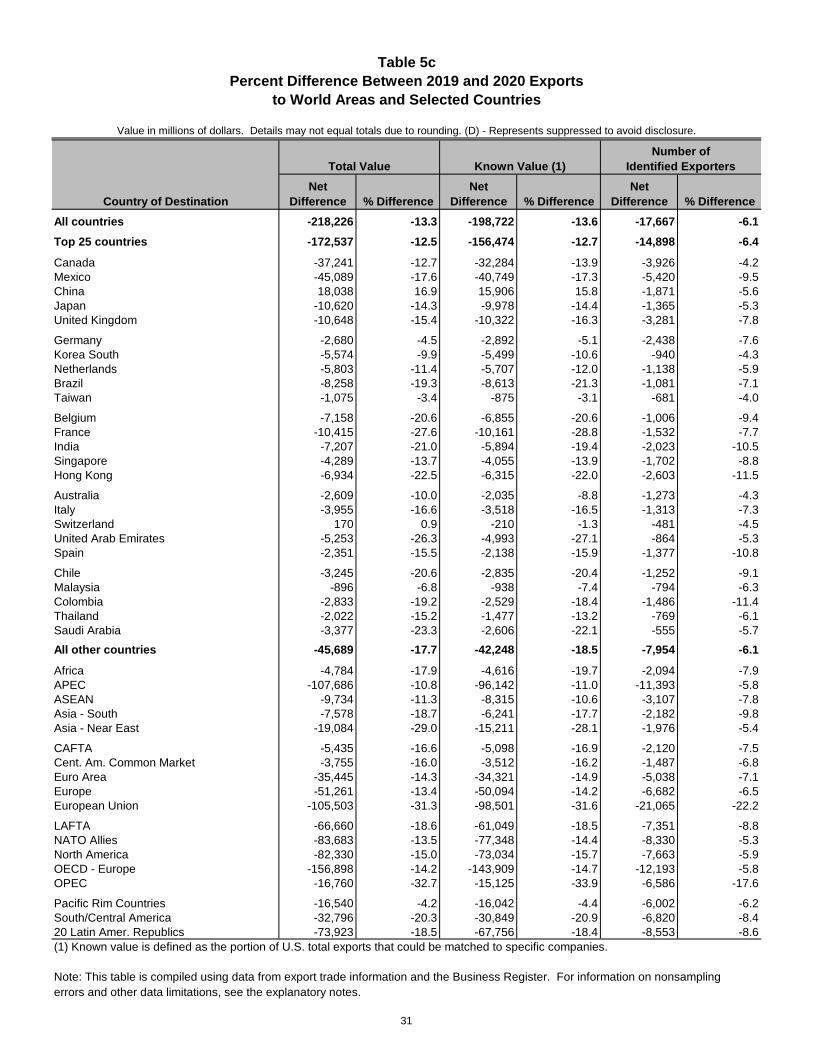
Table 5c
Percent Difference Between 2019 and 2020 Exports
to World Areas and Selected Countries
Value in millions of dollars. Details may not equal totals due to rounding. (D) - Represents suppressed to avoid disclosure.
Net Net Net
Country of Destination Difference % Difference Difference % Difference Difference % Difference
All countries -218,226 -13.3 -198,722 -13.6 -17,667 -6.1
Top 25 countries -172,537 -12.5 -156,474 -12.7 -14,898 -6.4
Canada -37,241 -12.7 -32,284 -13.9 -3,926 -4.2
Mexico -45,089 -17.6 -40,749 -17.3 -5,420 -9.5
China 18,038 16.9 15,906 15.8 -1,871 -5.6
Japan -10,620 -14.3 -9,978 -14.4 -1,365 -5.3
United Kingdom -10,648 -15.4 -10,322 -16.3 -3,281 -7.8
Germany -2,680 -4.5 -2,892 -5.1 -2,438 -7.6
Korea South -5,574 -9.9 -5,499 -10.6 -940 -4.3
Netherlands -5,803 -11.4 -5,707 -12.0 -1,138 -5.9
Brazil -8,258 -19.3 -8,613 -21.3 -1,081 -7.1
Taiwan -1,075 -3.4 -875 -3.1 -681 -4.0
Belgium -7,158 -20.6 -6,855 -20.6 -1,006 -9.4
France -10,415 -27.6 -10,161 -28.8 -1,532 -7.7
India -7,207 -21.0 -5,894 -19.4 -2,023 -10.5
Singapore -4,289 -13.7 -4,055 -13.9 -1,702 -8.8
Hong Kong -6,934 -22.5 -6,315 -22.0 -2,603 -11.5
Australia -2,609 -10.0 -2,035 -8.8 -1,273 -4.3
Italy -3,955 -16.6 -3,518 -16.5 -1,313 -7.3
Switzerland 170 0.9 -210 -1.3 -481 -4.5
United Arab Emirates -5,253 -26.3 -4,993 -27.1 -864 -5.3
Spain -2,351 -15.5 -2,138 -15.9 -1,377 -10.8
Chile -3,245 -20.6 -2,835 -20.4 -1,252 -9.1
Malaysia -896 -6.8 -938 -7.4 -794 -6.3
Colombia -2,833 -19.2 -2,529 -18.4 -1,486 -11.4
Thailand -2,022 -15.2 -1,477 -13.2 -769 -6.1
Saudi Arabia -3,377 -23.3 -2,606 -22.1 -555 -5.7
All other countries -45,689 -17.7 -42,248 -18.5 -7,954 -6.1
Africa -4,784 -17.9 -4,616 -19.7 -2,094 -7.9
APEC -107,686 -10.8 -96,142 -11.0 -11,393 -5.8
ASEAN -9,734 -11.3 -8,315 -10.6 -3,107 -7.8
Asia - South -7,578 -18.7 -6,241 -17.7 -2,182 -9.8
Asia - Near East -19,084 -29.0 -15,211 -28.1 -1,976 -5.4
CAFTA -5,435 -16.6 -5,098 -16.9 -2,120 -7.5
Cent. Am. Common Market -3,755 -16.0 -3,512 -16.2 -1,487 -6.8
Euro Area -35,445 -14.3 -34,321 -14.9 -5,038 -7.1
Europe -51,261 -13.4 -50,094 -14.2 -6,682 -6.5
European Union -105,503 -31.3 -98,501 -31.6 -21,065 -22.2
LAFTA -66,660 -18.6 -61,049 -18.5 -7,351 -8.8
NATO Allies -83,683 -13.5 -77,348 -14.4 -8,330 -5.3
North America -82,330 -15.0 -73,034 -15.7 -7,663 -5.9
OECD - Europe -156,898 -14.2 -143,909 -14.7 -12,193 -5.8
OPEC -16,760 -32.7 -15,125 -33.9 -6,586 -17.6
Pacific Rim Countries -16,540 -4.2 -16,042 -4.4 -6,002 -6.2
South/Central America -32,796 -20.3 -30,849 -20.9 -6,820 -8.4
20 Latin Amer. Republics -73,923 -18.5 -67,756 -18.4 -8,553 -8.6
(1) Known value is defined as the portion of U.S. total exports that could be matched to specific companies.
Note: This table is compiled using data from export trade information and the Business Register. For information on nonsampling
errors and other data limitations, see the explanatory notes.
Total Value Known Value (1) Identified Exporters
Number of
31
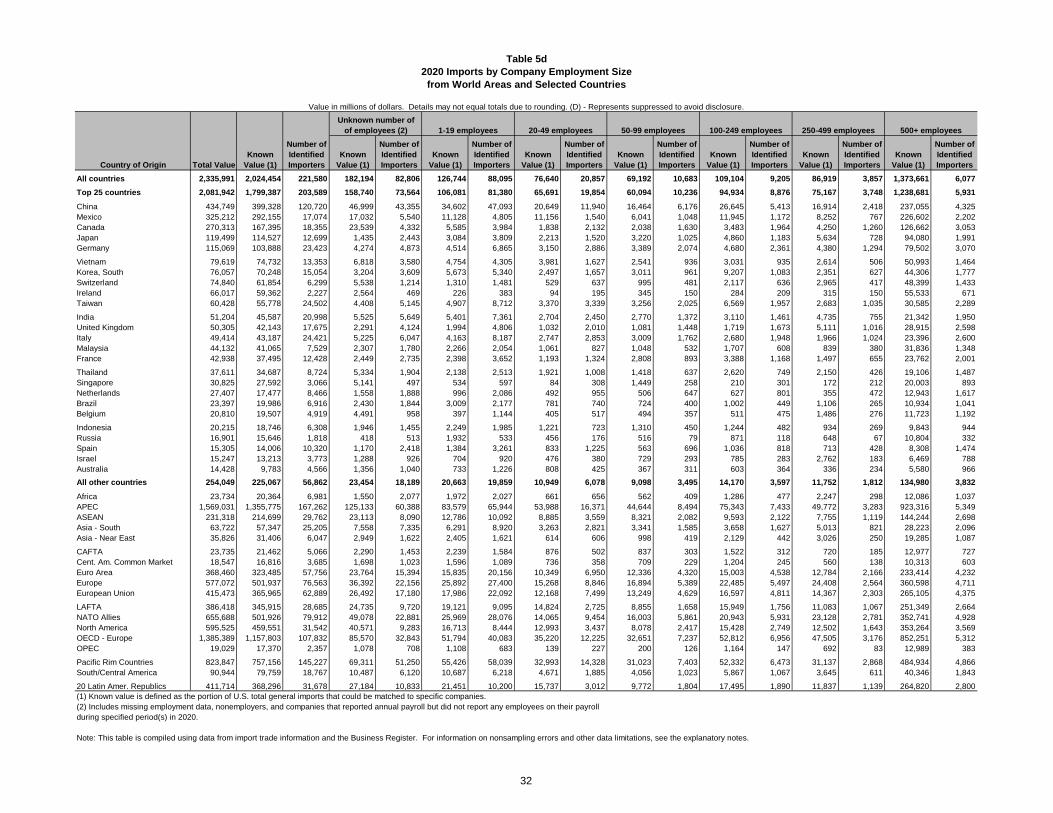
Table 5d
2020 Imports by Company Employment Size
from World Areas and Selected Countries
Number of Number of Number of Number of Number of Number of Number of Number of
Known Identified Known Identified Known Identified Known Identified Known Identified Known Identified Known Identified Known Identified
Country of Origin Total Value Value (1) Importers Value (1) Importers Value (1) Importers Value (1) Importers Value (1) Importers Value (1) Importers Value (1) Importers Value (1) Importers
All countries 2,335,991 2,024,454 221,580 182,194 82,806 126,744 88,095 76,640 20,857 69,192 10,683 109,104 9,205 86,919 3,857 1,373,661 6,077
Top 25 countries 2,081,942 1,799,387 203,589 158,740 73,564 106,081 81,380 65,691 19,854 60,094 10,236 94,934 8,876 75,167 3,748 1,238,681 5,931
China 434,749 399,328 120,720 46,999 43,355 34,602 47,093 20,649 11,940 16,464 6,176 26,645 5,413 16,914 2,418 237,055 4,325
Mexico 325,212 292,155 17,074 17,032 5,540 11,128 4,805 11,156 1,540 6,041 1,048 11,945 1,172 8,252 767 226,602 2,202
Canada 270,313 167,395 18,355 23,539 4,332 5,585 3,984 1,838 2,132 2,038 1,630 3,483 1,964 4,250 1,260 126,662 3,053
Japan 119,499 114,527 12,699 1,435 2,443 3,084 3,809 2,213 1,520 3,220 1,025 4,860 1,183 5,634 728 94,080 1,991
Germany 115,069 103,888 23,423 4,274 4,873 4,514 6,865 3,150 2,886 3,389 2,074 4,680 2,361 4,380 1,294 79,502 3,070
Vietnam 79,619 74,732 13,353 6,818 3,580 4,754 4,305 3,981 1,627 2,541 936 3,031 935 2,614 506 50,993 1,464
Korea, South 76,057 70,248 15,054 3,204 3,609 5,673 5,340 2,497 1,657 3,011 961 9,207 1,083 2,351 627 44,306 1,777
Switzerland 74,840 61,854 6,299 5,538 1,214 1,310 1,481 529 637 995 481 2,117 636 2,965 417 48,399 1,433
Ireland 66,017 59,362 2,227 2,564 469 226 383 94 195 345 150 284 209 315 150 55,533 671
Taiwan 60,428 55,778 24,502 4,408 5,145 4,907 8,712 3,370 3,339 3,256 2,025 6,569 1,957 2,683 1,035 30,585 2,289
India 51,204 45,587 20,998 5,525 5,649 5,401 7,361 2,704 2,450 2,770 1,372 3,110 1,461 4,735 755 21,342 1,950
United Kingdom 50,305 42,143 17,675 2,291 4,124 1,994 4,806 1,032 2,010 1,081 1,448 1,719 1,673 5,111 1,016 28,915 2,598
Italy 49,414 43,187 24,421 5,225 6,047 4,163 8,187 2,747 2,853 3,009 1,762 2,680 1,948 1,966 1,024 23,396 2,600
Malaysia 44,132 41,065 7,529 2,307 1,780 2,266 2,054 1,061 827 1,048 532 1,707 608 839 380 31,836 1,348
France 42,938 37,495 12,428 2,449 2,735 2,398 3,652 1,193 1,324 2,808 893 3,388 1,168 1,497 655 23,762 2,001
Thailand 37,611 34,687 8,724 5,334 1,904 2,138 2,513 1,921 1,008 1,418 637 2,620 749 2,150 426 19,106 1,487
Singapore 30,825 27,592 3,066 5,141 497 534 597 84 308 1,449 258 210 301 172 212 20,003 893
Netherlands 27,407 17,477 8,466 1,558 1,888 996 2,086 492 955 506 647 627 801 355 472 12,943 1,617
Brazil 23,397 19,986 6,916 2,430 1,844 3,009 2,177 781 740 724 400 1,002 449 1,106 265 10,934 1,041
Belgium 20,810 19,507 4,919 4,491 958 397 1,144 405 517 494 357 511 475 1,486 276 11,723 1,192
Indonesia 20,215 18,746 6,308 1,946 1,455 2,249 1,985 1,221 723 1,310 450 1,244 482 934 269 9,843 944
Russia 16,901 15,646 1,818 418 513 1,932 533 456 176 516 79 871 118 648 67 10,804 332
Spain 15,305 14,006 10,320 1,170 2,418 1,384 3,261 833 1,225 563 696 1,036 818 713 428 8,308 1,474
Israel 15,247 13,213 3,773 1,288 926 704 920 476 380 729 293 785 283 2,762 183 6,469 788
Australia 14,428 9,783 4,566 1,356 1,040 733 1,226 808 425 367 311 603 364 336 234 5,580 966
All other countries 254,049 225,067 56,862 23,454 18,189 20,663 19,859 10,949 6,078 9,098 3,495 14,170 3,597 11,752 1,812 134,980 3,832
Africa 23,734 20,364 6,981 1,550 2,077 1,972 2,027 661 656 562 409 1,286 477 2,247 298 12,086 1,037
APEC 1,569,031 1,355,775 167,262 125,133 60,388 83,579 65,944 53,988 16,371 44,644 8,494 75,343 7,433 49,772 3,283 923,316 5,349
ASEAN 231,318 214,699 29,762 23,113 8,090 12,786 10,092 8,885 3,559 8,321 2,082 9,593 2,122 7,755 1,119 144,244 2,698
Asia - South 63,722 57,347 25,205 7,558 7,335 6,291 8,920 3,263 2,821 3,341 1,585 3,658 1,627 5,013 821 28,223 2,096
Asia - Near East 35,826 31,406 6,047 2,949 1,622 2,405 1,621 614 606 998 419 2,129 442 3,026 250 19,285 1,087
CAFTA 23,735 21,462 5,066 2,290 1,453 2,239 1,584 876 502 837 303 1,522 312 720 185 12,977 727
Cent. Am. Common Market 18,547 16,816 3,685 1,698 1,023 1,596 1,089 736 358 709 229 1,204 245 560 138 10,313 603
Euro Area 368,460 323,485 57,756 23,764 15,394 15,835 20,156 10,349 6,950 12,336 4,320 15,003 4,538 12,784 2,166 233,414 4,232
Europe 577,072 501,937 76,563 36,392 22,156 25,892 27,400 15,268 8,846 16,894 5,389 22,485 5,497 24,408 2,564 360,598 4,711
European Union 415,473 365,965 62,889 26,492 17,180 17,986 22,092 12,168 7,499 13,249 4,629 16,597 4,811 14,367 2,303 265,105 4,375
LAFTA 386,418 345,915 28,685 24,735 9,720 19,121 9,095 14,824 2,725 8,855 1,658 15,949 1,756 11,083 1,067 251,349 2,664
NATO Allies 655,688 501,926 79,912 49,078 22,881 25,969 28,076 14,065 9,454 16,003 5,861 20,943 5,931 23,128 2,781 352,741 4,928
North America 595,525 459,551 31,542 40,571 9,283 16,713 8,444 12,993 3,437 8,078 2,417 15,428 2,749 12,502 1,643 353,264 3,569
OECD - Europe 1,385,389 1,157,803 107,832 85,570 32,843 51,794 40,083 35,220 12,225 32,651 7,237 52,812 6,956 47,505 3,176 852,251 5,312
OPEC 19,029 17,370 2,357 1,078 708 1,108 683 139 227 200 126 1,164 147 692 83 12,989 383
Pacific Rim Countries 823,847 757,156 145,227 69,311 51,250 55,426 58,039 32,993 14,328 31,023 7,403 52,332 6,473 31,137 2,868 484,934 4,866
South/Central America 90,944 79,759 18,767 10,487 6,120 10,687 6,218 4,671 1,885 4,056 1,023 5,867 1,067 3,645 611 40,346 1,843
20 Latin Amer. Republics 411,714 368,296 31,678 27,184 10,833 21,451 10,200 15,737 3,012 9,772 1,804 17,495 1,890 11,837 1,139 264,820 2,800
(1) Known value is defined as the portion of U.S. total general imports that could be matched to specific companies.
(2) Includes missing employment data, nonemployers, and companies that reported annual payroll but did not report any employees on their payroll
during specified period(s) in 2020.
Note: This table is compiled using data from import trade information and the Business Register. For information on nonsampling errors and other data limitations, see the explanatory notes.
Value in millions of dollars. Details may not equal totals due to rounding. (D) - Represents suppressed to avoid disclosure.
1-19 employees
Unknown number of
of employees (2) 500+ employees20-49 employees 50-99 employees 100-249 employees 250-499 employees
32
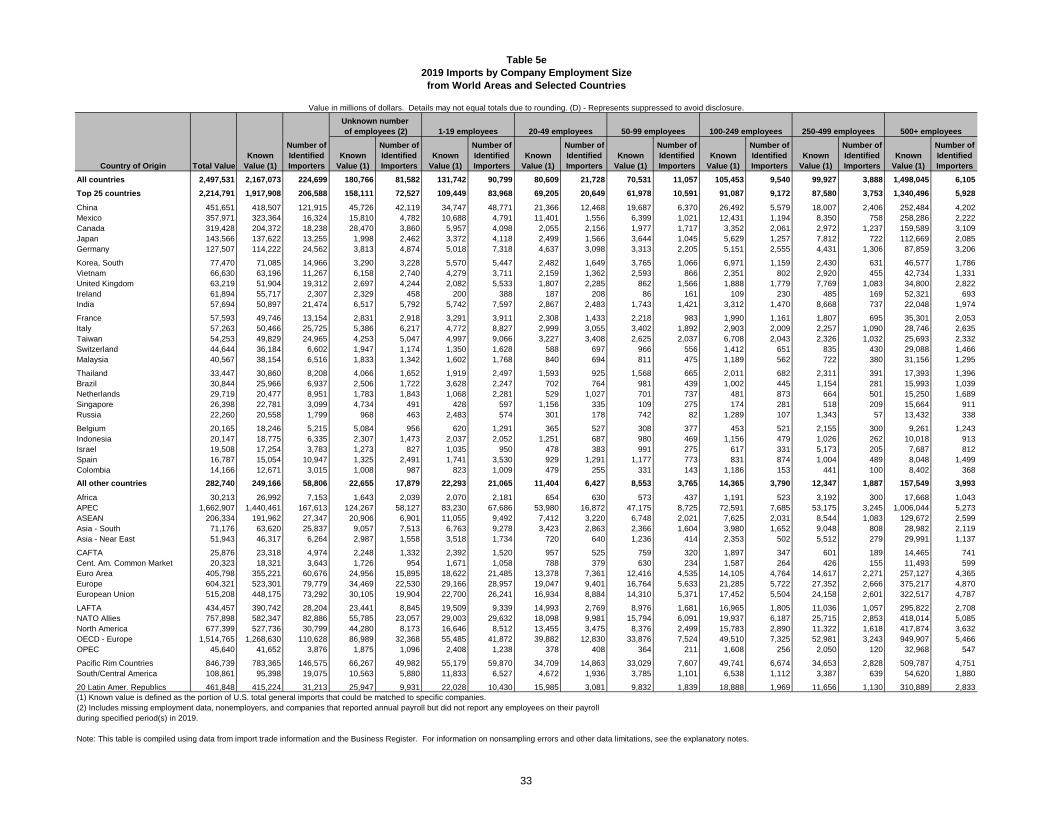
Table 5e
2019 Imports by Company Employment Size
from World Areas and Selected Countries
Number of Number of Number of Number of Number of Number of Number of Number of
Known Identified Known Identified Known Identified Known Identified Known Identified Known Identified Known Identified Known Identified
Country of Origin Total Value Value (1) Importers Value (1) Importers Value (1) Importers Value (1) Importers Value (1) Importers Value (1) Importers Value (1) Importers Value (1) Importers
All countries 2,497,531 2,167,073 224,699 180,766 81,582 131,742 90,799 80,609 21,728 70,531 11,057 105,453 9,540 99,927 3,888 1,498,045 6,105
Top 25 countries 2,214,791 1,917,908 206,588 158,111 72,527 109,449 83,968 69,205 20,649 61,978 10,591 91,087 9,172 87,580 3,753 1,340,496 5,928
China 451,651 418,507 121,915 45,726 42,119 34,747 48,771 21,366 12,468 19,687 6,370 26,492 5,579 18,007 2,406 252,484 4,202
Mexico 357,971 323,364 16,324 15,810 4,782 10,688 4,791 11,401 1,556 6,399 1,021 12,431 1,194 8,350 758 258,286 2,222
Canada 319,428 204,372 18,238 28,470 3,860 5,957 4,098 2,055 2,156 1,977 1,717 3,352 2,061 2,972 1,237 159,589 3,109
Japan 143,566 137,622 13,255 1,998 2,462 3,372 4,118 2,499 1,566 3,644 1,045 5,629 1,257 7,812 722 112,669 2,085
Germany 127,507 114,222 24,562 3,813 4,874 5,018 7,318 4,637 3,098 3,313 2,205 5,151 2,555 4,431 1,306 87,859 3,206
Korea, South 77,470 71,085 14,966 3,290 3,228 5,570 5,447 2,482 1,649 3,765 1,066 6,971 1,159 2,430 631 46,577 1,786
Vietnam 66,630 63,196 11,267 6,158 2,740 4,279 3,711 2,159 1,362 2,593 866 2,351 802 2,920 455 42,734 1,331
United Kingdom 63,219 51,904 19,312 2,697 4,244 2,082 5,533 1,807 2,285 862 1,566 1,888 1,779 7,769 1,083 34,800 2,822
Ireland 61,894 55,717 2,307 2,329 458 200 388 187 208 86 161 109 230 485 169 52,321 693
India 57,694 50,897 21,474 6,517 5,792 5,742 7,597 2,867 2,483 1,743 1,421 3,312 1,470 8,668 737 22,048 1,974
France 57,593 49,746 13,154 2,831 2,918 3,291 3,911 2,308 1,433 2,218 983 1,990 1,161 1,807 695 35,301 2,053
Italy 57,263 50,466 25,725 5,386 6,217 4,772 8,827 2,999 3,055 3,402 1,892 2,903 2,009 2,257 1,090 28,746 2,635
Taiwan 54,253 49,829 24,965 4,253 5,047 4,997 9,066 3,227 3,408 2,625 2,037 6,708 2,043 2,326 1,032 25,693 2,332
Switzerland 44,644 36,184 6,602 1,947 1,174 1,350 1,628 588 697 966 556 1,412 651 835 430 29,088 1,466
Malaysia 40,567 38,154 6,516 1,833 1,342 1,602 1,768 840 694 811 475 1,189 562 722 380 31,156 1,295
Thailand 33,447 30,860 8,208 4,066 1,652 1,919 2,497 1,593 925 1,568 665 2,011 682 2,311 391 17,393 1,396
Brazil 30,844 25,966 6,937 2,506 1,722 3,628 2,247 702 764 981 439 1,002 445 1,154 281 15,993 1,039
Netherlands 29,719 20,477 8,951 1,783 1,843 1,068 2,281 529 1,027 701 737 481 873 664 501 15,250 1,689
Singapore 26,398 22,781 3,099 4,734 491 428 597 1,156 335 109 275 174 281 518 209 15,664 911
Russia 22,260 20,558 1,799 968 463 2,483 574 301 178 742 82 1,289 107 1,343 57 13,432 338
Belgium 20,165 18,246 5,215 5,084 956 620 1,291 365 527 308 377 453 521 2,155 300 9,261 1,243
Indonesia 20,147 18,775 6,335 2,307 1,473 2,037 2,052 1,251 687 980 469 1,156 479 1,026 262 10,018 913
Israel 19,508 17,254 3,783 1,273 827 1,035 950 478 383 991 275 617 331 5,173 205 7,687 812
Spain 16,787 15,054 10,947 1,325 2,491 1,741 3,530 929 1,291 1,177 773 831 874 1,004 489 8,048 1,499
Colombia 14,166 12,671 3,015 1,008 987 823 1,009 479 255 331 143 1,186 153 441 100 8,402 368
All other countries 282,740 249,166 58,806 22,655 17,879 22,293 21,065 11,404 6,427 8,553 3,765 14,365 3,790 12,347 1,887 157,549 3,993
Africa 30,213 26,992 7,153 1,643 2,039 2,070 2,181 654 630 573 437 1,191 523 3,192 300 17,668 1,043
APEC 1,662,907 1,440,461 167,613 124,267 58,127 83,230 67,686 53,980 16,872 47,175 8,725 72,591 7,685 53,175 3,245 1,006,044 5,273
ASEAN 206,334 191,962 27,347 20,906 6,901 11,055 9,492 7,412 3,220 6,748 2,021 7,625 2,031 8,544 1,083 129,672 2,599
Asia - South 71,176 63,620 25,837 9,057 7,513 6,763 9,278 3,423 2,863 2,366 1,604 3,980 1,652 9,048 808 28,982 2,119
Asia - Near East 51,943 46,317 6,264 2,987 1,558 3,518 1,734 720 640 1,236 414 2,353 502 5,512 279 29,991 1,137
CAFTA 25,876 23,318 4,974 2,248 1,332 2,392 1,520 957 525 759 320 1,897 347 601 189 14,465 741
Cent. Am. Common Market 20,323 18,321 3,643 1,726 954 1,671 1,058 788 379 630 234 1,587 264 426 155 11,493 599
Euro Area 405,798 355,221 60,676 24,956 15,895 18,622 21,485 13,378 7,361 12,416 4,535 14,105 4,764 14,617 2,271 257,127 4,365
Europe 604,321 523,301 79,779 34,469 22,530 29,166 28,957 19,047 9,401 16,764 5,633 21,285 5,722 27,352 2,666 375,217 4,870
European Union 515,208 448,175 73,292 30,105 19,904 22,700 26,241 16,934 8,884 14,310 5,371 17,452 5,504 24,158 2,601 322,517 4,787
LAFTA 434,457 390,742 28,204 23,441 8,845 19,509 9,339 14,993 2,769 8,976 1,681 16,965 1,805 11,036 1,057 295,822 2,708
NATO Allies 757,898 582,347 82,886 55,785 23,057 29,003 29,632 18,098 9,981 15,794 6,091 19,937 6,187 25,715 2,853 418,014 5,085
North America 677,399 527,736 30,799 44,280 8,173 16,646 8,512 13,455 3,475 8,376 2,499 15,783 2,890 11,322 1,618 417,874 3,632
OECD - Europe 1,514,765 1,268,630 110,628 86,989 32,368 55,485 41,872 39,882 12,830 33,876 7,524 49,510 7,325 52,981 3,243 949,907 5,466
OPEC 45,640 41,652 3,876 1,875 1,096 2,408 1,238 378 408 364 211 1,608 256 2,050 120 32,968 547
Pacific Rim Countries 846,739 783,365 146,575 66,267 49,982 55,179 59,870 34,709 14,863 33,029 7,607 49,741 6,674 34,653 2,828 509,787 4,751
South/Central America 108,861 95,398 19,075 10,563 5,880 11,833 6,527 4,672 1,936 3,785 1,101 6,538 1,112 3,387 639 54,620 1,880
20 Latin Amer. Republics 461,848 415,224 31,213 25,947 9,931 22,028 10,430 15,985 3,081 9,832 1,839 18,888 1,969 11,656 1,130 310,889 2,833
(1) Known value is defined as the portion of U.S. total general imports that could be matched to specific companies.
(2) Includes missing employment data, nonemployers, and companies that reported annual payroll but did not report any employees on their payroll
during specified period(s) in 2019.
Note: This table is compiled using data from import trade information and the Business Register. For information on nonsampling errors and other data limitations, see the explanatory notes.
Unknown number
of employees (2)
Value in millions of dollars. Details may not equal totals due to rounding. (D) - Represents suppressed to avoid disclosure.
1-19 employees 20-49 employees 50-99 employees 100-249 employees 250-499 employees 500+ employees
33
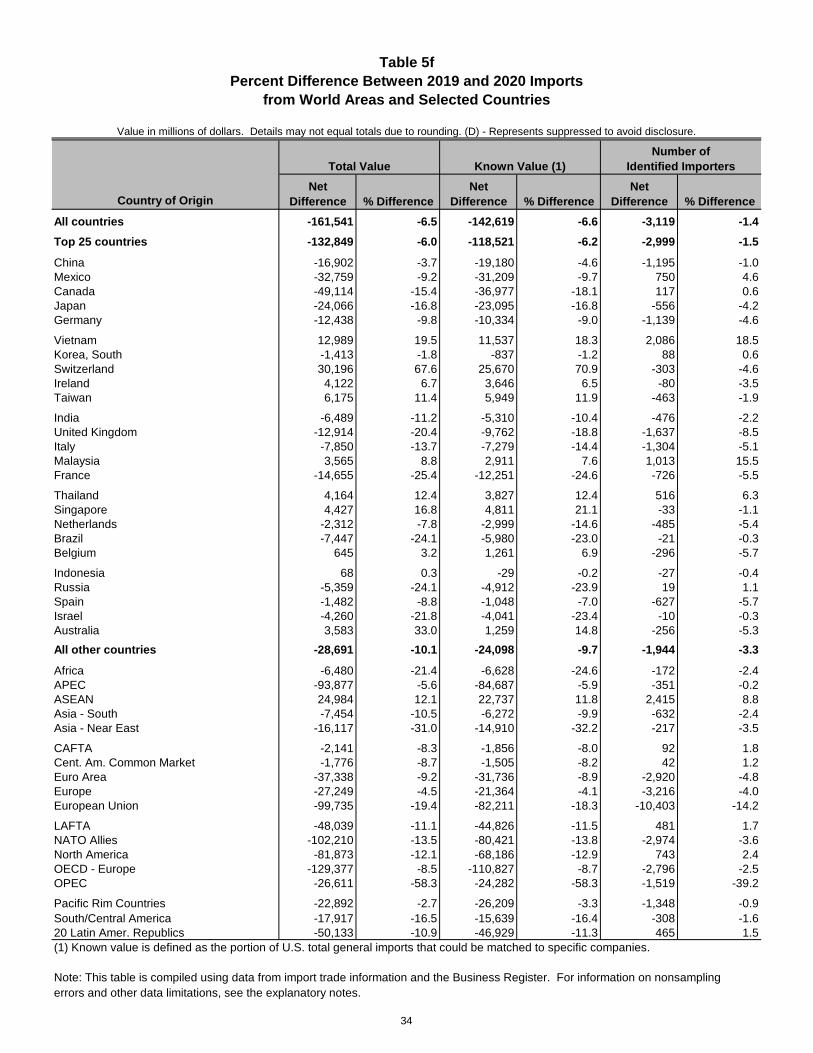
Table 5f
Percent Difference Between 2019 and 2020 Imports
from World Areas and Selected Countries
Value in millions of dollars. Details may not equal totals due to rounding. (D) - Represents suppressed to avoid disclosure.
Net Net Net
Country of Origin Difference % Difference Difference % Difference Difference % Difference
All countries -161,541 -6.5 -142,619 -6.6 -3,119 -1.4
Top 25 countries -132,849 -6.0 -118,521 -6.2 -2,999 -1.5
China -16,902 -3.7 -19,180 -4.6 -1,195 -1.0
Mexico -32,759 -9.2 -31,209 -9.7 750 4.6
Canada -49,114 -15.4 -36,977 -18.1 117 0.6
Japan -24,066 -16.8 -23,095 -16.8 -556 -4.2
Germany -12,438 -9.8 -10,334 -9.0 -1,139 -4.6
Vietnam 12,989 19.5 11,537 18.3 2,086 18.5
Korea, South -1,413 -1.8 -837 -1.2 88 0.6
Switzerland 30,196 67.6 25,670 70.9 -303 -4.6
Ireland 4,122 6.7 3,646 6.5 -80 -3.5
Taiwan 6,175 11.4 5,949 11.9 -463 -1.9
India -6,489 -11.2 -5,310 -10.4 -476 -2.2
United Kingdom -12,914 -20.4 -9,762 -18.8 -1,637 -8.5
Italy -7,850 -13.7 -7,279 -14.4 -1,304 -5.1
Malaysia 3,565 8.8 2,911 7.6 1,013 15.5
France -14,655 -25.4 -12,251 -24.6 -726 -5.5
Thailand 4,164 12.4 3,827 12.4 516 6.3
Singapore 4,427 16.8 4,811 21.1 -33 -1.1
Netherlands -2,312 -7.8 -2,999 -14.6 -485 -5.4
Brazil -7,447 -24.1 -5,980 -23.0 -21 -0.3
Belgium 645 3.2 1,261 6.9 -296 -5.7
Indonesia 68 0.3 -29 -0.2 -27 -0.4
Russia -5,359 -24.1 -4,912 -23.9 19 1.1
Spain -1,482 -8.8 -1,048 -7.0 -627 -5.7
Israel -4,260 -21.8 -4,041 -23.4 -10 -0.3
Australia 3,583 33.0 1,259 14.8 -256 -5.3
All other countries -28,691 -10.1 -24,098 -9.7 -1,944 -3.3
Africa -6,480 -21.4 -6,628 -24.6 -172 -2.4
APEC -93,877 -5.6 -84,687 -5.9 -351 -0.2
ASEAN 24,984 12.1 22,737 11.8 2,415 8.8
Asia - South -7,454 -10.5 -6,272 -9.9 -632 -2.4
Asia - Near East -16,117 -31.0 -14,910 -32.2 -217 -3.5
CAFTA -2,141 -8.3 -1,856 -8.0 92 1.8
Cent. Am. Common Market -1,776 -8.7 -1,505 -8.2 42 1.2
Euro Area -37,338 -9.2 -31,736 -8.9 -2,920 -4.8
Europe -27,249 -4.5 -21,364 -4.1 -3,216 -4.0
European Union -99,735 -19.4 -82,211 -18.3 -10,403 -14.2
LAFTA -48,039 -11.1 -44,826 -11.5 481 1.7
NATO Allies -102,210 -13.5 -80,421 -13.8 -2,974 -3.6
North America -81,873 -12.1 -68,186 -12.9 743 2.4
OECD - Europe -129,377 -8.5 -110,827 -8.7 -2,796 -2.5
OPEC -26,611 -58.3 -24,282 -58.3 -1,519 -39.2
Pacific Rim Countries -22,892 -2.7 -26,209 -3.3 -1,348 -0.9
South/Central America -17,917 -16.5 -15,639 -16.4 -308 -1.6
20 Latin Amer. Republics -50,133 -10.9 -46,929 -11.3 465 1.5
(1) Known value is defined as the portion of U.S. total general imports that could be matched to specific companies.
Note: This table is compiled using data from import trade information and the Business Register. For information on nonsampling
errors and other data limitations, see the explanatory notes.
Total Value Known Value (1) Identified Importers
Number of
34
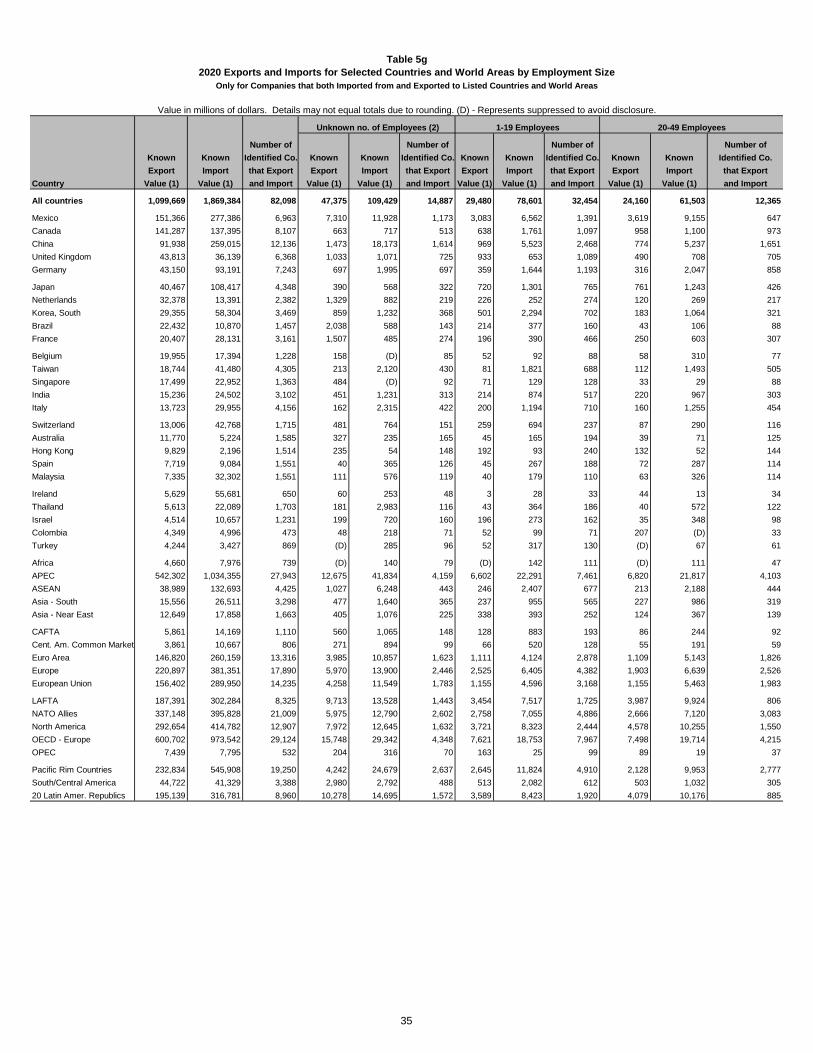
Value in millions of dollars. Details may not equal totals due to rounding. (D) - Represents suppressed to avoid disclosure.
Number of Number of Number of Number of
Known Known Identified Co. Known Known Identified Co. Known Known Identified Co. Known Known Identified Co.
Export Import that Export Export Import that Export Export Import that Export Export Import that Export
Country Value (1) Value (1) and Import Value (1) Value (1) and Import Value (1) Value (1) and Import Value (1) Value (1) and Import
All countries 1,099,669 1,869,384 82,098 47,375 109,429 14,887 29,480 78,601 32,454 24,160 61,503 12,365
Mexico 151,366 277,386 6,963 7,310 11,928 1,173 3,083 6,562 1,391 3,619 9,155 647
Canada 141,287 137,395 8,107 663 717 513 638 1,761 1,097 958 1,100 973
China 91,938 259,015 12,136 1,473 18,173 1,614 969 5,523 2,468 774 5,237 1,651
United Kingdom 43,813 36,139 6,368 1,033 1,071 725 933 653 1,089 490 708 705
Germany 43,150 93,191 7,243 697 1,995 697 359 1,644 1,193 316 2,047 858
Japan 40,467 108,417 4,348 390 568 322 720 1,301 765 761 1,243 426
Netherlands 32,378 13,391 2,382 1,329 882 219 226 252 274 120 269 217
Korea, South 29,355 58,304 3,469 859 1,232 368 501 2,294 702 183 1,064 321
Brazil 22,432 10,870 1,457 2,038 588 143 214 377 160 43 106 88
France 20,407 28,131 3,161 1,507 485 274 196 390 466 250 603 307
Belgium 19,955 17,394 1,228 158 (D) 85 52 92 88 58 310 77
Taiwan 18,744 41,480 4,305 213 2,120 430 81 1,821 688 112 1,493 505
Singapore 17,499 22,952 1,363 484 (D) 92 71 129 128 33 29 88
India 15,236 24,502 3,102 451 1,231 313 214 874 517 220 967 303
Italy 13,723 29,955 4,156 162 2,315 422 200 1,194 710 160 1,255 454
Switzerland 13,006 42,768 1,715 481 764 151 259 694 237 87 290 116
Australia 11,770 5,224 1,585 327 235 165 45 165 194 39 71 125
Hong Kong 9,829 2,196 1,514 235 54 148 192 93 240 132 52 144
Spain 7,719 9,084 1,551 40 365 126 45 267 188 72 287 114
Malaysia 7,335 32,302 1,551 111 576 119 40 179 110 63 326 114
Ireland 5,629 55,681 650 60 253 48 3 28 33 44 13 34
Thailand 5,613 22,089 1,703 181 2,983 116 43 364 186 40 572 122
Israel 4,514 10,657 1,231 199 720 160 196 273 162 35 348 98
Colombia 4,349 4,996 473 48 218 71 52 99 71 207 (D) 33
Turkey 4,244 3,427 869 (D) 285 96 52 317 130 (D) 67 61
Africa 4,660 7,976 739 (D) 140 79 (D) 142 111 (D) 111 47
APEC 542,302 1,034,355 27,943 12,675 41,834 4,159 6,602 22,291 7,461 6,820 21,817 4,103
ASEAN 38,989 132,693 4,425 1,027 6,248 443 246 2,407 677 213 2,188 444
Asia - South 15,556 26,511 3,298 477 1,640 365 237 955 565 227 986 319
Asia - Near East 12,649 17,858 1,663 405 1,076 225 338 393 252 124 367 139
CAFTA 5,861 14,169 1,110 560 1,065 148 128 883 193 86 244 92
Cent. Am. Common Market 3,861 10,667 806 271 894 99 66 520 128 55 191 59
Euro Area 146,820 260,159 13,316 3,985 10,857 1,623 1,111 4,124 2,878 1,109 5,143 1,826
Europe 220,897 381,351 17,890 5,970 13,900 2,446 2,525 6,405 4,382 1,903 6,639 2,526
European Union 156,402 289,950 14,235 4,258 11,549 1,783 1,155 4,596 3,168 1,155 5,463 1,983
LAFTA 187,391 302,284 8,325 9,713 13,528 1,443 3,454 7,517 1,725 3,987 9,924 806
NATO Allies 337,148 395,828 21,009 5,975 12,790 2,602 2,758 7,055 4,886 2,666 7,120 3,083
North America 292,654 414,782 12,907 7,972 12,645 1,632 3,721 8,323 2,444 4,578 10,255 1,550
OECD - Europe 600,702 973,542 29,124 15,748 29,342 4,348 7,621 18,753 7,967 7,498 19,714 4,215
OPEC 7,439 7,795 532 204 316 70 163 25 99 89 19 37
Pacific Rim Countries 232,834 545,908 19,250 4,242 24,679 2,637 2,645 11,824 4,910 2,128 9,953 2,777
South/Central America 44,722 41,329 3,388 2,980 2,792 488 513 2,082 612 503 1,032 305
20 Latin Amer. Republics 195,139 316,781 8,960 10,278 14,695 1,572 3,589 8,423 1,920 4,079 10,176 885
Table 5g
2020 Exports and Imports for Selected Countries and World Areas by Employment Size
Only for Companies that both Imported from and Exported to Listed Countries and World Areas
Unknown no. of Employees (2) 1-19 Employees 20-49 Employees
35
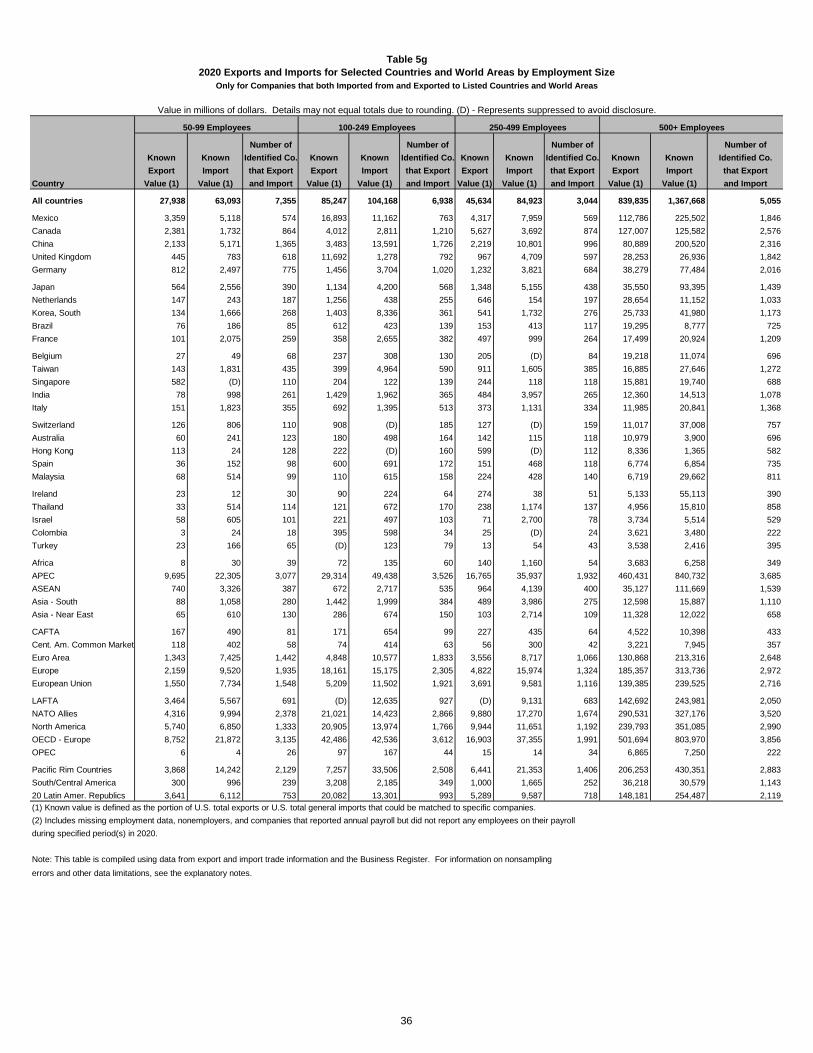
Value in millions of dollars. Details may not equal totals due to rounding. (D) - Represents suppressed to avoid disclosure.
Table 5g
2020 Exports and Imports for Selected Countries and World Areas by Employment Size
Only for Companies that both Imported from and Exported to Listed Countries and World Areas
Number of Number of Number of Number of
Known Known Identified Co. Known Known Identified Co. Known Known Identified Co. Known Known Identified Co.
Export Import that Export Export Import that Export Export Import that Export Export Import that Export
Country Value (1) Value (1) and Import Value (1) Value (1) and Import Value (1) Value (1) and Import Value (1) Value (1) and Import
All countries 27,938 63,093 7,355 85,247 104,168 6,938 45,634 84,923 3,044 839,835 1,367,668 5,055
Mexico 3,359 5,118 574 16,893 11,162 763 4,317 7,959 569 112,786 225,502 1,846
Canada 2,381 1,732 864 4,012 2,811 1,210 5,627 3,692 874 127,007 125,582 2,576
China 2,133 5,171 1,365 3,483 13,591 1,726 2,219 10,801 996 80,889 200,520 2,316
United Kingdom 445 783 618 11,692 1,278 792 967 4,709 597 28,253 26,936 1,842
Germany 812 2,497 775 1,456 3,704 1,020 1,232 3,821 684 38,279 77,484 2,016
Japan 564 2,556 390 1,134 4,200 568 1,348 5,155 438 35,550 93,395 1,439
Netherlands 147 243 187 1,256 438 255 646 154 197 28,654 11,152 1,033
Korea, South 134 1,666 268 1,403 8,336 361 541 1,732 276 25,733 41,980 1,173
Brazil 76 186 85 612 423 139 153 413 117 19,295 8,777 725
France 101 2,075 259 358 2,655 382 497 999 264 17,499 20,924 1,209
Belgium 27 49 68 237 308 130 205 (D) 84 19,218 11,074 696
Taiwan 143 1,831 435 399 4,964 590 911 1,605 385 16,885 27,646 1,272
Singapore 582 (D) 110 204 122 139 244 118 118 15,881 19,740 688
India 78 998 261 1,429 1,962 365 484 3,957 265 12,360 14,513 1,078
Italy 151 1,823 355 692 1,395 513 373 1,131 334 11,985 20,841 1,368
Switzerland 126 806 110 908 (D) 185 127 (D) 159 11,017 37,008 757
Australia 60 241 123 180 498 164 142 115 118 10,979 3,900 696
Hong Kong 113 24 128 222 (D) 160 599 (D) 112 8,336 1,365 582
Spain 36 152 98 600 691 172 151 468 118 6,774 6,854 735
Malaysia 68 514 99 110 615 158 224 428 140 6,719 29,662 811
Ireland 23 12 30 90 224 64 274 38 51 5,133 55,113 390
Thailand 33 514 114 121 672 170 238 1,174 137 4,956 15,810 858
Israel 58 605 101 221 497 103 71 2,700 78 3,734 5,514 529
Colombia 3 24 18 395 598 34 25 (D) 24 3,621 3,480 222
Turkey 23 166 65 (D) 123 79 13 54 43 3,538 2,416 395
Africa 8 30 39 72 135 60 140 1,160 54 3,683 6,258 349
APEC 9,695 22,305 3,077 29,314 49,438 3,526 16,765 35,937 1,932 460,431 840,732 3,685
ASEAN 740 3,326 387 672 2,717 535 964 4,139 400 35,127 111,669 1,539
Asia - South 88 1,058 280 1,442 1,999 384 489 3,986 275 12,598 15,887 1,110
Asia - Near East 65 610 130 286 674 150 103 2,714 109 11,328 12,022 658
CAFTA 167 490 81 171 654 99 227 435 64 4,522 10,398 433
Cent. Am. Common Market 118 402 58 74 414 63 56 300 42 3,221 7,945 357
Euro Area 1,343 7,425 1,442 4,848 10,577 1,833 3,556 8,717 1,066 130,868 213,316 2,648
Europe 2,159 9,520 1,935 18,161 15,175 2,305 4,822 15,974 1,324 185,357 313,736 2,972
European Union 1,550 7,734 1,548 5,209 11,502 1,921 3,691 9,581 1,116 139,385 239,525 2,716
LAFTA 3,464 5,567 691 (D) 12,635 927 (D) 9,131 683 142,692 243,981 2,050
NATO Allies 4,316 9,994 2,378 21,021 14,423 2,866 9,880 17,270 1,674 290,531 327,176 3,520
North America 5,740 6,850 1,333 20,905 13,974 1,766 9,944 11,651 1,192 239,793 351,085 2,990
OECD - Europe 8,752 21,872 3,135 42,486 42,536 3,612 16,903 37,355 1,991 501,694 803,970 3,856
OPEC 6 4 26 97 167 44 15 14 34 6,865 7,250 222
Pacific Rim Countries 3,868 14,242 2,129 7,257 33,506 2,508 6,441 21,353 1,406 206,253 430,351 2,883
South/Central America 300 996 239 3,208 2,185 349 1,000 1,665 252 36,218 30,579 1,143
20 Latin Amer. Republics 3,641 6,112 753 20,082 13,301 993 5,289 9,587 718 148,181 254,487 2,119
(1) Known value is defined as the portion of U.S. total exports or U.S. total general imports that could be matched to specific companies.
(2) Includes missing employment data, nonemployers, and companies that reported annual payroll but did not report any employees on their payroll
during specified period(s) in 2020.
Note: This table is compiled using data from export and import trade information and the Business Register. For information on nonsampling
errors and other data limitations, see the explanatory notes.
50-99 Employees 100-249 Employees 250-499 Employees 500+ Employees
36
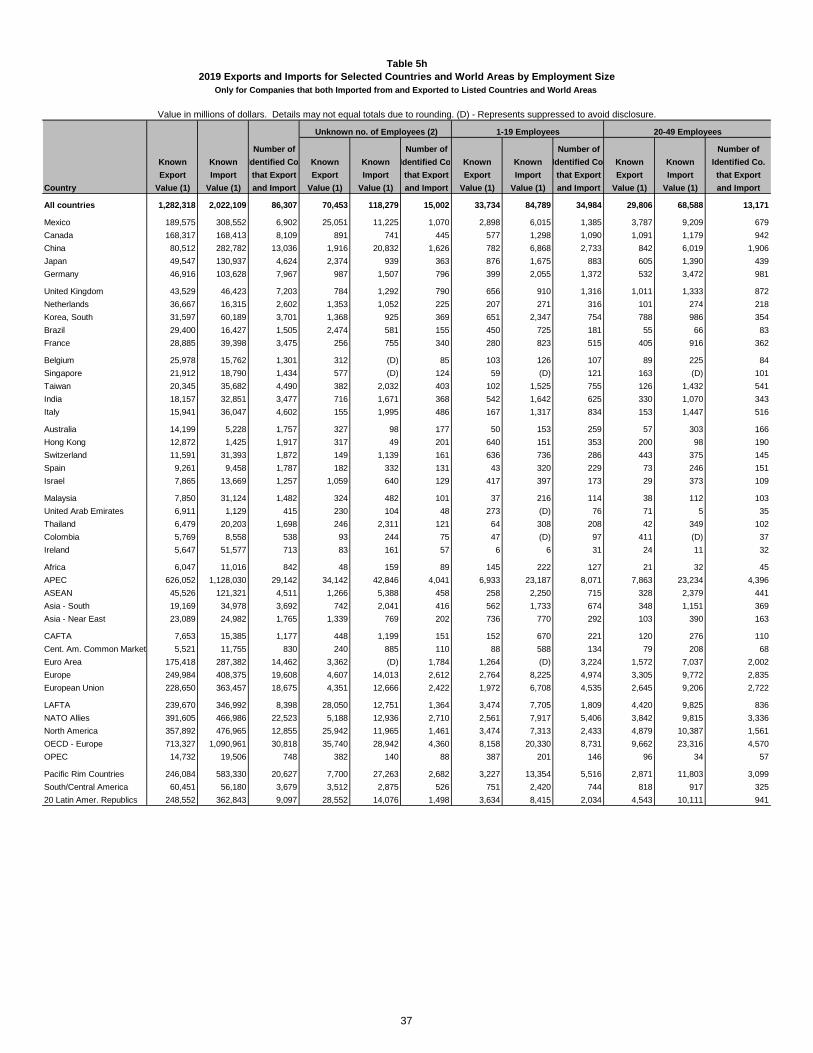
Value in millions of dollars. Details may not equal totals due to rounding. (D) - Represents suppressed to avoid disclosure.
Number of Number of Number of Number of
Known Known Identified Co. Known Known Identified Co. Known Known Identified Co. Known Known Identified Co.
Export Import that Export Export Import that Export Export Import that Export Export Import that Export
Country Value (1) Value (1) and Import Value (1) Value (1) and Import Value (1) Value (1) and Import Value (1) Value (1) and Import
All countries 1,282,318 2,022,109 86,307 70,453 118,279 15,002 33,734 84,789 34,984 29,806 68,588 13,171
Mexico 189,575 308,552 6,902 25,051 11,225 1,070 2,898 6,015 1,385 3,787 9,209 679
Canada 168,317 168,413 8,109 891 741 445 577 1,298 1,090 1,091 1,179 942
China 80,512 282,782 13,036 1,916 20,832 1,626 782 6,868 2,733 842 6,019 1,906
Japan 49,547 130,937 4,624 2,374 939 363 876 1,675 883 605 1,390 439
Germany 46,916 103,628 7,967 987 1,507 796 399 2,055 1,372 532 3,472 981
United Kingdom 43,529 46,423 7,203 784 1,292 790 656 910 1,316 1,011 1,333 872
Netherlands 36,667 16,315 2,602 1,353 1,052 225 207 271 316 101 274 218
Korea, South 31,597 60,189 3,701 1,368 925 369 651 2,347 754 788 986 354
Brazil 29,400 16,427 1,505 2,474 581 155 450 725 181 55 66 83
France 28,885 39,398 3,475 256 755 340 280 823 515 405 916 362
Belgium 25,978 15,762 1,301 312 (D) 85 103 126 107 89 225 84
Singapore 21,912 18,790 1,434 577 (D) 124 59 (D) 121 163 (D) 101
Taiwan 20,345 35,682 4,490 382 2,032 403 102 1,525 755 126 1,432 541
India 18,157 32,851 3,477 716 1,671 368 542 1,642 625 330 1,070 343
Italy 15,941 36,047 4,602 155 1,995 486 167 1,317 834 153 1,447 516
Australia 14,199 5,228 1,757 327 98 177 50 153 259 57 303 166
Hong Kong 12,872 1,425 1,917 317 49 201 640 151 353 200 98 190
Switzerland 11,591 31,393 1,872 149 1,139 161 636 736 286 443 375 145
Spain 9,261 9,458 1,787 182 332 131 43 320 229 73 246 151
Israel 7,865 13,669 1,257 1,059 640 129 417 397 173 29 373 109
Malaysia 7,850 31,124 1,482 324 482 101 37 216 114 38 112 103
United Arab Emirates 6,911 1,129 415 230 104 48 273 (D) 76 71 5 35
Thailand 6,479 20,203 1,698 246 2,311 121 64 308 208 42 349 102
Colombia 5,769 8,558 538 93 244 75 47 (D) 97 411 (D) 37
Ireland 5,647 51,577 713 83 161 57 6 6 31 24 11 32
Africa 6,047 11,016 842 48 159 89 145 222 127 21 32 45
APEC 626,052 1,128,030 29,142 34,142 42,846 4,041 6,933 23,187 8,071 7,863 23,234 4,396
ASEAN 45,526 121,321 4,511 1,266 5,388 458 258 2,250 715 328 2,379 441
Asia - South 19,169 34,978 3,692 742 2,041 416 562 1,733 674 348 1,151 369
Asia - Near East 23,089 24,982 1,765 1,339 769 202 736 770 292 103 390 163
CAFTA 7,653 15,385 1,177 448 1,199 151 152 670 221 120 276 110
Cent. Am. Common Market 5,521 11,755 830 240 885 110 88 588 134 79 208 68
Euro Area 175,418 287,382 14,462 3,362 (D) 1,784 1,264 (D) 3,224 1,572 7,037 2,002
Europe 249,984 408,375 19,608 4,607 14,013 2,612 2,764 8,225 4,974 3,305 9,772 2,835
European Union 228,650 363,457 18,675 4,351 12,666 2,422 1,972 6,708 4,535 2,645 9,206 2,722
LAFTA 239,670 346,992 8,398 28,050 12,751 1,364 3,474 7,705 1,809 4,420 9,825 836
NATO Allies 391,605 466,986 22,523 5,188 12,936 2,710 2,561 7,917 5,406 3,842 9,815 3,336
North America 357,892 476,965 12,855 25,942 11,965 1,461 3,474 7,313 2,433 4,879 10,387 1,561
OECD - Europe 713,327 1,090,961 30,818 35,740 28,942 4,360 8,158 20,330 8,731 9,662 23,316 4,570
OPEC 14,732 19,506 748 382 140 88 387 201 146 96 34 57
Pacific Rim Countries 246,084 583,330 20,627 7,700 27,263 2,682 3,227 13,354 5,516 2,871 11,803 3,099
South/Central America 60,451 56,180 3,679 3,512 2,875 526 751 2,420 744 818 917 325
20 Latin Amer. Republics 248,552 362,843 9,097 28,552 14,076 1,498 3,634 8,415 2,034 4,543 10,111 941
Table 5h
2019 Exports and Imports for Selected Countries and World Areas by Employment Size
Only for Companies that both Imported from and Exported to Listed Countries and World Areas
Unknown no. of Employees (2) 1-19 Employees 20-49 Employees
37
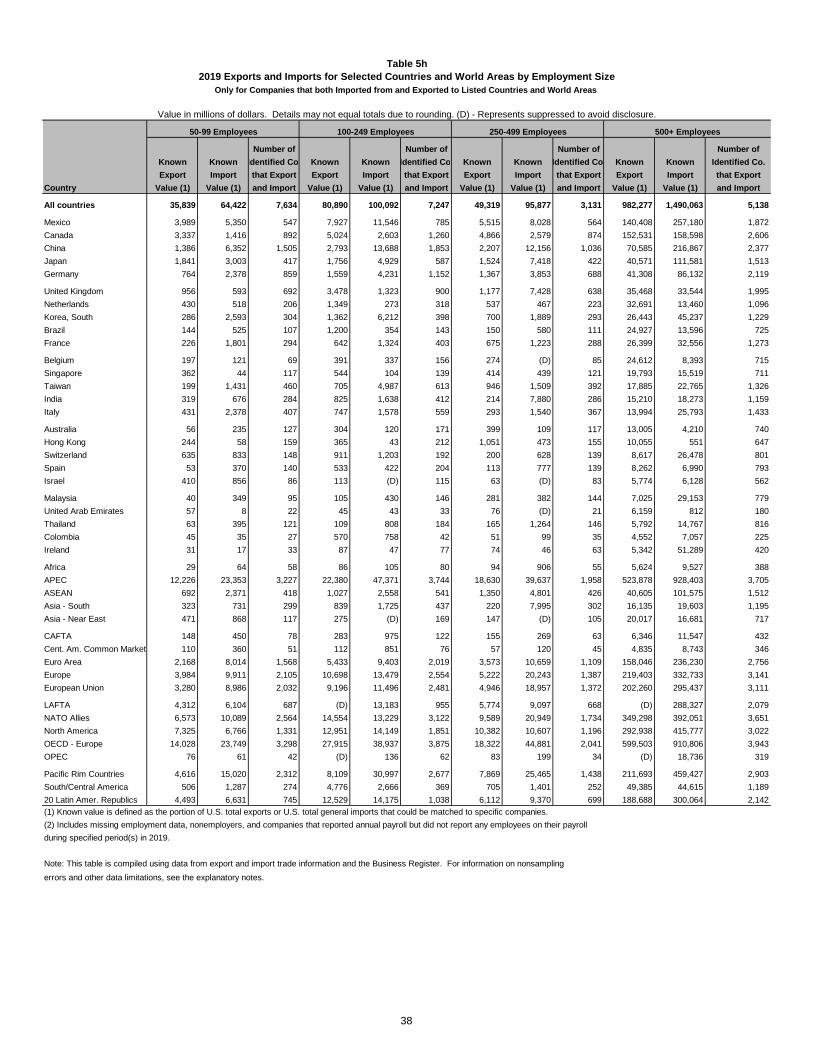
Value in millions of dollars. Details may not equal totals due to rounding. (D) - Represents suppressed to avoid disclosure.
Table 5h
2019 Exports and Imports for Selected Countries and World Areas by Employment Size
Only for Companies that both Imported from and Exported to Listed Countries and World Areas
Number of Number of Number of Number of
Known Known Identified Co. Known Known Identified Co. Known Known Identified Co. Known Known Identified Co.
Export Import that Export Export Import that Export Export Import that Export Export Import that Export
Country Value (1) Value (1) and Import Value (1) Value (1) and Import Value (1) Value (1) and Import Value (1) Value (1) and Import
All countries 35,839 64,422 7,634 80,890 100,092 7,247 49,319 95,877 3,131 982,277 1,490,063 5,138
Mexico 3,989 5,350 547 7,927 11,546 785 5,515 8,028 564 140,408 257,180 1,872
Canada 3,337 1,416 892 5,024 2,603 1,260 4,866 2,579 874 152,531 158,598 2,606
China 1,386 6,352 1,505 2,793 13,688 1,853 2,207 12,156 1,036 70,585 216,867 2,377
Japan 1,841 3,003 417 1,756 4,929 587 1,524 7,418 422 40,571 111,581 1,513
Germany 764 2,378 859 1,559 4,231 1,152 1,367 3,853 688 41,308 86,132 2,119
United Kingdom 956 593 692 3,478 1,323 900 1,177 7,428 638 35,468 33,544 1,995
Netherlands 430 518 206 1,349 273 318 537 467 223 32,691 13,460 1,096
Korea, South 286 2,593 304 1,362 6,212 398 700 1,889 293 26,443 45,237 1,229
Brazil 144 525 107 1,200 354 143 150 580 111 24,927 13,596 725
France 226 1,801 294 642 1,324 403 675 1,223 288 26,399 32,556 1,273
Belgium 197 121 69 391 337 156 274 (D) 85 24,612 8,393 715
Singapore 362 44 117 544 104 139 414 439 121 19,793 15,519 711
Taiwan 199 1,431 460 705 4,987 613 946 1,509 392 17,885 22,765 1,326
India 319 676 284 825 1,638 412 214 7,880 286 15,210 18,273 1,159
Italy 431 2,378 407 747 1,578 559 293 1,540 367 13,994 25,793 1,433
Australia 56 235 127 304 120 171 399 109 117 13,005 4,210 740
Hong Kong 244 58 159 365 43 212 1,051 473 155 10,055 551 647
Switzerland 635 833 148 911 1,203 192 200 628 139 8,617 26,478 801
Spain 53 370 140 533 422 204 113 777 139 8,262 6,990 793
Israel 410 856 86 113 (D) 115 63 (D) 83 5,774 6,128 562
Malaysia 40 349 95 105 430 146 281 382 144 7,025 29,153 779
United Arab Emirates 57 8 22 45 43 33 76 (D) 21 6,159 812 180
Thailand 63 395 121 109 808 184 165 1,264 146 5,792 14,767 816
Colombia 45 35 27 570 758 42 51 99 35 4,552 7,057 225
Ireland 31 17 33 87 47 77 74 46 63 5,342 51,289 420
Africa 29 64 58 86 105 80 94 906 55 5,624 9,527 388
APEC 12,226 23,353 3,227 22,380 47,371 3,744 18,630 39,637 1,958 523,878 928,403 3,705
ASEAN 692 2,371 418 1,027 2,558 541 1,350 4,801 426 40,605 101,575 1,512
Asia - South 323 731 299 839 1,725 437 220 7,995 302 16,135 19,603 1,195
Asia - Near East 471 868 117 275 (D) 169 147 (D) 105 20,017 16,681 717
CAFTA 148 450 78 283 975 122 155 269 63 6,346 11,547 432
Cent. Am. Common Market 110 360 51 112 851 76 57 120 45 4,835 8,743 346
Euro Area 2,168 8,014 1,568 5,433 9,403 2,019 3,573 10,659 1,109 158,046 236,230 2,756
Europe 3,984 9,911 2,105 10,698 13,479 2,554 5,222 20,243 1,387 219,403 332,733 3,141
European Union 3,280 8,986 2,032 9,196 11,496 2,481 4,946 18,957 1,372 202,260 295,437 3,111
LAFTA 4,312 6,104 687 (D) 13,183 955 5,774 9,097 668 (D) 288,327 2,079
NATO Allies 6,573 10,089 2,564 14,554 13,229 3,122 9,589 20,949 1,734 349,298 392,051 3,651
North America 7,325 6,766 1,331 12,951 14,149 1,851 10,382 10,607 1,196 292,938 415,777 3,022
OECD - Europe 14,028 23,749 3,298 27,915 38,937 3,875 18,322 44,881 2,041 599,503 910,806 3,943
OPEC 76 61 42 (D) 136 62 83 199 34 (D) 18,736 319
Pacific Rim Countries 4,616 15,020 2,312 8,109 30,997 2,677 7,869 25,465 1,438 211,693 459,427 2,903
South/Central America 506 1,287 274 4,776 2,666 369 705 1,401 252 49,385 44,615 1,189
20 Latin Amer. Republics 4,493 6,631 745 12,529 14,175 1,038 6,112 9,370 699 188,688 300,064 2,142
(1) Known value is defined as the portion of U.S. total exports or U.S. total general imports that could be matched to specific companies.
(2) Includes missing employment data, nonemployers, and companies that reported annual payroll but did not report any employees on their payroll
during specified period(s) in 2019.
Note: This table is compiled using data from export and import trade information and the Business Register. For information on nonsampling
errors and other data limitations, see the explanatory notes.
50-99 Employees 100-249 Employees 250-499 Employees 500+ Employees
38
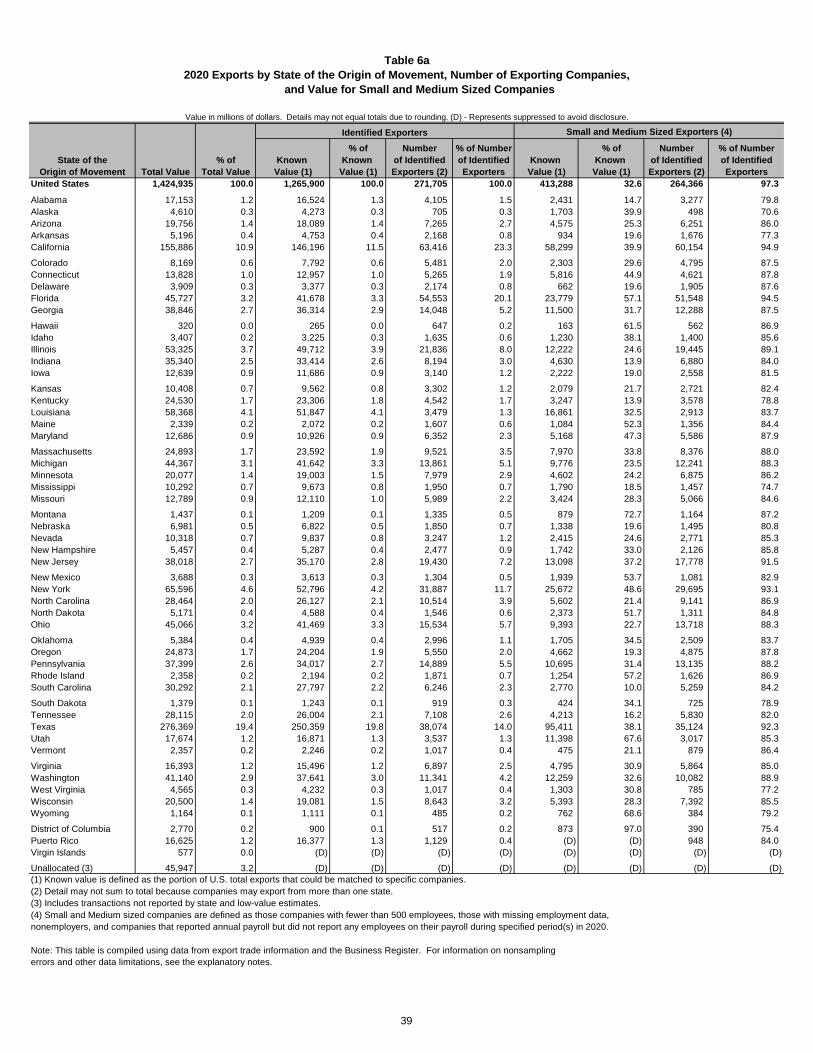
Table 6a
2020 Exports by State of the Origin of Movement, Number of Exporting Companies,
and Value for Small and Medium Sized Companies
Value in millions of dollars. Details may not equal totals due to rounding. (D) - Represents suppressed to avoid disclosure.
Small and Medium Sized Exporters (4)
% of Number % of Number % of Number % of Number
State of the % of Known Known of Identified of Identified Known Known of Identified of Identified
Origin of Movement Total Value Total Value Value (1) Value (1) Exporters (2) Exporters Value (1) Value (1) Exporters (2) Exporters
United States 1,424,935 100.0 1,265,900 100.0 271,705 100.0 413,288 32.6 264,366 97.3
Alabama 17,153 1.2 16,524 1.3 4,105 1.5 2,431 14.7 3,277 79.8
Alaska 4,610 0.3 4,273 0.3 705 0.3 1,703 39.9 498 70.6
Arizona 19,756 1.4 18,089 1.4 7,265 2.7 4,575 25.3 6,251 86.0
Arkansas 5,196 0.4 4,753 0.4 2,168 0.8 934 19.6 1,676 77.3
California 155,886 10.9 146,196 11.5 63,416 23.3 58,299 39.9 60,154 94.9
Colorado 8,169 0.6 7,792 0.6 5,481 2.0 2,303 29.6 4,795 87.5
Connecticut 13,828 1.0 12,957 1.0 5,265 1.9 5,816 44.9 4,621 87.8
Delaware 3,909 0.3 3,377 0.3 2,174 0.8 662 19.6 1,905 87.6
Florida 45,727 3.2 41,678 3.3 54,553 20.1 23,779 57.1 51,548 94.5
Georgia 38,846 2.7 36,314 2.9 14,048 5.2 11,500 31.7 12,288 87.5
Hawaii 320 0.0 265 0.0 647 0.2 163 61.5 562 86.9
Idaho 3,407 0.2 3,225 0.3 1,635 0.6 1,230 38.1 1,400 85.6
Illinois 53,325 3.7 49,712 3.9 21,836 8.0 12,222 24.6 19,445 89.1
Indiana 35,340 2.5 33,414 2.6 8,194 3.0 4,630 13.9 6,880 84.0
Iowa 12,639 0.9 11,686 0.9 3,140 1.2 2,222 19.0 2,558 81.5
Kansas 10,408 0.7 9,562 0.8 3,302 1.2 2,079 21.7 2,721 82.4
Kentucky 24,530 1.7 23,306 1.8 4,542 1.7 3,247 13.9 3,578 78.8
Louisiana 58,368 4.1 51,847 4.1 3,479 1.3 16,861 32.5 2,913 83.7
Maine 2,339 0.2 2,072 0.2 1,607 0.6 1,084 52.3 1,356 84.4
Maryland 12,686 0.9 10,926 0.9 6,352 2.3 5,168 47.3 5,586 87.9
Massachusetts 24,893 1.7 23,592 1.9 9,521 3.5 7,970 33.8 8,376 88.0
Michigan 44,367 3.1 41,642 3.3 13,861 5.1 9,776 23.5 12,241 88.3
Minnesota 20,077 1.4 19,003 1.5 7,979 2.9 4,602 24.2 6,875 86.2
Mississippi 10,292 0.7 9,673 0.8 1,950 0.7 1,790 18.5 1,457 74.7
Missouri 12,789 0.9 12,110 1.0 5,989 2.2 3,424 28.3 5,066 84.6
Montana 1,437 0.1 1,209 0.1 1,335 0.5 879 72.7 1,164 87.2
Nebraska 6,981 0.5 6,822 0.5 1,850 0.7 1,338 19.6 1,495 80.8
Nevada 10,318 0.7 9,837 0.8 3,247 1.2 2,415 24.6 2,771 85.3
New Hampshire 5,457 0.4 5,287 0.4 2,477 0.9 1,742 33.0 2,126 85.8
New Jersey 38,018 2.7 35,170 2.8 19,430 7.2 13,098 37.2 17,778 91.5
New Mexico 3,688 0.3 3,613 0.3 1,304 0.5 1,939 53.7 1,081 82.9
New York 65,596 4.6 52,796 4.2 31,887 11.7 25,672 48.6 29,695 93.1
North Carolina 28,464 2.0 26,127 2.1 10,514 3.9 5,602 21.4 9,141 86.9
North Dakota 5,171 0.4 4,588 0.4 1,546 0.6 2,373 51.7 1,311 84.8
Ohio 45,066 3.2 41,469 3.3 15,534 5.7 9,393 22.7 13,718 88.3
Oklahoma 5,384 0.4 4,939 0.4 2,996 1.1 1,705 34.5 2,509 83.7
Oregon 24,873 1.7 24,204 1.9 5,550 2.0 4,662 19.3 4,875 87.8
Pennsylvania 37,399 2.6 34,017 2.7 14,889 5.5 10,695 31.4 13,135 88.2
Rhode Island 2,358 0.2 2,194 0.2 1,871 0.7 1,254 57.2 1,626 86.9
South Carolina 30,292 2.1 27,797 2.2 6,246 2.3 2,770 10.0 5,259 84.2
South Dakota 1,379 0.1 1,243 0.1 919 0.3 424 34.1 725 78.9
Tennessee 28,115 2.0 26,004 2.1 7,108 2.6 4,213 16.2 5,830 82.0
Texas 276,369 19.4 250,359 19.8 38,074 14.0 95,411 38.1 35,124 92.3
Utah 17,674 1.2 16,871 1.3 3,537 1.3 11,398 67.6 3,017 85.3
Vermont 2,357 0.2 2,246 0.2 1,017 0.4 475 21.1 879 86.4
Virginia 16,393 1.2 15,496 1.2 6,897 2.5 4,795 30.9 5,864 85.0
Washington 41,140 2.9 37,641 3.0 11,341 4.2 12,259 32.6 10,082 88.9
West Virginia 4,565 0.3 4,232 0.3 1,017 0.4 1,303 30.8 785 77.2
Wisconsin 20,500 1.4 19,081 1.5 8,643 3.2 5,393 28.3 7,392 85.5
Wyoming 1,164 0.1 1,111 0.1 485 0.2 762 68.6 384 79.2
District of Columbia 2,770 0.2 900 0.1 517 0.2 873 97.0 390 75.4
Puerto Rico 16,625 1.2 16,377 1.3 1,129 0.4 (D) (D) 948 84.0
Virgin Islands 577 0.0 (D) (D) (D) (D) (D) (D) (D) (D)
Unallocated (3) 45,947 3.2 (D) (D) (D) (D) (D) (D) (D) (D)
(1) Known value is defined as the portion of U.S. total exports that could be matched to specific companies.
(2) Detail may not sum to total because companies may export from more than one state.
(3) Includes transactions not reported by state and low-value estimates.
(4) Small and Medium sized companies are defined as those companies with fewer than 500 employees, those with missing employment data,
nonemployers, and companies that reported annual payroll but did not report any employees on their payroll during specified period(s) in 2020.
Note: This table is compiled using data from export trade information and the Business Register. For information on nonsampling
errors and other data limitations, see the explanatory notes.
Identified Exporters
39

Table 6b
2019 Exports by State of the Origin of Movement, Number of Exporting Companies,
and Value for Small and Medium Sized Companies
Value in millions of dollars. Details may not equal totals due to rounding. (D) - Represents suppressed to avoid disclosure.
Small and Medium Sized Exporters (4)
% of Number % of Number % of Number % of Number
State of the % of Known Known of Identified of Identified Known Known of Identified of Identified
Origin of Movement Total Value Total Value Value (1) Value (1) Exporters (2) Exporters Value (1) Value (1) Exporters (2) Exporters
United States 1,643,161 100.0 1,464,623 100.0 289,372 100.0 463,947 31.7 281,421 97.3
Alabama 20,800 1.3 20,080 1.4 4,229 1.5 2,681 13.4 3,374 79.8
Alaska 4,990 0.3 4,727 0.3 786 0.3 2,559 54.1 586 74.6
Arizona 24,669 1.5 23,295 1.6 7,898 2.7 5,618 24.1 6,857 86.8
Arkansas 6,232 0.4 5,868 0.4 2,277 0.8 1,116 19.0 1,741 76.5
California 174,026 10.6 162,459 11.1 69,287 23.9 66,809 41.1 65,918 95.1
Colorado 8,097 0.5 7,689 0.5 5,963 2.1 2,077 27.0 5,199 87.2
Connecticut 16,243 1.0 15,400 1.1 5,683 2.0 7,138 46.4 4,996 87.9
Delaware 4,407 0.3 4,020 0.3 2,335 0.8 916 22.8 2,044 87.5
Florida 55,995 3.4 51,774 3.5 58,044 20.1 29,376 56.7 54,918 94.6
Georgia 41,252 2.5 38,588 2.6 15,205 5.3 10,669 27.6 13,318 87.6
Hawaii 454 0.0 334 0.0 751 0.3 178 53.3 643 85.6
Idaho 3,434 0.2 3,182 0.2 1,719 0.6 945 29.7 1,455 84.6
Illinois 59,724 3.6 55,208 3.8 23,281 8.0 13,488 24.4 20,745 89.1
Indiana 39,283 2.4 36,955 2.5 8,647 3.0 5,136 13.9 7,265 84.0
Iowa 13,221 0.8 12,262 0.8 3,343 1.2 2,185 17.8 2,729 81.6
Kansas 11,659 0.7 10,509 0.7 3,391 1.2 2,304 21.9 2,781 82.0
Kentucky 32,991 2.0 31,765 2.2 4,743 1.6 3,653 11.5 3,728 78.6
Louisiana 63,700 3.9 56,465 3.9 3,827 1.3 18,106 32.1 3,248 84.9
Maine 2,724 0.2 2,435 0.2 1,863 0.6 1,270 52.1 1,553 83.4
Maryland 13,055 0.8 11,373 0.8 6,540 2.3 3,731 32.8 5,698 87.1
Massachusetts 26,130 1.6 24,898 1.7 10,152 3.5 9,449 37.9 8,940 88.1
Michigan 55,802 3.4 52,492 3.6 14,919 5.2 10,264 19.6 13,199 88.5
Minnesota 22,188 1.4 20,942 1.4 8,559 3.0 5,020 24.0 7,338 85.7
Mississippi 11,859 0.7 11,322 0.8 2,070 0.7 1,757 15.5 1,555 75.1
Missouri 13,406 0.8 12,741 0.9 6,182 2.1 3,467 27.2 5,212 84.3
Montana 1,685 0.1 1,487 0.1 1,445 0.5 1,038 69.8 1,253 86.7
Nebraska 7,453 0.5 7,259 0.5 1,954 0.7 1,336 18.4 1,573 80.5
Nevada 8,976 0.5 7,839 0.5 3,516 1.2 1,887 24.1 3,009 85.6
New Hampshire 5,829 0.4 5,641 0.4 2,571 0.9 1,764 31.3 2,193 85.3
New Jersey 35,675 2.2 32,512 2.2 20,751 7.2 13,893 42.7 19,003 91.6
New Mexico 4,679 0.3 4,626 0.3 1,459 0.5 2,202 47.6 1,214 83.2
New York 75,653 4.6 62,759 4.3 35,903 12.4 35,557 56.7 33,477 93.2
North Carolina 34,336 2.1 30,915 2.1 11,090 3.8 6,204 20.1 9,624 86.8
North Dakota 6,977 0.4 6,307 0.4 1,781 0.6 3,318 52.6 1,513 85.0
Ohio 53,229 3.2 49,309 3.4 16,513 5.7 11,049 22.4 14,556 88.1
Oklahoma 6,143 0.4 5,634 0.4 3,185 1.1 1,792 31.8 2,648 83.1
Oregon 23,599 1.4 22,834 1.6 5,896 2.0 4,920 21.5 5,194 88.1
Pennsylvania 42,722 2.6 39,244 2.7 15,636 5.4 12,613 32.1 13,796 88.2
Rhode Island 2,675 0.2 2,439 0.2 1,994 0.7 1,326 54.4 1,747 87.6
South Carolina 41,462 2.5 37,933 2.6 6,559 2.3 3,012 7.9 5,491 83.7
South Dakota 1,357 0.1 1,234 0.1 894 0.3 432 35.0 679 76.0
Tennessee 31,076 1.9 29,172 2.0 7,415 2.6 4,380 15.0 6,116 82.5
Texas 328,864 20.0 300,593 20.5 40,697 14.1 105,611 35.1 37,605 92.4
Utah 17,339 1.1 16,578 1.1 3,714 1.3 11,142 67.2 3,134 84.4
Vermont 3,021 0.2 2,893 0.2 1,125 0.4 532 18.4 964 85.7
Virginia 17,843 1.1 16,904 1.2 7,246 2.5 4,432 26.2 6,163 85.1
Washington 60,310 3.7 55,293 3.8 12,226 4.2 14,282 25.8 10,904 89.2
West Virginia 5,937 0.4 5,419 0.4 1,068 0.4 1,558 28.8 826 77.3
Wisconsin 21,668 1.3 20,022 1.4 9,018 3.1 5,731 28.6 7,722 85.6
Wyoming 1,367 0.1 1,306 0.1 486 0.2 878 67.2 382 78.6
District of Columbia 3,690 0.2 939 0.1 598 0.2 876 93.4 435 72.7
Puerto Rico 20,371 1.2 20,155 1.4 1,308 0.5 (D) (D) 1,090 83.3
Virgin Islands 624 0.0 (D) (D) 86 0.0 (D) (D) (D) (D)
Unallocated (3) 52,259 3.2 (D) (D) 4 0.0 (D) (D) (D) (D)
(1) Known value is defined as the portion of U.S. total exports that could be matched to specific companies.
(2) Detail may not sum to total because companies may export from more than one state.
(3) Includes transactions not reported by state and low-value estimates.
(4) Small and Medium sized companies are defined as those companies with fewer than 500 employees, those with missing employment data,
nonemployers, and companies that reported annual payroll but did not report any employees on their payroll during specified period(s) in 2019.
Note: This table is compiled using data from export trade information and the Business Register. For information on nonsampling
errors and other data limitations, see the explanatory notes.
Identified Exporters
40

Table 6c
Percent Difference Between 2019 and 2020 Export
Results for Small and Medium Sized Companies
Value in millions of dollars. Details may not equal totals due to rounding.
(D) - Represents suppressed to avoid disclosure.
% Difference 2019-2020
Identified Exporters Small and Medium
Exporters (3)
Total Value Known Number of Known Number of
State of the Value (1) Identified Value (1) Identified
Origin of Movement Exporters Exporters
United States -13.3 -13.6 -6.1 -10.9 -6.1
Alabama -17.5 -17.7 -2.9 -9.3 -2.9
Alaska -7.6 -9.6 -10.3 -33.5 -15
Arizona -19.9 -22.3 -8 -18.6 -8.8
Arkansas -16.6 -19 -4.8 -16.3 -3.7
California -10.4 -10 -8.5 -12.7 -8.7
Colorado 0.9 1.3 -8.1 10.8 -7.8
Connecticut -14.9 -15.9 -7.4 -18.5 -7.5
Delaware -11.3 -16 -6.9 -27.7 -6.8
Florida -18.3 -19.5 -6 -19.1 -6.1
Georgia -5.8 -5.9 -7.6 7.8 -7.7
Hawaii -29.5 -20.7 -13.8 -8.5 -12.6
Idaho -0.8 1.3 -4.9 30.1 -3.8
Illinois -10.7 -10 -6.2 -9.4 -6.3
Indiana -10 -9.6 -5.2 -9.9 -5.3
Iowa -4.4 -4.7 -6.1 1.7 -6.3
Kansas -10.7 -9 -2.6 -9.8 -2.2
Kentucky -25.6 -26.6 -4.2 -11.1 -4
Louisiana -8.4 -8.2 -9.1 -6.9 -10.3
Maine -14.1 -14.9 -13.7 -14.6 -12.7
Maryland -2.8 -3.9 -2.9 38.5 -2
Massachusetts -4.7 -5.2 -6.2 -15.7 -6.3
Michigan -20.5 -20.7 -7.1 -4.8 -7.3
Minnesota -9.5 -9.3 -6.8 -8.3 -6.3
Mississippi -13.2 -14.6 -5.8 1.9 -6.3
Missouri -4.6 -5 -3.1 -1.2 -2.8
Montana -14.7 -18.7 -7.6 -15.3 -7.1
Nebraska -6.3 -6 -5.3 0.2 -5
Nevada 15 25.5 -7.7 28 -7.9
New Hampshire -6.4 -6.3 -3.7 -1.2 -3.1
New Jersey 6.6 8.2 -6.4 -5.7 -6.4
New Mexico -21.2 -21.9 -10.6 -11.9 -11
New York -13.3 -15.9 -11.2 -27.8 -11.3
North Carolina -17.1 -15.5 -5.2 -9.7 -5
North Dakota -25.9 -27.3 -13.2 -28.5 -13.4
Ohio -15.3 -15.9 -5.9 -15 -5.8
Oklahoma -12.3 -12.3 -5.9 -4.9 -5.2
Oregon 5.4 6 -5.9 -5.2 -6.1
Pennsylvania -12.5 -13.3 -4.8 -15.2 -4.8
Rhode Island -11.9 -10 -6.2 -5.4 -6.9
South Carolina -26.9 -26.7 -4.8 -8.1 -4.2
South Dakota 1.6 0.7 2.8 -1.9 6.8
Tennessee -9.5 -10.9 -4.1 -3.8 -4.7
Texas -16 -16.7 -6.4 -9.7 -6.6
Utah 1.9 1.8 -4.8 2.3 -3.7
Vermont -22 -22.4 -9.6 -10.7 -8.8
Virginia -8.1 -8.3 -4.8 8.2 -4.9
Washington -31.8 -31.9 -7.2 -14.2 -7.5
West Virginia -23.1 -21.9 -4.8 -16.4 -5
Wisconsin -5.4 -4.7 -4.2 -5.9 -4.3
Wyoming -14.8 -15 -0.2 -13.2 0.5
District of Columbia -24.9 -4.1 -13.5 -0.4 -10.3
Puerto Rico -18.4 -18.7 -13.7 (D) -13
Virgin Islands -7.6 (D) (D) (D) (D)
Unallocated (2) 0.7 (D) (D) (D) (D)
(1) Known value is defined as the portion of U.S. total exports that could be matched to specific companies.
(2) Includes transactions not reported by state and low-value estimates.
(3) Small and Medium sized companies are defined as those companies with fewer than 500 employees, those with missing employment data,
nonemployers, and companies that reported annual payroll but did not report any employees on their payroll during specified period(s) in 2020 or 2019.
Note: This table is compiled using data from export trade information and the Business Register. For information on nonsampling
errors and other data limitations, see the explanatory notes.
41

Table 6d
2020 Imports by State of Destination, Number of Importing Companies,
Value, and Percent Difference Between 2019 and 2020 Imports
Number of % of Number Number of
% of Known % of Known Identified of Identified Known Identified
State of Destination Total Value Total Value Value (1) Value Importers (2) Importers Total Value Value Importers
United States 2,335,991 100 2,024,454 100 221,580 100 -6.5 -6.6 -1.4
Alabama 25,503 1.1 22,480 1.1 4,032 1.8 -10.3 -11.3 3.0
Alaska 2,371 0.1 2,171 0.1 805 0.4 3.6 7.8 -5.6
Arizona 25,647 1.1 21,018 1.0 5,869 2.6 -3.4 -2.2 -1.1
Arkansas 8,634 0.4 7,814 0.4 2,011 0.9 -10.3 -8.8 -0.6
California 395,879 16.9 359,449 17.8 70,979 32.0 -3.0 -4.3 -0.5
Colorado 12,023 0.5 10,547 0.5 6,036 2.7 -8.3 -6.7 -3.6
Connecticut 17,965 0.8 13,437 0.7 4,145 1.9 -10.5 -9.8 -3.4
Delaware 9,111 0.4 8,389 0.4 1,815 0.8 -4.2 0.8 4.7
Florida 76,803 3.3 65,625 3.2 29,794 13.4 -6.0 -4.4 0.7
Georgia 98,876 4.2 90,760 4.5 14,920 6.7 -3.1 -2.0 3.7
Hawaii 1,912 0.1 1,609 0.1 2,122 1.0 -49.5 -52.0 -13.8
Idaho 5,497 0.2 4,466 0.2 1,693 0.8 7.3 1.0 1.0
Illinois 155,892 6.7 132,090 6.5 21,495 9.7 -4.8 -4.1 1.6
Indiana 63,965 2.7 55,555 2.7 6,656 3.0 -0.9 0.6 -1.0
Iowa 8,963 0.4 7,394 0.4 2,802 1.3 -10.8 -10.8 -1.0
Kansas 10,467 0.4 8,296 0.4 2,801 1.3 -14.0 -13.9 -3.5
Kentucky 54,921 2.4 43,999 2.2 4,262 1.9 -3.4 -3.9 -4.5
Louisiana 20,719 0.9 18,536 0.9 3,899 1.8 -29.5 -30.5 -1.7
Maine 4,746 0.2 3,318 0.2 1,538 0.7 2.4 6.6 -1.2
Maryland 30,643 1.3 27,448 1.4 6,646 3.0 -13.7 -14.8 3.0
Massachusetts 35,029 1.5 28,295 1.4 9,037 4.1 -4.0 -4.5 -2.7
Michigan 115,890 5.0 102,271 5.1 10,296 4.6 -18.6 -19.5 0.2
Minnesota 28,147 1.2 22,027 1.1 6,736 3.0 -5.9 -0.3 -2.1
Mississippi 15,766 0.7 14,861 0.7 2,054 0.9 -7.2 -7.0 1.3
Missouri 18,741 0.8 16,264 0.8 6,053 2.7 -8.7 -8.1 0.0
Montana 3,955 0.2 2,487 0.1 1,164 0.5 -15.0 -24.9 -1.3
Nebraska 3,728 0.2 2,991 0.1 2,012 0.9 -12.6 -14.0 3.3
Nevada 12,889 0.6 11,704 0.6 4,257 1.9 17.6 21.4 -6.0
New Hampshire 6,935 0.3 5,716 0.3 1,927 0.9 -34.1 -38.8 -3.2
New Jersey 114,905 4.9 105,132 5.2 20,961 9.5 -9.0 -7.4 -0.5
New Mexico 4,584 0.2 3,898 0.2 1,380 0.6 3.0 3.4 0.0
New York 153,802 6.6 123,673 6.1 36,242 16.4 15.8 16.7 -1.9
North Carolina 61,115 2.6 52,080 2.6 9,746 4.4 2.7 0.1 -0.7
North Dakota 2,841 0.1 1,758 0.1 1,101 0.5 -17.0 -11.0 -1.2
Ohio 65,470 2.8 56,501 2.8 11,783 5.3 -5.1 -3.7 1.7
Oklahoma 10,816 0.5 8,809 0.4 2,602 1.2 -8.6 -7.7 -0.4
Oregon 17,295 0.7 14,385 0.7 5,817 2.6 -7.3 -9.0 -3.6
Pennsylvania 84,679 3.6 74,787 3.7 11,896 5.4 -5.8 -3.9 -0.6
Rhode Island 8,807 0.4 8,328 0.4 1,507 0.7 -24.0 -24.9 0.5
South Carolina 40,089 1.7 34,868 1.7 6,685 3.0 -5.2 -4.8 -0.3
South Dakota 1,261 0.1 946 0.0 895 0.4 9.8 11.2 -2.9
Tennessee 83,628 3.6 78,389 3.9 7,399 3.3 -4.1 -4.5 0.3
Texas 247,932 10.6 223,952 11.1 29,819 13.5 -15.9 -16.3 1.0
Utah 15,495 0.7 12,952 0.6 4,828 2.2 1.5 1.1 1.1
Vermont 2,631 0.1 1,626 0.1 1,100 0.5 -32.9 -41.1 2.4
Virginia 28,930 1.2 25,318 1.3 7,505 3.4 -3.6 -5.2 2.6
Washington 48,813 2.1 38,327 1.9 11,362 5.1 -7.6 -8.0 -1.2
West Virginia 2,912 0.1 2,450 0.1 906 0.4 -17.1 -15.3 -9.1
Wisconsin 26,776 1.1 22,862 1.1 6,227 2.8 -5.9 -5.1 -1.8
Wyoming 1,090 0.0 722 0.0 784 0.4 -26.1 -11.8 0.9
District of Columbia 540 0.0 422 0.0 894 0.4 -20.5 -22.4 -11.5
Puerto Rico 21,306 0.9 20,420 1.0 3,513 1.6 -12.1 -12.6 2.6
Virgin Islands 876 0.0 775 0.0 142 0.1 -6.6 -12.1 -17.0
Unallocated (3) 17,783 0.8 53 0.0 486 0.2 -7.1 87.9 -10.7
(1) Known value is defined as the portion of U.S. total general imports that could be matched to specific companies.
(2) Detail may not sum to total because companies may import to more than one state.
(3) Includes transactions not reported by state and low-value estimates.
Note: This table is compiled using data from import trade information and the Business Register. For information on nonsampling
errors and other data limitations, see the explanatory notes.
% Difference 2019-2020
Value in millions of dollars. Details may not equal totals due to rounding. (D) - Represents suppressed to avoid disclosure.
42
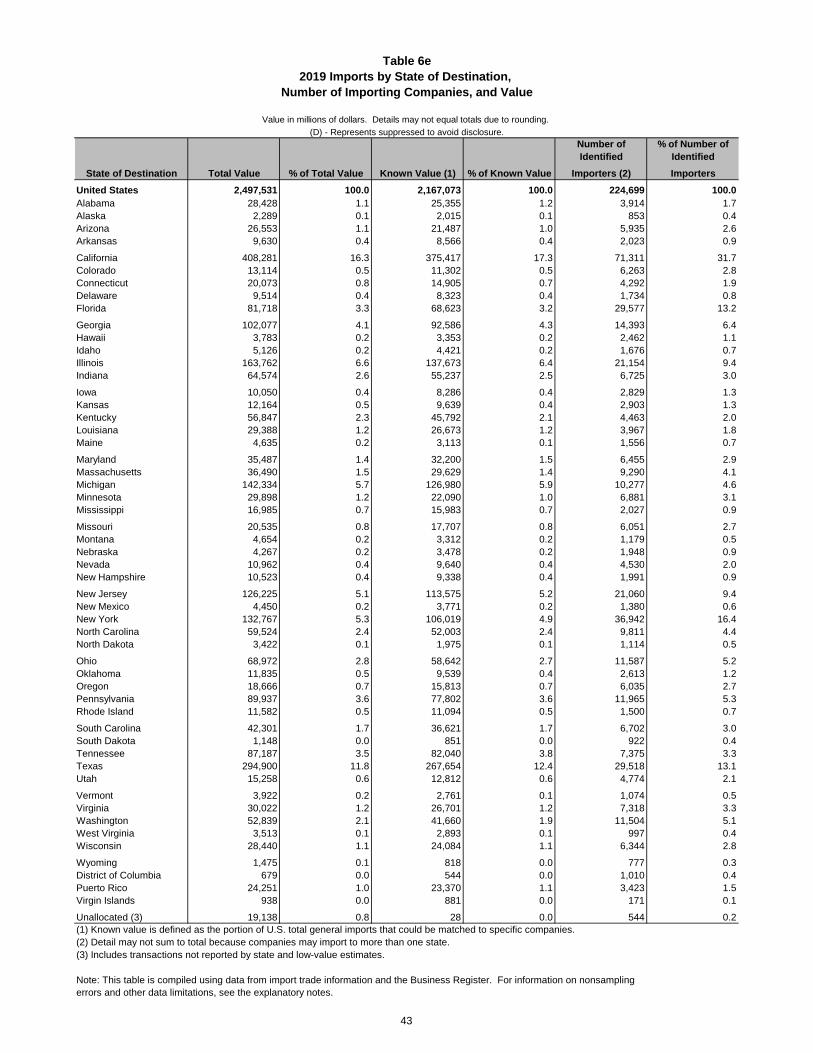
Table 6e
2019 Imports by State of Destination,
Number of Importing Companies, and Value
Value in millions of dollars. Details may not equal totals due to rounding.
(D) - Represents suppressed to avoid disclosure.
Number of % of Number of
Identified Identified
State of Destination Total Value % of Total Value Known Value (1) % of Known Value Importers (2) Importers
United States 2,497,531 100.0 2,167,073 100.0 224,699 100.0
Alabama 28,428 1.1 25,355 1.2 3,914 1.7
Alaska 2,289 0.1 2,015 0.1 853 0.4
Arizona 26,553 1.1 21,487 1.0 5,935 2.6
Arkansas 9,630 0.4 8,566 0.4 2,023 0.9
California 408,281 16.3 375,417 17.3 71,311 31.7
Colorado 13,114 0.5 11,302 0.5 6,263 2.8
Connecticut 20,073 0.8 14,905 0.7 4,292 1.9
Delaware 9,514 0.4 8,323 0.4 1,734 0.8
Florida 81,718 3.3 68,623 3.2 29,577 13.2
Georgia 102,077 4.1 92,586 4.3 14,393 6.4
Hawaii 3,783 0.2 3,353 0.2 2,462 1.1
Idaho 5,126 0.2 4,421 0.2 1,676 0.7
Illinois 163,762 6.6 137,673 6.4 21,154 9.4
Indiana 64,574 2.6 55,237 2.5 6,725 3.0
Iowa 10,050 0.4 8,286 0.4 2,829 1.3
Kansas 12,164 0.5 9,639 0.4 2,903 1.3
Kentucky 56,847 2.3 45,792 2.1 4,463 2.0
Louisiana 29,388 1.2 26,673 1.2 3,967 1.8
Maine 4,635 0.2 3,113 0.1 1,556 0.7
Maryland 35,487 1.4 32,200 1.5 6,455 2.9
Massachusetts 36,490 1.5 29,629 1.4 9,290 4.1
Michigan 142,334 5.7 126,980 5.9 10,277 4.6
Minnesota 29,898 1.2 22,090 1.0 6,881 3.1
Mississippi 16,985 0.7 15,983 0.7 2,027 0.9
Missouri 20,535 0.8 17,707 0.8 6,051 2.7
Montana 4,654 0.2 3,312 0.2 1,179 0.5
Nebraska 4,267 0.2 3,478 0.2 1,948 0.9
Nevada 10,962 0.4 9,640 0.4 4,530 2.0
New Hampshire 10,523 0.4 9,338 0.4 1,991 0.9
New Jersey 126,225 5.1 113,575 5.2 21,060 9.4
New Mexico 4,450 0.2 3,771 0.2 1,380 0.6
New York 132,767 5.3 106,019 4.9 36,942 16.4
North Carolina 59,524 2.4 52,003 2.4 9,811 4.4
North Dakota 3,422 0.1 1,975 0.1 1,114 0.5
Ohio 68,972 2.8 58,642 2.7 11,587 5.2
Oklahoma 11,835 0.5 9,539 0.4 2,613 1.2
Oregon 18,666 0.7 15,813 0.7 6,035 2.7
Pennsylvania 89,937 3.6 77,802 3.6 11,965 5.3
Rhode Island 11,582 0.5 11,094 0.5 1,500 0.7
South Carolina 42,301 1.7 36,621 1.7 6,702 3.0
South Dakota 1,148 0.0 851 0.0 922 0.4
Tennessee 87,187 3.5 82,040 3.8 7,375 3.3
Texas 294,900 11.8 267,654 12.4 29,518 13.1
Utah 15,258 0.6 12,812 0.6 4,774 2.1
Vermont 3,922 0.2 2,761 0.1 1,074 0.5
Virginia 30,022 1.2 26,701 1.2 7,318 3.3
Washington 52,839 2.1 41,660 1.9 11,504 5.1
West Virginia 3,513 0.1 2,893 0.1 997 0.4
Wisconsin 28,440 1.1 24,084 1.1 6,344 2.8
Wyoming 1,475 0.1 818 0.0 777 0.3
District of Columbia 679 0.0 544 0.0 1,010 0.4
Puerto Rico 24,251 1.0 23,370 1.1 3,423 1.5
Virgin Islands 938 0.0 881 0.0 171 0.1
Unallocated (3) 19,138 0.8 28 0.0 544 0.2
(1) Known value is defined as the portion of U.S. total general imports that could be matched to specific companies.
(2) Detail may not sum to total because companies may import to more than one state.
(3) Includes transactions not reported by state and low-value estimates.
Note: This table is compiled using data from import trade information and the Business Register. For information on nonsampling
errors and other data limitations, see the explanatory notes.
43
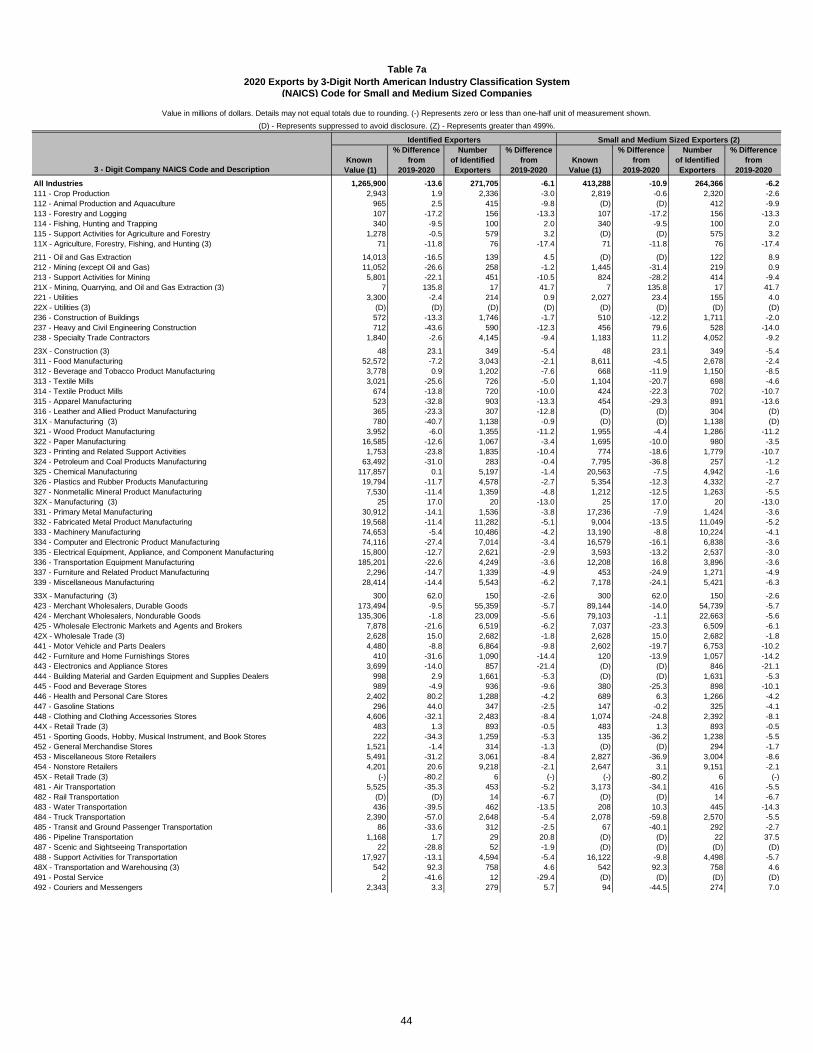
Table 7a
2020 Exports by 3-Digit North American Industry Classification System
(NAICS) Code for Small and Medium Sized Companies
% Difference Number % Difference % Difference Number % Difference
Known from of Identified from Known from of Identified from
3 - Digit Company NAICS Code and Description Value (1) 2019-2020 Exporters 2019-2020 Value (1) 2019-2020 Exporters 2019-2020
All Industries 1,265,900 -13.6 271,705 -6.1 413,288 -10.9 264,366 -6.2
111 - Crop Production 2,943 1.9 2,336 -3.0 2,819 -0.6 2,320 -2.6
112 - Animal Production and Aquaculture 965 2.5 415 -9.8 (D) (D) 412 -9.9
113 - Forestry and Logging 107 -17.2 156 -13.3 107 -17.2 156 -13.3
114 - Fishing, Hunting and Trapping 340 -9.5 100 2.0 340 -9.5 100 2.0
115 - Support Activities for Agriculture and Forestry 1,278 -0.5 579 3.2 (D) (D) 575 3.2
11X - Agriculture, Forestry, Fishing, and Hunting (3) 71 -11.8 76 -17.4 71 -11.8 76 -17.4
211 - Oil and Gas Extraction 14,013 -16.5 139 4.5 (D) (D) 122 8.9
212 - Mining (except Oil and Gas) 11,052 -26.6 258 -1.2 1,445 -31.4 219 0.9
213 - Support Activities for Mining 5,801 -22.1 451 -10.5 824 -28.2 414 -9.4
21X - Mining, Quarrying, and Oil and Gas Extraction (3) 7 135.8 17 41.7 7 135.8 17 41.7
221 - Utilities 3,300 -2.4 214 0.9 2,027 23.4 155 4.0
22X - Utilities (3) (D) (D) (D) (D) (D) (D) (D) (D)
236 - Construction of Buildings 572 -13.3 1,746 -1.7 510 -12.2 1,711 -2.0
237 - Heavy and Civil Engineering Construction 712 -43.6 590 -12.3 456 79.6 528 -14.0
238 - Specialty Trade Contractors 1,840 -2.6 4,145 -9.4 1,183 11.2 4,052 -9.2
23X - Construction (3) 48 23.1 349 -5.4 48 23.1 349 -5.4
311 - Food Manufacturing 52,572 -7.2 3,043 -2.1 8,611 -4.5 2,678 -2.4
312 - Beverage and Tobacco Product Manufacturing 3,778 0.9 1,202 -7.6 668 -11.9 1,150 -8.5
313 - Textile Mills 3,021 -25.6 726 -5.0 1,104 -20.7 698 -4.6
314 - Textile Product Mills 674 -13.8 720 -10.0 424 -22.3 702 -10.7
315 - Apparel Manufacturing 523 -32.8 903 -13.3 454 -29.3 891 -13.6
316 - Leather and Allied Product Manufacturing 365 -23.3 307 -12.8 (D) (D) 304 (D)
31X - Manufacturing (3) 780 -40.7 1,138 -0.9 (D) (D) 1,138 (D)
321 - Wood Product Manufacturing 3,952 -6.0 1,355 -11.2 1,955 -4.4 1,286 -11.2
322 - Paper Manufacturing 16,585 -12.6 1,067 -3.4 1,695 -10.0 980 -3.5
323 - Printing and Related Support Activities 1,753 -23.8 1,835 -10.4 774 -18.6 1,779 -10.7
324 - Petroleum and Coal Products Manufacturing 63,492 -31.0 283 -0.4 7,795 -36.8 257 -1.2
325 - Chemical Manufacturing 117,857 0.1 5,197 -1.4 20,563 -7.5 4,942 -1.6
326 - Plastics and Rubber Products Manufacturing 19,794 -11.7 4,578 -2.7 5,354 -12.3 4,332 -2.7
327 - Nonmetallic Mineral Product Manufacturing 7,530 -11.4 1,359 -4.8 1,212 -12.5 1,263 -5.5
32X - Manufacturing (3) 25 17.0 20 -13.0 25 17.0 20 -13.0
331 - Primary Metal Manufacturing 30,912 -14.1 1,536 -3.8 17,236 -7.9 1,424 -3.6
332 - Fabricated Metal Product Manufacturing 19,568 -11.4 11,282 -5.1 9,004 -13.5 11,049 -5.2
333 - Machinery Manufacturing 74,653 -5.4 10,486 -4.2 13,190 -8.8 10,224 -4.1
334 - Computer and Electronic Product Manufacturing 74,116 -27.4 7,014 -3.4 16,579 -16.1 6,838 -3.6
335 - Electrical Equipment, Appliance, and Component Manufacturing 15,800 -12.7 2,621 -2.9 3,593 -13.2 2,537 -3.0
336 - Transportation Equipment Manufacturing 185,201 -22.6 4,249 -3.6 12,208 16.8 3,896 -3.6
337 - Furniture and Related Product Manufacturing 2,296 -14.7 1,339 -4.9 453 -24.9 1,271 -4.9
339 - Miscellaneous Manufacturing 28,414 -14.4 5,543 -6.2 7,178 -24.1 5,421 -6.3
33X - Manufacturing (3) 300 62.0 150 -2.6 300 62.0 150 -2.6
423 - Merchant Wholesalers, Durable Goods 173,494 -9.5 55,359 -5.7 89,144 -14.0 54,739 -5.7
424 - Merchant Wholesalers, Nondurable Goods 135,306 -1.8 23,009 -5.6 79,103 -1.1 22,663 -5.6
425 - Wholesale Electronic Markets and Agents and Brokers 7,878 -21.6 6,519 -6.2 7,037 -23.3 6,509 -6.1
42X - Wholesale Trade (3) 2,628 15.0 2,682 -1.8 2,628 15.0 2,682 -1.8
441 - Motor Vehicle and Parts Dealers 4,480 -8.8 6,864 -9.8 2,602 -19.7 6,753 -10.2
442 - Furniture and Home Furnishings Stores 410 -31.6 1,090 -14.4 120 -13.9 1,057 -14.2
443 - Electronics and Appliance Stores 3,699 -14.0 857 -21.4 (D) (D) 846 -21.1
444 - Building Material and Garden Equipment and Supplies Dealers 998 2.9 1,661 -5.3 (D) (D) 1,631 -5.3
445 - Food and Beverage Stores 989 -4.9 936 -9.6 380 -25.3 898 -10.1
446 - Health and Personal Care Stores 2,402 80.2 1,288 -4.2 689 6.3 1,266 -4.2
447 - Gasoline Stations 296 44.0 347 -2.5 147 -0.2 325 -4.1
448 - Clothing and Clothing Accessories Stores 4,606 -32.1 2,483 -8.4 1,074 -24.8 2,392 -8.1
44X - Retail Trade (3) 483 1.3 893 -0.5 483 1.3 893 -0.5
451 - Sporting Goods, Hobby, Musical Instrument, and Book Stores 222 -34.3 1,259 -5.3 135 -36.2 1,238 -5.5
452 - General Merchandise Stores 1,521 -1.4 314 -1.3 (D) (D) 294 -1.7
453 - Miscellaneous Store Retailers 5,491 -31.2 3,061 -8.4 2,827 -36.9 3,004 -8.6
454 - Nonstore Retailers 4,201 20.6 9,218 -2.1 2,647 3.1 9,151 -2.1
45X - Retail Trade (3) (-) -80.2 6 (-) (-) -80.2 6 (-)
481 - Air Transportation 5,525 -35.3 453 -5.2 3,173 -34.1 416 -5.5
482 - Rail Transportation (D) (D) 14 -6.7 (D) (D) 14 -6.7
483 - Water Transportation 436 -39.5 462 -13.5 208 10.3 445 -14.3
484 - Truck Transportation 2,390 -57.0 2,648 -5.4 2,078 -59.8 2,570 -5.5
485 - Transit and Ground Passenger Transportation 86 -33.6 312 -2.5 67 -40.1 292 -2.7
486 - Pipeline Transportation 1,168 1.7 29 20.8 (D) (D) 22 37.5
487 - Scenic and Sightseeing Transportation 22 -28.8 52 -1.9 (D) (D) (D) (D)
488 - Support Activities for Transportation 17,927 -13.1 4,594 -5.4 16,122 -9.8 4,498 -5.7
48X - Transportation and Warehousing (3) 542 92.3 758 4.6 542 92.3 758 4.6
491 - Postal Service 2 -41.6 12 -29.4 (D) (D) (D) (D)
492 - Couriers and Messengers 2,343 3.3 279 5.7 94 -44.5 274 7.0
Identified Exporters Small and Medium Sized Exporters (2)
Value in millions of dollars. Details may not equal totals due to rounding. (-) Represents zero or less than one-half unit of measurement shown.
(D) - Represents suppressed to avoid disclosure. (Z) - Represents greater than 499%.
44
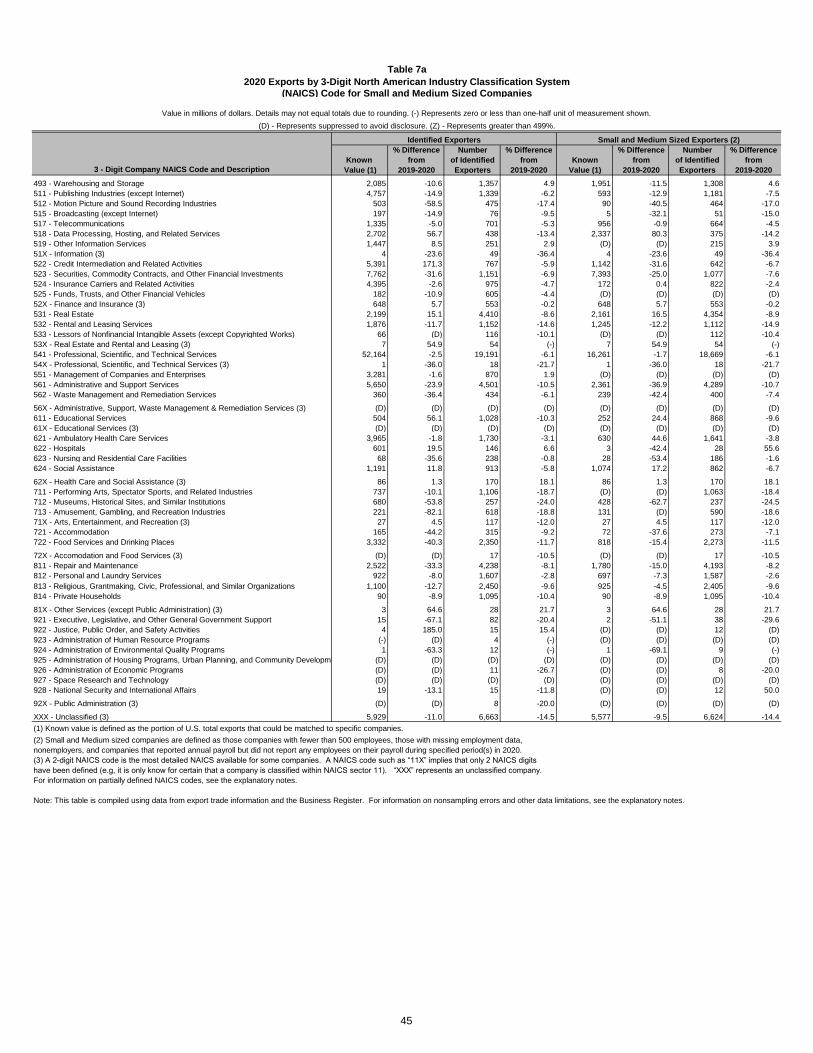
Table 7a
2020 Exports by 3-Digit North American Industry Classification System
(NAICS) Code for Small and Medium Sized Companies
% Difference Number % Difference % Difference Number % Difference
Known from of Identified from Known from of Identified from
3 - Digit Company NAICS Code and Description Value (1) 2019-2020 Exporters 2019-2020 Value (1) 2019-2020 Exporters 2019-2020
Identified Exporters Small and Medium Sized Exporters (2)
Value in millions of dollars. Details may not equal totals due to rounding. (-) Represents zero or less than one-half unit of measurement shown.
(D) - Represents suppressed to avoid disclosure. (Z) - Represents greater than 499%.
493 - Warehousing and Storage 2,085 -10.6 1,357 4.9 1,951 -11.5 1,308 4.6
511 - Publishing Industries (except Internet) 4,757 -14.9 1,339 -6.2 593 -12.9 1,181 -7.5
512 - Motion Picture and Sound Recording Industries 503 -58.5 475 -17.4 90 -40.5 464 -17.0
515 - Broadcasting (except Internet) 197 -14.9 76 -9.5 5 -32.1 51 -15.0
517 - Telecommunications 1,335 -5.0 701 -5.3 956 -0.9 664 -4.5
518 - Data Processing, Hosting, and Related Services 2,702 56.7 438 -13.4 2,337 80.3 375 -14.2
519 - Other Information Services 1,447 8.5 251 2.9 (D) (D) 215 3.9
51X - Information (3) 4 -23.6 49 -36.4 4 -23.6 49 -36.4
522 - Credit Intermediation and Related Activities 5,391 171.3 767 -5.9 1,142 -31.6 642 -6.7
523 - Securities, Commodity Contracts, and Other Financial Investments 7,762 -31.6 1,151 -6.9 7,393 -25.0 1,077 -7.6
524 - Insurance Carriers and Related Activities 4,395 -2.6 975 -4.7 172 0.4 822 -2.4
525 - Funds, Trusts, and Other Financial Vehicles 182 -10.9 605 -4.4 (D) (D) (D) (D)
52X - Finance and Insurance (3) 648 5.7 553 -0.2 648 5.7 553 -0.2
531 - Real Estate 2,199 15.1 4,410 -8.6 2,161 16.5 4,354 -8.9
532 - Rental and Leasing Services 1,876 -11.7 1,152 -14.6 1,245 -12.2 1,112 -14.9
533 - Lessors of Nonfinancial Intangible Assets (except Copyrighted Works) 66 (D) 116 -10.1 (D) (D) 112 -10.4
53X - Real Estate and Rental and Leasing (3) 7 54.9 54 (-) 7 54.9 54 (-)
541 - Professional, Scientific, and Technical Services 52,164 -2.5 19,191 -6.1 16,261 -1.7 18,669 -6.1
54X - Professional, Scientific, and Technical Services (3) 1 -36.0 18 -21.7 1 -36.0 18 -21.7
551 - Management of Companies and Enterprises 3,281 -1.6 870 1.9 (D) (D) (D) (D)
561 - Administrative and Support Services 5,650 -23.9 4,501 -10.5 2,361 -36.9 4,289 -10.7
562 - Waste Management and Remediation Services 360 -36.4 434 -6.1 239 -42.4 400 -7.4
56X - Administrative, Support, Waste Management & Remediation Services (3) (D) (D) (D) (D) (D) (D) (D) (D)
611 - Educational Services 504 56.1 1,028 -10.3 252 24.4 868 -9.6
61X - Educational Services (3) (D) (D) (D) (D) (D) (D) (D) (D)
621 - Ambulatory Health Care Services 3,965 -1.8 1,730 -3.1 630 44.6 1,641 -3.8
622 - Hospitals 601 19.5 146 6.6 3 -42.4 28 55.6
623 - Nursing and Residential Care Facilities 68 -35.6 238 -0.8 28 -53.4 186 -1.6
624 - Social Assistance 1,191 11.8 913 -5.8 1,074 17.2 862 -6.7
62X - Health Care and Social Assistance (3) 86 1.3 170 18.1 86 1.3 170 18.1
711 - Performing Arts, Spectator Sports, and Related Industries 737 -10.1 1,106 -18.7 (D) (D) 1,063 -18.4
712 - Museums, Historical Sites, and Similar Institutions 680 -53.8 257 -24.0 428 -62.7 237 -24.5
713 - Amusement, Gambling, and Recreation Industries 221 -82.1 618 -18.8 131 (D) 590 -18.6
71X - Arts, Entertainment, and Recreation (3) 27 4.5 117 -12.0 27 4.5 117 -12.0
721 - Accommodation 165 -44.2 315 -9.2 72 -37.6 273 -7.1
722 - Food Services and Drinking Places 3,332 -40.3 2,350 -11.7 818 -15.4 2,273 -11.5
72X - Accomodation and Food Services (3) (D) (D) 17 -10.5 (D) (D) 17 -10.5
811 - Repair and Maintenance 2,522 -33.3 4,238 -8.1 1,780 -15.0 4,193 -8.2
812 - Personal and Laundry Services 922 -8.0 1,607 -2.8 697 -7.3 1,587 -2.6
813 - Religious, Grantmaking, Civic, Professional, and Similar Organizations 1,100 -12.7 2,450 -9.6 925 -4.5 2,405 -9.6
814 - Private Households 90 -8.9 1,095 -10.4 90 -8.9 1,095 -10.4
81X - Other Services (except Public Administration) (3) 3 64.6 28 21.7 3 64.6 28 21.7
921 - Executive, Legislative, and Other General Government Support 15 -67.1 82 -20.4 2 -51.1 38 -29.6
922 - Justice, Public Order, and Safety Activities 4 185.0 15 15.4 (D) (D) 12 (D)
923 - Administration of Human Resource Programs (-) (D) 4 (-) (D) (D) (D) (D)
924 - Administration of Environmental Quality Programs 1 -63.3 12 (-) 1 -69.1 9 (-)
925 - Administration of Housing Programs, Urban Planning, and Community Development (D) (D) (D) (D) (D) (D) (D) (D)
926 - Administration of Economic Programs (D) (D) 11 -26.7 (D) (D) 8 -20.0
927 - Space Research and Technology (D) (D) (D) (D) (D) (D) (D) (D)
928 - National Security and International Affairs 19 -13.1 15 -11.8 (D) (D) 12 50.0
92X - Public Administration (3) (D) (D) 8 -20.0 (D) (D) (D) (D)
XXX - Unclassified (3) 5,929 -11.0 6,663 -14.5 5,577 -9.5 6,624 -14.4
(1) Known value is defined as the portion of U.S. total exports that could be matched to specific companies.
(2) Small and Medium sized companies are defined as those companies with fewer than 500 employees, those with missing employment data,
nonemployers, and companies that reported annual payroll but did not report any employees on their payroll during specified period(s) in 2020.
(3) A 2-digit NAICS code is the most detailed NAICS available for some companies. A NAICS code such as “11X” implies that only 2 NAICS digits
have been defined (e.g, it is only know for certain that a company is classified within NAICS sector 11). “XXX” represents an unclassified company.
For information on partially defined NAICS codes, see the explanatory notes.
Note: This table is compiled using data from export trade information and the Business Register. For information on nonsampling errors and other data limitations, see the explanatory notes.
45
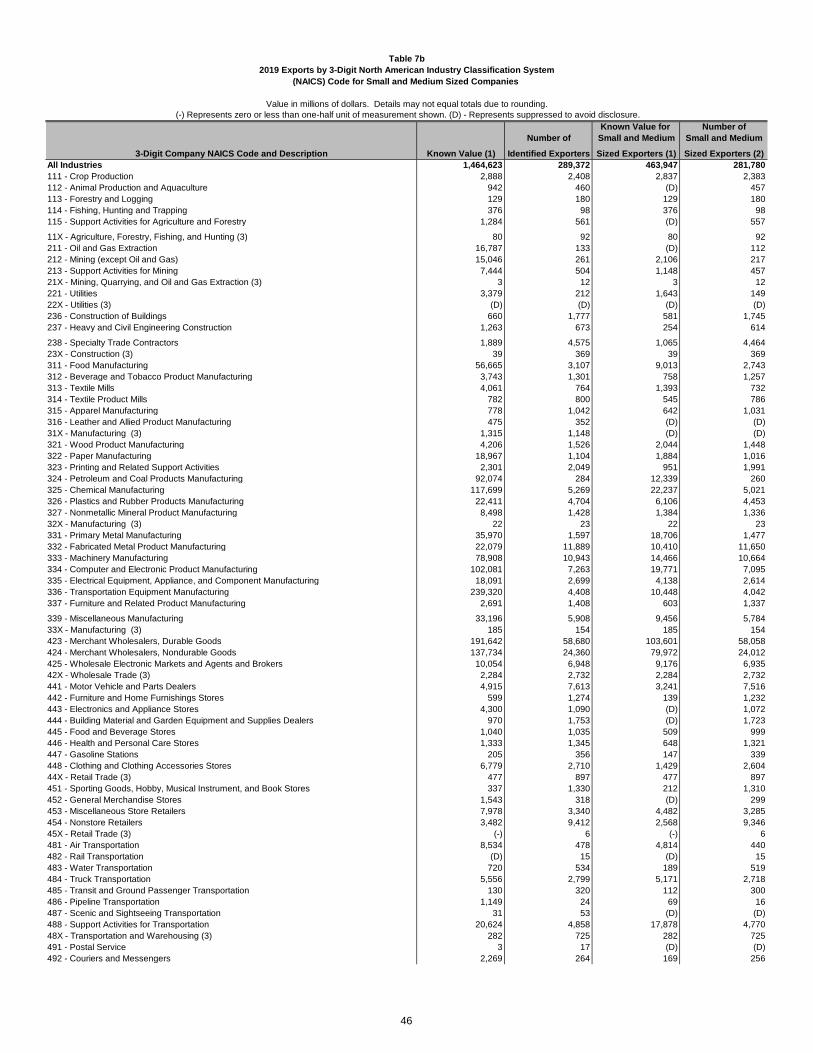
Table 7b
2019 Exports by 3-Digit North American Industry Classification System
(NAICS) Code for Small and Medium Sized Companies
Value in millions of dollars. Details may not equal totals due to rounding.
Known Value for Number of
Number of Small and Medium Small and Medium
3-Digit Company NAICS Code and Description Known Value (1) Identified Exporters Sized Exporters (1) Sized Exporters (2)
All Industries 1,464,623 289,372 463,947 281,780
111 - Crop Production 2,888 2,408 2,837 2,383
112 - Animal Production and Aquaculture 942 460 (D) 457
113 - Forestry and Logging 129 180 129 180
114 - Fishing, Hunting and Trapping 376 98 376 98
115 - Support Activities for Agriculture and Forestry 1,284 561 (D) 557
11X - Agriculture, Forestry, Fishing, and Hunting (3) 80 92 80 92
211 - Oil and Gas Extraction 16,787 133 (D) 112
212 - Mining (except Oil and Gas) 15,046 261 2,106 217
213 - Support Activities for Mining 7,444 504 1,148 457
21X - Mining, Quarrying, and Oil and Gas Extraction (3) 3 12 3 12
221 - Utilities 3,379 212 1,643 149
22X - Utilities (3) (D) (D) (D) (D)
236 - Construction of Buildings 660 1,777 581 1,745
237 - Heavy and Civil Engineering Construction 1,263 673 254 614
238 - Specialty Trade Contractors 1,889 4,575 1,065 4,464
23X - Construction (3) 39 369 39 369
311 - Food Manufacturing 56,665 3,107 9,013 2,743
312 - Beverage and Tobacco Product Manufacturing 3,743 1,301 758 1,257
313 - Textile Mills 4,061 764 1,393 732
314 - Textile Product Mills 782 800 545 786
315 - Apparel Manufacturing 778 1,042 642 1,031
316 - Leather and Allied Product Manufacturing 475 352 (D) (D)
31X - Manufacturing (3) 1,315 1,148 (D) (D)
321 - Wood Product Manufacturing 4,206 1,526 2,044 1,448
322 - Paper Manufacturing 18,967 1,104 1,884 1,016
323 - Printing and Related Support Activities 2,301 2,049 951 1,991
324 - Petroleum and Coal Products Manufacturing 92,074 284 12,339 260
325 - Chemical Manufacturing 117,699 5,269 22,237 5,021
326 - Plastics and Rubber Products Manufacturing 22,411 4,704 6,106 4,453
327 - Nonmetallic Mineral Product Manufacturing 8,498 1,428 1,384 1,336
32X - Manufacturing (3) 22 23 22 23
331 - Primary Metal Manufacturing 35,970 1,597 18,706 1,477
332 - Fabricated Metal Product Manufacturing 22,079 11,889 10,410 11,650
333 - Machinery Manufacturing 78,908 10,943 14,466 10,664
334 - Computer and Electronic Product Manufacturing 102,081 7,263 19,771 7,095
335 - Electrical Equipment, Appliance, and Component Manufacturing 18,091 2,699 4,138 2,614
336 - Transportation Equipment Manufacturing 239,320 4,408 10,448 4,042
337 - Furniture and Related Product Manufacturing 2,691 1,408 603 1,337
339 - Miscellaneous Manufacturing 33,196 5,908 9,456 5,784
33X - Manufacturing (3) 185 154 185 154
423 - Merchant Wholesalers, Durable Goods 191,642 58,680 103,601 58,058
424 - Merchant Wholesalers, Nondurable Goods 137,734 24,360 79,972 24,012
425 - Wholesale Electronic Markets and Agents and Brokers 10,054 6,948 9,176 6,935
42X - Wholesale Trade (3) 2,284 2,732 2,284 2,732
441 - Motor Vehicle and Parts Dealers 4,915 7,613 3,241 7,516
442 - Furniture and Home Furnishings Stores 599 1,274 139 1,232
443 - Electronics and Appliance Stores 4,300 1,090 (D) 1,072
444 - Building Material and Garden Equipment and Supplies Dealers 970 1,753 (D) 1,723
445 - Food and Beverage Stores 1,040 1,035 509 999
446 - Health and Personal Care Stores 1,333 1,345 648 1,321
447 - Gasoline Stations 205 356 147 339
448 - Clothing and Clothing Accessories Stores 6,779 2,710 1,429 2,604
44X - Retail Trade (3) 477 897 477 897
451 - Sporting Goods, Hobby, Musical Instrument, and Book Stores 337 1,330 212 1,310
452 - General Merchandise Stores 1,543 318 (D) 299
453 - Miscellaneous Store Retailers 7,978 3,340 4,482 3,285
454 - Nonstore Retailers 3,482 9,412 2,568 9,346
45X - Retail Trade (3) (-) 6 (-) 6
481 - Air Transportation 8,534 478 4,814 440
482 - Rail Transportation (D) 15 (D) 15
483 - Water Transportation 720 534 189 519
484 - Truck Transportation 5,556 2,799 5,171 2,718
485 - Transit and Ground Passenger Transportation 130 320 112 300
486 - Pipeline Transportation 1,149 24 69 16
487 - Scenic and Sightseeing Transportation 31 53 (D) (D)
488 - Support Activities for Transportation 20,624 4,858 17,878 4,770
48X - Transportation and Warehousing (3) 282 725 282 725
491 - Postal Service 3 17 (D) (D)
492 - Couriers and Messengers 2,269 264 169 256
(-) Represents zero or less than one-half unit of measurement shown. (D) - Represents suppressed to avoid disclosure.
46
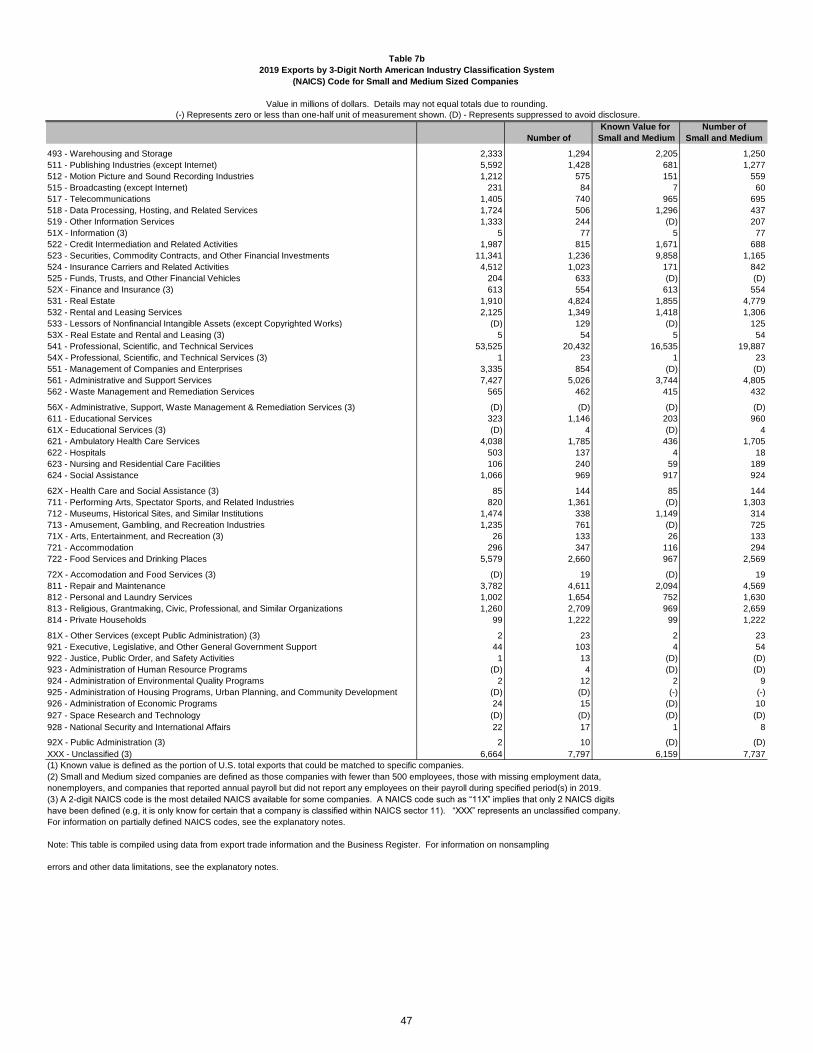
Table 7b
2019 Exports by 3-Digit North American Industry Classification System
(NAICS) Code for Small and Medium Sized Companies
Value in millions of dollars. Details may not equal totals due to rounding.
Known Value for Number of
Number of Small and Medium Small and Medium
(-) Represents zero or less than one-half unit of measurement shown. (D) - Represents suppressed to avoid disclosure.
493 - Warehousing and Storage 2,333 1,294 2,205 1,250
511 - Publishing Industries (except Internet) 5,592 1,428 681 1,277
512 - Motion Picture and Sound Recording Industries 1,212 575 151 559
515 - Broadcasting (except Internet) 231 84 7 60
517 - Telecommunications 1,405 740 965 695
518 - Data Processing, Hosting, and Related Services 1,724 506 1,296 437
519 - Other Information Services 1,333 244 (D) 207
51X - Information (3) 5 77 5 77
522 - Credit Intermediation and Related Activities 1,987 815 1,671 688
523 - Securities, Commodity Contracts, and Other Financial Investments 11,341 1,236 9,858 1,165
524 - Insurance Carriers and Related Activities 4,512 1,023 171 842
525 - Funds, Trusts, and Other Financial Vehicles 204 633 (D) (D)
52X - Finance and Insurance (3) 613 554 613 554
531 - Real Estate 1,910 4,824 1,855 4,779
532 - Rental and Leasing Services 2,125 1,349 1,418 1,306
533 - Lessors of Nonfinancial Intangible Assets (except Copyrighted Works) (D) 129 (D) 125
53X - Real Estate and Rental and Leasing (3) 5 54 5 54
541 - Professional, Scientific, and Technical Services 53,525 20,432 16,535 19,887
54X - Professional, Scientific, and Technical Services (3) 1 23 1 23
551 - Management of Companies and Enterprises 3,335 854 (D) (D)
561 - Administrative and Support Services 7,427 5,026 3,744 4,805
562 - Waste Management and Remediation Services 565 462 415 432
56X - Administrative, Support, Waste Management & Remediation Services (3) (D) (D) (D) (D)
611 - Educational Services 323 1,146 203 960
61X - Educational Services (3) (D) 4 (D) 4
621 - Ambulatory Health Care Services 4,038 1,785 436 1,705
622 - Hospitals 503 137 4 18
623 - Nursing and Residential Care Facilities 106 240 59 189
624 - Social Assistance 1,066 969 917 924
62X - Health Care and Social Assistance (3) 85 144 85 144
711 - Performing Arts, Spectator Sports, and Related Industries 820 1,361 (D) 1,303
712 - Museums, Historical Sites, and Similar Institutions 1,474 338 1,149 314
713 - Amusement, Gambling, and Recreation Industries 1,235 761 (D) 725
71X - Arts, Entertainment, and Recreation (3) 26 133 26 133
721 - Accommodation 296 347 116 294
722 - Food Services and Drinking Places 5,579 2,660 967 2,569
72X - Accomodation and Food Services (3) (D) 19 (D) 19
811 - Repair and Maintenance 3,782 4,611 2,094 4,569
812 - Personal and Laundry Services 1,002 1,654 752 1,630
813 - Religious, Grantmaking, Civic, Professional, and Similar Organizations 1,260 2,709 969 2,659
814 - Private Households 99 1,222 99 1,222
81X - Other Services (except Public Administration) (3) 2 23 2 23
921 - Executive, Legislative, and Other General Government Support 44 103 4 54
922 - Justice, Public Order, and Safety Activities 1 13 (D) (D)
923 - Administration of Human Resource Programs (D) 4 (D) (D)
924 - Administration of Environmental Quality Programs 2 12 2 9
925 - Administration of Housing Programs, Urban Planning, and Community Development (D) (D) (-) (-)
926 - Administration of Economic Programs 24 15 (D) 10
927 - Space Research and Technology (D) (D) (D) (D)
928 - National Security and International Affairs 22 17 1 8
92X - Public Administration (3) 2 10 (D) (D)
XXX - Unclassified (3) 6,664 7,797 6,159 7,737
(1) Known value is defined as the portion of U.S. total exports that could be matched to specific companies.
(2) Small and Medium sized companies are defined as those companies with fewer than 500 employees, those with missing employment data,
nonemployers, and companies that reported annual payroll but did not report any employees on their payroll during specified period(s) in 2019.
(3) A 2-digit NAICS code is the most detailed NAICS available for some companies. A NAICS code such as “11X” implies that only 2 NAICS digits
have been defined (e.g, it is only know for certain that a company is classified within NAICS sector 11). “XXX” represents an unclassified company.
For information on partially defined NAICS codes, see the explanatory notes.
Note: This table is compiled using data from export trade information and the Business Register. For information on nonsampling
errors and other data limitations, see the explanatory notes.
47
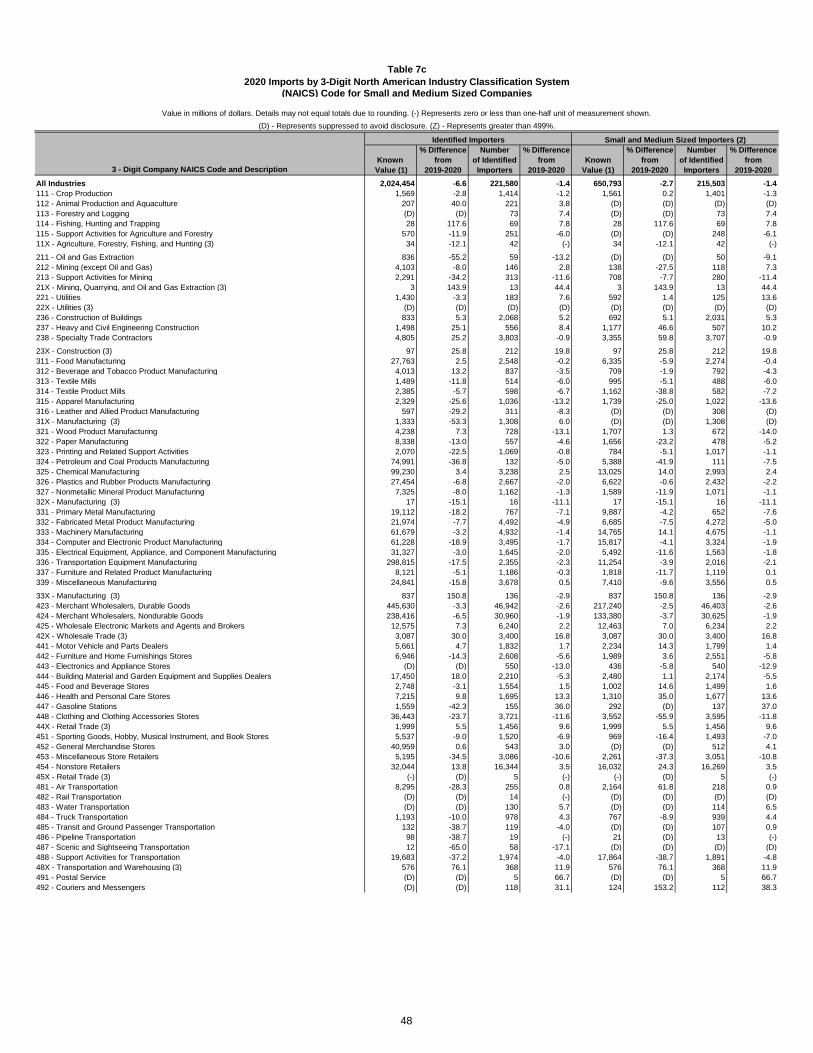
Table 7c
2020 Imports by 3-Digit North American Industry Classification System
(NAICS) Code for Small and Medium Sized Companies
% Difference Number % Difference % Difference Number % Difference
Known from of Identified from Known from of Identified from
3 - Digit Company NAICS Code and Description Value (1) 2019-2020 Importers 2019-2020 Value (1) 2019-2020 Importers 2019-2020
All Industries 2,024,454 -6.6 221,580 -1.4 650,793 -2.7 215,503 -1.4
111 - Crop Production 1,569 -2.8 1,414 -1.2 1,561 0.2 1,401 -1.3
112 - Animal Production and Aquaculture 207 40.0 221 3.8 (D) (D) (D) (D)
113 - Forestry and Logging (D) (D) 73 7.4 (D) (D) 73 7.4
114 - Fishing, Hunting and Trapping 28 117.6 69 7.8 28 117.6 69 7.8
115 - Support Activities for Agriculture and Forestry 570 -11.9 251 -6.0 (D) (D) 248 -6.1
11X - Agriculture, Forestry, Fishing, and Hunting (3) 34 -12.1 42 (-) 34 -12.1 42 (-)
211 - Oil and Gas Extraction 836 -55.2 59 -13.2 (D) (D) 50 -9.1
212 - Mining (except Oil and Gas) 4,103 -8.0 146 2.8 138 -27.5 118 7.3
213 - Support Activities for Mining 2,291 -34.2 313 -11.6 708 -7.7 280 -11.4
21X - Mining, Quarrying, and Oil and Gas Extraction (3) 3 143.9 13 44.4 3 143.9 13 44.4
221 - Utilities 1,430 -3.3 183 7.6 592 1.4 125 13.6
22X - Utilities (3) (D) (D) (D) (D) (D) (D) (D) (D)
236 - Construction of Buildings 833 5.3 2,068 5.2 692 5.1 2,031 5.3
237 - Heavy and Civil Engineering Construction 1,498 25.1 556 8.4 1,177 46.6 507 10.2
238 - Specialty Trade Contractors 4,805 25.2 3,803 -0.9 3,355 59.8 3,707 -0.9
23X - Construction (3) 97 25.8 212 19.8 97 25.8 212 19.8
311 - Food Manufacturing 27,763 2.5 2,548 -0.2 6,335 -5.9 2,274 -0.4
312 - Beverage and Tobacco Product Manufacturing 4,013 13.2 837 -3.5 709 -1.9 792 -4.3
313 - Textile Mills 1,489 -11.8 514 -6.0 995 -5.1 488 -6.0
314 - Textile Product Mills 2,385 -5.7 598 -6.7 1,162 -38.8 582 -7.2
315 - Apparel Manufacturing 2,329 -25.6 1,036 -13.2 1,739 -25.0 1,022 -13.6
316 - Leather and Allied Product Manufacturing 597 -29.2 311 -8.3 (D) (D) 308 (D)
31X - Manufacturing (3) 1,333 -53.3 1,308 6.0 (D) (D) 1,308 (D)
321 - Wood Product Manufacturing 4,238 7.3 728 -13.1 1,707 1.3 672 -14.0
322 - Paper Manufacturing 8,338 -13.0 557 -4.6 1,656 -23.2 478 -5.2
323 - Printing and Related Support Activities 2,070 -22.5 1,069 -0.8 784 -5.1 1,017 -1.1
324 - Petroleum and Coal Products Manufacturing 74,991 -36.8 132 -5.0 5,388 -41.9 111 -7.5
325 - Chemical Manufacturing 99,230 3.4 3,238 2.5 13,025 14.0 2,993 2.4
326 - Plastics and Rubber Products Manufacturing 27,454 -6.8 2,667 -2.0 6,622 -0.6 2,432 -2.2
327 - Nonmetallic Mineral Product Manufacturing 7,325 -8.0 1,162 -1.3 1,589 -11.9 1,071 -1.1
32X - Manufacturing (3) 17 -15.1 16 -11.1 17 -15.1 16 -11.1
331 - Primary Metal Manufacturing 19,112 -18.2 767 -7.1 9,887 -4.2 652 -7.6
332 - Fabricated Metal Product Manufacturing 21,974 -7.7 4,492 -4.9 6,685 -7.5 4,272 -5.0
333 - Machinery Manufacturing 61,679 -3.2 4,932 -1.4 14,765 14.1 4,675 -1.1
334 - Computer and Electronic Product Manufacturing 61,228 -18.9 3,495 -1.7 15,817 -4.1 3,324 -1.9
335 - Electrical Equipment, Appliance, and Component Manufacturing 31,327 -3.0 1,645 -2.0 5,492 -11.6 1,563 -1.8
336 - Transportation Equipment Manufacturing 298,815 -17.5 2,355 -2.3 11,254 -3.9 2,016 -2.1
337 - Furniture and Related Product Manufacturing 8,121 -5.1 1,186 -0.3 1,818 -11.7 1,119 0.1
339 - Miscellaneous Manufacturing 24,841 -15.8 3,678 0.5 7,410 -9.6 3,556 0.5
33X - Manufacturing (3) 837 150.8 136 -2.9 837 150.8 136 -2.9
423 - Merchant Wholesalers, Durable Goods 445,630 -3.3 46,942 -2.6 217,240 -2.5 46,403 -2.6
424 - Merchant Wholesalers, Nondurable Goods 238,416 -6.5 30,960 -1.9 133,380 -3.7 30,625 -1.9
425 - Wholesale Electronic Markets and Agents and Brokers 12,575 7.3 6,240 2.2 12,463 7.0 6,234 2.2
42X - Wholesale Trade (3) 3,087 30.0 3,400 16.8 3,087 30.0 3,400 16.8
441 - Motor Vehicle and Parts Dealers 5,661 4.7 1,832 1.7 2,234 14.3 1,799 1.4
442 - Furniture and Home Furnishings Stores 6,946 -14.3 2,608 -5.6 1,989 3.6 2,551 -5.8
443 - Electronics and Appliance Stores (D) (D) 550 -13.0 436 -5.8 540 -12.9
444 - Building Material and Garden Equipment and Supplies Dealers 17,450 18.0 2,210 -5.3 2,480 1.1 2,174 -5.5
445 - Food and Beverage Stores 2,748 -3.1 1,554 1.5 1,002 14.6 1,499 1.6
446 - Health and Personal Care Stores 7,215 9.8 1,695 13.3 1,310 35.0 1,677 13.6
447 - Gasoline Stations 1,559 -42.3 155 36.0 292 (D) 137 37.0
448 - Clothing and Clothing Accessories Stores 36,443 -23.7 3,721 -11.6 3,552 -55.9 3,595 -11.8
44X - Retail Trade (3) 1,999 5.5 1,456 9.6 1,999 5.5 1,456 9.6
451 - Sporting Goods, Hobby, Musical Instrument, and Book Stores 5,537 -9.0 1,520 -6.9 969 -16.4 1,493 -7.0
452 - General Merchandise Stores 40,959 0.6 543 3.0 (D) (D) 512 4.1
453 - Miscellaneous Store Retailers 5,195 -34.5 3,086 -10.6 2,261 -37.3 3,051 -10.8
454 - Nonstore Retailers 32,044 13.8 16,344 3.5 16,032 24.3 16,269 3.5
45X - Retail Trade (3) (-) (D) 5 (-) (-) (D) 5 (-)
481 - Air Transportation 8,295 -28.3 255 0.8 2,164 61.8 218 0.9
482 - Rail Transportation (D) (D) 14 (-) (D) (D) (D) (D)
483 - Water Transportation (D) (D) 130 5.7 (D) (D) 114 6.5
484 - Truck Transportation 1,193 -10.0 978 4.3 767 -8.9 939 4.4
485 - Transit and Ground Passenger Transportation 132 -38.7 119 -4.0 (D) (D) 107 0.9
486 - Pipeline Transportation 98 -38.7 19 (-) 21 (D) 13 (-)
487 - Scenic and Sightseeing Transportation 12 -65.0 58 -17.1 (D) (D) (D) (D)
488 - Support Activities for Transportation 19,683 -37.2 1,974 -4.0 17,864 -38.7 1,891 -4.8
48X - Transportation and Warehousing (3) 576 76.1 368 11.9 576 76.1 368 11.9
491 - Postal Service (D) (D) 5 66.7 (D) (D) 5 66.7
492 - Couriers and Messengers (D) (D) 118 31.1 124 153.2 112 38.3
Value in millions of dollars. Details may not equal totals due to rounding. (-) Represents zero or less than one-half unit of measurement shown.
(D) - Represents suppressed to avoid disclosure. (Z) - Represents greater than 499%.
Identified Importers Small and Medium Sized Importers (2)
48
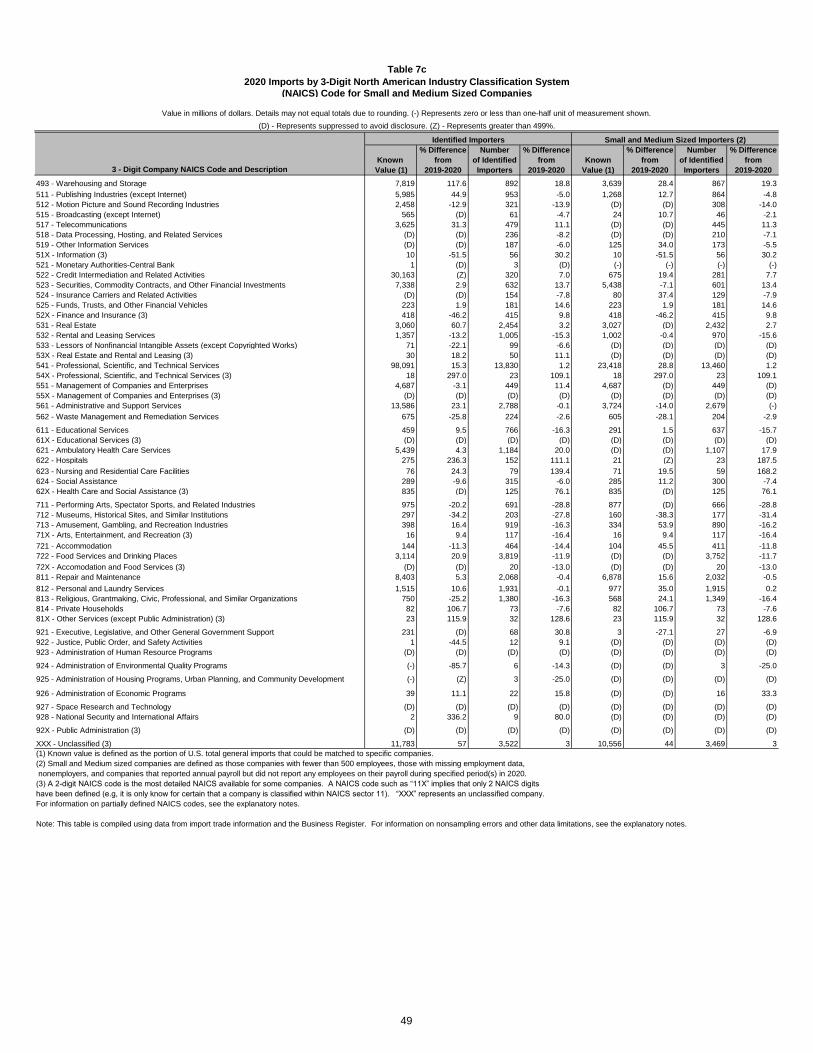
Table 7c
2020 Imports by 3-Digit North American Industry Classification System
(NAICS) Code for Small and Medium Sized Companies
% Difference Number % Difference % Difference Number % Difference
Known from of Identified from Known from of Identified from
3 - Digit Company NAICS Code and Description Value (1) 2019-2020 Importers 2019-2020 Value (1) 2019-2020 Importers 2019-2020
Value in millions of dollars. Details may not equal totals due to rounding. (-) Represents zero or less than one-half unit of measurement shown.
(D) - Represents suppressed to avoid disclosure. (Z) - Represents greater than 499%.
Identified Importers Small and Medium Sized Importers (2)
493 - Warehousing and Storage 7,819 117.6 892 18.8 3,639 28.4 867 19.3
511 - Publishing Industries (except Internet) 5,985 44.9 953 -5.0 1,268 12.7 864 -4.8
512 - Motion Picture and Sound Recording Industries 2,458 -12.9 321 -13.9 (D) (D) 308 -14.0
515 - Broadcasting (except Internet) 565 (D) 61 -4.7 24 10.7 46 -2.1
517 - Telecommunications 3,625 31.3 479 11.1 (D) (D) 445 11.3
518 - Data Processing, Hosting, and Related Services (D) (D) 236 -8.2 (D) (D) 210 -7.1
519 - Other Information Services (D) (D) 187 -6.0 125 34.0 173 -5.5
51X - Information (3) 10 -51.5 56 30.2 10 -51.5 56 30.2
521 - Monetary Authorities-Central Bank 1 (D) 3 (D) (-) (-) (-) (-)
522 - Credit Intermediation and Related Activities 30,163 (Z) 320 7.0 675 19.4 281 7.7
523 - Securities, Commodity Contracts, and Other Financial Investments 7,338 2.9 632 13.7 5,438 -7.1 601 13.4
524 - Insurance Carriers and Related Activities (D) (D) 154 -7.8 80 37.4 129 -7.9
525 - Funds, Trusts, and Other Financial Vehicles 223 1.9 181 14.6 223 1.9 181 14.6
52X - Finance and Insurance (3) 418 -46.2 415 9.8 418 -46.2 415 9.8
531 - Real Estate 3,060 60.7 2,454 3.2 3,027 (D) 2,432 2.7
532 - Rental and Leasing Services 1,357 -13.2 1,005 -15.3 1,002 -0.4 970 -15.6
533 - Lessors of Nonfinancial Intangible Assets (except Copyrighted Works) 71 -22.1 99 -6.6 (D) (D) (D) (D)
53X - Real Estate and Rental and Leasing (3) 30 18.2 50 11.1 (D) (D) (D) (D)
541 - Professional, Scientific, and Technical Services 98,091 15.3 13,830 1.2 23,418 28.8 13,460 1.2
54X - Professional, Scientific, and Technical Services (3) 18 297.0 23 109.1 18 297.0 23 109.1
551 - Management of Companies and Enterprises 4,687 -3.1 449 11.4 4,687 (D) 449 (D)
55X - Management of Companies and Enterprises (3) (D) (D) (D) (D) (D) (D) (D) (D)
561 - Administrative and Support Services 13,586 23.1 2,788 -0.1 3,724 -14.0 2,679 (-)
562 - Waste Management and Remediation Services 675 -25.8 224 -2.6 605 -28.1 204 -2.9
611 - Educational Services 459 9.5 766 -16.3 291 1.5 637 -15.7
61X - Educational Services (3) (D) (D) (D) (D) (D) (D) (D) (D)
621 - Ambulatory Health Care Services 5,439 4.3 1,184 20.0 (D) (D) 1,107 17.9
622 - Hospitals 275 236.3 152 111.1 21 (Z) 23 187.5
623 - Nursing and Residential Care Facilities 76 24.3 79 139.4 71 19.5 59 168.2
624 - Social Assistance 289 -9.6 315 -6.0 285 11.2 300 -7.4
62X - Health Care and Social Assistance (3) 835 (D) 125 76.1 835 (D) 125 76.1
711 - Performing Arts, Spectator Sports, and Related Industries 975 -20.2 691 -28.8 877 (D) 666 -28.8
712 - Museums, Historical Sites, and Similar Institutions 297 -34.2 203 -27.8 160 -38.3 177 -31.4
713 - Amusement, Gambling, and Recreation Industries 398 16.4 919 -16.3 334 53.9 890 -16.2
71X - Arts, Entertainment, and Recreation (3) 16 9.4 117 -16.4 16 9.4 117 -16.4
721 - Accommodation 144 -11.3 464 -14.4 104 45.5 411 -11.8
722 - Food Services and Drinking Places 3,114 20.9 3,819 -11.9 (D) (D) 3,752 -11.7
72X - Accomodation and Food Services (3) (D) (D) 20 -13.0 (D) (D) 20 -13.0
811 - Repair and Maintenance 8,403 5.3 2,068 -0.4 6,878 15.6 2,032 -0.5
812 - Personal and Laundry Services 1,515 10.6 1,931 -0.1 977 35.0 1,915 0.2
813 - Religious, Grantmaking, Civic, Professional, and Similar Organizations 750 -25.2 1,380 -16.3 568 24.1 1,349 -16.4
814 - Private Households 82 106.7 73 -7.6 82 106.7 73 -7.6
81X - Other Services (except Public Administration) (3) 23 115.9 32 128.6 23 115.9 32 128.6
921 - Executive, Legislative, and Other General Government Support 231 (D) 68 30.8 3 -27.1 27 -6.9
922 - Justice, Public Order, and Safety Activities 1 -44.5 12 9.1 (D) (D) (D) (D)
923 - Administration of Human Resource Programs (D) (D) (D) (D) (D) (D) (D) (D)
924 - Administration of Environmental Quality Programs (-) -85.7 6 -14.3 (D) (D) 3 -25.0
925 - Administration of Housing Programs, Urban Planning, and Community Development (-) (Z) 3 -25.0 (D) (D) (D) (D)
926 - Administration of Economic Programs 39 11.1 22 15.8 (D) (D) 16 33.3
927 - Space Research and Technology (D) (D) (D) (D) (D) (D) (D) (D)
928 - National Security and International Affairs 2 336.2 9 80.0 (D) (D) (D) (D)
92X - Public Administration (3) (D) (D) (D) (D) (D) (D) (D) (D)
XXX - Unclassified (3) 11,783 57 3,522 3 10,556 44 3,469 3
(1) Known value is defined as the portion of U.S. total general imports that could be matched to specific companies.
(2) Small and Medium sized companies are defined as those companies with fewer than 500 employees, those with missing employment data,
nonemployers, and companies that reported annual payroll but did not report any employees on their payroll during specified period(s) in 2020.
(3) A 2-digit NAICS code is the most detailed NAICS available for some companies. A NAICS code such as “11X” implies that only 2 NAICS digits
have been defined (e.g, it is only know for certain that a company is classified within NAICS sector 11). “XXX” represents an unclassified company.
For information on partially defined NAICS codes, see the explanatory notes.
Note: This table is compiled using data from import trade information and the Business Register. For information on nonsampling errors and other data limitations, see the explanatory notes.
49
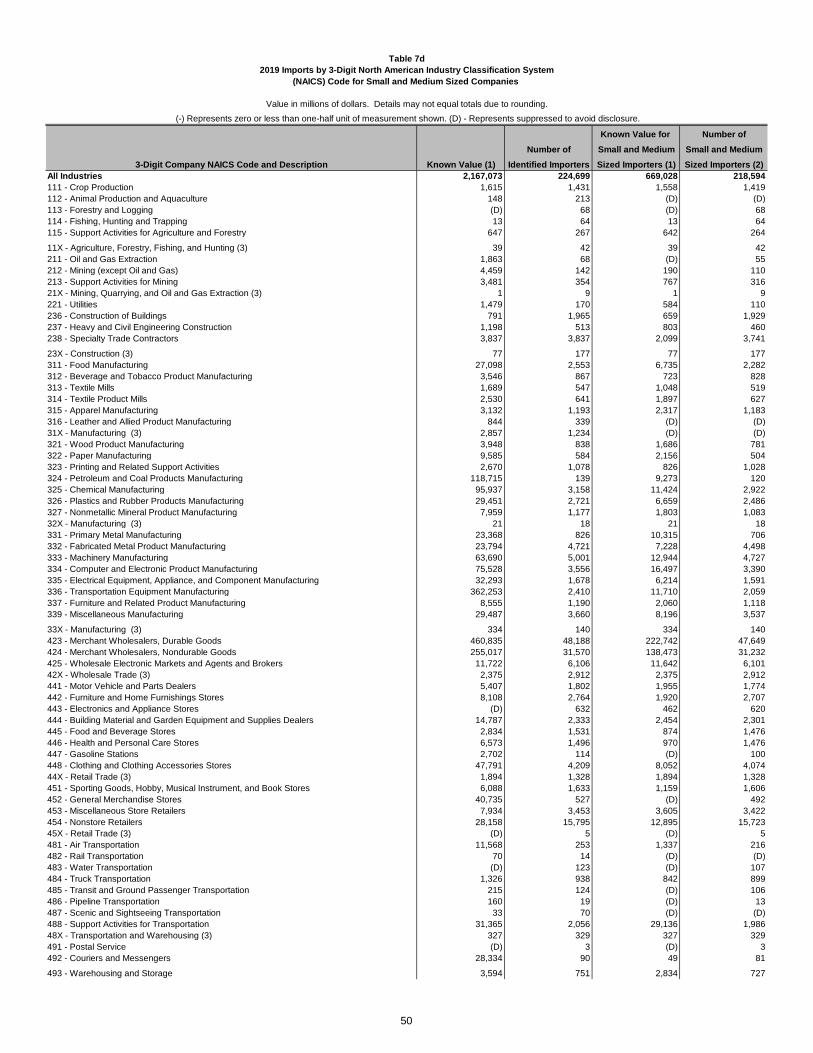
Table 7d
2019 Imports by 3-Digit North American Industry Classification System
(NAICS) Code for Small and Medium Sized Companies
Value in millions of dollars. Details may not equal totals due to rounding.
Known Value for Number of
Number of Small and Medium Small and Medium
3-Digit Company NAICS Code and Description Known Value (1) Identified Importers Sized Importers (1) Sized Importers (2)
All Industries 2,167,073 224,699 669,028 218,594
111 - Crop Production 1,615 1,431 1,558 1,419
112 - Animal Production and Aquaculture 148 213 (D) (D)
113 - Forestry and Logging (D) 68 (D) 68
114 - Fishing, Hunting and Trapping 13 64 13 64
115 - Support Activities for Agriculture and Forestry 647 267 642 264
11X - Agriculture, Forestry, Fishing, and Hunting (3) 39 42 39 42
211 - Oil and Gas Extraction 1,863 68 (D) 55
212 - Mining (except Oil and Gas) 4,459 142 190 110
213 - Support Activities for Mining 3,481 354 767 316
21X - Mining, Quarrying, and Oil and Gas Extraction (3) 1 9 1 9
221 - Utilities 1,479 170 584 110
236 - Construction of Buildings 791 1,965 659 1,929
237 - Heavy and Civil Engineering Construction 1,198 513 803 460
238 - Specialty Trade Contractors 3,837 3,837 2,099 3,741
23X - Construction (3) 77 177 77 177
311 - Food Manufacturing 27,098 2,553 6,735 2,282
312 - Beverage and Tobacco Product Manufacturing 3,546 867 723 828
313 - Textile Mills 1,689 547 1,048 519
314 - Textile Product Mills 2,530 641 1,897 627
315 - Apparel Manufacturing 3,132 1,193 2,317 1,183
316 - Leather and Allied Product Manufacturing 844 339 (D) (D)
31X - Manufacturing (3) 2,857 1,234 (D) (D)
321 - Wood Product Manufacturing 3,948 838 1,686 781
322 - Paper Manufacturing 9,585 584 2,156 504
323 - Printing and Related Support Activities 2,670 1,078 826 1,028
324 - Petroleum and Coal Products Manufacturing 118,715 139 9,273 120
325 - Chemical Manufacturing 95,937 3,158 11,424 2,922
326 - Plastics and Rubber Products Manufacturing 29,451 2,721 6,659 2,486
327 - Nonmetallic Mineral Product Manufacturing 7,959 1,177 1,803 1,083
32X - Manufacturing (3) 21 18 21 18
331 - Primary Metal Manufacturing 23,368 826 10,315 706
332 - Fabricated Metal Product Manufacturing 23,794 4,721 7,228 4,498
333 - Machinery Manufacturing 63,690 5,001 12,944 4,727
334 - Computer and Electronic Product Manufacturing 75,528 3,556 16,497 3,390
335 - Electrical Equipment, Appliance, and Component Manufacturing 32,293 1,678 6,214 1,591
336 - Transportation Equipment Manufacturing 362,253 2,410 11,710 2,059
337 - Furniture and Related Product Manufacturing 8,555 1,190 2,060 1,118
339 - Miscellaneous Manufacturing 29,487 3,660 8,196 3,537
33X - Manufacturing (3) 334 140 334 140
423 - Merchant Wholesalers, Durable Goods 460,835 48,188 222,742 47,649
424 - Merchant Wholesalers, Nondurable Goods 255,017 31,570 138,473 31,232
425 - Wholesale Electronic Markets and Agents and Brokers 11,722 6,106 11,642 6,101
42X - Wholesale Trade (3) 2,375 2,912 2,375 2,912
441 - Motor Vehicle and Parts Dealers 5,407 1,802 1,955 1,774
442 - Furniture and Home Furnishings Stores 8,108 2,764 1,920 2,707
443 - Electronics and Appliance Stores (D) 632 462 620
444 - Building Material and Garden Equipment and Supplies Dealers 14,787 2,333 2,454 2,301
445 - Food and Beverage Stores 2,834 1,531 874 1,476
446 - Health and Personal Care Stores 6,573 1,496 970 1,476
447 - Gasoline Stations 2,702 114 (D) 100
448 - Clothing and Clothing Accessories Stores 47,791 4,209 8,052 4,074
44X - Retail Trade (3) 1,894 1,328 1,894 1,328
451 - Sporting Goods, Hobby, Musical Instrument, and Book Stores 6,088 1,633 1,159 1,606
452 - General Merchandise Stores 40,735 527 (D) 492
453 - Miscellaneous Store Retailers 7,934 3,453 3,605 3,422
454 - Nonstore Retailers 28,158 15,795 12,895 15,723
45X - Retail Trade (3) (D) 5 (D) 5
481 - Air Transportation 11,568 253 1,337 216
482 - Rail Transportation 70 14 (D) (D)
483 - Water Transportation (D) 123 (D) 107
484 - Truck Transportation 1,326 938 842 899
485 - Transit and Ground Passenger Transportation 215 124 (D) 106
486 - Pipeline Transportation 160 19 (D) 13
487 - Scenic and Sightseeing Transportation 33 70 (D) (D)
488 - Support Activities for Transportation 31,365 2,056 29,136 1,986
48X - Transportation and Warehousing (3) 327 329 327 329
491 - Postal Service (D) 3 (D) 3
492 - Couriers and Messengers 28,334 90 49 81
493 - Warehousing and Storage 3,594 751 2,834 727
(-) Represents zero or less than one-half unit of measurement shown. (D) - Represents suppressed to avoid disclosure.
50

Table 7d
2019 Imports by 3-Digit North American Industry Classification System
(NAICS) Code for Small and Medium Sized Companies
Value in millions of dollars. Details may not equal totals due to rounding.
Known Value for Number of
Number of Small and Medium Small and Medium
(-) Represents zero or less than one-half unit of measurement shown. (D) - Represents suppressed to avoid disclosure.
511 - Publishing Industries (except Internet) 4,130 1,003 1,125 908
512 - Motion Picture and Sound Recording Industries 2,822 373 90 358
515 - Broadcasting (except Internet) (D) 64 22 47
517 - Telecommunications 2,761 431 701 400
518 - Data Processing, Hosting, and Related Services (D) 257 (D) 226
519 - Other Information Services (D) 199 93 183
51X - Information (3) 21 43 21 43
521 - Monetary Authorities-Central Bank (D) (D) (D) (-)
522 - Credit Intermediation and Related Activities 3,504 299 565 261
523 - Securities, Commodity Contracts, and Other Financial Investments 7,133 556 5,853 530
524 - Insurance Carriers and Related Activities (D) 167 58 140
525 - Funds, Trusts, and Other Financial Vehicles 219 158 219 158
52X - Finance and Insurance (3) 778 378 778 378
531 - Real Estate 1,904 2,379 (D) 2,367
532 - Rental and Leasing Services 1,564 1,187 1,006 1,149
533 - Lessors of Nonfinancial Intangible Assets (except Copyrighted Works) 91 106 (D) 103
53X - Real Estate and Rental and Leasing (3) 25 45 25 45
541 - Professional, Scientific, and Technical Services 85,091 13,671 18,185 13,299
54X - Professional, Scientific, and Technical Services (3) 5 11 5 11
551 - Management of Companies and Enterprises 4,837 403 (D) (D)
55X - Management of Companies and Enterprises (3) (D) (D) (D) (D)
561 - Administrative and Support Services 11,033 2,792 4,329 2,680
562 - Waste Management and Remediation Services 910 230 842 210
56X - Administrative, Support, Waste Management & Remediation Services (3) (D) (D) (D) (D)
611 - Educational Services 419 915 286 756
61X - Educational Services (3) (D) (D) (D) (D)
621 - Ambulatory Health Care Services 5,212 987 (D) 939
622 - Hospitals 82 72 1 8
623 - Nursing and Residential Care Facilities 61 33 59 22
624 - Social Assistance 320 335 256 324
62X - Health Care and Social Assistance (3) (D) 71 (D) 71
711 - Performing Arts, Spectator Sports, and Related Industries 1,222 971 (D) 935
712 - Museums, Historical Sites, and Similar Institutions 450 281 260 258
713 - Amusement, Gambling, and Recreation Industries 342 1,098 217 1,062
71X - Arts, Entertainment, and Recreation (3) 15 140 15 140
721 - Accommodation 162 542 72 466
722 - Food Services and Drinking Places 2,576 4,337 (D) 4,250
72X - Accomodation and Food Services (3) 74 23 74 23
811 - Repair and Maintenance 7,981 2,076 5,950 2,043
812 - Personal and Laundry Services 1,370 1,932 724 1,911
813 - Religious, Grantmaking, Civic, Professional, and Similar Organizations 1,003 1,649 457 1,614
814 - Private Households 40 79 40 79
81X - Other Services (except Public Administration) (3) 11 14 11 14
921 - Executive, Legislative, and Other General Government Support (D) 52 4 29
922 - Justice, Public Order, and Safety Activities 1 11 (D) (D)
923 - Administration of Human Resource Programs (D) (D) (D) (D)
924 - Administration of Environmental Quality Programs 1 7 (-) 4
925 - Administration of Housing Programs, Urban Planning, and Community Development (-) 3 (D) (D)
926 - Administration of Economic Programs 39 22 (D) 16
927 - Space Research and Technology (D) (D) (D) (D)
928 - National Security and International Affairs 2 9 (D) (D)
92X - Public Administration (3) (D) (D) (D) (D)
XXX - Unclassified (3) 11,783 3,522 10,556 3,469
(1) Known value is defined as the portion of U.S. total general imports that could be matched to specific companies.
(2) Small and Medium sized companies are defined as those companies with fewer than 500 employees, those with missing employment data,
nonemployers, and companies that reported annual payroll but did not report any employees on their payroll during specified period(s) in 2019.
(3) A 2-digit NAICS code is the most detailed NAICS available for some companies. A NAICS code such as “11X” implies that only 2 NAICS digits
have been defined (e.g, it is only know for certain that a company is classified within NAICS sector 11). “XXX” represents an unclassified company.
For information on partially defined NAICS codes, see the explanatory notes.
Note: This table is compiled using data from import trade information and the Business Register. For information on nonsampling
errors and other data limitations, see the explanatory notes.
51
i
Explanatory Notes
NOTE TO USERS: This section contains critical information on sources and reliability of data, as well as
definitions of terms and methodological procedures that users should consider before attempting to interpret or
analyze the statistical data presented in this report. Failure to do so may affect the results.
The Census Bureau has reviewed this data product for unauthorized disclosure of confidential information and
has approved the disclosure avoidance practices applied. (Approval ID: CBDRB-FY22-156)
Overview
This report is a continuing series of reports profiling U.S. importers and exporters. The first report, A Profile of
United States Exporters: Initial Findings from the Exporter Data Base, was released by the International Trade
Administration in September 1993. That report was based on Census Bureau data compiled both from the 1987
Economic Census and from documents filed for export clearances during 1987 and used a methodology not
employed in succeeding reports. Subsequent reports, covering 1992 through present, are based on economic
census and survey data on file at the Census Bureau, administrative records from other government agencies,
and documents filed for export clearances. The 2009 report introduced import data to the profile. The annual
release is now named the Profile of U.S. Importing and Exporting Companies.
These profiles are compiled by the Economic Statistical Methods Division of the U. S. Census Bureau. The
International Trade Administration (ITA) is a partial sponsor of the work, providing both financial assistance
and advice on data user needs. The ITA also sponsors more detailed tabulations, which will be available on their
website later this year. Users will be notified on the ITA website (http://trade.gov) when this information is
available.
Effective with the 1997/1998 report, companies are classified according to the North American Industry
Classification System (NAICS) instead of the Standard Industrial Classification (SIC) system. There are
differences in the ways NAICS and SIC classify certain types of companies. For example, manufacturers of
prepackaged software and books are classified as manufacturers under SIC and as “Other” types of companies
under NAICS. Users are advised to consider these differences when making year-over-year comparisons of
exporters and exporter characteristics before and after 1997. This profile, based on new and revised data, uses
the same methodology as previous years.
The importer and exporter profiles are developed to provide both government and private sector users with
information about the importing and exporting community including employment size, type of company, and
major foreign markets. In this report the data are presented in Tables 1 through 7, where the export and import
data use letters a through h to designate whether the data represents statistical year, prior year, or year-over-year
comparisons. Letters g and h represent data on companies that both import and export for current and prior year.
The previous year’s export figures in this report are revised from data released in the previous exporter profile.
The revisions are based on the ability to match additional export records.
The tables in this report include detailed breakdowns based upon the number of employees of the identified
importing and exporting companies. In presenting these results, companies are classified as small (less than 100
employees including number of employees unknown), medium (100 to 499 employees), and large (500 or more
employees).
Table 3 provides information on exports to related parties, such as parent or subsidiary firms. Two parties are
considered related if either party owns, directly or indirectly, 10 percent or more of the other party. We do not
currently capture related party information for imports entered into U.S. Foreign Trade Zones. As a result, the
import related party tables (3c and 3d) are not available at this time. Due to mandatory AES filing requirements,
ii
an exporter must report whether or not an export shipment is to a related party. Therefore, effective with the
2009/2010 report, the columns in tables 3a and 3b labeled “Non-reported” have been eliminated.
All percentages stated in this report, unless otherwise specified, were calculated based solely upon the statistical
and prior years’ import or export values that could be linked to specific active companies in the Business
Register--the “known value.” In addition, the source of the administrative records, the Business Register, was
restructured starting with 2002 data. For explanations of the methods used in tabulating the information as well
as non-sampling errors and other limitations of the export data in this report, see the Methodology section below.
Users are advised to consider these limitations when analyzing this information as they may affect the results.
Users should cite the U.S. Census Bureau, U.S. Department of Commerce as the source of the information in
this report, not as the source of their analyses.
Sources of Information
The importer and exporter profiles were created from import and export merchandise trade information and
company characteristics contained in the Census Bureau’s database of company information, the Business
Register. Company characteristics are gathered through economic censuses and surveys and supplemented with
employment and payroll information provided by the Internal Revenue Service. Data on U.S. exports of
merchandise from the U.S. to all countries, except Canada, is compiled from the Electronic Export Information
(EEI) filed by the United States Principal Party in Interest (USPPI) or their agents through the Automated Export
System (AES). The EEI is unique among Census Bureau data collection methods since it is not sent to
respondents soliciting responses as in the case of surveys. Each EEI represents a shipment of one or more kinds
of merchandise from one exporter to one foreign importer on a single carrier. Filing the EEI is mandatory under
Chapter 9, Title 13, United States Code. Qualified exporters or their agents submit EEI data by automated means
directly to the U.S. Census Bureau. The United States is substituting Canadian import statistics for U.S. exports
to Canada in accordance with a 1987 Memorandum of Understanding signed by the Census Bureau, U.S.
Customs and Border Protection, Canadian Customs, and Statistics Canada. The import trade statistics are
compiled from multiple sources. The majority of import data comes from transactions filed electronically by
importers or their licensed brokers via the Automated Broker Interface (ABI) or the Automated Commercial
Environment (ACE). Other sources include electronic or paper documents for foreign trade zone admission and
paper import entry summaries. In addition, data on imports of electricity and natural gas from Canada are
obtained from Canadian sources.
Methodology
This profile was compiled using company identifiers or company names from import and export transactions to
electronically or manually link trade data to company characteristics in the Business Register. Beginning with
data year 2002, the Business Register database was completely restructured to include additional information.
Due to these changes and problems with our prior methodology, the matching routines used to create the Profile
were updated. Despite the limitations within the Business Register, we are able to maintain consistency with our
prior Profiles’ matching routines.
Less than 3 percent of the total export value and slightly more than 3 percent of the import value, including low-
value estimates, imports or exports by U.S. and foreign governments, timing adjustments, and end-of-year
revisions, was excluded from this matching process because the transactions cannot be attributed to specific
importing or exporting companies. Export transactions that could not be matched electronically were
investigated and linked manually to specific companies using a combination of criteria, including company
name, location, type, and product. Import transactions that could not be matched electronically were left
unmatched. Unlike exports, all of the identifiers are numeric for imports, so the name matching investigations
used to increase the export match rates cannot be applied. A comparison of the overall match rates, based on
iii
total import and export value, is presented in Table 1 under Distribution of Exports and Imports by Identified
and Unidentified Companies, on page 7.
It was not possible to investigate every unmatched export transaction, so priority was given to those with the
highest export values. The percentage of unidentified value tends to decrease each year as more companies are
identified and value thresholds triggering investigation are lowered. Therefore, users should make year-to-year
comparisons with caution and be aware that the number of small companies and their associated known value
are most likely understated. Similarly, the known value may not reflect all shipments by identified companies.
Beginning with data year 2010, this profile is produced using the same revised import and export data used to
compile the Economic Indicator Division’s published U.S. International Trade in Goods and Services Annual
Revision for a given data year. The rows labeled “Revisions” will be removed from Table 1 under Distribution
of Exports and Imports by Identified and Unidentified Companies effective with the 2010/2011 report.
Data Quality
Quality assurance procedures were applied to all phases of collection, processing and tabulation of the
information in this report to minimize errors. The data continue to be subject to non-sampling errors in data
reporting (of the basic trade statistics and the administrative record source data), coding, keying, and in coverage
(due to failure to identify all importing and exporting companies). For an explanation of non-sampling errors
affecting the trade statistics, see the Information on Goods and Services section of the FT 900 U.S.
International Trade in Goods and Services, or call (301)763-2311 to request a copy of the release. One can also
obtain this information from the web at the following address: http://www.census.gov/ft900
The characteristics of importing and exporting companies in this report reflect companies that could be matched
to the Business Register. When analyzing these data, users should consider the possible impact of unmatched
transactions and unidentified companies on their results. Unidentified importers or exporters may not reflect the
same distribution of company types and sizes as identified companies. Similarly, comparisons between the
number of companies importing or exporting in given categories may be misleading due to differences in the
percentage of value matched to companies of various types and sizes.
Year-over-year comparisons should also be made with caution. Changes in the number of importers or exporters
and the value of their transactions, the known value, may be due to differences in match rates or companies
entering/dropping out of the import/export market. Table 1, under Distribution of Exports and Imports by
Identified and Unidentified Companies, at the beginning of this report shows a comparison of the match rates,
based on total value, as well as the value attributable to companies that either imported or exported in both years.
Each Table of the report is analyzed to determine if one or more companies’ trade values would be disclosed by
a particular known value. In cases where this is deemed true, a “D” will indicate that the known value was
suppressed as a result of this disclosure concern. In cases where the particular Table contains additive structures,
complimentary known values are suppressed to eliminate the possibility of calculating the known value of a
suppressed cell.
Data by State
The data contained in Tables 6a through 6c are based on the Origin of Movement (OM) State. The U.S. state of
origin is the 2-character postal code for the state in which the goods begin their journey to the port of export.
This field allowed the compilation of the Origin of Movement - Based on Origin State Series. The OM series
based on origin state has been available since 1987 and is intended to reflect the transportation origin of exports.
iv
The data contained in Tables 6d and 6e are based on the U.S. State of Destination. This is defined as the U.S.
state, U.S. territory or U.S. possession where the merchandise is destined, as known at the time of entry summary
filing. For shipments into Foreign Trade Zones, the import state represents the location of the zone.
For more complete information on the state data series, refer to the notice at: https://www.census.gov/foreign-
trade/statistics/state/index.html
NAICS-based Data
The North American Industrial Classification System (NAICS) is a two- through six-digit hierarchical
classification system, offering five levels of detail. Each digit in the code is part of a series of progressively
narrower categories, and the more digits in the code signify greater classification detail. The first two digits
designate the economic sector, the third digit designates the subsector, the fourth digit designates the industry
group, the fifth digit designates the NAICS industry, and the sixth digit designates the national industry.
NAICS information for a given company or establishment comes from a variety of governmental agencies. These
include the Internal Revenue Service (IRS), the Social Security Administration (SSA) and the Bureau of Labor
Statistics (BLS). These agencies collect information from companies and provide these data to the Census
Bureau to the best of their abilities. Generally, the U.S. Census Bureau's NAICS classification codes are derived
from information that the business establishment provided on surveys, census forms, or administrative records.
Occasionally, these codes can only be defined at a level of very low detail (as low as 2 digits).
For more information on NAICS, refer to the web at the following address: North American Industry
Classification System (NAICS) U.S. Census Bureau
Definitions of Terms
Business Register. Data base of companies included in economic census and surveys conducted by the Census
Bureau.
Company. A company is a business consisting of one domestic location (single location company) or more
than one domestic location (multiple location company) under its ownership or control.
Identified Companies: Identified companies are those companies to which one or more transactions
were matched. The import or export value associated with these companies is termed “known value.”
Unclassified Companies: These are identified companies for which no NAICS classification
(manufacturers, wholesalers or other companies) could be assigned. As of 2012, these companies will
be considered other companies.
Company Size. Company sizes are based on employment: small (less than 100 employees including number
of employees unknown), medium (100 - 499 employees), and large (500 or more employees).
Company Type. Company types are based on the North American Industry Classification System (NAICS)
and are broken out into manufacturers, wholesalers, and all other companies. Those companies for which
a valid NAICS code is not available are placed in the other grouping.
Employment. Employment includes all employees, full-time or part-time, reported on a firm’s payroll during specific payroll periods.
v
General Imports. "General Imports" measure the total physical arrivals of merchandise from foreign countries,
whether such merchandise enters consumption channels immediately or is entered into bonded warehouses
or Foreign Trade Zones under Customs custody.
Low-value Estimates. Export transactions valued under $2,501 and import transactions valued under $251 for
certain quota items and $2001 for all other imported goods, are not required to be reported. Instead, the
Census Bureau estimates the value of such shipments to each country using factors based on the ratios of
low-valued shipments to individual country totals for past periods. For more information please see the
following link: http://www.census.gov/foreign-trade/aip/lvpaper.html
Related Party. A related party transaction is one between a U.S. exporter and a foreign consignee, where either
party owns (directly or indirectly) 10 percent or more of the other party.
State of the Origin of Movement (OM). The OM series data provides export statistics based on the U.S. state
from which the merchandise starts its journey to the port of export; i.e., the transportation origin. This
information is reported by the exporter. See the Data Quality section above for limitations of this data
series.
State of Destination. The State of Destination data series provides import statistics based on the U.S. state,
U.S. territory or U.S. possession where the merchandise is destined, as known at the time of entry summary
filing. This information is reported by the importer. See the Data Quality section above for limitations of
this data series.
Value (Exports). The export values in this report are f.a.s. (“free alongside ship”) and include both domestic
exports and re-exports of foreign merchandise. Several different values are given:
Total export value: The total value includes all transactions whether or not linked to specific companies.
Known value: The value of transactions linked to specific companies. All percentages given for
company size and types are based on known value.
Unidentified Value: The valued transactions that were not linked to a specific company. Note that these
shipments might have been exported either by identified companies or by other companies not identified
in the linking process.
Value (Imports). The import values in this report are customs import value. The Customs value is the value
of imports as appraised by the U.S. Customs and Border Protection in accordance with the legal
requirements of the Tariff Act of 1930, as amended. This value is generally defined as the price actually
paid or payable for merchandise when sold for exportation to the United States, excluding U.S. import
duties, freight, insurance, and other charges incurred in bringing the merchandise to the United States. The
term "price actually paid or payable" means the total payment (whether direct or indirect, and exclusive of
any costs, charges, or expenses incurred for transportation, insurance, and related services incident to the
international shipment of the merchandise from the country of exportation to the place of importation in
the United States) made, or to be made, for imported merchandise by the buyer to, or for the benefit, of the
seller. The type of imports shown in this report is “general.” Please see the definition for “General Imports”
for more information. Several different values are given:
Total import value: The total value includes all transactions whether or not linked to specific companies.
vi
Known value: The value of transactions linked to specific companies. All percentages given for
company size and types are based on known value.
Unidentified Value: The valued transactions that were not linked to a specific company. Note that these
shipments might have been imported either by identified companies or by other companies not identified
in the linking process.
Country Groupings
Country groupings are defined at the time of the statistical reporting period. Therefore, country groupings may
have different definitions between years. Any differences are noted in the listing below.
Africa - Algeria, Angola, Benin, Botswana, British Indian Ocean Territories, Burkina Faso, Burundi, Cameroon,
Cabo Verde, Central African Republic, Chad, Comoros, Congo (Brazzaville), Congo (Kinshasa), Cote d'Ivoire,
Djibouti, Egypt, Equatorial Guinea, Eritrea, Eswatini, Ethiopia, French Southern and Antarctic Lands, Gabon,
Gambia, Ghana, Guinea, Guinea-Bissau, Kenya, Lesotho, Liberia, Libya, Madagascar, Malawi, Mali,
Mauritania, Mauritius, Mayotte, Morocco, Mozambique, Namibia, Niger, Nigeria, Reunion, Rwanda, Sao Tome
and Principe, Senegal, Seychelles, Sierra Leone, Somalia, South Africa, South Sudan, St. Helena, Sudan,
Tanzania, Togo, Tunisia, Uganda, Western Sahara, Zambia, Zimbabwe.
APEC (Asia - Pacific Economic Cooperation) - Australia, Brunei, Canada, Chile, China, Hong Kong, Indonesia,
Japan, Korea (South), Malaysia, Mexico, New Zealand, Papua New Guinea, Peru, Philippines, Russia,
Singapore, Taiwan, Thailand, Vietnam.
ASEAN (Association of Southeast Asian Nations) - Brunei, Burma, Cambodia, Indonesia, Laos, Malaysia,
Philippines, Singapore, Thailand, Vietnam.
Asia Near East - Bahrain, Gaza Strip Administered by Israel, Iran, Iraq, Israel, Jordan, Kuwait, Lebanon, Oman,
Qatar, Saudi Arabia, Syria, United Arab Emirates, West Bank Administered by Israel, Yemen.
Asia - South - Afghanistan, Bangladesh, India, Nepal, Pakistan, Sri Lanka.
CAFTA - DR (Dominican Republic-Central America-United States Free Trade Agreement) - Costa Rica,
Dominican Republic, El Salvador, Guatemala, Honduras, Nicaragua
Central American Common Market - Costa Rica, El Salvador, Guatemala, Honduras, Nicaragua.
Euro Area - Austria, Belgium, Cyprus, Estonia, Finland, France, Germany, Greece, Ireland, Italy, Latvia,
Lithuania, Luxembourg, Malta, Netherlands, Portugal, Slovakia, Slovenia, Spain.
Europe - Albania, Andorra, Armenia, Austria, Azerbaijan, Belarus, Belgium, Bosnia-Herzegovina, Bulgaria,
Croatia, Cyprus, Czech Republic, Denmark, Estonia, Faroe Islands, Finland, France, Georgia, Germany,
Gibraltar, Greece, Hungary, Iceland, Ireland, Italy, Kazakhstan, Kosovo, Kyrgyzstan, Latvia, Liechtenstein,
Lithuania, Luxembourg, Malta, Moldova, Monaco, Montenegro, Netherlands, North Macedonia, Norway,
Poland, Portugal, Romania, Russia, San Marino, Serbia, Slovakia, Slovenia, Spain, Svalbard, Jan Mayen Island,
Sweden, Switzerland, Tajikistan, Turkey, Turkmenistan, Ukraine, United Kingdom, Uzbekistan, Vatican City,
European Union - Austria, Belgium, Bulgaria, Croatia, Cyprus, Czech Republic, Denmark, Estonia, Finland,
France, Germany, Greece, Hungary, Ireland, Italy, Latvia, Lithuania, Luxembourg, Malta, Netherlands, Poland, Portugal, Romania, Slovakia, Slovenia, Spain, Sweden.
vii
LAFTA (Latin American Free Trade Area) - Argentina, Bolivia, Brazil, Chile, Colombia, Ecuador, Mexico,
Paraguay, Peru, Uruguay, Venezuela.
NATO (North Atlantic Treaty Organization) Allies - Belgium, Bulgaria, Canada, Czech Republic, Denmark,
Estonia, France, Germany, Greece, Hungary, Iceland, Italy, Latvia, Lithuania, Luxembourg, Netherlands,
Norway, Poland, Portugal, Romania, Slovakia, Slovenia, Spain, Turkey, United Kingdom.
NICS (Newly Industrialized Countries) - Hong Kong, Korea (South), Singapore, Taiwan.
North America - Canada, Mexico
OECD (Organization for Economic Cooperation and Development) - Australia, Austria, Belgium, Canada,
Chile, Czech Republic, Denmark, Estonia, Finland, France, Germany, Greece, Hungary, Iceland, Ireland, Israel,
Italy, Japan, Korea (South), Luxembourg, Mexico, Netherlands, New Zealand, Norway, Poland, Portugal,
Slovakia, Slovenia, Spain, Sweden, Switzerland, Turkey, United Kingdom.
OPEC (Organization of the Petroleum Exporting Countries) - Algeria, Angola, Congo (Brazzaville),
Ecuador, Equatorial Guinea, Gabon, Iran, Iraq, Kuwait, Libya, Nigeria, Saudi Arabia, United Arab Emirates,
Venezuela.
Pacific Rim Countries - Australia, Brunei, China, Hong Kong, Indonesia, Japan, Korea (South), Macau,
Malaysia, New Zealand, Papua New Guinea, Philippines, Singapore, Taiwan.
South/Central America - Anguilla, Antigua and Barbuda, Argentina, Aruba, Bahamas, Barbados, Belize,
Bermuda, Bolivia, Brazil, British Virgin Islands, Cayman Islands, Chile, Colombia, Costa Rica, Cuba, Curacao,
Dominica, Dominican Republic, Ecuador, El Salvador, Falkland Islands (Islas Malvinas), French Guiana,
Grenada, Guadeloupe, Guatemala, Guyana, Haiti, Honduras, Jamaica, Martinique, Montserrat, Nicaragua,
Panama, Paraguay, Peru, St. Kitts and Nevis, Sint Maarten, St. Lucia, St. Vincent and the Grenadines, Suriname,
Trinidad and Tobago, Turks and Caicos Islands, Uruguay, Venezuela.
Twenty Latin American Republics - Argentina, Bolivia, Brazil, Chile, Colombia, Costa Rica, Cuba,
Dominican Republic, Ecuador, El Salvador, Guatemala, Haiti, Honduras, Mexico, Nicaragua, Panama,
Paraguay, Peru, Uruguay, Venezuela.
Additional Information
For additional information, refer to the Guide to Foreign Trade Statistics: https://www.census.gov/foreign-
trade/guide/index.html