a physically-based parsimonious hydrological model for flash floods in mediterranean catchments
TRANSCRIPT
Nat. Hazards Earth Syst. Sci., 11, 2567–2582, 2011www.nat-hazards-earth-syst-sci.net/11/2567/2011/doi:10.5194/nhess-11-2567-2011© Author(s) 2011. CC Attribution 3.0 License.
Natural Hazardsand Earth
System Sciences
A physically-based parsimonious hydrological model for flash floodsin Mediterranean catchments
H. Roux1,2, D. Labat1,2,3, P.-A. Garambois1,2, M.-M. Maubourguet 1,2, J. Chorda1,2, and D. Dartus1,2
1Universite de Toulouse, INPT, UPS, IMFT (Institut de Mecanique des Fluides de Toulouse), Allee Camille Soula,31400 Toulouse, France2CNRS, IMFT, 31400 Toulouse, France3LMTG-Universite de Toulouse-CNRS-IRD-OMP, 14 Avenue Edouard Belin, 31400 Toulouse, France
Received: 2 June 2010 – Revised: 17 June 2011 – Accepted: 20 June 2011 – Published: 27 September 2011
Abstract. A spatially distributed hydrological model, dedi-cated to flood simulation, is developed on the basis of phys-ical process representation (infiltration, overland flow, chan-nel routing). Estimation of model parameters requires dataconcerning topography, soil properties, vegetation and landuse. Four parameters are calibrated for the entire catchmentusing one flood event. Model sensitivity to individual param-eters is assessed using Monte-Carlo simulations. Results ofthis sensitivity analysis with a criterion based on the Nash ef-ficiency coefficient and the error of peak time and runoff areused to calibrate the model. This procedure is tested on theGardon d’Anduze catchment, located in the Mediterraneanzone of southern France. A first validation is conducted usingthree flood events with different hydrometeorological char-acteristics. This sensitivity analysis along with validationtests illustrates the predictive capability of the model andpoints out the possible improvements on the model’s struc-ture and parameterization for flash flood forecasting, espe-cially in ungauged basins. Concerning the model structure,results show that water transfer through the subsurface zonealso contributes to the hydrograph response to an extremeevent, especially during the recession period. Maps of soilsaturation emphasize the impact of rainfall and soil proper-ties variability on these dynamics. Adding a subsurface flowcomponent in the simulation also greatly impacts the spatialdistribution of soil saturation and shows the importance ofthe drainage network. Measures of such distributed variableswould help discriminating between different possible modelstructures.
Correspondence to:H. Roux([email protected])
1 Introduction
Flash floods are defined as sudden floods with high peak dis-charges produced by severe thunderstorms that are generallyof limited area extent (IAHS-UNESCO-WMO, 1974). Theyrepresent one of the most destructive hydrological hazards inthe Mediterranean region and have caused billions of eurosof damages in France over the last two decades (Gaume etal., 2004). Flash flood prediction and risk assessment stilllack efficient procedures, mainly because these events arepoorly monitored and understood (Marchi et al., 2010). Ef-fectively, this kind of hydrological event is often concernedwith poorly gauged small catchments. Moreover, hydromet-ric stations are vulnerable to destruction or damage in case offlooding and the data flow continuity requirement may not besatisfied. Gaume et al. (2009) and Gaume and Borga (2008)also point out that flash floods are poorly documented phe-nomena and propose a methodology to increase the existingknowledge of such events using post-flood surveys.
In the Mediterranean climatic zone, precipitation is highlyvariable, both in time and space, and this variability increaseswith elevation in mountainous regions (Moussa et al., 2009).Norbiato et al. (2007) studied a flash flood generating stormoccurring in the eastern Italian Alps in August 2003 andfound extreme spatial gradients up to 80 mm km−1 in pre-cipitation accumulations on 12 h. As a consequence, hydro-logical processes are also highly variable and therefore diffi-cult to predict (Moussa et al., 2009). Intense, short-durationprecipitation rates usually cause flash flood events primarilydominated by overland flow (Gaume et al., 2003).
Modeling the hydrological response of Mediterraneancatchments has been explored by several authors who em-phasized the importance of the topic. Pinol et al. (1997)
Published by Copernicus Publications on behalf of the European Geosciences Union.
2568 H. Roux et al.: A physically-based parsimonious hydrological model for flash floods
applied TOPMODEL to simulate the hydrological responseof two catchments located in northeastern Spain. The authorsemphasized that the major difficulties encountered for suchcatchments consists in the spatial soil depth heterogeneity aswell as the characteristics and the localized nature of down-slope flows of water in the soil. They also pointed out thatmodels with very large numbers of parameters would not beeasy to calibrate. Several other applications of TOPMODELin the Mediterranean environment have already been made(Datin, 1998; Durand et al., 1992; Saulnier, 1996; Saulnierand Le Lay, 2009), and lead to promising results even thoughimprovements are needed in modeling wetting-up periods orextreme storm events. Moussa et al. (2009) proposed a spa-tially distributed model based on simplified physical processrepresentations of the water cycle and flood genesis. Thismodel is well adapted to event-based simulations of floodswhen surface runoff is the main hydrological process. How-ever, their results show that when the calibrated model pa-rameters were constrained to simulate intense flood events,then the model’s performance decreased during years withlow rainfall rates. Thus the question arises of the domainand limit of application of the model. It seems difficult towell represent hydrological processes during both droughtand flood periods.
Bloschl et al. (2008) developed a distributed flood fore-casting system that they evaluated over the 622 km2 Kampcatchment (Austria). They adopted a modeling strategybased on (i) a model structure defined at the model elementscale and (ii) multi-source model identification and verifica-tion. Within the proposed model structure, the adjustment of21 parameters for each pixel, 6 routing parameters for eachcatchment and 7 stream routing parameters for each riverreach is required. On the studied catchment, there was a to-tal of 1550 pixels, 12 sub-catchments and 10 stream reaches.The authors relied on the interpretability of model parame-ters and on their multi-source model identification procedureto facilitate the estimation of model parameters in a realisticway. In their study, they used runoff data along with spa-tial data including piezometric heads or inundation patterns,both from satellite and ground-based data. However, theseare not easily available data and they might not be accessiblein the case of poorly-gauged catchments. The study of Reedet al. (2007) was flash flood forecasting dedicated, too: theirmodel produces high-resolution grids of peak flow forecastfrequencies during rainfall events. Forecasters can thereforecompare these grids to locally derived threshold frequencygrids to aid in warning decisions. Their model can be imple-mented using any continuous simulation distributed hydro-logic model. However, if this approach can be helpful forreal time forecasting, it doesn’t lead to any improvement onthe understanding of flash flood hydrological processes.
In this study, rather than adopting directly an existingmodel and simply going through a calibration/validationexercise, we propose an approach based on building thestructure of the model using the understanding of the
LATERALTRANSFERS
VERTICALFLUXES
Initial soilwater content
WATERSHED
HillslopeFlow pathway
Drainage network
D.E.M.
Surface roughness
Vegetation and land useSoil survey
Hydraulic conductivitySaturated water content
Soil suctionSoil thickness
Drainage network flow*
Output hydrographs*Distributed ouput variables
EVENT
Rainfall
Distributed input data
Subsurface flow*Infiltration*
Surface runoff* Overland flow*
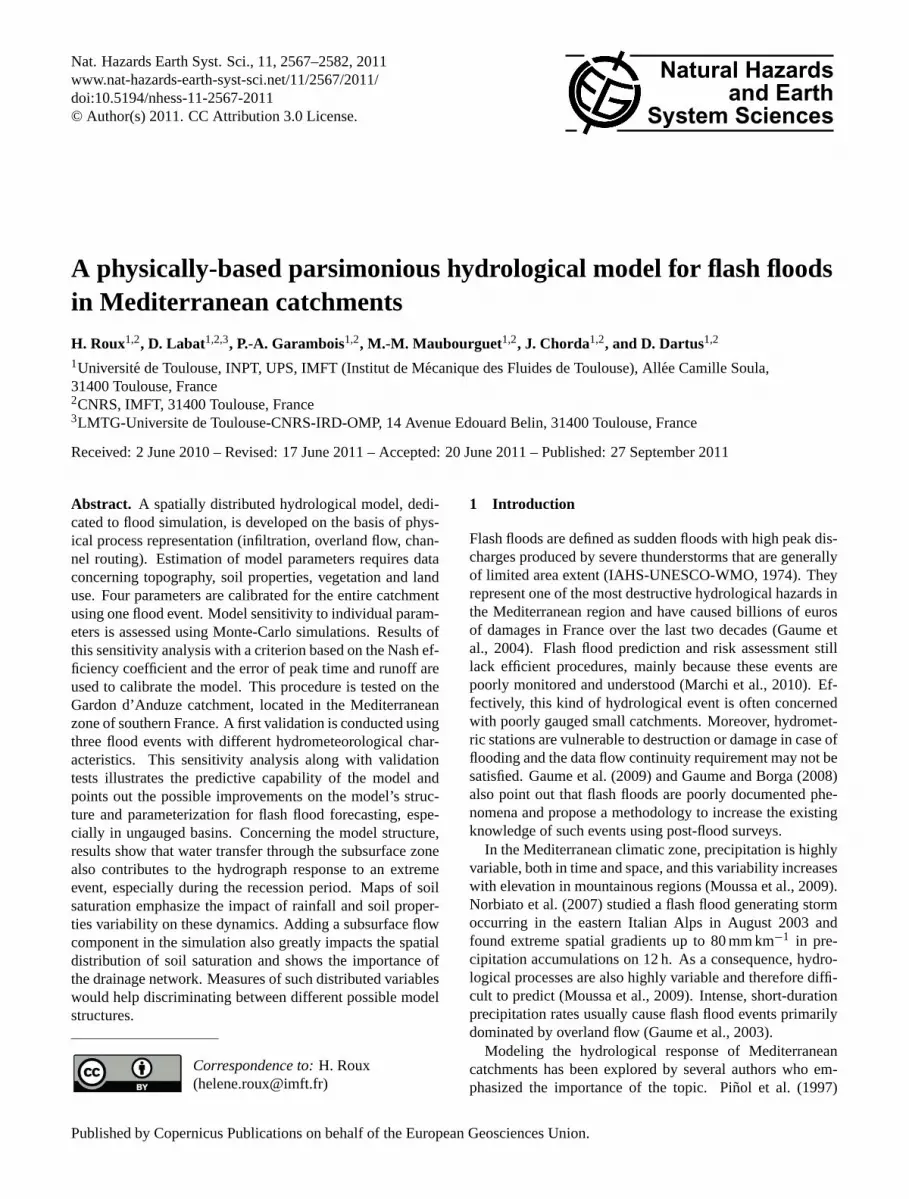
Fig. 1. MARINE model structure.
Mediterranean catchments’ hydrological processes. The hy-drological rainfall-runoff model MARINE (Modelisation del’Anticipation du Ruissellement et des Inondations pour deseveNements Extremes) introduced in this paper aims at (i)exploiting the potential of distributed models (ii) using phys-ically meaningful parameters while (iii) maintaining a simpleand parsimonious parameterization. The present paper ex-plains the overall structure and methodology of the MARINEmodel, the infiltration, the subsurface and surface runoff cal-culation, the data requirements and the model calibrationprocedure. The MARINE model is applied to the Gardond’Anduze basin (southern France) to clarify the model dataand calibration requirements together with its flood forecast-ing capabilities. In the present study, water transfer throughthe subsurface zone was first assumed too slow to contributeto the hydrograph response to an extreme rainfall event andtherefore the MARINE model was run without activation ofthe subsurface lateral flow component. In a second step, theimpact of including it in the modeling is discussed.
2 Structure and methodology of the MARINE model
The modeling approach followed herein consists in buildinga distributed model for flash flood forecasting. The predomi-nant factor determining the formation of runoff is representedby the topography: slope and downhill directions. MARINEruns on a fixed time step and is structured into three mainmodules (Fig.1). The first module allows separating theprecipitation into surface runoff and infiltration; the secondmodule represents subsurface downhill flow, and the thirdone the overland and channel flows: the transfer functioncomponent allows routing the rainfall excess to the catch-ment outlet using different approximations of Saint-Venantequations. Both infiltration excess and saturation excessare represented within MARINE. The spatial discretizationof the catchment is performed using the Digital ElevationModel grid resolution, a regular grid of squared cells. Evap-otranspiration is not represented since the model’s purpose
Nat. Hazards Earth Syst. Sci., 11, 2567–2582, 2011 www.nat-hazards-earth-syst-sci.net/11/2567/2011/
H. Roux et al.: A physically-based parsimonious hydrological model for flash floods 2569
was to simulate individual flood events during which suchprocess is negligible.
The model simulates the flood hydrograph at any point ofthe drainage network. It is also possible to follow the evolu-tion of the distributed variables such as soil moisture or over-land flow velocities all over the catchment. A description ofeach procedure is detailed hereafter.
2.1 Infiltration
Local scale infiltration is described assuming one-dimensional flow to occur into independent, verticallyhomogeneous soil columns using the Green and Amptmodel. Infiltration rate is equal to rainfall intensity as longas rainfall intensity doesn’t exceed potential infiltration rate.When rainfall rate exceeds the infiltration rate, pondingoccurs (Gourley and Vieux, 2006).
The infiltration ratei (m s−1) is given at the local scale by:
i (t)=
{r (t) t ≤ tp
K(1+ψ
θs (1−θi )I (t)
)t > tp
(1)
wherer is rainfall rate (m s−1), tp is time to ponding (s),K is the saturated hydraulic conductivity (m s−1), ψ is thesoil suction at wetting front (m),θ s and θ i are saturatedand initial water contents (m3 m−3) respectively andI isthe cumulative infiltration (m).I is calculated from rainfallrates accumulated over time andi(t) andI (t) are related by:i (t)=
dI(t)dt
.Infiltration stops when soil water contentθ (m3 m−3) ex-
ceeds saturated water contentθ s .
2.2 Subsurface flow
The subsurface model is based on Darcy’s law. Using fre-quently invoked assumptions, (i) the slope of the water ta-ble in the saturated zone is assumed to coincide with localtopographic slope, (ii) the local transmissivity is an expo-nential function of the local storage deficit (Original TOP-MODEL assumption, Beven and Kirkby, 1979), the flow perunit widthq is expressed as:
q(t)= T0exp
(θs−θ
m
)tanβ (2)
whereT0 is the local transmissivity of fully saturated soil(m2 s−1), θ s and θ are saturated and local water contents(m3 m−3),m is transmissivity decay parameter (–), andβ islocal slope angle (rad). When soil water reaches the drainagenetwork, it is assumed that the flow into the drainage networkoccurs with a velocity calculated using Eq. (2).
This subsurface model represents the horizontal flow inthe unsaturated zone which usually occurs in a layer of lim-ited thickness and with high hydraulic conductivity due tothe preferential flow paths and macroporosity (Ciarapica andTodini, 2002).
WD
HD
DSfloodplain slope
network reach width
network reach depth
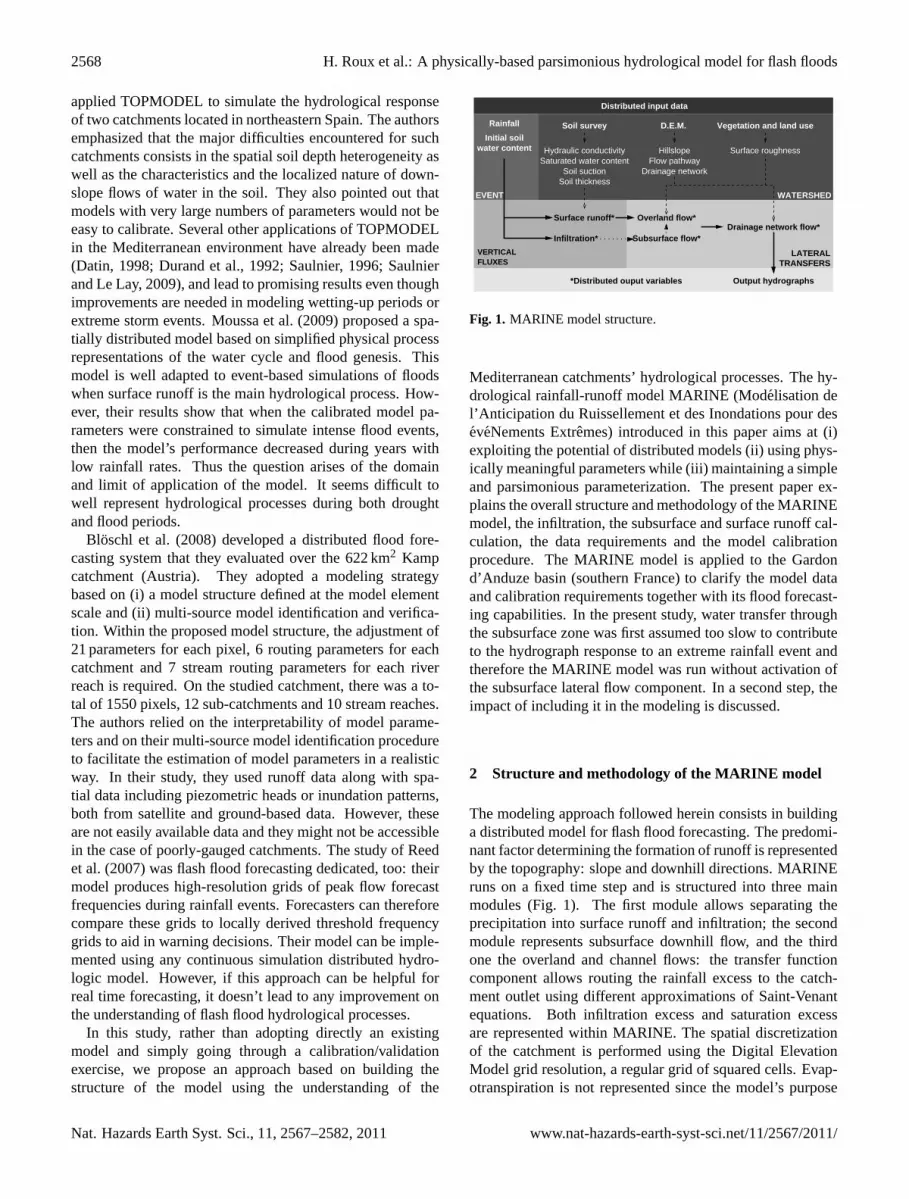
Fig. 2. Geometry of the network reach cross-section.
2.3 Surface water
The surface runoff calculation is divided into two parts: theoverland flow and the flow along the drainage network. Bothare simulated using the 1-D kinematic wave approximationof the Saint-Venant equations with the Manning friction law.
2.3.1 Overland flow
To represent the overland flow, it is assumed that conditionshold for the application of the kinematic model. The one-dimensional water mass balance equation for the overlandflow along a uniform slope is described as follows:
∂h
∂t+∂ (uh)
∂x= r− i (3)
whereh is water depth (m),t is time (s),u is overland flowvelocity (m s−1), x is space variable (m),r is rainfall rate(m s−1), andi is infiltration rate (m s−1). In the kinematicwave analogy, the momentum equation reduces toS0 = Sf ,whereS0 stands for bed slope (m m−1) andSf for energygradient line (m m−1). The Manning friction law provides arelationship between flow depthh and flow velocityu:
u=S
1/20
noh2/3 (4)
whereno is the Manning roughness coefficient (m−1/3 s).Along with the mass conservation Eq. (3), this law allowssimulating the overland flow:
∂h
∂t+S
1/20
no
5
3h2/3∂h
∂x= r− i (5)
The forcing function on the right hand side of Eq. (5) ex-presses the rainfall excess that is the difference between therainfall rate and the soil infiltration rate. Soil infiltration istreated by the Green and Ampt equation as explained above.
2.3.2 Drainage network
When the drainage area becomes greater than 1 km2, theoverland flow is structured in a drainage network. Flow inthis drainage network is simulated using the kinematic wave
www.nat-hazards-earth-syst-sci.net/11/2567/2011/ Nat. Hazards Earth Syst. Sci., 11, 2567–2582, 2011
2570 H. Roux et al.: A physically-based parsimonious hydrological model for flash floods
C6 Sandyclay loam
C4LoamC5
Silt loam
C12Silt
C3Sandy loam
C8 Siltyclay loam
Silty clayC10
C11Clay
C7Clay loam
0
10
20
30
90
80
70
60
50
40
100
0 10010 20 30 40 90807050 60
C9Sandy clay
C2Loamy sand
C1Sand
% Sand
% C
lay
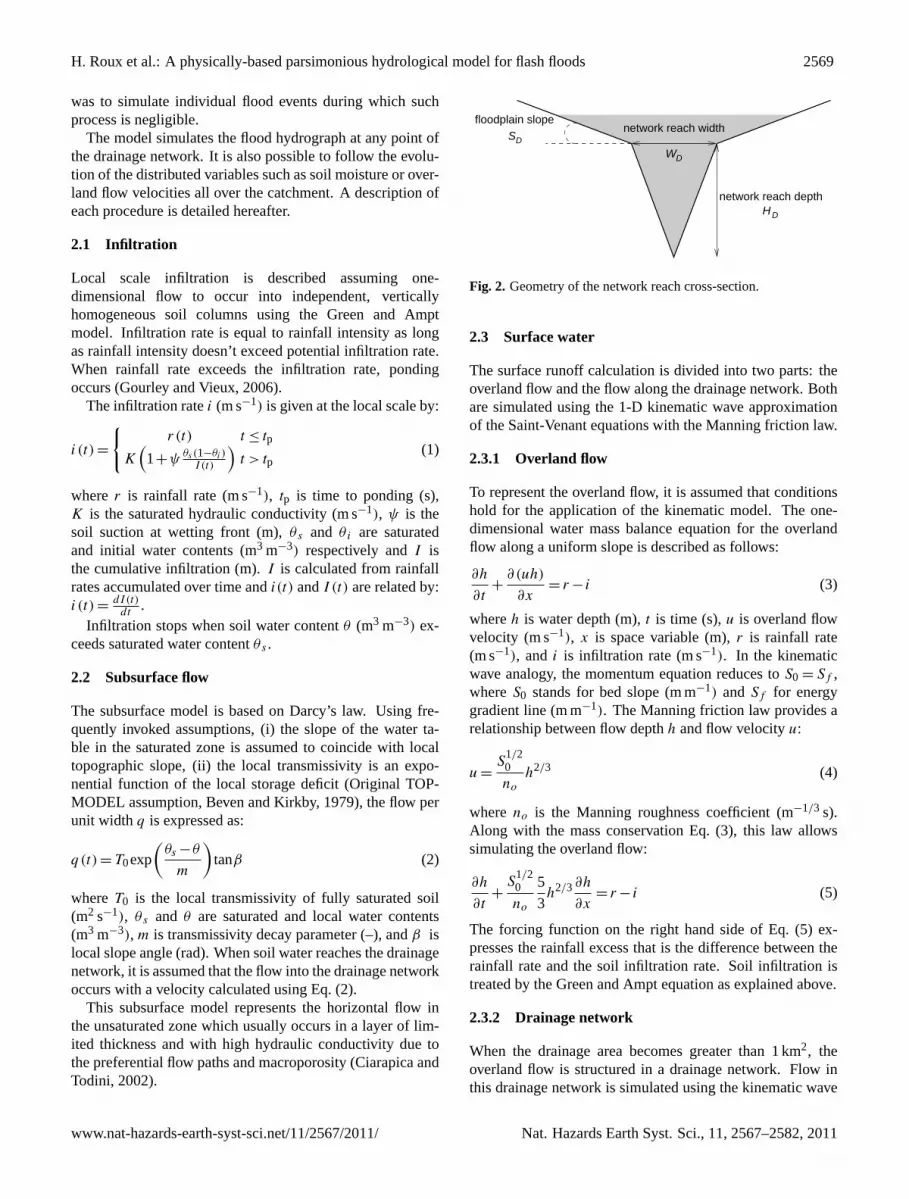
Fig. 3. Soil texture triangle (Rawls et al., 1992).
approximation by taking into account the width of the net-work reach. A hypothesis is made on the network reachcross-section geometry (Fig.2). This leads to a new trans-port equation in the drainage network. Characteristics of thenetwork reach are calculated using geomorphological con-siderations (Liu and Todini, 2002): network reach widthWDiand depthHDi are taken to increase as a function of the areadrained by theith cell, such that :
WDi =WDmax+
(WDmax−WDmin√
atot−√ath
)(√adi −
√atot)
HDi =HDmax+
(HDmax−HDmin√
atot−√ath
)(√adi −
√atot) (6)
whereWDmax is the maximum width at the basin outlet,WDmin is the minimum width, corresponding to the thresholdarea estimation of Giannoni et al. (2000)ath=1 km2, whichis the minimum upstream drainage area required to initiate achannel,atot is the total area andadi is the area drained bytheith cell.
3 Parameter description and data requirements
Parameterization of the MARINE model and the required in-put data to run the MARINE model without activation of thesubsurface lateral flow component are described below.
3.1 Parameter description
On each cell, the model needs the following parameters: (i)5 parameters for the estimation of the surface runoff and in-filtration, namely the saturated hydraulic conductivityK, thesaturated and initial water contentsθ s andθ i , the soil suctionat wetting frontψ , and the soil thicknessZ, (ii) 2 parametersfor the calculation of overland flow if the cell is not in thedrainage network, namely the local slopeS0 and the surface
roughnessno, (iii) 6 parameters for the transfer function inthe drainage network, namely the hillslopeS0, the depthHD,the widthWD and the cross-sectional slopeSD of the networkreach, and two roughness coefficientsnD1 andnD2 (river bedand flood plain Manning coefficient). Coefficientno variesfrom 0.03 up to 0.1 m−1/3 s andnD1 varies from 0.025 upto 0.05 m−1/3 s. Hence the model needs 7 parameters for ahillslope cell and 11 parameters for a cell in the drainage net-work. Most of these parameters can be estimated using infor-mation on topography, soil and land cover as explained laterin Sects. 3.2 and 4. When a separate modeling of the channelhydrodynamic is required, that is to say when the kinematicwave assumption doesn’t hold in the river (Moussa and Boc-quillon, 1996), the mass transfer model requires more knowl-edge about the geometric characteristics of the river (crosssections geometry, roughness, hydraulic structures).
3.2 Data requirements
The MARINE model requires field data, usually from Dig-ital Elevation Models (DEM), soil survey and vegetation orland-use, as well as precipitation measurements. The DEMapplication consists in identifying connections between cells,thereby giving the catchment extent and the flow pathways,calculating the hillslope and cumulating the drainage area fordetecting the drainage network and calculating the geomet-ric characteristics of the network reaches. In the MARINEmodel, as in many rainfall-runoff models (Liu and Todini,2002), drainage is only possible along the cardinal directionsfor the four adjacent cells at each edges. The overbank cross-sectional slopesSD of each network reach are also derivedfrom the DEM. TheSD parameter is approximated by theslope between the cell in the network reach and the neigh-bouring cells in the catchment.
Soil surveys, provided by INRA and BRGM, allow de-riving soil texture and thickness. Soils are assumed to bevertically homogeneous. According to the soil texture, aRawls and Brakensiek (1983) soil class is assigned to eachcell (Fig.3). For each soil class, the estimated values for theGreen and Ampt front suction, saturated hydraulic conduc-tivity and porosity are determined according to the results ofRawls and Brakensiek (1983). The vegetation and land-usemap (2000 Corine Land Cover: Service de l’Observation etdes Statistiques) is used to derive distributed surface rough-ness (Chow, 1959).
4 Model calibration and formulation of calibrationcriteria
The chosen approach for model calibration and validationfollowed by the sensitivity analysis procedure is describedin the following section.
Nat. Hazards Earth Syst. Sci., 11, 2567–2582, 2011 www.nat-hazards-earth-syst-sci.net/11/2567/2011/

H. Roux et al.: A physically-based parsimonious hydrological model for flash floods 2571
Fig. 4. Gardon d’Anduze river basin and elevations (m).
4.1 Estimated parameters and calibration procedure
Parameterization and calibration is a crucial issue for hydro-logic models. As it is physically based, the MARINE modelcan take advantage of the information on topography, soilcharacteristics and land cover for parameter estimation. Inorder to avoid a model over-parameterization, the number ofparameters to estimate was kept as low as possible. Accord-ing to Refsgaard’s (1997) recommendations, this can be doneby fixing a spatial pattern of a parameter and allowing its ab-solute value to be modified by calibration. This approachhas been chosen for two parameters, namely the distributedsaturated hydraulic conductivitiesK and soil thicknessesZ.The spatial patterns of these parameters are derived fromsoil surveys and a unique coefficient of correction is thenapplied to each parameter map. The calibration procedureconsisted in estimating (i) these two coefficients of correc-tion: one for the saturated hydraulic conductivities, namedCK and the other one for the soil thicknesses, namedCZ, (ii)the overbank roughness of the drainage networknD2, (iii)the initial soil saturation conditionθ i . The choice of thesecalibration parameters followed observations made during afirst calibration process carried out manually using a trial-and-error procedure. As a matter of fact, the model was notvery sensitive to some parameters, especially to both otherroughness coefficientsno (surface roughness) andnD1 (mainchannel roughness of the drainage network), therefore theywere chosen according to vegetation and land-use informa-tion andnD1 was kept constant all over the catchment. Theestimation ofCK ,CZ andnD2 has been implemented for oneflood event and then, as a validation procedure, the estimatedvalues were used to simulate other events that occurred in thesame catchment. The initial soil saturation conditionθ i hadto be set for each event. Eventually, only four parametersneeded to be calibrated for the whole catchment.
Calibration of the MARINE model has more to do with anadjustment than with a conventional calibration and couldhave been carried out by a simple trial-and-error method.However, in order to be able to qualify model outputs, thechosen procedure was to achieve Monte-Carlo simulationsto derive the sensitivity of the model to individual parame-ters and to determine a calibrated parameter set defined asthe set giving the best simulated hydrograph according to achosen criterion. Calibration criterion and sensitivity analy-sis procedure are introduced in the following paragraphs.
4.2 Model performance criterion and sensitivityanalysis
The first step of the sensitivity analysis consists in the def-inition of a likelihood measure intended as an evaluation ofhow well the model conforms to the observed system behav-ior. The possibility of including various types of criteria intothe likelihood measure makes the concept attractive for eval-uating reliability in flood extent modeling, as demonstratedin several examples (Aronica et al., 1998, 2002; Romanowiczand Beven, 2003; Werner, 2004). Well known performancecriterion functions have been used to build a criterion evalu-ating the performance of the MARINE model: it consists ina linear combination of the efficiency coefficient (Nash andSutcliffe, 1970) and the error of peak time and runoff (Leeand Singh, 1998):
LNP=1
3×
1−
N∑i=1
(Qsi −Q
oi
)2N∑i=1
(Qoi −Q
o)2+
1
3× (7)
(1−
∣∣QsP−Qo
P
∣∣Qo
P
)+
1
3×
(1−
∣∣T sP −T oP
∣∣T oC
)whereN is the number of observation data,Qs andQo arerespectively the simulated and the observed runoff,Qs
P andQo
P are respectively the simulated and observed peak runoff,T sP andT oP are respectively the simulated and observed timeto peak,T oC is the time of concentration of the catchment.The error of peak time and runoff is designed to aid in warn-ing decisions in emphasizing peak flow characteristics. Thatis one of the attractive aspects of this method: in formulatingthe likelihood measure, explicit thought must be given to howmodel performance is assessed in the light of model applica-tion. ThisLNP criterion is therefore an attempt to conciliatereal time flood forecasting requirements with a better under-standing of the physical phenomena involved in flood eventgeneration. It has been calculated only for specific observeddischargesQo greater than 0.3 m3 s−1 km−2 at the Anduzestation since the aim was to focus on reproducing extremeevents and very high flows. Therefore, smaller dischargeswere neglected in the evaluation of the goodness of simu-lated hydrographs.
www.nat-hazards-earth-syst-sci.net/11/2567/2011/ Nat. Hazards Earth Syst. Sci., 11, 2567–2582, 2011

2572 H. Roux et al.: A physically-based parsimonious hydrological model for flash floods
In order to derive the sensitivity of the model to individ-ual parameters, Monte-Carlo simulations were achieved byrunning the model with different randomly chosen sets of pa-rameter values. Initial range of parameter values to be con-sidered is selected with the intent of preserving physicallyrealistic parameter values. Uniform parameter distributionswithin their range of variation are mainly used in lack of priorinformation. Each set of parameter values is then assigned alikelihood of being a simulator of the system, on the basis ofthe chosen likelihood measure (Eq. 7).
5 Model implementation on the Gardon d’Anduzeriver basin
Since its advent in 2000, the MARINE model has been ap-plied to several catchments for uses such as flood forecast-ing or extreme flood analysis. For instance, it has been im-plemented on the Thore river (Goutorbe et al., 2002) andon the Orbieu river (Estupina-Borrell et al., 2006) for de-veloping a real time flood forecasting system. Castaingset al. (2009) provide an example of MARINE model ap-plication for extreme flood analysis. A case study ap-plying the MARINE model to the Gardon d’Anduze riveris presented in details below. The Gardon catchment ispart of a hydrological rainfall runoff model intercompari-son project for flood forecasting called BVNE (Bassins Ver-sants Numeriques Experimentaux) lead by the French centralhydrometeorological service for flood forecasting (SCHAPI)(Tanguy et al., 2005).
5.1 Catchment characteristics
The Gardon d’Anduze river is located in southern France,70 km northeast of the city of Montpellier. The catchmentdrains an area of 545 km2. The river flows in a southeastdirection to the confluence with the Rhone river. Over itscourse, the Gardon d’Anduze river is joined by tributaries in-cluding the Gardon de Sainte Croix, Gardon de Mialet andGardon de Saint Jean (Fig.4). The river water course hasa total length of approximately 50 km. Local climatic ten-dencies produce the highest flooding risk in autumn withthe maximum rainfall rate in this period. Summers are hotand dry; however summer storms can also present a non-negligible flooding risk. TheWDmin parameter (Eq. 6) isequal to the nearest value of drain width corresponding tointermittent flow process in the region and is set to one meteraccording to field observation. Field observations also led usto propose thatWD varies from 1 m to 30 m, andHD variesfrom 0.1 m up to 2 m.
5.1.1 Topography
The catchment has a highly marked topography consistingof mountain peaks, narrow valleys and steep hillslopes. The
Fig. 5. Maps of(a) soil thicknesses (m) and(b) Rawls and Braken-siek soil classes (3 = sandy loam, 4 = loam, 7 = clay loam, 12 = silt)on the Gardon d’Anduze catchment.
highest areas are found in the Cevennes, where the eleva-tion rises till 1200 m a.s.l. near the mount Aigoual. Theriver basin elevation at Anduze is approximately 130 m. ADEM data file of the study site with a grid scale of 50 m wasavailable from the National Geographic Institute (IGN – BDTOPO®) (Fig.4). The mean slope of the whole river basinis approximately 20 %.
5.1.2 Soils
About 64 % of the catchment area develops on metamorphicterrain. The substrate is made of shale and crystalline rocksoverlain by silty clay loams – on 83 % of the area – and sandyloam top soil (Moussa and Chahinian, 2009). Soil thick-nesses and Rawls and Brakensiek soil classes were availablefrom the BDSol-LR (Robbez-Masson et al., 2002) (Fig.5).Soil classes allow the determination of saturated hydraulicconductivities, saturated water contents and soil suctions.
Nat. Hazards Earth Syst. Sci., 11, 2567–2582, 2011 www.nat-hazards-earth-syst-sci.net/11/2567/2011/

H. Roux et al.: A physically-based parsimonious hydrological model for flash floods 2573
X (m)
Y(m
)
7.00E+05 7.10E+05 7.20E+05 7.30E+051.89E+06
1.90E+06
1.91E+0625020015010050
1994/09/24 07hUTCMax : 291.4 mm
X (m)
Y(m
)
7.00E+05 7.10E+05 7.20E+05 7.30E+051.89E+06
1.90E+06
1.91E+06
35030025020015010050
1995/10/15 07hUTCMax : 396.9 mm
X (m)
Y(m
)
7.00E+05 7.10E+05 7.20E+05 7.30E+051.89E+06
1.90E+06
1.91E+06
30025020015010050
2000/09/29 22hUTCMax : 337.1 mm
X (m)
Y(m
)
7.00E+05 7.10E+05 7.20E+05 7.30E+051.89E+06
1.90E+06
1.91E+06
800700600500400300200100
2002/09/09 17hUTCMax : 841.2 mm
Fig. 6. Total cumulated rainfall (mm), events of 1994, 1995, 2000 and 2002.
5.1.3 Vegetation and land use
Vegetation is dense and mainly composed of chestnut trees,pasture, Holm oaks, conifers, waste land and garrigue.Chestnut trees are located in the upstream area and on thesouth-facing slopes (sunny sides or adret) while forested gar-rigues and Holm oaks are located in the downstream area andon the north-facing slopes (shady sides or ubac). A vegeta-tion and land-use map (2000 Corine Land Cover providedby the Service de l’Observation et des Statistiques (SOeS) ofthe French Ministry of Environment,www.ifen.fr) was usedto derive distributed surface roughnesses.
5.2 Hydrometeorological data availability
Radar rainfall measurements combined with rain gauge datahave been available since 1994, with a 6 min time step from1994 to 2001, and 5 min since 2002. Measurement grid spa-tial resolution is 1 km by 1 km. Several floods have been ex-perienced in this catchment since 1994. Four events, occur-ring in 1994, 1995, 2000 and 2002, were retained accordingto their representativeness of the various hydrological behav-iors observed in the basin. The flood of 2002 is an excep-tional event with a return period of more than 50 yr. Thismaximal water level at Anduze has been exceeded in 1907and 1958. The events of 1994, 1995 and 2000 are medium
ones but the flood of 1994 is the consequence of two distinctrainfall events separated by a 30-h interval while the flood of1995 occurred in October. October often presents high soilmoisture, but it also occurs that the first rain after summertakes place in November. The total rainfalls range between187 mm for the flood of 1995 and 297 mm for the flood of2002, the runoff coefficients – that is to say the ratio of totalstreamflow volume to the total precipitation over the catch-ment area for the considered event - between 24 % for theflood of 2000 and 48 % for the flood of 1995 and the maxi-mum discharges between around 800 m3 s−1 for the flood of1994 and around 3600 m3 s−1 for the flood of 2002. Charac-teristics of the studied flood events are summarized in Table1and total cumulated rainfalls are shown in Fig.6.
6 Model calibration and validation
6.1 Sensitivity analysis and model calibration
Sensitivity analysis was achieved on two flood events: the in-termediate flood of 1994 and the exceptional flood of 2002.The aim was to compare the model sensitivity to individualparameters for different kinds of flood. Sensitivity to the es-timated 4 parameters was tested: the two correction coef-ficients –CK for the saturated hydraulic conductivities and
www.nat-hazards-earth-syst-sci.net/11/2567/2011/ Nat. Hazards Earth Syst. Sci., 11, 2567–2582, 2011

2574 H. Roux et al.: A physically-based parsimonious hydrological model for flash floods
Table 1. Characteristics of the studied flood events, peak discharge and time of peak are observed at the Anduze station.
Flood event September 1994 October 1995 September 2000 September 2002
Total rainfall (mm) 231 187 195 297Runoff coefficient 31 % 48 % 24 % 39 %Peak discharge (m3 s−1) 750–775 1411 1184 3634Time of peak (UTC) 23 Sep, 16:00–23:00 14 Oct, 07:00 29 Sep, 13:00 9 Sep, 06:00
Table 2. Parameter ranges used in Monte-Carlo simulations and values of the parameters corresponding to the best simulation in terms oflikelihood measureLNP (Eq. 7) for the flood of 1994.
Parameter Description Minimum MaximumLNP=0.69
CK Correction coefficient of the hydraulic conductivities (–) 0.1 10 9.3CZ Correction coefficient of the soil thicknesses (–) 0.1 10 5.3θ i Initial soil water content (%) 0 100 58nD2 Manning roughness coefficient of the overbanks (m−1/3 s) 0.06 1 0.2
CZ for the soil thicknesses – the overbank roughness of thedrainage networknD2 and the initial soil saturation conditionθ i . Parameter variation ranges are listed in Table2. Priorparameter distributions have been chosen uniform.
The scatter plots of Fig.7 correspond to the results ob-tained for the flood of 2002 but the results obtained for theflood of 1994 are quite similar. The values of simulated dis-charges seem to be very sensitive to the overbank roughnessof the drainage networknD2. In Fig. 7, it can be seen thatgood and poor simulations are available throughout the samerange for the 4 parameters. It suggests that the parameter re-sponse surface is very complex and confirms that the value ofone single parameter has little meaning when taken outsidethe context of the other parameter values. ParametersCK ,CZ andθ i show a large range of equifinality. However, lowvalues of the correction coefficientsCK andCZ and high val-ues of the initial soil moisture contentθ i always correspondto negative likelihood values. There seems to be a thresh-old in those three parameter values: above this threshold –or below this threshold forθ i – the model is less sensitiveto the chosen parameter. These parameters govern the infil-tration mechanism, they determine how much water is infil-trated and at which rate: they therefore control the value ofthe simulated runoff coefficient.
The model was calibrated on the basis of these Monte-Carlo simulations using the medium flood of 1994. Theparameter set giving the best simulated hydrograph for thelikelihood measureLNP is described in Table2. With theseparameter values, the soil depths range from 0 m to 5.3 mwith an average of 1.5 m and the hydraulic conductivitiesrange from 9 mm h−1 to 101 mm h−1 with an average of61 mm h−1.
The next step was to test the calibration by simulatingother flood events with the parameters estimated from theflood of 1994.
6.2 Model validation
Using the parameter values of Table2, simulations were car-ried out for the floods occurring in 1995, 2000 and 2002.Comparison of observed and simulated hydrographs for allfloods is shown in Fig.8. Table 3 summarizes the simu-lation results: they show a good agreement with the cor-responding observations for all three events, except for thesimulated runoff coefficient and peak discharge of the 1995event. Indeed, the floods of 1994, 2000 and 2002 occurred inSeptember and show similar runoff coefficients, below 40 %.The flood of 1995 occurred in October and has therefore agreater runoff coefficient. If it seems to be relevant to usethe same initial soil moisture contentθ i for the floods of1994, 2000 and 2002, this is not the case for the flood of1995. This may explain the lower value of theLNP criterionfor this event: 0.57 against 0.94 for the 2000 flood and 0.91for the 2002 flood. Indeed, using the same parameters but ahigher value of the initial soil moisture content –θ i = 78 %– the goodness criterion value increases toLNP = 0.82 as itcan be seen in Fig.9. This emphasizes the need for a modelinitialization related to the time of occurrence of each event.
6.3 Simulated hydrographs at upstream locations
Output hydrographs are available at any point of the drainagenetwork, as it can be seen in Fig.10. It is consequentlypossible to follow the evolution of the discharge along thedrainage network. Therefore, the hydrographs simulated us-ing the parameters estimated from the observed discharges
Nat. Hazards Earth Syst. Sci., 11, 2567–2582, 2011 www.nat-hazards-earth-syst-sci.net/11/2567/2011/

H. Roux et al.: A physically-based parsimonious hydrological model for flash floods 2575
Table 3. Estimated and simulated peak discharges, time of peak and runoff coefficient at the Anduze station, corresponding values of theLNP criterion. The flood of September 1994 at the Anduze station is the calibration event.
Flood event Anduze peakdischarge(m3 s−1)
Simulated peakdischarge(m3 s−1)
Anduze time ofpeak (UTC)
Simulated timeof peak (UTC)
Anduze runoffcoefficient
Simulatedrunoffcoefficient
LNP
September 1994 750775
807733
23 Sep, 16:0023 Sep, 23:00
23 Sep, 15:4223 Sep 23:18
31 % 28 % 0.69
October 1995 1411 958 14 Oct, 07:00 14 Oct, 06:36 48 % 24 % 0.57September 2000 1184 1136 29 Sep, 13:00 29 Sep, 13:30 24 % 26 % 0.94September 2002 3634 3202 9 Sep, 06:00 9 Sep, 06:25 39 % 38 % 0.91
Table 4. Estimated and simulated peak discharges, time of peak and runoff coefficient at the Mialet station, corresponding values of theLNPcriterion.
Flood event Mialet peakdischarge(m3 s−1)
Simulated peakdischarge(m3 s−1)
Mialet time ofpeak (UTC)
Simulated timeof peak (UTC)
Mialet runoffcoefficient
Simulatedrunoffcoefficient
LNP
September 1994 243263
528565
23 Sep, 14:0023 Sep, 22:00
23 Sep, 14:3823 Sep, 22:42
17 % 40 % −0.85
October 1995 249 397 14 Oct, 06:00 14 Oct, 05:45 29 % 34 % 0.16September 2000 428 626 29 Sep, 12:12 29 Sep, 12:50 32 % 33 % −0.28September 2002 915 1208 9 Sep, 05:50 9 Sep, 05:50 33 % 39 % 0.36
Table 5. Estimated and simulated peak discharges, time of peak and runoff coefficient at the Saumane station, corresponding values of theLNP criterion.
Flood event Saumane peakdischarge(m3 s−1)
Simulated peakdischarge(m3 s−1)
Saumane timeof peak (UTC)
Simulated timeof peak (UTC)
Saumanerunoffcoefficient
Simulatedrunoffcoefficient
LNP
September 1994 15596
17192
23 Sep, 13:0023 Sep, 21:00
23 Sep, 13:0823 Sep, 20:24
24 % 27 % 0.25
October 1995 – 61 – 14 Oct, 04:45 – 13 % –September 2000 240 231 29 Sep, 10:00 29 Sep, 10:51 21 % 25 % 0.57September 2002 833 783 9 Sep, 04:40 9 Sep, 05:05 38 % 32 % 0.45
www.nat-hazards-earth-syst-sci.net/11/2567/2011/ Nat. Hazards Earth Syst. Sci., 11, 2567–2582, 2011

2576 H. Roux et al.: A physically-based parsimonious hydrological model for flash floods
CK
L NP
2 4 6 8 100
0.2
0.4
0.6
0.8
1
CZ
L NP
2 4 6 8 100
0.2
0.4
0.6
0.8
1
θι
L NP
0 10 20 30 40 50 60 70 80 90 1000
0.2
0.4
0.6
0.8
1
nD2
L NP
0.1 0.2 0.3 0.4 0.5 0.6 0.7 0.8 0.9 10
0.2
0.4
0.6
0.8
1
Fig. 7. Scatter plot of efficiency results for each parameter in Monte-Carlo simulations of the flood of 2002; likelihood measure LNP ofEq. (7).
of the 1994 event at Anduze have also been compared withthe observations made at Saumane and Mialet, two dischargegauging stations located upstream of the Anduze station(Fig. 4). Results are shown in Tables4, 5 and Fig.11.
The hydrographs at the Mialet station present poorLNPvalues as discharges are systematically overestimated. Trib-utaries on this area of the catchment are indeed signifi-cantly affected by karst processes: part of the dischargeprobably flows in fissure-karstic paths and is therefore notmeasured by the gauging station at Mialet. Simulated hy-drographs at the Saumane station show a better agreementwith observed discharges, especially for the 2000 event withLNP = 0.57 againstLNP = −0.28 at Mialet andLNP = 0.94at Anduze. However, even at the Saumane station, simu-lated discharges are less satisfactory than at the Anduze sta-tion. Indeed, the estimated parameters enabling the modelto reproduce the integrated response at Anduze and theSaumane subcatchment characteristics differ from the onesof the entire catchment: for instance, the mean soil depthis approximately 1m for Saumane catchment against 1.5 mfor the Gardon catchment. This emphasizes the need for
regionalization methods and the assessment of the relation-ship between local parameter identifiability and catchmentcharacteristics (Wagener and Wheater, 2006).
6.4 Soil saturation dynamics
Figure12maps the saturation state of 1994 and 2002 events,at the beginning and at the end of the events. Saturation inthe upstream part of the catchment was more important atthe end of 1994 event than at the end of 2002 event despitea total rainfall of 297 mm for 2002 against 231 mm for 1994.This shows the impact of rainfall spatial distribution on sat-uration dynamics as the major part of the 2002 rainfall eventoccurring on the downstream part of the catchment as it canbe seen in Fig.6, whereas it occurred on the upstream partin 1994. Moreover, in the upstream part of the catchment,soil depths are lower than in the downstream part as it can beseen in Fig.5a).
To emphasize the importance of soil properties spatial dis-tribution on the evolution of soil saturation dynamics, themean saturation state of 1994 event has been calculated for7 soil categories combining Rawls and Brakensiek’s (1983)
Nat. Hazards Earth Syst. Sci., 11, 2567–2582, 2011 www.nat-hazards-earth-syst-sci.net/11/2567/2011/
H. Roux et al.: A physically-based parsimonious hydrological model for flash floods 2577
0
200
400
600
800
1000
1200
1400
Sep 2200:00
Sep 2208:00
Sep 2216:00
Sep 2300:00
Sep 2308:00
Sep 2316:00
Sep 2400:00
Sep 2408:00
0
20
40
60
80
100
Dis
char
ge (
m3 /s
)
Rai
nfal
l rat
e (m
m/h
)
Anduze 21/09/1994
0
500
1000
1500
2000
Oct 1308:00
Oct 1316:00
Oct 1400:00
Oct 1408:00
Oct 1416:00
Oct 1500:00
Oct 1508:00
0
20
40
60
80
100
Dis
char
ge (
m3 /s
)
Rai
nfal
l rat
e (m
m/h
)
Anduze 13/10/1995
17/06/2011 36
0
500
1000
1500
2000
Sep 2900:00
Sep 2908:00
Sep 2916:00
Sep 3000:00
0
20
40
60
80
100
Dis
char
ge (
m3 /s
)
Rai
nfal
l rat
e (m
m/h
)
Anduze 28/09/2000
1
0
1000
2000
3000
4000
5000
Sep 0808:00
Sep 0816:00
Sep 0900:00
Sep 0908:00
Sep 0916:00
Sep 1000:00
0
50
100
150
200
Dis
char
ge (
m3 /s
)
Rai
nfal
l rat
e (m
m/h
)
Anduze 08/09/2002
2 Figure 8. Simulated hydrograph (solid line) compare d with observed discharges (circle 3 symbols) at the Anduze station, events of 1994, 199 5, 2000 and 2002. 4
0
1000
2000
3000
4000
5000
Sep 0808:00
Sep 0816:00
Sep 0900:00
Sep 0908:00
Sep 0916:00
Sep 1000:00
0
50
100
150
200
Dis
char
ge (
m3 /s
)
Rai
nfal
l rat
e (m
m/h
)
Anduze 08/09/2002
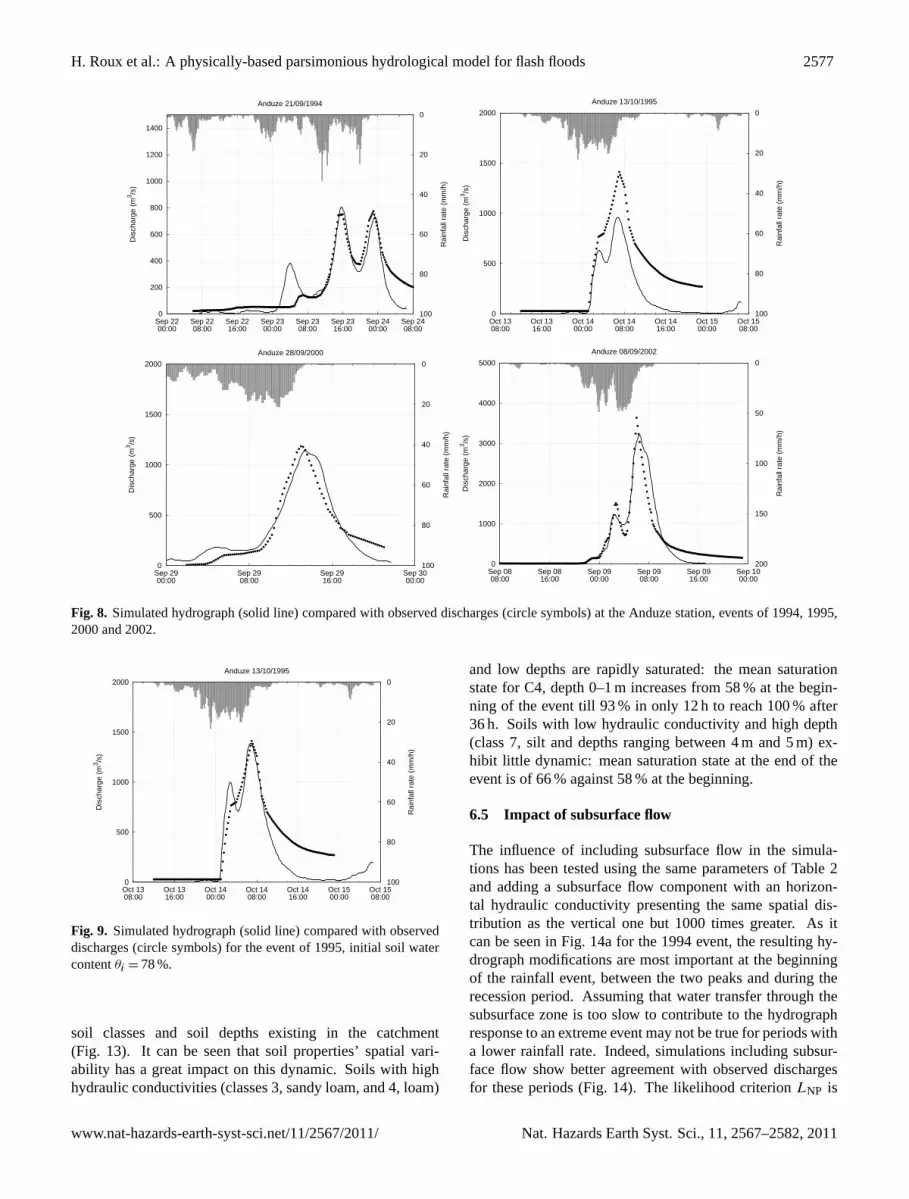
Fig. 8. Simulated hydrograph (solid line) compared with observed discharges (circle symbols) at the Anduze station, events of 1994, 1995,2000 and 2002.
0
500
1000
1500
2000
Oct 1308:00
Oct 1316:00
Oct 1400:00
Oct 1408:00
Oct 1416:00
Oct 1500:00
Oct 1508:00
0
20
40
60
80
100
Dis
char
ge (
m3 /s
)
Rai
nfal
l rat
e (m
m/h
)
Anduze 13/10/1995
Fig. 9. Simulated hydrograph (solid line) compared with observeddischarges (circle symbols) for the event of 1995, initial soil watercontentθi = 78 %.
soil classes and soil depths existing in the catchment(Fig. 13). It can be seen that soil properties’ spatial vari-ability has a great impact on this dynamic. Soils with highhydraulic conductivities (classes 3, sandy loam, and 4, loam)
and low depths are rapidly saturated: the mean saturationstate for C4, depth 0–1 m increases from 58 % at the begin-ning of the event till 93 % in only 12 h to reach 100 % after36 h. Soils with low hydraulic conductivity and high depth(class 7, silt and depths ranging between 4 m and 5 m) ex-hibit little dynamic: mean saturation state at the end of theevent is of 66 % against 58 % at the beginning.
6.5 Impact of subsurface flow
The influence of including subsurface flow in the simula-tions has been tested using the same parameters of Table2and adding a subsurface flow component with an horizon-tal hydraulic conductivity presenting the same spatial dis-tribution as the vertical one but 1000 times greater. As itcan be seen in Fig.14a for the 1994 event, the resulting hy-drograph modifications are most important at the beginningof the rainfall event, between the two peaks and during therecession period. Assuming that water transfer through thesubsurface zone is too slow to contribute to the hydrographresponse to an extreme event may not be true for periods witha lower rainfall rate. Indeed, simulations including subsur-face flow show better agreement with observed dischargesfor these periods (Fig.14). The likelihood criterionLNP is
www.nat-hazards-earth-syst-sci.net/11/2567/2011/ Nat. Hazards Earth Syst. Sci., 11, 2567–2582, 2011

2578 H. Roux et al.: A physically-based parsimonious hydrological model for flash floods
70050030010010
2000/09/29 12hUTCMax : 817.0 m3.s-1
0
200
400
600
Sep 2900:00
Sep 2912:00
Sep 3000:00
Dis
char
ge (
m3 /s
)
Gardon de Saint Jean
0
200
400
600
Sep 2900:00
Sep 2912:00
Sep 3000:00
Dis
char
ge (
m3 /s
)
St−Jean−du−Gard
0
200
400
600
Sep 2900:00
Sep 2912:00
Sep 3000:00
Dis
char
ge (
m3 /s
)
Mialet
0
200
400
600
Sep 2900:00
Sep 2912:00
Sep 3000:00
Dis
char
ge (
m3 /s
)
Corbes
0
200
400
600
Sep 2900:00
Sep 2912:00
Sep 3000:00
Dis
char
ge (
m3 /s
)
Gardon de Sainte Croix
0
200
400
600
Sep 2900:00
Sep 2912:00
Sep 3000:00
Dis
char
ge (
m3 /s
)
Saumane
Fig. 10. Discharge map on the catchment for the 29 September 2000 at 12:00 UTC and examples of output hydrographs at different pointsof the drainage network.
0
200
400
600
800
1000
1200
1400
1600
Sep 0808:00
Sep 0816:00
Sep 0900:00
Sep 0908:00
Sep 0916:00
Sep 1000:00
0
20
40
60
80
100
120
140
160
Dis
char
ge (
m3 /s
)
Rai
nfal
l rat
e (m
m/h
)
Saumane 08/09/2002
0
200
400
600
800
1000
1200
1400
1600
Sep 0808:00
Sep 0816:00
Sep 0900:00
Sep 0908:00
Sep 0916:00
Sep 1000:00
0
20
40
60
80
100
120
140
160
Dis
char
ge (
m3 /s
)
Rai
nfal
l rat
e (m
m/h
)
Mialet 08/09/2002
Fig. 11.Simulated hydrograph (solid line) compared with observeddischarges (circle symbols) for the 2002 event at the upstream gaug-ing stations of(a) Saumane and(b) Mialet.
therefore higher: 0.92 and 0.95, respectively, for the 1994and 1995 events with subsurface component against 0.69 and0.82 without subsurface.
The inclusion of subsurface flow also greatly modifiesthe soil saturation dynamics. Figure15 clearly shows theimportance of the drainage network on saturation dynamicswhen subsurface flow is activated. This is due to the factthat exfiltration can occur in the drainage network. Measuresdescribing the spatial distribution of saturation state wouldbe helpful to choose which physical phenomenon should beincluded in the model.
7 Discussion and conclusions
The MARINE model is structured around the understandingof Mediterranean catchment hydrological response in orderto be dedicated to flash flood prediction and analysis. It wastested on the Gardon d’Anduze river basin as part of a hy-drological rainfall runoff model intercomparison project leadby the French central hydrometeorological service for floodforecasting (Ministere de l’ecologie du developpement et del’amenagement durables, 2003). Model construction and as-signments of prior values to model parameters were based oneasily available spatial data. Only four parameters needed tobe estimated in the model. Two flood events were chosen toimplement a sensitivity analysis of the model prediction tothese parameters using Monte-Carlo simulations. The modelwas then calibrated on one flood event and tested on threeothers. Simulation results were compared on the basis of amodel performance criterion representing both efficiency andthe error of peak time and runoff.
Nat. Hazards Earth Syst. Sci., 11, 2567–2582, 2011 www.nat-hazards-earth-syst-sci.net/11/2567/2011/
H. Roux et al.: A physically-based parsimonious hydrological model for flash floods 2579
X (m)
Y(m
)
7.00E+05 7.10E+05 7.20E+05 7.30E+051.89E+06
1.90E+06
1.91E+06
0.990.90.80.70.60.50.4
1994/09/22 08hUTC
X (m)
Y(m
)
7.00E+05 7.10E+05 7.20E+05 7.30E+051.89E+06
1.90E+06
1.91E+06
0.990.90.80.70.60.50.4
2002/09/09 00hUTC
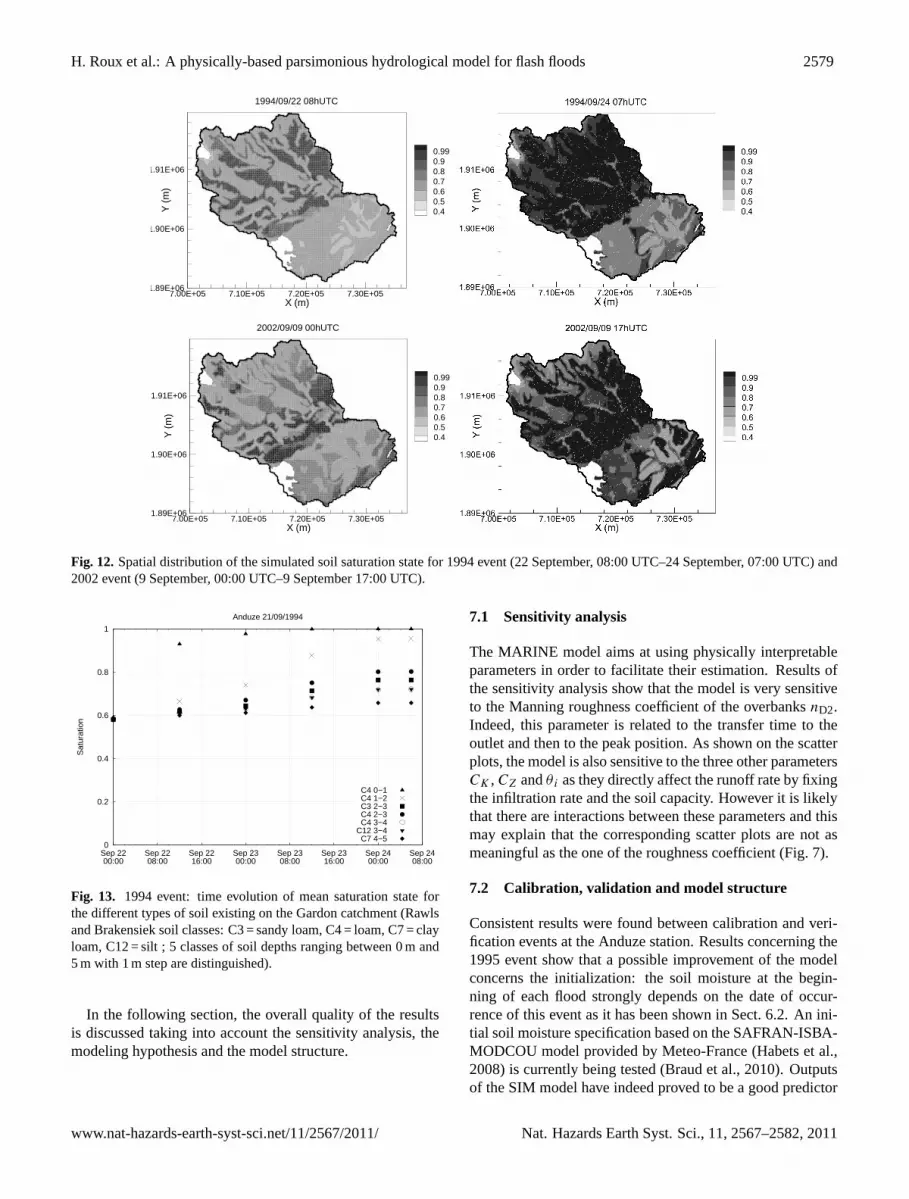
Fig. 12. Spatial distribution of the simulated soil saturation state for 1994 event (22 September, 08:00 UTC–24 September, 07:00 UTC) and2002 event (9 September, 00:00 UTC–9 September 17:00 UTC).
0
0.2
0.4
0.6
0.8
1
Sep 2200:00
Sep 2208:00
Sep 2216:00
Sep 2300:00
Sep 2308:00
Sep 2316:00
Sep 2400:00
Sep 2408:00
Sat
urat
ion
Anduze 21/09/1994
C4 0−1C4 1−2C3 2−3C4 2−3C4 3−4
C12 3−4C7 4−5
Fig. 13. 1994 event: time evolution of mean saturation state forthe different types of soil existing on the Gardon catchment (Rawlsand Brakensiek soil classes: C3 = sandy loam, C4 = loam, C7 = clayloam, C12 = silt ; 5 classes of soil depths ranging between 0 m and5 m with 1 m step are distinguished).
In the following section, the overall quality of the resultsis discussed taking into account the sensitivity analysis, themodeling hypothesis and the model structure.
7.1 Sensitivity analysis
The MARINE model aims at using physically interpretableparameters in order to facilitate their estimation. Results ofthe sensitivity analysis show that the model is very sensitiveto the Manning roughness coefficient of the overbanksnD2.Indeed, this parameter is related to the transfer time to theoutlet and then to the peak position. As shown on the scatterplots, the model is also sensitive to the three other parametersCK ,CZ andθ i as they directly affect the runoff rate by fixingthe infiltration rate and the soil capacity. However it is likelythat there are interactions between these parameters and thismay explain that the corresponding scatter plots are not asmeaningful as the one of the roughness coefficient (Fig.7).
7.2 Calibration, validation and model structure
Consistent results were found between calibration and veri-fication events at the Anduze station. Results concerning the1995 event show that a possible improvement of the modelconcerns the initialization: the soil moisture at the begin-ning of each flood strongly depends on the date of occur-rence of this event as it has been shown in Sect. 6.2. An ini-tial soil moisture specification based on the SAFRAN-ISBA-MODCOU model provided by Meteo-France (Habets et al.,2008) is currently being tested (Braud et al., 2010). Outputsof the SIM model have indeed proved to be a good predictor
www.nat-hazards-earth-syst-sci.net/11/2567/2011/ Nat. Hazards Earth Syst. Sci., 11, 2567–2582, 2011
2580 H. Roux et al.: A physically-based parsimonious hydrological model for flash floods
0
200
400
600
800
1000
1200
1400
Sep 2200:00
Sep 2208:00
Sep 2216:00
Sep 2300:00
Sep 2308:00
Sep 2316:00
Sep 2400:00
Sep 2408:00
0
20
40
60
80
100
Dis
char
ge (
m3 /s
)
Rai
nfal
l rat
e (m
m/h
)
Anduze 21/09/1994
0
500
1000
1500
2000
Oct 1308:00
Oct 1316:00
Oct 1400:00
Oct 1408:00
Oct 1416:00
Oct 1500:00
Oct 1508:00
0
20
40
60
80
100
Dis
char
ge (
m3 /s
)
Rai
nfal
l rat
e (m
m/h
)
Anduze 13/10/1995
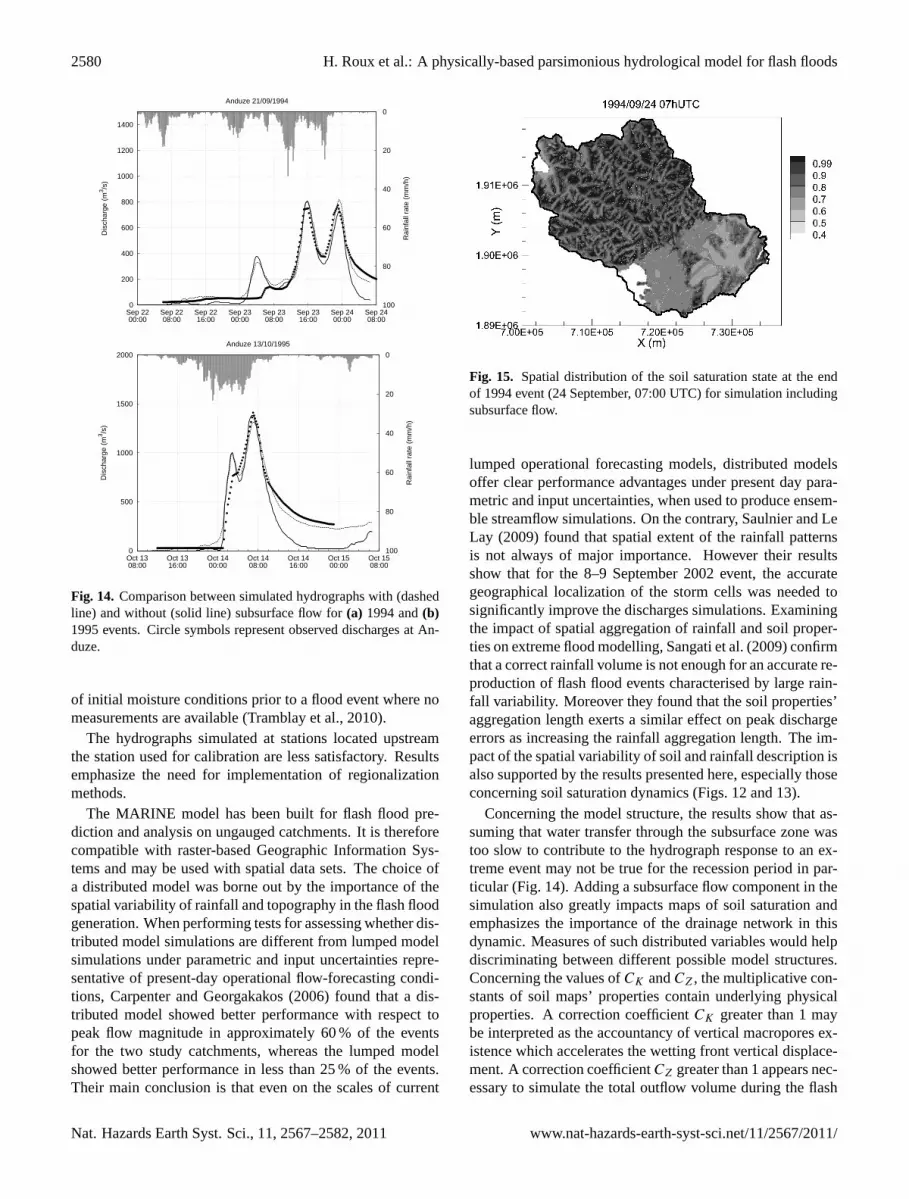
Fig. 14. Comparison between simulated hydrographs with (dashedline) and without (solid line) subsurface flow for(a) 1994 and(b)1995 events. Circle symbols represent observed discharges at An-duze.
of initial moisture conditions prior to a flood event where nomeasurements are available (Tramblay et al., 2010).
The hydrographs simulated at stations located upstreamthe station used for calibration are less satisfactory. Resultsemphasize the need for implementation of regionalizationmethods.
The MARINE model has been built for flash flood pre-diction and analysis on ungauged catchments. It is thereforecompatible with raster-based Geographic Information Sys-tems and may be used with spatial data sets. The choice ofa distributed model was borne out by the importance of thespatial variability of rainfall and topography in the flash floodgeneration. When performing tests for assessing whether dis-tributed model simulations are different from lumped modelsimulations under parametric and input uncertainties repre-sentative of present-day operational flow-forecasting condi-tions, Carpenter and Georgakakos (2006) found that a dis-tributed model showed better performance with respect topeak flow magnitude in approximately 60 % of the eventsfor the two study catchments, whereas the lumped modelshowed better performance in less than 25 % of the events.Their main conclusion is that even on the scales of current
Fig. 15. Spatial distribution of the soil saturation state at the endof 1994 event (24 September, 07:00 UTC) for simulation includingsubsurface flow.
lumped operational forecasting models, distributed modelsoffer clear performance advantages under present day para-metric and input uncertainties, when used to produce ensem-ble streamflow simulations. On the contrary, Saulnier and LeLay (2009) found that spatial extent of the rainfall patternsis not always of major importance. However their resultsshow that for the 8–9 September 2002 event, the accurategeographical localization of the storm cells was needed tosignificantly improve the discharges simulations. Examiningthe impact of spatial aggregation of rainfall and soil proper-ties on extreme flood modelling, Sangati et al. (2009) confirmthat a correct rainfall volume is not enough for an accurate re-production of flash flood events characterised by large rain-fall variability. Moreover they found that the soil properties’aggregation length exerts a similar effect on peak dischargeerrors as increasing the rainfall aggregation length. The im-pact of the spatial variability of soil and rainfall description isalso supported by the results presented here, especially thoseconcerning soil saturation dynamics (Figs.12and13).
Concerning the model structure, the results show that as-suming that water transfer through the subsurface zone wastoo slow to contribute to the hydrograph response to an ex-treme event may not be true for the recession period in par-ticular (Fig.14). Adding a subsurface flow component in thesimulation also greatly impacts maps of soil saturation andemphasizes the importance of the drainage network in thisdynamic. Measures of such distributed variables would helpdiscriminating between different possible model structures.Concerning the values ofCK andCZ, the multiplicative con-stants of soil maps’ properties contain underlying physicalproperties. A correction coefficientCK greater than 1 maybe interpreted as the accountancy of vertical macropores ex-istence which accelerates the wetting front vertical displace-ment. A correction coefficientCZ greater than 1 appears nec-essary to simulate the total outflow volume during the flash
Nat. Hazards Earth Syst. Sci., 11, 2567–2582, 2011 www.nat-hazards-earth-syst-sci.net/11/2567/2011/

H. Roux et al.: A physically-based parsimonious hydrological model for flash floods 2581
flood integrating a soil volume increase. This could be inter-preted as a loss term which could represent bedrock percola-tion.
Table A1. Notation.
ad (m2) Drainage areaCK (–) Correction coefficient of the saturated
hydraulic conductivityCZ (–) Correction coefficient of the soil
thicknessI (m) Cumulative infiltrationHD (m) Depth of the network reachh (m) Water depthi (m s−1) Infiltration rater (m s−1) Rainfall rateK (m s−1) Saturated hydraulic conductivityLNP (–) Performance criterionno (m−1/3 s) Manning roughness coefficient of the
overlandnD1 (m−1/3 s) Manning roughness coefficient of the
main channel (drainage network)nD2 (m−1/3 s) Manning roughness coefficient of the
overbanks (drainage network)Q (m3 s−1) DischargeSf (m m−1) Friction slopeS0 (m m−1) Bed slopetp (s) Time to pondingu (m s−1) Overland flow velocityWD (m) Width of the network reachZ (m) Soil thicknessθ i (m3 m−3) Initial water content of the soilθ s (m3 m−3) Saturated water content of the soil9 (m) Soil suction at wetting front
Acknowledgements.The authors acknowledge the anonymousreviewers and the editor for their help in improving the quality ofthe paper.
Edited by: G. BoniReviewed by: three anonymous referees
References
Aronica, G., Hankin, B., and Beven, K.: Uncertainty and equifi-nality in calibrating distributed roughness coefficients in a floodpropagation model with limited data, Adv. Water Resour., 22(4),349–365, 1998.
Aronica, G., Bates, P. D., and Horritt, M. S.: Assessing the uncer-tainty in distributed model predictions using observed binary pat-tern information within GLUE, Hydrol. Process., 16(10), 2001–2016, 2002.
Beven, K. J. and Kirkby, M. J.: A physically based, variable con-tributing area model of basin hydrology, Hydrolog. Sci. J., 24(1),43–69, 1979.
Bloschl, G., Reszler, C., and Komma, J.: A spatially distributedflash flood forecasting model, Environ. Modell. Softw., 23(4),464–478, 2008.
Braud, I., Roux, H., Anquetin, S., Maubourguet, M.-M., Manus,C., Viallet, P., and Dartus, D.: The use of distributed hydro-logical models for the Gard 2002 flash flood event: Analysisof associated hydrological processes, J. Hydrol., Special issueFlash Floods: Observations and Analysis of Hydrometeorologi-cal Controls, 394(1–2), 162–181, 2010.
Carpenter, T. M. and Georgakakos, K. P.: Intercomparison oflumped versus distributed hydrologic model ensemble simula-tions on operational forecast scales, J. Hydrol., 329(1–2), 174–185, 2006.
Castaings, W., Dartus, D., Le Dimet, F.-X., and Saulnier, G.-M.:Sensitivity analysis and parameter estimation for distributed hy-drological modeling: potential of variational methods, Hydrol.Earth Syst. Sci., 13, 503–517,doi:10.5194/hess-13-503-2009,2009.
Chow, V. T.: Open-channel Hydraulics, Mc Graw-Hill, New-York,USA, 1959.
Ciarapica, L. and Todini, E.: TOPKAPI: a model for the represen-tation of the rainfall-runoff process at different scales, Hydrol.Process., 16(2), 207–229, 2002.
Datin, R.: Outils operationnels pour la prevision des crues rapi-des: traitement des incertitudes et integration des previsionsmeteorologiques. Developpements de TOPMODEL pour la priseen compte de la variabilite spatiale de la pluie. Application aubassin versant de l’Ardeche, These de doctorat, Institut nationalpolytechnique de Grenoble, Grenoble, France, 330 pp., 1998.
Durand, P., Robson, A., and Neal, C.: Modelling the Hydrology ofSubmediterranean Montane Catchments (Mont-Lozere, France)Using TOPMODEL: Initial Results, J. Hydrol., 139(1–4), 1992.
Estupina-Borrell, V., Dartus, D., and Ababou, R.: Flash flood mod-eling with the MARINE hydrological distributed model, Hydrol.Earth Syst. Sci. Discuss., 3, 3397–3438,doi:10.5194/hessd-3-3397-2006, 2006.
Gaume, E. and Borga, M.: Post-flood field investigations in uplandcatchments after major flash floods: proposal of a methodologyand illustrations, J. Flood Risk Manag., 1(4), 175–189, 2008.
Gaume, E., Livet, M., and Desbordes, M.: Study of the hydrologi-cal processes during the Avene river extraordinary flood (south ofFrance): 6–7 October 1997. Physics and Chemistry of the Earth,Parts A/B/C – Hydrological Processes and Distributed Hydrolog-ical Modelling, 28(6–7), 263–267, 2003.
Gaume, E., Livet, M., Desbordes, M. and Villeneuve, J.-P.: Hydro-logical analysis of the river Aude, France, flash flood on 12 and13 November 1999, J. Hydrol., 286(1–4), 135–154, 2004.
Gaume, E., Bain, V., Bernardara, P., Newinger, O., Barbuc,M., Bateman, A., Blaskovicova, L., Bloschl, G., Borga, M.,Dumitrescu, A., Daliakopoulos, I., Garcia, J., Irimescu, A.,Kohnova, S., Koutroulis, A., Marchi, L., Matreata, S., Medina,V., Preciso, E., Sempere-Torres, D., Stancalie, G., Szolgay, J.,Tsanis, I., Velasco, D. and Viglione, A.: A compilation of dataon European flash floods, J. Hydrol., 367(1–2), 70–78, 2009.
Giannoni, F., Roth, G., and Rudari, R.: A semi-distributed rainfall-runoff model based on a geomorphologic approach, Phys. Chem.Earth, Part B: Hydrology, Oceans and Atmosphere, 25(7–8),665–671, 2000.
Gourley, J. J. and Vieux, B. E.: A method for identifying sources
www.nat-hazards-earth-syst-sci.net/11/2567/2011/ Nat. Hazards Earth Syst. Sci., 11, 2567–2582, 2011
2582 H. Roux et al.: A physically-based parsimonious hydrological model for flash floods
of model uncertainty in rainfall-runoff simulations, J. Hydrol.,327(1–2), 68–80, 2006.
Goutorbe, J. P., Alquier, M., Dartus, D., Ducuing, J. L., Estupina,V., Gregoris, Y., and Robert de Saint Vincent, A.: Using spaceobservations fot flood monitoring : the PACTES project, EU-METSAT – Meteorological Satellite Conference, Dublin, Ire-land, 2002.
Habets, F., Boone, A., Champeaux, J.L., Etchevers, P., Fran-chisteguy, L., Leblois, E., Ledoux, E., Le Moigne, P., Martin, E.,Morel, S., Noilhan, J., Quintana Seguı, P., Rousset-Regimbeau,F., and Viennot, P.: The SAFRAN-ISBA-MODCOU hydrome-teorological model applied over France, J. Geophys. Res., 113,doi:10.1029/2007JD008548, 2008.
IAHS-UNESCO-WMO (Eds.): Flash Floods, Proceedins of theParis Symposium, 1974.
Lee, Y. H. and Singh, V. P.: Application of the Kalman filter to theNash model, Hydrol. Process., 12, 755–767, 1998.
Liu, Z. and Todini, E.: Towards a comprehensive physically-based rainfall-runoff model, Hydrol. Earth Syst. Sci., 6, 859-881,doi:10.5194/hess-6-859-2002, 2002.
Marchi, L., Borga, M., Preciso, E. and Gaume, E.: Characterisa-tion of selected extreme flash floods in Europe and implicationsfor flood risk management, J. Hydrol. – Special issue on Flashfloods : observations and analysis of hydrometeorological con-trols, 394(1–2), 118–133, 2010.
Ministere de l’ecologie du developpement et de l’amenagementdurables. Le SCHAPI : Service Central d’Hydrometeorologie etd’Appui a la Prevision des Inondations:http://www.rdbrmc.com/hydroreel2/schapi.pdf, access: 2010, 2003.
Moussa, R. and Bocquillon, C.: Criteria for the choice of flood-routing methods in natural channels, J. Hydrol., 186, 1–30, 1996.
Moussa, R. and Chahinian, N.: Comparison of different multi-objective calibration criteria using a conceptual rainfall-runoffmodel of flood events, Hydrol. Earth Syst. Sci., 13, 519–535,doi:10.5194/hess-13-519-2009, 2009.
Moussa, R., Chahinian, N., and Bocquillon, C.: Distributed hydro-logical modelling of a Mediterranean mountainous catchment –Model construction and multi-site validation, J. Hydrol., 337(1–2), 35–51, 2007.
Nash, J. E. and Sutcliffe, J. V.: River flow forecasting through con-ceptual models. Part I – A discussion of principles, J. Hydrology,10, 282–290, 1970.
Norbiato, D., Borga, M., Sangati, M., and Zanon, F.: Regional fre-quency analysis of extreme precipitation in the eastern ItalianAlps and the August 29, 2003 flash flood, J. Hydrol., 345(3–4),149–166, 2007.
Pinol, J., Beven, K., and Freer, J.: Modelling the hydrological re-spose of mediterranean catchments, Prades, Catalonia. The useof distributed models as aids to hypothesis formulation, Hy-drolog. Process., 11(9), 1287–1306, 1997.
Rawls, W. J., Ahuja, L. R., Brakensiek, D. L., and Shirmohammadi,A.: Infiltration and Soil Water Movement, in: Handbook of Hy-drology, edited by: Maidment, D. R., McGraw-Hill, Inc., 1992.
Rawls, W. J. and Brakensiek, D. L.: A procedure to predict GreenAmpt infiltration parameters, Proceedings of the National Con-ference on Advances in Infiltration, Chicago, IL., 12–13 Decem-ber 1983, 102–112, 1983.
Reed, S., Schaake, J., and Zhang, Z.: A distributed hydrologicmodel and threshold frequency-based method for flash floodnextterm forecasting at ungauged locations, J. Hydrol., 337(3–4),402–420, 2007.
Refsgaard, J. C.: Parameterisation, calibration and validation of dis-tributed hydrological models, J. Hydrology, 198, 69–97, 1997.
Robbez-Masson, J.-M., Mazzoni, C., Vallejo, S., Ernesty, D., andFalipou, P.: A regional multimedia soil and landscape databaseon the web in order to help use and teaching of soil data, 17thWorld congress of Soil Science, Bangkok, Thailand, 14–21 Au-gust 2002.
Romanowicz, R. and Beven, K.: Estimation of flood inundationprobabilities as conditioned on event inundation maps, Water Re-sour. Res., 39(3), 1–12, 2003.
Sangati, M., Borga, M., Rabuffetti, D., and Bechini, R.: Influence ofrainfall and soil properties spatial aggregation on extreme flashflood response modelling: An evaluation based on the Sesia riverbasin, North Western Italy, Adv. Water Resour., 32(7), 1090–1106, 2009.
Saulnier, G.-M.: Information pedologique spatialisee et traitementstopographiques ameliores dans la modelisation hydrologique parTOPMODEL, These de doctorat, Institut national polytechniquede Grenoble, Grenoble, France, 300 pp., 1996.
Saulnier, G.-M. and Le Lay, M.: Sensitivity of flash-flood simula-tions on the volume, the intensity, and the localization of rainfallin the Cevennes-Vivarais region (France), Water Resour. Res.,45(10), W10425, doi:10.1029/2008WR006906, 2009.
Tanguy, J.-M., Carriere, J.-M., Le Trionnaire, Y., and Schoen,R.: Reorganisation de l’annonce des crues en France:Crues Mediterraneennes (Reorganisation of flood forecasting inFrance), La Houille Blanche, 2, 44–48, 2005.
Tramblay, Y., Bouvier, C., Martin, C., Didon-Lescot, J.-F., Todor-ovik, D. and Domergue, J.-M.: Assessment of initial soil mois-ture conditions for event-based rainfall-runoff modelling, J. Hy-drol., 387(3–4), 176–187, 2010.
Wagener, T. and Wheater, H. S.: Parameter estimation and region-alization for continuous rainfall-runoff models including uncer-tainty. Journal of Hydrology, The model parameter estimationexperiment – MOPEX, 320(1–2), 132–154, 2006.
Werner, M.: Spatial flood extent modelling. A performance-basedcomparison, PhD Thesis, Delft University of Technology, Delft,Nederlands, 189 pp., 2004.
Nat. Hazards Earth Syst. Sci., 11, 2567–2582, 2011 www.nat-hazards-earth-syst-sci.net/11/2567/2011/