a novel attractant for mexican fruit fly,anastrepha ludens, from fermented host fruit
TRANSCRIPT
Journal of Chemical Ecology, Vol. 16, No. 10, 1990
A NOVEL ATTRACTANT FOR MEXICAN FRUIT FLY, Anastrepha ludens, 1 FROM FERMENTED HOST FRUIT
D . C . R O B A C K E R , 2'4 A . M . T A R S H I S M O R E N O , 2 J . A . G A R C I A , 2 a n d
R . A . F L A T H 3
2Crop Quality and Fruit Insects Research, ARS, USDA 2301 South International Blvd.
Weslaco, Texas 78596
3Plant Protection Research, ARS, USDA 800 Buchanan
Albany, California 94710
(Received January 11, 1990; accepted April 9, !990)
Abstract- -Chemicals from fermented chapote fruit were identified and eval- uated as attractants for hungry adult Mexican fruit flies in laboratory and greenhouse bioassays. Twenty-eight chemicals identified from an attractive gas-chromatography fraction were as attractive as a chapote volatiles extract (CV) when mixed in the same amounts found in CV. Sixteen of the chemicals were slightly attractive to flies when tested individually. A mixture contain- ing 15 of the chemicals by design and the 16th as an impurity, in arbitrary concentrations, was at least as attractive as the original CV. In a series of experiments, the number of chemicals was reduced to three by elimination of unnecessary components. The three-component mixture retained the attractiveness of the 15-component mixture. The three chemicals were 1,8-cineole, ethyl hexanoate, and hexanol (CEH). Attractiveness of the three- chemical mixture was equal to the sum of the attractiveness of the three indi- vidual components, suggesting that each chemical binds to a different recep- tor type that independently elicits partial attraction behavior. Optimal ratios were 10 : 1 : 1 of the three chemicals, respectively. Optimal test quantities ranged between 0 .4-4/~g of 1,8-cineole and 40-400 ng each of ethyl hex- anoate and hexanol applied to filter paper in the laboratory bioassays. A neat 10:1 : 1 mixture of the chemicals was 1.8 times more attractive than aqueous solutions of Torula dried yeast and borax to starved 2-day-old flies when the lures were tested in competing McPhail traps in a large greenhouse cage.
Key Words--Attractants, Mexican fruit fly, Diptera, Tephritidae, Anastre- pha ludens, host fruit, yellow chapote, Rutaceae, Sargentia greggii.
Diptera: Tephritidae. 4To whom correspondence should be addressed.
2799

2800 ROBACKER ET AL.
INTRODUCTION
Fermenting sugars, yeasts, and protein hydrolysates combined with water in McPhail traps (Shaw et al., 1970) have been the standard lures for various species of Anastrepha fruit flies for over 50 years. Laboratory and field screen- ing of thousands of candidate attractant chemicals during 1955-1963 by J.F. Cooper, D.L. Chambers, F. Lopez-D, and O. Hernandez-B (Shaw et al., 1970), over a thousand during 1972-1978 by Burditt and McGovern (1979), and thou- sands again during 1982-1988 by W.G. Hart (personal communication), dis- covered no promising attractants for Anastrepha. Further, Lopez-D and Chambers evaluated extracts of 456 plant species and also found no promising attractants (Shaw et al., 1970). Baker et al. (1944) reported that Mexican fruit fly (Anastrepha ludens Loew) adults frequently were seen feeding on fallen mangoes, suggesting that the fermenting fruit was attractive to the flies. How- ever, no attractant was developed from this or any fruit for Anastrepha species. Finally, Hedstr6m (1988) demonstrated that human urine was 10 times more attractive to A. striata and A. obliqua than aqueous solutions of Torula dried yeast and sodium borate in McPhail traps, but no attractive chemicals have been identified.
Robacker et al. (1990) demonstrated that the odor of fermented chapote fruit, a native host ofA. ludens, was highly attractive to hungry adult A. ludens. In greenhouse experiments, fermented chapote fruit was 3.6 times more attrac- tive than aqueous solutions of Torula dried yeast and borax (YB) at distances of <0 .3 m. These promising results led to the current work to develop from chapote odor a mixture of chemicals attractive to hungry A. ludens.
Specifically, objectives of this research were to: identify chemicals in fer- mented chapote odor attractive to A. ludens; prepare a mixture of the chemicals with attractiveness equal to chapote odor; eliminate unnecessary chemicals; determine optimal component ratios and concentrations; and evaluate the final mixture against YB, one of the most commonly used lures for A. ludens, in greenhouse tests.
METHODS AND MATERIALS
Insects and Test Conditions. Flies were from a culture maintained for at least 70 generations with no wild-fly introductions. Pupae were irradiated with 7000-9200 rads (cobalt-60 source) one to three days before adult eclosion in the YB/CEH comparison experiment because it was conducted in a greenhouse. Flies used in other experiments were not irradiated. Flies were tested when 2-3 days old: 2-day-old flies were never fed as adults; 3-day-old flies were fed sugar until one day before tests to prevent excessive mortality. Flies were not deprived

ATTRACTANT FOR MEXICAN FRUIT FLY 2801
of water. Mixed-sex groups of 140-200 flies were used. Unless stated other- wise, tests were conducted between 0900 and 1400 hr in the laboratory under a combination of fluorescent and natural light. Responses to chapote odor are relatively constant during this period of the day (Robacker et al., 1990). Lab- oratory conditions were 22 + 2~ 50 _+ 20% relative humidity, and photo- phase from 0600 to 2000 hr.
Chapote Volatiles (CV). The fermented, immature chapote fruit was described previously (Robacker et al., 1990). Between 70 and 150 g of the fruit (ca. 150-300 fruits) were put into a cylindrical glass aeration chamber (26 cm long x 8 cm ID) with an airflow of about 100-120 ml/min. The chamber was fitted with both an air filter and a trapping tube each containing Porapak Q (Waters Associates, Milford, Massachusetts) (50/80 mesh). The Porapak Q was precleaned with successive rinses of acetone, dichloromethane, and 10% di- chloromethane in pentane. Volatiles were extracted with 10% dichloromethane in pentane following 24 hr of fruit aeration. The extract was stored at - 2 0 ~
Gas Chromatography-Mass Spectrometry. Chemicals in CV were identi- fied by gas chromatography-mass spectrometry (GC-MS). A Finnigan MAT 4500 GC-MS data system (Finnigan MAT, San Jose, California) was operated in the electron-impact ionization mode (emission current = - 0 . 3 0 mA, elec- tron energy = 70 eV, multiplier voltage = - 1225 V). Mass spectral data were acquired over a mass range of 33-350 amu, using a 1-sec scan rate. Several columns were employed: DB-1 and DB-Wax (J & W Scientific, Rancho Cor- dova, California) (60 m, fused silica, 0.32 mm ID, 0.25 and 1.0/xm film).
Gas Chromatography (GC). We used a Shimadzu GC-9A instrument (Shi- madzu Scientific Instruments, Inc., Columbia, Maryland) with a flame ioniza- tion detector. Analyses were on either a DB-225 Megabore column (J & W Scientific) (30 m, fused silica, 0.53 mm ID, 1 /zm film) or a SPB-1 capillary column (Supelco, Inc., Bellefonte, Pennsylvania) (60 m, fused silica, 0.32 mm ID, 1 /xm film).
Chemicals Evaluated in Bioassays. Twenty-eight chemicals identified in CV by GC-MS were obtained for behavioral assays. Chemicals, sources, and purities are listed in Table 1. Purities stated on product labels were verified by GC. Note that Table 1 lists specific enantiomers for several chemicals even though GC-MS does not distinguish optical isomers. In most cases, enantiomers were chosen because they are the predominant isomers found in natural plant sources.
Chapote Volatile Synthetic Mixture (CVSM). The 28 chemicals listed in Table 1 were mixed together approximately in the same amounts as in CV. Table 1 shows the concentrations of the chemicals in CVSM. CVSM was used as a standard in attractiveness tests of various mixtures of chemicals.
Tandem GC-Behavior Bioassay. This bioassay was used to evaluate attrac- tiveness of chemicals as they eluted from the GC column: DB-225 Megabore;

2802 ROBACKER ET AL.
TABLE 1. CHEMICAL NAMES, SOURCES, PURITIES, AND CONCENTRATIONS IN CVSM TEST MIXTURE OF 28 CHEMICALS EVALUATED BEHAVIORALLY IN VARIOUS
EXPERIMENTS
Chemical Source" Purity' (%)
Amounts in CVSM
(ng//zl)
Ethyl butyrate Sigma 99 1 (+)-~-Pinene Sigma 99 445 Ethyl 2-methylbutyrate Aldrich 99 1 3-Methylbutanol Sigma 99 36 (S)-(-)-2-Methylbutanol Sigma 99 12 ( + )-Camphene Aldrich 80 4 Hexanal Sigma 98 1 3-Methyl-3-buten- 1-ol Aldrich 97 2 Pentanol Sigma 99 1 3-Methylbutyl acetate Sigma 98 1 ~3-Pinene PCR 95 12 (+)-Sabinene Aldrich 99 4 3-Methyl-2-buten- 1 -ol Aldrich 99 1 /3-Myrcene Sigma 90 76 c~-Phellandrene P&B 97 2 ~-Terpinene PCR 88 4 Methyl hexanoate Alltech 99 1 D-Limonene Sigma 97 117 /3-Phellandrene unknown 80 17 Hexanol Sigma 99 1 7-Terpinene Sigma 95 107 cis-3-Hexen- 1-ol Sigma 97 2 1,2,4-Trimethylbenzene Sigma 98 7 1,8-Cineole Aldrich 99 < 1 Ethyl hexanoate Alltech 99 2 trans-2-Hexen- 1 -ol Aldrich 97 1 Dodecane Alltech 99 2 p-Cymene PCR 95 95
aSigma Chemical Company, St. Louis, Missouri; Aldrich Chemical Company, Inc., Milwaukee, Wisconsin; PCR Research Chemicals, Inc., Gainesville, Florida; Pfaltz & Bauer, Inc., Water- bury, Connecticut; Alltech Associates, Inc., Deerfield, Illinois.
b Determined from label information and GC analysis.
5 0 ~ for 5 min , 1 ~ inc rease un t i l 1 2 0 ~ i s o t he rma l . A spl i t te r at the end
o f the c o l u m n d i v e r t e d ca. 95 % o f the eff luent t h r o u g h a cage (20 c m / s i d e )
c o n t a i n i n g 200 2 - d a y - o l d flies. Al l flies w i t h i n a 5 - c m - d i a m . c i rc le a r o u n d the
eff luent en t ry po in t w e r e c o u n t e d e v e r y 15 sec for 80 m i n . T w e n t y rep l i ca t ions
we re c o n d u c t e d fo r C V and 22 fo r C V S M .

ATTRACTANT FOR MEXICAN FRUIT FLY 2803
Cage-Top Bioassay. Cage-top bioassays were used to evaluate attractive- ness of chemicals and mixtures of chemicals in most experiments (Robacker and Hart, 1984; Robacker et al., 1990). A response index (RI) was defined as the ratio of the number of flies attracted to treatments vs. solvent controls (Robacker et al., 1990).
Tests of Individual Chemicals. Solutions of the 28 chemicals in Table 1 were prepared in hexane and tested using cage-top bioassays. Two amounts of each chemical were tested: 400 ng in 10 /~1 and 4 /~g in 100 Izl (except 1,8-cineole). 1,8-Cineole was not identified in the initial GC-MS work. When it was identified later, we tested it at 40 ng in 10 t~l and 400 ng in 100/xl to reflect its concentration in various mixtures in which it was present as a con- taminant of c~-terpinene. Further, it was tested during mixture experiment 8 instead of at the same time as the other individual chemicals. Ten replications each were conducted for low and high amounts.
Mixture Experiments. These experiments were conducted to determine a minimum set of chemicals as attractive as the original CV. Chemicals evaluated in the individual-chemical tests that were more attractive at the lower test quan- tity were incorporated into mixtures at 4 ng//~l and those more attractive at the higher quantity at 40 ng//A. Two quantities of each mixture were tested, 10 ~1 and 100 ~1, using cage-top bioassays. Ten replications each were conducted for both 10- and 100-/~1 amounts. The composition of the various mixtures is shown in Table 2. Mixture names reflect the number of chemicals they contained by design, although others were present as impurities. Eight mixture experiments were conducted (Table 3).
The first mixture experiment evaluated six mixtures. Mix 15 contained all chemicals (including 1,8-cineole as an impurity of o~-terpinene) that outper- formed the blank in the individual-chemical tests at either the low amount, the high amount, or over both amounts. Other mixtures in the first experiment con- tained fewer chemicals, each deletion based on lower attractiveness in the indi- vidual-chemical tests.
For experiments 2-4, each successive experiment was based on results of the preceding one. Generally, the minimum-chemical mixture from each exper- iment that retained attractiveness equal to CVSM was used as the maximum set of chemicals from which further eliminations were made.
Mixture experiment 5 was performed to evaluate further the attractiveness of D-limonene. Mix 3G contained hexanol and ethyl hexanoate at the same concentration as in mix 4D, and c~-terpinene at 80 ng//zl, twice the concentration in mix 4D, to substitute for D-limonene.
Mixture experiment 6 was conducted to determine if the attractiveness attributed to the commercial-grade c~-terpinene (Table 1:88 % purity) was due to c~-terpinene or to contaminants. Commercial c~-terpinene was purified by high- performance liquid chromatography (HPLC). A Waters HPLC (Waters Asso-

2804 ROBACKER ET AL.
TABLE 2. CHEMICAL CONCEYTRATIONS (ng//~l) IN MIXTURES USED IN MIXTURE EXPERIMENTS 1-8
Mix
Chemical 15 12 8 7A 7B 7C 6 5A 5B 4A 4B 4C 4D
Ethyl butyrate 40 Ethyl 2-methyl-
butyrate 40 40 40 40 40 Pentanol 4 4 4 4 4 (+)-Sabinene 40 40 40 40 40 40 40 40 40 40 40 t3-Myrcene 40 c~-Phellandrene 40 40 c~-Terpinene
88 % 40 40 40 40 40 40 40 40 40 40 40 40 40 99.7 %
Methyl hexanoate 40 40
D-Limonene 40 40 40 40 40 40 40 40 40 ~-Phellandrene 40 40 Hexanol 4 4 4 4 4 4 4 4 4 4 7-Terpinene 40 cis-3-Hexen- 1-ol 4 4 4 4 4 4 4 4 4 4 4 4 1,8-Cineole Ethyl hexanoate 4 4 4 4 4 4 4 4 4 4 4 4 trans-2-
Hexen-l-ol 4 4 p-Cymene
ciates) with a Resolve silica Radial-PAK HPLC cartridge (5-~m particle size)
was used. Mobile phase was hexane at 2 ml/min. Purity of the HPLC-purified
o~-terpinene was determined by GC. Three mixtures were prepared. Mixes 3G
and 2C were repeated. Mix 3G contained commercial o~-terpinene (88 % pure).
Mix 3H was prepared like mix 3G except purified o~-terpinene (99.7%) was
used. Mixture experiment 7 was conducted after results of mixture experiment 6
dictated that contaminants in commercial-grade c~-terpinene be identified. GC- MS of commercial c~-terpinene identified 1,8-cineole and p-cymene, among others. 1,8-Cineole was obtained (Table 1). Mix 3I contained p-cymene at 2
ng/#l to reflect its concentration in commercial c~-terpinene. Mix 3K contained
1,8-cineole at 4 ng//xl to reflect total cineole (1,4-cineole and 1/8-cineole) found in commercial c~-terpinene. The purposes of mixes 3I and 3K were to evaluate p-cymene and 1,8-cineole, respectively, as the active chemicals in commercial

A T T R A C T A N T FOR MEXICAN FRUIT FLY 2805
TABLE 2. Continued
Mix
4E 3A 3B 3C 3D 3E 3F 3G 3H 31 3J 3K 2A 2B 2C
40 40
40 40 40 40 40 80 40 40 80
40 40 40 40
4 4 4 4 4 4 4 4 4 4
4 4 4 4 4 4 4 4 4 4 4 4 4 4 4 4
2 2
cr Mix 3J was tested to evaluate (+) - sab inene in combinat ion with hexanol and ethyl hexanoate since this had not been done earlier.
Mixture experiment 8 was conducted to evaluate the abili ty of p -cymene to augment the attractiveness of mix 3K. Mix 4E equaled mix 3K plus p -cymene at 2 ng/txl. In addit ion, 1,8-cineole was tested individually at 4 ng//xl, during this experiment.
Ratio Experiment. This experiment was to determine the most attractive ratios o f 1,8-cineole, ethyl hexanoate, and hexanol. Eight mixtures were pre- pared, each containing all three chemicals. Ratios were 1 : 1 : 1, 10:1 : 1, 1: 10: 1, 1 :1 : 10, 10: 10: 1, 10: 1 :10 , 1: 10: 10, and 10: 10: 10, of 1,8-cineole, ethyl hexanoate, and hexanol , respectively. The 1 : 1 : 1 mixture equaled mix 3K. In all mixtures, " 1 " indicated 4 ng//xl and " 1 0 " indicated 40 ng/tA. The ratio mixtures were tested as in the other mixture experiments.
Dose-Response Experiment. Eight concentrations of the 10 : 1 : 1 mixture
2806 ROBACKER ET AL.
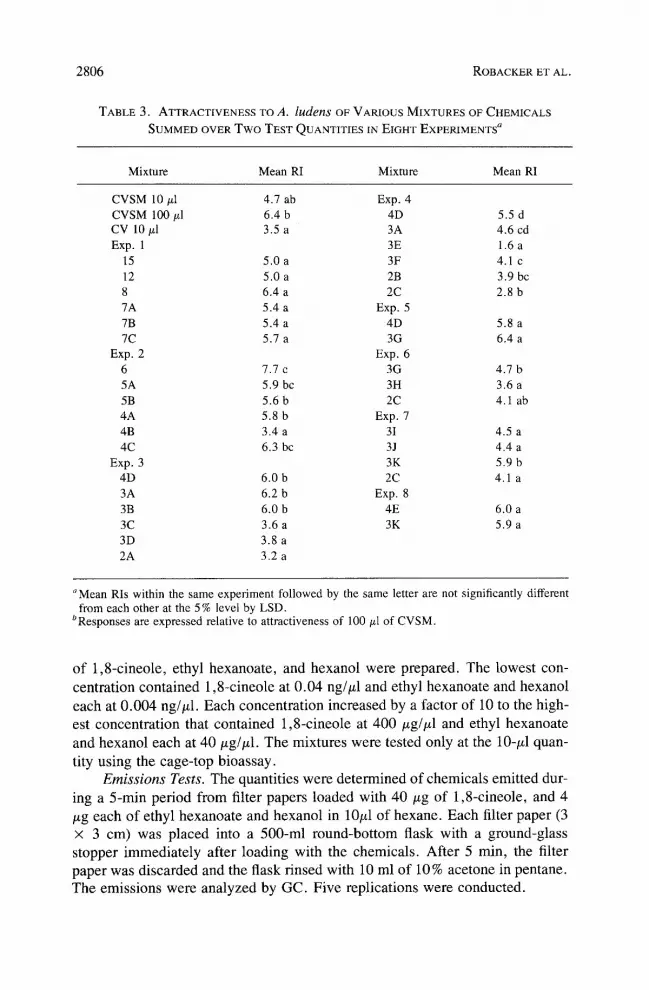
TABLE 3. ATTRACTIVENESS TO A. ludens OF VARIOUS MIXTURES OF CHEMICALS
SUMMED OVER T w o TEST QUANTITIES IN EIGHT EXPERIMENTS a
Mixture Mean RI Mixture Mean RI
CVSM 10/zl 4.7 ab Exp. 4
CVSM 100/xl 6.4 b 4D 5.5 d CV 10/zl 3.5 a 3A 4.6 cd Exp. 1 3E 1.6 a
15 5.0 a 3F 4.1 c
12 5.0 a 2B 3.9 bc
8 6.4 a 2C 2.8 b
7A 5.4 a Exp. 5
7B 5.4 a 4D 5.8 a
7C 5.7 a 3G 6.4 a Exp. 2 Exp. 6
6 7.7 c 3G 4.7 b
5A 5.9 bc 3H 3.6 a
5B 5.6 b 2C 4.1 ab
4A 5.8 b Exp. 7
4B 3.4 a 31 4.5 a
4C 6.3 bc 3J 4.4 a
Exp. 3 3K 5.9 b
4D 6.0 b 2C 4.1 a
3A 6.2 b Exp. 8
3B 6.0 b 4E 6.0 a
3C 3.6 a 3K 5.9 a
3D 3.8 a
2A 3.2 a
a Mean RIs within the same experiment followed by the same letter are not significantly different from each other at the 5 % level by LSD.
~Responses are expressed relative to attractiveness of 100/zl of CVSM.
of 1,8-cineole, ethyl hexanoate, and hexanol were prepared. The lowest con- centration contained 1,8-cineole at 0.04 ng//zl and ethyl hexanoate and hexanol each at 0.004 ng//zl. Each concentration increased by a factor of 10 to the high- est concentration that contained 1,8-cineole at 400 ~g/tzl and ethyl hexanoate and hexanol each at 40/xg/tzl. The mixtures were tested only at the 10-~1 quan- tity using the cage-top bioassay.
Emissions Tests. The quantities were determined of chemicals emitted dur- ing a 5-min period from filter papers loaded with 40 /zg of 1,8-cineole, and 4 /zg each of ethyl hexanoate and hexanol in 10/zl of hexane. Each filter paper (3 x 3 cm) was placed into a 500-ml round-bottom flask with a ground-glass stopper immediately after loading with the chemicals. After 5 min, the filter paper was discarded and the flask rinsed with 10 ml of 10% acetone in pentane. The emissions were analyzed by GC. Five replications were conducted.

A T T R A C T A N T FOR MEXICAN FRUIT FLY 2807
As a check for sample handling losses, a test similar to the one described above was conducted in which the 10/xl of test mixture was injected directly into a 500-ml round-bottom flask without filter paper. Five replications were conducted.
For another emissions test, a 10 : 1 : 1 (w/w/w) mixture of 1,8-cineole, ethyl hexanoate, and hexanol (CEH) was prepared neat. Either 25 or 100 Ixl of the CEH mixture was put into a 400-/A polyethylene microcentrifuge tube (Centaur West, Inc., Sparks, Nevada, Catalog #219-OMT1-006) and closed with the attached cap. The tube was put into a 500-ml round-bottom flask with a ground- glass stopper for 0.5 hr, then transferred to a second flask for 0.5 hr. Each flask was extracted immediately after removal of the tube. Five replications were conducted for both 25- and 100-txl quantities.
YB/CEH Comparison. The purpose of this experiment was to compare the attractiveness of CEH to an aqueous solution of Torula dried yeast and borax (YB), a common bait used for detection of A. ludens and other Anastrepha. YB traps were prepared using six Torula yeast-borax "bait pellets" (Sit-Khem Corp., Michigan City, Indiana) in 300 ml of water in a McPhail trap (Baker et al., 1944). The YB was allowed to ferment for four to five days before tests. CEH was prepared neat and either 25 or 100 ~1 were put into a polyethylene microcentrifuge tube as described above (Emissions Tests). The tubes were suspended in the entrance holes on the undersides of McPhail traps containing 300 ml of amber-colored water to mimic the color of YB. Amber-colored water was prepared from red, yellow, and green McCormick food colors (McCormick & Co., Inc., Baltimore, Maryland). The amber-colored water also contained 0.01% Triton X-100 (Rohm and Haas Co., Philadelphia, Pennsylvania) as a wetting agent.
The traps were tested in an aluminum-screened wind tunnel (2.0 m long x 0.7 m wide x 1.3 m high) with an airflow of 1-2 m/sec in a greenhouse. Approximately 800-1000 2-day-old flies were released into the downwind end of the cage at the beginning of each replication. The traps were removed from the cage after 1-2 hr. Four replications using 25 txl of CEH and five using 100 txl were conducted.
Statistical Analyses. Tandem GC-behavior bioassays of CV and CVSM were analyzed by paired t tests comparing tops of behavior peaks to baseline. All data were smoothed by averaging with the points from the preceding and following 15-sec periods. Thus, peak tops and baselines were lower and higher, respectively, than the actual data. Variances were calculated from unsmoothed data.
Individual chemical tests were analyzed by paired t tests to compare total counts beneath the solvent-control papers to counts beneath chemical-loaded papers. Mixture experiments 1-8 and the dose-response experiment were ran- domized complete block designs and were analyzed by separate analyses of variance (ANOVA). Means were compared by the least significant difference

2808 ROBACKER ET AL.
method. The ratio experiment was a randomized complete block design and was analyzed by a factorial ANOVA with three factors (chemicals). Captures in McPhail traps containing CEH and YB were compared by paired t tests.
RESULTS AND DISCUSSION
Identification of Chemicals in CV. Over 70 chemicals were identified by GC-MS. The 10 most abundant chemicals were: germacrene-D, 52% of the total chemicals in CV; caryophyllene, 9.2 %, ot-pinene, 6.6 %; unknown, 4.4 %; /3-bourbonene, 3.2 %; humulene, 1.8 %; alloaromadendrene, 1.7 %; 3,-cadinene, 1.5%; limonene, 1.5%; and unknown, 1.5%.
Tandem GC-Behavior Bioassays of CV and CVSM. The 5 to 15-min reten- tion time region was the most attractive region of the CV chromatogram, con- taining three distinct attraction peaks (each P < 0.001). The 28 chemicals in Table 1 were identified from this region by GC-MS (except that optical ster- eoisomerism was not determined). In addition to a-pinene and limonene dis- cussed above, major components in the 5 to 15-min region were: 3,-terpinene, 1.4% of the total; p-cymene, 1.2%; and/3-myrcene, 1.1%. Five smaller attrac- tion peaks in the 20 to 60-min retention time region were also significantly greater than baseline (P < 0.05). This region was not investigated. Only one of the three attraction peaks elicited by CV in the 5 to 15-min region was repro- duced by CVSM. Apparently, some unknown chemicals in CV but absent from CVSM were responsible for the other two attraction peaks.
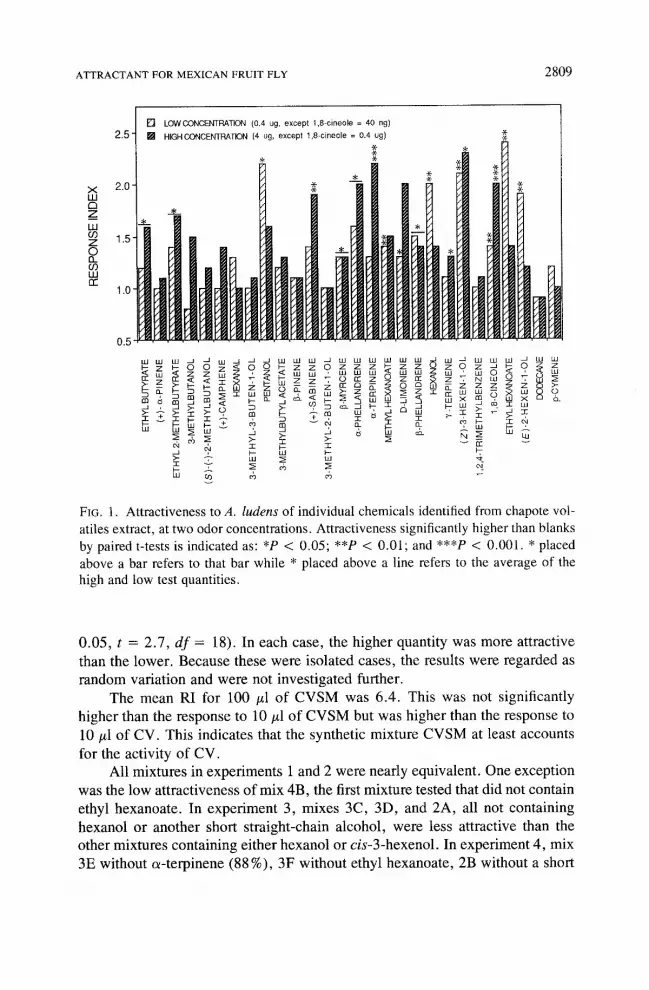
Tests of Individual Chemicals. Figure 1 shows that 11 chemicals were sig- nificantly attractive in at least one of the two test quantities and five others were significantly attractive summed over both test quantities. In general, short-chain, oxygenated molecules were more attractive at the lower odor concentration. These included pentanol, hexanol, ethyl hexanoate, and trans-2-hexen-l-ol. Exceptions were methyl hexanoate and cis-3-hexen-l-ol, which elicited nearly equal responses at the two concentrations. Terpenoid molecules were more attractive at the higher concentration. These included ( +)-sabinene, cr D-limonene, and 7-terpinene. 1,8-Cineole could not be compared since it was not tested at the same two concentrations as the other chemicals. Also, note that because ot-terpinene contained 3% 1,8-cineole (see Mixture Experiments, below), the apparently greater response to the higher concentration of a-terpinene may have been response to 1,8-cineole (120 ng in the 100-/zl sample of a-terpinene).
Mixture Experiments. The results of the mixture experiments, summed over low and high test quantities, are shown in Table 3. Summing over low and high quantities was done because they were equally attractive in all but two cases. The exceptions were: mix 4C (P < 0.05, t = 2.3, df = 18) and mix 3B (P <
A T T R A C T A N T F O R M E X I C A N F R U I T F L Y 2809
X ILl E) Z IJJ (/3 Z o 12. 09 LU Cr
[ ] LOW CONCENTRATION (0.4 ug, except 1,8-cineole = 40 ng)
2 . 5 - [ ] HIGH CONCENTRATION (4 ug, except 1,8-cineole = 0.4 ug)
.K-
~ 5 -
1 .0 "
0.5 . . . . . . . . . . . . . . . . . . . . . . . . . . . . .
u J
a co
, m %-
z z
FIG. 1. Attractiveness to A. ludens of individual chemicals identified from chapote vol- atiles extract, at two odor concentrations. Attractiveness significantly higher than blanks by paired t-tests is indicated as: *P < 0.05; **P < 0.01; and ***P < 0.001. * placed above a bar refers to that bar while * placed above a line refers to the average of the high and low test quantities.
0.05, t = 2.7, d f = 18). In each case, the higher quantity was more attractive than the lower. Because these were isolated cases, the results were regarded as random variation and were not investigated further.
The mean RI for 100 ~1 of CVSM was 6.4. This was not significantly higher than the response to 10 #1 of CVSM but was higher than the response to 10 #1 o f CV. This indicates that the synthetic mixture CVSM at least accounts
for the activity of CV. All mixtures in experiments 1 and 2 were nearly equivalent. One exception
was the low attractiveness of mix 4B, the first mixture tested that did not contain ethyl hexanoate. In experiment 3, mixes 3C, 3D, and 2A, all not containing hexanol or another short straight-chain alcohol, were less attractive than the other mixtures containing either hexanol or cis-3-hexenol. In experiment 4, mix 3E without a - te rp inene (88 %), 3F without ethyl hexanoate, 2B without a short

2810 ROBACKER ET AL.
straight-chain alcohol, and 2C without a terpenoid component, were less attrac- tive than 4D and 3A, both of which contained ethyl hexanoate, hexanol, and c~-terpinene (88%). Results to this point indicated that an alcohol such as hex- anol, an ester such as ethyl hexanoate, and a terpene such as a-terpinene were necessary and sufficient components of the minimum-component mixture that retained the attractiveness of the original 15-component mixture (mix 15).
Several questions remained. Did D-limonene contribute to the attractive- ness of mix 4D since it was slightly more attractive (not significant) than mix 3A? In experiment 5, mix 3G containing extra a-terpinene (88%) to replace D-limonene was at least as attractive as mix 4D containing both c~-terpinene (88%) and D-limonene. Thus D-limonene was eliminated from further consid- eration.
Mix 3G, the minimum-chemical mixture with attractiveness equal to CVSM, contained commercial grades of ethyl hexanoate, hexanol, and o~-terpinene (Table 1). Investigation by GC-MS showed that ethyl hexanoate and hexanol each contained no contaminants greater than 0.5 %. Commercial- grade o~-terpinene contained: c~-terpinene, 88.3 %; B-myrcene, 0.4 %; a-phellandrene, 1.4 %; D-limonene, 1.7 %; p-cymene, 2.9 %; 1,4-cineole, 1.6 %; 1,8-cineole, 3.0%; and unidentified components, 0.7%. a-Terpinene was pur- ified by HPLC to 99.7%.
In mixture experiment 6, mix 3H, containing purified o~-terpinene, was less attractive than mix 3g, containing commercial grade c~-terpinene. We concluded that o~-terpinene was not responsible for the attractiveness of commercial c~-terpinene in mix 3G.
In mixture experiment 7, mix 3K, containing 1,8-cineole, ethyl hexanoate, and hexanol, was ca. 1.4 times more attractive than mix 2C, containing only ethyl hexanoate and hexanol. Mixes 31 and 3J containing p-cymene and (+)-sabinene, respectively, in addition to ethyl hexanoate and hexanol, were not more attractive than mix 2C. We concluded that 1,8-cineole was the con- taminant of commercial grade a-terpinene responsible for part of the attractive- ness of mix 3G and that neither p-cymene nor (+)-sabinene contributed to the attractiveness of mix 3G.
In mixture experiment 8, mixes 4E and 3K were equivalent, indicating the p-cymene did not increase the attractiveness of a mixture containing 1,8-cineole, ethyl hexanoate, and hexanol, p-Cymene was eliminated from further consid- eration.
Reexamination of CV by GC-MS. Careful reexamination of CV found 1,8-cineole present as a trace component. The concentration was ca. 0.5 times that of c~-terpinene. 1,4-Cineole was not found.
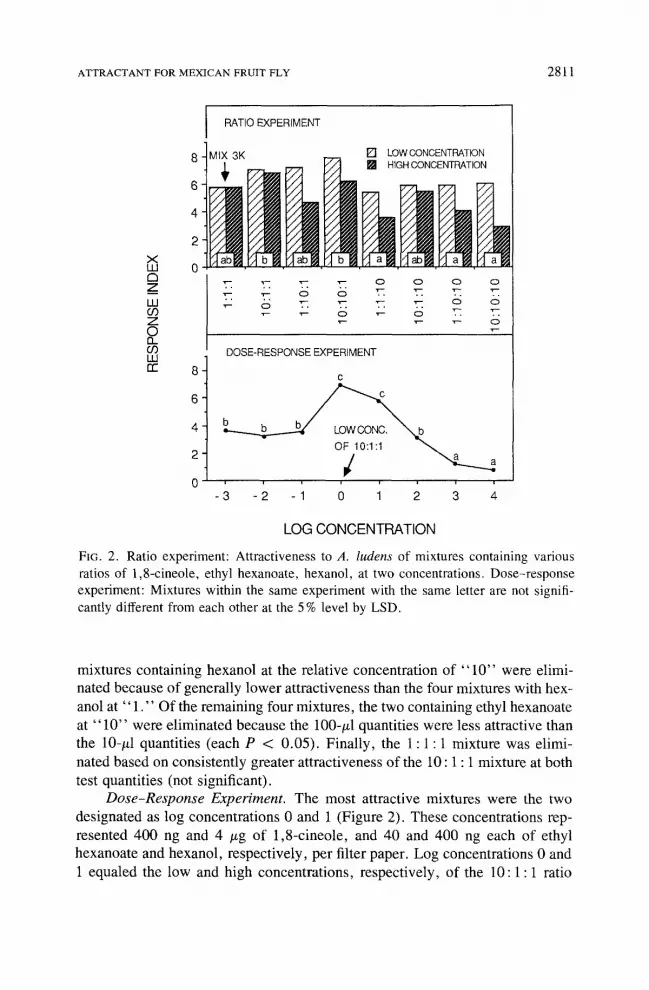
Ratio Experiment. Only small differences in attractiveness of the eight mix- tures occurred despite a wide range of chemical ratios (Figure 2). However, the 10 : 1 : 1 ratio was chosen for further testing for several reasons. First, the four
ATTRACTANT FOR MEXICAN FRUIT FLY 2811
,,>f s Z
W 09 Z 0 O_ 03 W rr
8 -
6 -
4 -
RATIO EXPERIMENT
MIX 3K [ ] LOW CONCENTRATION
.~. ~ .~. ~ o o o o
~ 0 ~ 0 ~
DOSE-RESPONSE EXPERIMENT
c
OF 10:1:1
-3 - 2 -1 0 1 2 3 4
LOG CONCENTRATION
FIG. 2. Ratio experiment: Attractiveness to A. ludens of mixtures containing various ratios of 1,8-cineole, ethyl hexanoate, hexanol, at two concentrations. Dose-response experiment: Mixtures within the same experiment with the same letter are not signifi- cantly different from each other at the 5 % level by LSD.
mixtures containing hexanol at the relative concentration of " 1 0 " were elimi- nated because of generally lower attractiveness than the four mixtures with hex- anol at "1 . " Of the remaining four mixtures, the two containing ethyl hexanoate at " 1 0 " were eliminated because the 100-/xl quantities were less attractive than the 10-/zl quantities (each P < 0.05). Finally, the 1 : 1 : 1 mixture was elimi- nated based on consistently greater attractiveness o f the 10:1 : 1 mixture at both test quantities (not significant).
Dose-Response Experiment. The most attractive mixtures were the two designated as log concentrations 0 and 1 (Figure 2). These concentrations rep- resented 400 ng and 4 /zg of 1,8-cineole, and 40 and 400 ng each of ethyl hexanoate and hexanol, respectively, per filter paper. Log concentrations 0 and 1 equaled the low and high concentrations, respectively, of the 10 : 1 : 1 ratio

2812 ROBACKER ET AL.
tested in the ratio experiment (Figure 2). Attractiveness decreased rapidly as log concentration increased to 2, 3, and 4. Attractiveness of log concentration - 1 was about half that of log concentration 0 (P < 0.05), but no further decrease in attractiveness occurred as log concentration decreased to - 2 and - 3. These results demonstrate that too much of this mixture is not attractive to the flies, while amounts less than optimum retain moderate attractiveness. We concluded that the 10:1 : 1 mixture of 1,8-cineole, ethyl hexanoate, and hexanol at 400 ng-4/zg, 40-400 ng and 40-400 ng, respectively, applied to filter papers, is the optimal mixture of these chemicals, at least under our conditions.
The log concentration 0 mixture (Figure 2) was 1.1 and 2.0 times more attractive than 100/zl of CVSM and 10/~1 of CV, respectively (Table 3). Note, however, that greater quantities of CVSM and CV that may have been more attractive were not tested. It also is possible that other potentially attractive chemicals are present in CV but in concentrations too low to elicit responses.
Receptor Site Physiology. The attractivenesses of 1,8-cineole, ethyl hex- anoate, and hexanol were additive. The high concentration of mix 3K, consist- ing of 400 ng each of the three chemicals applied to filter paper, elicited RIs of 5.8 in the ratio experiment, 5.9 in mixture experiment 7, and 6.5 in mixture experiment 8 for a mean RI of 6.1. In separate tests, 400 ng of each of the three individual chemicals elicited RIs of 2.0, 2.4, and 2.0 for 1,8-cineole, ethyl hexanoate, and hexanol, respectively (Figure 1). The sum of these RIs, 6.4, is nearly equal to the RI elicited by the three-chemical mixture (6.1). Further, the high concentration of mix 2C, consisting of 400 ng each of ethyl hexanoate and hexanol, elicited RIs of 3.6 in mixture experiment 4, 3.5 in mixture experiment 6, and 4.0 in mixture experiment 7 for a mean RI of 3.7. This RI is nearly equal to the sum of the RI's of its components, 2.4 + 2.0 = 4.4. Note, how- ever, that these additivity comparisons are only approximations, since RIs are not defined in a way that allows them to be summed.
These results cannot be explained simply as addition of more molecules stimulating the same receptor site. If that were true, then greater quantities of the chemicals would also elicit higher RIs. In fact, greater quantities of two of the chemicals, ethyl hexarloate and hexanol, elicited lower RIs than the smaller quantities (Figure 2). Instead, the results indicate the presence of three receptor types, each maximally sensitive to different molecule classes represented in this work by 1,8-cineole, ethyl hexanoate, and hexanol. Apparently, stimulation of each receptor type independently increases attraction behavior. Quite possibly, more receptor types sensitive to other chemical classes remain to be discovered in A. ludens.
Emissions Tests. The amounts emitted from filter papers during 5 min were 78, 75, and 40% of the 1,8-cineole, ethyl hexanoate, and hexanol, respectively, loaded onto the papers. We predicted that at least these percentages, possibly up to 100%, would emit from filter papers loaded with 1 or 10% as much of

ATTRACTANT FOR MEXICAN FRUIT FLY 2813
the chemicals, the amounts that were most attractive to flies in the dose-response experiment (log concentrations 0 and 1). The predicted emissions for 5-min periods were converted to a 0.5-hr basis by multiplying by six. Thus, the pre- dicted emission ranges covering the two most attractive concentrations were 1.9-24, 0.18-2.4 and 0.10-2.4/zg/0.5 hr for 1,8-cineole, ethyl hexanoate, and hexanol, respectively. These amounts were predicted rather than measured because of detection problems at the low emission rates.
Quantities emitted from polyethylene tubes during both 0.5-hr periods gen- erally were in the attractive ranges predicted above. One exception was the first 0.5 hr of emission from the polyethylene tubes containing 25 #1 of CEH. Even in this case, however, three of the five tubes emitted within the predicted attrac- tive ranges of the three chemicals. There were no significant differences between the 25- and 100-/~1 tubes. The mean emissions from the tubes during the first 0.5 hr (summed over 25- and 100-/zl amounts) were: 1,8-cineole, 10.1 • 4.2 tzg (mean ___ SE); ethyl hexanoate, 3.3 +_ 1.7/zg; and hexanol, 5.8 + 4.0/~g.
An important point is that filter papers used in cage-top bioassays emitted the chemicals in relatively still air while polyethylene tubes used in the green- house wind tunnel emitted chemicals in moving air. Thus, our predictions of attractive emission ranges of the chemicals, based on measurements in still air, should not be regarded as absolute.
High variability of emission was characteristic of the polyethylene tubes where standard errors averaged 64 % of the means. The variability was attrib- uted to the tubes instead of the extraction procedure since standard errors of the checks and filter paper emissions averaged only 10 and 16 % of their respective means.
Emissions from polyethylene tubes during the second 0.5 hr averaged 26 % of the first 0.5-hr emission. This result, coupled with the great variability of emission among tubes discussed above, demonstrates that research is needed to develop a dispenser that emits a reliable quantity of the chemicals for a long period of time.
FB/CEH Comparison. Table 4 shows that CEH attracted ca. 1.8 times as many starved, 2-day-old, male and female flies as YB, when both baits were tested in McPhail traps in a cage in a greenhouse (P < 0.001). The 25- and 100-~1 quantities of CEH performed equally. Robacker et al. (1990) showed that fermented chapote fruit was 3.6 times more attractive than YB in green- house experiments. This suggests that fermented chapote fruit contains addi- tional chemicals that could enhance the attractiveness of CEH.
The results of this work suggest that CEH may be a more potent field attractant than YB for A. ludens. However, CEH was developed using starved, 2-day-old, laboratory-culture flies as test animals. Responses of older flies, wild flies, and unstarved flies have not been evaluated. Robacker et al. (1990) showed that laboratory flies of various ages, starvation levels, and mating status were

2814 ROBACKER ET AL.
TABLE 4. CAPTURES OF 2-DAY-OLD, NEVER-FED ADULTS OF A. ludens BY COMPETING PAIRS OF MCPHAIL TRAPS BAITED WITH NEAT MIXTURE OF I~8-C1NEOLE~ ETHYL
HEXANOATE, AND HEXANOL (CEH) ( 1 0 : 1 : 1) vs . AQUEOUS SOLUTION OF Torl~[a DRIED YEAST AND BORAX (YB) IN WIND TUNNEL IN GREENHOUSE a
Number of Males + CEH/YB Bait replications Males b Females h femaled' (M + F)
25 #1 CEH 4 44 40 42 1.8 YB 25 22 23
100/zl CEH 5 45 40 43 1.8 YB 25 23 24
Overall CEH 9 45b 40b 43b 1.8 YB 25a 23a 24a
CEH traps contained 300 ml of amber-colored water to mimic YB color; YB traps contained 300 ml of water + 6 Torula yeast bait pellets.
bData are mean percentages of the total flies in the chamber captured by each trap. Means in the same vertical column followed by different letters are significantly different at the 0.1% level by paired t tests.
attracted to chapote odor, but responses were not compared with responses to YB.
Another important point is that the comparison of CEH with YB was con- ducted with gamma-irradiated flies. Galun et al. (1985) showed that attractive- ness of yeast hydrolysate to two tephritid species irradiated with gamma rays was 50% less than to unirradiated flies. Similarly, Robacker et al. (1990) found that gamma irradiation adversely affected responses of A. ludens females to chapote odor. Thus, irradiation of flies probably lowered responses to both YB and CEH, but perhaps more so to YB because of a probable link between ste- rility, need for protein, and attractiveness of proteinaceous baits such as YB (Galun et al., 1985).
Finally, CEH-baited McPhail traps used in the present work also contained amber-colored water. The purpose was to equalize factors other than odor dif- ferences. Under dry climatic conditions, water may be an important component of the attractiveness of YB. In one study, traps containing proteinaceous baits in water were 20 times more attractive to Dacus dorsalis in dry than in wet climates (Cunningham et al., 1978). Water also may be necessary in CEH- baited traps to make them competitive with YB. In our tests, attractiveness of water was minimized by giving flies access to water before tests. Nevertheless, it has not been shown that CEH will attract flies in traps without water.
ATTRACTANT FOR MEXICAN FRUIT FLY 2815
Acknowledgments--The authors thank Bianca Chapa, Jimmy Justin, and Maura Rodriguez for technical assistance; Sammy Ingle for insects; and A.W. Guenthner (USDA-APHIS, Mission, Texas) for irradiation of pupae. This work was partially supported by a grant (86-004-EP) from the California Department of Food and Agriculture. Use of a product brand in this work does not constitute an endorsement by the USDA.
REFERENCES
BAKER, A.C., STONE, W.E., PLUMMER, C.C., and MCPHAIL, M. 1944. A review of studies on the Mexican fmitfly and related Mexican species. U.S. Department of Agriculture Misc. PuN. 531.
BURDITT, A.K., JR., and McGOVERN, T.P. 1979. Chemicals tested as attractants for the Caribbean fruit fly, 1972-78. U.S. Department of Agriculture, Agricultural Reviews and Manuals, Southern Series, No. 6.
CUNMNCHAM, R.T., NAKAGAWA, S., SUDA, D.Y., and URA~O, T. 1978. Tephritid fruit fly trap- ping: Liquid food baits in high and low rainfall climates. J. Econ. Entomol. 71:762-763.
GALUN, R., GOTHILF, S., BLONDHEIM, S., SHARP, J.L. MAZOR, M., and LACHMAN, A. 1985. Comparison of aggregation and feeding responses by normal and irradiated fruit flies, Ceratitis capitata and Anastrepha suspensa (Diptera: Tephritidae). Environ. Entomol. 14:726-732.
HEDSTROM, I. 1988. Una sustancia natural en la captura de moscas de la fruta del genero Anastre- pha Schiner (Diptera: Tephritidae). Rev. Biol. Trop. 36:269-272.
ROBACKER, D.C., and HART, W.G. 1984. A bioassay for investigation of sex pheromones of fruit flies. Southwest. Entomol. 9:134-137.
ROBACKER, D.C., GARCIA, J.A., and HART, W.G. 1990. Attraction of a laboratory strain of Anas- trepha ludens (Diptera: Tephritidae) to the odor of fermented chapote fruit and to pheromones in laboratory experiments. Environ. Entornol. 19:403-408.
SHAW, J.G., LOPEZ-D, F., and CHAMBERS, D.L. 1970. A review of research done with the Mexican fruit fly and the citrus blackfly in Mexico by the Entomology Research Division. Bull Entomol. Soc. Am. 16:186-193.