a new evaluation of skin factor in inclined wells with ... - mdpi
TRANSCRIPT
Energies 2021, 14, 5585. https://doi.org/10.3390/en14175585 www.mdpi.com/journal/energies
Article
A New Evaluation of Skin Factor in Inclined Wells
with Anisotropic Permeability
Ekhwaiter Abobaker 1,*, Abadelhalim Elsanoose 1, Faisal Khan 1, Mohammad Azizur Rahman 2, Amer Aborig 1
and Khalid Noah 3
1 Faculty of Engineering and Applied Science, Memorial University of Newfoundland,
St. John’s, NL A1C 5S7, Canada; [email protected] (A.E.); [email protected] (F.K.); [email protected] (A.A.) 2 Petroleum Engineering, Texas A&M University at Qatar, Doha 23874, Qatar; [email protected] 3 Faculty of Engineering, University of Tobruk, Tobruk, Libya; [email protected]
* Correspondence: [email protected]
Abstract: Oil and gas well productivity can be affected by a number of different skin factors, the
combined influences of which contribute to a well’s total skin factor. The skin caused by deviated
wells is one such well‐known factor. The present study aimed to investigate skin effects caused by
deviated well slants when considering vertical‐to‐horizontal permeability anisotropy. The research
employed computational fluid dynamics (CFD) software to simulate fluid flows in inclined wells
through the injection of water with Darcy flow using 3D geometric formations. The present work
investigates the effects of four main characteristics—namely, the permeability anisotropy, wellbore
radius, reservoir thickness, and deviation angle—of open‐hole inclined wells. Additional investiga‐
tions sought to verify the effect of the direction of perforations on the skin factor or pressure drop
in perforated inclined wells. In the case of an inclined open hole well, the novel correlation produced
in the current study simplifies the estimation of the skin factor of inclined wells at different inclina‐
tion angles. Our comparison indicates good agreement between the proposed correlation and avail‐
able models. Furthermore, the results demonstrated a deviation in the skin factor estimation results
for perforated inclined wells in different perforation orientation scenarios; therefore, existing mod‐
els must be improved in light of this variance. This work contributes to the understanding and sim‐
ulation of the effects of well inclination on skin factor in the near‐wellbore region.
Keywords: skin factor; inclined wells; anisotropic permeability; CFD
1. Introduction
To a great extent, a well’s geometry may determine its production performance.
Common geometrical shapes of wells include inclined, undulating, multi‐branched, hor‐
izontal, and vertical. Both the increasing complexity of sites as a result of drilling in non‐
traditional locations and the geological condition of the reservoir increase the overall com‐
plexity. To overcome these potential challenges, technology developed for inclined wells
is beginning to be used during the extraction stage. The extent to which inclination affects
an inclined open‐hole well may be quantified using the inclination pseudo‐skin factor.
Investigations of transient inclined well solutions show radial flows around the length of
the inclined well, which can be applied when determining the effects of combined well
deviation and formation damage. In the damaged zones, flow convergence caused by well
deviation typically occurs close to the near‐wellbore region prior to the entry of the fluid
into the damaged zone. Figure 1 presents a schematic of flow convergence at a formation‐
damaged deviated well.
Citation: Abobaker, E.;
Elsanoose, A.; Khan, F.;
Rahman, M.A.; Aborig, A.; Noah, K.
A New Evaluation of Skin Factor in
Inclined Wells with Anisotropic
Permeability. Energies 2021, 14, 5585.
https://doi.org/10.3390/en14175585
Academic Editor:
Guglielmo Lomonaco
Received: 2 August 2021
Accepted: 31 August 2021
Published: 6 September 2021
Publisher’s Note: MDPI stays neu‐
tral with regard to jurisdictional
claims in published maps and institu‐
tional affiliations.
Copyright: © 2021 by the authors. Li‐
censee MDPI, Basel, Switzerland.
This article is an open access article
distributed under the terms and con‐
ditions of the Creative Commons At‐
tribution (CC BY) license (http://crea‐
tivecommons.org/licenses/by/4.0/).

Energies 2021, 14, 5585 2 of 16
Figure 1. Schematic of inclined open‐hole well flow with formation damage.
In the case of completely or partially perforated wells where the flow is located far
from a wellbore, fluid typically moves along a radial‐like flow in the general direction of
the wellbore. This flow type usually occurs in cases of wells designated as partially perfo‐
rated vertical structures. In such cases, well inclination and perforations have little impact
on fluid streamlines. Instead, as the fluid nears the wellbore, the streamlines slowly con‐
verge until they are perpendicular in relation to the axis of the wellbore. This results in a
pseudo‐radial flow that surrounds the inclined wellbore prior to arrival at the perforated
well. When the fluid streamlines finally do reach the near‐wellbore region, they are redi‐
rected due to perforations and formation damage, as shown in Figure 2.
Figure 2. Schematic of inclined and completely perforated well with perforations. Perpendicular to
well and formation damage.
In inclined wells, the pressure transient behavior needs to be determined with math‐
ematical models. Many models have been developed over the past several decades for the
prediction of perforated skin for inclined wells; Cinco, Miller, and Ramey (1975) [1] de‐
scribed analytical solutions for inclined wells that take into account pseudo‐radial flow
periods for relatively large time values. The slant pseudo‐skin equation of Cinco et al.
Energies 2021, 14, 5585 3 of 16
(1975) is commonly applied when estimating how a well’s productivity is influenced by
inclination. After determining the pseudo‐skin’s inclination, the additional pressure
change caused by well deviation can be expressed as follows:
𝑆 𝜃, ℎ 𝜃
41
.
𝜃
56
.
logℎ
100 (1)
ℎℎ𝑟
𝑘𝑘 (2)
For 0° 𝜃 75°, 𝜃 𝑡𝑎𝑛 tan 𝜃 (3)
Later, (Besson 1990) employed a semi‐analytical simulator to determine pressure de‐
cline curves in slant horizontal wells located within an isotropic, infinite, and homogene‐
ous formation.
𝑆 𝑙𝑛4 𝑟𝐿
ℎ𝐿
ln√𝐿ℎ4 𝑟
(4)
This formula can then be changed to accommodate an anisotropic reservoir via spa‐
tial transformation (i.e., real medium to isotropic medium) (Besson 1990) [2], as shown in
Equation (5) below:
𝑆 ln4 𝑟𝐿
1
𝐼 𝛾 ℎ𝛾𝐿
ln√𝐿ℎ4 𝑟
2 𝐼 √𝛾
11𝛾
(5)
𝛾 𝑐𝑜𝑠 𝜃1
𝐼𝑠𝑖𝑛 𝜃 (6)
𝐼𝑘𝑘 (7)
Rogers and Economides (1996) [3] later developed a correlation that involved the
skin’s complete penetration of deviated wells located in anisotropic reservoirs. The re‐
searchers employed a semi‐analytical productivity index model proposed previously by
Besson (1990) [2]. The model was intended to be applied in horizontal wells as a means of
taking well deviation into account. To measure the effect of anisotropy, Rogers and Econ‐
omides (1996) [3] applied the transformation used in the experiments of Besson (1990) [2].
For 𝐼 1, 𝑆 1.64. .
. (8)
For 𝐼 1, 𝑆 2.48. .
. (9)
In related works, Yildiz and Ozkan (1998) [4], Ozkan, Yildiz, and Raghavan, (1999)
[5], and Ozkan and Raghavan (2000) [6] investigated rate distribution and transient pres‐
sure behavior in perforated and slanted wells. Their applied calculation strategies for
these types of wells were shown to boost both computational accuracy and efficiency.
Sensitivity studies were also carried out by Suk Kyoon, Ouyang, and Huang (2008) [7] to
determine analytical correlations that could be used to calculate deviated well productiv‐
ity. The researchers found that the available semi‐analytical correlations appeared to be
Energies 2021, 14, 5585 4 of 16
unsuitable when applied to wells that had a deviation angle of 75° or greater. Semi‐ana‐
lytical correlations also did not appear to be suitable in calculations for partially penetrat‐
ing deviated wells. Additionally, they reviewed several different analytical solutions for
the inflow performance relationship (IPR) and productivity index (PI). Their extensive re‐
view of the literature was augmented with case studies that compared correlations in sim‐
ilar categories as a means of building selection guidelines. Numerous empirical and the‐
oretical models and correlations of variable reservoir parameters have been devised since
Darcy’s law was first proposed in 1856 [8]. These parameters include elements such as
area, reservoir shape, time independence, well trajectory, and fluid phases.
In recent studies conducted by Wang, Xue, Gao, and Tong (2012) [9], a highly devi‐
ated well inflow model for an anisotropic reservoir was tested. Their results indicated that
an increase in the anisotropy index effectively boosted the deviation angle effect on well
productivity. In the same year, Ghahri and Jamiolahmady (2012) [10] conducted a sensi‐
tivity study that reviewed skin values from the work of Rogers and Economides (1996)
[3]. They proposed that these values had been underestimated by the researchers and thus
differed significantly in comparison to those produced by the models of Cinco et al. (1975)
[1] and Besson (1990) [2] when applying the same or similar transformation models in
isotropic media.
In a subsequent study, Feng and Liu (2014) [11] developed a mathematical model for
testing inclined wells that featured impermeable faults using point source theory. Re‐
cently, Dong, Wang, and Wang (2018) [12] proposed a model for the skin factor of wells
that were directionally drilled and partially penetrated in anisotropic reservoirs. Their aim
was to simulate how slants were affected by flow and drilling. There are several draw‐
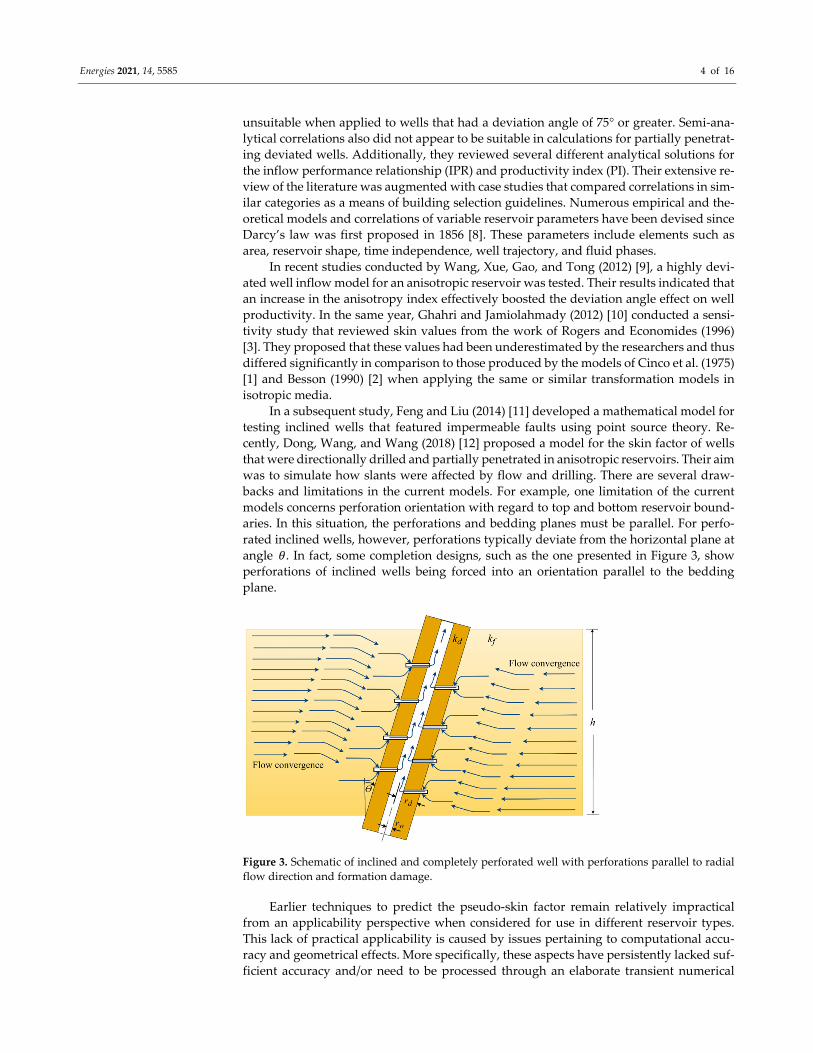
backs and limitations in the current models. For example, one limitation of the current
models concerns perforation orientation with regard to top and bottom reservoir bound‐
aries. In this situation, the perforations and bedding planes must be parallel. For perfo‐
rated inclined wells, however, perforations typically deviate from the horizontal plane at
angle 𝜃. In fact, some completion designs, such as the one presented in Figure 3, show
perforations of inclined wells being forced into an orientation parallel to the bedding
plane.
Figure 3. Schematic of inclined and completely perforated well with perforations parallel to radial
flow direction and formation damage.
Earlier techniques to predict the pseudo‐skin factor remain relatively impractical
from an applicability perspective when considered for use in different reservoir types.
This lack of practical applicability is caused by issues pertaining to computational accu‐
racy and geometrical effects. More specifically, these aspects have persistently lacked suf‐
ficient accuracy and/or need to be processed through an elaborate transient numerical
Energies 2021, 14, 5585 5 of 16
simulator. Accordingly, the primary aim of the present work is to present a numerical
model that can simulate the real conditions of fluid flows in inclined wells. In order to
compare and discuss the accuracy of the proposed model, the analytical model of Cinco
et al. (1975) [1] and the Besson (1990) [2] anisotropic formulations were utilized as a basis
for the comparison of numerical simulations of slant skin. This was accomplished by de‐
termining the differences between cases of vertical open‐hole and inclined‐well pressure
drops.
2. Methodology
This study is an extension of the work of Abobaker et al. (2021A) [13] and Abobaker
et al. (2021B) [14], which conducts the two main investigative procedures of numerical
and statistical analysis for more accurate estimation of the skin factor of inclined wells
with anisotropic permeability. Abobaker et al. (2021A and 2021B) used the experimental
schemes (2018 and 2019, [15,16]) as a radial flow cell (RFC). Their experiments carried out
on fluid flows through the perforation samples primarily relied on rather simplistic as‐
sumptions, such as those presented by Rahman et al. (2006, 2007a, 2007b, 2008, and 2016)
[17–21]. The results of numerical model used in this study were validated with the exper‐
imental data of studies’ Abobaker et al. (2021A and 2021B). In this study, statistical anal‐
ysis was coupled with numerical simulation to expand the investigation of fluid flow in
the near‐wellbore region by producing data that cannot be obtained experimentally due
to limitations in the experimental setup and, especially, the small sample size.
2.1. Numerical Simulation Procedure
ANSYS (ANSYS Inc., Pittsburgh, PA, USA) fluent (3D) 18.1 was used for numerical
simulations of fluid flow through a near‐wellbore region. The cylindrical geometry—in‐
cluding permeability anisotropy, wellbore radius, reservoir thickness, and deviation an‐
gle—were used to represent near‐wellbore conditions in inclined wells. The single phase
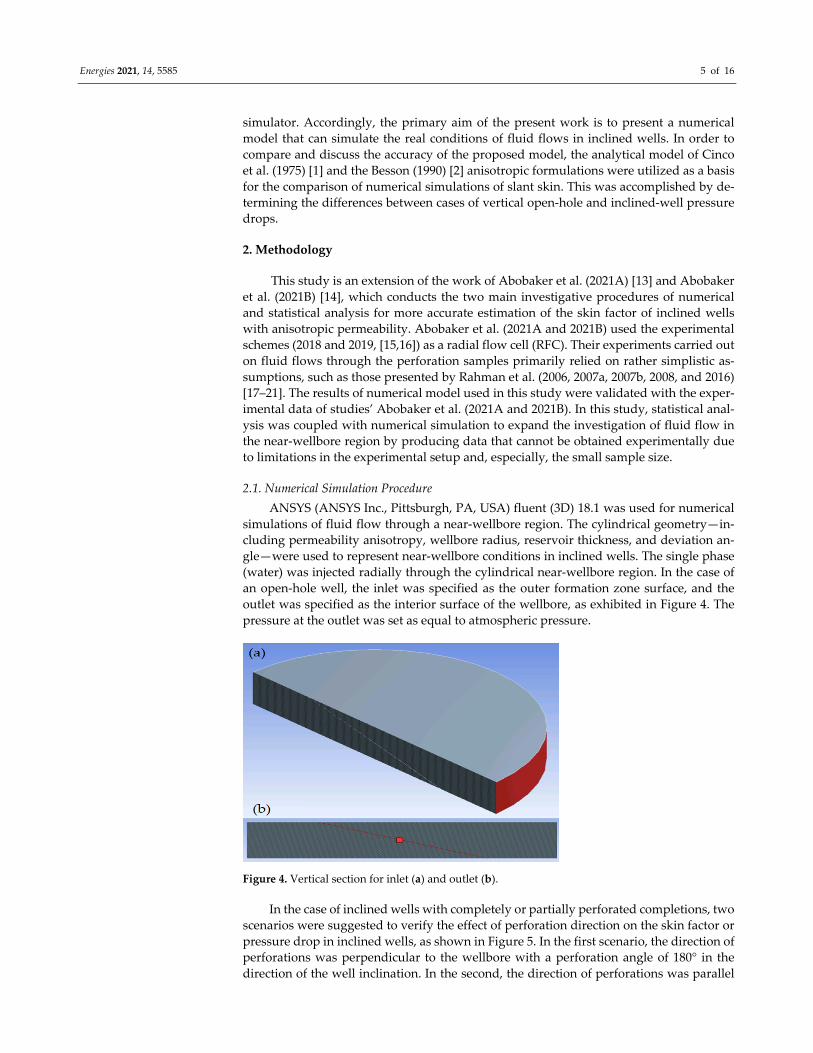
(water) was injected radially through the cylindrical near‐wellbore region. In the case of
an open‐hole well, the inlet was specified as the outer formation zone surface, and the
outlet was specified as the interior surface of the wellbore, as exhibited in Figure 4. The
pressure at the outlet was set as equal to atmospheric pressure.
Figure 4. Vertical section for inlet (a) and outlet (b).
In the case of inclined wells with completely or partially perforated completions, two
scenarios were suggested to verify the effect of perforation direction on the skin factor or
pressure drop in inclined wells, as shown in Figure 5. In the first scenario, the direction of
perforations was perpendicular to the wellbore with a perforation angle of 180° in the
direction of the well inclination. In the second, the direction of perforations was parallel

Energies 2021, 14, 5585 6 of 16
to radial flow direction with the same perforation angle. The effect of increasing the three
factors (perforation depth 𝐿 , perforation diameter 𝑟 , and penetration space 𝑛 ) on the
skin factor was analyzed, as shown in Table 1.
Figure 5. Schematic of inclined and completely perforated well with perforations perpendicular to
well and formation damage.
The uniform mesh and cut mesh methods were used to generate high quality mesh,
as shown in Figure 6. This configuration contributed to the production of a high mesh
density to capture the significant pressure gradients in the border regions.
Figure 6. The shape of the uniform configuration mesh used in CFD simulations.
Table 1. Dimensions and properties of the vertical near‐wellbore region and the ranges of three
investigated parameters.
Dimensions and Properties of the Sample Values (Units)
Reservoir or pay zone thickness (ℎ) 2.66 m
Reservoir radius (𝑟 ) 10 m
Formation permeability (𝑘 ) 10−14 m2
Porosity (∅ 20%
Flow rate (𝑄 2 L/min
Viscosity of water (µ) 0.00103 kg/m−s
Perforation depth 𝐿 30.48–91.44 cm
Perforation diameter 𝑟 ) 1–2.5 cm
Penetration space 𝑛 ) 1–5 perforations/30.48 cm
Energies 2021, 14, 5585 7 of 16
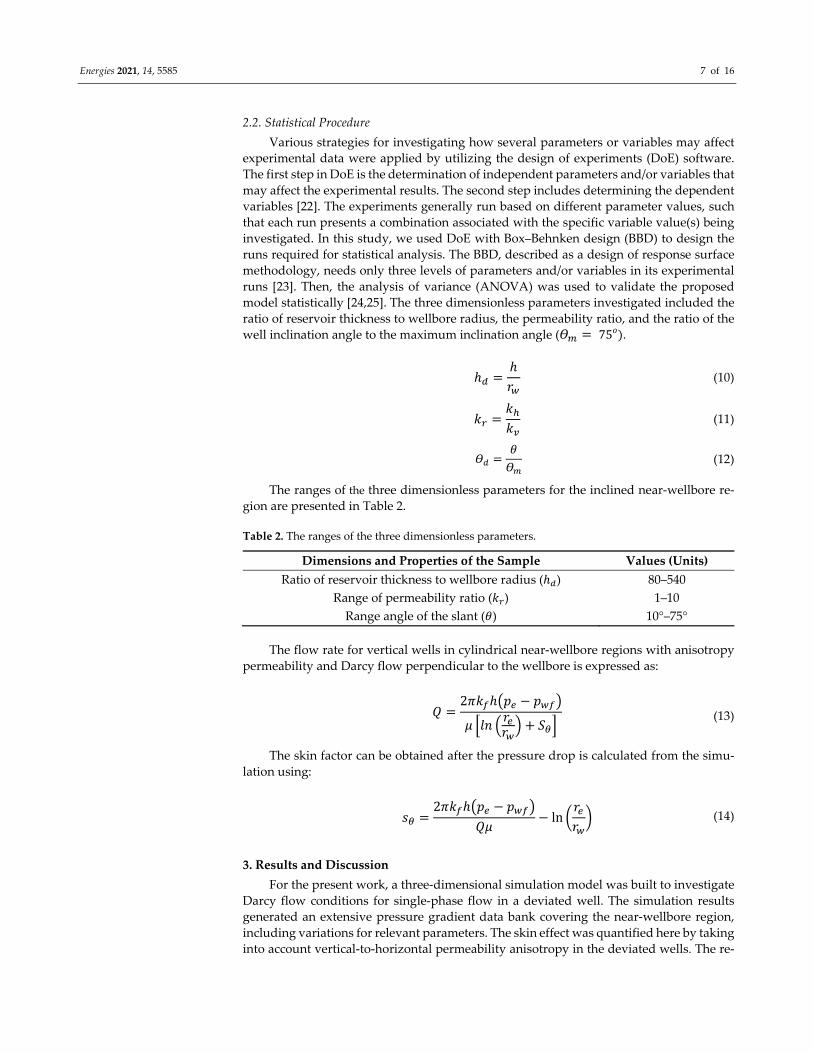
2.2. Statistical Procedure
Various strategies for investigating how several parameters or variables may affect
experimental data were applied by utilizing the design of experiments (DoE) software.
The first step in DoE is the determination of independent parameters and/or variables that
may affect the experimental results. The second step includes determining the dependent
variables [22]. The experiments generally run based on different parameter values, such
that each run presents a combination associated with the specific variable value(s) being
investigated. In this study, we used DoE with Box–Behnken design (BBD) to design the
runs required for statistical analysis. The BBD, described as a design of response surface
methodology, needs only three levels of parameters and/or variables in its experimental
runs [23]. Then, the analysis of variance (ANOVA) was used to validate the proposed
model statistically [24,25]. The three dimensionless parameters investigated included the
ratio of reservoir thickness to wellbore radius, the permeability ratio, and the ratio of the
well inclination angle to the maximum inclination angle (𝛳 75𝜊 .
ℎℎ𝑟 (10)
𝑘𝑘𝑘 (11)
𝛳𝜃𝛳 (12)
The ranges of the three dimensionless parameters for the inclined near‐wellbore re‐
gion are presented in Table 2.
Table 2. The ranges of the three dimensionless parameters.
Dimensions and Properties of the Sample Values (Units)
Ratio of reservoir thickness to wellbore radius (ℎ ) 80–540
Range of permeability ratio (𝑘 ) 1–10
Range angle of the slant (𝜃) 10°–75°
The flow rate for vertical wells in cylindrical near‐wellbore regions with anisotropy
permeability and Darcy flow perpendicular to the wellbore is expressed as:
𝑄2𝜋𝑘 ℎ 𝑝 𝑝
𝜇 𝑙𝑛𝑟𝑟 𝑆
(13)
The skin factor can be obtained after the pressure drop is calculated from the simu‐
lation using:
𝑠2𝜋𝑘 ℎ 𝑝 𝑝
𝑄𝜇ln
𝑟𝑟
(14)
3. Results and Discussion
For the present work, a three‐dimensional simulation model was built to investigate
Darcy flow conditions for single‐phase flow in a deviated well. The simulation results
generated an extensive pressure gradient data bank covering the near‐wellbore region,
including variations for relevant parameters. The skin effect was quantified here by taking
into account vertical‐to‐horizontal permeability anisotropy in the deviated wells. The re‐

Energies 2021, 14, 5585 8 of 16
sults of numerical investigations showed that CFD simulation was able to predict the ef‐
fect of an inclined well on the pressure gradient in the near‐wellbore region, as shown in
Figure 7. Based on these outcomes, our numerical model presents a streamlined method
that significantly outperforms the requirements of 3D simulation as used in previously
developed simulations. In fact, the simulation results agree with the actual flow perfor‐
mance by utilizing the skin effect applied to inclined wells.
Geometric skin essentially determines how geometry affects flow in a deviated well‐
bore. In Equation (14), the skin is utilized to determine the equivalent open‐hole produc‐
tivity and shows a flow rate that is nearly the same as that of the deviated wells. To con‐
struct the formula, a data bank was generated that includes geometrical parameter varia‐
tions such as reservoir thickness, wellbore radius, deviation angle, formation properties,
and anisotropy. A deviated well’s flow regime can be divided into two regions to provide
a deeper perspective. In such a division, one region represents the flow regime near the
deviated well and is primarily affected by geometrical parameters. The other region is
only slightly affected by geometrical parameters as the flow regime proceeds in a mostly
radial pattern.
Figure 7. Numerical results of the pressure gradient through the near‐wellbore region for vertical
angle 90° and inclination angle 75° with two dimensionless parameters (ℎ = 108.267, 𝑘 = 1) and flow rate 𝑄 = 2 L/min). 104
Twelve numerical runs were performed to obtain a statistical model deemed suitable
via ANOVA analysis with the BBD model; the results of skin factor values for twelve nu‐
merical runs are shown in Table 3.
Table 3. Twelve numerical runs and the results of skin factor.
Runs 𝒉𝒅 𝜭𝒅 𝒌𝒓 𝑺𝜭
1 180 0.566665 10 −0.35
2 180 0.13333 5.5 −0.0010
3 180 1 5.5 −2.9
4 360 0.13333 10 −0.02
5 180 0.566665 1 −1.32
6 360 0.13333 1 −0.1
7 360 1 1 −4.2
8 360 1 10 −2.22
9 540 1 5.5 –3.1
10 540 0.566665 10 −0.41
11 540 0.13333 5.5 −0.06
12 540 0.566665 1 −1.8
Energies 2021, 14, 5585 9 of 16
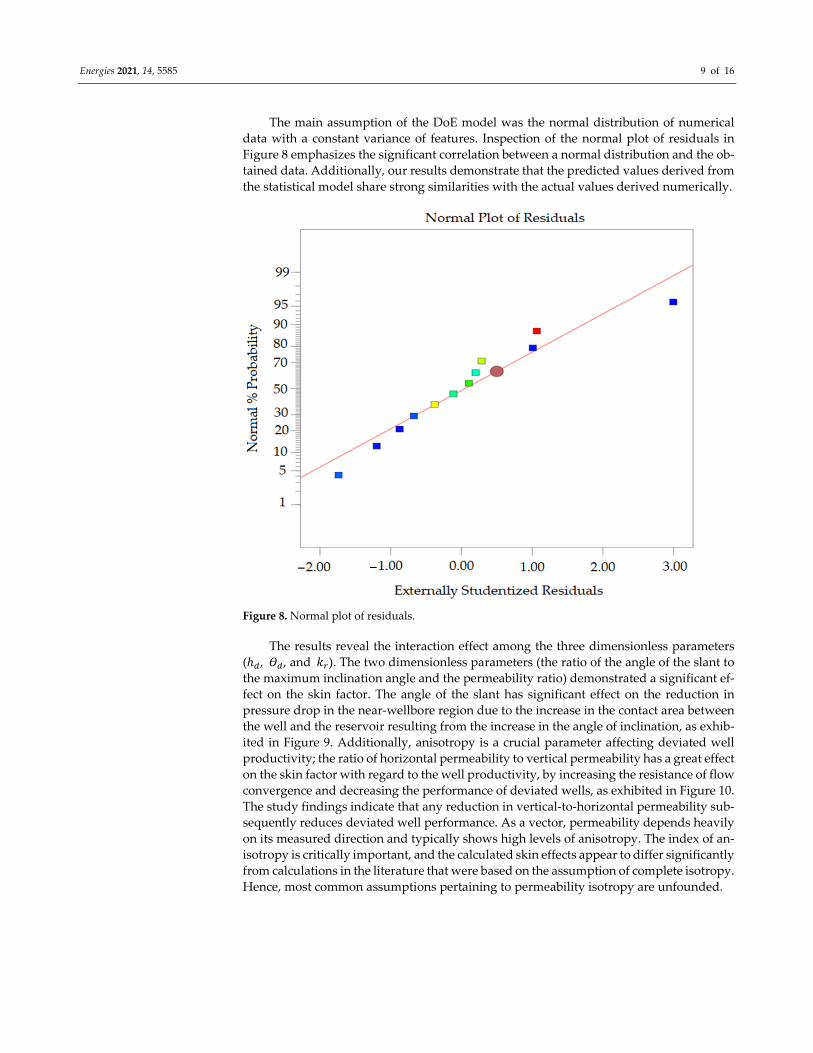
The main assumption of the DoE model was the normal distribution of numerical
data with a constant variance of features. Inspection of the normal plot of residuals in
Figure 8 emphasizes the significant correlation between a normal distribution and the ob‐
tained data. Additionally, our results demonstrate that the predicted values derived from
the statistical model share strong similarities with the actual values derived numerically.
Figure 8. Normal plot of residuals.
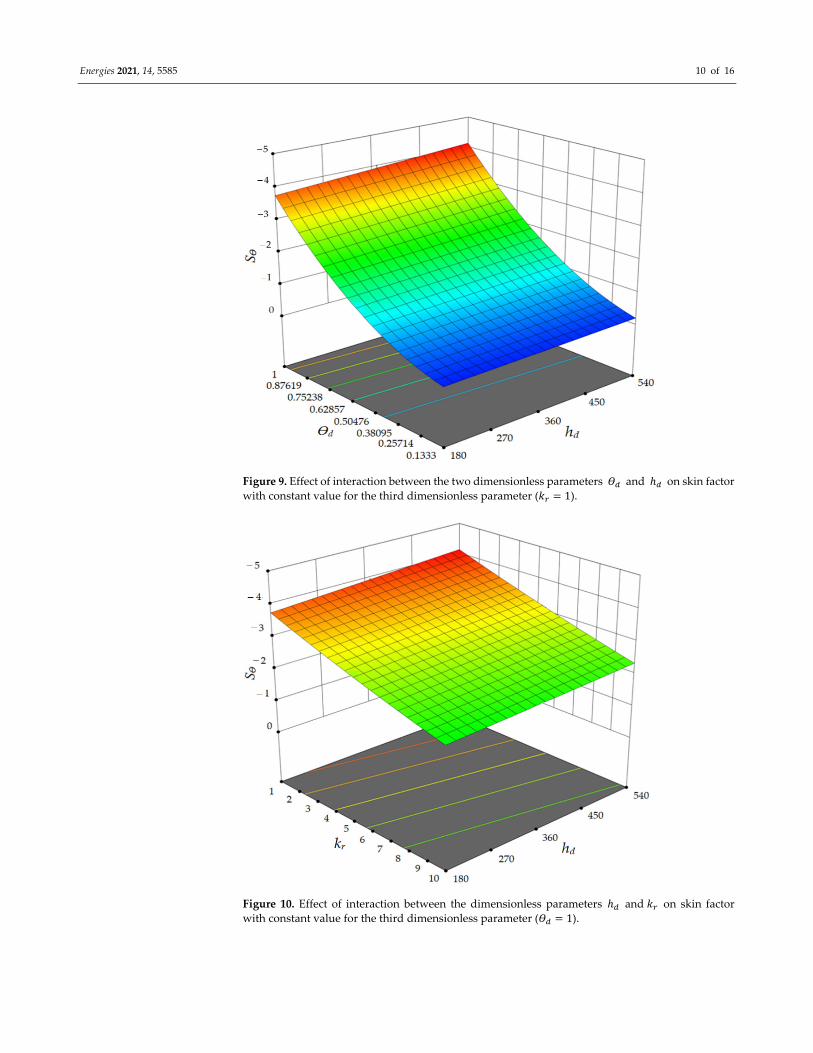
The results reveal the interaction effect among the three dimensionless parameters
(ℎ , 𝛳 , and 𝑘 ). The two dimensionless parameters (the ratio of the angle of the slant to
the maximum inclination angle and the permeability ratio) demonstrated a significant ef‐
fect on the skin factor. The angle of the slant has significant effect on the reduction in
pressure drop in the near‐wellbore region due to the increase in the contact area between
the well and the reservoir resulting from the increase in the angle of inclination, as exhib‐
ited in Figure 9. Additionally, anisotropy is a crucial parameter affecting deviated well
productivity; the ratio of horizontal permeability to vertical permeability has a great effect
on the skin factor with regard to the well productivity, by increasing the resistance of flow
convergence and decreasing the performance of deviated wells, as exhibited in Figure 10.
The study findings indicate that any reduction in vertical‐to‐horizontal permeability sub‐
sequently reduces deviated well performance. As a vector, permeability depends heavily
on its measured direction and typically shows high levels of anisotropy. The index of an‐
isotropy is critically important, and the calculated skin effects appear to differ significantly
from calculations in the literature that were based on the assumption of complete isotropy.
Hence, most common assumptions pertaining to permeability isotropy are unfounded.
Energies 2021, 14, 5585 10 of 16
Figure 9. Effect of interaction between the two dimensionless parameters 𝛳 and ℎ on skin factor with constant value for the third dimensionless parameter (𝑘 1).
Figure 10. Effect of interaction between the dimensionless parameters ℎ and 𝑘 on skin factor with constant value for the third dimensionless parameter (𝛳 1).
Energies 2021, 14, 5585 11 of 16
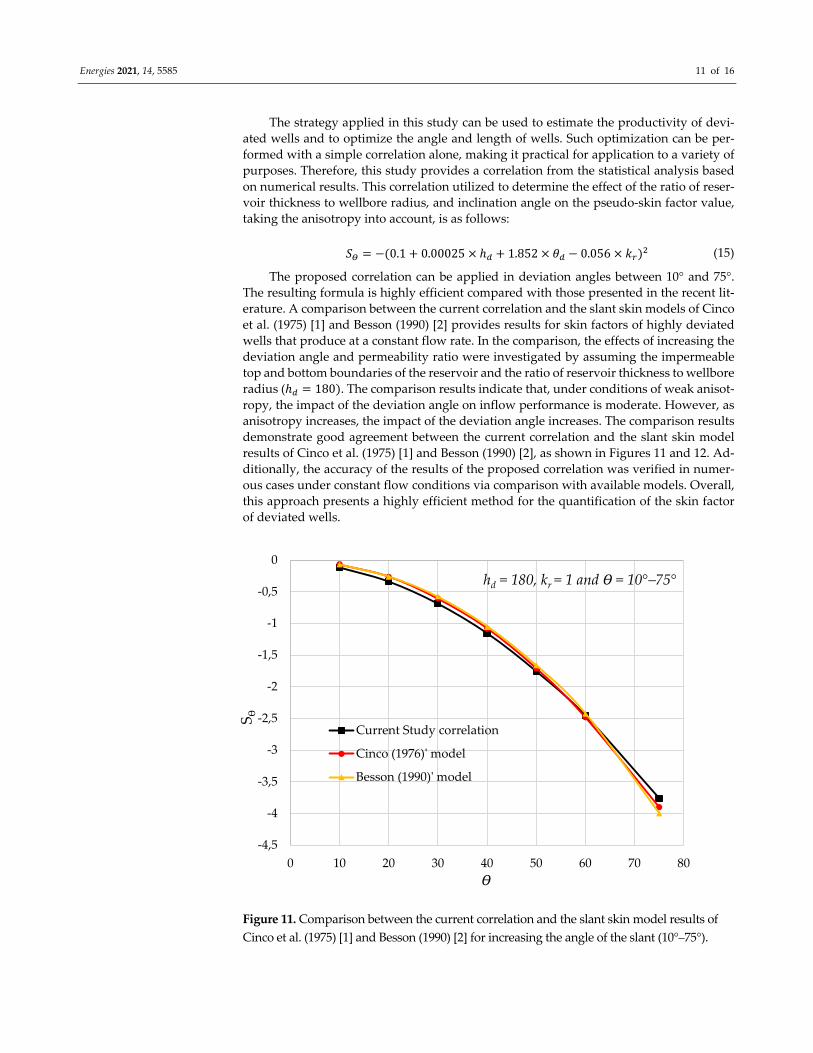
The strategy applied in this study can be used to estimate the productivity of devi‐
ated wells and to optimize the angle and length of wells. Such optimization can be per‐
formed with a simple correlation alone, making it practical for application to a variety of
purposes. Therefore, this study provides a correlation from the statistical analysis based
on numerical results. This correlation utilized to determine the effect of the ratio of reser‐
voir thickness to wellbore radius, and inclination angle on the pseudo‐skin factor value,
taking the anisotropy into account, is as follows:
𝑆 0.1 0.00025 ℎ 1.852 𝜃 0.056 𝑘 (15)
The proposed correlation can be applied in deviation angles between 10° and 75°.
The resulting formula is highly efficient compared with those presented in the recent lit‐
erature. A comparison between the current correlation and the slant skin models of Cinco
et al. (1975) [1] and Besson (1990) [2] provides results for skin factors of highly deviated
wells that produce at a constant flow rate. In the comparison, the effects of increasing the
deviation angle and permeability ratio were investigated by assuming the impermeable
top and bottom boundaries of the reservoir and the ratio of reservoir thickness to wellbore
radius (ℎ 180 . The comparison results indicate that, under conditions of weak anisot‐
ropy, the impact of the deviation angle on inflow performance is moderate. However, as
anisotropy increases, the impact of the deviation angle increases. The comparison results
demonstrate good agreement between the current correlation and the slant skin model
results of Cinco et al. (1975) [1] and Besson (1990) [2], as shown in Figures 11 and 12. Ad‐
ditionally, the accuracy of the results of the proposed correlation was verified in numer‐
ous cases under constant flow conditions via comparison with available models. Overall,
this approach presents a highly efficient method for the quantification of the skin factor
of deviated wells.
Figure 11. Comparison between the current correlation and the slant skin model results of
Cinco et al. (1975) [1] and Besson (1990) [2] for increasing the angle of the slant (10°–75°).
‐4,5
‐4
‐3,5
‐3
‐2,5
‐2
‐1,5
‐1
‐0,5
0
0 10 20 30 40 50 60 70 80
Sϴ
ϴ
hd = 180, kr = 1 and ϴ = 10°–75°
Current Study correlation
Cinco (1976)ʹ model
Besson (1990)ʹ model

Energies 2021, 14, 5585 12 of 16
Figure 12. Comparison between the current correlation and the slant skin model results of Cinco et
al. (1975) [1] and Besson (1990) [2] for increasing permeability ratio (1–10).
In inclined perforated well cases, when the direction of perforations is perpendicular
to the wellbore or parallel to the radial flow direction, the results of numerical investiga‐
tions reveal different pressure gradients for these two scenarios in the near‐wellbore re‐
gion, as shown in Figure 13. The results demonstrate the difference in skin factor (𝑆 or pressure gradient that result from the different directions of perforations in relation to the
wellbore.
Figure 13. Numerical results for the pressure gradient through the near‐wellbore region for two
scenarios with maximum inclination angle 75°, 𝑄 = 2 L/min, 𝐿 = 60.96 cm, and 𝑛 = 1 perfora‐tion/30.48 cm).
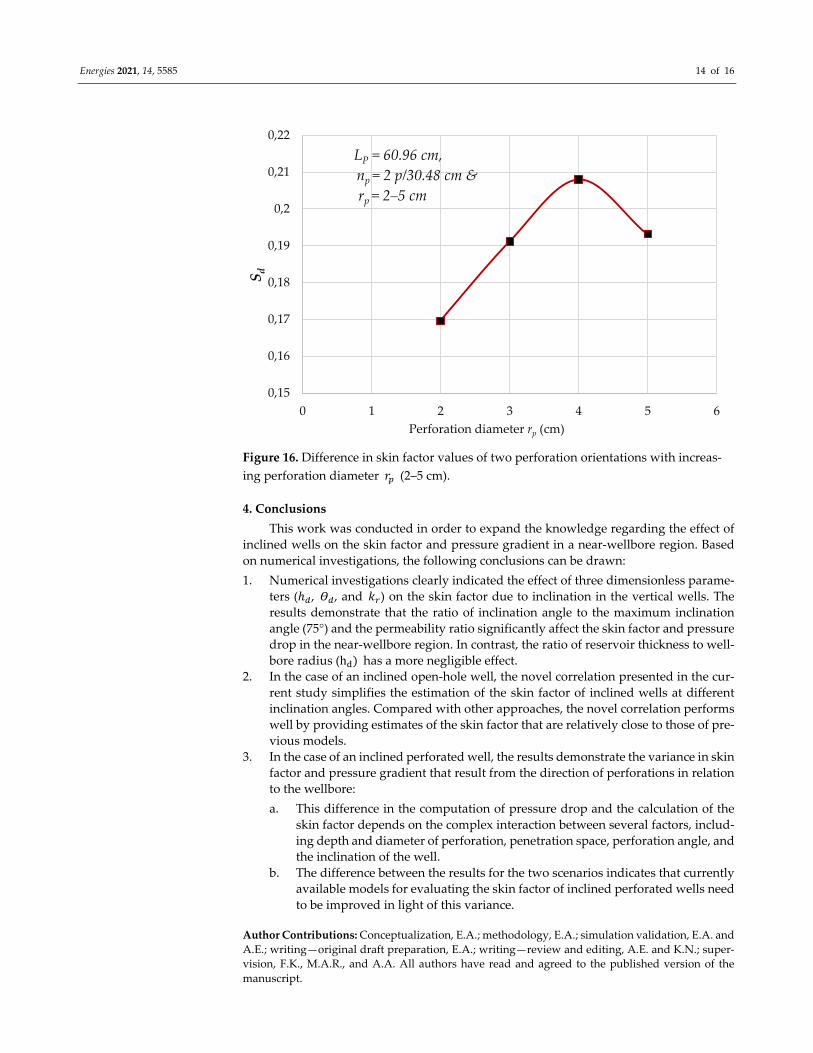
This contrast increases with an increase in the depth and diameter of the perforations
and penetration space to reach a maximum value at critical values of the three parameters
(𝐿 = 60.96 cm, 𝑟 = 2 cm, and 𝑛 = 4 perforations/30.48 cm), after which it begins to de‐
crease, as shown in Figures 14–16. Simultaneously, the increase in flow rate during the
‐4,5
‐4
‐3,5
‐3
‐2,5
‐2
‐1,5
‐1
‐0,5
0
0 2 4 6 8 10 12
Sϴ
kr
hd =180, kr=1–10 and ϴ=75°
Current Study correlationCinco (1976)ʹ modelBesson (1990)ʹ model

Energies 2021, 14, 5585 13 of 16
Darcy flow range does not show any effect on the variance in skin factor. The variance
between the two scenarios results from an increase in the cross‐area in the radial flow
direction combined with a decrease in the flow convergence effect in the first scenario.
Meanwhile, the perforation tips are subject to radial flow with increasing flow conver‐
gence in the second. This difference in the computation of pressure drop and the calcula‐
tion of the skin factor depends on a complex interaction between several factors, including
the depth and diameter of perforation, penetration space, perforation angle, and the incli‐
nation of the well. In this study, the variance between the two scenarios, including the
effects of the indicated parameters, was investigated in the case of perforation direction at
the same inclination as the well angle with a perforation angle of 180°. The interaction
effect of other perforation angles with different configurations on the skin factor warrants
further investigation.
Figure 14. Difference in skin factor values for two perforation orientations with increasing penetra‐
tion space 𝑛 (1–5 perforations/30.48 cm).
Figure 15. Difference in skin factor values for two perforation orientations with increasing perfora‐
tion depth 𝐿 (30.48–91.44 cm).
0,15
0,2
0,25
0,3
0,35
0,4
0,45
0 1 2 3 4 5 6
Sd
Penetration space np (p/30.48 cm)
Lp = 60.96cm,
np = 1–5 P/30.48cm &
rp = 5cm
0,12
0,14
0,16
0,18
0,2
0,22
0 10 20 30 40 50 60 70 80 90 100
Sd
Perforation depth Lp (cm)
Lp = 30.48–91.44cm,np = 2 p/30.48cm &
rp = 5cm
Energies 2021, 14, 5585 14 of 16
Figure 16. Difference in skin factor values of two perforation orientations with increas‐
ing perforation diameter 𝑟 (2–5 cm).
4. Conclusions
This work was conducted in order to expand the knowledge regarding the effect of
inclined wells on the skin factor and pressure gradient in a near‐wellbore region. Based
on numerical investigations, the following conclusions can be drawn:
1. Numerical investigations clearly indicated the effect of three dimensionless parame‐
ters (ℎ , 𝛳 , and 𝑘 ) on the skin factor due to inclination in the vertical wells. The
results demonstrate that the ratio of inclination angle to the maximum inclination
angle (75°) and the permeability ratio significantly affect the skin factor and pressure
drop in the near‐wellbore region. In contrast, the ratio of reservoir thickness to well‐
bore radius (h has a more negligible effect.
2. In the case of an inclined open‐hole well, the novel correlation presented in the cur‐
rent study simplifies the estimation of the skin factor of inclined wells at different
inclination angles. Compared with other approaches, the novel correlation performs
well by providing estimates of the skin factor that are relatively close to those of pre‐
vious models.
3. In the case of an inclined perforated well, the results demonstrate the variance in skin
factor and pressure gradient that result from the direction of perforations in relation
to the wellbore:
a. This difference in the computation of pressure drop and the calculation of the
skin factor depends on the complex interaction between several factors, includ‐
ing depth and diameter of perforation, penetration space, perforation angle, and
the inclination of the well.
b. The difference between the results for the two scenarios indicates that currently
available models for evaluating the skin factor of inclined perforated wells need
to be improved in light of this variance.
Author Contributions: Conceptualization, E.A.; methodology, E.A.; simulation validation, E.A. and
A.E.; writing—original draft preparation, E.A.; writing—review and editing, A.E. and K.N.; super‐
vision, F.K., M.A.R., and A.A. All authors have read and agreed to the published version of the
manuscript.
0,15
0,16
0,17
0,18
0,19
0,2
0,21
0,22
0 1 2 3 4 5 6
Sd
Perforation diameter rp (cm)
LP = 60.96 cm,
np = 2 p/30.48 cm &
rp = 2–5 cm
Energies 2021, 14, 5585 15 of 16
Funding: This publication was made possible by grant NPRP10‐0101‐170091 from the Qatar Na‐
tional Research Fund (a member of the Qatar Foundation). Statements made herein are solely the
responsibility of the authors.
Institutional Review Board Statement: Not applicable.
Informed Consent Statement: Not applicable.
Data Availability Statement: All data are contained within the article.
Conflicts of Interest: The authors declare no conflicts of interest.
Abbreviations
ANOVA Analysis of variance
BBD Box–Behnken design
CFD Computational fluid dynamics
DoE Design of experiments
IPR Inflow performance relationship
PR Productivity index
RSM Response surface methodology
Symbols
ℎ Reservoir thickness (m)
ℎ Reservoir dimensionless thickness
ℎ Ratio of reservoir thickness to wellbore radius
𝐼 Index of anisotropy
𝑘 Damage permeability (m )
𝑘 Formation permeability (m )
𝑘 Horizontal permeability (m )
𝑘 Vertical permeability (m )
𝑘 Permeability ratio
L Well length (m)
𝐿 Perforation depth (cm)
𝑚 Mass flow rate (kg s⁄ )
np Number of perforations (number of perforations/foot (30.48
cm))
𝑄 Flow rate (L min⁄ )
p Perforation
𝑝 Formation inlet pressure (Pa)
𝑝 Wellbore pressure (Pa)
𝑟 Damage region radius (cm)
𝑟 Reservoir radius (cm)
𝑟 Perforation radius (cm)
𝑟 Wellbore radius (cm)
𝑆 Difference skin factor
𝑆 Skin factor caused by inclination
𝛾 See Equation (6)
𝛳 Angle of the slant
𝜃 See Equation (3)
𝛳 Maximum angle of the slant
𝛳 Ratio of well inclination angle to the maximum inclination
angle
𝜇 Fluid viscosity (kg/m s)
Energies 2021, 14, 5585 16 of 16
∅ Porosity (%)
References
1. Cinco, H.; Miller, F.G.; Ramey, H.J., Jr. Unsteady‐state pressure distribution created by a directionally drilled well. J. Pet. Technol.
1975, 27, 1392–1400.
2. Besson, J. Performance of slanted and horizontal wells on an anisotropic medium. In Proceedings of the European Petroleum
Conference, Hague, The Netherlands, 21–24 October 1990.
3. Rogers, E.J.; Economides, M.J. The skin due to slant of deviated wells in Permeability‐Anisotropic reservoirs. In Proceedings of
the International Conference on Horizontal Well Technology, Calgary, Alta., Canada, 18–20 November 1996.
4. Yildiz, T.; Ozkan, E. Pressure‐transient analysis for perforated wells. In Proceedings of the SPE Annual Technical Conference
and Exhibition, New Orleans, LA, USA, 27–30 September 1998.
5. Ozkan, E.; Yildiz, T.; Raghavan, R. Pressure‐Transient analysis of Perforated slant and horizontal wells. In Proceedings of the
SPE Annual Technical Conference and Exhibition, Houston, TX, USA, 3–6 October 1999.
6. Ozkan, E.; Raghavan, R. A computationally efficient, transient‐pressure solution for inclined wells. SPE Reserv. Eval. Eng. 2000,
3, 414‐425.
7. Kyoon, C.S.; Ouyang, L.‐B.; Huang, W.S.B. A comprehensive comparative study on analytical pi/ipr correlations. In Proceedings
of the SPE Annual Technical Conference and Exhibition, Denver, CO, USA, 21–24 September 2008.
8. Darcy, H. Les Fontaines Publiques de la Ville de Dijon; Dalmont: Paris, France, 1856.
9. Wang, H.; Xue, S.; Gao, C.; Tong, X. Inflow performance for highly deviated wells in anisotropic reservoirs. Pet. Explor. Dev.
2012, 39, 239–244.
10. Ghahri, P.; Jamiolahmady, M. A new, accurate and simple model for calculation of productivity of deviated and highly deviated
well–part I: Single‐phase incompressible and compressible fluid. Fuel 2012, 97, 24–37.
11. Feng, G.‐q.; Liu, Q.‐g. Pressure transient behavior of a slanted well with an impermeable fault. J. Hydrodyn. 2014, 26, 980–985.
12. Dong, W.; Wang, X.; Wang, J. A new skin factor model for partially penetrated directionally‐drilled wells in anisotropic reser‐
voirs. J. Pet. Sci. Eng. 2018, 161, 334–348.
13. Abobaker, E.; Elsanoose, A.; Khan, F.; Rahman, M.A.; Aborig, A.; Noah, K. Quantifying the partial penetration skin factor for
evaluating the completion efficiency of vertical oil wells. J. Pet. Explor. Prod. Technol. 2021, 11, 3031–3043.
14. Abobaker, E.; Elsanoose, A.; Khan, F.; Rahman, M.A.; Aborig, A.; Butt, S. Comparison of Crushed‐zone skin factor for cased
and PERFORATED WELLS calculated with and without including a Tip‐Crushed Zone effect. Geofluids 2021, 2021, 1–13.
15. Ahammad, M.; Rahman, M.; Zheng, L.; Alam, J.M.; Butt, S.D. Numerical investigation of Two‐phase fluid flow in a perforation
tunnel. J. Nat. Gas Sci. Eng. 2018, 55, 606–611.
16. Ahammad, M.J.; Rahman, M.A.; Butt, S.D.; Alam, J.M. An experimental development to characterise the Flow phenomena at
THE Near‐Wellbore Region. In Proceedings of the ASME 2019 38th International Conference on Ocean, Offshore and Arctic
Engineering, Glasgow, Scotland, UK, 9–14 June 2019.
17. Rahman, M.A.; Heidrick, T.; Fleck, B.; Koksal, M. Enhancement of the completion efficiency of perforation tunnels in petroleum
wells. In Proceedings of the ASME 2006 2nd Joint U.S.‐European Fluids Engineering Summer Meeting Collocated With the 14th
International Conference on Nuclear Engineering, Miami, FL, USA, 17–20 July 2006.
18. Rahman, M.A. Scale‐up of perforation process from laboratory model to bottom hole dimensions. J. Porous Media 2008, 11, 19–
34.
19. Rahman, M.A.; Mustafiz, S.; Biazar, J.; Koksal, M.; Islam, M.R. Investigation of a novel perforation technique in petroleum
wells—Perforation by drilling. J. Frankl. Inst. 2007, 344, 777–789.
20. Rahman, M.A.; Mustafiz, S.; Koksal, M.; Islam, M.R. Quantifying the skin factor for estimating the completion efficiency of
perforation tunnels in petroleum wells. J. Pet. Sci. Eng. 2007, 58, 99–110.
21. Zheng, L.; Rahman, M.A.; Ahammad, M.J.; Butt, S.D.; Alam, J.M. Experimental and numerical investigation of a novel technique
for perforation in petroleum reservoir. In Proceedings of the SPE International Conference and Exhibition on Formation Dam‐
age Control, Lafayette, LA, USA, 24–26 February 2016.
22. Davim, J.P. Design of Experiments in Production Engineering; Springer: Cham, Switzerland, 2016.
23. Box, G.E.P.; Cox, D.R. An analysis of transformations. J. R. Stat. Soc. Ser. B (Methodol.) 1964, 26, 211–243.
24. Box, G.E.P.; Behnken, D.W. Some new three level designs for the study of quantitative variables. Technometrics 1960, 2, 455–475.
25. Ferreira, S.L.C.; Bruns, R.E.; Ferreira, S.H.; Matos, G.D.; David, J.M.; Brandão, G.C.; da Silva, E.G.P.; Portugal, L.A.; dos Reis,
P.S.; Souza, A.S.; et al. Box‐Behnken design: An alternative for the optimization of analytical methods. Anal. Chim. Acta. 2007,
597, 179–186.