a neurobehavioral study of current and former welders exposed to manganese
TRANSCRIPT
A
7
9
A
t
t
D
p
t
m
h
S
#
K
0
d
A neurobehavioral study of current and former welders
exposed to manganese
Dag G. Ellingsen a,*, Roman Konstantinov b, Rita Bast-Pettersen a,Ludmila Merkurjeva b, Maxim Chashchin b, Yngvar Thomassen a,
Valery Chashchin b
a National Institute of Occupational Health, P.O. Box 8149 Dep, N-0033 Oslo, Norwayb Northwest Public Health Research Centre, 191036 2-Sovetskaya, 4 St. Petersburg, Russia
Received 18 May 2007; accepted 28 August 2007
Available online 7 September 2007
bstract
Neurobehavioral functions were studied in 96 welders currently exposed to the geometric mean (GM) concentration of 121 mg/m3 (range
–2322) manganese (Mn) in welding fume (air-Mn) based on the individual mean from two successive days of sampling. They were compared to
6 age-matched referents. The arithmetic mean (AM) concentration of Mn in whole blood (B-Mn) was 8.6 mg/L versus 6.9 mg/L in the referents.
ssociations between the Digit Symbol and Finger Tapping test scores and B-Mn and air-Mn, respectively, were observed. The welders exposed to
he highest air-Mn concentrations (GM 423 mg/m3 range 204–2322) had statistically significantly poorer Finger Tapping test score as compared to
heir age-matched referents. The welders with the highest AM concentration of B-Mn (12.6 mg/L) scored statistically significantly poorer on the
igit Symbol test when compared to the age-matched referents (AM B-Mn 7.5 mg/L). The same neurobehavioral test battery was applied to 27
atients diagnosed, and financially compensated, as having welding related manganism. They were on average 44.9 (range 34–51) years old at the
ime of diagnosis, which on average was 5.8 years prior to this study. They had worked as welders for 23.1 years on average (range 15–30). The
ost affected neurobehavioral functions were associated with impaired Finger Tapping speed and Grooved Pegboard performance. The patients
ad no alterations in hand tremor as assessed by the CATSYS system, while a few subjects had noticeable tremor as assessed by the Static
teadiness test.
2007 Elsevier Inc. All rights reserved.
Available online at www.sciencedirect.com
NeuroToxicology 29 (2008) 48–59
eywords: Welding; Manganese; Neurobehavioral tests; Manganism
1. Introduction
High occupational exposure to manganese (Mn) can cause
manganism, a severe disorder of the central nervous system
(CNS) characterized mainly by movement disturbances and
psychiatric features (Couper, 1837; McMillan, 1999). Mangan-
ism has been diagnosed in workers employed in mining and
crushing of Mn ore, Mn alloy production, and in the production
of steel and dry cell batteries (Cook et al., 1974; Emara et al.,
1971; Huang et al., 1989; Rodier, 1955; Tanaka and Lieben,
1969).
* Corresponding author. Tel.: +47 23195205; fax: +47 23195205.
E-mail address: [email protected] (D.G. Ellingsen).
161-813X/$ – see front matter # 2007 Elsevier Inc. All rights reserved.
oi:10.1016/j.neuro.2007.08.014
There are few scientifically reported cases of manganism in
welders, although they probably constitute the highest number
of occupationally exposed workers. Their exposure to Mn may
originate from the steel, but more important from the welding
electrode and the flux. Particles in the respirable aerosol
fraction ranging from 10 to 100 nm near the welding arc and
agglomerates ranging from 0.5 to 2.0 mm in aerodynamic
diameter have been measured (Antonini et al., 2003;
Voitkevich, 1995).
Welders examined with magnetic resonance imaging had
increased amounts of Mn in the globus pallidus, midbrain and
putamen (Kim et al., 1999). Despite this, there are few studies
of currently exposed welders using neurobehavioral methods.
Slightly inferior motor functions (Siegl and Bergert, 1982;
Sjogren et al., 1996), but also severely impaired motor
functions (Bowler et al., 2003, 2006) have been reported.
D.G. Ellingsen et al. / NeuroToxicology 29 (2008) 48–59 49
Also slightly poorer cognitive test performance (Wang et al.,
2006) and severely impaired cognitive performance have been
reported (Bowler et al., 2003, 2006, 2007).
Studies of other Mn-exposed workers have shown altera-
tions in reaction time measures and in hand tremor test
parameters, and poorer performance on motor tests assessing
eye-hand coordination, motor speed or manual dexterity (Bast-
Pettersen et al., 2004; Beuter et al., 1994; Hochberg et al., 1996;
Iregren, 1990; Lucchini et al., 1995, 1999; Mergler et al., 1994;
Roels et al., 1987, 1992). There are also reports of reduced
cognitive performance, including memory functions and
increased prevalence of neuropsychiatric symptoms (Iregren,
1990; Lucchini et al., 1995, 1999; Mergler et al., 1994; Roels
et al., 1987). While these studies suggest neurobehavioral
alterations to result from Mn exposure, the exposure level
associated with the alterations is insufficiently established.
Manganese accumulates mainly in striatum, globus pallidus
and the subthalamic nuclei, with irreversible damage to the
nerve cells of these areas in Mn-intoxicated humans
(Normandin and Hazell, 2002; Pal et al., 1999). Increased
levels of Mn in the brain, however, were not measured in
clinically affected primates (Olanow et al., 1996). Manganism
resembles clinically other extrapyramidal disorders, in parti-
cular idiopathic Parkinson’s disease (PD) (Calne et al., 1994).
Neurodegeneration in PD occurs primarily in the substantia
nigra pars compacta. The nigrostriatal pathway is usually is
preserved in manganism (Pal et al., 1999).
Neurobehavioral tests are often used in epidemiological
studies to assess potential CNS effects of low Mn-exposure, but
neurobehavioral performance of patients with manganism has
hardly been described. Three stages of manganism has been
characterized in neurological terms; the prodromal phase was
dominated mostly by subjective symptoms; various neurolo-
gical signs appeared in the intermediate phase; while severe
disabling neurological signs appeared in the established phase
(Rodier, 1955).
Manganism among welders is considered a serious
occupational health problem in Russia. This work is part of
a larger study of welders’ exposure and health. Exposure
characteristics were described previously (Ellingsen et al.,
2006). This study was designed to assess the association
between exposure and nervous system function in current
welders, emphasizing motor system functions. A number of
patients diagnosed, and officially recognised in the Russian
insurance system many years previously as having welding
related manganism, were examined as well, in order to
contribute to the neurobehavioral characterization of the
disease.
2. Material and methods
2.1. Study design and participants
The study of currently exposed welders had a cross-sectional
pair-matched design restricted to men. The welders were
recruited from one facility producing heavy machinery and
from one shipyard, each employing several thousand workers.
The facilities had five and two welding departments,
respectively, and one department was randomly selected from
each. One shift of welders from each of the departments was
eligible for inclusion.
Main criteria for inclusion were at least 1 year of
employment as a welder and currently employed. Referents
(turners/fitters) recruited from the same facilities were matched
1:1 with a welder based on age, with a maximum age difference
within a pair of �2 years.
Known alcohol (or drug) abuse, diabetes mellitus, any larger
damage of the dominant hand, current or previous diseases of
the CNS that is probably unrelated to Mn exposure (e.g. brain
tumours, transitory ischemic attacks) or serious kidney or liver
diseases were among the exclusion criteria. Subjects with
occupational exposure to organic solvents (>3 years) in jobs
like painters or spray-painters, ever employed at plants
producing solvents or occupational exposure to lead or mercury
for more than 1 year were also excluded. Individuals that had
been on sick leave for more than 14 days at the examination day
were not included.
In all, 132 welders worked in the selected departments, of
whom five were not available for inclusion (sick leave,
vacation) and 11 were excluded due to violation of the
exclusion criteria as recorded in the occupational health
service files (mainly due to high alcohol intake). Among the
remaining 116 eligible welders, 20 declined to participate
(82.8% participation rate). Thirty-nine percent stated always
to use respiratory protection when welding, 42% mostly, 11%
rarely and in 8% this information was missing. Among the
156 turners/fitters working in other departments that were
chosen for recruiting the referents, 14 were not available due
to sick leave or vacation. Twenty-two potential referents were
excluded (mainly due to high alcohol intake). Thus the
reference base consisted of 120 eligible potential referents, of
whom 24 refused to participate (participation rate 80.0%). We
are not aware of any occupational Mn exposure in the
referents.
The Northwest Public Health Research Centre (NWPHRC)
in St. Petersburg (Russia) had in their medical files recorded 74
patients with the diagnosis of manganism, officially recognised
as an occupational disease in the Russian insurance system
(List of Occupational Diseases, 1996). The aim was to examine
half of the patients, by considering every second individual
from an alphabetical list. Four patients were excluded, two were
not available, and four refused to participate. Thus, 87.1% of
the available 31 patients participated (N = 27). They were all
former welders and four were women. As the youngest patient
was 41 years old, the patients were compared to the participants
from the cross-sectional study above this age.
The neurobehavioral examinations, blood and urine sam-
pling, and a structured interview were carried out at the
occupational health clinics of the respective facilities and at the
NWPHRC for the patients. Personal air samples were collected
on day 1 and day 2. The neurobehavioral examinations and the
collection of biological samples were carried out on the third
day. Background characteristics for the participants are shown
in Tables 1 and 5.

Table 1
Background and exposure characteristics in current welders and referents
Welders (N = 96) Referents (N = 96) p
AMa Range AM Range
Age (years) 36.3 20–65 36.1 18–66 0.90
Education (years) 12.7 8–17 12.3b 8–19 0.20
Weight (kg) 78.5 47.3–118.2 75.7 50.2–113.5 0.09
Smokers (%)c 60.4 – 62.5 – 0.77
Cigarettes/day (no.) 9.5 0–40 10.6 0–30 0.41
Alcohol consumption (g/year) 7700 0–47,320 5300 0–72,800 0.07
Earlier concussions (%)c 12.5 – 6.3 – 0.22
Use of prescribed medication (%)c 9.4 – 11.5 – 0.81
Years exposed 13.5 1.0–40.0 – – –
Current air-Mn (mg/m3)d 121e 7–2322 – – –
B-Mn (mg/L) 8.6b 4.7–21.7 6.9 3.8–14.3 <0.001
B-Pb (mg/L)d 47b 18–141 37 16–208 0.001
U-Mn (mg/g cr.)d 0.17b,f 0.03–1.1 0.12 0.02–10.2 0.07
a AM: arithmetic mean.b One subject missing.c Prevalence.d GM: geometric mean.e AM = 238 mg/m3.f AM = 0.37 mg/g cr.
D.G. Ellingsen et al. / NeuroToxicology 29 (2008) 48–5950
The study was approved by the Ethics Committee of St.
Petersburg Pasteur Institute. An informed written consent was
obtained from each participant.
2.2. Neurobehavioral examinations
The participants with-in an age-matched pair were examined
by the same investigator, usually for 1.5–2 h. The same test
sequence was applied for all subjects, and the participants in a
matched pair were examined at the same time of the day.
2.2.1. Cognitive tests and subjective symptoms
Sixteen neuropsychiatric and neurological symptoms, such
as fatigue, concentration and memory difficulties, were
recorded using the questionnaire Q 16 (Lundberg et al.,
1997). Digit Symbol (WAIS) (Lezak, 1995) is a paper and
pencil test requiring psychomotor speed, attention, perceptual
organization, and visual short-term memory. The task is to
recode symbols into digits. The number of correctly recoded
symbols during 90 s was recorded. Digit Span (WAIS) is a test
of attentional capacity and short-term memory. The measure is
the maximum number of digits repeated after an oral
presentation, either in the same order as presented (forwards)
or in reverse order (backwards) (Lezak, 1995).
2.2.2. Motor tests
Finger Tapping (Lafayette Instrument Company) requires
the participant to press a tapping key with the index finger as
fast as possible (Reitan and Wolfson, 1985). The measure of
this manual version was the median number of presses based on
three trials of 10 s.
Foot Tapping (Matthews and Kløve, 1964) requires the
participant to press a lever with the foot as quickly as possible
for 10 s while standing. The measure was the mean number of
presses based on two trials.
Dynamometer (Lafayette Psychological Instruments Model
78010) (Reitan and Wolfson, 1985). The participant holds the
dynamometer in the palm of the hand and squeezes the stirrup
with the fingers as firm as possible. The measure was the
amount of pressure in kg. Grooved Pegboard (Matthews and
Kløve, 1964) is a test of motor speed and fine manipulative
dexterity consisting of a board containing a 5 � 5 set of slotted
holes angled in different directions and 25 pegs with a ridge that
are to be inserted as quickly as possible. The completion time
(in s) was recorded for each hand.
The CATSYS Postural Sway test (Danish Product Devel-
opment, 1996) consists of a platform with sensors mapping the
position of the force centre resulting from the participants
position. The participant is instructed to stand erect and keep
the balance during three administrations, each period for 60 s
(total test time 75 s): 1. Eyes open. 2. Blindfolded. 3.
Blindfolded, standing on the platform with a pad of foam
(2 cm) under their feet. Recorded were: weight (in kg); mean
sway: the mean of the distance from the geometrical centre of
all positions (in mm); transversal and sagittal sway: the mean of
recorded x and y values of the force centre in a coordinate
system with the mean force centre position as the origo (in
mm); sway area: the area of the smallest polygon that includes
all force centre positions (in mm2); sway intensity: the root
mean square of the accelerations recorded in the 0.1–10 Hz
band (mm); sway velocity: the average travel period of the force
centre, calculated by dividing the total length of the force centre
trajectory with the duration (mm/s). Condition 3 did not yield
additional significant information and is not reported.
The CATSYS Maximum Frequency test (Danish Product
Development, 1996) was recorded for 12 s with a touch-
sensitive recording drum connected to a computer. The
participant is required to lightly hit the surface of the drum
in an alternating hand pronation–supination as close as possible
to a metronome beat increasing in frequency from 1.6 to 7.5 Hz.
D.G. Ellingsen et al. / NeuroToxicology 29 (2008) 48–59 51
The maximum frequency at which the sound could be followed
was recorded (in Hz).
2.2.3. Hand steadiness/hand tremor
The Kløve–Matthews Static Steadiness test is a stylus-and-
hole apparatus. In the CATSYS Tremor test, version 7.0
(Danish Product Development, 1996), the participant is
required to hold a tremor pen containing a biaxial micro-
accelerometer like an ordinary pen. The arm is bent at an angle
of 908 without any support for 10.2, 2 s to stabilize and 8.2 s for
recording. The tests have been described in detail (Bast-
Pettersen and Ellingsen, 2005).
2.3. Collection of biological samples and elemental
measurements
The participants were instructed to void the first morning
urine. Heparinized whole blood was collected between 8.30 and
9.30 the same morning. The samples were analysed by
inductively coupled plasma sector field mass spectrometry
using an Element 2 mass spectrometer (Thermo Electron,
Bremen, Germany). SeronormTM Trace Elements human whole
blood and urine quality control materials were used. Creatinine
in urine was measured according to Jaffe reaction. Analytical
and sampling details have been presented (Ellingsen et al.,
2006).
2.4. Air sampling and measurements
Current exposure to welding fumes was characterized by
full-shift samples collected with Millipore (25 mm) plastic
cassettes equipped with 5.0 mm pore-size polyvinyl chloride
membrane filters mounted underneath the welding helmet in the
breathing zone of each welder on two successive days. SKC
(SKC Ltd., Dorset, UK) pumps operated at a constant flow rate
of 2.0 L/min were used for the sampling. The samples were
analysed by inductively coupled plasma optical emission
spectrometry. Reference workroom air filters traceable to
international certified reference materials were used for the
quality assurance. Analytical and sampling details have been
presented (Ellingsen et al., 2006).
2.5. Estimates of exposure to manganese
The individual concentrations of U-Mn and B-Mn were used
as biological exposure measures. The mean Mn concentration
of the 2 days of air sampling preceding the collection of the
biological samples was used as an individual air exposure
estimate (air-Mn).
2.6. Statistics
Continuous variables that had a skewed distribution were
log-transformed if the skewness exceeded 2.0. For those
variables the geometric mean (GM) is presented. The
arithmetic mean (AM) is otherwise used. Analysis of variance
(ANOVA) was used for group comparisons of continuous
variables, and the least square difference (LSD) was calculated
when more than two groups were compared. For the
comparison of bilateral differences in neurobehavioral perfor-
mance, the Mann–Whitney test was applied because the
variables could not be log-transformed due to several 0-values.
The x2-test was applied for dichotomous variables.
Potential confounders were assessed by multiple linear
regression analysis (backward procedure) including exposure
status (1/0), age (in years), tobacco smoking (1/0), alcohol
consumption (g/year), use of medication (1/0), head injury with
concussion (Hinj) (1/0) and the concentration of B-Pb (log)
(mg/L) as independent variables. ‘‘Years of education’’ was
included when assessing Digit Span and Digit Symbol. If
exposure status was associated with the outcome variable, the
same regression models were used to study dose–response
associations, but exposure status was substituted with B-Mn
(mg/L), U-Mn (log) (mg/g cr.) or air-Mn (log) (mg/m3) in
separate models. In order to include all subjects for the
assessment of air-Mn, the referents were assigned a log-value of
0.001 for that variable. When a dose–response association was
observed, the welders were stratified into three equally large
groups according to the exposure variable in question (N = 32
in each stratified group), and compared with their pair-matched
(on age) referents within each stratum. A general linear model
was used to adjust for covariates between subgroups. Two-
tailed p-values < 0.05 were considered to be of statistical
significance. The statistical package SPSS1, version 11.5, was
used.
3. Results
3.1. Current welders
The current welders and their referents were comparable
with respect to age, education and current smoking habits
(Table 1). The exposed group had worked as welders for on
average 13.5 years, and their current GM exposure to air-Mn
was 121 mg/m3.
Although the performance on most motor tests was quite
similar, the AM Finger Tapping score was slightly poorer in the
welders than in the referents (Table 2). The AM scores for the
cognitive Digit Span test (forwards) were almost identical,
although the backwards performance and the AM Digit Symbol
test scores were significantly lower in the welders. The welders
reported more subjective symptoms, but the difference was not
significant.
The results of the hand tremor/hand steadiness tests were
somewhat contradictory. The TREMOR 7.0 test performance
was similar in the two groups (Table 3), but the welders
performed better on the Static Steadiness test (Table 2). The two
groups performed similar on the Postural Sway test (Table 3).
The welders performed slightly better on two of the parameters
under regular test conditions, but the difference disappeared
when blindfolded.
Exposure status (1/0) was assessed taking into account
potential confounders (see Section 2.6) in a multiple linear
regression analysis (results not shown). The performance for
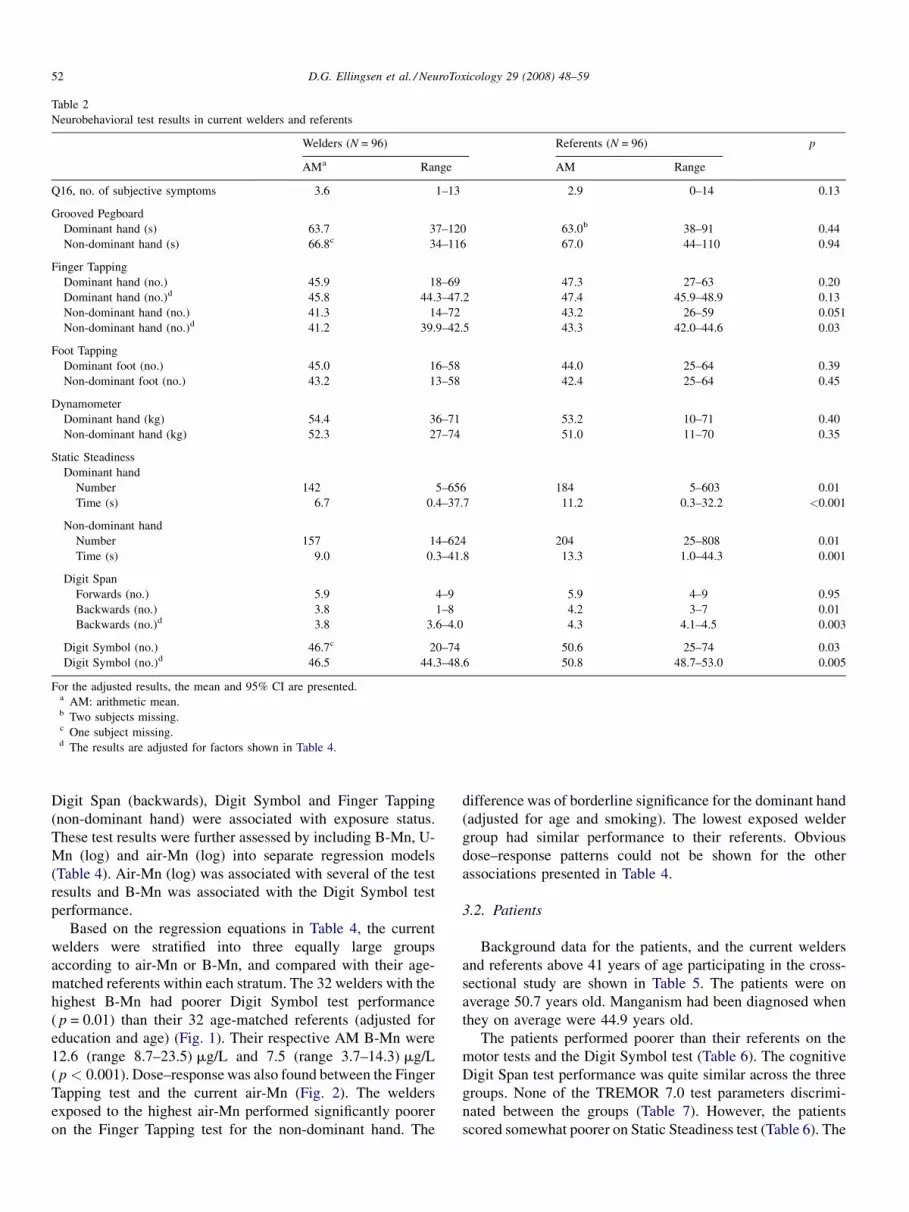
Table 2
Neurobehavioral test results in current welders and referents
Welders (N = 96) Referents (N = 96) p
AMa Range AM Range
Q16, no. of subjective symptoms 3.6 1–13 2.9 0–14 0.13
Grooved Pegboard
Dominant hand (s) 63.7 37–120 63.0b 38–91 0.44
Non-dominant hand (s) 66.8c 34–116 67.0 44–110 0.94
Finger Tapping
Dominant hand (no.) 45.9 18–69 47.3 27–63 0.20
Dominant hand (no.)d 45.8 44.3–47.2 47.4 45.9–48.9 0.13
Non-dominant hand (no.) 41.3 14–72 43.2 26–59 0.051
Non-dominant hand (no.)d 41.2 39.9–42.5 43.3 42.0–44.6 0.03
Foot Tapping
Dominant foot (no.) 45.0 16–58 44.0 25–64 0.39
Non-dominant foot (no.) 43.2 13–58 42.4 25–64 0.45
Dynamometer
Dominant hand (kg) 54.4 36–71 53.2 10–71 0.40
Non-dominant hand (kg) 52.3 27–74 51.0 11–70 0.35
Static Steadiness
Dominant hand
Number 142 5–656 184 5–603 0.01
Time (s) 6.7 0.4–37.7 11.2 0.3–32.2 <0.001
Non-dominant hand
Number 157 14–624 204 25–808 0.01
Time (s) 9.0 0.3–41.8 13.3 1.0–44.3 0.001
Digit Span
Forwards (no.) 5.9 4–9 5.9 4–9 0.95
Backwards (no.) 3.8 1–8 4.2 3–7 0.01
Backwards (no.)d 3.8 3.6–4.0 4.3 4.1–4.5 0.003
Digit Symbol (no.) 46.7c 20–74 50.6 25–74 0.03
Digit Symbol (no.)d 46.5 44.3–48.6 50.8 48.7–53.0 0.005
For the adjusted results, the mean and 95% CI are presented.a AM: arithmetic mean.b Two subjects missing.c One subject missing.d The results are adjusted for factors shown in Table 4.
D.G. Ellingsen et al. / NeuroToxicology 29 (2008) 48–5952
Digit Span (backwards), Digit Symbol and Finger Tapping
(non-dominant hand) were associated with exposure status.
These test results were further assessed by including B-Mn, U-
Mn (log) and air-Mn (log) into separate regression models
(Table 4). Air-Mn (log) was associated with several of the test
results and B-Mn was associated with the Digit Symbol test
performance.
Based on the regression equations in Table 4, the current
welders were stratified into three equally large groups
according to air-Mn or B-Mn, and compared with their age-
matched referents within each stratum. The 32 welders with the
highest B-Mn had poorer Digit Symbol test performance
( p = 0.01) than their 32 age-matched referents (adjusted for
education and age) (Fig. 1). Their respective AM B-Mn were
12.6 (range 8.7–23.5) mg/L and 7.5 (range 3.7–14.3) mg/L
( p < 0.001). Dose–response was also found between the Finger
Tapping test and the current air-Mn (Fig. 2). The welders
exposed to the highest air-Mn performed significantly poorer
on the Finger Tapping test for the non-dominant hand. The
difference was of borderline significance for the dominant hand
(adjusted for age and smoking). The lowest exposed welder
group had similar performance to their referents. Obvious
dose–response patterns could not be shown for the other
associations presented in Table 4.
3.2. Patients
Background data for the patients, and the current welders
and referents above 41 years of age participating in the cross-
sectional study are shown in Table 5. The patients were on
average 50.7 years old. Manganism had been diagnosed when
they on average were 44.9 years old.
The patients performed poorer than their referents on the
motor tests and the Digit Symbol test (Table 6). The cognitive
Digit Span test performance was quite similar across the three
groups. None of the TREMOR 7.0 test parameters discrimi-
nated between the groups (Table 7). However, the patients
scored somewhat poorer on Static Steadiness test (Table 6). The

Table 3
Results from the computerized CATSYS test battery in current welders and referents
Welders (N = 96) Referents (N = 96) p
AMa Range AM Range
TREMOR 7.0
Dominant handb
Tremor intensity (m/s2)c 0.13 0.06–0.71 0.14 0.07–0.46 0.69
Central frequency (Hz) 7.8 5.0–12.6 7.5 4.8–11.6 0.12
Frequency dispersion (Hz) 3.2 0.2–5.6 3.0 0.2–5.4 0.26
Harmonic index 0.86 0.68–0.98 0.86 0.70–0.98 0.47
Non-dominant hand
Tremor intensity (m/s2)c 0.14d 0.06–0.68 0.15d 0.07–0.45 0.41
Central frequency (Hz) 7.5d 1.6–12.6 7.8d 5.0–12.3 0.23
Frequency dispersion (Hz) 3.3d 0.2–6.1 3.1d 0.2–4.9 0.19
Harmonic index 0.85d 0.64–0.98 0.84d 0.67–0.97 0.70
Maximum frequency test
Dominant (Hz) 5.0d 1.0–7.5 5.4 1.0–7.5 0.09
Non-dominant (Hz) 5.1d 1.0–7.5 5.2d 1.0–7.5 0.83
Postural Sway test
Eyes openb
Transversal x (mm) 2.6 0.9–5.4 2.8 1.1–6.9 0.33
Sagittal y (mm)c 3.4 1.4–14.3 3.6 1.8–9.7 0.31
Sway area (mm2)c 182 36–948 219 67–1328 0.02
Mean sway (mm) 5.1 2.1–15.6 5.2 2.7–11.2 0.50
Intensity (mm)c 3.7 1.7–14.2 4.0 1.8–10.4 0.14
Sway velocity (mm/s) 8.8 4.6–20.6 9.6 4.9–23.2 0.045
Blindfoldede
Transversal x (mm) 3.3 1.4–11.2 3.3 0.9–6.1 0.93
Sagittal y (mm) 4.4 1.6–12.7 4.1 1.8–8.9 0.28
Sway area (mm2)c 295 70–3183 313 47–1293 0.51
Mean sway (mm) 6.1 2.8–15.3 5.9 2.3–11.6 0.45
Intensity (mm)c 5.1 2.5–21.6 5.1 2.7–8.7 0.56
Sway velocity (mm/s)c 12.1 5.8–53.4 13.2 5.6–21.3 0.10
a AM: arithmetic mean.b For this test 95 welders and 96 referents.c GM: geometric mean.d One subject missing.e For this test 93 welders and 95 referents.
D.G. Ellingsen et al. / NeuroToxicology 29 (2008) 48–59 53
patients also performed poorer on all test parameters for the
Postural Sway test (Table 7).
Tables 6 and 7 show the prevalence of patients scoring
poorer than the mean and 2 S.D. of the referents (or the 2nd
Table 4
Results from the multiple linear regression (backward procedure) analysisa assessi
Alfa Beta
Air-Mn
Finger Tapping
Dominant hand (no.) 55.6**** �0.79* Air-Mn (log)
Non-dominant hand (no.) 49.0**** �1.04** Air-Mn (log
Digit Symbol 51.7**** �2.1*** Air-Mn (log)
Digit Span backw. 4.1**** �0.20*** Air-Mn (log
B-Mn
Digit Symbol 51.7**** �0.66*** B-Mn � 0.5
a Model used; see Section 2.6.* p < 0.10.
** p < 0.05.*** p < 0.01.**** p < 0.001.
percentile for non-normally distributed variables). The pre-
valence of ‘‘abnormal’’ test scores was highest for the Finger
Tapping test, being 59.3% and 66.7% for the two hands,
respectively. Few patients scored below the cut-off points for
ng the impact of the exposure-related variables B-Mn, U-Mn and air-Mn
mult.r
� 0.20**** Age � 2.0* Smoking 0.34****
) � 0.11*** Age � 2.1** Smoking 0.30***
� 0.5**** Age + 1.4**** Edu 0.57****
) � 0.02*** Age � 0.0002* Alco + 0.08** Edu + 0.5* Hinj 0.37****
**** Age + 1.4**** Edu 0.56****

Fig. 1. The mean difference (and 95% CI) in the Digit Symbol test scores
(adjusted for age and education) between welders and referents matched for age
according to the level of B-Mn. The mean B-Mn (in mg/L) concentrations and
ranges are shown.
Fig. 2. The mean difference (and 95% CI) in the Finger Tapping test scores for
the dominant (dom.) and non-dominant (non-dom.) hand (adjusted for age and
smoking) between welders and referents matched for age according to the level
of air-Mn. The geometric mean air-Mn concentrations (in mg/m3) and ranges
are shown in brackets.
D.G. Ellingsen et al. / NeuroToxicology 29 (2008) 48–5954
the TREMOR 7.0 parameters, although about 20% had poorer
performance on the Static Steadiness test. Greater than 90% of
the patients had more subjective symptoms than the cut-off
point.
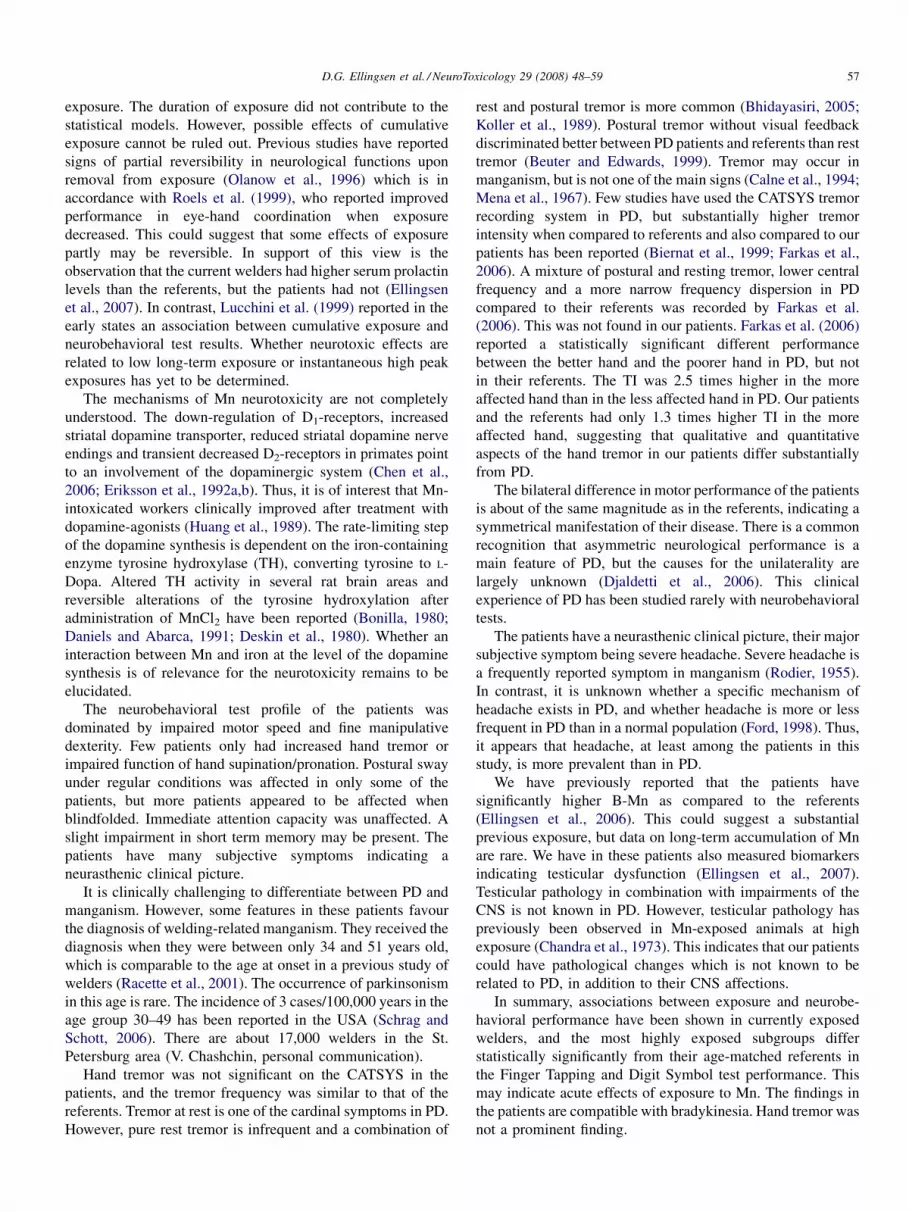
In order to assess symmetry, the percentage difference in
neurobehavioral performance between the best and the poorest
hand/foot was calculated for all test variables applied
bilaterally. No statistically significant differences in bilateral
performance were found between the patients and the referents
for any of the tests (results not shown). The Pearson’s
correlation coefficients between the performances on the
dominant and the non-dominant side in the patients were 0.95
(Finger Tapping) (Fig. 3), 0.92 (Grooved Pegboard) and 0.93
(Foot Tapping) for the tests with the highest prevalence of
scores <2 S.D. (or 2nd percentile).
Table 5
Background characteristics and the mean concentrations of trace elements in whole b
referents above 41 years of age
Patients (N = 27) Welder
AMa Range AM
Age (years)b 50.7 41–58 46
Education (years) 10.0 8–13 12
Weight (kg) 78.5 61.4–98.8 78
Smokers (%)d 40.7 – 59
Cigarettes/day (no.) 5.6 0–20 9
Alcohol consumption (g/year)b 1670 0–8110 10,260
Concussions (%)d 0 – 16
Prescribed medication (%)d 25.9 – 16
Age at diagnosis (years) 44.9 34–51 –
Years since diagnosis 5.8 4–7 –
Years exposed 23.1 15–30 21
B-Mn (mg/L)e,f 8.7 5.2–19.1 8
B-Pb (mg/L)g,b,f 31.1 12.5–82.8 48
U-Mn (mg/g cr.)g,b,e,f 0.07 0.03–0.17 0
a AM: arithmetic mean.b p < 0.05 between patients and welders.c One subject missing.d Prevalence.e p < 0.05 between patients and referents.f p < 0.05 between welders and referents.g GM: geometric mean.
4. Discussion
Neurobehavioral functions were investigated in welders
currently exposed to welding fumes containing the GM of
121 mg/m3 of Mn. The welders had been exposed to welding
aerosols for 13.5 years on average. Patients diagnosed as having
welding-related manganism also were examined. Their
exposure, which had ceased on average 5.8 years prior to
the examinations, was on average 23.1 years. Reliable
quantitative data on their past exposure was not available.
The participation rates were high in all groups. Thus,
selection bias may be of little concern. The current welders and
the referents are blue-collar workers selected from the same
plants, and their socio-demographic background variables are
comparable. This may also be valid for the patients because
lood and urine in patients diagnosed with manganism, 42 current welders and 42
s (N = 42) Referents (N = 42) pANOVA
Range AM Range
.8 41–65 48.4 41–66 0.03
.5 8–17 12.0 8–19 <0.001
.3c 55.7–118.2 79.9 58.8–113.5 0.80
.5 – 52.4 – 0.31
.9 0–40 8.6 0–30 0.17
0–47,320 6450 0–72,800 0.004
.7 – 4.8 – –
.7 – 19.0 – 0.63
– – – –
– – – –
.4 1–40 – – –
.5 4.7–21.7 7.0 3.8–14.3 0.051
.4 18.0–141.4 35.8 16.1–208.0 0.01
.12 0.03–1.1 0.19 0.02–10.2 0.001
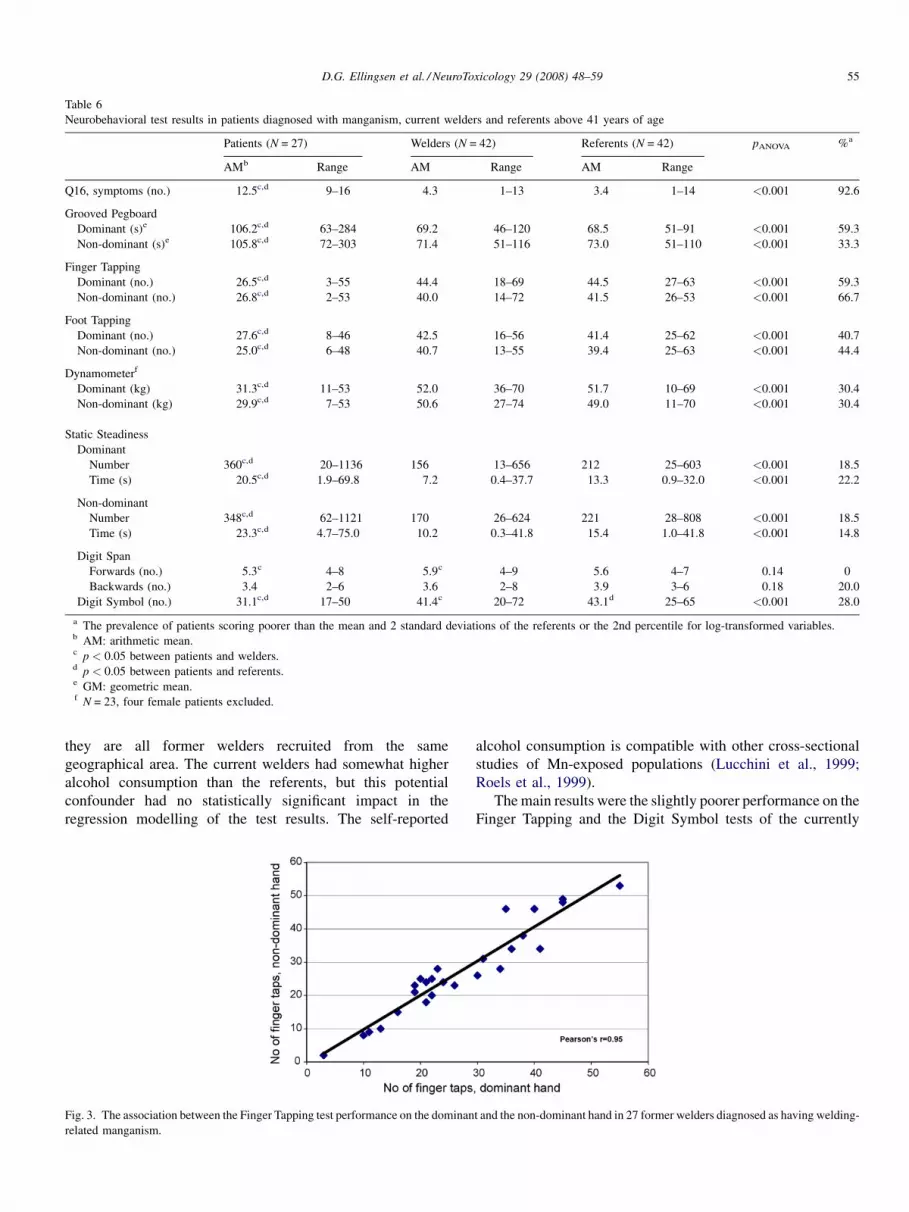
Table 6
Neurobehavioral test results in patients diagnosed with manganism, current welders and referents above 41 years of age
Patients (N = 27) Welders (N = 42) Referents (N = 42) pANOVA %a
AMb Range AM Range AM Range
Q16, symptoms (no.) 12.5c,d 9–16 4.3 1–13 3.4 1–14 <0.001 92.6
Grooved Pegboard
Dominant (s)e 106.2c,d 63–284 69.2 46–120 68.5 51–91 <0.001 59.3
Non-dominant (s)e 105.8c,d 72–303 71.4 51–116 73.0 51–110 <0.001 33.3
Finger Tapping
Dominant (no.) 26.5c,d 3–55 44.4 18–69 44.5 27–63 <0.001 59.3
Non-dominant (no.) 26.8c,d 2–53 40.0 14–72 41.5 26–53 <0.001 66.7
Foot Tapping
Dominant (no.) 27.6c,d 8–46 42.5 16–56 41.4 25–62 <0.001 40.7
Non-dominant (no.) 25.0c,d 6–48 40.7 13–55 39.4 25–63 <0.001 44.4
Dynamometerf
Dominant (kg) 31.3c,d 11–53 52.0 36–70 51.7 10–69 <0.001 30.4
Non-dominant (kg) 29.9c,d 7–53 50.6 27–74 49.0 11–70 <0.001 30.4
Static Steadiness
Dominant
Number 360c,d 20–1136 156 13–656 212 25–603 <0.001 18.5
Time (s) 20.5c,d 1.9–69.8 7.2 0.4–37.7 13.3 0.9–32.0 <0.001 22.2
Non-dominant
Number 348c,d 62–1121 170 26–624 221 28–808 <0.001 18.5
Time (s) 23.3c,d 4.7–75.0 10.2 0.3–41.8 15.4 1.0–41.8 <0.001 14.8
Digit Span
Forwards (no.) 5.3c 4–8 5.9c 4–9 5.6 4–7 0.14 0
Backwards (no.) 3.4 2–6 3.6 2–8 3.9 3–6 0.18 20.0
Digit Symbol (no.) 31.1c,d 17–50 41.4c 20–72 43.1d 25–65 <0.001 28.0
a The prevalence of patients scoring poorer than the mean and 2 standard deviations of the referents or the 2nd percentile for log-transformed variables.b AM: arithmetic mean.c p < 0.05 between patients and welders.d p < 0.05 between patients and referents.e GM: geometric mean.f N = 23, four female patients excluded.
D.G. Ellingsen et al. / NeuroToxicology 29 (2008) 48–59 55
they are all former welders recruited from the same
geographical area. The current welders had somewhat higher
alcohol consumption than the referents, but this potential
confounder had no statistically significant impact in the
regression modelling of the test results. The self-reported
Fig. 3. The association between the Finger Tapping test performance on the dominan
related manganism.
alcohol consumption is compatible with other cross-sectional
studies of Mn-exposed populations (Lucchini et al., 1999;
Roels et al., 1999).
The main results were the slightly poorer performance on the
Finger Tapping and the Digit Symbol tests of the currently
t and the non-dominant hand in 27 former welders diagnosed as having welding-

Table 7
Results on the CATSYS Sway test with eyes open and blindfolded, TREMOR 7.0 and the maximum frequency test in patients diagnosed with manganism, welders
and referents above 41 years of age
Patients (N = 27) Welders (N = 42) Referents (N = 42) pANOVA %a
AMb Range AM Range AM Range
TREMOR 7.0
Dominant
Tremor intensity (m/s2)c 0.16 0.06–0.98 0.14 0.06–0.71 0.13 0.07–0.32 0.22 7.4
Central frequency (Hz) 7.4 3.1–11.6 7.8 5.5–12.6 7.2 5.2–11.6 0.27 14.8
Frequency dispersion (Hz) 2.8 1.0–4.4 3.1 0.2–5.4 2.8 0.2–4.9 0.36 0
Harmonic index 0.86 0.74–0.95 0.86 0.70–0.97 0.87 0.70–0.98 0.35 0
Non-dominant
Tremor intensity (m/s2)c 0.16 0.07–0.55 0.14 0.06–0.54 0.14 0.07–0.45 0.53 3.7
Central frequency (Hz) 7.4 3.1–12.1 7.5 1.6–10.9 7.9 5.0–12.3 0.41 11.1
Frequency dispersion (Hz) 3.0 0.7–4.9 3.4 1.0–6.1 3.0 0.7–4.6 0.13 7.4
Harmonic index 0.84 0.72–0.96 0.85 0.72–0.96 0.86 0.70–0.97 0.51 0
Maximum frequency
Dominant (Hz) 4.0d,e 1.0–7.5 4.9 1.0–7.5 5.7 3.0–7.5 <0.001 11.1
Non-dominant (Hz) 3.8d,e 1.0–6.7 4.8 1.0–7.5 5.4 2.7–7.5 <0.001 11.1
Postural Sway test
Eyes open
Transversal x (mm) 3.6d,e 1.8–6.0 2.8 1.1–5.4 2.7 1.1–5.3 0.003 29.6
Sway area (mm2)c 381d,e 104–1567 219 56–948 228 67–1328 0.003 4.0
Mean sway (mm) 7.8d,e 3.3–17.7 5.7 2.3–15.6 5.3 2.7–11.2 <0.001 29.6
Intensity (mm) 6.7d,e 2.8–13.9 4.5 1.8–14.2 4.4 1.8–10.4 <0.001 18.5
Sagittal y (mm)c 5.3d,e 2.3–17.1 3.9 1.7–14.3 3.7 1.9–9.7 0.003 14.8
Sway velocity (mm/s) 14.3d,e 6.0–32.2 9.6 4.8–20.6 10.0 5.2–23.2 <0.001 25.9
Blindfolded
Transversal x (mm) 5.0d,e 2.0–22.4 3.2 1.5–6.5 3.1 1.3–6.1 <0.001 29.6
Sway area (mm2)c 1077d,e 173–10,872 350 81–3183 319 72–1293 <0.001 29.6
Mean sway (mm) 10.6d,e 3.9–36.4 6.1 3.0–15.3 5.6 2.8–11.6 <0.001 33.3
Intensityc (mm) 10.16d,e 3.4–35.9 5.8 2.6–21.6 5.3 2.7–8.7 <0.001 55.6
Sagittal y (mm)c 8.0d,e 2.6–28.3 4.4 1.8–12.7 4.0 1.8–8.9 <0.001 51.9
Sway velocity (mm/s) 23.8d,e 8.6–93.3 13.9 7.2–53.4 13.6 5.8–21.3 <0.001 51.9
a The prevalence of patients scoring poorer than the mean and 2 standard deviations of the referents or the 2nd percentile for log-transformed variables.b AM: arithmetic mean.c GM: geometric mean.d p < 0.05 between patients and welders.e p < 0.05 between patients and referents.
D.G. Ellingsen et al. / NeuroToxicology 29 (2008) 48–5956
exposed welders. Poorer performance was associated with
increasing air-Mn or B-Mn, which strengthens the evidence of
Mn being the causative agent. Poorer Finger Tapping test
performance has been reported in Mn-exposed populations
(Bowler et al., 2003, 2006; Chia et al., 1993; Iregren, 1990;
Lucchini et al., 1999). However, relationship between dose and
response are rare. Poorer performance was associated with a
current full-shift GM exposure to Mn in the welding aerosol of
423 mg/m3 (range 204–2322). That the patients’ performance
on the Finger Tapping test was relatively the poorest among all
areas tested adds evidence to suggest that Finger Tapping test
performance truly may be related to Mn-exposure in
chronically exposed welders.
The association between the Digit Symbol test and B-Mn
suggests impaired performance to be related to exposure from
welding resulting in 5.1 mg/L higher B-Mn on average than in
the referents. Poorer Digit Symbol performance has been
reported previously (Bowler et al., 2003, 2006; Chia et al.,
1993; Lucchini et al., 1999). Associations between Mn in
biological matrices and neurobehavioral performance has
rarely been observed. A dose–response relationship was not
found for the Digit Span test (backwards) when using stratified
analysis. Thus the overall group difference found for this test
should be interpreted with caution, especially because the
performance of the patients was similar to referents.
The currently exposed welders performed significantly
better on the Static Steadiness test when compared to the
referents. We have observed this phenomenon in welders
previously (Bast-Pettersen et al., 2000). The task of this test is
to keep a steady hand in a small space. This is similar to what
welders do during work, suggesting work practice to be of
importance. However, the results are in contrast to a recent
study that reported a very high prevalence of impairments in the
harmonic index of the CATSYS test battery when compared to
normative data of age and education matched participants from
another study (Bowler et al., 2007).
The poorer test performance in the welders is associated
with measures that may be regarded as indices of current
D.G. Ellingsen et al. / NeuroToxicology 29 (2008) 48–59 57
exposure. The duration of exposure did not contribute to the
statistical models. However, possible effects of cumulative
exposure cannot be ruled out. Previous studies have reported
signs of partial reversibility in neurological functions upon
removal from exposure (Olanow et al., 1996) which is in
accordance with Roels et al. (1999), who reported improved
performance in eye-hand coordination when exposure
decreased. This could suggest that some effects of exposure
partly may be reversible. In support of this view is the
observation that the current welders had higher serum prolactin
levels than the referents, but the patients had not (Ellingsen
et al., 2007). In contrast, Lucchini et al. (1999) reported in the
early states an association between cumulative exposure and
neurobehavioral test results. Whether neurotoxic effects are
related to low long-term exposure or instantaneous high peak
exposures has yet to be determined.
The mechanisms of Mn neurotoxicity are not completely
understood. The down-regulation of D1-receptors, increased
striatal dopamine transporter, reduced striatal dopamine nerve
endings and transient decreased D2-receptors in primates point
to an involvement of the dopaminergic system (Chen et al.,
2006; Eriksson et al., 1992a,b). Thus, it is of interest that Mn-
intoxicated workers clinically improved after treatment with
dopamine-agonists (Huang et al., 1989). The rate-limiting step
of the dopamine synthesis is dependent on the iron-containing
enzyme tyrosine hydroxylase (TH), converting tyrosine to L-
Dopa. Altered TH activity in several rat brain areas and
reversible alterations of the tyrosine hydroxylation after
administration of MnCl2 have been reported (Bonilla, 1980;
Daniels and Abarca, 1991; Deskin et al., 1980). Whether an
interaction between Mn and iron at the level of the dopamine
synthesis is of relevance for the neurotoxicity remains to be
elucidated.
The neurobehavioral test profile of the patients was
dominated by impaired motor speed and fine manipulative
dexterity. Few patients only had increased hand tremor or
impaired function of hand supination/pronation. Postural sway
under regular conditions was affected in only some of the
patients, but more patients appeared to be affected when
blindfolded. Immediate attention capacity was unaffected. A
slight impairment in short term memory may be present. The
patients have many subjective symptoms indicating a
neurasthenic clinical picture.
It is clinically challenging to differentiate between PD and
manganism. However, some features in these patients favour
the diagnosis of welding-related manganism. They received the
diagnosis when they were between only 34 and 51 years old,
which is comparable to the age at onset in a previous study of
welders (Racette et al., 2001). The occurrence of parkinsonism
in this age is rare. The incidence of 3 cases/100,000 years in the
age group 30–49 has been reported in the USA (Schrag and
Schott, 2006). There are about 17,000 welders in the St.
Petersburg area (V. Chashchin, personal communication).
Hand tremor was not significant on the CATSYS in the
patients, and the tremor frequency was similar to that of the
referents. Tremor at rest is one of the cardinal symptoms in PD.
However, pure rest tremor is infrequent and a combination of
rest and postural tremor is more common (Bhidayasiri, 2005;
Koller et al., 1989). Postural tremor without visual feedback
discriminated better between PD patients and referents than rest
tremor (Beuter and Edwards, 1999). Tremor may occur in
manganism, but is not one of the main signs (Calne et al., 1994;
Mena et al., 1967). Few studies have used the CATSYS tremor
recording system in PD, but substantially higher tremor
intensity when compared to referents and also compared to our
patients has been reported (Biernat et al., 1999; Farkas et al.,
2006). A mixture of postural and resting tremor, lower central
frequency and a more narrow frequency dispersion in PD
compared to their referents was recorded by Farkas et al.
(2006). This was not found in our patients. Farkas et al. (2006)
reported a statistically significant different performance
between the better hand and the poorer hand in PD, but not
in their referents. The TI was 2.5 times higher in the more
affected hand than in the less affected hand in PD. Our patients
and the referents had only 1.3 times higher TI in the more
affected hand, suggesting that qualitative and quantitative
aspects of the hand tremor in our patients differ substantially
from PD.
The bilateral difference in motor performance of the patients
is about of the same magnitude as in the referents, indicating a
symmetrical manifestation of their disease. There is a common
recognition that asymmetric neurological performance is a
main feature of PD, but the causes for the unilaterality are
largely unknown (Djaldetti et al., 2006). This clinical
experience of PD has been studied rarely with neurobehavioral
tests.
The patients have a neurasthenic clinical picture, their major
subjective symptom being severe headache. Severe headache is
a frequently reported symptom in manganism (Rodier, 1955).
In contrast, it is unknown whether a specific mechanism of
headache exists in PD, and whether headache is more or less
frequent in PD than in a normal population (Ford, 1998). Thus,
it appears that headache, at least among the patients in this
study, is more prevalent than in PD.
We have previously reported that the patients have
significantly higher B-Mn as compared to the referents
(Ellingsen et al., 2006). This could suggest a substantial
previous exposure, but data on long-term accumulation of Mn
are rare. We have in these patients also measured biomarkers
indicating testicular dysfunction (Ellingsen et al., 2007).
Testicular pathology in combination with impairments of the
CNS is not known in PD. However, testicular pathology has
previously been observed in Mn-exposed animals at high
exposure (Chandra et al., 1973). This indicates that our patients
could have pathological changes which is not known to be
related to PD, in addition to their CNS affections.
In summary, associations between exposure and neurobe-
havioral performance have been shown in currently exposed
welders, and the most highly exposed subgroups differ
statistically significantly from their age-matched referents in
the Finger Tapping and Digit Symbol test performance. This
may indicate acute effects of exposure to Mn. The findings in
the patients are compatible with bradykinesia. Hand tremor was
not a prominent finding.

D.G. Ellingsen et al. / NeuroToxicology 29 (2008) 48–5958
Acknowledgement
The study was carried out with financial support from
International Manganese Institute, Paris, France.
References
Antonini JM, Taylor MD, Zimmer AT, Roberts JR. Pulmonary responses to
welding fumes: role of metal constituents. J Toxicol Environ Health (Part A)
2003;67:233–49.
Bast-Pettersen R, Skaug V, Ellingsen D, Thomassen Y. Neurobehavioral
performance in aluminium welders. Am J Ind Med 2000;37:184–92.
Bast-Pettersen R, Ellingsen DG, Hetland SM, Thomassen Y. Neuropsycholo-
gical function in manganese alloy plant workers. Int Arch Occup Environ
Health 2004;77:277–87.
Bast-Pettersen R, Ellingsen DG. The Kløve–Matthews Static Steadiness test
compared with the DPD TREMOR; comparison of fine motor control task
with measures of tremor in smokers and manganese-exposed workers.
Neurotoxicology 2005;26:331–42.
Beuter A, Edwards R. Using frequency domain characteristics to discriminate
physiologic and Parkinsonian tremors. J Clin Neurophysiol 1999;16:
484–94.
Beuter A, Mergler D, deGeoffry A, Carriere L, Belanger S, Varghese L, et al.
Diadochokinesimetry: a study of patients with Parkinson’s disease and
manganese exposed workers. Neurotoxicology 1994;15:655–64.
Bhidayasiri R. Differential diagnosis of common tremor syndromes. Postgrad
Med J 2005;81:756–62.
Biernat H, Ellias SA, Wermuth L, Cleary D, De Oliveira Santos EC, Jørgensen
PJ, et al. Tremor frequency patterns in mercury vapour exposure, compared
with early Parkinson’s disease and essential tremor. Neurotoxicology
1999;20:945–52.
Bonilla E. L-Tyrosine hydroxylase activity in the rat brain after chronic oral
administration of manganese chloride. Neurobehav Toxicol 1980;2:37–41.
Bowler RM, Gysens S, Diamond E, Booty A, Hartney C, Roels HA. Neurop-
sychological sequelae of exposure to welding fumes in a group of occu-
pationally exposed men. Int J Hyg Environ Health 2003;206:517–29.
Bowler RM, Gysens S, Diamond E, Nakagawa S, Drezgic M, Roels H.
Manganese exposure: neuropsychological and neurological symptoms
and effects in welders. Neurotoxicology 2006;27:315–26.
Bowler RM, Roels HA, Nakagawa S, Drezgic M, Diamond E, Park R, et al.
Dose-effect relationships between manganese exposure and neurological,
neuropsychological and pulmonary function in confined space bridge
welders. Occup Environ Med 2007;64:167–77.
Calne DB, Chu N-S, Huang C-C, Lu C-S, Olanow W. Manganism and
idiopathic parkinsonism: similarities and differences. Neurology 1994;44:
1583–6.
Chandra SV, Aar R, Nagar N, Seth PK. Sterility in experimental manganese
toxicity. Acta Biologica et Medica Germanica 1973;30:857–62.
Chen M-K, Lee J-S, McGlothan JL, Furukawa E, Adams RJ, Alexander M, et
al. Acute manganese administration alters dopamine transporter levels in
the non-human primate striatum. Neurotoxicology 2006;27:229–36.
Chia SE, Foo SC, Gan SL, Jeyaratnam J, Tian CS. Neurobehavioral function
among workers exposed to manganese ore. Scand J Work Environ Health
1993;19:264–70.
Cook DG, Fahn S, Brait KA. Chronic manganese intoxication. Arch Neurol
1974;30:59–64.
Couper J. On the effects of black oxide of manganese when inhaled into the
lungs. Br Ann Med Pharm 1837;1:41–2.
Daniels AJ, Abarca J. Effect of intranigral Mn2+ on striatal and nigral synthesis
and levels of dopamine and cofactor. Neurotoxicol Teratol 1991;13:483–7.
Danish Product Development Ltd. (DPD). User’s manual. Snekkersten, Den-
mark: DPD; 1996.
Deskin R, Bursian SJ, Edens FW. Neurochemical alterations induced by
manganese chloride in neonatal rats. Neurotoxicology 1980;2:65–73.
Djaldetti R, Ziv I, Melamed E. The mystery of motor asymmetry in Parkinson’s
disease. Lancet Neurol 2006;5:796–802.
Ellingsen DG, Dubeikovskaya L, Dahl K, Chashchin M, Chashchin V, Zibarev
E, et al. Air exposure assessment and biological monitoring of manganese
and other welding fume components in welders. J Environ Monit 2006;8:
1078–86.
Ellingsen DG, Chashchin V, Haug E, Chashchin M, Tkachenko V, Lubnina N,
et al. An epidemiological study of reproductive function biomarkers in male
welders. Biomarkers 2007;12(5):497–509.
Emara AM, El-Ghawabi. Madkour OI, El-Samra GH. Chronic manganese
poisoning in the dry battery industry. Br J Ind Med 1971;28:78–82.
Eriksson H, Gillberg P-G, Aquilonius S-M, Hedstrom K-G, Heilbronn E.
Receptor alterations in manganese intoxicated monkeys. Toxicology
1992a;66:359–64.
Eriksson H, Tedroff J, Thuomas KA, Aquilonius S-M, Hartvig P, Fasth KJ, et al.
Manganese induced brain-lesions in macaca fascicularis as revealed by
positron emission tomography and magnetic resonance imaging. Arch
Toxicol 1992b;66:403–7.
Farkas Z, Csillik A, Szirmai I, Kamondi A. Asymmetry of tremor intensity and
frequency in Parkinson’s disease and essential tremor. Parkinsonism Relat
Disord 2006;12:49–55.
Ford B. Pain in Parkinson’s disease. Clin Neurosci 1998;5:63–72.
Hochberg F, Miller G, Valenzuela R, McNelis S, Crump KS, Covington T, et al.
Late motor deficits of Chilean manganese miners: a blinded control study.
Neurology 1996;47:788–95.
Huang C-C, Chu N-S, Lu C-S, Wang J-D, Tsai J-L, Tzeng J-L, et al. Chronic
manganese intoxication. Arch Neurol 1989;46:1104–6.
Iregren A. Psychological test performance in foundry workers exposed to low
levels of manganese. Neurotoxicol Teratol 1990;12:673–5.
Kim Y, Kim KS, Yang JS, Park IJ, Kim E, Jin Y, et al. Increase in signal
intensities on T1-weighted magnetic resonance images in asymptomatic
manganese-exposed workers. Neurotoxicology 1999;20:901–8.
Koller WC, Vetere-Overfield B, Barter R. Tremors in early Parkinson’s disease.
Clin Neuropharmacol 1989;12:293–7.
Lezak MD. Neuropsychological assessment. New York: Oxford University
Press; 1995.
List of Occupational Diseases. Ministry of Health and Medical Industry of the
Russian Federation. Order no. 90, Appendix no., 1996.
Lucchini R, Selis L, Folli D, Apostoli P, Mutti A, Vanoni O, et al. Neurobe-
havioral effects of manganese in workers from a ferroalloy plant after
temporary cessation of exposure. Scand J Work Environ Health 1995;21:
143–9.
Lucchini R, Apostoli P, Perrone C, Placidi D, Albini E, Migliorati P, et al. Long
term exposure to ‘‘low levels’’ of manganese oxides and neurofunctional
changes in ferroalloy workers. Neurotoxicology 1999;20:287–98.
Lundberg I, Hogberg M, Michelsen H, Nise G, Hogstedt C. Evaluation of the
Q16 questionnaire on neurotoxic symptoms and a review of its use. Occup
Environ Med 1997;54:343–50.
Matthews CG, Kløve H. Instruction manual for the adult neuropsychological
test battery. Madison, WI: University of Wisconsin Medical School; 1964.
McMillan DE. A brief history of the neurobehavioral toxicity of manganese:
some un-answered questions. Neurotoxicology 1999;20:499–508.
Mena I, Marin O, Fuenzalida S, Cotzias GC. Chronic manganese poisoning.
Clinical picture and manganese turnover. Neurology 1967;17:128–36.
Mergler D, Huel G, Bowler R, Iregren A, Belanger S, Baldwin M, et al.
Nervous system dysfunction among workers with long-term exposure to
manganese. Environ Res 1994;64:151–80.
Normandin L, Hazell AS. Manganese neurotoxicity: an update of pathophy-
siologic mechanism. Metabol Brain Dis 2002;17:375–87.
Olanow CW, Good PF, Shinotoh H, Hewitt KA, Vingerhoets F, Snow BJ, et al.
Manganese intoxication in the rhesus monkey: a clinical, imaging, patho-
logic, and biochemical study. Neurology 1996;46:492–8.
Pal PK, Samii A, Calne DB. Manganese neurotoxicity: a review of clinical
features, imaging and pathology. Neurotoxicology 1999;20:227–8.
Racette BA, McGee-Minnich L, Moerlein SM, Mink JW, Videen TO, Perl-
mutter JS. Welding related parkinsonism; clinical features, treatment, and
pathophysiology. Neurology 2001;56:8–13.
Reitan RM, Wolfson D. The Halstead-Reitan Neuropsychological Test
Battery. In: Theory and clinical implication. Arizona: Neuropsychology
Press; 1985 .

D.G. Ellingsen et al. / NeuroToxicology 29 (2008) 48–59 59
Rodier J. Manganese poisoning in Moroccan miners. Br J Ind Med 1955;12:
21–35.
Roels H, Lauwerys R, Buchet JP, Genet P, Sarhan MJ, Hanotiau I, et al.
Epidemiological survey among workers exposed to manganese: effects on
lung, central nervous system, and some biological indices. Am J Ind Med
1987;11:307–27.
Roels HA, Ghyselen P, Buchet JP, Ceulemans E, Lauwerys RR. Assessment of
permissible exposure level to manganese in workers exposed to manganese
dioxide dust. Br J Ind Med 1992;49:25–34.
Roels HA, Ortega Eslava MI, Ceulemans E, Robert A, Lison D.
Prospective study on the reversibility of neurobehavioral effects in
workers exposed to manganese dioxide. Neurotoxicology 1999;20:
255–72.
Schrag A, Schott JM. Epidemiological, clinical, and genetic characteristics of
early-onset parkinsonism. Lancet Neurol 2006;5:355–63.
Siegl P, Bergert K-D. Eine fruhdiagnostische Uberwachungsmetode bei Man-
ganexposition. Z Ges Hyg 1982;28:524–6 [in German].
Sjogren B, Iregren A, Frech W, Hagman M, Johansson L, Tesarz M, et al.
Effects on the nervous system among welders exposed to aluminium and
manganese. Occup Environ Med 1996;53:32–40.
Tanaka S, Lieben J. Manganese poisoning and exposure in Pennsylvania. Arch
Environ Health 1969;19:674–84.
Voitkevich V. Welding fume properties. In: Welding fumes—formation, proper-
ties and biological effects. Abington, England: Cambridge; 1995 p. 18–71.
Wang X, Yang Y, Wang X, Xu S. The effect of occupational exposure to metals
on the nervous system function in welders. J Occup Health 2006;48:100–6.