a multidimensional conceptualization of environmental velocity
TRANSCRIPT
A MULTIDIMENSIONAL CONCEPTUALIZATION
OF ENVIRONMENTAL VELOCITY
Ian P. McCarthy [email protected]
Thomas B. Lawrence [email protected]
Brian Wixted
Brian R. Gordon [email protected]
Faculty of Business Administration
Simon Fraser University Vancouver, BC
CANADA V6C 1W6
This paper has been accepted for the Academy of Management Review.
McCarthy, I.P., Lawrence, T.B., Wixted, B., and Gordon, B. A Multidimensional conceptualization of environmental velocity. Academy of Management Review October, 2010 (In press)
1
A MULTIDIMENSIONAL CONCEPTUALIZATION
OF ENVIRONMENTAL VELOCITY
Environmental velocity has emerged as an important concept but remains theoretically
underdeveloped, particularly with respect to its multidimensionality. In response, we develop a
framework that examines the variations in velocity across multiple dimensions of the
environment (homology) and the causal linkages between those velocities (coupling). We then
propose four velocity regimes based on different patterns of homology and coupling, and argue
that the conditions of each regime have important implications for organizations.
We are grateful to Associate Editor Mason Carpenter and three anonymous reviewers for their helpful and constructive comments. The development of this paper also benefited from comments from Joel Baum, Danny Breznitz, Sebastian Fixson, Mark Freel, Rick Iverson, Danny Miller, Andrew von Nordenflycht, Dave Thomas, Mark Wexler, Carsten Zimmermann, and seminar participants at Simon Fraser University and the 2008 INFORMS Organization Science Paper Development Workshop. We are also grateful to the Canadian Social Sciences and Humanities Research Council for funding that supported this research.
2
Environmental velocity1 has become an important concept for characterizing the
conditions of organizational environments. It was introduced to the management literature in
Bourgeois and Eisenhardt’s (1988) study of strategic decision making in the micro-computer
industry. They described this industry as a “high-velocity environment” – one characterized by
“rapid and discontinuous change in demand, competitors, technology and/or regulation, such that
information is often inaccurate, unavailable, or obsolete” (Bourgeois & Eisenhardt, 1988: 816).
From the perspective that the environment is a source of information that managers use to
maintain or modify their organizations (Aldrich, 1979, Scott, 1981), velocity has important
implications for organizations. Studies have found, for example, that success in high-velocity
industries is related to fast formal strategic decision making processes (Eisenhardt, 1989; Judge
& Miller, 1991), high levels of team and process integration (Smith et al., 1994), rapid
organizational adaptation and fast product innovation (Eisenhardt & Tabrizi, 1995), and the use
of heuristic reasoning processes (Oliver & Roos, 2005). More generally, research on velocity has
shown that it affects how managers interpret their environments (Nadkarni & Barr, 2008;
Nadkarni & Narayanan, 2007a), further highlighting the effects of environmental dynamism on
key organizational members (Dess & Beard, 1984).
A common feature of the treatment of environmental velocity in the literature has been
the use of singular, categorical descriptors to characterize industries – most typically as “low”,
“moderate” or “high” velocity (e.g., Bourgeois & Eisenhardt, 1988; Eisenhardt, 1989; Eisenhardt
& Tabrizi, 1995; Judge & Miller, 1991; Nadkarni & Narayanan, 2007a, 2007b). Although
Bourgeois and Eisenhardt (1988) defined environmental velocity in terms of change (rate and
direction) in multiple dimensions (demand, competitors, technology and regulation), research on
velocity has tended to overlook its multidimensionality. Instead, research on environmental 1 To increase the paper’s readability we use the terms “environmental velocity” and “velocity” interchangeably.
3
velocity tends to assume that a single velocity can be determined by aggregating the paces of
change across all the dimensions of an organization’s environment. This assumption overlooks
the fact that environmental velocity is a vector quantity jointly defined by two attributes (the rate
and the direction of change), and that organizational environments are composed of multiple
dimensions each of which may be associated with a distinct rate and direction of change.
In this paper we aim to advance understanding of environmental velocity by developing a
theoretical framework that articulates its multidimensionality, and by exploring the implications
of this framework for understanding the organization-environment relationship. We argue that
while there may be cases in which organizational environments can be accurately specified by a
single descriptor (e.g., “high velocity”), a multidimensional conceptualization opens up a number
of opportunities. First, it provides a basis for more fine-grained descriptions of the patterns of
change that occur in organizational environments. An understanding of a firm’s environmental
velocity as composed of multiple, distinct rates and directions of change across multiple
dimensions allows us to move beyond characterizations of industries as “high” or “low” velocity
and the assumption that all dimensions change at similar rates and in similar directions
(Bourgeois & Eisenhardt, 1988; Eisenhardt, 1989; Judge & Miller, 1991; Smith et al., 1994).
Perhaps most importantly in this regard, a multidimensional conceptualization allows for an
examination of the relationships among the dimensions of velocity, which we argue can have a
profound impact on organizations.
Second, a multidimensional conceptualization of velocity offers a foundation for more
consistent operationalizations of the construct, which would help improve the reliability and
validity of research that employs it. Our review of the environmental velocity literature indicates
a reliance on singular descriptors of velocity, which has led to inconsistent operationalizations of
4
the construct. Thus, while it has sometimes been claimed that people can recognize a high-
velocity environment when they see one (Judge & Miller 1991), the different ways that the
velocity of the same industry has been categorized by different researchers would seem to
indicate otherwise. Such inconsistencies may be due to a focus on one or two particularly salient
velocity dimensions, or to combining data for multiple velocity dimensions without considering
the aggregation errors that can occur if the dimensions do not perfectly covary.
Finally, by understanding that the environments of organizations have multiple distinct
velocities it is possible to identify different patterns of environmental velocity, whose conditions
affect organizations in ways that go beyond the insights that have emerged from studies that
characterize velocity as simply high or low. Specifically, we explain how the
multidimensionality of velocity can affect the degree to which an organization’s activities will be
entrained and adjusted over time. We then highlight how these implications apply to two
processes that have been central to prior research on velocity: strategic decision making and new
product development.
Our exclusive focus on environmental velocity differs from prior research that has sought
to characterize organizational environments in terms of a set of core properties, most commonly
some variation of complexity, dynamism, and munificence (Aldrich, 1979; Dess & Beard, 1984;
Scott, 1981). In pursuing this aim, we recognize the trade-offs among generalizability, accuracy,
and simplicity (Blalock, 1982) inherent in examining one dimension of the environment in depth,
while bracketing other important environmental dimensions. Research focused on the general
organizational environment has strived for “high levels of simplicity and generalizability, with a
corresponding sacrifice of accuracy” (Dess & Rasheed, 1991: 703). This approach has been
characterized as “collapsing” the heterogeneity of the environment into a more parsimonious set
5
of properties (Keats & Hitt, 1988). In contrast, we focus on a single specific aspect of
environmental dynamism – velocity – and explore in detail its dimensions, how the velocities of
these dimensions vary and interact, and the consequences of those differences and interactions.
Our approach follows other studies that have examined specific environmental constructs, such
as uncertainty (Milliken, 1987) and munificence (Castrogiovanni, 1991). An important
consequence of focusing on a single aspect of the environment is that any normative or
predictive claims we make must be made with ceteris paribus restrictions placed on them. This,
of course, complicates the application of such claims in research or practice, but also allows a
deeper examination of specific phenomena (Pietroski & Rey, 1995).
We present our arguments in five sections. First, we review the concept of environmental
velocity as it has been developed in management research, focusing on the opportunities that this
work presents for developing a multidimensional conceptualization. Second, we present our
framework by defining several fundamental dimensions of the organizational environment, and
defining the key aspects of velocity – the rate and direction of change – for each dimension.
Third, we examine the potential relationships among velocity dimensions (such as products and
technology) by introducing three concepts: “velocity homology” which is the degree to which
velocity dimensions have similar rates and directions of change at a point in time; “velocity
coupling” which is the degree to which the velocities of different dimensions affect one another
over time; and “velocity regimes” which represent patterns of velocity homology and velocity
coupling. Fourth, we explore the implications of our framework for organization-environment
relationships, and for strategic decision making and new product development.
ENVIRONMENTAL VELOCITY IN MANAGEMENT RESEARCH
In physics, velocity refers to the rate of displacement or movement of a body in a
6
particular direction. Thus, it is a vector quantity jointly defined by two distinct attributes, the rate
of change and the direction of change. The definition of “high velocity” environments articulated
by Bourgeois and Eisenhardt (1988) captured these two attributes, as it referred to rapid and
discontinuous change in multiple dimensions of the environment such as demand, competitors,
technology and regulation. The notion of “high velocity” provided an evocative way of
characterizing the fast moving, high technology industry that was the context of their studies, and
complemented a number of similar, but conceptually distinct environmental constructs, including
dynamism (Baum & Wally, 2003; Dess & Beard, 1984; Lawrence & Lorsch, 1967), turbulence
(Emery & Trist, 1965; Terreberry, 1968) and hyper-turbulence (McCann & Selsky, 1984). More
recently, environmental velocity has been used in conjunction with or as a synonym for other
related environmental constructs, such as clockspeed (i.e., the speed of change in an industry)
(Fine, 1998; Nadkarni & Narayanan 2007a, 2007b), and hyper-competition (Bogner & Barr,
2000; D’Aveni, 1994).
Table 1 lists some of the major studies in strategic management and organization theory
in which the concept of environmental velocity plays a central role. For each study, it delineates
the phenomenon of interest, the industry context, the “level” (high, moderate or low) of velocity
considered, and the measures employed (if any). Looking across these studies, we identify three
themes that characterize much of the existing research in the area and provide the motivation for
the theoretical framework that we develop.
Insert Table 1 about here
First, existing studies have predominantly focused on “high-velocity” environments, with
limited attention to other potential patterns of velocity. Consequently, we know relatively little,
for instance, about the velocity-related challenges faced by firms operating in “low-velocity”
7
environments, in which the slow pace of change may be associated with protracted development
lead-times, long decision horizons, and relatively infrequent feedback. Also, and more generally,
the focus on “high-velocity” environments may be a significant factor in the treatment of
velocity in terms of singular categorical descriptors: the term “high-velocity environment” itself
seems to imply that multiple dimensions of the environment (e.g., products, markets, technology)
combine non-problematically to produce a single, cumulative, high level of velocity. While this
may be true in some cases, it is not clear that it applies broadly across firms and industries.
Second, “high-velocity” environments are often presented as synonymous with high-
technology industries, perhaps because Bourgeois and Eisenhardt’s initial study focused on the
early micro-computer industry. Industries have been categorized as “high-velocity” simply
because they are technology intensive (Smith et al., 1994), or built around an evolving scientific
base (Eisenhardt & Tabrizi, 1995), regardless of whether other environmental dimensions exhibit
low or modest rates of change or relatively continuous directions. Judge and Miller (1991), for
instance, identify the biotechnology industry as high-velocity, despite its relatively long product
development lead-times and product life-cycles (both 10 to 20 years).
Finally, existing research tends to lack an explicit measurement model or justification for
the categorization of specific organizational contexts or industries. Instead, studies just declare
that they are studying high velocity environments, and reiterate Bourgeois and Eisenhardt’s
(1988) original definition without significant explanation or direct evidence (the studies by Judge
and Miller (1991) and Nadkarni & Barr (2008) representing notable exceptions). This variation
in the extent to which velocity has been operationalized has resulted in some counterintuitive and
inconsistent categorizations of industry velocity. Studies of healthcare, for instance, have labeled
those environments as both high velocity (Stepanovich & Uhrig, 1999) and moderate velocity
8
(Judge & Miller, 1991). Furthermore, our understanding of velocity and its effects across
industry contexts has largely focused on only one attribute of velocity – the rate of change – as
prior research has tended to use measures associated with the “clockspeed” of an industry (e.g.,
Nadkarni & Narayanan, 2007a; Oliver & Roos, 2005; Smith et al., 1994) or equated velocity to
the speed at which new opportunities emerge (Davis, Eisenhardt & Bingham, 2009).
Looking across these themes, we see that research on environmental velocity has
provided interesting and influential insights, particularly into the nature of organizational
processes operating in fast changing, high technology industries. We suggest, however, that the
construct itself requires a more fine-grained examination, as existing research tends to assume
that it can be adequately represented by an aggregation of the rates of change across different
environmental dimensions, or by a focusing on change in only one dimension of the environment
to the exclusion of others. In contrast, we believe that a multidimensional conceptualization of
velocity would provide a stronger foundation for clarifying and operationalizing its
characteristics and better understanding its diversity and impacts on organizations.
ENVIRONMENTAL VELOCITY AS A MULTIDIMENSIONAL CONCEPT
The core understanding of environmental velocity that we propose is that organizational
environments are composed of multiple dimensions, each of which is associated with its own
rate and direction of change. This simple notion, we argue, has profound effects on how we
understand and research velocity, and on the organizational reactions to velocity we expect and
prescribe. In this section we begin to construct our theoretical framework, first by defining the
basic concepts of rate of change and direction of change as they apply to the organizational
environment in general, and then by describing how these basic concepts apply to some primary
dimensions of the organizational environment.
9
The Rate and Direction of Change
Environmental velocity is a vector quantity defined by the rate and direction of change
exhibited by one or more dimensions of the organizational environment over a specified period.
The rate of change is the amount of change in a dimension of the environment over a specified
period of time, and is synonymous with concepts such as pace, speed, clock rate, or frequency of
change. The direction of change, while often mentioned in studies when they cite Bourgeois and
Eisenhardt’s (1988) definition, has had relatively little attention paid to it beyond that. One
possible reason for this is the relative difficultly of describing the direction of environmental
change. Whereas the velocity of a physical object can be described simply as moving eastwards
at 50km/hr, similarly straightforward descriptions of the direction of change of an organizational
environment are not so obvious. This is particularly the case when we consider the direction of
change across different industry dimensions, such as products, technology and regulation, the
direction of each of which could be described in numerous distinct ways.
In order to describe the direction of change in a way that allows comparison across
industry dimensions, we follow Bourgeois and Eisenhardt (1988) who suggest that the direction
of change varies in terms of its degree of continuity-discontinuity. They argue that continuous
change represents an extension of past development (e.g., continuously faster computer
technology), whereas discontinuous change represents a shift in direction (the move from film to
digital photography, or the shifts that occur in fashion industries). Discontinuities can, therefore,
be represented by inflection points in the trajectories that describe change in a dimension over
time (e.g., technology price-performance curves, or demand curves for specific products). To
more fully articulate a continuum of continuous-discontinuous change, we draw on Wholey and
Brittain’s (1989) three-part conceptualization of environmental variation: we argue that the
10
direction of change is discontinuous to the extent that shifts in the trajectory of change are more
recurrent, with greater amplitude, and with greater unpredictability, over a period of time. This
approach helps to distinguish between relatively regular, predictable (e.g., seasonal) variations in
environmental velocity, and irregular types of change that are more difficult to predict and
consequently more challenging in terms of organizational responses (Milliken, 1987). We
suggest that such variations in the continuity-discontinuity of a velocity dimension’s trajectory
allow for the use of structural equation modeling (Kline, 2004) and difference scores (Edwards,
1994), to produce growth models that measure transitions in change over time (Bliese, Chan &
Ployhart, 2007; Singer & Willett, 2003). Furthermore, to operationalize the rate and direction of
change of each velocity dimension, we suggest that the measures will require scale uniformity to
allow the relative differences between the dimensions to be compared and correlated (Downey,
Hellriegel & Slocum, 1975; Milliken, 1987). To achieve this we suggest that the rate and
direction of change will be some form of scalar measure (e.g., change/time). Therefore, even
though what is changing will vary for each of the dimensions, their relative rates and directions
of change can be determined and compared by using the same period of time for the different
dimensions (i.e., new products per year and changes in product direction per year).
Dimensions of Environmental Velocity
The second way in which we break down the concept of environmental velocity is in
terms of the dimensions of the organizational environment that are changing. While the
dimensions of the environment that are salient for any particular study will vary according to the
specifics of the research project, there are several that have been widely used in prior research on
organizational environments. We use the four dimensions suggested by Bourgeois and
Eisenhardt (1988) – demand, competitors, technology, and regulation, and to this list we add a
11
fifth dimension – products. We do this because prior research on environmental velocity has
tended to merge the technology and product dimensions, and we argue that they often have
dissimilar rates and directions of change, which makes separating them important for our
purposes. Archibugi and Pianta (1996) point to the importance of this distinction when they
argue that product changes need not be technical, but can also include changes in the aesthetic,
branding or pricing features of a product. Our discussion of environmental dimensions is not
meant to be exhaustive; rather, it is meant to highlight the heterogeneity of environmental
dimensions that motivates our development of a multidimensional conceptualization of velocity.
Technological velocity. Technological velocity is the rate and direction of change in the
production processes and component technologies that underlie a specific industrial context, such
as float glass technology in glass manufacturing, genetic engineering in the biotechnology
industry, and rolling mills in metals processing. See Table 2 for a summary of the definitions for
each of the velocity dimensions on which we focus.
Insert Table 2 about here
The rate of technological change is the amount of change in those technologies over a
specific time period, including the creation of new technologies, the refinement of existing
technologies, and the recombination of component technologies. The rate of technological
change varies dramatically across industries. Drawing on patents as an indicator of the rate of
technological change, one can argue, for instance, that the electronics industry exhibits a more
rapid rate of technological change than does the oil industry. In 2006, rankings for the number of
patents granted in the U.S. showed that the top five positions were held by electronics
companies, while the oil industry firms Shell and Exxon, occupied positions 126 and 139
respectively (IFI, 2008). Although some technological change is either not patentable or not
12
patented for strategic reasons, the rate of patenting can, nevertheless provide a useful indication
of technological rate of change, as it is a relatively direct and publicly available indicator of the
proprietary technological outputs of an industry (Archibugi & Pianta, 1996; Griliches, 1990).
The direction of technological change refers to the trajectories along which technological
advancements take place (Abernathy & Clark, 1985; Dosi, 1982; Tushman & Anderson, 1986).
Distinguishing between continuous and discontinuous directions of technological change is most
easily understood in terms of performance/price curves. Continuous technological change
involves a series of improvements that enhance the performance of the technology (e.g.,
advances in photographic film technology focused on improving contrast quality, light sensitivity
and speed). Such changes move a technology smoothly along a performance/price curve, usually
at a decreasing rate, thus creating a concave downward performance/price curve. In contrast,
discontinuous technological change involves “architectural” (Henderson & Clark, 1990) or
“radical” innovations that “dramatically advance an industry's price vs. performance frontier”
(Anderson & Tushman, 1990: 604). These innovations temporarily alter the shape of the
performance/price curve such that it becomes concave upward until the immediate benefits of the
innovation are exhausted.
Product velocity. This dimension is the rate and direction of new product introductions
and product enhancements. We define products as any combination of ideas, services and goods
offered to the market (Kotler, 1984). The rate of change in products can vary tremendously
across industries and across markets segments within an industry. In terms of the former,
Nadkarni and Narayanan (2007a, 2007b) and Fine (1998), show that the movie, toy, and athletic
footwear industries have relatively high rates of product change (new products launched every 3-
6 months), while the aircraft, petrochemical and paper industries have low rates of product
13
change (new products launched every 10-20 years). The direction of change for products can be
described as continuous when new product introductions represent improvements on previously
important product attributes, and discontinuous when the new products introduce fundamentally
new attributes for consumer choice. Adner and Levinthal’s (2001) study of the personal
computer industry between 1974 and 1998 provides an example of relatively continuous product
change with only two major inflection points with respect to price (in 1981 and 1988), and no
major inflection points with respect to performance. In contrast, fashion products, such as
clothing, music and travel, all change frequently through the creation of new products and the
transformation and repackaging of existing ones. Such variations in product change across
industries are associated with differences in the complexity, risk and impact of the product
change. While velocity research has often lumped together product and technological velocities,
our definitions of their rates and directions of change illustrate the importance of distinguishing
between them. Over the past several decades, for example, the underlying materials and
production processes in the automobile industry have changed more rapidly and discontinuously
than have the end products themselves. In contrast, textile production technologies have changed
more slowly and continuously than the fashion products they are used to create.
Demand velocity. Demand velocity is the rate and direction of change of the willingness
and ability of the market to pay for goods or services, including changes in the number and types
of transactions and market segments. The rate of change in demand varies tremendously across
industries, with some experiencing rapid growth or decline and others facing steady growth for
years. Such variance is influenced by a wide range of factors including changes in tastes, new
rival products, substitutes, complements, changes in relative prices, business cycle fluctuations,
and switching costs. Empirical research has used summary industry sales figures as an indicator
14
of the rate of change in demand (e.g., Bourgeois & Eisenhardt, 1988).
The direction of change for demand is continuous when there is a steady progression of
increasing or decreasing sales to a consistent set of consumers. Conversely, change in the
direction of demand is discontinuous when there are frequent, significant, unpredictable shifts in
the growth, decline or steady state of demand, or a radical change in the segments that comprise
the overall market. For example, demand velocity in the U.S. restaurant industry from 1970 to
1995, was relatively continuous with sales gains made nearly every year during that period
(Harrington, 2001). In contrast, the demand for commodities, such as copper and gold can be
highly volatile due to a wide range of macro-economic influences, exemplifying the case of a
discontinuous demand velocity. Similarly, the Nintendo Corporation created discontinuous
change in the demographics of demand as its Wii games console appealed to non-traditional
market segments such as families, women and older people.
Regulatory velocity. We define regulatory velocity as the rate and direction of change in
the regulations and/or laws that directly affect the firm or industry under consideration. This
includes government action (e.g., changes in laws, regulations and polices) and industry self-
regulation (e.g., voluntary standards and codes). It is a dimension that can open or close markets,
present organizations with compliance costs, and necessitate strategic shifts in practices. The rate
of regulatory change is a function of the creation of new laws or regulations, or changes to
existing laws or regulations, in a time period. It can vary greatly across industrial, national and
historical contexts, and often depends on other factors such as technology (e.g., regulations for
stem cell research), business scandals (e.g., the Enron scandal), health and safety issues (e.g.,
mad cow disease), and demographic shifts (e.g., an increase in the retired population).
The direction of change in regulation is continuous to the degree that new regulations
15
resemble the old in scope, form, or substantive areas of concern, and is discontinuous to the
degree that they address new issues, focus on different kinds of behaviors, or employ new
principles. The U.S. airline industry, for example, from 1938 to 1975, experienced changes in
regulations that were relatively continuous, in that the Civil Aeronautics Board (CAB) restricted
prices, flight frequency, and flight capacity (Vietor, 1990). Then in 1975 the direction of
regulatory change changed as the CAB began experimenting with limited deregulation, and in
1978 the industry was completely deregulated and the CAB was abolished.
Competitive velocity. Competitive velocity is the rate and direction of change in the
structural determinants of industry profitability (Barney, 1986; Porter, 1980). Its rate of change
is, in part, a function of entrance and exit of industry rivals (Hannan & Carroll, 1992), as well as
the speed with which firms respond to competitors’ strategic moves or other shifts in the
environment (Bowman & Gatignon, 1995). Such measures describe the overall pace at which the
competitive conditions that define an industry are changing; a factor that has been shown to
influence firm performance across a wide range of industries, including automotives (Hannan,
Carroll, Dundon & Torres, 1995), computer firms (Henderson, 1999), and insurance companies
(Ranger-Moore, 1997).
The direction of change in competitive structure involves continuity-discontinuity with
respect to the value chain in an industry (Jacobides & Winter, 2005), the nature of rivals
(Schumpeter, 1950; Porter, 1980), or changes in market contestability (Hatten & Hatten, 1987).
Change in competitive structure is continuous to the degree that these characteristics remain
constant and stable over time. Conversely, the change in direction in competitive structure is
discontinuous to the degree that industry value chains are in flux (Jacobides, 2005), and existing
bases of competition are challenged by firms introducing new products, pioneering new markets
16
or sources of supply, or implementing new means of productions (Schumpeter, 1950).
RELATIONSHIPS AMONG VELOCITY DIMENSIONS:
HOMOLOGY, COUPLING, AND VELOCITY REGIMES
An important benefit of a multidimensional conceptualization of environmental velocity
is the potential it provides to examine the differences and relationships among the velocities of
different dimensions. To that end, we introduce three concepts: (1) “velocity homology” – the
relative similarity among the rates and directions of change of different dimensions; (2) “velocity
coupling” – the degree to which the velocities of different dimensions are causally connected;
and (3) “velocity regimes” – different patterns of environmental velocity that emerge from the
variations in velocity homology and velocity coupling.
Velocity Homology
The term “homology” was coined by the paleontologist Richard Owen (1843) to explain the
morphological similarities among organisms. It has been used by management scholars to
describe the degree to which two phenomena are similar (Chen, Bliese & Mathieu, 2005; Glick,
1985; Hanlon, 2004) and is consistent with the homogeneity-heterogeneity aspect of
environmental complexity (Aldrich, 1979; Dess & Beard, 1984). In our framework, velocity
homology is the degree to which the rates and directions of change of different dimensions are
similar to each other over a period of time. Thus, “high homology” describes a condition in
which the velocities of different dimensions in a given environment exhibit relatively similar
rates and directions of change, while “low homology” describes relatively dissimilar rates and
directions of change. To help explain velocity homology we present a map of the velocities of
different dimensions, with the rate of change and the direction of change on each axis (see Figure
1). From this image of velocity (based on the fashion apparel industry example we present in the
17
following sections), homology is represented by the closeness of the points. Thus, “low
homology” (as is the case in Figure 1) is represented by relatively spread out points, and “high
homology” would be represented by relatively tightly clustered points. To operationalize this
concept of homology we suggest using distance measures and methods such as cluster analysis
(Ketchen & Shook, 1996), factor analysis (Segars & Grover, 1993), and multidimensional
scaling (Cox & Cox, 2001), all of which are considered suitable for assessing inter-dimension
similarity in construct composition (Harrison & Klein, 2007; Law, Wong & Mobley, 1998).
Insert Figure 1 “Fashion Industry” about here
An assumption of a highly homologous set of velocities typifies much of the early work
on high-velocity environments, in which industries such as micro-computers are characterized by
“rapid and discontinuous change” across multiple dimensions (Bourgeois & Eisenhardt, 1988:
816). An assumption of high homology has been carried over to subsequent studies with limited
consideration for the degree to which homology might vary across firms and industries. Most
studies seem to have aggregated the velocities of different dimensions regardless of the variance
among these dimensions, thereby assuming similarity (i.e., high homology in our terms) among
the velocities of different environmental dimensions. Consequently, we know relatively little
about the conditions and effects of low homology environments, in which the velocity properties
of a firm’s multiple environmental dimensions are highly dissimilar.
Velocity homology in the fashion apparel industry. To illustrate and clarify the
concept of homology, we present the example of the apparel industry, and focus on the industry
segment involved in the design and supply of seasonal fashion apparel, including brands sold
primarily through own stores (e.g., Gap, Zara and American Apparel) and brands sold through a
mixture of own stores and independent stores (e.g., Armani, Benetton and Levis). We chose this
18
industry because academic studies and business reports suggest that from 1985 – 2005, the
velocities of different dimensions in this industry spanned a diverse range of rates and directions
of change (Djelic & Ainamo, 1999; Economist, 2005; Jacobides & Billinger, 2006; Taplin &
Winterton, 1995).
Beginning with the product dimension, this segment of fashion retailing is associated
with a relatively high rate of change and a moderately discontinuous direction. This is illustrated
by the operations of Zara, one of Europe’s leading fashion brands: Zara launches some 11,000
new products annually, most of which are completely new products as perceived by the
customer, and typically take only five weeks from design to retail store (Economist, 2005). Even
casual fashion houses such as Sweden’s Hennes & Mauritz (H&M) and the American chain,
Gap, roll out between 2,000 and 4,000 products each year. Moreover, the rate of change in
products has increased with the emergence of “fast fashion” as a dominant strategy for mass
market designer/retailers (Doeringer & Crean, 2006). We argue that the direction of product
change is moderately discontinuous because although these firms launch many new products,
they represent a mix of new items and extensions of existing products. This view is consistent
with studies of the rate and direction of change in women’s formal wear (Lowe & Lowe, 1990).
The technologies that underpin the fashion industry have been changing rapidly over the
past 20 years (c.f., Richardson, 1996), but at a relatively slower rate than changes in fashion
products. Although manufacturing technology in the apparel industry has remained stable for
nearly a century (Audet & Safadi, 2004), there have been advances in the manufacture of
textiles, as well as in communication and information technologies that have facilitated the
moves to “quick response” (Forza & Vinelli, 1997) and “fast fashion” (Doeringer & Crean,
2006) strategies in fashion design and retailing. The direction of these changes has been
19
relatively continuous over the past 20 or so years – toward greater automation and efficiency in
textile manufacturing, more rapid response to customer demands, and more efficient
communication and coordination in fashion design and retailing (Doeringer & Crean, 2006;
Economist, 2005).
In contrast to the product and technological velocities, regulatory change in this industry
has, for the past two decades, occurred relatively slowly and continuously. The regulation that
affects this industry most significantly is directed at the manufacture of clothing and the
protection of consumer rights, both of which have changed slowly over that period. With respect
to the manufacture of garments, the Multi Fibre Arrangement (MFA) was introduced in 1974 as
a short term measure to govern world trade in textiles and garments, imposing quotas on the
amount developing countries could export to developed countries (Spinanger, 1999). This
regulation underwent only minor modifications until it expired in 2005 (Audet & Safadi, 2004).
National-level regulation tends to focus on labor and employment standards. In response to the
shift of clothing manufacturing from developed to emerging economies, the governments of
Western nations have been reluctant to further regulate (and potentially stifle) clothing
manufacturing, much of which occurs as home-based work (Ng, 2007).
Change in demand for fashion apparel has, for the past 20 years, occurred moderately
slowly with a high degree of discontinuity. Researchers argue that the fashion industry is
characterized by low to moderate levels of positive sales growth each year (Nueno & Quelch,
1998), with occasional, major demographic and lifestyle shifts, and changes in customer
preferences (Danneels, 2003; Siggelkow, 2001). Although the direction of change in demand for
fashion has oscillated between relative stability and discontinuity over the last 150 years (Djelic
& Ainamo, 1999), the past 20 year period has been associated with customers becoming more
20
demanding, arbitrary and heterogeneous (Djelic & Ainamo, 1999; Economist, 2005).
The competitive velocity of the fashion industry has long fascinated observers. In recent
years, it has altered as increased cost pressures have led firms to engage in rapid-fire attempts to
source the lowest cost materials and move labor-intensive aspects of the value chain to countries
with lower costs. The industry has also experienced constant shifts in the major centers of
production (Dosi, Freeman & Fabiani, 1994). By way of example, U.S. employment levels in
this sector in 2002 were a third of what they were in the early 1980s (Doeringer & Crean, 2006).
The intersection of cost pressures and the increasing rate of change in consumer preference and
demand has led to significant shifts in firms’ strategies, particularly speeding up the supply chain
(Richardson, 1996), and altering organizational structures and boundaries (Djelic & Ainamo
1999; Jacobides & Billinger, 2006; Sigglekow, 2001). Such conditions characterize change that
is both moderately rapid and continuous in nature.
The fashion industry points to two important issues with respect to understanding
homology among environmental velocity dimensions. First, it highlights that the organizational
environment is composed of a number of distinct dimensions, each of which is defined by its
own rate and direction of change, or velocity. Second, we see that there are significant
differences in the rates and directions of change (low homology) across the five dimensions that
we have considered. This makes the idea of describing the industry as having a single velocity,
whether based on an “average” across dimensions, or on the velocity of whichever dimension
might be as considered most important, misleading both to researchers attempting to understand
the industry and to managers needing to make strategic decisions.
Velocity Coupling
A second important aspect of the relationship between velocity dimensions is the degree
21
to which and the ways that they interact over time. We examine these interactions through the
concept of coupling. This is the degree to which elements of a system are causally linked to each
other (Orton & Weick, 1990; Weick, 1976), including product components (Baldwin & Clark,
1997; Sanchez & Mahoney, 1996), individuals (DiTomaso, 2001), organizational subunits
(Meyer & Rowan, 1977; Weick, 1976; 1982), and organizations (Afuah, 2001; Brusoni, Prencipe
& Pavitt, 2001). In our framework, velocity coupling is the degree to which the velocities of
different dimensions in an organizational environment are causally connected – the degree to
which a change in the velocity of one dimension causes a change in the velocity of another.
Weick (1976) defined loosely coupled systems as those in which the properties of constitutive
elements are relatively independent, whereas the properties of elements in tightly coupled
systems are strongly mutually dependent. Weick (1982) further argued that loose coupling
involves causal effects that are relatively periodic, occasional and negligible, while tight
coupling involves relatively continuous, constant and significant causal effects. Thus, we
describe the velocities of different dimensions of a firm’s environment as loosely coupled when
changes in the velocity of one dimension (e.g., technology velocity) have relatively little,
immediate, direct impact on the velocities of other dimensions (e.g., product velocity), and as
tightly coupled when the relationship between the velocities of different dimensions involve
significant, immediate, direct causal effects. To determine the degree of coupling between
velocity dimensions, we suggest using structural equation modeling (Kline, 2004) which is
recommended for operationalizing covariance between construct variables (Law et al., 1998).
Although coupling and homology both describe the relationships among velocity
dimensions, they are separate, distinguishable aspects of those relationships. The velocities of
different dimensions can have high levels of interdependence (coupling), regardless of whether
22
they exhibit similar rates and directions of change (homology). Homology is a first order
property of velocity – it describes the similarity among velocities over a period of time. In
contrast, coupling is a second order property, describing the degree to which changes in the
velocity of a dimension affect the velocity of another dimension over the same specified period
of time. The distinction between homology and coupling is observable in the biotechnology
industry, which experiences high rates and discontinuous directions of technological change, but
relatively slow, continuous regulatory and product velocities (Zollo, Reuer & Singh, 2002).
While these dimensions have very different velocities (low homology), there is evidence to
suggest that they are relatively tightly coupled. This is illustrated by the impacts of the 2001 U.S.
regulation for stem cell research, which restricted research to 21 stem cell lines (a family of
constantly-dividing cells) and in turn limited the rate and direction of U.S. stem cell research
activity (i.e., technological velocity) relative to other countries. In 2009 this regulation was
overturned, permitting research on up to 1000 new stem cell lines, allowing “U.S. human
embryonic stem-cell research to thrive at last” (Hayden, 2009: 130).
Velocity coupling in the fashion apparel industry. We again draw on the fashion
apparel industry to illustrate the idea of coupling among velocity dimensions. Beginning with
products, changes in the velocity of this dimension have been attributed to increases in the
adoption of new communications, design and manufacturing technologies, suggesting a
relatively tight coupling between product and technological velocity dimensions. Perhaps most
significantly, changes in the direction of technology have improved the ability of fashion apparel
firms to gather market feedback and thus to develop new product offerings at a faster rate
(Jacobides & Billinger, 2006; Kraut, Steinfield, Chan, Butler & Hoag, 1999; Richardson 1996).
Similarly, the velocity of demand has been tightly coupled to product velocity over the past two
23
decades: industry observers argue that the perceived new arbitrariness of customer demand has
forced fashion organizations to frequently engage in large scale market explorations (Cammet,
2006; Jacobides & Billinger, 2006). In contrast, there is little evidence of a strong relationship
between product velocity and competitive velocity. Product velocity appears to be primarily
driven by changes in market demand and the product innovation programs of existing
organizations to exploit those changes, as opposed to a flow of new entrants (Cammet, 2006).
In terms of the velocity of regulation in this industry, there is evidence that it is tightly
coupled to the velocities of competition, demand and products, as changes in international trade
regulations (Spinanger, 1999) and domestic labor standards (Ng, 2007) have led to increasing
imports from developing economies, both creating and satisfying the demand for cheaper fashion
products. Similarly, the velocities of competition and demand appear to be tightly coupled, as
firms in this industry attempt to predict and adapt to what Sigglekow (2001) called “fit-
destroying changes” that can significantly alter their competitive positions. There is also tight
coupling between the velocity of technology and the velocity of demand. For example, in their
study of the U.S. fashion apparel industry in the 1980s, Abernathy, Dunlop, Hammond and Weil,
(1999) explain how changes in demand led to “lean retailing” which in turn required firms to
drastically alter their information and production technologies to enable new working practices.
In contrast, there is little evidence to suggest that changes in the velocity of technology for the
fashion industry will affect or are affected by changes in the velocities of competition or
regulation.
In this illustrative example (see Figure 1), we argue that seven of ten possible dyadic
connections among velocity dimensions are relatively tightly coupled (designated by solid lines),
such that changes in the velocity of one dimension will affect the velocity of another. We have
24
argued that the three other connections are loosely coupled, as indicated by dotted lines. Thus,
although not all of the velocity dimensions of the fashion industry exhibit strong causal
connections to each other, we suggest that this industry can be described as a relatively tightly
coupled environment. Any assignment of such a category is somewhat arbitrary without a formal
measurement of coupling, so for now we follow work on modular (loosely coupled) and
integrated (tightly coupled) organizational forms that suggests that when at least 50% of the
system elements are tightly coupled to each other, it can be considered tightly coupled (Schilling
& Steensma, 2001).
The Combination of Homology and Coupling: A Typology of Velocity Regimes
We propose the concept of a “velocity regime” as a way of describing the pattern of
velocity homology and velocity coupling within an organizational environment. Although both
these characteristics of velocity vary continuously, we focus on combinations of high or low
homology and tight or loose coupling to more clearly illustrate how they vary and the effects of
these variations. The result is a typology (see Figure 2) with four distinct velocity regimes that
represent ideal types rather than an exhaustive taxonomy of velocity conditions. To illustrate and
visualize the degrees of homology and coupling that characterize each regime, we have
embedded a variation of Figure 1 into each cell of Figure 2. Like Figure 1, these embedded
figures present illustrative sets of velocities, the relative positions of which indicate their rates
and directions of change for different dimensions.
Insert Figure 2 about here
The first velocity regime in our typology occurs when environmental dimensions are
highly homologous and loosely coupled to each other. We refer to this as the “simple velocity
regime” because it has similar rates and directions of change across all dimensions. Thus,
25
regardless of whether these dimensions are all changing slowly and continuously, or rapidly and
discontinuously, we argue that it is the relative uniformity of the change in strategic information
that makes the environment relatively analyzable (Daft & Weick, 1984). Furthermore, as the
velocities of the multiple dimensions are loosely coupled they are free to vary independently, so
that changes in the velocity of one dimension are unlikely to affect the velocities of other
dimensions.
An example of a simple velocity regime is the U.K. tableware industry from the mid
1950s to the late 1970s. During this period, this industry was exposed to changes in regulations,
demand, product, technology and competition, that were all relatively slow and continuous in
nature (Imrie, 1989; Rowley, 1992). At the same time this industry had relatively loose coupling
among velocity dimensions. For example, when change did occur in the velocity of the product
dimension during the 1970s, due to an increase in the rate at which product variety and
customization changed, the only other velocity dimension to be affected was technology,
whereby changes in the flexibility of production machinery altered at a similar rate (Caroll,
Cooke, Hassard & Marchington, 2002; Day, Burnett, Forrester & Hassard, 2000). This
combination of high homology and loosely coupled dimension velocities created an environment
that analysts and scholars described as being uniformly stable, consistent and regular in nature
(Imrie, 1989).
The second environmental velocity regime in our typology occurs when the velocities of
different dimensions are highly homologous and tightly coupled. This creates what we refer to as
an “integrated velocity regime”. This regime is integrated in two senses: the velocity attributes of
each dimension (i.e., rates and directions of change) are very similar, and the velocities of the
dimensions are highly interdependent on each other, for a period of time. The tight coupling
26
differentiates this regime from the simple regime, presenting managers with the complex task of
monitoring and responding to causally connected changes in a velocity. This is what Aldrich
(1979: 77) called the “everything’s related syndrome”, where a change in the velocity of one
dimension reverberates throughout the velocities of other dimensions. Together, these conditions
create an environment that is best understood as having, at least for a time, a single overarching
velocity. Moreover, if all the dimensions are changing rapidly and discontinuously this situation
would be exemplified by the “high velocity” industries that have dominated research on
environmental velocity.
Consequently, an example of an integrated velocity regime is the global computer
industry from approximately 1982 to 1995. During this period, which is known as the third era of
the industry – the invention of the microprocessor era (Malerba, Nelson, Orsenigo & Winter,
1999) – most of the environmental dimensions were changing rapidly and in a discontinuous
direction. Firms were frequently entering and exiting the industry, as well as forming and
breaking alliances with each other (Bresnahan & Malerba, 1999; Langlois, 1990). Technological
substitution in hardware and software was a frequent occurrence, resulting in regular product
innovations (Bourgeois & Eisenhardt, 1988; Brown & Eisenhardt, 1997). While Eisenhardt and
colleagues clearly argued that such conditions equated to multiple velocities undergoing similar
“rapid and discontinuous change”, we suggest there was also a significant level of
interdependence between the velocities of these dimensions. For example, studies have explained
how the velocity of competition affected the rate at which new technologies and products were
developed, which in turn affected the rate at which new market segments were created
(Bresnahan & Malerba, 1999; Langlois, 1990). This coupling among dimensions also brought
about the wholesale change in the velocities that occurred around 1995 as the industry began its
27
fourth era – the age of the network (Malerba et al., 1999).
The third velocity regime, which we refer to as the “divergent velocity regime”, has a set
of dissimilar and loosely coupled velocities, so firms face diverse and possibly contradictory
environmental conditions. This potentially makes the environment more difficult to analyze,
because some dimensions change slowly and continuously – generating modest amounts of
information – while other dimensions change rapidly and discontinuously – producing large
quantities of information that quickly becomes inaccurate or obsolete. This set of dissimilar
velocities presents diverse temporal demands on the information processing and sensemaking
abilities of managers. The relatively loose coupling among these dissimilar velocities, however,
lessens somewhat the challenge of monitoring and responding to environmental conditions
because changes in the velocities of different dimensions are relatively independent, limiting the
potential for rapid, widespread change in the flows of strategic information.
An example industry for this regime would be the U.S. flat glass manufacturing industry
from 1955 and to 1975. During this period, the environmental dimensions for this industry had
very different and unconnected velocities. The technology – float glass production methods –
that was developed to produce flat glass was adopted relatively quickly during this period
compared to other process technology innovations (Teece, 2000). It was also a discontinuous
change that revolutionized how flat glass was made, with productivity gains approaching 300 per
cent as the need for grinding the glass was eliminated (Anderson & Tushman, 1990). This led to
significant price/performance improvements where float glass product replaced existing flat glass
products in a relatively rapid and continuous fashion, rising from 30 million square feet per year
of glass in 1960 to 1,730 million square feet per year of glass in 1973 (Bethke, 1973). As this
change in demand was generated by existing producers for existing automotive and construction
28
customers, the pace and direction of competitive change remained relatively slow and continuous
in nature. The only significant regulatory event for this industry was that the U.S. Tariff
Commission and Treasury more frequently cited foreign producers for dumping flat glass on the
U.S. market at prices lower than those in their own markets (Bethke, 1973). This link between
the rate of government action and the increase in production capacity from the new technology
appears to be the only major interdependency between the different velocities of the dimensions
for this industry during this period.
The final velocity regime we propose is composed of dimensions whose velocities are
relatively dissimilar and tightly coupled. We refer to this as the “conflicted velocity regime”, as
organizations operating in such a regime will experience diverse and potentially contradictory
velocities that are also highly interdependent. As in the case of the divergent regime, the low
level of homology among velocity dimensions in the conflicted velocity regime leads to
conditions that are, as a whole, inconsistent and relatively unanalyzable. However, the tight
coupling among these heterogeneous velocities increases the difficulty associated with tracking,
understanding, and responding to changes in the conditions of this regime, because the causal
variation makes the environment relatively unstable over time. Although neglected in the
velocity literature, we believe that this kind of velocity regime may be quite common. Our
example of the fashion industry since the mid 1980s illustrates the dynamics associated with the
conflicted velocity regime. We have argued that the rates and direction of change in this industry
span a diverse range. We further argued that this industry’s environmental dimensions are
relatively tightly coupled. Such conditions define an environment with a set of dimensions that
are not only changing dissimilarly, but are also highly interdependent.
29
ORGANIZATIONAL AND STRATEGIC IMPLICATIONS
The importance of environmental velocity is due to the impacts it has on key
organizational and strategic processes. Thus, in this section, we examine how a multidimensional
conceptualization of environmental velocity would affect our understanding of these impacts.
We explore the implications of velocity homology and velocity coupling, both in terms of their
general impacts on organizing and on the processes of strategic decision making and new
product development.
Implications of Velocity Homology
We argue that the notion of velocity homology significantly affects how we need to think
about the relationship between an organization and the temporal characteristics of its
environment. The dominant notion that has emerged over the past two decades in the velocity
literature, and more broadly in research on time and organizations, has been the importance of
organizations operating “in time” with their environments and in synchrony across their sub-
units and activities. This is the view of research on organizational “entrainment” (Ancona &
Chong 1996; McGrath, Kelly & Machatka, 1984; Pérez-Nordtvedt, Payne, Short & Kedia, 2008)
which argues that “Functional groups not only must be [internally] entrained with each other for
the organization to work, there must also be external entrainment, at both the subsystem and
system levels, to ensure adaptation to the environment” (Ancona & Chong, 1996: 19). The
impact of external entrainment on performance is echoed in research on high velocity industries,
which argues that organizational performance in such environments is associated with rapid
decision making (Eisenhardt, 1989) and fast new product development (Eisenhardt & Tabrizi,
1995; Schoonhoven, Eisenhardt & Lyman, 1990). In their discussion of “timepacing”, Eisenhardt
and Brown (1998) provide examples of the importance of external entrainment, including the
30
household goods manufacturer that timed its product launch cycles to key retailers’ shelf
planning cycles and was thus able to win more shelf space.
Our multidimensional conceptualization of velocity suggests that temporal alignment
between an organization’s operations and its environment is critically important, but that
variations in homology create significant limits to the synchronization of activities within firms
(internal entrainment). If the velocities associated with different environmental dimensions are
similar, as in our high homology regimes (simple and integrated), then it is appropriate to entrain
the pace and direction of all organizational activities to this uniform environmental velocity. This
would be a relatively simple situation to manage. However, if the dimension velocities differ
significantly, as in our low homology regimes (conflicted and divergent), then the situation is
more difficult to manage. This is because the task of entraining organizational activities with
dissimilar dimension velocities will lead to heterogeneous sets of paces and directions of
activities within firms. Such differences create challenges for firms, including potential
incoherence among sub-units and activities, fragmented internal information flows, and the
breakdown of issue capture and analysis across intra-organizational boundaries. Furthermore,
managers who understand that changes in velocity homology conditions can be both endogenous
and exogenous in nature, will not only have the option of reactively entraining their
organizations to their environment, but also the option of trying to alter the speed and direction
of change in specific environmental dimensions to suit their organization. Firms might, for
example, lobby to influence the rate at and direction in which legislators develop laws and
regulations, (i.e. shape what is regulated/deregulated in an industry and the pace at which
regulatory reform occurs), or undertake marketing activities to influence changes in demand.
A central theme of research on environmental velocity has been its effect on strategic
31
decision making – those “infrequent decisions made by the top leaders of an organization that
critically affect organizational health and survival” (Eisenhardt & Zbaracki, 1992: 17).
Following our general argument regarding the impact of velocity homology, we argue that
variations in homology reward strategic decision making activities that are individually entrained
with the velocity of their relevant environmental dimension. Thus, more effective strategic
decision making in high homology regimes (simple and integrated) would involve a set of
activities with similar paces and directions. Such internal consistency provides benefits in terms
of greater efficiency and lowered task conflict (Gherardi & Strati, 1988). In contrast, strategic
decision making in low homology regimes (conflicted and divergent) will be more effective
when the pace and direction of strategic decision making activities are dissimilar, because they
are tailored to their relevant, but distinct dimension velocities.
A second key strategic process that illustrates the implications of velocity homology is
new product development – the set of activities that transforms ideas, needs and opportunities
into new marketable products (Cooper, 1990). Previous research has shown the value of rapid
new product development in high velocity industries (Eisenhardt & Tabrizi, 1995), but leaves
open the question of how this might change if we incorporated a multidimensional conception of
environmental velocity. Although new product development processes may seem to be primarily
linked to the product dimension of the organizational environment, they cut across a wide range
of organizational functions, including research, development, design, manufacturing, legal,
marketing and sales. Consequently, each of these different new product development activities
collects, interprets and applies relevant information from different dimensions of the
organization’s environment. Thus, the contribution of each function to new product development
is likely to be more effective when that function is entrained with the environmental dimension
32
for which it is more directly responsible. The ability of marketing, for instance, to effectively
contribute to the development of new products depends on it being entrained with the velocity of
demand. This means that different new product development functions may need to operate at
different speeds and in different directions in order to ensure process-environment entrainment.
Again, this can potentially create significant organizational challenges in terms of coordination
and integration across the stages of the new product development process.
Implications of Velocity Coupling
We argue that the notion of velocity coupling significantly affects how we think about the
stability of velocity conditions and the impacts on how organizations coordinate changes in the
pace and direction of their internal activities. Previous research has tended to treat environmental
velocity not only as a unidimensional concept, but also as a relatively stable feature of
organizational environments. In contrast, we argue that variations in velocity coupling will lead
to important differences in the stability of the velocity conditions of environments. For firms
operating in tightly coupled environments, a change in the velocity of any one dimension (e.g.,
technology) will have a broad impact on the velocity conditions of the regime, through its effects
on the velocities of the other dimensions to which it is coupled (e.g., products, demand,
competition). This suggests that regimes with tight velocity coupling (integrated and conflicted)
will have relatively unstable velocity conditions. This argument follows research on coupling in
both organizational environments and in organizations that has shown that tight coupling among
elements of a system increases the instability of that system (Aldrich, 1979; Dess & Beard, 1984;
Terreberry 1968). An important facet of this instability is the rhythms through which it occurs.
The impacts of changes in the velocity of one dimension on the velocities of other dimensions
are unlikely to occur instantaneously but over time, as the social and technological mechanisms
33
that connect the dimensions are sequentially triggered and exert their impact.
We argue that the environmental instability and sequencing of changes associated with
tight coupling provide an advantage to certain firms over others. In particular, tightly coupled
regimes (integrated and conflicted) would reward firms that employ mechanisms that sensitize
them to velocity changes and allow them to rapidly and effectively shift the paces of their
internal operations. Typical mechanisms could include strategic scanning systems that managers
use to monitor and respond to changes in their environments (Aguilar, 1967; Daft & Weick,
1984), and the use of “interactive control systems” (Simons 1994) to promote external reflection
and internal communication and action. These mechanisms are analogous to other traditional
organizational integration (Lawrence & Lorsch, 1967) and boundary-spanning mechanisms
(Galbraith, 1973), but with a focus on coordinating change in the pace and direction of
organizational activities to match temporal instability in the environment. Moreover, sequenced
changes in velocities provide an advantage to firms that recognize these causal connections and
are consequently able to anticipate sequences of velocity changes. For example, increases in
human genetic engineering technology in the late 1990s led geneticists and government agencies
to call for more regulation to control the development and application of this technology. Those
firms that anticipated the connection between technological velocity and regulatory velocity
proactively planned and shifted the velocities of their research advocacy units to better link with
the activities of patient advocacy groups. These changes helped the industry to garner the public
support necessary to overturn regulations (Campbell, 2009). Achieving this sequenced change in
the pace and direction of organizational activities would involve the use of time-based
mechanisms. These include scheduling and project deadlines, information technologies that align
organizational activities, and resource allocation rules that specify the time to be spent on
34
decision tasks (McGrath, 1991).
Like velocity homology, changes in velocity coupling may stem from external
conditions, or it may be that managers are able to increase or decrease the causal connections
among velocity dimensions in order to create strategic advantage for their firms. One strategy to
affect velocity coupling is to alter the degree of modularity in products (Baldwin & Clark, 1997;
Sanchez & Mahoney, 1996), technologies (Yayavaram & Ahuja, 2008), organizations, (Meyer &
Rowan, 1977; Weick, 1976; 1982), or inter-organizational networks and supply chains (Afuah,
2001; Brusoni et al., 2001). Such changes can affect the overall coupling among environmental
dimensions, particularly if they establish new competitive standards. Furthermore, such changes
can be hard to attain and therefore difficult to imitate, thus creating a competitive advantage.
Shimano, for example, became the dominant supplier of bicycle drive train components (shifters,
chains, derailleurs, etc.) by developing high performing, tightly coupled component systems that
changed the nature of the new product development and production functions for their
customers, as well as the nature of end-user demand. Shimano’s strategy altered the pace and
direction of multiple velocity dimensions for the bicycle industry and has been credited with
helping Shimano to gain almost 90% of the drive train market for mountain bicycles (Fixson &
Park, 2008).
The effects of velocity coupling on how organizations coordinate their activities can also
be illustrated by considering strategic decision making and new product development processes.
For strategic decision making, coordination is an issue of social cognition within top
management teams (Forbes & Milliken, 1999), which we argue is significantly affected by the
“temporal orientation” of team. A temporal orientation is a cognitive concept that describes how
individuals and teams conceive of time: as “monochronic”, a unified phenomenon that motivates
35
attention to individual events in serial fashion; or “polychronic”, a heterogeneous phenomenon
that necessitates simultaneous attention to multiple events (Ancona, Okhuysen & Perlow, 2001;
Bluedorn & Denhardt 1988; Hall, 1959). We argue that strategic decision making in tightly
coupled regimes would benefit from a polychronic orientation on the part of top management
teams, so that the team members share a view of time as malleable and unstructured. This would
help them to simultaneously coordinate strategic decision making velocities, and pay continuous
partial attention to a broad set of issues (Stone 2007). In contrast, in loosely coupled regimes the
benefits of multitasking, monitoring and simultaneously adjusting to the velocities of different
dimensions are lower. Such situations, we argue, reward a monochronic temporal orientation that
leads senior management teams to engage in strategic decision making in a relatively
independent manner, focusing on one issue at a time.
For new product development processes, the impact of velocity coupling rests on the
ability of firms to recognize and predict the conditions under which a new product will be
launched. The instability associated with tightly coupled regimes (integrated and conflicted)
influences the effectiveness of different process control frameworks that help ensure that the
right type of product innovation is launched at the right time (McCarthy, Tsinopoulos, Allen &
Rose-Anderssen, 2006). “Linear” new product development frameworks conceive of the process
as a series of relatively discrete, sequential stages, with team members at each stage making
decisions (go forward, kill the project, put the project on hold, etc.) about the progress and
outputs of the process (McCarthy et al., 2006). These frameworks include the waterfall model
(Royce, 1970) and the stage-gate method (Cooper, 1990), which assume and impose structures or
“scaffolds” that restrict the amount of iterative feedback. We argue that such linear frameworks
are best suited to new product development processes that operate in loosely coupled velocity
36
regimes in which the activities within the new product development process are relatively
discrete, with changes in their paces and directions having limited impacts on each other. In
contrast, “recursive” new product development frameworks conceive of the process as a system
of interconnected, overlapping activities that generate iterative and non-linear behaviors over
time (McCarthy et al., 2006). These include Kline and Rosenberg’s (1986) chain-linked model
and Eisenhardt and Tabrizi’s (1995) experiential model both of which, we argue, are suited to
tightly coupled velocity regimes because they facilitate improvisation and flexibility. These
capabilities help managers of the process to focus on and accommodate both the greater
instability and more turbulent information flows associated with these velocity regimes.
CONCLUSION
In the paper’s introduction, we suggested that a multidimensional conceptualization of
environmental velocity presented three important opportunities to advance research in the area.
First, we argued that it would allow a more fine-grained examination of environmental velocity
so as to better understand the diversity of this construct across different organizational contexts.
In our discussions of several industries, including fashion, tableware, computers and flat glass,
we have shown that characterizing these environments simply as high or low velocity overlooks
that environmental velocity is composed of multiple dimensions each with a distinct velocity.
Second, we argued that a multidimensional approach to velocity could lead to more
reliable and thus more valid empirical research by offering a basis for more consistent
operationalizations of velocity. Consequently, with our framework we urge researchers to
consider both the rate and direction of change for multiple pertinent dimensions of the
organizational environment. This reveals homology and coupling relationships among the
velocity dimensions, which describe the different velocity regimes we propose. These concepts
37
provide a basis to better specify environmental velocity and use appropriate operationalizations
to measure its diversity. This in turn helps avoid inappropriate aggregations and inconsistent uses
of the velocity construct.
Third, we suggested that a multidimensional conceptualization of environmental velocity
and the conditions of our proposed velocity regimes could provide insights into organizational
and strategic processes beyond what was possible with a unidimensional concept. To this end,
we have explored some general implications for organizations that follow from velocity
homology and velocity coupling, and more specific implications for two key processes –
strategic decision making and new product development. We explain how variations in velocity
homology influence the degree to which a firm’s activities or sub-units will be synchronized
(internal entrainment) as they seek to operate in time with their respective dimensions of the
environment (external entrainment). We also describe how variations in velocity coupling affect
the need for organizations to recognize the stability of their velocity regime and anticipate
sequences of changes in the velocities of their environmental dimensions.
In summary, the challenges of high-velocity environments have captured the attention of
managers and scholars. However, the multidimensional nature of the velocity construct and its
effects have not been explored. Our work builds on contingency approaches to organization-
environment relations and work on time and organizations. To these traditions it offers a more
nuanced understanding of one aspect of change in organizational environments; and urges
researchers to examine both the complexity and diversity of the construct and its effects on
organizations.
38
REFERENCES
Abernathy, W. J., & Clark, K. B. 1985. Innovation: Mapping the winds of creative destruction.
Research Policy, 14(1): 3-22.
Abernathy, H. F., Dunlop, J. T., Hammond, J. H., & Weil, D. 1999. A stitch in time: Lean
retailing and the transformation of manufacturing -- lessons from the apparel and textile
industries. New York: Oxford University Press.
Adner, R., & Levinthal, D. 2001. Demand heterogeneity and technology evolution: Implications
for product process innovations. Management Science, 47(5): 611-628.
Afuah, A. 2001. Dynamic boundaries of the firm: Are firms better off being vertically integrated
in the face of a technological change? Academy of Management Journal, 44(6): 1211-1228.
Aguilar, F. J. 1967. Scanning the business environment. New York: McMillan.
Aldrich, H. E. 1979. Organizations and environments. Englewood Cliffs, NJ: Prentice-Hall.
Ancona, D. G., & Chong, C. L. 1996. Entrainment: Pace, cycle, and rhythm in organizational
behavior. Research in Organizational Behavior, 18: 251-284.
Ancona, D. G., Okhuysen, G. A., & Perlow, L. A. 2001. Taking time to integrate temporal
research. Academy of Management Review, 26(4): 512–529.
Anderson, P., & Tushman, M. L. 1990. Technological discontinuities and dominant designs: A
cyclical model of technological change. Administrative Science Quarterly, 35(4): 604-633.
Archibugi, D., & Pianta, M. 1996. Measuring technological change through patents and
innovation surveys. Technovation, 16(9): 451-468.
39
Audet, D. & Safadi, R. 2004. A new world map in textiles and clothing: Adjusting to change.
Paris: OECD.
Baldwin, C., & Clark, K. 1997. Managing in an age of modularity. Harvard Business Review,
75(5): 84-93.
Barney, J. B. 1986. Types of competition and the theory of strategy: Toward an integrative
framework. Academy of Management Review, 11(4): 791-800.
Baum, J., & Wally, S. 2003. Strategic decision speed and firm performance. Strategic
Management Journal, 24(11): 1107-1129.
Bethke, W. M. 1973. The outlook for the flat glass industry. Financial Analysts Journal, 29(1):
41-92.
Blalock, H. M., Jr. 1982. Conceptualization and measurement in the social sciences. Beverly
Hills, CA: Sage Publications.
Bliese, P. D., Chan, D., & Ployhart, R. E. 2007. Multilevel methods: Future directions in
measurement, longitudinal analyses, and nonnormal outcomes. Organizational Research
Methods, 10(4): 551-563.
Bluedorn, A. C., & Denhardt, R. B. 1988. Time and organizations. Journal of Management. 14:
299-320.
Bogner, W. C., & Barr, P. S. 2000. Making sense in hypercompetitive environments: A cognitive
explanation for the persistence of high velocity competition. Organization Science, 11(2):
212–226.
40
Bourgeois III, L. J., & Eisenhardt, K. M. 1988. Strategic decision processes in high velocity
environments: Four cases in the microcomputer industry. Management Science, 34(7): 816-
835.
Bowman, D. & Gatignon, H. 1995. Determinants of competitor response time to a new product
introduction. Journal of Marketing Research, 32(1): 42-53.
Brauer, M., & Schmidt, S. M. 2006. Exploring strategy implementation consistency over time:
The moderating effects of industry velocity and firm performance. Journal of Management
and Governance, 10(2): 205-226.
Bresnahan, T., & Malerba, F. 1999. Industrial dynamics and the evolution of firms' and nations'
competitive capabilities in the world computer industry. In D. Mowery, & R. Nelson (Eds.),
The Sources of industrial leadership: Studies of seven industries, Cambridge: Cambridge
University Press.
Brown, S. L., & Eisenhardt, K. M. 1997. The art of continuous change: Linking complexity
theory and time-paced evolution in relentlessly shifting organizations. Administrative
Science Quarterly, 42(1): 1-34.
Brusoni, S., Prencipe, A., & Pavitt, K. 2001. Knowledge specialization, organizational coupling,
and the boundaries of the firm: Why do firms know more than they make? Administrative
Science Quarterly, 46 (4): 597-621.
Cammet, M. 2006. Development and the changing dynamics of global production: Global value
chains and local clusters in apparel manufacturing. Competition and Change, 10(1): 23-48.
Campbell P. 2009. By common consent. Nature, 458(125): 125
41
Carroll, M., Cooke, F. L., Hassard, J., & Marchington, M. 2002. The strategic management of
outsourcing in the UK tableware industry. Competition and Change, 6(4): 327-343.
Castrogiovanni, G. J. 1991. Environmental munificence: A theoretical assessment. Academy of
Management Review, 16(3): 542-565.
Chen, G., Bliese, P. D., & Mathieu, J. E. 2005. Conceptual framework and statistical procedures
for delineating and testing multilevel theories of homology. Organizational Research
Methods, 8(4): 375-409.
Cooper, R. G. 1990. Winning at new products. Reading, MA: Addison-Wesley.
Cox, T. F., & Cox, M. A. A. 2001. Multidimensional scaling. Monographs on statistics and
applied probability, Vol. 88. Great Britain: Chapman & Hall.
Daft, R. L., & Weick, K. E. 1984. Toward a model of organizations as interpretation systems.
Academy of Management Review, 9(2): 284-295.
Danneels, E. 2003. Tight-loose coupling with customers: The enactment of customer orientation.
Strategic Management Journal, 24(6): 559-577.
D’Aveni, R. A. 1994. Hypercompetition: Managing the dynamics of strategic maneuvering.
New York: Free Press.
Davis, J. P., Eisenhardt, K. M., & Bingham, C. B. 2009. Optimal structure, market dynamism,
and the strategy of simple rules. Administrative Science Quarterly, 54: 413-452.
Davis, C., & Shirato, Y. 2007. Firms, governments and WTO adjudication: Japan’s selection of
WTO disputes. World Politics, 59(January): 274-313.
42
Day, M., Burnett, J., Forrester, P. L., & Hassard, J. 2000. Britain's last industrial district? A case
study of ceramics production. International Journal of Production Economics, 65(1): 5-15.
Dess, G. G., & Beard, D. W. 1984. Dimensions of organizational task environments.
Administrative Science Quarterly, 29(1): 52-73.
Dess, G. G., & Rasheed, A. M. A. 1991. Conceptualizing and measuring organizational
environments: A critique and suggestions. Journal of Management, 17(4): 701-710.
DiTomaso, N. 2001. The loose coupling of jobs: The subcontracting of everyone? In I. Berg, &
A. L. Kalleberg, (Eds.), Sourcebook of labor markets: Evolving structures and processes:
247-270. New York: Kluwer Academic/Plenum.
Djelic, M. L., & Ainamo, A. 1999. The coevolution of new organizational forms in the fashion
industry: A historical and comparative study of France, Italy, and the United States.
Organization Science, 10(5): 622-637.
Doeringer, P., & Crean, S. 2006. Can fast fashion save the US apparel industry? Socio-
Economic Review, 4(3): 353-377.
Dosi, G. 1982. Technological paradigms and technological trajectories. Research Policy, 11(3):
147-62.
Dosi, G., Freeman, C., & Fabiani, S. 1994. The process of economic development: Introducing
some stylized facts and theories on technologies, firms and institutions. Industrial and
Corporate Change, 3(1): 1-45.
Downey, H. K., Hellriegel, D., & Slocum, J. W. 1975. Environmental uncertainty: The construct
and its application. Administrative Science Quarterly, 20(4): 613-629.
Economist. 2005. The future of fast fashion. Economist, 375(8431): 57-58.
43
Edwards, J. R. 1994. Regression analysis as an alternative to different scores. Journal of
Management, 20(3): 683-690.
Eisenhardt, K. M. 1989. Making fast strategic decisions in high-velocity environments. Academy
of Management Journal, 32(3): 543-576.
Eisenhardt, K. M., & Bourgeois III, L. J. 1988. Politics of decision making in high velocity
environments: Towards a midrange theory. Academy of Management Journal, 31(4): 737-
770.
Eisenhardt, K. M., & Brown, S. L. 1998. Time pacing: Competing in markets that won't stand
still. Harvard Business Review, 76(2): 59-69.
Eisenhardt, K. M., & Tabrizi, B. N. 1995. Accelerating adaptive processes: Product innovation in
the global computer industry. Administrative Science Quarterly, 40(1): 84-110.
Eisenhardt, K. M., & Zbaracki, M. J. 1992. Strategic decision making. Strategic Management
Journal, 13(Winter Special Issue): 17-37.
Emery, F. E., & Trist, E. L. 1965. The causal texture of organizational environments. Human
Relations, 18(1): 21-32.
Fine, C. 1998. Clockspeed: Winning industry control in the age of temporary advantage.
Reading, MA: Perseus Books.
Fixson, S. K., & Park, J. K. 2008. The power of integrality: Linkages between product
architecture, innovation, and industry structure. Research Policy, 37(8): 1296-1316.
Forbes, D. P., & Milliken, F. J. 1999. Cognition and corporate governance: Understanding
boards of directors as strategic decision-making groups. Academy of Management Review,
24(3): 489-505.
44
Forza, C., & Vinelli, A. 1997. Quick response in the textile-apparel industry and the support of
information technologies. Integrated Manufacturing Systems, 8(3): 125-136.
Galbraith, J.R. 1973. Designing complex organizations. Reading, MA: Addison-Wesley.
Gherardi, S., & Strati, A. 1988. The temporal dimension of organizational studies. Organization
Studies. 9(2): 149–164.
Glick, W. H. 1985 .Conceptualizing and measuring organizational and psychological climate:
Pitfalls in multilevel research. Academy of Management Review, 10(3): 601-616.
Griliches, Z. 1990. Patent statistics as economic indicators: A survey. Journal of Economic
Literature, 28(4): 1661-1797.
Hall, M. 1959. The theory of groups. New York: Macmillan.
Hanlon, G. 2004. Institutional forms and organizational structures: Homology, trust and
reputational capital in professional service firms. Organization, 11(2): 187-210.
Hannan, M.T., & Carroll, G. 1992. Dynamics of organizational populations. New York: Oxford
University Press.
Hannan, M. T., Carroll, G. R., Dundon, E. A., & Torres, J. C. 1995. Organizational evolution in
a multinational context: Entries of automobile manufacturers in Belgium, Britain, France,
Germany, and Italy. American Sociological Review, 60(4): 509-528.
Hayden, E.C. 2009. Obama overturns stem-cell ban: President’s executive order will allow US
human embryonic stem-cell research to thrive at last. Nature, 458(12 March): 130-131.
45
Harrington, R. 2001. Environmental uncertainty within the hospitality industry: Exploring the
measure of dynamism and complexity between restaurant segments. Journal of Hospitality
& Tourism Research, 25(4) 386-398.
Harrison, D.A., & Klein, K. J. 2007. What’s the difference? Diversity constructs as separation,
variety, or disparity in organizations. Academy of Management Review, 32(4): 1199–1228.
Hatten K. J., & Hatten M. L. 1987. Strategic groups, asymmetrical mobility barriers and
contestability. Strategic Management Journal, 8(4): 329-342.
Henderson, A. D. 1999. Firm strategy and age dependence: A contingent view of the liabilities of
newness, adolescence, and obsolescence. Administrative Science Quarterly, 44(2): 281-284.
Henderson, R. M., & Clark, K. B.1990. Architectural innovation: The reconfiguration of existing
product technologies and the failure of established firms. Administrative Science Quarterly,
35(1): 9-30.
IFI. 2008. IFI patent intelligence announces 2007’s top U.S. patent assignees.
http://www.ificlaims.com/IFI%20Patent%20Release%201-9-08.htm, January 2008.
Imrie, R F. 1989. Industrial restructuring, labour, and locality: The case of the British pottery
industry. Environment and Planning A, 21: 3-26.
Jacobides, M. G. 2005. Industry change through vertical disintegration: How and why markets
emerged in mortgage banking. Academy of Management Journal, 48(3): 465-498.
Jacobides, M. G., & Billinger, S. 2006. Designing the boundaries of the firm: From "Make, Buy,
or Ally" to the dynamic benefits of vertical architecture. Organization Science, 17(2): 249-
261.
46
Jacobides, M. G., & Winter, S. G. 2005. The co-evolution of capabilities and transaction costs:
Explaining the institutional structure of production. Strategic Management Journal, 26(5):
395-413.
Judge, W. Q., & Miller, A. 1991. Antecedents and outcomes of decision speed in different
environmental contexts. Academy of Management Journal, 34(2): 449-463.
Keats, B., & Hitt, M. 1988. A causal model of linkages among environmental dimensions,
macro-organizational characteristics, and performance. Academy of Management Journal,
31(3): 570-598.
Ketchen, D. J., & Shook, C. L. 1996. The application of cluster analysis in strategic management
research: An analysis and critique. Strategic Management Journal, 17(6): 441-458.
Kline, R. B. 2004. Principles and practice of structural equation modeling. New York, NY:
The Guilford Press.
Kline, J., & Rosenberg, N. 1986. An Overview of Innovation. In R. Landau & N. Rosenberg
(Eds.), The positive sum strategy: Harnessing technology for economic growth: 275-305
Washington, DC: National Academy Press.
Kotler, P. 1984. Marketing management: Analysis, planning, and control. Englewood Cliffs,
NJ: Prentice-Hall.
Kraut, R., Steinfield, C., Chan, A. P., Butler, B., & Hoag, A. 1999. Coordination and
virtualization: The role of electronic networks and personal relationships. Organization
Science, 10(6): 722-740.
Langlois, R. N. 1990. Creating external capabilities: Innovation and vertical disintegration in the
microcomputer industry. Business and Economic History, (19)1: 93-102.
47
Law, K. S., Wong, C-S., & Mobley, W. 1998. Towards a taxonomy of multidimensional
constructs. Academy of Management Review, 23(4): 741-755.
Lawrence, P. R., & Lorsch, J. W. 1967. Organization and environment: Managing
differentiation and integration. Boston, MA: Harvard University Press.
Lowe E. D., & Lowe, J. W. G. 1990. Velocity of the fashion process in women's formal evening
dress, 1789-1980. Clothing and Textiles Research Journal, 9(1): 1-50.
Malerba, F., Nelson, R., Orsenigo, L., & Winter, S. 1999. History-friendly models of industry
evolution: the computer industry. Industrial and Corporate Change, 8(1): 3-40.
McCann, J. E., & Selsky, J. 1984. Hyperturbulence and the emergence of type 5 environments.
Academy of Management Review, 9(3): 460-470.
McCarthy, I. P., Tsinopoulos, C., Allen, P. M., & Rose-Anderssen, C. 2006. New product
development as a complex adaptive system of decisions. Journal of Product Innovation
Management, 23(5): 437-456.
McGrath, J. E. 1991. Time, interaction, and performance (TIP): A theory of groups. Small
Group Research, 22(2): 147-174.
McGrath, J. E., Kelly, J. R., & Machatka, D. E. 1984. The social psychology of time:
Entrainment of behavior in social and organizational settings. In S. Oskamp (Ed.), Applied
Social Psychology Annual, 5: 21-44. Beverly Hills, CA: Sage.
Meyer, J.W., & Rowan, B. 1977. Institutionalized organizations: Formal structure as myth and
ceremony. American Journal of Sociology, 83(2): 340-363.
Milliken, F. J. 1987. Three types of perceived uncertainty about the environment: State, effect,
and response uncertainty. Academy of Management Review, 12(1): 133-143.
48
Nadkarni, S., & Barr, P. S. 2008. Environmental context, managerial cognition, and strategic
action: An integrated view. Strategic Management Journal, 29(13): 1395-1427.
Nadkarni, S., & Narayanan, V. K. 2007a. The evolution of collective strategy frames in high-
and low-velocity industries. Organization Science, 18(4): 688-710.
Nadkarni, S., & Narayanan, V. K. 2007b. Strategic schemas, strategic flexibility, and firm
performance: The moderating role of industry clockspeed. Strategic Management Journal,
28(3): 243-270.
Ng, R. 2007. Garment production in Canada: Social and political implications. Studies in
Political Economy, 79: 193-211.
Nueno, J. L., & Quelch, J. A. 1998. The mass marketing of luxury. Business Horizons, 46(6):
61-68.
Oliver, D., & Roos, J. 2005. Decision making in high-velocity environments: The importance of
guiding principles. Organization Studies, 26(6): 889-913.
Orton, J. D., & Weick, K. E. 1990. Loosely coupled systems: A reconceptualization. Academy of
Management Review, 15(2): 203-223.
Owen, R. 1843. Lectures on the comparative anatomy and physiology of the invertebrate
animals. Delivered at the Royal College of Surgeons, London: Longman, Brown, Green &
Longmans.
Pérez-Nordtvedt, L., Payne, G. T., Short, J. C., & Kedia, B. L. 2008. An entrainment-based
model of temporal organizational fit, misfit, and performance. Organization Science, 19(5):
785-801.
49
Pietroski, P. & Rey, G. 1995. When other things aren't equal: Saving ceteris paribus laws from
vacuity. The British Journal for the Philosophy of Science, 46(1): 81-110.
Porter, M.E. 1980. Competitive strategy: Techniques for analyzing industries and competitors.
New York: Free Press.
Ranger-Moore, J. 1997. Bigger may be better, but is older wiser? Organizational age and size in
the New York life insurance industry. American Sociological Review, 62(6): 903-920.
Richardson, G.B. 1996. The organization of industry. In P. J. Buckley & J. Michie (Eds.), Firms,
organizations and contracts: A reader in industrial organization: 59-75. New York:
Oxford University Press.
Rowley, C. 1992 The illusion of flexible specialization: the case of the domestic ware sector of
the British ceramics industry. New Technology, Work and Employment, 9(2): 127-129.
Royce, W. 1970. Managing the development of large software systems. Proceedings of IEEE,
WESCON, 26 (August): 1-9.
Sanchez, R., & Mahoney, J. T. 1996. Modularity, flexibility, and knowledge management in
product and organization design. Strategic Management Journal, 17(Winter): 63–76.
Schilling, M. A., & Steensma, K. H. 2001. The use of modular organizational forms: An
industry-level analysis. The Academy of Management Journal, 44(6):1149-1168.
Schoonhoven, C. B., Eisenhardt, K. M., & Lyman, K. 1990. Speeding products to market:
Waiting time to first product introduction in new firms. Administrative Science Quarterly,
35(1): 177-207.
Schumpeter, J. A. 1950. Capitalism, socialism and democracy. New York: Harper Brothers.
50
Scott, W. R. 1981. Organizations: Rational, natural, and open systems. Englewood Cliffs, NJ:
Prentice-Hall.
Segars, A. H., & Grover, V. 1993. Re-examining perceived ease of use and usefulness: A
confirmatory factor analysis. MIS Quarterly, 17(4): 517-525.
Siggelkow, N. 2001. Change in the presence of fit: The rise, the fall, and the renaissance of Liz
Claiborne. Academy of Management Journal, 44(4): 838-857.
Simons, R. 1994. How new top managers use control systems as levers of strategic renewal.
Strategic Management Journal, 15(3): 169-189.
Singer, J. D., & Willett, J. B. 2003. Applied longitudinal data analysis: Modeling change and
event occurrence. New York: Oxford University Press.
Smith, K. G., Smith, K. K, Olian, J. D, Sims, H. P., Jr., O'Bannon, D. P., & Scully, J. A. 1994.
Top management team demography and process: The role of social integration and
communication. Administrative Science Quarterly, 39(3): 412-438.
Spinanger, D. 1999. Textiles beyond the MFA phase-out. The World Economy, 22(4): 455-476.
Stepanovich, P. L., & Uhrig, J. D. 1999. Decision making in high-velocity environments:
Implications for healthcare. Journal of Healthcare Management, 44(3):197-205.
Stone, L. 2007. Living with continuous partial attention. Harvard Business Review, 85(2): 28.
Taplin, I. M., & Winterton, J. 1995. New clothes from old techniques: Restructuring and
flexibility in the US and UK clothing industries. Industrial and Corporate Change, 4(1):
615-638.
51
Teece, D. J. 2000. Managing intellectual capital: Organizational, strategic, and policy
dimensions. New York: Oxford University Press.
Terreberry, S. 1968. The evolution of organizational environments. Administrative Science
Quarterly, 12(4): 590-613.
Tuma, N. B., & Hannan, M. T. 1984. Social dynamics. New York: Academic Press.
Tushman, M. L., & Anderson, P. 1986. Technological discontinuities and organizational
environments. Administrative Science Quarterly, 31(3): 439–465.
Vietor, R. H. K. 1990. Contrived competition: Airline regulation and deregulation, 1925-1988.
Business History Review, 64(1): 61-108.
Weick, K. E. 1976. Educational organizations as loosely coupled systems. Administrative
Science Quarterly, 21(1): 1-19.
Weick, K. E. 1982. Management of organizational change among loosely coupled elements. In
P. S. Goodman (Ed.), Change in organizations: 375-408. San Francisco: Jossey-Bass.
Wholey, D. R., & Brittain, J. 1989. Characterizing environmental variation. Academy of
Management Journal, 32(4): 867-882.
Yayavaram, S., & Ahuja, G. 2008. Decomposability in knowledge structures and its impact on
the usefulness of inventions and knowledge-base malleability. Administrative Science
Quarterly, 53(2): 333–362.
Zollo, M., Reuer, J. J., & Singh, H. 2002. Interorganizational routines and performance in
strategic alliances. Organization Science, 13(6): 701-713.
52
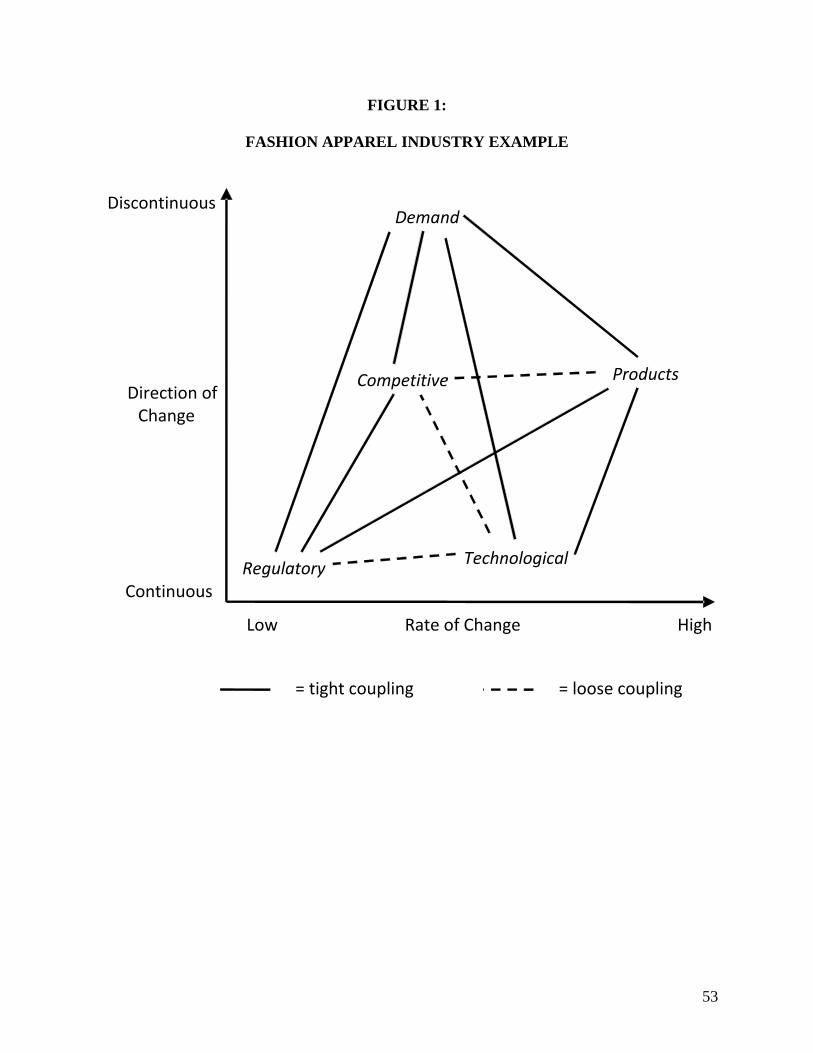
FIGURE 1:
FASHION APPAREL INDUSTRY EXAMPLE
Rate of Change
Direction of Change
Products
TechnologicalRegulatory
Demand
Competitive
Low High
Continuous
Discontinuous
= loose coupling= tight coupling
53
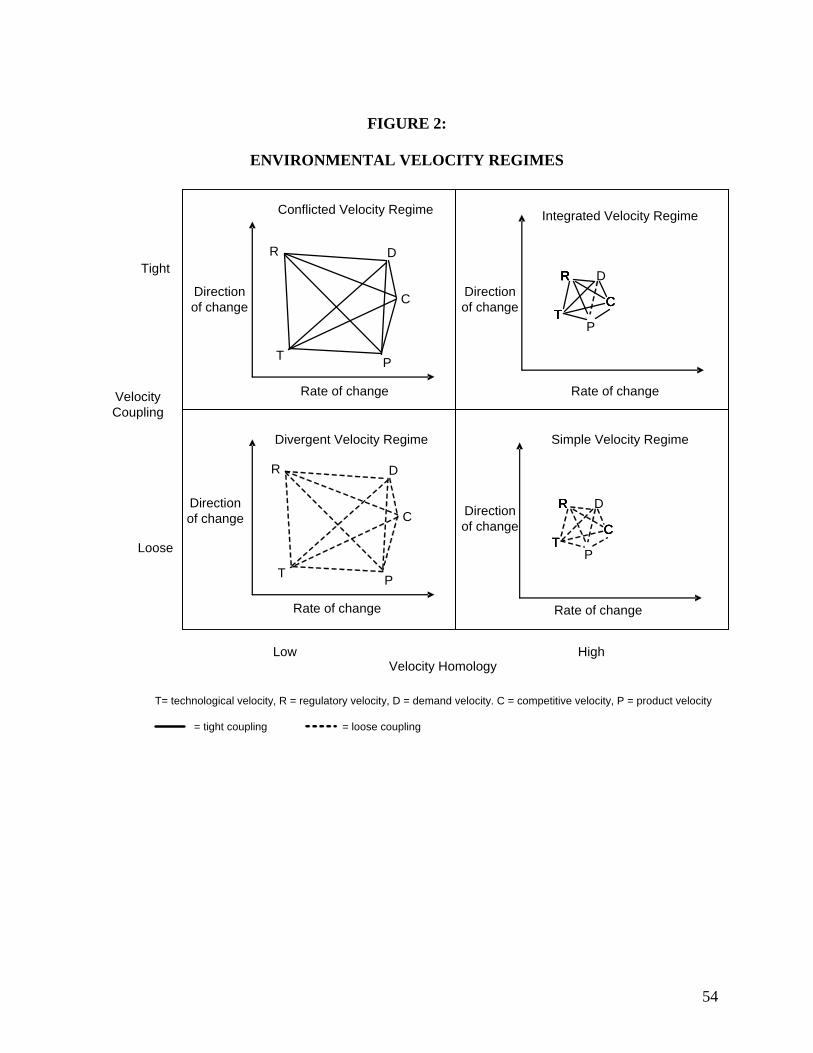
FIGURE 2:
ENVIRONMENTAL VELOCITY REGIMES
Velocity Homology
Tight
Loose
HighLow
Velocity Coupling
Direction of change
Rate of change
T= technological velocity, R = regulatory velocity, D = demand velocity. C = competitive velocity, P = product velocity
= tight coupling = loose coupling
Conflicted Velocity Regime Integrated Velocity Regime
Direction of change
Direction of change
Rate of change
Rate of change
P
D
Divergent Velocity Regime
C
T
R
Simple Velocity Regime
C
PT
R D
CT
R
CT
R
CT
RDirection of change
Rate of change
C
PT
R D
CT
R
CT
R
CT
R
P
D
C
T
R
54
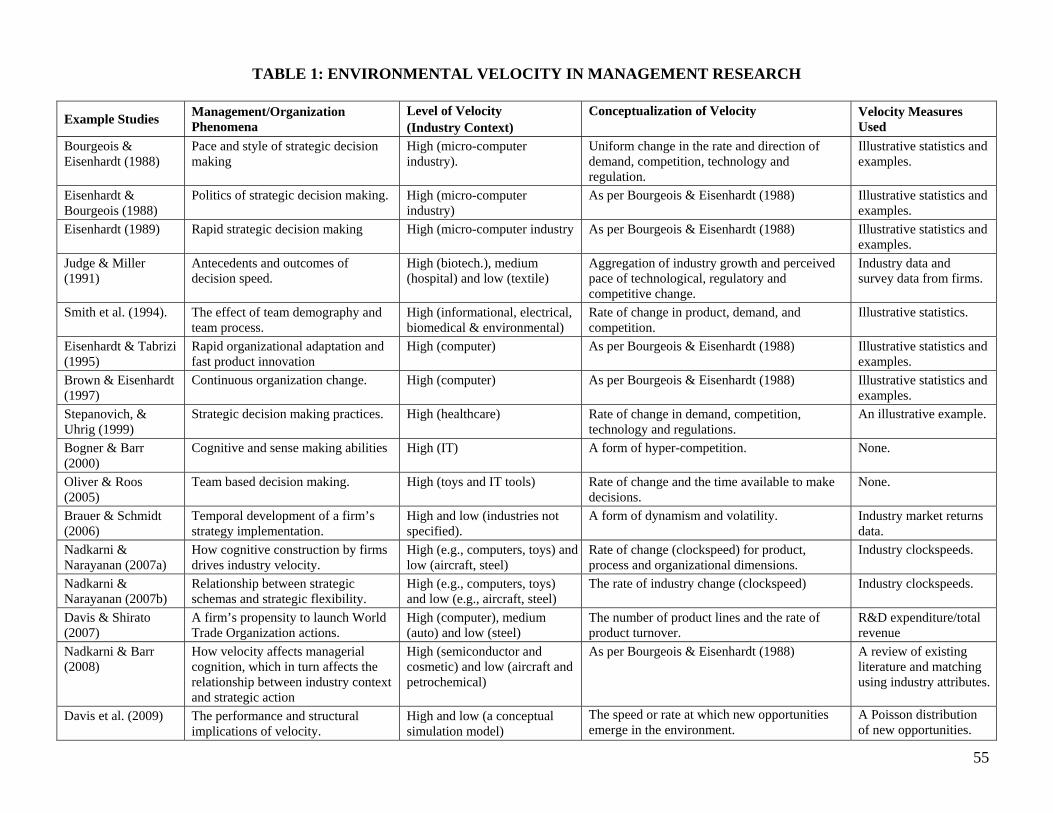
TABLE 1: ENVIRONMENTAL VELOCITY IN MANAGEMENT RESEARCH
Example Studies Management/Organization Phenomena
Level of Velocity (Industry Context)
Conceptualization of Velocity
Velocity Measures Used
Bourgeois & Eisenhardt (1988)
Pace and style of strategic decision making
High (micro-computer industry).
Uniform change in the rate and direction of demand, competition, technology and regulation.
Illustrative statistics and examples.
Eisenhardt & Bourgeois (1988)
Politics of strategic decision making. High (micro-computer industry)
As per Bourgeois & Eisenhardt (1988) Illustrative statistics and examples.
Eisenhardt (1989) Rapid strategic decision making High (micro-computer industry As per Bourgeois & Eisenhardt (1988) Illustrative statistics and examples.
Judge & Miller (1991)
Antecedents and outcomes of decision speed.
High (biotech.), medium (hospital) and low (textile)
Aggregation of industry growth and perceived pace of technological, regulatory and competitive change.
Industry data and survey data from firms.
Smith et al. (1994). The effect of team demography and team process.
High (informational, electrical, biomedical & environmental)
Rate of change in product, demand, and competition.
Illustrative statistics.
Eisenhardt & Tabrizi (1995)
Rapid organizational adaptation and fast product innovation
High (computer) As per Bourgeois & Eisenhardt (1988) Illustrative statistics and examples.
Brown & Eisenhardt (1997)
Continuous organization change. High (computer) As per Bourgeois & Eisenhardt (1988) Illustrative statistics and examples.
Stepanovich, & Uhrig (1999)
Strategic decision making practices. High (healthcare) Rate of change in demand, competition, technology and regulations.
An illustrative example.
Bogner & Barr (2000)
Cognitive and sense making abilities High (IT) A form of hyper-competition. None.
Oliver & Roos (2005)
Team based decision making. High (toys and IT tools) Rate of change and the time available to make decisions.
None.
Brauer & Schmidt (2006)
Temporal development of a firm’s strategy implementation.
High and low (industries not specified).
A form of dynamism and volatility. Industry market returns data.
Nadkarni & Narayanan (2007a)
How cognitive construction by firms drives industry velocity.
High (e.g., computers, toys) and low (aircraft, steel)
Rate of change (clockspeed) for product, process and organizational dimensions.
Industry clockspeeds.
Nadkarni & Narayanan (2007b)
Relationship between strategic schemas and strategic flexibility.
High (e.g., computers, toys) and low (e.g., aircraft, steel)
The rate of industry change (clockspeed) Industry clockspeeds.
Davis & Shirato (2007)
A firm’s propensity to launch World Trade Organization actions.
High (computer), medium (auto) and low (steel)
The number of product lines and the rate of product turnover.
R&D expenditure/total revenue
Nadkarni & Barr (2008)
How velocity affects managerial cognition, which in turn affects the relationship between industry context and strategic action
High (semiconductor and cosmetic) and low (aircraft and petrochemical)
As per Bourgeois & Eisenhardt (1988) A review of existing literature and matching using industry attributes.
Davis et al. (2009) The performance and structural implications of velocity.
High and low (a conceptual simulation model)
The speed or rate at which new opportunities emerge in the environment.
A Poisson distribution of new opportunities.
55
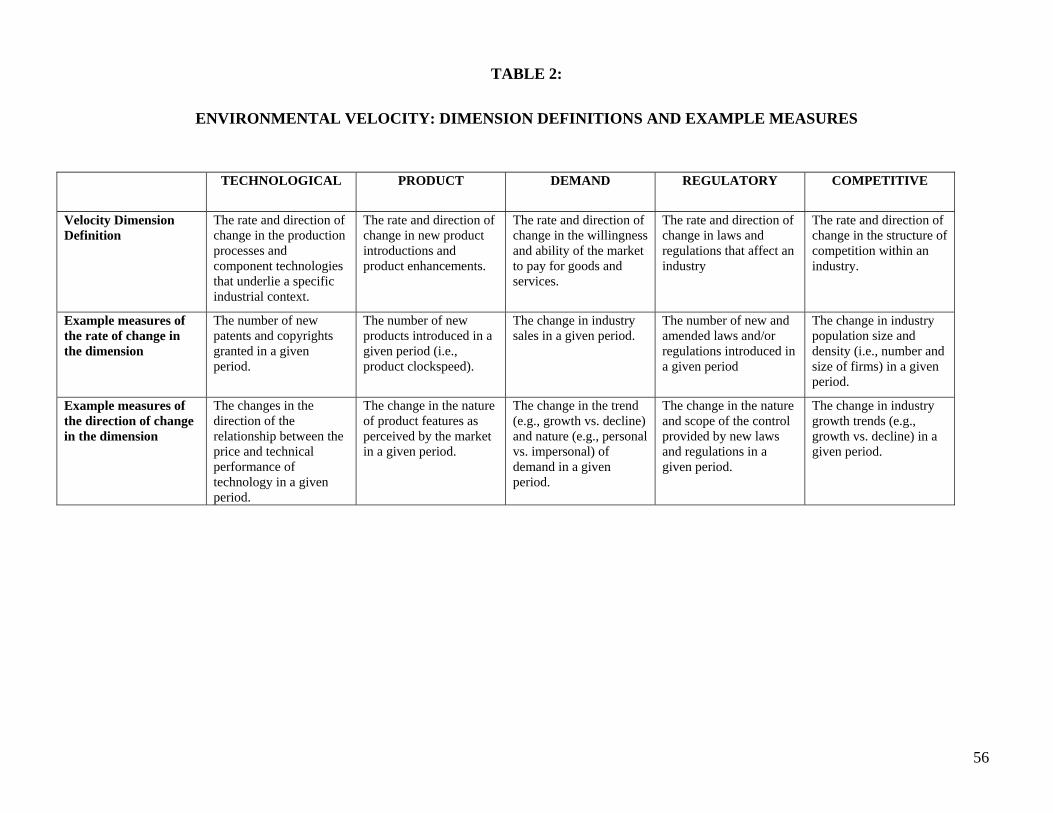
56
TABLE 2:
ENVIRONMENTAL VELOCITY: DIMENSION DEFINITIONS AND EXAMPLE MEASURES
TECHNOLOGICAL PRODUCT DEMAND REGULATORY COMPETITIVE
Velocity Dimension Definition
The rate and direction of change in the production processes and component technologies that underlie a specific industrial context.
The rate and direction of change in new product introductions and product enhancements.
The rate and direction of change in the willingness and ability of the market to pay for goods and services.
The rate and direction of change in laws and regulations that affect an industry
The rate and direction of change in the structure of competition within an industry.
Example measures of the rate of change in the dimension
The number of new patents and copyrights granted in a given period.
The number of new products introduced in a given period (i.e., product clockspeed).
The change in industry sales in a given period.
The number of new and amended laws and/or regulations introduced in a given period
The change in industry population size and density (i.e., number and size of firms) in a given period.
Example measures of the direction of change in the dimension
The changes in the direction of the relationship between the price and technical performance of technology in a given period.
The change in the nature of product features as perceived by the market in a given period.
The change in the trend (e.g., growth vs. decline) and nature (e.g., personal vs. impersonal) of demand in a given period.
The change in the nature and scope of the control provided by new laws and regulations in a given period.
The change in industry growth trends (e.g., growth vs. decline) in a given period.